Embed Size (px)
Citation preview

Jennifer M. Cunliffe1
Matthew R. Whorton2
Roger K. Sunahara2
Robert T. Kennedy1, 2
1Department of Chemistry,University of Michigan,Ann Arbor, MI, USA
2Department of Pharmacology,University of Michigan,Ann Arbor, MI, USA
Received September 8, 2006Revised November 12, 2006Accepted November 16, 2006
Research Article
A CE assay for the detection of agonist-stimulated adenylyl cyclase activity
A CE assay was developed for the detection of adenylyl cyclase (AC) activity stimulated atthe AC and G protein-coupled receptor (GPCR) level. In the assay, cell membranes over-expressing GPCR and/or AC were incubated with modulators and substrate ATP to producecAMP in a dose-dependent manner. In both the CE-UV and a radiochemical assay, theaddition of forskolin (FSK) resulted in a two- to three-fold maximum increase in AC activitywith EC50s of 4.2 6 0.7 and 2.4 6 0.7 mM, respectively, demonstrating that similar resultswere obtained by both assays. GPCR activation was also detected using cell membranesoverexpressing AC and the b2-adrenergic receptor (b2AR) fused to the stimulatory G pro-tein. Terbutaline (b2AR agonist) increased the basal rate of cAMP formation 1.7 6 0.1-foldresulting in an EC50 of 62 6 10 nM. The assay’s ability to detect antagonists is demon-strated by the expected right-shifted EC50 of terbutaline by the b2AR antagonist propranolol.The CE-UV assay offers advantages over the traditional radioactivity assay in terms of safetyand labor.
Keywords:
Adenylyl cyclase / CE / Enzyme assay / G protein-coupled receptorDOI 10.1002/elps.200600571
Electrophoresis 2007, 28, 1913–1920 1913
1 Introduction
The G protein signaling cascade is initiated by an extra-cellular ligand (or drug) binding to a membrane-bound Gprotein-coupled receptor (GPCR). The ligand-binding eventcauses a conformational change in the associated intracel-lular G proteins that further activate downstream effectorssuch as adenylyl cyclase (AC). Over 50% of current drugstarget GPCRs [1], and GPCRs are implicated in many condi-tions including addiction [2], heart failure [3], and infectionby the human immunodeficiency virus [4, 5]. More recently,AC has also been viewed as a drug target based on itsinvolvement in Alzheimer’s [6], diabetes [7], and addiction [8,9]. Novel, rapid, and robust assays are required for ligandscreening and drug discovery at both of these signal trans-duction targets.
AC converts ATP to the second messenger cAMP, andtherefore ligands directly targeting AC can be studied by
monitoring this enzymatic reaction. A common approach todetect GPCR activation is to monitor a downstream bio-chemical reaction that results from binding of ligands to theGPCR. For example, GPCR activation may be detected bymonitoring the activation of AC by stimulatory G proteins(Gas) coupled to the GPCR [10–14]. An advantage of mon-itoring AC activity for GPCR studies is that it is often moresensitive than assays upstream of the biochemical pathway,such as [35S]GTPgS binding, due to signal amplification [12,15]. Therefore, the same AC assay can be used to monitorligands binding to GPCRs or AC.
The most common method for detecting AC activity usesradioactive substrate as a tracer and ion-exchange chroma-tography to separate the product from substrate and side-product nucleotides (AMP and ADP) [16, 17]. Although sen-sitive and reliable, this technique is slow, labor intensive, anduses radioactivity, which adds danger and cost to the assay.Desire for a safer, nonradioactive assay led to the develop-ment and commercialization of enzyme immunoassays(EIAs) for cAMP [18–20] to probe AC activity, but the limiteddynamic range, expense, and time associated with the EIAmake it impractical for everyday use. Several other assayplatforms have also been commercialized and have beenrecently reviewed, including the use of radio- or fluorescentlylabeled cAMP to compete with cAMP formed in the assay ina competitive immunoassay format [12, 21, 22]. Drawbacksof commercially available assays include requirements forspecial reagents (antibodies and/or labeled cAMP), time-
Correspondence: Professor Robert T. Kennedy, Department ofChemistry, University of Michigan, 930 N. University Avenue,Ann Arbor, MI 48109-1055, USAE-mail: [email protected]: 11-734-615-6462
Abbreviations: AC, adenylyl cyclase; �2AR, b2 adrenergic recep-tor; EIA, enzyme immunoassay; FSK, forskolin; GPCR, G protein-coupled receptor; PDE, phosphodiesterase
© 2007 WILEY-VCH Verlag GmbH & Co. KGaA, Weinheim www.electrophoresis-journal.com

1914 J. M. Cunliffe et al. Electrophoresis 2007, 28, 1913–1920
consuming filtering steps, or custom endpoint detectors, allof which add expense to the assay. An ideal assay wouldeliminate the requirements for radioactivity and expensivereagents with limited shelf lives. One possibility would be touse native ATP as the substrate and a high-resolutionseparation technique, such as CE, to resolve the substratefrom product (cAMP).
CE has emerged as a valuable tool for measuring theenzymatic activity due to low volume sample requirements,rapid analysis times, high-resolution separations, and ease-of-use (for reviews, see [23–25]). Many variations of the CEenzyme assay have been reported [23], but the simplestinvolves off-line incubation of substrate–enzyme mixturefollowed by injection and separation. The different charge-to-size ratios of cAMP and ATP suggest that CE could poten-tially be a valuable addition to the armamentarium of tech-niques used to measure AC activity.
In this work, CE was used to measure AC activation inmembranes from Spodoptera frugiperda (fall armyworm, Sf9)cells expressing AC or coexpressing the b2-adrenergic recep-tor (b2AR) fused to GasL (a long splice variant of Gas) andAC. CE is used to detect the conversion of ATP to cAMP fol-lowing the addition of drugs that act either at the GPCR ordirectly at AC. The technique offers a more rapid and auto-matable approach to detect AC activity, and has promise to bescaled up for use in high-throughput screening.
2 Materials and methods
2.1 Materials
Sf9 cells were purchased from Invitrogen (Carlsbad, CA). Tris-HCl, sodium phosphate monobasic monohydrate, andMgCl2?6H2O were purchased from Fisher (Fair Lawn, NJ,USA). Forskolin (FSK; from Coleus forskohlii) was purchasedfrom Calbiochem (San Diego, CA, USA) and Ro 20-1724 waspurchased from A.G. Scientific (San Diego, CA, USA).[a-32P]ATP and [3H]cAMP were purchased form Perkin-Elmer.(6)-Propranolol, (2)-isoproterenol, terbutaline, and all theother materials were purchased from Sigma (St. Louis, MO,USA). Buffers were made in deionized water purified by E-Purewater systems (Barnstead International, Dubuque, IA, USA).
2.2 Protein expression and purification
Cytosolic AC domains VC1 (isoform V, first cytosolic domain)and ArgC-IIC2 (IIC2, isoform II, second cytosolic domain)were expressed and purified as previously described [26, 27]and stored at 2807C until use.
2.3 Membrane preparations
Sf9 cells (cell density of 1.6–1.86106 cells/mL) were infectedwith viruses containing the cDNAs for AC2 alone (AC) or afusion of b2AR and GasL (b2ARGasL) [28] and AC2
(b2ARGasL-AC) and incubated at 277C under rotation. TheAC2 virus was a kind gift from A. G. Gilman (University ofTexas Southwestern Medical Center). Cells were harvested48–72 h post infection in buffer containing 50 mM Tris-HClpH 8.0, 150 mM NaCl, and protease inhibitors (32 mg/mLeach of N-tosyl-L-phenylalanine chloromethyl ketone and N-a-P-tosyl-L-lysine chloromethyl ketone, 35 mg/mL phe-nylmethylsulfonylfluoride, and 3.2 mg/mL each of leupeptinand soybean trypsin inhibitor) and lysed by nitrogen cavita-tion using a Parr bomb (600 psi, 30 min). Unlysed cells wereremoved by a low speed spin (20006g, 10 min), and mem-branes were collected following ultracentrifugation(100 0006g, 35 min). Membranes were diluted in 50 mMTris-HCl pH 8.0, 50 mM NaCl, and protease inhibitors (sameas above) and protein concentrations were determined by theBradford Assay (BioRad Laboratories, Hercules, CA, USA).With the exception of the cell infection, all the steps wereperformed at 47C. Aliquots were snap frozen in liquid nitro-gen and stored at 2807C. Thawed samples were homoge-nized (Kimble Kontes, Vineland, NJ, USA) prior to use.
2.4 Adenylyl cyclase assays for purified AC
Samples containing 1 mM AC (1 mM VC1 and 7.6 mM IIC2)and 1 mM ATP were incubated with or without 100 mM FSKin buffer containing 10 mM Tris-HCl pH 8.0, 1 mM EDTA,5 mM MgCl2, and 1 mM DTT. Samples were maintained at257C and were not prepared in a regeneration system be-cause endogenous ATPase and phosphodiesterases (PDEs)were absent.
2.5 Adenylyl cyclase assays for membrane-bound AC
2.5.1 Radioactivity assay
AC assays were performed as previously described [16, 26,28, 29]. Briefly, 25–100 mg of membrane was incubated withmodulators in 10 mM Tris-HCl pH 8.0, 1 mM EDTA, and5 mM MgCl2 for 30 min on ice with a final volume of 50 mL.The reaction was initiated by the addition of 50 mL of activa-tion buffer (20 mM Tris-HCl pH 8.0, 3 mM potassiumphosphoenolpyruvate, 100 mM Ro 20-1724, 0.6 mM EDTA,5 mM MgCl2, 50 mg/mL pyruvate kinase, 2 mM ATP, and,106 cpm [a-32P]ATP), and membranes were incubated for30 min at 307C, unless otherwise indicated. The reaction wasquenched with buffer containing 0.25% SDS, 5 mM ATP,and 0.175 mM cAMP and nucleotides were separated withDowex and alumina columns. [3H]-cAMP was used as theinternal standard to account for column recovery variation.
2.5.2 CE assay
Samples were prepared the same as above with the excep-tions of the elimination of radiolabeled ATP and reactionsbeing quenched with 2 mL of 500 mM EDTA([EDTA]final = 10 mM). The autosampler was at 307C when
© 2007 WILEY-VCH Verlag GmbH & Co. KGaA, Weinheim www.electrophoresis-journal.com

Electrophoresis 2007, 28, 1913–1920 CE and CEC 1915
kinetic studies were performed on-line. Bovine Gas wasexpressed in Escherichia coli, purified and preactivated withGTPgS as previously described [30]. Thymidine was used asthe internal standard.
2.6 CE with UV detection
A PACE/MDQ CE unit (Beckman Coulter, Fullerton, CA,USA) was used to separate nucleotides using a 75 mm innerdiameter, 360 mm outer diameter fused-silica capillary (Poly-micro Technologies, Phoenix, AZ, USA) with an effectivelength of 20 cm and a total length of 30 cm. Absorbance wasmeasured at 254 nm. The autosampler was maintained at47C for all the experiments unless otherwise noted. Dataacquisition (16 Hz) and control were performed usingP/ACE 32 Karat Software Version 5.0 (Beckman) for Win-dows 2000 on a 2.0 GHz IBM personal computer.
For experiments using purified cytosolic domains,separation buffer was 20 mM sodium phosphate, pH 8.8.For experiments using membrane-bound AC, separationbuffer was 20 mM sodium phosphate, 10 mM EDTApH 10.3. At the beginning of each day, capillary was rinsedwith 0.1 M NaOH, H2O, and separation buffer for 5 mineach. Between separations, the capillary was rinsed with0.1 M NaOH and electrophoresis buffer for 1 min each priorto injection. Unfiltered samples were injected for 3 s at0.5 psi and separation was at 15 kV (500 V/cm) and 10 kV(333 V/cm) for experiments using purified and membrane-bound AC, respectively.
2.7 Data analysis
CE data were analyzed with Cutter 7, software written in-house [31]. The amount of cAMP produced in the CE assaywas quantified using a calibration curve of cAMP standards.For the radioactivity assay, cAMP was quantified using scin-tillation counting as described elsewhere [17]. EC50 valueswere determined by fitting dose–response data using Graph-Pad Prism (Version 3.0, GraphPad Software, San Diego, CA,USA) to y = Bottom 1 [(Top-Bottom)/(1 1 10LogEC50-x)] wherex is the logarithmic concentration of the activator in M and y isthe rate of cAMP formation. Each dose–response experimentwas performed in quadruplicate and similar EC50 values wereobtained. Error is reported as 6 S.E.M.
3 Results and discussion
Our goal was to develop a radioactive-free, rapid, and robustCE assay for the detection of AC activity. The assay was initi-ally demonstrated with purified AC before being extended tocell membranes overexpressing AC to better mimic AC’sphysiological environment. After the assay was optimized forcell membranes, AC drugs were detected using membranesoverexpressing AC, then GPCR drugs were detected usingmembranes overexpressing GPCR and AC.
3.1 Detection of AC activity using purified AC
Initial experiments used purified cytosolic domains of ACand monitored the conversion of ATP to cAMP under basaland FSK-stimulated conditions. The cytosolic domains con-tain the active site, and previous studies have used the cyto-solic domains to model membrane-bound AC [27, 32]. Whencytosolic domains of AC were incubated with ATP and theresulting mixture separated by CE, peaks corresponding toproduct (cAMP, t = 1.9 min) and substrate (ATP, t = 3.7 min)were observed (Fig. 1A), validating the assay’s ability to detectAC activity. (The identity of the cAMP and ATP peaks wasconfirmed by spiking in standards.) The small samplevolumes associated with CE allowed the same sample to beserially injected for measuring the rate of cAMP formation.Figure 1B demonstrates that linear rates can be monitoredunder basal conditions (inset). When AC was stimulatedwith FSK, the rate of cAMP formation increased as expected,but rapidly deviated from linearity (Fig. 1B). When productand substrate were monitored with time under these condi-tions (Fig. 1C), it became apparent that the deviation fromlinearity was due to rapid substrate depletion. It was alsonoted that the amount of cAMP formed plus ATP remainingwas not constant throughout the 100 min reaction (Fig. 1C).This was not likely due to the formation of side products asnone were detected. It is partially due to a lower extinctioncoefficient for cAMP (12.36103/M/cm) [33] than ATP(15.46103/M/cm) [34], resulting in a decrease in the totalpeak area as the amount of cAMP formed increased. In viewof the narrower peaks for cAMP than ATP, the decrease intotal area may also be partially due to using a concentration-sensitive detector, which can yield smaller peak areas for agiven mass injected if the peak is narrower.
3.2 Assay optimization for detecting AC activity in
cell membranes
When measuring AC activity in cell membranes, modifica-tions to the assay must be made to account for endogenousATPase and PDE activities [17]. ATPases convert ATP to ADPand AMP resulting in substrate depletion and nonlinearrates of product formation. PDEs convert cAMP to AMPmaking the detection of cAMP difficult if not impossible. Tocompensate for ATPase activity, ATP-regeneration systems(such as pyruvate kinase/phosphoenol pyruvate) are com-monly used to regenerate ATP from ADP and AMP, ensur-ing a constant substrate supply [35, 36]. PDE activity is pre-vented by the addition of PDE inhibitors such as Ro 20-1724,allowing accumulation and detection of cAMP.
All nucleotides must be well resolved to ensure properfunctioning of the regeneration system and PDE inhibitors.The separation conditions used for the experiments involv-ing purified AC cytosolic domains were sufficient for theseparation of cAMP and ATP (samples lacked endogenousATPases and PDEs and therefore separating ADP from ATPwas not a concern). A change in separation conditions was
© 2007 WILEY-VCH Verlag GmbH & Co. KGaA, Weinheim www.electrophoresis-journal.com

1916 J. M. Cunliffe et al. Electrophoresis 2007, 28, 1913–1920
Figure 1. Purified cytosolic domains validate the use of theCE-UV assay to monitor AC activity. All the samples contained1 mM AC and 1 mM ATP. (A) Electropherogram of sample con-taining AC, ATP, and 100 mM forskolin after 4 min of reaction. (B)Samples containing AC, and 0 mM (n) or 100 mM forskolin (s)were serially injected and cAMP was monitored with time. Theinset is a blowup of the linear cAMP formation under non-stimulated (0 mM forskolin) conditions. (C) ATP and cAMP weremonitored with time in sample containing AC, ATP, and 100 mMforskolin. The y-axis represents the peak area of ATP or cAMPdivided by the peak area of internal standard (IS).
required for analysis of AC activity in membranes becauseADP was not well resolved from ATP using the separationconditions for purified AC. Addition of EDTA to the separa-tion buffer was found to improve the resolution between thenucleotides; however, this also increased the current result-ing in slower EOF and longer migration times. To alleviatesome of the heating associated with the increased current,the electric field was decreased to 333 V/cm, further con-tributing to longer migration times.
3.3 Detection of basal AC activity in cell membranes
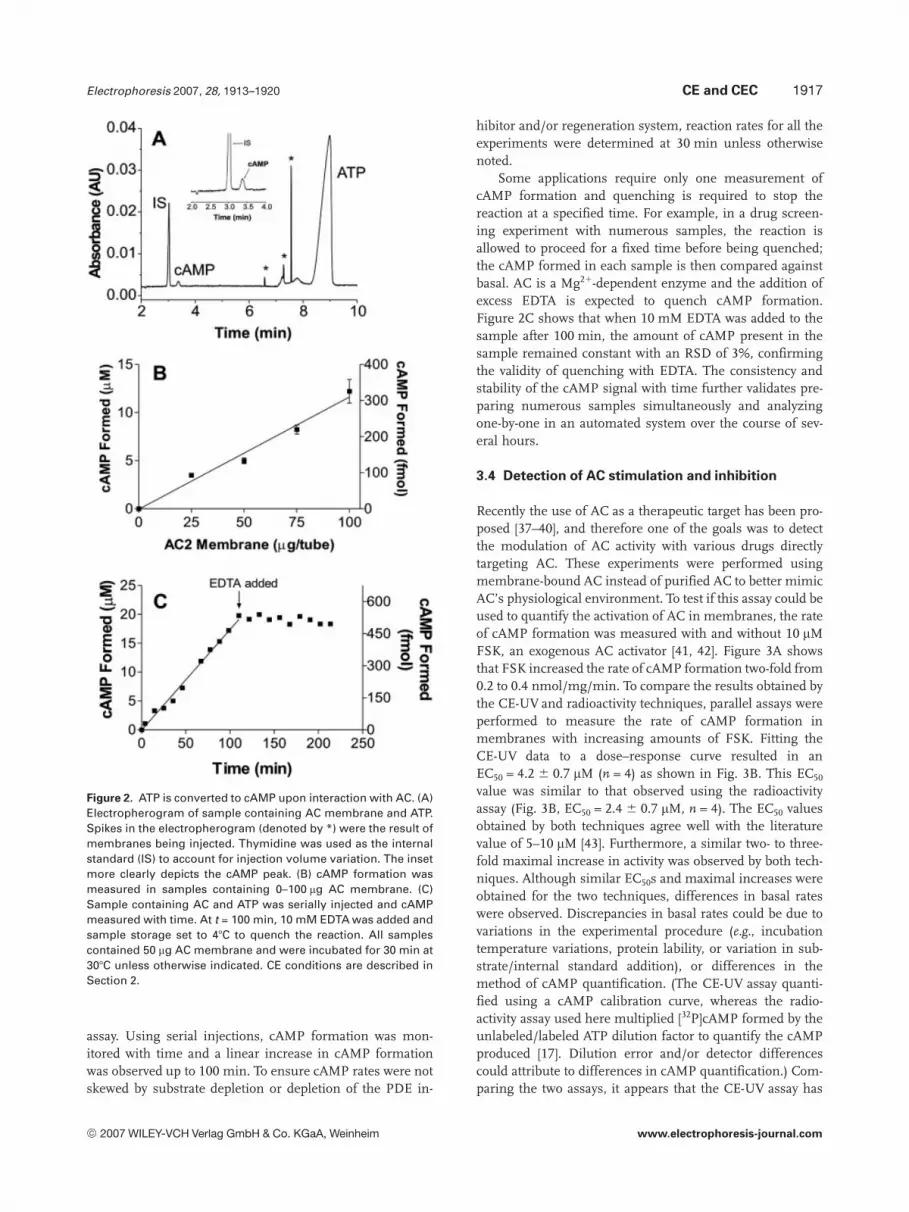
Using the improved sample and separation conditions,detection of AC activity in cell membranes was attemptedusing CE. Sf9 membranes containing overexpressed AC wereincubated with ATP (see Section 2) and cAMP was produced,migrating at 3.3 min by CE, as shown in Fig. 2A. After30 min of reaction, ,5 mM cAMP (or 133 fmol cAMP) wasformed. The identity of cAMP peak was confirmed by spik-ing with standards. ATP migrated after cAMP at t = 9.0 min.Both cAMP and ATP migrated at longer times than in Fig. 1Abecause the separation buffer was changed to better resolvethe nucleotides (see above). After ,100 min of reaction time(depending on the amount of protein used in the assay),AMP and ADP were detected in the electropherogrammigrating between cAMP and ATP (data not shown). Thepresence of these nucleotides indicated depletion of the PDEinhibitor and regeneration system. Occasionally, spikes ofirreproducible migration time (denoted by asterisks inFig. 2A) were observed in electropherograms and were at-tributed to the injection of membrane fragments or otherparticulates from the unfiltered samples.
An important experiment when detecting enzyme activi-ty is to ensure that the amount of product formed increaseslinearly with the amount of protein in the sample. To test thelinearity of cAMP formation as a function of protein amount,substrate was added to various amounts of AC membraneand the amount of cAMP formed after a 30 min reaction wasmeasured. As expected, the amount of cAMP producedincreased linearly as a function of protein amount (Fig. 2B).However, increasing protein amounts to above 75 mg/tubealso led to irreproducible migration times, making quantifi-cation more difficult by increasing the peak area RSD from4% (25 mg/tube) to 17% (100 mg/tube). For most of theexperiments, 25–75 mg protein/tube was used to achieve abalance between signal strength and quantification repro-ducibility.
To determine the assay’s utility for kinetic experiments,sample containing AC membrane and ATP was seriallyinjected and cAMP formation monitored (Fig. 2C). The rapidseparation of substrate from enzyme in the capillary is usedto quench the reaction of the aliquot, allowing the samplereaction to continue in the autosampler. In this way, thesample can be repeatedly injected for the acquisition ofkinetic information, drastically reducing sample consump-tion compared to kinetic studies using the radiochemical
© 2007 WILEY-VCH Verlag GmbH & Co. KGaA, Weinheim www.electrophoresis-journal.com
Electrophoresis 2007, 28, 1913–1920 CE and CEC 1917
Figure 2. ATP is converted to cAMP upon interaction with AC. (A)Electropherogram of sample containing AC membrane and ATP.Spikes in the electropherogram (denoted by *) were the result ofmembranes being injected. Thymidine was used as the internalstandard (IS) to account for injection volume variation. The insetmore clearly depicts the cAMP peak. (B) cAMP formation wasmeasured in samples containing 0–100 mg AC membrane. (C)Sample containing AC and ATP was serially injected and cAMPmeasured with time. At t = 100 min, 10 mM EDTA was added andsample storage set to 47C to quench the reaction. All samplescontained 50 mg AC membrane and were incubated for 30 min at307C unless otherwise indicated. CE conditions are described inSection 2.
assay. Using serial injections, cAMP formation was mon-itored with time and a linear increase in cAMP formationwas observed up to 100 min. To ensure cAMP rates were notskewed by substrate depletion or depletion of the PDE in-
hibitor and/or regeneration system, reaction rates for all theexperiments were determined at 30 min unless otherwisenoted.
Some applications require only one measurement ofcAMP formation and quenching is required to stop thereaction at a specified time. For example, in a drug screen-ing experiment with numerous samples, the reaction isallowed to proceed for a fixed time before being quenched;the cAMP formed in each sample is then compared againstbasal. AC is a Mg21-dependent enzyme and the addition ofexcess EDTA is expected to quench cAMP formation.Figure 2C shows that when 10 mM EDTA was added to thesample after 100 min, the amount of cAMP present in thesample remained constant with an RSD of 3%, confirmingthe validity of quenching with EDTA. The consistency andstability of the cAMP signal with time further validates pre-paring numerous samples simultaneously and analyzingone-by-one in an automated system over the course of sev-eral hours.
3.4 Detection of AC stimulation and inhibition
Recently the use of AC as a therapeutic target has been pro-posed [37–40], and therefore one of the goals was to detectthe modulation of AC activity with various drugs directlytargeting AC. These experiments were performed usingmembrane-bound AC instead of purified AC to better mimicAC’s physiological environment. To test if this assay could beused to quantify the activation of AC in membranes, the rateof cAMP formation was measured with and without 10 mMFSK, an exogenous AC activator [41, 42]. Figure 3A showsthat FSK increased the rate of cAMP formation two-fold from0.2 to 0.4 nmol/mg/min. To compare the results obtained bythe CE-UV and radioactivity techniques, parallel assays wereperformed to measure the rate of cAMP formation inmembranes with increasing amounts of FSK. Fitting theCE-UV data to a dose–response curve resulted in anEC50 = 4.2 6 0.7 mM (n = 4) as shown in Fig. 3B. This EC50
value was similar to that observed using the radioactivityassay (Fig. 3B, EC50 = 2.4 6 0.7 mM, n = 4). The EC50 valuesobtained by both techniques agree well with the literaturevalue of 5–10 mM [43]. Furthermore, a similar two- to three-fold maximal increase in activity was observed by both tech-niques. Although similar EC50s and maximal increases wereobtained for the two techniques, differences in basal rateswere observed. Discrepancies in basal rates could be due tovariations in the experimental procedure (e.g., incubationtemperature variations, protein lability, or variation in sub-strate/internal standard addition), or differences in themethod of cAMP quantification. (The CE-UV assay quanti-fied using a cAMP calibration curve, whereas the radio-activity assay used here multiplied [32P]cAMP formed by theunlabeled/labeled ATP dilution factor to quantify the cAMPproduced [17]. Dilution error and/or detector differencescould attribute to differences in cAMP quantification.) Com-paring the two assays, it appears that the CE-UV assay has
© 2007 WILEY-VCH Verlag GmbH & Co. KGaA, Weinheim www.electrophoresis-journal.com

1918 J. M. Cunliffe et al. Electrophoresis 2007, 28, 1913–1920
Figure 3. Rates of cAMP formation can be modulated with ACdrugs. (A) Addition of 10 mM forskolin (FSK, m) to 50 mg ACmembrane increased the basal (u) rate of cAMP formation. (B)AC activity was determined in samples containing 75 mg AC (CE-UV) or 25 mg AC (radioactivity), ATP, and 0–100 mM forskolin.Results are representative of four independent experiments foreach type of assay. (C) Samples containing 75 mg AC membraneswere incubated with ATP and 10 mM forskolin (FSK), 5 nM Gas-GTPgS (Gas-GTPgS), or 25 mM 20,50-dd-30-ADP (dd-30-ADP) and therate of cAMP formation was compared to basal. All samples wereincubated for 30 min at 307C unless otherwise indicated. CE andradioactivity assay conditions are described in Section 2.
greater precision than the radioactivity assay; the largest peakarea RSD for the radioactivity assay is approximately double(22%) compared to the CE-UV assay (12%).
In a drug screen-type experiment, the CE-UV assay maybe used by mixing the membranes with drugs, and thenquenching the reaction for readout by CE. To test this modeof operation, AC membranes were incubated with variousmodulators and the amount of cAMP formed after 30 minwas measured using an automated system (Fig. 3C). FSKand Gas-GTPgS increased the amount of cAMP formed by253 6 7 and 472 6 10%, respectively, compared to basal(n = 4), yielding Z0 values [44] of 0.5 and 0.7, respectively. TheZ0 value measures the quality of a high-throughput assay,and a value above 0.5 is considered an excellent assay [44].Therefore, the CE-UV assay has sufficient reproducibilityand S/N for high-throughput screening. The P-site inhibitor20,50-dd-30-ADP only produced 28 6 1% of the basal signal(Z0 = 0.5, n = 4), also demonstrating the ability of the CE-UVassay to detect AC inhibition. DMSO (0.5%; vehicle for FSK)had no effect on basal cAMP rate formation (data notshown).
3.5 GPCR drug screening using the CE-UV assay
GPCRs are more customary drug targets than AC, so thisassay was tested for its ability to detect agonist-activation atthe GPCR level using membranes coexpressing b2ARGasL
and AC (b2ARGasL-AC). Addition of b2AR agonists wasexpected to increase the rate of cAMP formation as pre-viously demonstrated [15, 45–47]. Figure 4 shows incubatingb2ARGasL-AC membranes with substrate and increasingamounts of terbutaline (a specific b2AR agonist) resulted in a1.7 6 0.1-fold maximal increase in the rate of cAMP forma-tion and revealed a sigmoidal dose–response curve with anEC50 of 62 6 10 nM (n = 4).
Figure 4. Rates of cAMP formation can be modulated with GPCRdrugs. Samples containing 30 mg b2ARGasL-AC membrane, ATP,25 mM GTP, and 0–100 mM terbutaline were incubated in thepresence (u) or absence (n) of 100 nM propranolol. EC50s weredetermined by fitting dose–response data. Error bars are smallerthan the data points. Results are representative of at least twoexperiments. Sample preparation and CE details are described inSection 2.
© 2007 WILEY-VCH Verlag GmbH & Co. KGaA, Weinheim www.electrophoresis-journal.com

Electrophoresis 2007, 28, 1913–1920 CE and CEC 1919
The assay was next tested for its ability to detect antago-nists binding to the receptor. Addition of a fixed amount ofantagonist should shift the agonist dose–response curve tothe right in cases where agonist and antagonists compete forthe same binding site. Figure 4 shows that the terbutalinedose–response curve was right-shifted in the presence of100 nM propranolol (b2AR antagonist), resulting in EC50 of27 6 1 mM (n = 2). As expected, addition of 50 nM propra-nolol resulted in a smaller right shift with and EC50 of17 6 2 mM (n = 2, data not shown). These results demon-strate that this assay can be used to screen both agonists andantagonists.
In the same manner as modulators for AC were screened(Fig. 3C), agonists for various GPCRs were incubated withb2ARGasL-AC membranes and cAMP formation was meas-ured. The amount of cAMP formed after 30 min was accel-erated in the presence of b2AR agonists isoproterenol(165 6 5%, Z0 = 0.4) and terbutaline (171 6 8%, Z0 = 0.5).As negative controls, the effects of a2-adrenergic receptoragonist UK 14 304 (n = 4) and dopamine 3 receptor agonistPD 128 907 (n = 4) were tested and found to have no effects(98 6 2 and 102 6 2%, respectively) as expected.
3.6 Advantages and limitations of CE-UV assay
The CE-UV assay addresses many of the disadvantages asso-ciated with the radioactivity, RIA, and EIA techniques formeasuring AC activity. Coupling CE with UVdetection allowsnucleotides to be separated and detected, eliminating theneed for radioactive substrate used in the radiochemical assay.Furthermore, the cost of the assay is reduced because the CE-UV assay does not require special reagents or filtering steps.Eliminating the filtering step also reduces assay time (byremoving washing steps), allows acquisition of kinetic infor-mation (same sample can be serially injected), and makes theassay more amenable to robotic operation. Similar to theradioactivity assay, the linear dynamic range of the CE-UVassay is several orders of magnitude larger than that of theRIA or EIA, and is limited by enzyme kinetics (i.e., substratedepletion) rather than the assay itself. The results presentedherein indicate that the CE-UV assay has greater precisionthan the radioactivity assay. Furthermore, the combined sam-ple preparation and analysis involved in the CE-UV assay isless labor intensive than more traditional techniques.
Although multiplexed CE systems were initiallydesigned for DNA sequencing [48–50], they have recentlybeen used for increasing throughput in CE drug screeningassays [51]. For example, He and Yeung [51] used a 48-capil-lary array system to improve throughput for the determina-tion of six IC50 values (screening three inhibitors vs. twoenzymes). Transferring the AC assay described herein to acapillary 96-array system would drastically improvethroughput for screening both AC and GPCR modulators.Furthermore, if a hit is present in a screen, it should bereadily identified because the assay has Z0 values in the rangeof 0.4–0.7.
Use of microgram quantities of membranes over-expressing AC is common in radioactivity assays [36, 40], andthe CE-UV assay provided sufficient sensitivity to detect ACactivity under these conditions. Detection difficulties couldarise in samples expressing physiological levels of AC. Usingan S/N of 3, the LOD was ,1 mM cAMP (,30 fmol ofcAMP). For tissue samples with low AC activity, samplestacking (oncolumn concentration) techniques could beimplemented to increase the cAMP signal [52–54], or assayconditions could be altered (longer reaction times, moreprotein/tube) to increase cAMP production and allow relia-ble cAMP detection and quantification.
In recent work, we have used a fluorescent substrate andCE with LIF to detect the activity of purified AC [55]. Thiswork differs substantially in that we do not require a specialfluorescent substrate and in that we use the assay withenzymes still bound to the membrane. This allows us todetect GPCR activity that is coupled to the AC enzyme. Thesemodifications make the assay of greater interest for potentialdrug screening.
4 Concluding remarks
CE separation coupled with UV detection allowed the rapidand automatable detection of AC activity in cell membranes.CE eliminates the need for manual column chromatographyand washing steps, and UV detection allows the use of native,radioactive-free substrate alleviating safety and cost concernssurrounding the radioactivity assay. When the CE-UV andradioactivity assays were directly compared, similar EC50
values and stimulation increases were obtained demonstrat-ing the validity of the CE-UV assay. Detection of agonist-mediated GPCR activation suggests that the assay has pro-mise in drug screening applications.
A. G. Gilman (University of Texas Southwestern MedicalCenter) is thanked for his kind gift of the virus containing thecDNA for AC2. This work was supported by funding from NSFGrant CHE-0242440 (RTK), NIH Grant GM068603 (RKS),and University of Michigan Biological Scholars Program (RKS).JMC was partially supported by a Natural Sciences and Engi-neering Research Council of Canada (NSERC) postgraduatescholarship.
5 References
[1] Marinissen, M. J., Gutkind, J. S., Trends Pharmacol. Sci. 2001,22, 368–376.
[2] Nestler, E. J., Aghajanian, G. K., Science 1997, 278, 58–63.
[3] Brodde, O. E., Pharmacol. Rev. 1991, 43, 203–242.
[4] Yi, Y., Isaacs, S. N., Williams, D. A., Frank, I. et al., J. Virol.1999, 73, 7117–7125.
[5] Zhang, Y. J., Moore, J. P., J. Virol. 1999, 73, 3443–3448.
© 2007 WILEY-VCH Verlag GmbH & Co. KGaA, Weinheim www.electrophoresis-journal.com

1920 J. M. Cunliffe et al. Electrophoresis 2007, 28, 1913–1920
[6] Wu, Z. L., Thomas, S. A., Villacres, E. C., Xia, Z. et al., Proc.Natl. Acad. Sci. USA 1995, 92, 220–224.
[7] Abdel-Halim, S. M., Guenifi, A., He, B., Yang, B. et al., Dia-betes 1998, 47, 498–504.
[8] Avidor-Reiss, T., Nevo, I., Saya, D., Bayewitch, M., Vogel, Z.,J. Biol. Chem. 1997, 272, 5040–5047.
[9] Bie, B., Peng, Y., Zhang, Y., Pan, Z. Z., J. Neurosci. 2005, 25,3824–3832.
[10] Murad, F., Chi, Y. M., Rall, T. W., Sutherland, E. W., J. Biol.Chem. 1962, 237, 1233–1238.
[11] Mukherjee, C., Caron, M. G., Mullikin, D., Lefkowitz, R. J.,Mol. Pharmacol. 1976, 12, 16–31.
[12] Thomsen, W., Frazer, J., Unett, D., Curr. Opin. Biotechnol.2005, 16, 655–665.
[13] Samama, P., Pei, G., Costa, T., Cotecchia, S., Lefkowitz, R. J.,Mol. Pharmacol. 1994, 45, 390–394.
[14] Chidiac, P., Hebert, T. E., Valiquette, M., Dennis, M., Bouvier,M., Mol. Pharmacol. 1994, 45, 490–499.
[15] Seifert, R., Wenzel-Seifert, K., Lee, T. W., Gether, U. et al., J.Biol. Chem. 1998, 273, 5109–5116.
[16] Salomon, Y., Londos, C., Rodbell, M., Anal. Biochem. 1974,58, 541–548.
[17] Johnson, R. A., Salomon, Y., Methods Enzymol. 1991, 195,3–21.
[18] Long, S. D., Pekala, P. H., J. Biol. Chem. 1996, 271, 1138–1144.
[19] Harrison, T., Samuel, B. U., Akompong, T., Hamm, H. et al.,Science 2003, 301, 1734–1736.
[20] Fabre, J. E., Nguyen, M., Athirakul, K., Coggins, K. et al., J.Clin. Invest. 2001, 107, 603–610.
[21] Gabriel, D., Vernier, M., Pfeifer, M. J., Dasen, B. et al., AssayDrug Dev. Technol. 2003, 1, 291–303.
[22] Williams, C., Nat. Rev. Drug Discov. 2004, 3, 125–135.
[23] Schultz, N. M., Tao, L., Rose, D. J. J., Kennedy, R. T., in:Landers, J. P. (Ed.), Handbook of Capillary Electrophoresis,CRC Press, Boca Raton, FL 1997, pp. 611–637.
[24] Van Dyck, S., Kaale, E., Novakova, S., Glatz, Z. et al., Elec-trophoresis 2003, 24, 3868–3878.
[25] Novakova, S., Van Dyck, S., Van Schepdael, A., Hoogmar-tens, J., Glatz, Z., J. Chromatogr. A 2004, 1032, 173–184.
[26] Sunahara, R. K., Dessauer, C. W., Whisnant, R. E., Kleuss, C.,Gilman, A. G., J. Biol. Chem. 1997, 272, 22265–22271.
[27] Tesmer, J. J., Sunahara, R. K., Gilman, A. G., Sprang, S. R.,Science 1997, 278, 1907–1916.
[28] Vadakkadathmeethal, K., Felczak, A., Davignon, I., Collins, J.,Sunahara, R. K., Insect Biochem. Mol. Biol. 2005, 35, 333–345.
[29] Smigel, M. D., J. Biol. Chem. 1986, 261, 1976–1982.
[30] Lee, E., Linder, M. E., Gilman, A. G., Methods Enzymol. 1994,237, 146–164.
[31] Shackman, J. G., Watson, C. J., Kennedy, R. T., J. Chroma-togr. A 2004, 1040, 273–282.
[32] Tang, W. J., Gilman, A. G., Science 1995, 268, 1769–1772.
[33] Gorshkova, I., Moore, J. L., McKenney, K. H., Schwarz, F. P.,J. Biol. Chem. 1995, 270, 21679–21683.
[34] Menetski, J. P., Varghese, A., Kowalczykowski, S. C., J. Biol.Chem. 1992, 267, 10400–10404.
[35] Ross, E. M., Maguire, M. E., Sturgill, T. W., Biltonen, R. L.,Gilman, A. G., J. Biol. Chem. 1977, 252, 5761–5775.
[36] Taussig, R., Methods Mol. Biol. 2004, 237, 77–85.
[37] Sunahara, R. K., Taussig, R., Mol. Interv. 2002, 2, 168–184.
[38] Iwatsubo, K., Minamisawa, S., Tsunematsu, T., Nakagome,M. et al., J. Biol. Chem. 2004, 279, 40938–40945.
[39] Johnson, R. A., Desaubry, L., Bianchi, G., Shoshani, I. et al.,J. Biol. Chem. 1997, 272, 8962–8966.
[40] Gille, A., Lushington, G. H., Mou, T. C., Doughty, M. B. et al.,J. Biol. Chem. 2004, 279, 19955–19969.
[41] Whisnant, R. E., Gilman, A. G., Dessauer, C. W.Proc. Natl.Acad. Sci. USA 1996, 93, 6621–6625.
[42] Zhang, G., Liu, Y., Ruoho, A. E., Hurley, J. H., Nature 1997,386, 247–253.
[43] Seamon, K. B., Padgett, W., Daly, J. W., Proc. Natl. Acad. Sci.USA 1981, 78, 3363–3367.
[44] Zhang, J. H., Chung, T. D., Oldenburg, K. R., J. Biomol.Screen 1999, 4, 67–73.
[45] Seifert, R., J. Pharmacol. Exp. Ther. 2001, 298, 840–847.
[46] Seifert, R., Lee, T. W., Lam, V. T., Kobilka, B. K., Eur. J. Bio-chem. 1998, 255, 369–382.
[47] Seifert, R., Wenzel-Seifert, K., Gether, U., Lam, V. T., Kobilka,B. K., Eur. J. Biochem. 1999, 260, 661–666.
[48] Gong, X. Y., Yeung, E. S., Anal. Chem. 1999, 71, 4989–4996.
[49] Gong, X., Yeung, E. S., J. Chromatogr. B 2000, 741, 15–21.
[50] Pang, H. M., Kenseth, J., Coldiron, S., Drug Discov. Today2004, 9, 1072–1080.
[51] He, Y., Yeung, E. S., Electrophoresis 2003, 24, 101–108.
[52] Burgi, D. S., Chien, R. L., Anal. Biochem. 1992, 202, 306–309.
[53] Burgi, D. S., Chien, R. L., Anal. Chem. 1991, 63, 2042–2047.
[54] Baryla, N. E., Lucy, C. A., Electrophoresis 2001, 22, 52–58.
[55] Cunliffe, J. M., Sunahara, R. K., Kennedy, R. T., Anal. Chem.2006, 78, 1731–1738.
© 2007 WILEY-VCH Verlag GmbH & Co. KGaA, Weinheim www.electrophoresis-journal.com


