Embed Size (px)
Citation preview
Researchjournali’s Journal of Technology Management Vol. 2 | No. 4 October | 2015
1
George Nyori Makari
Lecturer, Department of Mechanical and
manufacturing Engineering, School of Engineering,
University of Nairobi
Julius Maima Ogola
Associate professor, Department of Mechanical
and manufacturing Engineering, School of
Engineering, University of Nairobi
Martin Ogutu
Associate professor, Department of Business,
School of Business, University of Nairobi
Advanced
Manufacturing
Technology And Size
As Determinants Of
Organizational
Structure
Researchjournali’s Journal of Technology Management Vol. 2 | No. 4 October | 2015
2
ABSTRACT
The study used data from 92 companies to study the effects of company size index (CSI) on the relationship
between Advanced Manufacturing Technology Index (AMTI) and organization structure index (OI).
Company size was operationalized in terms of workforce number and capital invested. When empirically
tested, the research findings present the interrelationships among the main effects (AMTI and CSI) and the
interaction effect (AMTI*CSI). Coefficient for the interaction term was positive at 0.468 with p-value at
0.041 while coefficients of the main effects were 0.652 with p-value at 0.502 for AMT index and -0.568 with
p-value at 0.177 for company size index. The constant of the model was 0.974 at p-value of 0.582. This
implies that the interactions term positively and significantly affect AMTI and OI relationship. With this
findings company size positively moderates the relationship between AMT adoption and Organizational
structure.
Keywords: AMT Adoption index, Company size index, Organizational structure index
1. INTRODUCTION
Manufacturing processes, equipment and systems used in design and production are undergoing dramatic
changes in response to new customer needs, competitive challenges and emerging technologies. Complexity,
dynamism and uncertainty have become dominant characteristics of recent competition patterns which have
resulted in a demand-diversified market with more multifaceted products (Efstathiades et al., 1999).
Advanced Manufacturing Technology (AMT) appears to represent a perfect interaction between technological
potential and the manufacturing challenges. The major benefits of AMTs include faster machine cycle, greater
reliability, reduced inventory, saving on labor, greater flexibility and improved quality. For these benefits to
be realized, organizations will require a flexible structure and higher company’s capabilities in managing and
planning the manufacturing processes.
The benefits of advanced techniques can be realized equally by applying only a few components of AMTs
and as a result firms can gradually invest in these technologies to get the most benefit from it (Yusuff et al.,
2008). Larger companies often own sufficient business, human and technology resources to invest in AMTs
(Xu et al., 2004). However, larger companies also have a great disadvantage in the form of structural inertia,
which may exert a negative impact on AMT adoption. Smaller companies with flexible structure can make
rapid adjustment to dynamic environment and survive the fierce competition.
Fry (1982) reported a mild positive relation between size and structure. Pearson and Grandon (2004) found
that availability of monetary assets is indispensably significant to managers and owners, and such subjects
often determine the fate of AMT implementation. However Simpson and Doherty (2004) showed that it is
Researchjournali’s Journal of Technology Management Vol. 2 | No. 4 October | 2015
3
unlikely that the paucity of monetary funds hinders AMT acceptance in smaller companies. Spanos and
Voudouris (2009) found out that the degree of fit between an organization’s competitive priorities and its key
decisions regarding its investments depends on the size of a company. Rahman and Bennett (2009), found that
smaller companies have limited rapport with the suppliers of technology because of fragile financial
resources, which leads to reluctance to invest in AMTs.
Although some authors argue that the company age has a significant role in the assimilation of technology
(Simpson and Doherty, 2004). Li et al. (2010) reveals that there is not significant association between these
two variables. However both agree that the size of a company do influence the company`s technological
adoption strategy. Edwards-Schachter et al.(2011) found that smaller companies do not have efficient
funding instruments for technology adoption as do larger companies. Smaller companies tend to employ
technology to gain competitiveness, whereas larger companies regard AMT as a source to lower
manufacturing costs (Li and Xie, 2012).
2. ADVANCED MANUFACTURING TECHNOLOGY
Over the past few decades, manufacturing has gone from a highly labor-intensive set of mechanical processes
to an increasingly sophisticated set of information technology-intensive processes. This trend is expected to
continue to accelerate as advances in manufacturing technologies are made. The major strategic benefits that
these technologies offer are the increased flexibility and responsiveness, enabling an organization to improve
substantially its competitiveness in the marketplace (Efstathiades et al., 1999). Godwin et al. (1995)
emphasized that these manufacturing technologies have the potential to improve production performance
dramatically and create vital business opportunities for companies capable of successfully implementing and
managing them.
Different studies have adopted wider definitions of AMTs. Youssef (1992) defined AMTs as a group of
integrated hardware and software based technologies. These technologies are often referred to as intelligent or
smart manufacturing systems and often integrate computational predictability within the production process
(Hunt, 1987). Boyer et al. (1997) used the term AMT to describe a variety of technologies that utilize
computers to control, track, or monitor manufacturing activities, either directly or indirectly. Small and Chen
(1997) regards AMTs as a wide variety of modern computer based technologies in the manufacturing
environment. From these studies, it can be summarized that, AMT suggests both soft and hard technologies
which are being employed to enhance manufacturing competencies. This study adopts the narrower form of
AMT as the use of innovative technology to improve production processes or products and it is this concept
that is further explored within this study.
Researchjournali’s Journal of Technology Management Vol. 2 | No. 4 October | 2015
4
The use of AMTs is often claimed to achieve higher quality levels, reduce manufacturing cycle times and
lower costs since it permits the integration of the full spectrum of production functions and manufacturing
processes with computer technologies (Sun et al., 2007). With the use of computer technology, AMTs makes
the data storing and manipulation possible, that is, data held electronically can be changed and distributed
easily and cheaply between technologies. Companies therefore adopt these technologies for a wide range of
activities, ranging from scheduling to quality inspection.
Given the wide range of computer-based technologies that can be found in manufacturing companies, the
holistic technology perspective, which covers the whole range of AMTs, is believed to be the research wave
of the future in production technology, which is in line with the focus of this study. Given the wide range of
AMTs, this study adopts a similar list as that put forward by Small and Chen (1997). However, the
management practice element Just-in-Time (JIT), is excluded as the researcher considers it not a technology,
but instead more of a practice.
3. ORGANIZATIONAL STRUCTURE
As manufacturing companies adopt AMTs organizational structure is affected at operational and
administrative levels. Organizational structure is the formal allocation of work roles and the administrative
mechanism to control and integrate work activities (Child and Mansfield, 1972). An organizational structure
defines how activities such as task allocation, coordination and supervision are directed towards the
achievement of organizational aims (Pugh, 1990). An organizational structure allows the expressed allocation
of responsibilities for different functions and processes to different entities. The structure of an organization
will determine the modes in which it operates and performs. From an organizational structure a co-ordination
mechanism between the various players in a given company is created (Mintzberg, 1979).
The Structure of an organizational entails the degree and type of horizontal differentiation, vertical
differentiation, mechanisms of coordination and control, formalization and centralization of power.
Characteristics of organizational structure are explained in terms of division of task, job description, decision-
making, communication, control system, coordination and span of control at supervisory level, vertical levels
and ratio of white-collar to blue-collar employees. Our concern here is with the basic specializations within
the organization such as sub-units, level of authority, span of control and programs specifications. These
particular aspects of organizational structure exert considerable influence over the organizational decision-
making processes.
The adoption of new manufacturing technologies by companies warrants a review of organizational structure.
In the 21st century, organizational theorists such as Lim et al. (2010) have proposed that organizational
structure development should be dependent on the behavior of the management and the workers as
Researchjournali’s Journal of Technology Management Vol. 2 | No. 4 October | 2015
5
constrained by the power distribution between them and should be influenced by their environment. However,
theorists such as Lawrence and Lorsch (1969) found that companies operating in less stable environments
operated more effectively if the organizational structure was less formalized, more decentralized and more
reliant on mutual adjustment between various departments in the company and the outcome. Ideally,
organizational structure should be shaped and implemented for the primary purpose of facilitating the
achievement of organizational goals in an efficient manner.
4. COMPANY SIZE
The skill demand of AMTs is a formidable challenge for smaller manufacturing companies to acquire which
leads to reluctance in smaller companies to invest in AMTs (Love et al., 2001). Company size plays a
particularly important role in determining an organisation’s ability to adopt AMTs. The larger the company,
the greater the need for increased complexity and divisions to achieve synergy. Larger companies with a
wider range of operational initiatives require careful structural considerations to achieve optimization. For
companies in the manufacturing sector, the definition of size takes into account the workforce number in plant
and machinery and the capital invested in the company (Rosnah et al., 2003).
In Kenya, according to MSME bill (2009), companies employing 10 workers or less and having a capital
invested of less than Ksh 500,000 are termed as micro companies, 10 to 99 workers and capital investment of
Ksh 500,000 to Ksh 5M as small companies, 100 to 199 workers and capital investment of Ksh 5M to Ksh
800M as medium companies and 200 and above workers and capital investment of over 800M as large
companies. It is however unlikely that micro companies will invest in AMTs and so our attention will focus
mainly on the continuum small to large companies. The term smaller and larger company purely describing
the side of continuum of a company.
Smaller companies tend to use AMTs as a source to acquire competitive advantages, while larger companies
tend to take it as a way to simplify company operation and lower costs (Mirmahdi, 2012). The skill demand of
AMT is a formidable challenge for smaller manufacturing companies to acquire and retain. The strongest
determinants of the level of AMT adoption are by far the technical skills of blue-collar workers followed by
the influence of customers and vendors. Mansfield (1993) found that larger companies tend to use Flexible
Manufacturing System (FMS) in order to make manufacturing easier, more accurate, flexible, sophisticated,
faster and cheaper. Meredith (1987) noted that large companies are able to afford the often extreme expense
of these computerized manufacturing technologies and the cost of the failure should the investment fail. Large
companies also are likely to have the skills and human resources it takes to understand, implement, and
manage such technologies (Noe et al., 2008).
Researchjournali’s Journal of Technology Management Vol. 2 | No. 4 October | 2015
6
The implementation of AMT in smaller companies is necessary to face the challenges of globalization and to
ensure their future survival. Rosnah et al. (2003) reported that the level of AMT implemented in smaller
companies are low and maybe due to the lack of understanding of the ways in which AMT can help them. It
has been noted by researchers that company size is an enabler variable in the use of AMTs and that it is
common for smaller companies to lag behind larger companies in implementing the new technologies (Ettlie,
1990, Voss, 1988; Scott and Davis; 2007). The obvious fragile financial resource of smaller company has
been stated as the main obstacle which leads to reluctance to invest in AMTs (Love et al., 2001). Likewise,
Pearson and Grandon (2004) found that availability of monetary assets is indispensably significant to
managers and owners, and such subjects often determine the fate of AMT implementation, particularly in
smaller manufacturing companies.
5. STUDY HYPOTHESIS
Larger capacity companies are able to afford the often extreme expense of these computerized manufacturing
technologies and have the skills and human resources it takes to understand, implement, and manage such
technologies (Yusuff et al., 2008). Therefore the larger a company is the greater the benefits from using these
technologies. We now propose to link these variables in terms of the following hypothesis: The relationship
between AMT adoption and organizational structure depends on Company size. Thus, as the degree of capital
invested and workforce number increases organizational structure characteristics increases; Fig 1 shows the
conceptual model.
Fig 1: The moderation effect of human factors on the relationship between AMT adoption and organizational
structure
6. MEASUREMENT PROCEDURE
A questionnaire was used as the instrument to measure reality objectively. The questionnaire used in this
study incorporated inputs from various sources; Woodward (1965); Small and Chen, (1997); Ghani (2002)
Researchjournali’s Journal of Technology Management Vol. 2 | No. 4 October | 2015
7
and the researcher. Preliminary drafts of the questionnaire were discussed with academic scholars and
practitioners and subsequently tested in one of the beverage manufacturing company in Nairobi to assess the
content validity. The feedback from the above party was then used to improve the clarity, comprehensiveness
and relevance of the research instrument. The final survey instrument incorporated some minor changes that
were picked up during this preliminary test.
The questionnaire solicited information on the three variables of the study; Organizational structure
characteristics, AMT adoption and company size. Specifically, the questionnaire used for collecting
information from the sample companies was divided into two sections. The first section was used for
collecting information from production/plant managers in the sample companies. The second section was self-
administered to at least 5 blue collar employees and the researcher took more respondents where previous
respondents were unable to answer the questions appropriately. An average for each company for this section
was thereafter calculated. In order to measure the level of organizational index on 1-5 continuum the list of
items used in the study of Ghani (2002) were adapted. To obtain logical response and required information of
the study a five point Likert type scale was used in perception questions.
Organizational structure index was operationalized in terms of the number of sub-units, levels of authorities,
span of control, role programming, output programming and communication programming. The above
determinants were measured on 1 - 5 polar point such that 5 indicated the structure with the highest dimension
and 1 indicated the structure with the least dimension. In the case of AMT adoption, the continuum from high
to low was measured by the level of AMT investment and integration. The study investigated 14 AMTs in 5
domains based on their functionality. Companies were asked to indicate the amount of investment they had in
the individual technology, on a Likert scale of 1-5, where 1 indicated little investment and 5 indicated heavy
investment. The respondents were also asked to indicate the level of integration of each AMT invested in the
company on a Likert scale of 1-5, where 1 indicated no integration and 5 indicated extended integration.
Company size was operationalized in terms of workforce number in the plant and the registered capital
invested.
7. RESPONDENTS' PROFILE
Gaining admission to industrial organizations for the purposes of sociological research is difficult at best. The
author, dependent to a large extent on the efficacy of personal contact networks for the purposes of getting
information. A letter of introduction accompanying the questionnaire was addressed to the Production
Manager / Managing Director of the company. Thereafter the letter was followed up by telephone calls to fix
an appointment since section 2 of the questionnaire was to be self-administered. 183 letters were written to all
the AMT companies identified and either delivered or posted. As the AMT plants are located at different
Researchjournali’s Journal of Technology Management Vol. 2 | No. 4 October | 2015
8
places, geographically ranging from 5 to 700 km, data collection process took nearly 7 months. 101
companies showed positive response and data from these companies were collected for analysis.
In Section 1 of the instrument the respondents were required to fill up their job title and the duration in
holding the position in the company. This information was deemed important in order to find out the
credibility of the informant. Out of the 101 respondents whose data was collected the credibility of 9,
representing about 9%, did not meet the standard required and so were rejected in the analysis. The analysis is
therefore based on 92 companies, representing all the sectors. The majority of the respondents in section 1 of
the instrument 42.5% were from top management levels, i.e. director, managing director, chief executive
officer or chairman, and approximately 40% of the respondents were directly responsible for
manufacturing or operations or production issues of their companies. 17.5% of respondents were holding non-
manufacturing-related positions such as administration manager, company secretary, marketing manager,
commercial manager, purchasing manager, human resource manager and finance manager.
Section 2 of the instrument was self- administered to the blue collar workers working within AMT machines.
Five (5) respondents were sampled from each company and an average for each unit of analysis was thereafter
calculated. In this part of the instrument the respondents were required to answer as to their job title and the
duration in holding the position in the company. This information was deemed important in order to find out
the credibility of the informant. Since this was self-administered all the respondents sampled herein were
from machine operators, shop stewards or maintenance personnel. Out of the 460 questionnaires (5 from each
company), majority of the respondents (63%) were machine operators, 23% were maintenance personnel and
14% were shop stewards.
As the mean workforce number of companies surveyed was rather low, at around 50 employees, it is no
surprise that the top management level were in-charge of their manufacturing function and involved in
decision making in manufacturing issues. At a glance, we can infer that the sampled information collected
from the survey was highly credible and with good understanding of informants, with the average duration in
their respective positions as 9 years.
The 92 AMT manufacturing companies were grouped into eight sub-sectors based on manufactured products.
The majority of respondents were from food, beverage and animal feeds industry at 31.5%, followed by the
construction and material industry at 14.1%, chemical and pharmaceuticals industry at 12.0%, plastics,
packaging and stationery industry at 12.0% and power generation and electrical/electronic industry at 10.9%.
Other respondents represent a small fraction like fabricated metals industry at 7.6%, textiles, apparel, leather
and foot ware industry at 6.5% and automobile and parts industry at 5.4%.
Researchjournali’s Journal of Technology Management Vol. 2 | No. 4 October | 2015
9
8. RESULTS AND INTERPRETATIONS
8.1 PRODUCT DESIGN AND ENGINEERING TECHNOLOGIES
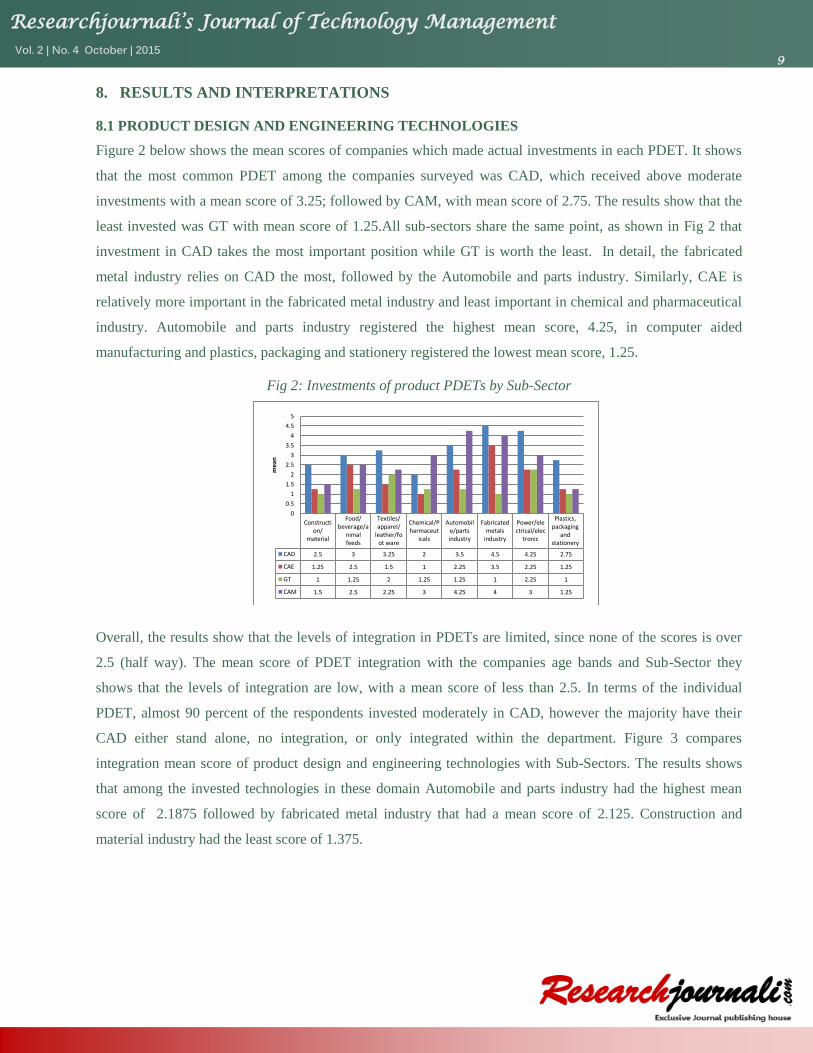
Figure 2 below shows the mean scores of companies which made actual investments in each PDET. It shows
that the most common PDET among the companies surveyed was CAD, which received above moderate
investments with a mean score of 3.25; followed by CAM, with mean score of 2.75. The results show that the
least invested was GT with mean score of 1.25.All sub-sectors share the same point, as shown in Fig 2 that
investment in CAD takes the most important position while GT is worth the least. In detail, the fabricated
metal industry relies on CAD the most, followed by the Automobile and parts industry. Similarly, CAE is
relatively more important in the fabricated metal industry and least important in chemical and pharmaceutical
industry. Automobile and parts industry registered the highest mean score, 4.25, in computer aided
manufacturing and plastics, packaging and stationery registered the lowest mean score, 1.25.
Fig 2: Investments of product PDETs by Sub-Sector
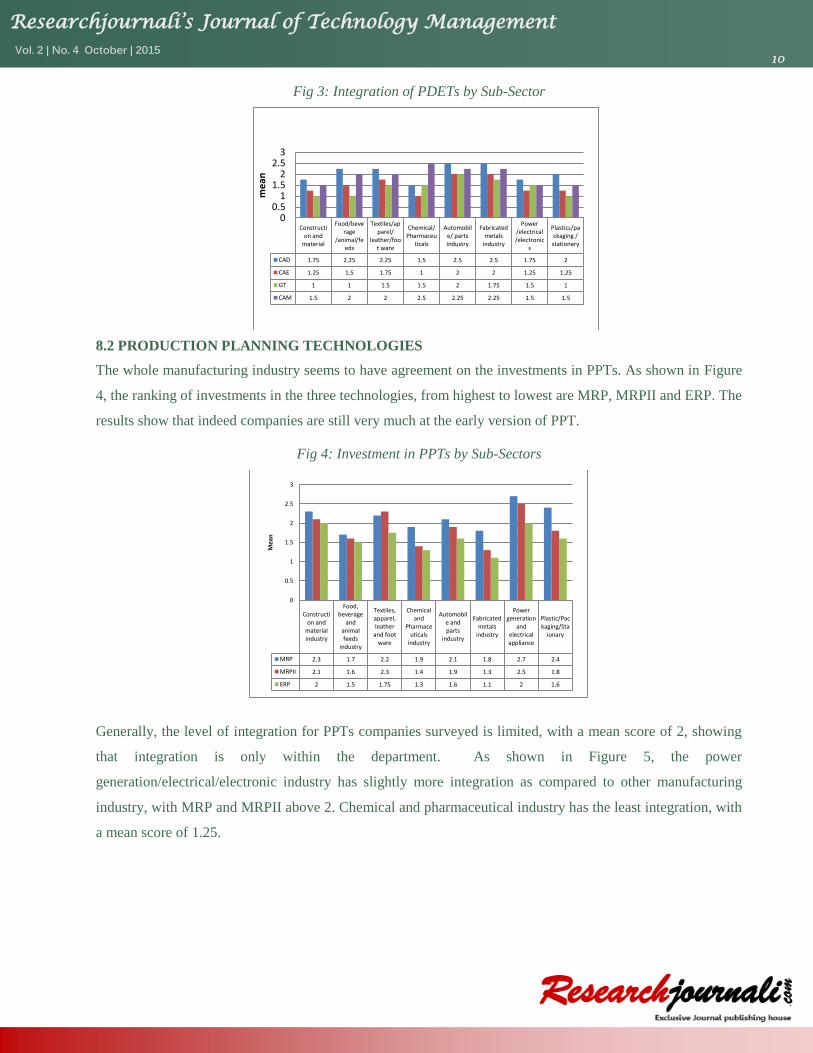
Overall, the results show that the levels of integration in PDETs are limited, since none of the scores is over
2.5 (half way). The mean score of PDET integration with the companies age bands and Sub-Sector they
shows that the levels of integration are low, with a mean score of less than 2.5. In terms of the individual
PDET, almost 90 percent of the respondents invested moderately in CAD, however the majority have their
CAD either stand alone, no integration, or only integrated within the department. Figure 3 compares
integration mean score of product design and engineering technologies with Sub-Sectors. The results shows
that among the invested technologies in these domain Automobile and parts industry had the highest mean
score of 2.1875 followed by fabricated metal industry that had a mean score of 2.125. Construction and
material industry had the least score of 1.375.
Construction/
material
Food/beverage/a
nimalfeeds
Textiles/apparel/
leather/foot ware
Chemical/Pharmaceut
icals
Automobile/partsindustry
Fabricatedmetals
industry
Power/electrical/elec
tronic
Plastics,packaging
andstationery
CAD 2.5 3 3.25 2 3.5 4.5 4.25 2.75
CAE 1.25 2.5 1.5 1 2.25 3.5 2.25 1.25
GT 1 1.25 2 1.25 1.25 1 2.25 1
CAM 1.5 2.5 2.25 3 4.25 4 3 1.25
0
0.5
1
1.5
2
2.5
3
3.5
4
4.5
5
me
an
Researchjournali’s Journal of Technology Management Vol. 2 | No. 4 October | 2015
10
Fig 3: Integration of PDETs by Sub-Sector
8.2 PRODUCTION PLANNING TECHNOLOGIES
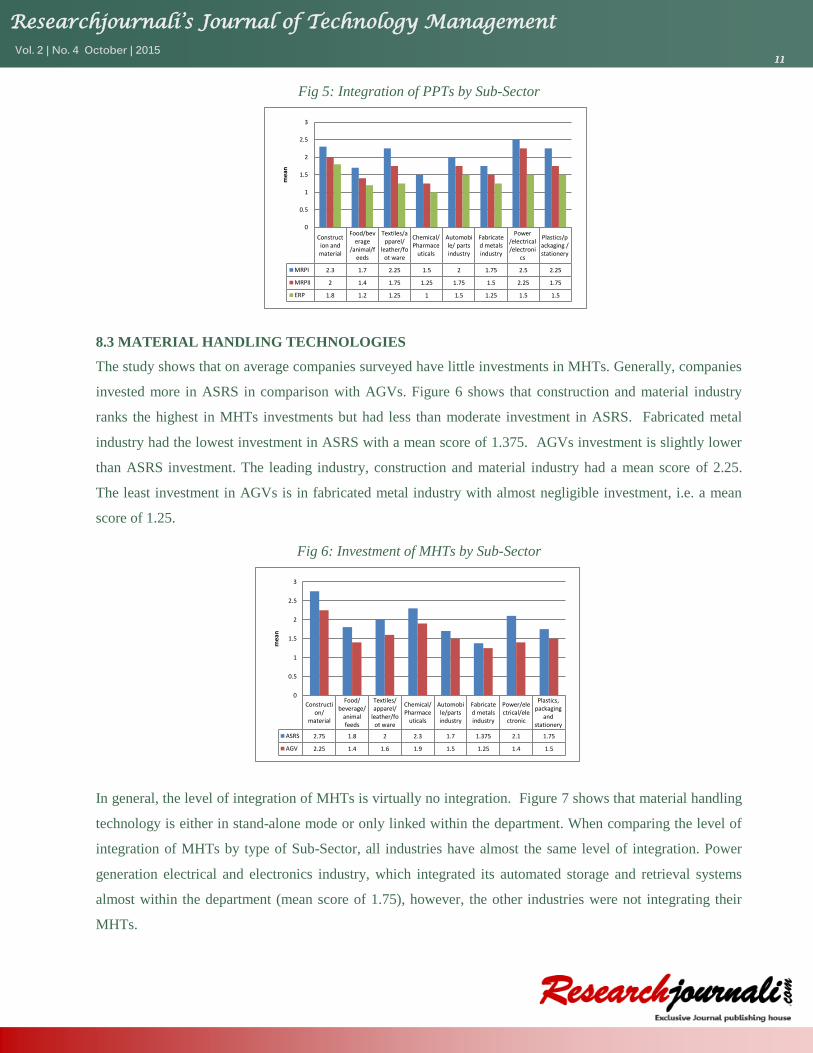
The whole manufacturing industry seems to have agreement on the investments in PPTs. As shown in Figure
4, the ranking of investments in the three technologies, from highest to lowest are MRP, MRPII and ERP. The
results show that indeed companies are still very much at the early version of PPT.
Fig 4: Investment in PPTs by Sub-Sectors
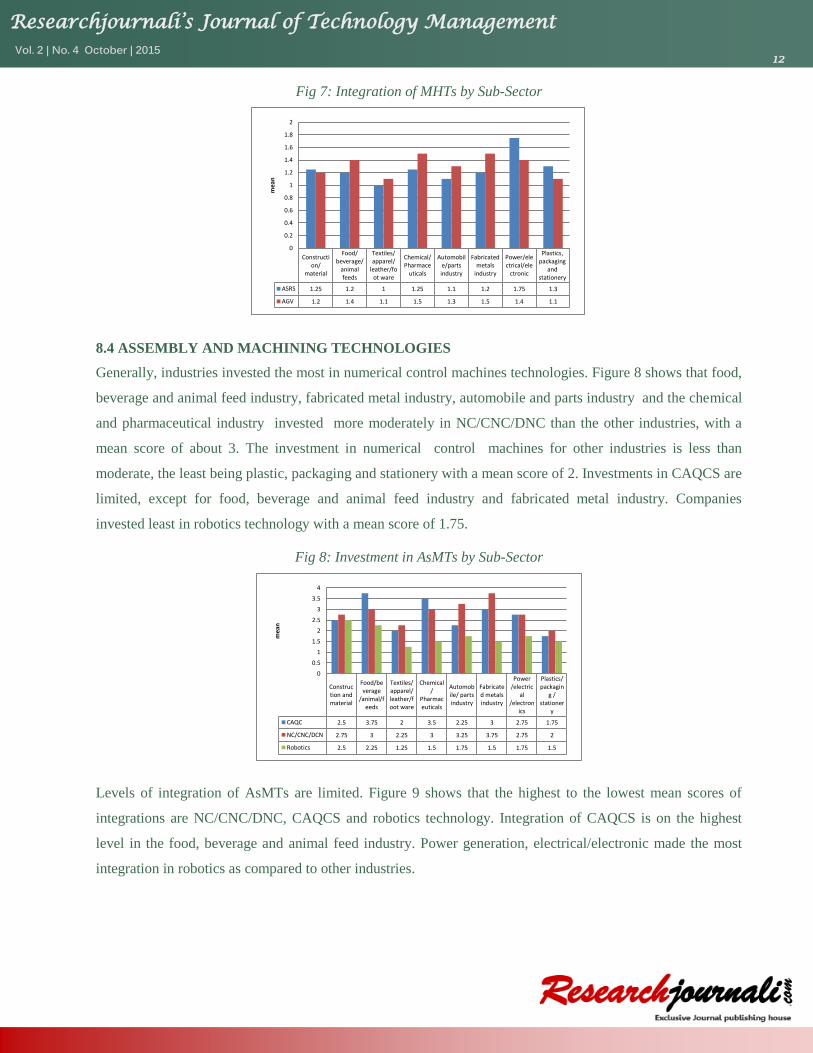
Generally, the level of integration for PPTs companies surveyed is limited, with a mean score of 2, showing
that integration is only within the department. As shown in Figure 5, the power
generation/electrical/electronic industry has slightly more integration as compared to other manufacturing
industry, with MRP and MRPII above 2. Chemical and pharmaceutical industry has the least integration, with
a mean score of 1.25.
Construction and
material
Food/beverage
/animal/feeds
Textiles/apparel/
leather/foot ware
Chemical/Pharmaceu
ticals
Automobile/ partsindustry
Fabricatedmetals
industry
Power/electrical/electronic
s
Plastics/packaging /
stationery
CAD 1.75 2.25 2.25 1.5 2.5 2.5 1.75 2
CAE 1.25 1.5 1.75 1 2 2 1.25 1.25
GT 1 1 1.5 1.5 2 1.75 1.5 1
CAM 1.5 2 2 2.5 2.25 2.25 1.5 1.5
00.5
11.5
22.5
3
me
an
Construction and
materialindustry
Food,beverage
andanimalfeeds
industry
Textiles,apparel,leather
and footware
Chemicaland
Pharmaceuticals
industry
Automobile andparts
industry
Fabricatedmetals
industry
Powergeneration
andelectricalappliance
Plastic/Packaging/Sta
ionary
MRP 2.3 1.7 2.2 1.9 2.1 1.8 2.7 2.4
MRPII 2.1 1.6 2.3 1.4 1.9 1.3 2.5 1.8
ERP 2 1.5 1.75 1.3 1.6 1.1 2 1.6
0
0.5
1
1.5
2
2.5
3
Me
an
Researchjournali’s Journal of Technology Management Vol. 2 | No. 4 October | 2015
11
Fig 5: Integration of PPTs by Sub-Sector
8.3 MATERIAL HANDLING TECHNOLOGIES
The study shows that on average companies surveyed have little investments in MHTs. Generally, companies
invested more in ASRS in comparison with AGVs. Figure 6 shows that construction and material industry
ranks the highest in MHTs investments but had less than moderate investment in ASRS. Fabricated metal
industry had the lowest investment in ASRS with a mean score of 1.375. AGVs investment is slightly lower
than ASRS investment. The leading industry, construction and material industry had a mean score of 2.25.
The least investment in AGVs is in fabricated metal industry with almost negligible investment, i.e. a mean
score of 1.25.
Fig 6: Investment of MHTs by Sub-Sector
In general, the level of integration of MHTs is virtually no integration. Figure 7 shows that material handling
technology is either in stand-alone mode or only linked within the department. When comparing the level of
integration of MHTs by type of Sub-Sector, all industries have almost the same level of integration. Power
generation electrical and electronics industry, which integrated its automated storage and retrieval systems
almost within the department (mean score of 1.75), however, the other industries were not integrating their
MHTs.
Construction andmaterial
Food/beverage
/animal/feeds
Textiles/apparel/
leather/foot ware
Chemical/Pharmace
uticals
Automobile/ partsindustry
Fabricated metalsindustry
Power/electrical/electroni
cs
Plastics/packaging /stationery
MRPI 2.3 1.7 2.25 1.5 2 1.75 2.5 2.25
MRPII 2 1.4 1.75 1.25 1.75 1.5 2.25 1.75
ERP 1.8 1.2 1.25 1 1.5 1.25 1.5 1.5
0
0.5
1
1.5
2
2.5
3
mea
n
Construction/
material
Food/beverage/
animalfeeds
Textiles/apparel/
leather/foot ware
Chemical/Pharmace
uticals
Automobile/partsindustry
Fabricated metalsindustry
Power/electrical/ele
ctronic
Plastics,packaging
andstationery
ASRS 2.75 1.8 2 2.3 1.7 1.375 2.1 1.75
AGV 2.25 1.4 1.6 1.9 1.5 1.25 1.4 1.5
0
0.5
1
1.5
2
2.5
3
me
an
Researchjournali’s Journal of Technology Management Vol. 2 | No. 4 October | 2015
12
Fig 7: Integration of MHTs by Sub-Sector
8.4 ASSEMBLY AND MACHINING TECHNOLOGIES
Generally, industries invested the most in numerical control machines technologies. Figure 8 shows that food,
beverage and animal feed industry, fabricated metal industry, automobile and parts industry and the chemical
and pharmaceutical industry invested more moderately in NC/CNC/DNC than the other industries, with a
mean score of about 3. The investment in numerical control machines for other industries is less than
moderate, the least being plastic, packaging and stationery with a mean score of 2. Investments in CAQCS are
limited, except for food, beverage and animal feed industry and fabricated metal industry. Companies
invested least in robotics technology with a mean score of 1.75.
Fig 8: Investment in AsMTs by Sub-Sector
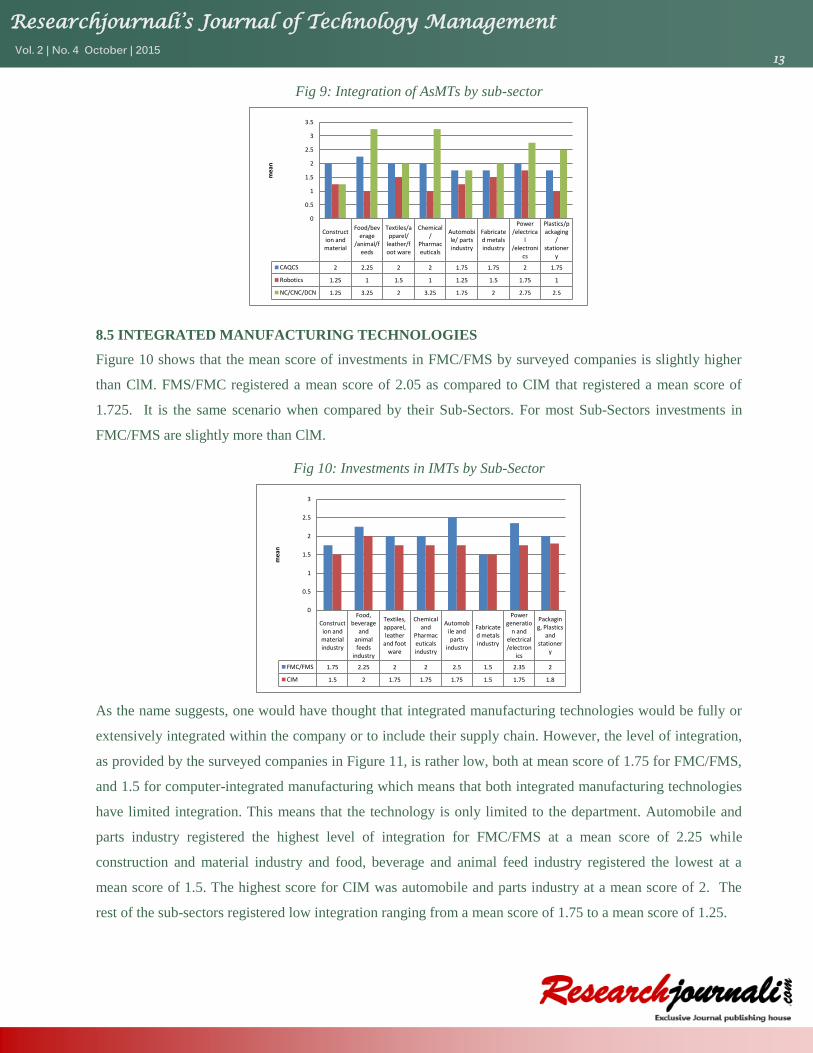
Levels of integration of AsMTs are limited. Figure 9 shows that the highest to the lowest mean scores of
integrations are NC/CNC/DNC, CAQCS and robotics technology. Integration of CAQCS is on the highest
level in the food, beverage and animal feed industry. Power generation, electrical/electronic made the most
integration in robotics as compared to other industries.
Construction/
material
Food/beverage/
animalfeeds
Textiles/apparel/
leather/foot ware
Chemical/Pharmace
uticals
Automobile/partsindustry
Fabricatedmetals
industry
Power/electrical/ele
ctronic
Plastics,packaging
andstationery
ASRS 1.25 1.2 1 1.25 1.1 1.2 1.75 1.3
AGV 1.2 1.4 1.1 1.5 1.3 1.5 1.4 1.1
0
0.2
0.4
0.6
0.8
1
1.2
1.4
1.6
1.8
2
mea
n
Construction andmaterial
Food/beverage
/animal/feeds
Textiles/apparel/leather/foot ware
Chemical/
Pharmaceuticals
Automobile/ partsindustry
Fabricated metalsindustry
Power/electric
al/electron
ics
Plastics/packagin
g /stationer
y
CAQC 2.5 3.75 2 3.5 2.25 3 2.75 1.75
NC/CNC/DCN 2.75 3 2.25 3 3.25 3.75 2.75 2
Robotics 2.5 2.25 1.25 1.5 1.75 1.5 1.75 1.5
0
0.5
1
1.5
2
2.5
3
3.5
4
me
an
Researchjournali’s Journal of Technology Management Vol. 2 | No. 4 October | 2015
13
Fig 9: Integration of AsMTs by sub-sector
8.5 INTEGRATED MANUFACTURING TECHNOLOGIES
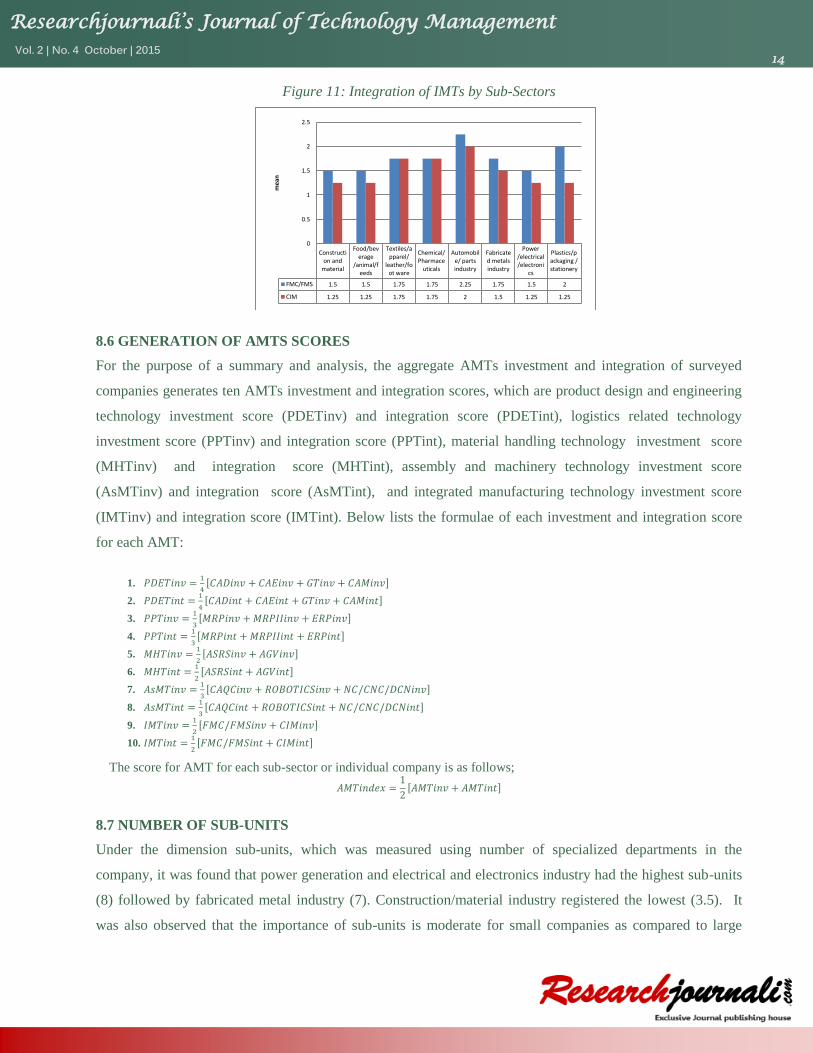
Figure 10 shows that the mean score of investments in FMC/FMS by surveyed companies is slightly higher
than ClM. FMS/FMC registered a mean score of 2.05 as compared to CIM that registered a mean score of
1.725. It is the same scenario when compared by their Sub-Sectors. For most Sub-Sectors investments in
FMC/FMS are slightly more than ClM.
Fig 10: Investments in IMTs by Sub-Sector
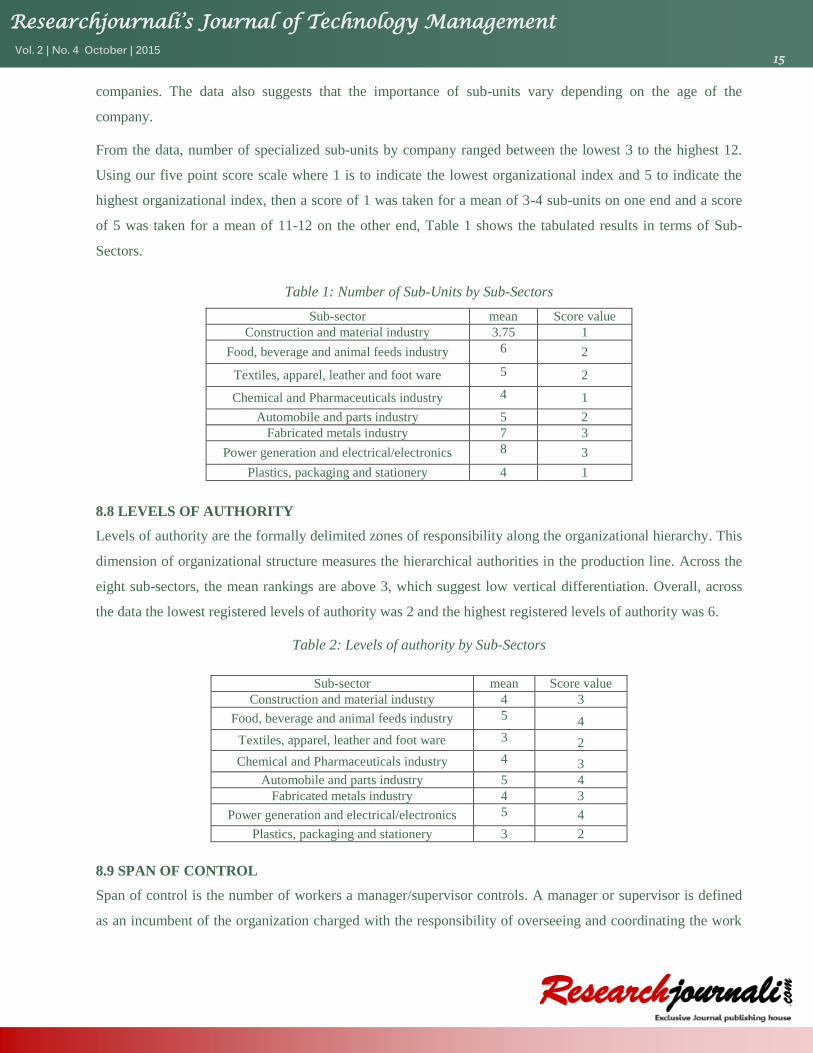
As the name suggests, one would have thought that integrated manufacturing technologies would be fully or
extensively integrated within the company or to include their supply chain. However, the level of integration,
as provided by the surveyed companies in Figure 11, is rather low, both at mean score of 1.75 for FMC/FMS,
and 1.5 for computer-integrated manufacturing which means that both integrated manufacturing technologies
have limited integration. This means that the technology is only limited to the department. Automobile and
parts industry registered the highest level of integration for FMC/FMS at a mean score of 2.25 while
construction and material industry and food, beverage and animal feed industry registered the lowest at a
mean score of 1.5. The highest score for CIM was automobile and parts industry at a mean score of 2. The
rest of the sub-sectors registered low integration ranging from a mean score of 1.75 to a mean score of 1.25.
Construction andmaterial
Food/beverage
/animal/feeds
Textiles/apparel/
leather/foot ware
Chemical/
Pharmaceuticals
Automobile/ partsindustry
Fabricated metalsindustry
Power/electrica
l/electroni
cs
Plastics/packaging
/stationer
y
CAQCS 2 2.25 2 2 1.75 1.75 2 1.75
Robotics 1.25 1 1.5 1 1.25 1.5 1.75 1
NC/CNC/DCN 1.25 3.25 2 3.25 1.75 2 2.75 2.5
0
0.5
1
1.5
2
2.5
3
3.5
mea
n
Construction andmaterialindustry
Food,beverage
andanimalfeeds
industry
Textiles,apparel,leather
and footware
Chemicaland
Pharmaceuticalsindustry
Automobile andparts
industry
Fabricated metalsindustry
Powergeneratio
n andelectrical/electron
ics
Packaging, Plastics
andstationer
y
FMC/FMS 1.75 2.25 2 2 2.5 1.5 2.35 2
CIM 1.5 2 1.75 1.75 1.75 1.5 1.75 1.8
0
0.5
1
1.5
2
2.5
3
me
an
Researchjournali’s Journal of Technology Management Vol. 2 | No. 4 October | 2015
14
Figure 11: Integration of IMTs by Sub-Sectors
8.6 GENERATION OF AMTS SCORES
For the purpose of a summary and analysis, the aggregate AMTs investment and integration of surveyed
companies generates ten AMTs investment and integration scores, which are product design and engineering
technology investment score (PDETinv) and integration score (PDETint), logistics related technology
investment score (PPTinv) and integration score (PPTint), material handling technology investment score
(MHTinv) and integration score (MHTint), assembly and machinery technology investment score
(AsMTinv) and integration score (AsMTint), and integrated manufacturing technology investment score
(IMTinv) and integration score (IMTint). Below lists the formulae of each investment and integration score
for each AMT:
1. 𝑃𝐷𝐸𝑇𝑖𝑛𝑣 =1
4[𝐶𝐴𝐷𝑖𝑛𝑣 + 𝐶𝐴𝐸𝑖𝑛𝑣 + 𝐺𝑇𝑖𝑛𝑣 + 𝐶𝐴𝑀𝑖𝑛𝑣]
2. 𝑃𝐷𝐸𝑇𝑖𝑛𝑡 =1
4[𝐶𝐴𝐷𝑖𝑛𝑡 + 𝐶𝐴𝐸𝑖𝑛𝑡 + 𝐺𝑇𝑖𝑛𝑣 + 𝐶𝐴𝑀𝑖𝑛𝑡]
3. 𝑃𝑃𝑇𝑖𝑛𝑣 =1
3[𝑀𝑅𝑃𝑖𝑛𝑣 +𝑀𝑅𝑃𝐼𝐼𝑖𝑛𝑣 + 𝐸𝑅𝑃𝑖𝑛𝑣]
4. 𝑃𝑃𝑇𝑖𝑛𝑡 =1
3[𝑀𝑅𝑃𝑖𝑛𝑡 + 𝑀𝑅𝑃𝐼𝐼𝑖𝑛𝑡 + 𝐸𝑅𝑃𝑖𝑛𝑡]
5. 𝑀𝐻𝑇𝑖𝑛𝑣 =1
2[𝐴𝑆𝑅𝑆𝑖𝑛𝑣 + 𝐴𝐺𝑉𝑖𝑛𝑣]
6. 𝑀𝐻𝑇𝑖𝑛𝑡 =1
2[𝐴𝑆𝑅𝑆𝑖𝑛𝑡 + 𝐴𝐺𝑉𝑖𝑛𝑡]
7. 𝐴𝑠𝑀𝑇𝑖𝑛𝑣 =1
3[𝐶𝐴𝑄𝐶𝑖𝑛𝑣 + 𝑅𝑂𝐵𝑂𝑇𝐼𝐶𝑆𝑖𝑛𝑣 + 𝑁𝐶/𝐶𝑁𝐶/𝐷𝐶𝑁𝑖𝑛𝑣]
8. 𝐴𝑠𝑀𝑇𝑖𝑛𝑡 =1
3[𝐶𝐴𝑄𝐶𝑖𝑛𝑡 + 𝑅𝑂𝐵𝑂𝑇𝐼𝐶𝑆𝑖𝑛𝑡 + 𝑁𝐶/𝐶𝑁𝐶/𝐷𝐶𝑁𝑖𝑛𝑡]
9. 𝐼𝑀𝑇𝑖𝑛𝑣 =1
2[𝐹𝑀𝐶/𝐹𝑀𝑆𝑖𝑛𝑣 + 𝐶𝐼𝑀𝑖𝑛𝑣]
10. 𝐼𝑀𝑇𝑖𝑛𝑡 =1
2[𝐹𝑀𝐶/𝐹𝑀𝑆𝑖𝑛𝑡 + 𝐶𝐼𝑀𝑖𝑛𝑡]
The score for AMT for each sub-sector or individual company is as follows;
𝐴𝑀𝑇𝑖𝑛𝑑𝑒𝑥 =1
2[𝐴𝑀𝑇𝑖𝑛𝑣 + 𝐴𝑀𝑇𝑖𝑛𝑡]
8.7 NUMBER OF SUB-UNITS
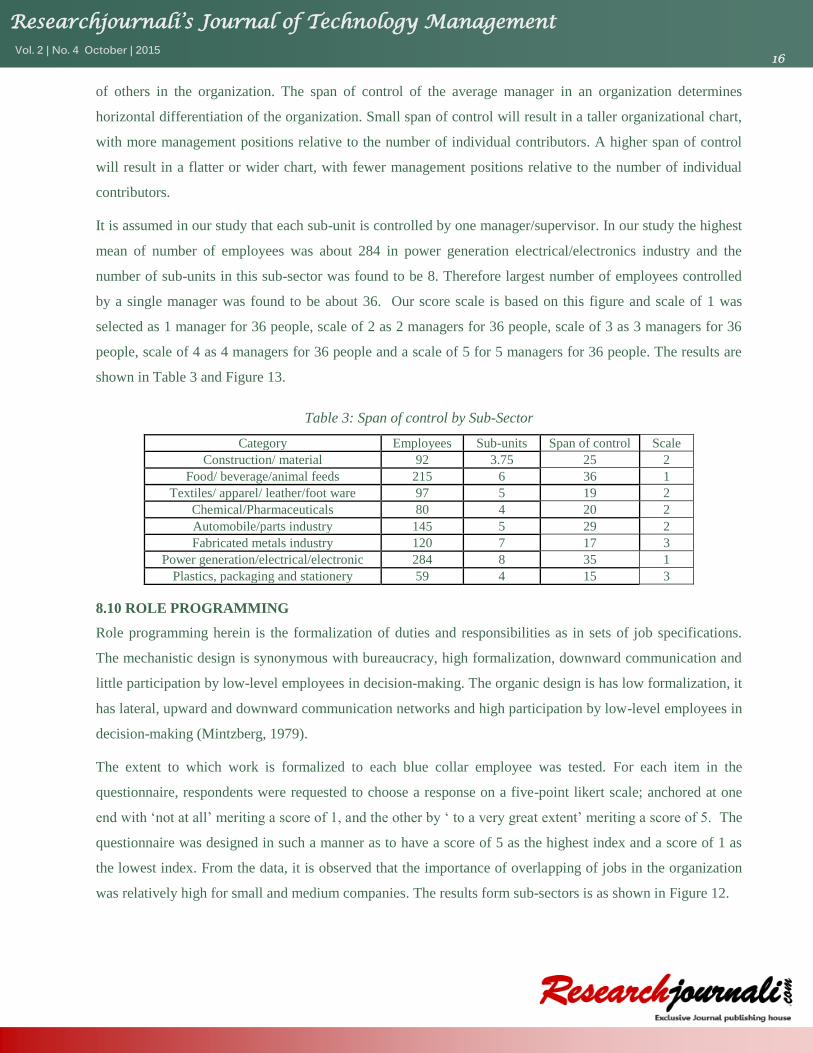
Under the dimension sub-units, which was measured using number of specialized departments in the
company, it was found that power generation and electrical and electronics industry had the highest sub-units
(8) followed by fabricated metal industry (7). Construction/material industry registered the lowest (3.5). It
was also observed that the importance of sub-units is moderate for small companies as compared to large
Construction and
material
Food/beverage
/animal/feeds
Textiles/apparel/
leather/foot ware
Chemical/Pharmace
uticals
Automobile/ partsindustry
Fabricated metalsindustry
Power/electrical/electroni
cs
Plastics/packaging /stationery
FMC/FMS 1.5 1.5 1.75 1.75 2.25 1.75 1.5 2
CIM 1.25 1.25 1.75 1.75 2 1.5 1.25 1.25
0
0.5
1
1.5
2
2.5
mea
n
Researchjournali’s Journal of Technology Management Vol. 2 | No. 4 October | 2015
15
companies. The data also suggests that the importance of sub-units vary depending on the age of the
company.
From the data, number of specialized sub-units by company ranged between the lowest 3 to the highest 12.
Using our five point score scale where 1 is to indicate the lowest organizational index and 5 to indicate the
highest organizational index, then a score of 1 was taken for a mean of 3-4 sub-units on one end and a score
of 5 was taken for a mean of 11-12 on the other end, Table 1 shows the tabulated results in terms of Sub-
Sectors.
Table 1: Number of Sub-Units by Sub-Sectors
Sub-sector mean Score value
Construction and material industry 3.75 1
Food, beverage and animal feeds industry 6 2
Textiles, apparel, leather and foot ware 5 2
Chemical and Pharmaceuticals industry 4 1
Automobile and parts industry 5 2
Fabricated metals industry 7 3
Power generation and electrical/electronics 8 3
Plastics, packaging and stationery 4 1
8.8 LEVELS OF AUTHORITY
Levels of authority are the formally delimited zones of responsibility along the organizational hierarchy. This
dimension of organizational structure measures the hierarchical authorities in the production line. Across the
eight sub-sectors, the mean rankings are above 3, which suggest low vertical differentiation. Overall, across
the data the lowest registered levels of authority was 2 and the highest registered levels of authority was 6.
Table 2: Levels of authority by Sub-Sectors
8.9 SPAN OF CONTROL
Span of control is the number of workers a manager/supervisor controls. A manager or supervisor is defined
as an incumbent of the organization charged with the responsibility of overseeing and coordinating the work
Sub-sector mean Score value
Construction and material industry 4 3
Food, beverage and animal feeds industry 5 4
Textiles, apparel, leather and foot ware 3 2
Chemical and Pharmaceuticals industry 4 3
Automobile and parts industry 5 4
Fabricated metals industry 4 3
Power generation and electrical/electronics 5 4
Plastics, packaging and stationery 3 2
Researchjournali’s Journal of Technology Management Vol. 2 | No. 4 October | 2015
16
of others in the organization. The span of control of the average manager in an organization determines
horizontal differentiation of the organization. Small span of control will result in a taller organizational chart,
with more management positions relative to the number of individual contributors. A higher span of control
will result in a flatter or wider chart, with fewer management positions relative to the number of individual
contributors.
It is assumed in our study that each sub-unit is controlled by one manager/supervisor. In our study the highest
mean of number of employees was about 284 in power generation electrical/electronics industry and the
number of sub-units in this sub-sector was found to be 8. Therefore largest number of employees controlled
by a single manager was found to be about 36. Our score scale is based on this figure and scale of 1 was
selected as 1 manager for 36 people, scale of 2 as 2 managers for 36 people, scale of 3 as 3 managers for 36
people, scale of 4 as 4 managers for 36 people and a scale of 5 for 5 managers for 36 people. The results are
shown in Table 3 and Figure 13.
Table 3: Span of control by Sub-Sector
Category Employees Sub-units Span of control Scale
Construction/ material 92 3.75 25 2
Food/ beverage/animal feeds 215 6 36 1
Textiles/ apparel/ leather/foot ware 97 5 19 2
Chemical/Pharmaceuticals 80 4 20 2
Automobile/parts industry 145 5 29 2
Fabricated metals industry 120 7 17 3
Power generation/electrical/electronic 284 8 35 1
Plastics, packaging and stationery 59 4 15 3
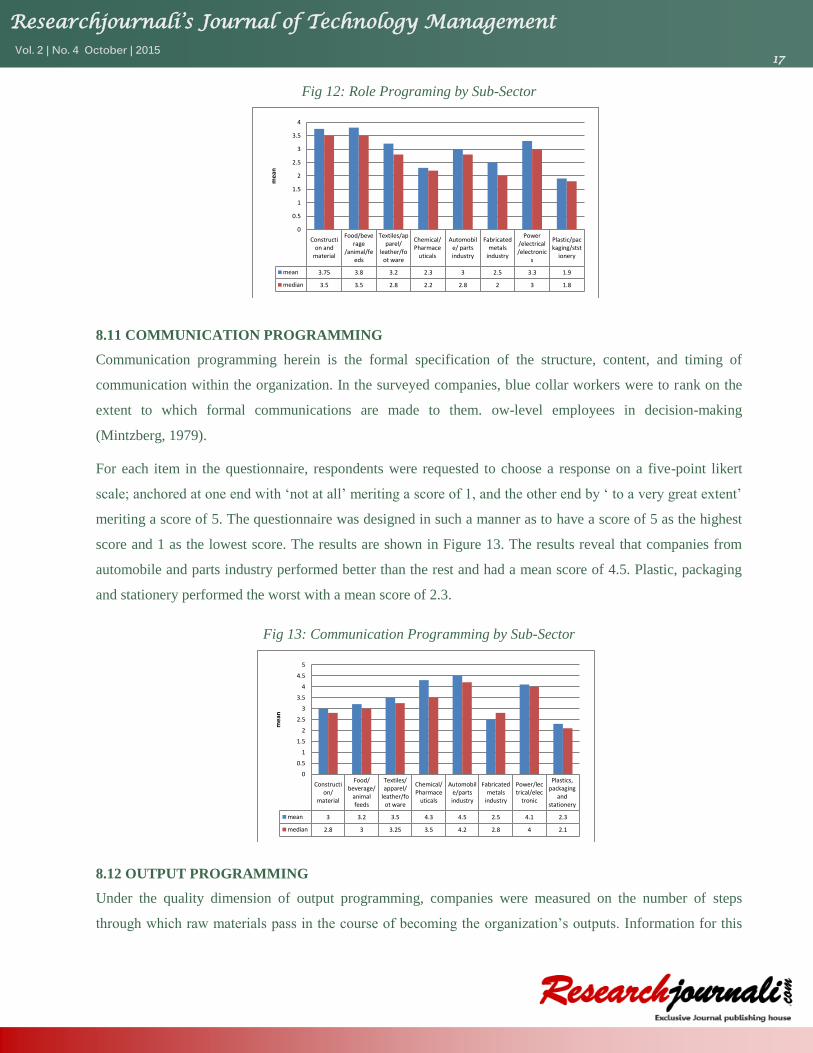
8.10 ROLE PROGRAMMING
Role programming herein is the formalization of duties and responsibilities as in sets of job specifications.
The mechanistic design is synonymous with bureaucracy, high formalization, downward communication and
little participation by low-level employees in decision-making. The organic design is has low formalization, it
has lateral, upward and downward communication networks and high participation by low-level employees in
decision-making (Mintzberg, 1979).
The extent to which work is formalized to each blue collar employee was tested. For each item in the
questionnaire, respondents were requested to choose a response on a five-point likert scale; anchored at one
end with ‘not at all’ meriting a score of 1, and the other by ‘ to a very great extent’ meriting a score of 5. The
questionnaire was designed in such a manner as to have a score of 5 as the highest index and a score of 1 as
the lowest index. From the data, it is observed that the importance of overlapping of jobs in the organization
was relatively high for small and medium companies. The results form sub-sectors is as shown in Figure 12.
Researchjournali’s Journal of Technology Management Vol. 2 | No. 4 October | 2015
17
Fig 12: Role Programing by Sub-Sector
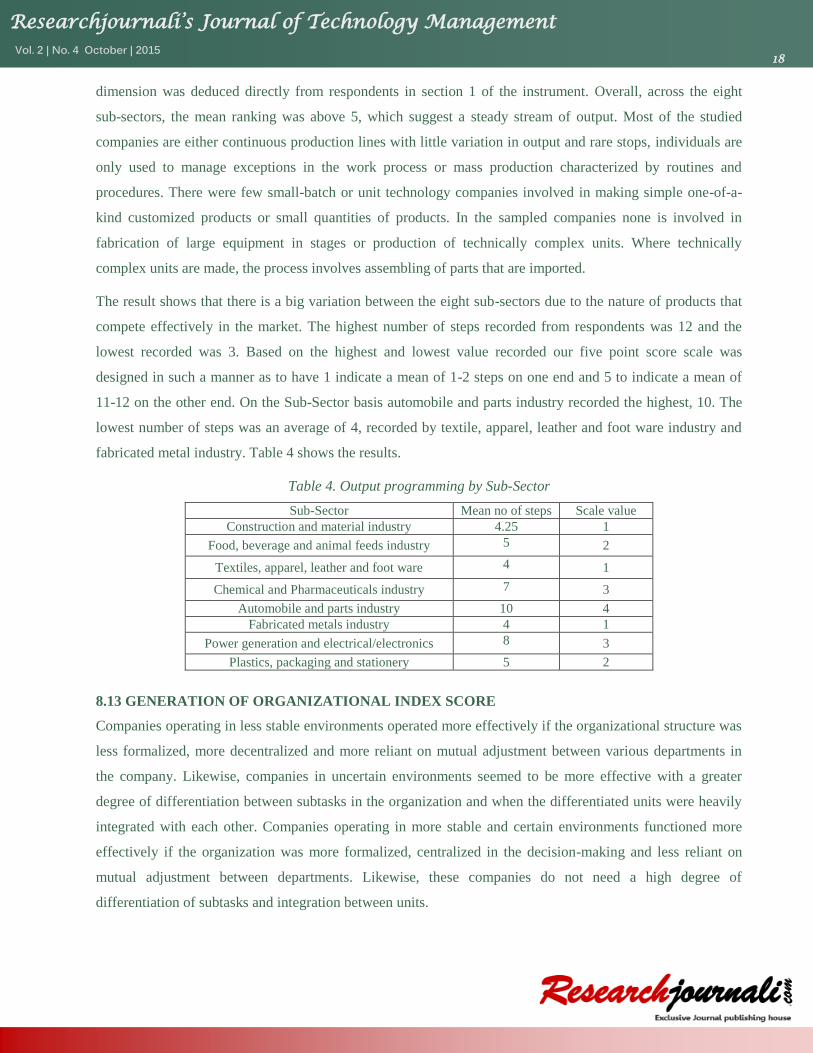
8.11 COMMUNICATION PROGRAMMING
Communication programming herein is the formal specification of the structure, content, and timing of
communication within the organization. In the surveyed companies, blue collar workers were to rank on the
extent to which formal communications are made to them. ow-level employees in decision-making
(Mintzberg, 1979).
For each item in the questionnaire, respondents were requested to choose a response on a five-point likert
scale; anchored at one end with ‘not at all’ meriting a score of 1, and the other end by ‘ to a very great extent’
meriting a score of 5. The questionnaire was designed in such a manner as to have a score of 5 as the highest
score and 1 as the lowest score. The results are shown in Figure 13. The results reveal that companies from
automobile and parts industry performed better than the rest and had a mean score of 4.5. Plastic, packaging
and stationery performed the worst with a mean score of 2.3.
Fig 13: Communication Programming by Sub-Sector
8.12 OUTPUT PROGRAMMING
Under the quality dimension of output programming, companies were measured on the number of steps
through which raw materials pass in the course of becoming the organization’s outputs. Information for this
Construction and
material
Food/beverage
/animal/feeds
Textiles/apparel/
leather/foot ware
Chemical/Pharmace
uticals
Automobile/ partsindustry
Fabricatedmetals
industry
Power/electrical/electronic
s
Plastic/packaging/stst
ionery
mean 3.75 3.8 3.2 2.3 3 2.5 3.3 1.9
median 3.5 3.5 2.8 2.2 2.8 2 3 1.8
0
0.5
1
1.5
2
2.5
3
3.5
4
mea
n
Construction/
material
Food/beverage/
animalfeeds
Textiles/apparel/
leather/foot ware
Chemical/Pharmace
uticals
Automobile/partsindustry
Fabricatedmetals
industry
Power/lectrical/elec
tronic
Plastics,packaging
andstationery
mean 3 3.2 3.5 4.3 4.5 2.5 4.1 2.3
median 2.8 3 3.25 3.5 4.2 2.8 4 2.1
0
0.5
1
1.5
2
2.5
3
3.5
4
4.5
5
mea
n
Researchjournali’s Journal of Technology Management Vol. 2 | No. 4 October | 2015
18
dimension was deduced directly from respondents in section 1 of the instrument. Overall, across the eight
sub-sectors, the mean ranking was above 5, which suggest a steady stream of output. Most of the studied
companies are either continuous production lines with little variation in output and rare stops, individuals are
only used to manage exceptions in the work process or mass production characterized by routines and
procedures. There were few small-batch or unit technology companies involved in making simple one-of-a-
kind customized products or small quantities of products. In the sampled companies none is involved in
fabrication of large equipment in stages or production of technically complex units. Where technically
complex units are made, the process involves assembling of parts that are imported.
The result shows that there is a big variation between the eight sub-sectors due to the nature of products that
compete effectively in the market. The highest number of steps recorded from respondents was 12 and the
lowest recorded was 3. Based on the highest and lowest value recorded our five point score scale was
designed in such a manner as to have 1 indicate a mean of 1-2 steps on one end and 5 to indicate a mean of
11-12 on the other end. On the Sub-Sector basis automobile and parts industry recorded the highest, 10. The
lowest number of steps was an average of 4, recorded by textile, apparel, leather and foot ware industry and
fabricated metal industry. Table 4 shows the results.
Table 4. Output programming by Sub-Sector
Sub-Sector Mean no of steps Scale value
Construction and material industry 4.25 1
Food, beverage and animal feeds industry 5 2
Textiles, apparel, leather and foot ware 4 1
Chemical and Pharmaceuticals industry 7 3
Automobile and parts industry 10 4
Fabricated metals industry 4 1
Power generation and electrical/electronics 8 3
Plastics, packaging and stationery 5 2
8.13 GENERATION OF ORGANIZATIONAL INDEX SCORE
Companies operating in less stable environments operated more effectively if the organizational structure was
less formalized, more decentralized and more reliant on mutual adjustment between various departments in
the company. Likewise, companies in uncertain environments seemed to be more effective with a greater
degree of differentiation between subtasks in the organization and when the differentiated units were heavily
integrated with each other. Companies operating in more stable and certain environments functioned more
effectively if the organization was more formalized, centralized in the decision-making and less reliant on
mutual adjustment between departments. Likewise, these companies do not need a high degree of
differentiation of subtasks and integration between units.
Researchjournali’s Journal of Technology Management Vol. 2 | No. 4 October | 2015
19
From the analysis above, we have descriptive knowledge of detailed organizational structure dimensions from
our surveyed companies. Organizational index of each company is taken as the average measure of
dimensions score. For the convenience of comparison and analysis, the following equation gives us the
organizational index for each company and also for each sub-sector.
Organizational index (OI) =(Χ01+Χ02+Χ03+Χ04+Χ05+Χ06)/6 where
Χ01 = Sub-unit score
Χ02 = Levels of authority score
Χ03 = Span of control score
Χ04 = Role programming score
Χ05 = Communication programming score
Χ06 = Out programming score
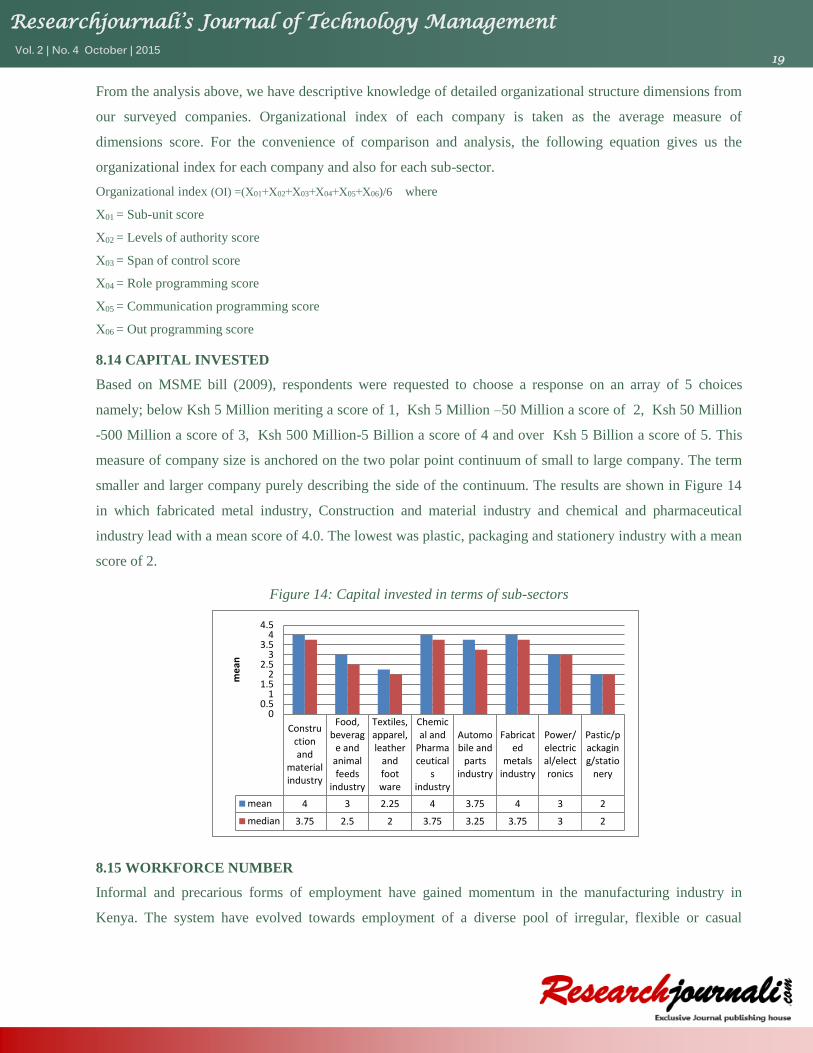
8.14 CAPITAL INVESTED
Based on MSME bill (2009), respondents were requested to choose a response on an array of 5 choices
namely; below Ksh 5 Million meriting a score of 1, Ksh 5 Million –50 Million a score of 2, Ksh 50 Million
-500 Million a score of 3, Ksh 500 Million-5 Billion a score of 4 and over Ksh 5 Billion a score of 5. This
measure of company size is anchored on the two polar point continuum of small to large company. The term
smaller and larger company purely describing the side of the continuum. The results are shown in Figure 14
in which fabricated metal industry, Construction and material industry and chemical and pharmaceutical
industry lead with a mean score of 4.0. The lowest was plastic, packaging and stationery industry with a mean
score of 2.
Figure 14: Capital invested in terms of sub-sectors
8.15 WORKFORCE NUMBER
Informal and precarious forms of employment have gained momentum in the manufacturing industry in
Kenya. The system have evolved towards employment of a diverse pool of irregular, flexible or casual
Constructionand
materialindustry
Food,beverag
e andanimalfeeds
industry
Textiles,apparel,leather
andfootware
Chemical and
Pharmaceutical
sindustry
Automobile and
partsindustry
Fabricated
metalsindustry
Power/electrical/electronics
Pastic/packaging/statio
nery
mean 4 3 2.25 4 3.75 4 3 2
median 3.75 2.5 2 3.75 3.25 3.75 3 2
00.5
11.5
22.5
33.5
44.5
me
an
Researchjournali’s Journal of Technology Management Vol. 2 | No. 4 October | 2015
20
workers with no formal labor contracts and employment benefits. Most of these employment effects have
been witnessed during the period of intense trade liberalization and openness. This may have been largely
undertaken as a cost-cutting strategy as casual workers usually do not enjoy fringe benefits or other
employment benefits such as house allowance, medical allowance and so on. The study used the full-time
equivalent (FTE) employees as the number of employees, where one part-time employee is equal to half of a
full-time employee.
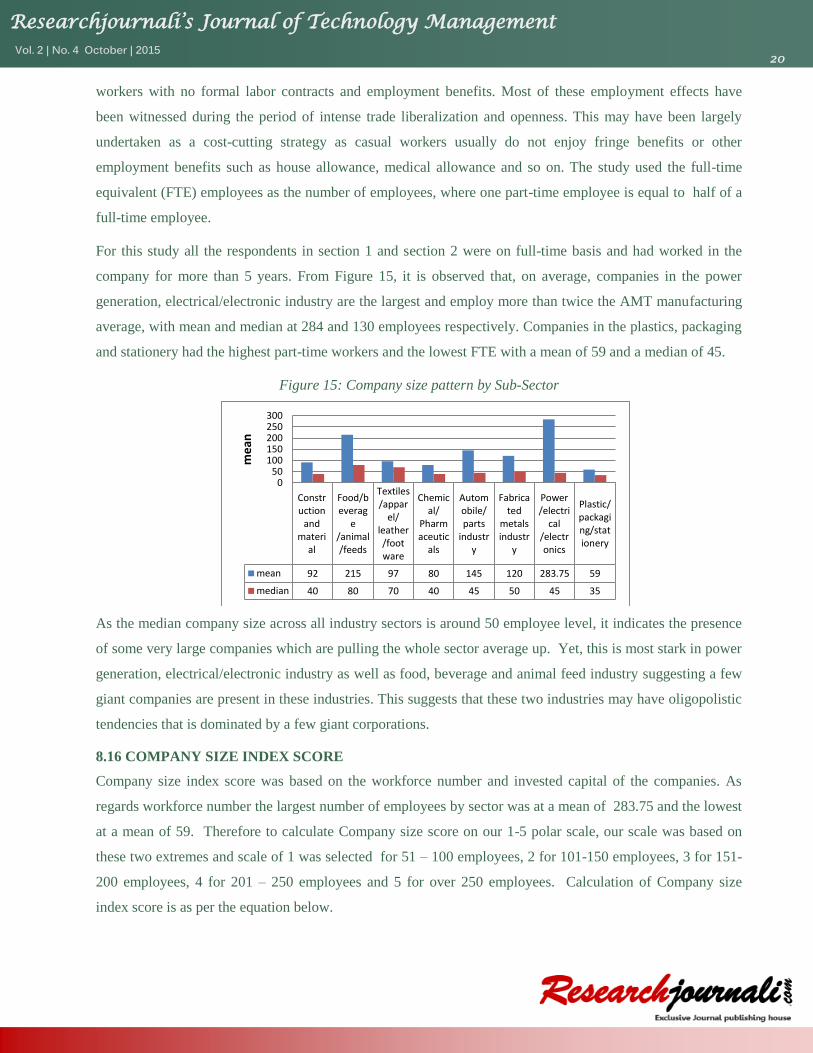
For this study all the respondents in section 1 and section 2 were on full-time basis and had worked in the
company for more than 5 years. From Figure 15, it is observed that, on average, companies in the power
generation, electrical/electronic industry are the largest and employ more than twice the AMT manufacturing
average, with mean and median at 284 and 130 employees respectively. Companies in the plastics, packaging
and stationery had the highest part-time workers and the lowest FTE with a mean of 59 and a median of 45.
Figure 15: Company size pattern by Sub-Sector
As the median company size across all industry sectors is around 50 employee level, it indicates the presence
of some very large companies which are pulling the whole sector average up. Yet, this is most stark in power
generation, electrical/electronic industry as well as food, beverage and animal feed industry suggesting a few
giant companies are present in these industries. This suggests that these two industries may have oligopolistic
tendencies that is dominated by a few giant corporations.
8.16 COMPANY SIZE INDEX SCORE
Company size index score was based on the workforce number and invested capital of the companies. As
regards workforce number the largest number of employees by sector was at a mean of 283.75 and the lowest
at a mean of 59. Therefore to calculate Company size score on our 1-5 polar scale, our scale was based on
these two extremes and scale of 1 was selected for 51 – 100 employees, 2 for 101-150 employees, 3 for 151-
200 employees, 4 for 201 – 250 employees and 5 for over 250 employees. Calculation of Company size
index score is as per the equation below.
Construction
andmateri
al
Food/beverag
e/animal/feeds
Textiles/appar
el/leather/footware
Chemical/
Pharmaceutic
als
Automobile/parts
industry
Fabricated
metalsindustr
y
Power/electri
cal/electronics
Plastic/packaging/stationery
mean 92 215 97 80 145 120 283.75 59
median 40 80 70 40 45 50 45 35
050
100150200250300
me
an
Researchjournali’s Journal of Technology Management Vol. 2 | No. 4 October | 2015
21
Company Size Index (CSI) = (Χ01 + Χ02)/2 where
Χ01 = Capital invested score
Χ02 = Workforce number score
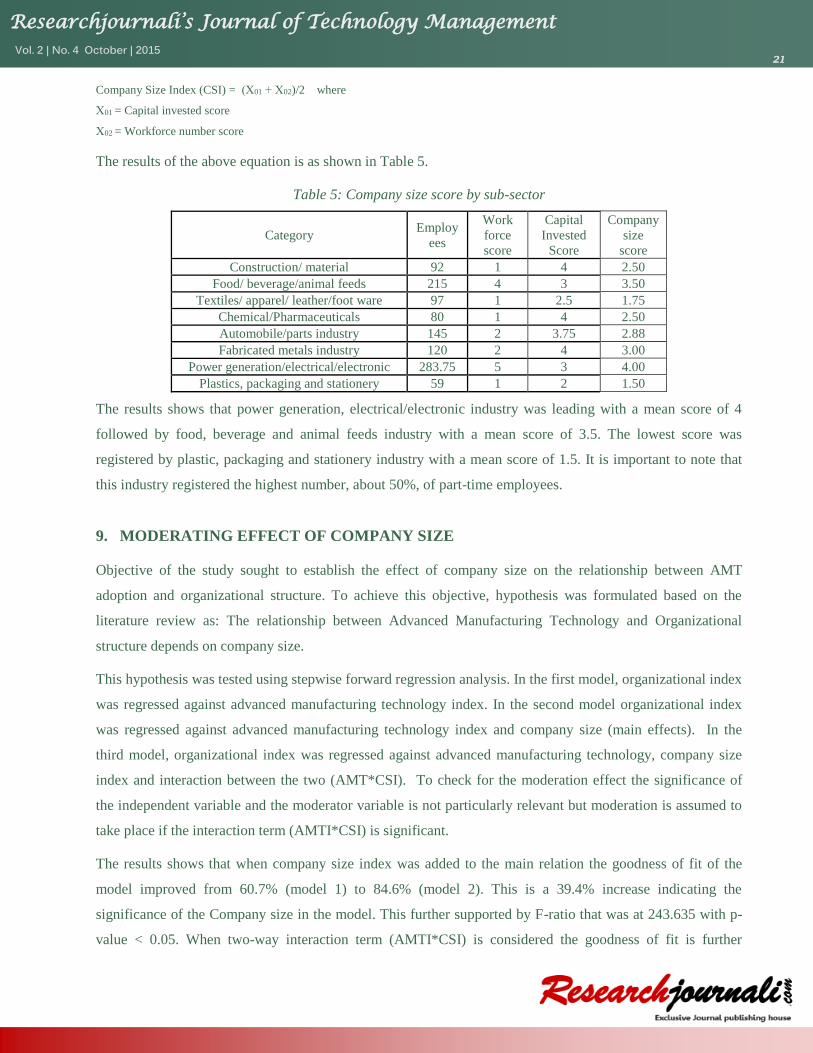
The results of the above equation is as shown in Table 5.
Table 5: Company size score by sub-sector
Category Employ
ees
Work
force
score
Capital
Invested
Score
Company
size
score
Construction/ material 92 1 4 2.50
Food/ beverage/animal feeds 215 4 3 3.50
Textiles/ apparel/ leather/foot ware 97 1 2.5 1.75
Chemical/Pharmaceuticals 80 1 4 2.50
Automobile/parts industry 145 2 3.75 2.88
Fabricated metals industry 120 2 4 3.00
Power generation/electrical/electronic 283.75 5 3 4.00
Plastics, packaging and stationery 59 1 2 1.50
The results shows that power generation, electrical/electronic industry was leading with a mean score of 4
followed by food, beverage and animal feeds industry with a mean score of 3.5. The lowest score was
registered by plastic, packaging and stationery industry with a mean score of 1.5. It is important to note that
this industry registered the highest number, about 50%, of part-time employees.
9. MODERATING EFFECT OF COMPANY SIZE
Objective of the study sought to establish the effect of company size on the relationship between AMT
adoption and organizational structure. To achieve this objective, hypothesis was formulated based on the
literature review as: The relationship between Advanced Manufacturing Technology and Organizational
structure depends on company size.
This hypothesis was tested using stepwise forward regression analysis. In the first model, organizational index
was regressed against advanced manufacturing technology index. In the second model organizational index
was regressed against advanced manufacturing technology index and company size (main effects). In the
third model, organizational index was regressed against advanced manufacturing technology, company size
index and interaction between the two (AMT*CSI). To check for the moderation effect the significance of
the independent variable and the moderator variable is not particularly relevant but moderation is assumed to
take place if the interaction term (AMTI*CSI) is significant.
The results shows that when company size index was added to the main relation the goodness of fit of the
model improved from 60.7% (model 1) to 84.6% (model 2). This is a 39.4% increase indicating the
significance of the Company size in the model. This further supported by F-ratio that was at 243.635 with p-
value < 0.05. When two-way interaction term (AMTI*CSI) is considered the goodness of fit is further
Researchjournali’s Journal of Technology Management Vol. 2 | No. 4 October | 2015
22
improved. The results shows that model 3 explained 85.3% of variation in organizational index (R2 =0.853).
The results reveals that R2 increased by 0.83% from 0.846 to 0.853 when the interaction variable was added.
The results shows a statistically significant relationship between OI and AMTI, CSI and AMTI*CSI
(F=169.924 with p< 0.05).
This results suggest that interaction between AMT index and company size index is significantly related with
organizational index. Coefficients of the explanatory variables were 0.652 with p-value at 0.502 for AMTI
and -0.568 with p-value at 0.177 for CSI. Coefficient for the interaction term was positive at 0.468 with p-
value at 0.041. The constant of the model was 0.974 at p-value of 0.582. From these results only the
interactive term is significant at 95% level of confidence. The regression equations for the models can
therefore be fitted as follows:
OI31 = -5.55 + 4.722(AMTI) + ε31 model 1
OI32 = -2.524 + 2.559(AMTI) + 0.297(CSI) +ε32 model 2
OI33 = 0.468(AMTI*CSI) + ε33 model 3
Where,
OI = Organizational index,
AMTI = Advanced manufacturing technology index
CSI = Company size index
AMTI*CSI = AMT and CSI Interaction term
ε31, ε32, ε33 = Error terms
The equations indicates that company size statistically moderates the relation between AMT adoption and
organizational structure indicating that there is a linear dependence of OI from AMTI*CSI. This implies that
changes in company size positively and significantly affect AMTI and OI relationship as the direction of the
relation is positive. This means that the hypothesis that the relationship between Advanced Manufacturing
Technology and Organizational structure depends on company size is therefore supported.
10. CONCLUSIONS
The objective of the study was to determine the effect of Human Factors on the relationship between AMT
adoption and organizational structure. The hypothesis we seek to test is that human factors moderates the
relationship between AMT adoption and organizational structure. The degree of fit between AMT index and
organizational index will increase as the level in eliminating psychological effects among blue collar
employees increases. The third objective of the study was to determine the effect of company size on the
relationship between AMT adoption and organizational structure. Evidence in the literature shows that
conventional technology use increases with company size, measured as the logarithm of workforce number
(Yasai-Ardekani, 1989). In our study company size was operationalized further in terms of workforce number
and capital invested. With this measure of company size the hypothesis we seek to test is that the relation
between AMT adoption and organizational structure depends on company size. The average employment
Researchjournali’s Journal of Technology Management Vol. 2 | No. 4 October | 2015
23
across the sub-sector was found to be around 140 but the median was at around 50. This is an indication of the
presence of some very large companies which were pulling the whole sub-sector average up. When
empirically tested, the research findings present the interrelationships among the main effects (AMT index
and company size) and the interactions (AMT index * Company size). Four dominant findings emerged from
the study.
First, company size positively moderates the relationship between AMT adoption and Organizational
structure. Our stepwise regression equation on organizational structure against the main effects (AMTI and
CSI) and the interaction term (AMTI*CSI) revealed that the coefficients of the main effects were 0.652 with
p-value at 0.502 for AMT index and -0.568 with p-value at 0.177 for company size index. Coefficient for the
interaction term (AMTI*CSI) was positive at 0.468 with p-value at 0.041. The constant of the model was
0.974 at p-value of 0.582. From these results only the interactive term is significant at 95% level of
confidence. The regression equation reduced to OI = 0.468(AMTI*CSI) + ε33. The equations indicates that
CSI statistically moderates the relation between AMT adoption and organizational structure indicating that
there is a linear dependence of OI from AMTI*CSI. This implies that changes in company size index
positively and significantly affect AMTI and OI relationship as the direction of the relation is positive. This
means that the hypothesis that the relationship between Advanced Manufacturing Technology and
Organizational structure depends on company size is therefore supported. In agreement with Yusuff et al.
(2008) the broader product line in large companies may contribute to better use of AMTs. This finding means
that Company size enhances the fit between AMT adoption and organizational structure perhaps due to larger
companies’ command of resources which gives them access to skilled operators and professionals who could
get more out of these technologies.
Second, we found a positive linear relationship between organizational structure, AMT adoption and company
size (OI = -2.524 + 2.559(AMTI) + 0.297(CSI) +ε32). The study revealed that the introduction of capital
invested as a dimension of size linearized the relation of AMT adoption and company size. This is supported
by the scatter diagram in Appendix 7. In previous empirical studies where company size was only measured
in terms of workforce number, literature shows that conventional technology use increases with company size
logarithmically (Noe et al., 2008; Yasai-Ardekani, 1989). In particular when all other terms are held constant
a unit increase in company size will results in 0.297 increase in organizational index.
Thirdly, we found a weak positive linear relationship between AMT adoption and company size (AMTI =
1.700 + 0.048(CSI)). The investment of numerical controlled machines was highest in the medium industries
but integration of this technology increased linearly with company size. The study found that the skill demand
of AMT is a formidable challenge for smaller manufacturing companies to acquire and retain. The strongest
determinants of the level of AMT adoption are by far the technical skills of blue-collar workers followed by
Researchjournali’s Journal of Technology Management Vol. 2 | No. 4 October | 2015
24
the influence of customers and vendors. In agreement with Noe et al. (2008) large companies also are likely to
have the skills and human resources it takes to understand, implement, and manage such technologies.
Fourthly, the result of our empirical analyses confirms that the availability of monetary assets is indispensably
significant in determining the fate of AMT implementation. Other studies have shown that companies, with
less capital invested, were found to have limited AMT adoption probably because of their fragile financial
resources which lead to reluctance to invest in AMTs (Ettlie, 1990, Voss, 1988; Scott and Davis; 2007).
Likewise, Pearson and Grandon (2004) found that availability of monetary assets is indispensably significant
to managers and owners, and such subjects often determine the fate of AMT implementation, particularly in
smaller manufacturing companies. Companies with higher capital invested were found to use AMTs to make
manufacturing easier, more accurate, flexible, sophisticated, faster and cheaper.
11. REFERENCE
Boyer, K.K, G. Keong Leong, P.T. Ward, and L.J. Krajewski (1997). Unlocking the Potential of advanced Manufacturing
Technologies. Journal of Operations Management 15. pp. 331-347.
Child, J. & Mansfield, R. (1972). Technology, size and organization structure, Sociology, 6,369–393
Dornfeld, D.,(2011) “Leveraging Manufacturing for a Sustainable Future,” Proceedings of 18th CIRP International Conference on
Life Cycle Engineering (LCE2011), University of Braunschweig, Germany, May, 2011, pp. 17-21.
Edward-Schachter, M., Castro- Martínez, E., Fernández-de-Lucio, I. (2011). International Co-operation between Companies on
Innovation and R&D: Empirical Evidence from Argentina and Spain. Journal of Technology Management & Innovation, 6 (3), 126-
147.
Efstathiades, A., S.A. Tassou, G. Oxinos and A. Antoniou, (2000). Advanced manufacturing technology transfer and implementation
in developing countries: The case of the Cypriot manufacturing industry. Technovation, 20: 93-102.
Ettlte, J. E. (1990). What makes a manufacturing company innovative‘? Academy of Management executive 4(4):7-20.
Fry, L. W. (1982). Technology–structure research: three critical issues. Academy of Management Journal, 25, 532–552.
Ghani, K. A. (2002). Impact of advanced manufacturing technology on organizational structure and work attitudes of blue-collar
employees. PhD thesis published, Anna University, Chennai, India.
Godwin, J. U., Ehie, I.C., and Oluruniwo, F. (1995).Fulfilling the Promises of Advanced Manufacturing Systems. IM. Sept/ Oct. pp.
23-28.
Hunt, V. D. (1987). Dictionary of advanced manufacturing technology. London: Elsevier.
Lawrence, P. R., & Lorsch, J. N. (1969). Organization and environment. Homewood, IL: Irwin
Li, P., Xie, W. (2012). A strategic framework for determining e-commerce adoption. Journal of Technology Management in China, 7
(1), 22-35.
Li, D., Lai, F., Wang, J.E. (2010). E-business assimilation in China’s international trade companies: the technology-organization
environment framework. Journal of Global Information Management, 18 (1) 39-65
Lim, M., G. Griffiths, and S. Sambrook. (2010). Organizational structure for the twenty-first century. Presented at the annual meeting
of The Institute for Operations Research and The Management Sciences, Austin. London: Tavistock Publications.
Love, D., Irani, Z., LI, H., Cheng, L., Tse, Y. (2001). An empirical analysis of the barriers to implementing e-commerce in small-
medium-sized construction contractors in the state of Victoria, Australia. Construction Innovation, 1(1), 31-41. Mansfield (1993)
Researchjournali’s Journal of Technology Management Vol. 2 | No. 4 October | 2015
25
Meredith, J. R., & Hill, M. M. (1987, Summer). Justifying new manufacturing systems: a managerial approach. Sloan Management
Review, 29(3), 49–61.
Mintzberg, H. (1979). The structuring of organizations. New Jersey: Prentice-Hall.
Mirmahdi D. (2012). Advanced Manufacturing Technology Adoption in SMEs: an Integrative Model. Journal of Technology
Management & Innovation. Volume 7, Issue 4
Noe, A. R., Hollenbeck, J. R., Gerhart, B., Wright, P. M. (2008). Human Resource Management: Getting a Competitive Advantage
.McGraw-Hill, New York.
Pearson, M., Grandon, E. (2004). E-commerce adoption: perceptions of managers/owners of small and medium-sized companies in
Chile. Communications of the Association for Information Systems, 13(8). 81-102.
Pugh, D. S., ed. (1990).Organization Theory: Selected Readings. Harmond sworth: Penguin.
Rahman, A. A., Bennett, D. (2009). Advanced manufacturing technology adoption in developing countries: The role of buyer-supplier
relationships. Journal of Manufacturing Technology Management, 20(8), 1099-1118.
Rosnah et al. (2003)
Rosnah, M.Y., Ahmad, M.M.H.M., Sulaiman, S. and Mohammad, Z. (2003) Increasing Competitiveness through advanced
manufacturing technologies, International journal of Manufacturing Technology and Management, Vol.5, No.4, pp.371-379.
Scott, W. R., & Davis, G. F. (2007). Organizations and organizing: Rational, natural, and open system perspectives. New Jersey:
Pearson Prentice Hall.
Simpson, M., Doherty, A. J. (2004). E-commerce adoption support and advice for UK SMEs. Journal of Small Business and
Enterprise Development, 11(3), 315-28.
Small, M.H., and Chen, 1.1. (1997), Organizational development and time based flexibility: an empirical analysis of AMT adoptions.
International Journal of Production Research. 35(11),3005-3021
Spanos, Y. E., Voudouris, I. (2009). Antecedents and trajectories of AMT adoption: The case of Greek manufacturing SMEs.
Research Policy, 38 (9) 144–155.
Sun, X.L., Y.Z. Tian and G.G. Cui, 2007. The empirical study on the impact of advanced manufacturing technology on organizational
structure and human resources management. Proceedings of the 14th International Conference on Management Science and
Engineering, Aug. 20-22, IEEE Xplore, London, 1548-1553.
Voss, C.A. (1988) Success and Failure in Advanced Manufacturing Technology. International Journal of Technology Management.
Vol. 3. no.3. pp. 285-297.
Woodward, J. (1965). Industrial organization: theory and practice. London: Oxford University Press.
Xu, S., Zhu, K., Gibbs, J. (2004), "Global technology, local adoption: a cross-country investigation of internet adoption by companies
in the United States and China", Electronic Markets, Vol. 14 No.1, pp.13-24.
Yasai-Ardekani, M. (1989), Effect of Environmental Scarcity and Munificence on the Relationship of
Context to Organizational Structure, Academy Management Journal, 32, pp. 131–156.
Youssef, M.A., 1992. Getting to know advanced manufacturing technologies. Industrial Engineering, 24: 40-42.
Yusuff, R.M., Saberi, S., Zulkifli, N. (2008). A comparison on the capabilities of Malaysian SMEs with different equity structure in
implementing advanced manufacturing technologies. Asian International Journal of Science and Technology in Production and
Manufacturing Engineering, 1(15), 63-75


