Embed Size (px)
Citation preview
lable at ScienceDirect
Polymer Degradation and Stability 107 (2014) 356e365
Contents lists avai
Polymer Degradation and Stability
journal homepage: www.elsevier .com/locate/polydegstab
Advanced non-invasive fluorescence spectroscopy and imaging formapping photo-oxidative degradation in acrylonitrileebutadieneestyrene: A study of model samples and of an object from the 1960s
D. Comelli a,*, F. Toja b, C. D’Andrea a,c, L. Toniolo b, G. Valentini a, M. Lazzari d, A. Nevin e
aDipartimento di Fisica, Politecnico di Milano, Piazza Leonardo da Vinci 32, Milano 20133, ItalybDipartimento di Chimica, Politecnico di Milano, Via Mancinelli 7, Milano 20133, ItalycCenter for NanoScience and Technology CNST-IIT@POLIMI, via Pascoli 70/3, 20133 Milano, ItalydCentre for Research in Biological Chemistry and Molecular Materials (CIQUS), University of Santiago de Compostela, 15782 Santiago de Compostela, Spaine Istituto di Fotonica e Nanotecnologie - Consiglio Nazionale delle Ricerche (IFN-CNR), Dipartimento di Fisica, Politecnico di Milano, Piazza Leonardo daVinci 32, Milano 20133, Italy
a r t i c l e i n f o
Article history:Received 20 September 2013Received in revised form15 December 2013Accepted 23 December 2013Available online 3 January 2014
Keywords:AcrylonitrileebutadieneestyreneFluorescence spectroscopyFluorescence lifetimeMultispectral imagingDesign objectsPhoto-oxidation
* Corresponding author. Tel.: þ39 0223996165; faxE-mail addresses: [email protected]
(D. Comelli).
0141-3910/$ e see front matter � 2013 Elsevier Ltd.http://dx.doi.org/10.1016/j.polymdegradstab.2013.12.0
a b s t r a c t
Complementary use of fluorescence multispectral imaging and fluorescence lifetime imaging (FLIM) forthe assessment of the degradation of a historical design object made in acrylonitrileebutadieneestyrene(ABS) is demonstrated. Model samples of ABS, exposed to UV irradiation to simulate photodegradation,have been analysed with fluorescence spectroscopy and fluorescence lifetime spectroscopy. Resultsdemonstrate rapid modifications of the picosecond and nanosecond fluorescence lifetimes followingshort irradiation times, which are accompanied with significant modifications in fluorescence excitation-emission spectra. Changes in spectra and lifetimes in samples are ascribed to the accumulation of a,bunsaturated aldehydes and a,b diketones and the loss of volatile organic components (including ace-tophenone). Complementary analyses of samples with Fourier transform infrared spectroscopy suggestthat modifications in fluorescence are correlated with photo-oxidative degradation of ABS. Fluorescencelifetime and fluorescence multispectral images of the Grillo telephone (1965) made in ABS were ac-quired. Analysis of images allowed the rapid mapping of differences in fluorescence which are attributedto heterogeneous degradation on the object surface. Implications for the assessment, monitoring andconservation of objects in ABS and other polymers are suggested.
� 2013 Elsevier Ltd. All rights reserved.
1. Introduction
Much tangible Cultural Heritage is made of naturally occurringpolymeric materials. Over the last century synthetic materials wereintroduced to the market and used for the creation of works of art,industrial and household objects, offering new forms of expressionfor artists, architects and designers [1,2]. Thus the degradation ofmodern synthetic materials is of particular interest to curators andcollectors, archives and researchers e and understanding, pre-venting and monitoring chemical modifications which may alterthe appearance and stability of plastics is crucial for the conser-vation of historical design objects [3]. Extensive research has beencarried out to establishmethods for analysis and characterisation ofplastic objects, including recent studies on non-invasive analytical
: þ39 0223996126.t, [email protected]
All rights reserved.30
techniques based on the detection of volatile organic compounds(VOC) [4] and near infrared (NIR) [5,6] or terahertz (THz) imaging[7]. However, little research has concentrated on the direct analysisof the degradation of plastic objects and polymers usingfluorescence-based techniques [8e10]. This work focusses on theapplication of non-invasive and advanced fluorescence spectros-copy and imaging for assessing photodegradation of model samplesand a naturally degraded object made of acrylonitrileebutadieneestyrene (ABS), a polymerwhich has received limited scientific studyin heritage collections [3].
While scientific analysis of historical objects made of ABS islimited [11], significant research has been dedicated to the study ofthe degradation and stability of the material which is widely used inindustry [12e14]. ABS is a copolymer made of an acrylonitrileesty-renecontinuousphase (SAN) andpartiallygraftedpolybutadiene, themechanical propertiesofwhich canbefine-tunedbyvaryinggraftingconditions and the proportions of components in the polymer. It iswell known that ABS is prone to photo-oxidative degradationwhich
D. Comelli et al. / Polymer Degradation and Stability 107 (2014) 356e365 357
may lead to chemical modifications such as crosslinking and chainscission and significant colour changes (yellowing)with the build-upof oxidation products and changes in the free volume of the blend[15,16]. The susceptibility of ABS to photo-oxidative degradation isdue to the instabilityof butadiene, and inparticular to thepresenceofresidual double bonds along the polymer chains [17]. This degrada-tion of ABS has been shown to involve an autocatalytic free radicalchain mechanism where allylic radicals react with oxygen to formhydroperoxides products. Labile oxygeneoxygen bonds break toform RO� radicals, precursors of oxidation products identified in ABSsuch as aldehydes, esters, carboxylic acids and ketones [17e20].
Because of difficulties in sampling important historical designobjects and the need for rapid methods for the assessment ofchemical changes, non-invasive analytical methods, which canprovide indications of the composition and degree of degradationof an object without requiring the taking of samples, are desirable[3]. Fluorescence spectroscopy is particularly suitable for theanalysis of plastics as changes in fluorescence may be related tomodifications in chemical composition; fluorescence spectroscopy,and in some cases fluorescence lifetime measurements, have beenemployed for the assessment of oxidation of polymers includingpolyethylene [8], polystyrene [21], styrene butadiene copolymers[22], and styrene ethylene butadiene styrene (SEBS) copolymers[23,24].
With respect to point-like analysis, imaging techniques canprovide a rapid indication of the heterogeneous degradation andcondition of plastic objects. More in detail, both spectroscopy im-aging methods, including those based on the analysis of the NIRradiation reflected and absorbed by a surface [5,6], and structuralimaging methods, based on THz techniques [7], have proved to beeffective tools for monitoring degradation. In turn, fluorescenceimaging, based on the analysis of the spectral [25,26] and lifetime[27] properties of the emission, has been used for the assessment ofthe conditions of cultural heritage and specifically paintings andsculptures, but has not been applied to the analysis of plastics orhistorical objects. Large multispectral imaging datasets can benefitfrom the application of supervised and unsupervised multivariatestatistical methods, which can allow the discrimination of regionsin an image on the basis of spectral differences, as has recently beenestablished during investigations by means of NIR hyperspectralimaging [5,6,28].
In this work, standard samples of ABS were investigated underaccelerated degradation conditions in which the processes occur-ring under natural conditions were provoked through acceleratedphotodegradation. Samples were studied using excitation-emissionand time-resolved fluorescence spectroscopy to investigatechanges in emission and fluorescence lifetime which occur withdegradation. Non-invasive fluorescence spectroscopy, fluorescencemultispectral and fluorescence lifetime imaging (FLIM) were thenemployed for the analysis of the complex three-dimensional (3D)surfaces of a well-known historical object made in ABS dating from1965 e the Grillo telephone. Multivariate analysis of data fromspectral images was applied to classify different areas of the objectstudied. Results from fluorescence analysis were compared withresults from complementary analysis of micro-samples, collectedfrom standard samples and from the object studied, by Fouriertransform infrared spectroscopy (FTIR).
FTIR spectroscopy provides a method for identification ofchanges in bulk material due to modifications in FTIR spectra.However, the technique is inherently limited by its detection limit.Fluorescence spectroscopy, in contrast, may detect fluorescentoxidation products in trace concentrations before changes areapparent in FTIR spectra, but the interpretation of fluorescencespectra is less straightforward, as has been shown in another workon other polymer matrices [9].
2. Experimental
2.1. Reference ABS model samples and photodegradation
ABS reference materials were supplied as extruded rectangularblocks whichwere approximately 5 mm in thickness by Lanxess Srl,Milan. Accelerated photo-oxidative degradation mimiced naturaldegradation of ABS which has been shown to depend on thewavelength of irradiation, with different photo-oxidation mecha-nisms occurring below 300 nm [16]. For this reason, accelerateddegradation is relevant even for objects stored indoors, althoughthe comparison between accelerated degradation and naturalageing indoors is not trivial. Accelerated photodegradation ofsamples was carried out following the UNI 10925:2001 guidelinesfor artificial solar light testing [29] with the aid of a high-speedexposure unit (Suntest CPSþ apparatus, Heraeus, Germany),equipped with a Xenon lamp having a constant emittance of765 W/m2; a long-pass filter with cut-off wavelength at 295 nmwas used to exclude radiation more energetic than that of outdoorsolar exposure. The maximum temperature of the samples duringirradiation was 45 �C in order to avoid any thermo-oxidativedegradation. Samples of ABS were subjected to accelerated degra-dation with exposure to 5, 10, 50, 100, 200 500 and 1000 h.
2.2. Grillo telephone (1965)
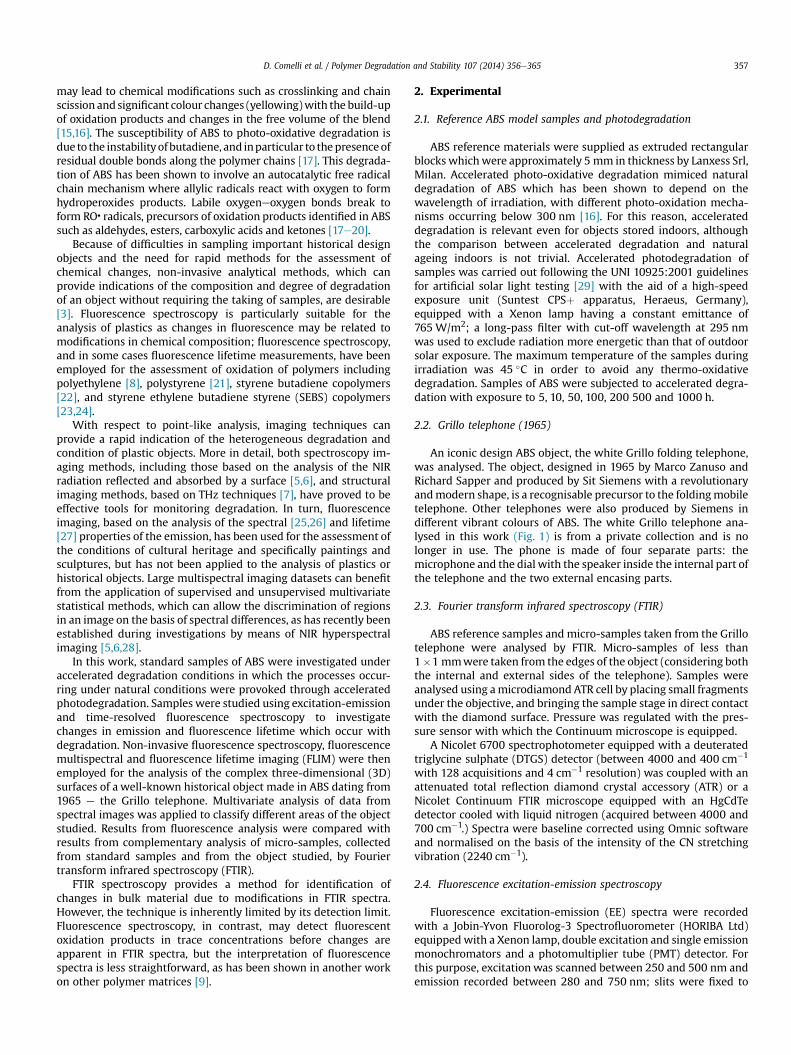
An iconic design ABS object, the white Grillo folding telephone,was analysed. The object, designed in 1965 by Marco Zanuso andRichard Sapper and produced by Sit Siemens with a revolutionaryandmodern shape, is a recognisable precursor to the foldingmobiletelephone. Other telephones were also produced by Siemens indifferent vibrant colours of ABS. The white Grillo telephone ana-lysed in this work (Fig. 1) is from a private collection and is nolonger in use. The phone is made of four separate parts: themicrophone and the dial with the speaker inside the internal part ofthe telephone and the two external encasing parts.
2.3. Fourier transform infrared spectroscopy (FTIR)
ABS reference samples and micro-samples taken from the Grillotelephone were analysed by FTIR. Micro-samples of less than1�1 mmwere taken from the edges of the object (considering boththe internal and external sides of the telephone). Samples wereanalysed using amicrodiamond ATR cell by placing small fragmentsunder the objective, and bringing the sample stage in direct contactwith the diamond surface. Pressure was regulated with the pres-sure sensor with which the Continuum microscope is equipped.
A Nicolet 6700 spectrophotometer equipped with a deuteratedtriglycine sulphate (DTGS) detector (between 4000 and 400 cm�1
with 128 acquisitions and 4 cm�1 resolution) was coupled with anattenuated total reflection diamond crystal accessory (ATR) or aNicolet Continuum FTIR microscope equipped with an HgCdTedetector cooled with liquid nitrogen (acquired between 4000 and700 cm�1.) Spectra were baseline corrected using Omnic softwareand normalised on the basis of the intensity of the CN stretchingvibration (2240 cm�1).
2.4. Fluorescence excitation-emission spectroscopy
Fluorescence excitation-emission (EE) spectra were recordedwith a Jobin-Yvon Fluorolog-3 Spectrofluorometer (HORIBA Ltd)equippedwith a Xenon lamp, double excitation and single emissionmonochromators and a photomultiplier tube (PMT) detector. Forthis purpose, excitationwas scanned between 250 and 500 nm andemission recorded between 280 and 750 nm; slits were fixed to
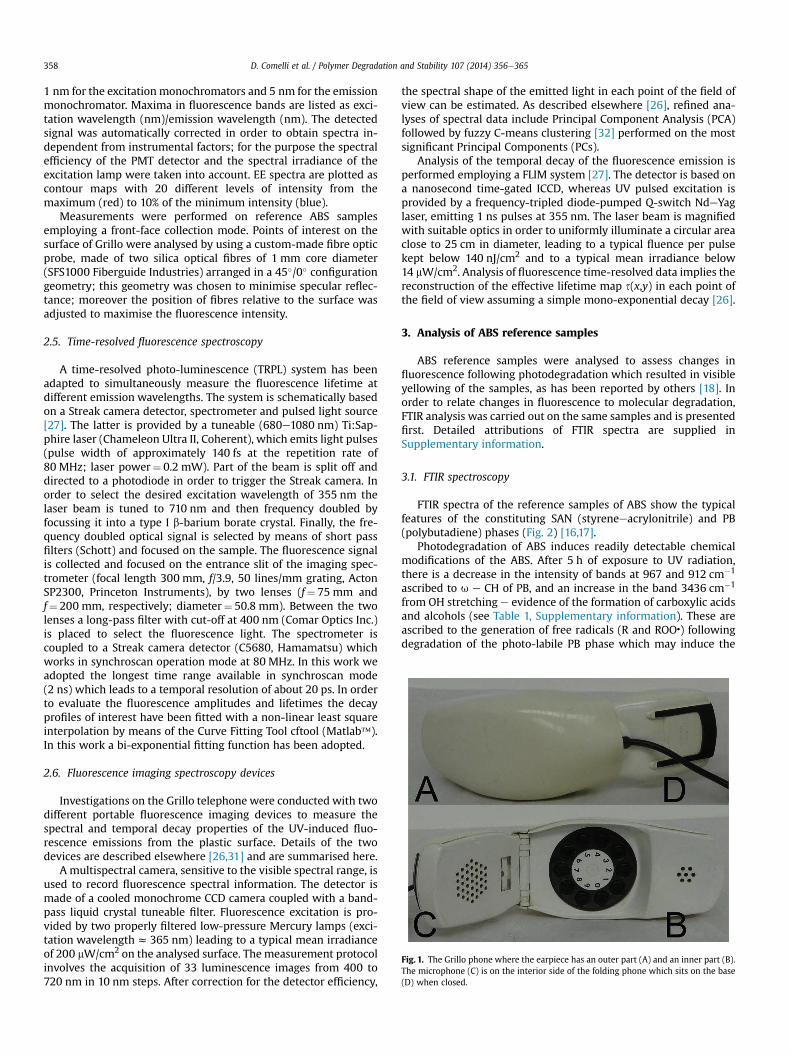
Fig. 1. The Grillo phone where the earpiece has an outer part (A) and an inner part (B).The microphone (C) is on the interior side of the folding phone which sits on the base(D) when closed.
D. Comelli et al. / Polymer Degradation and Stability 107 (2014) 356e365358
1 nm for the excitation monochromators and 5 nm for the emissionmonochromator. Maxima in fluorescence bands are listed as exci-tation wavelength (nm)/emission wavelength (nm). The detectedsignal was automatically corrected in order to obtain spectra in-dependent from instrumental factors; for the purpose the spectralefficiency of the PMT detector and the spectral irradiance of theexcitation lamp were taken into account. EE spectra are plotted ascontour maps with 20 different levels of intensity from themaximum (red) to 10% of the minimum intensity (blue).
Measurements were performed on reference ABS samplesemploying a front-face collection mode. Points of interest on thesurface of Grillo were analysed by using a custom-made fibre opticprobe, made of two silica optical fibres of 1 mm core diameter(SFS1000 Fiberguide Industries) arranged in a 45�/0� configurationgeometry; this geometry was chosen to minimise specular reflec-tance; moreover the position of fibres relative to the surface wasadjusted to maximise the fluorescence intensity.
2.5. Time-resolved fluorescence spectroscopy
A time-resolved photo-luminescence (TRPL) system has beenadapted to simultaneously measure the fluorescence lifetime atdifferent emission wavelengths. The system is schematically basedon a Streak camera detector, spectrometer and pulsed light source[27]. The latter is provided by a tuneable (680e1080 nm) Ti:Sap-phire laser (Chameleon Ultra II, Coherent), which emits light pulses(pulse width of approximately 140 fs at the repetition rate of80 MHz; laser power¼ 0.2 mW). Part of the beam is split off anddirected to a photodiode in order to trigger the Streak camera. Inorder to select the desired excitation wavelength of 355 nm thelaser beam is tuned to 710 nm and then frequency doubled byfocussing it into a type I b-barium borate crystal. Finally, the fre-quency doubled optical signal is selected by means of short passfilters (Schott) and focused on the sample. The fluorescence signalis collected and focused on the entrance slit of the imaging spec-trometer (focal length 300 mm, f/3.9, 50 lines/mm grating, ActonSP2300, Princeton Instruments), by two lenses (f¼ 75 mm andf¼ 200 mm, respectively; diameter¼ 50.8 mm). Between the twolenses a long-pass filter with cut-off at 400 nm (Comar Optics Inc.)is placed to select the fluorescence light. The spectrometer iscoupled to a Streak camera detector (C5680, Hamamatsu) whichworks in synchroscan operation mode at 80 MHz. In this work weadopted the longest time range available in synchroscan mode(2 ns) which leads to a temporal resolution of about 20 ps. In orderto evaluate the fluorescence amplitudes and lifetimes the decayprofiles of interest have been fitted with a non-linear least squareinterpolation by means of the Curve Fitting Tool cftool (Matlab�).In this work a bi-exponential fitting function has been adopted.
2.6. Fluorescence imaging spectroscopy devices
Investigations on the Grillo telephone were conducted with twodifferent portable fluorescence imaging devices to measure thespectral and temporal decay properties of the UV-induced fluo-rescence emissions from the plastic surface. Details of the twodevices are described elsewhere [26,31] and are summarised here.
A multispectral camera, sensitive to the visible spectral range, isused to record fluorescence spectral information. The detector ismade of a cooled monochrome CCD camera coupled with a band-pass liquid crystal tuneable filter. Fluorescence excitation is pro-vided by two properly filtered low-pressure Mercury lamps (exci-tation wavelengthz 365 nm) leading to a typical mean irradianceof 200 mW/cm2 on the analysed surface. The measurement protocolinvolves the acquisition of 33 luminescence images from 400 to720 nm in 10 nm steps. After correction for the detector efficiency,
the spectral shape of the emitted light in each point of the field ofview can be estimated. As described elsewhere [26], refined ana-lyses of spectral data include Principal Component Analysis (PCA)followed by fuzzy C-means clustering [32] performed on the mostsignificant Principal Components (PCs).
Analysis of the temporal decay of the fluorescence emission isperformed employing a FLIM system [27]. The detector is based ona nanosecond time-gated ICCD, whereas UV pulsed excitation isprovided by a frequency-tripled diode-pumped Q-switch NdeYaglaser, emitting 1 ns pulses at 355 nm. The laser beam is magnifiedwith suitable optics in order to uniformly illuminate a circular areaclose to 25 cm in diameter, leading to a typical fluence per pulsekept below 140 nJ/cm2 and to a typical mean irradiance below14 mW/cm2. Analysis of fluorescence time-resolved data implies thereconstruction of the effective lifetime map s(x,y) in each point ofthe field of view assuming a simple mono-exponential decay [26].
3. Analysis of ABS reference samples
ABS reference samples were analysed to assess changes influorescence following photodegradation which resulted in visibleyellowing of the samples, as has been reported by others [18]. Inorder to relate changes in fluorescence to molecular degradation,FTIR analysis was carried out on the same samples and is presentedfirst. Detailed attributions of FTIR spectra are supplied inSupplementary information.
3.1. FTIR spectroscopy
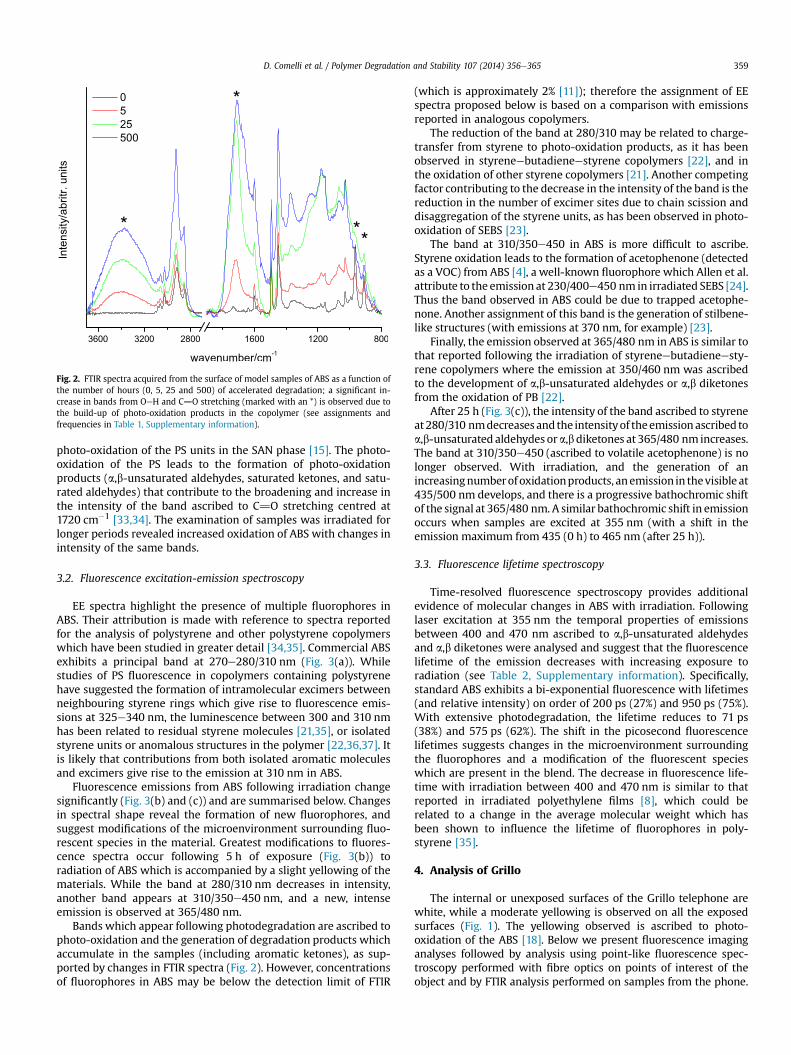
FTIR spectra of the reference samples of ABS show the typicalfeatures of the constituting SAN (styreneeacrylonitrile) and PB(polybutadiene) phases (Fig. 2) [16,17].
Photodegradation of ABS induces readily detectable chemicalmodifications of the ABS. After 5 h of exposure to UV radiation,there is a decrease in the intensity of bands at 967 and 912 cm�1
ascribed to u e CH of PB, and an increase in the band 3436 cm�1
from OH stretching e evidence of the formation of carboxylic acidsand alcohols (see Table 1, Supplementary information). These areascribed to the generation of free radicals (R and ROO�) followingdegradation of the photo-labile PB phase which may induce the
*
*
**
Fig. 2. FTIR spectra acquired from the surface of model samples of ABS as a function ofthe number of hours (0, 5, 25 and 500) of accelerated degradation; a significant in-crease in bands from OeH and C]O stretching (marked with an *) is observed due tothe build-up of photo-oxidation products in the copolymer (see assignments andfrequencies in Table 1, Supplementary information).
D. Comelli et al. / Polymer Degradation and Stability 107 (2014) 356e365 359
photo-oxidation of the PS units in the SAN phase [15]. The photo-oxidation of the PS leads to the formation of photo-oxidationproducts (a,b-unsaturated aldehydes, saturated ketones, and satu-rated aldehydes) that contribute to the broadening and increase inthe intensity of the band ascribed to C]O stretching centred at1720 cm�1 [33,34]. The examination of samples was irradiated forlonger periods revealed increased oxidation of ABS with changes inintensity of the same bands.
3.2. Fluorescence excitation-emission spectroscopy
EE spectra highlight the presence of multiple fluorophores inABS. Their attribution is made with reference to spectra reportedfor the analysis of polystyrene and other polystyrene copolymerswhich have been studied in greater detail [34,35]. Commercial ABSexhibits a principal band at 270e280/310 nm (Fig. 3(a)). Whilestudies of PS fluorescence in copolymers containing polystyrenehave suggested the formation of intramolecular excimers betweenneighbouring styrene rings which give rise to fluorescence emis-sions at 325e340 nm, the luminescence between 300 and 310 nmhas been related to residual styrene molecules [21,35], or isolatedstyrene units or anomalous structures in the polymer [22,36,37]. Itis likely that contributions from both isolated aromatic moleculesand excimers give rise to the emission at 310 nm in ABS.
Fluorescence emissions from ABS following irradiation changesignificantly (Fig. 3(b) and (c)) and are summarised below. Changesin spectral shape reveal the formation of new fluorophores, andsuggest modifications of the microenvironment surrounding fluo-rescent species in the material. Greatest modifications to fluores-cence spectra occur following 5 h of exposure (Fig. 3(b)) toradiation of ABS which is accompanied by a slight yellowing of thematerials. While the band at 280/310 nm decreases in intensity,another band appears at 310/350e450 nm, and a new, intenseemission is observed at 365/480 nm.
Bands which appear following photodegradation are ascribed tophoto-oxidation and the generation of degradation products whichaccumulate in the samples (including aromatic ketones), as sup-ported by changes in FTIR spectra (Fig. 2). However, concentrationsof fluorophores in ABS may be below the detection limit of FTIR
(which is approximately 2% [11]); therefore the assignment of EEspectra proposed below is based on a comparison with emissionsreported in analogous copolymers.
The reduction of the band at 280/310 may be related to charge-transfer from styrene to photo-oxidation products, as it has beenobserved in styreneebutadieneestyrene copolymers [22], and inthe oxidation of other styrene copolymers [21]. Another competingfactor contributing to the decrease in the intensity of the band is thereduction in the number of excimer sites due to chain scission anddisaggregation of the styrene units, as has been observed in photo-oxidation of SEBS [23].
The band at 310/350e450 in ABS is more difficult to ascribe.Styrene oxidation leads to the formation of acetophenone (detectedas a VOC) from ABS [4], a well-known fluorophore which Allen et al.attribute to the emission at 230/400e450 nm in irradiated SEBS [24].Thus the band observed in ABS could be due to trapped acetophe-none. Another assignment of this band is the generation of stilbene-like structures (with emissions at 370 nm, for example) [23].
Finally, the emission observed at 365/480 nm in ABS is similar tothat reported following the irradiation of styreneebutadieneesty-rene copolymers where the emission at 350/460 nm was ascribedto the development of a,b-unsaturated aldehydes or a,b diketonesfrom the oxidation of PB [22].
After 25 h (Fig. 3(c)), the intensity of the band ascribed to styreneat280/310 nmdecreases andthe intensityof theemissionascribed toa,b-unsaturated aldehydes ora,bdiketones at 365/480 nm increases.The band at 310/350e450 (ascribed to volatile acetophenone) is nolonger observed. With irradiation, and the generation of anincreasingnumberof oxidationproducts, anemission in thevisible at435/500 nm develops, and there is a progressive bathochromic shiftof the signal at 365/480 nm. A similar bathochromic shift in emissionoccurs when samples are excited at 355 nm (with a shift in theemission maximum from 435 (0 h) to 465 nm (after 25 h)).
3.3. Fluorescence lifetime spectroscopy
Time-resolved fluorescence spectroscopy provides additionalevidence of molecular changes in ABS with irradiation. Followinglaser excitation at 355 nm the temporal properties of emissionsbetween 400 and 470 nm ascribed to a,b-unsaturated aldehydesand a,b diketones were analysed and suggest that the fluorescencelifetime of the emission decreases with increasing exposure toradiation (see Table 2, Supplementary information). Specifically,standard ABS exhibits a bi-exponential fluorescence with lifetimes(and relative intensity) on order of 200 ps (27%) and 950 ps (75%).With extensive photodegradation, the lifetime reduces to 71 ps(38%) and 575 ps (62%). The shift in the picosecond fluorescencelifetimes suggests changes in the microenvironment surroundingthe fluorophores and a modification of the fluorescent specieswhich are present in the blend. The decrease in fluorescence life-time with irradiation between 400 and 470 nm is similar to thatreported in irradiated polyethylene films [8], which could berelated to a change in the average molecular weight which hasbeen shown to influence the lifetime of fluorophores in poly-styrene [35].
4. Analysis of Grillo
The internal or unexposed surfaces of the Grillo telephone arewhite, while a moderate yellowing is observed on all the exposedsurfaces (Fig. 1). The yellowing observed is ascribed to photo-oxidation of the ABS [18]. Below we present fluorescence imaginganalyses followed by analysis using point-like fluorescence spec-troscopy performed with fibre optics on points of interest of theobject and by FTIR analysis performed on samples from the phone.
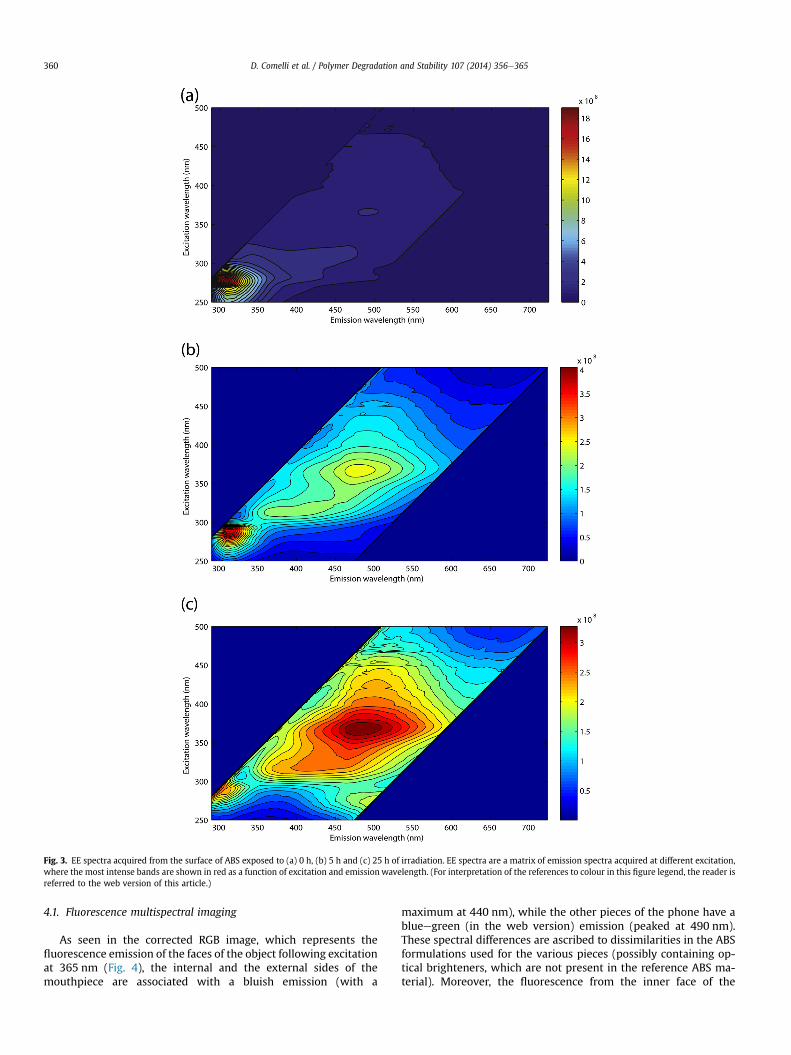
Fig. 3. EE spectra acquired from the surface of ABS exposed to (a) 0 h, (b) 5 h and (c) 25 h of irradiation. EE spectra are a matrix of emission spectra acquired at different excitation,where the most intense bands are shown in red as a function of excitation and emission wavelength. (For interpretation of the references to colour in this figure legend, the reader isreferred to the web version of this article.)
D. Comelli et al. / Polymer Degradation and Stability 107 (2014) 356e365360
4.1. Fluorescence multispectral imaging
As seen in the corrected RGB image, which represents thefluorescence emission of the faces of the object following excitationat 365 nm (Fig. 4), the internal and the external sides of themouthpiece are associated with a bluish emission (with a
maximum at 440 nm), while the other pieces of the phone have ablueegreen (in the web version) emission (peaked at 490 nm).These spectral differences are ascribed to dissimilarities in the ABSformulations used for the various pieces (possibly containing op-tical brighteners, which are not present in the reference ABS ma-terial). Moreover, the fluorescence from the inner face of the
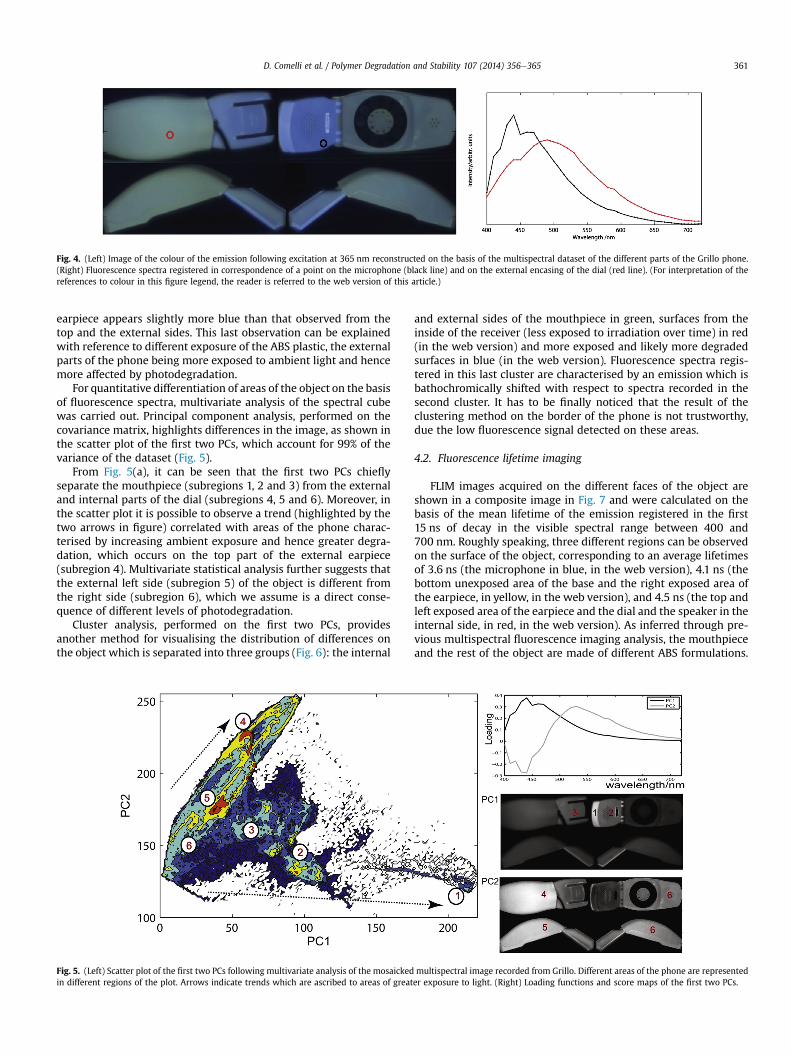
Fig. 4. (Left) Image of the colour of the emission following excitation at 365 nm reconstructed on the basis of the multispectral dataset of the different parts of the Grillo phone.(Right) Fluorescence spectra registered in correspondence of a point on the microphone (black line) and on the external encasing of the dial (red line). (For interpretation of thereferences to colour in this figure legend, the reader is referred to the web version of this article.)
D. Comelli et al. / Polymer Degradation and Stability 107 (2014) 356e365 361
earpiece appears slightly more blue than that observed from thetop and the external sides. This last observation can be explainedwith reference to different exposure of the ABS plastic, the externalparts of the phone being more exposed to ambient light and hencemore affected by photodegradation.
For quantitative differentiation of areas of the object on the basisof fluorescence spectra, multivariate analysis of the spectral cubewas carried out. Principal component analysis, performed on thecovariance matrix, highlights differences in the image, as shown inthe scatter plot of the first two PCs, which account for 99% of thevariance of the dataset (Fig. 5).
From Fig. 5(a), it can be seen that the first two PCs chieflyseparate the mouthpiece (subregions 1, 2 and 3) from the externaland internal parts of the dial (subregions 4, 5 and 6). Moreover, inthe scatter plot it is possible to observe a trend (highlighted by thetwo arrows in figure) correlated with areas of the phone charac-terised by increasing ambient exposure and hence greater degra-dation, which occurs on the top part of the external earpiece(subregion 4). Multivariate statistical analysis further suggests thatthe external left side (subregion 5) of the object is different fromthe right side (subregion 6), which we assume is a direct conse-quence of different levels of photodegradation.
Cluster analysis, performed on the first two PCs, providesanother method for visualising the distribution of differences onthe object which is separated into three groups (Fig. 6): the internal
Fig. 5. (Left) Scatter plot of the first two PCs following multivariate analysis of the mosaickedin different regions of the plot. Arrows indicate trends which are ascribed to areas of great
and external sides of the mouthpiece in green, surfaces from theinside of the receiver (less exposed to irradiation over time) in red(in the web version) and more exposed and likely more degradedsurfaces in blue (in the web version). Fluorescence spectra regis-tered in this last cluster are characterised by an emission which isbathochromically shifted with respect to spectra recorded in thesecond cluster. It has to be finally noticed that the result of theclustering method on the border of the phone is not trustworthy,due the low fluorescence signal detected on these areas.
4.2. Fluorescence lifetime imaging
FLIM images acquired on the different faces of the object areshown in a composite image in Fig. 7 and were calculated on thebasis of the mean lifetime of the emission registered in the first15 ns of decay in the visible spectral range between 400 and700 nm. Roughly speaking, three different regions can be observedon the surface of the object, corresponding to an average lifetimesof 3.6 ns (the microphone in blue, in the web version), 4.1 ns (thebottom unexposed area of the base and the right exposed area ofthe earpiece, in yellow, in the web version), and 4.5 ns (the top andleft exposed area of the earpiece and the dial and the speaker in theinternal side, in red, in the web version). As inferred through pre-vious multispectral fluorescence imaging analysis, the mouthpieceand the rest of the object are made of different ABS formulations.
multispectral image recorded from Grillo. Different areas of the phone are representeder exposure to light. (Right) Loading functions and score maps of the first two PCs.
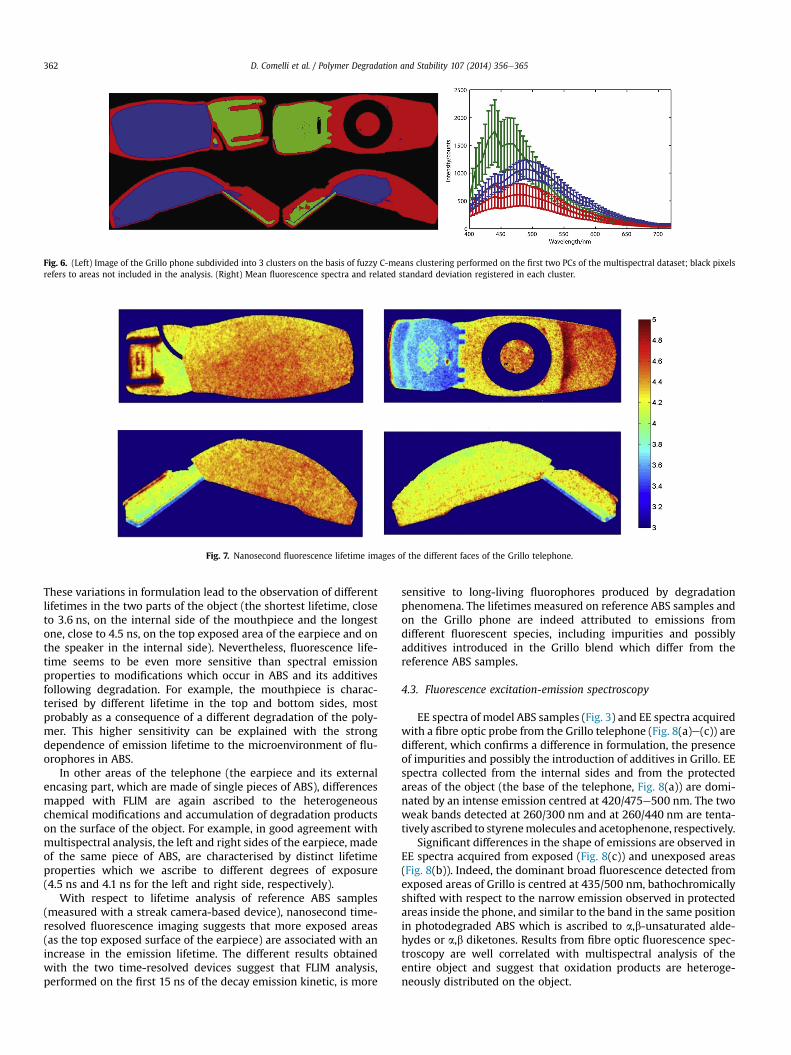
Fig. 6. (Left) Image of the Grillo phone subdivided into 3 clusters on the basis of fuzzy C-means clustering performed on the first two PCs of the multispectral dataset; black pixelsrefers to areas not included in the analysis. (Right) Mean fluorescence spectra and related standard deviation registered in each cluster.
Fig. 7. Nanosecond fluorescence lifetime images of the different faces of the Grillo telephone.
D. Comelli et al. / Polymer Degradation and Stability 107 (2014) 356e365362
These variations in formulation lead to the observation of differentlifetimes in the two parts of the object (the shortest lifetime, closeto 3.6 ns, on the internal side of the mouthpiece and the longestone, close to 4.5 ns, on the top exposed area of the earpiece and onthe speaker in the internal side). Nevertheless, fluorescence life-time seems to be even more sensitive than spectral emissionproperties to modifications which occur in ABS and its additivesfollowing degradation. For example, the mouthpiece is charac-terised by different lifetime in the top and bottom sides, mostprobably as a consequence of a different degradation of the poly-mer. This higher sensitivity can be explained with the strongdependence of emission lifetime to the microenvironment of flu-orophores in ABS.
In other areas of the telephone (the earpiece and its externalencasing part, which are made of single pieces of ABS), differencesmapped with FLIM are again ascribed to the heterogeneouschemical modifications and accumulation of degradation productson the surface of the object. For example, in good agreement withmultispectral analysis, the left and right sides of the earpiece, madeof the same piece of ABS, are characterised by distinct lifetimeproperties which we ascribe to different degrees of exposure(4.5 ns and 4.1 ns for the left and right side, respectively).
With respect to lifetime analysis of reference ABS samples(measured with a streak camera-based device), nanosecond time-resolved fluorescence imaging suggests that more exposed areas(as the top exposed surface of the earpiece) are associated with anincrease in the emission lifetime. The different results obtainedwith the two time-resolved devices suggest that FLIM analysis,performed on the first 15 ns of the decay emission kinetic, is more
sensitive to long-living fluorophores produced by degradationphenomena. The lifetimes measured on reference ABS samples andon the Grillo phone are indeed attributed to emissions fromdifferent fluorescent species, including impurities and possiblyadditives introduced in the Grillo blend which differ from thereference ABS samples.
4.3. Fluorescence excitation-emission spectroscopy
EE spectra of model ABS samples (Fig. 3) and EE spectra acquiredwith a fibre optic probe from the Grillo telephone (Fig. 8(a)e(c)) aredifferent, which confirms a difference in formulation, the presenceof impurities and possibly the introduction of additives in Grillo. EEspectra collected from the internal sides and from the protectedareas of the object (the base of the telephone, Fig. 8(a)) are domi-nated by an intense emission centred at 420/475e500 nm. The twoweak bands detected at 260/300 nm and at 260/440 nm are tenta-tively ascribed to styrenemolecules and acetophenone, respectively.
Significant differences in the shape of emissions are observed inEE spectra acquired from exposed (Fig. 8(c)) and unexposed areas(Fig. 8(b)). Indeed, the dominant broad fluorescence detected fromexposed areas of Grillo is centred at 435/500 nm, bathochromicallyshifted with respect to the narrow emission observed in protectedareas inside the phone, and similar to the band in the same positionin photodegraded ABS which is ascribed to a,b-unsaturated alde-hydes or a,b diketones. Results from fibre optic fluorescence spec-troscopy are well correlated with multispectral analysis of theentire object and suggest that oxidation products are heteroge-neously distributed on the object.
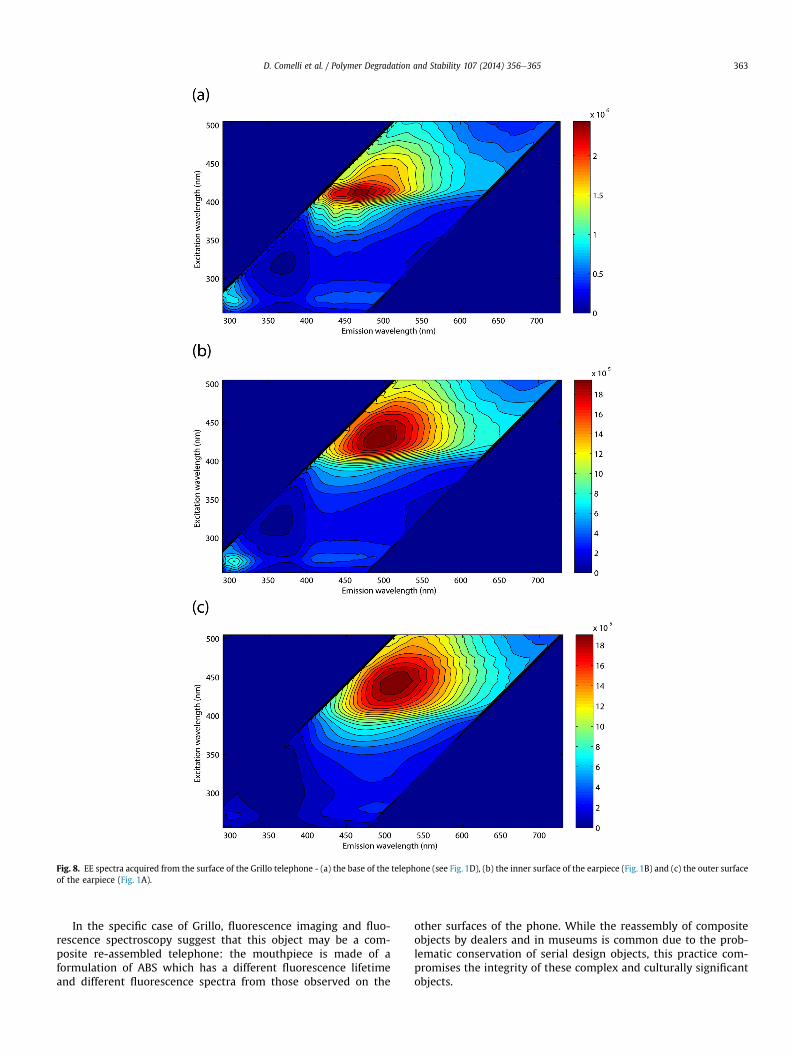
Fig. 8. EE spectra acquired from the surface of the Grillo telephone - (a) the base of the telephone (see Fig. 1D), (b) the inner surface of the earpiece (Fig. 1B) and (c) the outer surfaceof the earpiece (Fig. 1A).
D. Comelli et al. / Polymer Degradation and Stability 107 (2014) 356e365 363
In the specific case of Grillo, fluorescence imaging and fluo-rescence spectroscopy suggest that this object may be a com-posite re-assembled telephone: the mouthpiece is made of aformulation of ABS which has a different fluorescence lifetimeand different fluorescence spectra from those observed on the
other surfaces of the phone. While the reassembly of compositeobjects by dealers and in museums is common due to the prob-lematic conservation of serial design objects, this practice com-promises the integrity of these complex and culturally significantobjects.
D. Comelli et al. / Polymer Degradation and Stability 107 (2014) 356e365364
4.4. FTIR analysis of micro-samples from Grillo
FTIR of micro-samples confirmed the presence of ABS in all areasof the telephone, with main differences in samples related to thedegree of degradation of the polymer. It was not possible to identifyadditives on the basis of the spectra acquired.
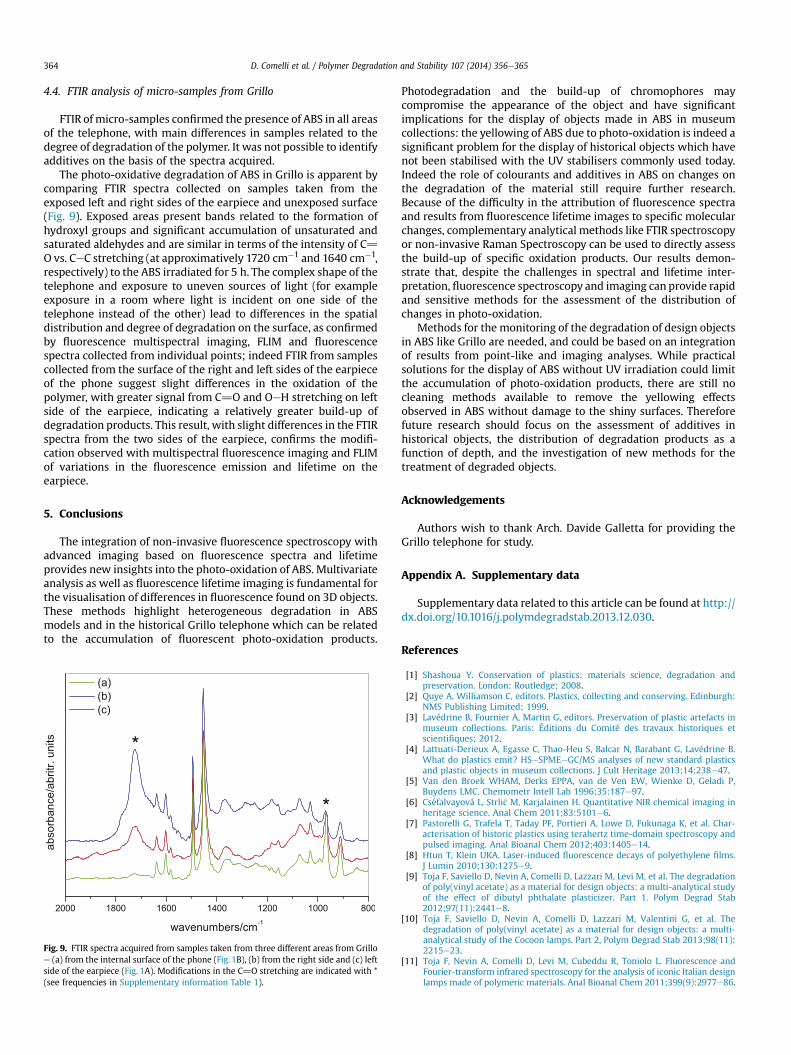
The photo-oxidative degradation of ABS in Grillo is apparent bycomparing FTIR spectra collected on samples taken from theexposed left and right sides of the earpiece and unexposed surface(Fig. 9). Exposed areas present bands related to the formation ofhydroxyl groups and significant accumulation of unsaturated andsaturated aldehydes and are similar in terms of the intensity of C]O vs. CeC stretching (at approximatively 1720 cm�1 and 1640 cm�1,respectively) to the ABS irradiated for 5 h. The complex shape of thetelephone and exposure to uneven sources of light (for exampleexposure in a room where light is incident on one side of thetelephone instead of the other) lead to differences in the spatialdistribution and degree of degradation on the surface, as confirmedby fluorescence multispectral imaging, FLIM and fluorescencespectra collected from individual points; indeed FTIR from samplescollected from the surface of the right and left sides of the earpieceof the phone suggest slight differences in the oxidation of thepolymer, with greater signal from C]O and OeH stretching on leftside of the earpiece, indicating a relatively greater build-up ofdegradation products. This result, with slight differences in the FTIRspectra from the two sides of the earpiece, confirms the modifi-cation observed with multispectral fluorescence imaging and FLIMof variations in the fluorescence emission and lifetime on theearpiece.
5. Conclusions
The integration of non-invasive fluorescence spectroscopy withadvanced imaging based on fluorescence spectra and lifetimeprovides new insights into the photo-oxidation of ABS. Multivariateanalysis as well as fluorescence lifetime imaging is fundamental forthe visualisation of differences in fluorescence found on 3D objects.These methods highlight heterogeneous degradation in ABSmodels and in the historical Grillo telephone which can be relatedto the accumulation of fluorescent photo-oxidation products.
*
*
Fig. 9. FTIR spectra acquired from samples taken from three different areas from Grilloe (a) from the internal surface of the phone (Fig. 1B), (b) from the right side and (c) leftside of the earpiece (Fig. 1A). Modifications in the C]O stretching are indicated with *(see frequencies in Supplementary information Table 1).
Photodegradation and the build-up of chromophores maycompromise the appearance of the object and have significantimplications for the display of objects made in ABS in museumcollections: the yellowing of ABS due to photo-oxidation is indeed asignificant problem for the display of historical objects which havenot been stabilised with the UV stabilisers commonly used today.Indeed the role of colourants and additives in ABS on changes onthe degradation of the material still require further research.Because of the difficulty in the attribution of fluorescence spectraand results from fluorescence lifetime images to specific molecularchanges, complementary analytical methods like FTIR spectroscopyor non-invasive Raman Spectroscopy can be used to directly assessthe build-up of specific oxidation products. Our results demon-strate that, despite the challenges in spectral and lifetime inter-pretation, fluorescence spectroscopy and imaging can provide rapidand sensitive methods for the assessment of the distribution ofchanges in photo-oxidation.
Methods for the monitoring of the degradation of design objectsin ABS like Grillo are needed, and could be based on an integrationof results from point-like and imaging analyses. While practicalsolutions for the display of ABS without UV irradiation could limitthe accumulation of photo-oxidation products, there are still nocleaning methods available to remove the yellowing effectsobserved in ABS without damage to the shiny surfaces. Thereforefuture research should focus on the assessment of additives inhistorical objects, the distribution of degradation products as afunction of depth, and the investigation of new methods for thetreatment of degraded objects.
Acknowledgements
Authors wish to thank Arch. Davide Galletta for providing theGrillo telephone for study.
Appendix A. Supplementary data
Supplementary data related to this article can be found at http://dx.doi.org/10.1016/j.polymdegradstab.2013.12.030.
References
[1] Shashoua Y. Conservation of plastics: materials science, degradation andpreservation. London: Routledge; 2008.
[2] Quye A, Williamson C, editors. Plastics, collecting and conserving. Edinburgh:NMS Publishing Limited; 1999.
[3] Lavédrine B, Fournier A, Martin G, editors. Preservation of plastic artefacts inmuseum collections. Paris: Éditions du Comité des travaux historiques etscientifiques; 2012.
[4] Lattuati-Derieux A, Egasse C, Thao-Heu S, Balcar N, Barabant G, Lavédrine B.What do plastics emit? HSeSPMEeGC/MS analyses of new standard plasticsand plastic objects in museum collections. J Cult Heritage 2013;14:238e47.
[5] Van den Broek WHAM, Derks EPPA, van de Ven EW, Wienke D, Geladi P,Buydens LMC. Chemometr Intell Lab 1996;35:187e97.
[6] Cséfalvayová L, Strli�c M, Karjalainen H. Quantitative NIR chemical imaging inheritage science. Anal Chem 2011;83:5101e6.
[7] Pastorelli G, Trafela T, Taday PF, Portieri A, Lowe D, Fukunaga K, et al. Char-acterisation of historic plastics using terahertz time-domain spectroscopy andpulsed imaging. Anal Bioanal Chem 2012;403:1405e14.
[8] Htun T, Klein UKA. Laser-induced fluorescence decays of polyethylene films.J Lumin 2010;130:1275e9.
[9] Toja F, Saviello D, Nevin A, Comelli D, Lazzari M, Levi M, et al. The degradationof poly(vinyl acetate) as a material for design objects: a multi-analytical studyof the effect of dibutyl phthalate plasticizer. Part 1. Polym Degrad Stab2012;97(11):2441e8.
[10] Toja F, Saviello D, Nevin A, Comelli D, Lazzari M, Valentini G, et al. Thedegradation of poly(vinyl acetate) as a material for design objects: a multi-analytical study of the Cocoon lamps. Part 2, Polym Degrad Stab 2013;98(11):2215e23.
[11] Toja F, Nevin A, Comelli D, Levi M, Cubeddu R, Toniolo L. Fluorescence andFourier-transform infrared spectroscopy for the analysis of iconic Italian designlamps made of polymeric materials. Anal Bioanal Chem 2011;399(9):2977e86.
D. Comelli et al. / Polymer Degradation and Stability 107 (2014) 356e365 365
[12] Davis P, Tiganis BE, Burn LS. The effect of photo-oxidative degradation onfracture in ABS pipe resins. Polym Degrad Stab 2004;84(2):233e42.
[13] Ghaemy M, Scott G. Photo-and thermal oxidation of ABS: correlation of loss ofimpact strength with degradation of the rubber component. Polym DegradStab 1981;3(3):233e42.
[14] Boldizar A, Möller K. Degradation of ABS during repeated processing andaccelerated ageing. Polym Degrad Stab 2003;81(2):359e66.
[15] Santos RM, Botelho GL, Machado AV. Artificial and natural weathering of ABS.J Appl Polym Sci 2010;116:2005e14.
[16] Piton M, Rivaton A. Photo-oxidation of ABS at long wavelengths (lamb-da> 300 nm). Polym Degrad Stab 1997;55(2):147e57.
[17] Bokria JG, Schlick S. Spatial effects in the photodegradation of poly (acrylo-nitrileebutadieneestyrene): a study by ATR-FTIR. Polymer 2002;43(11):3239e46.
[18] Jouan X, Gardette JL. Photo-oxidation of ABS: part 2dorigin of the photo-discoloration on irradiation at long wavelengths. Polym Degrad Stab1991;36(1):91e6.
[19] Blom H, Yeh R, Wojnarowski R, Ling M. Detection of degradation of ABSmaterials via OSC. Thermochim Acta 2006;442(1e2):64e6.
[20] Lala D, Rabek JF. The role of hydroperoxides in photo-oxidative degradation ofcis-1,4-polybutadiene. Euro Polym J 1981;17(1):7e14.
[21] O’Connor DB, Scott GW. Emission spectra and kinetics of copolymer filmsof styrene and 2,3,4,5,6-pentafluorostyrene. Macromolecules 1991;24:2355e60.
[22] David C, Zabeau F, Jacobs RA. Photo-oxidation and photo-stabilization ofblends of low-density polyethylene and styreneebutadieneestyrene co-polymers. Polym Eng Sci 1982;22(14):912e6.
[23] Luengo C, Allen NS, Edge M, Wilkinson A, Parellada MD, Barrio JA, et al. Photo-oxidative degradation mechanisms in styrene ethylene butadiene styrene(SEBS) triblock copolymer. Polym Degrad Stab 2006;91:947e56.
[24] Allen NS, Edge M, Wilkinson A, Liauw CM, Mourelatou D, Barrio J, et al.Degradation and stabilization of styreneeethyleneebutadieneestyrene(SEBS) block copolymer. Polym Degrad Stab 2001;71(1):113e22.
[25] Nevin A, Spoto G, Anglos D. Laser spectroscopies for elemental and molecularanalysis in art and archaeology. Appl Phys A 2012;106(2):339e61.
[26] Comelli D, Nevin A, Valentini G, Osticioli I, Castellucci EM, Toniolo L, et al.Insights into Masolino’s wall paintings in Castiglione Olona: advancedreflectance and fluorescence imaging analysis. J Cult Herit 2011;12(1):11e8.
[27] Comelli D, D’Andrea C, Valentini G, Cubeddu R, Colombo C, Toniolo L. Fluo-rescence lifetime imaging and spectroscopy as tools for nondestructiveanalysis of works of art. Appl Opt 2004;43(10):2175e83.
[28] Grahn H, Geladi P. Techniques and applications of hyperspectral imageanalysis. Chichester: John Wiley; 2007.
[29] http://www.tine.it/normal/UNINormal.htm [accessed 14.11.13].[31] Comelli D, Valentini G, Nevin A, Farina A, Toniolo L, Cubeddu R. A portable UV-
fluorescence multispectral imaging system for the analysis of painted sur-faces. Rev Sci Inst 2008;79(8). art no. 086112.
[32] Bezdec JC. Pattern recognition with fuzzy objective function algorithms. NewYork: Plenum Press; 1981.
[33] Mailhot B, Gardette JL. Polystyrene photooxidation 1: identification of the IRabsorbing photoproducts formed at short and long wavelengths. Macromol-ecules 1992;25(16):4119e26.
[34] Mailhot B, Gardette JL. Polystyrene photooxidation 2: a pseudo wavelengtheffect. Macromolecules 1992;25(16):4127e33.
[35] Basile LJ. Effect of styrene monomer on the fluorescence properties of poly-styrene. J Chem Phys 1962;36(8):2204e10.
[36] Torkelson JM, Lipsky S, Tirrell M. Polystyrene fluorescence: effects of molec-ular weight in various solvents. Macromolecules 1981;14(5):1601e3.
[37] Healy MS, Hanson JE. Fluorescence excitation spectroscopy of polystyrenenear the critical concentration c*. J Appl Polym Sci 2007;104(1):360e4.


