Embed Size (px)
Citation preview
Available online at www.sciencedirect.comEUROPEAN
European Polymer Journal 44 (2008) 821–831
www.elsevier.com/locate/europolj
POLYMERJOURNAL
Interpolymer complexation in hydrolysed poly(styrene-co-maleicanhydride)/poly(styrene-co-4-vinylpyridine)
Nabila Haddadine-rahmoun a,*, Farouk Amrani a, Valeria Arrighi b,John M.G. Cowie b
a University of Sciences and Technology Houari Boumediene, Faculty of Chemistry, Laboratory of Polymer Chemistry,
BP. 32, El -Alia, Algiers 16111, Algeriab Chemistry, School of Engineering and Physical Sciences, Heriot-Watt University, Riccarton, Edinburgh EH14 4AS, United Kingdom
Received 30 July 2007; received in revised form 15 December 2007; accepted 25 December 2007Available online 11 January 2008
Abstract
Complexation between hydrolysed poly(styrene-co-maleic anhydride) (HSMA) copolymers containing 28% and 50%maleic anhydride and a poly(styrene-co-4-vinylpyridine), St4VP32 copolymer with 32% of 4-vinylpyridine content has beeninvestigated. Formation of interpolymer complexes from 1,4-dioxane solutions is observed, over the entire compositionrange and the stoichiometry of these complexes has been determined from elemental analysis.
Quantitative FTIR study of the system HSMA50/StV4Py32 shows that the ideal complex composition leads to 2:1 unitmole ratio of interacting component. FTIR results are in good agreement with DSC and TGA ones, since this complexcomposition gives the maximum value of the glass transition temperature and the best thermic stability.
For the systems investigated, the Tg versus composition curve do not follow any of the commonly accepted models pro-posed for polymer blends. A new model proposed by Cowie [Cowie JMG, Garay MT, Lath D, McEwen IJ. Br Poly J1989;21:81] is used to fit the Tg data and found to reproduce the experimental results more closely.� 2008 Elsevier Ltd. All rights reserved.
Keywords: Interpolymer complexes; Hydrogen bond; Modified Kwei equation; DSC
1. Introduction
The incorporation of specific interactions betweenthe individual components of polymer–polymer mix-tures are known to promote blend miscibility [1,2].These range from relatively weak Van der Waals
0014-3057/$ - see front matter � 2008 Elsevier Ltd. All rights reserved
doi:10.1016/j.eurpolymj.2007.12.023
* Corresponding author. Tel.: +213 17 02 40 88; fax: +213 2124 73 11.
E-mail address: [email protected] (N. Haddadine-rahmoun).
forces [3,4] to strong associative hydrogen bonds[5]. When a large number of intermolecular interac-tions are present, occurring at regular intervals alongthe polymer chain, highly associating materials canbe obtained [6–8]. This special class of polymer–poly-mer blends are known as interpolymer associationcomplexes. They can be obtained either by mixingsolutions of structurally complementary polymers[9–14] or through polymerisation of a monomer inthe presence of a template polymer. The former aremore common and have been reviewed by Tsuchida
.

Table 1Characteristics of synthesized copolymers
Copolymers MA(mol%)
4-VPy(mol%)
Mw � 10�5
(g/mol)Mw/Mn
Tg
(�C)
SAM50 50 – 2.19 1.08 207SAM28 28 – 2.09 1.32 179St4VPy32 – 32.25 2.69 1.1 117
822 N. Haddadine-rahmoun et al. / European Polymer Journal 44 (2008) 821–831
and Abe [15]. These complexes are stabilized by eitherelectrostatic interactions between a polyanion and apolycation or by hydrogen bond formation (poly-acid–polybase).
In this paper we describe a study of complexationbetween hydrolysed poly(styrene-alt-maleic anhy-dride) (HSMA) and poly(styrene-co-4-vinylpyri-dine) (St4VPy32). The pyridyl unit is known to bea strong proton acceptor. While miscibility withpyridyl containing polymers has been extensivelystudied [16–21], complexation in these systems hasreceived less attention. Dai et al. [17] investigatedthe formation of complexes between polyvinylphe-nol (PVPh) and pyridine containing polymers suchas poly(4-vinylpyridine) (P4VPy), poly(2-vinylpyri-dine) (P2VPy) and poly(styrene-co-2-vinylpyridine)(St2VPy). All the homopolymers and the copolymerwith 70% pyridyl units were reported to forminsoluble complexes in ethanol but not in DMF.Furthermore, P4VPy showed stronger complexationability than P2VPy, probably because sterichindrance interferes with complex formation in thelatter polymer.
The system investigated here consists of astrongly associated dicarboxylic polyacid (HSMA)and a weakly self-associated copolymer (St4VPy).‘It is shown that these copolymers, under givenexperimental conditions, form complexes as a resultof both hydrogen bonding and electrostatic interac-tions, as evidenced by the FTIR data. Polymer–polymer complex formation in this system isattributed to the specific acid–base interactionbetween the carboxylic groups of HSMA and thepyridyl nitrogen of St4VPy. This interaction hasbeen quantitatively characterized in this workthrough analysis of the FTIR spectra. Additionally,we apply here a method first proposed by Cowieet al. [22] and based on the application of a modifiedKwei equation [23] in order to quantify the extent ofhydrogen bonding interactions in the HSMA/St4VPy polymer–polymer complexes from the com-position dependence of the glass transition.
2. Experimental section
2.1. Materials
Poly(styrene-co-maleic anhydride), (SMA28) and(SMA50) containing 28 and 50 mol% of maleicanhydride, respectively, and poly(styrene-co-4-vinylpyridine), (St4VPy32) containing 32.16 mol%of 4-vinylpyridine, were prepared in 1,4-dioxane
solution by free radical polymerisation using AIBNas initiator agent. The degree of conversion wascontrolled and kept below 10%, to minimise compo-sition drifts. Samples were purified by two dissolu-tion–precipitation cycles using 1,4-dioxane and n-hexane as the non-solvent.
The composition of maleic anhydride in SMA28and SMA50 and the composition of 4-vinylpyridinein the St4VPy32 sample were determined by elemen-tal analysis using a Perkin–Elmer 2400 elementalanalyser.
Weight-average molecular weights, Mw, andpolydispersities, Mw/Mn, were determined by sizeexclusion chromatography in THF solution, usinga Waters GPCII, calibrated with polystyrene stan-dards. The characteristics of the copolymers arelisted in Table 1.
SMA28 and SMA50 were hydrolysed in refluxingwater–butanone 20/80 wt% solution at 60 �C for 2and 4 days, respectively. The solution was thenpoured in excess petroleum ether, to precipitatethe polymers. Hydrolysed poly(styrene-co-maleicanhydride), HSMA28 and HSMA50 were dried ina vacuum oven at 65 �C for 2 weeks. The degreesof hydrolysis calculated by elemental analysis are100% and 12% for HSMA50 and HSMA28,respectively.
2.2. Preparation of interpolymer complexes
HSMA28, HSMA50 and St4VPy32 were sepa-rately dissolved in 1,4-dioxane (2% w/v). Precipi-tates formed immediately upon mixing the HSMAand St4VPy32 solutions. After 2 days continuousstirring, polymer complexes in the form of precipi-tates were isolated by centrifugation and thenwashed with the same solvent. The precipitate wasdried in vacuum for 2 weeks, at 65 �C, to ensuretotal elimination of residual solvent.
The yield values reported in Table 2 correspondto the ratio between the amount of dried complex

Table 2Characteristics of HSMA50/St4VPy32 and HSMA28/St4VPy32complexes from 2,4-dioxane solutions
HSMA50content
HSMA50/St4VPy32
HSMA28content
HSMA28/St4VPy32
Feed(wt%)
Bulk(mol%)
Yield(wt%)
Tg
(�C)Feed(wt%)
Bulk(mol%)
Yield(wt%)
Tg
(�C)
10 44 43 150 10 12 3 13720 54 68 176 20 29 31 16730 54 81 184 30 34 61 17740 65 83 195 40 40 73 17950 65 85 203 50 45 81 17360 71 64 202 60 53 71 16970 65 52 200 70 55 62 16480 71 43 205 80 59 18 16090 67 43 210 90 77 19 159
N. Haddadine-rahmoun et al. / European Polymer Journal 44 (2008) 821–831 823
and the total amount of the two polymers in the ini-tial solution.
The nitrogen contents of the various complexeswere determined by elemental analysis using a Per-kin–Elmer 2400 elemental analyser, the sampleweight being about 2 mg in all cases. The bulk com-position of the complexes was calculated from theirnitrogen content, which is proportional to theamount of St4VPy32. Complexes were stored in des-iccators to prevent moisture absorption.
2.3. Tg measurements
The glass-transition temperatures (Tgs) of thesamples were measured with a TA Instrument 2010,DSC2 differential scanning calorimeter (DSC) usinga sample size of approximately 10–15 mg, at a heat-ing rate of 20 K/min, under nitrogen flow. The initialonset of the change of slope in the DSC trace duringthe second heating was identified with the sample Tg.All samples were preheated to 180 �C and kept for10 min at that temperature to ensure completeremoval of any trace of solvent.
The Tg data of the copolymers are listed inTable 1. The glass transitions temperature of thepoly(styrene-co-acid anhydride) samples, HSAM50and HSAM28, after hydrolysis, are 214 �C and165 �C. One should note that the first stage degrada-tion temperatures are 193 �C and 169 �C forHSAM50 and HSAM28, respectively, as deter-mined by the thermogravimetric measurements tobe shown later. Therefore care was taken in theDSC measurements not to exceed 180 �C in the firstscan to avoid anhydride formation, which can mod-ify the structure of the initial copolymers and givehigher value of their Tgs.
2.4. Fourier-transform infrared spectroscopy
measurements
Infrared spectra were recorded on a Nicolet 560Fourier Transform Infrared Spectrometer at roomtemperature for the copolymers and at 50 �C forHSMA50. Copolymer solutions of 1.2 g/dl concen-tration were stirred for 1 day to ensure thermody-namic equilibrium and then cast on Teflon discs.The samples were first dried at room temperatureto reduce the rate of evaporation and avoid filmcracking, and then placed in a vacuum oven at60 �C for several days. The infrared spectra ofcopolymers and complexes used for the quantitativeanalysis were recorded on a Bio-Rad 165 FTIRspectrophotometer, at room temperature. The reso-lution of the instruments was set at 2 cm�1 and atleast 64 scans per spectrum were recorded.
2.5. Thermogravimetric measurements
Thermogravimetric (TG) and Differential Ther-mogravimetric (DTG) measurements were per-formed using a DuPont Thermal Analyser 2000(50 cm3/min nitrogen flow). About 10 mg of samplewas heated in a platinum crucible from ambienttemperature to 600 �C, at a heating rate of 10 �C/min. The fractional conversion and the correspond-ing temperatures at which changes occur were eval-uated using the general analysis software versionV4.0D. The onset temperature of decompositionwas determined from the inflection point, on extrap-olation of the initial base of the TG curves.
3. Results and discussion
3.1. Infrared studies of copolymers
The chemical structures of the copolymers stud-ied are given in Fig. 1. As shown in Fig. 2, the FTIRspectra of SMA50 show two bands at 1850 and1780 cm�1 characteristic of the five ring cyclic anhy-dride corresponding to maleic anhydride groups.The FTIR spectrum of HSMA50 obtained afterhydrolysis, shows that these two bands have almostdisappeared and a new double band whose maximaare located at 1649 cm�1 and 1704 cm�1 hasappeared. The former is assigned to HOH bendingand it indicates that water adsorption on the hydro-philic acid group is present in this copolymer.
The water adsorption band disappears after heat-ing the HSMA50 copolymer at 50 �C suggesting
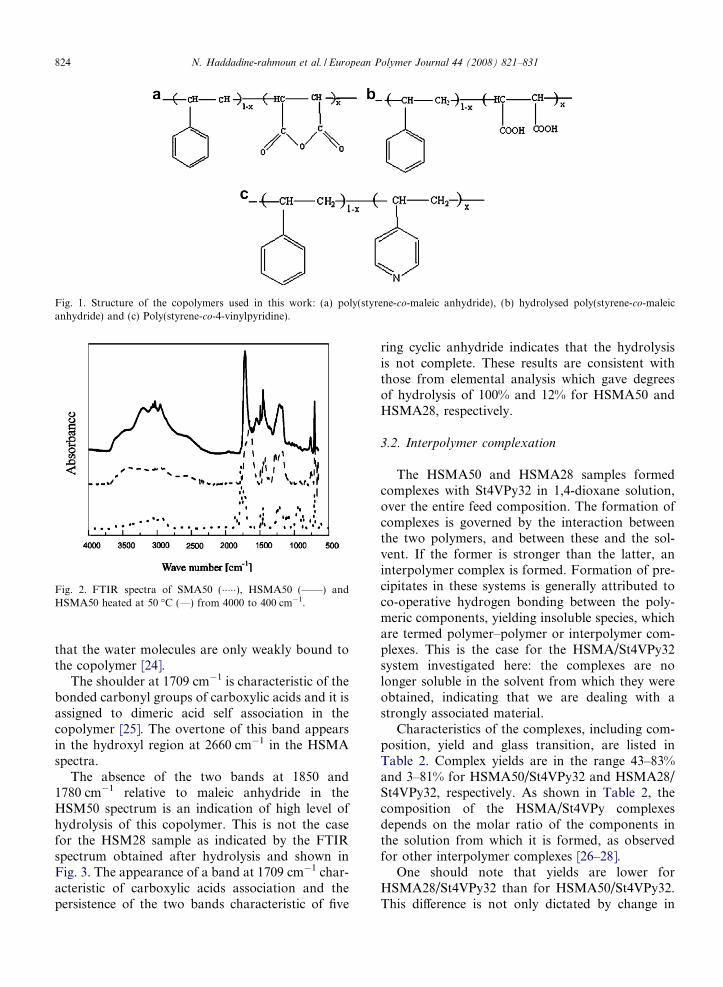
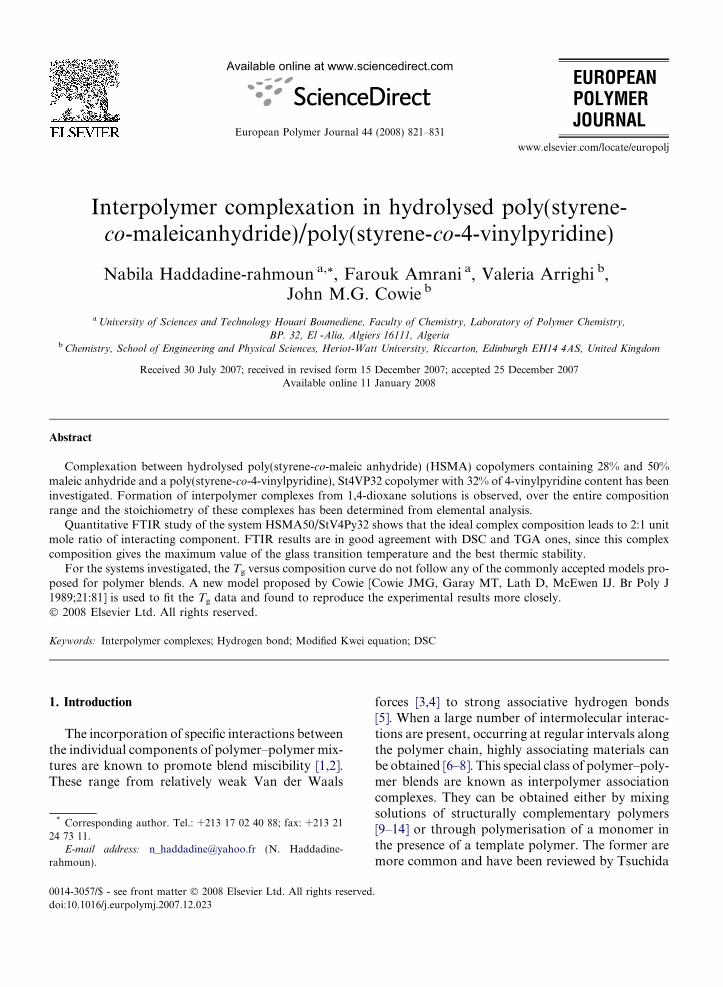
Fig. 1. Structure of the copolymers used in this work: (a) poly(styrene-co-maleic anhydride), (b) hydrolysed poly(styrene-co-maleicanhydride) and (c) Poly(styrene-co-4-vinylpyridine).
Fig. 2. FTIR spectra of SMA50 (�����), HSMA50 (——) andHSMA50 heated at 50 �C (—) from 4000 to 400 cm�1.
824 N. Haddadine-rahmoun et al. / European Polymer Journal 44 (2008) 821–831
that the water molecules are only weakly bound tothe copolymer [24].
The shoulder at 1709 cm�1 is characteristic of thebonded carbonyl groups of carboxylic acids and it isassigned to dimeric acid self association in thecopolymer [25]. The overtone of this band appearsin the hydroxyl region at 2660 cm�1 in the HSMAspectra.
The absence of the two bands at 1850 and1780 cm�1 relative to maleic anhydride in theHSM50 spectrum is an indication of high level ofhydrolysis of this copolymer. This is not the casefor the HSM28 sample as indicated by the FTIRspectrum obtained after hydrolysis and shown inFig. 3. The appearance of a band at 1709 cm�1 char-acteristic of carboxylic acids association and thepersistence of the two bands characteristic of five
ring cyclic anhydride indicates that the hydrolysisis not complete. These results are consistent withthose from elemental analysis which gave degreesof hydrolysis of 100% and 12% for HSMA50 andHSMA28, respectively.
3.2. Interpolymer complexation
The HSMA50 and HSMA28 samples formedcomplexes with St4VPy32 in 1,4-dioxane solution,over the entire feed composition. The formation ofcomplexes is governed by the interaction betweenthe two polymers, and between these and the sol-vent. If the former is stronger than the latter, aninterpolymer complex is formed. Formation of pre-cipitates in these systems is generally attributed toco-operative hydrogen bonding between the poly-meric components, yielding insoluble species, whichare termed polymer–polymer or interpolymer com-plexes. This is the case for the HSMA/St4VPy32system investigated here: the complexes are nolonger soluble in the solvent from which they wereobtained, indicating that we are dealing with astrongly associated material.
Characteristics of the complexes, including com-position, yield and glass transition, are listed inTable 2. Complex yields are in the range 43–83%and 3–81% for HSMA50/St4VPy32 and HSMA28/St4VPy32, respectively. As shown in Table 2, thecomposition of the HSMA/St4VPy complexesdepends on the molar ratio of the components inthe solution from which it is formed, as observedfor other interpolymer complexes [26–28].
One should note that yields are lower forHSMA28/St4VPy32 than for HSMA50/St4VPy32.This difference is not only dictated by change in

Fig. 3. FTIR spectra of SMA28 (�����) and HSMA28 (___) from4000 to 400 cm�1.
N. Haddadine-rahmoun et al. / European Polymer Journal 44 (2008) 821–831 825
HSMA composition but it also probably resultsfrom difference in the degree of hydrolysis.
3.3. Glass transition
The complexes formed by the mixing of pre-exist-ing polymers are characterized by a well-definedstoichiometry, which is often independent of thecomposition of the starting mixture, and displaythermal and mechanical properties that differ signif-icantly from those of the individual polymericcomponents [21].
Many complexes have higher Tgs than the com-ponent polymers [26–28]. In several cases, the Tg
of the complex exceeds that of the high-Tg compo-nent. These high Tg values have been ascribed tointeractions between the polymeric componentswhich act as physical cross-links, resulting inreduced segmental mobility, hence leading to higherTg.
All complexes prepared in this work display a sin-gle Tg, indicative of a miscible blend. Tg values arereported in Table 2 and plotted versus compositionin Figs. 4 and 5. For both systems investigated, theTgs are higher than predicted by linear additivity,values ranging from 183–210 �C for HSMA50/St4VPy32 and from 177 to 169 �C for HSMA26/St4VPy32. This suggests strong interactions betweenthe two components, restricting chain motion andthereby raising Tg. It is generally observed thatcomplexes show large positive deviation because ofthe intimate contact between the two complemen-tary copolymers.
The glass transition of miscible blends and itschanges with blend composition can be describedby several empirical equations, such as those pro-posed by Gordon–Taylor [29], Eq. (1) given by
T g ¼w1T g1
þ kw2T g2
w1 þ kw2
ð1Þ
where Tg is the blend glass transition, T g1and T g2
are those of the pure components and wi the weightfraction of component i. The semiempirical param-eter k ¼ DCp2
=DCp1, with DCpi
representing the dif-ference in specific heat between the liquid andglassy states at T gi
, is treated as an adjustable fittingparameter.
Other models include the Jenkel and Heusch [30]Eq. (2)
T g ¼ w1T g1þ w2T g2
þ bw1w2ðT g1� T g2
Þ ð2Þ
where b is an empirical parameter that varies fromsystem to system, the Fox [31] Eq. (3)
1
T g
¼ w1
T g1
þ w2
T g2
ð3Þ
and the Couchman [32] Eq. (4)
ln T g ¼w1DCp1 ln T g1
þ w2DCp2ln T g2
w1DCp1þ w2DCp2
ð4Þ
A further model which has been extensivelyemployed, and it is particularly suited to describesystems with specific interactions, is the Kwei [23]Eq. (5):
T g ¼w1T g1
þ kw2T g2
w1 þ kw2
þ qw1w2 ð5Þ
Here the empirical fitting parameter q gives ameasure of the strength of the specific interactionsacting between the blend components.
As shown in Fig. 4, Eqs. (1)–(5) cannot describethe Tg-composition behaviour of interpolymer com-plexes. Fig. 5 gives plots of Tg versus complex com-position for the HSMA50/St4VPy32 and HSMA28/St4VPy32 systems. Both data sets display a maxi-mum Tg value at a given composition which corre-sponds to the maximum yield of complex. Thissupports the suggestion that the number of ‘connec-tions’ between interacting copolymers is maximisedat a given copolymer–copolymer ratio. When thefeeds approximate this ratio the complex yieldshould be at its highest and this should give tightlybound and thus high Tg complexes. The maximumglass transition temperature for HSMA50/St4VPy32 and HSMA28/ St4VPy32 occur at 65

Fig. 4. Glass transitions of complexes versus feed compositionfor (a) HSMA28/St4VPy32 and (b) HSMA50/St4VPy32 com-parison with expected trends according to Eqs. (1)–(5) andtheoretical curves predicted by Kwei (____), Gordon–Taylor (_._._),Couchman (_.._.._), Jenkel-Heusch (———) and fox (������)equations.
Fig. 5. Tg-composition curves of HSAM50/St4VPy32 [h] andHSAM28/St4VPy32 [D] complexes. Lines are theoretical Tgcalculated from modified Kwei equation.
826 N. Haddadine-rahmoun et al. / European Polymer Journal 44 (2008) 821–831
and 40 mol% of HSMA50 and HSMA28 respec-tively, which correspond to initial feed compositionsof 50 and 40 mol% of acidic copolymer and coincidewith the maximum yield of complex for each ofthese systems (Table 2).
In the examined systems, the composition of thecomplex obtained from different feeds approachesan ideal ratio; moreover the composition of theresultant complex appears to strive towards an ideal
level which is somewhat greater than one to oneratio of polymers in the complex. So that appearsas a narrowing of the plot of Tg versus complexcomposition, see Fig. 5, consequently the inter poly-mer complexes would form the S-shape Tg behav-iour with presence of maxima and inflexion.
Moreover the inter polymer complexes underexamination do not fall within the scope of any ofthe commonly accepted models proposed for poly-mer blends, since it is not possible for any systemdescribed by these models to show a maximum,minimum or inflexion, this is why a new modelwhich fits the data more closely is required.
The Kwei equation (5), then contains almost allnecessary elements to effectively model a systemwhere the polymer chains interact to some extentand could form the basis of any extended model.The asymmetric shape of the Tg versus compositioncurve needs the k value to be maintained. The samecurve has also an exaggerated form of the S-shapewhich the Kwei model describes so well, that meansthe q value is also valid.
However, since the number of interactions occur-ring in the interpolymer complex are important andhave higher order to those occurring in polymerblend, it should be evident that the equation ele-ments of the model, have also different order ‘‘n”.
One further fact which presents the major failingof the Kwei equation concerns the maxima of the Tg
versus composition curve which do not occurs onthe one to one polymers ratio.
Harding and Cowie have proposed a slightlymodified version of Eq. (5) to describe the composi-

N. Haddadine-rahmoun et al. / European Polymer Journal 44 (2008) 821–831 827
tion dependence of the glass transition of interpoly-mer complexes
T g ¼ðw1 þ f ÞT g1
þ kðw2 � f ÞT g2
ðw1 þ f Þ þ kðw2 � f Þþ ðqðw1 þ f Þðw2 � f ÞÞn ð6Þ
Comparison between Eqs. (5) and (6) shows thatthe latter includes two additional empirical parame-ters: a shifting factor f which describes deviationsfrom the 1:1 polymer [A]/polymer [B] ratio, and aparameter n which represents the degree of co-oper-ation between the two polymers forming the com-plex. This new model was designed to explain thesimplest mathematical relation for a physical prop-erty between a pair of polymers, producing a smallregular deviation across the entire compositionrange of the complex [22].
As previously mentioned before, the changes inTgs with complex composition cannot be explainedby the Kwei equation; factor ‘n’ needs to be intro-duced which accounts for the degree of affinity ofthe polymers to each other.
In systems where the polymers have no particularaffinity n = 1, reducing to the original Kwei equa-tion, but high n values indicate high polymer–poly-mer affinity. The parameters n and f are empirical,but they do provide a way for comparison of the rel-ative strengths of polymer–polymer interactions inblends of a pre-formed complex. The Tg behaviourof both systems studied presents a positivedeviation.
The best fitting parameters obtained with themodified Kwei equation (k, q, n and f) are summa-rized in Table 3. According to these results, ‘n’ ishigher for HSMA28/St4VPy32 than for HSMA50/St4VPy32 so we can expect stronger backbone inter-actions in the first system.
This can be explained by considering thatHSAM50 forms more dimeric acid–acid intra andintermolecular interactions (which are in competi-tion with the formation of acid–pyridyl interactions)than HSAM28 as expected given the low degree of
Table 3Fitting parameters obtained by using the modified Kwei equationto describe the composition dependence of the glass transitions ofHSMA50/St4VPy32 and HSMA28/St4VPy32
System k q n f
HSAM50/St4VPy32 2.5 7.9 6.0 �0.14HSAMH28/St4VPy32 1.5 6.7 7.2 0.12
hydrolysis. Additionally, HSAM28 has lower acid–acid interactions along the polymeric chain thanHSMA50 and this is likely to result in better inter-polymer associations with formation more acid–pyridyl interactions.
The value of q which is a measure of the back-bone stabilisation is higher in the system HSMA50/StV4Py32 than HSMA28/StV4Py32. This result wasexpected since the Tgs value of the former systemare higher than those obtained for the later one(Table 3).
3.4. FTIR Characterisation of the complexes
FTIR spectroscopy is a powerful tool for investi-gating specific intermolecular interactions. It hasbeen reported that intermolecular hydrogen bond-ing plays a dominant role in determining the misci-bility of polymers containing carbonyl or carbonategroups [33]. FTIR studies also provide evidence ofionic interactions in complexes.
The pyridyl modes are useful in monitoring inter-molecular interactions [34–38]. According to thechemical structure of the copolymers involved inthe interpolymer complexation process (Fig. 1), itmay be expected that extensive hydrogen bondingwould be at the origin of complex formation involv-ing carboxyl and pyridyl groups.
The pyridinium absorbance appears as a mainlysharp peak centred between 1630 and 1637 cm�1
according to the strength of the ionic interactions,which can change from one system to the other[39,40]. This peak can not be confused with thewater absorption since this later appears as a largeshoulder around 1649 cm�1 of the mean carboxylicband situated around 1700 cm�1 [24].
As shown in Fig. 6, the pyridyl ring stretchingmodes of St4VPy32 at 1597 cm�1 gradually shiftto higher frequencies, i.e. 1607 cm�1, with increas-ing HSMA50 content in the complex. The shiftarises from an increase in the rigidity of the pyridylring due to intermolecular interactions. This result islater confirmed by quantitative FTIR analysis.More importantly, the appearance of a pyridiniumring stretching band at 1637 cm�1 clearly showsthe presence of ionic interaction in the complexes(Fig. 8). The transfer of protons from the carboxylicgroups of HSMA to the nitrogen atoms ofSt4VPy32 also leads to the appearance of an anti-symmetric vibration band of carboxylate anions(va, COO�) which is usually located in the regionof 1600–1550 cm�1. In this case, this band is not

Fig. 6. FTIR spectra of the HSMA50/St4VPy32 system in 1660–1570 cm�1 regions (blend composition indicated).
828 N. Haddadine-rahmoun et al. / European Polymer Journal 44 (2008) 821–831
observed due to possible overlapping with the pyri-dyl ring band [35].
The inter association interactions can be deter-mined by FTIR measurements through the analysisof the vibration bands of the pyridyl (C@C) doublebond. This band shows three spectral contributions,one due to the stretching vibration of the free pyri-dine ring at 1597 cm�1, the second one at 1607 cm�1
attributed to the hydrogen interaction and the lastone at 1637 cm�1, corresponding to the pyridiniumcation [39,40]. The first two contributions overlapwith the styrene vibration at 1601 cm�1. Therefore,in order to assess the relative contributions to theoverall spectrum it is necessary to deconvolute intothe different components. Thus an attempt to deter-mine the fraction of free, associated and complexedpyridyl groups, curve-fitting was carried out in theregion 1660–1575 cm�1. Both Gaussian and Lorenz-ian curves were used for the deconvolution processand the best results were obtained using Lorentzians
Table 4Fitting parameters as obtained from curve fitting of the infrared spectrato 1660 cm�1, at room temperature
Mol% Free pyridyl groups Associated pyri
Wave-number(cm�1)
Width(cm�1)
ff Wave-number(cm�1)
44 1597 21.20 0.41 160454 1597 6.03 0.08 160765 1597 2.88 0.06 160367 1597 7.57 0.02 160771 1597 12.82 0.11 1607
(as indicated by the correlation coefficient). Quanti-tative FTIR data are reported in Table 4. Anincrease of the fractional area of the complexed pyr-idyl ring and a decrease of the fractional area of thefree and associated pyridyl rings with feed composi-tion (expressed as mol% of HSMA50) is evident.This is a consequence of the increasing ionic interac-tion between the pyridyl nitrogen and the hydrogenof the poly(acid), at high feed compositions ofHSMA50.
The results of this analysis made possible to sep-arate three bands relative to St4VPy vibrations andcentred at 1601, 1597 and 1583 cm�1 and two bandsrelative to HSMA located at 1601 and 1583 cm�1.
Similar quantitative FTIR studies of pyridinecomplexation as a function of temperature were car-ried out by M. Iriarte et al [39] for the poly(maleicacid-alt-ethylene)/poly(4-vinylpyridine) system.The authors found that the total area of the free,associated and complexed pyridyl groups remainedconstant, reflecting that the absorption coefficientsof these three vibrations are similar. According tothis, they calculated the fraction of free pyridinegroup from the following relationship:
ff ¼A1597
A1597 þ A1607 þ A1637
ð7Þ
where A1597, A1597 and A1597 are the areas of thefree, associated and complexed pyridyl groups,respectively. The fractional areas of the associatedfa and complexed fc pyridyl ring calculated by thesame maner are plotted in Fig. 7 against bulk com-plex composition.
The fractional areas of the free, associated andcomplexed pyridyl: the fractional area of the com-plexed pyridyl ring, fc, reaches a maximum valuefor a bulk composition corresponding to 65 mol%of HSMA50. At the same composition the frac-tional area of the associated pyridyl ring reaches aminimum. This result is in good agreement with
of HSMA50/St4VPy32 complexes in the pyridyl region from 1575
dyl groups Ionised pyridyl groups
Width(cm�1)
fa Wave-number(cm�1)
Width(cm�1)
fc
6.43 0.41 1637 31.00 0.188.64 0.15 1637 12.19 0.773.14 0.08 1637 68.05 0.99
12.57 0.03 1639 95.25 0.947.90 0.11 1637 42.88 0.77

Fig. 7. Variation of fraction area of free ff [h], associated fa [s]and complexed fc[D] pyridyl ring via bulk composition ofHSMA50.
Fig. 8. Thermogravimetric and differential thermogravimetriccurves of HSMA50, St4VPy32 and their complex in 4/6 ratio.
Fig. 9. Thermogravimetric and differential thermogravimetriccurves of HSMA28, St4VPy32 and their complex in 4/6 ratio.
N. Haddadine-rahmoun et al. / European Polymer Journal 44 (2008) 821–831 829
the DSC data, since the maximum value of the glasstransition temperature was obtained for a complexof 65 mol% of HSMA50 bulk composition, corre-sponding to a 40 mol% feed composition ofHSMA50.
We therefore conclude that for a feed composi-tion of 40 mol% of HSMA50 in HSMA50/St4VPy32 complex corresponding to a bulk compo-sition of 65 mol% of HSMA50, the Tg maximumwhich is observed (Fig. 7) correspond to a maxi-mum ratio of complexation.
All analysis showed that the ideal complex com-position leads to 2:1 unit mole ratio of interactingcomponent for the system HSMA50/StV4Py32.
3.5. Thermogravimetric measurements
The TGA thermograms of HSMA50, HSMA28and PSt4VP32 and their complexes are shown inFigs. 8 and 9. These thermograms show that allcopolymers degrade in two main stages while theircomplexes display three-stage degradation. The firststage of degradation for the acidic copolymers and
their complexes is mainly associated with loss ofwater [23]. The percentage of mass loss increaseswith increasing acid content in the copolymers;however, it always exceeds the calculated loss ofwater molecules through anhydride formation. Thisis to be attributed to the hydrophilic character ofthe maleic acid copolymers [23]. The other decom-position reactions which can take place at highertemperature involve decarboxylation during the sec-ond and third stages. The onset temperature of thesecond main degradation stage and the temperatureof maximum degradation for the copolymers ofboth acids decrease with acid content. The incom-plete degradation of the copolymers and their com-plexes is probably a result of thermal cross-linkinginduced by heating the sample during thermogravi-metric analysis. The thermogravimetric parametersof all samples investigated in this work are summa-rized in Table 5 for the copolymers and Table 6 for

Table 6Thermogravimetric data for hydrolysed poly(styrene-co-maleic anhydride)/poly(styrene-co-4vinylpyridine) complexes
Feed ratio Stage 1 Stage 2 Stage 3
DTa (�C) DWb (wt%) Tmaxc (�C) DTa (�C) DWb (wt%) Tmax
c (�C) DTa (�C) Tmaxc (�C) Residual weight (wt%)
HSMA50/St4VPy32
9/1 110–239 19.5 187 239–296 5.22 262 296–479 398 5.08/2 72–232 22.01 180 232–290 5.78 256 294–503 402 5.86/4 121–236 17.0 191 236–297 6.68 263 297–484 395 14.51/1 122–202 14.09 164 202–300 12.11 264 300–488 397 5.34/6 64–225 17.4 175 225–292 7.12 250 292–477 398 4.53/7 111–213 13.39 170 213–286 5.25 251 286–462 397 4.32/8 107–228 14.56 175 228–298 4.85 247 298–475 397 4.61/9 124–227 14.19 186 227–292 3.94 244 296–473 398 4.6
HSMA28/St4VPy32
7/3 121–235 15.08 175 235–302 2.43 272 302–460 397 7.06/4 122–236 12.52 174 236–300 3.63 264 300–463 398 4.34/6 113–230 13.66 173 230–295 1.74 263 295–453 396 6.1
Table 5Thermogravimetric data for HSMA and St4VPy copolymers
Copolymers Stage 1 Stage 2
DTa (�C) DWb (wt%) Tmaxc (�C) DTa (�C) Tmax
c (�C) Residual (wt%)
HSMA50 128–193 14.3 193 301–496 372 7.53HSMA28 99–220 9.33 169 304–497 394 9.46St4VPy32 126–222 1.62 149 398–474 427.8 1.43
a Temperature range.b Total weight loss percentage at the end of the step.c Temperature maximum values for each step.
830 N. Haddadine-rahmoun et al. / European Polymer Journal 44 (2008) 821–831
the complexes. It is observed that HSMA50 hasmuch lower thermal stability than HSMA28 andSt4VPy32.
The thermal behaviour of the poly-complexesindicates the existence of different degradative pro-cesses. The degradative reactions start around140 �C with loss of water molecules. The secondstage of degradation involves the formation of cyclicanhydrides. Above 294 �C, in the last stage of degra-dation, the formation of linear anhydrides becomesimportant, which leads to physical cross-linking ofthe material [36]. Overlapped with these processesare decarboxylation reactions with loss of CO andCO2.
4. Conclusions
The results obtained in this work confirm thatmixing solutions of hydrolysed poly(styrene-co-maleic anhydride) and poly(styrene-co-4-vinylpyri-dine) containing 28% and 50% of maleic anhydrideand 32% of 4-vinylpyridine, under appropriateexperimental conditions, lead to the formation ofcomplexes over the entire feed composition.
The results presented here seem to indicate that65 mol% of HSMA50 bulk composition forHSMA50/St4VPy32 complex gives the best yieldcorresponding to the higher value of the Tg andgives the maximum ionic interactions and the higherthermogravimetric stability and all analysis showedthat the ideal complex composition leads to 2:1 unitmole ratio of interacting component for the systemHSMA50/StV4Py32.
The similar proprieties seem to be obtained forthe bulk composition corresponding to 40 mol% ofHSMA28 for the complex HSMA28/St4VPy32.
The behaviour of polymer complexes is radicallydifferent from that of polymer blends. The polymercomplexes do not follow any of the existing modelsfor predicting the glass transitions of polymerblends. The empirical method used here allows fora high degree of interaction between the componentpolymers in a complex and appears suitable todescribe the variation of Tg with composition.
This model, based on the Kwei equation, intro-duces two new parameters: a factor, n, which relatesto the level of interaction between the two polymersinvolved in complexation, and a ‘shift factor’, f, that

N. Haddadine-rahmoun et al. / European Polymer Journal 44 (2008) 821–831 831
accounts for the fact that in tightly bound complexesthe ideal composition ratio may not be 1:1 in all cases.
Acknowledgements
N.H.R gratefully acknowledges financial supportfrom The Faculty of Chemistry, University ofSciences and Technology Houari Boumediene. Shethanks Professor A.J. Welch for supporting her vis-its at Heriot-Watt University, Dr. J. Hargreaves andDr. M. Mezna for supporting her visit at GlasgowUniversity. The authors thank Mrs. ChristinaGraham for carrying out the elemental analysis mea-surements and Dr. I.J. McEwen for help and assis-tance during the first part of the project.
References
[1] Hara M, Wu JL, Lee AH. Macromolecules 1988;21:2214.[2] Eisenberg A, Hara M. Polym Eng Sci 1984;24:1306.[3] Challa G, Tan YY. Pure Appl Chem 1981;53:627.[4] Challa G, Tan YY. Int J Polym Mater 1976;4:239.[5] Pierce EM, Kwei TK, Min BY. J Macromol Sci Chem
1984;A21:118.[6] Smith KL, Winslow AE, Peterson DE. Ind Eng Chem
1959;51:1361.[7] Aubin M, Voyer RE, Prud’homme RE. Makromol Chem-
Rapid 1984;5:419.[8] Cowie JMG, Garay MT, Lath D, McEwen IJ. Br Polym J
1989;21:81.[9] Pennacchia J, Pearce EM, Kwei TK, Bulkin BJ, Chen JP.
Macromolecules 1986;19:973.[10] Kwei TK. J Polym Sci Polym Lett Ed 1984;22:307.[11] Chen FL, Pearce EM, Kwei TK. Polymer 1988;29:2285.[12] Yang TP, Pearce EM, Kwei TK, Bulkin BJ, Chen JP.
Macromolecules 1989;22:1813.[13] Lin PY, Clash C, Pearce EM, Kwei TK. J Polym Sci Polym
Phys Ed 1988;26:603.[14] Garay MT, Rodriguez M, Vilas JL, Leon LM. J Macromol
Sci Phys 2004;43:437.
[15] Tsuchida E, Abe K. Adv Polym Sci 1982;45:2.[16] Vivas de Meftahi M, Frechet JM. Polymer 1988;29:477.[17] Dai J, Goh SH, Lee SY, Siow KS. Polym J 1994;26:905.[18] Oyama HT, Nakajima T. J Polym Sci Polym Chem Ed
1983;21:2987.[19] Fujimori K, Costigan MJ, Trainor GT. J Polym Sci Polym
Chem Ed 1984;22:2479.[20] Lee JY, Painter PC, Colman MM. Macromolecules 1998;21:
346.[21] Gargallo L, Gatica N, Radic D. Int J Polymer Mater
1994;27:107.[22] Harding PD. A study of the relationship between water, water
soluble polymers and their inter-polymer association com-plexes. PhD thesis, Heriot-Watt University; Edinburgh,1997.
[23] Kwei TK. J Polym Lett Ed 1984;22:307.[24] Switala-Zeliazkow M. Polym Degrad Stab 2006;91:1233–9.[25] Daniliuc L, David C. Polymer 1996;37:5219.[26] Bokias G, Staikos G, Ilopoulos I, Audebert R. Macromol-
ecules 1994;27:427.[27] Ilopoulos I, Audebert R. J Polym Sci Polym Phys Ed
1998;26:2093.[28] Wong LF, Pearce EM, Kwei TK. J Polym Sci Polym Phys
Ed 1991;29:619.[29] Gordon M, Taylor JS. J Appl Chem 1952;2:493.[30] Jenkel E, Heusch K. Kolloid Z 1953;130:89.[31] Fox TG. Bull Am Phys Soc 1956;1:123.[32] Couchman PR. Macromolecules 1978;11:1157.[33] Li X et al. Polymer 2001;42:5463.[34] Kuo SW, Huang CF, Chang FC. J Polym Sci Polym Phys
Ed 2001;39:1348.[35] Velada JL, Cesteros LC, Katime I. Appl Spectrosc 1996;50:
893.[36] Cesteros LC, Meaurio E, Katime I. Macromolecules
1993;26:2323.[37] Cesteros LC, Velada JL, Katime I. Polymer 1995;36:2765.[38] Lee JY, Painter PC, Coleman MM. Macromolecules
1988;21:954.[39] Villar V, Irusta L, Fernandez-Berridi MJ, Iruin JJ, Iriarte M.
Thermochim Acta 2003;402:209.[40] Colemann MM, Graf JF, Painter PC. Specific interaction
and the miscibility of polymer blends. Lancaster, PA: Tech-nomic Publishing Inc; 1991.


![Nanostructured poly(urethane)s and poly(urethane-urea)s from reactive solutions of poly[styrene-b-butadiene-b-(methyl methacrylate)]-triblock copolymers](https://img.pdfslide.net/doc/110x75/63494541b88fb0854f02e452/nanostructured-polyurethanes-and-polyurethane-ureas-from-reactive-solutions.jpg)


