Embed Size (px)
Citation preview
ADVANCES IN X-RAY COMPUTED MICROTOMOGRAPHY AT THE NSLS
B.A. Dowd, A.B. Andrews, K.W. Jones, R.B. Marr, A.M. Peskin, D.P. Siddons Brookhaven National Laboratory, Upton, NewYork, 11973
ABSTRACT
The X-Ray Computed Microtomography (XCMT) workstation at beamline X27A at the NSLS has been utilized by scientists from a broad range of disciplines from industrial materials processing to environmental science. The facility is being used to study the structure and properties of a wide variety of materials including aerostructure materials, reservoir sandstones, rodent bones, insects, wood products, and soils with resolution on the order of two microns. For example, the tomographic data of reservoir sandstone has been used to determine porosity and to model fluid flow in the oil fields. Volumetric images of wood infested with fungi have been used to track the structural changes in the path of an invading fungus. Microtomographs of rodent bones are producing structural information useful for the study of osteoporosis. Some results from these as well as other studies are presented here, along with recent improvements to the instrument. One exciting new development resulted from a pursuit of faster reconstruction techniques. A Fast Filtered Back Transform (FFBT) reconstruction program has been developed and implemented, that is based on a refinement of the “gridding” algorithm first developed for use with radio astronomical data. This program has reduced the reconstruction time to 8.5 set for a 929 x 929 pixel2 slice on an RlO,OOO CPU, more than 8x reduction compared with the Filtered Back-Projection method.
INTRODUCTION
X-Ray Computed Tomography provides volumetric data of elemental composition nondestructively, by mapping the three-dimensional X-Ray absorption through the sample. As such, CMT can be a valuable tool in uncovering spatial distribution and interconnectivity of pore or elements through a volume. The technique was initially developed for clinical use in radiology in the 1970’s21,22. In the 1980’s, the availability of synchrotron X-ray sources to the scientific community broadened the scope of tomography and gave rise to a new breed of high-resolution or Microtomography (XCMT) instrumentation. The high fluence and energy tunability of nearly collimated synchrotron sources made monochromatic, high-resolution X-ray transmission measurements possible, enticing scientists from a variety of disciplines to apply XCMT to their worklT6. More recently, commercial developments in two-dimensional detector arrays, parallel architecture computing technology and 3-D visualization schemes have made XCMT even more attractive as a tool for researchers.
The initial motivation for the XCMT station at the NSLS Beamline X27A was to develop an instrument to image the pore geometry of reservoir rock for fluid flow simulations in collaboration with Mobil Corp. Since the inception of the station in 1995, however, the BNL developers have sought to create a tool for investigative research in a multitude of scientific disciplines7. Subsequently, microtomographic volumes of samples ranging from biological to metallurgical have been produced at the beamline. The varying requirements of our users have pushed us toward higher resolution over a larger field of view, calling for high-speed data
Copyright(C)JCPDS-International Centre for Diffraction Data 2000, Advances in X-ray Analysis, Vol.42 171Copyright(C)JCPDS-International Centre for Diffraction Data 2000, Advances in X-ray Analysis, Vol.42 171
acquisition and computing and faster reconstruction algorithms. Currently, one can acquire data at a resolution of 2 microns over a field of view of about 3 mm in 1.5 hours. Larger fields of view of up to 27mm can be obtained at proportionately lower resolution in the same amount of time. Computational time for a 656 x 656 x 656 pixel3 volume or equivalently, 280 million voxels currently stands at 30 minutes, using an on-site Pentium farm running eight Symmetric Multiprocessors (SMP). Once reconstructed, the data is ported over a fiber-optic link to a Silicon Graphics Reality Engine in the 3-D theater located in our Computing and Communications Division (CCD). In this facility, up to 30 viewers can don polarized glasses and fly through the interior of a volume or surface rendering of their sample.
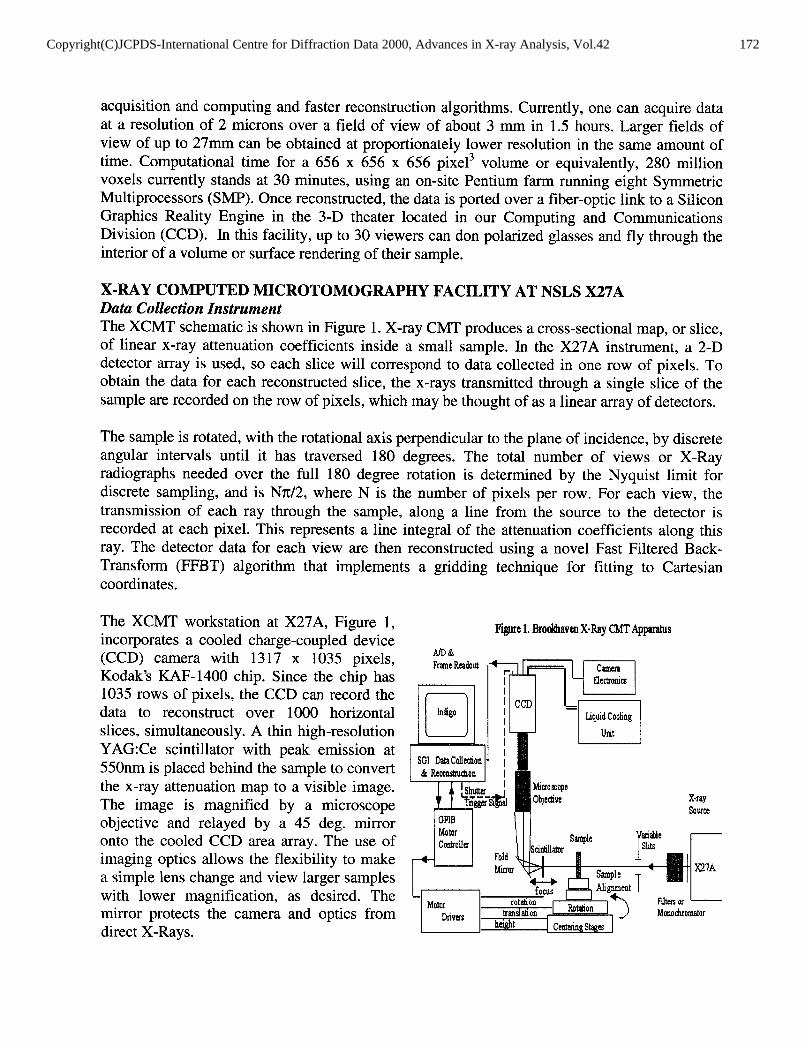
X-RAY COMPUTED MICROTOMOGRAPHY FACILITY AT NSLS X27A Data Collection Instrument The XCMT schematic is shown in Figure 1. X-ray CMT produces a cross-sectional map, or slice, of linear x-ray attenuation coefficients inside a small sample. In the X27A instrument, a 2-D detector array is used, so each slice will correspond to data collected in one row of pixels. To obtain the data for each reconstructed slice, the x-rays transmitted through a single slice of the sample are recorded on the row of pixels, which may be thought of as a linear array of detectors.
The sample is rotated, with the rotational axis perpendicular to the plane of incidence, by discrete angular intervals until it has traversed 180 degrees. The total number of views or X-Ray radiographs needed over the full 180 degree rotation is determined by the Nyquist limit for discrete sampling, and is N7c/2, where N is the number of pixels per row. For each view, the transmission of each ray through the sample, along a line from the source to the detector is recorded at each pixel. This represents a line integral of the attenuation coefficients along this ray. The detector data for each view are then reconstructed using a novel Fast Filtered Back- Transform (FFBT) algorithm that implements a gridding technique for fitting to Cartesian coordinates.
The XCMT workstation at X27A, Figure 1, incorporates a cooled charge-coupled device (CCD) camera with 1317 x 1035 pixels, Kodak’s KAF-1400 chip. Since the chip has 1035 rows of pixels, the CCD can record the data to reconstruct over 1000 horizontal slices, simultaneously. A thin high-resolution YAG:Ce scintillator with peak emission at 550nm is placed behind the sample to convert the x-ray attenuation map to a visible image. The image is magnified by a microscope objective and relayed by a 45 deg. mirror onto the cooled CCD area array. The use of imaging optics allows the flexibility to make a simple lens change and view larger samples with lower magnification, as desired. The mirror protects the camera and optics from direct X-Rays.
Figure 1. Broold~avea X-Ray CMT Appanlus
Copyright(C)JCPDS-International Centre for Diffraction Data 2000, Advances in X-ray Analysis, Vol.42 172Copyright(C)JCPDS-International Centre for Diffraction Data 2000, Advances in X-ray Analysis, Vol.42 172
With the current instrument, one can acquire data at a resolution of 2 microns over a field of view of about 3 mm in 1.5 hours. Larger fields of view of up to 27 mm can be obtained at proportionately lower resolution in the same amount of time. Long working-distance microscope objectives provide a choice of magnification of lx, 3x, 5x, or 10x. A variable zoom microscopic lens of .75 to 3x magnification may also be used. Another variable is the pixel size. For a diffraction-limited lens, the pixel size, d, and optical magnification, M, will generally determine the resolution of the acquired data, d/M. Often, one is willing to sacrifice some resolution in favor of faster data acquisition and higher signal to noise ratios. When this is the case, the CCD may be binned so that NxN adjacent pixels are summed together and read out as one. This allows the user some control over the size of the sample that can be examined, data acquisition time, and resolution.
Of course, variability in the incident X-Ray energy spectrum is also crucial when different types of materials are to be studied on a day-to-day basis. An important addition to the instrument for biological and environmental studies was a double-pair multilayer monochromator. The attenuation coefficient, CL, of an element is a function of both the energy of the X-Ray beam, and the atomic number, Z, of the element. The X-Ray Synchrotron emits a broad energy spectrum. X27A is at the bending magnet section of the ring, where the usable energy range is from about 5 to 50 keV. The attenuation coefficient of a material is strongly dependent on Z, the atomic number of the element, and on the incident X-Ray energy. As polychromatic X-Ray beam traverses a sample the shape of the energy spectrum changes, the lower end of the incident energy spectrum being absorbed more than the higher end. This property is called beam hardening.* Particularly for the lower Z elements found in environmental and biological samples, low energy and monochromatic beam of order 1% bandwidth or less are required to optimize contrast and minimize image artifacts from beam hardening effects.’
The monochromator design chosen for the XCMT beamline uses a highly efficient pair of W-B& multilayers deposited on Silicon substrates made by Osmic, Inc. Energy tunability from 5 to 13keV, with a AE/E of about 1.5% is possible. When higher energies are necessary for metallurgical samples, the monochromator is lowered out of the X-Ray beam path, and the broad-energy or “white” beam is filtered using metal foils to peak the energy spectrum as desired. This flexibility has allowed us to be highly successful in acquiring tomographic volumes of a wide range of sample types and sizes.
Data Reconstruction and Rendering The raw data files are saved as they are collected to a remote drive, for subsequent processing. Because each slice is computed independently, reconstruction is trivially parallelized by parsing the reconstruction of slices to parallel processors. No additional software for parallel processing is required, as it is for Parallel Virtual Memory (PVM), for example. Computational time for the reconstruction of a 656 x 656 x 656 pixel3 volume or 280 million voxels currently stands at 30 minutes, using an on-site Pentium farm running eight Symmetric Multiprocessors (SMP). The Fast Filtered Back Transform (FFBT) used for the reconstruction is described in the section that follows. Once reconstructed, the data is ported over a fiber-optic link to a Silicon Graphics Reality Engine in the 3-D stereo viewing theater located in our Computing Division. A volume or surface rendering is performed on the data to build a 3-D microtomographic volume. This 3-D
Copyright(C)JCPDS-International Centre for Diffraction Data 2000, Advances in X-ray Analysis, Vol.42 173Copyright(C)JCPDS-International Centre for Diffraction Data 2000, Advances in X-ray Analysis, Vol.42 173
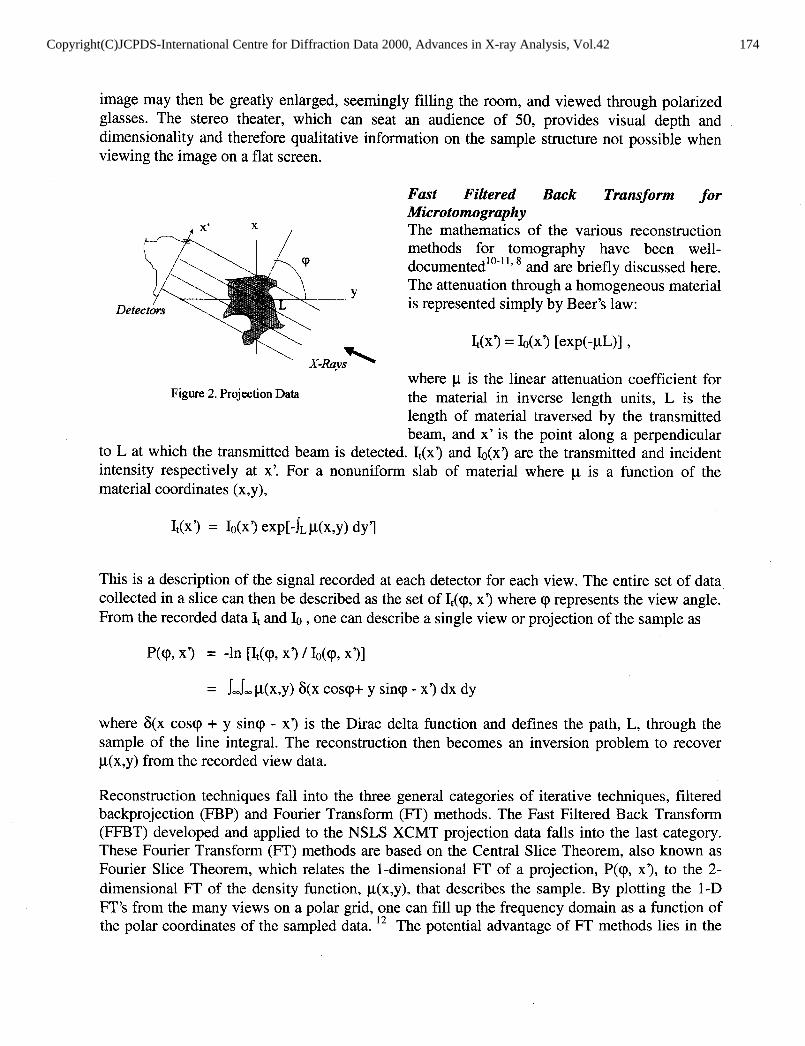
image may then be greatly enlarged, seemingly filling the room, and viewed through polarized glasses. The stereo theater, which can seat an audience of 50, provides visual depth and dimensionality and therefore qualitative information on the sample structure not possible when viewing the image on a flat screen.
Fast Filtered Back Transform for Microtomography The mathematics of the various reconstruction methods for tomography have been well- documented’O-‘lV * and are briefly discussed here. The attenuation through a homogeneous material is represented simply by Beer’s law:
WI = b(x3 [exp(-pL)l ,
where lt is the linear attenuation coefficient for Figure 2. Projection Data the material in inverse length units, L is the
length of material traversed by the transmitted beam, and x’ is the point along a perpendicular
to L at which the transmitted beam is detected. &(x’) and I,$x’) are the transmitted and incident intensity respectively at x’. For a nonuniform slab of material where lt is a function of the material coordinates (x,y),
It(x? = 10(x? exp[-JL p(x,y) dy’l
This is a description of the signal recorded at each detector for each view. The entire set of data collected in a slice can then be described as the set of I,(cp, x’) where <p represents the view angle. From the recorded data It and b , one can describe a single view or projection of the sample as
POP7 x3 = -In Mp, x? / IO@, x31
= Jc-aJc-+(x,y) 6~ x coscp+ y sincp - x’) dx dy
where 6(x coscp + y simp - x’) is the Dirac delta function and defines the path, L, through the sample of the line integral. The reconstruction then becomes an inversion problem to recover p(x,y) from the recorded view data.
Reconstruction techniques fall into the three general categories of iterative techniques, filtered backprojection (FBP) and Fourier Transform (FT) methods. The Fast Filtered Back Transform (FFBT) developed and applied to the NSLS XCMT projection data falls into the last category. These Fourier Transform (FT) methods are based on the Central Slice Theorem, also known as Fourier Slice Theorem, which relates the l-dimensional FT of a projection, P(<p, x’), to the 2- dimensional FT of the density function, p(x,y), that describes the sample. By plotting the 1-D FT’s from the many views on a polar grid, one can fill up the frequency domain as a function of the polar coordinates of the sampled data. l2 The potential advantage of FT methods lies in the
Copyright(C)JCPDS-International Centre for Diffraction Data 2000, Advances in X-ray Analysis, Vol.42 174Copyright(C)JCPDS-International Centre for Diffraction Data 2000, Advances in X-ray Analysis, Vol.42 174
possibility of using the Fast Fourier Transform (FFI) to perform the inverse 2-D FT in a number of steps on the order of N210gN2 for an N x N pixel array, compared with on the order of N3 steps for the filtered backprojection (FBP) method. This requires, however, that the polar grid data be somehow mapped onto a Cartesian grid in a comparable or smaller number of steps.
The traditional approach is to use some relatively simple local interpolation scheme to carry out the polar-to-Cartesian mapping. Despite considerable difficulties encountered in early attempts, several successful Fourier reconstruction algorithms using interpolation were developed in the 1980’s 6,10. Generally speaking, they require oversampling the FT to some degree in the radial direction, for which the interpolation error can be shown to be most critical.”
With the FFRT algorithm, a somewhat different technique called “gridding” is employed. Gridding was first developed by radio astronomers for use in aperture synthesis as a means to back-transform irregularly sampled Fourier data. Since then it has been suggested as a robust method of reconstruction for computed tomography13 and implemented for MRI data.14 Succinctly put, the data on the polar grid are first weighted (or ‘filtered’) by factors which take into account the non-uniform area elements on the polar grid. The weighted data set is then mapped onto a Cartesian grid -- not by simple interpolation, but by convolution with the Fourier transform of a certain function, w(x,y). Next, the 2-D inverse FFT is applied, and finally, the resulting image is divided by w(xty) to correct for the effects of the convolution.
The function w(x,y) can be chosen so that its Fourier transform vanishes for spatial frequency magnitudes larger than a few grid spacings, while w(x,y) itself remains well concentrated in the region of interest. Then the number of steps needed for the convolution scales only as N2, while aliasing artifacts arising from the discrete Cartesian sampling remain small.
In our implementation, we use for w(x,y) a separable form, w(x)w(y), with w(x) chosen from the family of (l-dimensional) Prolate Spheroidal Wave Functions (PSWFs) of zeroth orde?. Every such w(x,y) has the property that it is maximally concentrated in a square region of interest, subject to the constraint that its Fourier transform vanishes outside a given square centered on the origin in frequency space. Tables of the desired PSWF and its Fourier transform can be efficiently computed and stored at run time, using known rapidly converging expansions of PSWFs in terms of Legendre polynomials16.
The FFE3T has essentially the same speed advantages as the Fourier methods based on interpolation, with some additional benefits. The user can specify the desired origin, size and resolution of the region to be displayed. Choosing a smaller region and/or a lower resolution decreases the number of grid points needed in the 2-D FFT. In this way, extremely fast “quick- look” reconstructions become possible, even with large data sets. The FFBT also has potential application to other problems in tomography that can be described as having irregularly sampled points, such as the limited angle problem.13
RECENT APPLICATIONS OF XCMT AT NSLS BEAMLINE X27A
The development of the XCMT station at the NSLS X27 beamline was initially motivated by a collaboration with Mobil Corporation. The high-resolution microtomographs of reservoir sandstone have been used to model flow properties in porous rocks from which hydrocarbons are
Copyright(C)JCPDS-International Centre for Diffraction Data 2000, Advances in X-ray Analysis, Vol.42 175Copyright(C)JCPDS-International Centre for Diffraction Data 2000, Advances in X-ray Analysis, Vol.42 175
produced. The binarized 3-D images have provided the boundary condition framework for more rigorous computational fluid dynamics simulations of oil being displaced by injected fluids.17 XCMT was also used to look at the 3-D structure of source rock, rock that contains the material from which useful hydrocarbons are formed under heat and high pressure, and seal rocks, the barriers to the upward migration of these hydrocarbons.
Over the past three years, many other types of geological samples have been imaged using the XCMT instrument. Microtomographic volumes of basalt and pumice were generated and applied to study lava flows’* (Univ. of New Hampshire and National Taiwan Univ.).XCMT volumes of synthetic rock were produced for simulated geological studies (Rensselaer Polytechnic Institute). In addition, the digitized 3-D data from rare meteorites (Univ. of Chicago, CARS) provided a means of nondestructive evaluation of properties that will shed light on the velocity and trajectory distribution of mm-sized extraterrestial objects.
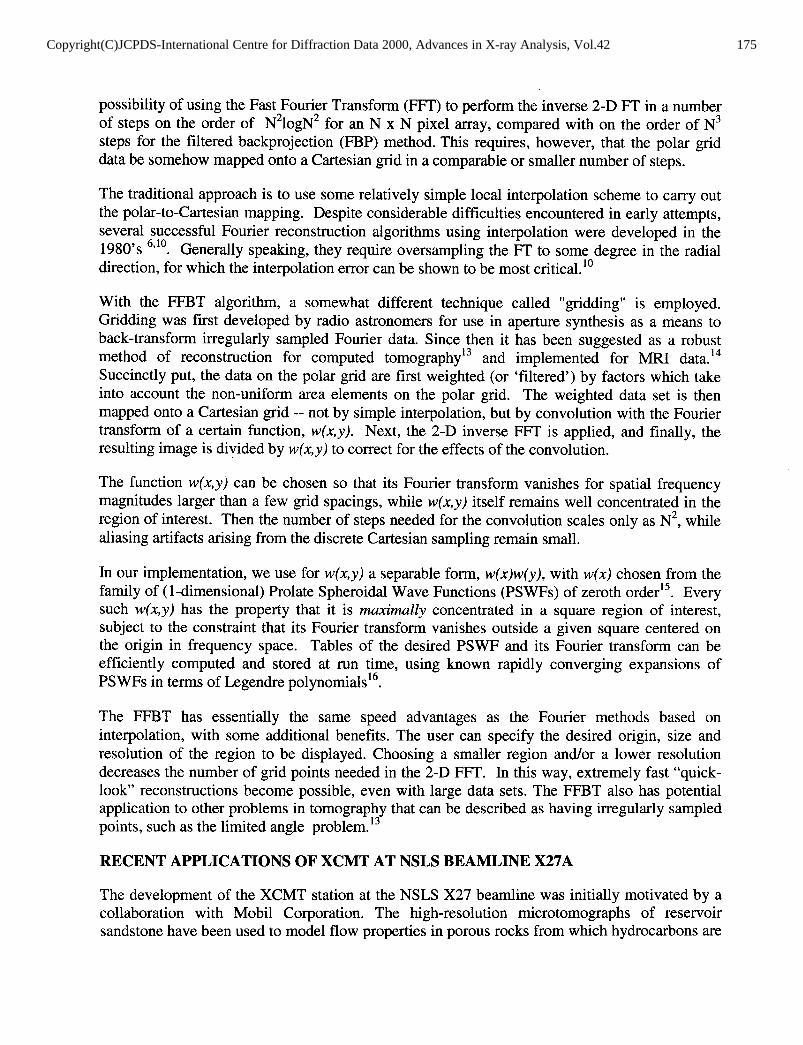
Two types of biological specimens, wood and beetles, are being researched using XCMT in addition to other X-Ray techniques by the Forest Products Laboratory. Dr. Barbara Illman of the Univ. of Wisconsin/ Forest Products Lab. has been an active collaborator in establishing the XCMT instrument as a useful tool for the biological sciences. Dr. Illman’s research has focussed on understanding the epidemiology and effects of a fungal infestation among the Alaskan spruce forests.” We have imaged samples of wood under controlled conditions, applying quantitative analysis to the evident degradation of the lignocellulose by fungi. Models are being developed that will provide information about the spatial relationship between Figure 3. Reconstructed XCMT slice of mm-sized xylem vessels, inter- and intracellular areas control (left) and degraded pine wood after 68 hours of tracheids and the clear structural changes of exposure to fungus (right).Research supported by
incited by the invading fungi (Figure 3). IJSDA want 94-3710.31016.
Characterization of the degradation in the microstructure of solid wood during exposure to fungi has been quantified with the aid of the same medial axis formalism employed by the geologists for XCMT data, the 3-D Medial Axis (3DMA) code generously made available to us by Dr. W.B. Lindquist of SUNY, Stony Brook. 2o
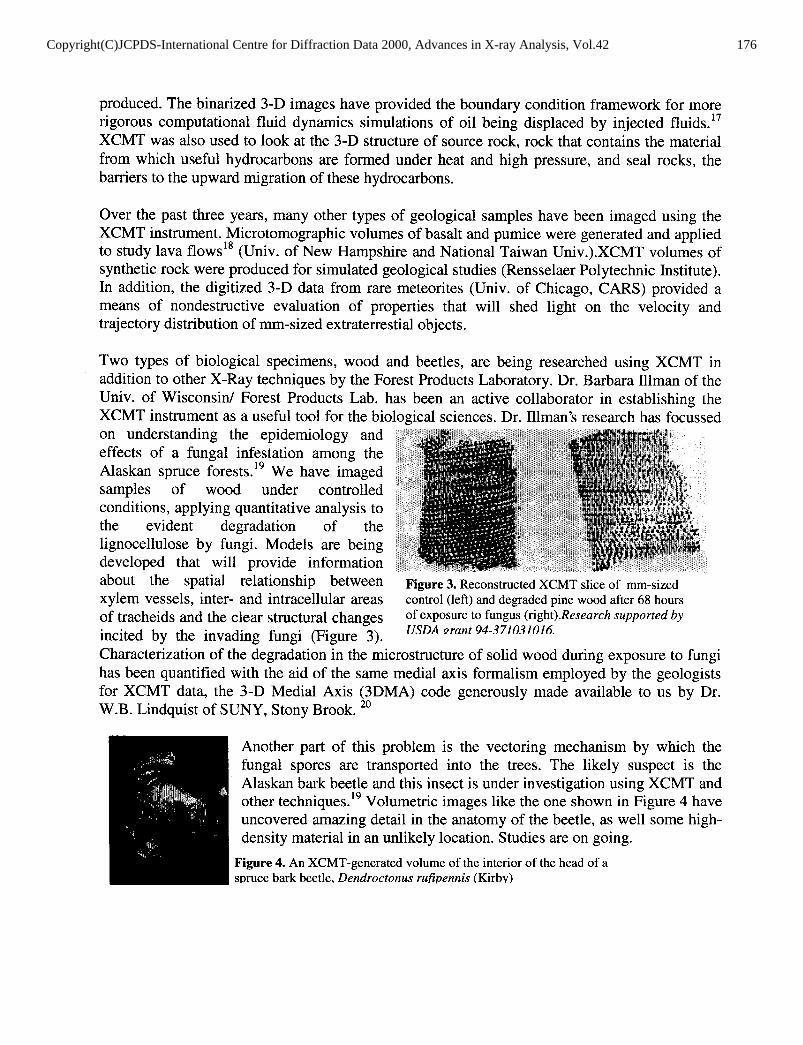
Another part of this problem is the vectoring mechanism by which the fungal spores are transported into the trees. The likely suspect is the Alaskan bark beetle and this insect is under investigation using XCMT and other techniques. l9 Volumetric images like the one shown in Figure 4 have uncovered amazing detail in the anatomy of the beetle, as well some high- density material in an unlikely location. Studies are on going.
Figure 4. An XCMT-generated volume of the interior of the head of a spruce bark beetle, Dendroctonus rufipennis (Kirby)
Copyright(C)JCPDS-International Centre for Diffraction Data 2000, Advances in X-ray Analysis, Vol.42 176Copyright(C)JCPDS-International Centre for Diffraction Data 2000, Advances in X-ray Analysis, Vol.42 176

In the medical field, we have been working with a few groups interested in investigating the mechanisms of osteoporosis. Figure 5 shows a microtomographic slice through a rat femur generated as a test case for 3-D imaging of animal bones.
Figure 6. XCMT surface rendering of a block of GASAR Copper.
During the past three years, we have actively pursued
Figure 5. Slice midway through rat femur.
collaboration with the X-Ray E -17keV. Bone shaded white, voids are dark. Note structure in marrow.
aerospace industry with applications to Nondestructive Evaluation (NDE) of materials. As a result, a program to monitor and evaluate parameters in the processing of various lightweight aerostructure materials has developed with the Naval Research Laboratory (Dr. R. Everett), Northrop-Grumman
Corp.(Dr. R.Schulte and Dr. D. DiMarzio) and Sandia National Laboratory. The digitized volumetric data from the X-Ray Computed Microtomography instrument is analyzed for pore distribution, size and shape, and used to calculate porosity and connectivity of the pores, using analysis tools such as the SUNY 3DMA code. A surface rendering from a tomographic volume of one of the materials under study is shown in Figure 6, GASAR copper. The process that produces this porous metal was imported from the Ukraine, as was the acronym “GASAR” . The pores are on the order of 20 microns, of lOO-micron average length, and the pore volume fraction is about 22 percent. Without the aid of XCMT, these characteristics would be determined by brute force means: sectioning, polishing and then imaging each surface with optical microscopy. Once a digital 3-D image is generated using XCMT, one can “slice” through the volume in any direction using image analysis codes such as IBM’s Data Explorer. Figure 7 shows another recent application of the NDE of materials.
Figure 7 was generated from an array of 200- micron laser-drilled holes in a 2-mm thick
One magnified 3-mil laser- drilled hole showing su$ace
composite graphite material used for acoustic irregularity paneling in aerostructures. The computer- generated slice shows a preferential delamination of the epoxy in the material along the direction of the fibers. These aligned ellipses rotate slice by slice through the sample, the major ellipse aligning with the direction of the fibers throughout the thickness of the panel. This elliptical pattern induced by laser-generated heat was an accidental discovery; the original intent of the test was to examine the surface
One slice through the volume, of 9-hole array. Dark regions represent voids.
Figure 7. Laser-drilled graphite fiber Ibis
holes in acoustic panels of ;maleimide composite
irregularity of the holes, a task impossible to do by mechanical sectioning.
One of the most recent materials problems under study required high resolution on the order of one micron. This past year, we successfully imaged a millimeter-sized sample of plasma-sprayed
Copyright(C)JCPDS-International Centre for Diffraction Data 2000, Advances in X-ray Analysis, Vol.42 177Copyright(C)JCPDS-International Centre for Diffraction Data 2000, Advances in X-ray Analysis, Vol.42 177
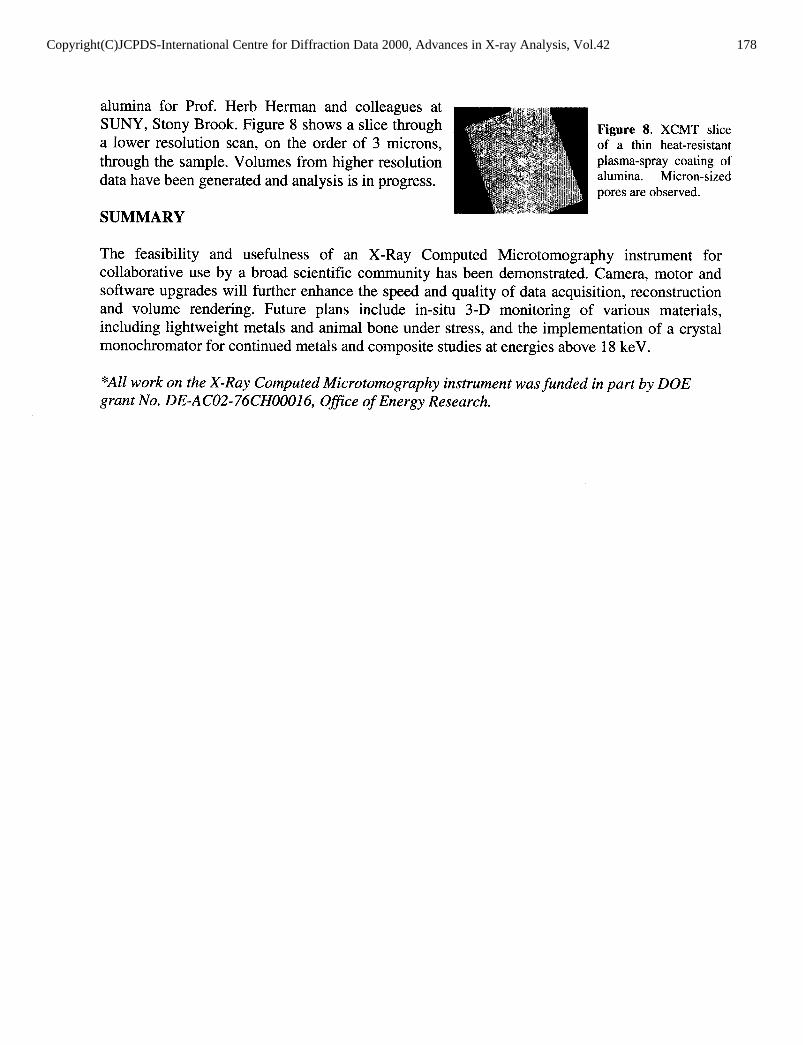
ahunina for Prof. Herb Herman and colleagues at SUNY, Stony Brook. Figure 8 shows a slice through a lower resolution scan, on the order of 3 microns, through the sample. Volumes from higher resolution data have been generated and analysis is in progress.
SUMMARY
Figure 8. XCMT slice of a thin heat-resistant plasma-spray coating of alumina. Micron-sized pores are observed.
The feasibility and usefulness of an X-Ray Computed Microtomography instrument for collaborative use by a broad scientific community has been demonstrated. Camera, motor and software upgrades will further enhance the speed and quality of data acquisition, reconstruction and volume rendering. Future plans include in-situ 3-D monitoring of various materials, including lightweight metals and animal bone under stress, and the implementation of a crystal monochromator for continued metals and composite studies at energies above 18 keV.
*All work on the X-Ray Computed Microtomography instrument was funded in part by DOE grant No. DE-AC02-76CHOOO16, Ofice of Energy Research.
Copyright(C)JCPDS-International Centre for Diffraction Data 2000, Advances in X-ray Analysis, Vol.42 178Copyright(C)JCPDS-International Centre for Diffraction Data 2000, Advances in X-ray Analysis, Vol.42 178
REFERENCES
[l] L. Grodzins, “Optimum Energies for X-Ray Transmission Tomography of Small Samples: Application of Synchrotron Radiation to Tomography”, Nucl. Znstrum. and Meth., 206 (1983) 541.
[2] K.L. D’Amico, H.W. Deckman, J.H. Dunsmuir, B.P. Flannery, W.G. Roberge, “X-Ray Microtomography with Monochromatic Synchrotron Radiation”, Rev. Sci. Instrum., 60:7 (July 1989) 1524-1526.
[3] P. Spanne, M. Rivers, “Computerized Microtomography using Synchrotron Radiation from the NSLS”, Nucl. Znstrum. and Meth., B24/25 (1987) 1063-1067.
[4] U. Bonse, Q.C. Johnson, M.C. Nichols, R. Nuflhardt, S. Krasnicki, J. Kinney, “High Resolution Tomography with Chemical Specificity”, Nucl. Znstrum. and Meth. A246 (1986) 644- 648.
[5] J. Kinney, Q.C. Johnson, M.C. Nichols, U. Bonse, R. Nuflhardt, “Elemental and Chemical- State Imaging Using Synchrotron Radiation”, Appl. Optics, 25 (1986) 4583-4585.
[6] B.P. Flannery, H.W. Deckman, W. Roberge, K.L. D’Amico, “Three-Dimensional X-Ray Microtomography”, Science, 237 (Sept. 1987) 1439-1444.
[7] B.A. Dowd, “Synchrotron X-Ray Computed Tomography at the NSLS”, NSLS Newsletter, (July 1996) .
[8] G.T. Herman, Image Reconstruction From Proiections, Academic Press (1980).
[9] F.A. Dilmanian, “Computed Tomography with Monochromatic X-Rays”, Amer. Jour. of Physiol. Imag., 3/4 (1992) 175-193.
[lo] F. Natterer, The Mathematics of Computerized Tomography, Wiley, (1986).
[ 1 l] A. C. Kak, M. Slaney, Principles of computerized tomographic imaging, New York : IEEE Press, ~1988.
[ 121 A. Rosenfeld, A. Kak, Digital Picture Processing, San Diego: Academic Press (1982).
[ 131 J.D. O’Sullivan, “A Fast Sine Function Gridding Algorithm for Fourier Inversion in Computer Tomography”, IEEE Transactions on Medical Imaging (Jan. 1985).
[ 141 R.B. Marr, “Fast Filtered Back-Transform Reconstruction Algorithm for Generalized Fourier Data”, Sot. OfMagnetic Resonance in Med., 6th Annual Meeting (August 17-2 1, 1987).
Copyright(C)JCPDS-International Centre for Diffraction Data 2000, Advances in X-ray Analysis, Vol.42 179Copyright(C)JCPDS-International Centre for Diffraction Data 2000, Advances in X-ray Analysis, Vol.42 179
[15] D. Slepian, H. 0. Pollack. “Prolate Spheroidal Wave Functions, Fourier Analysis and Uncertainty - I”, The Bell System Technical Journal (Jan. 1961).
[16] A. L. Van Buren, “Tables of Angular Spheroidal Wave Functions”, Washington: Naval Research Laboratory (1975).
[17] M.E.Coles, R.D. Hazlett, E.L.Muegge, etal., “Developments in Synchrotron X-Ray Microtomography with Applications to Flow in Porous Media”, Proceedings of the Society of Petroleum Engineers, SPE 36531 (October 1996).
[18] S-R. Song, K.W. Jones, W.B. Lindquist, B.A. Dowd, D.L. Sahagian,“Synchrotron X-Ray Computed Microtomography (CMT) Studies of Vesiculated Basaltic Rocks”, presented at 1997 Spring Meeting of the American Geophysical Union, Baltimore, MD (May 27-30, 1997).
[ 191 B.L. Illman, and B.A. Dowd, “Synchrotron Applications in Forestry and Forest Products”, Synchrotron Radiation News, Vol. 10, No. l(1997).
[20] W.B. Lindquist, S-M Lee, D.A. Coker, K.W. Jones and P. Spanne, “Medial Axis Analysis of Void Structure in Three Dimensional Tomographic Images of Porous Media”, Journal of Geophysical Research B, Vol. 101, No.B4 (Apr. 10, 1996) 8297-83 10.
[21] G.N. Hounsfield, “A Method and Apparatus for Examination of a Body of Radiation such as X or Gamma Radiation”, The Patent Ofice, London, Patent Specification 1283915 (1972).
[22] L.A. Shepp, B.F. Logan, “Reconstructing Interior Head Tissue from X-Ray Transmissions”, IEEE Trans. Nucl. Sci., N&21,228-236 (1974).
Copyright(C)JCPDS-International Centre for Diffraction Data 2000, Advances in X-ray Analysis, Vol.42 180Copyright(C)JCPDS-International Centre for Diffraction Data 2000, Advances in X-ray Analysis, Vol.42 180


