Embed Size (px)
Citation preview

4-1 Attachment 4 – Value of imputation credits | Final decision: Amadeus Gas Pipeline Access
Arrangement 2016–21
FINAL DECISION
Amadeus Gas Pipeline
Access Arrangement
2016 to 2021
Attachment 4 – Value of
imputation credits
May 2016

4-2 Attachment 4 – Value of imputation credits | Final decision: Amadeus Gas Pipeline Access
Arrangement 2016–21
© Commonwealth of Australia 2016
This work is copyright. In addition to any use permitted under the Copyright Act 1968, all material
contained within this work is provided under a Creative Commons Attributions 3.0 Australia licence,
with the exception of:
the Commonwealth Coat of Arms
the ACCC and AER logos
any illustration, diagram, photograph or graphic over which the Australian Competition and
Consumer Commission does not hold copyright, but which may be part of or contained within this
publication. The details of the relevant licence conditions are available on the Creative Commons
website, as is the full legal code for the CC BY 3.0 AU licence.
Requests and inquiries concerning reproduction and rights should be addressed to the:
Director, Corporate Communications
Australian Competition and Consumer Commission
GPO Box 4141, Canberra ACT 2601
Inquiries about this publication should be addressed to:
Australian Energy Regulator
GPO Box 520
Melbourne Vic 3001
Tel: (03) 9290 1444
Fax: (03) 9290 1457
Email: [email protected]

4-3 Attachment 4 – Value of imputation credits | Final decision: Amadeus Gas Pipeline Access
Arrangement 2016–21
Note
This attachment forms part of the AER's final decision on the access arrangement for the
Amadeus Gas Pipeline for 2016–21. It should be read with all other parts of the final
decision.
The final decision includes the following documents:
Overview
Attachment 1 - Services covered by the access arrangement
Attachment 2 - Capital base
Attachment 3 - Rate of return
Attachment 4 - Value of imputation credits
Attachment 5 - Regulatory depreciation
Attachment 6 - Capital expenditure
Attachment 7 - Operating expenditure
Attachment 8 - Corporate income tax
Attachment 9 - Efficiency carryover mechanism
Attachment 10 - Reference tariff setting
Attachment 11 - Reference tariff variation mechanism
Attachment 12 - Non-tariff components
Attachment 13 - Demand

4-4 Attachment 4 – Value of imputation credits | Final decision: Amadeus Gas Pipeline Access
Arrangement 2016–21
Contents
Note .............................................................................................................. 4-3
Contents ....................................................................................................... 4-4
Shortened forms.......................................................................................... 4-6
4 Value of imputation credits .................................................................. 4-8
4.1 Final decision ................................................................................. 4-8
4.2 APTNT's revised proposal ........................................................... 4-16
4.3 AER’s assessment approach ...................................................... 4-17
4.3.1 Requirements of the NEL/NGL and NER/NGR .......................... 4-17
4.3.2 Rate of return Guideline ............................................................. 4-20
4.3.3 Definition of a benchmark efficient entity .................................... 4-20
4.3.4 Interrelationships ....................................................................... 4-21
4.3.5 Expert reports ............................................................................ 4-22
4.3.6 Approach to determining the value of imputation credits ............ 4-23
4.4 Reasons for final decision ........................................................... 4-25
4.4.1 Evidence underlying our estimate of the value of imputation credits4-30
4.4.2 Response to submissions by stakeholders ................................ 4-41
A Value of imputation credits: Detailed analysis ................................. 4-51
A.1 Expert views on the value of imputation credits ....................... 4-52
A.2 The value of imputation credits used by other regulators ....... 4-54
A.3 Previous Australian Competition Tribunal considerations ...... 4-56
A.4 Key concerns of the service providers ...................................... 4-68
A.5 The role of the value of imputation credits in the regulatory framework
4-72
A.6 The conceptual framework for the value of imputation credits 4-75
A.7 Gray's comments on the conceptual framework. ...................... 4-82

4-5 Attachment 4 – Value of imputation credits | Final decision: Amadeus Gas Pipeline Access
Arrangement 2016–21
A.8 Further issues relating to the utilisation rate ............................ 4-93
A.9 Estimation approach considerations ....................................... 4-116
A.10 Estimating the distribution rate .......................................... 4-120
A.11 Application of rate of return criteria to evidence on the utilisation
rate 4-130
A.12 The equity ownership approach ............................................. 4-0
A.13 Tax statistics ............................................................................ 4-6
A.14 Difference between equity ownership approach and tax statistics
4-9
A.15 Implied market value studies ................................................ 4-10
A.16 Revised consideration of the conceptual goalposts approach4-40

4-6 Attachment 4 – Value of imputation credits | Final decision: Amadeus Gas Pipeline Access
Arrangement 2016–21
Shortened forms Shortened form Extended form
AA Access Arrangement
AAI Access Arrangement Information
APTNT APT Pipelines (NT) Pty Limited (APTNT)
AER Australian Energy Regulator
AGP Amadeus Gas Pipeline
ATO Australian Tax Office
capex capital expenditure
CAPM capital asset pricing model
CPI consumer price index
DRP debt risk premium
ECM Efficiency carryover mechanism
ERP equity risk premium
Expenditure Guideline Expenditure Forecast Assessment Guideline
gamma value of imputation credits
GTA Gas Transport Services Agreement
MRP market risk premium
NGP Northern Gas Pipeline (formerly North East Gas Interconnector/NEGI)
NGL National Gas Law
NGO National Gas Objective
NGR National Gas Rules
NPV net present value
opex operating expenditure
PTRM post-tax revenue model
RBA Reserve Bank of Australia
RFM roll forward model
RIN regulatory information notice
RPP revenue and pricing principles
SLCAPM Sharpe-Lintner capital asset pricing model
TAB tax asset base
UAFG unaccounted for gas

4-7 Attachment 4 – Value of imputation credits | Final decision: Amadeus Gas Pipeline Access
Arrangement 2016–21
Shortened form Extended form
WACC weighted average cost of capital
WPI Wage Price Index

4-8 Attachment 4 – Value of imputation credits | Final decision: Amadeus Gas Pipeline Access
Arrangement 2016–21
4 Value of imputation credits
Imputation credits are valuable to investors and are therefore a benefit in addition to any
cash dividend or capital gains they receive from owning shares. Under the Australian
imputation tax system, investors can receive an imputation credit for income tax paid at the
company level.1 For eligible investors, this credit offsets their Australian income tax liabilities.
If the amount of imputation credits received exceeds an investor's tax liability, that investor
can receive a cash refund for the balance.
The National Electricity Rules/National Gas Rules (NER/NGR) recognises that a service
provider's allowed revenue does not need to include the value of imputation credits. Under
the NER/NGR, service providers are to recover revenue that compensates them for their
efficient costs in providing regulated services. This includes, among other things, a return to
be provided to investors (return on equity) that is required to promote efficient levels of
investment. The more that imputation credits are valuable, the less return that investors
require from dividends and capital gains. However, the estimation of the return on equity
does not take imputation credits into account.2 Therefore, an adjustment for the value of
imputation credits is required. This adjustment could take the form of a decrease in the
estimated return on equity itself.
An alternative but equivalent form of adjustment, which is employed by the NER/NGR, is via
the revenue granted to a service provider to cover its expected tax liability. Specifically, the
NER/NGR require that the estimated cost of corporate income tax be determined in
accordance with a formula that reduces the estimated cost of corporate tax by the 'value of
imputation credits' (represented by the Greek letter, 𝛾, 'gamma').3 This form of adjustment
recognises that it is the payment of corporate tax which is the source of the imputation credit
return to investors.
In this attachment, we set out our final decision on the value of imputation credits and our
key reasons for this decision. We also consider APT Pipelines (NT) Pty Ltd's (APTNT)
proposed value of imputation credits and the key reasons for its (revised) proposal. In
appendix A, we include further supporting detail on our position on the value of imputation
credits and also respond to APTNT's revised proposal in detail.
4.1 Final decision
We do not accept APTNT's proposed value of imputation credits (or gamma) of 0.25.
Instead, we adopt a value of imputation credits of 0.4. We consider that the use of a value
for imputation credits of 0.4 will result in equity investors in the benchmark efficient entity
1 Income Tax Assessment Act 1997, parts 3–6.
2 While the return on equity is not reduced to take into account the value of imputation credits, we note our estimate of the
market risk premium (MRP) does consider the value we use for imputation credits to ensure it reflects the value to
investors in the domestic Australian market inclusive of credits. 3 NER, cll. 6.4.3(a)(4), 6.4.3(b)(4), 6.5.3, 6A.5.4(a)(4), 6A.5.4(b)(4), 6A.6.4; NGR, rr. 76(c), 87A.

4-9 Attachment 4 – Value of imputation credits | Final decision: Amadeus Gas Pipeline Access
Arrangement 2016–21
receiving an ex ante total return (inclusive of the value of imputation credits) commensurate
with the efficient equity financing costs of a benchmark efficient entity.
Estimating the value of imputation credits is a complex and imprecise task. There is no
consensus among experts on the appropriate value or estimation techniques to use.4
Further, with each estimation technique there are often a number of ways these may be
applied resulting in different outcomes. Conceptually, the value of imputation credits must be
between 0 and 1, and the range of expert views on the value of imputation credits is almost
this wide.5
In coming to a value of imputation credits of 0.4:
We adopt a conceptual approach consistent with the Officer framework,6 which we
consider best promotes the objectives and requirements of the NER/NGR. This
approach considers the value of imputation credits is a post-tax value before the impact
of personal taxes and transaction costs. As such, we view the value of imputation credits
as the proportion of company tax returned to investors through the utilisation of
imputation credits.7
We consider our conceptual approach allows for the value of imputation credits to be
estimated on a consistent basis with the allowed rate of return and allowed revenues
under the post-tax framework in the NER/NGR.8
We use the widely accepted approach of estimating the value of imputation credits as the
product of two sub-parameters: the 'distribution rate' and the 'utilisation rate'.9 Our
definition of, and estimation approach for, these sub-parameters is set out in Table 4-1.
4 See section A.1 of appendix A.
5 The value of imputation credits must be between 0 and 1 because receiving an imputation credit cannot make an investor
worse off, nor would an investor value an imputation credit more than its face value. 6 The Officer framework is discussed in detail in section A.6.
7 This means one dollar of claimed imputation credits has a post (company) tax value of one dollar to investors before
personal taxes and personal transaction costs. 8 In finance, the consistency principle requires that the definition of the cash flows in the numerator of a net present value
(NPV) calculation must match the definition of the discount rate (or rate of return / cost of capital) in the denominator of the
calculation (see Peirson, Brown, Easton, Howard, Pinder, Business Finance, McGraw-Hill, Ed. 10, 2009, p. 427). By
maintaining this consistency principle, we provide a benchmark efficient entity with an ex ante total return (inclusive of the
value of imputation credits) commensurate with the efficient financing costs of a benchmark efficient entity. 9 These sub-parameters are discussed further in section 4.4.

4-10 Attachment 4 – Value of imputation credits | Final decision: Amadeus Gas Pipeline Access
Arrangement 2016–21
Table 4-1 Gamma sub-parameters: definition and estimation approach
Sub-parameter Definition Estimation approach
Distribution rate (or payout ratio)
The proportion of imputation credits
generated that is distributed to
investors
Primary reliance placed on the widely accepted
cumulative payout ratio approach. Some regard is
also given to Lally's estimate for listed equity from
financial reports of the 20 largest listed firms.
Utilisation rate (or theta)
The utilisation value to investors in the
market per dollar of imputation credits
distributed10
A range of approaches, with due regard to the
merit of each approach:
equity ownership approach
tax statistics
implied market value studies
Source: AER analysis, see section A.10, A.12, A.13 and A.15.
Overall, the evidence suggests a range of estimates for the value of imputation credits might
be reasonable. With regard to the merits of the evidence before us, we choose a value of
imputation credits of 0.4 from within a range of 0.3 to 0.5.
In considering the evidence on the distribution and utilisation rates, we have broadly
maintained the approach set out in the Rate of Return Guideline (the Guideline), but have re-
examined the relevant evidence and estimates. This re-examination, and new evidence and
advice considered since the Guideline, led us to depart from the 0.5 value of imputation
credits we proposed in the Guideline.
Recent developments
Since the service providers submitted their revised proposals, a number of service providers
made late submissions. These late submissions have asked us to take into account a range
of issues identified in the recent Australian Competition Tribunal (the Tribunal) decisions for
ActewAGL Distribution, Ausgrid, Endeavour Energy, Essential Energy and Jemena Gas
Networks.11 The Tribunal ordered the remittal of our final decisions for these service
providers, with directions to remake our decision by reference to an estimated cost of
corporate income tax based on a gamma of 0.25. We consider that the Tribunal erred in
reaching its conclusion and we have sought review of the Tribunal's decision in the Federal
Court. We take the view:
there is no consensus amongst experts as to the best approach to estimating gamma.
The AER must therefore choose an appropriate value for gamma from amongst the
alternatives. We must reach our own view on the appropriate reliance to place upon
different views and methodologies in reaching our decision
10
In this decision we use the terms theta, utilisation value and utilisation rate interchangeably to mean the same thing. 11
For example, see Australian Competition Tribunal, Applications by Public Interest Advocacy Centre Ltd and Ausgrid [2016]
ACompT 1, 26 February 2016, para 1(c).

4-11 Attachment 4 – Value of imputation credits | Final decision: Amadeus Gas Pipeline Access
Arrangement 2016–21
the Tribunal's view that the “tax statistics approach” to estimating gamma could be used
only as an “upper bound” for the purposes of ascertaining theta, is not correct
the Tribunal erred on the meaning of “the valuation of imputation credits” in the NER and
NGR. The value of gamma should be seen as a post-tax value, before the impact of
personal taxes and transaction costs, with the result that one dollar of claimed imputation
credits has a post (company) tax value of one dollar to investors, before personal taxes
and personal transaction costs.
applying the Tribunal’s reasons in relation to gamma does not automatically lead to a
value of 0.25 for gamma.
At this time we have not completed the remittal of our final decisions for ActewAGL
Distribution, Ausgrid, Endeavour Energy, Essential Energy and Jemena Gas Networks. In
the time available, we have, however, reviewed the late submissions from United Energy,
ActewAGL and CitiPower/Powercor.12 To the extent time has permitted we have updated
this decision to include a response to the key issues raised in the late submissions, with
reference to the Tribunal's reasoning on these specific issues.
Of the late submissions, the most comprehensive was provided by United Energy. By
addressing United Energy's submission, we have addressed all of the issues raised in the
late submissions by service providers (on gamma).13 United Energy submitted we should
apply a gamma of 0.25, consistent with the Tribunal decisions. The key issues it raised are
set out in section 4.4.2.
We have also sought expert advice from Dr Martin Lally (Lally), in the context of obtaining
specific advice on the issues raised by service providers in their late submissions including
the matters raised by the Tribunal in its recent decision.14 We recognise stakeholders have
not had an opportunity to comment on this advice as it was requested following the late
submissions and only received shortly before the publication of our determination. We
consider the advice from Lally is directed only to the issues that have been raised for our
consideration.
Following this review, we consider the use of a gamma of 0.4 is appropriate for the reasons
set out in this decision and we therefore maintain that value from our preliminary
determination. These reasons are substantively based on the reasons we set out in prior
decisions, but we have clarified our reasoning in response to the issues raised in the late
submissions following the Tribunal's recent decisions.
12
United Energy, Submission on AER preliminary determination - Submission on gamma, 26 April 2016;
CitiPower/Powercor, Submission on implications of recent Australian Competition Tribunal Decision, 18 April 2016;
ActewAGL, Implication of recent Tribunal decisions for final decision and updates to the allowed rate of return and forecast
inflation estimate, 12 May 2016. 13
CitiPower and Powercor's submission covers most of the issues raised in United Energy's submission. See CitiPower and
Powercor, CitiPower and Powercor 2016-2020 distribution determinations—Submission on implications of recent
Australian Competition Tribunal decisions, 18 April 2016. 14
Lally, Gamma and the ACT Decision, May 2016.

4-12 Attachment 4 – Value of imputation credits | Final decision: Amadeus Gas Pipeline Access
Arrangement 2016–21
With regard to United Energy's late submission, we consider:
Our conceptual approach considers the value of gamma is a post-tax value before the
impact of personal taxes and transaction costs. This means one dollar of claimed
imputation credits has a post (company) tax value of one dollar to investors before
personal taxes and personal transaction costs. Our approach considers gamma to be
equal to the product of the distribution rate multiplied by the utilisation value to investors
in the market per dollar of imputation credits distributed (the utilisation rate). We consider
the utilisation value reflects the weighted average, by wealth and risk aversion, of the
utilisation rates of investors—some of whom will have a utilisation rate of 1 and others
who will have utilisation rate of 0. This is covered in section A.5 and A.6.
Our conceptual framework is consistent with the Officer framework, our allowed rate of
return and our allowed revenues. For example, the allowed rate of return is a post-
company tax pre-personal tax weighted average cost of capital (WACC). We estimate
the allowed revenue, including the corporate tax allowance (and the value of imputation
credits), on the same basis. Moreover, when calculating the yield to maturity on debt (for
the return on debt and risk free rate) and market risk premium (MRP), the face value of
coupons/dividends are used (see section A.8.2). Our interpretation of the post-tax
framework in the NER/NGR is covered in section A.6.
We use a range of relevant evidence to estimate the utilisation rate. We consider:
o The equity ownership approach provides the best estimate of the utilisation value
to investors in the market per dollar of imputation credits distributed (see section
A.12).
o Taxation statistics (tax statistics) can also provide a reasonable estimate of the
utilisation value to investors in the market per dollar of imputation credits
distributed, if the data upon which those statistics are based is reliable. However,
there are potential issues with the quality of the underlying taxation data. For
example, Lally has advised that the taxation data is unreliable.15 Having regard to
the potential data limitations and alternate estimates, the evidence from tax
statistics is not inconsistent with the evidence from the equity ownership
approach, but we place less reliance upon it. (see section A.13).We also note,
regardless of any issues of taxation data reliability, an estimate of gamma of
approximately 0.4 is obtained when combining a utilisation rate of 0.48 (consistent
with FAB data) with Lally's preferred estimate of the distribution rate for a
benchmark efficient entity of 0.83.16
o On the other hand, implied market value studies are affected by factors such as
differential personal taxation and other personal costs. This means they do not
provide an estimate of the utilisation value to investors in the market per dollar of
imputation credits distributed on a post-tax (pre-personal tax and costs basis).
Therefore, they are inconsistent with the Officer framework unless they are
adjusted. Even when adjusted, implied market value studies are subject to many
15
Lally, Gamma and the ACT Decision, May 2016, pp. 18–20. 16
Lally, Gamma and the ACT Decision, May 2016, p. 5.

4-13 Attachment 4 – Value of imputation credits | Final decision: Amadeus Gas Pipeline Access
Arrangement 2016–21
limitations and do not clearly measure the value to the aggregate investors who
provide long term capital to a benchmark efficient entity. Lally stated his views on
dividend drop off studies are 'highly adverse' and considers it appropriate to place
the lowest reliance on their results (see section A.15).17
Tax statistics do not provide an upper bound estimate for gamma, as the Tribunal
found.18 Lally supports this view.19 We consider tax statistics provide a point estimate of
the utilisation rate. The uncertainty associated with redemption estimates from taxation
data means the true (unobservable) redemption value could be above or below the mean
estimate. This is covered in section A.13. However, we note that even if we do use an
estimate of the utilisation rate of 0.48 from taxation statistics (consistent with FAB data),
this results in an estimate for gamma of approximately 0.4 when combined with Lally's
preferred distribution rate of 0.83 for a benchmark efficient entity.
Because tax statistics are not an upper bound, there is no evidence the equity ownership
approach materially overstates the true utilisation rate. On this point, we also consider:
o There is no data to suggest the redemption of imputation credits is materially
lower than the estimate of the utilisation rate derived from the equity ownership
approach. In particular, there is no credible data on the impact of the 45 day
holding rule. This is covered in section A.8.3.
o Estimates of the gamma value from the equity ownership approach range from
0.28 to 0.47 if the ranges from both listed equity (0.28 to 0.41) and all equity (0.40
to 0.47) are considered and where estimates of gamma are based on matching
cumulative distribution rate data. We use an estimate well below the top of the
range for all equity.
It is open to us to have regard to a listed equity measure of the distribution rate, which we
consider is reasonably reflective of a benchmark efficient entity given the trade-offs
associated with choosing an appropriate dataset (see section A.10).20 In a similar vein,
we agree with Lally that it is not essential (but 'nor is it precluded') to combine estimates
of the distribution rate and utilisation rate from the same dataset (see section A.9.2).21
Given this, while we primarily maintain our previous approach in this decision, we also
have some regard to Lally's preferred approach. This combines a distribution rate for
listed equity from financial reports of the top 20 listed firms with an all equity utilisation
rate from the equity ownership approach.22 We also have some regard to a gamma
estimate based on the utilisation rate from taxation statistics of 0.48 (consistent with FAB
data used to calculate the cumulative payout ratio distribution rate) and Lally's preferred
estimate of the distribution rate for a benchmark efficient entity of 0.83.
17
Lally, Gamma and the ACT Decision, May 2016, p. 22. 18
Australian Competition Tribunal, Application by Public Interest Advocacy Centre Ltd and Ausgrid [2016] ACompT 1, 26
February 2016, paras. 1048, 1090 and 1095. 19
Lally, Gamma and the ACT Decision, May 2016, p. 20. 20
See Lally, Gamma and the ACT Decision, May 2016, pp. 24–26. 21
This is because, in principle, the distribution rate is a firm specific parameter and the utilisation rate is a market wide
parameter. See Lally, Gamma and the ACT Decision, May 2016, p. 25. 22
Lally, Gamma and the ACT Decision, May 2016, p. 4–6.

4-14 Attachment 4 – Value of imputation credits | Final decision: Amadeus Gas Pipeline Access
Arrangement 2016–21
Lally (in his latest report) supports, among other things, our conceptual approach to
estimating gamma and the relative reliance we place on different sources of evidence to
estimate the utilisation rate.23 However, he recommended an implementation of the equity
ownership approach which resulted in an estimate of gamma of at least 0.5. This is higher
than the estimate of 0.4 we adopt in this decision. We maintain our approach and final
estimate because we consider it meets the requirements of the NER/NGR and takes into
account the importance of regulatory certainty and predictability.
The use of taxation statistics
In response to the recent submissions on the Tribunal decisions, we have again considered
the reliability of utilisation rate and gamma estimates based on tax statistics. We have also
considered what can reasonably be concluded about the appropriate estimate of gamma for
a benchmark efficient entity based on these statistics. This section briefly summarises our
views on these matters.
In this final decision, we consider there are potential underlying data issues with tax statistics
and as a result, the utilisation rate cannot be estimated reliably from this data. As outlined by
Lally, the data issues with tax statistics are generally accepted by service providers, the
Tribunal, Hathaway, NERA, Handley and Frontier.24 For this reason, in this decision, we
have placed limited weight on tax statistics.
Lally considers tax statistics do not provide a reliable estimate of the utilisation rate.25 Lally
also considers our tax statistic estimate of 0.48 is not an upper bound. As Lally explains, the
fact that Hathaway also considered 0.62 a possible estimate of the utilisation rate
demonstrates the utilisation rate estimate of 0.48 is not an upper bound.26 We consider that
any uncertain estimate is not an upper bound.
Putting aside the data reliability issues with tax statistics, all the evidence before us on tax
statistics does not demonstrate our gamma estimate for a benchmark efficient entity of 0.4 is
too high. This is evident in Table 4-2.
23
Lally, Gamma and the ACT Decision, May 2016, pp. 3–6. 24
Lally, Gamma and the ACT Decision, May 2016, p. 20. 25
Lally, Gamma and the ACT Decision, May 2016, pp. 19, 30. 26
Lally, Gamma and the ACT Decision, May 2016, p. 20. We note Lally considered the 0.45 from our previous decisions in
his report. However, his analysis would hold with respect to our updated estimate from taxations statistics of 0.48.
4-15 Attachment 4 – Value of imputation credits | Final decision: Amadeus Gas Pipeline Access
Arrangement 2016–21
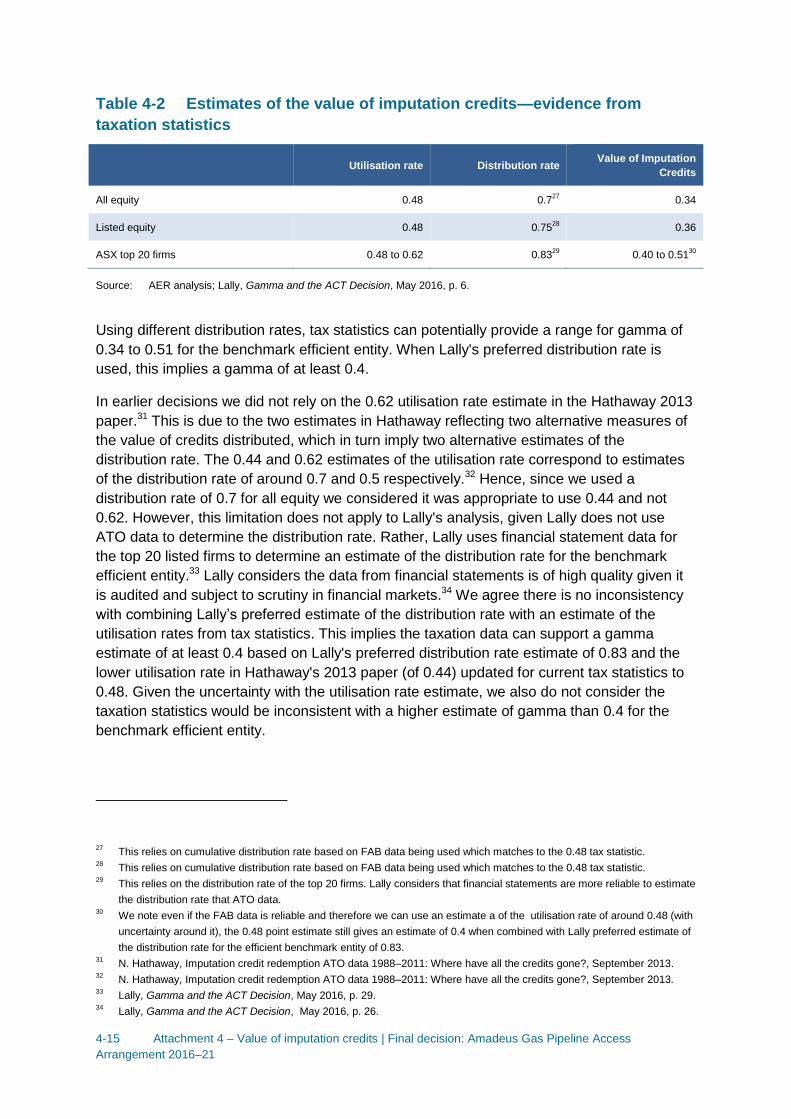
Table 4-2 Estimates of the value of imputation credits—evidence from
taxation statistics
Utilisation rate Distribution rate Value of Imputation
Credits
All equity 0.48 0.727
0.34
Listed equity 0.48 0.7528
0.36
ASX top 20 firms 0.48 to 0.62 0.8329
0.40 to 0.5130
Source: AER analysis; Lally, Gamma and the ACT Decision, May 2016, p. 6.
Using different distribution rates, tax statistics can potentially provide a range for gamma of
0.34 to 0.51 for the benchmark efficient entity. When Lally's preferred distribution rate is
used, this implies a gamma of at least 0.4.
In earlier decisions we did not rely on the 0.62 utilisation rate estimate in the Hathaway 2013
paper.31 This is due to the two estimates in Hathaway reflecting two alternative measures of
the value of credits distributed, which in turn imply two alternative estimates of the
distribution rate. The 0.44 and 0.62 estimates of the utilisation rate correspond to estimates
of the distribution rate of around 0.7 and 0.5 respectively.32 Hence, since we used a
distribution rate of 0.7 for all equity we considered it was appropriate to use 0.44 and not
0.62. However, this limitation does not apply to Lally's analysis, given Lally does not use
ATO data to determine the distribution rate. Rather, Lally uses financial statement data for
the top 20 listed firms to determine an estimate of the distribution rate for the benchmark
efficient entity.33 Lally considers the data from financial statements is of high quality given it
is audited and subject to scrutiny in financial markets.34 We agree there is no inconsistency
with combining Lally’s preferred estimate of the distribution rate with an estimate of the
utilisation rates from tax statistics. This implies the taxation data can support a gamma
estimate of at least 0.4 based on Lally's preferred distribution rate estimate of 0.83 and the
lower utilisation rate in Hathaway's 2013 paper (of 0.44) updated for current tax statistics to
0.48. Given the uncertainty with the utilisation rate estimate, we also do not consider the
taxation statistics would be inconsistent with a higher estimate of gamma than 0.4 for the
benchmark efficient entity.
27
This relies on cumulative distribution rate based on FAB data being used which matches to the 0.48 tax statistic. 28
This relies on cumulative distribution rate based on FAB data being used which matches to the 0.48 tax statistic. 29
This relies on the distribution rate of the top 20 firms. Lally considers that financial statements are more reliable to estimate
the distribution rate that ATO data. 30
We note even if the FAB data is reliable and therefore we can use an estimate a of the utilisation rate of around 0.48 (with
uncertainty around it), the 0.48 point estimate still gives an estimate of 0.4 when combined with Lally preferred estimate of
the distribution rate for the efficient benchmark entity of 0.83. 31
N. Hathaway, Imputation credit redemption ATO data 1988–2011: Where have all the credits gone?, September 2013. 32
N. Hathaway, Imputation credit redemption ATO data 1988–2011: Where have all the credits gone?, September 2013. 33
Lally, Gamma and the ACT Decision, May 2016, p. 29. 34
Lally, Gamma and the ACT Decision, May 2016, p. 26.

4-16 Attachment 4 – Value of imputation credits | Final decision: Amadeus Gas Pipeline Access
Arrangement 2016–21
For the reasons explained above (and in section 4.4 and section A.13), we consider tax
statistics do not demonstrate our gamma value of 0.4 is unreasonable.
4.2 APTNT's revised proposal
In its revised proposal, APTNT did not adopt our Guideline based approach to estimating
gamma as reflected in our decisions released in November 2014, and April, June, October
and November 2015 (recent decisions).35
In its revised proposal APTNT proposed a value of imputation credits of 0.25, calculated as
the product of a distribution rate of 0.7 and a utilisation rate of 0.35.36
APTNT's proposed distribution rate of 0.7 is consistent with the value in the Guideline and
the value in our recent decisions when estimated over all companies (all equity). However, in
our recent decisions we also relied, in part, on a distribution rate estimated over just public
companies (listed equity).
APTNT's proposed utilisation rate of 0.35 is lower than the value in the Guideline and a
number of estimates we relied on in making our recent decisions. APTNT's proposed
utilisation rate is supported by Professor Stephen Gray's (Gray's) view that the 'best
available estimate of theta is 0.35'.37 This estimate is from a 'dividend drop off' study by SFG
Consulting and co-authored by Gray.38
APTNT's proposed value of imputation credits (of 0.25) and supporting reasons are broadly
consistent with the proposals we received from a number of other service providers. 17
service providers over the past 23 months have now made broadly consistent proposals on
the value of imputation credits.39 The majority of these service providers jointly
commissioned two reports from SFG Consulting (SFG) and relied on these reports in their
proposals. In addition, the majority of service providers have commissioned and relied on
expert reports from NERA Economic Consulting (NERA) and Frontier Economics
(Frontier).40
35
Australian Gas Networks, Attachment 11 Response to Draft Decision: Cost of Tax, January 2016. Also see AER, Draft
decision: Australian Gas Networks access arrangement 2016 to 2021—Attachment 4: Value of imputation credits,
November 2015. In our recent decisions, we broadly maintained the approach we set out in the Guideline, although a re-
examination of the evidence resulted in us choosing a value for imputation credits of 0.4. 36
APNT, Access Arrangement Revised Proposal to Draft Decision, January 2016, p. 94. This is consistent with its initial
proposal and the value in its current access arrangement. 37
Frontier Economics, The appropriate use of tax statistics when estimating gamma, January 2016, p. 30. 38
SFG, Updated dividend drop-off estimate of theta: Report for the Energy Networks Association, 7 June 2013. Dividend
drop off studies are explained in section A.15.1. 39
These service providers are: ActewAGL, Ausgrid, Directlink, Endeavour Energy, Essential Energy, Jemena Gas Networks
(JGN), TransGrid, SA Power Networks, Energex, Ergon Energy, AusNet Services, CitiPower, Powercor, Jemena
Electricity Networks (JEN), ActewAGL Distribution, Australian Gas Networks, and APT Pipeline (NT) Pty Ltd (APTNT). 40
Frontier Economics, The appropriate use of tax statistics when estimating gamma, January 2016; Frontier Economics, An
appropriate regulatory estimate of gamma, June 2015; NERA Economic Consulting, Estimating Distribution and
Redemption Rates: Response to the AER's Final Decisions for the NSW and ACT Electricity Distributors, and for Jemena
Gas Networks, June 2015.

4-17 Attachment 4 – Value of imputation credits | Final decision: Amadeus Gas Pipeline Access
Arrangement 2016–21
4.3 AER’s assessment approach
In this section we set out the approach we have taken to assessing proposals on the value
of imputation credits. This approach includes consideration of:
the requirements of the NEL/NGL and NER/NGR
the Guideline
our definition of the benchmark efficient entity
interrelationships with other aspects of the decision
expert reports
our approach to determining the value of imputation credits.
4.3.1 Requirements of the NEL/NGL and NER/NGR
The NER/NGR require that the estimated cost of corporate income tax of a service provider
for each regulatory year (𝐸𝑇𝐶𝑡) must be estimated in accordance with the following
formula:41
𝐸𝑇𝐶𝑡 = (𝐸𝑇𝐼𝑡 × 𝑟𝑡)(1 − 𝛾)
where:
𝐸𝑇𝐼𝑡 is an estimate of the taxable income for that regulatory year that would be earned by
a benchmark efficient entity as a result of the provision of regulated services if such an
entity, rather than the service provider, operated the business of the service provider,
such estimate being determined in accordance with the post-tax revenue model.
𝑟𝑡 is the expected statutory income tax rate for that regulatory year as determined by the
AER.
𝛾 is the value of imputation credits.
Unlike many other aspects of the NER/NGR, there is no specific objective we must achieve
for the value of imputation credits and no specific factors we must take into account in
estimating it. The allowed rate of return objective does not specifically apply to the value of
imputation credits. However, the rate of return must be determined on a nominal vanilla
basis that is consistent with our estimate of the value of imputation credits.42
In this context, the conceptual rate of return framework developed by Officer in a 1994 paper
informs our approach to interpreting and estimating the value of imputation credits.43 This is
because:
41
NER, cll. 6.5.3, 6A.6.4; NGR, r. 87A. 42
NER, cll. 6.5.2(d)(2), 6A.6.2(d)(2); NGR, r. 87(4)(b). 43
R. Officer, 'The cost of capital of a company under an imputation system', Accounting and finance, vol. 34(1), May 1994,
pp. 1–17.

4-18 Attachment 4 – Value of imputation credits | Final decision: Amadeus Gas Pipeline Access
Arrangement 2016–21
The NER/NGR's cost of corporate income tax formula (shown above) mirrors Officer's
framework for the treatment of imputation credits, including through the use of the
parameter denoted by the Greek letter 'gamma'.44
We have received expert advice that Officer's definition of the nominal vanilla rate of
return provides the basis for the rate of return framework in the NER/NGR.45 Previous
statements by the consultant for the majority of the service providers', Gray, and their
industry association appear to support this consideration:
o During the AEMC's 2012 rule change process, Gray advised the AEMC that
'…there are a number of different WACC formulas that can all be identified as
post-tax nominal definitions of WACC. Officer (1994), in the paper that forms the
basis for the regulatory rate of return framework, sets out four such
definitions…'.46
o During the development of the Guideline, the Energy Networks Association (ENA)
submitted '[t]he fundamental economic framework in relation to dividend
imputation was set out by Officer (1994)…'.47
The NER/NGR require that we determine the rate of return on a nominal vanilla basis that is
consistent with our estimate of the value of imputation credits.48 The Officer framework
provides a means for doing this. It provides a consistent framework for determining the rate
of return for a business, which takes into account the value that investors receive from
imputation credits.49 An important implication of this is that gamma is not a standalone
concept or parameter. It is part of a broader framework, and should be interpreted and
estimated accordingly.
Consistent with the expert advice we have received, we consider that the Officer framework
provides the basis for the rate of return framework in the NER/NGR. We therefore also
consider that estimating the value of imputation credits consistent with the Officer framework
will best promote the National Electricity Objective/National Gas Objective (NEO/NGO) 50
and other requirements of the NER/NGR.
To this end, we have had regard to the differing expert opinions on the proper interpretation
of the gamma parameter in the Officer framework. As discussed in section A.7.3, we accept
Handley's expert advice on the Officer framework. An important aspect of this advice is that
44
R. Officer, 'The cost of capital of a company under an imputation system', Accounting and finance, vol. 34(1), May 1994,
equation 2. 45
J. Handley, Report prepared for the Australian Energy Regulator: Advice on the value of imputation credits, 29 September
2014, pp. 7–8. 46
SFG, Response to submissions on rule change proposals, Report for the AEMC, 5 November 2012, para. 2. 47
ENA, Response to the Draft Rate of Return Guideline of the Australian Energy Regulator, 11 October 2013, p. 49. 48
NER, cll. 6.5.2, 6A.6.2; NGR, r. 87. 49
For a detailed discussion of the Officer framework, see: J. Handley, Report prepared for the Australian Energy Regulator:
Advice on the value of imputation credits, 29 September 2014, pp. 7–12. 50
NEL, s. 16(1)(a); NGL, s. 28(1)(a).

4-19 Attachment 4 – Value of imputation credits | Final decision: Amadeus Gas Pipeline Access
Arrangement 2016–21
the framework is on a 'before-personal-tax and before-personal-costs' basis.51 That is, 'the
per dollar value of an imputation credit 𝛾 gamma should be measured prior to any personal
tax on the credit and prior to any personal costs associated with the receipt of the credit'.52
By determining a value of imputation credits in a manner consistent with the Officer
framework, we consider that we are making our decision in a manner that will or is likely to
contribute to the achievement of the NEO/NGO.53 Further, when exercising our discretion in
making the relevant parts of a decision, we must take into account the revenue and pricing
principles (RPP).54 The RPP provide, amongst other things, that:55
a service provider should be provided with a reasonable opportunity to recover at least
the efficient costs the operator incurs providing regulated services and complying with
regulatory obligations
a service provider should be provided with effective incentives in order to promote
economic efficiency with respect to the regulated services it provides, and
a price, charge or tariff for the provision of a regulated service should allow for a return
commensurate with the regulatory and commercial risks involved in providing the
regulated service.
Therefore, the value of imputation credits we adopt must ultimately promote the achievement
of the NEO/NGO (via its application in the estimated cost of corporate income tax building
block) and must take into account the RPP.
With reference to the language of the RPP, this requires the exercise of our discretion in
determining a tax building block (including the exercise of our discretion in determining the
adjustment for the value of imputation credits) that is:
not too low, in that it contributes to providing a reasonable opportunity to recover at least
efficient corporate tax costs
not too high, in that it contributes to a return that is not excessive and is commensurate
with the relevant risks.
We consider that finding the right balance is best served by having regard to the merits of
the full range of relevant evidence. We explain our consideration of, and reliance upon, the
range of relevant evidence in this attachment. We have determined a value of imputation
credits that we are satisfied achieves a balance between the opportunity for service
providers to recover at least efficient costs but that is commensurate with relevant risks.
51
Although the term 'personal' is used, we note that classes of investors other than individual persons can value imputation
credits (for example, superannuation funds and charities). Therefore, an alternative characterisation might be 'before-
investor-tax' and 'before-investor-costs'. 52
J. Handley, Report prepared for the Australian Energy Regulator: Further advice on the value of imputation credits, 16
April 2015, p. 5. 53
NEL, s. 16(1)(a); NGL, s. 28(1)(a). 54
NEL, s. 16(2)(a)(i); NGL, s. 28(2)(a)(i). 55
NEL, ss. 7A(2)–(7); NGL, ss. 24(2)–(7).

4-20 Attachment 4 – Value of imputation credits | Final decision: Amadeus Gas Pipeline Access
Arrangement 2016–21
4.3.2 Rate of return Guideline
In December 2013, we published the Guideline which is available on our website.56 Within it
we specified:57
the methodologies we propose to use to estimate the allowed rate of return (derived from
the expected return on equity and the return on debt) for electricity and gas network
service providers
the method we propose to use to estimate the value of imputation credits
how these methods will result in an allowed return on equity and return on debt which we
are satisfied achieve the allowed rate of return objective.
In the Guideline we also set out the estimation methods, financial models, market data and
other evidence that we propose to take into account in estimating the expected return on
equity, return on debt and the value of imputation credits.58 We discuss our development of
the Guideline in detail in attachment 3 of this decision.
The Guideline is not binding in determining the value of imputation credits. However, should
we decide to depart from the Guideline we must provide reasons for doing so.59 Equally, it is
open to service providers to propose departures from the Guideline, so long as they provide
reasons.60
4.3.3 Definition of a benchmark efficient entity
As shown in section 4.3.1, the NER/NGR refer to a 'benchmark efficient entity'. We have
adopted:
a single benchmark across gas, electricity, transmission and distribution
a conceptual definition of the benchmark efficient entity as 'a 'pure play', regulated
energy network business operating within Australia'.61
We provide a detailed discussion of our definition of a benchmark efficient entity in
attachment 3 of this decision. This includes a response to service providers' submissions
that a benchmark efficient entity should not be a regulated entity. The definition of a
benchmark efficient entity we use for determining the rate of return is identical to the
definition we use for determining the value of imputation credits in this decision.
However, we discuss one element of the definition in this attachment: 'operating within
Australia'. We consider the rate of return should be estimated on a basis that is consistent
56
The requirements to make and publish the Guideline are set out in: NER, cls. 6.5.2(m) and 6A.6.2(m); NGR, r. 87(13). The
Guideline is available at: http://www.aer.gov.au/node/18859. 57
NER, cll. 6.5.2(n), 6A.6.2(n); NGR, r. 87(14). 58
NER, cll. 6.5.2(n)(2), 6.A.6.2(n)(2); NGR, r. 87(14)(b). 59
NER, cll. 6.2.8(c), 6A.2.3(c); NGR, r. 87(18). 60
NER, ss. S6.1.3(9)–(9B), S6A.1.3(4)(vi),(4A)–(4C); NGR, r. 72(1)(g). 61
AER, Better Regulation: Rate of Return Guideline, December 2013, p. 8.

4-21 Attachment 4 – Value of imputation credits | Final decision: Amadeus Gas Pipeline Access
Arrangement 2016–21
with our estimate of gamma. The rate of return should also be commensurate with the
efficient financing costs of a benchmark efficient entity with a similar degree of risk to the
relevant service provider in the provision of its regulated services. The degree of risk a
service provider faces in the provision of its services is significantly affected by location. This
is because the location of a business determines the conditions under which the business
operates. This includes the regulatory regime, tax laws, industry structure and broader
economic environment that impact the risks faced by the service provider in its provision of
regulated services. An additional consideration that is particularly relevant to the value of
imputation credits is that we recognise that both domestic and foreign investors participate in
the Australian market. That is, we consider that the defined market is an Australian domestic
market that recognises the presence of foreign investors to the extent that they invest in the
Australian market. This is important for determining a value of imputation credits because
typically domestic investors are eligible to utilise imputation credits while foreign investors
are not.
4.3.4 Interrelationships
The NER/NGR recognise that a service provider's allowed revenue does not need to include
the value of imputation credits. The NER/NGR adjust for the value of imputation credits via
the revenue granted to a service provider to cover its expected tax liability. This form of
adjustment recognises that it is the payment of corporate tax which is the source of the
imputation credit return to investors.
The CCP's view suggests that we should take into account the interrelationship with the
corporate tax allowance when determining the value of imputation credits. The CCP
submitted evidence that our benchmark tax allowance was substantially higher than the
corporate tax actually paid by service providers.62 The CCP then concluded:63
Regarding gamma, it is difficult for the CCP to support a gamma of 0.5 as being
better or worse than 1 or 0 or any number in between, we simply do not know enough
about the vagaries of such calculations. Though the lack of tax paid would suggest a
gamma nearer 1 than 0.
We agree with the CCP's suggestion that it would be reasonable to consider the tax building
block as a whole when determining the value of imputation credits. Under this approach, a
tendency toward a higher value of imputation credits (and therefore greater reduction in the
tax building block) might be reasonable if the benchmark tax allowance is above the efficient
cost of tax. However, in the Guideline and this draft decision our determination of the value
of imputation credits is guided by the relevant theoretical framework and associated
evidence.
62
CCP, Responding to NSW draft determinations and revised proposals from electricity distribution networks, February
2015, pp. 48–49. 63
CCP, Responding to NSW draft determinations and revised proposals from electricity distribution networks, February
2015, p. 49.

4-22 Attachment 4 – Value of imputation credits | Final decision: Amadeus Gas Pipeline Access
Arrangement 2016–21
The value of imputation credits is also interrelated with the market risk premium (MRP). As
discussed in attachment 3, the definition of the MRP in the Sharpe-Lintner capital asset
pricing model (CAPM) should account for the capitalised value of imputation credits.
Accordingly, in our determination of the return on equity in attachment 3 we adjust estimates
of the MRP in a manner consistent with our determination of the value of imputation credits
in this attachment. This is also required by the NER/NGR.64
4.3.5 Expert reports
During the development of the Guideline, we commissioned expert advice on the value of
imputation credits from Dr Martin Lally of the Victoria University of Wellington.65
Since the Guideline, we commissioned further expert advice from Associate Professor John
Handley of the University of Melbourne and Dr Martin Lally.66 We have also had regard to,
among other things:
the May 2014, February 2015, June 2015 and January 2016 reports by Professor
Stephen Gray that were commissioned by service providers.67
the March 2015, April 2015 and June 2015 reports by NERA Economic Consulting
(NERA) that were commissioned by service providers.68
the November 2013 and March 2014 reports by Associate Professor Lally that were
commissioned by the Queensland Competition Authority.69
an October 2013 review of a network rail access undertaking by Professor Michael
McKenzie of the University of Liverpool and Associate Professor Graham Partington of
the University of Sydney.70 This review was commissioned by the Queensland
Resources Council and submitted to the Queensland Competition Authority.
a September 2013 report on tax statistics by Dr. Neville Hathaway that was
commissioned by the Energy Networks Association.71
64
NER, cll. 6.5.2(d)(2), 6A.6.2(d)(2); NGR, r. 87(4)(b). 65
M. Lally, The estimation of gamma, 23 November 2013. 66
J. Handley, Report prepared for the Australian Energy Regulator: Advice on the value of imputation credits, 29 September
2014; J. Handley, Report prepared for the Australian Energy Regulator: Further advice on the value of imputation credits,
16 April 2015. J. Handley, Report prepared for the Australian Energy Regulator: Advice on the NERA report 'Estimating
distribution and redemption rates from taxation statistics', 20 May 2015. Lally, Gamma and the ACT decision, May 2016. 67
SFG, An appropriate regulatory estimate of gamma, 21 May 2014; SFG, Estimating gamma for regulatory purposes, 6
February 2015; Frontier Economics, An appropriate regulatory estimate of gamma, June 2015; Frontier, The appropriate
use of tax statistics when estimating gamma, January 2016. 68
NERA, Estimating distribution and redemption rates from taxation statistics, March 2015. NERA, Do imputation credits
lower the cost of equity? Cross-sectional tests, April 2015. NERA, Estimating distribution and redemption rates: Response
to the AER's final decisions for the NSW and ACT electricity distributors, and for Jemena Gas Networks, June 2015. 69
M. Lally, Estimating gamma, 25 November 2013. M. Lally, Review of submissions to the QCA on the MRP, risk-free rate
and gamma, 12 March 2014. 70
M. McKenzie and G. Partington, Report to the Queensland Resources Council: Review of Aurizon Network’s draft access
undertaking, 5 October 2013. 71
N. Hathaway, Imputation credit redemption ATO data 1988–2011: Where have all the credits gone?, September 2013.

4-23 Attachment 4 – Value of imputation credits | Final decision: Amadeus Gas Pipeline Access
Arrangement 2016–21
a June 2013 report on the distribution rate by NERA that was commissioned by the
Energy Networks Association.72
4.3.6 Approach to determining the value of imputation credits
There is no consensus among experts or regulators on the value of imputation credits or the
techniques to use to estimate it.73 Our approach to determining the value of imputation
credits is guided by:
The requirements of the NER/NGR—see section 4.3.1.
The role of the value of the imputation credits in the revenue building block framework—
this suggests that the value of imputation credits is intended to reflect the value of
imputation credits to investors in the benchmark efficient entity.74
Relevant academic literature (Officer)—the framework developed in a 1994 paper by
Officer is widely recognised as providing the basis for the value of imputation credits in
the building block framework.75 A key implication of Officer's framework is that the value
of imputation credits should be estimated on a before-personal-tax and before-personal-
costs basis. This is consistent with a rate of return determined on a nominal vanilla (that
is, a post-company tax pre-personal tax and costs) basis. Therefore, we view the value
of imputation credits as the proportion of company tax returned to investors through the
utilisation of imputation credits.
Relevant academic literature (Monkhouse)—the work of Monkhouse (and others)
extends the Officer framework, and shows that the value of imputation credits can be
estimated as the product of two parameters:
o the proportion of imputation credits generated that is distributed to investors (the
distribution rate)
o the utilisation value to investors in the market per dollar of imputation credits
distributed (the utilisation rate).76
Consistent with this literature, we determine the value of imputation credits as the
product of these two parameters.
A wide range of relevant evidence—we use this range of evidence to estimate the
distribution rate and utilisation rate. In particular:
o Distribution rate—we place primary reliance on the widely accepted approach to
estimating the distribution rate (that is, the 'cumulative payout ratio approach'). We
also have some regard to Lally's estimate for listed equity from financial reports of
the 20 largest listed firms.77
72
NERA, The payout ratio: A report for the Energy Networks Association, June 2013. 73
See sections A.1 and A.2 of appendix A. 74
See section A.5 of appendix A. 75
See sections 4.3.1 and A.6 of appendix A. 76
Assuming retained imputation credits have no value. See section A.6 of appendix A. 77
Lally, Gamma and the ACT Decision, May 2016, p. 29.

4-24 Attachment 4 – Value of imputation credits | Final decision: Amadeus Gas Pipeline Access
Arrangement 2016–21
o Utilisation rate—unlike the distribution rate, there is no single accepted approach
to estimating the utilisation rate, and there is a range of evidence relevant to the
utilisation rate. This includes:
the proportion of Australian equity held by domestic investors (the 'equity
ownership approach')78
the reported value of credits utilised by investors in Australian Taxation Office
(ATO) statistics ('tax statistics')79
studies that seek to infer from market prices the value to investors of
distributed imputation credits ('implied market value studies').80
We place varying levels of reliance on these sources of evidence (which is
supported by Lally).81 That is:
we place most reliance on the equity ownership approach because we
consider it generates the best estimate of the utilisation value to investors in
the market per dollar of imputation credits distributed
we place less reliance on tax statistics because the underlying taxation data
are unreliable
we place even less reliance on implied market value studies because we
consider they have many limitations, including they do not measure the pre-
personal tax and pre-personal cost value of distributed imputation credits.82
Also, when estimating the distribution rate and the utilisation rate there is no consensus
regarding whether evidence and data should be used on all companies and their
investors (all equity) or just listed companies and their investors (only listed equity).83 In
determining the value of imputation credits, we rely on the results from both approaches.
the views of experts—experts differ in their interpretations of the:
o role of the value of imputation credits in the regulatory framework
o underlying theory and academic literature
o relevance of different estimation techniques, particularly for the utilisation rate.
78
See section 4.4. 79
See section 4.4. 80
See section 4.4. 81
Lally, Gamma and the ACT Decision, May 2016, pp. 4–5. 82
Rather, they measure the dividend drop off ratio which is influenced by personal tax factors. This is not appropriate given
our post (corporate) tax regulatory framework based on Officer's 1994 paper (see R. Officer, 'The cost of capital of a
company under an imputation system', Accounting and finance, vol. 34(1), May 1994). 83
For instance, some experts advocate use of evidence on just listed companies and their investors because this is
considered to be more reflective of the benchmark efficient entity and its investors, and/or this is consistent with the use of
evidence from just listed companies when estimating the market risk premium. We note that Lally, in his latest report,
recommends that the distribution rate should be set with reference to the financial reports of the top 20 listed companies
(as he considers this is most representative of the firm specific distribution rate for a benchmark efficient entity) and the
utilisation rate should be set with reference to all equity (as he considers this likely the best estimate of the economy wide
theta value) (see Lally, Gamma and the ACT Decision, May 2016, pp. 4–6). See section A.9.1 of appendix A for more
discussion.

4-25 Attachment 4 – Value of imputation credits | Final decision: Amadeus Gas Pipeline Access
Arrangement 2016–21
4.4 Reasons for final decision
In determining the value of imputation credits, we have considered the full range of evidence
before us with regard to its merits (see section 4.3.6 for our approach). We consider that a
value of imputation credits of 0.4, selected from within a range of 0.3 to 0.5, is reasonable
because:
It is within the range of values indicated by the evidence, and the relevance of the
evidence is supported by the expert opinion of Handley, Lally, and McKenzie and
Partington.
It primarily reflects an estimate of the utilisation rate from the equity ownership approach.
Handley considered this the most important approach to estimating the utilisation rate,
relative to the alternatives of tax statistics and implied market value studies.84 The equity
ownership approach was Lally's second preference after his recommendation for a
utilisation rate of 1.85
It is within the 'preferred' range for the value of imputation credits (0.4 to 0.5) in Handley's
September 2014 advice.86
It is slightly below the Lally's recommended application of the equity ownership
approach.87 This suggests a gamma of at least 0.50 based on Lally's preferred estimate
of the distribution rate and using the equity ownership data based on all equity (which
Lally prefers).
It is consistent with providing regulatory certainty given it is consistent with the value we
used for all regulatory decisions released in 2015, including our draft decision for
APTNT.
Based on the evidence before us at this time, adopting a value of imputation credits that
is rounded to one decimal place appropriately reflects the uncertainty and imprecision
associated with this parameter. This uncertainty is evident in the range of views and
values that have been espoused by experts, and was recognised by Handley and
McKenzie and Partington.88 The imprecision of determining the value of imputation
credits was emphasised by Handley.89
84
J. Handley, Report prepared for the Australian Energy Regulator: Advice on the value of imputation credits, 29 September
2014, p. 31. 85
M. Lally, The estimation of gamma, 23 November 2013, p. 4. Lally's recommendation of a utilisation rate of 1 is based on
his consideration that, because we use a domestic rate of return framework, we should assume that all investors in the
market are domestic (and therefore eligible to make full use of imputation credits). 86
J. Handley, Report prepared for the Australian Energy Regulator: Advice on the value of imputation credits, 29 September
2014, p. 3. 87
Lally, Gamma and the ACT Decision, May 2016, pp. 3–6. 88
J. Handley, Report prepared for the Australian Energy Regulator: Advice on the value of imputation credits, 29 September
2014, p. 32. M. McKenzie and G. Partington, Report to the Queensland Resources Council: Review of Aurizon Network’s
draft access undertaking, 5 October 2013, pp. 31–35. See also section A.1 of appendix A. 89
J. Handley, Report prepared for the Australian Energy Regulator: Advice on the value of imputation credits, 29 September
2014, p. 32.

4-26 Attachment 4 – Value of imputation credits | Final decision: Amadeus Gas Pipeline Access
Arrangement 2016–21
In considering the evidence on the distribution and utilisation rates, we have broadly
maintained the approach set out in the Guideline, but have re-examined the relevant
evidence and estimates. This re-examination, and new evidence and advice considered
since the Guideline, led us to depart from the Guideline value of imputation credits of 0.5.
Departures from specific aspects of the Guideline are noted in the discussion of the
distribution rate and utilisation rate below.
Further to the Guideline approach, in this final decision we consider we may have regard to
evidence from all equity and/or only listed equity. Some experts advocate use of evidence on
only listed companies and their investors because they consider it to be more reflective of
the benchmark efficient entity and its investors, or because they consider this is consistent
with the use of evidence from only listed companies when estimating the MRP. However,
there is no consensus on this point. We discuss the issue further in sections A.8 and A.8.4.
We did not consider this issue in the Guideline.
Lally, in his latest report, considered it is 'not essential but nor is it precluded' to 'match'
distribution rates from all equity (all listed equity) to utilisation rates from all equity (all listed
equity).90 Following this, we consider it is not necessary to 'match' estimates of distribution
rates and utilisation rates based on the dataset used; although we note the choice is open to
us. We discuss this further in section 4.4.1 and A.9.2.
We also note that, following his advice, Lally recommended pairing an estimate of the
utilisation rate for all equity from the equity ownership approach, with a distribution rate for
listed equity estimated from the financial statements of the top 20 listed firms (which he
considered likely to best reflect the distribution rate of a benchmark efficient entity).91
Recognising these considerations, Table 4-3 and Table 4-4 show estimates of the value of
imputation credits that arise from internally consistent evidence from all equity and only listed
equity.92 It also shows the estimated value of imputation credits from Lally's recommended
approach (see above). These individual sources of evidence allow us to present estimates to
two decimal places. However, we consider it reasonable to determine a value of imputation
credits to only one decimal place when determining a single value from across this evidence.
90
M. Lally, Gamma and the ACT Decision, May 2016, pp. 5–6, 24–25, 28. 91
M. Lally, Gamma and the ACT Decision, May 2016, pp. 4–6, 18, 25. In making this choice, Lally considered there is a
trade-off between statistical reliability (which is greater if a market-wide estimate is used) versus potential bias (worse from
a sector-wide estimate). Lally discussed various issues with using firm-specific data, industry averages and market-wide
data to estimate the distribution rate. 92
Note that our estimates of the distribution rate for listed equity come from ATO data on public companies. Handley advised
that it is not strictly correct to refer to ATO data on public companies as data on listed companies. This is because the ATO
definition of a public company includes but is not limited to listed companies. However, Handley also advised that referring
to the public company data as relating to listed companies is suitable for our purpose. J. Handley, Report prepared for the
Australian Energy Regulator: Further advice on the value of imputation credits, 16 April 2015, footnote 26.

4-27 Attachment 4 – Value of imputation credits | Final decision: Amadeus Gas Pipeline Access
Arrangement 2016–21
Table 4-3 Estimates of the value of imputation credits—evidence from all
equity
Evidence on utilisation rate Utilisation rate Distribution rate Value of Imputation
Credits
Equity ownership approach 0.56 to 0.68 0.7 0.40 to 0.47
Equity ownership approach (Lally
recommended distribution rate) 0.56 to 0.68 0.83 0.46 to 0.56
93
Tax statistics 0.48 0.7 0.34
Tax statistics (Lally recommended
distribution rate) 0.48 0.83 0.40
Source: AER analysis; Lally, Gamma and the ACT Decision, May 2016, p. 6.
Table 4-4 Estimates of the value of imputation credits—evidence from listed
equity
Evidence on utilisation rate Utilisation rate Distribution rate Value of Imputation
Credits
Equity ownership approach 0.38 to 0.55 0.75 0.28 to 0.41 (a)
Implied market value studies
SFG dividend drop off study
0 to 1
0.35 (0.4)(a)
0.75 0 to 0.75
0.26 (0.30)(b)
Source: AER analysis.
(a) We note Lally recommends the utilisation rate from all equity over the utilisation rate from listed equity. However, if
his preferred distribution rate was paired with the utilisation rate for listed equity it would give a range for the value of
imputation credits of 0.31 to 0.46.
(b): Following the adjustment proposed by Handley and Lally. This adjustment is discussed further in section A.15.4.
Overall, the evidence suggests that a reasonable estimate of the value of imputation credits
is within the range 0.3 to 0.5.94 From within these possible ranges, we choose a value for
gamma of 0.4 based on the following considerations:
The equity ownership approach, on which we place the most reliance, suggests a value
between 0.28 to 0.47 using 'matched' distribution and utilisation rates for all equity and
for all listed equity, respectively. This is based on a range of 0.40 and 0.47 when applied
to all equity and 0.28 and 0.41 when applied to only all listed equity. The overlap of the
different evidence from the equity ownership approach using these 'matched' distribution
and utilisation rates suggests a value between 0.40 and 0.41. We also have regard to
Lally's recommended approach, which combines the use of an all equity utilisation rate
93
Lally recommends a gamma estimate of at least 0.5 which is based on a distribution rate of at least 0.83 and a utilisation
rate of 0.6. See: M. Lally, Gamma and the ACT Decision, May 2016, p. 6. 94
Although implied market value studies produce estimates below 0.3 and above 0.5, we place less reliance on these
studies.

4-28 Attachment 4 – Value of imputation credits | Final decision: Amadeus Gas Pipeline Access
Arrangement 2016–21
from the equity ownership approach with a distribution rate for listed equity from financial
reports of the top 20 listed firms.
The evidence from tax statistics, on which we place less reliance, suggests a value
around 0.34 based on a utilisation rate of 0.48 and an economy wide distribution rate of
0.70. This is within the equity ownership approach range of 0.28 to 0.47 using 'matched'
data and below the overlap of estimates from listed and all equity of 0.40 to 0.41. The
taxation data also suggests a value around 0.40 based on a utilisation rate of 0.48 and
Lally's preferred distribution rate for a benchmark efficient entity of 0.83.
The evidence from implied market value studies, on which we place even less reliance,
suggests a value between 0 and 0.75. In particular, SFG's dividend drop off study
suggests a value of 0.26 or 0.30. This is around the bottom end of the 'matched' equity
ownership approach range of 0.28 to 0.47, below the overlap of 0.40 to 0.41, and well
below Lally's recommended gamma estimate of at least 0.5. Evidence from implied
market value studies more generally suggests the value could be higher than 0.5 or
lower than 0.28.
On balance, we have considered it appropriate to continue to apply a value of imputation
credits of 0.4 in this final decision. We note this is within the range of the overlap if 'matched'
utilisation rates and distribution rates for all equity and all listed equity are used (0.40 to
0.41). This is also at the bottom of the range for the paired values from all equity using a
distribution rate of 0.7 (range of 0.40 to 0.47). We consider this estimate satisfies the
requirements in the NER/NGR.
We consider a gamma value of 0.4 remains appropriate despite Lally's recent advice
indicating this might be too low and recommending a value of at least 0.5. In maintaining the
use of a gamma value of 0.4 we have given particular consideration to the desirability of
regulatory certainty and predictability. We also note we have used a value of 0.4 for all
decisions released in 2015 and for the draft decision for APTNT. Given these considerations,
we would be reluctant to depart from the value of 0.4 used in our preliminary decision
without broad stakeholder consultation, and we note stakeholders have not had an
opportunity to comment on Lally's latest report. We also do not consider Lally's report shows
0.4 is not open to us to choose when exercising our regulatory discretion.
Therefore, we remain of the view that our choice of 0.4 gives appropriate regard to the
relative merits of the equity ownership approach, tax statistics and implied market value
studies (in particular, SFG’s evidence).
In section 4.3.6 (and in appendix A), we describe the sources of the estimates in Table 4-3
and Table 4-4, and present our assessment of the underlying evidence. This includes
reasons for the relative levels of reliance we place on the underlying sources of evidence.
We do not accept the service providers' proposed value of imputation credits of 0.25,
calculated as the product of a distribution rate of 0.7 and a utilisation rate of 0.35 (see
section 4.2). Specifically, we do not accept the service providers' proposed estimate of the
utilisation rate of 0.35. This is because we do not consider it appropriate to rely exclusively

4-29 Attachment 4 – Value of imputation credits | Final decision: Amadeus Gas Pipeline Access
Arrangement 2016–21
on implied market value studies (or SFG's single dividend drop off study). This position is
supported by a number of experts.95 The South Australian Centre for Economic Studies
suggested that dividend drop off studies be disregarded entirely.96
Even if we were to rely solely on the estimate of the utilisation rate of 0.35 from SFG's study,
we consider that a value of imputation credits of 0.25 is unreasonable. This is because:
Handley and Lally advised that the proper use of this estimate of the utilisation rate
requires its adjustment to 0.4. We agree with this adjustment which is required to correct
for the incorrect post tax valuation of cash dividends from SFG's study, which will also be
expected to be reflected in the estimated utilisation rate. In the post-tax Officer
framework underlying the NER/NGR, one dollar of dividends distributed to the investor is
worth one dollar to investors post (company) tax. This is clear from Officer's definition of
after tax net cash flows consistent with the post-tax vanilla WACC in formula (12) of his
1994 paper.97 The incorrect post tax valuation of dividends (that will also be reflected in
the estimated utilisation rate) is most likely due to differential personal taxes on dividends
and capital gains which impact dividend drop off studies.
This is an estimate of the utilisation rate of investors in only listed equity, and therefore
we remain of the view it should be paired with either an estimate of the distribution rate
from only listed equity using the cumulative payout approach (that is, 0.75); or Lally's
estimate for only listed equity estimated using the top 20 listed firms (that is, 0.83).
Therefore, even if the service providers' proposed utilisation rate estimate is used, it yields a
value of imputation credits of at least 0.30 (0.4 x 0.75) rather than 0.25. However, with
regard to the discussion above, our estimated value of imputation credits is higher than 0.30.
We also note we do not consider even the adjusted value from SFG's dividend drop off study
is a reliable estimate of the utilisation rate for the reasons discussed in this decision (see
section 4.4.1).
We remain of the view that limited reliance should be placed on market based studies.
These studies are influenced by differential personal taxes and are determined by the
marginal investor that is trading around the ex-dividend date. We consider market based
95
For example, Handley and Lally advised that other classes of evidence are more valuable. Handley considers that the
equity ownership approach and tax statistics are more important to estimating the utilisation rate than implied market value
studies: J. Handley, Report prepared for the Australian Energy Regulator: Advice on the value of imputation credits, 29
September 2014, p. 31. Lally prefers an estimate of the utilisation rate from the equity ownership approach to one from
implied market value studies: M. Lally, The estimation of gamma, 23 November 2013, p. 4. We discuss the different
approaches to estimating the utilisation rate in more detail in section 4.4.1. Also, McKenzie and Partington's report for the
Queensland Resources Council also suggested that it is reasonable to have regard to other classes of evidence.
McKenzie and Partington describe the approach to estimating the utilisation rate in our draft rate of return Guideline, which
relied on evidence other than implied market value studies, as making a 'reasonable case' for the estimate adopted in that
document; M. McKenzie and G. Partington, Report to the Queensland Resources Council: Review of Aurizon Network’s
draft access undertaking, 5 October 2013, p. 32. 96
SA Centre for Economic Studies suggested this in a report for the South Australian Council of Social Service. See SA
Centre for Economic Studies (2015), Independent estimate of the WACC for SA Power Networks 2015 to 2020: Report
commissioned by the SA Council of Social Services, January 2015, p. 17. 97
R. Officer, 'The cost of capital of a company under an imputation system', Accounting and finance, vol. 34(1), May 1994,
pg. 8.

4-30 Attachment 4 – Value of imputation credits | Final decision: Amadeus Gas Pipeline Access
Arrangement 2016–21
studies are unlikely to provide an appropriate estimate for the utilisation rate. Therefore,
given the data reliability issues with tax statistics, we consider the equity ownership
approach provides the best estimate for the proportion of distributed imputation credits that
are expected to be used to offset investor personal tax (that is, the utilisation rate). This is
due to local investors effectively fully valuing distributed imputation credit at their face value
on a pre-personal tax and pre-personal costs basis.98 We remain of the view the 45 day
holding rule does not be have a material impact on the utilisation of imputation credits by
otherwise eligible (that is, domestic) investors.
In section 4.4.2 (and appendix A) we respond to the service providers' revised proposals in
more detail. This includes late submissions that address the recent Tribunal decision.
4.4.1 Evidence underlying our estimate of the value of imputation
credits
This section discusses the distribution rate and utilisation rate (or value) in more detail. More
specifically, it describes our approach to estimating these sub-parameters of the value of
imputation credits. This includes reasons for the relative levels of reliance we place on the
underlying sources of evidence (for the utilisation rate in particular).
The distribution rate
The distribution rate is the proportion of imputation credits generated by the benchmark
efficient entity that is distributed to investors.99 We consider:
an estimate of 0.75 for the distribution rate is reasonable when considering estimates of
the utilisation rate that relate to only listed equity.
an estimate of 0.7 for the distribution rate is reasonable when considering estimates of
the utilisation rate that relate to all equity.
Whether an estimate of the distribution rate will result in a reasonable estimate of the
gamma value for a benchmark efficient entity depends on what is considered the best
estimate of the utilisation rate (and if this should be based on all equity or a subset) and what
is considered the best estimate of the distribution rate for a benchmark efficient entity. We
note Lally effectively considers both 'matched' estimates will be too low given what he
considers to be the best estimate of the market wide utilisation rate (of around 0.6) and the
appropriate (firm specific) estimate of the distribution rate for a benchmark efficient entity (of
0.83).100
98
We note that there may be a very small diminution in value from face value due to the time value of money. However, we
consider this immaterial for the reasons discussed in section A.8.3. 99
In the Guideline we referred to the distribution rate as the 'payout ratio'. We have in this decision adopted 'distribution rate'
as we consider this to be the more commonly used terminology. In the Guideline and this decision we attach the same
meaning to these two different ways of describing the parameter. Note also that the distribution rate is referred to as the
'access fraction' in the Monkhouse framework. 100
M. Lally, Gamma and the ACT Decision, May 2016, p. 6.

4-31 Attachment 4 – Value of imputation credits | Final decision: Amadeus Gas Pipeline Access
Arrangement 2016–21
Consistent with the Guideline, we estimate the distribution rate using the 'cumulative payout
ratio approach', which uses data from the ATO on the accounts used by companies to track
their stocks of imputation credits ('franking account balances').101 We use the cumulative
payout ratio approach because it:
uses long-term, published data
is supported by the service providers, Gray (for SFG), Handley, and McKenzie and
Partington102
is simple and intuitive.
Using this approach, NERA estimated a distribution rate across all equity of 0.7 for the
period 1987 to 2011.103 Hathaway found a similar estimate for the period 2004 to 2011.104
We relied on these estimates in the Guideline and the decisions released in 2014. We
consider that updated analysis of the ATO data to the 2012 tax year by NERA and Handley
indicates that 0.7 remains a reasonable estimate of the distribution rate over all equity.105
Gray (for Frontier) updated the ATO data up to 2012-13 and found that the payout ratio for
all equity latest year is 64% and the cumulative ratio is 67%.106 However, recognising the
volatility in the data Frontier considered that 0.7 distribution rate still remained appropriate
for all equity.107 We have updated this data to 2014 and find the cumulative payout ratio for
listed equity is 0.75 and for all equity is 0.68. However, consistent with the service providers'
proposals, we remain of the view that a distribution rate of 0.7 is appropriate for all equity.
Also using this approach, Handley estimated a distribution rate across only listed equity of
0.8 for the period 1987 to 2011.108 We found a similar estimate for the period 2004 to
2011.109 We relied on these estimates in the decisions we released in November 2014 and
April 2015. Updated analysis of the ATO data to the 2012 tax year by NERA and Handley
indicates that the distribution rate over only listed equity has fallen slightly.110 In this final
decision following a further update incorporating 2013 and 2014 data we consider an
appropriate estimate of the distribution rate over only listed equity is 0.75. This is slightly
lower than the value of 0.77 we used in our October and November 2015 decisions.
101
We discuss the cumulative payout approach and alternative approaches to estimating the distribution rate in section A.10
of appendix A. 102
SFG, An appropriate regulatory estimate of gamma, 21 May 2014, paras. 84–92; J. Handley, Report prepared for the
Australian Energy Regulator: Advice on the value of imputation credits, 29 September 2014, p. 25–30; M. McKenzie and
G. Partington, Report to the Queensland Resources Council: Review of Aurizon Network’s draft access undertaking, 5
October 2013, p. 31. 103
NERA, The payout ratio: A report for the Energy Networks Association, June 2013. 104
N. Hathaway, Imputation credit redemption ATO data 1988–2011: Where have all the credits gone?, September 2013. 105
We discuss this updated analysis in section A.10 of appendix A. NERA, Estimating distribution and redemption rates from
taxation statistics, March 2015. J. Handley, Report prepared for the Australian Energy Regulator: Advice on the NERA
report 'Estimating distribution and redemption rates from taxation statistics', 20 May 2015. 106
Frontier Economics, The appropriate use of tax statistics when estimating gamma, January 2016, pp. 7, 18-19. 107
Frontier Economics, The appropriate use of tax statistics when estimating gamma, January 2016, p. 7. 108
J. Handley, Report prepared for the Australian Energy Regulator: Advice on the value of imputation credits, 29 September
2014, pp. 28–29. 109
See section A.10 for more detail. 110
We discuss this updated analysis in section A.10 of appendix A.

4-32 Attachment 4 – Value of imputation credits | Final decision: Amadeus Gas Pipeline Access
Arrangement 2016–21
A distribution rate across only listed equity was not presented in the Guideline. However, as
set out above, we now consider it is open to us to have regard to evidence from all equity
and/or only listed equity (see section A.9.2). We consider estimates of the distribution rate
from listed equity and all equity are reasonably consistent with a benchmark efficient entity
given the difficulties associated with choosing a representative dataset (see section A.10).111
In his latest report, Lally agrees that when estimating the distribution rate for a benchmark
efficient entity, practical considerations indicate the use of sector-wide data. He recommends
a listed equity distribution rate estimated from financial statements of the top 20 listed firms,
stating that:112
Furthermore, since privately-owned regulated businesses in Australia are typically
listed firms or subsidiaries of listed firms, the appropriate set of firms to use to
estimate the distribution rate of regulated businesses would seem to be listed firms.
In his latest report, Lally also considered it is 'not essential but nor is it precluded' to 'match'
distribution rates from all equity (all listed equity) to utilisation rates from all equity (all listed
equity).113 This is because, even though the distribution rate may be estimated using market-
wide data, it is, in principle, a firm-specific parameter. On the other hand, the utilisation rate
is a market-wide parameter.114 Following this, we consider it is not necessary to 'match'
estimates of distribution rates and utilisation rates based on the dataset used; although we
note the choice is open to us. While we principally maintain our previous approach (as is
open to us), we also have some regard to Lally's preferred approach (which combines an all
equity utilisation rate from the equity ownership approach with a distribution rate for listed
equity from financial reports of the top 20 listed firms).115
We discuss our approach to estimating the distribution rate further in sections A.8 and A.8.4.
The utilisation rate
We understand the utilisation rate to be the utilisation value to investors in the market per
dollar of imputation credits distributed.116 In the Monkhouse framework, the utilisation rate is
equal to the weighted average, by wealth and risk aversion, of the utilisation rates of
individual investors. For an ‘eligible’ investor, each dollar of imputation credit received can be
fully returned to the investor in the form of a reduction in tax payable or a refund.117
Therefore, we consider that eligible investors have a utilisation rate of 1. Conversely,
‘ineligible’ investors cannot utilise imputation credits and have a utilisation rate of 0. It follows
that the utilisation rate reflects the extent to which investors can utilise the imputation credits
they receive to reduce their tax or obtain a refund.
111
See M. Lally, Gamma and the ACT Decision, May 2016, pp. 24–25. 112
M. Lally, Gamma and the ACT Decision, May 2016, pp. 26, 28–29. 113
M. Lally, Gamma and the ACT Decision, May 2016, pp. 25–26, 28–29. 114
Lally's view on this issue appears consistent with the views of Gray. See Frontier Economics, An appropriate regulatory
estimate of gamma, June 2015, pp. 12–13. 115
M. Lally, Gamma and the ACT Decision, May 2016, pp. 5–6, 24–26, 29..
116 In this decision we use the terms theta, utilisation value and utilisation rate interchangeably to mean the same thing.
117 This is the return to eligible investors before administrative costs, personal taxes and diversification costs. Handley advises
that this is the desired basis for the utilisation rate. We discuss this further in section A.8.1 of appendix A.

4-33 Attachment 4 – Value of imputation credits | Final decision: Amadeus Gas Pipeline Access
Arrangement 2016–21
This means imputation credits expected to be utilised should be valued at full face value on
a pre-personal tax basis. Valuing imputation credits at face value is consistent with how all
inputs into the allowed rate of return are estimated. For example, the yield on debt is
calculated where the face value of coupon payments and face value of the principal is used
to determine the yield to maturity. Similarly, the face value of dividends are used to calculate
the MRP under the historical average approach and in the dividend growth model.
The implied market value studies that value dividends and imputation credits around the ex-
dividend date are influenced by different personal tax treatment of capital gains and dividend
income. These estimates are neither pre- nor post- personal tax estimates. We do not
consider this is appropriate given our post (corporate) tax regulatory framework based on
Officer 1994.118 What is relevant is the cost that is imposed on a benchmark efficient entity.
This is the cost before personal taxes and personal transaction costs are incurred. The face
value of the imputation credit is the pre-personal tax value and personal tax is levied on this
estimate.119
Consistent with the Guideline, when estimating the utilisation rate we place:
significant reliance upon the equity ownership approach
some reliance upon tax statistics
less reliance upon implied market value studies.
This weighting is supported by Lally.120
The results from these classes of evidence are summarised in Table 4-3 and Table 4-4. The
relative importance that we assign to each approach is supported by Handley and Lally,
while McKenzie and Partington's report for the Queensland Resources Council suggested
that having regard to all of these approaches is reasonable.121 We discuss each approach in
the sections below.122 We depart from the Guideline by not relying upon the 'conceptual
goalposts approach'.
We discuss our interpretation and definition of the utilisation rate further in sections A.6 and
A.8.
The equity ownership approach
We consider that the value-weighted proportion of domestic investors in the Australian equity
market is a reasonable estimate of the utilisation rate. This is because, in general, domestic
118
R. Officer, 'The cost of capital of a company under an imputation system', Accounting and finance, vol. 34(1), May 1994. 119
Personal tax is levied on the gross dividend which is the sum of the face value of the franked dividend and the face vlaue
of the imputation credit. 120
M. Lally, Gamma and the ACT Decision, May 2016, p. 22. 121
J. Handley, Report prepared for the Australian Energy Regulator: Advice on the value of imputation credits, 29 September
2014, p. 31; M. Lally, The estimation of gamma, 23 November 2013, p. 4; M. McKenzie and G. Partington, Report to the
Queensland Resources Council: Review of Aurizon Network’s draft access undertaking, 5 October 2013, p. 32. 122
We have also considered these approaches and the evidence they employ against the criteria used to assess evidence on
the allowed rate of return. See section A.11 of appendix A.

4-34 Attachment 4 – Value of imputation credits | Final decision: Amadeus Gas Pipeline Access
Arrangement 2016–21
investors are eligible to utilise imputation credits and foreign investors are not. Moreover, as
discussed above, we consider that eligible investors have a utilisation rate of 1 because
each dollar of imputation credit received by these investors can be fully returned to them in
the form of a reduction in tax payable or a refund. On a pre-personal tax basis, one dollar of
imputation credits reduces an eligible investor's tax bill by one dollar. We refer to this
approach as the 'equity ownership approach', and we use data from the National Accounts
of the Australian Bureau of Statistics (ABS) to estimate the domestic ownership share.123
We place significant reliance upon the equity ownership approach when considering
estimates of the utilisation rate. This is because:
it is well aligned with the definition of the utilisation rate in the Monkhouse framework
it employs a relatively simple and intuitive methodology
it uses a reliable and transparent source of data
it provides estimates of the utilisation rate for investors in both all equity and only listed
equity
We recognise the equity ownership approach does not take into account the existence of
some domestic investors that do not hold their shares for 45 days at risk over the ex-
dividend date (the 45 day rule).124 However, we consider it is unlikely to have a material
impact on the utilisation of imputation credits by domestic investors. Importantly, no data has
been presented that demonstrates a material impact.
We also recognise the equity ownership approach produces a range of estimates of the
utilisation rate, and the upper end of this range is higher than the estimate produced from tax
statistics (see discussion under 'Tax statistics' below). However, we do not consider this
means the equity ownership approach is incorrect. This is because tax statistics, like the
equity ownership approach, produce an estimate of the utilisation rate. These estimates are
uncertain and dependent on the quality of the underlying data (this is a particular issue for
tax statistics). As such, the true (unknown) value could be higher or lower. Following this, we
do not consider the 45 day rule explains the difference in utilisation rate estimates between
tax statistics and the equity ownership approach. We consider the difference is likely driven
by estimation error in the taxation data. This view is supported by Lally.125 We also note
Lally's statement that:126
Thus, if foreign investors are recognized and absent any information on the terms
other than the value weights on the RHS of equation (8), the equity ownership
approach is not an upper bound on theta but an unbiased estimate.
We consider that a reasonable estimate for the utilisation rate from the equity ownership
approach is between:
123
Specifically, we use data from Australian National Accounts: Finance and Wealth (ABS cat. 5232.0). 124
Australian Competition Tribunal, Application by Public Interest Advocacy Centre Ltd and Ausgrid [2016] ACompT 1, 26
February 2016, paras. 1048. 125
M. Lally, Gamma and the ACT Decision, May 2016, p. 23. 126
M. Lally, Gamma and the ACT Decision, May 2016, p. 17.

4-35 Attachment 4 – Value of imputation credits | Final decision: Amadeus Gas Pipeline Access
Arrangement 2016–21
0.56 and 0.68, if all equity is considered
0.38 and 0.55, if only listed equity is considered.
This differs from the Guideline. In the Guideline, we considered that the equity ownership
approach supported a utilisation rate between 0.7 and 0.8. Since the Guideline's publication,
we have examined more closely the relevant data from the National Accounts. This has
allowed us to update and refine our estimates.
We describe our application of the equity ownership approach and our re-examination of this
source of evidence since the Guideline in detail in section A.12.
Tax statistics
The ATO publishes aggregate statistics on the tax returns submitted by individuals,
superannuation funds and companies, as well as on the imputation credits refunded to
certain income tax exempt entities (for example, charities).127 In theory, these statistics can
be used to derive a measure of the total amount of imputation credits utilised by eligible
investors to offset tax or to be refunded. As discussed in relation to the distribution rate, ATO
statistics also provide estimates of the amount of imputation credits distributed. We consider
the reported value of credits utilised divided by the reported value of credits distributed is an
estimate of the utilisation rate.
We have had regard to tax statistics when considering estimates of the utilisation rate. We
place a degree of reliance upon tax statistics that is less than that placed upon the equity
ownership approach, but which is more than that placed on implied market value studies.
Our position on tax statistics is consistent with the advice from Handley and Lally. Handley
considered tax statistics to be the second most important approach to estimating the
utilisation rate after the equity ownership approach.128 Lally considered that the tax statistics
approach lacks precision, and he did not prefer it to the equity ownership approach.129
However, Lally still preferred tax statistics to implied market value studies.130
We have placed less reliance upon tax statistics compared with the equity ownership
approach because we consider that tax statistics have a number of limitations:
There are residual concerns regarding the data. While Hathaway considered that the
amounts of tax paid and credits utilised can be concluded ‘with some confidence’ and
that they are ‘unlikely to be in major error’. Hathaway also identified a significant
discrepancy associated with the tracking of imputation credits in the data that led him to
127
These statistics are available at: https://www.ato.gov.au/About-ATO/Research-and-statistics/Taxation-statistics/. Accessed
9 April 2015. 128
J. Handley, Report prepared for the Australian Energy Regulator: Advice on the value of imputation credits, 29 September
2014, p. 31. 129
M. Lally, The estimation of gamma, 23 November 2013, p. 4. Also see M. Lally, Gamma and the ACT Decision, May 2016,
p. 4–5. 130
M. Lally, The estimation of gamma, 25 November 2013, p. 4. Also see M. Lally, Gamma and the ACT Decision, May 2016,
p. 4–5.

4-36 Attachment 4 – Value of imputation credits | Final decision: Amadeus Gas Pipeline Access
Arrangement 2016–21
'urge all caution in using ATO statistics for any estimates of parameters concerned with
[imputation] credits'.131
They do not reflect the amount of credits refunded to individuals that do not have to fill
out a tax return.
They might not reflect the amount of credits refunded to certain types of entities.132
They do not provide estimates of the utilisation rate for investors in only listed equity.
Handley suggested that evidence from listed equity is more relevant to the benchmark
efficient entity.133
Lally, in his latest report, considered tax statistics based estimates of the utilisation rate
are unreliable and potentially biased.134
With regard to Hathaway's analysis, in the draft decisions released in 2014 we considered
that tax statistics supported an estimate of the utilisation rate between 0.4 and 0.6.135
However, we also recognised in the draft decisions released in 2014 that our estimate of the
distribution rate (0.7) implied that we should adopt a utilisation rate of around 0.43 from
within this range for consistency. This differs from the Guideline, in which we considered that
tax statistics supported an estimate of the utilisation rate between 0.4 and 0.8.
Since the Guideline, we have continued to examine this evidence. We now consider that
greater reliance should be placed upon estimates that are:
derived from post-2004 data, consistent with Hathaway's findings that the ATO statistics
are subject to a number of issues prior to 2004136
consistent with our estimates of the distribution rate using cumulative distribution rate
data. However, we note this consistency principle does not preclude the combination of a
utilisation rate estimated based on this principle with a higher estimate of the distribution
rate for the benchmark efficient entity based on Lally's latest advice.137
In this final decision, we have regard to NERA's updated analysis of the ATO data to the
2012 tax year.138 This analysis supports a distribution rate of 0.7 and a utilisation rate of
0.45. Using updated ATO data to the 2012-13 year, Gray (for Frontier) has estimated a
slightly higher utilisation rate of 0.46 for the period 2004 to 2013. Our analysis uses updated
131
N. Hathaway, Imputation credit redemption ATO data 1988–2011: Where have all the credits gone?, September 2013,
paras. 9 and 99–100. 132
That is, statistics are published on the refunds to 'endorsed income tax-exempt entities and deductible gift recipients', but it
is not clear whether this covers refunds to other entities entitled to a refund of imputation credits. Such entities include
public funds declared by the Treasurer to be a developing country relief fund and exempt institutions that are eligible for a
refund under the regulations. See: https://www.ato.gov.au/Non-profit/Franking-credits/In-detail/FAQs/Refund-of-franking-
credits--endorsed-entities---FAQs/?page=3. Accessed 9 April 2015. 133
We discuss this issue further in section A.9.1 of appendix A. 134
M. Lally, Gamma and the ACT Decision, May 2016, pp. 19-20, 26, 30. 135
N. Hathaway, Imputation credit redemption ATO data 1988–2011: Where have all the credits gone?, September 2013. 136
N. Hathaway, Imputation credit redemption ATO data 1988–2011: Where have all the credits gone?, September 2013,
para. 32. 137
M. Lally, Gamma and the ACT Decision, May 2016, pp. 5, 25. 138
NERA, Estimating distribution and redemption rates from taxation statistics, March 2015.
4-37 Attachment 4 – Value of imputation credits | Final decision: Amadeus Gas Pipeline Access
Arrangement 2016–21
ATO data up to 2013-14 and estimates a slightly higher utilisation rate of 0.48 for the period
2004 to 2014.
We consider tax statistics are a valid method for estimating a point estimate of the utilisation
rate. However, we consider it provides a less reliable estimate of the utilisation rate than the
equity ownership approach (see discussion under 'Equity ownership approach' above). This
is because there are issues with the underlying taxation data. As explained above, we
consider there are issues with the underlying taxation data and experts consider it to be
unreliable. Nevertheless, having regard to the potential data limitations and alternate
estimates, the evidence from tax statistics is not inconsistent with the evidence from the
equity ownership approach. We also note that an estimate of gamma of approximately 0.4 is
obtained when combining a utilisation rate of 0.48 (consistent with FAB data) with Lally's
preferred estimate of the distribution rate for a benchmark efficient entity of 0.83.
We discuss our revised (post-Guideline) consideration of tax statistics in more detail in
section A.13.
Implied market value studies
Implied market value studies seek to infer from market prices the value of distributed
imputation credits. A wide range of such studies have been conducted over time, employing
a variety of techniques. A common type of implied market value study are dividend drop off
studies. These studies compare the price of a security with and without the entitlement to a
dividend. Econometric techniques are then used to infer the value of the imputation credits
attached to these dividends. We discuss the different types of implied market value study in
section A.15.1.
We consider that the equity ownership approach and tax statistics provide more direct and
simpler evidence on the utilisation rate than implied market value studies. Handley
supported this view; he noted that dividend drop off studies are the most relevant class of
implied market value study, but considered them less important to estimating the utilisation
rate than the equity ownership approach and tax statistics.139 Lally identified a number of
issues with using market prices to estimate the utilisation rate and, therefore, preferred the
equity ownership approach.140 In his latest report, Lally preferred both the equity ownership
approach and tax statistics to dividend drop off studies.141
We also consider that these studies can be subject to a number of limitations. The limitations
of implied market value studies can include:
These studies can produce nonsensical estimates of the utilisation rate; that is, greater
than one or less than zero.
139
J. Handley, Report prepared for the Australian Energy Regulator: Advice on the value of imputation credits, 29 September
2014, p. 31. 140
M. Lally, The estimation of gamma, 23 November 2013, p. 4. 141
M. Lally, Gamma and the ACT Decision, May 2016, pp. 4–5.

4-38 Attachment 4 – Value of imputation credits | Final decision: Amadeus Gas Pipeline Access
Arrangement 2016–21
The results of these studies can be influenced by factors, such as differential personal
taxes and risk, which are not relevant to the utilisation rate. The utilisation rate should be
estimated on a pre-personal tax basis consistent with the allowed rate of return
parameters and the post (corporate) tax framework in the NER/NGR.
The results of these studies might not be reflective of the value of imputation credits to
investors in the market as a whole. For instance, in dividend drop off studies the value of
imputation credits is determined by the marginal investor that trade around the ex-
dividend date.142 There is no reason to assume this reflects the value that long term
investors who provide capital to a benchmark efficient entity place on imputation credits
in aggregate. There is also no reason to assume this value will show what proportion of
company tax is a prepayment of personal tax.143
These studies can be data intensive and employ complex and sometimes problematic
estimation methodologies.
Regarding dividend drop off studies, it is only the value of the combined package of
dividends and imputation credits that can be observed in the market. However, there is
no consensus among experts on how to separate the value to the market of dividends
from the value to the market of imputation credits (this is referred to as the 'allocation
problem').
The limitations of dividend drop off studies are discussed in more detail in section A.15.
However, we note here the following statement from Lally's latest report:144
In respect of dividend drop-off studies, my views on the merits of this approach
appear in Lally (2013, section 3.5) and they are highly adverse. In particular, the
results from such studies are subject to considerable statistical uncertainty, to the tax
positions and transactions costs incurred by arbitrageurs who may be quite
unrepresentative of investors in general, the contentious question of which model to
use, data filtering rules, deletion of outliers, the choice of the “tuning constant” in
robust regression models, the wide divergence in results from other types of studies
using market evidence, the wide range of evidence on anomalous behaviour around
ex-days, and the need to correct the estimated coefficient on imputation credits for
the difference in the tax rate on capital gains and dividends.
In section A.15.2, we summarise the available implied market value studies and their results.
Opinion on the merits of the various studies differs:
Gray (for SFG) considered that implied market value studies should be relied upon
exclusively when estimating the (after-personal-tax and after-personal-costs) utilisation
rate. Moreover, he considered that dividend drop off studies should be preferred to
142
J. Handley, Report prepared for the Australian Energy Regulator: Advice on the value of imputation credits, 29 September
2014, p. 44; A. Ainsworth, G. Partington and G. Warren, Do franking credits matter? Exploring the financial implications of
dividend imputation, May 2015, p. 18. 143
J. Handley, Report prepared for the Australian Energy Regulator: Advice on the value of imputation credits, 29 September
2014, p. 44; A. Ainsworth, G. Partington and G. Warren, Do franking credits matter? Exploring the financial implications of
dividend imputation, May 2015, p. 18. 144
M. Lally, Gamma and the ACT Decision, May 2016, p. 22.

4-39 Attachment 4 – Value of imputation credits | Final decision: Amadeus Gas Pipeline Access
Arrangement 2016–21
alternative market studies. In Gray's view, there is no reasonable basis for adopting an
estimate from dividend drop off analysis above the 0.35 estimate from SFG's study.145
The Economic Regulation Authority of Western Australia (ERA) conducted its own
dividend drop off study and concluded that a reasonable estimate is between 0.35 and
0.55.146
Lally concurred with the view that implied market value studies 'warrant low weight', but
suggested that some studies are more useful than others based on their
characteristics.147 Lally also raised a number of issues in relation to SFG's dividend drop
off study.148 In his latest report, Lally reaffirmed his view that 'minimal weight' should be
placed on dividend drop off studies.149
McKenzie and Partington considered that there is no obvious manner in which to weigh
the results from various studies based on their characteristics. They observed that a
simple average of the results from a reasonably comprehensive sample of studies
suggests an estimate of the utilisation rate of 0.53. They also noted that their own
studies suggest a significantly higher estimate of 0.83.150
Gray (for Frontier) expressed concerns that the reintroduction of pre-2000 and low quality
studies is an error, and that it is also an error to assume all market value studies are of
uniform relevance and quality.151
A further issue regarding implied market value studies is the appropriate interpretation of
their results. Handley and Lally both advised that in the rate of return framework investors
are assumed to value one dollar of dividends at one dollar (on a pre-personal-tax basis).
This is certainly true of how the MRP is estimated, where the face value of historically
distributed dividends and historical capital gains are used. However, the results of implied
market value studies can reflect certain factors that suggest that investors value one dollar of
dividends at less than one dollar (such as differential personal taxes on dividends and capital
gains). Moreover, any such factors will affect these studies' results for investors' valuation of
imputation credits. Handley and Lally advised that the desired estimate of the utilisation rate
should exclude the effect of these factors.152 To remove the effect, they advised that the
estimate of the utilisation rate from a given study can be divided by investors' estimated
valuation of dividends from the same study.153 Therefore, Handley and Lally advised that the
145
SFG, An appropriate regulatory estimate of gamma, 21 May 2014, paras. 17 and 20. 146
Economic Regulation Authority, Explanatory Statement for the Rate of Return Guidelines, 13 December 2013, para. 921. 147
M. Lally, The estimation of gamma, 23 November 2013, pp. 20–30. 148
M. Lally, The estimation of gamma, 23 November 2013, pp. 24–26 and 28–29; M. Lally, Review of submissions to the
QCA on the MRP, risk-free rate and gamma, 12 March 2014, pp. 35–38. 149
M. Lally, Gamma and the ACT Decision, May 2016, pp. 4–5, 23, 31. 150
M. McKenzie and G. Partington, Report to the Queensland Resources Council: Review of Aurizon Network’s draft access
undertaking, 5 October 2013, p. 34. 151
Frontier Economics, An appropriate regulatory estimate of gamma, June 2015, p. 35. 152
J. Handley, Report prepared for the Australian Energy Regulator: Advice on the value of imputation credits, 29 September
2014, pp. 43–44; J. Handley, Report prepared for the Australian Energy Regulator: Further advice on the value of
imputation credits, 16 April 2015, p. 16; M. Lally, The estimation of gamma, 23 November 2013, p. 21. 153
In the appendix to the Guideline we noted that this adjustment was contentious and required further examination. In his
recent advice, Handley also advised that this adjustment should be applied. Having given this issue further consideration,

4-40 Attachment 4 – Value of imputation credits | Final decision: Amadeus Gas Pipeline Access
Arrangement 2016–21
0.35 estimate from SFG's dividend drop off study should in fact be interpreted as an
estimate of around 0.4.
In light of this, we consider implied market value studies, if they are to be used at all, need to
be adjusted for the incorrect estimates of the post-tax value of cash dividends which would
expect to also result in an incorrect estimate of the value of imputation credits. This is likely
correcting for the effect on the observed drop off ratio of differential personal taxes between
income and capital gains (see section A.15.3). This limitation does not apply to other market
parameters in the allowed rate of return framework. We also consider that, even when
adjusted, we should place limited reliance on estimates of the utilisation rate from implied
market value studies because of residual concerns about these studies and what they are
measuring.
In light of the differing views on these studies and the range of estimates they produce, we
consider that implied market value studies provide limited guidance. In the Guideline, we
considered that implied market value studies supported an estimate of the utilisation rate
between 0 and 0.5. This range was determined with regard to a range of studies, with higher
regard given to those studies that:
used longer data periods
used data since 2000, when the change in tax law entitled eligible investors to a refund of
credits that exceeded their tax liability
encompassed the breadth of the market instead of just selected firms, and
appeared to use more reasonable and robust econometric treatments.
However, in this final decision we recognise that experts advocate both broader and
narrower assessments of the evidence from implied market value studies. McKenzie and
Partington considered it reasonable to have regard to a range of studies, including those that
produced estimates above 0.5.154 In Gray's view (for SFG), there is no reasonable basis for
adopting an estimate from dividend drop off analysis above the 0.35 estimate from SFG's
study.155 It appears that Gray (for Frontier) continues to hold this view.156
Ultimately, as discussed in section A.15.5, estimates from implied market value studies and
the level of reliance we place on them (including SFG's dividend drop off study) do not give
us cause to move from the estimate of the value of imputation credits that we determine with
regard to evidence from the equity ownership approach and tax statistics. In response to
Gray's comments (for Frontier) on our consideration of "pre-2000 and low-quality studies"157
we note that our having regard to more studies since the Guideline, including those that use
pre 2000 data and those that estimate a value for theta between 0.5 and 1, was not material
we agree with the advice from Lally and Handley that estimates from dividend drop off studies should he adjusted in this
manner for the reasons that Lally and Handley explain. 154
M. McKenzie and G. Partington, Report to the Queensland Resources Council: Review of Aurizon Network’s draft access
undertaking, 5 October 2013, pp. 33–35. 155
SFG, An appropriate regulatory estimate of gamma, 21 May 2014, paras. 17 and 20. 156
Frontier Economics, An appropriate regulatory estimate of gamma, June 2015, p. 33. 157
Frontier Economics, An appropriate regulatory estimate of gamma, June 2015, p. 35.

4-41 Attachment 4 – Value of imputation credits | Final decision: Amadeus Gas Pipeline Access
Arrangement 2016–21
to our decision to set gamma at 0.4, and that we have had particular regard to SFG's
dividend drop off study in making our decision.
We discuss our consideration of implied market value studies in detail in section A.15.
4.4.2 Response to submissions by stakeholders
The service providers currently under assessment submitted their initial proposals in
April/June 2015 and their revised proposals in January 2016.158 In section A.4, we set out
the key issues raised by these service providers, as well as the key issues raised by service
providers we have assessed in the past (post-Guideline). The key issues raised are broadly
consistent across the service providers.
Since the service providers currently under assessment submitted their revised proposals, a
number have made late submissions.159 These late submissions have asked us to take into
account a range of issues identified in the Tribunal's recent decisions for ActewAGL
Distribution, Ausgrid, Endeavour Energy, Essential Energy and Jemena Gas Networks.160
The Tribunal ordered the remittal of our final decisions for these service providers, with
directions to remake by reference to an estimated cost of corporate income tax based on a
gamma of 0.25.
As discussed in section 4.1, at this time we have not completed the remittal of our final
decisions for ActewAGL Distribution, Ausgrid, Endeavour Energy, Essential Energy and
Jemena Gas Networks. As such, we have not fully considered the Tribunal’s reasons nor
formed a concluded view on how they should be applied in future decisions. However, in the
limited time available, we have reviewed the late submissions from United Energy,
ActewAGL, CitiPower and Powercor.161 We have updated this decision to include a limited
response to the key issues raised in the late submissions, with reference to the Tribunal's
reasoning on these specific issues.
Table 4-5 sets out the key issues raised by the service providers in their revised proposals
and late submissions. We also provide a summary of our response and a reference to our
more detailed response.
158
These service providers are Australian Gas Networks, ActewAGL Distribution, APTNT, JEN, AusNet Services, United
Energy, CitiPower and Powercor. 159
United Energy, Submission on AER preliminary determination - Submission on gamma, 26 April 2016; CitiPower and
Powercor, CitiPower and Powercor 2016-2020 distribution determinations—Submission on implications of recent
Australian Competition Tribunal decisions, 18 April 2016. 160
For example, see Australian Competition Tribunal, Applications by Public Interest Advocacy Centre Ltd and Ausgrid [2016]
ACompT 1, 26 February 2016, para 1(c). 161
United Energy, Submission on AER preliminary determination - Submission on gamma, 26 April 2016;
CitiPower/Powercor, Submission on implications of recent Australian Competition Tribunal Decision, 18 April 2016;
ActewAGL, Implication of recent Tribunal decisions for final decision and updates to the allowed rate of return and forecast
inflation estimate, 12 May 2016.

4-42 Attachment 4 – Value of imputation credits | Final decision: Amadeus Gas Pipeline Access
Arrangement 2016–21
Table 4-5 Key issues raised by service providers
Issue Summary of response Section
Conceptual framework
Our conceptual approach to gamma, redefining
it as the value of imputation credits that are
available for redemption, is inconsistent with the
concept of gamma in the Officer framework for
the WACC and inconsistent with the
requirements of the NGR. It is also inconsistent
with the objective of ensuring a market rate of
return on equity.162
The Tribunal considered the equity ownership
and tax statistics approaches to estimating the
utilisation rate ignore factors which reduce the
value of imputation credits to shareholders
below the face value. As a result, it considered
these approaches are inconsistent with a proper
interpretation of the Officer framework.163
We have not redefined gamma as the value of imputation
credits available for redemption. Rather, our conceptual
approach considers imputation credits should be valued at
face value on a post-company tax basis, before the impact
of personal taxes and transaction costs. This is consistent
with the Officer framework. Based on this, we consider
gamma to be equal to the product of the distribution rate
and the utilisation rate to investors in the market per dollar
of credits distributed (the 'utilisation rate').
The equity ownership approach and tax statistics are
consistent with our conceptual approach. They value
imputation credits expected to be utilised (the utilisation
rate) at full face value on a pre-personal tax and costs
basis. Conversely, estimates of the utilisation rate from
implied market value studies are influenced by different
personal tax treatment of capital gains and dividend
income.
Also, valuing imputation credits at face value is consistent
with how all inputs into the allowed rate of return are
estimated.
In regards to the 'factors', we have received advice from
Handley on these factors. We consider such factors are
either immaterial or should not be accounted for when
estimating the properly defined utilisation rate.
4.1
4.3.1
A.5
A.6
A.7
A.8
Distribution rate
It is appropriate to use an all equity based
estimate of the distribution rate.164
The
distribution rate for listed equity is likely to be a
poor proxy for a benchmark efficient entity.165
We consider the use of a distribution rate for listed equity
is open to us and reasonably reflective of a benchmark
efficient entity given the difficulties associated with
choosing a representative dataset. Lally also recommends
4.4.1
A.10
162
United Energy, Submission on AER preliminary determination - Submission on gamma, 26 April 2016; Australian Gas
Networks, Attachment 11 Response to Draft Decision: Cost of Tax, January 2016, pp. 2, 4, 6: ActewAGL, Appendix 5.01
Detailed response to rate of return, gamma and inflation, January 2016, p. 40; AusNet Electricity Services, Revised
Regulatory Proposal, January 2016, p. 7-79; United Energy, Response to AER Preliminary Determination Re: Rate of
return and gamma, January 2016, p. 80; CitiPower, Revised Regulatory Proposal 2016-2020; January 2016, p. 358;
Jemena Electricity Networks, Attachment 6-1 Rate of return, gamma, forecast inflation, and debt and equity raising costs,
January 2016, p. 86; Powercor, Revised Regulatory Proposal 2016-2020, January 2016, p. 352. 163
Australian Competition Tribunal, Application by Public Interest Advocacy Centre Ltd and Ausgrid [2016] ACompT 1, 26
February 2016, paras. 1095. 164
United Energy, Submission on AER preliminary determination - Submission on gamma, 26 April 2016; Australian Gas
Networks, Attachment 11 Response to Draft Decision: Cost of Tax, January 2016, pp. 7-9; ActewAGL, Appendix 5.01
Detailed response to rate of return, gamma and inflation, January 2016, pp. 109-110; AusNet Electricity Services, Revised
Regulatory Proposal, January 2016, pp. 7-80, 7-81; United Energy, Response to AER Preliminary Determination Re: Rate
of return and gamma, January 2016, pp. 87-88; CitiPower, Revised Regulatory Proposal 2016-2020; January 2016,
pp. 359-360; Jemena Electricity Networks, Attachment 6-1 Rate of return, gamma, forecast inflation, and debt and equity
raising costs, January 2016, pp. 87-88; Powercor, Revised Regulatory Proposal 2016-2020, January 2016, pp. 353-354. 165
Australian Gas Networks, Attachment 11 Response to Draft Decision: Cost of Tax, January 2016, pp. 7-9; ActewAGL,
Appendix 5.01 Detailed response to rate of return, gamma and inflation, January 2016, pp. 109-110; AusNet Electricity

4-43 Attachment 4 – Value of imputation credits | Final decision: Amadeus Gas Pipeline Access
Arrangement 2016–21
Issue Summary of response Section
The Tribunal considered we provided insufficient
reasoning for introducing listed equity
distribution rate.166
distribution rate based on listed equity for a benchmark
efficient entity, although he estimates this using financial
statements of the top 20 listed firms.
Further, we consider it is inappropriate to focus on
individual elements of a benchmark efficient entity, such as
foreign income and foreign ownership. Instead, we
consider a benchmark efficient entity should be assessed
holistically. When determining gamma for a benchmark
efficient entity, what is relevant is how it generates and
distributes imputation credits. We also note that if we
estimated a distribution rate strictly in accordance with our
benchmark definition we would use only the firms we
regulate, or an observable set of similar firms.
Finally, it is not clear that foreign income results in a higher
imputation payout ratio. In fact, Lally's analysis suggests
the opposite.
Estimates of the utilisation rate from listed equity
(all equity) do not have to be paired with
estimates of the distribution rate from listed
equity (all equity).167
Following Lally's latest report, we consider it is not
essential to 'match' estimates of distribution rates and
utilisation rates based on the dataset used; although we
note the choice is open to us. While we primarily rely on
'matched' estimates, we also have regard to Lally's
preferred estimate based on an all equity utilisation rate
from the equity ownership approach and a distribution rate
for listed equity from financial reports of the top 20 listed
firms.
4.4.1
A.9
Utilisation rate
Equity ownership approach
The equity ownership approach overstates the
utilisation rate (relative to an upper bound based
on tax statistics)168
We do not consider the estimate of the utilisation rate from
tax statistics is an upper bound (see response under 'Tax
statistics').
4.4.1
A.12
Services, Revised Regulatory Proposal, January 2016, pp. 7-80, 7-81; United Energy, Response to AER Preliminary
Determination Re: Rate of return and gamma, January 2016, pp. 87-88; CitiPower, Revised Regulatory Proposal 2016-
2020; January 2016, pp. 359-360; Jemena Electricity Networks, Attachment 6-1 Rate of return, gamma, forecast inflation,
and debt and equity raising costs, January 2016, pp. 87-88; Powercor, Revised Regulatory Proposal 2016-2020, January
2016, pp. 353-354. Also see HoustonKemp, A response to the Australian Energy Regulator Draft Decision on Australian
Gas Networks AA2016 Revenue Reset, February 2016, p. 35. 166
Australian Competition Tribunal, Application by Public Interest Advocacy Centre Ltd and Ausgrid [2016] ACompT 1, 26
February 2016, para. 1106. 167
Australian Gas Networks, Attachment 11 Response to Draft Decision: Cost of Tax, January 2016, p. 4; ActewAGL,
Appendix 5.01 Detailed response to rate of return, gamma and inflation, January 2016, pp. 41, 111, 128; AusNet Electricity
Services, Revised Regulatory Proposal, January 2016, pp. 7-81, 7-95; United Energy, Response to AER Preliminary
Determination Re: Rate of return and gamma, January 2016, pp. 82, 96; CitiPower, Revised Regulatory Proposal 2016-
2020; January 2016, pp. 360-374; Jemena Electricity Networks, Attachment 6-1 Rate of return, gamma, forecast inflation,
and debt and equity raising costs, January 2016, pp.88, 103; Powercor, Revised Regulatory Proposal 2016-2020, January
2016, pp. 354, 368. 168
United Energy, Submission on AER preliminary determination - Submission on gamma, 26 April 2016; Australian Gas
Networks, Attachment 11 Response to Draft Decision: Cost of Tax, January 2016, pp. 10-11; ActewAGL, Appendix 5.01
Detailed response to rate of return, gamma and inflation, January 2016, pp. 112-114; AusNet Electricity Services, Revised
Regulatory Proposal, January 2016, pp. 7-83, 7-84; United Energy, Response to AER Preliminary Determination Re: Rate
of return and gamma, January 2016, pp. 84-85; CitiPower, Revised Regulatory Proposal 2016-2020; January 2016,

4-44 Attachment 4 – Value of imputation credits | Final decision: Amadeus Gas Pipeline Access
Arrangement 2016–21
Issue Summary of response Section
The Tribunal considered this shows there are
investors who we assume are eligible to redeem
imputation credits but, for whatever reasons,
either cannot redeem them or attribute so little
value to the credits that they do not utilise them.
In particular, there are investors who hold
shares for less than 45 days.169
We consider the 45 day rule is unlikely to have a material
impact on the utilisation of imputation credits by domestic
investors, and no data has been presented that
demonstrates a material impact. As such, we do not
consider the 45 day rule explains the difference in
utilisation rate estimates between tax statistics and the
equity ownership approach. We consider the difference is
likely driven by estimation error in the taxation data. Lally
considers the most obvious explanation for the difference
is the estimate of the redemption rate from tax statistics
used by the AER is too low.170
We use an estimate of the utilisation rate below the top of
the range from the equity ownership approach.
A.14
A.8.3
The equity ownership approach is inconsistent
with the proper interpretation of the Officer
framework.171
The equity ownership approach does not reflect
factors which affect investors' valuation of
imputation credits (below their full face value).172
See response under 'Conceptual framework'. A.8.3
A.12
The equity ownership approach can only be
used informatively as an upper bound or as a
check on other estimates (like tax statistics)173
The equity ownership approach (and tax statistics) can
used to generate a point estimate of the utilisation rate.
4.4
A.12
The equity ownership approach estimate of the
utilisation rate should be based on listed
equity174
We consider utilisation rates from the equity ownership
approach based on listed equity and all equity.
A.9.1
A.12
pp. 362-363; Jemena Electricity Networks, Attachment 6-1 Rate of return, gamma, forecast inflation, and debt and equity
raising costs, January 2016, pp. 90-91; Powercor, Revised Regulatory Proposal 2016-2020, January 2016, pp. 356-357. 169
Australian Competition Tribunal, Application by Public Interest Advocacy Centre Ltd and Ausgrid [2016] ACompT 1, 26
February 2016, paras. 1048, 1090, 1092. 170
M. Lally, Gamma and the ACT Decision, May 2016, p. 21. 171
United Energy, Submission on AER preliminary determination - Submission on gamma, 26 April 2016; Australian
Competition Tribunal, Application by Public Interest Advocacy Centre Ltd and Ausgrid [2016] ACompT 1, 26 February
2016, para. 1095. 172
ActewAGL, Appendix 5.01 Detailed response to rate of return, gamma and inflation, January 2016, pp. 112-114; AusNet
Electricity Services, Revised Regulatory Proposal, January 2016, p. 7-83; United Energy, Response to AER Preliminary
Determination Re: Rate of return and gamma, January 2016, p. 84; CitiPower, Revised Regulatory Proposal 2016-2020;
January 2016, p. 362; Jemena Electricity Networks, Attachment 6-1 Rate of return, gamma, forecast inflation, and debt
and equity raising costs, January 2016, pp. 90-91; Powercor, Revised Regulatory Proposal 2016-2020, January 2016,
p. 356. 173
United Energy, Submission on AER preliminary determination - Submission on gamma, 26 April 2016; Australian Gas
Networks, Attachment 11 Response to Draft Decision: Cost of Tax, January 2016, pp. 10-11; ActewAGL, Appendix 5.01
Detailed response to rate of return, gamma and inflation, January 2016, p. 114; AusNet Electricity Services, Revised
Regulatory Proposal, January 2016, pp. 7-83, 7-84; United Energy, Response to AER Preliminary Determination Re: Rate
of return and gamma, January 2016, p. 85; CitiPower, Revised Regulatory Proposal 2016-2020; January 2016, pp. 362-
363; Jemena Electricity Networks, Attachment 6-1 Rate of return, gamma, forecast inflation, and debt and equity raising
costs, January 2016, p. 91; Powercor, Revised Regulatory Proposal 2016-2020, January 2016, pp. 356-357; Australian
Competition Tribunal, Application by Public Interest Advocacy Centre Ltd and Ausgrid [2016] ACompT 1, 26 February
2016, para. 1095. 174
Australian Gas Networks, Attachment 11 Response to Draft Decision: Cost of Tax, January 2016, pp. 17-18; ActewAGL,
Appendix 5.01 Detailed response to rate of return, gamma and inflation, January 2016, pp. 121-122; AusNet Electricity
Services, Revised Regulatory Proposal, January 2016, pp. 7-90–7-91; United Energy, Response to AER Preliminary

4-45 Attachment 4 – Value of imputation credits | Final decision: Amadeus Gas Pipeline Access
Arrangement 2016–21
Issue Summary of response Section
Only the most recent point estimates of the
equity ownership share are relevant.175
We disagree. Given that the series exhibits considerable
volatility, we consider it is reasonable to not rely solely on
the most recent point estimate. Similarly, we estimate an
MRP (for the return on equity) that reflects prevailing
market conditions using a historical series of excess
returns.
A.12
Tax statistics
Tax statistics are inconsistent with the proper
interpretation of the Officer framework176
Tax statistics do not reflect factors which affect
investors' valuation of imputation credits (below
their full face value).177
See response under 'Conceptual framework'.
4.1
A.8.3
A.13
Tax statistics can only provide an upper bound
for the estimate of the utilisation rate178
We do not consider tax statistics provide an upper bound
estimate. An upper bound is a value above which the true
value cannot exceed.179
Rather, tax statistics provide one point estimate for the
utilisation rate. This estimate is, by definition, uncertain
and dependant on the quality of the underlying data. As
such, the true (unknown) value could be higher or lower.
Importantly, the quality of the underlying taxation data is
4.4.1
A.13
Determination Re: Rate of return and gamma, January 2016, pp. 91–92; CitiPower, Revised Regulatory Proposal 2016-
2020; January 2016, pp. 369-370; Jemena Electricity Networks, Attachment 6-1 Rate of return, gamma, forecast inflation,
and debt and equity raising costs, January 2016, pp. 98-99; Powercor, Revised Regulatory Proposal 2016-2020, January
2016, pp. 363-364. 175
Australian Gas Networks, Attachment 11 Response to Draft Decision: Cost of Tax, January 2016, pp. 18-19; ActewAGL,
Appendix 5.01 Detailed response to rate of return, gamma and inflation, January 2016, pp. 123-124; AusNet Electricity
Services, Revised Regulatory Proposal, January 2016, pp. 7-91–7-92; United Energy, Response to AER Preliminary
Determination Re: Rate of return and gamma, January 2016, pp. 92–93; CitiPower, Revised Regulatory Proposal 2016-
2020; January 2016, pp. 370-371; Jemena Electricity Networks, Attachment 6-1 Rate of return, gamma, forecast inflation,
and debt and equity raising costs, January 2016, pp. 99-100; Powercor, Revised Regulatory Proposal 2016-2020, January
2016, pp. 364-365. 176
United Energy, Submission on AER preliminary determination - Submission on gamma, 26 April 2016. 177
Australian Gas Networks, Attachment 11 Response to Draft Decision: Cost of Tax, January 2016, pp. 11-12: ActewAGL,
Appendix 5.01 Detailed response to rate of return, gamma and inflation, January 2016, pp. 114-115; AusNet Electricity
Services, Revised Regulatory Proposal, January 2016, p. 7-84; United Energy, Response to AER Preliminary
Determination Re: Rate of return and gamma, January 2016, pp. 85-86; CitiPower, Revised Regulatory Proposal 2016-
2020; January 2016, pp. 363-364; Jemena Electricity Networks, Attachment 6-1 Rate of return, gamma, forecast inflation,
and debt and equity raising costs, January 2016, p. 92; Powercor, Revised Regulatory Proposal 2016-2020, January 2016,
pp. 357-358. 178
United Energy, Submission on AER preliminary determination - Submission on gamma, 26 April 2016; Australian Gas
Networks, Attachment 11 Response to Draft Decision: Cost of Tax, January 2016, pp. 4, 20, 23; ActewAGL, Appendix 5.01
Detailed response to rate of return, gamma and inflation, January 2016, pp. 41, 115, 125; AusNet Electricity Services,
Revised Regulatory Proposal, January 2016, pp. 7-84, 7-93, 7-107; United Energy, Response to AER Preliminary
Determination Re: Rate of return and gamma, January 2016, pp. 86, 94, 97; CitiPower, Revised Regulatory Proposal
2016-2020; January 2016, pp. 364, 372, 375; Jemena Electricity Networks, Attachment 6-1 Rate of return, gamma,
forecast inflation, and debt and equity raising costs, January 2016, pp. 92, 101, 104; Powercor, Revised Regulatory
Proposal 2016-2020, January 2016, pp. 358, 366, 369; Australian Competition Tribunal, Application by Public Interest
Advocacy Centre Ltd and Ausgrid [2016] ACompT 1, 26 February 2016, paras. 1048, 1090 and 1095. 179
For an example of the correct use of the term "upper bound" see John. C. Hull, Options Futures and other Derivatives,
Fourth Edition, 2000, p171.

4-46 Attachment 4 – Value of imputation credits | Final decision: Amadeus Gas Pipeline Access
Arrangement 2016–21
Issue Summary of response Section
poor and experts consider it to be unreliable. Lally
considers the tax statistic used by us is not an upper
bound.180
Implied market value studies
We should rely more on estimates of the
utilisation rate from implied market value studies
as they are direct evidence on the value of
imputation credits to investors.181
The Tribunal considered implied market value
studies are best placed to capture the
considerations investors make in determining
the utilisation rate (or the worth of imputation
credits to them).182
See response under 'Conceptual framework'.
Even when adjusted for the impacts of differential personal
taxation, we consider limited reliance should be placed on
the results of these studies. This is because these studies
have a range of limitations, including that they do not
clearly measure the utilisation value to long term investors.
We consider market value studies do not provide a post-
tax estimate of the utilisation rate unless they are
corrected for the impact of differential personal taxation on
capital gains and dividend income. Without this adjustment
they are inconsistent with the Officer framework.
4.4.1
A.15
We should rely exclusively on SFG's study,
which suggests a best estimate of 0.35 for the
utilisation rate183
See response to 'We should rely more on estimates of the
utilisation rate from implied market value studies'.
We do not consider it appropriate to rely exclusively on
implied market value studies (or SFG's single dividend
drop off study). Even if we were to rely solely on SFG's
study, we consider it does not support a gamma of 0.25.
This is because the estimate of the utilisation rate requires
an adjustment for factors that suggest investors value a
dollar of dividends at less than one dollar.
4.4
4.4.1
The use of implied market value studies to
estimate the utilisation rate (and thus gamma) is
consistent with the approach to estimating other
rate of return parameters.184
We disagree. See response under 'Conceptual
framework'.
A.8.2
A.15
180
M. Lally, Gamma and the ACT Decision, May 2016, p. 23. 181
United Energy, Submission on AER preliminary determination - Submission on gamma, 26 April 2016; Australian Gas
Networks, Attachment 11 Response to Draft Decision: Cost of Tax, January 2016, p. 13; ActewAGL, Appendix 5.01
Detailed response to rate of return, gamma and inflation, January 2016, pp. 41, 46; AusNet Electricity Services, Revised
Regulatory Proposal, January 2016, p. 7-85; United Energy, Response to AER Preliminary Determination Re: Rate of
return and gamma, January 2016, p. 86; CitiPower, Revised Regulatory Proposal 2016-2020; January 2016, pp. 364-365;
Jemena Electricity Networks, Attachment 6-1 Rate of return, gamma, forecast inflation, and debt and equity raising costs,
January 2016, pp. 92-93; Powercor, Revised Regulatory Proposal 2016-2020, January 2016, pp. 358-359; APNT, Access
Arrangement Revised Proposal to Draft Decision, January 2016, p. 93. 182
United Energy, Submission on AER preliminary determination - Submission on gamma, 26 April 2016; Australian
Competition Tribunal, Application by Public Interest Advocacy Centre Ltd and Ausgrid [2016] ACompT 1, 26 February
2016, paras. 1096. 183
SFG, An appropriate regulatory estimate of gamma, 21 May 2014, paras. 17 and 20; Frontier Economics, An appropriate
regulatory estimate of gamma, June 2015, p. 33. 184
Australian Gas Networks, Attachment 11 Response to Draft Decision: Cost of Tax, January 2016, p. 13; ActewAGL,
Appendix 5.01 Detailed response to rate of return, gamma and inflation, January 2016, p. 117; AusNet Electricity Services,
Revised Regulatory Proposal, January 2016, p. 7-85; United Energy, Response to AER Preliminary Determination Re:
Rate of return and gamma, January 2016, p. 87; CitiPower, Revised Regulatory Proposal 2016-2020; January 2016,
p. 365; Jemena Electricity Networks, Attachment 6-1 Rate of return, gamma, forecast inflation, and debt and equity raising
costs, January 2016, p. 93; Powercor, Revised Regulatory Proposal 2016-2020, January 2016, p. 359.

4-47 Attachment 4 – Value of imputation credits | Final decision: Amadeus Gas Pipeline Access
Arrangement 2016–21
Issue Summary of response Section
Under our conceptual approach to gamma, the
appropriate adjustment to the results of SFG's
study results in a gamma of 0.3. However, this
adjustment is not necessary because our
conceptual approach is incorrect.185
See response under 'Conceptual framework'.
We disagree and consider the Handley/Lally adjustment is
necessary.
4.4.1
A.15
Several of the limitations that we have identified
as applying to implied market value studies do
not apply to SFG's study, which has not been
assessed individually on its merits186
We consider the key limitations that apply to implied
market value studies also apply to SFG's study. A.15
Instead of adjusting the estimate of the
utilisation rate (theta) to correct for the apparent
incorrect valuation of cash dividends, the
appropriate response is not to adjust the theta
estimate. Rather it is to adjust the allowed return
on equity.187
We consider that such an adjustment to the allowed return
on equity would not be appropriate. The post-company tax
and pre-personal tax required return on the equities
market is reflective of the face value of dividends paid in
the market, not a higher amount. We also note the equities
market sets equilibrium prices based on the expected
post-tax returns to shareholders (post-tax dividends, post-
tax capital gains and post-tax imputation credits).
Other
There is an inconsistency between the
corporate income tax and the allowed rate of
return.188
We disagree. We discuss this in detail in section C.6 of
Attachment 3.
Source: AER analysis; service providers' revised proposals; Tribunal decisions.
We have also received a number of submissions on gamma from consumer representatives.
These are summarised below:
The CCP expressed a view that suggests we should take into account the
interrelationship with the corporate tax allowance when determining the value of
imputation credits.189 We address this in section 4.3.4.
185
Australian Gas Networks, Attachment 11 Response to Draft Decision: Cost of Tax, January 2016, pp. 4, 13, 22;
ActewAGL, Appendix 5.01 Detailed response to rate of return, gamma and inflation, January 2016, pp. 41,117,127;
AusNet Electricity Services, Revised Regulatory Proposal, January 2016, pp. 7-86, 7-94; United Energy, Response to AER
Preliminary Determination Re: Rate of return and gamma, January 2016, pp. 87, 95; CitiPower, Revised Regulatory
Proposal 2016-2020; January 2016, pp. 365, 373; Jemena Electricity Networks, Attachment 6-1 Rate of return, gamma,
forecast inflation, and debt and equity raising costs, January 2016, pp. 94, 103; Powercor, Revised Regulatory Proposal
2016-2020, January 2016, pp. 359, 367. 186
Australian Gas Networks, Attachment 11 Response to Draft Decision: Cost of Tax, January 2016, pp. 13-14, 20;
ActewAGL, Appendix 5.01 Detailed response to rate of return, gamma and inflation, January 2016, pp. 117-120, 125-12:
AusNet Electricity Services, Revised Regulatory Proposal, January 2016, pp. 7-86, 7-87, 7-93; United Energy, Response
to AER Preliminary Determination Re: Rate of return and gamma, January 2016, pp. 87, 88, 94; CitiPower, Revised
Regulatory Proposal 2016-2020; January 2016, pp. 365-366, 372; Jemena Electricity Networks, Attachment 6-1 Rate of
return, gamma, forecast inflation, and debt and equity raising costs, January 2016, pp. 94-95, 102; Powercor, Revised
Regulatory Proposal 2016-2020, January 2016, pp. 359-360, 366. 187
Frontier Economics, An appropriate regulatory estimate of gamma, June 2015, pp. 37–38. 188
HoustonKemp, A response to the Australian Energy Regulator Draft Decision on Australian Gas Networks AA2016
Revenue Reset, February 2016, p. 35. 189
CCP, Responding to NSW draft determinations and revised proposals from electricity distribution networks, February
2015, p. 49.

4-48 Attachment 4 – Value of imputation credits | Final decision: Amadeus Gas Pipeline Access
Arrangement 2016–21
The Public Interest Advocacy Centre (PIAC) submitted that the Australian Competition
Tribunal's decision in 2011 to rely on an estimate of the utilisation rate from the 2011
version of SFG's dividend drop off study should not be viewed as permanently
determinative.190 We agree with these comments in light of the Tribunal's finding that:191
Further, the Tribunal notes that estimation of a parameter such as gamma [the value
of imputation credits] is necessarily, and desirably, an ongoing intellectual and
empirical endeavour. Its decision in these proceedings is based on the material
before it.
PIAC also submitted that our draft decisions adequately set out the reasons for departing
from the value of imputation credits in the Guideline.192
The Energy Markets Reform Forum (EMRF) submitted that our estimates of the
utilisation and distribution rates are lower (and, therefore more favourable to service
providers) than those relevant to a pure play energy network (which is the benchmark
efficient entity for setting the rate of return).193 The EMRF also submitted that we should
consider actual industry practices when determining the value of imputation credits—for
example, the EMRF submitted that none of APA Group, Envestra Limited (pre-sale) or
JGN's parent company had balances in their franking accounts.194 To clarify, we have
interpreted and estimated the value of imputation credits consistently with Officer's 1994
paper and related literature, such as Monkhouse. Under this literature, the utilisation rate
is a market-wide parameter and the distribution rate is a firm specific parameter. We
estimate the utilisation rate on a market-wide basis. Although the distribution rate is a
firm specific parameter, we estimate it on a market-wide basis also and our reasons for
doing so are set out in the Guideline.195
The South Australian Council of Social Service (SACOSS) submitted, based on advice
received from the South Australian Centre for Economic Studies, that evidence was
emerging for a value of imputation credits lower than the 0.5 in the Guideline.196
SACOSS supported a value of imputation credits of at least 0.4. In a subsequent
submission on the AER's preliminary decision for SA Power Networks SACOSS
supported the AER's decision to use the lower estimate of gamma than in the rate of
return guideline, although noting its preferred estimate was for a gamma of 0.36.
190
PIAC, Moving to a new paradigm: submission to the Australian Energy Regulator’s NSW electricity distribution network
price determination, 8 August 2014, pp. 90–92; PIAC, A missed opportunity? Submission to the Australian Energy
Regulator’s draft determination for Ausgrid, Endeavour Energy and Essential Energy, 13 February 2015, p. 46. 191
Australian Competition Tribunal, Application by Energex Limited (Gamma) (No 5) [2011] ACompT 9, 12 May 2011, para.
45. 192
PIAC, A missed opportunity? Submission to the Australian Energy Regulator’s draft determination for Ausgrid, Endeavour
Energy and Essential Energy, 13 February 2015, pp. 19–20. 193
EMRF, NSW Electricity Distribution Revenue Reset, AER Draft Decision and revised proposals from Ausgrid, Endeavour
Energy and Essential Energy, A response, February 2015, pp. 31–32. 194
EMRF, NSW gas distribution revenue reset, Draft decision by the Australian Energy Regulator on Jemena’s Gas Networks
Access Arrangement, A response, March 2015, p. 71. 195
AER, Better regulation: Explanatory Statement Rate of Return Guideline, December 2013, pp. 163–164. 196
SACOSS, Submission to Australian Energy Regulator on SA Power Networks’ 2015 – 2020 Regulatory Proposal, January
2015, p. 21.
4-49 Attachment 4 – Value of imputation credits | Final decision: Amadeus Gas Pipeline Access
Arrangement 2016–21
However, given the AER is reporting gamma to one decimal place SACOSS
acknowledged that its preferred estimate of 0.36 concurs with the AER's estimate of 0.4
to one decimal place.197
The Energy Consumers Coalition of South Australia (ECCSA) considered that the
service providers (who had submitted regulatory proposals to us in 2014) submitted no
new evidence to change our conclusions in the Guideline regarding the value of
imputation credits.198 We set out in this decision how and why we have departed from the
Guideline. In a subsequent submission on the AER's preliminary decision the ECCSA
submitted that 'the AER has moved to a conservative position on the issue of gamma to
the detriment of consumers' and it appeared 'the AER has based its assessment on
lower utilisation and distribution rates than would otherwise be the case for a pure play
energy network which is the benchmark entity for setting the WACC.'199
In a submission on our draft decision for Australian Gas Networks, the ECCSA consider
that imposing an assumption that the benchmark entity would frank its dividend to the
market average is a conservative assumption.200 The AER considers that the benchmark
selected to estimate gamma is appropriate. In section A.9.2 and section A.10.1, the AER
considers that benchmark should be assessed holistically. Further, the ECCSA stated
that it is inappropriate to reward offshore investors in energy networks by providing extra
revenue when they have made a conscious decision to invest even though they gain no
benefit from imputation.201 In response, the AER considers that gamma and the return on
equity are estimated on a consistent basis.
The Queensland Council of Social Service (QCOSS) submitted a 'more even-handed
and consistent approach' would be a value of imputation credits of 0.5 as per the
Guideline.202 QCOSS had regard to a recent decision by the Queensland Competition
Authority for a value of 0.47. We set out in this decision why we consider 0.4 to be the
best estimate from within the range 0.3 to 0.5.
The Alliance of Electricity Consumers (the Alliance) employed a value of imputation
credits of 0.25 in its estimation of an efficient rate of return.203 However, the Alliance
provided no discussion or justification for the use of this estimate. Regardless, the
Alliance submitted that the appropriate rate of return was 3.76 per cent, which is less
than half the rate of return typically proposed by the service providers.
197
SACOSS, Submission to Australian Energy Regulator on SA Power Networks’ 2015 – 2020 AER Preliminary Decision
June 2015, p. 5. 198
ECCSA, SA Electricity Distribution Revenue Reset, SA PowerNetworks Application, A response, December 2014, pp. 80–
81. 199
ECCSA, SA Electricity Distribution Revenue Reset, The AER preliminary decision, A response, June 2015, p. 42. 200
ECCSA, A response to the Australian Energy Regulator Draft Decision on Australian Gas Networks AA2016 Revenue
Reset, February 2016, p. 35. 201
ECCSA, A response to the Australian Energy Regulator Draft Decision on Australian Gas Networks AA2016 Revenue
Reset, February 2016, p. 35. 202
QCOSS, Understanding the long term interests of electricity customers, Submission to the AER’s Queensland electricity
distribution determination 2015-2020, 30 January 2015, p. 81. 203
Alliance of Electricity Consumers, Submission on Ergon Energy’s Regulatory Proposal 2015-2020, 30 January 2015, p.
24.

4-50 Attachment 4 – Value of imputation credits | Final decision: Amadeus Gas Pipeline Access
Arrangement 2016–21
UnitingCare Australia supported our value for gamma, if a value for gamma is
necessary.204
204
Uniting Care Australia, Submission to the Australian Energy Regulator -Response to Electricity Distribution Business
Revised Regulatory Proposal from 2015–20 from SA Power Networks, and AER Preliminary Determination, July 2015, p.
29.

4-51 Attachment 4 – Value of imputation credits | Final decision: Amadeus Gas Pipeline Access
Arrangement 2016–21
A Value of imputation credits: Detailed analysis
In attachment 4, we set out our decision on the value of imputation credits (gamma)—which
is to adopt a value of 0.4—and our key reasons for that view. We also indicated the position
submitted to us by the service providers and briefly set out our consideration of that position.
In this appendix, we set out further supporting material for our decision on the value of
imputation credits. We also respond in more detail to the position submitted to us by the
service providers.
All of the service providers proposed a value of imputation credits of 0.25. The reasons
submitted by the service providers in their initial and revised proposals were largely the
same. The only new material that was submitted as part of the revised proposal was a
consultant report by Frontier Economics.205 The substance of this report is largely
unchanged from earlier expert material submitted by the service providers and considered in
our draft decisions. However, the Frontier Economics report has updated values for the
distribution rate and the tax statistics which are considered in this final decision.
In addition, as set out in section 4.1, the Australian Competition Tribunal (Tribunal) released
its decisions for a number of service providers on 26 February 2016. Following this, four
service providers filed late submissions in support of a value of imputation credits of 0.25,
referencing the recent Tribunal decisions in support of their position.206 Consistent with our
draft decision, in this final decision we have adopted a value of 0.4 for gamma. We remain of
the view 0.4 is appropriate having given careful consideration to all the material before us.
This includes the late submissions by a number of service providers, and a report we
commissioned from Dr Martin Lally (Lally) following the late submissions. However, given the
timing of the late submissions, we have had limited time to review the material.
This appendix is structured under the following headings:
expert views on the value of imputation credits
the value of imputation credits used by other regulators
previous Australian Competition Tribunal (Tribunal) considerations
key concerns of the service providers
the role of the value of imputation credits in the regulatory framework
the conceptual framework for the value of imputation credits
Professor Stephen Gray's (Gray's) comments on the conceptual framework
further issues relating to the utilisation rate
205
Frontier economics, The appropriate use of tax statistics when estimating gamma, January 2016. 206
United Energy, Submission on AER preliminary determination - Submission on gamma, 26 April 2016;
CitiPower/Powercor, Submission on implications of recent Australian Competition Tribunal Decision, 18 April 2016;
ActewAGL, Implication of recent Tribunal decisions for final decision and updates to the allowed rate of return and forecast
inflation estimate, 12 May 2016.

4-52 Attachment 4 – Value of imputation credits | Final decision: Amadeus Gas Pipeline Access
Arrangement 2016–21
estimation approach considerations
estimating the distribution rate
application of rate of return criteria to evidence on the utilisation rate
the equity ownership approach
tax statistics
the difference between equity ownership approach and tax statistics
implied market value studies.
A.1 Expert views on the value of imputation credits
We, other regulators, service providers and consumer representatives have commissioned
expert advice on the value of imputation credits from a range of experts in the context of a
number of regulatory processes. These expert reports demonstrate that there is no
consensus among experts on either the value of imputation credits (particularly for the
utilisation rate parameter), nor on the techniques to estimate it. Table 4-6 summarises recent
expert advice of which we are aware. We have considered the advice from each of these
experts in forming our position on the value of imputation credits. For this final decision we
have considered the new expert report from the service providers.207 We have also
commissioned further expert advice from Lally following late submissions by a number of
service providers.208 We consider the new expert report from the service providers do not
provide new evidence to justify a departure from the position we adopted in the decisions we
released in October and November 2015.
Table 4-6 Summary of expert views on the value of imputation credits
Expert Distribution rate Utilisation rate Value of imputation credits
Lally (2016)209
At least 0.83 using the financial
statements of 20 largest ASX-
listed companies
At least 0.6, using the all equity
estimate of local equity
ownership
At least 0.5
Lally (2013a,
2013b, 2014)210
0.84 using the financial
statements of 20 largest ASX-
listed companies
1.0, based on assumption that
all investors in the Officer CAPM
are domestic investors
0.54 to 0.7, using equity
ownership as second preference
0.84
0.45 to 0.59 using second
preference utilisation rate
207
Frontier, The appropriate use of tax statistics when estimating gamma, January 2016. 208
M. Lally, Gamma and the ACT Decision, May 2016. 209
M. Lally, Gamma and the ACT Decision, May 2016, p. 6. 210
M. Lally, The estimation of gamma, 23 November 2013; M. Lally, Estimating gamma, 25 November 2013; M. Lally, Review
of submissions to the QCA on the MRP, risk-free rate and gamma, 12 March 2014.

4-53 Attachment 4 – Value of imputation credits | Final decision: Amadeus Gas Pipeline Access
Arrangement 2016–21
Expert Distribution rate Utilisation rate Value of imputation credits
McKenzie and
Partington
(2013)211
0.7, using cumulative payout
ratio approach over all equity
None recommended, although
estimates considered included
0.7 from AER draft rate of return
Guideline approach, 0.53 from
average of implied market value
studies and 0.83 from average of
McKenzie and Partington's
implied market value studies
Evidence not compelling enough
to depart from 0.5
Handley (2014)212
0.8, using cumulative payout
ratio approach over only listed
equity
0.5 to 0.6, with regard to (in
order of importance) equity
ownership approach, tax
statistics and dividend drop off
studies
0.4 to 0.5
SACES (2015)213
0.8, using cumulative payout
ratio approach over only listed
equity
0.45, using the average of the
estimate from tax statistics
(0.43) and the refined domestic
ownership share of only listed
equity (0.46)
0.36
CEG (2014)214
0.7, using cumulative payout
ratio approach over all equity
0.35, based on SFG's dividend
drop off study 0.25
Gray (for SFG)
(2015)215
0.7, using cumulative payout
ratio approach over all equity
0.35, based on SFG's dividend
drop off study 0.25
Gray (for Frontier)
(2015)216
0.7, using cumulative payout
ratio approach over all equity, or
alternatively using an estimate of
the payout ratio for listed equity
excluding the 20 largest firms.
0.35, based on SFG's dividend
drop off study 0.25
Source: As specified in table.
In summary:
A distribution rate of 0.7 estimated using the cumulative payout ratio approach is most
commonly accepted. We describe this approach in section A.10.2. However, Handley
considers that this approach should be applied to only listed equity, and this produces a
higher estimate of the distribution rate. The South Australian Centre for Economic
Studies (SACES) accepts Handley's approach. Lally considers consistency between the
distribution rate and utilisation rate is not essential (but nor is it precluded). Lally
211
M. McKenzie and G. Partington, Report to the Queensland Resources Council: Review of Aurizon Network’s draft access
undertaking, 5 October 2013. 212
J. Handley, Report prepared for the Australian Energy Regulator: Advice on the value of imputation credits, 29 September
2014. 213
SA Centre for Economic Studies (2015), Independent estimate of the WACC for SA Power Networks 2015 to 2020: Report
commissioned by the SA Council of Social Services, January 2015. 214
CEG, WACC estimates: A report for NSW DNSPs, May 2014. 215
SFG, Estimating gamma for regulatory purposes, February 2015. 216
Frontier Economics, An appropriate regulatory estimate of gamma, June 2015 and Frontier, The appropriate use of tax
statistics when estimating gamma, January 2016.

4-54 Attachment 4 – Value of imputation credits | Final decision: Amadeus Gas Pipeline Access
Arrangement 2016–21
considers the best estimate of the distribution rate for a benchmark efficient entity is
0.83, calculated using the financial statements of the 20 largest ASX-listed companies.
There is no widely accepted utilisation rate or method for estimating it. The
recommended values for the utilisation rate range from 0.35 to 1.0.
Only CEG, SFG, and Gray (for SFG and Frontier), rely exclusively on the SFG dividend
drop off study when estimating the utilisation rate. Handley and McKenzie and Partington
rely on a range of evidence. SACES gives equal weight to the equity ownership
approach and tax statistics. Lally prefers a conceptual approach, but his second
preference is the equity ownership approach.
As a result of the differing approaches, particularly to the utilisation rate, the range of
estimates of the value of imputation credits is 0.25 to 0.83.
Conceptually, the value of imputation credits must be between 0 and 1. Accordingly, the
range of recommended estimates from 0.25 to 0.83, which spans most of the possible range
for the value of imputation credits, highlights the lack of consensus among experts. Our final
decision value of imputation credits of 0.4 sits in the lower half of the range recommended by
experts, which is more favourable to service providers.
A.2 The value of imputation credits used by other regulators
Australian regulators have applied a wide range of approaches to estimate the value of
imputation credits, resulting in varied outcomes. Table 4-7 summarises some recent
regulatory decisions on the value of imputation credits. While these decisions have not
directly informed our position on the value of imputation credits, they indicate that there is no
conceptual or practical consensus amongst Australian regulators.
Table 4-7 Australian regulators' approaches to the value of imputation
credits
Regulator Form of adoption Year Distribution rate Utilisation rate Value of imputation
credits
IPART217
Review of imputation
credits, final decision 2012
0.7, using cumulative
payout ratio approach
0.35, using 2011
version of SFG
dividend drop off study
0.25
217
Independent Pricing and Regulatory Tribunal, Review of imputation credits (gamma), Research—Final decision, March
2012.

4-55 Attachment 4 – Value of imputation credits | Final decision: Amadeus Gas Pipeline Access
Arrangement 2016–21
Regulator Form of adoption Year Distribution rate Utilisation rate Value of imputation
credits
ESC218
Price review, greater
metropolitan water
businesses, final
decision
2013 N/A N/A 0.5, based on 2011
guidance219
QCA220
Cost of capital market
parameters, final
decision
2014
0.84, using the
financial statements
of 20 largest ASX-
listed companies
0.56, based primarily
on the domestic
ownership share of
listed equity
0.47
ERA221
Review of rate of
return estimation for
rail networks, revised
draft determination
2014 0.7, using cumulative
payout ratio approach
0.7, most weight to
simple domestic
ownership share of all
equity, some weight to
conceptual goalposts
approach, low weight to
tax statistics and
dividend drop off
studies
0.5
ACCC222
Fixed line services
(telecommunications),
draft decision on
access determination
2015 N/A N/A
0.45, set for
consistency with
previous ACCC
decisions, but with
regard to a range of
recent evidence,
including firm specific
factors
Source: As specified in table.
Conceptually, the value of imputation credits must be between 0 and 1. The range of values
adopted by Australian regulators is from 0.25 to 0.5. This range is narrower than the range of
estimates recommended by experts (from 0.25 to 0.84), but it is still quite wide. This
highlights the lack of consensus among regulators on the value of imputation credits. Given
218
Essential Services Commission, Price Review 2013: Greater Metropolitan Water Businesses, Final decision, June 2013. 219
Essential Services Commission, 2013 Water Price Review, Guidance on Water Plans, October 2011, p. 66. The Essential
Services Commission also proposes to continue to apply a value of imputation credits of 0.5 to Melbourne Water's 2016
price review: Essential Services Commission, Proposed approach to Melbourne Water's 2016 price review—Consultation
paper, February 2015, p. 40. 220
Queensland Competition Authority, Cost of capital: Market parameters, August 2014. 221
Economic Regulation Authority, Review of the method for estimating the weighted average cost of capital for regulated
railway networks, Revised draft decision, 28 November 2014. 222
Australian Competition and Consumer Commission, Public inquiry into final access determinations for fixed line services—
primary price terms, Draft decision, March 2015. We note that this estimate is based on the ACCC's draft decision on the
fixed line services supplied by Telstra (ACCC, Public inquiry into final service determinations for fixed line services—
Primary price terms: Draft decision, March 2015, p. 101). The ACCC released its final decision on 9 October 2015, which
maintained its value for imputation credits estimate of 0.45 (ACCC, Public inquiry into final service determinations for fixed
line services: Final decision, October 2015, p. 67). However, we consider information up to the end of July 2015 for the
SA/Qld DNSPs and the end of August 2015 for the Victorian service providers and the 2015 gas network service providers
in estimating the MRP. This is reasonably consistent with these NSPs' risk free rate averaging periods. Therefore, to be
consistent with the estimation of the required return on equity, we do not include the ACCC's final decision in our analysis.

4-56 Attachment 4 – Value of imputation credits | Final decision: Amadeus Gas Pipeline Access
Arrangement 2016–21
the lack of consensus among experts, this is perhaps not surprising. Our final decision value
of imputation credits of 0.4 sits within the range adopted by regulators.
A.3 Previous Australian Competition Tribunal considerations
The Australian Competition Tribunal has considered in detail the value of imputation credits
(gamma) in four proceedings since 2010, relating to applications by:
ActewAGL Distribution, Ausgrid, Endeavour Energy, Essential Energy and Jemena Gas
Networks
Energex Limited
DBNGP (WA) Transmission Pty Ltd, and
WA Gas Networks Pty Ltd.
The Tribunal's comments in each case referred to the lack of expert consensus regarding
the value of imputation credits and the scope that existed for future assessments of the
evidence. We discuss these comments further in the sections below.
A.3.1 ActewAGL Distribution, Ausgrid, Endeavour Energy,
Essential Energy and Jemena Gas Networks
In April and June 2015 we released our final decisions for ActewAGL Distribution, Ausgrid,
Endeavour Energy, Essential Energy and Jemena Gas Networks. In these decisions, we
adopted a gamma estimate of 0.4.
ActewAGL Distribution, Ausgrid, Endeavour Energy, Essential Energy and Jemena Gas
Networks successfully sought review of these final decisions by the Australian Competition
Tribunal.223 The Tribunal set aside our decisions and has remitted the matter back to us to
remake the decision using a gamma value of 0.25. The Tribunal considered the appropriate
distribution rate to use is 0.7 based on a value from all equity. It also considered it was
appropriate to use market based studies to solely estimate the value of distributed
imputation credits (also known as the utilisation rate, or theta).
In reaching its position, the Tribunal expressed views on the important factors in its
decisions. The Tribunals views and our initial response is summarised in Table 4-8 below.
However, we note that at this time, we have not completed the remittal of our final decisions
for the above-mentioned service providers.
223
See for example, Australian Competition Tribunal, Application by Public Interest Advocacy Centre Ltd and Ausgrid [2016]
ACompT 1, 26 February 2016. The Tribunal gave similar reasoning in its decisions for applications by the other service
providers.

4-57 Attachment 4 – Value of imputation credits | Final decision: Amadeus Gas Pipeline Access Arrangement 2016–21
Table 4-8 Australian Competition Tribunal's observations on imputation credits in ActewAGL Distribution, Ausgrid,
Endeavour Energy, Essential Energy and Jemena Gas Networks matter
Issue Tribunal comments AER initial comments
The conceptual framework
for gamma
By placing most reliance on the equity ownership approach and effectively defining the
utilisation value as the proportion of distributed imputation credits available for
redemption, the AER has adopted a conceptual approach to gamma that redefines it as
the value of imputation credits that are available for redemption.224
This is inconsistent
with the concept of gamma in the Officer Framework for the WACC which underlines
the Rules, and with the objective of ensuring a market rate of return on equity by
making an adjustment to the revenue allowance for taxation to account for imputation
credits.225
It did not accept the AER's approach that imputation credits are values at their
claimable amount or face value. The value is not what can be claimed or utilised, but
what is claimed or utilised as demonstrated by the behaviour of the shareholder
recipients of the imputation credits.226
Handley's extension of the Officer Framework does not appear to present an empirically
robust and internally consistent explanation for the link between the existence of
imputation credits and the applicability of the vanilla WACC.227
In developing the Guideline, we re-evaluated the conceptual framework for
the value of imputation credits in consultation with stakeholders. In making
this final decision, we have built on this re-evaluation. We discuss the role
of the value of imputation credits and the underlying conceptual framework
in sections A.5 and A.6.
We consider the face value of imputation credits is the most appropriate
measure and is consistent with the Officer framework. We consider it uses
market values only where it is appropriate to do so and some other
parameters used by us are also based on face values. For instance, when
estimating the MRP we use the face value of dividends. Similarly, when
estimating the yield to maturity for the return on debt and the risk free rate,
the face value of the coupon payment and the face value of the principal is
used.
The Officer framework is based on a post-company tax and pre-personal
tax framework. In order to be consistent with the Officer framework, all
parameters need to be estimated on a pre-personal tax basis. The face
value of imputation credits, dividends and debt coupon payments are the
pre-personal tax values as personal tax rates are levied on these values.
Similarly, the returns calculated from the market values of equity prices
and debt prices are pre-personal tax values as the personal capital gains
tax is levied on these returns.
However, the dividend drop off imputation credit estimate is neither a pre-
personal tax nor a post-personal tax estimate. As a result, this estimate
(absent adjustment) cannot be used at all in our regulatory context as it is
224
Australian Competition Tribunal, Application by Public Interest Advocacy Centre Ltd and Ausgrid [2016] ACompT 1, 26 February 2016, para. 1100. 225
Australian Competition Tribunal, Application by Public Interest Advocacy Centre Ltd and Ausgrid [2016] ACompT 1, 26 February 2016, para. 1100. 226
Australian Competition Tribunal, Application by Public Interest Advocacy Centre Ltd and Ausgrid [2016] ACompT 1, 26 February 2016, para. 1081. 227
Australian Competition Tribunal, Application by Public Interest Advocacy Centre Ltd and Ausgrid [2016] ACompT 1, 26 February 2016, para. 1076.

4-58 Attachment 4 – Value of imputation credits | Final decision: Amadeus Gas Pipeline Access Arrangement 2016–21
Issue Tribunal comments AER initial comments
inconsistent with the post-tax Officer framework. This is further discussed
in section A.15.3.
The distribution rate (payout
ratio)
There is insufficient explanation for introducing the distribution rate for only listed
equity.228
As discussed in section 4.4 of attachment 4 and section A.10 of this
appendix, we consider the use of a distribution rate for listed equity is open
to us and reasonably reflective of a benchmark efficient entity given the
difficulties associated with choosing a representative dataset.229
Lally also
recommends distribution rate based on listed equity for a benchmark
efficient entity, although he estimates this using financial statements of the
top 20 listed firms.230
As discussed in section 4.4 of attachment 4 and section A.9.2 of this
appendix, following Lally's latest report, we consider it is not essential to
'match' estimates of distribution rates and utilisation rates based on the
dataset used; although we note the choice is open to us.231
While we
primarily rely on 'matched' estimates, we also have regard to Lally's
preferred estimate based on an all equity utilisation rate from the equity
ownership approach and a distribution rate for listed equity from financial
reports of the top 20 listed firms.232
Equity ownership approach
To the extent that the equity ownership approach indicates that theta is above the
amount specified through tax statistics, it is apparent that there are investors who the
AER assume are eligible to redeem imputation credits but, for whatever reasons, either
cannot redeem them or attribute so little value to the credits that they do not utilise
them.233
There are investors who hold shares for less than 45 days. The issue is not whether
such a class exists, but the size of that class and the extent to which the value of
We consider the equity ownership approach remains the best method to
estimate the utilisation rate. We do not consider the difference between
the equity ownership approach and tax statistics is due to the 45 day
holding rule and Lally, in his recent report, agrees with this.237
Instead, we
consider the difference in the utilisation rate is likely driven by the
unreliability in the taxation data underlying the tax statistics estimate. Lally,
in his recent report, considers the most obvious explanation for the
difference is the estimate of the redemption rate from tax statistics used by
228
Australian Competition Tribunal, Application by Public Interest Advocacy Centre Ltd and Ausgrid [2016] ACompT 1, 26 February 2016, para. 1106. 229
See M. Lally, Gamma and the ACT Decision, May 2016, pp. 24–25. 230
M. Lally, Gamma and the ACT Decision, May 2016, pp. 26, 28–29. 231
M. Lally, Gamma and the ACT Decision, May 2016, pp. 25–26, 28–29. 232
M. Lally, Gamma and the ACT Decision, May 2016, pp. 5–6, 24–26, 29. 233
Australian Competition Tribunal, Application by Public Interest Advocacy Centre Ltd and Ausgrid [2016] ACompT 1, 26 February 2016, para. 1090.

4-59 Attachment 4 – Value of imputation credits | Final decision: Amadeus Gas Pipeline Access Arrangement 2016–21
Issue Tribunal comments AER initial comments
imputation credits is lower as a result of domestic shareholders being unable to use
them.234
The equity ownership approach overstates the redemption rates and would only be
useful a further check on other estimates.235
The AER's equity ownership and tax statistics approaches makes no attempt to assess
the value of imputation credits to shareholders and ignores the likely existent of factors,
such as the 45 day rule, which, across all eligible shareholders, reduce the value of
imputation credits to those shareholders below the "face" value assumed by the AER.
As a result, these approaches are inconsistent with a proper interpretation of the Officer
Framework underlying 2 .5.3 of the NEL.236
the AER is too low.238
However we note that, regardless of any issues of
taxation data reliability, an estimate of gamma of approximately 0.4 is
obtained when combining a utilisation rate of 0.48 (consistent with FAB
data) with Lally's preferred estimate of the distribution rate for a
benchmark efficient entity of 0.83.239
We remain of the view that the 45 day rule does not have a material
impact on the utilisation rate. This is supported by Lally.240
We have not
been presented with any data that would suggest the 45 day rule is having
any impact on the utilisation of imputation credits.
We consider that on a pre-personal tax basis, investors that are eligible to
receive imputation credits value them at their full face value. A dollar face
value of imputation credits reduces eligible investor's tax liabilities by one
dollar. The face value of the imputation credit is the pre-personal tax value
of the imputation credit.
Tax statistic estimates
Tax statistics can only provide an upper bound on the estimate of theta.241
The value of theta produced by taxation statistics is evidence that Australian investors
do not value imputation credits at their face value, because they may be unable to use
them.242
The ATO data relied by Hathaway has since been acknowledged by Hathaway to be of
some concern.243
Handley advised that his previous comments regarding the use of tax
statistics being an 'upper bound' were misinterpreted in these proceedings.
Handley confirmed that tax statistics can be used to produce a point
estimate of the utilisation rate. We discussed Handley's views in section
A.6.1 of the draft/preliminary decisions. We discuss the use of tax statistics
more broadly in section A.13 of this appendix.
Lally advised that the correct tax statistic is upward biased as it is
expected local investors would tilt their shareholding towards stock with
237
M. Lally, Gamma and the ACT Decision, May 2016, pp. 19-20. 234
Australian Competition Tribunal, Application by Public Interest Advocacy Centre Ltd and Ausgrid [2016] ACompT 1, 26 February 2016, paras. 1048 and 1090. 235
Australian Competition Tribunal, Application by Public Interest Advocacy Centre Ltd and Ausgrid [2016] ACompT 1, 26 February 2016, para. 1093. 236
Australian Competition Tribunal, Application by Public Interest Advocacy Centre Ltd and Ausgrid [2016] ACompT 1, 26 February 2016, para. 1095. 238
M. Lally, Gamma and the ACT Decision, May 2016, p. 4. 239
M. Lally, Gamma and the ACT Decision, May 2016, p. 5. 240
M. Lally, Gamma and the ACT Decision, May 2016, pp. 20-21. 241
Australian Competition Tribunal, Application by Public Interest Advocacy Centre Ltd and Ausgrid [2016] ACompT 1, 26 February 2016, paras. 1048, 1090 and 1095. 242
Australian Competition Tribunal, Application by Public Interest Advocacy Centre Ltd and Ausgrid [2016] ACompT 1, 26 February 2016, para. 1092. 243
Australian Competition Tribunal, Application by Public Interest Advocacy Centre Ltd and Ausgrid [2016] ACompT 1, 26 February 2016, para. 1092.

4-60 Attachment 4 – Value of imputation credits | Final decision: Amadeus Gas Pipeline Access Arrangement 2016–21
Issue Tribunal comments AER initial comments
high imputation credit yields. However, he considers that given the
taxation data reliability issues and the fact that we select the lower of the
two possible tax statistic estimates (0.45 vs. 0.62), the tax statistic
estimate we use (updated to 0.48 in this decision) is not an upper
bound.244
Ultimately, we consider any uncertain estimate is not an upper
bound. Moreover, even if we do use an estimate of the utilisation rate of
0.48 from tax statistics (consistent with FAB data), this results in an
estimate for gamma of approximately 0.4 when combined with Lally's
preferred distribution rate of 0.83 for a benchmark efficient entity.
Having regard to the potential data limitations and alternate estimates, the
evidence from tax statistics is not inconsistent with the evidence from the
equity ownership approach, but we place less reliance upon it.
We do not consider the utilisation rate produced by taxation statistics is
evidence that Australian investors do not value imputation credits at their
face value. Rather we consider the evidence demonstrates there are
potential data reliability issues with tax statistics. The Tribunal itself has
acknowledged concerns with the ATO data.245
The conceptual basis for
dividend drop off studies
Of the various methodologies for estimating gamma employed by the AER, market
value studies are best placed to capture the considerations that investors make in
determining the worth of imputation credits to them.246
The AER could have excluded earlier market based studies that were not relevant, such
as the studies that were conducted on pre 2000 data.247
That the econometric issues identified in market based studies is at odds with the
AER's reliance on economic modelling in other aspects of its determinations.248
The best estimate derived by the updated SFG study is 0.35 and it is incorrect for the
AER to adjusted the SFG study for factors, such as differential personal taxes and
The limitations of dividend drop off studies have been widely identified—
we provide a selection of comments from academics and regulators in
section A.15 and 4.4.1. Moreover, both Handley and Lally advised that
other approaches to estimating the utilisation rate should be preferred.
Handley and Lally also advised that, without adjustment, dividend drop off
studies produce downwards-biased estimates of the utilisation rate.
The issue with dividend drop off estimates of the utilisation rate (or value)
is that they do not produce a post-tax (pre-personal tax) estimate and
therefore do not produce estimates consistent with the Officer post-tax
framework. The dividend drop off estimate is influenced by differential
244
M. Lally, Gamma and the ACT Decision, May 2016, pp. 19-20. 245
Australian Competition Tribunal, Application by Public Interest Advocacy Centre Ltd and Ausgrid [2016] ACompT 1, 26 February 2016, para. 1092. 246
Australian Competition Tribunal, Application by Public Interest Advocacy Centre Ltd and Ausgrid [2016] ACompT 1, 26 February 2016, para. 1096. 247
Australian Competition Tribunal, Application by Public Interest Advocacy Centre Ltd and Ausgrid [2016] ACompT 1, 26 February 2016, para. 1092. 248
Australian Competition Tribunal, Application by Public Interest Advocacy Centre Ltd and Ausgrid [2016] ACompT 1, 26 February 2016, para. 1052.
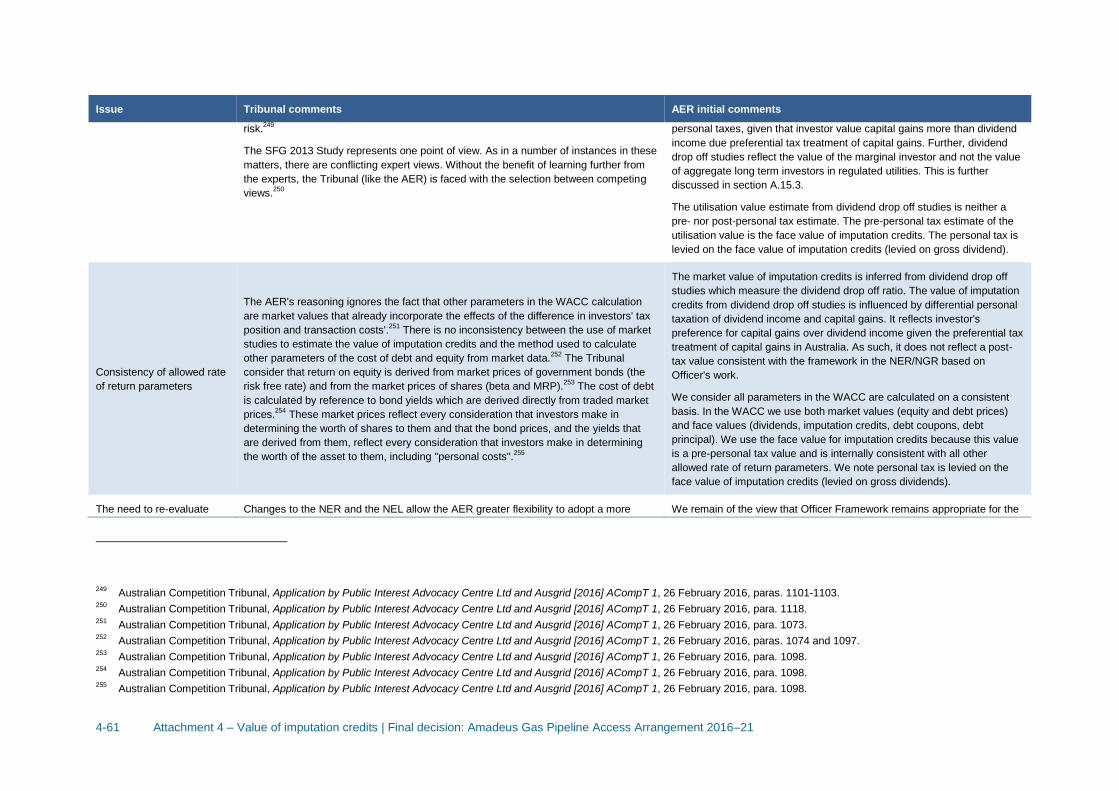
4-61 Attachment 4 – Value of imputation credits | Final decision: Amadeus Gas Pipeline Access Arrangement 2016–21
Issue Tribunal comments AER initial comments
risk.249
The SFG 2013 Study represents one point of view. As in a number of instances in these
matters, there are conflicting expert views. Without the benefit of learning further from
the experts, the Tribunal (like the AER) is faced with the selection between competing
views.250
personal taxes, given that investor value capital gains more than dividend
income due preferential tax treatment of capital gains. Further, dividend
drop off studies reflect the value of the marginal investor and not the value
of aggregate long term investors in regulated utilities. This is further
discussed in section A.15.3.
The utilisation value estimate from dividend drop off studies is neither a
pre- nor post-personal tax estimate. The pre-personal tax estimate of the
utilisation value is the face value of imputation credits. The personal tax is
levied on the face value of imputation credits (levied on gross dividend).
Consistency of allowed rate
of return parameters
The AER's reasoning ignores the fact that other parameters in the WACC calculation
are market values that already incorporate the effects of the difference in investors' tax
position and transaction costs'.251
There is no inconsistency between the use of market
studies to estimate the value of imputation credits and the method used to calculate
other parameters of the cost of debt and equity from market data.252
The Tribunal
consider that return on equity is derived from market prices of government bonds (the
risk free rate) and from the market prices of shares (beta and MRP).253
The cost of debt
is calculated by reference to bond yields which are derived directly from traded market
prices.254
These market prices reflect every consideration that investors make in
determining the worth of shares to them and that the bond prices, and the yields that
are derived from them, reflect every consideration that investors make in determining
the worth of the asset to them, including "personal costs".255
The market value of imputation credits is inferred from dividend drop off
studies which measure the dividend drop off ratio. The value of imputation
credits from dividend drop off studies is influenced by differential personal
taxation of dividend income and capital gains. It reflects investor's
preference for capital gains over dividend income given the preferential tax
treatment of capital gains in Australia. As such, it does not reflect a post-
tax value consistent with the framework in the NER/NGR based on
Officer's work.
We consider all parameters in the WACC are calculated on a consistent
basis. In the WACC we use both market values (equity and debt prices)
and face values (dividends, imputation credits, debt coupons, debt
principal). We use the face value for imputation credits because this value
is a pre-personal tax value and is internally consistent with all other
allowed rate of return parameters. We note personal tax is levied on the
face value of imputation credits (levied on gross dividends).
The need to re-evaluate Changes to the NER and the NEL allow the AER greater flexibility to adopt a more We remain of the view that Officer Framework remains appropriate for the
249
Australian Competition Tribunal, Application by Public Interest Advocacy Centre Ltd and Ausgrid [2016] ACompT 1, 26 February 2016, paras. 1101-1103. 250
Australian Competition Tribunal, Application by Public Interest Advocacy Centre Ltd and Ausgrid [2016] ACompT 1, 26 February 2016, para. 1118. 251
Australian Competition Tribunal, Application by Public Interest Advocacy Centre Ltd and Ausgrid [2016] ACompT 1, 26 February 2016, para. 1073. 252
Australian Competition Tribunal, Application by Public Interest Advocacy Centre Ltd and Ausgrid [2016] ACompT 1, 26 February 2016, paras. 1074 and 1097. 253
Australian Competition Tribunal, Application by Public Interest Advocacy Centre Ltd and Ausgrid [2016] ACompT 1, 26 February 2016, para. 1098. 254
Australian Competition Tribunal, Application by Public Interest Advocacy Centre Ltd and Ausgrid [2016] ACompT 1, 26 February 2016, para. 1098. 255
Australian Competition Tribunal, Application by Public Interest Advocacy Centre Ltd and Ausgrid [2016] ACompT 1, 26 February 2016, para. 1098.

4-62 Attachment 4 – Value of imputation credits | Final decision: Amadeus Gas Pipeline Access Arrangement 2016–21
Issue Tribunal comments AER initial comments
gamma sophisticated approach to the cost of capital than previously envisaged by the NER and
the NEL.256
It is appropriate that the AER should use that additional flexibility to seek
advice on alternatives to the Officer Framework that better define the impact of
imputation credits on the cost of capital.257
Suggested that given the New Zealand High Court decision financial modelling may not
yet have produced a workable version of a CAPM that incorporates a generalised
treatment of imputation credits, in which case the AER would necessarily have to make
judgements about whether and how to modify the methodology in the RoR Guidelines
for factors subsequently raise in advice it received from experts.258
Experts present no consistently coherent CAPM framework for the assessment of the
components of the cost of capital. There are models with disputed applicability which
may or may not be consistent with the application of a vanilla WACC.259
current final decisions. We consider our application of the Officer
Framework will lead to an overall rate of return (inclusive of the value of
imputation credits) that is commensurate with the efficient financing costs
of a benchmark efficient entity in the provision of regulated services. I
Source: As specified in table.
256
Australian Competition Tribunal, Application by Public Interest Advocacy Centre Ltd and Ausgrid [2016] ACompT 1, 26 February 2016, para. 1083. 257
Australian Competition Tribunal, Application by Public Interest Advocacy Centre Ltd and Ausgrid [2016] ACompT 1, 26 February 2016, para. 1084. 258
Australian Competition Tribunal, Application by Public Interest Advocacy Centre Ltd and Ausgrid [2016] ACompT 1, 26 February 2016, para. 1088. 259
Australian Competition Tribunal, Application by Public Interest Advocacy Centre Ltd and Ausgrid [2016] ACompT 1, 26 February 2016, para. 1084.

4-63 Attachment 4 – Value of imputation credits | Final decision: Amadeus Gas Pipeline Access
Arrangement 2016–21
A.3.2 Energex
In our 2009 industry wide review of rate of return parameters (the 2009 WACC review), we
adopted a gamma of 0.65.260 In 2009, we applied this value in the Queensland and South
Australian electricity distribution determinations. Energex and Ergon successfully sought
review of this decision by the Australian Competition Tribunal. The Tribunal set the
distribution rate to 0.7 and initiated a dividend drop off study from SFG to estimate the
utilisation rate. The Tribunal adopted SFG's recommendation that the utilisation rate be set
at 0.35. This resulted in a gamma of 0.25.
In reaching its position, the Tribunal expressed views on the important factors in its
decisions. This included areas where the Tribunal felt its understanding was incomplete, as
summarised in Table 4-9 below. We have carefully considered these views.
260
AER, Final decision: Electricity transmission and distribution network service providers, Review of the weighted average
cost of capital (WACC) parameters, 1 May 2009.

4-64 Attachment 4 – Value of imputation credits | Final decision: Amadeus Gas Pipeline Access Arrangement 2016–21
Table 4-9 Australian Competition Tribunal's observations on imputation credits in Energex matter
Issue Tribunal comments AER comments
The conceptual framework
for gamma
"The Tribunal has found some deficiencies in its understanding of the foundations of the
task facing it, and the AER, in determining the appropriate value of gamma. These
issues have not been explored so far because they have not arisen between the
parties, who appear to be in agreement about how the Rules should be interpreted
regarding the treatment of corporate income tax. They may be matters that the Tribunal
will take up in its further decision in these matters; or they may best be left until the next
WACC review. Indeed, they may go to the basis for the Rules themselves.
The Tribunal would be assisted in its consideration of the issues before it if the AER
were to provide relevant extrinsic material explaining:
(a) the rationale for including the gamma component in the formula for calculating the
estimated cost of corporate income tax; and
(b) how it relates to the rest of the building blocks, especially the rate of return (cl
6.4.3(a) and cl 6.5.2(b) of the Rules)."261
In developing the Guideline, we re-evaluated the conceptual framework for
the value of imputation credits. In making this final decision, we have built
on this re-evaluation. We discuss the role of the value of imputation credits
and the underlying conceptual framework in sections A.5 and A.6.
Also see our response above in section A.3.1 under ' The conceptual
framework for gamma'.
The distribution rate (payout
ratio)
"…there is [was] no empirical evidence currently available supporting a distribution ratio
higher than 0.70."262
As discussed in section A.10 of this appendix, we consider that a
distribution rate of 0.7 across all equity and a distribution rate of 0.77 for
listed equity is appropriate for a benchmark efficient entity. Lally also finds
a distribution rate of 0.83 for listed equity estimated from financial reports
of the largest 20 listed companies.
Also see our response above in section A.3.1 under 'The distribution rate
(payout ratio)'.
Tax statistic estimates "The AER accepted that utilisation rates derived from tax statistics provide an upper
bound on possible values of theta. Setting aside the manner in which the AER derived a
value from the tax statistics study, it correctly considered that information from a tax
Handley advised that his previous comments regarding the use of tax
statistics being an 'upper bound' were misinterpreted in these proceedings.
Handley confirmed that tax statistics can be used to produce a point
261
Australian Competition Tribunal, Application by Energex Limited (No 2) [2010] ACompT 7, October 2010, paras. 149–150. 262
Australian Competition Tribunal, Application by Energex Limited (Distribution Ratio (Gamma)) (No 3) [2010] ACompT 9, December 2010, para. 2.

4-65 Attachment 4 – Value of imputation credits | Final decision: Amadeus Gas Pipeline Access Arrangement 2016–21
Issue Tribunal comments AER comments
statistics study was relevant. However, its relevance could only be related to the fact
that it was an upper bound. No estimate that exceeded a genuine upper bound could be
correct. Thus the appropriate way to use the tax statistics figure was as a check."263
"SIRCA’s March 2011 report provided responses to a number of specific questions
asked by the AER. Some of these responses raise serious issues regarding the use of
dividend drop-off studies and the Tribunal’s earlier reasons. For example, SIRCA’s
March 2011 report suggests that:
- estimates from dividend drop-off studies are very imprecise and of questionable
reliability;
- such studies are likely to produce downwardly-biased estimates of theta; and
- taxation studies do not give an upper bound to theta.
By way of background, the Tribunal in earlier reasons noted that the AER accepted that
tax statistics studies provide an upper bound on possible values of theta. The AER in its
report, while being less unequivocal than SIRCA, adopts SIRCA’s suggestion that the
results of tax statistics studies (now called the redemption rate) could be discounted for
factors such as the time between the distribution and the redemption of imputation
credits. These adjustments “would need to be made on an economically justifiable
basis”. The AER referred to a 2004 study by Hathaway and Officer as being an
example of such a use of an estimate of the utilisation rate.
Beyond these observations, the AER does not seek to adduce material from SIRCA’s
March 2011 report to advance its submissions. On the material before it, the Tribunal is
unable to reach any conclusions about the further use of tax statistics studies in
estimating the utilisation ratio, theta. No doubt the AER will in the future have
opportunity, and perhaps cause, to investigate further. It has not sought to do so in
these proceedings."264
estimate of the utilisation rate. We discussed Handley's views in section
A.6.1 of our draft/preliminary decisions. We discuss the use of tax
statistics more broadly in section A.13 of this appendix.
Also see our response above in section A.3.1 under 'Tax statistic
estimates'.
The conceptual basis for
dividend drop off studies
"The AER has tendered, largely without comment, material that casts some doubt on
the use of dividend drop-off studies in estimating gamma for regulatory purposes. In
responding to questions from the AER, SIRCA's March 2011 report raises questions
about the theoretical basis for dividend drop-off studies. In doing so, it touches on
The limitations of dividend drop off studies have been widely identified
since these proceedings—we provide a selection of comments from
academics and regulators in section A.15. Moreover, both Handley and
Lally advised that other approaches to estimating the utilisation rate should
263
Australian Competition Tribunal, Application by Energex Limited (No 2) [2010] ACompT 7, October 2010, para. 91. 264
Australian Competition Tribunal, Application by Energex Limited (Gamma) (No 5) [2011] ACompT 9, May 2011, paras. 32–34.

4-66 Attachment 4 – Value of imputation credits | Final decision: Amadeus Gas Pipeline Access Arrangement 2016–21
Issue Tribunal comments AER comments
issues raised in the Tribunal's earlier reasons regarding the arbitrage model underlying
dividend drop-off studies.
However, SIRCA's March 2011 report does not resolve these issues and the AER has
provided no conclusions of its own."265
be preferred. Handley and Lally also advised that, without adjustment,
dividend drop off studies produce downwards-biased estimates of the
utilisation rate.
Also see our response above in section A.3.1 under 'The conceptual basis
for dividend drop off studies '.
The need to re-evaluate
gamma
"Further, the Tribunal notes that estimation of a parameter such as gamma is
necessarily, and desirably, an ongoing intellectual and empirical endeavour. Its decision
in these proceedings is based on the material before it.”266
Consistent with this comment, we have not sought to apply the Tribunal's
previous considerations in this final decision. Instead, we adopt a value of
imputation credits that is based on our assessment of the merits of the
evidence before us, which includes a large amount of material that was not
before the Tribunal in these proceedings.
Also see our response above in section A.3.1 under 'The need to re-
evaluate gamma '.
Source: As specified in table.
265
Australian Competition Tribunal, Application by Energex Limited (Gamma) (No 5) [2011] ACompT 9, May 2011, paras. 40–41. 266
Australian Competition Tribunal, Application by Energex Limited (Gamma) (No 5) [2011] ACompT 9, May 2011, para. 45.

4-67 Attachment 4 – Value of imputation credits | Final decision: Amadeus Gas Pipeline Access
Arrangement 2016–21
During the Guideline process, service providers frequently proposed a value of imputation
credits of 0.25 and referenced the Tribunal decision for Energex in support of this.267
However, the last quote from the Tribunal demonstrates that it did not intend for its decision
to be determinative of the appropriate estimation technique for gamma, and certainly not on
a permanent basis. In the Guideline, we also made this point. Service providers with current
proposals no longer refer to the Tribunal's decision as if it were precedent. Rather, they
propose a value of imputation credits, and reasons for that value, which are consistent with
the Tribunal decision. However, the service providers consider that the problematic
estimation methodologies and the currency of the underlying data that apply to other
dividend drop off studies does not apply to the SFG study.268 We do not agree for the
reasons outlined in section A.15.
Both during the Guideline development process and this determination process, we have
considered the previous Tribunal decision for Energex carefully in forming our view on the
value of imputation credits. For the reasons expressed in this appendix and attachment 4 we
have come to a different position. This is consistent with the Tribunal's expectation that the
value of imputation credits is 'necessarily, and desirably, an ongoing intellectual and
empirical endeavour'.
A.3.3 DBNGP and WA Gas Networks
In 2012, Dampier to Bunbury Natural Gas Pipeline (DBNGP) sought Tribunal review of the
ERA's decision to adopt a value of imputation credits of 0.25. In upholding the ERA's value,
the Tribunal again emphasised the lack of consensus on an appropriate value and the fact
that determining a value for gamma is continually being refined:269
171 Determining the appropriate values of F [the distribution rate] and theta has
been a fiercely contested issue in Australia’s regulatory history. There is no unique
pair of values of F and theta that are regarded as universally correct. Therefore there
is no value of gamma that is regarded as universally correct. The academic models,
empirical research methods, data and relevant time periods all need to be carefully
investigated. Debate is inevitable, and ultimately, which value is most relevant for the
matter at hand must be decided on a case-by-case basis.
…
267
For example, see: ENA, Response to the Draft Rate of Return Guideline of the Australian Energy Regulator, 11 October
2013. 268
Australian Gas Networks, Attachment 11 Response to Draft Decision: Cost of Tax, January 2016, pp. 14-16, 21;
ActewAGL, Appendix 5.01 Detailed response to rate of return, gamma and inflation, January 2016, pp. 117-118; AusNet
Electricity Services, Revised Regulatory Proposal, January 2016, p. 7-86; United Energy, Response to AER Preliminary
Determination Re: Rate of return and gamma, January 2016, p. 87; CitiPower, Revised Regulatory Proposal 2016-2020;
January 2016, pp. 365-366; Jemena Electricity Networks, Attachment 6-1 Rate of return, gamma, forecast inflation, and
debt and equity raising costs, January 2016, p. 94; Powercor, Revised Regulatory Proposal 2016-2020, January 2016,
pp. 359-360. 269
Australian Competition Tribunal, Application by DBNGP (WA) Transmission Pty Ltd (No 3) [2012] ACompT 14, July 2012.

4-68 Attachment 4 – Value of imputation credits | Final decision: Amadeus Gas Pipeline Access
Arrangement 2016–21
210 The material (and conclusions drawn from it) that were relied on by the ERA
were objectively produced by respected academic researchers. Professor Gray
advanced alternative interpretations. This whole area of discourse about inputs into
the CAPM and the correct approach to estimating the relevant parameters of the
CAPM, including gamma, is a continuing area of sophisticated debate involving
competing opinions. An agreed position appears to be a distant outcome. In reaching
its decision the ERA relied on expert opinions that were contrary to those of Professor
Gray, who had been engaged by DBP. Such a difference of opinion is common
amongst academics in this as in other similar areas. Thus, so long as the ERA acted
reasonably in preferring one expert to another, it will not have committed error.
211 The Tribunal reiterates that there is no single agreed-upon correct value of
gamma. While the value of F is relatively settled in Australia, great controversy has
surrounded the relevant value of theta. Many papers on the measurement of theta,
and thus gamma, were produced for the ERA’s consideration, from its own and from
DBP’s experts. The gap between their estimating models, and their ensuing
calculations, was wide.
214 The Tribunal observes that this is not to say, however, that a gamma value of
0.25 is the only possible value for this parameter. It is simply the best estimate
currently available for use in this matter now before it. As with the estimation of many
economic and financial parameters, finding the “right” value is a process of continual
refinement as new models and paradigms emerge and as better data and estimating
techniques become available.
The Tribunal made similar comments in the earlier WA Gas Networks matter.270
A.4 Key concerns of the service providers
In their revised proposals, Ausgrid, Endeavour Energy, Essential Energy, ActewAGL,
TransGrid, Directlink, and Jemena Gas Networks directly raised eight key concerns with our
draft decisions released in 2014, which they characterised as errors.271 A number of these
concerns were also implicitly or explicitly raised in the revised or initial proposals of the
service providers currently under assessment, and/or and their supporting expert's reports.
Below we set out each of these and identify where we have responded to each of these
eight key concerns in this final decision.
Our definition of the utilisation rate is conceptually incorrect and inconsistent with the
requirements of the NER/NGR—our understanding of the utilisation rate (and the value
of imputation credits more broadly) is discussed in sections 4.3.1, 4.3.6, A.5, A.6, and
270
Australian Competition Tribunal, Application by WA Gas Networks Pty Ltd (No 3) [2012] ACompT 12, June 2012, paras.
119 and 125. 271
ActewAGL, Revised Regulatory Proposal 2015-19, January 2015, pp. 485–486; Ausgrid, Ausgrid's revised proposal on
gamma, January 2015, p. 1; Directlink, Directlink submission on gamma (updated), January 2015, pp. 1–2; Endeavour
Energy, Endeavour Energy's response to the AER draft decision re gamma, January 2015, p. 1; Essential Energy,
Essential's response to AER draft decision re gamma, January 2015, p. 1; and JGN, Gamma - response to the draft
decision, February 2015, p. 1.

4-69 Attachment 4 – Value of imputation credits | Final decision: Amadeus Gas Pipeline Access
Arrangement 2016–21
A.7. As shown there, our understanding is consistent with the theoretical framework that
underpins the NER/NGR and is supported by expert advice from Handley and Lally.
We incorrectly use equity ownership rates as direct evidence of the value of distributed
imputation credits—given our understanding of the utilisation rate, we set out in section
A.12 why the equity ownership approach provides a reasonable estimate.
The ranges we used for the equity ownership rate were not supported by the evidence in
the draft decisions—as discussed in section A.12, the service providers who raised this
did not recognise that our ranges were based on the evidence from two alternative
applications of the equity ownership approach. In this final decision, our ranges are
primarily based on the application that was deemed more relevant by Handley, although
we also have regard to the range for all equity implied by Lally's recommended estimate
for the distribution rate and particularly his preferred point estimate for gamma of at least
0.5.
We incorrectly use tax statistics as direct evidence of the value of distributed imputation
credits—given our understanding of the utilisation rate, we set out in section A.13 why
tax statistics provide a valid, albeit uncertain, estimate.
We incorrectly conclude that implied market value studies reflect factors that are not
relevant to estimating the utilisation rate—given our understanding of the utilisation rate,
we set out in sections A.15.4 and A.15.5 why the results of implied market value studies
can reflect factors that are not relevant to the utilisation rate.
We erred by considering implied market value studies in a general manner rather than
considering the merits of SFG's dividend drop off study—in sections 4.4.1 and A.15 we
set out a list of limitations that can apply to implied market value studies, and in section
A.15.5 we conclude that that there is reasonable evidence to suggest that several of
these limitations apply to SFG's dividend drop off study. In sections 4.4.1and A.15 we
also refer to the issues raised by Lally in relation to SFG's dividend drop off study, and
McKenzie and Partington's view that there is no obvious manner in which to weigh the
results from various implied market value studies based on their characteristics. In
section A.15 we set out statements from experts and other regulators on the limitations
of dividend drop off studies. All but one of these statements occurred after the
development of SFG's dividend drop off study.
It was neither necessary nor appropriate for us to identify a distribution rate for only listed
equity—in sections A.9 and A.10.1 this is further discussed.
Our ultimate conclusion as to the value of imputation credits was inconsistent with the
evidence presented in our recent decisions—as set out in section 4.4, the evidence
presented in this final decision suggests that a reasonable estimate for the value of
imputation credits is within the range 0.3 to 0.5. Our estimate of 0.4 is within this range.

4-70 Attachment 4 – Value of imputation credits | Final decision: Amadeus Gas Pipeline Access
Arrangement 2016–21
In the revised regulatory proposals of SA Power Networks, Ergon Energy, and Energex
submitted in July 2015, two issues were raised as the key issues in dispute.272 These issues
were also raised in Gray's June 2015 report (for Frontier) relied on by the majority of service
providers currently under assessment. These issues are:
The first key point of difference is conceptually whether theta should be interpreted as
the value of distributed credits, or the redemption proportion. The service providers
consider that if their value interpretation is adopted then you must use estimates that
measure the value of distributed credits (such as dividend drop-off studies).273 In
sections A.5 and A.8.1 we explain why we consider the proportion of imputation credits
distributed to shareholders eligible to utilise them is an appropriate measure of the value
of imputation credits before personal taxes and transaction costs.
The second key point of difference concerns the set of comparator businesses that
should be used when estimating a benchmark distribution rate.274 The service providers
consider: firstly, we are incorrect to consider the same set of firms need to be used to
estimate the distribution rate and to estimate the value of imputation credits; and
secondly, we are incorrect to use a distribution rate from all listed equity of around 0.8275
given our benchmark efficient network operator is a pure play wholly domestic business
that is not necessarily stock market listed. We respond to these views in sections A.9
and A.10.
We note that both of these points of difference were considered in our decisions released in
April and June 2015 and also considered by Handley who supported our approach. We also
note Lally's latest advice recommends a distribution rate for listed equity estimated from the
financial reports of the top 20 listed firms. It also implies matching distribution and utilisation
rates based on the dataset used is likely to result in an underestimate of gamma (given his
recommended values for the distribution rate and utilisation rate).276
In the revised proposals of the service providers currently under assessment (or their new
expert reports by Gray (for Frontier)), a number of key 'second order' differences of view
have been identified:
272
We note that these issues have been raised by other service providers. However SA Power Networks, Ergon Energy and
Energex have clarified that they consider these to be the key issues in dispute with the AER. We also note Gray did not
explicitly identify these as the key issues in dispute, although they featured prominently in his report. 273
SA Power Networks, Revised regulatory proposal 2015-20, July 2015, pp. 370–371; Ergon, Submission on value of
imputation credits (gamma), July 2015, p. 7; Frontier Economics, An appropriate regulatory estimate of gamma, p. 8, June
2015; Australian Gas Networks, Attachment 11.2 Value of Imputation Credits, p. 3, July 2015: ActewAGL Distribution,
Attachment 8 Detailed gamma proposal, pp. 2-3. 274
SA Power Networks, Revised regulatory proposal 2015-20, July 2015, pp. 370–371; Ergon, Submission on value of
imputation credits (gamma), July 2015, p. 7; Frontier Economics, An appropriate regulatory estimate of gamma, pp. 26–30,
June 2015; Australian Gas Networks, Attachment 11.2 Value of Imputation Credits, July 2015, p. 3. 275
We note we have used an estimate of the distribution rate of 0.77 in this decision. This was updated to 0.77 in our JGN
decision released in June 2015 from 0.8 used in our final decisions released in April 2015. 276
M. Lally, Gamma and the ACT Decision, May 2016, pp. 5–6, 25–26, 28–29

4-71 Attachment 4 – Value of imputation credits | Final decision: Amadeus Gas Pipeline Access
Arrangement 2016–21
A redemption rate study can only provide an upper bound for estimating theta.277 In
section A.8.3 we consider this further.
The criticisms of Gray and Hall's dividend drop-off work is not reasonable.278 We discuss
the limitations of dividend drop off studies and which of these apply to the SFG dividend
drop off study in section A.15.5.
We note the primary and second order differences of view identified above do not appear to
be new issues and largely overlap with the eight key concerns that service providers have
raised previously. Having considered the revised proposals, the new experts' reports since
our 2015 JGN decision and late submissions (discussed in section 4.1 and 4.4.2), we remain
of the view that a gamma value of 0.4 is appropriate.
In their revised proposals, these service providers have broadly not submitted anything new.
Besides a new report by Frontier Economics, which presented no substantive new
arguments, the service providers have submitted essentially the same arguments that were
considered in our decisions released in October and November 2015. Overall the service
providers propose a gamma estimate of 0.25 which is based on a 0.35 utilisation rate from
the SFG dividend drop off study and an all equity distribution rate of 0.7.279
As a high level summary of the revised proposals, service providers submitted:
our approach to estimating gamma is premised on an incorrect interpretation of the
NGR280
277
AusNet Services, 2016-20 Regulatory Proposal, April 2015, p. 354; United Energy, Assessment of the Value of Imputation
Credits - Gamma, Proposal for 2016 to 2020, April 2015, p. 2; CitiPower, Appendix J - Gamma, April 2015, p. 4; Powercor,
Appendix J - Gamma, April 2015, p. 4; Jemena Electricity, Attachment 06-06 Gamma proposal, April 2015, p. 5; SA Power
Networks, Revised regulatory proposal 2015-20, July 2015, pp. 370–371 ; Ergon, Submission on value of imputation
credits (gamma), July 2015, p. 7; ActewAGL Distribution, Attachment 8 Detailed gamma proposal, p. 2; Australian Gas
Networks, Attachment 11.2 Value of Imputation Credits, pp. 9–10, July 2015; Amadeus Gas Pipeline, Access Arrangement
revision submission, August 2015, p. 151. 278
AusNet Services, 2016-20 Regulatory Proposal, April 2015, p. 367; United Energy, Assessment of the Value of Imputation
Credits - Gamma, Proposal for 2016 to 2020, April 2015, p. 18; CitiPower, Appendix J - Gamma, April 2015, p. 16;
Powercor, Appendix J - Gamma, April 2015, p. 16; Jemena Electricity, Attachment 06-06 Gamma proposal, April 2015, p.
7; SA Power Networks, Revised regulatory proposal 2015-20, July 2015, pp. 370-371; Ergon, Submission on value of
imputation credits (gamma), July 2015, p. 8; ActewAGL Distribution, Attachment 8 Detailed gamma proposal, p. 15;
Australian Gas Networks, Attachment 11.2 Value of Imputation Credits, p. 3, July 2015. 279
Australian Gas Networks, Attachment 11 Response to Draft Decision: Cost of Tax, January 2016, p. 4; ActewAGL,
Appendix 5.01 Detailed response to rate of return, gamma and inflation, January 2016, p. 40; AusNet Electricity Services,
Revised Regulatory Proposal, January 2016, p. 7-96; United Energy, Response to AER Preliminary Determination Re:
Rate of return and gamma, January 2016, p. 97; CitiPower, Revised Regulatory Proposal 2016-2020; January 2016,
p. 375; Jemena Electricity Networks, Attachment 6-1 Rate of return, gamma, forecast inflation, and debt and equity raising
costs, January 2016, pp. 104-105; Powercor, Revised Regulatory Proposal 2016-2020, January 2016, p. 369. 280
Australian Gas Networks, Attachment 11 Response to Draft Decision: Cost of Tax, January 2016, p. 2; ActewAGL,
Appendix 5.01 Detailed response to rate of return, gamma and inflation, January 2016, pp. 40; AusNet Electricity Services,
Revised Regulatory Proposal, January 2016, p. 7-79; United Energy, Response to AER Preliminary Determination Re:
Rate of return and gamma, January 2016, p. 80; CitiPower, Revised Regulatory Proposal 2016-2020; January 2016,
p. 358; Jemena Electricity Networks, Attachment 6-1 Rate of return, gamma, forecast inflation, and debt and equity raising
costs, January 2016, p. 86; Powercor, Revised Regulatory Proposal 2016-2020, January 2016, p. 352.

4-72 Attachment 4 – Value of imputation credits | Final decision: Amadeus Gas Pipeline Access
Arrangement 2016–21
both the equity ownership value and taxation statistics can be no more than an upper
bound for the utilisation rate281
market value studies are direct evidence of the value of imputation credits to investors—
we have erred in concluding that market value studies reflect factors such as differential
personal taxes and risk which are not relevant to the task of measuring the utilisation
rate282
we incorrectly assume that estimates of the utilisation rate from listed equity (all equity)
can only be combined with estimates distribution rate from listed equity (all equity)283
under our interpretation of the NGR, our gamma estimate cannot be supported as the
pre-personal cost estimate of the utilisation rate is approximately 0.3.284
A.5 The role of the value of imputation credits in the regulatory framework
To explain the role of the value of imputation credits in the NER/NGR, we must consider:
the 'building block' revenue framework in the NER/NGR, and
the construction of the tax building block.
A.5.1 The building block framework
Under the NER/NGR, we employ a building block framework to estimate revenue for service
providers. The building block framework sets out how to estimate the various components
(that is, 'building blocks') that make up a total revenue allowance.285 The function of this
281
Australian Gas Networks, Attachment 11 Response to Draft Decision: Cost of Tax, January 2016, p. 4; ActewAGL,
Appendix 5.01 Detailed response to rate of return, gamma and inflation, January 2016, pp. 41, 125; AusNet Electricity
Services, Revised Regulatory Proposal, January 2016, pp. 7-84, 7-83; United Energy, Response to AER Preliminary
Determination Re: Rate of return and gamma, January 2016, pp. 85, 86; CitiPower, Revised Regulatory Proposal 2016-
2020; January 2016, pp. 362, 364; Jemena Electricity Networks, Attachment 6-1 Rate of return, gamma, forecast inflation,
and debt and equity raising costs, January 2016, pp. 91, 92; Powercor, Revised Regulatory Proposal 2016-2020, January
2016, pp. 356, 358. 282
Australian Gas Networks, Attachment 11 Response to Draft Decision: Cost of Tax, January 2016, p. 4; ActewAGL,
Appendix 5.01 Detailed response to rate of return, gamma and inflation, January 2016, p. 41. 283
Australian Gas Networks, Attachment 11 Response to Draft Decision: Cost of Tax, January 2016, p. 4; ActewAGL,
Appendix 5.01 Detailed response to rate of return, gamma and inflation, January 2016, pp. 41, 111, 128; AusNet Electricity
Services, Revised Regulatory Proposal, January 2016, pp. 7-81, 7-95; United Energy, Response to AER Preliminary
Determination Re: Rate of return and gamma, January 2016, pp. 82, 96; CitiPower, Revised Regulatory Proposal 2016-
2020; January 2016, pp. 360, 374; Jemena Electricity Networks, Attachment 6-1 Rate of return, gamma, forecast inflation,
and debt and equity raising costs, January 2016, pp. 88, 103; Powercor, Revised Regulatory Proposal 2016-2020, January
2016, pp. 354, 368. 284
Australian Gas Networks, Attachment 11 Response to Draft Decision: Cost of Tax, January 2016, p. 4; ActewAGL,
Appendix 5.01 Detailed response to rate of return, gamma and inflation, January 2016, pp. 41, 127; AusNet Electricity
Services, Revised Regulatory Proposal, January 2016, p. 7-94; United Energy, Response to AER Preliminary
Determination Re: Rate of return and gamma, January 2016, p. 95; CitiPower, Revised Regulatory Proposal 2016-2020;
January 2016, p. 374; Jemena Electricity Networks, Attachment 6-1 Rate of return, gamma, forecast inflation, and debt
and equity raising costs, January 2016, p. 103; Powercor, Revised Regulatory Proposal 2016-2020, January 2016, p. 368. 285
NER, cll. 6.4.3, 6A.5.4; NGR, r. 76.

4-73 Attachment 4 – Value of imputation credits | Final decision: Amadeus Gas Pipeline Access
Arrangement 2016–21
building block revenue estimate is to determine the revenue that a service provider requires
to:
fund its operating expenses.
achieve adequate returns to raise debt and equity in order to finance its capital
investments. This is made up of a rate of return on capital to compensate investors for
the risks of investment. It also includes a return of capital (depreciation), which gradually
returns the initial principal of the investment, and subsequent investments, back to
investors.
pay its tax liability.
reflect any revenue increments or decrements from incentive mechanisms in the design
of the regulatory regime.
Importantly, the building block framework is intended to compensate the service provider
(and its investors) only for costs incurred by the service provider and not by its investors; that
is, the framework is on a before-personal-tax and before-personal-costs basis. Handley
described this consideration as follows:286
The post-tax basis of the regulatory framework can be more fully described as an
after-company-before-personal-tax framework. In other words, cash flows and returns
are to be measured after company taxes but before personal taxes. By definition, this
means that allowed revenues should include compensation for corporate taxes
incurred by the regulated firm but not for personal taxes incurred by the firm’s
shareholders. Similarly, allowed revenues should include compensation for prudent,
efficient costs incurred by the regulated firm but not for costs (including personal
transactions costs) incurred at the shareholder level. Note, this does not mean that
personal taxes and costs are being ignored or assumed not to exist – rather there is
no need to explicitly include them in the modelling framework.
…
The regulatory WACC framework is an after-company-before-personal-tax framework
which requires explicit modelling of cash flows and returns after allowing for company
tax but avoids most of the complications associated with having to model personal
taxes - one complication which remains of course, is gamma. If one wanted to
explicitly model personal taxes then an after-company-after-personal-tax WACC
framework could be used instead.
In particular, Handley advised that the Officer framework provides the basis for the building
block framework in the NER/NGR, and that the before-personal-tax and before-personal-
costs interpretation is consistent with Officer. Handley's advice on these matters is
discussed in more detail in sections A.6, A.7.3 and A.8.1.
286
J. Handley, Report prepared for the Australian Energy Regulator: Advice on the value of imputation credits, 29 September
2014, pp. 4–5 and footnote 2.

4-74 Attachment 4 – Value of imputation credits | Final decision: Amadeus Gas Pipeline Access
Arrangement 2016–21
In response to a number of service providers' view that we prefers our conceptual valuation
relative to a market mechanism derived value, and their concerns around our definition of
gamma, we note:
There is no market for imputation credits and therefore there is no directly observable
market price.287 This is also discussed below in section A.15.3.
The value of imputation credits as estimated through a dividend drop off study:
o is not a post company tax value before personal taxes and personal transaction
costs (particularly demonstrated where the study estimates a value for cash
dividends materially below their face value as the SFG study does).
o is not necessarily consistent with the estimate of the return on equity and return on
debt which are estimated required returns before personal taxes and personal
transaction costs (particularly demonstrated where the study estimates a value for
cash dividends materially below their face value as the SFG study does)
o is not clearly measuring a value to long term investors supplying capital to the
benchmark efficient entity (even where adjusted for adjusted for differential tax
impacts)
o is subject to significant uncertainty.
A number of limitations of these studies are discussed further in sections A.15.4 and
A.15.5.
Our definition of the utilisation value is consistent with Officer Framework underpinning
the rules that uses a post-tax Vanilla WACC, is consistent with the way we estimate the
required return on equity, and is supported by Handley. Lally also considers our
approach to imputation credits is consistent with the post-tax framework in the
NER/NGR.288
The explicit recognition that this is a pre personal taxes and pre personal transaction
costs value is simply explicit recognition of something implicit in the Officer Vanilla
WACC framework. This framework determines the required return to the company (i.e.
before personal taxes and personal transaction costs are incurred) consistent with the
definition of the after-tax net cash flows set out in Officer.289
Our definition is consistent with the 'value' concept in the rules given the rules are
requiring the AER to estimate a post-tax nominal Vanilla WACC consistent with Officer
formula (12) in his 1994 paper, which as stated by Officer is one particular definition of "a
company's after-tax cost of capital (WACC)" and "is determined by the definition used of
after-tax operating income or really after-tax net cash flows".290 As these after-tax net
287
We note that if there was a post-tax market for imputation credits they should trade for approximately their face value as
this is the amount of post-tax cash flow from the government they entitle the claimant to receive from the government. 288
M. Lally, Gamma and the ACT Decision, May 2016, pp. 11-12. 289
R. Officer, 'The cost of capital of a company under an imputation system', Accounting and finance, vol. 34(1), May 1994, p.
7. 290
R. Officer, 'The cost of capital of a company under an imputation system', Accounting and finance, vol. 34(1), May 1994, p.
6.

4-75 Attachment 4 – Value of imputation credits | Final decision: Amadeus Gas Pipeline Access
Arrangement 2016–21
cash flows are at the company level they are before personal taxes and personal
transaction costs. This is supported by the advice of Handley and Lally.291
A.5.2 The tax building block
One expense that a service provider faces is taxation. An allowance for taxation can be
estimated as a separate building block allowance, or through the rate of return. Either way,
the service provider and its investors are compensated for its tax liability. The difference is
only how this return is presented. The NER/NGR specify that we must estimate a nominal
vanilla rate of return.292 A nominal vanilla rate of return combines a post-tax return on equity
with a pre-tax return on debt. More specifically, as described by Handley above, the return
on equity is a post-company-tax-pre-personal-tax return on equity.
Amongst other things, this means the return on capital does not include an allowance for the
cost of taxation. As a result, the building block framework includes an estimate of the cost of
corporate income tax as a separate revenue item.
The cost of corporate income tax building block takes the following form:
𝐸𝑇𝐶𝑡 = (𝐸𝑇𝐼𝑡 × 𝑟𝑡)(1 − 𝛾)
where:
(𝐸𝑇𝐼𝑡 × 𝑟𝑡) is an estimate of the benchmark efficient entity's tax liability.
𝛾 is the value of imputation credits.
Therefore, the effect of the value of imputation credits is to reduce a service provider's
allowed revenue by 𝛾 (gamma) dollars for each dollar of expected company tax payable by
the benchmark efficient entity. Given it is the tax paid by the benchmark efficient entity that
gives rise to the imputation credits, we consider that it is the (pre-personal tax) value of
imputation credits to investors in the benchmark efficient entity that is relevant.293
A.6 The conceptual framework for the value of imputation credits
With regard to the discussion of the tax building block in section A.5.2, we consider the
'value of imputation credits' to be the value of imputation credits to investors in the
benchmark efficient entity. Moreover, as noted above, it is the pre-personal tax value of
imputation credits to those investors that we seek to estimate. The issue is then how to
interpret and estimate the value of imputation credits. Our approach to interpreting and
291
J. Handley, Report prepared for the Australian Energy Regulator: Advice on the value of imputation credits, 29 September
2014, pp. 4–5 and footnote 2; M. Lally, Gamma and the ACT Decision, May 2016, pp. 7, 11, 12. 292
NER, cll. 6.5.2, 6A.6.2; NGR, r. 87. 293
Although we consider that it is implied that the 'value of imputation credits' refers to the value of imputation credits to
investors in the benchmark efficient entity, we note that the NER/NGR are not explicit on this point.

4-76 Attachment 4 – Value of imputation credits | Final decision: Amadeus Gas Pipeline Access
Arrangement 2016–21
estimating the value of imputation credits is guided in the first instance by the conceptual
framework developed by Officer.294 This is because:
The construction of the tax building block mirrors the treatment of imputation credits in
the framework developed by Officer, including through use of the parameter denoted by
the Greek letter 'gamma'.295
Handley advised that Officer's definition of the nominal vanilla rate of return provides the
basis for the rate of return framework in the NER/NGR.296
The NER/NGR require that we determine the rate of return on a nominal vanilla basis
that is consistent with our estimate of the value of imputation credits.297
We do not contend that the Officer Paper is a “statute or a code”. However, as the Officer
Paper underpins the inclusion of gamma in the corporate income tax formula in NER 6.5.3
and NGR 87A, it is fundamental to a coherent understanding of the role of gamma in the
regulatory scheme.
The Officer Paper specifically identified gamma in its WACC formulae to be the “proportion
of tax collected from the company which gives rise to the tax credit associated with a franked
dividend”: It directly supports an interpretation of gamma which is focused on the utilisation
or redemption of imputation credits, and an approach to theta which seeks to identify the
proportion of investors that are eligible to utilise distributed imputation credits. So much is
confirmed by Handley, who states:298
It is clear from Monkhouse (1996) that the second parameter refers to the utilisation
value of a distributed imputation credit. This parameter is commonly denoted and
called theta. It is also clear from the post-tax basis of the regulatory framework (and
the Officer and Monkhouse WACC frameworks) that the item of interest is more
precisely described as the after-company-before-personal-tax utilisation value of a
distributed imputation credit.
The Officer Paper makes clear that gamma is:
(a) the proportion of tax collected from the company which gives rise to the tax credit
associated with a franked dividend; which is
(b) the value of a dollar of tax credit to the shareholder; with the result that
294
R. Officer, 'The cost of capital of a company under an imputation system', Accounting and finance, vol. 34(1), May 1994,
pp. 1–17. 295
R. Officer, 'The cost of capital of a company under an imputation system', Accounting and finance, vol. 34(1), May 1994,
equation 2. 296
J. Handley, Report prepared for the Australian Energy Regulator: Advice on the value of imputation credits, 29 September
2014, pp. 7–8. 297
NER, cll. 6.5.2, 6A.6.2; NGR, r. 87. 298
Handley, Report prepared for the Australian Energy Regulator: Advice on the value of imputation credits, 29 September
2014, pp. 9, 17.

4-77 Attachment 4 – Value of imputation credits | Final decision: Amadeus Gas Pipeline Access
Arrangement 2016–21
(c) if the shareholder can fully utilise the imputation tax credits then the value of gamma
=1.299
Our approach to gamma, as drawing upon the Officer Paper, advances the NEO and the
NGO and does not detract from those objectives. The purpose of including the gamma
parameter in the corporate income tax formula is to ensure that investors are
appropriately compensated having regard to the combined value of dividends, capital
gains and imputation credits they receive.
The Officer Paper included the following explanation of gamma at pp 2-4 (emphasis added):
Under an imputation system, credit is given to shareholders for the company tax
implicitly levied on their dividend receipts, i.e. dividends paid after company tax has
been levied which implies that the dividends have been taxed at the company level.
Under a full imputation tax system, tax that is implicitly being levied on the dividends
can be credited against any further tax liabilities of the shareholder (the recipient of
the dividend).
The proportion of company tax that can be fully rebated against personal tax liabilities
is best viewed as personal income tax collected at the company level. In effect, the
tax collected at the company level is a mixture of personal tax and company tax, the
company tax being that proportion of the tax collected which is not credited (rebated)
against personal tax. If all the collection of tax from a company is rebateable (in the
Australian terminology if all the franking credits can be used against personal tax
liabilities), then for that company’s shareholders company tax is effectively eliminated.
The tax the company pays is simply the shareholders’ personal income tax being
collected at the company level.
The amount of tax collected from the company by the government is found by
applying the effective tax rate (T) to the operating income less interest, ie XO – XD.
This amount, ie T(XO – XD) represents the amount of tax collected from the company
but not all of this is company tax. A proportion (γ) of the tax collected from the
company will be rebated against personal tax and, therefore, is not really company
tax but rather is a collection of personal tax at the company level. Therefore, if we
wish to define the effective company tax collection, we need to reduce T by the
proportion γ.
In these circumstances, the effective level of company tax paid is defined by:
XG = T(XO – XD) - γ . T(XO – XD)
= T (XO – XD) (1-γ) (2)
where
T is the tax rate effective for the definition of assessable income as defined in (2), it is
the effective rate which is levied at the company level and it is a mixture of company
299
R. Officer, 'The cost of capital of a company under an imputation system', Accounting and finance, vol. 34(1), May 1994,
p. 4.

4-78 Attachment 4 – Value of imputation credits | Final decision: Amadeus Gas Pipeline Access
Arrangement 2016–21
tax T(1-γ) and personal tax, T. γ, i.e. T= T( 1-γ) + Tγ. Thus γ is the proportion of tax
collected from the company which gives rise to the tax credit associated with a
franked dividend. This franking credit can be utilized as tax credit against the personal
tax liabilities of the shareholder. γ can be interpreted as the value of a dollar of tax
credit to the shareholder.
The Officer Paper set out the following example of its interpretation of gamma:300
For example, if the shareholder can fully utilize the imputation tax credits then
(“value”) γ = 1, e.g. a superfund or an Australian resident personal taxpayer. On the
other hand a tax exempt or an offshore taxpayer who cannot utilize or otherwise
access the value in the tax credit will set γ = 0.
While the above passages of the Officer Paper describe gamma using slightly different
permutations of language, it is clear that, at its core, gamma is conceptualised by Officer as
being concerned with investors’ utilisation of tax credits.
Officer describes gamma in different ways, and this is a potential source of ambiguity
regarding what the parameter represents and therefore how one might estimate it in
practice. Whilst Handley acknowledged that Officer describes gamma in seemingly different
ways, he advised that, when examined closely, there is no ambiguity in the meaning of
Officer. Handley advised:301
Similarly, Officer has described gamma in seemingly different ways. For example he
refers to:
“A proportion (γ) of the tax collected from the company will be rebated against
personal tax.”
and shortly thereafter:
“γ can be interpreted as the value of a dollar of tax credit to the shareholder.”
But again, there is no ambiguity. These terms can and have been used
interchangeably because the underlying source of value of an imputation credit to
shareholders is the consequent reduction in personal taxes in recognition of taxes
that were previously paid at the corporate level. In other words, within the Officer
framework, it is clear that gamma represents the utilisation or redemption value of
imputation credits and this value corresponds to the proportion of company tax which
is in effect a prepayment of personal tax by the company on behalf of its
shareholders. It is this identification of the personal tax component of the company
tax paid which is the central idea of the paper.
In other words, gamma in the Officer framework represents the proportion of company tax
that is returned to investors through the utilisation of imputation credits and this is the value
300
R. Officer, 'The cost of capital of a company under an imputation system', Accounting and finance, vol. 34(1), May 1994,
p. 4. 301
J. Handley, Report prepared for the Australian Energy Regulator: Advice on the value of imputation credits, 29 September
2014, p. 9.

4-79 Attachment 4 – Value of imputation credits | Final decision: Amadeus Gas Pipeline Access
Arrangement 2016–21
of imputation credits to investors. This is the interpretation of the value of imputation credits
we adopted in the Guideline and continue to adopt in this decision. This interpretation is
consistent with the Officer framework and is supported by advice from Handley.
In late submissions, United Energy, ActewAGL, CitiPower and Powercor submitted that the
Tribunal considered we had erred in adopting a conceptual approach to gamma that
redefines it as the value of imputation credits that are available for redemption.302 The
Tribunal found this due to us placing most reliance on the equity ownership approach and
effectively defining the utilisation value as the proportion of distributed imputation credits that
are available for redemption.303 The Tribunal considered that such an approach:304
Is inconsistent with the concept of gamma in the Officer Framework for the WACC
which underlies the rules and the objective of ensuring a market rate of return on
equity by making an adjustment to the revenue allowance for taxation to take account
for imputation credits.
We consider our approach is consistent with the Officer framework and our estimation of the
required return on equity. We consider what matters from a value to investor's perspective is
the face value of imputation credits expected to be utilised as this reflects both the cost of
these imputation credits to the regulated businesses and the benefit that investors receive
from these credits when utilised to reduce their tax payable (or to receive a refund from the
government). The post company (pre-personal) tax value of an imputation credit when
utilised is approximately305 its face value. This is further discussed in section A.15.3.
The Officer framework assumes all free cash flows (including imputation credits) are fully
paid out each period. That is, the Officer framework is a 'perpetuity' framework. However, in
reality not all imputation credits are necessarily paid out each period, nor are all other free
cash flows necessarily paid out.306 For example, it is typical for a company to retain some
earnings from a previous year to fund part of its future investment, rather than pay out all
earnings as dividends and fully raise the funding of future investment from external sources.
Work by Monkhouse (and others) extends the Officer framework by allowing for less than a
302
Australian Competition Tribunal, Application by Public Interest Advocacy Centre Ltd and Ausgrid [2016] ACompT 1, 26
February 2016, para. 1100; United Energy, Submission on AER preliminary determination - Submission on gamma, 26
April 2016; CitiPower/Powercor, Submission on implications of recent Australian Competition Tribunal Decision, 18 April
2016; ActewAGL, Implication of recent Tribunal decisions for final decision and updates to the allowed rate of return and
forecast inflation estimate, 12 May 2016. 303
Australian Competition Tribunal, Application by Public Interest Advocacy Centre Ltd and Ausgrid [2016] ACompT 1,
January 2016, para. 1100. 304
United Energy, Submission on AER preliminary determination - Submission on gamma, 26 April 2016;
CitiPower/Powercor, Submission on implications of recent Australian Competition Tribunal Decision, 18 April 2016;
ActewAGL, Implication of recent Tribunal decisions for final decision and updates to the allowed rate of return and forecast
inflation estimate, 12 May 2016; Australian Competition Tribunal, Application by Public Interest Advocacy Centre Ltd and
Ausgrid [2016] ACompT 1, 26 February 2016, para. 1100. 305
It is approximately equal due to the time value of money that impacts the present valuation of distributed imputation
credits. However, we consider any discounting for this would be immaterial for the reasons discussed in section A.8.3 306
This is evident in companies having positive franking account balances in aggregate.

4-80 Attachment 4 – Value of imputation credits | Final decision: Amadeus Gas Pipeline Access
Arrangement 2016–21
full payout of cash flows and imputation credits each period. Handley advised that
Monkhouse effectively shows that:307
𝛾 = 𝐹𝜃 + (1 − 𝐹)𝜓
where:
𝐹 is the proportion of imputation credits generated that are distributed in a period (the
'distribution rate').
𝜃 (theta) is the utilisation value to investors in the market per dollar of imputation credits
distributed (the 'utilisation rate').
𝜓 (psi) is the utilisation value of a retained credit to investors in the market.
Handley also advised that in frameworks such as Monkhouse's the utilisation rate in
equilibrium is equal to the weighted average, by wealth and risk aversion, of the individual
utilisation rates of investors in the market:308
This interpretation of theta as a complex weighted average of investor utilisation rates
is consistent with that appearing in Monkhouse (1993) and Lally and van Zijl (2003)…
This is also supported by Lally's remarks on the work of Lally and van Zijl:309
Although Officer (1994) provides no clarification on this matter, because his derivation
of the model is intuitive rather than formal, Lally and van Zijl (2003, section 3) provide
a formal derivation of a generalisation of Officer’s model (with the Officer model being
a special case), in which variation of utilisation rates across investors is recognised.
In this derivation, they show that [the utilisation rate] is a complex weighted average
over all investors holding risky assets, where the weights involve each investor’s
investment in risky assets and their risk aversion.
Consistent with the advice we received from Lally, in the Guideline we recognised that the
utilisation rate is equal to the weighted average, by wealth and risk aversion, of the individual
utilisation rates of investors in the market. In the Guideline, we also defined the utilisation
rate as the extent to which investors can use the imputation credits they receive to reduce
their tax (or receive a refund). In this decision, consistent with Handley's advice, we consider
the utilisation rate is the utilisation value to investors in the market per dollar of imputation
credits distributed. However, we consider that our views in the Guideline and in this decision
are broadly equivalent; that is, our definition of the utilisation rate in this final decision still
reflects the extent to which investors in the market can use the imputation credits they
receive. This is because, as discussed above and in sections A.5, A.7 and A.8.1, to be
consistent with the Officer framework (and therefore the building block framework in the
307
Handley considered that, although Monkhouse does not use the term gamma, the interpretation is clear: J. Handley,
Report prepared for the Australian Energy Regulator: Advice on the value of imputation credits, 29 September 2014, p. 11
and footnote 12. 308
J. Handley, Report prepared for the Australian Energy Regulator: Advice on the value of imputation credits, 29 September
2014, pp. 18–20. 309
M. Lally, The estimation of gamma, 23 November 2013, p. 11.

4-81 Attachment 4 – Value of imputation credits | Final decision: Amadeus Gas Pipeline Access
Arrangement 2016–21
NER/NGR) the utilisation rate should reflect the before-personal-tax and before-personal-
costs value of imputation credits to investors. On a before-personal-tax and before-personal-
costs basis, an investor that is eligible to fully utilise imputation credits should value each
dollar of imputation credits received at one dollar (that is, have a utilisation rate of 1).
Therefore, the utilisation value to investors in the market will reflect the weighted average, by
wealth and risk aversion, of the utilisation rates of investors—some of whom will have a
utilisation rate of 1 and others who will have a utilisation rate of 0.310 We discuss Handley's
advice on this matter further in section A.8.1.
Returning to the expression for 𝛾 above, we have not explicitly included the value of retained
credits, 𝜓, when determining the value of imputation credits. This is mainly because we
recognise that investors can only use imputation credits to reduce tax or receive a refund
once the credits have been distributed. There is also the practical problem of how to quantify
the value of retained credits. Handley acknowledged the potential for retained credits to have
value, but also the difficulty in quantifying it:311
Retained imputation credits can be worth no less than zero but may be worth more
than zero. Estimates of gamma using the traditional approach will therefore be
downward biased to the extent that retained imputation credits have value. Although it
is not possible to reasonably estimate the magnitude of the bias, its direction is clear.
We agree with Handley and consider assuming retained imputation credits have no value is
a conservative assumption. We consider retained imputation credits have a positive value
but it is difficult to quantify this value. There are many ways retained imputation credits could
potentially benefit investors. For example, retained imputation credits may allow firms to
conduct off market buy backs of their own stocks at a discount to prevailing market values.
Off market buybacks can be structured in such a way that the purchase price is derived from
both fully franked dividends and capital. Investors are prepared to sell back their shares at a
discount as they derive value from imputation credits distributed and the capital gains loss
that outweighs the capital loss they incur from selling at a discount.312 Shareholders that do
not participate in off market buybacks benefit from capital appreciation of their shares as the
firm's capital is brought back at a discount to the prevailing market prices. An example of a
recently completed off market buy back completed a discount that likely was used to stream
imputation credits to those who could utilise them most highly was by Caltex Australia.313
However, we consider assuming retained imputation credits have no value might be a
reasonable assumption to the extent that imputation distributions rates are expected to
remain constant overtime. To the extent firms maintain in perpetuity a distribution rate less
that a 100 per cent, the proportion of imputation credits that are not distributed are worthless.
As we assume the historical cumulative payout ratios (for listed and all equity) are
310
Recall from section 4.3.3 that we define the relevant market as an Australian domestic market that recognises the
presence of foreign investors to the extent that they invest in the Australian market. 311
J. Handley, Report prepared for the Australian Energy Regulator: Advice on the value of imputation credits, 29 September
2014, p. 14. 312
L. Gitman, R. Juchau and J. Flanagan, Principles of Managerial Finance, 6th Edition, 2011, p. 475. 313
Caltex Australia Limited, Off-market buy-back booklet, 26 February 2016; Caltex Australia Limited, Caltex successfully
completes $270m off-market share buy-back, 11 April 2016.

4-82 Attachment 4 – Value of imputation credits | Final decision: Amadeus Gas Pipeline Access
Arrangement 2016–21
reasonable estimates of the future expected payout ratios, we consider our approach is
appropriate.
A.7 Gray's comments on the conceptual framework.314
In the previous section, we set out our position on the appropriate conceptual framework for
the estimation of the value of imputation credits. In this section, we respond to Gray's view.
Gray's view on the conceptual framework was largely adopted by the service providers in
their proposals.
Gray's May 2014 report (for SFG) for the service providers submitted that:
The advice and evidence cited in the Guideline does not support the interpretation of the
utilisation rate in the Guideline.
Officer shows that the value of imputation credits (gamma) represents the extent to which
imputation credits are capitalised into the stock price.
The utilisation rate in the framework provided by Monkhouse (and Lally and van Zijl)
should not be used to estimate the value of imputation credits.
The submissions from Gray, including comments in his February 2015 report (for SFG) and
his June 2015 and January 2016 report (for Frontier), do not change our view on the
conceptual framework for the estimation of the value of imputation credits. We do not
consider his work supports the position that our conceptual framework is not an appropriate
basis on which to estimate the value of imputation credits.315 We set out our reasoning
below.
A.7.1 Gray's comments on the AER's position
Gray (for SFG) submitted that '…the AER's position is that theta (and consequently gamma)
no longer represents the value (as in "worth" or "market value to investors")…'.316 This is
incorrect. Our definition of the utilisation rate in this final decision and our prior decisions
released in 2014 and 2015 (our prior decisions) is the utilisation value to investors in the
market per dollar of imputation credits distributed. Thus, we do consider that the utilisation
rate represents the value to investors in the market. However, the key difference between
our position and Gray's is we consider that, to be consistent with the underlying conceptual
framework provided by Officer, we need to estimate the before-personal-tax and before-
personal-cost value. This is discussed further in section A.7.3.
In its recent decisions referenced in late submissions by United Energy, ActewAGL
CitiPower and Powercor, the Tribunal considered that the AER's reasoning ignored the fact
314
Professor Gray undertook reports for both SFG and Frontier economics. To avoid confusion, we have generally referred to
Professor Gray by name with the consulting firm after his name. 315
SA Power Networks, Revised regulatory proposal 2015-20, July 2015, p. 373. 316
SFG, Estimating gamma for regulatory purposes, 6 February 2015, para. 42.

4-83 Attachment 4 – Value of imputation credits | Final decision: Amadeus Gas Pipeline Access
Arrangement 2016–21
that other parameters in the allowed rate return calculation are market values that already
incorporate the effects of the difference in investors' tax position and transaction costs.317
In response to this, we remain of the view that market studies that estimate the value of
imputation credits are influenced by differential personal taxation of ordinary income (which
includes both cash dividends and the face value of imputation credits to eligible domestic
investors) relative to capital gains. These differential taxation rates heavily influence these
"market values" and therefore these market value estimates neither reflect a pre-personal
nor post-personal tax value of imputation credits. None of our allowed rate of return
parameter estimates require an explicit adjustment to make them consistent with the Officer
Framework underpinning the rules. That is, they are already appropriate post tax estimates.
This is discussed further below in section A.8.2.
Gray also submitted that '[t]he AER then estimates the redemption rate, which it interprets as
being consistent with the specific reference to "value" in the Rules in that it is "the number
that is adopted" for imputation credits'.318 This is also incorrect. In this final decision and our
prior decisions we estimate the utilisation rate. Further, nowhere in this final decision or in
our prior decisions do we seek to support any aspect of our position with 'specific reference
to "value" in the Rules in that it is "the number that is adopted" for imputation credits'.
We also disagree with Gray's view that:319
The AER is not saying that it has identified a number of approaches for estimating the
value (as in "worth to investors in the market") of imputation credits. Rather, the AER
considers:
a) Some approaches for estimating the value (as in "worth to investors in the market")
of imputation credits – the market value studies; and
b) Some approaches for estimating the redemption rate – the equity ownership and
ATO tax statistic approaches.
By contrast, the approaches on which we rely in this decision to estimate the utilisation rate
are all relevant for the reasons discussed in section 4.4 of attachment 4.
A.7.2 Gray's comments on certain evidence and advice cited in
the Guideline
In his May 2014 report, Gray (for SFG) set out why it considered that certain evidence cited
in the Guideline did not support the position in the Guideline.320 This evidence included:
317
United Energy, Submission on AER preliminary determination - Submission on gamma, 26 April 2016;
CitiPower/Powercor, Submission on implications of recent Australian Competition Tribunal Decision, 18 April 2016;
ActewAGL, Implication of recent Tribunal decisions for final decision and updates to the allowed rate of return and forecast
inflation estimate, 12 May 2016; Australian Competition Tribunal, Application by Public Interest Advocacy Centre Ltd and
Ausgrid [2016] ACompT 1, 26 February 2016, para. 1073. 318
SFG, Estimating gamma for regulatory purposes, 6 February 2015, para. 42. 319
SFG, Estimating gamma for regulatory purposes, 6 February 2015, para. 53. 320
SFG, An appropriate regulatory estimate of gamma, 21 May 2014, paras. 294–313, 331–334 and 341(b).

4-84 Attachment 4 – Value of imputation credits | Final decision: Amadeus Gas Pipeline Access
Arrangement 2016–21
The AEMC's 2012 rule change
McKenzie and Partington (2013)
Handley (2008), and
Hathaway and Officer (2004).
In our decisions released in 2014, we set out why we disagreed with Gray's view on each
piece of evidence.321 In his February 2015 report (for SFG), Gray set out why his view on this
evidence has not changed.322 Gray's February 2015 report (for SFG) and June 2015 and
January 2016 report (for Frontier) does not change our view as set out in our earlier
decisions. It seems that the disagreement between us and Gray regarding this evidence is
unlikely to be resolved.
A.7.3 Gray's comments on Officer (1994)
Gray set out his views on Officer's 1994 paper in his May 2014 and February 2015 reports
for SFG, and in his June 2015 and January 2016 report for Frontier. These views do not
change our own view, consistent with the advice of Handley, that the value of imputation
credits should be estimated on a before-personal-tax and before-personal-costs basis. We
respond to Gray's comments on Officer below.
The text in Officer (1994)
Gray (for SFG) submitted that Officer's paper suggests that there are two possible
interpretations of gamma:323
(a) Officer means gamma to have a value interpretation and that words suggesting a
utilisation interpretation were poorly drafted (i.e., the reference to utilisation should be
read as simply identifying the source of value); or
(b) Officer means gamma to have a utilisation interpretation and that words
suggesting a value interpretation were poorly drafted (i.e., the reference to value
should be read as "the number used for" rather than "worth.
I concluded that the value interpretation was plausible and the utilisation/redemption
interpretation was not, and set out my reasons for doing so. Nothing in the AER's
recent draft decisions lead me to change my conclusion on this point.
We do not agree with Gray's opinion. As explained by Handley in his September 2014
report, interpretation of gamma on a before-personal-tax and before-personal-costs basis
321
See section A.6.1 of the draft decisions. 322
SFG, Estimating gamma for regulatory purposes, 6 February 2015, paras. 111–121 and 136–137. 323
SFG, Estimating gamma for regulatory purposes, 6 February 2015, paras. 122–123.

4-85 Attachment 4 – Value of imputation credits | Final decision: Amadeus Gas Pipeline Access
Arrangement 2016–21
reconciles this apparent inconsistency in Officer;324 that is, on this basis the 'value' and
'utilisation' interpretations are consistent. Handley reiterates this in his April 2015 report:325
This is precisely the reason why Officer refers to gamma as the value of franking
credits in some parts of the paper, and as the proportion of tax collected from the
company which will be rebated against personal tax, in other parts of the paper.
These two descriptions are equivalent when one interprets value to mean the value of
imputation credits before personal tax and before personal costs.
There would appear to be further support for Handley's view in the first line of footnote 5 of
Officer's paper, which seemingly equates the ideas of 'utilisation' and 'value':326
For example, if the shareholder can fully utilize the imputation tax credits then
("value") 𝛾 = 1, e.g. a superfund or an Australian resident taxpayer.
Handley also noted:327
It is clear that the Officer WACC valuation framework is a before-personal-tax
framework. It is also a before-personal-cost framework in the limited sense that, there
is no explicit adjustment (deduction) made to the cash flows or the discount rate for
either personal taxes or personal costs.
On the other hand, if gamma was intended to reflect investors' personal taxes and costs,
then the proportion of company tax returned to investors would never be equivalent to the
value to investors per dollar of imputation credits. This is because, on an after-personal-tax
and after-personal-costs basis where such taxes and costs were non-negligible, investors
would likely value credits at less than their face value. Therefore, there would be no
justification for defining gamma, as Officer does, in terms of the proportion of company tax
returned to investors. As shown in the earlier quote, Gray attributes such a definition to 'poor
drafting'. However, this is unconvincing to us.
Further, if the intended interpretation of gamma is on an after-personal-tax and after-
personal-costs basis, then it would seem to make little sense to contemplate, as Officer does
in footnote 5 of his paper, an investor having an individual utilisation rate of 1.328 Again, this
is because, on an after-personal-tax and after-personal-costs basis where such taxes and
costs were non-negligible, investors would likely value credits at less than their face value.
Conversely, Gray has previously argued that it is difficult to understand why Officer would
contemplate in the same footnote the estimation of gamma via dividend drop off studies if
the correct interpretation of gamma was as the proportion of company tax returned to
324
J. Handley, Report prepared for the Australian Energy Regulator: Advice on the value of imputation credits, 29 September
2014, pp. 8–9. 325
J. Handley, Report prepared for the Australian Energy Regulator: Further advice on the value of imputation credits, 16
April 2015, p. 5. 326
R. Officer, 'The cost of capital of a company under an imputation system', Accounting and finance, vol. 34(1), May 1994,
pp. 1–17. 327
J. Handley, Report prepared for the Australian Energy Regulator: Further advice on the value of imputation credits, 16
April 2015, p. 4. 328
Recall that the utilisation rate equals gamma under Officer's perpetuity framework.

4-86 Attachment 4 – Value of imputation credits | Final decision: Amadeus Gas Pipeline Access
Arrangement 2016–21
investors.329 However, as we have maintained throughout the Guideline and current
determination process, implied market value studies remain a relevant estimation method for
gamma. This is because any value attributed to credits which can be inferred from market
prices is ultimately derived from the utilisation of those credits.
Finally, our view is supported by Officer's treatment of gamma in the numerical example in
the appendix to his paper. Officer describes this numerical example as ‘…designed to help
the reader through some of the obstacles to going from theory to practice’:330
Assume that 50 percent of the tax collected at the company level represents personal
tax, i.e. 50 percent of tax credits can be utilized against personal tax liabilities so that
𝛾 = 0.5.
The formulas in Officer (1994)
Gray (for SFG) submitted that the formulas in Officer (1994) support his interpretation of the
value of imputation credits:331
…gamma represents the extent to which imputation credits are capitalised into the
market value of equity. I note that this is precisely what is estimated by dividend drop-
off analysis and other market value studies. The formula shows that one takes the
present face value of imputation credits (𝐼𝐶 𝑟𝑒⁄ ) and then multiplies by gamma and the
result makes up part of the market value of equity.
Another way to see this is to rearrange the formula to isolate gamma as follows:
𝐸𝑤𝑖𝑡ℎ−𝐼𝐶 = 𝐸𝑒𝑥−𝐼𝐶 + 𝛾𝐼𝐶
𝑟𝑒
where 𝐸𝑤𝑖𝑡ℎ−𝐼𝐶 represents the market value of equity including imputation credits,
𝐸𝑒𝑥−𝐼𝐶 represents the market value of equity excluding imputation credits and 𝐼𝐶 𝑟𝑒⁄
represents the present face value of imputation credits. It is clear in this formula that
gamma does not represent the proportion of imputation credits that might be
redeemed, but the extent to which imputation credits increase the market value of
equity.
Handley reviewed Gray's submission and considered:332
SFG (2015 para. 124-135) also suggests that the mathematical formulae in Officer
(1994) support a value interpretation of gamma but not a redemption value
interpretation since: “It is clear in this formula [para.127] that gamma represents …
the extent to which imputation credits increase the market value of equity”. There is
no dispute that the (market) value of credits are capitalised into stock prices – this is
329
SFG, An appropriate regulatory estimate of gamma, 21 May 2014, para. 319. 330
R. Officer, 'The cost of capital of a company under an imputation system', Accounting and finance, vol. 34(1), May 1994,
pp. 11–17. 331
SFG, Estimating gamma for regulatory purposes, 6 February 2015, paras. 126–127. 332
J. Handley, Report prepared for the Australian Energy Regulator: Further advice on the value of imputation credits, 16
April 2015, p. 7.

4-87 Attachment 4 – Value of imputation credits | Final decision: Amadeus Gas Pipeline Access
Arrangement 2016–21
clear from equation (2) [in Handley's report]. However, SFG fails to see that within
Officer’s framework it is the before personal tax and before personal costs value of a
credit – the redemption value – which is the item being capitalised.
Thus, Handley appeared to agree with Gray that the formulas in Officer indicated that the
value of imputation credits is capitalised into stock prices. However, Handley considers (for
the reasons set out in the previous sub-section) that it is the before-personal-tax and before-
personal-costs value which is capitalised into the stock price in Officer's framework. As also
set out in the previous sub-section, we agree with Handley's interpretation of the Officer
framework.
Interpretation of gamma in textbooks
In his June 2015 report (for Frontier), Gray stated:333
I am unaware of any published work that interprets gamma in terms of the redemption
rate.
However, there are several textbooks that describe gamma in a manner consistent with our
understanding. For example, Peirson et al (2009):334
Officer (1994) discussed several alternative ways of defining net cash flows and the
cost of capital under imputation. One way to define the after-tax cash flows is that
they are equal to the before-tax cash flows multiplied by (1 − 𝑡𝑒), where 𝑡𝑒 is the
effective company income tax rate. The effective company tax rate is 𝑡𝑒 = 𝑡𝑐(1 − 𝛾),
where 𝑡𝑐 is the statutory company tax rate and 𝛾 represents the proportion of the tax
collected from a company that is paid out to shareholders and recovered through tax
credits associated with franked dividends.
…
For example, if…the company income tax rate is 30 cents in the dollar, and 60 per
cent of the tax collected from the company is claimed as a credit by shareholders,
then the effective company tax rate is 0.30(1 − 0.6) = 0.12..
Berk et al (2014):335
In a 1994 study, Officer shows that for valuation purposes the cost of equity under an
imputation system should be adjusted by a factor equal to:
1 − 𝑇
1 − 𝑇(1 − 𝛾)
333
Frontier Economics, An appropriate regulatory estimate of gamma, June 2015, p. 24. 334
G. Peirson, R. Brown, S. Easton and P. Howard, Business Finance, 10th Edition, 2009, pp. 429 and 432. 335
J. Berk, P. DeMarzo, J. Harford, G. Ford, V. Mollica and N. Finch, Fundamentals of Corporate Finance, 2nd Edition, 2014,
p. 535.

4-88 Attachment 4 – Value of imputation credits | Final decision: Amadeus Gas Pipeline Access
Arrangement 2016–21
where 𝑇 represents the effective corporate tax rate and (𝛾) represents the proportion
of tax collected from the firm that will be rebated against personal tax in the hands of
shareholders.
Gitman et al (2011):336
If we let 𝛾 be the proportion of company income tax that can be used by shareholders
to offset their personal income tax liabilities…
…
With dividend imputation, the calculation of the weighted average cost of capital
depends heavily on the estimate of 𝛾. For a good estimate of 𝛾 we would need to
know the proportion of company income that has borne Australian income tax, and
the proportion of the company's shareholders who were Australian residents who
could benefit from dividend imputation.
Gray quoted approvingly from a textbook co-authored by Partington in 2000, but none of the
statements quoted contradict our understanding of gamma. For instance, Gray quoted:337
𝛾 = the market value of franking credits as a percentage of face value.
However, there is no dispute here. As Handley explained:338
Implicit in Officer's WACC framework (and the standard classical tax WACC
framework) is the notion of market value and so the relevant measure of utilisation
value is that value as determined by the market – in other words it is not the utilisation
value of a credit to any single investor or the utilisation value to any single class of
investors that we want but rather the utilisation value to the market as a whole. In
contrast, much of the current debate appears to incorrectly suggest that market value
and utilisation value are alternative concepts for this purpose.
Moreover, there are other references to gamma in Partington's textbook that accord more
closely with the characterisation in Officer's paper:
𝛾 = the proportion of corporate tax recovered by investors through imputation tax
credits.339
We assume a 100 per cent dividend payout and full use of imputation credits (𝛾 =
1)…However, 100 per cent payout and full use of imputation credits are unrealistic
assumptions. It is more realistic to assume that about 50 to 60 per cent of profits are
336
L. Gitman, R. Juchau and J. Flanagan, Principles of Managerial Finance, 6th Edition, 2011, pp. 543 and 546. 337
Frontier Economics, An appropriate regulatory estimate of gamma, June 2015, p. 24. 338
J. Handley, Report prepared for the Australian Energy Regulator: Advice on the value of imputation credits, 29 September
2014, p. 9. 339
R. Brealey, S. Myers, G. Partington and D. Robinson, Principles of corporate finance, 1st Edition, 2000, p. 523, footnote 8.

4-89 Attachment 4 – Value of imputation credits | Final decision: Amadeus Gas Pipeline Access
Arrangement 2016–21
paid out as dividends. Of the imputation credits attached to those dividends only
about 50 to 60 per cent will be claimed by investors to offset their tax liabilities.340
Gray also quoted:341
The results have been mixed, but they suggest that the market value of franking
credits is positive, but significantly less than the credit’s face value.
…
…the market value of the franking credit is likely to differ from its face value. We do
not know exactly what the market value is, but the evidence suggests that franking
credits are valued at a significant discount to their face value.
Again, there is no dispute. The estimates of the utilisation rate on which we rely are all
significantly less than one, and our estimate of gamma is significantly less than one.
Finally, Gray quoted an explanation, with which he agreed, as to why imputation may have
had an immaterial effect on the corporate cost of equity capital:342
The impact of imputation may not have been that big. There are several reasons for
this. As suggested by Bob Officer, in a small open economy like Australia, equilibrium
rates of return are likely to be determined by capital flows from international investors.
If so, domestic tax changes are likely to have a reduced effect, or no effect at all, on
equilibrium rates of return.
The implications of this quote for understanding or determining gamma are unclear to us.
For instance:
Gray appeared elsewhere to be of the view that imputation is having a material effect on
the cost of capital. This is because he submitted that, in his view, the best estimate of the
extent to which imputation credits are capitalised into stock prices per dollar of credit
distributed is 0.35, and this is not immaterial.343
The view in a recent paper co-authored by Partington did not appear to align with that in
the quote:344
Indeed, whether prices are set by a marginal investor, or by aggregation across
investors, is an open question… It is our contention, therefore, that a policy decision
should not be based on the assertion that the marginal investor setting prices in the
Australian market is an overseas investor. To do so would base policy on an insecure
foundation, and risks serious error.
340
R. Brealey, S. Myers, G. Partington and D. Robinson, Principles of corporate finance, 1st Edition, 2000, p. 526. 341
Frontier Economics, An appropriate regulatory estimate of gamma, June 2015, p. 25. 342
Frontier Economics, An appropriate regulatory estimate of gamma, June 2015, p. 25. 343
Frontier Economics, An appropriate regulatory estimate of gamma, June 2015, p. 6. 344
A. Ainsworth, G. Partington and G. Warren, Do franking credits matter? Exploring the financial implications of dividend
imputation, May 2015.
4-90 Attachment 4 – Value of imputation credits | Final decision: Amadeus Gas Pipeline Access
Arrangement 2016–21
Recent academic work
The recent paper co-authored by Partington has been raised in direct support of the position
that the equity ownership approach is not an appropriate way to estimate the value of
distributed imputation credits.345 This paper largely draws on the existing literature and
available evidence with the intention of contributing to the policy debate around the efficacy
of dividend imputation.346 While the paper does consider relevant matters, we consider that
the paper raises a number of issues without making strong recommendations. Consistent
with the above quote it notes:347
Whether the marginal investor or aggregation approach better describes how
imputation credits become priced in equilibrium is a point of debate. The marginal
investor approach might be seen as more in keeping with the ‘Economics 101’
notions of price determination, and more consistent with general equilibrium analysis
under which investor demand for (and supply of) imputation credits is jointly
determined with the market clearing price. As a consequence, the marginal investor
approach may assist in analysing the potential effect of changes in the demand curve.
By contrast, aggregating observed demands assumes that investors have found their
equilibrium position given market prices [footnote 6: Monkhouse (1993) explicitly
states this assumption]. It thus does not directly address how the market equilibrium
emerges in the first place. Nevertheless, the aggregation approach may still provide a
useful description of an existing equilibrium. In any event, the key point is that there is
no clear consensus on the appropriate approach, adding another layer of uncertainty
to the issue of whether imputation credits are priced.
As such, while the paper raises a number of points highlighted by Gray (for Frontier), we do
not consider the paper provides evidence that the equity ownership approach that uses the
aggregation approach to estimate the value of theta is not reasonable. Frontier has taken a
number of statements from the paper that should not be read in isolation of the remainder of
the paper. For example, in response to Gray's point at paragraph 189 where he states
"Ainsworth, Partington and Warren (2015) note that the evidence generally suggests that the
two companies do sell for the same price",348 the paper makes clear this evidence needs to
be treated with caution stating:349
In contrast, examination of returns and price levels reveals little evidence that
imputation credits are priced. Lajbcygier and Wheatley (2012) find that the presence
of imputation credits is not associated with lower realised returns. Further, they find a
positive relation between realised returns and imputation credits, which is significant
under some specifications. This implies an (implausible) negative value on imputation
345
Access Arrangement Information for Australian Gas Networks' South Australian Natural Gas Distribution Network, p. 11,
July 2015; Frontier Economics, An appropriate regulatory estimate of gamma, June 2015, pp. 45–48. 346
A. Ainsworth, G. Partington and G. Warren, Do franking credits matter? Exploring the financial implications of dividend
imputation, May 2015, p. 3. 347
A. Ainsworth, G. Partington and G. Warren, Do franking credits matter? Exploring the financial implications of dividend
imputation, May 2015, p. 14. 348
Frontier Economics, An appropriate regulatory estimate of gamma, June 2015, p. 46. 349
A. Ainsworth, G. Partington and G. Warren, Do franking credits matter? Exploring the financial implications of dividend
imputation, May 2015, p. 17.

4-91 Attachment 4 – Value of imputation credits | Final decision: Amadeus Gas Pipeline Access
Arrangement 2016–21
credits. While the sign on the coefficient probably flags issues with the empirical
method (see Section 4.2), it is nevertheless the case that no hint emerges that
imputation credits have lowered the distribution of realised returns. Saiu, Sault and
Warren (2015) find that imputation might be reflected in share prices under
discounted cash flow models, at perhaps about $0.30 in the dollar. However, the
imputation variable adds little explanatory power. Meanwhile, the results under the
earnings yield model and portfolio sorts suggest that imputation credits are not priced,
and in fact may be associated with higher earnings yields as well as lower prices
relative to other valuation measures.10 The fact that the earnings yield results have
the wrong sign suggests that caution needs to be applied in interpreting these
findings (similar to Lajbcygier and Wheatley, 2012).
On the same page the paper also states in relation to some empirical evidence more
generally:350
A very mixed set of results emerges from this body of research. Figure 4 (over)
summarises the findings from the majority of dividend drop-off and comparative
pricing studies. While a wide range of estimates emerges, these studies on balance
indicate that imputation credits are partially priced. The data points in Figure 4
average 0.38, which would suggest that imputation credits are priced at about $0.38
in the dollar.
A.7.4 Gray's comments on the Monkhouse framework
As discussed in section A.6, we consider that:
The Officer framework provides the basis for the value of imputation credits adjustment in
the NER/NGR.
Monkhouse extends the Officer framework to a non-perpetuity setting, and shows that—
assuming retained credits have no value—gamma from the Officer framework effectively
equals the product of:
o the distribution rate, and
o 𝜃 (theta), which is the utilisation value to investors in the market per dollar of
imputation credits distributed (the 'utilisation rate'), which in equilibrium is equal to
the weighted average, by wealth and risk aversion, of the individual utilisation
rates of investors in the market.
In his May 2014 and February 2015 reports, Gray (for SFG) provided a discussion of the
class of CAPM employed by Monkhouse (and related literature).351 Gray concluded that our
recognition of foreign investors breaches the assumptions of this class of CAPM, and
therefore we cannot estimate the value of imputation credits using the definition of theta in
equilibrium from the Monkhouse framework. Gray's June 2015 report (for Frontier), upon
350
A. Ainsworth, G. Partington and G. Warren, Do franking credits matter? Exploring the financial implications of dividend
imputation, May 2015, p. 17. 351
SFG, An appropriate regulatory estimate of gamma, 21 May 2014, appendix 6; SFG, Estimating gamma for regulatory
purposes, 6 February 2015, section 4.

4-92 Attachment 4 – Value of imputation credits | Final decision: Amadeus Gas Pipeline Access
Arrangement 2016–21
which a number of service providers rely, holds the same view and notes the inconsistency
between Lally and Handley's advice on this point352
Handley responded to Gray's view in his September 2014 and April 2015 reports and his
response is equally applicable to the June 2015 report by Gray (for Frontier). He disagrees
with Gray's view, and considers reasonable our use of:353
the definition of theta from the Monkhouse framework, and
the equity ownership approach to estimate theta.
In the remainder of this section we identify what we consider to be the key points of this
debate, and their implications for our estimation of the value of imputation credits.
Gray's key point appears to be that:354
[The relevant class of CAPM models] derive an equilibrium by solving a market
clearing condition. This involves noting that:
(a) All of the m investors must invest all of their wealth across the n assets and
nothing else; and
(b) All of the n assets must be owned entirely by the m investors and no one else.
This suggests that the only legitimate application of the CAPM is one which recognises all
investors and assets in the world (that is, an international CAPM). However, CAPMs have
been employed in contexts other than the international one. Handley suggested that the key
consideration is whether assets and investors that are outside the model are relevant to the
determination of the prices of assets inside the model:355
[SFG’s claim that a representative investor equilibrium does not apply in the AER’s
framework] – which appears to be SFG’s major criticism of this approach – is not
correct since it is based on SFG’s incorrect assertion that the market clearing
condition invoked in the CAPM class of equilibrium asset pricing models is based on
an assumption that the m investors in the model invest all their wealth across the n
assets in the model and nothing else.
But the CAPM makes no such assumption – it is SFG who does.
An implication of SFG’s assertion is that one could validly use a “domestic” version of
the CAPM say to price U.S. stocks only if you assume that investors in the U.S. stock
market hold no other assets except U.S. stocks. Such an assumption would be clearly
implausible.
352
Frontier Economics, An appropriate regulatory estimate of gamma, June 2015, pp. 17–18. 353
J. Handley, Report prepared for the Australian Energy Regulator: Advice on the value of imputation credits, 29 September
2014, pp. 22–23, 30–31 and 35; J. Handley, Report prepared for the Australian Energy Regulator: Further advice on the
value of imputation credits, 16 April 2015, pp. 3–11. 354
SFG, Estimating gamma for regulatory purposes, 6 February 2015, para. 89. 355
J. Handley, Report prepared for the Australian Energy Regulator: Further advice on the value of imputation credits, 16
April 2015, pp. 10–11.

4-93 Attachment 4 – Value of imputation credits | Final decision: Amadeus Gas Pipeline Access
Arrangement 2016–21
An alternative and less extreme assumption which is implicit in the use of a
“domestic” version of the CAPM is that any assets outside the model and any
investors outside the model are not relevant for determining the prices of the assets
inside the model. This is equivalent to saying that the system is “closed” by definition
– everything that matters is inside the model and anything outside the model does not
matter – which means a standard market clearing condition can indeed be invoked
and a valid equilibrium can be found. There is nothing in the Copeland and
Rosenberg statements quoted in SFG (2015) which is inconsistent with this approach.
Therefore, it would seem that the criticisms of our use of the definition of theta from the
Monkhouse framework, and our responses to those criticisms, might be summarised as
follows:
By not using all assets and investors in the world, we are breaching a fundamental
condition required by CAPMs to derive an equilibrium value. However, CAPMs have
been used in contexts other than the international one, and therefore we are not
convinced that this criticism presents grounds to disregard these models.
The following implicit assumption in our approach is unreasonable: that the foreign asset
holdings of (both Australian and foreign) investors in Australian assets are not relevant to
those investors' valuation of Australian assets. Gray's view is that the assumption is
unreasonable.356 Handley's view is, if the assumption is considered unreasonable, 'then
one should bring the outside assets and outside investors into the model, for example,
by using an international CAPM'.357 However, neither Gray nor Handley suggested that
we employ an international CAPM. Moreover, Handley clearly set out his view that our
use of the definition of theta from the Monkhouse framework is reasonable.358
In conclusion, we are not convinced that we should disregard the definition of theta from the
Monkhouse framework when estimating the value of imputation credits.
A.8 Further issues relating to the utilisation rate
As discussed in section A.6, we define the utilisation rate as the utilisation value to investors
in the market per dollar of imputation credits distributed. As also discussed in section A.6,
the utilisation rate is equal to the weighted average, by wealth and risk aversion, of the
utilisation rates of individual investors. For an ‘eligible’ investor, each dollar of imputation
credit received can be fully returned to the investor in the form of a reduction in tax payable
or a refund. Therefore, we consider that eligible investors have a utilisation rate of 1 (on a
before-personal-tax and before-personal-costs basis). Conversely, ‘ineligible’ investors
cannot utilise imputation credits and have a utilisation rate of 0. It follows that the utilisation
356
SFG, An appropriate regulatory estimate of gamma, 21 May 2014, appendix 6; SFG, Estimating gamma for regulatory
purposes, 6 February 2015, paras. 103–105. 357
J. Handley, Report prepared for the Australian Energy Regulator: Further advice on the value of imputation credits, 16
April 2015, footnote 14. 358
J. Handley, Report prepared for the Australian Energy Regulator: Advice on the value of imputation credits, 29 September
2014, pp. 22–23, 30–31 and 35; J. Handley, Report prepared for the Australian Energy Regulator: Further advice on the
value of imputation credits, 16 April 2015, pp. 3–11.

4-94 Attachment 4 – Value of imputation credits | Final decision: Amadeus Gas Pipeline Access
Arrangement 2016–21
rate reflects the extent to which investors can utilise the imputation credits they receive to
reduce their tax or get a refund.
This is supported by Lally who considers that within the Officer Framework model, the
utilisation rate is a weighted average over the utilisation rate for imputation credits by
individual investors and these utilisation rates are 1 if investors can use the credits and zero
otherwise.359
In this section we provide further support for our position on the utilisation rate. In particular,
we:
explain how our position is consistent with the basis of the building block framework
contrast our position with that of the service providers, including with reference to factors
they considered should be reflected in the utilisation rate, and
respond to NERA's view.
A.8.1 Consistency with the building block framework
To be consistent with the building block framework, the utilisation rate should reflect the
before-personal-tax and before-personal-costs value of imputation credits to investors. In a
before-personal-tax and before-personal-costs framework, an investor that is eligible to fully
utilise imputation credits should value each dollar of imputation credits received at one dollar
(that is, have a utilisation rate of 1).
This consideration is supported by Handley's advice on the basis of the regulatory (building
block) framework:360
The post-tax basis of the regulatory framework can be more fully described as an
after-company-before-personal-tax framework. In other words, cash flows and returns
are to be measured after company taxes but before personal taxes. By definition, this
means that allowed revenues should include compensation for corporate taxes
incurred by the regulated firm but not for personal taxes incurred by the firm’s
shareholders. Similarly, allowed revenues should include compensation for prudent,
efficient costs incurred by the regulated firm but not for costs (including personal
transactions costs) incurred at the shareholder level. Note, this does not mean that
personal taxes and costs are being ignored or assumed not to exist – rather there is
no need to explicitly include them in the modelling framework.
359
M. Lally, Gamma and the ACT Decision, May 2016, pp. 8-9. 360
J. Handley, Report prepared for the Australian Energy Regulator: Advice on the value of imputation credits, 29 September
2014, pp. 4–5.

4-95 Attachment 4 – Value of imputation credits | Final decision: Amadeus Gas Pipeline Access
Arrangement 2016–21
Handley also referred specifically to the basis on which the utilisation rate should be
estimated:361
Since the objective is to estimate the after-company-before-personal-tax value of a
distributed imputation credit and also to avoid compensating the regulated firm for
transactions costs incurred at the shareholder level then the particular estimation
methodology should allow for these factors – in other words, ideally we want the
value of credits before administrative costs, personal taxes and diversification costs.
The service providers consider our interpretation of the utilisation rate conceptually incorrect
and inconsistent with the requirements of the NER/NGR.362 They submitted that we are
required to estimate the value of imputation credits, not the expected utilisation value of
distributed credits, or a measure of investor's eligibility to utilise those credits.363 Specifically,
a number of service providers submitted:364
It is certainly true that theta must reflect the value of imputation credits to investors.
However it is unusual for theta to be defined in a way that excludes the effect of
certain factors that may impact on value (and which will be reflected in market value
measures), such as personal costs.
We disagree. We consider that our approach is consistent with the NER/NGR. We have
previously noted in the Guideline and in our prior decisions, and maintain in this final
decision, that the Officer framework provides the basis for the rate of return framework in the
NER/NGR.365 This point has not been contested by the service providers or their
361
J. Handley, Report prepared for the Australian Energy Regulator: Advice on the value of imputation credits, 29 September
2014, p. 46. 362
Australian Gas Networks, Attachment 11 Response to Draft Decision: Cost of Tax, January 2016, pp. 2,4,6; ActewAGL,
Appendix 5.01 Detailed response to rate of return, gamma and inflation, January 2016, p. 40; AusNet Electricity Services,
Revised Regulatory Proposal, January 2016, p. 7-79; United Energy, Response to AER Preliminary Determination Re:
Rate of return and gamma, January 2016, p. 80; CitiPower, Revised Regulatory Proposal 2016-2020; January 2016,
p. 358; Jemena Electricity Networks, Attachment 6-1 Rate of return, gamma, forecast inflation, and debt and equity raising
costs, January 2016, p. 86; Powercor, Revised Regulatory Proposal 2016-2020, January 2016, p. 352. 363
Australian Gas Networks, Attachment 11 Response to Draft Decision: Cost of Tax, January 2016, p. 6; ActewAGL,
Appendix 5.01 Detailed response to rate of return, gamma and inflation, January 2016, pp. 41, 108; AusNet Electricity
Services, Revised Regulatory Proposal, January 2016, pp. 7-79, 7-80; United Energy, Response to AER Preliminary
Determination Re: Rate of return and gamma, January 2016, p. 81; CitiPower, Revised Regulatory Proposal 2016-2020;
January 2016, p. 358; Jemena Electricity Networks, Attachment 6-1 Rate of return, gamma, forecast inflation, and debt
and equity raising costs, January 2016, p. 87; Powercor, Revised Regulatory Proposal 2016-2020, January 2016, p. 352. 364
ActewAGL, Detailed response to the AER's draft decision in relation to gamma, January 2015, p. 2; Ausgrid, Ausgrid's
revised proposal on gamma, January 2015, p. 4; Directlink, Directlink submission on gamma (updated), January 2015, p.
5; Endeavour Energy, Endeavour Energy's response to the AER draft decision re gamma, January 2015, p. 4; Essential
Energy, Essential's response to AER draft decision re gamma, January 2015, p. 4; JGN, Gamma - response to the draft
decision, February 2015, p. 6; AusNet Services, 2016-20 Regulatory Proposal, April 2015, p. 360; United Energy,
Assessment of the Value of Imputation Credits - Gamma, Proposal for 2016 to 2020, April 2015, p. 9; CitiPower,- Appendix
J - Gamma, April 2015, p. 9; Powercor, Appendix J - Gamma, April 2015, p. 9; Jemena Electricity, Attachment 06-06
Gamma proposal, April 2015, p. 9 ; Energex, Submission on Energex's regulatory proposal 2015-20 and AER issues
paper - attachment 2, January 2015, p. 6; ActewAGL Distribution, Attachment 8 Detailed gamma proposal, June 2015, p.
7. 365
See section A.5 of the draft decisions and: AER, Better regulation: Explanatory Statement Rate of Return Guideline,
Appendices, December 2013, p. 138.

4-96 Attachment 4 – Value of imputation credits | Final decision: Amadeus Gas Pipeline Access
Arrangement 2016–21
consultants. If the Officer framework provides the basis for the rate of return framework in
the NER/NGR, then it is reasonable—if not necessary—to estimate gamma in a manner
consistent with Officer. Therefore, we have considered whether Officer's framework is
intended to reflect factors such as personal taxes and personal costs when determining the
rate of return. We consider that it is not, and that Handley's and Lally's advice supports our
approach. Gray (for both SFG and Frontier) disagrees, but as discussed in section A.7.3,
Gray's interpretation is unconvincing to us.
Put another way, our approach to estimating the value of imputation credits recognises that
this parameter does not exist in isolation. That is, the NER/NGR employ the building block
framework to determine a revenue allowance that contributes to the achievement of the
NEO/NGO. The building block framework employs the Officer framework to determine a rate
of return that contributes to meeting the NEO/NGO, and gamma forms part of the Officer
framework. We consider that proper regard to the NER/NGR's use of the Officer framework
best promotes the objectives and requirements of the NER/NGR.
Handley supports our approach and has explicitly stated that the AER's definition of theta
does correspond to a "market value" on a before personal taxes and before personal costs
basis:366
When used in everyday language, the meaning of the term “value” is generally well
understood. However, in a cost of capital context, the term value is potentially
ambiguous. Value can be used to refer to a value before taxes or a value after taxes.
It can refer to a value before costs or a value after costs. The term “rate of return” (or
discount rate) is similarly potentially ambiguous. A return can be measured or defined
before taxes or after taxes. A return can also be measured or defined before costs or
after costs.
This is why it is very important to be absolutely precise about how the key inputs of a
WACC analysis – cash flow and discount rate – are defined and to ensure that they
are defined on the same basis.
The AER definition of theta does indeed correspond to a market value (as in “worth to
investors”) interpretation of theta if value is taken here to mean the value of
imputation credits before personal taxes and before personal costs. This
interpretation is neither novel nor new. It comes directly from the seminal 1994 paper
by Officer.
Finally, given the discussion above that indicates why we consider our definition of theta is
an estimate of the value of imputation credits to investors in the market before personal
taxes and personal transactions costs, we consider there is little in the service providers
position that imputation credits should either be interpreted as the value of distributed
credits, or the proportion of distributed credits likely to be redeemed by investors. Handley
366
J. Handley, Report prepared for the Australian Energy Regulator: Further advice on the value of imputation credits, 16
April 2015, pp. 3-4.

4-97 Attachment 4 – Value of imputation credits | Final decision: Amadeus Gas Pipeline Access
Arrangement 2016–21
also states with respect to the alleged difference between the value of imputation credits and
the redemption value:367
There is no either-or decision to be made here. The value of distributed credits and
the proportion of credits redeemed are the same thing when one uses the proper
definition of “value” in relation to theta (and gamma). Specifically, theta is the value of
a dollar of distributed credits before personal taxes and before personal costs. In this
case, the value of the credits and the proportion of the credits redeemed are one and
the same thing. This is why Officer (1994) uses both descriptions interchangeably
when referring to gamma in his seminal paper.
Handley also states:368
SFG (2015 para. 124-135) also suggests that the mathematical formulae in Officer
(1994) support a value interpretation of gamma but not a redemption value
interpretation since: “It is clear in this formula [para.127] that gamma represents …
the extent to which imputation credits increase the market value of equity”. There is
no dispute that the (market) value of credits are capitalised into stock prices – this is
clear from equation (2) above. However, SFG fails to see that within Officer’s
framework it is the before personal tax and before personal costs value of a credit –
the redemption value – which is the item being capitalised.
A.8.2 Consistency with other allowed rate of return parameters
We consider we are estimating the value of imputation credits consistently with the other
allowed rate of return parameters on a post company tax basis before personal taxes and
personal costs.
For instance, when estimating the MRP, the dividend yield component is determined by the
face value of dividends where one dollar of dividends paid by the company is valued at one
dollar to the investor. We do not account for the personal costs and personal taxes
associated with cash dividends when estimating the MRP using observed historical market
returns. By contrast, dividend drop-off studies estimate the value one dollar of distributed
cash dividends at less than one dollar (in the range of eighty one cents to ninety three cents
in the case of SFG's study).369 This highlights that dividend drop off studies are not
estimating a post-tax return (which is the full face value of one dollar per one dollar of
dividends distributed). Therefore, given imputation credits are also post tax income (like
dividends), estimates of the value of imputation credits from these studies will require an
adjustment to convert them to a post-tax return. Absent such an adjustment they are not
appropriate to use as estimates of the post-tax value of distributed imputation credits for use
in the Officer Framework underpinning the rules.
367
J. Handley, Report prepared for the Australian Energy Regulator: Further advice on the value of imputation credits, 16
April 2015, p. 2, 3. 368
J. Handley, Report prepared for the Australian Energy Regulator: Further advice on the value of imputation credits, 16
April 2015, p. 7. 369
SFG, Updated dividend drop-off estimate of theta: Report for the Energy Networks Association, 7 June 2013, pp. 18-20.

4-98 Attachment 4 – Value of imputation credits | Final decision: Amadeus Gas Pipeline Access
Arrangement 2016–21
When estimating the MRP we do not use a ninety cent value per one dollar face value of
dividends. Doing so would significantly reduce the MRP estimate and would be
inappropriate. The incorrect post tax valuation of cash dividends from dividend drop off
studies is most likely driven by differential personal tax of dividend income and capital gains.
As noted above, the correct post tax (pre-personal tax and personal costs) value of
dividends is clearly one dollar per dollar of dividends distributed and not ninety cents or less
as implied by the SFG study. The undervaluation relative to the full face value is likely
primarily driven by investors valuing capital gains more highly than dividend income as
capital gains are generally taxed at a concessional personal tax rate.370 We consider that the
incorrect post tax valuation of cash dividends in SFG's dividend drop of study will also be
reflected it the estimates of the value of imputation credits. This is because imputation
credits are also taxed as ordinary income like cash dividends. Therefore, the uncorrected
estimate of the value of imputation credits from a dividend drop off study is not an
appropriate post tax value to use in our post (corporate) tax regulatory framework which is
based on the Officer Framework.371 It neither reflects the post-tax cost faced by the
regulated businesses, nor the post-tax value received by investors. This is further discussed
in section A.15.3, where it is shown that the pre-personal tax value of an imputation credit is
equal to the face value of the imputation credit.
Under the Officer 1994 framework we are effectively assessing the regulated business at the
company level (post company tax and pre personal tax and pre personal costs) and a dollar
of dividends costs the regulated business one dollar and benefits the shareholder by one
dollar. The same argument holds true for imputation credits distributed to eligible domestic
investors. The issues with dividend drop off studies are further discussed in section A.15.3.
The Tribunal decision considered our reasoning ignores the fact that other parameters in the
WACC calculation are market values that already incorporate the effects of the difference in
investors' tax positon and transaction costs.372 In response we note that we consider our
estimates across the rate of return inputs and gamma inputs are consistent and we have not
ignored how the rate of return parameters are estimated. For example, as outlined above,
when estimating the value of the MRP using historical returns, the value of cash dividends
are not assessed on market values which are influenced by pre-personal costs and pre-
personal tax factors. For instance:
Unlike the cash dividend and the imputation estimates from market based studies, the
return measured from market price of debt securities (both corporate bonds and
commonwealth government security) is a genuine post company tax (pre-personal tax
and personal costs) return. As noted above, the estimates of the value of cash dividends
and imputation credits from market based studies are neither pre nor post-personal tax
estimates. They are an estimate of the ordinary income value measured relative to
370
Capital gains are normally taxed at half the marginal tax rate if the investment was held for a period of 12 months or more.
See ATO: https://www.ato.gov.au/general/capital-gains-tax/working-out-your-capital-gain-or-loss/working-out-your-capital-
gain/ accessed: 20 May 2016. 371
N. Hathaway and B. Officer, The value of imputation tax credits, Update 2004, November 2004. 372
Australian Competition Tribunal, Application by Public Interest Advocacy Centre Ltd and Ausgrid [2016] ACompT 1, 26
February 2016, para. 1073.

4-99 Attachment 4 – Value of imputation credits | Final decision: Amadeus Gas Pipeline Access
Arrangement 2016–21
capital gains income (that are generally taxed at a lower rate and are therefore more
valuable). All other input parameters used in the estimate of the cost of debt and risk free
rate, the coupons and principal amount, are valued at 'face value' in order to determine
the yield to maturity. That is, our modelling assumes the investors receive the face value
of the cash flows on these securities, a post-tax value consistent with the Officer
Framework before personal taxes and personal transaction costs are incurred.
Historical capital gains used in estimating the market risk premium are directly
observable post (company) tax returns to investors in the market before personal taxes
and personal transaction costs are incurred.
In the allowed rate of return framework, we use both market values and face values. In Table
4-10 below, we highlight all the parameters that are used in order to calculate the return on
equity using the CAPM.
Table 4-10 Parameters used to determine the return on equity
Market Value Face Value
Risk Free Rate Price of CGS Coupon, Principle
Market Risk Premium Price of equity Dividends, Imputation credits
Beta Price of equity Dividends
As is evident in Table 4-10, in order to determine the return on equity we use a combination
of market values and face values. When determining whether to use market value or face
value, we have to consider whether it is consistent with the Officer framework. All input
parameters in Table 4-10 are to measure cost of equity on the post-company tax but pre-
personal tax and personal costs basis and reflect the cost faced by the firm. For instance,
the return measured from the market price of equity is the post company tax value investors
actually receive before they pay personal taxes and this market price reflects the cost of
equity if a firm tried to issue new capital. Similarly, the face value of dividends and imputation
credits reflects the post company tax cost to the firm and is the value before personal taxes
are incurred. Hence they are post-company tax (pre-personal tax and personal costs)
values.
Similarly, we use a mixture of market values and face values to determine the return on
debt. This is demonstrated in Table 4-11.
Table 4-11 Parameters used to determine the return on debt
Market Value Face Value
Return on debt Price of debt Coupon, Principle
Risk Free Rate Price of CGS Coupon, Principle
As is evident in Table 4-11, the return on debt estimated via the yield to maturity is
determined from using a combination of market values and face values. All input parameters
are to measure the cost of debt on a post-company tax but pre-personal tax basis. For
example, the debt holder has to pay personal tax on the face value of the coupon payments
and if a bond holder sells their bond they have to pay personal on the return measured from

4-100 Attachment 4 – Value of imputation credits | Final decision: Amadeus Gas Pipeline Access
Arrangement 2016–21
market price of the bond. The input parameters also reflect the cost faced by the firm. The
firm has to pay the face value of the coupon and principal to the bond holders. Also the
market price of a bond determines how much funds a firm can raise given a certain coupon
and principal payment.
Consistent with our view, Lally does not consider there is an inconsistency with the cost of
debt and equity being market rates and the utilisation rate being determined on the face
value:373
Both the cost of equity and theta appear in equation (1), with the cost of equity being
a market rate and theta not being a market value. This equation arises from the set of
assumptions underlying the Officer (1994) model.
All allowed rate of return parameters are estimated on a post company tax basis before
personal taxes are incurred. For capital gains component of return on equity estimate,
investors have to pay capital gains tax on the post company tax capital gain. For the
dividend income grossed up with redeemable imputation credits and interest income of
bonds, investors pay personal tax at their marginal tax rate on the post company tax income.
Importantly, the allowed return we estimate is estimated from observed post company tax
returns before these personal taxes are incurred. As a result, all input parameters into the
allowed rate of return are genuine post company tax estimates before personal taxes are
incurred.
Further, all input parameters in the allowed rate of return are also estimated on a pre-
personal cost basis. For example, all components of the return on equity (capital gain,
dividends and imputation credits) are estimated pre-personal costs. If an investor wants to
realise their capital gains by selling their stock, they have to pay transaction costs like
brokerage fees and costs associated with filling in a tax return. These costs are not
accounted for in our post-tax regulatory framework. Similarly, for dividends and bond returns,
personal costs are incurred by investors when realising these returns and these costs are
not accounted for in our regulatory framework. The allowed return we estimate is estimated
from observed post company tax returns before these personal costs and taxes are incurred
(for example. historical estimates of the MRP are before personal costs have been incurred).
A.8.3 Factors affecting investors' valuation of imputation credits
A number of service providers submitted that estimates of the utilisation value from the
equity ownership approach and tax statistics do not reflect a number of factors which affect
investors' valuation of imputation credits.374 They submitted the equity ownership approach
373
M. Lally, Gamma and the ACT Decision, May 2016, p. 12. 374
Australian Gas Networks, Attachment 11 Response to Draft Decision: Cost of Tax, January 2016, 1; ActewAGL, Appendix
5.01 Detailed response to rate of return, gamma and inflation, January 2016, pp. 112-114; AusNet Electricity Services,
Revised Regulatory Proposal, January 2016, pp. 7-83, 7-84; United Energy, Response to AER Preliminary Determination
Re: Rate of return and gamma, January 2016, pp. 84-86; CitiPower, Revised Regulatory Proposal 2016-2020; January
2016, pp. 362-364; Jemena Electricity Networks, Attachment 6-1 Rate of return, gamma, forecast inflation, and debt and
equity raising costs, January 2016, pp. 90-92; Powercor, Revised Regulatory Proposal 2016-2020, January 2016, pp. 356-
358.

4-101 Attachment 4 – Value of imputation credits | Final decision: Amadeus Gas Pipeline Access
Arrangement 2016–21
is at best an upper bound as domestic investors cannot use imputation credits due to the 45
day rule and investors that can use imputation credit do not value them at full face value.375
Service providers submit that tax statistics provide a closer value of imputation credits in
comparison to equity ownership, but it still fails to recognise that investors might value
imputation credits at less than face value due to transaction costs, time value of money and
portfolio effects.376 Gray (for Frontier) supports this by submitting that the redemption rate
should be used as an upper bound (0.45-0.46) for utilisation value and that it should not be
used as a point estimate for the utilisation rate.377 Gray (for Frontier) considers that the tax
statistics estimate should be preferred to the equity ownership estimate.378
We addressed each of these factors in our prior decisions, and concluded that they are
either immaterial or should not be accounted for when estimating the properly defined
utilisation value. Nothing in the service providers' revised proposals, nor in the recent
Tribunal decisions referenced in service providers' late submissions, give us cause to
change this conclusion. To the extent time has permitted we have expanded on the following
points in other sections of this decision:
Why estimates from tax statistics and the equity ownership approach are not upper
bounds and can be used as valid point estimates for the utilisation rate (or theta). See
sections A.12, A.13
Why the 45 day rule and other factors preventing utilisation by eligible investors are not
expected to be responsible for the difference between the estimated utilisation rate from
tax statistics and the equity ownership approach. See the following sub section.
The 45-day holding rule
To be eligible to utilise imputation credits, an otherwise-eligible investor must have held the
shares that distributed the credits ‘at risk’ for at least 45 days (90 days for certain preference
shares).379 However, this rule does not apply if the investor's total credit entitlement is below
$5,000.
375
Australian Gas Networks, Attachment 11 Response to Draft Decision: Cost of Tax, January 2016, p. 11; ActewAGL,
Appendix 5.01 Detailed response to rate of return, gamma and inflation, January 2016, pp. 112-114; AusNet Electricity
Services, Revised Regulatory Proposal, January 2016, pp. 7-83, 7-84; United Energy, Response to AER Preliminary
Determination Re: Rate of return and gamma, January 2016, pp. 84-86; CitiPower, Revised Regulatory Proposal 2016-
2020; January 2016, pp. 362-364; Jemena Electricity Networks, Attachment 6-1 Rate of return, gamma, forecast inflation,
and debt and equity raising costs, January 2016, pp. 90-92; Powercor, Revised Regulatory Proposal 2016-2020, January
2016, pp. 356-358. 376
Australian Gas Networks, Attachment 11 Response to Draft Decision: Cost of Tax, January 2016, pp. 11-12; ActewAGL,
Appendix 5.01 Detailed response to rate of return, gamma and inflation, January 2016, pp. 114-115; AusNet Electricity
Services, Revised Regulatory Proposal, January 2016, p. 7-84; United Energy, Response to AER Preliminary
Determination Re: Rate of return and gamma, January 2016, pp. 85-86; CitiPower, Revised Regulatory Proposal 2016-
2020; January 2016, pp. 363-364; Jemena Electricity Networks, Attachment 6-1 Rate of return, gamma, forecast inflation,
and debt and equity raising costs, January 2016, p. 92; Powercor, Revised Regulatory Proposal 2016-2020, January 2016,
pp. 357-358. 377
Frontier Economics, The appropriate use of tax statistics when estimating gamma, January 2016, p. 7. 378
Frontier Economics, The appropriate use of tax statistics when estimating gamma, January 2016, p. 7. 379
See: https://www.ato.gov.au/Individuals/Investing/In-detail/Investing-in-shares/You-and-your-shares-2013-14/?page=11.
Accessed 9 April 2015.

4-102 Attachment 4 – Value of imputation credits | Final decision: Amadeus Gas Pipeline Access
Arrangement 2016–21
A number of service providers stated:380
It has been estimated that the 45-day rule has about a 5-10% impact on the
redemption rate.
The source of this estimate is a 2010 paper by Handley. The relevant passage from this
paper is:381
Post 1 July 2000, [Handley and Maheswaran in their 2008 paper] assume full
utilization of credits by resident individuals since excess credits were refundable from
that time. It is of course likely that the actual utilization rate would be somewhat lower
due to for example, “investor irrationality” and the impact of the 45 day rule but any
difference is likely to be small. (The effect of the 45 day rule is that the franking credit
is denied i.e. the credit is worthless unless certain conditions are satisfied. I am not
aware of any data on the extent to which credits have been denied pursuant to this
rule, but one would expect that it continues to have some operation each year. As a
guide, in their table 4, [Handley and Maheswaran] report that the estimated credit
utilization rate for resident individuals was 94% in 1998, 89% in 1999 and 90% in
2000. Since the rule was operating at this time and assuming the less than 100%
utilization is fully attributable to the impact of the 45 day rule (which would not be the
case since credits were not refundable at that time), then the rule would have had
about a 5-10% impact on the utilisation rate.)
Thus, it seems the service providers' submission as to the impact of the 45-day holding rule
misinterprets the source data upon which it relies, being Handley and Maheswaran's 2008
paper. It does not appear that Handley ever intended the 5 to 10 per cent figure to be
considered a point estimate of the effect of the 45-day holding rule. Rather, we consider that
it was presented as a ‘guide’ to the maximum theoretical effect of the rule’s operation as
indicated by the analysis conducted in Handley and Maheswaran. Our interpretation of
Handley’s intention is supported by the fact that in their paper Handley and Maheswaran
consider the post-2000 utilisation rate to be 1. That is, we consider that if Handley and
Maheswaran had available to them a reliable estimate of the effect of the 45-day holding
rule, then they would have used it. As Handley stated in his 2010 paper, he 'is not aware of
any data on the extent to which credits have been denied pursuant to this rule'.382 Handley
maintained this view in his April 2015 report.383
It is also appears from the above quote that Handley and Maheswaran considered that, if
anything, the 5 to 10 per cent estimate would be an overestimate of the impact of the 45 day
rule. This is because they attribute the full underutilisation of credits in 1998, 1999 and 2000
to the 45 day rule. However, they also note that, in reality, part of this underutilisation would
380
ActewAGL, Gamma, detailed proposal, May 2014, s. 1.4.3; Ausgrid, Ausgrid's gamma proposal, May 2014, p. 14;
Directlink, Directlink submission on gamma, May 2014, p. 15; Endeavour Energy, Endeavour Energy's gamma proposal,
May 2014, p. 14; Essential Energy, Essential Energy's gamma proposal, May 2014, p. 14; JGN, Gamma proposal, June
2014, p. 17; and TransGrid, TransGrid's approach to gamma, May 2014, p. 19. 381
J. Handley, Further issues relating to the estimation of gamma, October 2010, footnote 59. 382
J. Handley, Further issues relating to the estimation of gamma, October 2010, footnote 59. 383
J. Handley, Report prepared for the Australian Energy Regulator: Further advice on the value of imputation credits, 16
April 2015, p. 29.

4-103 Attachment 4 – Value of imputation credits | Final decision: Amadeus Gas Pipeline Access
Arrangement 2016–21
reflect that credits for eligible investors that did not have a tax liability were not refundable in
those years (whereas they are now refundable for cash).
In their late submissions, United Energy, ActewAGL, CitiPower and Powercor submitted the
Tribunal did not agree with our position.384 The Tribunal considered that the issue is not
whether such a class exists (domestic investors that hold for less than 45 days), but the size
of that class to which the value of imputation credits is lower as a result of domestic
shareholders being unable to use them.385 However, as outlined below, we remain of the
view that the 45 day rule and other facts preventing utilisation by eligible investors is likely to
be having an immaterial impact on the utilisation value by domestic investors. For clarity, the
we do not claim there are no domestic investors that hold shares for less than 45 days over
the ex-dividend date. However, we consider this class of investors (that holds share for less
than 45 days over the ex-dividend date) is likely to be immaterial in size and the extent to
which the value of imputation credits is lower as a result of domestic investors being unable
to use them due to this is likely to be immaterial. We also note there is no compelling
evidence to the contrary.
One source of evidence on the effect of the rule is Hathaway's analysis of ATO data. This
analysis indicates the reported amounts of fully franked dividends received and imputation
credits utilised by taxpayers. Taxpayers are required to report in their tax returns all franked
dividends received, but only those imputation credits that they are eligible to utilise (bearing
in mind the 45-day holding rule and other criteria).386 We know that the amount of imputation
credits attached to a dollar of fully franked dividends is $0.43 ($1 x 0.3/(1–0.3)).387
Accordingly, we can compare the amount of imputation credits utilised by taxpayers with the
amount of imputation credits received by those taxpayers as implied by the amount of fully
franked dividends received. If the 45-day holding rule is having a material effect, then we
would expect to see that the amount of credits utilised is materially lower than the amount of
credits implied to have been received. Table 4-12 shows the relevant data for the two major
classes of investor eligible to utilise imputation credits: individuals and superannuation funds.
It shows that the amount of credits utilised is effectively the same as the amount of credits
that are implied to have been received.388 This suggests that the 45-day holding rule is not
having a material effect.
384
Australian Competition Tribunal, Application by Public Interest Advocacy Centre Ltd and Ausgrid [2016] ACompT 1, 26
February 2016, paras. 1048 and 1090. 385
Australian Competition Tribunal, Application by Public Interest Advocacy Centre Ltd and Ausgrid [2016] ACompT 1, 26
February 2016, paras. 1092. 386
See: https://www.ato.gov.au/Individuals/Tax-return/2014/Tax-return/Income-questions-1-12/11---Dividends/. Accessed 9
April 2015. 387
Franked dividends must be paid out of after-tax profits. Accordingly, if the corporate tax rate is 30 per cent, then the pre-
tax profit (X) that gives rise to $1 dollar of fully franked dividends is given by the expression X - 0.3X = $1 where X = $1.43.
Therefore, $0.43 of tax is paid on (and $0.43 of imputation credits can be attached to) each $1 of fully franked dividends. 388
The fact that credits implied to have been received by individuals is higher than credits utilised could reflect rounding or
issues with the dividend data in the ATO statistics. Our residual concerns with the ATO statistics are discussed in section
4.4of attachment 4.

4-104 Attachment 4 – Value of imputation credits | Final decision: Amadeus Gas Pipeline Access
Arrangement 2016–21
Table 4-12 Imputation credits received and utilised, 2004–2011 – $ billions
Individuals Superannuation funds
Fully franked dividends received 188.1 84.8
Implied imputation credits received 80.6 36.3
Imputation credits utilised 81.2 36.2
Source: N. Hathaway, Imputation credit redemption ATO data 1988–2011: Where have all the credits gone?, September
2013; AER analysis.
However, service providers submitted the analysis that underpins this analysis is based on
data that is unreliable.389 We recognise the data limitations, but as outlined in section A.10.4,
we note this is the best data available and there is no evidence before us that the 45 day
rule is having a material effect.
Based on these considerations, the 45-day holding rule does not appear to have a material
effect on the utilisation rate. The analysis above was presented in our draft decisions
released in 2014, but the service providers subject of those proposals did not comment on it
in their revised proposals. Instead, they submitted:390
The AER seeks to dismiss the impact of tax rules affecting eligibility of domestic
investors to redeem imputation credits by saying that:
“…we do not consider that there is clear evidence as to effect that these rules have or should be expected to have.”
…[we do] not consider that there must be "clear evidence" as to the effect of
particular tax rules in order for these to be taken into account. The fact is that these
rules exist and that they will affect the eligibility of certain domestic investors to
redeem imputation credits.
In any event, the fact that the redemption rate indicated by tax statistics is significantly
below the domestic equity ownership rate does indicate that these tax rules (and
possibly other factors as discussed below) are affecting domestic investors' ability to
redeem imputation credits. As the AER observes, the redemption rate indicated by
tax statistics is approximately 0.43, which is well below the domestic equity ownership
rate for all equity.
389
Australian Gas Networks, Attachment 11 Response to Draft Decision: Cost of Tax, January 2016, p. 10; ActewAGL,
Appendix 5.01 Detailed response to rate of return, gamma and inflation, January 2016, p. 113; AusNet Electricity Services,
Revised Regulatory Proposal, January 2016, p. 7-83; United Energy, Response to AER Preliminary Determination Re:
Rate of return and gamma, January 2016, p. 84; CitiPower, Revised Regulatory Proposal 2016-2020; January 2016,
p. 362; Jemena Electricity Networks, Attachment 6-1 Rate of return, gamma, forecast inflation, and debt and equity raising
costs, January 2016, p. 90; Powercor, Revised Regulatory Proposal 2016-2020, January 2016, p. 356. 390
ActewAGL, Detailed response to the AER's draft decision in relation to gamma, January 2015, p. 4; Ausgrid, Ausgrid's
revised proposal on gamma, January 2015, pp. 5–6; Directlink, Directlink submission on gamma (updated), January 2015,
p. 7; Endeavour Energy, Endeavour Energy's response to the AER draft decision re gamma, January 2015, pp. 5–6;
Essential Energy, Essential's response to AER draft decision re gamma, January 2015, pp. 5–6; and JGN, Gamma -
response to the draft decision, February 2015, p. 7.

4-105 Attachment 4 – Value of imputation credits | Final decision: Amadeus Gas Pipeline Access
Arrangement 2016–21
We do not consider that this represents clear evidence as to the effect of the 45-day rule and
other tax rules. Firstly, the service providers' approach does not contemplate error or
inaccuracy in the tax statistics. In section 4.4, we set out data concerns that exist regarding
the tax statistics. Further, these service providers, in their initial proposals, submitted that no
weight be placed on estimates of the utilisation rate from tax statistics because of significant
unresolved problems with the data.391 While it does now appear some service providers we
regulate may consider tax statistics can be used to estimate an upper bound for theta,392 we
do not consider the above analysis provides compelling evidence that the 45 day rule is
having a material impact given residual concerns with the data.
Secondly, the service providers' conclusion is contradicted by the analysis of tax statistics
we presented in our prior decisions and which we repeat above. While we acknowledge the
limitations of the tax data used for this analysis, the service providers themselves have not
demonstrated the rule is having a material impact, and we do not consider the rule would be
expected to have a material impact.
Frontier considers the 45-day rule has some effect because otherwise it would be redundant
to have the rule.393 We do not agree. A key outcome of the requirement to hold shares at risk
for 45 day in order to receive an imputation credit will be to prevent the streaming of
imputation credits to investors that value them the most.394 This could happen where
investors that values imputation credits, for example superannuation funds, buy the share
before the ex-dividend date and sell the share after the ex-dividend date and hedges their
risk exposure over the investment holding period. Therefore, the 45 day rule could logically
be not having a material impact on the utilisation value, while still working as intended and
preventing investors from streaming imputation credits to investors that value them the most.
In his June 2015 report for a number of service providers Gray assert that "[o]ne cannot
assume that the effect of the 45-day rule is negligible in the absence of any data about it."395
The new report by Gray (for Frontier) does not change our view that the 45 day rule is
unlikely to be having a material impact on the utilisation rate. It does not present any data to
demonstrate that the 45 day rule is having a material effect on utilisation of imputation
credits.
391
ActewAGL, Gamma, detailed proposal, May 2014, s. 1.4.3; Ausgrid, Ausgrid's gamma proposal, May 2014, p. 15;
Directlink, Directlink submission on gamma, May 2014, p. 16; Endeavour Energy, Endeavour Energy's gamma proposal,
May 2014, p. 15. Essential Energy, Essential Energy's gamma proposal, May 2014, pp. 15–16; JGN, Gamma proposal,
June 2014, p. 19; and TransGrid, TransGrid's approach to gamma, May 2014, p. 21. 392
Australian Gas Networks, Attachment 11 Response to Draft Decision: Cost of Tax, January 2016, p. 4; ActewAGL,
Appendix 5.01 Detailed response to rate of return, gamma and inflation, January 2016, pp. 41, 115; AusNet Electricity
Services, Revised Regulatory Proposal, January 2016, p. 7-84; United Energy, Response to AER Preliminary
Determination Re: Rate of return and gamma, January 2016, p. 86; CitiPower, Revised Regulatory Proposal 2016-2020;
January 2016, p. 364; Jemena Electricity Networks, Attachment 6-1 Rate of return, gamma, forecast inflation, and debt
and equity raising costs, January 2016, p. 92; Powercor, Revised Regulatory Proposal 2016-2020, January 2016, p. 357. 393
Frontier Economics, The appropriate use of tax statistics when estimating gamma, January 2016, p. 28. 394
See:
http://taxreview.treasury.gov.au/content/FinalReport.aspx?doc=html/publications/Papers/Final_Report_Part_2/chapter_b2-
3.htm. Accessed: 21 May 2016; M. Lally, Gamma and the ACT Decision, May 2016, p. 20. 395
Frontier Economics, An appropriate regulatory estimate of gamma, June 2015, p. 41.

4-106 Attachment 4 – Value of imputation credits | Final decision: Amadeus Gas Pipeline Access
Arrangement 2016–21
We consider Lally's recent report supports our positon that the 45 day rule is not having a
material impact on the utilisation value. Lally notes that that the 45 day rule prevents some
'genuine' investors from obtaining the credits, and therefore drives down the redemption
rate, but this downward effect is unlikely to be significant because 'genuine' investors have
the option of changing the time of their transactions and would have strong incentives to do
so.396 Further, Lally considers the 45 day rule constrains tax arbitrage and therefore
minimises the gap between the correctly estimated redemption rate (tax statistics), and the
proportion of Australian equities held by local investors.397
Transactions costs
Service providers submitted that the redemption of imputation credits may involve
transactions costs, such as requirements to keep records and follow administrative
processes.398 Service providers also submitted that these transactions costs will tend to
reduce their value to investors and may dissuade some investors from redeeming (utilising)
imputation credits.399
Firstly, we note that Handley advised that we specifically not take account of these costs:400
Since the objective is to estimate the after-company-before-personal-tax value of a
distributed imputation credit and also to avoid compensating the regulated firm for
transactions costs incurred at the shareholder level then the particular estimation
methodology should allow for these factors – in other words, ideally we want the
value of credits before administrative costs, personal taxes and diversification costs.
Secondly, we are not convinced that transactions costs are likely to dissuade a material
number of investors from redeeming imputation credits. Our considerations on this are as
follows:
When filling out a tax return, one is required to report the franked dividends received and
the imputation credits that are eligible to be utilised.401
396
M. Lally, Gamma and the ACT Decision, May 2016, p. 21. 397
M. Lally, Gamma and the ACT Decision, May 2016, p. 21. 398
Australian Gas Networks, Attachment 11 Response to Draft Decision: Cost of Tax, January 2016, p. 11; ActewAGL,
Appendix 5.01 Detailed response to rate of return, gamma and inflation, January 2016, p. 115; AusNet Electricity Services,
Revised Regulatory Proposal, January 2016, p. 7-84; United Energy, Response to AER Preliminary Determination Re:
Rate of return and gamma, January 2016, p. 85; CitiPower, Revised Regulatory Proposal 2016-2020; January 2016,
p. 363; Jemena Electricity Networks, Attachment 6-1 Rate of return, gamma, forecast inflation, and debt and equity raising
costs, January 2016, p. 92; Powercor, Revised Regulatory Proposal 2016-2020, January 2016, p. 357. 399
Australian Gas Networks, Attachment 11 Response to Draft Decision: Cost of Tax, January 2016, p. 11; ActewAGL,
Appendix 5.01 Detailed response to rate of return, gamma and inflation, January 2016, p. 115; AusNet Electricity Services,
Revised Regulatory Proposal, January 2016, p. 7-84; United Energy, Response to AER Preliminary Determination Re:
Rate of return and gamma, January 2016, p. 85; CitiPower, Revised Regulatory Proposal 2016-2020; January 2016,
p. 363; Jemena Electricity Networks, Attachment 6-1 Rate of return, gamma, forecast inflation, and debt and equity raising
costs, January 2016, p. 92; Powercor, Revised Regulatory Proposal 2016-2020, January 2016, p. 357. 400
J. Handley, Report prepared for the Australian Energy Regulator: Advice on the value of imputation credits, 29 September
2014, p. 46. 401
See: https://www.ato.gov.au/Individuals/Tax-return/2014/Tax-return/Income-questions-1-12/11---Dividends/. Accessed:
9 April 2015.

4-107 Attachment 4 – Value of imputation credits | Final decision: Amadeus Gas Pipeline Access
Arrangement 2016–21
Investors are already incurring the transactions costs associated with shareholding, and
most would also be already incurring the transactions costs associated with completing a
tax return. This applies particularly to professional organisations, such as charities and
superannuation funds, which we expect would utilise all imputation credits as a matter of
proper accounting. But we consider it true also of individual investors, particularly when
innovations such as 'e-tax' and automatic pre-filling of tax returns would reduce any
incremental costs if they exist.402
As outlined in A.8.2, we consider that we are estimating the value of imputation credits
consistently with the other allowed rate of return parameters on a before personal taxes and
personal costs basis. For all cost of equity components (capital gains and dividend income)
and cost of debt components (capital gains and interest income) investors have to incur
transaction costs in order to realise their returns. These transaction costs include brokerage
fees and costs associated with filling in a tax return. Compensation for these costs is
inconsistent with our post tax framework. Our benchmarking of the required return on equity
and the required return on debt is based on a post-tax returns before investor level
transaction costs are incurred. We also consider any incremental costs associated with
claiming imputation credits would be immaterial for the reasons outlined above.
We only compensate regulated businesses for the transaction cost incurred by regulated
businesses via debt and equity raising costs. However, these costs are incurred at the
company level and only require compensation so that the post company tax allowed return
reflects the required post company tax return in the market. We do not compensate
regulated businesses for the costs incurred by investor in regulated businesses as all the
allowed rate of return parameters and gamma are estimate on post company tax (pre-
personal tax and pre personal cost) basis. If we were to compensate regulated businesses
for investors' transaction costs in addition to the post tax return we set, it would result in an
over compensation of the firms and their investors relative to the efficient returns in the
market. This would not be expected to lead to efficient investment, or to be in the long term
interests of consumers.
Lally considered that transaction costs associated with investors redeeming credits cannot
be dealt with by reducing theta. Instead, if considered important (which Lally considers not to
be the case) these transaction costs can only be addressed through an extension of the
Officer model.403 Given we use a beta estimate of 0.7 for regulated utilities, Lally considers
that the possible transaction costs not compensated for is not a material issue because
these costs are very small.404 Based on these considerations, we consider that in estimating
the utilisation rate, adjustments should not be made for transactions costs. And even if an
adjustment was to be made, it would likely have an immaterial effect on the utilisation rate.
402
Eligible investors that do not need to submit a tax return can have imputation credits refunded by submitting this form to
the ATO: https://www.ato.gov.au/uploadedFiles/Content/MEI/downloads/ind39831n40980614.pdf. Accessed 9 April 2015.
We consider that the form is quite straightforward, and therefore the cost of filling it out and submitting it is unlikely to
outweigh the benefit of any material amount of imputation credits. 403
M. Lally, Gamma and the ACT Decision, May 2016, p. 29. 404
M. Lally, Gamma and the ACT Decision, May 2016, pp. 9-10.

4-108 Attachment 4 – Value of imputation credits | Final decision: Amadeus Gas Pipeline Access
Arrangement 2016–21
Time value of money
Service providers submitted that the delay between the distribution of an imputation credit
and the time at which it is redeemed may be expected to reduce an investor's valuation of
the credit.405 In response, we note that:
We are unaware of any evidence that indicates the average size of this time delay across
all investors.
Even if there were a material time delay that should be accounted for when estimating
the utilisation rate, we consider that the appropriate discount rate to apply to such delay
would be a short-term risk free rate. This is because an imputation credit represents a
promise from the Australian Government to reduce an investor's tax liability by the size of
the credit or to refund the credit. Current interest rates on two year Commonwealth
Government bonds suggest that the appropriate discount rate would be likely less than 2
per cent. Therefore, the magnitude of the adjustment would be quite small. Handley
agreed with the immateriality of any required adjustment for time delay.406
Based on these considerations, we conclude that it is reasonable to not adjust any of our
estimates of the utilisation rate for the time value of money where this effect is not already
accounted for.
Portfolio effects
Service providers submit that investors may shift their portfolio away from the optimal
portfolio towards a more local portfolio in order to utilise more imputation credits.407 It is
submitted that to the extent than an investor reduces the value of their overall portfolio
simply to increase their redemption of imputation credits, this loss in value will be reflected in
a lower valuation of imputation credits. Gray's report (for SFG) to the service providers on
this topic referred to the 'cost of losing diversification'.408 However, as discussed in section
A.8.1, Handley advised that our estimate of the utilisation rate should exclude 'diversification
costs'. More specifically, we do not agree that portfolio effects would mean that a dollar of
imputation credits in the hands of an eligible investor would be worth less than one dollar to
that investor on a pre-personal-tax and pre-personal-costs basis. We made this point in our
405
Australian Gas Networks, Attachment 11 Response to Draft Decision: Cost of Tax, January 2016, p. 11; ActewAGL,
Appendix 5.01 Detailed response to rate of return, gamma and inflation, January 2016, p. 115; AusNet Electricity Services,
Revised Regulatory Proposal, January 2016, p. 7-84; United Energy, Response to AER Preliminary Determination Re:
Rate of return and gamma, January 2016, p. 85; CitiPower, Revised Regulatory Proposal 2016-2020; January 2016,
p. 363; Jemena Electricity Networks, Attachment 6-1 Rate of return, gamma, forecast inflation, and debt and equity raising
costs, January 2016, p. 92; Powercor, Revised Regulatory Proposal 2016-2020, January 2016, p. 357. 406
J. Handley, Report prepared for the Australian Energy Regulator: Advice on the value of imputation credits, 29 September
2014, p. 46. 407
Australian Gas Networks, Attachment 11 Response to Draft Decision: Cost of Tax, January 2016, p. 12; ActewAGL,
Appendix 5.01 Detailed response to rate of return, gamma and inflation, January 2016, p. 115; AusNet Electricity Services,
Revised Regulatory Proposal, January 2016, p. 7-84; United Energy, Response to AER Preliminary Determination Re:
Rate of return and gamma, January 2016, pp. 83-84; CitiPower, Revised Regulatory Proposal 2016-2020; January 2016,
pp. 363-364; Jemena Electricity Networks, Attachment 6-1 Rate of return, gamma, forecast inflation, and debt and equity
raising costs, January 2016, p. 92; Powercor, Revised Regulatory Proposal 2016-2020, January 2016, pp. 357-358. 408
SFG, An appropriate regulatory estimate of gamma, 21 May 2014, para. 65(e).
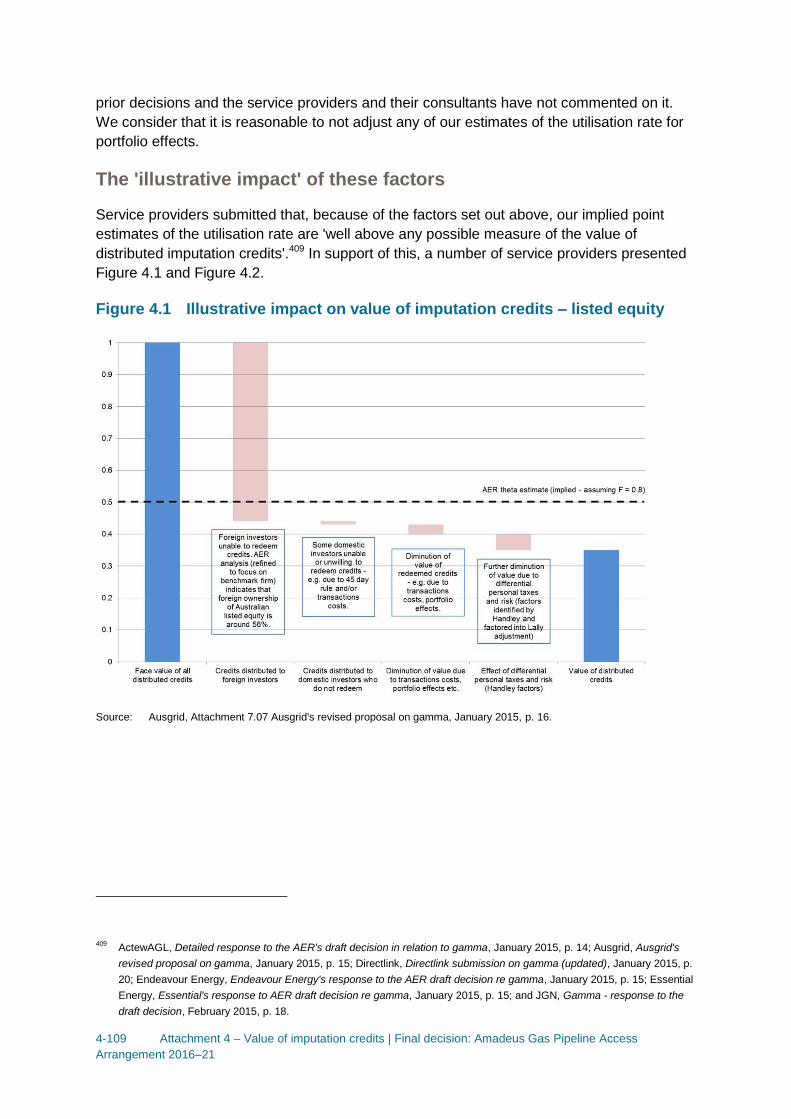
4-109 Attachment 4 – Value of imputation credits | Final decision: Amadeus Gas Pipeline Access
Arrangement 2016–21
prior decisions and the service providers and their consultants have not commented on it.
We consider that it is reasonable to not adjust any of our estimates of the utilisation rate for
portfolio effects.
The 'illustrative impact' of these factors
Service providers submitted that, because of the factors set out above, our implied point
estimates of the utilisation rate are 'well above any possible measure of the value of
distributed imputation credits'.409 In support of this, a number of service providers presented
Figure 4.1 and Figure 4.2.
Figure 4.1 Illustrative impact on value of imputation credits – listed equity
Source: Ausgrid, Attachment 7.07 Ausgrid's revised proposal on gamma, January 2015, p. 16.
409
ActewAGL, Detailed response to the AER's draft decision in relation to gamma, January 2015, p. 14; Ausgrid, Ausgrid's
revised proposal on gamma, January 2015, p. 15; Directlink, Directlink submission on gamma (updated), January 2015, p.
20; Endeavour Energy, Endeavour Energy's response to the AER draft decision re gamma, January 2015, p. 15; Essential
Energy, Essential's response to AER draft decision re gamma, January 2015, p. 15; and JGN, Gamma - response to the
draft decision, February 2015, p. 18.

4-110 Attachment 4 – Value of imputation credits | Final decision: Amadeus Gas Pipeline Access
Arrangement 2016–21
Figure 4.2 Illustrative impact on value of imputation credits – all equity
Source: Ausgrid, Attachment 7.07 Ausgrid's revised proposal on gamma, January 2015, p. 17.
As already discussed, there is disagreement between the service providers and us on
whether the utilisation rate (and therefore the value of imputation credits) should be
estimated on a basis that is 'before' or 'after' the taxes and costs incurred by investors. The
service providers consider that the value of imputation credits should be estimated 'after'
these factors. Given these factors can only result in the diminution of the value of credits, it
follows that the service providers' preferred estimate of the value of imputation credits will be
no higher than that estimated on a before-personal-tax and before-personal-costs basis.
This notwithstanding, we consider that there are a number of problems with Figure 4.1 and
Figure 4.2. Moreover, the figures suggest that the value of distributed credits on which the
service providers rely is likely understated relative to the (after-personal-tax and after-
personal-costs) value to investors in all equity.
The relevant equity ownership share
The key difference between the figures is that in Figure 4.1 the SFG estimate of the value of
distributed credits is ultimately compared to the refined share of foreign ownership of listed
equity, and in Figure 4.2 the comparison is made with the refined share of foreign ownership
in all equity. However, Gray (for SFG) indicated that if the value of distributed credits is
estimated via a 'market value approach' (such as SFG's dividend drop off study), then the

4-111 Attachment 4 – Value of imputation credits | Final decision: Amadeus Gas Pipeline Access
Arrangement 2016–21
estimate will represent 'an average across all listed firms'.410 Accordingly, the relevant
foreign ownership share is that of listed equity, and it would be internally inconsistent to
compare the SFG estimate of the value of distributed credits with the foreign ownership
share of all equity (as the service providers have done in Figure 4.2).
It also seems that the SFG estimate of the value of distributed credits reflects the average
value over the sample period of the data used by SFG: July 2001 to October 2012. If so, this
estimate should be compared with the average, refined foreign ownership share of listed
equity over a similar period (June 2001 to December 2012). This is equal to 0.51.
Implications for the value of distributed credits across investors in all equity
Although we have above identified the inconsistency in comparing SFG's dividend drop off
estimate of the value of distributed credits to the foreign ownership share of all equity, Figure
4.1 and Figure 4.2 appear to be intended to indicate that the presence of foreign investors is
a relevant source of the diminution of the market-wide value of distributed credits. This
suggests that, all else held equal, an implied market value study conducted over all equity
might produce a higher estimate of the value of distributed credits. This would be because
the foreign ownership share of all equity is lower.
Using the relevant estimate of the foreign equity ownership share discussed above, the logic
of Figure 4.1 and Figure 4.2 indicates that SFG's estimate of the value of distributed credits
(0.35) represents the diminution of the face value of distributed credits by 51 per cent due to
the presence of foreign investors and by (1 - 0.35 - 0.51 =) 14 per cent due to other factors
(including differential personal taxes and risk). If the combined diminution due to these other
factors is the same for investors in all equity, then the logic of the figures indicates that the
value of distributed credits across investors in all equity might be (1 - 0.14 - 0.39 =) 0.47.411
Comparison to the redemption rate from tax statistics
The figures suggest that the difference between the foreign ownership share and the
redemption rate from tax statistics is an estimate of the credits distributed to domestic
investors who do not redeem them. The figures suggest that this might be because of the
45-day holding rule and/or transactions costs. We consider that there are a number of
problems with this estimate.
Firstly, the redemption rate from tax statistics reflects all equity, and therefore it is
inconsistent to compare it to the foreign ownership share of listed equity.
Secondly, this estimate does not contemplate error or inaccuracy in the tax statistics. In
section 4.4, we set out the data concerns that exist regarding the tax statistics. The service
providers that we released draft decisions for in 2014 submitted in their initial proposals that
no weight be placed on estimates of the utilisation rate from tax statistics because of
410
SFG, Estimating gamma for regulatory purposes, 6 February 2015, para. 216. 411
The refined foreign ownership share of all equity between June 2001 and December 2012 was 0.39 on average.

4-112 Attachment 4 – Value of imputation credits | Final decision: Amadeus Gas Pipeline Access
Arrangement 2016–21
significant unresolved problems with the data.412 NERA has subsequently submitted that tax
statistics can be used to estimate a value for theta consistent with a 70% distribution rate,
and can also be used to estimate an upper bound value for gamma.413 Gray (for Frontier)
appears to support this.414 However, given the issues with the tax data and Hathaway's
caveated comments regarding the data where he says "[t]he conclusion is that I accept the
tax payments and FAB data as given post-2003, and assume that the problem is more likely
to have arisen within the franked dividend payments data"415, we remain of the view we
should treat estimates of theta based on tax data with caution. Hathaway's draft 2014 report
gives us no cause to change our view.416 Lally, in his 2016 report, indicates he considers the
most likely reason for a difference between the estimate of the utilisation rate from the equity
ownership approach and tax statistics is data issues with the tax statistics.417
Thirdly, we are not convinced that the 45-day holding rule and transaction costs are
contributing to a material amount of credits not being redeemed. As discussed above, this is
because:
Our analysis of the 45-day rule suggests that it is not having a material effect. Although
we acknowledge this analysis is subject to any data quality issues with the tax statistics.
We do not consider that transactions costs are likely to dissuade a material number of
investors from redeeming imputation credits.
In response to the service providers' submissions,418 we do not consider there is any
inconsistency between Handley's earlier work and subsequent work indicating taxation
statistics can be used as a point estimate of theta. Handley has clearly explained why tax
statistics can be used as a point estimate for theta, a position we agree with.419 While we
acknowledge that the ultimate source of the value for imputation credits is from redemption,
this does not prevent an estimate of the redemption value from taxation statistics being a
point estimate. We note, given the uncertainty with estimates based on the tax data, the true
(unobservable) redemption value could be above or below the estimate.
In section A.14, the difference between the utilisation value from the equity ownership
approach and taxation statistics is analysed
412
ActewAGL, Gamma, detailed proposal, May 2014, s. 1.4.3; Ausgrid, Ausgrid's gamma proposal, May 2014, p. 15;
Directlink, Directlink submission on gamma, May 2014, p. 16; Endeavour Energy, Endeavour Energy's gamma proposal,
May 2014, p. 15. Essential Energy, Essential Energy's gamma proposal, May 2014, pp. 15–16; JGN, Gamma proposal,
June 2014, p. 19; and TransGrid, TransGrid's approach to gamma, May 2014, p. 21. 413
NERA, Estimating distribution and redemption rates from taxation statistics, March 2015, pp. 25–28. 414
Frontier Economics, An appropriate regulatory estimate of gamma, June 2015, pp. 6–7. 415
Neville Hathaway, Imputation Credit Redemption ATO data 1988–2011 Where have all the credits gone?, September
2013, p. 25. 416
Neville Hathaway, Franking Credit Redemption ATO data 1988–2012 Where have all the credits gone? Draft only
comments welcome, October 2014. 417
M. Lally, Gamma and the ACT Decision, May 2016, p. 23. 418
SA Power Networks, Revised regulatory proposal 2015–20, July 2015, p. 373; Access Arrangement Information for
Australian Gas Networks' South Australian Natural Gas Distribution Network, p. 10, July 2015. 419
J. Handley, Report prepared for the Australian Energy Regulator: Advice on the value of imputation credits, 29 September
2014, p. 39; J. Handley, Further Advice on the value of imputation credits, 16 April 2015, p. 28.

4-113 Attachment 4 – Value of imputation credits | Final decision: Amadeus Gas Pipeline Access
Arrangement 2016–21
A.8.4 NERA's comments on the utilisation rate
NERA submitted that theta is the value that a representative investor places on a dollar of
distributed imputation credits.420 NERA also presented a simple derivation of theta. The
simple model employed by NERA consisted of, among other things: a set of domestic and
foreign investors; a domestic asset that distributes imputation credits; and a foreign asset
that does not distribute imputation credits. NERA showed that in this model:
𝜃 =𝐷
𝐷 + 𝐹
where 𝐷 is the wealth of domestic investors and 𝐹 is the wealth of foreign investors.421
NERA also showed that the redemption rate of imputation credits does not equal theta in this
model, and is instead given by the ratio of domestic holdings of the domestic asset to the
sum of domestic and foreign holdings of the asset. NERA concluded:422
In a small open economy – like Australia – the proportion of credits created that are
redeemed is likely to exceed by a substantial margin the value of a dollar of tax
credits created to a representative shareholder.
That is, if domestic investors make up only a small proportion of all investors, then theta will
be small. However, this conclusion appears to rely on determining theta in an international
CAPM context—domestic and foreign investors can invest in both domestic and foreign
assets. By contrast, we determine the value of imputation credits (and other rate of return
parameters) using a domestic CAPM. In the domestic CAPM context, domestic investors
that are eligible to redeem credits make up a significant proportion of all investors that invest
in domestic assets. Further, the scope for a material 'wedge' to arise between the
redemption rate and theta in the domestic CAPM context is not clear from NERA's analysis
because it only considers the international CAPM context.
Our view is supported by Handley's review of NERA's submission. Handley concluded:423
The problem with the NERA model is that it is an international asset pricing model –
along the lines of the Black (1974) International CAPM – whereas the current
framework is based within a domestic market setting. This means that domestic
investors have only a small market weighting by definition. Clearly, the value of
imputation credits in an international asset pricing model will be substantially different
from the value of imputation credits in a domestic asset pricing model.
…
420
NERA, Estimating distribution and redemption rates from taxation statistics, March 2015, p. ii. 421
Strictly, D is the number of domestic investors and F is the number of foreign investors. However, NERA's model assumes
that each investor has starting period wealth of $1. 422
NERA, Estimating distribution and redemption rates from taxation statistics, March 2015, p. ii. 423
J. Handley, Report prepared for the Australian Energy Regulator: Advice on the NERA report 'Estimating distribution and
redemption rates from taxation statistics', 20 May 2015, pp. 6 and 7.

4-114 Attachment 4 – Value of imputation credits | Final decision: Amadeus Gas Pipeline Access
Arrangement 2016–21
In my opinion, NERA’s analysis does not establish the presence of a wedge between
theta and the redemption rate and so does not invalidate the use of tax statistics to
estimate theta.
NERA responded to the AER position in the JGN decision in its June 2015 report.424 In this
report NERA put forward several propositions:
It would be expected that the proportions of credits that are redeemed would significantly
exceed the value of a dollar of credits to a representative shareholder in a small open
economy like Australia.
The AER's use of a domestic Australian CAPM does not justify any presumption that
theta take a non-negligible value.
The estimated cost of capital from a domestic CAPM will equal the cost of capital from an
international CAPM under certain assumptions.
In response, we note that we consider our approach is consistent with our definition of the
Australian domestic market in the presence of foreign investors.
While NERA does show a model consistent with the redemption of credits exceeding the
value for theta, you may only get theta falling significantly below the redemption rate under
specific assumptions.425 We also note that NERA's model is an international asset pricing
model.426 This model is inconsistent with our definition of the domestic market. We also
consider the use of the international CAPM, with a high proportion of wealth held by foreign
investors (NERA using 98% in its primary example) is prima facie inconsistent with the way
in which the service providers estimate the return on equity using an Australian Domestic
CAPM. Handley shows that NERA's claimed "wedge" between the redemption rate and
theta can be either small, if input assumptions are made consistent with our definition of the
market (domestic in the presence of foreign investors), or zero or even negative depending
on your assumption about a number of largely unobservable factors.427 NERA response to
one of Handley's examples that shows the wedge may be small makes clear they are using
an International CAPM to argue Handley's response is invalid stating:428
"The assumption that Australian aggregated wealth makes up 60 percent of the world
wealth is also very clearly at odds with the evidence and so we conclude that
Handley's second example is similarly of no practical relevance."
424
NERA, Estimating distribution and redemption rates: Response to the AER's final decisions for the NSW and ACT
electricity distributors, and for Jemena Gas Networks, June 2015. 425
NERA, Estimating distribution and redemption rates: Response to the AER's final decisions for the NSW and ACT
electricity distributors, and for Jemena Gas Networks, June 2015, pp. 6–7. 426
J. Handley, Report prepared for the Australian Energy Regulator: Advice on the NERA report 'Estimating distribution and
redemption rates from taxation statistics', 20 May 2015, p. 6. 427
J. Handley, Report prepared for the Australian Energy Regulator: Advice on the NERA report 'Estimating distribution and
redemption rates from taxation statistics', 20 May 2015, pp. 6–7. 428
NERA, Estimating distribution and redemption rates: Response to the AER's final decisions for the NSW and ACT
electricity distributors, and for Jemena Gas Networks, June 2015, p. 7.

4-115 Attachment 4 – Value of imputation credits | Final decision: Amadeus Gas Pipeline Access
Arrangement 2016–21
We consider this response by NERA of limited relevance given our definition of the relevant
market is a domestic market in the presence of foreign investors, a market which we have
used to estimate both the return on equity and the value for imputation credits. Handley's
example is appropriate given this definition.
While NERA responded to the position that theta could exceed the redemption rate arguing
the market will not clear, irrespective of this we consider the wedge is not clearly material
under our definition of the market and as Handley notes, the current framework is based
within a domestic market setting.429 NERA's comment in a separate report that it does not
recommend the use of an International CAPM does not resolve this inconsistency issue.430
In addition, while NERA has effectively put forward the position that the use of a domestic
CAPM to set the return on equity and the use of an international CAPM to determine theta
are not inconsistent because both models may generate the same return on equity estimate
under certain assumptions, we consider NERA's position is not adequately supported. An
International CAPM may give a materially different required return on equity estimate. This
may be lower or higher depending on whether local (domestic) systematic risk can be
diversified away in the global market, or if specific risk in the domestic market contains
global systematic risk.431 While NERA appear to have made a number of assumptions to
show both a domestic version of the SLCPAM and international version of the SLCAPM can
hold simultaneously432, these are assumptions that can only be tested empirically. An
academic article by Koedijk, Mathiijs and van Dijk explains the underlying premise of such a
test stating:433
The testing methodology boils down to assessing whether the exposure of an
individual company to the global risk factors is effectively captured in the international
pricing of the domestic market index. If not, a significant pricing error will exist, which
implies that global factors do have a substantial impact on the cost of capital. In
effect, the domestic CAPM will underestimate the cost of equity capital of a company
if the specific risk according to the domestic CAPM contains additional systematic risk
related to the priced global factors. The domestic CAPM will lead to an overestimation
of the cost of capital if part of the systematic risk indicated by the CAPM can be
diversified away in the global market.
NERA appear to agree this is an empirical question as it states earlier in its report "[w]hether
equity markets are integrated or segmented is an empirical issue."434
429
J. Handley, Report prepared for the Australian Energy Regulator: Advice on the NERA report 'Estimating distribution and
redemption rates from taxation statistics', 20 May 2015, p. 6. 430
NERA, Do Imputation Credits Lower the Cost of Equity? Cross-Sectional Tests A report for United Energy, April 2015, p.
79. 431
Koedijk, K,G,, and van Dijk, M, A., 2004, Global risk factors and the cost of capital, Financial analysts journal, March/April
2004, p. 33. 432
NERA, Estimating distribution and redemption rates: Response to the AER's final decisions for the NSW and ACT
electricity distributors, and for Jemena Gas Networks, June 2015, pp. 8–10. 433
Koedijk, K,G,, and van Dijk, M, A., 2004, Global risk factors and the cost of capital, Financial analysts journal, March/April
2004, p. 33. 434
NERA, Estimating distribution and redemption rates: Response to the AER's final decisions for the NSW and ACT
electricity distributors, and for Jemena Gas Networks, June 2015, p. 3.

4-116 Attachment 4 – Value of imputation credits | Final decision: Amadeus Gas Pipeline Access
Arrangement 2016–21
We also note that some work by Associate Professor Lally at the time of the development of
the Rate of return guideline indicated that the required return on equity for Australian firms
could be materially lower under full integration.435
A.9 Estimation approach considerations
Two considerations that were not proposed in the Guideline in determining the value of
imputation credits are discussed below.
A.9.1 Evidence from all equity or only listed equity
When determining the value of imputation credits, we remain of the view it is appropriate to
have regard to evidence from all companies and their investors (all equity) and just listed
companies and their investors (only listed equity). There is no consensus on which should
be the preferred approach.
United Energy submitted that the Tribunal recently considered that the AER had erred in
using a listed equity only measure.436 In this decision the Tribunal considered that the AER
had not provide sufficient explanation for introducing the distribution rate for only listed equity
and that the considered it appropriate to continue to follow past practice.437
We have had regard to experts' comments on the issue. Lally made some comments in
support of considering all equity:438
The more important point here is whether unlisted equity should be included, in
principle. Arguably, the fact that only listed equity is used to estimate the MRP and
beta suggests that the same limitation be applied to the present issue. However, the
limitation is only imposed for the MRP and beta because data from unlisted firms is
entirely inadequate for estimating returns. Furthermore, MRP estimates are generally
based on a subset of listed equity (such as the ASX200), the subsets used may vary
and are sometimes never specified (in surveys), and betas are typically estimated
from foreign returns data. All of these results could reasonably be viewed as proxies
for the results that would arise from using Australian data on all equities. In addition,
treating the CAPM as a model that applies to only listed equities would rule out using
it to estimate the cost of equity for an unlisted company (and some regulated
businesses are unlisted). Thus, in principle, I favour inclusion of unlisted equity for
estimating the proportion of Australian equities held locally.
In his latest report, Lally reaffirmed this view that all equity rather than listed equity should be
used to estimate the utilisation value. Lally considers that using all equity data suggest the
utilisation value is at least 0.60.439
435
Lally, The estimation of gamma, November 2013, pp. 39–43. 436
United Energy, Submission on AER preliminary determination - Submission on gamma, 26 April 2016. 437
Australian Competition Tribunal, Application by Public Interest Advocacy Centre Ltd and Ausgrid [2016] ACompT 1, 26
February 2016, para. 1106. 438
M. Lally, Review of submissions to the QCA on the MRP, risk-free rate and gamma, 12 March 2014, p. 34. 439
M. Lally, Gamma and the ACT Decision, May 2016, p. 18.

4-117 Attachment 4 – Value of imputation credits | Final decision: Amadeus Gas Pipeline Access
Arrangement 2016–21
However, Handley suggested that evidence from listed equity is more relevant:440
Specifically, the NERA estimate [of the distribution rate] is based on aggregate
[franking account balance] data for all companies – including public companies and
private companies. In contrast, one can reasonably argue that the estimate should be
based on public companies only since this is more likely to reflect the composition of
the Australian domestic market for equity funds – private companies by definition are
financed in entirely different ways – and so be a more relevant proxy for a benchmark
efficient entity.
Gray's view (for SFG) is not clear to us. In his May 2014 report, Gray stated:441
The 45% foreign ownership figure in Figure 9 above is based on listed equity. In our
view, this is the appropriate calculation given that all other WACC parameters are
estimated with reference to exchange-listed businesses because they are more
reflective of the efficient benchmark entity.
And in his February 2015 report (for SFG) Gray stated:442
There is also a question about whether data should be restricted to listed firms or
whether it should be expanded to include private firms as well. Since the benchmark
efficient entity is not necessarily listed, this would imply that private firms are also
relevant.
A number of the service providers indicated clearly in their initial or revised proposals, or in a
submission on their proposal, their view that the value of imputation credits should be
estimated with regard to evidence from all equity:443
Gamma is conventionally estimated as a market-wide parameter and therefore there
is no reason to measure the distribution rate based on data for listed equity only, in
circumstances where data is available for both listed and unlisted firms.
Despite this view, the service providers propose to rely on the 'best estimate' of the
utilisation rate from implied market value studies, which by definition relate to only listed
equity.444 The service providers do not recognise that the evidence they have presented on
440
J. Handley, Report prepared for the Australian Energy Regulator: Advice on the value of imputation credits, 29 September
2014, p. 28. 441
SFG, An appropriate regulatory estimate of gamma, 21 May 2014, para. 412. 442
SFG, Estimating gamma for regulatory purposes, 6 February 2015, para. 222. 443
ActewAGL, Detailed response to the AER's draft decision in relation to gamma, January 2015, p. 1; Ausgrid, Ausgrid's
revised proposal on gamma, January 2015, p. 3; Directlink, Directlink submission on gamma (updated), January 2015, p.
3; Endeavour Energy, Endeavour Energy's response to the AER draft decision re gamma, January 2015, p. 3; Essential
Energy, Essential's response to AER draft decision re gamma, January 2015, p. 3; and JGN, Gamma - response to the
draft decision, February 2015, p. 4; CitiPower, Appendix J - Gamma, April 2015, p. 6; Powercor, Regulatory Proposal
2016–20, April 2015, p. 6; Energex, Submission on Energex's regulatory proposal 2015-20 and the AER issues paper,
January 2015, p. 4. 444
ActewAGL, Detailed response to the AER's draft decision in relation to gamma, January 2015, p. 13; Ausgrid, Ausgrid's
revised proposal on gamma, January 2015, p. 14; Directlink, Directlink submission on gamma (updated), January 2015, p.
19; Endeavour Energy, Endeavour Energy's response to the AER draft decision re gamma, January 2015, p. 14; Essential
Energy, Essential's response to AER draft decision re gamma, January 2015, p. 14; and JGN, Gamma - response to the

4-118 Attachment 4 – Value of imputation credits | Final decision: Amadeus Gas Pipeline Access
Arrangement 2016–21
their preferred estimate of the utilisation rate implies that it likely understates the value of
distributed credits to investors across all equity (see our discussion in section A.8.3).
We have considered all the material before us. We agree that the utilisation rate is a market
wide parameter. However, as set out above, there is no consensus on whether it should be
estimated using all equity or listed equity. Therefore, we consider both.
In relation to the distribution rate, we note it is a firm specific parameter in principle.
However, as Lally advised, there are reasons why it may not be appropriate to use firm
specific data or industry averages, so sector wide data can be used as a reasonable
proxy.445 Therefore, we consider it is appropriate to use estimates of the distribution rate
based on listed equity and all equity. We also have regard to Lally's recommended estimate
of the distribution rate for listed equity estimated from financial reports of the top 20 listed
firms (that is, 0.83).446 Lally considers this estimate is reflective of the distribution rate for a
benchmark efficient entity.
With respect to United Energy's late submission on the recent Tribunal decision, we note the
Tribunal did not find a clear error in our approach prior to using its preferred approach. We
remain of the view that our approach is open to us, and results in a conservative estimate
(see section A.10).
A.9.2 Relationship between the distribution rate and the
utilisation value
In developing the Guideline, we did not recognise the relationship between definitions and
estimates of the distribution rate and the utilisation rate. This relationship is that a given
estimate of the distribution rate represents the proportion of credits distributed by a given set
of companies to the set of investors in those companies. In decisions released post the
Guideline we considered that for consistency in estimating the value of imputation credits, a
corresponding estimate of the utilisation rate should reflect the utilisation of that same set of
investors.
We considered that this relationship should be recognised when determining estimates of
the value of imputation credits. We therefore considered that estimates of the utilisation rate
determined with regard to investors in only listed equity should be paired with estimates of
the distribution rate that are also determined with regard to only listed equity. Similarly, we
considered that estimates of the utilisation rate determined with regard to all equity should
be paired with estimates of the distribution rate that are also determined with regard to all
equity.
draft decision, February 2015, p. 17; CitiPower, Appendix J - Gamma, April 2015, pp. 4-5; Powercor, Regulatory Proposal
2016-20, April 2015, pp. 4-5; Energex, Revised regulatory proposal 2015-20, July 2015, p. 13. 445
M. Lally, Gamma and the ACT Decision, May 2016, pp. 24–26. 446
M. Lally, Gamma and the ACT Decision, May 2016, pp. 5, 29.

4-119 Attachment 4 – Value of imputation credits | Final decision: Amadeus Gas Pipeline Access
Arrangement 2016–21
The service providers do not agree that the estimate of the utilisation value based on listed
equity (all equity) can be paired only with a listed equity (all equity) distribution rate.447 They
submit that for the equity ownership approach both ownership and distribution data is
available for all equity and listed equity and it should be necessary to consider which of
these measures is more reflective of the benchmark firm.448 Service providers consider that
the distribution rate should be set with reference to all equity to avoid the influence of
imputation credits being attached to foreign income. For the utilisation value they consider
that it should to be estimated with reference to only listed equity in order to reflect foreign
ownership in the benchmark firm.449 Both Stephen Gray (for Frontier) and NERA submitted
that there is no inconsistency with paring the distribution rate for all equity with a theta value
(or utilisation rate) for listed equity as the distribution rate is firm specific within the Officer
model.450 As a result they appear to consider we should use either the distribution rate from
the broadest market (all equity) in combination with a theta estimate from listed equity,451 or
alternatively we should use of a distribution rate estimated from listed equity excluding the
20 largest firms in the market, both of which yield an estimated distribution rate of around
70%. They effectively consider the use of the 20 largest listed firms to estimate the
distribution rate from listed equity data alone will overestimate the distribution rate for the
benchmark efficient entity as we assume this entity is not a large listed entity.452
447
Australian Gas Networks, Attachment 11 Response to Draft Decision: Cost of Tax, January 2016, pp. 8, 22; ActewAGL,
Appendix 5.01 Detailed response to rate of return, gamma and inflation, January 2016, pp. 4, 11, 128; AusNet Electricity
Services, Revised Regulatory Proposal, January 2016, pp. 7-81, 7-95; United Energy, Response to AER Preliminary
Determination Re: Rate of return and gamma, January 2016, pp. 82, 96; CitiPower, Revised Regulatory Proposal 2016-
2020; January 2016, pp. 360, 374; Jemena Electricity Networks, Attachment 6-1 Rate of return, gamma, forecast inflation,
and debt and equity raising costs, January 2016, pp. 88, 103; Powercor, Revised Regulatory Proposal 2016-2020, January
2016, pp. 354, 368. 448
Australian Gas Networks, Attachment 11 Response to Draft Decision: Cost of Tax, January 2016, p. 17; ActewAGL,
Appendix 5.01 Detailed response to rate of return, gamma and inflation, January 2016, pp. 111, 121, 128; AusNet
Electricity Services, Revised Regulatory Proposal, January 2016, pp. 7-81, 7-90, 7-95; United Energy, Response to AER
Preliminary Determination Re: Rate of return and gamma, January 2016, pp. 82, 91, 96; CitiPower, Revised Regulatory
Proposal 2016-2020; January 2016, pp. 360, 369, 374; Jemena Electricity Networks, Attachment 6-1 Rate of return,
gamma, forecast inflation, and debt and equity raising costs, January 2016, pp. 88, 98, 163; Powercor, Revised Regulatory
Proposal 2016-2020, January 2016, p. 354, 363, 368. 449
Australian Gas Networks, Attachment 11 Response to Draft Decision: Cost of Tax, January 2016, p. 8; ActewAGL,
Appendix 5.01 Detailed response to rate of return, gamma and inflation, January 2016, pp. 111, 128; AusNet Electricity
Services, Revised Regulatory Proposal, January 2016, pp. 7-81, 7-95; United Energy, Response to AER Preliminary
Determination Re: Rate of return and gamma, January 2016, pp. 82-83, 96; CitiPower, Revised Regulatory Proposal 2016-
2020; January 2016, pp. 360, 374; Jemena Electricity Networks, Attachment 6-1 Rate of return, gamma, forecast inflation,
and debt and equity raising costs, January 2016, p. 88-89, 103-104; Powercor, Revised Regulatory Proposal 2016-2020,
January 2016, pp. 354, 367-368. 450
Frontier Economics, An appropriate regulatory estimate of gamma, June 2015, pp. 26–27; NERA, Estimating distribution
and redemption rates: Response to the AER's final decisions for the NSW and ACT electricity distributors, and for Jemena
Gas Networks, June 2015, p. iii. 451
Frontier Economics, An appropriate regulatory estimate of gamma, June 2015, pp. 28–30; NERA, Estimating distribution
and redemption rates: Response to the AER's final decisions for the NSW and ACT electricity distributors, and for Jemena
Gas Networks, June 2015, pp. 17–18. 452
Frontier Economics, An appropriate regulatory estimate of gamma, June 2015, pp. 28–30; NERA, Estimating distribution
and redemption rates: Response to the AER's final decisions for the NSW and ACT electricity distributors, and for Jemena
Gas Networks, June 2015, pp. 17–19.

4-120 Attachment 4 – Value of imputation credits | Final decision: Amadeus Gas Pipeline Access
Arrangement 2016–21
Gray (for Frontier) considers that the distribution rate is firm specific, while theta is a market
wider parameter.453 Gary (for Frontier) draws an analogy between gamma and the CAPM,
where the distribution rate is similar to beta and theta is similar to the MRP. Handley
previously considered this issues and supported our decision in JGN to not remove the
largest listed equity firms from the estimation of the distribution rate on the basis foreign
sourced income allows them to distribute a higher proportion of imputation credits.454
Further, as outlined in section A.10.1, Lally has demonstrated there is a negative relationship
between foreign operations and the distribution rate.455 This demonstrates that foreign
income actually decreases the distribution rate and not increases it as suggested by
Frontier.
The service providers consider that two benchmark characteristics, foreign ownership and
foreign income, justify a lower gamma estimate. However, we consider that are other
benchmark characteristics that may justify a higher gamma estimate and/or a lower
corporate tax allowance. For instance, the EMRF has submitted that the Franking account
balance of APA Group, Envestra Limited (pre-sale) and JGN's parent company is zero.456
This could imply that regulated businesses distribute all their imputation credits and therefore
the appropriate benchmark distribution rate is closer to one hundred per cent. Alternatively,
this could imply that the regulated businesses do not generate any imputation credits as they
do not pay company tax. We consider the benchmark should be considered holistically and
individual characteristics of the benchmark should not be considered in isolation.
In his latest report, Lally considered it is 'not essential but nor is it precluded' estimate the
distribution rate and utilisation rate on a consistent basis.457 Following this, we consider it is
not necessary to 'match' estimates of distribution rates and utilisation rates based on the
dataset used, although we note the choice is open to us. While we principally maintain our
previous approach, we also have some regard to Lally's preferred approach (which
combines an all equity utilisation rate from the equity ownership approach with a distribution
rate for listed equity from financial reports of the top 20 listed firms).458 We note that Lally's
preferred approach suggests a distribution rate of at least 0.83 and a utilisation rate of
0.60.459 This suggests a gamma value of at least 0.50, which is higher than our estimate of
0.4.460
A.10 Estimating the distribution rate
We consider that the distribution rate is the proportion of imputation credits generated by the
benchmark efficient entity that is distributed to investors. We set out our position on the
453
Frontier, The appropriate use of tax statistics when estimating gamma, January 2016, pp. 12-13. 454
J. Handley, Report prepared for the Australian Energy Regulator: Further advice on the value of imputation credits, 16
April 2015, p. 21. 455
M. Lally, Gamma and the ACT Decision, May 2016, pp. 27. 456
EMRF, NSW gas distribution revenue reset, Draft decision by the Australian Energy Regulator on Jemena’s Gas Networks
Access Arrangement, A response, March 2015, p. 71. 457
M. Lally, Gamma and the ACT Decision, May 2016, pp. 25–26, 28–29. 458
M. Lally, Gamma and the ACT Decision, May 2016, pp. 5–6, 24–26, 29..
459 M. Lally, Gamma and the ACT Decision, May 2016, p. 7.
460 M. Lally, Gamma and the ACT Decision, May 2016, p. 7.

4-121 Attachment 4 – Value of imputation credits | Final decision: Amadeus Gas Pipeline Access
Arrangement 2016–21
distribution rate in section 4.4.1 of attachment 4. Consistent with the Guideline, we estimate
it using the 'cumulative payout ratio approach', which uses data from the ATO on the
accounts used by companies to track their stocks of imputation credits ('franking account
balances'). Using this approach, NERA estimated a distribution rate across all equity of 0.7
for the period 1987 to 2011.461 Hathaway found a similar estimate for the period 2004 to
2011.462 Gray (for Frontier) submitted that the distribution rate for all equity and listed equity
excluding the impact of the top 20 listed companies is approximately 70%.463 Also using this
approach, Handley estimated a distribution rate across only listed equity of 0.8 for the period
1987 to 2011.464 Our own analysis indicated that the distribution rate over only listed equity
is 0.8 for the period 2004 to 2011—we calculated the aggregate net tax paid by public
companies over this period to be $255.6 billion and the change in aggregate franking
account balances of those companies over the same period to be $50.2 billion (suggesting
that $205.4 billion, or 80 per cent, of imputation credits generated were distributed).
We relied on an estimate of the distribution rate over all equity of 0.7 in the Guideline and
decisions released in 2014 and April 2015 and June 2015. We also relied on an estimate of
the distribution rate over only listed equity of 0.8 in the decision released in 2014 and April
2015. We reviewed these estimates in light of an updated analysis of the ATO data to the
2012 tax year by NERA, which was submitted to us as part of JGN's decision process.465
Handley also reviewed NERA's analysis, and provided his own report.466 Both NERA and
Handley found an estimate of 0.7 for the period 2004 to 2012.467 However, both NERA and
Handley found that the distribution rate over only listed equity has fallen slightly from 0.8.
Specifically, Handley found an estimate of 0.77 over the period 2004 to 2012. We used this
updated estimate for the decisions released in June, October and November 2015.
Gray (for frontier) replicated and updated using the latest Taxation Statistics cumulative
payout ratio for public and private companies in NERA's (2015) report.468 However, Gray's
(for frontier) replication of Handley (2014) and Handley (2015) cumulative payout ratio is
slightly different due to what Gray believes to be a different rounding method.469 The update
payout ratios presented below in Table 4-13.
461
NERA, The payout ratio: A report for the Energy Networks Association, June 2013. 462
N. Hathaway, Imputation credit redemption ATO data 1988–2011: Where have all the credits gone?, September 2013. 463
Frontier, The appropriate use of tax statistics when estimating gamma, January 2016, p. 15. 464
J. Handley, Report prepared for the Australian Energy Regulator: Advice on the value of imputation credits, 29 September
2014, pp. 28–29. 465
NERA, Estimating distribution and redemption rates from taxation statistics, March 2015. 466
J. Handley, Report prepared for the Australian Energy Regulator: Advice on the NERA report 'Estimating distribution and
redemption rates from taxation statistics', 20 May 2015. 467
As discussed in section A.13, we have regard to Hathaway's finding that the ATO statistics are subject to a number of
issues prior to 2004. 468
Frontier, The appropriate use of tax statistics when estimating gamma, January 2016, p. 20. 469
Frontier, The appropriate use of tax statistics when estimating gamma, January 2016, p. 20.

4-122 Attachment 4 – Value of imputation credits | Final decision: Amadeus Gas Pipeline Access
Arrangement 2016–21
Table 4-13 Frontier Economics updated distribution rates
2001-2012 2001-2013
Handley (public companies) 0.76 0.742
Handley (Private companies) 0.52 0.507
NERA (public companies) 0.755 0.742
NERA (Private companies) 0.505 0.495
Source: Frontier, The appropriate use of tax statistics when estimating gamma, January 2016, p. 22.
For this final decision the AER has updated the cumulative distribution rate to 2014. Through
this process we have estimated that the distribution rate for listed equity has fallen to 0.75
and this value is adopted in this final decision. Consistent with draft decision and the
regulated businesses revised proposals, the AER adopts a 0.7 distribution rate for all equity
in this decision.
We note that Lally recommends we use the distribution rate for listed equity estimated from
financial reports of the top 20 listed firms. This is due to Lally considering that listed equity is
more representative of the benchmark efficient entity, stating:470
Furthermore, since privately-owned regulated businesses in Australia are typically
listed firms or subsidiaries of listed firms, the appropriate set of firms to use to
estimate the distribution rate of regulated businesses would seem to be listed firms.
Lally also considers the data on the top 20 firms is of a higher quality (via financial
statements) relative to the ATO data which contains unresolved discrepancies.471 We note
that if we were to adopt Lally recommendation in this decision it would result in our estimate
for the distribution rate of the benchmark efficient entity (and therefore gamma) increasing.
Therefore, while we have not used this advice to increase gamma above 0.4, it does provide
support to reject the proposals from the service providers to reduce the gamma value to 0.25
based on the recent Tribunal decision.
In the remainder of this section we respond to the service providers' and Gray's comments
on the distribution rate; describe the cumulative payout ratio approach and alternative
approaches to estimating the distribution rate; and discuss an updated report on tax
statistics from Hathaway.
A.10.1 Service providers', Gray's and NERA's comments on the
distribution rate
The service providers and Gray (for SFG) submitted that it would be inappropriate to apply a
distribution rate based on evidence from only listed equity and that the distribution rate for all
470
M. Lally, Gamma and the ACT Decision, May 2016, p. 25. 471
M. Lally, Gamma and the ACT Decision, May 2016, p. 31.

4-123 Attachment 4 – Value of imputation credits | Final decision: Amadeus Gas Pipeline Access
Arrangement 2016–21
equity is likely to be a reasonable proxy for that of the benchmark entity.472 United Energy
cite the recent Tribunal decision in support of this position.473 We disagree and set out our
reasons below.
There appears to be agreement between the service providers, Gray and us that the
distribution rate is the proportion of imputation credits generated by the benchmark efficient
entity that is distributed to investors. There also appears to be agreement between the
service providers and us that the distribution rate should be estimated on a broad basis; for
instance, a number of service providers submitted:474
Gamma is conventionally estimated as a market-wide parameter and therefore there
is no reason to measure the distribution rate based on data for listed equity only, in
circumstances where data is available for both listed and unlisted firms.
In the decisions previously released in 2014 and 2015, and in section A.9 and A.10 of this
decision, we consider that there are good reasons for using estimates of the distribution rate
based on all equity and only listed equity.
Gray's report (for SFG) appears to support an estimate of the distribution rate that is not
affected by the distribution behaviour of very large public firms or very small private firms.
That is, Gray (for SFG) stated:
Conceptually, the task is…to estimate the distribution rate for the benchmark efficient
firm.475
…
For the same reason that very large multinational firms are not comparable to the
benchmark efficient entity, very small private firms would also not be close
comparators.476
In particular, Gray submitted that the distribution behaviour of large multinational firms
seemed unrepresentative of the benchmark efficient entity on account of their foreign-
472
Australian Gas Networks, Attachment 11 Response to Draft Decision: Cost of Tax, January 2016, p. 7; ActewAGL,
Appendix 5.01 Detailed response to rate of return, gamma and inflation, January 2016, p. 109; AusNet Electricity Services,
Revised Regulatory Proposal, January 2016, p. 7-80; United Energy, Response to AER Preliminary Determination Re:
Rate of return and gamma, January 2016, p. 81; CitiPower, Revised Regulatory Proposal 2016-2020; January 2016,
p. 359; Jemena Electricity Networks, Attachment 6-1 Rate of return, gamma, forecast inflation, and debt and equity raising
costs, January 2016, p. 87; Powercor, Revised Regulatory Proposal 2016-2020, January 2016, p. 353; APNT, Access
Arrangement Revised Proposal to Draft Decision, January 2016, p. 92. 473
United Energy, Submission on AER preliminary determination - Submission on gamma, 26 April 2016. 474
ActewAGL, Detailed response to the AER's draft decision in relation to gamma, January 2015, p. 1; Ausgrid, Ausgrid's
revised proposal on gamma, January 2015, p. 3; Directlink, Directlink submission on gamma (updated), January 2015, p.
3; Endeavour Energy, Endeavour Energy's response to the AER draft decision re gamma, January 2015, p. 3; Essential
Energy, Essential's response to AER draft decision re gamma, January 2015, p. 3; and JGN, Gamma - response to the
draft decision, February 2015, p. 4; CitiPower, Appendix J - Gamma, April 2015, p. 6; Powercor, Regulatory Proposal
2016-20, April 2015, p. 6; Energex, Submission on Energex's regulatory proposal 2015-20 and the AER issues paper,
January 2015, p. 4. 475
SFG, Estimating gamma for regulatory purposes, 6 February 2015, para. 211. 476
SFG, Estimating gamma for regulatory purposes, 6 February 2015, para. 222.

4-124 Attachment 4 – Value of imputation credits | Final decision: Amadeus Gas Pipeline Access
Arrangement 2016–21
sourced income.477 Gray concluded that the 'best estimate' of the distribution rate from
analysis which considered only listed equity was not materially different from 0.7.478 Handley
considered Gray's analysis to be ' incomplete and oversimplified to support such a strong
conclusion'.479 Gray (for Frontier) considers that Handley's response does not address the
issue that any firm with foreign profits will be able to distribute more imputation credits.480
We agree with Handley that Gray's analysis is oversimplified. There are many factors that
determine a firm's imputation payout ratio. The introduction of the imputation system in
Australia itself resulted in higher dividend payout ratio in order to distribute more imputation
credits.481 This would imply that firms recognise that investors value imputation credits and
want to distribute a certain amount of them in order to maximise value to shareholders. It is
also important to note that even if other firms do not have any foreign earnings they still have
an ability to distribute their imputation credits via methods including higher dividend
payments and off-market share buybacks. Subsequently if these firms need to retain more of
their earnings to fund growth they can achieve this via dividend reinvestment plans and
secondary equity raisings. Ultimately, the service providers have not shown the imputation
payout ratio is higher due to foreign income or if any increase due to this is material. They
have simply asserted that because these firms have foreign source income, and because
this may allow these firms to pay a higher imputation payout ratio (without using things like
dividend reinvestment plans), these firms should be excluded from the calculation of the
dividend payout ratio.
Lally examined this issue for us and concluded that firms with higher foreign earnings
actually appear to be distributing less imputation credits. 482 Lally empirically assessed the
seven largest tax paying entities on the ASX and found that the proportion of profit from
foreign operation is monotonically decreasing in the distribution rate (correlation of -0.95),
which is in the opposite direction to that claimed by Frontier.483 Lally concluded, based on his
analysis, we should use a distribution rate for listed equity from the top 20 listed firms.484
We also consider it is inappropriate to focus on one aspect of the benchmark (foreign
ownership and foreign income) and not look at the benchmark holistically. We should be
looking at how all regulated businesses distribute imputation credits to investors, rather than
focus on the foreign ownership. As the EMRF submitted, the listed regulated businesses
(APA, Envestra (pre-sale) and JGN's parent company) have a franking account balance of
477
SFG, Estimating gamma for regulatory purposes, 6 February 2015, paras. 215 and 217–218; Frontier, The appropriate use
of tax statistics when estimating gamma, January 2016, p. 6. 478
SFG, Estimating gamma for regulatory purposes, 6 February 2015, para. 223; Frontier, The appropriate use of tax
statistics when estimating gamma, January 2016, p. 6. 479
J. Handley, Report prepared for the Australian Energy Regulator: Further advice on the value of imputation credits, 16
April 2015, p. 21. 480
Frontier, The appropriate use of tax statistics when estimating gamma, January 2016, p. 12. 481
A. Ainsworth, G. Partington and G. Warren, Do franking credits matter? Exploring the financial implications of dividend
imputation, May 2015, p. 34. 482
M. Lally, Gamma and the ACT Decision, May 2016, pp. 26-29. 483
M. Lally, Gamma and the ACT Decision, May 2016, p. 27. 484
M. Lally, Gamma and the ACT Decision, May 2016, pp. 24-26, 28-29.

4-125 Attachment 4 – Value of imputation credits | Final decision: Amadeus Gas Pipeline Access
Arrangement 2016–21
zero.485 This can imply one of the following: (a) the regulated businesses distributed all either
imputation credits to investors and therefore the distribution should be set to 100 per cent or
(b) the regulated business do not generate any imputation credits as they do not pay
corporate tax. This raises the question of whether our tax building block allowance may be
too high. Based on the material submitted by the EMRF, it might be posited that our overall
tax assumptions (including the use of a gamma of 0.4) are conservative (in the favour of the
regulated businesses).
Regarding internal consistency when combining estimates of the distribution and utilisation
rates, Gray (for SFG) submitted:486
Since all credits from all companies are identical, it must be the case that, in
equilibrium, the credits have the same value throughout the economy. Consequently,
it is generally accepted that theta is a market-wide parameter – with a single value
that would apply to all firms.
That is, if the only value of theta is the market-wide value, then it is internally consistent to
combine it with any estimate of the distribution rate. NERA agreed:487
As theta should not vary from firm to firm, however, there should be no link between
how one estimates theta and how one estimates the distribution rate.
Gray (for Frontier) considered this matter again in his June 2015 report (for Frontier) and
stated:488
In my view, when estimating the distribution rate there are two reasons to be
concerned about the weight that is afforded to the top 20 listed firms:
a. The AER has specifically stated that the benchmark efficient entity should not be assumed to be a large listed company, as set out above; and
b. The top 20 listed firms differ from the benchmark entity in that their foreign sourced
profits enable a higher distribution rate.
The service providers submit that the distribution rate for listed equity is likely to be skewed
by the practices of multinational firms with significant foreign earnings.489
485
EMRF, NSW Electricity Distribution Revenue Reset, AER Draft Decision and revised proposals from Ausgrid, Endeavour
Energy and Essential Energy, A response, February 2015, p. 71. 486
SFG, Estimating gamma for regulatory purposes, 6 February 2015, para. 209. 487
NERA, Estimating distribution and redemption rates from taxation statistics, March 2015, p. ii. 488
Frontier Economics, An appropriate regulatory estimate of gamma, June 2015, p. 28. 489
Australian Gas Networks, Attachment 11 Response to Draft Decision: Cost of Tax, January 2016, pp. 7-8; ActewAGL,
Appendix 5.01 Detailed response to rate of return, gamma and inflation, January 2016, p. 109; AusNet Electricity Services,
Revised Regulatory Proposal, January 2016, p. 7-80; United Energy, Response to AER Preliminary Determination Re:
Rate of return and gamma, January 2016, p. 81; CitiPower, Revised Regulatory Proposal 2016-2020; January 2016,
p. 359; Jemena Electricity Networks, Attachment 6-1 Rate of return, gamma, forecast inflation, and debt and equity raising
costs, January 2016, p. 87; Powercor, Revised Regulatory Proposal 2016-2020, January 2016, p. 353; APNT, Access
Arrangement Revised Proposal to Draft Decision, January 2016, p. 91.

4-126 Attachment 4 – Value of imputation credits | Final decision: Amadeus Gas Pipeline Access
Arrangement 2016–21
However, for the reasons outlined above, we consider it is not clear that foreign income
results in a higher imputation payout ratio. Lally's analysis actually implies the opposite.490
Further, when determining the gamma value for the benchmark efficient entity, the
benchmark has to be determined holistically and individual aspect of the benchmark should
not be considered in isolation. We do not exclude the impact of the top 20 firms when
determining the cost of equity (MRP historical, DGM and beta) and consider it would be
inconsistent to exclude the top 20 firms when estimating the imputation distribution rate to be
used for estimating a gamma value for listed equity.
NERA appears to agree with SFG that one should not consider the largest listed companies.
It also considers "it is difficult to see there is a case for setting the distribution rate to be any
different to the value … of 0.7".491
In the proposals lodged in 2015 and 2016 the service providers have submitted that the
appropriate distribution rate for both listed and all equity is 70% consistent with the advice
from Gray and NERA.492 Service providers also consider that theta under the equity
ownership approach should be determined with regard to only listed equity as listed equities
foreign ownership is more reflective of the benchmark efficient entity. To summarise,
regulated businesses want to ignore firms with foreign income when estimating the
distribution rate which reduces gamma and want to include firms with foreign ownership for
the purposes of estimating the utilisation value which also reduces gamma.493 We do not
agree with this approach and considers it will not give a reasonable estimate of gamma for
the benchmark efficient entity for the reasons outline above.
NERA's views and Gray's views (for SFG and Frontier) must be reconciled with the fact that
different investors can value imputation credits differently. For instance, foreign investors do
not value credits and eligible domestic investors do. Therefore, a given estimate of theta will
490
M. Lally, Gamma and the ACT Decision, May 2016, pp. 26-29. 491
NERA, Estimating distribution and redemption rates: Response to the AER's final decisions for the NSW and ACT
electricity distributors, and for Jemena Gas Networks, June 2015, p. 18. 492
AusNet Services, 2016-20 Regulatory Proposal, April 2015, pp. 353-354; United Energy, Assessment of the Value of
Imputation Credits - Gamma, Proposal for 2016 to 2020, April 2015, pp. 1–4; CitiPower, Appendix J - Gamma, April 2015,
pp. 4–7; Powercor, Appendix J - Gamma, April 2015, pp. 4–7; Jemena Electricity, Attachment 06-06 Gamma proposal,
April 2015, pp. 6–8; SA Power Networks, Revised regulatory proposal 2015-20, July 2015, p. 378; Energex, Revised
Regulatory Proposal, July 2015, pp. 124–125; Ergon, Revised Regulatory Proposal, July 2015, p. 153; ActewAGL
Distribution, Attachment 8 Detailed gamma proposal, June 2015, pp. 4-6; Australian Gas Networks, Access Arrangement
Information - Attachment 11.2 Value of Imputation Credits, July 2015; pp. 3–6. Amadeus Gas Pipeline Access
Arrangement Revision Proposal Submission, August 2015, p. 153; ActewAGL, Appendix 5.01 Detailed response to rate of
return, gamma and inflation, January 2016, p. 111; AusNet Electricity Services, Revised Regulatory Proposal, January
2016, p. 7-82; United Energy, Response to AER Preliminary Determination Re: Rate of return and gamma, January 2016,
p. 83; CitiPower, Revised Regulatory Proposal 2016-2020; January 2016, pp. 360-361; Jemena Electricity Networks,
Attachment 6-1 Rate of return, gamma, forecast inflation, and debt and equity raising costs, January 2016, p. 89;
Powercor, Revised Regulatory Proposal 2016-2020, January 2016, p. 355. 493
ActewAGL, Appendix 5.01 Detailed response to rate of return, gamma and inflation, January 2016, p. 122; AusNet
Electricity Services, Revised Regulatory Proposal, January 2016, p. 7-90; United Energy, Response to AER Preliminary
Determination Re: Rate of return and gamma, January 2016, p. 91; CitiPower, Revised Regulatory Proposal 2016-2020;
January 2016, p. 369; Jemena Electricity Networks, Attachment 6-1 Rate of return, gamma, forecast inflation, and debt
and equity raising costs, January 2016, p. 98; Powercor, Revised Regulatory Proposal 2016-2020, January 2016, p. 363.

4-127 Attachment 4 – Value of imputation credits | Final decision: Amadeus Gas Pipeline Access
Arrangement 2016–21
reflect the set of investors over which it is calculated. Gray (for SFG) appears to recognise
this elsewhere in his report:494
If theta is estimated using a market value approach, the estimate will represent an
average across all listed firms.
This is further illustrated in Figure 4.1 and Figure 4.2 submitted by a number of service
providers, which indicate that SFG's dividend drop off estimate of theta reflects the
proportion of foreign investors in listed equity.
To clarify, in theory there may be a single economy-wide theta. However, the practical reality
is that a given estimate of theta will reflect the set of investors in the evidence used.
Accordingly, we consider that the distribution rate we use in combination with that estimate
of theta represent the distribution of credits to that same set of investors (or at least a
similarly reflective set) and will give a gamma value for this subset of equity. The service
providers, NERA and Gray (for SFG and Frontier) give us no cause to change this view.
Handley also supported our view:495
It is correct to say that theta is not firm-specific and the distribution rate is firm-
specific. But I do not agree with the suggestion that there need be no link between
how one estimates theta and how one estimates the distribution rate.
We are interested in estimating the value of imputation credits to the market as a
whole. In setting prices, investors in the market will take into account the quantity of
credits expected to be distributed by all firms in the market. Since gamma is
effectively defined as a price (theta) times a quantity (distribution rate) then in my
opinion, it is obvious that both components should be based on consistent data sets
which relate to the same market.
We note that Lally considers that consistency between the distribution rate and utilisation
value is not essential nor is it precluded.496 At the same time, Lally considers that the
distribution rate (for listed equity) should be estimated with reference to the top 20 listed
firms and the utilisation value should be estimated with reference to all equity.497 This implies
that gamma is at least 0.5, which indicates our value of gamma may be too low.
We also note that even if we were minded to do so, there is not necessarily a correct way to
filter listed equity data to make it more reflective of the benchmark efficient entity (as the
benchmark entity has a number of characteristics). While Gray (for SFG and Frontier) and
NERA have proposed filtering based on a single characteristic (excluding the 20 largest
listed firms) in a way that leads to a lower estimated distribution rate (and therefore a lower
estimated value of imputation credits), they have not demonstrated their filtering method will
lead to a better estimate of the distribution rate for the benchmark efficient entity. Further,
advice that we have received for Lally suggest that the filtering is unnecessary and if
494
SFG, Estimating gamma for regulatory purposes, 6 February 2015, para. 216. 495
J. Handley, Report prepared for the Australian Energy Regulator: Advice on the NERA report 'Estimating distribution and
redemption rates from taxation statistics', 20 May 2015, pp. 7–8. 496
M. Lally, Gamma and the ACT Decision, May 2016, p. 25. 497
M. Lally, Gamma and the ACT Decision, May 2016, p. 7.

4-128 Attachment 4 – Value of imputation credits | Final decision: Amadeus Gas Pipeline Access
Arrangement 2016–21
anything the best estimate of the distribution rate is based on the financial data of the top 20
firms.498 We note Lally's choice of the top 20 firms as a proxy for the estimate of the
distribution rate for listed equity is not based on filtering listed equity based on the
characteristics of the benchmark efficient entity, although he does consider listed firms more
relevant to the estimation of the distribution rate for the benchmark efficient entity.
Handley indicated that Gray's analysis was 'incomplete and oversimplified' to support the
restriction proposed, and we consider that Gray's June 2015 report (for Frontier) and
NERA's June 2015 report add nothing material to the discussion.
We also note that if we estimated a distribution rate strictly in accordance with our
benchmark definition we would end up with only the firms that we regulate, or an observable
set of similar firms, yet the service providers have not suggested an industry benchmark
distribution rate. We also do not propose an industry benchmark for the reasons set out in
the Guideline, although we note Lally's estimate of 0.83 for the broader listed equity market
does not seem unreasonable.499 However, we note the EMRF submitted that our assumed
distribution rates are lower (and, therefore more favourable to service providers) than those
relevant to a pure play energy network.500
A.10.2 The cumulative payout ratio approach
The cumulative payout ratio approach is applied as follows. It starts with the change in the
total value of imputation credits in firms’ franking account balances over a particular period of
time. This reflects the cumulative additions and subtractions of imputation credits over that
particular period of time. Then, subtracting this from total company tax paid over the same
period of time produces an estimate of the imputation credits that have been distributed in
total. This relies on the idea that every dollar of company tax paid generates an imputation
credit, which can either be distributed or retained in franking account balances. Then,
dividing this estimate by the value of company tax paid over the same time period produces
an estimate of the distribution rate over this time.
A limitation of this approach is that factors other than the distribution of imputation credits
can lead to a decrease in aggregate franking account balances.501 However, we are
unaware of the materiality of these factors. Moreover, as discussed in the next section:
Hathaway and NERA each preferred this approach to an approach involving data on
franked dividends, and
498
M. Lally, Gamma and the ACT Decision, May 2016, p. 29. 499
AER, Better regulation: Explanatory Statement Rate of Return Guideline, December 2013, pp. 163–164. 500
EMRF, NSW Electricity Distribution Revenue Reset, AER Draft Decision and revised proposals from Ausgrid, Endeavour
Energy and Essential Energy, A response, February 2015, pp. 31–32. 501
The ATO website contains a list of events that cause a debit to a company's franking account balance:
https://www.ato.gov.au/Business/Imputation/In-detail/Simplified-imputation---the-franking-
account/?page=5#When_does_a_franking_debit_arise_. Accessed 9 April 2015. NERA identified that the bankruptcy of a
company and the failure of a company to report its franking account balance can also cause the aggregate franking
account balance to decrease: NERA, The payout ratio: A report for the Energy Networks Association, June 2013, p. 5.

4-129 Attachment 4 – Value of imputation credits | Final decision: Amadeus Gas Pipeline Access
Arrangement 2016–21
an estimate of the distribution rate across only listed equity using this approach is broadly
reinforced by evidence from the financial statements of the largest listed companies.
A.10.3 Alternative approaches
There are at least two alternative approaches to estimating the distribution rate:
Hathaway and NERA each estimated a distribution rate of around 0.5 using ATO
statistics on the franked dividends distributed by companies as reported in their tax
returns.502 However, neither advocated the use of this estimate. NERA considered:503
In our opinion, the cumulative payout ratio is the most reliable estimate that is least
likely to be affected by potential distortions in the underlying data set.
And Hathaway considered:504
As was explained in section 3, I have more faith in the [franking account balance]
data than in the dividend data. The dividend data appears to be missing about $87.5
billion and the ATO has had substantial problems with the dividend data in the past.
Lally examined the financial statements of the 20 largest ASX-listed firms by market
capitalisation, and found an aggregate distribution rate across these firms of 0.83.505 We
consider that this broadly reinforces the higher cumulative payout ratio estimate across only
listed equity.
A.10.4 Hathaway (2014)
After the publication of the draft decisions in 2014, and deep into the process of preparing
the final decision for JGN, we became aware of an updated analysis of the tax statistics by
Hathaway dated October 2014.506 This report updates the analysis to include tax data for the
2011–12 financial year, which were published by the ATO during 2014. Hathaway (2014)
remains in draft form. Importantly, Hathaway (2014) appears to come to the opposite
conclusion of his 2013 analysis regarding the FAB data:507
…the FAB data indicate a net $337.4 billion of credits have been distributed and a
gross $428 billion was distributed.
This gross distribution seems highly improbable and is quite inconsistent with the
recorded franking credit income. It represents a gross payout ratio of 88% of all
company tax as franking credits for the period 2004-12. This is in stark contrast to the
502
N. Hathaway, Imputation credit redemption ATO data 1988–2011: Where have all the credits gone?, September 2013,
para. 97; NERA, The payout ratio: A report for the Energy Networks Association, June 2013, p. 11. 503
NERA, The payout ratio: A report for the Energy Networks Association, June 2013, p. 11. 504
N. Hathaway, Imputation credit redemption ATO data 1988–2011: Where have all the credits gone?, September 2013,
para. 99. 505
M. Lally, Review of submissions to the QCA on the MRP, risk-free rate and gamma, 12 March 2014, p. 30; M. Lally,
Gamma and the ACT Decision, May 2016, p. 26. 506
N. Hathaway, Imputation credit redemption ATO data 1988–2012: Where have all the credits gone? (draft), October 2014. 507
N. Hathaway, Imputation credit redemption ATO data 1988–2012: Where have all the credits gone? (draft), October 2014.

4-130 Attachment 4 – Value of imputation credits | Final decision: Amadeus Gas Pipeline Access
Arrangement 2016–21
gross 66% distribution recorded by the payment of franked dividends. We conclude
that the FAB data are a concern.
To the extent that the new conclusions in Hathaway (2014) are well founded, the potential
implication is that an estimate of the distribution rate using franked dividend data might be
more appropriate (that is, around 0.5, or at least between 0.5 and 0.7). However, on first
assessment, we are not convinced by Hathaway's main reason for concluding that the FAB
data are a concern—the idea that they imply a gross distribution rate of 0.88 which is
'improbable' and much higher than the gross distribution rate implied by franked dividend
data (0.66, which appears to be considered by Hathaway to be probable). This is because
Lally's estimate of the gross distribution rate across the largest listed companies is 0.83, and
therefore we do not consider that an estimate of 0.88 is necessarily improbable.
While we are aware of it, we do not place reliance on the conclusion in Hathaway (2014)
regarding the FAB data in this final decision. This is because:
We do not find Hathaway's reasoning for his conclusion convincing.
This conclusion does not appear contingent on any new information provided by the
release of the 2011–12 statistics. Therefore, this conclusion would appear to have been
open to Hathaway, NERA and Handley previously, yet none of them came to it.
We also note the report is still marked draft nearly one year after initially being completed.
A.11 Application of rate of return criteria to evidence on the utilisation rate
Our main assessment of the various approaches to estimating the utilisation rate is set out in
section 4.4 of attachment 4, with supporting evidence provided in this appendix. However,
we have also considered these approaches and the evidence they employ against the
criteria used to assess evidence on the allowed rate of return (Table 4-14). Assessment
against these criteria broadly supports our main assessment of the approaches.
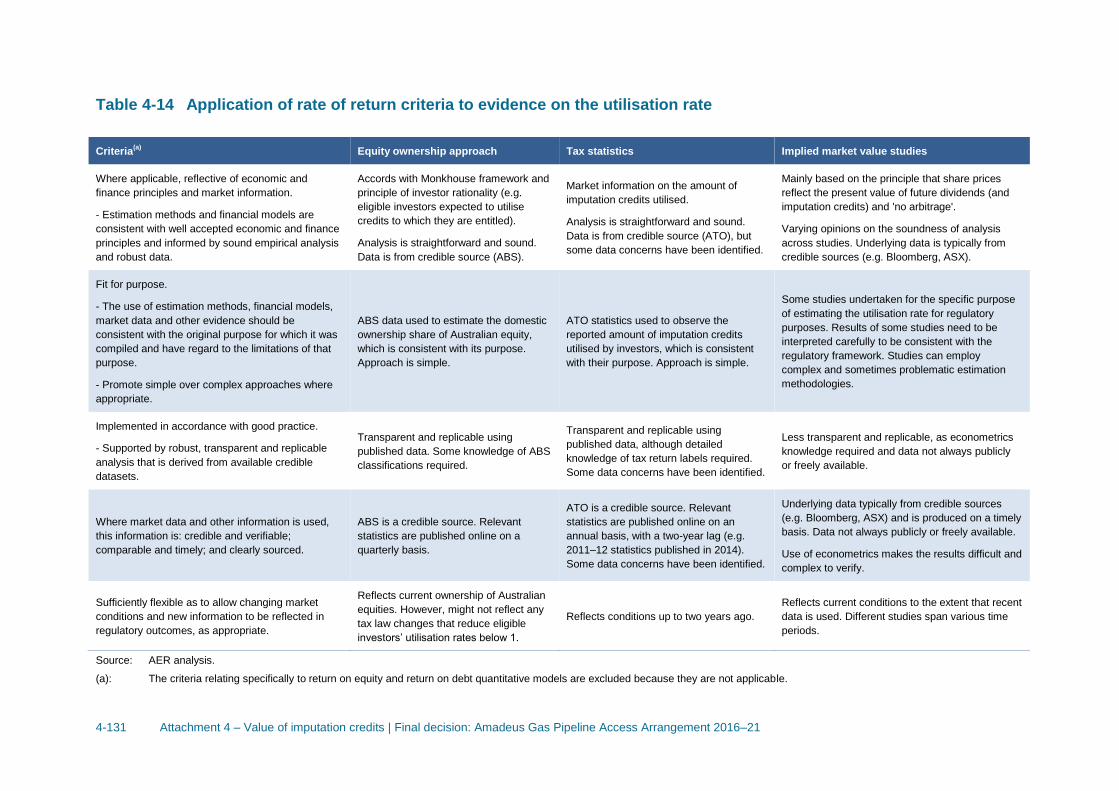
4-131 Attachment 4 – Value of imputation credits | Final decision: Amadeus Gas Pipeline Access Arrangement 2016–21
Table 4-14 Application of rate of return criteria to evidence on the utilisation rate
Source: AER analysis.
(a): The criteria relating specifically to return on equity and return on debt quantitative models are excluded because they are not applicable.
Criteria(a)
Equity ownership approach Tax statistics Implied market value studies
Where applicable, reflective of economic and
finance principles and market information.
- Estimation methods and financial models are
consistent with well accepted economic and finance
principles and informed by sound empirical analysis
and robust data.
Accords with Monkhouse framework and
principle of investor rationality (e.g.
eligible investors expected to utilise
credits to which they are entitled).
Analysis is straightforward and sound.
Data is from credible source (ABS).
Market information on the amount of
imputation credits utilised.
Analysis is straightforward and sound.
Data is from credible source (ATO), but
some data concerns have been identified.
Mainly based on the principle that share prices
reflect the present value of future dividends (and
imputation credits) and 'no arbitrage'.
Varying opinions on the soundness of analysis
across studies. Underlying data is typically from
credible sources (e.g. Bloomberg, ASX).
Fit for purpose.
- The use of estimation methods, financial models,
market data and other evidence should be
consistent with the original purpose for which it was
compiled and have regard to the limitations of that
purpose.
- Promote simple over complex approaches where
appropriate.
ABS data used to estimate the domestic
ownership share of Australian equity,
which is consistent with its purpose.
Approach is simple.
ATO statistics used to observe the
reported amount of imputation credits
utilised by investors, which is consistent
with their purpose. Approach is simple.
Some studies undertaken for the specific purpose
of estimating the utilisation rate for regulatory
purposes. Results of some studies need to be
interpreted carefully to be consistent with the
regulatory framework. Studies can employ
complex and sometimes problematic estimation
methodologies.
Implemented in accordance with good practice.
- Supported by robust, transparent and replicable
analysis that is derived from available credible
datasets.
Transparent and replicable using
published data. Some knowledge of ABS
classifications required.
Transparent and replicable using
published data, although detailed
knowledge of tax return labels required.
Some data concerns have been identified.
Less transparent and replicable, as econometrics
knowledge required and data not always publicly
or freely available.
Where market data and other information is used,
this information is: credible and verifiable;
comparable and timely; and clearly sourced.
ABS is a credible source. Relevant
statistics are published online on a
quarterly basis.
ATO is a credible source. Relevant
statistics are published online on an
annual basis, with a two-year lag (e.g.
2011–12 statistics published in 2014).
Some data concerns have been identified.
Underlying data typically from credible sources
(e.g. Bloomberg, ASX) and is produced on a timely
basis. Data not always publicly or freely available.
Use of econometrics makes the results difficult and
complex to verify.
Sufficiently flexible as to allow changing market
conditions and new information to be reflected in
regulatory outcomes, as appropriate.
Reflects current ownership of Australian
equities. However, might not reflect any
tax law changes that reduce eligible
investors’ utilisation rates below 1.
Reflects conditions up to two years ago.
Reflects current conditions to the extent that recent
data is used. Different studies span various time
periods.
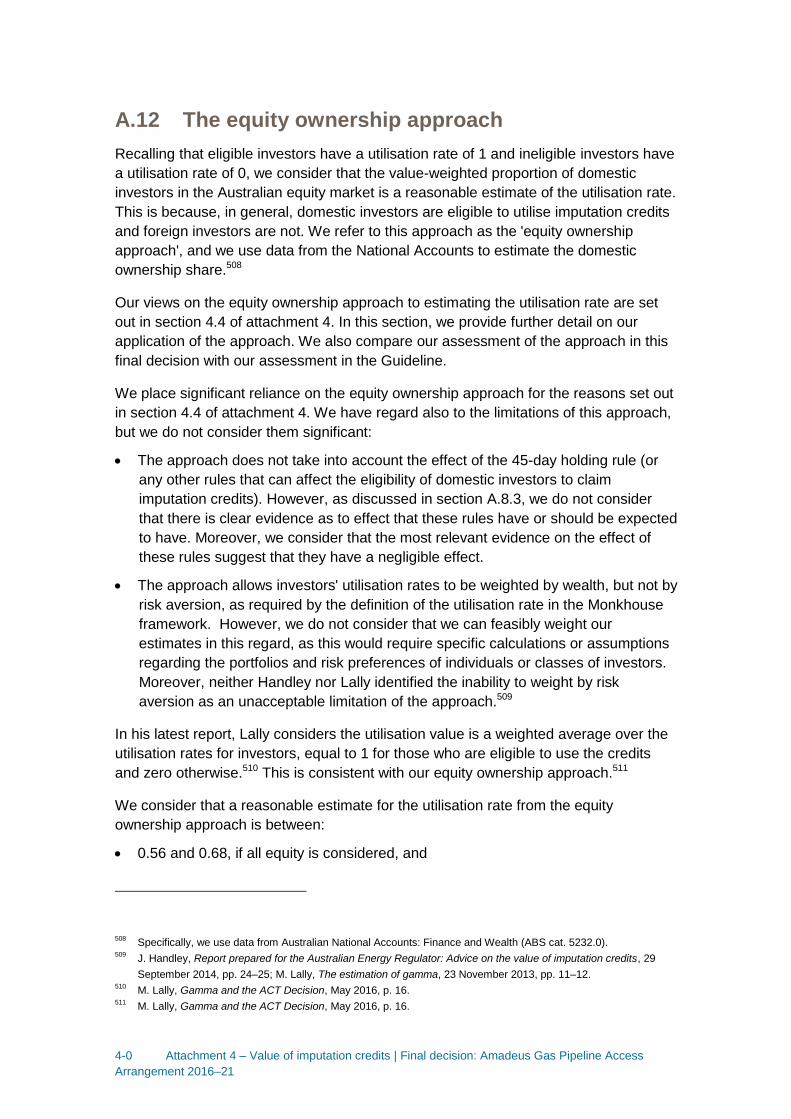
4-0 Attachment 4 – Value of imputation credits | Final decision: Amadeus Gas Pipeline Access
Arrangement 2016–21
A.12 The equity ownership approach
Recalling that eligible investors have a utilisation rate of 1 and ineligible investors have
a utilisation rate of 0, we consider that the value-weighted proportion of domestic
investors in the Australian equity market is a reasonable estimate of the utilisation rate.
This is because, in general, domestic investors are eligible to utilise imputation credits
and foreign investors are not. We refer to this approach as the 'equity ownership
approach', and we use data from the National Accounts to estimate the domestic
ownership share.508
Our views on the equity ownership approach to estimating the utilisation rate are set
out in section 4.4 of attachment 4. In this section, we provide further detail on our
application of the approach. We also compare our assessment of the approach in this
final decision with our assessment in the Guideline.
We place significant reliance on the equity ownership approach for the reasons set out
in section 4.4 of attachment 4. We have regard also to the limitations of this approach,
but we do not consider them significant:
The approach does not take into account the effect of the 45-day holding rule (or
any other rules that can affect the eligibility of domestic investors to claim
imputation credits). However, as discussed in section A.8.3, we do not consider
that there is clear evidence as to effect that these rules have or should be expected
to have. Moreover, we consider that the most relevant evidence on the effect of
these rules suggest that they have a negligible effect.
The approach allows investors' utilisation rates to be weighted by wealth, but not by
risk aversion, as required by the definition of the utilisation rate in the Monkhouse
framework. However, we do not consider that we can feasibly weight our
estimates in this regard, as this would require specific calculations or assumptions
regarding the portfolios and risk preferences of individuals or classes of investors.
Moreover, neither Handley nor Lally identified the inability to weight by risk
aversion as an unacceptable limitation of the approach.509
In his latest report, Lally considers the utilisation value is a weighted average over the
utilisation rates for investors, equal to 1 for those who are eligible to use the credits
and zero otherwise.510 This is consistent with our equity ownership approach.511
We consider that a reasonable estimate for the utilisation rate from the equity
ownership approach is between:
0.56 and 0.68, if all equity is considered, and
508
Specifically, we use data from Australian National Accounts: Finance and Wealth (ABS cat. 5232.0). 509
J. Handley, Report prepared for the Australian Energy Regulator: Advice on the value of imputation credits, 29
September 2014, pp. 24–25; M. Lally, The estimation of gamma, 23 November 2013, pp. 11–12. 510
M. Lally, Gamma and the ACT Decision, May 2016, p. 16. 511
M. Lally, Gamma and the ACT Decision, May 2016, p. 16.

4-1 Attachment 4 – Value of imputation credits | Final decision: Amadeus Gas Pipeline Access
Arrangement 2016–21
0.38 and 0.55, if only listed equity is considered.
In the Guideline, we considered that the equity ownership approach supported a
utilisation rate between 0.7 and 0.8. This range was based on:
A 2007 feature article by the ABS, in which it was estimated using data from the
National Accounts that domestic investors held 71 per cent of Australian equity.512
A graph in a September 2013 report by Hathaway, which suggested that the
domestic ownership share of Australian equity had fluctuated between 75 and 81
per cent over the period 1988 to 2012.513 The data underlying this graph also came
from the National Accounts.
Since the Guideline's publication, we have examined more closely the relevant data
from the National Accounts. This has allowed us to update and refine our estimates.
Moreover, we now express estimates for both all equity and only listed equity,
consistent with the approach set out in section A.9 and A.10.
We consider that the equity ownership approach can be refined by filtering the National
Accounts data to focus on the types of equity that we consider most relevant to the
benchmark entity, and the specific classes of investor that are expected to either utilise
or waste the imputation credits they receive. That is, we can:
Exclude from the calculation equity in entities that are wholly owned by the public
sector. In the National Accounts, this is equity issued by the 'central bank', 'central
borrowing authorities' and 'public non-financial corporations'.
Calculate the equity held by those classes of investor that are eligible to utilise
imputation credits as a share of the equity held by all classes of investor that either
utilise or waste credits. In the National Accounts, this is calculated as the equity
held by 'households', 'pension funds' and 'life insurance corporations' as a share of
the equity held by these classes plus 'rest of world'. In the draft decisions released
in 2014, our calculation of the refined domestic ownership share effectively
assumed that governments 'wasted' the imputation credits they received. We noted
in the draft decisions that there was no clear case for making this assumption. In
this final decision, consistent with the approach we took for the decisions we
released in October and November 2015, we exclude government-held equity from
the calculation of the refined domestic ownership share. This is because the value
of imputation credits forms part of our determination of the rate of return required
by private investors in the benchmark efficient entity.514 In doing this we are
512
Australian Bureau of Statistics, Feature article: Foreign ownership of equity, September 2007. Available at:
http://www.abs.gov.au/AUSSTATS/[email protected]/Previousproducts/5302.0Feature%20Article10Sep%202007?opendo
cument&tabname=Summary&prodno=5302.0&issue=Sep%202007&num=&view. Accessed 9 April 2015. 513
N. Hathaway, Imputation credit redemption ATO data 1988–2011: Where have all the credits gone?, September
2013, figure 5. 514
If governments are assumed to waste the credits they receive, the equity ownership approach supports an
estimate of the utilisation rate of between 0.54 and 0.65 if all equity is considered, and between 0.38 and 0.54 if
only listed equity is considered.

4-2 Attachment 4 – Value of imputation credits | Final decision: Amadeus Gas Pipeline Access
Arrangement 2016–21
estimating market-wide utilisation rates (for both listed and all equity) reflective of
the capital invested by private investors. We do not consider this is inconsistent
with other parameter estimates used for estimating the WACC and consider this
will lead to an overall return that should lead to efficient investment in regulated
assets.
The service providers have submitted that our refinement of the data may not be
complete as it is limited by the coarseness of the data and that there are a number of
concerns with the quality of the data as documented by the ABS.515 However, we do
not consider that the data limitations that may exist in all datasets is a valid reason not
to refine data. We consider there are valid reasons to refine the ABS data. It should be
noted that our approach to removing the government sector is conservative.
Alternatively, we could have assumed the government sector has a utilisation value of
1 given this equity is Australian owned.
Further, in response to Frontier, we do not consider the refinement of the ABS data is
what drives the difference between the equity ownership approach and taxation
statistics. We consider the difference is primarily driven by data issues with taxation
statics and other issues. This is further discussed in section A.14.
Our estimate ranges in this final decision differ from the corresponding ranges in the
draft decisions released in 2014. These changes in part reflect the views of service
providers, Gray (for SFG) and Handley. We discuss our consideration of these views
below.
A number of service providers have submitted that we erred in our earlier decisions
because:516
…the ranges used by the AER for the equity ownership rate are inconsistent
with the evidence in the Draft Decision.
The service providers then referred to the data presented in the draft decisions
released in 2014 on the refined domestic ownership share (figures 4.4 and 4.5 of the
draft decisions). However, as indicated in the draft decisions, our estimates were
based on evidence across both the refined domestic ownership share (figures 4.4 and
4.5 of the draft decisions) and simple domestic ownership share (figures 4.2 and 4.3 of
the draft decisions).
515
Frontier, The appropriate use of tax statistics when estimating gamma, January 2016, p. 7. 516
ActewAGL, Revised Regulatory Proposal 2015-19, January 2015, pp. 485–486; Ausgrid, Ausgrid's revised
proposal on gamma, January 2015, p. 1; Directlink, Directlink submission on gamma (updated), January 2015, p.
1; Endeavour Energy, Endeavour Energy's response to the AER draft decision re gamma, January 2015, p. 1;
Essential Energy, Essential's response to AER draft decision re gamma, January 2015, p. 1; and JGN, Gamma -
response to the draft decision, February 2015, p. 1; Jemena Electricity, Attachment 06-06 Gamma proposal, April
2015, p. 1: Energex, Revised Regulatory Proposal, July 2015, p. 13; Powercor, Regulatory Proposal 2016–20,
April 2015, p. 249; CitiPower, Regulatory Proposal, April 2015, p. 241; AusNet Services, 2016-20 Regulatory
Proposal, April 2015, pp. 367–368; United Energy, Assessment of the Value of Imputation Credits - Gamma,
Proposal for 2016 to 2020, April 2015, pp. 19–20.

4-3 Attachment 4 – Value of imputation credits | Final decision: Amadeus Gas Pipeline Access
Arrangement 2016–21
In his recent advice, Handley advised that, although it is reasonable to rely on both the
simple and refined domestic ownership share, 'the refined share should (subject to the
limitations in the data) be more relevant by construction'.517 Accordingly, as we did in
the decisions released in April, June, October and November 2015, in this final
decision we rely only on the refined domestic ownership share.
Service providers have also submitted that only the most recent point estimates of the
equity ownership share are relevant.518 We disagree. Given that the series exhibits
considerable volatility, we think it is reasonable to not rely solely on the most recent
point estimate. Handley supported this view:519
Referring to the refined data, it is apparent that there is substantial volatility in
the reported ABS estimates over time. There are also residual issues with the
ABS data. This suggests that more than just the most recent estimates should
be taken into consideration, although the length of period to be considered is
open to judgment.
In determining whether to use the current value of equity ownership or a historical
average, Lally considers that it depends on whether the series is following a random
walk or mean reversion.520 Lally does not concluded whether the series is mean
reverting or not and states the current observation are not unusually high or low. He
suggests that even if the series are mean reverting, a reasonable point estimate for the
next five years would still be approximately the latest values.521 We note that Lally uses
the current equity ownership rate of all equity to estimate an utilisation value of at least
0.6. In contrast we assess the utilisation value for all equity using the lowest point of
the range over the last 15 years. As a result, for the equity ownership approach for all
equity our approach of using a value towards the bottom end of the range is
conservative relative to Lally's use of a value of around the current estimate.
On Handley's point regarding the length of period to considered, we agree with Gray's
view (for SFG) that:522
517
J. Handley, Report prepared for the Australian Energy Regulator: Further advice on the value of imputation credits,
16 April 2015, p. 12. 518
Australian Gas Networks, Attachment 11 Response to Draft Decision: Cost of Tax, January 2016, p. 18;
ActewAGL, Appendix 5.01 Detailed response to rate of return, gamma and inflation, January 2016, pp. 121, 123;
AusNet Electricity Services, Revised Regulatory Proposal, January 2016, pp. 7-90, 7-91; United Energy, Response
to AER Preliminary Determination Re: Rate of return and gamma, January 2016, pp. 91, 92; CitiPower, Revised
Regulatory Proposal 2016-2020; January 2016, pp. 368, 370; Jemena Electricity Networks, Attachment 6-1 Rate of
return, gamma, forecast inflation, and debt and equity raising costs, January 2016, pp. 98, 99; Powercor, Revised
Regulatory Proposal 2016-2020, January 2016, pp. 362, 364. 519
J. Handley, Report prepared for the Australian Energy Regulator: Further advice on the value of imputation credits,
16 April 2015, p. 13. 520
M. Lally, Gamma and the ACT Decision, May 2016, p. 17. 521
M. Lally, Gamma and the ACT Decision, May 2016, p. 17. 522
SFG, Estimating gamma for regulatory purposes, 6 February 2015, para. 147(a).

4-4 Attachment 4 – Value of imputation credits | Final decision: Amadeus Gas Pipeline Access
Arrangement 2016–21
It is not clear why estimates of what the domestic equity ownership proportion
was in the 1980s are relevant to the current determination for the forthcoming
regulatory period.
We consider that the most relevant period to consider is that since July 2000, when
eligible investors became entitled for a refund of excess credits. This accords with one
of the periods Handley considered relevant.523 It is also consistent with the service
providers' proposed estimation of the value of distributed credits via SFG's dividend
drop off study. This study employs data from July 2001 to October 2012.
The service providers submit that the July 2000 start date is arbitrary and that more
recent events such as the GFC could provide a more appropriate start date.524
However, the AER considers that the service provider have not provided any evidence
why the GFC would result in a structural change in the value of imputation credits. The
AER considers that the 2000 tax law change is a structural change and would be
expected to increase the value of imputation credits to investors. The same cannot be
said about the GFC where the impact on imputation credits is unclear.
Gray (for Frontier) submitted that we are incorrect to exclude from the equity ownership
calculation entities that are wholly owned by the public sector and to the extent we
exclude them theta will be upward biased.525 We disagree for the reasons stated above
as set out in our April and June 2015 decisions. We consider that the Vanilla WACC
framework as embedded in the rules is aimed at ensuring private investors are fairly
compensated. This should ensure efficient investment and use of regulated network
infrastructure. We consider an estimate of gamma reduced due to government entities
being assumed to not redeem credits is not appropriate.
United Energy has submitted that the Tribunal found that the equity ownership
approach overstates the redemption rates and would only be useful as a further check
on other estimates.526 In this decision the Tribunal also indicated that since the equity
ownership approach utilisation value is higher than the tax statistics this implies that
there are investors who the AER assumes are eligible to redeem imputation credits
but, for whatever reasons, either cannot redeem them or attribute so little value to the
523
J. Handley, Report prepared for the Australian Energy Regulator: Further advice on the value of imputation credits,
16 April 2015, footnote 16. 524
Australian Gas Networks, Attachment 11 Response to Draft Decision: Cost of Tax, January 2016, p. 18;
ActewAGL, Appendix 5.01 Detailed response to rate of return, gamma and inflation, January 2016, p. 123; AusNet
Electricity Services, Revised Regulatory Proposal, January 2016, p. 7-91; United Energy, Response to AER
Preliminary Determination Re: Rate of return and gamma, January 2016, p. 92; CitiPower, Revised Regulatory
Proposal 2016-2020; January 2016, p. 370; Jemena Electricity Networks, Attachment 6-1 Rate of return, gamma,
forecast inflation, and debt and equity raising costs, January 2016, p. 99; Powercor, Revised Regulatory Proposal
2016-2020, January 2016, p. 364. 525
Frontier Economics, An appropriate regulatory estimate of gamma, June 2015, pp. 31–32; Frontier, The
appropriate use of tax statistics when estimating gamma, January 2016, p. 7. 526
United Energy, Submission on AER preliminary determination - Submission on gamma, 26 April 2016; Australian
Competition Tribunal, Application by Public Interest Advocacy Centre Ltd and Ausgrid [2016] ACompT 1, 26
February 2016, para. 1093.

4-5 Attachment 4 – Value of imputation credits | Final decision: Amadeus Gas Pipeline Access
Arrangement 2016–21
credits that they do not utilise them.527 We have carefully considered the Tribunal
reasoning and remain of the view that the equity ownership approach can be used as a
point estimate for the utilisation value. Lally supports this view by noting the equity
ownership approach is not an upper bound on the utilisation value but an unbiased
estimate. 528
United Energy also submitted that the Tribunal found that the AER is effectively
redefining the utilisation value as the proportion of distributed imputation credits
available for redemption, and this is inconsistent with the concept of gamma in the
Office Framework for the WACC.529 As set out in sections A.5, A.6 and A.7, we
consider our approach is consistent with the post-tax Officer Framework for the WACC.
We consider the face value of imputation credits is the post-tax (pre-personal tax)
value of imputation credits and reflects the cost of imputation credits to the regulated
businesses. The face value of distributed imputation credits also reflects the post-tax
value of distributed imputation credits to equity investors.
With regard to these considerations, the relevant data is shown in Figure 4.3.
527
Australian Competition Tribunal, Application by Public Interest Advocacy Centre Ltd and Ausgrid [2016] ACompT
1, 26 February 2016, para. 1090. 528
M. Lally, Gamma and the ACT Decision, May 2016, p. 16. 529
United Energy, Submission on AER preliminary determination - Submission on gamma, 26 April 2016; Australian
Competition Tribunal, Application by Public Interest Advocacy Centre Ltd and Ausgrid [2016] ACompT 1, 26
February 2016, para. 1100.
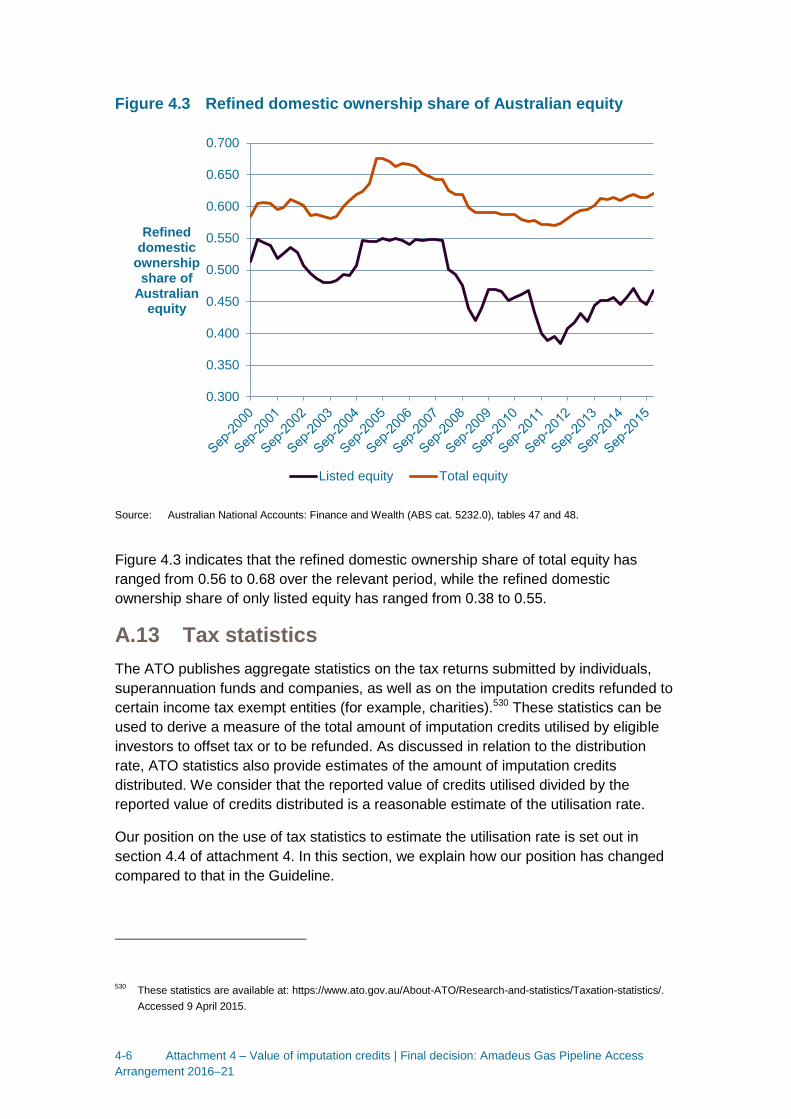
4-6 Attachment 4 – Value of imputation credits | Final decision: Amadeus Gas Pipeline Access
Arrangement 2016–21
Figure 4.3 Refined domestic ownership share of Australian equity
Source: Australian National Accounts: Finance and Wealth (ABS cat. 5232.0), tables 47 and 48.
Figure 4.3 indicates that the refined domestic ownership share of total equity has
ranged from 0.56 to 0.68 over the relevant period, while the refined domestic
ownership share of only listed equity has ranged from 0.38 to 0.55.
A.13 Tax statistics
The ATO publishes aggregate statistics on the tax returns submitted by individuals,
superannuation funds and companies, as well as on the imputation credits refunded to
certain income tax exempt entities (for example, charities).530 These statistics can be
used to derive a measure of the total amount of imputation credits utilised by eligible
investors to offset tax or to be refunded. As discussed in relation to the distribution
rate, ATO statistics also provide estimates of the amount of imputation credits
distributed. We consider that the reported value of credits utilised divided by the
reported value of credits distributed is a reasonable estimate of the utilisation rate.
Our position on the use of tax statistics to estimate the utilisation rate is set out in
section 4.4 of attachment 4. In this section, we explain how our position has changed
compared to that in the Guideline.
530
These statistics are available at: https://www.ato.gov.au/About-ATO/Research-and-statistics/Taxation-statistics/.
Accessed 9 April 2015.
0.300
0.350
0.400
0.450
0.500
0.550
0.600
0.650
0.700
Refined domestic
ownership share of
Australian equity
Listed equity Total equity

4-7 Attachment 4 – Value of imputation credits | Final decision: Amadeus Gas Pipeline Access
Arrangement 2016–21
In the Guideline, we considered that tax statistics supported a utilisation rate between
0.4 and 0.8. This was based on:
A 2013 report by Hathaway, which sought to estimate the proportion of distributed
credits that have been utilised. This report produced two estimates for the period
2004 to 2011: 0.43 and 0.61. The two estimates reflect two alternative measures
of the value of credits distributed, which in turn imply two alternative estimates of
the distribution rate (as discussed in section A.10). The 0.43 and 0.61 estimates of
the utilisation rate correspond to estimates of the distribution rate of around 0.7 and
0.5 respectively.531
A 2004 paper by Handley and Maheswaran, which sought to estimate the
proportion of distributed credits that were used to reduce investors' tax liabilities.
This paper produced an estimate for the period 2001 to 2004 of 0.81.
Since the Guideline we have continued to examine this evidence. We now consider
that greater reliance should be placed upon estimates that are:
derived from post-2004 data, consistent with Hathaway's findings that the ATO
statistics are subject to a number of issues prior to 2004,532 and
consistent with our preferred estimates of the distribution rate estimated using
cumulative distribution rate data. However, we note this consistency principle does
not preclude the combination of a utilisation rate estimated based on this principle
with a higher estimate of the distribution rate for the benchmark efficient entity
based on Lally's latest advice.
Applying these considerations, in our prior decisions, we did not rely on:
Handley and Maheswaran's estimate of 0.81, because this is (predominantly)
derived from pre-2004 data.
Hathaway's estimate of 0.61, because this corresponds to an estimate of the
distribution rate of around 0.5 whereas we adopt an estimate of the distribution rate
over all equity of 0.7. We note this does not apply to Lally's latest analysis, as he
determines the distribution rate from annual reports and not tax statistics. Lally
considers that the difference between the two Hathaway's utilisation rate estimates
demonstrates the unreliability of tax statistics data.533
531
N. Hathaway, Imputation credit redemption ATO data 1988–2011: Where have all the credits gone?, September
2013. Hathaway's calculations actually suggest estimates of the utilisation rate of 0.44 and 0.62 and corresponding
estimates of the distribution rate of 0.69 and 0.49, respectively. However, we round these distribution rate
estimates up to 0.7 and 0.5, which implies slightly higher amounts of credits distributed and therefore slightly lower
utilisation rates of 0.43 and 0.61. 532
N. Hathaway, Imputation credit redemption ATO data 1988–2011: Where have all the credits gone?, September
2013, para. 32. 533
M. Lally, Gamma and the ACT Decision, May 2016, p. 20.

4-8 Attachment 4 – Value of imputation credits | Final decision: Amadeus Gas Pipeline Access
Arrangement 2016–21
NERA updated analysis of the ATO data to the 2012 tax year and found an estimated
utilisation rate of 0.45.534 This analysis was subsequently updated by Frontier to the
2013 tax year which found an estimated utilisation rate of 0.46.535 We further updated
the estimate using tax statistics to the 2014 tax year and found a utilisation value of
0.48.
As discussed in section A.10, for this decision we place no reliance on Hathaway's
new report and therefore it does not change our conclusions regarding the utilisation
rate indicated by tax statistics.
As noted above, United Energy has submitted that the Tribunal considers that tax
statistics can only provide an upper bound on the estimate of theta.536 We remain of
the view that tax statistics can be used as point estimate for the utilisation value (see
section 4.4.1 and our reasoning below).
We consider tax statistics produce estimates of the utilisation rate. These estimates
are uncertain and dependent on the quality of the underlying data (which is an issue for
tax statistics, as shown in section 4.4.1). As such, the true (unknown) value could be
higher or lower. We consider this cannot constitute an upper bound for the true
utilisation rate.
Also, Lally considers that the correctly measured tax statistics provides an upward
biased estimate for the utilisation value.537 This is because local investors tilt their
shareholding to stocks with higher imputation credit yields. However, Lally considers
our estimate of 0.45 (updated to 0.48 in this decision) is not an upper bound as tax
statistics are unreliable and we use the lower of two possible tax statistics estimates for
the utilisation rate.538 Ultimately, as set out above, we consider any uncertain estimate
is not an upper bound. Given the uncertainty associated with the utilisation rate
estimate, we also do not consider the tax statistics would be inconsistent with a higher
estimate of gamma than 0.4 for the benchmark efficient entity. In particular, we note an
estimate of gamma of approximately 0.4 is obtained when combining a utilisation rate
of 0.48 (consistent with FAB data) with Lally's preferred estimate of the distribution rate
for a benchmark efficient entity of 0.83.539
Given the concerns with tax statistics data, we consider the equity ownership approach
provides the best point estimate for the utilisation value currently available. This is due
to the value of imputation credits being equal to face value on a pre-personal tax and
pre-personal cost basis. Given the 45 day holding rule should not be having a material
534
NERA, Estimating distribution and redemption rates from taxation statistics, March 2015. 535
Frontier Economics, An appropriate regulatory estimate of gamma, June 2015, pp. 31–32; Frontier, The
appropriate use of tax statistics when estimating gamma, January 2016, p. 31. 536
United Energy, Submission on AER preliminary determination - Submission on gamma, 26 April 2016; Australian
Competition Tribunal, Application by Public Interest Advocacy Centre Ltd and Ausgrid [2016] ACompT 1, 26
February 2016, paras. 1048, 1090 and 1095. 537
M. Lally, Gamma and the ACT Decision, May 2016, p. 20. 538
M. Lally, Gamma and the ACT Decision, May 2016, p. 20. 539
Lally, Gamma and the ACT Decision, May 2016, p. 5.

4-9 Attachment 4 – Value of imputation credits | Final decision: Amadeus Gas Pipeline Access
Arrangement 2016–21
impact on the utilisation of imputation credits (see section A.8.3), we consider the
proportion of local investor in the equity markets is a reasonable point estimate of the
utilisation value.
In comparison to tax statistics market studies do not provide as appropriate an
estimate of the utilisation value as they are determined by the marginal investor and
the not aggregate investors. As a result, we consider market studies do not provide as
good an estimate of the value of distributed imputation credits as estimates from the
equity ownership approach and tax statistics. Market studies are also influenced by
differential personal tax and personal cost factors and do not reflect a post-tax (pre-
personal) rate of imputation credits under our post-tax framework (see section A.15.3).
For these reasons we provide them relatively less weight.
A.14 Difference between equity ownership approach and tax statistics
In its decisions, the Tribunal considered it is apparent that there are investors who the
AER assumes are eligible to redeem imputation credits but, for whatever reasons,
either cannot redeem them or attribute so little value to the credits that they do not
utilise them.540 This is due to the equity ownership approach indicating the utilisation
rate is above the estimate specified through tax statistics. Further, the Tribunal
considered the value of the utilisation value produced by taxation statistics is evidence
that Australian investors do not value imputation credits at their face value, because
they may be unable to use them.541
We have considered the Tribunal's reasoning and consider there is no reason to
expect that the equity ownership approach and the taxation statistics should result in
the same utilisation value. We do not consider the difference is likely to be driven either
by the 45 day holding rule or by investors valuing imputation credits at less than face
value because they may be unable to use them. We consider the difference between
the equity ownership approach and tax statistics is likely driven primarily by data issues
associated with the tax statistics. The data issues with tax statistics was recognised by
the Tribunal.542 Lally supports this view by noting that the most obvious explanation for
the difference between the equity ownership and tax statistics is explained by our tax
statistics estimate being too low.543 Although, we note that an estimate of gamma of
approximately 0.4 is be obtained when combining a utilisation rate of 0.48 (consistent
with tax statistics, FAB data) with Lally's preferred estimate of the distribution rate for a
benchmark efficient entity of 0.83.544
540
Australian Competition Tribunal, Application by Public Interest Advocacy Centre Ltd and Ausgrid [2016] ACompT
1, 26 February 2016, para. 1090. 541
Australian Competition Tribunal, Application by Public Interest Advocacy Centre Ltd and Ausgrid [2016] ACompT
1, 26 February 2016, para. 1092. 542
Australian Competition Tribunal, Application by Public Interest Advocacy Centre Ltd and Ausgrid [2016] ACompT
1, 26 February 2016, para. 1092. 543
M. Lally, Gamma and the ACT Decision, May 2016, p. 21. 544
Lally, Gamma and the ACT Decision, May 2016, p. 5.

4-10 Attachment 4 – Value of imputation credits | Final decision: Amadeus Gas Pipeline Access
Arrangement 2016–21
Further, we note there is no compelling evidence before us that the 45 day rule is
having a material impact, or that investors are valuing imputation credits at less than
their face value because they may be unable to use them. As noted earlier, the
estimate from tax statistics that we rely upon is not an upper bound on the utilisation
value. 545
Finally we note that even if the data was highly reliable, the equity ownership approach
and taxation statistics are a slightly different measures based on different data sets
and methodologies. Therefore, there should be no expectation that both measures
should yield exactly the same estimates of the utilisation value. We consider both
measure are relevant in determining gamma. However, we place more reliance on the
equity ownership approach given they are conceptually more correct (see section
A.12) and there are data issues associated with tax statistics. The Tribunal itself has
acknowledged these data issues in its latest decision.546 In light of the Tribunals
acknowledgement of the data issues, we consider taxation statistics cannot be used to
infer the upper bound for theta (see section A.13). Moreover, having regard to the
potential data limitations and alternate estimates, we consider the evidence from tax
statistics is not inconsistent with the evidence from the equity ownership approach.
A.15 Implied market value studies
Implied market value studies seek to infer from market prices the value of distributed
imputation credits. Our position on the use of implied market value studies to estimate
the utilisation rate is set out in section 4.4 of attachment 4.
This section sets out further evidence which supports our position on the use of implied
market value studies to estimate the utilisation rate. It describes the types of study
available, and estimates from these studies. As we discuss in section 4.4 of
attachment 4, the level of reliance we place on implied market value studies reflects
the limitations of these studies. We discuss the limitations of the most common type of
implied market value study, dividend drop off studies, in sections A.15.5.
A.15.1 Types of implied market value studies
In this section, we describe the key characteristics of dividend drop off studies and
other implied market value studies.
Dividend drop off studies
Dividend drop off studies are the most common type of implied market value study.
These studies involve comparing share prices between:
545
M. Lally, Gamma and the ACT Decision, May 2016, p. 20. 546
Australian Competition Tribunal, Application by Public Interest Advocacy Centre Ltd and Ausgrid [2016] ACompT
1, 26 February 2016, para. 1092.

4-11 Attachment 4 – Value of imputation credits | Final decision: Amadeus Gas Pipeline Access
Arrangement 2016–21
the cum-dividend date—the last day on which investors owning shares will be
eligible to receive dividends and the attached imputation credits, and
the ex-dividend date—the first day on which investors owning shares will not be
eligible to receive dividends and attached imputation credits.
That is, an investor that buys a share on the cum-dividend date will be eligible to
receive a dividend from that company. An investor who buys a share on the ex-
dividend date will not. The difference in these prices should therefore reflect investors'
valuation of the combined package of dividends and imputation credits, all other things
being equal. Dividend drop off studies often will report this as a dividend drop off ratio.
This is the reduction in the share price as a proportion of the face value of dividends
paid out.
Table 4-15 identifies the dividend drop off studies that we are aware of, and describes
the methodology of each study. The results from these studies are presented in Table
4-17.
Table 4-15 Summary of available dividend drop off studies
Authors Data range Assessment relative to other studies in that class
Dividend drop off study – Compare share prices before and after dividend events (with and without imputation
credits).
Vo et al (2013)547
2001-2012 Builds on SFG (2011), includes additional econometric permutations
and sensitivity analysis.
SFG (2013a)548
2001-2012 Updates SFG (2011) – same author, longer data series.
SFG (2011)549
2001-2010 Study commissioned by the Australian Competition Tribunal.
Minney (2010)550
2001–2009 Partitions by firm size; sub-periods 2001–2005 and 2006–2009.
Beggs and Skeels (2006)551
1986-2004 Key study in the AER's 2009 review of rate of return parameters.
Data calculated yearly.
Hathaway and Officer
(2004)552
1986-2004 Study partitions by firm size, dividend yield level.
547
D. Vo, B. Gellard and S. Mero, 'Estimating the market value of franking credits: Empirical evidence from Australia',
ERA working paper, April 2013. 548
SFG, Updated dividend drop-off estimate of theta: Report for the Energy Networks Association, 7 June 2013. 549
SFG, Dividend drop-off estimate of theta, Final report, Re: Application by Energex Limited (No 2) [2010]
ACompT 7, 21 March 2011. 550
A. Minney, 'The valuation of franking credits to investors', JASSA: The FINSIA journal of applied finance, no. 2,
2010, pp. 29–34. 551
D. Beggs and C. Skeels, 'Market arbitrage of cash dividends and franking credits', The economic record, vol. 82,
2006, pp. 239–252. 552
N. Hathaway and B. Officer, The value of imputation tax credits, Update 2004, November 2004.

4-12 Attachment 4 – Value of imputation credits | Final decision: Amadeus Gas Pipeline Access
Arrangement 2016–21
Authors Data range Assessment relative to other studies in that class
Bellamy and Gray (2004)553
1995-2002
Several regression forms and sample selections. Partitions by size
and time period (pre and post 45-day holding rule). Use of simulation
to inform regression equation.
Bruckner et al (1994)554
1987-1993 Early study with limited data; sub-periods 1987–1990 and 1991–
1993.
Brown and Clarke (1993)555
1973–1991 Compares dividend drop off before and after imputation; presents
yearly figures and sub-periods.
Source: As specified in table.
Alternative implied market value studies
Besides dividend drop off studies, there are alternative market-based implied valuation
approaches to estimating the utilisation rate. Generally, these studies are based on
similar arbitrage principles to dividend drop off studies. This means they compare two
security prices where one security includes the entitlement and one security excludes
the entitlement. They then assume the difference reflects the market valuation of the
entitlement. However, they are designed to avoid the other influences in the data that
affect traditional dividend drop off analysis. In particular, these studies typically use
simultaneous price differentials that make them less affected by general market
movements. That is, the differentials should more accurately reflect the implied market
value of the specific dividend event. Some examples of alternative market-based
valuation approaches involve:
Simultaneous trading of shares with and without entitlements.
Simultaneous trading of derivatives and futures and of their underlying shares.
Hybrid securities which trade with imputation credits.
Comparison of the capital gains and (cash) dividend returns across time.
Table 4-16 identifies the alternative implied market value studies that we are aware of,
and describes the methodology of each study. The results from these studies are
presented in Table 4-18.
553
D. Bellamy and S. Gray, 'Using stock price changes to estimate the value of dividend franking credits', working
paper, University of Queensland Business School, March 2004. 554
P. Bruckner, N. Dews and D. White, 'Capturing value from dividend imputation: How Australian companies should
recognize and capitalise on a major opportunity to increase shareholder value', McKinsey and Company report,
1994. 555
P. Brown and A. Clarke, 'The ex-dividend day behaviour of Australian share prices before and after dividend
imputation', Australian journal of management, vol. 18, June 1993, pp. 1–40.

4-13 Attachment 4 – Value of imputation credits | Final decision: Amadeus Gas Pipeline Access
Arrangement 2016–21
Table 4-16 Summary of alternative implied market value studies
Authors Data range Assessment relative to other studies in that class
Dividend drop off using hybrids – Similar to standard DDO but using debt/equity hybrid securities.
Feuerherdt et al (2010)556
1995–2002 Uses hybrid securities (such as convertible preference shares), 165
ex-dividend events for 46 securities which are primarily fully franked.
Futures study (using individual firms or index) – Compare simultaneous prices for securities and futures contracts.
SFG (2013b)557
2000–2013
Updates Cannavan et al (2004). Compares matched trades in
individual shares to futures contracts and low exercise price options
for 98 firms (over 52,000 trades).
Cannavan et al (2004)558
1994–1999
Uses matched trades (four minute window) in individual shares and
futures contracts for 19 firms (over 14,000 trades). Sub-periods
1994–1997 and 1997–1999.
Cummings and Frino (2008)559
2002-2005
Uses entire ASX200 index (rather than specific firms) and futures
over the index, distinct from other studies in this class (which use
individual shares).
Rate of return study – Compare past returns (capital gains and cash dividends) or future returns (dividend forecasts).
NERA (2013b)560
1987–2012 Updates the Lajbcygier and Wheatley paper; same author and more
relevant data set. Sub-period splits 1987–2000 and 2000–2012.
Lajbcygier and Wheatley
(2012)561
1987–2009
Compares current prices to past returns from capital gains and
dividends. Includes sub-periods from 1987–2000 and 2000-2009.
Siau et al (2013)562
1996–2011 Compares current prices to expected future returns. Uses ASX300
index firms and consensus analyst dividend forecasts.
Siau et al (2015)563
1996-2011 Journal published version of the 2013 paper by Siau et al with
relatively minor editorial changes
NERA (2015)564
1987-2013 Updates the results of the Lajbcygier and Wheatley and NERA
(2013) studies.
556
C. Feuerherdt, S. Gray and J. Hall, 'The value of imputation tax credits on Australian hybrid securities',
International review of finance, vol. 10(3), 2010, pp. 365–401. 557
SFG, Using market data to estimate the equilibrium value of distributed imputation tax credits, Report for the
Energy Networks Association, 3 October 2013. 558
D. Cannavan, F. Finn, S. Gray, 'The value of dividend imputation tax credits in Australia', Journal of financial
economics, vol. 73, 2004, pp. 167–197. 559
J. Cummings and A. Frino, 'Tax effects on the pricing of Australian stock index futures', Australian journal of
management, vol. 33(2), December 2008, pp. 391–406. 560
NERA, Imputation credits and equity prices and returns, A report for the Energy Networks Association, October
2013. 561
P. Lajbcygier and S. Wheatley, 'Imputation credits and equity returns', The economic record, vol. 88 (283),
December 2012, pp. 476–494. 562
K. Siau, S. Sault and G. Warren, 'Are imputation credits capitalised into stock prices', ANU working paper, 18 June
2013. 563
K. Siau, S. Sault and G. Warren, 'Are imputation credits capitalised into stock prices', Accounting and Finance, Vol.
55, 2015, pp. 241–277. 564
NERA, Do Imputation Credits Lower the Cost of Equity? Cross-Sectional Tests A report for United Energy, April
2015.

4-14 Attachment 4 – Value of imputation credits | Final decision: Amadeus Gas Pipeline Access
Arrangement 2016–21
Authors Data range Assessment relative to other studies in that class
Simultaneous share trades – Compare simultaneous prices for shares that are/are not entitled to imputation credits.
Chu and Partington (2008)565
1996
Uses shares trading in two forms (one with dividend, one without) as
a result of the CRA bonus issue. 154 matched trades (one minute
window) across 3 months.
Chu and Partington (2001)566
1991–1999
Uses shares trading simultaneously with and without dividend after
certain rights issues - 3,356 trades (matched within a minute) from
26 rights issues for 23 firms.
Walker and Partington (1999)567
1995–1997
Looks at shares trading cum-dividend in the ex-dividend period.
1,015 data points (trades matched within a minute) for 93 ex-
dividend events from 50 securities.
Source: As specified in table.
A.15.2 Estimates from implied market value studies
This section presents the results from the available implied market value studies.
Table 4-17 reports estimates of the utilisation rate from the set of available dividend
drop off studies. As a high level summary table, it attempts to report the single
utilisation rate preferred by the authors for the scenario most relevant to our rate of
return framework. The service providers consider the AER does not have regard to the
estimation period for the market value studies and in particular to whether the analysis
is based on pre or post 2000.568 This is not true as seen in table 4.10 where the table
separately reports results based on whether the underlying data is (primarily) from
before or after 2000, when the change in tax law entitled eligible investors to a full
refund of excess imputation credits. In the recent Tribunal decision, the Tribunal stated
that the AER could have excluded earlier market based studies that were not relevant,
such as the studies that were conducted on pre 2000 data.569
When determining the point estimate from the range in the equity ownership approach
(0.4 to 0.41), the AER considers that studies post 2000 are more relevant, but still has
565
H. Chu and G. Partington, 'The market valuation of cash dividends: The case of the CRA bonus issue, International
review of finance, Vol. 8(2), June 2008, pp. 1–20. 566
H. Chu and G. Partington, 'The market value of dividends: evidence from a new method', Paper presented at the
Accounting Association of Australia and New Zealand Annual Conference, Wellington, 2001. 567
S. Walker and G. Partington, 'The value of dividends: Evidence from cum-dividend trading in the ex-dividend
period', Accounting and Finance, vol. 39(3), November 1999, pp. 275–296. 568
Australian Gas Networks, Attachment 11 Response to Draft Decision: Cost of Tax, January 2016, p. 20;
ActewAGL, Appendix 5.01 Detailed response to rate of return, gamma and inflation, January 2016, p. 126; AusNet
Electricity Services, Revised Regulatory Proposal, January 2016, p. 7-94; United Energy, Response to AER
Preliminary Determination Re: Rate of return and gamma, January 2016, p. 95; CitiPower, Revised Regulatory
Proposal 2016-2020; January 2016, p. 373; Jemena Electricity Networks, Attachment 6-1 Rate of return, gamma,
forecast inflation, and debt and equity raising costs, January 2016, p. 102; Powercor, Revised Regulatory Proposal
2016-2020, January 2016, p. 367. 569
Australian Competition Tribunal, Application by Public Interest Advocacy Centre Ltd and Ausgrid [2016] ACompT
1, 26 February 2016, para. 1092.

4-15 Attachment 4 – Value of imputation credits | Final decision: Amadeus Gas Pipeline Access
Arrangement 2016–21
regard to pre 2000 studies. However, even if the AER was to completely disregard the
pre 2000 studies this would not change the outcome of selecting the lowest point
estimate in the range from the equity ownership approach.
Table 4-18 is the equivalent table for alternative implied market value studies. In this
table, several results are recorded as 'N/A', even though there is a specific date range
provided. In such cases, that particular technique (or data limitations) did not permit the
disaggregation of the value of the dividend component and the imputation credit. In this
situation, the study typically reports the combined value of the cash dividend and
imputation credit together. The minimum value for the imputation credit component of
this package will arise if the cash dividend is fully valued, and these estimates are
presented in the 'notes' column.
Table 4-17 Estimates of the utilisation rate from dividend drop off studies
Authors Pre-2000
results
Post-2000
results Notes
Dividend drop off study
Vo et al (2013)570
0.35–0.55
(2001–2012)
Range derived from large number of
permutations and sensitivity tests.
SFG (2013a)571
0.35
(2001–2012)
Author's point estimate across a number of
different regression forms.
SFG (2011)572
0.35
(2001–2010)
Minney (2010)573
0.39
(2001–2009)
Average of results from 2001–2005 and
2006–2009 sub-periods. For the most
recent sub-period (2006–2009), utilisation
rate is 0.53.
Beggs and Skeels (2006)574
0.20
(1992–1997)
0.57
(2001–2004)
Several other pre-2000 periods are
presented.
Hathaway and Officer (2004)575
0.49
(1986–2004)
Authors suggest that estimate has
increased post-2000.
570
D. Vo, B. Gellard and S. Mero, 'Estimating the market value of franking credits: Empirical evidence from Australia',
ERA working paper, April 2013. 571
SFG, Updated dividend drop-off estimate of theta: Report for the Energy Networks Association, 7 June 2013, p. 1. 572
SFG, Dividend drop-off estimate of theta, Final report, Re: Application by Energex Limited (No 2) [2010] ACompT
7, 21 March 2011, p. 3. 573
A. Minney, 'The valuation of franking credits to investors', JASSA: The FINSIA journal of applied finance, no. 2,
2010, p. 32. 574
D. Beggs and C. Skeels, 'Market arbitrage of cash dividends and franking credits', The economic record, vol. 82,
2006, p. 247. 575
N. Hathaway and B. Officer, The value of imputation tax credits, Update 2004, November 2004, p. 21.
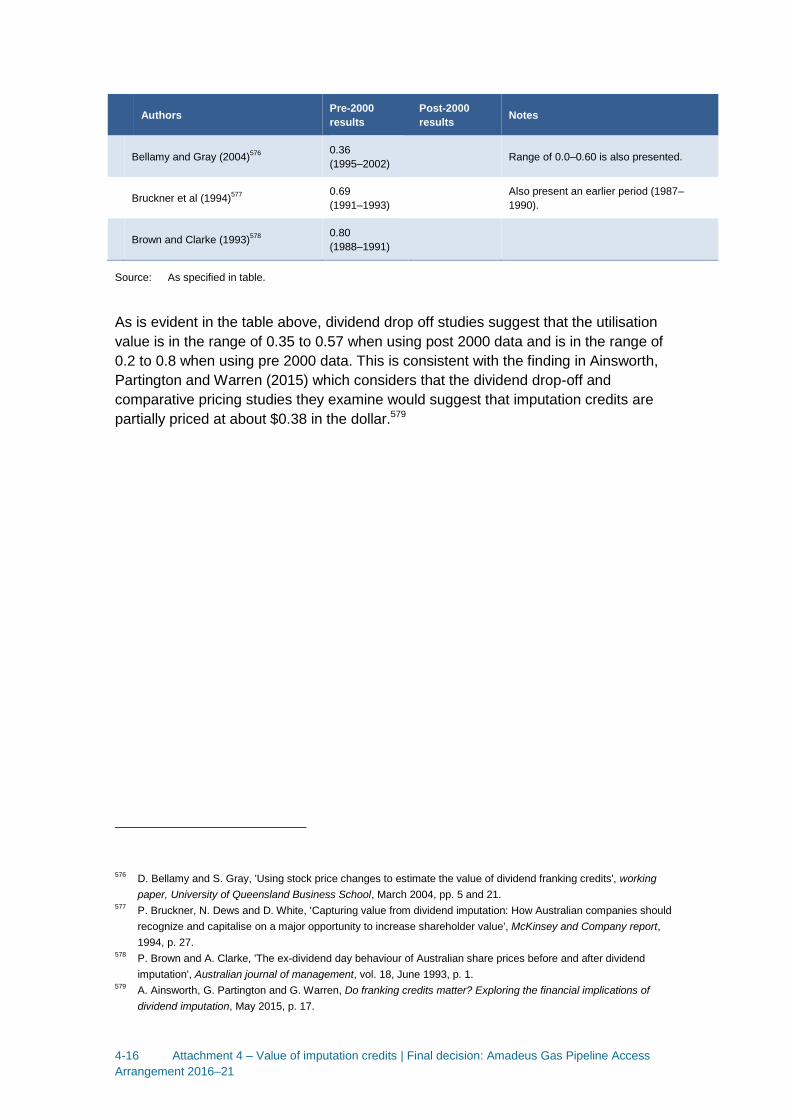
4-16 Attachment 4 – Value of imputation credits | Final decision: Amadeus Gas Pipeline Access
Arrangement 2016–21
Authors Pre-2000
results
Post-2000
results Notes
Bellamy and Gray (2004)576
0.36
(1995–2002) Range of 0.0–0.60 is also presented.
Bruckner et al (1994)577
0.69
(1991–1993)
Also present an earlier period (1987–
1990).
Brown and Clarke (1993)578
0.80
(1988–1991)
Source: As specified in table.
As is evident in the table above, dividend drop off studies suggest that the utilisation
value is in the range of 0.35 to 0.57 when using post 2000 data and is in the range of
0.2 to 0.8 when using pre 2000 data. This is consistent with the finding in Ainsworth,
Partington and Warren (2015) which considers that the dividend drop-off and
comparative pricing studies they examine would suggest that imputation credits are
partially priced at about $0.38 in the dollar.579
576
D. Bellamy and S. Gray, 'Using stock price changes to estimate the value of dividend franking credits', working
paper, University of Queensland Business School, March 2004, pp. 5 and 21. 577
P. Bruckner, N. Dews and D. White, 'Capturing value from dividend imputation: How Australian companies should
recognize and capitalise on a major opportunity to increase shareholder value', McKinsey and Company report,
1994, p. 27. 578
P. Brown and A. Clarke, 'The ex-dividend day behaviour of Australian share prices before and after dividend
imputation', Australian journal of management, vol. 18, June 1993, p. 1. 579
A. Ainsworth, G. Partington and G. Warren, Do franking credits matter? Exploring the financial implications of
dividend imputation, May 2015, p. 17.

4-17 Attachment 4 – Value of imputation credits | Final decision: Amadeus Gas Pipeline Access
Arrangement 2016–21
Table 4-18 Estimates of the utilisation rate from alternative market value
studies
Authors Pre-2000
results
Post-2000
results Notes
Dividend drop off study using hybrids
Feuerherdt, Gray and Hall (2010)580
N/A
(1995–2002)
Combined drop off of 1.0. With dividends at
full value, this is a utilisation rate of 0.
Futures study (individual or index)
SFG (2013b)581
0.12
(2000–2013) Uses individual firms.
Cannavan et al (2004)582
0–0.15
(1994–1999) Uses individual firms.
Cummings and Frino (2008)583
0.52
(2002–2005) Uses index.
Rate of return study
NERA (2013b)584
-1.57
(1987–2000)
-1.90
(2000–2012)
Uses past returns. For the entire period,
estimate is -1.50.
Lajbcygier and Wheatley (2012)585
-1.57
(1987–2000)
-1.68
(2000–2009)
Uses past returns. For the entire period,
estimate is -1.88
Siau et al (2013)586
-0.29–0.30
(1996–2011)
Uses forecast returns. Note range is from
negative 0.29 to positive 0.30.
Siau et al (2015)587
-0.29–0.30
(1996–2011)
Uses forecast returns. Note range is from
negative 0.29 to positive 0.30.
NERA (2015)588
-0.90
(1987-2000)
-3.18
(2000-2013)
Uses past returns. For the entire period,
estimate is -1.76
580
C. Feuerherdt, S. Gray and J. Hall, 'The value of imputation tax credits on Australian hybrid securities',
International review of finance, vol. 10(3), 2010, pp. 365–401. 581
SFG, Using market data to estimate the equilibrium value of distributed imputation tax credits, Report for the
Energy Networks Association, 3 October 2013, p. 3. 582
D. Cannavan, F. Finn, S. Gray, 'The value of dividend imputation tax credits in Australia', Journal of financial
economics, vol. 73, 2004, pp. 167–197. 583
J. Cummings and A. Frino, 'Tax effects on the pricing of Australian stock index futures', Australian journal of
management, vol. 33(2), December 2008, pp. 391–406. 584
NERA, Imputation credits and equity prices and returns, A report for the Energy Networks Association, October
2013, p. 22. 585
P. Lajbcygier and S. Wheatley, 'Imputation credits and equity returns', The economic record, vol. 88 (283),
December 2012, p. 490. 586
K. Siau, S. Sault and G. Warren, 'Are imputation credits capitalised into stock prices', ANU working paper, 18 June
2013, pp. 24 and 27. 587
K. Siau, S. Sault and G. Warren, 'Are imputation credits capitalised into stock prices', Accounting and Finance, Vol.
55, 2015, pp. 241–277. 588
NERA, Do Imputation Credits Lower the Cost of Equity? Cross-Sectional Tests A report for United Energy, April
2015, pp. 21,23.

4-18 Attachment 4 – Value of imputation credits | Final decision: Amadeus Gas Pipeline Access
Arrangement 2016–21
Authors Pre-2000
results
Post-2000
results Notes
Simultaneous share trades
Chu and Partington (2008)589
N/A
(1996)
Combined drop off of 1.29. With dividends
at full value, this is a utilisation rate of 0.68.
Walker and Partington (1999)590
0.88–0.96
(1995–1997)
Chu and Partington (2001)591
N/A
(1991–1999)
Combined drop off of 1.5. With dividends at
full value, this is a utilisation rate above 1.
Source: As specified in table.
In relation to the 2015 study by Siau et al, this is an academic journal published version
of the early study by Siau et al already considered by us. The 2015 paper has relatively
minor editorial changes and gives us no cause to change our views.592
In relation to the 2015 study by NERA, this is an update of the 2013 study by NERA
using one extra year's data. The results are somewhat similar to the 2013 study and
we consider the results do not provide compelling evidence on the value of imputation
credits, particularly given the large negative estimate for the value of imputation
credits.593 While NERA has responded to the criticism effectively stating the results
may indicate there is something wrong with the SLCAPM594, this does not resolve the
issue of the reliability of the theta estimate for use in the SLCAPM.595 As outlined by
Ainsworth, Partington and Warren (2015) the negative value on imputation credits is
implausible and the sign on the coefficient probably flags issues with the empirical
method.596
589
H. Chu and G. Partington, 'The market valuation of cash dividends: The case of the CRA bonus issue, International
review of finance, Vol. 8(2), June 2008, pp. 1–20. 590
S. Walker and G. Partington, 'The value of dividends: Evidence from cum-dividend trading in the ex-dividend
period', Accounting and Finance, vol. 39(3), November 1999, p. 293. 591
H. Chu and G. Partington, 'The value of dividends: evidence from a new method', Paper presented at the
Accounting Association of Australia and New Zealand Annual Conference, Wellington, 2001, p. 2. 592
The earlier working paper, although substantively the same as the 2015 paper, remains referenced in this decision
because this was the paper considered by us in making our decisions released in April and June 2015. 593
NERA, Do Imputation Credits Lower the Cost of Equity? Cross-Sectional Tests A report for United Energy, April
2015, p vii; M. Lally, The estimation of gamma, 23 November 2013, p. 25. 594
NERA, Do Imputation Credits Lower the Cost of Equity? Cross-Sectional Tests A report for United Energy, April
2015, p vii. 595
Concerns around the reliability of the estimates of the return on equity from the Black CAPM are discussed in the
rate of return attachment to this final decision. 596
A. Ainsworth, G. Partington and G. Warren, Do franking credits matter? Exploring the financial implications of
dividend imputation, May 2015.
4-19 Attachment 4 – Value of imputation credits | Final decision: Amadeus Gas Pipeline Access
Arrangement 2016–21
A.15.3 Comparison with other market-based estimation
approaches
The majority of service providers have submitted that the use of implied market value
studies to estimate the value of imputation credits is consistent with the approach to
estimating other rate of return parameters.597 We disagree. As we set our prior
decisions, we consider that the use of market prices to estimate the value of imputation
credits is fundamentally different to using market prices to estimate other rate of return
parameters.
For example, bonds are separately and (generally) regularly traded, and we can
observe the market price that arises from this trading. As correctly noted by Gray (for
SFG), '…when estimating the cost of debt the AER uses traded bond prices which
reflect the value of those bonds to investors…'.598 By contrast, imputation credits are
not separately traded. Therefore, no market price exists for imputation credits in the
same manner as that for separately traded assets.
Further, when returns are calculated on bonds for the cost of debt, and capital
gains/loss for the return on equity, these returns are pre-personal tax returns.
However, imputation credits and dividends market values derived from drop off studies
are influenced by differential personal tax resulting in these values being neither pre
nor post tax values. Lally notes that differential personal taxes on different types of
income should affect the pre personal tax costs of debt and equity but they should not
affect the estimate of theta. 599 This is further discussed in detail in section A.8.2 and
an example is provided to demonstrate the impact below.
We also noted in the decisions released in 2014 and April and June 2015 that,
because no market price exists for imputation credits in the same manner as that for
separately traded assets, dividend drop off studies must infer using ex-dividend price
changes and econometric techniques the value attributed to imputation credits by
investors. This is in contrast to simply observing or measuring the value attributed to
imputation credits by investors via prices resulting from market transactions in
imputation credits. Gray (for both SFG and Frontier) noted that we apply econometric
techniques (that is, regression analysis) to observed market prices when estimating
597
Australian Gas Networks, Attachment 11 Response to Draft Decision: Cost of Tax, January 2016, p. 13;
ActewAGL, Appendix 5.01 Detailed response to rate of return, gamma and inflation, January 2016, p. 117; AusNet
Electricity Services, Revised Regulatory Proposal, January 2016, p. 7-85; United Energy, Response to AER
Preliminary Determination Re: Rate of return and gamma, January 2016, p. 87; CitiPower, Revised Regulatory
Proposal 2016-2020; January 2016, p. 365; Jemena Electricity Networks, Attachment 6-1 Rate of return, gamma,
forecast inflation, and debt and equity raising costs, January 2016, p. 93; Powercor, Revised Regulatory Proposal
2016-2020, January 2016, p. 359; APNT, Access Arrangement Revised Proposal to Draft Decision, January 2016,
p. 93. 598
SFG, Estimating gamma for regulatory purposes, 6 February 2015, para. 79. 599
M. Lally, Gamma and the ACT Decision, May 2016, p. 15.

4-20 Attachment 4 – Value of imputation credits | Final decision: Amadeus Gas Pipeline Access
Arrangement 2016–21
beta.600 This is correct, but beta is not a measure of the value attributed to an asset by
investors; for example, Gray's definition of beta (for SFG) is ‘the risk of the asset or
firm in question relative to the average firm or asset’.601
A number of service providers also submitted, consistent with advice from Gray (for
SFG), that we do not seek to adjust other rate of return parameters for personal
costs.602 They consider that the value of imputation credits will reflect transaction costs
that are associated with redeeming imputation credits.603
However, this consideration did not change Handley’s view—which we accept—that
the value of imputation credits should be estimated on a before-personal-tax and
before-personal-costs basis:604
In other words, the per dollar value of an imputation credit 𝛾 gamma should be
measured prior to any personal tax on the credit and prior to any personal costs
associated with the receipt of the credit. This approach is also consistent with
the standard approach to calculating a return in a classical tax system – you
take the observed capital gain and the observed dividend without making any
adjustment for personal taxes or personal costs associated with trading the
share or receiving the dividend.
That is, we take the observed distribution of $1 of dividends to yield $1 of value to
investors. We do not take it to yield $1 of value minus personal taxes and personal
costs associated with that dividend. Similarly, we take a $1 change in stock prices
(capital gain) to yield $1 of value to investors. We do not take it to yield $1 of value
minus personal taxes and personal costs associated with that capital gain.
To explain how personal taxes influence market price/returns in the dividend drop off
studies we present a simple example below. Dividend drop off studies work on a no
arbitrage argument. In perfect capital with no transaction cost, no differential tax on
dividends relative to capital gains and no risk, the theory of no arbitrage predicts an ex-
600
SFG, Estimating gamma for regulatory purposes, 6 February 2015, para. 78; Frontier Economics, An appropriate
regulatory estimate of gamma, June 2015, p. 36. 601
SFG, Equity beta, 12 May 2014, para. 15. 602
SFG, Estimating gamma for regulatory purposes, 6 February 2015, para. 52. 603
Australian Gas Networks, Attachment 11 Response to Draft Decision: Cost of Tax, January 2016, p. 7; ActewAGL,
Appendix 5.01 Detailed response to rate of return, gamma and inflation, January 2016, p. 116; AusNet Electricity
Services, Revised Regulatory Proposal, January 2016, p. 7-85; United Energy, Response to AER Preliminary
Determination Re: Rate of return and gamma, January 2016, p. 86; CitiPower, Revised Regulatory Proposal 2016-
2020; January 2016, p. 364; Jemena Electricity Networks, Attachment 6-1 Rate of return, gamma, forecast
inflation, and debt and equity raising costs, January 2016, p. 93; Powercor, Revised Regulatory Proposal 2016-
2020, January 2016, p. 358. 604
J. Handley, Report prepared for the Australian Energy Regulator: Further advice on the value of imputation credits,
16 April 2015, p. 5.

4-21 Attachment 4 – Value of imputation credits | Final decision: Amadeus Gas Pipeline Access
Arrangement 2016–21
dividend drop-off being equal to the face value of the dividend. A representative
investor should be indifferent between the two following strategies:605
Selling their stock the day before the shareholder is entitled to receive the dividend
at the cum-dividend price (Pcum-div). In this scenario the shareholder receives only the
proceeds from the sale of the shares.
Selling their stock when the shareholder is entitled to receive the dividend at the ex-
dividend price (Pex-div). In this scenario the shareholder receives both the dividend
(D) and proceeds from the sale of the shares.
An investor should be indifferent between the two strategies given that if one strategy
is more profitable then arbitrage opportunities will exist. However, arbitrage
opportunities will be eliminated as the buying pressure on the more profitable strategy
combined with the selling pressure on less profitable strategy will result in an
equilibrium outcome, where the two strategies yield the same return. Note that
investors care about their post-personal tax return and not their pre-personal tax
return. What is important to investors is the return they get after paying their taxes and
not what they receive before taxes.
Where income and capital gains are taxed at the same rate, the investor should be
indifferent between receiving the cum-dividend price or the ex-dividend price plus the
dividend. I.e.
Pcum-div = Pex-div + D
More generally, the results of market studies are influenced by personal taxes and
need to be interpreted in light of this. For our regulatory purposes the efficient costs
that are imposed on the benchmark efficient firm is what matters. That is, the pre
personal taxes and personal costs impact. Market parameter estimates that are
influenced by personal tax and personal cost factors which do not correctly reflect the
efficient post-tax costs faced by the benchmark efficient entity are not appropriate
estimates under our post tax regulatory framework.
To demonstrate assume an investor faces the following investment scenario:
(Pcost) Purchased share in 2010 for $10
(Pcum-div) Current cum dividend price in 2016 is $20
(D) 2016 dividend is $1 assume fully unfranked
605
In equation (2) in Elton and Gruber (1970) if tax on ordinary income and capital gains tax are the same (to = tc) then
PA = PB + D. See: Edwin J. Elton and Martin J. Gruber, 'Marginal Stockholder Tax Rates and the Clientele effect'
The Review of Economics and Statistics, Vol. 52, No.1 (Feb 1970), p. 69.

4-22 Attachment 4 – Value of imputation credits | Final decision: Amadeus Gas Pipeline Access
Arrangement 2016–21
(Pex-div) Ex-dividend price in 2016 is $19 (calculated as cum-div price
minus dividend)
(MTR) Investors marginal tax rate = 47 %
(CGTdiscount) capital gains discount (0.5 when shares held for more than 12
months, otherwise 1)
For the time being it will be assumed that there is one type of investor in
the economy, however, this assumption will be relaxed.
Under this scenario ex-dividend and cum-dividend returns are equal on a pre-personal
tax basis:
Pcum-div = Pex-div + D
20 = 19 +1
However, investors care about their post personal tax return and not their pre-personal
tax returns. As a result, the investors post personal tax return if they sell cum-dividend
is:
Post Tax return = Pcum-div - Personal Tax (CGT)
Personal Tax (CGT) = (Pcum-div - Pcost) * MTR * CGTdiscount
Personal Tax Capital Gain = (20-10) * 0.5 * 0.47
Personal Tax Capital Gain = 2.35
Post Tax return = 20 - 2.35 = 17.65
The investors post personal tax return if they sell ex-dividend is:
Post Tax return = Pex-div + D - Personal Tax (CGT) - Personal Tax (Dividend)
Personal Tax (CGT) = (19-10) * 0.5 * 0.47 = 2.115
Personal Tax (Dividend) = 1 * 0.47 = 0.47
Total Tax = 2.115 + 0.47 = 2.585
Post Tax return = Pex-div + D - Personal Tax (CGT) - Personal Tax (Dividend)
Post Tax return = 19 + 1 - 2.115 - 0.47 = 17.415

4-23 Attachment 4 – Value of imputation credits | Final decision: Amadeus Gas Pipeline Access
Arrangement 2016–21
As is evident on a post personal tax basis the investor is better off by selling cum-
dividend ($17.65) in contrast to selling ex-dividend ($17.415). Such a situation cannot
exist in practice as arbitrage opportunities would exist. These arbitrage opportunities
would increase supply for cum-dividend pushing down the cum-dividend price and
increased demand for ex-dividend would push the ex-dividend price up.
For no arbitrage opportunities to exist the post personal tax return must be the same
cum dividend and ex-dividend, ignoring market volatility between cum-dividend price
and ex-dividend price for simplicity. Therefore:
Post Tax return cum div = Post Tax return ex div
Pcum-div - Personal Tax (CGT) = Pex-div + D - Personal Tax (CGT) - Personal Tax
(Dividend)
Pcum-div - (Pcum-div - Pcost)* CGTdiscount*MTR = Pex-div + D - (Pex-div - Pcost)* CGTdiscount*MTR -
D*MTR
This is the equilibrium condition.
Let: Pex-div = Pcum-div - xD where x is the market value of dividends implied by the dividend
drop off studies. In this example, x is the dividend drop off ratio. Also for simplicity,
assume the arbitrage opportunities only influence the ex-dividend price and not the
cum-dividend price. With this assumption the equilibrium condition is as:
Pcum-div - (Pcum-div - Pcost)* CGTdiscount*MTR = Pcum-div - xD + D - (Pcum-div - xD - Pcost)*
CGTdiscount*MTR - D*MTR
Substituting in all the parameters into the formula and solving for D we get the
following:
20 - (20 - 10)* 0.5*0.47 = 20 - x + 1 - (20 - x - 10) * 0.5 * 0.47 - 0.47
17.65 = 21 - x - (10 - x) * 0.235 - 0.47
X = 0.6928
As a result, for arbitrage opportunities to not exist the dollar face value dividend must
be worth 69 cents in the dividend drop off study. In such a situation the following
market prices will persist in the market:

4-24 Attachment 4 – Value of imputation credits | Final decision: Amadeus Gas Pipeline Access
Arrangement 2016–21
Pcum-div: $20
D: Face value = $1, as per dividend drop off $0.6928
Pex-div: $19.3072606
With these arbitrage free market parameters the investors post personal tax return is
as follows:
Post Tax return cum div = Pcum-div - Personal Tax (CGT)
Post Tax return cum div = 20 - 0.5 * 0.47 * (20-10)
Post Tax return cum div = 20 - 2.35 = 17.65
Post Tax return ex div = Pex-div + D - Personal Tax (CGT) - Personal Tax (Dividend)
Post Tax return ex div = 19.3072 + 1 - ((19.3072 - 10)*0.47*0.5) - 1*0.47
Post Tax return ex div = 17.65
As evident from above, the post-personal tax return cum dividend is equal to the post-
personal tax return ex dividend. I.e. no arbitrage opportunities exist and the investor is
indifferent between selling their share the day before they are entitled to receive the
dividend and the next day when they are entitled to the dividend. This is ignoring the
market volatility that may exist between the cum-div price and the ex-div price.
As a result, the investor's pre-personal tax return is:
$20 if they sold on the cum-dividend date
$20.3072 ($19.3072 + $1) if they sold on the ex-dividend date
The investor's post-personal tax return is:
$17.65 ($20 - $2.35) if they sold on the cum-dividend date
$17.65 ($20.3072 - $2.6572) if they sold on the ex-dividend date
On a pre-personal tax basis, the investor values the dividend at $1. On a post-personal
tax basis, the investor values the dividend at $0.53 ($1 - $1*0.47). The $0.6928
dividend value that is derived from dividend drop off studies is neither a pre-personal or
post-personal value of the dividend. It is the difference between the cum-dividend and
ex-dividend price, which is determined by the face value of the dividend and the
606
Defined as 20 minus 0.6928.

4-25 Attachment 4 – Value of imputation credits | Final decision: Amadeus Gas Pipeline Access
Arrangement 2016–21
relative difference in in the tax level on ordinary income (of which dividends are
classed) and on capital gains. It is driven by investor's preference for capital gains over
dividend income, as capital gains are taxed at a concessional rate relative to dividends
assuming the shares are held for more than 12 months.
As will be shown below, only when dividends and capital gains are taxed at the same
rate will the dividend drop off studies yield a value of the dividend on a correct pre-
personal tax basis (i.e. not impacted by differential personal taxes on dividends and
capital gains).
For regulatory purposes what matters is the investor's pre-personal tax value of
dividends which is $1, which is equal to the cost of the dividend imposed on the firm
(i.e. the post company tax cost). The AER uses the full face value of dividends in its
estimation of the MRP (i.e. it assumes $1 of distributed dividend income has a post
company tax value of $1 to investors). The AER does not use the market value of
dividends from dividend drop off studies to estimate the MRP. To do so would be
incorrect given this value is influenced by differential personal taxes on dividends and
capital gains.607
Earlier an assumption was made that the investor's tax rate was 47 per cent and that
investor purchased the share more than 12 months ago which allowed them to receive
a 50 per cent discount on capital gains tax. We will now relax these assumptions and
see how it changes the market value of the dividends in the dividend drop off study. As
shown above, for post personal tax return to be equal between cum-dividend and ex-
dividend the following condition must hold:
Pcum-div - (Pcum-div - Pcost)* CGTdiscount*MTR = Pcum-div - xD + D - (Pcum-div - xD - Pcost)*
CGTdiscount*MTR - D*MTR
Solving for X the formula simplifies to:
𝑋 =1 − 𝑀𝑇𝑅
1 − 𝐶𝐺𝑇𝑑𝑖𝑠𝑐𝑜𝑢𝑛𝑡 ∗ 𝑀𝑇𝑅
This is consistent with the formula in the Elton and Gruber (1970) paper which defined
ex-dividend behaviour as:608
Pcum−div − Pex−div
𝐷=
1 − t0
1 − tc
607
We also note distributed dividends are directly observable. 608
Edwin J. Elton and Martin J. Gruber, 'Marginal Stockholder Tax Rates and the Clientele effect' The Review of
Economics and Statistics, Vol. 52, No.1 (Feb 1970), pp. 68-74, pin point ref: 69.

4-26 Attachment 4 – Value of imputation credits | Final decision: Amadeus Gas Pipeline Access
Arrangement 2016–21
Where t0 is the tax rate of ordinary income and t0 is the capital gains tax rate.
Further, Lally generalises the dividend relationship to the following:609
∆𝑃 = 𝛿𝐷 + 𝛿𝜃(𝐼𝐶) + 휀
Where 𝛿 reflects the effect of the personal tax differential, risk, transaction costs and
other frictions and 휀 reflects noise in the data. 610
Using different values for MTR (0%, 15%, 21%, 34.5%. 39% 47%) and CGT discount
(50% if shares held for more than 12 months and 100% if shares held for less than 12
months)611 the market value for the dividend in the dividend drop off study changes. As
seen in the table below a lower tax rate results in a higher market value of dividend in
the dividend drop off studies. This is due to the differential taxes being smaller at a
lower MTR.
The table also shows that when the stocks are held for less than 12 months and the
CGT is taxed at the MTR rate rather than 50 per cent of the MTR, the dividends are
worth one dollar in a dividend drop of study. This is because when the stocks are held
for less than 12 months capital gains are taxed at the same rate as dividends. The
same is also true for the 0 per cent tax rate when stocks are held for more than 12
months. In this situation dividend tax and capital gains tax is consistent at 0 per cent.
As noted above, the difference between the cum-dividend price and ex-dividend price
is driven by differential personal taxes on dividends and capital gains. Hence, only
when dividends and capital gains are taxed at the same rate, the drop off just
represents the face value of the dividend. This is the value that is required for
regulatory purposes and is the post company tax (pre-personal tax) value.
609
M. Lally, Gamma and the ACT Decision, May 2016, p. 24. 610
M. Lally, Gamma and the ACT Decision, May 2016, p. 24. 611
In practice super funds have a CGT discount of 0.33 and not 0.5. However, in order to not complicate the analysis
we do not introduce an additional CGT discount rate.

4-27 Attachment 4 – Value of imputation credits | Final decision: Amadeus Gas Pipeline Access
Arrangement 2016–21
Table 4-19 Dividend drop off ratio with varying tax rates
CGT
50% 100%
Tax R
ate
0% 1 1
15% 0.9189 1
21% 0.8827 1
34.50% 0.7915 1
39% 0.7578 1
47% 0.6928 1
The example shows why estimates of the value of dividends (and imputation credits)
from market based studies are influenced by personal tax factors and this is not
appropriate in our regulatory context. Adjustment for the impact of differential personal
taxation of income and capital gains must be made to the estimates from dividend drop
off studies to ensure their consistency with our post tax framework.
As is evident above, different investors have a different dividend drop off ratio and this
is determined by many factors such as:
Investor marginal income tax rate
Whether the investor held the share for more than 12 months
Whether the investor is super fund or not
Whether the investor is foreign and how foreign income is taxed at their
home country
What determines the dividend drop off price in the market is based on who the
marginal investors are around the ex-dividend dates. For instance, if only local
investors with a marginal tax rate of 39% are trading around the ex-dividend date then
the dividend drop off should be 0.7578 cents per dollar of face value of dividends. If
there is a mixture of investors trading around the ex-dividend date then the drop off
price will be determined by supply and demand on those days. In real capital markets
with multiple types of investors facing differential tax rates and where those investors
may or may not be able to utilise franking credits, the resulting equilibrium is much
more complex.612
612
Edwin J. Elton and Martin J. Gruber, 'Marginal Stockholder Tax Rates and the Clientele effect' The Review of
Economics and Statistics, Vol. 52, No.1 (Feb 1970), p. 6.

4-28 Attachment 4 – Value of imputation credits | Final decision: Amadeus Gas Pipeline Access
Arrangement 2016–21
In the analysis above we focused on the impact on cash (unfranked) dividends and
ignored the effect of imputation credits. This was a simplifying assumption which
should not distract from the fact that imputation credits are similarly impacted in market
based studies by differential personal tax. The simple analysis can be extended to
cover franked dividends.613 Overall personal tax is levied on the grossed up dividend
which is the face value of the cash dividend plus the face value of the attached
imputation credit that can be utilised, both of which are taxed as ordinary income.
Furthermore, the marginal investor's valuation is not relevant for the purposes of
calculating the taxation building block. What is required is what proportion of the
company tax is a prepayment of the investor's personal tax. For the taxation building
block what matters is the value to all investors in aggregate and not the marginal
investors that trade around the cum-dividend and ex-dividend dates. This would
suggest that dividends drop off studies are not the best method for determining the
gamma adjustment to the taxation building block.
In the recent Tribunal decision, the Tribunal considered we were being inconsistent
with our approach as other allowed rate of return parameters were determined by
market prices which are influenced by personal taxes. We do not agree. Other allowed
rate of return parameters in the cost of equity and cost of debt are not influence by
personal tax factors in a manner that results in estimates not being a genuine expected
post tax returns.
For instance, the returns derived from equity prices is a post company tax (pre-
personal tax) return that is subject to capital gains tax when it is sold by an investor.
This contrast to the cash dividends and imputation credits estimates from market
based dividend drop off studies which are neither pre nor post-personal tax estimates
of the value to investors.
When calculating the MRP using historical data we use the face value of capital gains
and dividends and not market value implied by dividend drop off studies. Likewise
when calculating the MRP in the dividend growth model we discount the dividends at
face value and not the value implied in the dividend drop off studies.
Similarly, the bond returns derived from bond market price are a post company tax
(pre-personal tax) returns. When we or a third party service provider calculates the
yield to maturity on bonds and government securities, the face value of coupons and
the face value of the principal are used in the calculations.
The above examples demonstrate why we consider its approach to estimating gamma
is consistent with how it estimates the rate of return parameters when estimating in the
allowed rate of return for the benchmark efficient entity. This is further discussed in
section A.8.2.
613
Ainsworth A, K Fong, D Gallagher, and G Partington (2015),’Institutional Trading around the ex-dividend day’,
Australian Journal of Management, January, pp. 1-25.

4-29 Attachment 4 – Value of imputation credits | Final decision: Amadeus Gas Pipeline Access
Arrangement 2016–21
The above example shows that if market based dividend drop off studies are to be
used to estimate the utilisation value, adjustments have to be made for the impact of
personal tax and personal cost factors. However, for reasons outlined above this is not
ideal. For estimating the taxation building block we want to know what proportion of
corporate tax is a pre-payment of personal tax (as this is the direct value investors will
get from the reduction in their tax bill payable to the government, or via a rebate from
the government). We consider this is currently best estimated using the equity
ownership approach.
The analysis above ignored the impact of personal transaction costs but they similarly
impact the share price drop ratio as differential personal taxes. As outlined above, local
shareholders that have held shares for more than 12 months prefer a dollar of capital
gains over a dollar of unfranked dividends on a pre-personal tax basis. This is due to
capital gains being more valuable as they are taxed at a concessional tax rate relative
to unfranked dividends. Similarly, investors value the cash flow that has lower personal
transaction costs more than the cash flow that has higher personal transaction costs.
For example, investor on personal cost basis might value dividends more than capital
gains. This is due to investor having to pay brokerage fees in order to realise a capital
gains while dividends are distributed without brokerage costs. However, personal
transaction costs are not relevant in our regulatory context as they are not costs impost
on the regulated business (i.e. they are irrelevant to the post tax return under the
Officer WACC framework).
The analysis above is based around dividend drop off studies but is equally applicable
to alternative market value studies.
A.15.4 Adjustment of estimates from implied market value
studies
Although not proposing this approach, a number of service providers submitted that
estimates of the utilisation rate from implied market value studies can be adjusted to
make them consistent with the before-personal-tax and before-personal-costs value of
imputation credits.614 However, the service providers do not propose this adjustment as
they consider it to be unnecessary. 615
614
Australian Gas Networks, Attachment 11 Response to Draft Decision: Cost of Tax, January 2016, p. 13;
ActewAGL, Appendix 5.01 Detailed response to rate of return, gamma and inflation, January 2016, pp. 117, 126-
127; AusNet Electricity Services, Revised Regulatory Proposal, January 2016, pp. 7-86, 7-94; United Energy,
Response to AER Preliminary Determination Re: Rate of return and gamma, January 2016, pp. 87, 95; CitiPower,
Revised Regulatory Proposal 2016-2020; January 2016, pp. 365, 373-374; Jemena Electricity Networks,
Attachment 6-1 Rate of return, gamma, forecast inflation, and debt and equity raising costs, January 2016, pp. 94,
102-103; Powercor, Revised Regulatory Proposal 2016-2020, January 2016, p. 359, 367-368. 615
Australian Gas Networks, Attachment 11 Response to Draft Decision: Cost of Tax, January 2016, p. 13;
ActewAGL, Appendix 5.01 Detailed response to rate of return, gamma and inflation, January 2016, pp. 117, 126-
127; AusNet Electricity Services, Revised Regulatory Proposal, January 2016, pp. 7-86, 7-94; United Energy,
Response to AER Preliminary Determination Re: Rate of return and gamma, January 2016, pp. 87, 95; CitiPower,
Revised Regulatory Proposal 2016-2020; January 2016, pp. 365, 373-374; Jemena Electricity Networks,

4-30 Attachment 4 – Value of imputation credits | Final decision: Amadeus Gas Pipeline Access
Arrangement 2016–21
We do not consider that the relevant adjustment—proposed by Handley and Lally and
discussed in section 4.4—will fully account for the potential effect of personal taxes
and costs. This is because the proposed adjustment seeks to remove from the
estimates of investors’ valuation of dividends and imputation credits the effect of
factors that suggest that investors’ valuation of $1 of dividends is less than $1.
However, according to Gray (for SFG), there are:616
…costs that reasonable, efficient investors would incur in relation to imputation
credits, which do not apply to dividends or capital gains.
Thus, Gray's view (for SFG) appears to be that there are factors which affect investors'
valuation of imputation credits (as reflected in share prices) which do not affect
investors' valuation of dividends.617 Therefore, it does not appear that the proposed
adjustment—which only addresses factors which affect both dividends and imputation
credits—would exclude the effect of the factors identified by SFG as affecting just
imputation credits.
As outlined above in section A.15.3, the adjustment for the impact of differential
personal taxes is equivalent for dividends and imputation credits. Therefore, if market
value studies are to be used to estimate the utilisation value then at a minimum the
adjustment proposed by Lally and Handley should be used.
Lally considered that the coefficient on imputation credits in dividend drop off studies is
not 𝜃 but 𝛿𝜃. Therefore the estimated value of imputation credits in the dividend drop
off study must be divided by the estimate value of the cash dividend. 618
A.15.5 Limitations of SFG's dividend drop off study
A number of service providers submitted that ‘several of the general limitations [of
implied market value studies identified] do not apply to the SFG study’.619 Namely, the
service providers consider that the SFG dividend drop off study does not produce
nonsensical results and is not subject to problematic estimation methodologies.620 The
Attachment 6-1 Rate of return, gamma, forecast inflation, and debt and equity raising costs, January 2016, pp. 94,
102-103; Powercor, Revised Regulatory Proposal 2016-2020, January 2016, p. 359, 367-368; APNT, Access
Arrangement Revised Proposal to Draft Decision, January 2016, p. 94. 616
SFG, Estimating gamma for regulatory purposes, 6 February 2015, para. 50. 617
SFG, An appropriate regulatory estimate of gamma, 21 May 2014, para. 65. 618
M. Lally, Gamma and the ACT Decision, May 2016, p. 24. 619
Australian Gas Networks, Attachment 11 Response to Draft Decision: Cost of Tax, January 2016, pp. 13-16;
ActewAGL, Appendix 5.01 Detailed response to rate of return, gamma and inflation, January 2016, pp. 117-118,
125-126; AusNet Electricity Services, Revised Regulatory Proposal, January 2016, pp. 7-86, 7-87, 7-93; United
Energy, Response to AER Preliminary Determination Re: Rate of return and gamma, January 2016, pp. 87-88, 94;
CitiPower, Revised Regulatory Proposal 2016-2020; January 2016, pp. 365-366, 372; Jemena Electricity
Networks, Attachment 6-1 Rate of return, gamma, forecast inflation, and debt and equity raising costs, January
2016, pp. 94-95, 102; Powercor, Revised Regulatory Proposal 2016-2020, January 2016, pp. 359-360, 366. 620
Australian Gas Networks, Attachment 11 Response to Draft Decision: Cost of Tax, January 2016, pp. 13-16;
ActewAGL, Appendix 5.01 Detailed response to rate of return, gamma and inflation, January 2016, p. 117; AusNet
Electricity Services, Revised Regulatory Proposal, January 2016, p. 7-86; United Energy, Response to AER

4-31 Attachment 4 – Value of imputation credits | Final decision: Amadeus Gas Pipeline Access
Arrangement 2016–21
service providers consider we have not assessed the SFG study as a standalone
basis, rather they consider we assess it together with all drop off studies.621 We do not
agree and below we set out the limitations that we consider apply generally to implied
market value studies and consider whether these apply to SFG’s dividend drop off
study on a standalone basis. We conclude that there is reasonable evidence to
suggest that several of the limitations do apply to SFG's dividend drop off study. There
appears to be no information in the proposals lodged in 2016 or in Gray's June 2016
report (for Frontier),622 to warrant us changing our view on any of the material below
set out in our decisions released in October and November 2015.
These studies can produce nonsensical estimates of the
utilisation rate; that is, greater than one or less than zero.
We accept that this limitation does not apply to SFG’s study. Its estimate of the
utilisation rate is 0.35.
The results of these studies can reflect factors, such as
differential personal taxes and risk, which are not relevant to
the utilisation rate.
Both Handley and Lally advised that the results from SFG’s dividend drop off study
reflect these factors.623 A number of service providers themselves also acknowledged
this elsewhere in their revised proposals:624
…even if the AER’s definition of theta were to be adopted, there is a relatively
simple adjustment that can be made to estimates from market value studies to
address this concern. As explained by Associate Professor Handley, this
Preliminary Determination Re: Rate of return and gamma, January 2016, p. 87; CitiPower, Revised Regulatory
Proposal 2016-2020; January 2016, pp. 365-366; Jemena Electricity Networks, Attachment 6-1 Rate of return,
gamma, forecast inflation, and debt and equity raising costs, January 2016, p. 94; Powercor, Revised Regulatory
Proposal 2016-2020, January 2016, pp. 359-360. 621
Australian Gas Networks, Attachment 11 Response to Draft Decision: Cost of Tax, January 2016, p. 20;
ActewAGL, Appendix 5.01 Detailed response to rate of return, gamma and inflation, January 2016, p. 125; AusNet
Electricity Services, Revised Regulatory Proposal, January 2016, p. 7-93; United Energy, Response to AER
Preliminary Determination Re: Rate of return and gamma, January 2016, p. 94; CitiPower, Revised Regulatory
Proposal 2016-2020; January 2016, p. 372; Jemena Electricity Networks, Attachment 6-1 Rate of return, gamma,
forecast inflation, and debt and equity raising costs, January 2016, p. 101; Powercor, Revised Regulatory Proposal
2016-2020, January 2016, p. 366. 622
Frontier Economics, The appropriate use of tax statistics when estimating gamma, January 2016. 623
J. Handley, Report prepared for the Australian Energy Regulator: Advice on the value of imputation credits, 29
September 2014, pp. 43–44; J. Handley, Report prepared for the Australian Energy Regulator: Further advice on
the value of imputation credits, 16 April 2015, p. 16; M. Lally, The estimation of gamma, 23 November 2013, p. 21. 624
ActewAGL, Detailed response to the AER's draft decision in relation to gamma, January 2015, p. 7; Ausgrid,
Ausgrid's revised proposal on gamma, January 2015, p. 8; Directlink, Directlink submission on gamma (updated),
January 2015, p. 11; Endeavour Energy, Endeavour Energy's response to the AER draft decision re gamma,
January 2015, p. 8; Essential Energy, Essential's response to AER draft decision re gamma, January 2015, p. 8;
and JGN, Gamma - response to the draft decision, February 2015, p. 10.

4-32 Attachment 4 – Value of imputation credits | Final decision: Amadeus Gas Pipeline Access
Arrangement 2016–21
involves ‘grossing up’ the theta estimate from a market value study to reflect
the effect of personal taxes and personal costs.
Therefore, we conclude that this limitation does apply to SFG’s study.
In section A.15.3 we have also provided a worked example of how personal taxes
influence market value of dividend and imputation credits in market studies.
The results of these studies might not be reflective of the value
of imputation credits to investors in the market as a whole.
Gray’s response to this point (for SFG) was:625
The AER has previously argued that the increased trading volume that occurs
around ex-dividend dates could potentially affect the estimates. I have
previously responded to this point in great detail, explaining why, if anything,
this additional trading would have the effect of increasing the estimate of theta.
I have previously addressed this issue at pp. 31-32 of SFG (2014 Gamma) and
at ENA (2013), Section 7.9, pp.119-123.
The ENA (2013) report referred to by Gray (for SFG) was a response to our draft rate
of return Guideline. Lally reviewed our draft Guideline and the ENA response. His
conclusion was:626
The AER’s third approach to estimating [the utilisation rate] involves estimates
derived from market prices (AER, 2013, pp. 133–134, 239–247). The AER
does not consider that these estimates are useful for a number of reasons.
…
I concur with all of these concerns, and I have additional concerns about these
studies or their interpretation.
Regarding the particular limitation at hand, Lally noted:627
Tenthly, although the utilisation rate is a value-weighted average over all
investors in the market, the use of market prices will produce an estimate that
reflects the tax position, transactions costs and motives of those investors who
transact at the relevant times (such as tax arbitrageurs) and these investors
may be quite unrepresentative of the entire market.
625
SFG, Estimating gamma for regulatory purposes, 6 February 2015, para. 185(c); Australian Gas Networks,
Attachment 11 Response to Draft Decision: Cost of Tax, January 2016, p. 16. 626
M. Lally, The estimation of gamma, 23 November 2013, p. 20. 627
M. Lally, The estimation of gamma, 23 November 2013, p. 26.

4-33 Attachment 4 – Value of imputation credits | Final decision: Amadeus Gas Pipeline Access
Arrangement 2016–21
And on the effect of trading around the ex-dividend date, Lally noted:628
In respect of tax arbitrage around dividend ex-days, the ENA (2013, section
7.9) argues that this would lead to [the utilisation rate] being overestimated by
such studies (because these arbitrageurs would tend to drive up the prices of
shares with large imputation credits prior to ex-day in the course of buying
them, and then depress them shortly afterwards in the course of selling them).
This point would be plausible if tax considerations fully explained ex-dividend
day results. However, as described above, this is not the case.
Thus, Lally appeared unconvinced by the ENA’s views and provided no indication that
SFG’s study (or any implied market value study) should necessarily be deemed free of
this limitation.
Handley also appeared unconvinced by the views of Gray (for SFG) in his 2014 report
on this limitation, noting in his September 2014 report:629
…there remains a residual concern as to whether the composition of investors
around the ex-dividend date is reflective of the composition of (long term)
investors in the benchmark market who supply capital to firms (including to the
benchmark efficient entity) and therefore whether the implied value of
imputation credits around ex-dividend dates is representative of the value of
imputation credits to the market as a whole.
Handley reiterated this view in his April 2015 report.630
Finally, we note the South Australian Centre for Economic Studies recommended
disregarding evidence from all dividend drop off studies due to this limitation entirely:631
The studies included by SFG consulting in their review of estimates for theta all
appear to be of good quality and are undertaken in a manner which reflects the
current best practice in the literature.
However, purchase of stocks in any given period is dominated by a relatively
small share of equity holders who engage in active trading equities. Overall
ownership of equities, however, is dominated by those who trade infrequently.
As such there is no reason to believe that the value placed on franking credits
by active traders of equities is the same as that placed on franking credits by
those who trade infrequently.
On the third point, listed firms are also only part of the stock of Australian
equity. Data from the ABS’s ‘Australian National Accounts: Financial Accounts’
628
M. Lally, The estimation of gamma, 23 November 2013, p. 29. 629
J. Handley, Report prepared for the Australian Energy Regulator: Advice on the value of imputation credits, 29
September 2014, p. 44. 630
J. Handley, Report prepared for the Australian Energy Regulator: Further advice on the value of imputation credits,
16 April 2015, p. 18. 631
SA Centre for Economic Studies (2015), Independent estimate of the WACC for SA Power Networks 2015 to 2020:
Report commissioned by the SA Council of Social Services, January 2015, p. 17.

4-34 Attachment 4 – Value of imputation credits | Final decision: Amadeus Gas Pipeline Access
Arrangement 2016–21
indicates that as at June 2014 unlisted shares comprised 44.5 per cent of the
total value of shares in private firms (rising to 49.7 per cent if equity in
government non-financial corporations is included).
Due to the unrepresentative nature of both traders in stock, and the ownership
of listed stock, we believe that dropped dividend studies cannot be assumed to
be informative about the value placed by median investor in the ‘benchmark
efficient entity’. As such, we recommend that estimates derived from
dropped dividend studies be disregarded.
We consider that there is sufficient evidence in the expert views quoted above to
suggest that SFG's dividend drop off study is subject to this limitation.
In section A.15.3 it was outlined the dividend drop off ratio in market studies varies
depending on the investor's marginal tax rate. Low (high) marginal tax rate investors
have a higher (lower) dividend drop off ratio all else equal. The dividend drop off ratio
that prevails in the market is determined by the marginal investor, that trades around
the ex-dividend date, marginal tax rate. However, the marginal investor dividend drop
off ratio is not relevant for estimating gamma in the regulatory context for two reasons:
The purpose of gamma is to deduct the proportion of company tax is a pre-payment
of personal tax from the allowed regulated revenues. In order to determine this
proportion the analysis has to focus on the aggregate investors and not the
marginal investors that trade around the ex-dividend date.
This dividend drop off ratio is neither a pre-personal nor a post-persona tax
measure of dividends and imputation credits. It is just the change in the stock price
between the cum and ex-dividend date which is determined by the size of the
dividend, imputation credits and influenced by differential personal taxation of
dividend/imputation credit and capital gains. This is further discussed in section
A.15.3.
These studies can be data intensive and employ complex and
sometimes problematic estimation methodologies.
We consider the idea that the SFG dividend drop off study is data intensive is evident
in pages 4 to 14 of the 2011 version of that study and section 3 of the updated 2013
version.632
Regarding whether the SFG study employs a complex and potentially problematic
estimation methodology, we have regard to the views on dividend drop off studies
expressed by academics and other regulators. A wide selection of these views is set
out in section 0 below. All but one of these views were expressed subsequent to SFG's
dividend drop off study. It is not clear why experts would continue to canvass the
632
SFG, Dividend drop-off estimate of theta, Final report, Re: Application by Energex Limited (No 2) [2010] ACompT
7, 21 March 2011; SFG, Updated dividend drop-off estimate of theta: Report for the Energy Networks Association,
7 June 2013.

4-35 Attachment 4 – Value of imputation credits | Final decision: Amadeus Gas Pipeline Access
Arrangement 2016–21
methodological issues associated with dividend drop off studies in general if SFG's
dividend drop off study overcame these issues. This notwithstanding, we also have
regard to the Tribunal's acceptance of the results from SFG's dividend drop off study in
2011.
Therefore, we consider that there is evidence both for and against the idea that this
limitation applies to SFG's dividend drop off study.
It is only the value of the combined package of dividends and imputation credits that
can be observed in the market, and there is no consensus among experts on how to
separate the value to the market of dividends from the value to the market of
imputation credits.
Firstly, we note that it is strictly incorrect to say that the value of the combined package
of dividends and imputation credits can be 'observed'. The service providers support
this by quoting Gray that empirical evidence provides a very clear and consistent view
of the combined value of credit and dividend.633 This is because this value is actually
estimated based on assumptions about what the ex-dividend price change represents.
In any case, because imputation credits are only ever distributed with franked
dividends, all dividend drop off studies must make this allocation/separation. Therefore
this limitation applies to SFG's dividend drop off study.
A.15.6 The views of academics and other regulators on
dividend drop off studies
A number of academics and regulators have recognised the limitations of dividend
drop off studies. Moreover, many of these concerns continue to be expressed even
after the first version of SFG's dividend drop off study in 2011 (which was relied upon
by the Tribunal in the Energex matter), and the 2013 update of that study (which was
relied upon in service providers' current proposals).634 The comments of academics
and other regulators support the lesser reliance we place on SFG's dividend drop off
study in estimating the utilisation rate.
Some academics have identified a number of practical and methodological issues:
633
Australian Gas Networks, Attachment 11 Response to Draft Decision: Cost of Tax, January 2016, p. 16;
ActewAGL, Appendix 5.01 Detailed response to rate of return, gamma and inflation, January 2016, p. 120; AusNet
Electricity Services, Revised Regulatory Proposal, January 2016, p. 7-89; United Energy, Response to AER
Preliminary Determination Re: Rate of return and gamma, January 2016, p. 90; CitiPower, Revised Regulatory
Proposal 2016-2020; January 2016, p. 368; Jemena Electricity Networks, Attachment 6-1 Rate of return, gamma,
forecast inflation, and debt and equity raising costs, January 2016, p. 97; Powercor, Revised Regulatory Proposal
2016-2020, January 2016, p. 362. 634
SFG, Dividend drop-off estimate of theta, Final report, Re: Application by Energex Limited (No 2) [2010] ACompT
7, 21 March 2011; Australian Competition Tribunal, Application by Energex Limited (Gamma) (No 5) [2011]
ACompT 9, May 2011, para. 38; SFG, Updated dividend drop-off estimate of theta: Report for the Energy
Networks Association, 7 June 2013.

4-36 Attachment 4 – Value of imputation credits | Final decision: Amadeus Gas Pipeline Access
Arrangement 2016–21
Cannavan, Finn and Gray (2004):635
…it is unlikely that the traditional ex-dividend day drop-off methodology will be
able to separately identify the value of cash dividends and imputation credits.
Siau, Sault and Warren (2013):636
Despite a large number of studies, the market value of imputation credits
remains broadly disputed (see, for example, Gray and Hall, 2006; Lally, 2008;
Partington and Truong, 2008; Gray, 2008). The majority of empirical studies
have drawn inferences by focusing on the pricing of dividend distributions. This
includes analysis of stock price declines around ex-dividend dates (‘ex-dividend
drop-off studies’); and comparative pricing of instruments that differ only in their
dividend and imputation entitlements. These studies are subject to a number of
issues, such as imprecise estimates that may be influenced by the presence of
short-term traders arbitraging dividends and limited samples in the case of
comparative studies.
…
The variability of estimates joins with issues over design to cast some doubt
over estimates for the market value of imputation credits arising from drop-off
studies. A key methodological issue is that price movements around ex-
dividend events encapsulate not only the tax differential effect, but may also
reflect the presence of traders seeking to arbitrage dividends and noise
associated with trading activity around ex-dividend dates. Drop-off ratios can be
distorted by the need to compensate traders for transaction costs (Eades,
Hess, and Kim ,1984); Lakonishok and Vermaelen, 1986; Karpoff and Walkling,
1988, 1990; Bali and Francis, 2011); or the risk involved (Fedenia and
Grammatikos, 1993; Grammatikos, 1989; Heath and Jarrow, 1988; Michaely
and Vila, 1995). Transaction costs may be substantial, and can drive the drop-
off ratio below one (Kalay 1982, 1984; Boyd and Jagannathan, 1994). Market
microstructure effects may also complicate estimation of market value, as
discrete tick sizes can bias drop-off ratios downwards (Dubofsky, 1992; Bali
and Hite, 1998).
A further key methodological issue is the difficulty in attributing the observed
drop-off value between cash dividends and imputation credits. Dempsey and
Partington (2008) nominate this identification problem as a serious limitation of
ex-dividend drop-off studies. Drop-off studies are afflicted by multicollinearity
issues. Cannavan et al. (2004) and Bellamy and Gray (2006) reveal that
imputation credits are nearly perfectly collinear with their respective cash
dividends. This is exacerbated by corporate tax rates being almost constant
and partially-franked dividends being the exception rather than the norm. Gray
635
D. Cannavan, F. Finn, S. Gray, 'The value of dividend imputation tax credits in Australia', Journal of financial
economics, vol. 73, 2004, p. 175. 636
K. Siau, S. Sault and G. Warren, 'Are imputation credits capitalised into stock prices', ANU working paper, 18 June
2013, p. 2 and pp. 8–9.

4-37 Attachment 4 – Value of imputation credits | Final decision: Amadeus Gas Pipeline Access
Arrangement 2016–21
(2008) points out that the value attributed to imputation credits is conditional on
the assumed value on cash dividends by design, to the extent that they are
supplementary components within a single package. This notion is reinforced
by evidence of offsetting variation in the value attributed to dividends and
imputation credits across samples (see Bellamy and Gray, 2006; Gray, 2008).
McKenzie and Partington (2013):637
For over fifty years, academics have been trying to satisfactorily measure the
market value of dividends. So far we have not reached a generally agreed
consensus on the value or the method of measurement, which indicates the
difficulty of the task. Thus, the basic task of measuring the package value of
dividends and franking credits is a major challenge.
It is well understood that the market value of the package of dividends and
franking credits mixes together not just dividends and credits, but the effects of
income and capital gains taxes, transactions costs, discounting for time and risk
and possibly market microstructure effects as well. This leads to what we call
the allocation problem. That is how we attribute the value consequence of
these effects between the value of dividends and the value of franking credits.
All methods of splitting up the package value of dividends and franking credit
involve an explicit or implicit allocation. The problem with allocations is that by
their nature they are arbitrary. Thus, separating out the estimated value of the
franking credits is also a major challenge.
One approach to the estimation of the value of dividends and franking credits is
to measure the price drop when the stock goes ex-dividend. It is on the basis of
[SFG's dividend drop off study] that theta was taken to be 0.35 and hence the
value of gamma is given by 0.7 x 0.35, which rounded up furnishes a value of
0.25 or 25%.
We have several problems with this estimate of gamma. First, given the
difficulties in estimating theta, the estimate of theta and hence gamma should
not be based on one study, or on one method. Rather, it should be triangulated
across multiple studies and multiple methods. In particular the estimate of theta
should not just be reliant on ex-dividend studies, which are afflicted with many
problems. This issue is discussed extensively in McKenzie and Partington
(2010). In this paper, we argue that it is very unlikely that an accurate and
reliable estimate of the value of franking credits will come out of a traditional ex-
dividend study due to a number of problems including the extremely noisy data
(it is not unusual to have a price movement up or down of more than twenty
times the dividend on the ex-dividend day). Results are also sensitive to data
filtering, the choice of estimation method and whether the ex-dividend day price
is measured at the open or close of trading. Biased results can also arise from
market microstructure effects such as bid-ask bounce. There are also abnormal
volumes and abnormal returns about the ex-dividend day, which clearly
637
M. McKenzie and G. Partington, Report to the Queensland Resources Council: Review of Aurizon Network’s draft
access undertaking, 5 October 2013, pp. 33–34.

4-38 Attachment 4 – Value of imputation credits | Final decision: Amadeus Gas Pipeline Access
Arrangement 2016–21
indicate that trading is abnormal about the ex-dividend date. Consequently, it is
an open question whether an ex-dividend study gives a dividend and franking
credit valuation that reflects the clientele of investors normally holding the
stock. Finally, there are conceptual and econometric problems. For example,
multicollinearity in the regression equation used to separate the value of the
dividends and franking credits. Reflecting the inaccuracy of the ex-dividend
method and associated regression technique, the standard errors of the
estimates from the regression equations are typically quite large.
Lally (2013):638
The AER’s third approach to estimating U involves estimates derived from
market prices (AER, 2013, pp. 133–134, 239–247). The AER does not
consider that these estimates are useful for a number of reasons. In respect of
dividend drop-off studies, these include evidence that trading activity around
dividend ex-days is abnormal, that correction is required for market
movements, and the sensitivity of results to data, outliers and model choices.
More generally these problems include the difficulties in separating the values
of franking credits and dividends in these studies, the wide range of empirical
results from such studies, the possibility of bias from ‘bid-ask bounce, and the
exposure of such estimates to the tax circumstances and transactions costs of
tax arbitrageurs. Many of these problems are manifest in high standard errors
on the estimates of the coefficients.
I concur with all of these concerns, and I have additional concerns about these
studies or their interpretation.
Other academics have focussed on the specific issue of whether dividend drop off
studies produce results that are reflective of investors in the market as a whole:
Handley (2014):639
The second issue also concerns the correct interpretation of the regression
coefficient – but at a more fundamental level. Adjusting the coefficient to
remove the impact of differential personal taxes and risk gives us the (after-
company-before-personal-tax) value of a dollar of imputation credits but the
question is value to whom? In other words, there remains a residual concern as
to whether the composition of investors around the ex-dividend date is
reflective of the composition of (long term) investors in the benchmark market
who supply capital to firms (including to the benchmark efficient entity) and
therefore whether the implied value of imputation credits around ex-dividend
dates is representative of the value of imputation credits to the market as a
whole.
638
M. Lally, The estimation of gamma, 23 November 2013, p. 20. 639
J. Handley, Report prepared for the Australian Energy Regulator: Advice on the value of imputation credits, 29
September 2014, p. 44.

4-39 Attachment 4 – Value of imputation credits | Final decision: Amadeus Gas Pipeline Access
Arrangement 2016–21
South Australian Centre for Economic Studies (2015):640
In order for a dividend drop-off study to provide useful evidence of the value of
franking credits to a representative owner of equity three conditions need to be
met:
the studies being drawn on need to be of high quality;
the equity holders who buy shares in the period after dividends are issued need to be representative of the whole class of equity holders; and
the equity for which data is drawn on for the dividend drop off study needs to be representative of the overall stock of equity in the Australian economy
We would contend that only the first of these three conditions is definitely met.
The studies included by SFG consulting in their review of estimates for theta all
appear to be of good quality and are undertaken in a manner which reflects the
current best practice in the literature.
However, purchase of stocks in any given period is dominated by a relatively
small share of equity holders who engage in active trading equities. Overall
ownership of equities, however, is dominated by those who trade infrequently.
As such there is no reason to believe that the value placed on franking credits
by active traders of equities is the same as that placed on franking credits by
those who trade infrequently.
On the third point, listed firms are also only part of the stock of Australian
equity. Data from the ABS’s ‘Australian National Accounts: Financial Accounts’
indicates that as at June 2014 unlisted shares comprised 44.5 per cent of the
total value of shares in private firms (rising to 49.7 per cent if equity in
government non-financial corporations is included).
Due to the unrepresentative nature of both traders in stock, and the ownership
of listed stock, we believe that dropped dividend studies cannot be assumed to
be informative about the value placed by median investor in the ‘benchmark
efficient entity’. As such, we recommend that estimates derived from
dropped dividend studies be disregarded.
The limitations identified have been recognised by other regulators and reflected in
their respective approaches to determining the utilisation rate:
QCA (2014):641
Given the concerns identified, the QCA does not prefer an estimate of 0.35 for
the utilisation rate. The estimate is the result from only one study from one
class of evidence, and this class of evidence suffers from serious conceptual
640
SA Centre for Economic Studies (2015), Independent estimate of the WACC for SA Power Networks 2015 to 2020:
Report commissioned by the SA Council of Social Services, January 2015, pp. 16–17. 641
Queensland Competition Authority, Cost of capital: Market parameters, August 2014, pp. 27–28.

4-40 Attachment 4 – Value of imputation credits | Final decision: Amadeus Gas Pipeline Access
Arrangement 2016–21
and empirical limitations. Therefore, the QCA has assessed and given more
weight to alternative approaches to estimate the utilisation rate.
The ERA, which until the publication of a revised draft Guideline in November 2014
preferred the use of dividend drop off studies, stated:642
…dividend drop-off studies are known to suffer from a variety of estimation
issues that result in the estimated value of theta being vulnerable to the
dividend sample, parametric form of the regression equation and regression
technique used. As a consequence, the Authority is of the view that it is more
appropriate to use a range of dividend drop-off studies.
A.16 Revised consideration of the conceptual goalposts approach
We placed a degree of reliance upon the conceptual goalposts approach when coming
to an estimate for the utilisation rate in the Guideline. However, we do not rely on the
conceptual goalposts approach in this final decision. This is mainly to be consistent
with Handley's advice on the conceptual framework, which we have accepted in
making this final decision. Further, we do not consider this to be a significant departure
from the Guideline given we placed only limited reliance on the conceptual goalposts
approach in the Guideline. We note we do not consider Lally's support of the
conceptual goal posts approach, upon which we do not rely, supports the proposition
that our conceptual analysis is confused and unsafe.643 We also note the preference
for Handley's advice over Lally's is to the benefit of the service providers as it results in
a lower estimate of the value for imputation credits than would have been the case had
we followed Lally's advice on this issue. Our revised consideration of the approach is
set out in this section.
A.16.1 Description of the approach
The conceptual goalposts approach to informing estimates of the utilisation rate is
based on a test devised by Lally to consider the 'reasonableness' of such estimates.
To explain the approach, however, we must first explain some theoretical aspects of
the modelling framework that we employ. The starting point for a CAPM is a given set
of assets and a given set of investors who hold them.644 In the Officer CAPM, the given
set of assets is the domestic market and Lally considered that the given set of
642
Economic Regulation Authority, Explanatory Statement for the Rate of Return Guidelines, December 2013, para.
920. As noted, the ERA has published a revised draft Guideline, which no longer prefers the use of dividend drop
off studies: Economic Regulation Authority, Review of the method for estimating the weighted average cost of
capital for regulated railway networks, Revised draft decision, 28 November 2014. 643
SA Power Networks, Revised regulatory proposal 2015-20, July 2015, p. 373. 644
J. Handley, Report prepared for the Australian Energy Regulator: Advice on the value of imputation credits, 29
September 2014, p. 22.

4-41 Attachment 4 – Value of imputation credits | Final decision: Amadeus Gas Pipeline Access
Arrangement 2016–21
investors is domestic investors; that is, the domestic market is assumed to be 'fully
segmented' from international markets.645
Lally considered it paramount to estimate the utilisation rate consistently with the
underlying theoretical framework:646
In my view, the most important requirements in selecting a methodology for
estimating U [the utilisation rate] are that the estimate be consistent with the
definition of U, as a value-weighted average over the utilisation rates of all
investors who are relevant to the Officer CAPM, that the parameter estimate is
likely to give rise to an estimated cost of equity from the Officer model that lies
within the bounds arising from either complete segmentation or complete
integration of equity markets, and that the estimate is reasonably precise.
The importance of theoretical consistency led Lally to recommend that the optimal
estimate of the utilisation rate is 1, on these conceptual grounds:647
In respect of U, there are five possible approaches to estimating it. The first of
these arises from the definition of the parameter as a weighted average across
all investors; coupled with ignoring foreigners (consistent with the Officer
CAPM), this yields an estimate of 1 (the utilisation rate of local investors).
…
Using the three criteria described above, my preferred estimate is 1 from the
first approach…
An alternative to the 'domestic' Officer CAPM is an international CAPM, whereby the
relevant set of assets is all assets in the world and the relevant set of investors is all
investors in the world; that is, the domestic market is assumed to be 'fully integrated'
with international markets. Using this model would require inputs based on
international benchmarks, including a utilisation rate of 0 because the proportion of
global investors eligible to make use of domestic imputation credits is close to zero.
Both in the Guideline and in this final decision, we propose an approach to estimating
the utilisation rate that recognises foreign investors to the extent that they invest in the
Australian market. Thus, our approach sits between the alternative positions of Lally's
interpretation of the Officer framework (where only domestic investors are recognised)
and an international framework. This was recognised by Lally:648
The AER (2013, section 8.3.1, page 120) also includes foreign investors to the
extent that they invest in the Australian market, to reflect the empirical reality of
their existence. However this involves use of a model (the Officer CAPM) that
645
Note that the standard Sharpe–Lintner CAPM also assumes segmented capital markets. In effect, the Officer
CAPM is the standard Sharpe-Lintner CAPM adjusted to incorporate imputation credits. 646
Lally, The estimation of gamma, 23 November 2013, p. 3. 647
Lally, The estimation of gamma, 23 November 2013, pp. 3 and 4. 648
Lally, The estimation of gamma, 23 November 2013, p. 14.

4-42 Attachment 4 – Value of imputation credits | Final decision: Amadeus Gas Pipeline Access
Arrangement 2016–21
assumes that national markets for risky assets are segmented along with the
definition for a parameter (U) that is inconsistent with this model.
Lally considered the overarching concern is whether the inconsistency between input
parameters and model definitions might produce an unreasonable outcome. That is,
even if the individual components are each justified in isolation, the combination might
produce an overall result that is no longer reasonable:649
The Officer (1994) CAPM implicitly assumes that national markets for risky
assets are completely segmented, in the sense that investors are precluded
from purchasing foreign risky assets. However, most estimates of U reflect the
presence of foreign investors. Consequently the potential for economically
unreasonable estimates of the cost of equity arises, i.e., values that lie outside
range of those arising under complete segmentation and complete integration
of national markets for risky assets. In this event the partial recognition of
foreign investors would effectively constitute cherry-picking that maximises the
revenue or price cap, i.e., ignoring foreign investors when it is favourable to
regulated firms (choosing the CAPM) and also estimating U by a methodology
that reflects the presence of these investors when it is also favourable to
regulated firms. We therefore assess whether various estimates of U lead to
this outcome.
To do so it is necessary to consider the implications for the cost of equity of
complete integration and complete segmentation of national markets for risky
assets.
Lally pointed out that, while there is some uncertainty about the return on equity in a
partial integration scenario, it must lie within two boundaries. At one end, there is the
return on equity that would be required if the domestic market was fully segmented
from international markets. At the other extreme is the return on equity if the capital
market was fully integrated with international markets. To assess whether the
approach in the draft Guideline passed this test, Lally estimated for the average
Australian firm:650
The return on equity under segmentation, using a domestic-only (segmented)
CAPM populated with domestic parameters. That is, a market risk premium for a
segmented Australian market, an equity beta relative to the Australian market, and
a utilisation rate of 1.
The return on equity under integration, using an international CAPM (based on
Solnik, 1974) populated with global parameters. That is, using a market risk
premium for an integrated (global) market, an equity beta relative to the global
market and a utilisation rate of 0.
The return on equity using a segmented (Officer) CAPM, populated with
parameters that accord with our 'partially integrated' market definition. That is, a
649
Lally, The estimation of gamma, 23 November 2013, p. 38. 650
Lally, The estimation of gamma, 23 November 2013, pp. 38–47.

4-43 Attachment 4 – Value of imputation credits | Final decision: Amadeus Gas Pipeline Access
Arrangement 2016–21
market risk premium and an equity beta that reflect the domestic market, but
recognising foreign investors to the extent that they invest in the domestic
(Australian) market.
Lally's aim was to ascertain what utilisation rates under the third scenario will result in
a return on equity that lies between the two 'goalposts' represented by the return on
equity from the first two scenarios (full segmentation and full integration). This is how
Lally presented the results of this assessment:651
In summary, in the face of an inconsistency between the use of the Officer
model (which assumes that national equity markets are segmented) and an
estimate of the utilisation rate on imputation credits that is less than 1 (which
reflects the presence of foreign investors), a minimum requirement is that the
results from this approach should lie within the bounds arising from complete
segmentation of national equity markets and complete integration (to ensure
that the cost of capital results are consistent with some scenario regarding
segmentation or integration). However, estimates of U that are significantly
less than 1 fail this test in virtually every case examined, and are therefore
deficient. In effect, combining Officer’s CAPM with a utilisation rate that is
significantly less than 1 constitutes a defacto form of cherry-picking of
parameter values and models that maximises the price or revenue cap for
regulated businesses. By contrast, if the Officer model were combined with a
utilisation rate on imputation credits of 1, or close to it, the test described here
would be satisfied in most cases. All of this suggests that, if the Officer model is
used, the only sensible estimate of the utilisation rate is at or close to 1.
This analysis contributes to Lally's conclusion that the utilisation rate should be 1 or
close to it. To refine this estimate, we undertook further analysis using the approach
set out by Lally. This indicated that utilisation rates between 0.8 and 1 generate a
reasonable return on equity (that is, one that lies between the goalposts) in the majority
of permutation scenarios. Further, when interpreting this sensitivity analysis, it is also
relevant to consider whether each particular scenario has arisen from an extreme
permutation—that is, if the individual parameters are all at their highest (or lowest)
possible values. Such a scenario is much less likely than a permutation where most of
the parameters are at their expected values. A utilisation rate of 0.6 or below generates
very few return on equity results that are reasonable (between the goalposts), and
these all arise at extreme permutations.
In conclusion, in the Guideline we considered that the conceptual goalposts approach
supported an estimate of the utilisation rate in the range 0.8 to 1. We considered also
that it suggested that a utilisation rate of 0.6 or below was unreasonable.
651
Lally, The estimation of gamma, 23 November 2013, pp. 46–47.

4-44 Attachment 4 – Value of imputation credits | Final decision: Amadeus Gas Pipeline Access
Arrangement 2016–21
A.16.2 Advice received since the Guideline
In advice received since the Guideline's publication, Handley advised that he does not
consider the conceptual goalposts approach to be a reasonable approach to estimating
the utilisation rate:652
I do not consider the conceptual goalpost approach to be a reasonable
approach to estimation as first, it is motivated by a faulty premise – that the
CAPM suggested by Officer implicitly assumes that national markets for risky
assets are completely segmented in the sense that all domestic assets are held
by domestic investors only and all foreign assets are held by foreign investors
only – and second, that it seeks to sure up one uncertain estimate by reference
to two other estimates (the “goalposts”) which themselves are subject to
substantial uncertainty.
Handley expanded on his first point elsewhere in his advice:653
Lally (2013) adopts an unnecessarily narrow interpretation of segmentation in
suggesting that foreign investors should be excluded completely. But once you
choose a proxy for the market portfolio you define not only the set of assets
that are relevant for pricing purposes but you also define the set of investors
that are relevant for pricing purposes – in other words, it is a joint assumption.
Lally’s suggestion that we include the full set of n assets but only a subset of
the of m investors not only contradicts the starting point of the CAPM but also
does not accord with the reality that foreign investors are present in and
influence the pricing of assets in the domestic market. This notion of (complete)
segmentation – that only domestic assets are held by domestic investors – is
an assumption of Lally but is not an assumption of the CAPM.
Thus, Handley's first point is that he does not consider the return on equity yielded by a
domestic CAPM that ignores foreign investors to be a reasonable goalpost against
which to assess the return on equity yielded by our approach. Handley's second point
appears to accord closely with his view that estimation of the utilisation rate and the
value of imputation credits is imprecise.654
Gray (for SFG) also raised concerns with the approach, and a number of these have
been responded to by Lally.655
652
J. Handley, Report prepared for the Australian Energy Regulator: Advice on the value of imputation credits, 29
September 2014, pp. 31–32. 653
J. Handley, Report prepared for the Australian Energy Regulator: Advice on the value of imputation credits, 29
September 2014, p. 23. 654
J. Handley, Report prepared for the Australian Energy Regulator: Advice on the value of imputation credits, 29
September 2014, pp. 3 and 32. 655
SFG, An appropriate regulatory estimate of gamma, 21 May 2014, pp. 88–93; M. Lally, Review of submissions to
the QCA on the MRP, risk-free rate and gamma, 12 March 2014, pp. 31–33.


