Embed Size (px)
Citation preview

2011 INTERNATIONAL OIL SPILL CONFERENCE
1 2011-225
Aerial Dispersant Monitoring Using SMART Protocols during the Deepwater
Horizon Spill Response
February 21, 2011
Ed Levine
NOAA / ORR
USCG Battery Park Bldg.
1 South Street, room 329
NY, NY 10004
Jordan Stout
NOAA / ORR
Coast Guard Island, Bldg 51-1
Alameda, CA 94501-5100
Brian Parscal
Clean Islands Council
179 Sand Island Rd.
Honolulu, HI 96819
Ann Hayward Walker
SEA, Inc.
325 Mason Avenue
Cape Charles, VA 22310
DC1 Ken Bond
USCG Gulf Strike Team
Aviation Training Center
Mobile, AL 36608-9690
The information in this document reflects the views of the authors, and does not
necessarily reflect the official positions or policies of the National Oceanic and
Atmospheric Administration, the Department of Commerce, nor the US Coast Guard.
ABSTRACT
Shortly after the Deepwater Horizon (DWH) well blowout the FOSC authorized
dispersant use in accordance with the RRT VI Pre-Authorization protocols. As a
stipulation in the pre-authorization the applications had to be monitored using the
SMART (Special Monitoring for Advanced Response Technology) protocols. The
SMART protocols had never been implemented for a spill of this magnitude, this far
offshore, for an extended duration, and requiring unparalleled logistical support and
training.

2011 INTERNATIONAL OIL SPILL CONFERENCE
2 2011-225
For over three months multiple teams performed Tier I, II, and III level
monitoring of the DWH oil spill. These included aerial observations, vessel mounted
fluorometry, water sampling, video and photography, GPS tracking and GIS posting of
data. At the time the event occurred a workgroup had been formed and was in the process
of updating the SMART protocols. This event allowed the development of numerous
improvements to the protocols and many lessons learned. Data processing was a
formidable task as the number of samples and observations far exceeded anything prior.
As the use of dispersants became a very contentious topic in the media and a topic
of much discussion among government agencies, the SMART protocols and data became
extremely important to base the continued use on. This paper will describe the equipment
used, processes employed, resources expended, data flow and analysis, logistics support,
and final presentation format. Additionally we will enumerate lessons learned and future
suggestions for improving the SMART protocols.
INTRODUCTION
Once oil has spilled, responders use a variety oil spill countermeasures to reduce
the adverse effects of spilled oil on the environment. Dispersants are one kind of
countermeasure. Oil spill dispersants are chemicals applied directly to the spilled oil in
order to remove it from the water surface. Surface oil can be especially harmful to birds,
mammals and other organisms that come in contact with the water surface. The RRT 6
uses the below decision flow chart to determine to use dispersants or not (Figure 1).
Figure 1. RRT 6 Dispersant Decision Flow Chart.
Oil on the surface is often cohesive and natural degradation processes are slow.
When dispersants are effectively applied to surface oil slicks, tiny dispersant-oil droplets

2011 INTERNATIONAL OIL SPILL CONFERENCE
3 2011-225
then separate from the slick and mix into the water column, reducing the size and volume
of the surface slick. The tiny droplets are too small to refloat to the surface. Bacteria and
other microscopic organisms are able to act quickly to degrade the oil. Dispersants are
commonly applied through specialized equipment mounted on airplanes, helicopters and
ships.
Special Monitoring of Applied Response Technologies (SMART) (USCG,
NOAA, US EPA, CDC&P, MMS. 2006) is a cooperatively designed monitoring program
for dispersant use. SMART relies on small, mobile teams that collect real-time data using
portable, rugged and easy-to-use instruments. The SMART program is designed to
address critical questions: Are dispersants effective in dispersing the oil? How quickly
are dispersants working? Having monitoring data can assist the Unified Command with
decision-making for operational use of dispersants. To monitor the efficacy of dispersant
applications, SMART contains three options, or Tiers.
Tier I
A trained observer, flying over the oil slick and using photography, job aids
(NOAA, 2009) or advanced remote sensing instruments, assesses dispersant efficacy and
reports back to the Unified Command.
Tier II
Tier II provides real-time data from the treated slick. A sampling team on a boat
uses a fluorometer to continuously monitor for dispersed oil one meter under the
dispersant-treated oil slick. The team records and conveys fluorometer data to the
scientific support team, which forwards it with recommendations to the Unified
Command. Water samples are also taken for later analysis at a laboratory.
Tier III
By expanding the monitoring efforts in several ways, Tier III provides
information on where the dispersed oil goes and what happens to it: (1) the fluorometers
are used on the same vessel to monitor at multiple water depths; (2) monitoring is
conducted in the center of the treated slick at several water depths, from one to ten
meters; and (3) a portable water quality laboratory provides data on water temperature,
pH, conductivity, dissolved oxygen, and turbidity measurements.
Tier III+
Although not formally recognized in the SMART Protocol, several missions were
conducted at what was referred to as Tier III+. These missions followed all the
parameters of the normal Tier III protocol, but included more advanced instruments such
as a laser particle size analyzer, and increased sampling for laboratory analysis.
Field Experience
SMART has already been successfully tested in the field during exercises and

2011 INTERNATIONAL OIL SPILL CONFERENCE
4 2011-225
spills. SMART has been used previously to monitor dispersant applications in the Gulf of
Mexico. Practical usage helps us to enhance SMART protocols and equipment.
For on-line information on SMART: http://response.restoration.noaa.gov/smart
METHODS
Figure 2. Command, control, and data flow during dispersant monitoring operations.
Description of Equipment Used
Since there was a large amount of equipment used, breaking it down by Tiers will
simplify the discussion.
Tier I – While aerial observation requires minimal equipment, some key pieces can
simplify the mission. Cameras with high resolution and internal GPS units that display
not only the photo, but add in all tracking data make presentation of information much
easier. This also saves the need to carry a separate GPS unit and record positions that
adds to the workload while trying to record observations. Internal communications with
the aircraft pilot is essential. At least one member of the SMART team should be able to
convey the needs of the team to the pilot while in the air; some aircraft are not set up for
this and due to noise in the cabin make the mission much more difficult.
Initially, SMART Tier I monitoring was conducted as the logistics, personnel and
equipment were gathered to commence Tier II and III monitoring. Representative field
data collection forms used are shown in figures 3, 4, and 5.

2011 INTERNATIONAL OIL SPILL CONFERENCE
5 2011-225
Figure 3. Dispersant Application Observation Reporting Form. This form was used to
report the qualitative assessment of aerial visual monitoring of dispersant operations.

2011 INTERNATIONAL OIL SPILL CONFERENCE
6 2011-225
Figure 4. Example SMART Tier I photograph log.
2011 INTERNATIONAL OIL SPILL CONFERENCE
7 2011-225
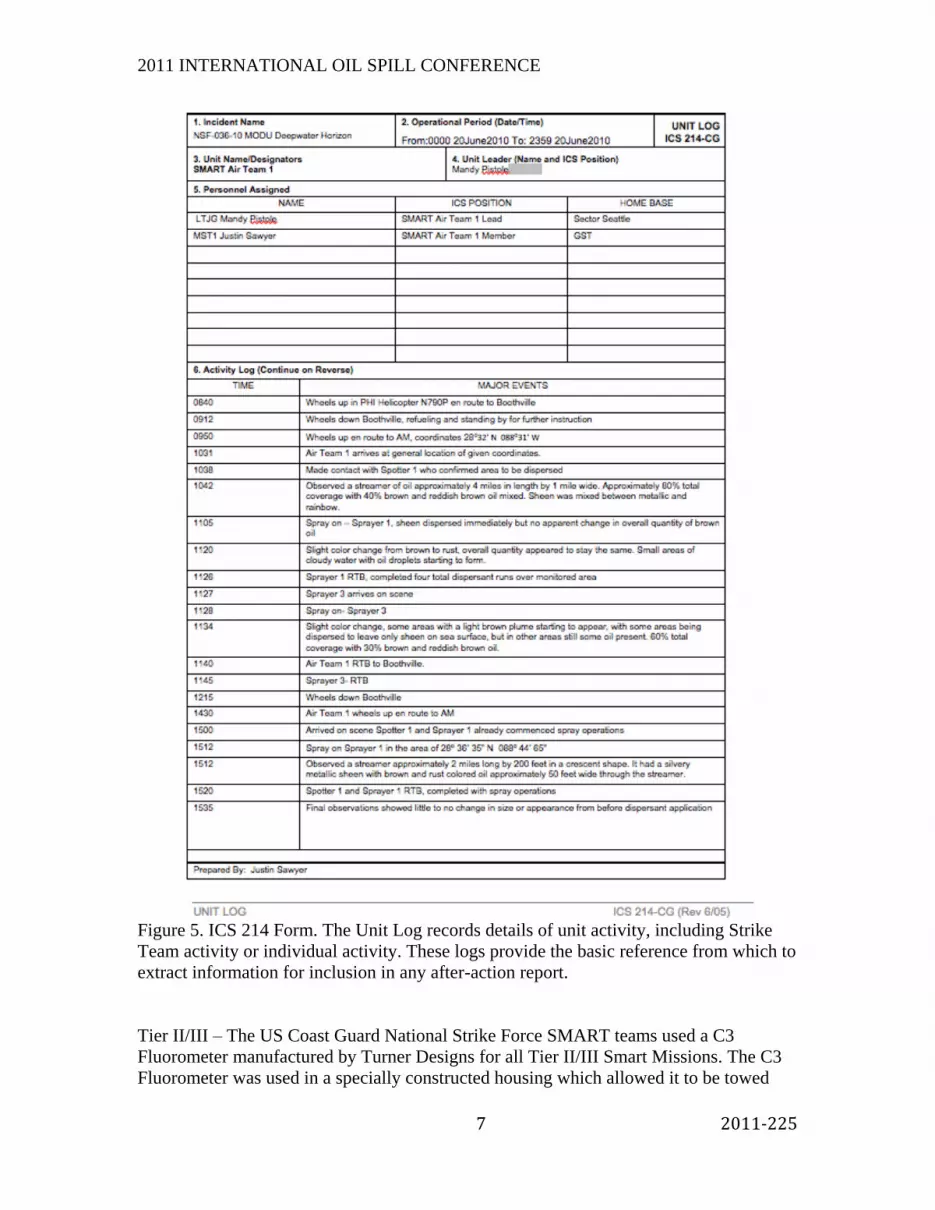
Figure 5. ICS 214 Form. The Unit Log records details of unit activity, including Strike
Team activity or individual activity. These logs provide the basic reference from which to
extract information for inclusion in any after-action report.
Tier II/III – The US Coast Guard National Strike Force SMART teams used a C3
Fluorometer manufactured by Turner Designs for all Tier II/III Smart Missions. The C3
Fluorometer was used in a specially constructed housing which allowed it to be towed

2011 INTERNATIONAL OIL SPILL CONFERENCE
8 2011-225
horizontally as opposed to vertically as the instrument was originally designed (see
Figure 6). The C3 fed data directly through a hard-wired connection to a laptop on the
deck of the vessel where it was compiled along with GPS data for later transmission to
data processing personnel. To supplement fluorometry for Tier III monitoring, a
HydroLab manufactured by Datasonde was utilized which recorded data on water
temperature, dissolved oxygen, PH, and turbidity. Tier III also required the use of a
Wildens air operated pump to draw samples from a depth of 10 meters.
Figure 6. SMART Team member lowering C3 Fluorometer with its specially made
housing into the water for a monitoring run.
Processes Employed
The coordination of SMART assets and dispersant aircraft proved to be an
immense challenge during the early portion of the response. Since the oil was being
released at a depth of 5,000 feet, any shift in ocean currents could change where the oil
2011 INTERNATIONAL OIL SPILL CONFERENCE
9 2011-225
broke the surface, sometimes by as much as two to three miles. The response positioned
skimming assets closest to the source (where the oil broke the surface), with dispersants
being used at a greater distance from the source. This movement of the oil greatly
increased the area that dispersant aircraft and consequently SMART teams had to operate
in. Because of this “moving target” combined with the up to four hour boat transit to get
the SMART teams on scene, there would sometimes not be any oil in the area which left
the teams playing catch up to follow the spotter aircraft and dispersant aircraft which
traveled 120-150 MPH faster than the vessel.
The work around for this problem was to pick a location that was thought to be
close to the oil based on projections from the previous day, and have the SMART team
transit to this position and stand by until contact was made with spotter aircraft directing
the dispersant assets. Once this contact had been made the SMART teams would
communicate directly with the spotter aircraft, who would direct them to a portion of the
slick that would be sprayed with dispersant later in the day allowing transit time for the
slow moving vessel without interfering with dispersant operations. The spotter aircraft
would then work with the dispersant aircraft in its normal fashion until the SMART
vessel was on scene at the predetermined location at which time it would vector a
dispersant aircraft to that spot. To compound the problems with coordinating assets,
aircraft and marine vessels use completely different radio systems. To retrofit aircraft
with marine band radios is a complex and expensive proposition due to FAA regulations,
and hand held aircraft band radios for use on vessels have limited power and range.
Resources used.
All total, the SMART teams employed in the response included three crew boats
(>100’ length), two small boats (<30’ length), three helicopters, two forward staging
areas, 50 USCG personnel, 30 contractor personnel, six C-3 Fluorometers, two SCUFA
fluorometers, one LISST (laser particle size analyzer), and 3 Hydro labs. There were a
total of 118 SMART missions conducted encompassing 77 Tier I, 30 Tier II/III, and 11
Tier III+ missions.
RESULTS / DISCUSSION
Due to the magnitude of the DWH event data transfer and data processing was a
formidable challenge throughout the SMART operations period.
With multiple SMART Teams operating over a large geographic area far from
Incident Command, data flow was one of the first challenges faced by the dispersant
monitoring group during the DWH event (see Figure 7). The 2006 SMART Protocol
provides a general guideline for data flow but does not address the specifics of efficiently
moving data from the field to Incident Command in a timely manner.

2011 INTERNATIONAL OIL SPILL CONFERENCE
10 2011-225
Figure 7. Screen shot from ERMA depicting locations of aerial dispersant operations.
The first SMART teams on scene were from the USCG NSF who set up a
SMART forward command base at Venice, La. The SMART vessels would depart
Venice in the morning and return late in the evening with the day’s data. This data was
then handed over to the USCG Field Response Coordinator in Venice who emailed it up
the USCG chain of Command and ultimately to the NOAA SSC. With the SMART data
passing through several sets of hands between the field and IC, delays in the data flow
developed as everyone's workload increased. After several unsuccessful attempts to
streamline the SMART data email procedures the EPA offered their On-Scene
Coordinator website as a repository and clearinghouse for the DWH SMART data. With
this, the SMART field teams could upload their data to the web site where it would be
available to IC minutes later. This proved quite effective and was utilized for the
remainder of the DWH response.
Data processing was another formidable challenge for the Dispersant Monitoring
Group. As with data transfer, the 2006 SMART Protocol provides little information on
how SMART data should be processed and presented. Early in the DWH response the
SMART field team members performed basic data processing in the field. During this
early phase of the response we were fortunate to have an NSF member on the field team
with exceptional data processing skills. He was able to generate valuable dispersant
monitoring data that was of use to the NOAA SSC without further processing at Incident
Command. Though this got the SMART teams off to a good start it was not a sustainable
situation. It’s unreasonable to expect this level of data processing skill from the field
teams and added several hours to their already overtaxed workday. We quickly identified

2011 INTERNATIONAL OIL SPILL CONFERENCE
11 2011-225
the need for a dedicated SMART processing team at Incident Command to relieve the
field teams of the data processing burden.
Adding to the challenge of setting up a SMART processing team was the fact that
the number of SMART field teams increased from one to three. This meant that data from
three separate field teams would need to be processed simultaneously. In order to
facilitate the processing of this large amount of data we established a standardized
SMART field-reporting guide. This guide provided the field teams with a standardized
format for packaging and transmitting their field data. Although writing the field reports
and formatting the SMART data added to the field team’s workload, it eliminated a
tremendous amount of confusion on the processing end. The standardized data package
along with the use of the EPA-OSC website greatly improved our SMART data
management.
After a bit of trial and error we developed a SMART data processing team at IC
that worked quite well. The team initially consisted of two NOAA contracted GIS experts
working closely with the SMART Technical Specialist (TS), but because the NOAA
contractors were not available to work with SMART full time we struggled to keep pace
with the processing demands of three SMART field teams. Later, the NOAA GIS experts
were replaced by two GIS experts from the EPA who were available to SMART on a full
time basis. This allowed the processing team to barely keep up with the incoming data.
Later, when SMART field operations were scaled back to one field team, the processing
team was reduced to one GIS expert and the SMART TS. This proved to be an ideal
combination. The GIS expert provided geospatial support while the SMART TS
performed the fluorometry processing and analysis.
How best to present the results of the SMART monitoring effort was another
challenge we faced early in the response and again, the 2006 SMART protocol provided
little guidance. After consulting with the NOAA Scientific Support Coordinators (SSC)
and other end-users the processing team developed a one-page poster format to present
the SMART monitoring results (see Figure 8). The challenge here was to present
adequate dispersant monitoring data without overwhelming the decision makers who may
have a limited knowledge of the SMART process. The SMART poster format that
evolved over the course of the DWH event, along with an associated written analysis for
each SMART mission, seemed to satisfy all concerned.

2011 INTERNATIONAL OIL SPILL CONFERENCE
12 2011-225
Figure 8. Tier III SMART Data Poster Presentation Format. Displays location of the
source, location of spray activities and monitoring sites, photographs of oil, 1-meter and
10-meter graphic results.
The original SMART field data was housed in the EPAOSC.ORG site. The results
would be reviewed by the SSC and BP representative to corroborate field observations as
to dispersant effectiveness and forwarded to the FOSC and unified command.
We learned a great many things about SMART operational procedures during the
DWH response, but due to the large magnitude (both in time and space) of this response,
one of the most important lessons is the value of data processing. As we work to update
the SMART protocols we must consider the important role of data processing and
provide adequate guidelines for its implementation.
Data storage, retrieval, and archiving of the water chemistry analyses became a
major issue as the number of teams, number of sorties, number of observations, and
number of samples increased dramatically. BP initially began filing the data and then it
was moved to the EPA SCRIBE system by EPA declaration. This system was initially a
good option, but became cumbersome and then overwhelmed soon afterwards. It was
difficult to navigate the massive amount of data in the system and required an EPA
employee to get access. This also made the data non-transparent to the public. The data is
in the process of being transferred to a NOAA site hosted by National Ocean Data Center
in Stennis, MS, which will be made available via Query Manager.

2011 INTERNATIONAL OIL SPILL CONFERENCE
13 2011-225
CONCLUSIONS
Designation as a SONS, the geographic scale (18,000 square mile operating area)
and continuing release of oil associated with this event were beyond the scope of
SMART as it was originally conceived, and the difference presented several challenges,
particularly:
1. There were insufficient SMART monitoring teams trained to align with the scope
of the daily aerial dispersant areas area. Beyond the staffing shortfall, the 4-hour
(one way) transit time by boat from staging areas to offshore sampling areas
required complex logistical support, and stretched the safe operating time for the
limited number of team personnel.
2. Plotting and interpreting SMART data was described in the 2006 protocol as
follows: Communication of monitoring results should flow from the field
(Monitoring Group Supervisor) to those persons in the Unified Command who
can interpret the results and use the data. Typically this falls under the
responsibility of a Technical Specialist on dispersants in the Planning Section of
the command structure. For the U.S. Coast Guard, the technical specialist is the
Scientific Support Coordinator. Given the scale of operations and limited cadre
of experienced dispersant technical specialists, additional details for SMART
plotting and interpretation had to be developed and a daily reporting protocol was
implemented to meet EPA requirements.
Lessons learned and future suggestions for improving the SMART protocols will
be suggested to the revision workgroup at the national level.
REFERENCES
USCG, NOAA, US EPA, CDC&P, MMS. 2006. Special Monitoring of Applied
Response Technologies. Version 8.
NOAA. 2010. Oil Spill Dispersant Application and Monitoring. Page 1.
NOAA, Office of Response and Restoration, Emergency Response Division. 2009.
Dispersant Application Observer Job Aid. 34 pages.