Embed Size (px)
Citation preview

HAL Id: hal-00518065https://hal.archives-ouvertes.fr/hal-00518065
Submitted on 8 Mar 2016
HAL is a multi-disciplinary open accessarchive for the deposit and dissemination of sci-entific research documents, whether they are pub-lished or not. The documents may come fromteaching and research institutions in France orabroad, or from public or private research centers.
L’archive ouverte pluridisciplinaire HAL, estdestinée au dépôt et à la diffusion de documentsscientifiques de niveau recherche, publiés ou non,émanant des établissements d’enseignement et derecherche français ou étrangers, des laboratoirespublics ou privés.
Aerosol layers from the 2008 eruptions of Mount Okmokand Mount Kasatochi: In situ upper troposphere and
lower stratosphere measurements of sulfate and organicsover Europe
J. Schmale, Jodi Schneider, T. Jurkat, C. Voigt, H. Kalesse, M. Rautenhaus,M. Lichtenstern, H. Schlager, Gérard Ancellet, F. Arnold, et al.
To cite this version:J. Schmale, Jodi Schneider, T. Jurkat, C. Voigt, H. Kalesse, et al.. Aerosol layers from the 2008eruptions of Mount Okmok and Mount Kasatochi: In situ upper troposphere and lower stratospheremeasurements of sulfate and organics over Europe. Journal of Geophysical Research: Atmospheres,American Geophysical Union, 2010, 115 (D2), pp.D00L07. �10.1029/2009JD013628�. �hal-00518065�

Aerosol layers from the 2008 eruptions of Mount Okmok andMount Kasatochi: In situ upper troposphere and lowerstratosphere measurements of sulfate and organics over Europe
J. Schmale,1 J. Schneider,1 T. Jurkat,2 C. Voigt,2,3 H. Kalesse,3 M. Rautenhaus,2
M. Lichtenstern,2 H. Schlager,2 G. Ancellet,4 F. Arnold,2,5 M. Gerding,6 I. Mattis,7
M. Wendisch,8 and S. Borrmann1,3
Received 1 December 2009; revised 26 April 2010; accepted 28 April 2010; published 17 September 2010.
[1] In 2008 Mount Okmok and Mount Kasatochi started erupting on 12 July and7 August, respectively, in the Aleutians, depositing emissions of trace gases and aerosolsas high as 15.2 km into the atmosphere. During an aircraft campaign, conducted overEurope in between 27 October and 2 November 2008, the volcanic aerosol was measuredby an Aerodyne aerosol mass spectrometer, capable of particle chemical compositionmeasurements covering a size diameter range between 40 nm and 1 mm. In the volcanicaerosol layer enhanced submicron particulate sulfate concentrations of up to 2.0 mg m−3
standard temperature and pressure (STP) were observed between 8 and 12 km altitude,while background values did not exceed 0.5 mg m−3 (STP). Twenty‐one percentof the volcanic aerosol consisted of carbonaceous material that increased by a factorof 1.9 in mass compared to the free troposphere. Enhanced gaseous sulfur dioxideconcentrations measured by an ion trap chemical ionization mass spectrometer of up to1.3 mg m−3 were encountered. An onboard radiation measurement system simultaneouslydetected an enhanced aerosol signal. Furthermore, two German lidar stations identifiedan aerosol layer before and after the campaign. Data analysis shows that the aerosol layerwas observed mainly in the lowermost stratosphere. Correlation of particulate sulfateconcentration and sulfur dioxide mixing ratios indicates that after a 3 month residence timein the stratosphere, not all sulfur dioxide has been converted into sulfate aerosol. Thesignificant fraction of organic material might have implications on heterogeneouschemistry in the stratosphere, which need to be explored more thoroughly.
Citation: Schmale, J., et al. (2010), Aerosol layers from the 2008 eruptions of Mount Okmok and Mount Kasatochi: In situupper troposphere and lower stratosphere measurements of sulfate and organics over Europe, J. Geophys. Res., 115, D00L07,doi:10.1029/2009JD013628.
1. Introduction
[2] Volcanoes are a sporadic but important source ofstratospheric aerosol and precursor gases. Large eruptionslike El Chichón (1982) or Mount Pinatubo (1991) emittedapproximately 8 and 20 Mt of sulfur dioxide, respectively,into the stratosphere [Krueger et al., 2008; von Glasow et al.,
2009] that was eventually converted into sulfate (or sulfuricacid) aerosol, temporarily enhancing the Junge aerosol layer.Especially after the Mount Pinatubo eruption, in situ aerosolmeasurements are available that quantify the additional par-ticle surface area due to the volcanic aerosol [e.g., Borrmannet al., 1993; Jonsson et al., 1995; Wilson et al., 1993]. Inaddition to the effects of the volcanic aerosols on radiationand climate the particles offer surface and volume for het-erogeneous reactions [Arnold et al., 1990; Borrmann et al.,1997; Fahey et al., 1993] and act as nuclei for the formationof polar stratospheric clouds [Thomason and Peter, 2006].In particular, for the layers directly in the vicinity of the midlatitude tropopause heterogeneous effects of cirrus andvolcanic aerosol enhancements may influence the ozoneabundance and thus the radiative budget [Borrmann et al.,1996; Solomon et al., 1997; Voigt et al., 2006]. For thedescending aerosol layer after the 1991 Mount Pinatuboeruption Keim et al. [1996] showed based on midlatitudein situ measurements that NOx can be reduced to almost
1Particle Chemistry Department, Max Planck Institute for Chemistry,Mainz, Germany.
2Deutsches Zentrum für Luft‐ und Raumfahrt, Institut für Physik derAtmosphäre, Oberpfaffenhofen, Germany.
3Institute for Atmospheric Physics, J. Gutenberg University, Mainz,Germany.
4LATMOS, Université Pierre et Marie Curie, Paris, France.5Max Planck Institute for Nuclear Physics, Heidelberg, Germany.6Leibniz Institute for Atmospheric Physics, Kühlungsborn, Germany.7Leibniz Institute for Tropospheric Research, Leipzig, Germany.8Institute of Meteorology, University of Leipzig, Leipzig, Germany.
Copyright 2010 by the American Geophysical Union.0148‐0227/10/2009JD013628
JOURNAL OF GEOPHYSICAL RESEARCH, VOL. 115, D00L07, doi:10.1029/2009JD013628, 2010
D00L07 1 of 18

zero near the thermal tropopause on account of heteroge-neous processing. The influence of such chemistry on ozoneis still under debate [Smith et al., 2001] and quantification ofits magnitude and frequency of occurrence still remainsopen. The efficiency of heterogeneous reactions largelydepends on the chemical composition and size of the aerosolparticles involved. Reaction rates (e.g., for N2O5) dependmost significantly on aerosol particles when the surface areais between 2 and 5 mm2 cm−3 [Fahey et al., 1993]. Thus, asmall enhancement of reactive particles as provided byvolcanic eruptions can increase the reaction rates efficientlyin the upper troposphere and lower stratosphere (UT/LS)[Griffiths et al., 2009; Sander et al., 2006]. For these reasonsdirect in situ measurements of the particulate chemicalcomposition are of high value. This is in particular the casefor the tropical UT/LS where post eruption volcanic aerosolshave been shown to contain significant amounts of nonvolatile material [Borrmann et al., 2010] and where lowtemperatures enhance heterogeneous processing [Popp et al.,2007; Voigt et al., 2007]. Comprehensive summaries of theissues in connection with volcanic aerosols are provided bySPARC und WMO ozone assessments [Thomason andPeter, 2006; World Meteorological Organization, 1999]including extensive referencing and by von Glasow et al.[2009].[3] New methods, such as aerosol mass spectrometry,
have been developed in recent years and are now used tomeasure particle composition in the UT/LS, beginning withthe works of Murphy et al. [1998] who was the first tooperate a single particle mass spectrometer in the strato-sphere. This type of laser ablation single particle massspectrometer has since then been employed repeatedly,recently also in the tropical UT/LS region [Froyd et al.,2009a, 2009b]. The bulk composition of polar aerosol hasbeen detected in the lower stratosphere by balloon borneaerosol mass spectrometry [Arnold et al., 1998; Schreineret al., 2002; Voigt et al., 2000] in the UT/LS. A similarmass spectrometric technique, the Aerodyne aerosol massspectrometer (AMS), that is able to quantify the non-refractory submicron aerosol components was first operatedon aircraft in the lower troposphere by Bahreini et al. [2003],followed by midlatitude UT/LS measurements by Schneideret al. [2006a] and later on several more occasions [Crosieret al., 2007; DeCarlo et al., 2008; Dunlea et al., 2009;Morgan et al., 2009].[4] After the eruption of Mount Pinatubo, a relatively long
period with low stratospheric aerosol load was observed thatis considered to represent the volcanically quiescent back-ground [Borrmann et al., 2010; Deshler, 2008]. Althoughtropospheric mass spectrometric measurements of continuousvolcanic sulfate emissions originating from Mount Popo-catépetl and Mount Colima near Mexico City and Iceland,respectively, have been reported by DeCarlo et al. [2008]and Ovadnevaite et al. [2009], there has not yet been theopportunity to obtain direct in situ measurements of strato-spheric volcanic aerosol by aerosol mass spectrometry. Inthe year 2000, airborne in situ measurements of aerosolnumber, size, and volatility were performed shortly after theMount Hekla eruption [Hunton et al., 2005; Rose et al.,2006]. However, these measurements did not include insitu particle chemistry.
[5] In summer 2008, two volcanoes on the Aleutianserupted: The volcano Mount Okmok (53.40°N, 168.17°W)became active on 12 July, and Mount Kasatochi (52.18°N,175.51°W) on 7 August. Both outbreaks were strongenough to inject trace gases and aerosol particles into thestratosphere [Carn et al., 2008], up to about 15 km. Theenhanced trace gas and aerosol load in the lower strato-sphere due to these volcanic emissions has been observed byin situ and remote sensing measurements [e.g., Martinssonet al., 2009; Theys et al., 2009].[6] In this paper we present aircraft based in situ mea-
surements from the CONCERT campaign (CONtrail andCirrus ExpeRimenT [Voigt et al., 2010]) conducted between27 October and 2 November 2008 of the particle chemicalcomposition of an aerosol layer encountered directly abovethe local tropopause and compare the results to data from theunperturbed upper troposphere and the lower stratosphere.Lidar profiles show that this aerosol layer was observed overcentral Europe continuously, starting 34 days after theKasatochi eruption. In an accompanying paper, Jurkat et al.[2010] discuss the modification of the trace gas distributionin the lowest stratosphere by the Kasatochi eruption basedon aircraft measurements of SO2, HCl and HNO3 during theCONCERT campaign.
2. Measurements
[7] The data on submicron aerosol chemical compositionand size distribution, CO, O3, SO2 and spectral upwellingradiances have been recorded by various instrumentsduring two aircraft campaigns, POLARCAT‐France andCONCERT‐Chemistry. Aerosol composition measurementswere performed using the Aerodyne aerosol mass spectrom-eter. The main results were obtained on board the DLR‐Falcon within the CONCERT campaign between 27 Octoberand 2 November 2008 during six flights. The operationbase of the CONCERT campaign was Oberpfaffenhofen(48.07°N, 11.27°E), Germany. Flights were conductedmostly at altitudes between 8000 and 12000 m over centraland western Europe between longitudes of 15°E and 14°Wand latitudes of 48° and 55°N. On 28 and 31 October2008, a tropopause fold over the North Atlantic near theNetherlands and between France and Ireland, respectively,was probed. During these measurement flights, an aerosollayer with enhanced particulate sulfate mass concentrationwas observed in the UT/LS region. To compare the recordeddata with results prior to the volcanic eruptions of MountOkmok and Mount Kasatochi on 12 July and 7 August,accordingly, data from the POLARCAT‐France project wasused. This campaign took place in June–July 2008 inGreenland as part of the International Polar Year activities.Flights were carried out with the French research aircraftATR‐42 in all directions around the base in Kangerlussuaqfrom 60° to 71°N and 40° to 60°W with a maximumaltitude ceiling of 7600 m.
2.1. Aerosol Mass Spectrometer
[8] On both aircraft the same Aerodyne compact time‐of‐flight aerosol mass spectrometer (in short C‐ToF‐AMS,hereafter AMS) was used to measure the chemical compo-sition and mass concentrations (in terms of sulfate (abbre-
SCHMALE ET AL.: AEROSOL LAYERS OF OKMOK AND KASATOCHI D00L07D00L07
2 of 18

viated as SO4), nitrate (NO3), ammonium (NH4), organics(Org), and chloride (Chl)) of submicron aerosol particles[Canagaratna et al., 2007; Drewnick et al., 2005]. Briefly,aerosol is sampled through a critical orifice followed by anaerodynamic lens system, where the particles are focusedinto a narrow beam, concentrated and accelerated whenentering the instrument’s vacuum chamber. After passing atime‐of‐flight region in the vacuum chamber the particlesimpact upon an inverted cone of tungsten operated at about600°C. On this vaporizer the particles are flash vaporizedand the generated gas molecules are ionized by electronimpact (70 eV) before the ions are extracted into a time‐of‐flight mass spectrometer. Via the difference of mass spectrarecorded with a completely open and blocked aerosol beam,the mass concentration of nonrefractory particle chemicalcomponents can be determined. Chemical composition canalso be provided size‐resolved. For this purpose, a chopper,located at the exit of the aerodynamic lens, cuts the particlebeam to determine the particle time of flight for the calcu-lation of the aerosol vacuum aerodynamic diameter (dva)[DeCarlo et al., 2004]. Based on a “fragmentation table”[Allan et al., 2004b] the mass spectra can be converted intomass concentration of chemical species (sulfate, ammonium,nitrate, organics, and chloride) at standard temperature andpressure (273 K, 1013.25 hPa). The standard AMS quanti-fication procedure is described by Allan et al. [2003].During both campaigns, the AMS was operated in theso‐called general alternation mode when the recording ofmass spectra (MS mode) and particle time of flight (PToFmode) happens sequentially. For POLARCAT, one datapoint corresponds to 30 s sampling time spending threetimes five seconds in each mode. For CONCERT, the timeresolution is ten seconds with each mode recording half ofthe time. Additionally, a fast mass spectrum (FMS) modewith one second time resolution was applied during certainintervals. Details of the FMS mode are described by Kimmelet al. [2008]. Data reported here are 30 s averages forCONCERT and 120 s averages for POLARCAT. In order toassure quantitative measurements, the instrument’s ioniza-tion efficiency was determined six and three times forPOLARCAT and CONCERT, respectively.[9] On each aircraft, the AMS was connected to a forward
facing inlet for isokinetic sampling. For the DLR‐Falcon,the inlet has been described by Fiebig [2001] and Schneideret al. [2006a]. The inlet extends 30 cm beyond the fuselagesampling the air outside the boundary layer of the aircraft.The upper cutoff diameter is larger than 1.3 mm and thusdoes not interfere with the upper cutoff diameter of the AMSinlet. Inside the aircraft, a 1.9 mm ID stainless steel tube ofless than one meter length connected the aircraft inlet withthe AMS pressure controlled inlet (PCI) system. To guar-antee isokinetic sampling the flow rate through this tube waskept constant at 2.5 l/min. Since the PCI had a flow rate ofonly 1.2 l/min a bypass with a throughput of 1.3 l/minwas installed not interfering with the sample flow. DuringPOLARCAT, the AMS sampled from the French commu-nity aerosol inlet (CAI) fabricated by COMAT as describedby Brenguier et al. [2008]. CAI is an isokinetic and isoaxialinlet with an estimated 50% transmission efficiency at2.5 mm; thus, the AMS measurements are not impaired. Themass spectrometer was connected via a 4.4 mm ID stainless
steel tube of approximately 2 m total length to the aircraftinlet.2.1.1. Pressure Controlled Inlet SystemCharacterization[10] The employed PCIs have been built according to the
design described by Bahreini et al. [2008]. The purpose of aPCI is to facilitate stable conditions in front of the AMSinlet lens to assure the operation of the aerodynamic lensunder constant pressure. Instable pressure conditions wouldlead to changes in the lens transmission function and todifferent acceleration velocities in the aerodynamic lens andthus to variability in particle sizing. Four modifications ofPCIs were used during CONCERT and POLARCAT. Adetailed description of the setup and functioning is providedin Appendix A. For correct quantification of particle mass,the transmission efficiency of the PCI was determined (fordetails see Appendix A) as shown in Figure 1. For PCI 1 to 3,deployed during CONCERT, the transmission efficiency isthe same as for the standard inlet within the calculated errorrange. Generally, transmission between 200 and 400 nm dvaparticles for PCI POLARCAT and between 200 and 600 nmfor all other inlets is close to 100%. Thus, the respective dataof the CONCERT campaign have not been corrected fordifferences in inlet transmission. The POLARCAT inletshows lower transmission for particle sizes smaller than200 nm dva and larger than 400 nm resulting in an overall inlettransmission of approximately 54% compared to the standardinlet. All acquired mass concentrations from POLARCAThave been corrected accordingly.2.1.2. AMS Data Correction, Errors, and Limitof Detection[11] Next to losses occurring in the inlet and lens system
(EL) and losses due to nonfocusing of nonspherical particlesafter having passed through the aerodynamic lens (ES), thereare certain types of particles which hit the heater and bounceoff immediately (EB). These particles are not vaporized andtheir mass is thus not accounted for. In order to compensatefor these artifacts, the so‐called collection efficiency (CE)factor, the product of all three effects (CE = EL* ES* EB),was introduced [Huffman et al., 2005]. It has been shownthat a CE factor of 0.5 represents quite well the sampling ofambient aerosol as determined and applied in various fieldcampaigns [e.g., Allan et al., 2004a; Drewnick et al., 2004;Hings et al., 2007]. Based on this experience and the lack ofopportunity to compare AMS mass concentrations to datarecorded by other instruments, the CE factor was assumed tobe 0.5 for data reported here. An additional argument infavor of this value is that particles were sampled at ambienttemperatures between −30 and −64°C at low relativehumidity most of the time. Since the sampling line in theaircraft was not cooled, temperature differences between theoutside and inside were on average 79 K with a maximumdifference of 107 K. Thus, it is assumed that most of thewater contained in the particles had been evaporated withinthe sampling line. So particles entering the AMS were dryand would therefore bounce of the heater more likely.Studies by Matthew et al. [2008] have shown that moresolid phase particles have low collection efficiencies around20%–30% opposed to liquid phase particles with CEsaround 100%. On the other hand, it was found that veryacidic aerosol mainly composed of sulfuric acid tends to
SCHMALE ET AL.: AEROSOL LAYERS OF OKMOK AND KASATOCHI D00L07D00L07
3 of 18

have a CE of 1 in a marine environment [Quinn et al., 2006].Here we applied a CE of 0.5 for all CONCERT measure-ments, while for POLARCAT we used a CEPCI of0.5*0.54 = 0.27, including PCI transmission efficiency.[12] Several corrections had to be applied to the data for
proper quantification. The employment of a PCI implies thatthe recorded data refer to conditions at PPCI. Conversion toSTP conditions was done by the following equation:
CSTP ¼ CAMS � Qmeas=QCO � PSTP=PPCI ; ð1Þ
with CSTP being the concentration at STP conditions, CAMS
the mass concentration obtained after standard AMS dataprocessing, Qmeas the measured flow rate by the instrument,QCO the nominal flow rate through the last critical orifice,and PSTP being equal to 1013.25 hPa. Furthermore, therelative ionization efficiencies (RIE) of sulfate, ammonium,and organics relative to nitrate were found to be differentfrom standard assumptions. Therefore, these values weredetermined in laboratory experiments for each flight’selectronic acquisition settings. 350 nm particles were gen-erated from a solution of known ratio of ammonium nitrate,ammonium sulfate and succinic acid, dried by two diffusiondryers and measured by the AMS in mass spectrum mode.By dividing the original mass composition ratio by the ratioobtained from the AMS the correct RIE values were deter-mined. The average values are: RIESO4 = 0.98 ± 0.03,RIENH4 = 3.11 ± 0.05, and RIEOrg = 1.76 ± 0.02. Third,different electronic acquisition settings for general alterna-
tion and fast mass spectrum mode had to be compensated.Thus, the same laboratory generated particle types weremeasured by the AMS in both modes with each flight’sinstrumental settings. Division of the FMS mode values bythe general alternation mode values yields the correctionfactor for each species.[13] For each AMS data point an error has been calcu-
lated. It comprises uncertainties derived from counting sta-tistics [Allan et al., 2003] and for sulfate containing particlesadditionally an uncertainty of 5.2% due to variations in therelative ionization efficiency caused by temperature fluc-tuations of the heater. Other species were found not to beaffected by this effect. The systematic error due to the col-lection efficiency cannot be determined on a point by pointbasis. The uncertainty in the transmission efficiency relatedto the PCI is in the order of 30% (see Figure 1) but notsignificantly higher than for the standard inlet. In Figure 3,exemplary error bars are shown accounting for this generaluncertainty.[14] The limit of detection (LOD) has been calculated as
three times the standard deviation of the closed signal ofeach aerosol species, multiplied by √2 [Drewnick et al.,2009]. For aircraft measurements special circumstancesapply, meaning that the instrument’s vacuum can only beestablished within a short time period before takeoff, i.e.,approximately 4 h for POLARCAT and CONCERT cam-paigns. Therefore, background concentrations of certain m/zare elevated compared to levels after long pumping periods.Thus, the pumping during the flight still has a significant
Figure 1. Measured particle transmission efficiency of AMS inlets. (a) Pressure controlled inlets (PCI) 1and 2 used in CONCERT compared to the PCI used in POLARCAT. (b) Comparison between PCI 3 usedin CONCERT, AMS standard inlet, and data from Liu et al. [2007]. For details on the PCIs, see Table A1.The error bars represent the standard deviation of 1 min averaged CPC counts over LSP counts for thetotal number of collected data points (15–20) with the LSP counting method. For the mass method, errorbars denote variations in the charge probability of the monodisperse aerosol and counting statistics fromAMS nitrate determination. Transmission efficiencies are around 100% from 200 to 400 nm for PCIPOLARCAT and from 200 to 600 nm for all other PCIs and the standard inlet. Lines between the pointswere drawn only to guide the eye.
SCHMALE ET AL.: AEROSOL LAYERS OF OKMOK AND KASATOCHI D00L07D00L07
4 of 18

impact on these background loadings and concentrations arereduced in the course of the flight. On average the pumpingtime during the flight is as long as the preparation periodbefore the flight. This results in a long‐term trend in thebackground signal on which noise is superimposed. Usingthe standard deviation from the closed signal backgroundwould thus yield an overestimated detection limit. Tocompensate for this effect, an algorithm has been appliedthat allows for calculation of the standard deviation of asignal that is a combination of short‐scale noise and a long‐scale trend. This algorithm is described in detail by P. Reitzand J. Schneider (Noise level determination by local cubicsignal approximation: Calculation of Aerodyne aerosol massspectrometer detection limits, submitted to AtmosphericMeasurement Techniques Discussion, 2010). It uses a localcubic approximation of the long‐scale variation of the signalin order to separate them from the short‐scale variationswhich contain the information on the noise of the curve. Theoutput of the algorithm corresponds to the standard devia-tion of the noise of the signal. LODs during CONCERThave been determined for 30 min intervals of each flight.Average limits of detection of 30 s average data are given inTable 1. These values show that the level of significance isin the order of 0.01 mg m−3.
2.2. Further Instruments Aboard DLR‐Falcon
[15] Ozone measurements were performed with a two cell(zero, sample) UV absorption photometer switching cham-bers every four seconds. Pressure and temperature data werealso recorded by the instrument at a 1 Hz rate. Ozone valuesare generated every four seconds. This data is then correctedfor pressure and temperature. The range of the instrument is0 to 1000 nmol mol−1 with a detection limit of 1 nmol mol−1
[Brough et al., 2003]. Carbon monoxide measurements arebased on fluorescence detection. The instrument can beoperated to less than 100 mbar and has been calibratedregularly during flights by injection of a known CO standard.The time resolution is one second and response is linearbetween 0 and 1000 mmol mol−1 while the detection limit issmaller than 6 nmol mol−1 and precision is 1.5 nmol mol−1
[Brough et al., 2003].[16] Sulfur dioxide measurements were performed with an
IT‐CIMS (ion trap chemical ionization mass spectrometer)[Fiedler et al., 2005; Speidel et al., 2007; Fiedler et al.,2009]. The IT‐CIMS instrument was equipped for the firsttime with an SF5
‐ ion source using a selective reaction for thedetection of SO2. HNO3 and HCl can be detected simulta-neously by the instrument [Marcy et al., 2005]. The timeresolution of the instrument is 1.6 s. Calibration was per-formed during the flight for HNO3 and after the flights for
SO2 and HCl. The detection limit for a running mean over10 spectra is 18 pptv for SO2 and 22 and 36 pptv for HCland HNO3 (for a running mean over 20 spectra), respec-tively. A detailed description of the instrument is given in anaccompanying paper by Jurkat et al. [2010].[17] Spectral upwelling radiation data was obtained with
the Spectral Modular Airborne Radiation measurement sys-Tem (SMART)‐Albedometer [Wendisch et al., 2001]. For theCONCERT experiment two optical inlets designed to mea-sure radiances Il
↑ and irradiances Fl↑ were installed in the rear
of the fuselage of the aircraft pointing downward to measureupwelling radiation. The inlets were each connected viaoptical fibers to a pair of grating spectrometers operating inthe wavelength ranges 350–1050 nm and 900–2200 nm withspectral resolutions (full width at half maximum, FWHM)of 2–3 nm and 9–16 nm, respectively. The design of theradiance inlet with an opening angle of 2.1° is described byEhrlich et al. [2008]. The performance of the SMART‐Albedometer on the Falcon aircraft in high‐altitude condi-tions has been demonstrated in a previous flight experiment[Eichler et al., 2009]. The temporal resolution of the radiancemeasurement was set to 1 s leading to a spatial averaging of200 m at an aircraft velocity of 200 m s−1. Resulting totalrelative errors are wavelength dependent and are in therange of 6%–9%.
2.3. Further Instruments Aboard ATR‐42
[18] The ATR ozone detection instrument is based on UVabsorption with two cells. It has a precision of 2 nmol mol−1
and a time resolution of four seconds. More detailed infor-mation can be obtained from Ancellet et al. [2009].
2.4. Additional Data Sets
[19] For supplementary analysis, potential vorticity (PV)was calculated fromECMWF (European Centre forMedium‐Range Weather Forecasts) analysis data to obtain informa-tion about the height of the tropopause as estimated from the2‐PVU (potential vorticity units) isosurface [Holton et al.,1995]. ECMWF analyses were available four times daily(00, 06, 12 and 18 UTC) at a resolution of 0.25 degrees inthe horizontal and 91 hybrid sigma‐pressure levels in thevertical direction. For comparison with the measurements,we interpolated the model PV linearly in time and space tothe Falcon flight track.[20] Additional AMS particulate sulfate and ozone mixing
ratio data have been used from the 60 s merged data setarchive of the ARCTAS campaigns in spring and summer2008. These two experiments were part of the InternationalPolar Year project and took place in Alaska and Canada,chronologically. Since the objectives were detection ofArctic haze in spring and influence of biomass burning insummer, data representing pollution conditions had to befiltered. This was achieved by applying a 0.2 nmol mol−1
acetonitrile [Warneke et al., 2006] and a 80 nmol mol−1
carbon monoxide upper threshold to exclude anthropogenicand biomass burning influences. To obtain data from onlyabove the troposphere an empirical definition for the tro-popause lower boundary based on ozone mixing ratio wasused [Zahn and Brenninkmeijer, 2003].[21] Further Aerosol data were provided by the EARLINET
lidar stations at Kühlungsborn (54°N, 12°E, Rayleigh‐Mie‐Raman) and Leipzig (51°N, 12°E, Raman). These data
Table 1. Limit of Detection (mg m−3, STP) per Flight DuringCONCERT for 30 s Average Data
Flight SO4 NO3 NH4 Org Chl
27 Oct 2008 0.02 0.03 0.12 0.14 0.0428 Oct 2008 0.03 0.02 0.17 0.11 0.0429 Oct 2008 0.02 0.03 0.10 0.10 0.0331 Oct 2008a 0.03 0.02 0.13 0.10 0.0331 Oct 2008b 0.02 0.02 0.13 0.07 0.032 Nov 2008 0.02 0.02 0.15 0.11 0.03
SCHMALE ET AL.: AEROSOL LAYERS OF OKMOK AND KASATOCHI D00L07D00L07
5 of 18

represent aerosol backscatter coefficients (sr−1 Mm−1) at 532and 1064 nm, respectively.
3. Results and Discussion
3.1. Identification of a Volcanic Aerosol Layer
[22] During one flight on 28 October and two flights on31 October 2008, unusually high concentrations of par-ticulate sulfate were measured over the North Sea (3–8°E,51–53°N) and the North Atlantic (4°E–14°W, 49–52°N, and4°E–12°W, 48–51°N), respectively. Figure 2 shows thetime series including particulate sulfate concentrations,sulfur dioxide mixing ratios, and altitude. Encounters of theaerosol layers, marked by shaded areas, are characterized bya rapid increase in sulfate aerosol concentration while itdecreases steeply when leaving the layer. More than 50% ofeach displayed flight has been spent within the aerosol layer.During several periods at altitudes above 8 km, particulatesulfate was enhanced, with mean values and standarddeviations of 0.54 ± 0.22, 0.82 ± 0.36 and 0.79 ± 0.50 mg m−3
(STP), in chronological order with a maximum observedvalue of 1.98 mg m−3. The mean value in the boundary layerfor all flights was 0.50 mg m−3 (STP) and thus lower thanthe mean values above 8 km which is a strong indication foran exceptional layer encounter in the UT/LS. The fluc-tuations in particulate sulfate mass loadings as shown inFigure 2 can be ascribed to inhomogeneity of the aerosollayer if they are greater than 8% of the actual measurementvalue. This estimation is based on the counting statistics error
of each data point. Thus, the time series show that theencountered aerosol layer was not completely homogeneous.During the measurement flights on 27 and 29 October and2 November 2008, mean sulfate loadings at the same alti-tudes were always below 0.17 mg m−3. The high values on28 and 31 October are remarkable especially when consid-ering earlier AMS airborne measurements over Germany in2003 [Schneider et al., 2006a] and over the UK region in2005 and 2006 [Morgan et al., 2009], both showing sig-nificantly lower concentrations. According to the lattermeasurements, the average particulate sulfate concentrationabove 8 km was about 0.39 mg m−3 for all recorded verticalprofiles, while for the free troposphere between 3 and 8 kmthe average was 0.23 mg m−3. This value is consistent to ourfindings in the free troposphere with 0.22 mg m−3 for allCONCERT flights.[23] Figure 2 also shows that particulate sulfate and gas-
eous sulfur dioxide concentrations are well correlatedthroughout the two flights on 31 October. Elevated partic-ulate sulfate concentrations are accompanied by elevatedSO2 concentrations. The enhanced SO2 values in the aerosollayer show that during the residence time of the air mass inthe atmosphere SO2 has been converted to certain extentinto sulfate aerosol but not entirely.[24] High particulate sulfate loadings between 8 and
12 km can result from various types of emissions. Theobserved sulfur dioxide might have been emitted by local airtraffic, and sulfate aerosol can be produced by conversion ofsulfur dioxide into sulfuric acid containing particles. Also,
Figure 2. Time series of the elevated particulate sulfate loadings during three flights and increased sulfurdioxide concentrations during two flights in October 2008 when the volcanic aerosol layer was encoun-tered (shaded areas). The vertical lines in Figure 2 (bottom) indicate the discussed sampling periods by theSMART‐Albedometer.
SCHMALE ET AL.: AEROSOL LAYERS OF OKMOK AND KASATOCHI D00L07D00L07
6 of 18

convective vertical transport of surface emissions might beresponsible for the elevated sulfur concentrations. A thirdexplanation is injection of sulfur dioxide into the strato-sphere by volcanic eruptions, with subsequent conversion ofSO2 to particulate sulfate, causing aerosol layers that canremain several months in the lower stratosphere above thetropopause [Borrmann et al., 1993]. Regarding the firstargument, CONCERT data indicates that air traffic emissionsare not responsible for this aerosol layer, although it wasencountered in the heavily trafficked North Atlantic flightcorridor. Data from measurements directly in contrails ofregular aircraft traffic do not show values higher than0.51 mg m−3, see Figure 3a (27 and 29 October, 2 November),and have a much lower average value, i.e., 0.17 mg m−3.[25] In order to test for recent or potentially high reaching
contributions from the surface other than volcanoes, trajec-tories were computed with HYSPLIT [Draxler and Rolph,2003]. However, the results indicate that the air masses inthe area in question did not originate from low altitudesin the 10 days prior to the encounter. The model was runwith the GDAS global data set. For the three flights of28 and 31 October, trajectories were initialized at hori-zontal coordinates taken in 15 min intervals from the flighttrack. Initial altitudes were set to 8, 10, and 12 km, as theactual flight altitude within the aerosol layers variedbetween 10300 and 10700 m. Computations were started at
the time of the observations and additionally 3 h earlier and3 h later and were run backward in time. The evaluation of234 trajectories shows that 79% of the tracked air parcelsstayed at constant altitudes between 10 and 14 km. Only21% of the trajectories encountered altitudes below 6 kmbefore arriving at the aircraft location, but most of themwere launched at the 8 km level, below the actual aircraftaltitude. The 12% of the total number of computed trajec-tories that dropped below 4 km were almost exclusivelylaunched at 8 km. Hence, the trajectory simulation stronglysuggests that surface emissions are not responsible for theobserved sulfate concentrations.[26] Thus, the only remaining explanation for the observed
aerosol layer is that sulfur was injected into the atmosphereby volcanic emission. However, since the volcanic eruptionsof Mount Okmok and Mount Kasatochi had alreadyoccurred in July and August 2008, respectively, the onlyplausible explanation why the volcanic emissions and theirconversion products survived until the end of October is thatthey had reached the stratosphere. Upper tropospheric sul-fate aerosol would have been removed by cloud processes[von Glasow et al., 2009]. In order to investigate whetherthe aerosol layer was located above or below the tropopause,we used the dynamic definition of the tropopause and set thethreshold for its lower boundary to 2 potential vorticity units(PVU) [Holton et al., 1995] from ECMWF model data. The
Figure 3. (a) Entire campaign vertical profile of particulate sulfate and gaseous sulfur dioxide (only31 October) relative to the ECMWF model tropopause boundary at 2 PVU. The exemplary blue error barsplotted along with the sulfate data represent the general AMS measurement uncertainty of 30%; the errorbars in symbol color represent the statistical uncertainty. (b) Vertical profile of particulate sulfate andozone on 28 October.
SCHMALE ET AL.: AEROSOL LAYERS OF OKMOK AND KASATOCHI D00L07D00L07
7 of 18

tropopause altitude varied strongly during flights with layerencounters from 250 to 550 hPa, whereas it was locatedbetween 200 and 300 hPa for days without enhanced aerosolconcentrations. Figure 3a shows particulate sulfate andgaseous sulfur dioxide displayed vertically as a function ofaltitude relative to the 2 PVU boundary, illustrating that theaerosol layer has been encountered solely above the tropo-pause. There is a clear difference in sulfate concentrationbetween the three flights with layer encounters (28 and31 October) and the three flights without encounters (27 and29 October, 2 November). The mean concentration withinthe layer (PVU > 2) is 3.5 times higher (0.79 mg m−3) thanfor background conditions. In the free troposphere (PVU< 2),values oscillate around similar means, i.e., 0.15 mg m−3 and0.18 mg m−3 for background and layer, respectively. Thesulfur dioxide data of 31 October also show enhancedconcentrations above the 2 PVU boundary at the samealtitude as particulate sulfur. Jurkat et al. [2010] calculatedthat for this day, 80% of the total sulfur had been convertedinto particulate matter.[27] Figure 3b shows the sulfate aerosol and ozone mixing
ratio vertical profile measured on 28 October as an example.The steep increase of the ozone mixing ratio from tropo-spheric values around 50 nmol mol−1 to stratospheric valuesof about 250 nmol mol−1 indicates the chemical tropopause.This plot additionally illustrates that the observed aerosollayer was located above the tropopause.[28] Another approach to investigate where the layer was
located with respect to the tropopause, is to consider tracerrelationships [Fischer et al., 2000] and [Pan et al., 2004].Even the aerosol measurements themselves can be usedunder certain circumstances as dynamical tracers as has beendemonstrated by Borrmann et al. [1995] by studying thetemporal evolution of the ozone versus aerosol correlationfor the development of the Mount Pinatubo eruption plume.Here ozone (O3) as a stratospheric tracer is plotted versuscarbon monoxide (CO) as a tropospheric tracer in Figure 4.The lines indicate regions that belong to the stratosphere,troposphere and the transition region. Color coding the data
points with particulate sulfate concentration provides anadditional perspective on where exactly the layer has beenencountered. The highest concentration of sulfate aerosolwas observed in the stratospheric branch while lower con-centrations were also encountered in the transition layer.However, no significant enhancement appeared in the tro-pospheric branch except for boundary layer data points.[29] The finding that the layer is encountered only above
the tropopause in the lower stratosphere is a strong indicationthat the sulfate aerosol layer is a result of a volcanic eruptionthat injected sulfur into the stratosphere. Mount Okmok(53.40°N, 168.17°W) and Mount Kasatochi (52.18°N,175.51°W) in the Aleutians are known to have fulfilled thiscriterion. Mount Okmok started erupting on 12 July forapproximately one month, Mount Kasatochi erupted on 7 and8 August, 2008. Mount Okmok injected about 0.1 Tg SO2
into the stratosphere up to 15 km, while Mount Kasatochiemitted 1.5 Tg SO2 [Carn et al., 2008] with a column heightof 15.2 km (http://www.avo.alaska.edu/). The layer was thusprobed between 108 and 111 days after the first eruption and82–85 days after the second one. Comparison to measure-ments conducted by the CARIBIC platform before, duringand after the eruption also supports the assumption that thislayer was of volcanic origin [Martinsson et al., 2009].CARIBIC is a scientific project which deploys a freightcontainer on commercial long‐distance aircraft to study theatmosphere’s chemical and physical processes. Figure 5depicts a 2008 timeline of ratios of particulate sulfur con-centrations and ozone mixing ratios. The most abundantdata set is provided by filter sampling of sulfate and tracegas measurements of the CARIBIC platform. Particulatesulfur is analyzed in the laboratory by particle‐induced X‐rayemission (PIXE) of particle sizes between 0.07 and 1.5 mm[Martinsson et al., 2001]. Even though particle sizes above1 mm are taken into account, results are still comparable toAMS submicron measurements, since experience shows thatmore than 90% of the mass is carried by particles smallerthan 0.6 mm [Martinsson et al., 2005]. Ozone was measuredby a UV absorption instrument. AMS particulate sulfate
Figure 4. Scatterplot of O3 versus CO, color coded by particulate sulfate concentration. Highest load-ings occur in the stratospheric branch (high O3) and partly also in the transition layer but not, however,in the tropospheric region (high CO).
SCHMALE ET AL.: AEROSOL LAYERS OF OKMOK AND KASATOCHI D00L07D00L07
8 of 18

values were transformed into particulate sulfur loadingsassuming that all sulfur was present as sulfate. According tothe CARIBIC data, the average ratio of sulfur to ozonebefore the Kasatochi eruption for above troposphere datawas 0.34 ng m−3 nmol−1 mol (hereafter termed “units”),illustrated by the dashed line between 21 June and 6 August.Shortly after the eruption, the ratio peaked with 3.4 units(triangle) and then leveled out at 1.05 units beginning inOctober (dashed black line). CONCERT measurements inOctober show a mean value of 0.65 units for backgroundconditions above the troposphere and 1.22 units within thevolcanic layer. The average is indicated by the red solid barwhile open circles refer to average values above 1.5 PVUper flight, which have an overall average of 1.03 units.Thus, general mean values determined during CONCERTare very close to findings by Martinsson et al. [2009] underthe condition that the CE is assumed to be 0.5. To compareCARIBIC levels from before the eruption to other AMSmeasurements, data from POLARCAT and ARCTAS wereconsulted. The POLARCAT average value for the S/O3 ratiois 0.36 units (solid green line July 2008), so very close againto CARIBIC findings. Tropopause and stratospheric back-ground measurements obtained from ARCTAS show levelsof 0.75 and 0.68 units for spring and summer, respectively,which is higher than the values from CARIBIC andPOLARCAT before the eruption, but in good agreement toCONCERT background findings (outside the volcanicaerosol layer) and still significantly lower than the CARIBICvalue after the eruption.[30] Further indication for a volcanic origin of the layer
provides a comparison to the particulate sulfur versuspotential vorticity findings of Martinsson et al. [2005] basedon CARIBIC data acquired at >8.2 km. They binned sulfurconcentrations for volcanically quiescent periods in intervalsof [0, 1], [1, 1.5], [1.5, 2.5], [2.5, 5], and [5, 7] PVU andfound an average concentration of 15.9 ng m−3 for the firsttwo intervals while concentrations increased linearly up to62 ng m−3 at 7 PVU over the other three intervals. DuringCONCERT concentrations at 2 and 7 PVU were approxi-mately 71 and 238 ng m−3. A linear fit through the average
value of each bin reveals that the slope after the Kasatochieruption is roughly a factor 4 higher than during “clean”periods between 1999 and 2002 (Figure 6). The uncertaintyof the AMS data due to the assumed collection efficiency of0.5 is by far not large enough to explain the different slopesof the data sets.[31] Figure 7 shows a cross section of the observed tro-
popause fold on 28 October at 12 UTC based on ECMWFanalysis. The dashed red line indicates the 2 PVU boundary,the color coded thick solid line represents the particulatesulfate concentrations along the flight track. A distinctincrease in the sulfate aerosol concentration is visible abovethe 2 PVU threshold. The elevated concentrations were firstobserved after the Falcon had reached the dynamic tropo-pause at around 11:15 UTC. For the flight leg between13:12 and 13:40 UTC, slightly below the 2 PVU line, theconcentration decreased to CONCERT‐typical free tropo-spheric values of below 0.2 mg m−3 (STP).[32] The aerosol layer was observed not only by the AMS
during CONCERT campaign but also by the SMART‐Albedometer on board the Falcon aircraft during the flighton 31 October from Shannon, Ireland to Oberpfaffenhofen,Germany. Over the Northeastern Atlantic approximately100 km off the English coast, the aerosol layer was detectedmost clearly. Before and after the aerosol layer encounter,measurements were made in clear air conditions. Smallscattered cumulus clouds discernable by pronounced peaksin the time series of Il
↑ were present all along the flight track.Times during which the highly reflective low‐level cloudswere detected have been removed from the data time series.Spectra of Il
↑ in the wavelength range 350–1000 nm arepresented in Figure 8. Measurements in clear sky conditionsmade at 15:11 UTC during a 15 s time span during which noclouds were beneath the aircraft were averaged and aredisplayed in black. Measurements of Il
↑ within the haze layerobtained at 14:58 UTC are shown in green (see Figure 2(bottom) for indication of sample periods). Data wereaveraged over the 30 s time span during which no cloudscontaminated the signal. Between the two measurements,the solar zenith angle (SZA) changed from 73.4° to 75.9°.
Figure 5. Chronological overview of particulate sulfur to ozone ratio in 2008 in the UT/LS includingdata sets from ARCTAS, POLARCAT, and CONCERT aircraft campaigns and CARIBIC data.
SCHMALE ET AL.: AEROSOL LAYERS OF OKMOK AND KASATOCHI D00L07D00L07
9 of 18

To allow for a comparison of the measured spectra, Il↑
observed at 14:58 UTC were rescaled to SZA = 75.9°.Figure 8 shows that the mean Il
↑ spectra measured in clearsky conditions are higher than the mean spectrum obtained
when the aircraft was flying within the haze layer. However,differences are wavelength dependent. While at 500–600 nm the clear sky Il
↑ is 28% higher than the signalmeasured in the haze layer, it is only 17% higher at 600–
Figure 6. Comparison of particulate sulfur concentrations found by Martinsson et al. [2005] duringvolcanically quiescent periods from 1999 to 2002 with data from 82 to 85 days after the Kasatochieruption. Open circles show all CONCERT data points above 8.2 km altitude; the diamonds are averagesof the these data within PVU bins, which are represented by the vertical solid bars. The error bars denotethe standard deviation within the bin.
Figure 7. Vertical cross section of ECMWF analyzed potential vorticity on 28 October 2008, 12 UTCalong the flight route. The height of the tropopause as estimated from the 2‐PVU isosurface is high-lighted by the dashed red line. The flight profile is color coded with the particulate sulfate concentration(mg m−3 STP). Note the elevated concentrations above the tropopause. The thin black lines show potentialtemperature (K).
SCHMALE ET AL.: AEROSOL LAYERS OF OKMOK AND KASATOCHI D00L07D00L07
10 of 18

800 nm which can be attributed to the scattering propertiesof the aerosol layer. The aircraft flew approximately 1.7 kmabove the tropopause when this radiance spectrum wasobtained. From Figure 3 we can conclude that the aerosollayer resided on average about 0.5 km above the dynamicaltropopause. Thus, the vertical extension of the aerosol layerbelow the aircraft was roughly 1.2 km.[33] A 5 K temperature increase within the haze layer was
measured. However, based on the available data set it is notpossible to attribute this warming solely to absorption by theaerosol. Information about the aerosol scattering properties(volume extinction coefficient or aerosol optical thickness,
single‐scattering albedo, and asymmetry parameter) wouldbe required to simulate up‐welling and downwelling irra-diances above and below the aerosol layer which in turnwould be needed to calculate local solar heating rates[Wendisch et al., 2008].[34] From AMS measurements it is known that 71% of the
aerosol was composed of particulate sulfate, a weaklyabsorbing component, and 21% of carbonaceous material(see section 3.2). However, possible refractory absorbingcomponents were not measured. Heating rates of approxi-mately 7 K/d have been observed before by Wendisch et al.[2008]. However, that study was based on measurements ofaerosol layers with a significant amount of soot with aparticle single‐scattering albedo of 0.85. Due to the lack ofinformation on absorbing material we cannot determinewhether local absorption of solar radiation contributes partlyto the observed temperature increase which is mainly causedby thermodynamic effects due to the tropopause folding.[35] Several EARLINET lidar stations observed the
haze layer. In Figure 9 data from two German stations,Kühlungsborn and Leipzig, together with two AMS sulfateparticle concentration vertical profiles are shown. Twenty‐three days after the eruption, a layer around 18 km wasobserved. In the period from 34 to 78 days later, a layer wasfound at lower altitudes with a peak at 12 km by both lidarstations as highlighted by the shaded area. The data at day78 show an average of about 30 min for altitudes between11 and 13 km, while above data are averaged over all nightfor the Kühlungsborn lidar. The Leipzig lidar suggests also asecond layer at higher altitudes around 17 km which wasalso observed on previous days at both stations. TheCONCERT aircraft measurements on day 82 show that thelayer had descended to 10 km and by day 85 to 8 km. Based
Figure 9. Time series of lidar and AMS aerosol vertical profiles after the Mount Kasatochi eruption.Signal intensity represents the backscatter coefficient (Mm−1 sr−1) for lidar data and mass concentration(mg m−3) for AMS data on linear axes. The shaded area highlights the observed volcanic aerosol layer inthe UT/LS.
Figure 8. Mean spectral upwelling radiances Il↑ in clear‐
sky and volcanic haze layer conditions. The shaded areascorrespond to the measurement and calibration uncertainties.
SCHMALE ET AL.: AEROSOL LAYERS OF OKMOK AND KASATOCHI D00L07D00L07
11 of 18
on particle sedimentation alone such vertical distances canbe covered in the given time frame only by particles withsize diameters above 3 mm according to settling velocitycalculations after Hinds [1999]. Typically, particles thislarge are not encountered in the stratosphere as data fromafter the Mount Pinatubo eruption show where the largestsizes were around 1 mm. Meteorological data like potentialvorticity as well as O3 and CO measurements suggest thatthis subsidence was caused by a tropopause fold. The lastprofile shows the layer again at 12 km with a second onemore pronounced around 15 km.[36] The encountered aerosol layer had a vertical thick-
ness of about 2 km (see Figure 3 and Figure 9). The hori-zontal extension can only be estimated roughly: The almostcontinuous observations of the layer by the two lidar stationssuggest that the layer was distributed equally around theglobe in the northern hemisphere. If we assume a south‐north extension of about 45°N to 75°N, this corresponds to avolume of about 1.32 × 10⁸ km3. With the measured averageparticulate sulfate concentration of 0.8 mg m−3 (STP) and amolar fraction of 80% sulfate in total sulfur, we can estimatethat the total sulfur content of the layer is 0.01 Tg S. Theamount of sulfur deposited by Mount Kasatochi and Mount
Okmok in the stratosphere was estimated to be 0.8 Mt(1.6 Mt SO2); thus, this estimate suggests that about 1% ofthe total sulfur that was deposited by the two volcanoes in thestratosphere is confined in the observed aerosol layer in thelower stratosphere. Although this estimation is very roughand can easily be wrong by a factor of two or more, it showsthat the layer contained only a small fraction of the totalsulfur from the two volcanoes. The second aerosol layerobserved by the lidar stations at about 16–18 km (Figure 9)may contain about the same amount of sulfur. This impliesthat either a large fraction has already been removed bystratosphere to troposphere air mass exchange, i.e., tropo-pause folding and quasi‐horizontal transport, followed bywet deposition in the upper troposphere, or that a significantfraction of volcanic aerosol in the stratosphere cannot bedetected and goes unnoticed by remote sensing and in situobservations.
3.2. Aerosol Characteristics
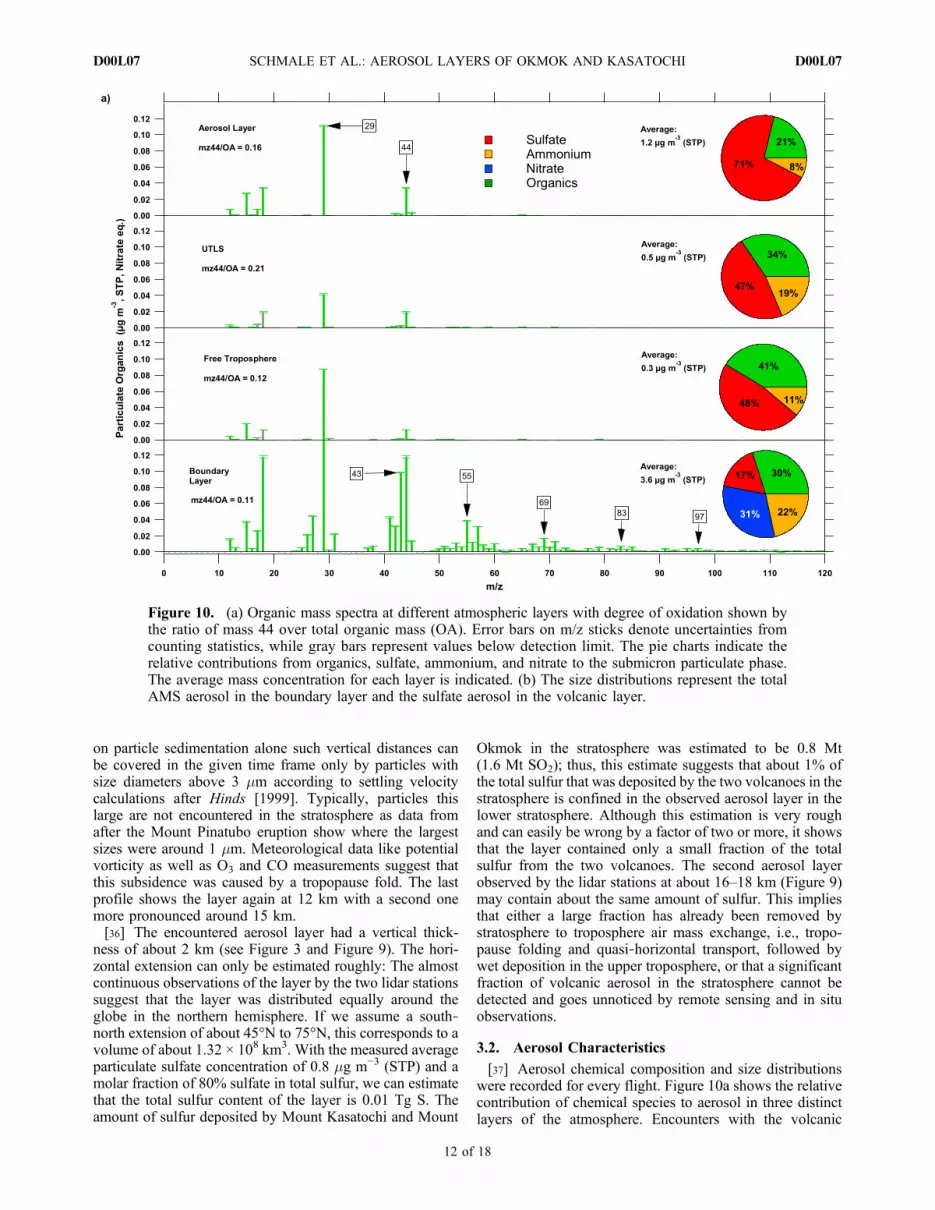
[37] Aerosol chemical composition and size distributionswere recorded for every flight. Figure 10a shows the relativecontribution of chemical species to aerosol in three distinctlayers of the atmosphere. Encounters with the volcanic
Figure 10. (a) Organic mass spectra at different atmospheric layers with degree of oxidation shown bythe ratio of mass 44 over total organic mass (OA). Error bars on m/z sticks denote uncertainties fromcounting statistics, while gray bars represent values below detection limit. The pie charts indicate therelative contributions from organics, sulfate, ammonium, and nitrate to the submicron particulate phase.The average mass concentration for each layer is indicated. (b) The size distributions represent the totalAMS aerosol in the boundary layer and the sulfate aerosol in the volcanic layer.
SCHMALE ET AL.: AEROSOL LAYERS OF OKMOK AND KASATOCHI D00L07D00L07
12 of 18

aerosol layer within the UT/LS region are shown separatelyfrom the background values (first panel versus second panelin Figure 10a). In the boundary layer, the average massconcentration of submicron aerosol is 3.6 mg m−3 (STP) withthe strongest contributions from nitrate, organics, andammonium. This aerosol type is rather alkaline with anacidity coefficient larger than one (defined as the molarequivalence ratio (ER) of measured ammonium and the sumof measured sulfate and nitrate, all in mmol m−3, see Quinnet al. [2006]). Alkaline boundary layer aerosol has beenobserved on other occasions, as well [Martin et al., 2008].In the free troposphere the composition changes, almost50% mass contribution from particulate sulfate makes theaerosol more acidic than in the boundary layer, and nonitrate is found. Furthermore, the average concentrationdecreases by a factor of 12 to 0.3 mg m−3. The UT/LS regionis very similar in aerosol mass and composition to the freetroposphere. However, during volcanic aerosol encountersboth characteristics change. Relative mass contributions are71%, 8% and 21%, sulfate, ammonium and organics,respectively. This results in an acidity coefficient of 0.29. Theaverage mass concentration within the encountered layerwas 1.2 mg m−3 (STP), a third of the boundary layer massconcentration.[38] Additional information is obtained from the organic
mass spectra that are displayed in Figure 10a. The error barsdenote uncertainties from counting statistics and gray barsrepresent values below detection limit. Near the surface, themass spectrum shows the typical sequence of uneven m/z,as pointed out in Figure 10a (fourth panel), representinghydrocarbon‐like organic aerosol (HOA) [Zhang et al., 2005]that is observed in fossil fuel combustion [Schneider et al.,2006b]. This signature might come from the emissions ofthe Falcon’s engines in addition to regular road trafficemissions from nearby sources. Furthermore, oxygenatedorganic aerosol (OOA) is present indicated by a high m/z44 (CO2
+) peak [Zhang et al., 2005]. The m/z 44 over totalorganics (OA) ratio as indicator of oxygenation is 0.11 ±0.002. The error denotes the 95% confidence interval ofthe linear regression fit of m/z 44 versus OA. Applying thelinear regression equation for elemental O/C ratio versusm/z 44 over OA as suggested by Aiken et al. [2008], theequivalent elemental ratio would be 0.50 ± 0.025. Suchorganic aerosol mass spectra have been identified as urbanoxygenated organic aerosol [Alfarra et al., 2004; Zhang et al.,
2005]. At higher altitudes the organic aerosol is found to beoxygenated to a much higher degree. The m/z 44/OA ratioincreases from 0.16 ± 0.003 (0.69 ± 0.022, equivalent O/C)in the free troposphere to 0.21 ± 0.004 (0.88 ± 0.019,equivalent O/C) in the upper troposphere and lower strato-sphere, where m/z 29 makes up 45%, and m/z 44 contributes21% to the total organic mass. Although the contribution ofm/z 29 is higher than observed in other data, such organicmass spectra can be identified with the type “OOA‐1” [Lanzet al., 2007; Ulbrich et al., 2009] or “LV‐OOA” (low‐volatile OOA) [Jimenez et al., 2009] and similar massspectra have been observed in the free troposphere before[Hock et al., 2008]. In the volcanic aerosol layer, the ratio isslightly lower with 0.16 ± 0.003 (0.69 ± 0.021, equivalentO/C).[39] In Figure 11 a schematic vertical profile of organic
and sulfate aerosol concentrations is shown distinguishingbetween loadings in the free troposphere, background UT/LSand volcanic layer. The absolute concentration of organicmaterial in the volcanic layer was found to be a factor 1.4times higher than in the background UT/LS, namely 0.25 ±0.12 versus 0.18 ± 0.11 mg m−3, respectively. Compared tothe free troposphere, an enhancement factor of 1.9 in masswas observed. Even though the increase in organic aerosolmass is not significant within the one standard deviationboundaries, the trend is clearly visible from Figure 11. It is
Figure 10. (continued)
Figure 11. Average concentration of particulate organicsand sulfate including one standard deviation.
SCHMALE ET AL.: AEROSOL LAYERS OF OKMOK AND KASATOCHI D00L07D00L07
13 of 18

possible that the AMS collection efficiency increased duringplume encounters due to the dominant presence of sulfuricacid [Quinn et al., 2006] and that therefore the increase inmass of organic compounds might not be real. However, thegeneral composition of UT/LS aerosol within and outside ofvolcanic plumes does not change much with respect to itscomposition of mainly particulate sulfate and organics.Thus, a significant change in the CE is not expected.Overall, the quantification of organic material in the volcanicplume is subject to uncertainties so that we cannot statewhether there is a true increase in organics. Nevertheless,these findings suggest that the volcanic aerosol containedalso carbonaceous material, a finding that has also beenreported by Martinsson et al. [2009].[40] It is unclear whether the apparent increase in carbo-
naceous mass might reflect injection of volcanic species orinjection of tropospheric species which experienced entrain-ment into the eruption column and thereafter participated inrapid injection into the LS. It is unlikely that the excessorganic aerosol is due to entrainment of ambient strato-spheric organic aerosol particles in the volcanic plume,because the organic aerosol mass concentration in the plumeis slightly higher than in the background. However, it isconceivable that semivolatile and low‐volatile organiccompounds of tropospheric origin have contributed to theformation and growth of the particles in the lower strato-sphere. Similarly Ekman et al. [2008] found for tropicalupper tropospheric aerosol in new particle formation eventsthat organics seem to play a role besides sulfate in the for-mation and growth of small particles. This also has implica-tions on the efficiency of heterogeneous reaction rates whichcan occur in/on volcanic aerosols because usually for thecorresponding calculations reactive uptake coefficients areadopted assuming the volcanic particles to consist of purebinary sulfuric acid solution droplets [Borrmann et al., 1997;Fahey et al., 1993; Keim et al., 1996]. The observed pres-ence of a significant organic component of about 20% maysubstantially influence the reactive uptake.
3.3. Size Distributions
[41] Figure 10b shows mass size distributions recorded inthe boundary layer and in the volcanic aerosol layer. Theboundary layer data were obtained shortly before landing on28 October and 2 November and shortly after takeoff on29 October. Figure 10b (left) shows the average distributionfor the sum of all chemical components. The size distribu-tion is bimodal: The smaller mode has a mode diameter ofabout 220 nm dva and the second mode has a mode diameterof about 400 nm. The resolution is 25 bins between 50 and800 nm dva. The vacuum aerodynamic diameter can beconverted into mobility diameter (dmob) after DeCarlo et al.[2004] by dividing dva by the density of the aerosol and itsshape factor. Assuming spherical shape and a density of1.7 g cm−3 for the inorganic fraction and 1 g cm−3 for theorganic fraction, the mode diameters correspond to 150 and260 nm dmob. For the free troposphere and UT/LS regionno size distribution could be obtained due to the lowmass concentrations. In the volcanic aerosol layer, the masssize distribution is dominated by particulate sulfate (seeFigure 10b, right). The mass size distribution has a modediameter at approximately 360 nm dva and a geometric
standard deviation of 1.4. According to Wilson et al. [1993]the volumetric size distribution of stratospheric aerosol78 days after the Pinatubo eruption showed a mode diameterbetween 300 and 400 nm dmob measured by a focused cavityaerosol spectrometer [Jonsson et al., 1995]) for submicronaerosol. Converting our findings into dmob by dividing360 nm dva by the density of sulfuric acid (1.84 g cm3) andassuming spherical particle shape a mode diameter ofapproximately 200 nm dmob is obtained. The fact that theKasatochi aerosol seems to be smaller after a very similarperiod after the eruption (85 days compared to 78 days)may reflect the larger amount of sulfur dioxide injected intothe stratosphere by Mount Pinatubo compared to MountKasatochi (20 Mt compared to 1.4 Mt), leading to higherparticle formation and growth rates after the Pinatuboeruption. As mentioned above, the conversion of SO2 tosulfate aerosol is almost complete (about 80%) after 85 days,see Jurkat et al. [2010].
4. Summary and Conclusion
[42] During the CONCERT campaign conducted between27 October and 2 November 2008, high concentrations witha maximum of about 2.0 mg m−3 (STP) of submicron par-ticulate sulfate were observed over the North Sea and NorthAtlantic Flight corridor. Relating these findings to variousdefinitions (PV, O3, CO‐O3) for the location of the tropo-pause we found that this aerosol layer was situated in thelower stratosphere, directly above the tropopause. Possiblesources of the observed aerosol layer such as air traffic, OCSconversion, and vertical convective transport were ruled out.Thus, the most likely explanation is that the observed aerosollayer originated from the eruptions of Mount Okmok andMount Kasatochi that erupted on 12 July and 7 August 2008,respectively, and transferred together more than 1.6 Tg SO2
into the stratosphere. Data records from two German lidarstations at Kühlungsborn and Leipzig support the conclu-sion that volcanic aerosol has been observed since theydetected lower stratospheric aerosol layers from shortly afterthe eruption to after the CONCERT campaign. According tometeorological data, potential vorticity and trace gases, theparticulate sulfate layer was observed during CONCERTwithin a tropopause fold which explains its descent toapproximately 8 km without entering the troposphere asmeasured on 31 October. Parallel measurement of sulfurdioxide aboard the Falcon showed that approximately 80%of gaseous sulfur had been converted into sulfate aerosol85 days after the Mount Kasatochi eruption [Jurkat et al.,2010]. The volcanic aerosol was found to be composed of71% sulfate, 21% highly oxygenated organic matter and 8%ammonium. These measurements represent to our knowledgethe first detection of stratospheric volcanic aerosol by anaerosol mass spectrometer. The origin of the carbonaceouscomponents in the volcanic aerosol that were also reportedby Martinsson et al. [2009] remains an open question. It isconceivable that the volcanic eruption column injected airfrom the troposphere that contained also organic precursorgases that contributed to the formation and growth of theobserved particles. Due to the lack of comparable data fromprevious volcanic eruptions, this question remains unan-swered, but the finding that volcanic aerosol contains also
SCHMALE ET AL.: AEROSOL LAYERS OF OKMOK AND KASATOCHI D00L07D00L07
14 of 18

organic material might have important implications forheterogeneous reactions on volcanic stratospheric aerosol.
Appendix A: Pressure Controlled Inlet SystemCharacterization
[43] The employed PCIs were built according to thedesign described by Bahreini et al. [2008]. The purpose of aPCI is to facilitate stable conditions in front of the AMSinlet lens to assure the operation of the aerodynamic lensunder constant pressure. Pressure changes in front of theinstrument’s inlet lead to changes in the lens transmissionfunction and to different acceleration velocities in theaerodynamic lens and thus to variability in particle sizingand transmission efficiency. Therefore, an intermediateregion, consisting of a 210 mm long 9.5 mm ID stainlesssteel tube, located between the critical orifice at the aero-dynamic lens entrance and another one upstream of it is keptat a constant pressure so that the mass flow remains con-stant, as well. This is realized by a PID controlled valvewhich is coupled via a feedback loop to a pressure sensorreporting the AMS lens pressure (PLens). If PLens exceeds thetarget value at lower altitudes the valve allows more air to bewithdrawn from the intermediate region. If PLens dropsbelow the target value at higher altitudes, the valve reducesthe throughput and the intermediate pressure (PPCI) stabi-lizes again. Before the excess air is withdrawn symmetri-cally from both sides of the half inch tube, a 1.9 mm ID tubeof 750 mm length connected directly to the AMS lens inletsamples the aerosol at a distance of 105 mm from theupstream orifice. For a schematic drawing of a PCI seeBahreini et al. [2008]. During the POLARCAT campaignthis PCI design was modified by introducing a sampling lineto a CPC (TSI 3010) in the intermediate chamber after thewithdrawal of AMS sampling air, so that the flow into thePCI was 1.74 l/min.[44] PPCI was aimed to be kept at half the lowest expected
ambient pressure for a maximum flight altitude of 12 km. Tomeet the requirements of a PCI operating between pressuresof approximately 950 and 200 hPa the combination ofcritical orifices was adapted various times during theCONCERT campaign. Table A1 shows the respectiveintermediate pressures, lens pressures and size cutoffs for
both campaigns. The cutoffs were derived by introducingPSL (polystyrene latex spheres) of defined size through thePCI into the AMS. The signal for m/z 104 (mass to chargeratio), dominant for PSL, was plotted against time of flightin the vacuum chamber. When no signal could be observedthe cutoff was assumed to be between the current and big-gest particle size giving a signal. Generally, the PCI alloweddetection for particles between 84 and 735 nm dva; however,very low ambient pressure forced the cutoff partially downto approximately 400 nm dva. This is most likely caused bya combination of two effects: First, lower lens pressure leadsto less acceleration within the particle time‐of‐flight regionin the vacuum chamber, and thus, the flight time exceeds thethreshold of the electronic acquisition settings. Second,lower lens pressures allow bigger particles not to follow thegas streamlines so that they strike the inner surfaces of thelens. The pressure regime where PPCI was kept constant bythe regulation is termed “core Pamb.” For ambient pressuresoutside of the core Pamb regime, PPCI is a function of Pamb.These pressure regions are termed “high Pamb” and “lowPamb.” Size calibrations for each PCI were performed atdifferent PLens. Thus, size distributions could be determinedfor all flight altitudes and lens pressures.[45] For correct quantification of particle mass, the
transmission efficiency of the PCI was determined in labo-ratory experiments. For particles larger than 400 nm dva(PSL) the transmission efficiency was determined by particlecounting using the integrated light scattering probe (LSP)[Cross et al., 2007], for particles smaller than 400 nm dva(NH4NO3, ammonium nitrate particles) the transmissionwas measured by the mass method as described by Liu et al.[2007]. The experiments were conducted for the standardAMS inlet and the four versions of the PCI coupled to thestandard inlet. Both methods include both PCI and aerody-namic lens transmission. The results are shown in Figure 1.[46] For the three PCIs with the second critical orifice
greater than 160 mm (PCI 1 to 3) the transmission efficiencyis the same as for the standard inlet within the calculatederror range. For LSP measurements, the error represents thestandard deviation of 1 min averaged CPC counts over LSPcounts for the total number of collected data points(between 15 and 20). For mass method measurements, the
Table A1. PCI Specifications for the CONCERT and POLARCAT Campaigna
CONCERT POLARCAT
PCI 1 PCI 2 PCI 3 PCI POLARCAT
Orifice 1 and 2 (mm) 380, 200 400, 200 380, 250 400, 160Operated on 27 Oct 2008 28 Oct 2008 29 Oct 2008 31 Oct 2008 1 Nov 2008 30 June to 14 July 2008High Pamb (hPa) >800 >600 >600PPCI function PPCI = 0.22*Pamb + 2.76 PPCI = 0.36*Pamb − 35.7 PPCI = 0.29*Pamb − 73.2PLens (hPa) 2.4–2.2 2.9–2.3 2.9–2.3Upper cutoff dva (nm) 735 735 735Core Pamb (hPa) 800–295 600–200 600–180 1000–350PPCI function PPCI = 190 PPCI = 188 PPCI = 110 PPCI = 387PLens (hPa) 2.2 2.2 2.2 2.2Upper cutoff dva (nm) 800 800 800 800Low Pamb (hPa) <295 <200 <180 <350PPCI function PPCI = 0.33*Pamb + 96.5 PPCI = 0.58*Pamb + 69.5 PPCI = 0.27*Pamb + 61.8 PPCI = 0.89*Pamb + 53.5PLens (hPa) <2.2 <2.2 <2.2 <2.2Upper cutoff dva (nm) 420 420 800 800
aPamb is ambient pressure; PPCI is pressure in the intermediate region; PLens is pressure in AMS lens. Core Pamb denotes ambient pressures when PPCI isconstant; high Pamb and low Pamb refer to ambient pressures that are too high or too low to keep PPCI constant; PPCI thus becomes a function of Pamb.
SCHMALE ET AL.: AEROSOL LAYERS OF OKMOK AND KASATOCHI D00L07D00L07
15 of 18

error accounts for variations in the charge probability of themonodisperse aerosol and the counting statistics for deter-mination of AMS nitrate mass. Generally, transmissionbetween 200 and 400 nm dva particles for the PCI used inPOLARCAT and between 200 and 600 nm for all otherinlets is close to 100%. Thus, the respective data of theCONCERT campaign have not been corrected for differ-ences in inlet transmission. The POLARCAT inlet showslower transmission for particle sizes smaller than 200 nm dvaand larger than 400 nm resulting in an overall inlet trans-mission of approximately 54% compared to the standardinlet. Mass concentrations from POLARCAT have beencorrected accordingly. Generally, PCIs with a larger secondorifice have higher transmission for small and large particlesand are similar to the standard inlet.
[47] Acknowledgments. We acknowledge funding by the GermanResearch Foundation (DFG) through the SPP 1294, by the “ExzellenzclusterGeocycles,” and by the Max Planck Society. We also thank the AEROTROPjunior research group for organizing the CONCERT campaign and theFalcon crew for assistance during measurements. The Falcon flights werefunded by the DLR project CATS. POLARCAT‐France gratefullyacknowledges funding from the following French research agencies:ANR, CNES, CNRS‐INSU, IPEV, and EUFAR, and we thank the ATR‐42crew for their support. Heike Eichler was funded under the CollaborativeResearch Center 641: TROPICE “The Tropospheric Ice Phase.” We alsowould like to thank the ARCTAS team, especially Michael Cubison andJose Jimenez (CU Boulder) for providing their data. The EARLINET‐ASOS project is funded by the European Commission (EC) under grantRICA‐025991. The authors gratefully acknowledge the NOAA AirResources Laboratory (ARL) for the provision of the HYSPLIT transportand dispersion model and READY Web site (http://www.arl.noaa.gov/ready.html) used in this publication. We also thank Michael Cubison forsharing AMS fast mode analysis routines. Many thanks go also to FriederikeFreutel for helping with the LSP data analysis and to Marco Brands for hisgreat support during the POLARCAT campaign.
ReferencesAiken, A. C., et al. (2008), O/C and OM/OC ratios of primary, secondary,and ambient organic aerosols with high‐resolution time‐of‐flight aerosolmass spectrometry, Environ. Sci. Technol., 42(12), 4478–4485,doi:10.1021/es703009q.
Alfarra, M. R., et al. (2004), Characterization of urban and rural organicparticulate in the lower Fraser valley using two Aerodyne aerosolmass spectrometers, Atmos. Environ., 38(34), 5745–5758, doi:10.1016/j.atmosenv.2004.01.054.
Allan, J. D., J. L. Jimenez, P. I. Williams, M. R. Alfarra, K. N. Bower, J. T.Jayne, H. Coe, and D. R. Worsnop (2003), Quantitative sampling usingan Aerodyne aerosol mass spectrometer: 1. Techniques of data interpre-tation and error analysis, J. Geophys. Res., 108(D3), 4090, doi:10.1029/2002JD002358.
Allan, J. D., et al. (2004a), Submicron aerosol composition at TrinidadHead, California, during ITCT 2K2: Its relationship with gas phase volatileorganic carbon and assessment of instrument performance, J. Geophys.Res., 109, D23S24, doi:10.1029/2003JD004208.
Allan, J. D., et al. (2004b), A generalised method for the extraction ofchemically resolved mass spectra from Aerodyne aerosol mass spectrom-eter data, J. Aerosol Sci., 35(7), 909–922, doi:10.1016/j.jaerosci.2004.02.007.
Ancellet, G., J. Leclair deBellevue, C.Mari, P.Nedelec, A.Kukui, A.Borbon,and P. Perros (2009), Effects of regional‐scale and convective transportson tropospheric ozone chemistry revealed by aircraft observation duringthe wet season of the AMMA campaign, Atmos. Chem. Phys., 9, 383–411, doi:10.5194/acp-9-383-2009.
Arnold, F., T. Buhrke, and S. Qiu (1990), Evidence for stratospheric ozone‐depleting heterogeneous chemistry on volcanic aerosols from El‐Chichon,Nature, 348(6296), 49–50, doi:10.1038/348049a0.
Arnold, F., J. Curtius, S. Spreng, and T. Deshler (1998), Stratospheric aerosolsulfuric acid: First direct in situ measurements using a novel balloon‐basedmass spectrometer apparatus, J. Atmos. Chem., 30(1), 3–10, doi:10.1023/A:1006067511568.
Bahreini, R., J. L. Jimenez, J. Wang, R. C. Flagan, J. H. Seinfeld, J. T.Jayne, and D. R. Worsnop (2003), Aircraft‐based aerosol size and com-
position measurements during ACE‐Asia using an Aerodyne aerosolmass spectrometer, J. Geophys. Res., 108(D23), 8645, doi:10.1029/2002JD003226.
Bahreini, R., E. J. Dunlea, B. M. Matthew, C. Simons, K. S. Docherty, P. F.DeCarlo, J. L. Jimenez, C. A. Brock, and A. M. Middlebrook (2008),Design and operation of a pressure‐controlled inlet for airborne samplingwith an aerodynamic aerosol lens, Aerosol Sci. Technol., 42, 465–471,doi:10.1080/02786820802178514.
Borrmann, S., J. E. Dye, D. Baumgardner, J. C. Wilson, H. H. Jonsson,C. A. Brock, M. Loewenstein, J. R. Podolske, G. V. Ferry, and K. S. Barr(1993), In‐situ measurements of changes in stratospheric aerosol and theN2O‐aerosol relationship inside and outside of the polar vortex, Geophys.Res. Lett., 20(22), 2559–2562, doi:10.1029/93GL01694.
Borrmann, S., et al. (1995), Aerosols as dynamical tracers in the lowerstratosphere: Ozone versus aerosol correlation after the Mount Pinatuboeruption, J. Geophys. Res., 100(D6), 11,147–11,156, doi:10.1029/95JD00016.
Borrmann, S., S. Solomon, J. E. Dye, and B. P. Luo (1996), The potentialof cirrus clouds for heterogeneous chlorine activation, Geophys. Res.Lett., 23(16), 2133–2136, doi:10.1029/96GL01957.
Borrmann, S., S. Solomon, J. E. Dye, D. Baumgardner, K. K. Kelly, andK. R. Chan (1997), Heterogeneous reactions on stratospheric backgroundaerosols, volcanic sulfuric acid droplets, and type I polar stratosphericclouds: Effects of temperature fluctuations and differences in particlephase, J. Geophys. Res., 102(D3), 3639–3648, doi:10.1029/96JD02976.
Borrmann, S., et al. (2010), Aerosols in the tropical und subtropical UT/LS:In‐situ measurements of ultrafine particle abundance and volatility, Atmos.Chem. Phys., 10, 5573–5592, doi:10.5194/acp-10-5573-2010.
Brenguier, J.‐L., L. Gomes, T. Bourrianne, R. Caillou, A. Gribkoff,P. Nacass, P. Laj, P. Villani, and D. Piccard (2008), Community aerosolinlet, paper presented at Workshop on Aircraft Instrumentation,Aerial Vehicles Program, Atmos. Radiat. Measure. Program, Urbana‐Champaign, Ill.
Brough, N., et al. (2003), Intercomparison of aircraft instruments on boardthe C‐130 and Falcon 20 over southern Germany during EXPORT 2000,Atmos. Chem. Phys., 3, 2127–2138, doi:10.5194/acp-3-2127-2003.
Canagaratna, M. R., et al. (2007), Chemical and microphysical character-ization of ambient aerosols with the Aerodyne aerosol mass spectrometer,Mass Spectrom. Rev., 26(2), 185–222, doi:10.1002/mas.20115.
Carn, S. A., N. A. Krotkov, V. Fioletov, K. Yang, A. J. Krueger, andD. Tarasick (2008), Emission, transport and validation of sulfur dioxidein the 2008 Okmok and Kasatochi eruption clouds, Eos Trans. AGU,89(53), Fall Meet. Suppl., Abstract A51J‐07.
Crosier, J., J. D. Allan, H. Coe, K. N. Bower, P. Formenti, and P. I. Williams(2007), Chemical composition of summertime aerosol in the Po Valley(Italy), northern Adriatic and Black Sea, Q. J. R. Meteorol. Soc., 133,61–75, doi:10.1002/qj.88.
Cross, E. S., J. G. Slowik, P. Davidovits, J. D. Allan, D. R. Worsnop, J. T.Jayne, D. K. Lewis, M. Canagaratna, and T. B. Onasch (2007), Labora-tory and ambient particle density determinations using light scattering inconjunction with aerosol mass spectrometry, Aerosol Sci. Technol., 41,343–359, doi:10.1080/02786820701199736.
DeCarlo, P. F., J. G. Slowik, D. R.Worsnop, P. Davidovits, and J. L. Jimenez(2004), Particle morphology and density characterization by combinedmobility and aerodynamic diameter measurements. Part 1: Theory,Aerosol Sci. Technol., 38, 1185–1205, doi:10.1080/027868290903907.
DeCarlo, P. F., et al. (2008), Fast airborne aerosol size and chemistry mea-surements above Mexico City and Central Mexico during the MILAGROcampaign, Atmos. Chem. Phys., 8, 4027–4048, doi:10.5194/acp-8-4027-2008.
Deshler, T. (2008), A review of global stratospheric aerosol: Measure-ments, importance, life cycle, and local stratospheric aerosol, Atmos.Res., 90(2–4), 223–232, doi:10.1016/j.atmosres.2008.03.016.
Draxler, R. R., and G. D. Rolph (2003), HYSPLIT—Hybrid Single‐ParticleLagrangian Integrated Trajectory Model, NOAA Air Resour. Lab., SilverSpring, Md. (Available at, http://www.arl.noaa.gov/ready/hysplit4.html)
Drewnick, F., J. J. Schwab, J. T. Jayne, M. Canagaratna, D. R. Worsnop,and K. L. Demerjian (2004), Measurement of ambient aerosol composi-tion during the PMTACS‐NY 2001 using an aerosol mass spectrometer.Part I: Mass concentrations, Aerosol Sci. Technol., 38, 92–103,doi:10.1080/02786820390229507.
Drewnick, F., et al. (2005), A new time‐of‐flight aerosol mass spectrometer(TOF‐AMS)—Instrument description and first field deployment, AerosolSci. Technol., 39, 637–658, doi:10.1080/02786820500182040.
Drewnick, F., S. S. Hings, M. R. Alfarra, A. S. H. Prevot, and S. Borrmann(2009), Aerosol quantification with the Aerodyne aerosol mass spectrom-eter: Detection limits and ionizer background effects, Atmos. Meas.Tech., 2, 33–46, doi:10.5194/amt-2-33-2009.
SCHMALE ET AL.: AEROSOL LAYERS OF OKMOK AND KASATOCHI D00L07D00L07
16 of 18

Dunlea, E. J., et al. (2009), Evolution of Asian aerosols during transpacifictransport in INTEX‐B, Atmos. Chem. Phys., 9, 7257–7287, doi:10.5194/acp-9-7257-2009.
Ehrlich, A., E. Bierwirth, M. Wendisch, J. F. Gayet, G. Mioche, A. Lampert,and J. Heintzenberg (2008), Cloud phase identification of Arctic bound-ary‐layer clouds from airborne spectral reflection measurements: Test ofthree approaches, Atmos. Chem. Phys., 8, 7493–7505, doi:10.5194/acp-8-7493-2008.
Eichler, H., A. Ehrlich, M. Wendisch, G. Mioche, J. F. Gayet, M. Wirth,C. Emde, and A. Minikin (2009), Influence of ice crystal shape onretrieval of cirrus optical thickness and effective radius: A case study,J. Geophys. Res., 114, D19203, doi:10.1029/2009JD012215.
Ekman, A. M. L., R. Krejci, A. Engstrom, J. Strom, M. de Reus, J. Williams,and M. O. Andreae (2008), Do organics contribute to small particle for-mation in the Amazonian upper troposphere?, Geophys. Res. Lett., 35,L17810, doi:10.1029/2008GL034970.
Fahey, D. W., et al. (1993), In situ measurements constraining the role ofsulfate aerosols in mid‐latitude ozone depletion, Nature, 363(6429), 509–514, doi:10.1038/363509a0.
Fiebig,M. (2001), The tropospheric aerosol at mid‐latitudes—Microphysics,optics, and climate forcing illustrated by the LACE 98 field study (inGerman), Ph.D. thesis, Univ. of Munich, Munich, Germany.
Fiedler, V., et al. (2005), The contribution of sulphuric acid to atmosphericparticle formation and growth: A comparison between boundary layers innorthern and central Europe, Atmos. Chem. Phys., 5, 1773–1785,doi:10.5194/acp-5-1773-2005.
Fiedler, V., R. Nau, S. Ludmann, F. Arnold, H. Schlager, and A. Stohl(2009), East Asian SO2 pollution over Europe—Part 1: Airborne tracegas measurements and source identification by particle dispersion modelsimulations, Atmos. Chem. Phys., 9, 4717–4728, doi:10.5194/acp-9-4717-2009.
Fischer, H., F. G. Wienhold, P. Hoor, O. Bujok, C. Schiller, P. Siegmund,M. Ambaum, H. A. Scheeren, and J. Lelieveld (2000), Tracer correla-tions in the northern high latitude lowermost stratosphere: Influence ofcross‐tropopause mass exchange, Geophys. Res. Lett., 27(1), 97–100,doi:10.1029/1999GL010879.
Froyd, K. D., D.M.Murphy, P. Lawson, D. Baumgardner, and R. L. Herman(2009a), Composition of cirrus‐forming aerosols at the tropical tropo-pause, Atmos. Chem. Phys. Discuss., 9, 20,347–20,369, doi:10.5194/acpd-9-20347-2009.
Froyd, K. D., D. M. Murphy, T. J. Sanford, D. S. Thomson, J. C. Wilson,L. Pfister, and L. Lait (2009b), Aerosol composition of the tropical uppertroposphere, Atmos. Chem. Phys., 9, 4363–4385, doi:10.5194/acp-9-4363-2009.
Griffiths, P. T., C. L. Badger, R. A. Cox, M. Folkers, H. H. Henk, and T. F.Mentel (2009), Reactive uptake of N2O5 by aerosols containing dicar-boxylic acids. Effect of particle phase, composition, and nitrate content,J. Phys. Chem. A, 113(17), 5082–5090, doi:10.1021/jp8096814.
Hinds, C. (1999), Aerosol Technology: Properties, Behavior, and Measure-ment of Airborne Particles, John Wiley, New York.
Hings, S. S., S. Walter, J. Schneider, S. Borrmann, and F. Drewnick (2007),Comparison of a quadrupole and a time‐of‐flight aerosol mass spectrom-eter during the Feldberg Aerosol Characterization Experiment 2004,Aerosol Sci. Technol., 41, 679–691, doi:10.1080/02786820701408483.
Hock, N., J. Schneider, S. Borrmann, A. Rompp, G. Moortgat, T. Franze,C. Schauer, U. Poschl, C. Plass‐Dulmer, and H. Berresheim (2008),Rural continental aerosol properties and processes observed during theHohenpeissenberg Aerosol Characterization Experiment (HAZE2002),Atmos. Chem. Phys., 8, 603–623, doi:10.5194/acp-8-603-2008.
Holton, J. R., P. H. Haynes, M. E. McIntyre, A. R. Douglass, R. B. Rood,and L. Pfister (1995), Stratosphere‐troposphere exchange, Rev. Geophys.,33(4), 403–439, doi:10.1029/95RG02097.
Huffman, J. A., J. T. Jayne, F. Drewnick, A. C. Aiken, T. Onasch, D. R.Worsnop, and J. L. Jimenez (2005), Design, modeling, optimization,and experimental tests of a particle beam width probe for the Aerodyneaerosol mass spectrometer, Aerosol Sci. Technol., 39, 1143–1163,doi:10.1080/02786820500423782.
Hunton, D. E., et al. (2005), In‐situ aircraft observations of the 2000Mt. Hekla volcanic cloud: Composition and chemical evolution in thearctic lower stratosphere, J. Volcanol. Geotherm. Res., 145(1–2), 23–34,doi:10.1016/j.jvolgeores.2005.01.005.
Jimenez, J. L., et al. (2009), Evolution of organic aerosols in the atmo-sphere, Science, 326(5959), 1525–1529, doi:10.1126/science.1180353.
Jonsson, H. H., et al. (1995), Performance of a focused cavity aerosol spec-trometer for measurements in the stratosphere of particle‐size in the0.06–2.0‐mm‐diameter range, J. Atmos. Oceanic Technol., 12(1), 115–129, doi:10.1175/1520-0426(1995)012<0115:POAFCA>2.0.CO;2.
Jurkat, T., C. Voigt, F. Arnold, H. Schlager, H. Aufmhoff, J. Schmale,J. Schneider, M. Lichtenstern, A. Dörnbrack (2010), Airborne strato-
spheric ITCIMS measurements of SO2, HCl, and HNO3 in the aged plumeof volcano Kasatochi, J. Geophys. Res., doi:10.1029/2010JD013890,in press.
Keim, E. R., et al. (1996), Observations of large reductions in the NO/NOyratio near the mid‐latitude tropopause and the role of heterogeneouschemistry, Geophys. Res. Lett., 23(22), 3223–3226, doi:10.1029/96GL02593.
Kimmel, J. R., D. K. Farmer, D. Sueper, M. Cubison, C. Tanner, and J.‐L.Jimenez (2008), Monitoring of fast changes in aerosol chemistry with atime‐of‐flight aerosol mass spectrometer, poster presented at 56th Con-ference on Mass Spectrometry and Allied Topics, Am. Soc. For Mass.Spectrom., Denver, Colo.
Krueger, A., N. Krotkov, and S. Carn (2008), El Chichon: The genesis ofvolcanic sulfur dioxide monitoring from space, J. Volcanol. Geotherm.Res., 175(4), 408–414, doi:10.1016/j.jvolgeores.2008.02.026.
Lanz, V. A., M. R. Alfarra, U. Baltensperger, B. Buchmann, C. Hueglin,and A. S. H. Prevot (2007), Source apportionment of submicron organicaerosols at an urban site by factor analytical modelling of aerosol massspectra, Atmos. Chem. Phys., 7, 1503–1522, doi:10.5194/acp-7-1503-2007.
Liu, P. S. K., R. Deng, K. A. Smith, L. R. Williams, J. T. Jayne, M. R.Canagaratna, K. Moore, T. B. Onasch, D. R. Worsnop, and T. Deshler(2007), Transmission efficiency of an aerodynamic focusing lens system:Comparison of model calculations and laboratory measurements for theAerodyne aerosol mass spectrometer, Aerosol Sci. Technol., 41, 721–733, doi:10.1080/02786820701422278.
Marcy, T. P., R. S. Gao, M. J. Northway, H. Stark, and D. W. Fahey(2005), Using chemical ionization mass spectrometry for detection ofHNO3, HCl and ClONO2 in the atmosphere, Int. J. Mass Spectrom.,243, 63–70, doi:10.1016/j.ijms.2004.11.012.
Martin, R. S., P. J. Silva, K. Moore, M. Erupe, and V. S. Doshi (2008),Particle composition and size distributions in and around a deep‐pitswine operation, Ames, IA, J. Atmos. Chem. , 59(2), 135–150,doi:10.1007/s10874-008-9097-y.
Martinsson, B. G., G. Papaspiropoulos, J. Heintzenberg, and M. Hermann(2001), Fine mode particulate sulphur in the tropopause region measuredfrom intercontinental flights (CARIBIC), Geophys. Res. Lett., 28(7),1175–1178, doi:10.1029/2000GL012257.
Martinsson, B. G., H. N. Nguyen, C. A. M. Brenninkmeijer, A. Zahn,J. Heintzenberg, M. Hermann, and P. F. J. van Velthoven (2005), Charac-teristics and origin of lowermost stratospheric aerosol at northern midlat-itudes under volcanically quiescent conditions based on CARIBICobservations, J. Geophys. Res., 110, D12201, doi:10.1029/2004JD005644.
Martinsson, B. G., C. A. M. Brenninkmeijer, S. A. Carn, M. Hermann,K. P. Heue, P. F. J. van Velthoven, and A. Zahn (2009), Influence ofthe 2008 Kasatochi volcanic eruption on sulfurous and carbonaceousaerosol constituents in the lower stratosphere, Geophys. Res. Lett., 36,L12813, doi:10.1029/2009GL038735.
Matthew, B. M., A. M. Middlebrook, and T. B. Onasch (2008), Collectionefficiencies in an Aerodyne aerosol mass spectrometer as a function ofparticle phase for laboratory generated aerosols, Aerosol Sci. Technol.,42, 884–898, doi:10.1080/02786820802356797.
Morgan, W. T., J. D. Allan, K. N. Bower, G. Capes, J. Croiser, P. I.Williams, and H. Coe (2009), Vertical distribution of sub‐micron aerosolchemical composition from north‐western Europe and the north‐eastAtlantic, Atmos. Chem. Phys., 9, 5389–5401, doi:10.5194/acp-9-5389-2009.
Murphy, D. M., D. S. Thomson, and T. M. J. Mahoney (1998), In situ mea-surements of organics, meteoritic material, mercury, and other elementsin aerosols at 5 to 19 kilometers, Science, 282(5394), 1664–1669,doi:10.1126/science.282.5394.1664.
Ovadnevaite, J., et al. (2009), Volcanic sulphate and arctic dust plumesover the North Atlantic Ocean, Atmos. Environ., 43(32), 4968–4974,doi:10.1016/j.atmosenv.2009.07.007.
Pan, L. L., W. J. Randel, B. L. Gary, M. J. Mahoney, and E. J. Hintsa(2004), Definitions and sharpness of the extratropical tropopause: A tracegas perspective, J.Geophys. Res., 109, D23103, doi:10.1029/2004JD004982.
Popp, P. J., et al. (2007), Condensed‐phase nitric acid in a tropical subvisiblecirrus cloud,Geophys. Res. Lett., 34, L24812, doi:10.1029/2007GL031832.
Quinn, P. K., et al. (2006), Impacts of sources and aging on submicrometeraerosol properties in the marine boundary layer across the Gulf of Maine,J. Geophys. Res., 111, D23S36, doi:10.1029/2006JD007582.
Rose, W. I., et al. (2006), Atmospheric chemistry of a 33–34 hour oldvolcanic cloud from Hekla volcano (Iceland): Insights from direct sam-pling and the application of chemical box modeling, J. Geophys. Res.,111, D20206, doi:10.1029/2005JD006872.
Sander, S. P., et al. (2006), Chemical kinetic and photochemical data foruse in atmospheric studies, Eval. 15, JPL Publ. 06‐2, Jet Propul. Lab.,Pasadena, Calif.
SCHMALE ET AL.: AEROSOL LAYERS OF OKMOK AND KASATOCHI D00L07D00L07
17 of 18

Schneider, J., S. S. Hings, B. N. Hock, S. Weimer, S. Borrmann, M. Fiebig,A. Petzold, R. Busen, and B. Karcher (2006a), Aircraft‐based operationof an aerosol mass spectrometer: Measurements of tropospheric aerosolcomposition, J. Aerosol Sci., 37(7), 839–857, doi:10.1016/j.jaerosci.2005.07.002.
Schneider, J., S. Weimer, F. Drewnick, S. Borrmann, G. Helas, P. Gwaze,O. Schmid, M. O. Andreae, and U. Kirchner (2006b), Mass spectrometricanalysis and aerodynamic properties of various types of combustion‐related aerosol particles, Int. J. Mass Spectrom., 258, 37–49,doi:10.1016/j.ijms.2006.07.008.
Schreiner, J., C.Voigt, P. Zink,D.Knopf,A.Kohlmann, andK.Mauersberger(2002), A mass spectrometer system for analysis of polar stratosphericaerosols, Rev. Sci. Instrum., 73, 446–452, doi:10.1063/1.1430732.
Smith, J. B., E. J. Hintsa, N. T. Allen, R. M. Stimpfle, and J. G. Anderson(2001), Mechanisms for midlatitude ozone loss: Heterogeneous chemistryin the lowermost stratosphere?, J. Geophys. Res., 106(D1), 1297–1309,doi:10.1029/2000JD900464.
Solomon, S., S. Borrmann, R. R. Garcia, R. Portmann, L. Thomason, L. R.Poole, D. Winker, and M. P. McCormick (1997), Heterogeneous chlorinechemistry in the tropopause region, J. Geophys. Res., 102(D17), 21,411–21,429, doi:10.1029/97JD01525.
Speidel, M., R. Nau, F. Arnold, H. Schlager, and A. Stohl (2007), Sulfurdioxide measurements in the lower, middle and upper troposphere:Deployment of an aircraft‐based chemical ionization mass spectrometerwith permanent in‐flight calibration, Atmos. Environ., 41(11), 2427–2437, doi:10.1016/j.atmosenv.2006.07.047.
Theys, N., M. Van Roozendael, B. Dils, F. Hendrick, N. Hao, and M. DeMaziere (2009), First satellite detection of volcanic bromine monoxideemission after the Kasatochi eruption, Geophys. Res. Lett., 36, L03809,doi:10.1029/2008GL036552.
Thomason, L., and T. Peter (Eds.) (2006), Assessment of stratosphericaerosol properties (ASAP), WCRP‐124, WMO/TD‐1295, SPARC Rep. 4,Stratospheric Processes and Their Role in Clim., Toronto, Ont., Canada.
Ulbrich, I. M., M. R. Canagaratna, Q. Zhang, D. R. Worsnop, and J. L.Jimenez (2009), Interpretation of organic components from positivematrix factorization of aerosol mass spectrometric data, Atmos. Chem.Phys., 9, 2891–2918, doi:10.5194/acp-9-2891-2009.
Voigt, C., et al. (2000), Nitric acid trihydrate (NAT) in polar stratosphericclouds, Science, 290(5497), 1756–1758, doi:10.1126/science.290.5497.1756.
Voigt, C., H. Schlager, H. Ziereis, B. Karcher, B. P. Luo, C. Schiller,M. Kramer, P. J. Popp, H. Irie, and Y. Kondo (2006), Nitric acid in cirrusclouds, Geophys. Res. Lett., 33, L05803, doi:10.1029/2005GL025159.
Voigt, C., B. Karcher, H. Schlager, C. Schiller, M. Kramer, M. de Reus,H. Vossing, S. Borrmann, and V. Mitev (2007), In‐situ observations andmodeling of small nitric acid‐containing ice crystals, Atmos. Chem.Phys., 7, 3373–3383, doi:10.5194/acp-7-3373-2007.
Voigt, C., et al. (2010), In‐situ observations of young contrails—Overviewand selected results from the CONCERT campaign, Atmos. Chem. Phys.Discuss., 10, 12,713–12,763, doi:10.5194/acpd-10-12713-2010.
von Glasow, R., N. Bobrowski, and C. Kern (2009), The effects of volcaniceruptions on atmospheric chemistry, Chem. Geol., 263, 131–142,doi:10.1016/j.chemgeo.2008.08.020.
Warneke, C., et al. (2006), Biomass burning and anthropogenic sources ofCO over New England in the summer 2004, J. Geophys. Res., 111,D23S15, doi:10.1029/2005JD006878.
Wendisch, M., D. Muller, D. Schell, and J. Heintzenberg (2001), An air-borne spectral albedometer with active horizontal stabilization, J. Atmos.Oceanic Technol., 18(11), 1856–1866, doi:10.1175/1520-0426(2001)018<1856:AASAWA>2.0.CO;2.
Wendisch, M., et al. (2008), Radiative and dynamic effects of absorbingaerosol particles over the Pearl River delta, China, Atmos. Environ.,42(25), 6405–6416, doi:10.1016/j.atmosenv.2008.02.033.
Wilson, J. C., et al. (1993), In situ observations of aerosol and chlorinemonoxide after the 1991 eruption of Mount Pinatubo—Effect of reac-tions on sulfate aerosol, Science, 261(5125), 1140–1143, doi:10.1126/science.261.5125.1140.
World Meteorological Organization (1999), Scientific assessment of ozonedepletion: 1998, Global Ozone Res. and Monitoring Project, Rep. 44,WMO Global Ozone Obs. Syst., Geneva, Switzerland.
Zahn, A., and C. A. M. Brenninkmeijer (2003), New directions: A chemicaltropopause defined, Atmos. Environ., 37(3), 439–440, doi:10.1016/S1352-2310(02)00901-9.
Zhang, Q., M. R. Alfarra, D. R. Worsnop, J. D. Allan, H. Coe, M. R.Canagaratna, and J. L. Jimenez (2005), Deconvolution and quantificationof hydrocarbon‐like and oxygenated organic aerosols based on aerosolmass spectrometry, Environ. Sci. Technol., 39(13), 4938–4952,doi:10.1021/es048568l.
G. Ancellet, LATMOS, Université Pierre et Marie Curie, CNRS, Tour15, Aile 15‐14‐5e Etage, Boite 102, 4 place Jussieu, F‐75252 ParisCEDEX 05, France.F. Arnold, Max Planck Institute for Nuclear Physics, Saupfercheckweg 1,
Postfach 103980, D‐69117 Heidelberg, Germany.S. Borrmann, J. Schmale, and J. Schneider, Particle Chemistry
Department, Max Planck Institute for Chemistry, J.‐J.‐Becherweg 27,D‐55128 Mainz, Germany. ([email protected])M. Gerding, Leibniz Institute for Atmospheric Physics, Schloss‐Str. 6,
D‐18225 Kühlungsborn, Germany.T. Jurkat, M. Lichtenstern, M. Rautenhaus, H. Schlager, and C. Voigt,
Deutsches Zentrum für Luft‐ und Raumfahrt, Institut für Physik derAtmosphäre, Münchner Straße 20, D‐82234 Oberpfaffenhofen, Germany.H. Kalesse, Institute for Atmospheric Physics, J. Gutenberg University,
Becherweg 21, D‐55099 Mainz, Germany.I. Mattis, Leibniz Institute for Tropospheric Research, Permoserstr. 15,
D‐04318 Leipzig, Germany.M.Wendisch, Institute of Meteorology, University of Leipzig, Permoserstr.
15, D‐04318 Leipzig, Germany.
SCHMALE ET AL.: AEROSOL LAYERS OF OKMOK AND KASATOCHI D00L07D00L07
18 of 18