Embed Size (px)
Citation preview
- 1 -
Agency Cost and Dividend:
Evidence from Anti-Takeover Legislation
Bill Francis
Lally School of Management and Technology of Rensselaer Polytechnic Institute
110 8th Street - Pittsburgh Building, Troy, NY, U.S.A., 12180, [email protected],
518-276-3908
Iftekhar Hasan
Lally School of Management and Technology of Rensselaer Polytechnic Institute
110 8th Street - Pittsburgh Building, Troy, NY, U.S.A., 12180, [email protected],
518-276-2525
Kose John
Stern School of Business, New York University
44 West 4th Street, Suite 9-190, New York, 10012, [email protected] ,
212-998-0337
Liang Song∗
Lally School of Management and Technology of Rensselaer Polytechnic Institute
110 8th Street - Pittsburgh Building, Troy, NY, U.S.A., 12180, [email protected],
518-892-8098
∗ Correspondence Author

- 2 -
Agency Cost and Dividend: Evidence from Anti-Takeover Legislation
Bill Francis, Iftekhar Hasan, Kose John, Liang Song
Abstract
The paper uses an exogenous shock-passage of Anti-Takeover Laws as proxies of
increased agency cost to investigate the relation between managerial entrenchment and
dividend policy for a large number of U.S. industrial firms over the period 1981-1993.
Consistent with conventional wisdom suggests that managers have a strong preference
against dividends payments since paying dividends reduces cash subject to managerial
discretion, this paper finds that firms with entrenched managers are less likely to pay
dividends, specifically; firms have fewer propensities to pay dividends and lower
dividend payout ratio after passage of Anti-Takeover Laws. This paper adds to the
existing literature by using an exogenous shock-passage of Anti-Takeover Laws
(Bertrand and Mullainathan 2003; Cheng, Nagar et al. 2005) as proxies of increased
agency cost to avoid the problem - endogenous measure of managerial entrenchment
and our results are consistent in various robustness checks.
Keywords: payout policy, corporate governance, agency conflicts.

- 3 -
I. Introduction
Agency theory (Jensen 1986; Morck, Shleifer et al. 1990; Lang, Stulz et al. 1991)
argues that in corporations with diffused ownership, managers are often found to
pursue their own goals instead of maximizing shareholder wealth when they are not
closely monitored. This conflict of interests is manifest when managers are entrenched.
They make value-destroying acquisitions (Jensen 1986; Morck, Shleifer et al. 1990;
Lang, Stulz et al. 1991); choose capital structures not in favor of shareholders’
interests (Jensen and Meckling 1976; Stulz 1988) and even make decisions in favor of
their own compensation (Fahlenbrach 2003). It is obvious to predict that managers
prefer to cut or lower dividend payout if they become more entrenched based on
Agency Theory since paying dividend reduces the amount of cash at managers’
disposal, therefore they will get better capital market monitoring or do fewer
inefficient investments. As Easterbrook and Jensen point out, a policy of paying
dividends reduces firms’ agency costs by improving the monitoring and risk-raking
incentives of managers (Easterbrook 1984; Jensen 1986).
However, empirical results about the relation between entrenched managers and
dividend payout policy are still mixed. One school of researches is consistent with the
theoretical prediction based on Agency Theory. For example, (La Porta,
Lopez-de-Silane et al.(2000) examine a cross-section of 4,000 companies from around
the world, which operate in 33 countries with different levels of shareholder protection,
and therefore different strength of minority shareholder rights and finds that stronger
minority shareholder rights are associated with higher dividends.

- 4 -
The other strand of researches gets the opposite results using firm level measures
of managerial entrenchment. Pan (2007) find that firms with entrenched managers, as
measured by the governance index (the G index) developed by Paul, Joy et al.(2003),
are more likely to pay dividends. Officer (2007) provides evidence that firms with
weak governance, as measured by board characteristics and so on, have significantly
higher dividend initiation announcement abnormal returns than other firms. Fenn and
Liang (2001) and Hu and Kumar (2004) find that the likelihood and level of dividend
payouts is increasing when factors such as managerial stock-option holding,
managerial and outside blockholder ownership, CEO compensation policy, and board
independence indicate a high likelihood of managerial entrenchment and high agency
cost.
One problem that arises in any analysis of managerial entrenchment effect
measured by firm level variables on dividend payout policy is endogeneity. Thus,
corporate governance may be driven by, rather than a determinant of, differences in
firms’ dividend payout policy. As a result, higher dividend payout ratio firms may
have stronger firm level corporate governance measures since managers in those firms
don’t have enough cash flow to do fewer inefficient investments and have to get better
capital market monitoring. Consistent with it, Chidambaran, Palia et al.(2006) finds
that firms choose governance endogenously by investigating a broader measure of
governance, including board of directors, pay-performance sensitivity, shareholder
rights, institutional ownership and CEO turnover. This paper adds to the existing
literature by using an exogenous shock-passage of Anti-Takeover Laws (Bertrand and

- 5 -
Mullainathan 2003; Cheng, Nagar et al. 2005) as proxies of increased agency cost to
investigate how managerial entrenchment is related to firms’ payout policies and
avoids the problem - endogenous measure of managerial entrenchment.
I measure entrenchment by passage of Anti-Takeover Legislation and take the
view that Anti-Takeover Laws make it more difficult for a potential raider to take
control a firm and further allocate extensive power to the incumbent management
since managers do not need to worry about the possibility to be replaced after firms
are taken over by outsiders, in other words, outside market discipline for managers
decreases after passage of Anti-Takeover Legislation. So they provide a natural testing
ground for Agency Theory to explain firms’ payout policy.
Overall, this paper uses an exogenous shock-passage of Anti-Takeover Laws
(Bertrand and Mullainathan 2003; Cheng, Nagar et al. 2005) as proxies of increased
agency cost to investigate the relation between managerial entrenchment and dividend
policy for a large number of U.S. industrial firms over the period 1981-1993. The
paper finds that firms with entrenched managers are less likely to pay dividends,
specifically; firms have fewer propensities to pay dividends and lower dividend
payout ratio after passage of Anti-Takeover Laws. This result is consistent with
conventional wisdom suggests that managers have a strong preference against
dividends payments since paying dividends reduces cash subject to managerial
discretion, therefore imposing additional discipline on firm managers and reducing
their ability to pursue their own objectives. The results from this analysis can be
briefly summarized as follows.

- 6 -
First, univariate analysis shows that dividend payer percentage, dividend payout
ratio and dividend propensity are decreasing when managers are more entrenched and
there is a strong impact of Anti-Takeover legislation on firms’ dividend payout policy.
Second, the likelihood of dividend payout significantly declines after an increase
in the level of entrenchment, proxied by passage of Anti-Takeover Legislation. In
particular, in logit regressions that estimate firms’ divided payout probability, the
dummy variable that represents passage of Anti-Takeover Legislation, has a
significant negative coefficient, suggesting that firms will cut or lower their dividend
payout compared to those firms incorporated in the stats where Anti-Takeover
Legislation does not pass.
Finally, we provide evidence that firms’ dividend payout ratio also significantly
decreases after managerial entrenchment becomes more severe using
difference-in-difference approach.
The remainder of this paper is structured as follows. Section II reviews some
previous dividend research. Section III gives a brief introduction of Anti-Takeover
Legislation and its impact. Section IV describes our methodology and sample. Section
V states empirical results. Section VI does some robustness test. Section VII
concludes.
II. Agency Conflicts and Payout Policy Theory
While finance academics have long wondered why firms pay dividends when cash
distributions in the form of dividends are tax disadvantaged relative to retention or

- 7 -
stock repurchase (Black 1976). Despite a large body of literature on dividends and
payout policy, researchers have not yet to reach a consensus on why firms pay
dividends and what determines the payout ratio. Theories based on signaling
hypothesis (Aharony and Swary 1980), tax clienteles (Michaely, Thaler et al. 1995) or
catering (Malcolm and Jeffrey 2004) are not always consistent with the existing
empirical results. Michaely and Allen (2002) and Baker, Powell et al.(2002) provide
detailed surveys of existing work on payout policy.
One strand of this recent literature relates payout policy to managerial
entrenchment (Erik and Juergen 2000; La Porta, Lopez-de-Silane et al. 2000; Hu and
Kumar 2004; Pan 2007). The relation between dividend policy and agency cost is
central to the debate about the agency costs of free-cash-flow (Easterbrook 1984;
Jensen 1986). To be specific, managers dislike dividend payout and want to cut or
lower it while they could since a policy of paying dividends reduces firms’ agency
costs by improving the monitoring and risk-raking incentives of managers
(Easterbrook 1984), as well as reducing the amount of cash flow at managers’
disposal.
It is very likely that managers will manipulate firms’ payout policy since the
existing empirical literature have found amounts of results that managers make
decisions in favor of themselves like value-destroying acquisitions (Jensen 1986;
Morck, Shleifer et al. 1990; Lang, Stulz et al. 1991); choosing capital structures not in
favor of shareholders’ interests (Jensen and Meckling 1976; Stulz 1988) and even
making decisions in favor of their own compensation (Fahlenbrach 2003).

- 8 -
One model of the relation between corporate governance and dividend policy is
the outcome model proposed by La Porta, Lopez-de-Silane et al. (2000). In the
outcome model, the payment of dividends is the result of effective governance-
well-governed. Firms pay dividends because strong governance makes expropriation
from shareholders more difficult and shareholders successfully pressure managers to
distribute excess cash. La Porta, Lopez-de-Silane et al. (2000) findings on payout
levels and other results support their outcome agency model of dividends by
examining a cross-section of 4,000 companies from around the world, which operate
in 33 countries with different levels of shareholder protection, and therefore different
strength of minority shareholder rights.
Another substitute model in La Porta, Lopez-de-Silane et al. (2000) argues that
dividend payments are a substitute for other characteristics that are consistent with
strong governance because poorly-governed firms need an alternate means of
establishing a reputation for acting in the interests of shareholders if they intend to
raise capital form public markets in the future. While it is almost a tautology that more
dividend payout will increase firm level corporate governance directly by reducing
free cash flow inside the firm or indirectly by having to access more to outside capital
market and get better capital market monitoring or discipline. So there is no surprise
that some existing literature (Paul, Joy et al. 2003; Officer 2007; Pan 2007) using firm
level corporate governance measures get the result that those firms with higher firm
level corporate governance have higher dividend payout ratio. They can not rule out

- 9 -
the possibility of endogeneity that those firms with higher dividend payout ratio have
higher firm level corporate governance.
Our paper presents evidence on the role of corporate governance in influencing
firms’ dividend payout. It differs from existing literature in several important ways.
First, we use an exogenous shock-passage of Anti-Takeover Laws (Bertrand and
Mullainathan 2003; Cheng, Nagar et al. 2005) as proxies of increased agency cost to
investigate the relation between managerial entrenchment and dividend policy and
avoid endogeneity problem of the existing literature using firm level variables to
measuring managerial entrenchment effect. Second, we use difference-in-difference
approach to find a control group of sample firms, so our results are more robust. We
find that firms decrease dividend payout after managers become more entrenched. In
particular, firms have less propensity to pay dividend and lower or cut dividend ratio
when corporate governance discipline from outside capital market declines measured
by passage of Anti-Takeover Legislation.
III. Anti-Takeover Laws
A. Description
The main proxy for managerial entrenchment in the paper is passage of
Anti-Takeover Legislation. More detailed description about Anti-Takeover laws can
be found in several researches (Karpoff and Malatesta 1989; Comment and Schwert
1995; Bertrand and Mullainathan 2003); we will give a brief discussion as follows.
Williams Act, a federal statute designed to protect investors from unannounced

- 10 -
takeovers, passed in 1968. Based on that, the first generation state laws passed in a lot
of states, but they were deemed unconstitutional in 1982. To address these concerns,
the second generation state laws passed in 1980’s. In the 1990s, the third generation
laws test current limits, attempting to make Anti-Takeover legislation more stringent.
In our study, we focus on the second generation state Anti-Takeover Laws, which
increased the difficulty of a successful takeover for firms incorporated in those states.
The second generation laws can be divided into three types: (1) Control Share
Acquisition (CSA), (2) Fair Price (FP) and (3) Business Combination (BC). Although
these laws have some differences in various states, they share some similar themes.
The similarity of Anti-Takeover Laws in various states allows us not to care about the
difference of role from Anti-Takeover Laws of various states.
B. Impact of Laws
Passage of Anti-Takeover Legislation has played an important role in deterring
takeovers, which further increases agency cost (Jensen 1986). Mass of cases tested
these laws as they passed, indicating that corporate raiders understood the implications.
Laws received extensive coverage by both popular press and legal practitioners. The
existing literature (Karpoff and Malatesta 1989; Morck, Shleifer et al. 1990; Bertrand
and Mullainathan 1999a; Bertrand and Mullainathan 1999b; Bertrand and
Mullainathan 2003) have done amounts of outstanding researches using
Anti-Takeover Legislation as a testing ground and argue that these legislations
increase the power of existing managers, which means that managers would not

- 11 -
maintain the same levels of operational efficiency as before while outside market
discipline decreases and agency cost increases. Although some scholars such as Stein
(1988) do not agree that agency cost increases after passage of Anti-Takeover
Legislation. Cheng, Nagar et al. (2005) argues that Stein’s arguments are flawed. So
we can get the conclusion that agency cost of the firms incorporated in the states
where Anti-Takeover laws have been passed increases and managers in those firms
become more entrenched than before. And we can use passage of Anti-Takeover
legislation as a testing ground to investigate the relation between managerial
entrenchment and dividend policy.
IV. Empirical Methodology and Sample Construction
A. Difference-in-Difference Approach
The goal of this paper is to understand whether cross-sectionally, the propensity to
pay dividends and the dividend payout ratio are related to the degree of managerial
entrenchment, controlling for other firm characteristics. We use the same
difference-in-difference methodology as Bertrand and Mullainathan (1999b). Our
control group for any given year is the set of states, which did not pass Anti-Takeover
Laws at that time, even if they will pass the law later, it makes our control group not
very small since it is very clear that most of companies are incorporated in the states
passing laws. Table I summarizes state Anti-Takeover Legislation.
[Insert TALBE I]

- 12 -
To use difference-in-difference approach, we define a dummy variable Treat one
if a firm is incorporated in a state, which passed Anti-Takeover laws, otherwise zero.
We also define a dummy variable Post as one after passage of the Anti-Takeover law
for a certain company and zero otherwise. Bertrand and Mullainathan (2003) uses the
passage of Business Combination Laws to represent Anti-Takeover Law passage time
and they argue that Business Combination Laws were the most stringent of the three
laws. In this way, we define the dummy variable Post for each firm that takes a value
of unity in the year when Business Combination Laws passed and call this approach
Business Combination Law Approach.
Cheng, Nagar et al. (2005) uses passage of the first Anti-Takeover Law to
represent Anti-Takeover Law passage time. They argue that the passages of various
Anti-Takeover Laws were stimulated by one another and further investors will have
anticipated the passage of next law upon knowing the passage of the previous law. So
they believe it is the first law that has the most influence on investors since the
enactment of subsequent laws in a certain state is eased by passage of the first piece of
Anti-Takeover laws. So based on this way, the dummy variable Post for each firm
takes a value of unity in the year when the corresponding state’s first Anti-Takeover
law passed and we call this approach the First Passed Law Approach. In this paper, we
only present the result based on the Business Combination Law Approach. When we
use the First Law Approach to do robustness test, we got qualitatively same empirical
results.

- 13 -
B. Sample Selection
Our sampling procedure parallels those of Fama and French (2001). Specifically,
we restrict analysis to nonfinancial and nonutility (hereafter, industrial firms) on
CRSP and Compustat, defined as firms with SIC codes outside the intervals
4900-4949 and 6000-6999. We consider only NYSE, NASDAQ, and AMEX firms
that have securities with CRSP share codes 10 or 11 to ensure those firms are publicly
traded and those are incorporated in the U.S. according to Compustat. We exclude
firms with book equity (BEt) below $250,000 or total assets (Assett) below $500,000.
We focus on our sample firms for calendar year t, 1981-1993 and include those firms
with fiscal year-ends in t. Since the first second-generation Anti-Takeover Law in our
sample passed in 1984 and the last one passed in 1990, we extend our sample coverage
three years before and after that period to include all possible related influence by
Anti-Takeover Laws. Firms’ state of incorporation are collected from Compustat,
which refers to the state of incorporation in 1994 if the firm is still running or the last
state of incorporation if the firm was dead before 1994 (Bertrand and Mullainathan
1999a).
To remain in the final sample, each firm-year observation must have information
available to derive the following variables (details provided in the appendix):
1. Dividend Dummy (DIVt).
2. NYSE Percentile (NYPt).
3. Market-to-Book Ratio (Vt/At).
4. Growth Rate of Assets (dAt/At)

- 14 -
5. Profitability (Et/At)
We impose additional Compustat data availability conditions when conducting
some of our tests and related analyses (details provided where appropriate).
C. Sample Statistics
The final sample contains 1,469 firms, and an overall total of 11,524 firm year
observations over the period 1981-1993. Table II presents descriptive statistics of key
variables and control variables for the sample and table III presents variable
correlation matrix.
[Insert TALBE II]
[Insert TALBE III]
V. Empirical Results
Fama and French (2001) identify four firm characteristics as important
determinants of a firm’s likelihood to pay dividends - firm size, investment
opportunities, growth rate and profitability. DeAngelo, DeAngelo et al.(2006) find
that firms are more likely to pay dividends when they enter into the mature stage of
their lifecycle. Using the ratio of retained earnings to total capital as a proxy for a
firm’s lifecycle stage, they show that the variables REt/TEt and REt/TAt have strong
explanatory power in estimating a firm’s likelihood to pay dividends. (Baker and
Wurgler (2004) propose a new dividend theory. They argue that managers cater to
investor demand for dividends by paying dividends when investors place a premium

- 15 -
on dividend-paying stocks, and vice versa. They measure dividend premium as equal
weighted dividend premium (EWt) and value weighted dividend premium (VWt)1.
Hoberg and Prabhala (2005) argues that of idiosyncratic risk (Riskt) is more important
variable than dividend premium mentioned above.
In the analysis that follows, we control for these firm characteristics, and examine
whether my proxy form managerial entrenchment, passage of Anti-Takeover
Legislation, has any additional explanatory power in explaining firms’ propensity to
pay dividends. we start with comparing dividend payout pattern before and after
passage of Anti-Takeover legislation, and then run logit regressions to estimate the
firms’ propensity to pay dividends, finally, we use difference-in-difference approach
to estimate dividend payout ratio. The key variable in multivariate test is Treat*Post
dummy variable.
A. Change of Dividend Pattern before and after Laws
Figure I shows the change in dividend payout pattern for the firms incorporated in
the states passed Anti-Takeover Legislation over the time period three years before
and three years after passage of the law. The year of passage of Anti-Takeover
Legislation is considered time 0. Dividend payout ratio (DivRatio) is defined as total
amount of dividend (Compustat item #21) scaled by earnings (Compustat item #18).
To construct DivRatio variable, we only include firms with positive earnings. To
mitigate the effect of outliers, we eliminate observations with a dividend payout ratio
1 In multivariate analysis, we only present results using variables REt/TEt and EWt, when we replace those with REt/TAt and VWt, our results do not qualitatively change.
- 16 -
greater than one. Dividend propensity measures the difference between firms’ real
dividend payout status and expected dividend payout status (details provided in the
appendix). We begin with two sided two-sample t-test to assess the difference in the
payout policy of firms three years before and after passage of Anti-Takeover
Legislation and plot the trend of dividend payout.
[Insert Figure I]
We observe that dividend payer percentage, dividend payout ratio and dividend
propensity are decreasing before the year 0 and increasing after the year 0 from Panel
B, Panel C ad Panel D. Our two sided two-sample t-test in Panel A shows that
dividend payout ratio and dividend propensity is decreasing in mean value. So we can
come to the conclusion that passage of Anti-Takeover Legislation has a strong impact
on firms’ dividend payout policy and on average, firms ‘s dividend payout declines
when managerial entrenchment are more severe.
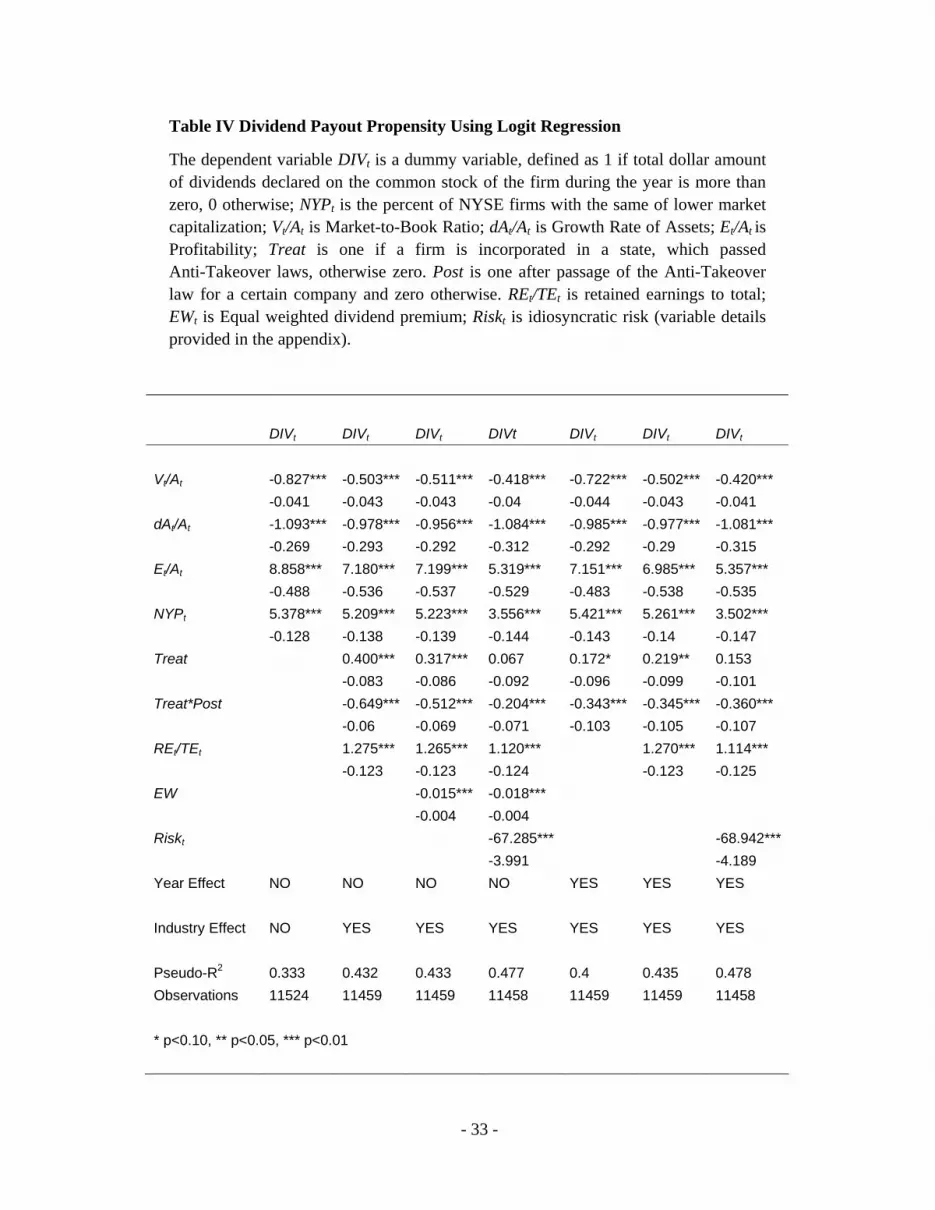
B. Dividend Payout Possibility Using Logit Regression
To control additional firm characteristics, we also do a multivariate analysis. The
likelihood of being a payer is predicted with the Logit model. All Logit regressions are
performed in the panel data format. Table IV presents regression results.
[Insert TALBE IV]
We observe that dividend payout is less likely when managers are more
entrenched after passage of Anti-Takeover Legislation. The result is robust even if we
add more control variables, industry effect and year effect into the regression equation.

- 17 -
Dividend pay out propensity is increasing in firm profitability and size and decreasing
in firm investment opportunities and growth rate, which is consistent with (Fama and
French (2001). Dividend pay out probability is increasing in firm retained earnings,
which is consistent with DeAngelo, DeAngelo et al.(2006) and decreasing in dividend
premium and idiosyncratic risk which is consistent with Hoberg and Prabhala (2005).
They argue that idiosyncratic risk is more important variable than dividend premium.
C. Dividend Payout Ratio Using Difference-in-Difference Approach
Although univariate results provide some evidence on the relation between
dividend payout ratio and managerial entrenchment, they do not control for other firm
characteristics that can be correlated with corporate governance as well as payout. To
address the issue, we employ difference-in-difference approach using a set of
firm-level controls described in the previous section. The dependent variable Dividend
payout ratio (DivRatio) is defined as total amount of dividend (Compustat item #21)
scaled by earnings (Compustat item #18). To construct DivRatio variable, we only
include firms with positive earnings. To mitigate the effect of outliers, we eliminate
observations with a dividend payout ratio greater than one. To make our dependent
variable more normal distributed, we eliminate firms with zero dividend payments
over the whole sample period. Table V presents regression results.
[Insert TALBE V]
We observe that dividend payout ratio is lower when managers are more
entrenched after passage of Anti-Takeover Legislation, even if compared to the

- 18 -
control group of firms incorporated in the states where Anti-Takeover Legislation
does not pass. Dividend pay out propensity is increasing in firm size and retained
earnings and decreasing in growth rate and idiosyncratic risk. The significant negative
coefficient of firm profitability shows that dividend payment is increasing in the lower
proportion compared to the increase of firms’ earning. The explanatory effect of firm
investment opportunities on firms’ payout ratio is not always significant.
VI. Robustness Test
A. Substitute Effect from Repurchase
Another possible explanation that dividend payout is decreasing when managers
become more entrenched is the Substitution Hypothesis proposed by Gustavo and
Roni (2002). They argue that firms have gradually substituted repurchases. To address
this concern, we plot the change in repurchase payout and total payout pattern for the
firms incorporated in the states passed Anti-Takeover Legislation over the time period
three years before and three years after passage of the law in figure II. The year of
passage of Anti-Takeover Legislation is considered time 0.
[Insert Figure II]
Panel A and B shows that repurchase payer percentage and repurchase ratio are
also decreasing when managerial entrenchment become more severe (variable
definition detail is provided in appendix). When we consider both dividend payout and
repurchase payout together, we can observe that total payout payer percentage and
total payout ratio have the same declining trend in our sample period from Panel C and

- 19 -
D. So we can get the conclusion that Substitution Hypothesis can not explain that
dividend payout decline after passage of Anti-Takeover Legislation, at least in our
sample period.
VII. Conclusions
We investigate the relationship between managerial entrenchment and dividend
policy for a large number of firms over the period 1981-1993. In particular, we study
the relation between a firm’s propensity to pay dividends, dividend payout ratio and
the degree of managerial entrenchment, proxied by an exogenous shock-passage of
Anti-Takeover Legislation. We find that, consistent with the conventional wisdom,
entrenched managers are less likely to pay dividends and pay less dividend. This paper
argues that other papers in this domain get the opposite results since their firm level
measures of managerial entrenchment are endogenous and we use an exogenous
shock-passage of Anti-Takeover legislation and avoid this endogeniety problem.
Logit regressions show a strong negative relation between dummy variable of
passage of Anti-Takeover Legislation, proxies for the degree of entrenchment, and its
propensity to pay dividends, after controlling for other firm characteristics, i.e., firm
size, investment opportunities, growth rate, profitability, retained earnings, dividend
premium and idiosyncratic risk. Difference-in-deference approach shows a significant
negative relation between dummy variable of passage of Anti-Takeover Legislation,
and dividend payout ratio. These results hold up well under a series of robustness
checks.

- 20 -
Our result is consistent with the recent findings in international context using
country level investor protection as a proxy for managerial entrenchment, dividends
are lower and cash holdings are higher in countries with weak investor protection (La
Porta, Lopez-de-Silane et al. 2000; Dittmar, Mahrt-Smith et al. 2003).

- 21 -
Reference
Aharony, J. and I. Swary (1980). "Quarterly Dividend and Earnings Announcements and Stockholders' Returns: An Empirical Analysis." The Journal of Finance: 1-12. Baker, H. K., G. E. Powell, et al. (2002). "Revisiting the dividend puzzle: Do all of the pieces now fit?" Review of Financial Economics 11(4): 241. Baker, M. and J. Wurgler (2004). "A Catering Theory of Dividends." Journal of Finance 59(3): 1125. Baker, M. P. and J. A. Wurgler (2002). Why are Dividends Disappearing? An Empirical Analysis, SSRN. Bertrand, M. and S. Mullainathan (1999a). "Is There Discretion in Wage Setting? A Test Using Takeover Legislation." RAND Journal of Economics 30: 535-554. Bertrand, M. and S. Mullainathan (1999b). "Corporate Governance and Executive Pay: Evidence from Takeover Legislation." Working Paper. Bertrand, M. and S. Mullainathan (2003). "Enjoying the Quiet Life? Managerial Behavior Following Antitakeover Legislation." Journal of Political Economy 111: 1043-1043. Black, F. (1976). "The dividend puzzle." Journal of Portfolio Management 2: 5-8. Cheng, S., V. Nagar, et al. (2005). "Identifying Control Motives in Managerial Ownership: Evidence from Antitakeover Legislation." The Review of Financial Studies 18(2): 637-672. Chidambaran, N. K., D. Palia, et al. (2006). Does Better Corporate Governance 'Cause' Better Firm Performance? SSRN. Comment, R. and G. W. Schwert (1995). "Poison or placebo? Evidence on the deterrence and wealth effects of modern antitakeover measures." Journal of Financial Economics 39(1): 3. DeAngelo, H., L. DeAngelo, et al. (2006). "Dividend policy and the earned/contributed capital mix: a test of the life-cycle theory." Journal of Financial Economics 81(2): 227. Dittmar, A., J. Mahrt-Smith, et al. (2003). "International Corporate Governance and Corporate Cash Holdings." Journal of Financial and Quantitative Analysis 38: 111-133. Easterbrook, F. H. (1984). "Two Agency-Cost Explanations of Dividends." American Economic Review 74(4): 650.

- 22 -
Erik, L. and W. Juergen (2000). Does the Governed Corporation Perform Better? Governance Structures and Corporate Performance in Germany, Center of Finance and Econometrics, University of Konstanz. Fahlenbrach, R. (2003). Shareholder Rights and CEO Compensation, SSRN. Fama, E. F. and K. R. French (2001). "Disappearing dividends: changing firm characteristics or lower propensity to pay?" Journal of Financial Economics 60(1): 3. Fenn, G. W. and N. Liang (2001). "Corporate Payout Policy and Managerial Stock Incentives." Journal of Financial Economics 60(1): 45. Gustavo, G. and M. Roni (2002). "Dividends, Share Repurchases, and the Substitution Hypothesis." Journal of Finance 57(4): 1649. Hoberg, G. and N. Prabhala (2005). "Disappearing Dividends: The Importance of. Idiosyncratic Risk and the Irrelevance of Catering." Working Paper. Hu, A. and P. Kumar (2004). "Managerial Entrenchment and Payout Policy." Journal of Financial and Quantitative Analysis 39: 759-790. Jensen, M. C. (1986). "Agency Cost of Free Cash Flow, Corporate Finance, and Takeovers." American Economic Review 76: 323-329. Jensen, M. C. and W. H. Meckling (1976). "Theory of the Firm: Managerial Behavior, Agency Costs and Ownership Structure." Journal of Financial Economics 3(4): 305. Karpoff, J. M. and P. H. Malatesta (1989). "The wealth effects of second-generation state takeover legislation." Journal of Financial Economics 25(2): 291. La Porta, R., F. Lopez-de-Silane, et al. (2000). "Agency Problems and Dividend Policies Around the World." The Journal of Finance, 55: 1-33. Lang, L. H. P., R. Stulz, et al. (1991). "A Test of the Free Cash Flow Hypothesis: The Case of Bidder Teturns." Journal of Financial Economics 29(2): 315. Malcolm, B. and W. Jeffrey (2004). "A Catering Theory of Dividends." Journal of Finance 59(3): 1125. Michaely, R. and F. Allen (2002). Payout Policy, SSRN. Michaely, R., R. H. Thaler, et al. (1995). "Price Reactions to Dividend Initiations and Omissions: Overreaction or Drift?" Journal of Finance 50(2): 573.

- 23 -
Morck, R., A. Shleifer, et al. (1990). "Do Managerial Objectives Drive Bad Acquisitions?" The Journal of Finance, 45(1): 31-48. Officer, M. S. (2007). "Dividend Initiations, Corporate Governance, and Agency Costs." Working Paper. Pan, C. H. (2007). Why are Firms With Entrenched Managers More Likely to Pay Dividends? SSRN. Paul, G., I. Joy, et al. (2003). "Corporate Governance And Equity Prices." The Quarterly Journal of Economics 118(1): 107. Stein, J. C. (1988). "Takeover Threats and Managerial Myopia." Journal of Political Economy 96(1): 61. Stulz, R. (1988). "Managerial control of voting rights: Financing policies and the market for corporate control." Journal of Financial Economics 20: 25.

- 24 -
Appendix:
Variable Definitions:
1. Total Asset (Assett). (Compustat item #6);
2. Book Equity (BEt). Defined as shareholders’ equity (Compustat item #216) [or total
liabilities (Compustat item #181), or common equity (Compustat item #60) +preferred
stock carrying value (Compustat item #130)] – preferred stock liquidating value
(Compustat item #10) [or preferred stock redemption value (Compustat item #56), or
preferred stock carrying value (Compustat item #130);
3. Market Equity (MEt). Defined as fiscal year end market price (Compustat item #199)
* common shares outstanding (Compustat item #25)
4. Dividend Dummy (DIVt). Defined as 1 if total dollar amount of dividends
(Compustat item #21) declared on the common stock of the firm during the year is
positive, 0 otherwise;
5. NYSE Percentile (NYPt). Defined as the percent of NYSE firms with the same of
lower market capitalization;
6. Market-to-Book Ratio (Vt/At). Defined as (Assett – BEt+ MEt)/ Assett;
7. Growth Rate of assets (dAt/At). Defined as (Assett-Assett-1)/Assett;
8. Profitability (Et/At). Defined as [income before extraordinary items (Compustat item
#18)+interest expense (Compustat item #15) + deferred taxes (Compustat item #50) if
available]/Assett;
9. Retained earnings to total capital (REt/TEt). Defined as Retained Earnings
(Compustat item #36)/ MEt;

- 25 -
10. Retained earnings to total capital (REt/TAt). Defined as Retained Earnings
(Compustat item #36)/ Assett;
11. Equal weighted dividend premium (EWt) and value weighted dividend premium
(VWt) are from (Baker and Wurgler 2004);
12. Idiosyncratic risk (Riskt). Defined as the standard deviation of residuals from a
regression of its excess returns (raw returns less the riskless rate) on the Fama and
French factors HML, SMB, and MKT;
13. Dividend propensity. Defined as the difference between Dividend Dummy (DIVt)
and expected probability of dividend payout. The expected probability of dividend
payout is calculates by the formula:
Pr (DIVt=1) =logit (-0.14+4.26 NYPt-0.81 Vt/At -1.07 dAt/At +15.57 Et/At) (1)
The coefficients of this formula are averages across years of Fama-MacBeth logit
regressions of the probability that a firm with given characteristics is a dividend payer
from 1963-1977, in the Compustat sample (Baker and Wurgler 2002);
14. Dividend payout ratio (DivRatio). Defined as total amount of dividend (Compustat
item #21) scaled by earnings (Compustat item #18);
15. Repurchase payout ratio. Defined as total amount of repurchase (the expenditure
on the purchase of common and preferred stocks (Compustat item # 115) minus any
reduction in the value (redemption value) of the net number of preferred shares
outstanding (Compustat item # 56)) scaled by earnings (Compustat item #18);
16. Total payout ratio. Defined as sum of dividend and repurchase scaled by earnings
(Compustat item #18).

- 26 -
Figure I Dividend Payout Pattern versus Time
Figure I show the change in Dividend Payout Pattern for the firms three years before and three years after passage of Anti-Takeover legislation. The year of passage of Anti-Takeover Legislation is considered time 0. Dividend payout ratio (DivRatio) is defined as total amount of dividend scaled by earnings. We only include firms with positive earnings and eliminate observations with a dividend payout ratio greater than one. Dividend propensity measures the difference between firms’ real dividend payout status and expected dividend payout status (details provided in the appendix).
Panel A
Relative Year -3 -2 -1 0 1 2 3 Total Firm Number 595 648 721 1234 1065 958 887 Payer Number 364 373 386 488 478 468 452 Payer Percent (%) 61.18 57.56 53.54 39.55 44.88 48.85 50.96
Before After DifferenceRelative Year -3 -2 -1 1 2 3 Dividend Propensity -0.074 -0.076 -0.115 -0.173 -0.159 -0.134 -5.62** Dividend Ratio 0.216 0.208 0.191 0.166 0.194 0.208 -2.27*
* p<0.05, ** p<0.01
Panel B

- 27 -
Panel C
Panel D

- 28 -
Figure II Repurchase and Total Payout Pattern versus Time
Figure II show the change in Repurchase Payout and Total Payout Pattern for the firms three years before and three years after passage of Anti-Takeover legislation. The year of passage of Anti-Takeover Legislation is considered time 0. Repurchase ratio is defined as total amount of repurchase scaled by earnings. Total payout ratio is defined as sum of dividend and repurchase scaled by earnings (details provided in the appendix).We only include firms with positive earnings and eliminate observations with a dividend payout ratio greater than one to make sample consistent with Figure I.
Panel A
Panel B

- 29 -
Panel C
Panel D

- 30 -
Table I State Anti-Takeover Legislation
Table I describes various Anti-Takeover legislation passage times in various states, which is obtained from Bertrand and Mullainathan (1999b).
Business Combination Law Fair Price Law Control Share Acquisition Law Arizona 1987 Arizona 1987 Arizona 1987 Connecticut 1989 Connecticut 1984 Hawaii 1985 Delaware 1988 Georgia 1985 Idaho 1988 Georgia 1988 Idaho 1988 Indiana 1986 Idaho 1988 Illinois 1984 Kansas 1988 Illinois 1989 Indiana 1986 Louisiana 1987 Indiana 1986 Kentucky 1989 Maryland 1988 Kansas 1989 Louisiana 1985 Massachusetts 1987 Kentucky 1987 Maryland 1983 Michigan 1988 Maine 1988 Michigan 1984 Minnesota 1984 Maryland 1989 Mississippi 1985 Mississippi 1991 Massachusetts 1989 Missouri 1986 Missouri 1984 Michigan 1989 New Jersey 1986 Nebraska 1988 Minnesota 1987 New York 1985 Nevada 1987 Missouri 1986 North Carolina 1987 North Carolina 1987 Nebraska 1988 Ohio 1990 Oklahoma 1987 New Jersey 1986 Pennsylvania 1989 Oregon 1987 New York 1985 South Carolina 1988 Pennsylvania 1989 Ohio 1990 South Dakota 1990 South Carolina 1988 Pennsylvania 1989 Tennessee 1988 South Dakota 1990 Rhode Island 1990 Virginia 1985 Tennessee 1988 South Carolina 1988 Washington 1990 Utah 1987 South Dakota 1990 Wisconsin 1985 Virginia 1988 Tennessee 1988 Wisconsin 1991 Virginia 1988 Wyoming 1990 Washington 1990 Wisconsin 1987 Wyoming 1989

- 31 -
Table II Descriptive Statistics
Table II presents descriptive statistics for the sample of 1,469 firms and an overall total of 11,524 firm year observations over the period 1981-1993. DIVt is a dummy variable, defined as 1 if total dollar amount of dividends declared on the common stock of the firm during the year is more than zero, 0 otherwise; NYPt is the percent of NYSE firms with the same of lower market capitalization; Vt/At is Market-to-Book Ratio; dAt/At is Growth Rate of Assets; Et/At is Profitability; Treat is one if a firm is incorporated in a state, which passed Anti-Takeover Laws, otherwise zero. Post is one after passage of the Anti-Takeover law for a certain company and zero otherwise. REt/TEt is retained earnings to total; REt/TAt is retained earnings to total capital; EWt is equal weighted dividend premium and VWt is value weighted dividend premium; Riskt is idiosyncratic risk (variable details provided in the appendix).
Variable Obs Mean Std. Dev. Min Max Key Variables DIVt 11524 0.521 0.500 0.000 1.000 Et/At 11524 0.048 0.157 -3.564 0.524 Vt/At 11524 1.859 2.458 0.275 84.229 NYPt 11524 0.332 0.301 0.050 1.000 dAt/At 11524 0.077 0.266 -11.004 0.989 treat 11524 0.858 0.349 0.000 1.000 treat*post 11524 0.505 0.500 0.000 1.000 Control Variables
REt/TEt 11524 0.234 1.386 -68.316 16.034
REt/TAt 11524 0.149 0.778 -24.235 3.539
EWt 11524 -34.038 7.862 -50.130 -23.530
VWt 11524 -9.834 6.478 -26.200 -1.020
Riskt 11523 0.031 0.022 0.000 0.497

- 32 -
Table III Variable Correlation Matrix
Table III presents variable correlation matrix for the sample of 1,469 firms and an overall total of 11,524 firm year observations over the period 1981-1993. DIVt is a dummy variable, defined as 1 if total dollar amount of dividends declared on the common stock of the firm during the year is more than zero, 0 otherwise; NYPt is the percent of NYSE firms with the same of lower market capitalization; Vt/At is Market-to-Book Ratio; dAt/At is Growth Rate of Assets; Et/At is Profitability; Treat is one if a firm is incorporated in a state, which passed Anti-Takeover laws, otherwise zero. Post is one after passage of the Anti-Takeover law for a certain company and zero otherwise. REt/TEt is retained earnings to total; REt/TAt is retained earnings to total capital; EWt is Equal weighted dividend premium and VWt is value weighted dividend premium; Riskt is idiosyncratic risk (variable details provided in the appendix).
DIVt Et/At Vt/At NYPt dAt/At treat Treat*Post REt/TEt REt/TAt EWt VWt Riskt DIVt 1.000 Et/At 0.274 1.000 Vt/At -0.137 -0.273 1.000 NYPt 0.524 0.250 0.027 1.000
dAt/At 0.009 0.338 0.052 0.108 1.000 treat 0.086 0.042 -0.009 0.143 0.007 1.000
Treat*Post -0.095 -0.048 0.012 0.023 -0.034 0.412 1.000
REt/TEt 0.210 0.197 -0.061 0.103 0.106 0.020 -0.061 1.000
REt/TAt 0.342 0.616 -0.314 0.244 0.163 0.027 -0.077 0.437 1.000
EWt -0.115 -0.058 -0.005 -0.039 -0.009 -0.009 0.481 -0.066 -0.073 1.000
VWt -0.126 -0.081 0.010 -0.032 -0.036 -0.008 0.499 -0.070 -0.077 0.751 1.000
Riskt -0.494 -0.340 0.060 -0.482 -0.150 -0.091 0.112 -0.265 -0.362 0.089 0.149 1.000
- 33 -
Table IV Dividend Payout Propensity Using Logit Regression
The dependent variable DIVt is a dummy variable, defined as 1 if total dollar amount of dividends declared on the common stock of the firm during the year is more than zero, 0 otherwise; NYPt is the percent of NYSE firms with the same of lower market capitalization; Vt/At is Market-to-Book Ratio; dAt/At is Growth Rate of Assets; Et/At is Profitability; Treat is one if a firm is incorporated in a state, which passed Anti-Takeover laws, otherwise zero. Post is one after passage of the Anti-Takeover law for a certain company and zero otherwise. REt/TEt is retained earnings to total; EWt is Equal weighted dividend premium; Riskt is idiosyncratic risk (variable details provided in the appendix).
DIVt DIVt DIVt DIVt DIVt DIVt DIVt Vt/At -0.827*** -0.503*** -0.511*** -0.418*** -0.722*** -0.502*** -0.420*** -0.041 -0.043 -0.043 -0.04 -0.044 -0.043 -0.041 dAt/At -1.093*** -0.978*** -0.956*** -1.084*** -0.985*** -0.977*** -1.081*** -0.269 -0.293 -0.292 -0.312 -0.292 -0.29 -0.315 Et/At 8.858*** 7.180*** 7.199*** 5.319*** 7.151*** 6.985*** 5.357*** -0.488 -0.536 -0.537 -0.529 -0.483 -0.538 -0.535 NYPt 5.378*** 5.209*** 5.223*** 3.556*** 5.421*** 5.261*** 3.502*** -0.128 -0.138 -0.139 -0.144 -0.143 -0.14 -0.147 Treat 0.400*** 0.317*** 0.067 0.172* 0.219** 0.153 -0.083 -0.086 -0.092 -0.096 -0.099 -0.101 Treat*Post -0.649*** -0.512*** -0.204*** -0.343*** -0.345*** -0.360*** -0.06 -0.069 -0.071 -0.103 -0.105 -0.107 REt/TEt 1.275*** 1.265*** 1.120*** 1.270*** 1.114*** -0.123 -0.123 -0.124 -0.123 -0.125 EW -0.015*** -0.018*** -0.004 -0.004 Riskt -67.285*** -68.942*** -3.991 -4.189 Year Effect NO NO NO NO YES YES YES Industry Effect NO YES YES YES YES YES YES Pseudo-R2 0.333 0.432 0.433 0.477 0.4 0.435 0.478 Observations 11524 11459 11459 11458 11459 11459 11458 * p<0.10, ** p<0.05, *** p<0.01

- 34 -
Table V Dividend Payout Ratio Using Difference-in-Difference Approach
The dependent variable Dividend payout ratio (DivRatio) is defined as total amount of dividend (Compustat item #21) scaled by earnings (Compustat item #18). To construct DivRatio variable, we only include firms with positive earnings. To mitigate the effect of outliers, we eliminate observations with a dividend payout ratio greater than one; Model 2 is truncated regression and others are ordinary least square regression; NYPt is the percent of NYSE firms with the same of lower market capitalization; Vt/At is Market-to-Book Ratio; dAt/At is Growth Rate of Assets; Et/At is Profitability; Treat is one if a firm is incorporated in a state, which passed Anti-Takeover laws, otherwise zero. Post is one after passage of the Anti-Takeover law for a certain company and zero otherwise. REt/TEt is retained earnings to total; Riskt is idiosyncratic risk (variable details provided in the appendix).
1 2 3 4 5 DivRatio DivRatio DivRatio DivRatio DivRatio Vt/At 0.001 0.032*** 0.006 0.01 0.011* -0.003 -0.005 -0.007 -0.007 -0.006 dAt/At -0.344*** -0.709*** -0.124*** -0.117*** -0.124*** -0.019 -0.034 -0.018 -0.017 -0.017 Et/At -0.885*** -1.887*** -2.013*** -1.952*** -1.958*** -0.068 -0.113 -0.091 -0.091 -0.09 NYPt 0.220*** 0.149*** 0.069** 0.080*** 0.046* -0.008 -0.012 -0.029 -0.029 -0.027 Treat 0.038*** 0.062*** -0.008 -0.012 Treat*Post -0.018*** -0.020*** -0.016** -0.015** -0.016** -0.006 -0.008 -0.007 -0.007 -0.007 REt/TEt 0.047*** 0.045*** -0.01 -0.01 Riskt -2.307*** -0.341 Year Effect NO NO YES YES YES Industry Effect NO NO YES YES YES R-Squared 0.177 0.702 0.704 0.709 Log likelihood 2013.0763 Observations 6121 5235 6121 6121 6121 * p<0.10, ** p<0.05, *** p<0.01