Embed Size (px)
Citation preview
Seediscussions,stats,andauthorprofilesforthispublicationat:https://www.researchgate.net/publication/279211594
AgglomerationofAgandTiO2nanoparticlesinsurfaceandwastewater:Roleofcalciumionsandoforganiccarbonfractions
ArticleinEnvironmentalPollution·September2015
DOI:10.1016/j.envpol.2015.05.034
CITATIONS
4
READS
27
4authors,including:
JacquelineTraber
Eawag,aquaticresearch
20PUBLICATIONS613CITATIONS
SEEPROFILE
İlhanTalinliIstanbulTechnicalUniversity
28PUBLICATIONS343CITATIONS
SEEPROFILE
Allin-textreferencesunderlinedinbluearelinkedtopublicationsonResearchGate,
lettingyouaccessandreadthemimmediately.
Availablefrom:JacquelineTraber
Retrievedon:21October2016

lable at ScienceDirect
Environmental Pollution 204 (2015) 313e323
Contents lists avai
Environmental Pollution
journal homepage: www.elsevier .com/locate/envpol
Agglomeration of Ag and TiO2 nanoparticles in surface andwastewater: Role of calcium ions and of organic carbon fractions
Emel Topuz a, b, *, Jacqueline Traber a, Laura Sigg a, Ilhan Talinli b
a Eawag, Swiss Federal Institute of Aquatic Science and Technology, CH-8600 Duebendorf, Switzerlandb Department of Environmental Engineering, Istanbul Technical University, Maslak, Istanbul, 34469, Turkey
a r t i c l e i n f o
Article history:Received 16 March 2015Received in revised form25 May 2015Accepted 27 May 2015Available online 6 June 2015
Keywords:Molecular weight fractionationBiopolymersNanomaterialsAgglomerationNatural water
* Corresponding author. Department of EnvironmTechnical University, Maslak, Istanbul, 34469, Turkey.
E-mail addresses: [email protected] (E. Topuz),(J. Traber), [email protected] (L. Sigg), [email protected]
http://dx.doi.org/10.1016/j.envpol.2015.05.0340269-7491/© 2015 Elsevier Ltd. All rights reserved.
a b s t r a c t
This study aims to investigate factors leading to agglomeration of citrate coated silver (AgNP-Cit), pol-yvinylpyrrolidone coated AgNPPVP and titanium dioxide (TiO2) nanoparticles in surface waters andwastewater. ENPs (1 mg/L) were spiked to unfiltered, filtered, ultrafiltered (<10 kDa and <1 kDa) sam-ples. Z-average particle sizes were measured after 1 h, 1 day and 1 week. AgNP-PVP was stable in allfractions of the samples and kept their original size around 60 nm over 1 week. Agglomeration of AgNP-Cit and TiO2 was positively correlated with Ca2þ concentration, but dissolved organic carbon concen-trations > 2 mg/L contributed to stabilizing these NP. Moreover, agglomeration of AgNP-Cit in the variousorganic matter fractions showed that high molecular weight organic compounds such as biopolymersprovide stabilization in natural water. A generalized scheme for the agglomeration behavior of AgNP-Cit,AgNP-PVP and TiO2 in natural waters was proposed based on their relation with Ca2þ, Mg2þ and DOCconcentration.
© 2015 Elsevier Ltd. All rights reserved.
1. Introduction
Nowadays, an increasing number of companies are attractingthe customer's interest with the consumer products that are con-sisting of engineered nanoparticles (ENPs) for a better functionalityor quality. Silver and TiO2 are among the most commonlyencountered nanoparticles applied in consumer products in recentyears (www.nanotechproject.org). However, their prevalent usageis of concern because of their possible release to the environment(Al-Kattan et al., 2014; Gondikas et al., 2014; Gottschalk andNowack, 2011; Hedberg et al., 2014; Kaegi et al., 2013; Lombiet al., 2014), which may result in exposure of the ecosystem com-ponents and lead to adverse effects (Ali et al., 2014). Agglomerationand dissolution studies are providing valuable contributions for thespeciation of the nanoparticles in the environment which areessential to develop an understanding of the mobility and trans-formation of ENPs. It is known that divalent cations can screen thesurface charge of the ENPs and lead to agglomeration because ofthe decreased energy barrier for stability based on Derjaguin-
ental Engineering, Istanbul
[email protected] (I. Talinli).
Landau-Verwey-Overbeek (DLVO) theory (Domingos et al., 2010).Presence of natural organic matter (NOM) may lead to steric sta-bilization due to their higher affinity to bind on the surfaces(Akaighe et al., 2011), but they may also cause agglomerationbecause of bridging effects between ENPs (Gao et al., 2009).
According to our previous study in synthetic media (Topuz et al.,2014), the agglomeration behavior of citrate coated Ag nano-particles (AgNP-Cit) and TiO2 depends on the concentration of Ca2þ
and the presence of NOM, which can provide steric stabilization ofparticle size over 1 week. In contrast, polyvinylpyrrolidone AgNP(AgNP-PVP) were stable over 1 week in the presence of various ionsexcept Mg2þ at high concentrations. Complexation of Ca2þ withcitrate (El Badawy et al., 2010) and Mg2þ with PVP coating (Topuzet al., 2014) can lead to agglomeration of AgNP-Cit and AgNP-PVP,respectively. Therefore, a surface water simulated medium wasproposed for the agglomeration studies. However, the behavior ofthese ENPs could differ in natural waters which are more complexwith various components, so that our motivation for this study wasto conduct agglomeration studies in natural water media toestablishmore realistic relations between agglomeration andwaterchemistry (Behra et al., 2013; Chambers et al., 2014; Yu et al., 2014).Although there are some studies conducted with natural watersamples, they are lacking in different aspects to make an overallevaluation for the agglomeration behavior of Ag and TiO2

E. Topuz et al. / Environmental Pollution 204 (2015) 313e323314
nanoparticles. Stabilization effect of dissolved organic carbon(DOC) in natural water samples was shown in some studies forAgNPs (Chinnapongse et al., 2011; Delay et al., 2011; Gao et al.,2009; Thio et al., 2012). Keller et al. (2010) concluded that theelectrophoretic mobility of TiO2, ZnO and CeO2 depends on ionicstrength and DOC by comparing their behavior in seawater, lagoon,river and groundwater. Ottofuelling et al. (2011) proposed a testscheme to predict the behavior of TiO2 in natural water (verifiedwith natural water samples) and suggested to apply similar ap-proaches to different kinds of ENPs and to study the effect ofdifferent types of NOM for further studies. Therefore, a detailedstudy for the prediction of agglomeration behavior of AgNPs islacking in the literature, as well as time resolution data for thestability of ENPs in natural water media (Reidy et al., 2013).Hammes et al. (2013) also classified European surface waters ac-cording to the colloid stability behavior, which was based ontheoretical calculations of Debye length, however without directcomparison to experimental data.
Furthermore, it is of interest to evaluate the ENP agglomerationbehavior in different fractions of natural water such as unfiltered,filtered, ultrafiltered (<10 kDa and <1 kDa cut-off) to understandwhich NOM fraction may have a dominant effect for stabilization ofENPs. Analyzing both unfiltered and filtered water is essential tocritically evaluate the experiments with synthetic water media interms of their relevance for the real environment. Louie et al. (2013)studied the agglomeration of gold nanoparticles in 2 differentSuwannee River NOM media with an average molecular weight of691 and 12.8 kDa, respectively. They showed that low amounts ofthe media with higher molecular weight were more effective fornanoparticle stabilization than high amounts of the media withlower molecular weight due to the steric effects.
This study has two major aims, namely first to examine thepossible correlations of the size levels of AgNP-Cit, AgNP-PVP andTiO2 after 1 h, 1 day and 1 week with the concentration of Ca2þ andDOC in natural waters of different composition. The second aim isto evaluate which fractions of the NOM are playing a major role forENP stabilization or agglomeration by fractionating natural watersamples by filtration and ultrafiltration. Therefore, this study pro-vides novelty to the literature with its results for the long termagglomeration (1 week) in different fractions of natural watersamples based on filtration and fractionation of organic matter bymolecular weight. The obtained results can then be applied for ENPrisk assessment to predict their size and fate in natural water, andso their hazard and exposure, and they can be used as a guide forthe preparation of exposure media for toxicity experiments.
2. Materials and methods
2.1. Chemicals
TiO2 P25 were obtained from Evonik Industries in powder formand AgNPs from NanoSys GmBH (Switzerland) as suspensions at1 g/L concentration. The manufacturers reported the nominal sizeof AgNPs (1 g/L) and TiO2 (0.1 mg/L) as 25 nm. TiO2 in powder formwas suspended in nanopure water (NW) to prepare a stock solution(100 mg/L), and sonication in a bath sonicator was applied to bothstock and working suspensions of TiO2 for 2 h. Agglomeration ex-periments were conducted with daily prepared working suspen-sions of AgNP-Cit, AgNP-PVP and TiO2 (5 mg/L) in NW. The Z-average sizes of AgNP-Cit, AgNP-PVP and TiO2 (1 mg/L) in NWwere61 ± 0.6 nm, 42 ± 0.4 nm and 317 ± 85 nm, respectively.
2.2. Sample site selection
Samples were taken from six surface water sources and three
wastewater treatment plants. The critical parameters for theagglomeration of ENPs (Ca2þ, Mg2þ, DOC and alkalinity), at theirrespective concentrations (Topuz et al., 2014) were employed tomake a preliminary classification for the sample site selection,based on the rivers in the NADUF (National long-term surveillanceof Swiss rivers) project database (http://www.bafu.admin.ch/).Concentration ranges were assigned for each parameter (Table S1in Supporting Information (SI)) and 8 classes were developed notto miss out a critical concentration level. The sample numbers wereoptimized to have one representative sample for each class. Finally,five river sampling sites (Glatt-Rheinsfelden, Thur-Andelfingen,Aare Brugg, Rhein- Rheinsfelden, Rhein- Diepoldsau) wereselected. The peat bog lake Etang de la Gru�ere with a very high(13.1 mg/L) concentration of DOC compared to river water sampleswas also included in the samples to observe a marginal class.Wastewater treatment plants (WWTPs) were selected consideringthe population they serve and their configuration which likelycause differences in terms of wastewater characteristics. All of theunits in one of the selected WWTPs were sampled to investigatethe possible differences in agglomeration behavior of ENPs atdifferent stages of WWTP. Duebendorf WWTP (Duebendorf,Switzerland) was selected for sampling unit by unit since it hasadvanced biological wastewater treatment technology for theremoval of nutrients (nitrogen and phosphorus). In addition, Due-bendorf WWTP serves more than 50,000 Population Equivalency(PE) which means that high organic matter load is expected in theeffluent sample. Effluent and influent samples were taken from twoother WWTPs to examine the possible effect of different treatmentconfigurations for biological wastewater treatment. Kuesnacht andZumikon were selected to represent relatively lower PE anddifferent treatment technologies (Table S2). Samples were taken inglass bottles, which were muffled at 550 �C for 24 h in order toprevent organic matter contamination. All samples were filtered assoon as they were brought to laboratory and kept at 4 �C for theexperiments and ultrafiltration.
2.3. Characterization of nanoparticle suspensions and water quality
Major ions were analyzed by ion chromatography according tostandard methods at the analytical laboratory of Eawag. Each mo-lecular weight fraction of the water samples was analyzed withLiquid Chromatography-Organic Carbon Detection-Organic Nitro-gen Detection (LC-OCD-OND) which is based on the theory of SizeExclusion Chromatography-OCD technique (Huber et al., 2011) toidentify the concentrations of biopolymers, humic substances,building blocks, low molecular weight humics and acids, neutrals.Zetasizer (Nano ZS, Malvern Instruments) equippedwith a red laser(633 nm)was used for DLSmeasurements. Z-average size (based onintensity mean) was measured in triplicate with at least 12 sub-measurements and zeta potential (ZP) was calculated from elec-trophoretic mobility using the Henry equation. ENPs were imagedin selected samples with NTA using a NanoSight LM10 equippedwith a LM14 temperature controller (NanoSight Ltd.). NanoSightNTA 2.2 Software was used to get mode and mean size of the ENPsin suspension with analyzing at least 3 different videos of ENPs.UVIKON 930 (Kontron Instruments) was used to measure UVevisabsorbance of AgNP suspensions in selected samples between 200and 800 nm.
2.4. Experimental set up
Samples were fractionated as shown in Figure S1. This frac-tionation scheme is based on preliminary experiments performedwith water from the small stream Chriesbach (Duebendorf,Switzerland). These preliminary experiments showed that AgNP-

Table 1Characterization of water quality for surface water samples.
Parameter (mM) Glatt Thur-Andelfingen AareBrugg Rhein-Rheinsfelden Rhein-Diepoldsau Etang de la Gruere
pH 8.26 8.20 8.16 8.27 7.98 6.56Alkalinity 4.83 4.05 3.08 2.86 1.89 0.69Hardness 2.67 2.20 1.82 1.74 1.18 0.40Naþ 1 0.6 0.3 0.28 <MQL 0.49Kþ 0.2 0.2 0.1 0.04 <MQL <MQLCaþþ 2 1.7 1.6 1.3 0.9 0.3Mgþþ 0.7 0.5 0.3 0.38 0.2 <MQLCl- 1 0.5 0.2 0.26 0.14 0.54NO3
� 0.1 0.04 0.03 0.02 0.01 <MQLSO4
2� 0.2 0.12 2.3 0.32 0.27 <MQLIonic Strength 6.9 5.3 4.6 4.3 2.8 1.1
DOC (mg/L) filtered (<0.2 mm) 1.55 1.99 3.82 1.36 0.929 13.1
DOC (mg/L) ultrafiltered(<10 kDa) 1.50 1.76 2.14 1.29 0.645 4.67
DOC (mg/L) ultrafiltered(<1 kDa) 1.25 1.49 1.58 1.16 0.624 3.26
Table 2Characterization of water quality for wastewater samples.
Parameter (mM) Duebendorfinfluent
Aerated Anaerobic Biologicaleffluent
Clarificationeffluent
Filtrationeffluent
Kuesnachtinfluent
Kuesnachteffluent
Zumikoninfluent
Zumikoneffluent
pH 8.0 7.91 7.81 7.99 7.81 7.96 8.22 7.67 8.00 6.70Alkalinity 9.09 6.91 8.46 6.29 6.91 6.93 5.84 3.29 5.2 1.35Hardness 3.47 3.47 3.40 3.30 3.31 3.32 2.42 2.46 2.42 2.43Naþ 5.25 5.29 5.17 3.96 5.35 5.41 3.74 2.49 2.58 2.93Kþ 0.70 1.04 0.89 0.62 0.83 0.84 0.57 0.59 0.67 0.73Caþþ 2.52 2.59 2.52 2.43 2.46 2.49 1.79 1.74 1.57 1.72Mgþþ 0.85 0.79 0.83 0.77 0.76 0.77 0.69 0.64 0.57 0.59Cl- 3.87 4.3 4.04 3.13 3.96 3.83 2.95 2.18 2.08 2.85NO3
� <0.05 0.18 <0.05 0.13 0.18 0.18 <0.05 0.23 0.1 0.47SO4
2� 0.53 0.56 0.55 0.54 0.58 0.59 0.44 0.59 0.69 1.10Ionic Strength 25.4 26.6 25.7 22.8 25.5 25.7 9.44 8.70 8.38 10.33DOC (mg/L) filtered
(<0.2 mm)60.7 6.8 9 5 7.3 6.5 24.3 3.5 16.1 3.1
DOC (mg/L) ultrafiltered(<10 kDa)
53.8 5.7 6.8 4 5.7 5.5 17.8 3.0 11 2.9
DOC (mg/L) ultrafiltered(<1 kDa)
49.2 4.9 6.3 1.6 5.1 4.8 11.7 2.5 9.7 2.7
Table 3Concentration of organic matter compounds in the fractions of surface water and wastewater effluent samples (mg/L).
Samples Dissolved organiccarbon
Biopolymers
Humicsubstances
Buildingblocks
Low MolecularWeighthumics
Low MolecularWeightacids
Neutrals
Rhein-Rheinsfelden-< 0.2 mm 1357 41 836 203 53 0 184Rhein-Rheinsfelden e <10 kDa 1289 6 817 166 56 0 159Rhein-Rheinsfelden e <1 kDa 1155 1 637 166 64 0 183Etang de la Gruere e < 0.2 mm 13058 82 9370 1182 333 0 1595Etang de la Gruere e <10 kDa 4670 14 2791 770 219 0 461Etang de la Gruere e <1 kDa 3257 6 1582 566 179 59 514Thur Andelfingen e < 0.2 mm 1994 68 943 319 89 0 394Thur Andelfingen e <10 kDa 1756 5 957 239 112 0 277Thur Andelfingen e <1 kDa 1488 1 663 275 99 14 300Glatt e Rheinsfelden e < 0.2 mm 1552 63 770 202 79 0 235Glatt e Rheinsfelden e <10 kDa 1504 4 874 273 67 0 183Glatt e Rheinsfelden e <1 kDa 1248 1 630 228 66 17 219Aare Brugg e < 0.2 mm 3821 63 848 471 140 944 1184Aare Brugg e <10 kDa 2139 21 888 417 140 35 445Aare Brugg e <1 kDa 1584 3 926 252 74 0 219Rhein-Diepoldsau e < 0.2 mm 929 44 543 106 51 0 148Rhein-Diepoldsau e <10 kDa 645 8 318 74 46 13 134Rhein-Diepoldsau e <1 kDa 624 0 311 70 48 12 148Zumikon Effluent e < 0.2 mm 3088 161 900 691 105 56 700Zumikon Effluent e <10 kDa 2884 24 813 643 101 98 671Zumikon Effluent e <1 kDa 2674 16 716 622 89 92 633Kuesnacht Effluent e < 0.2 mm 3515 195 1059 687 123 38 722Kuesnacht Effluent e <10 kDa 2974 9 929 617 106 45 659Kuesnacht Effluent e <1 kDa 2475 4 720 538 93 59 593
E. Topuz et al. / Environmental Pollution 204 (2015) 313e323 315

Fig. 1. Z-Average size levels of AgNP-Cit in different fractions of surface water samples (Error bars represents the standard deviation of triplicates).
E. Topuz et al. / Environmental Pollution 204 (2015) 313e323316
Cit were better stabilized in unfiltered samples than in filteredsamples and that samples filtered over 0.2 mmand 0.45 mm resultedin very similar Z-Average sizes. The second trials showed thatMinimate Tangential Flow Filtration (TFF) Capsule (Pall Coop.)capsules were effective for molecular weight fractionation oforganic matters under 10 kDa and 1 kDa cut off and that agglom-eration levels were different for these fractions (Figure S2).Therefore, unfiltered, 0.2 mm filtered, < 10 kDa and <1 kDa cut offfractions were included in the experiments. After an aliquot wasput aside as unfiltered water, remaining samples were filtered over0.2 mm filters (Cellulose acetate filters, Millipore) under vacuum.For the <10 kDa and <1 kDa cut off, filtered samples were passedthrough TFF of 10 kDa and 1 kDa, respectively. A water sample wasfed from a stirring cell inlet to the TFF capsulewith a vacuum pump,and the filtrate was collected in muffled glass bottles. Beforefiltering each sample, capsules were backwashed and flushed withNW until DOC was under limit of detection. Water quality param-eters were measured only in the 0.2-mm filtered fraction, whereasorganic matter characterizationwas performed for the <0.2 mmand
the <10 kDa and <1 kDa ultrafiltered fractions. Agglomeration ex-periments for unfiltered and filtered samples were conductedwithin 5 h as soon as they were brought to laboratory. Molecularweight fractionations of filtered samples were completed within24 h.
Three replicates of the samples were spiked with 1 mg/L ofENPs, shaken at 100 rpm for 1 h and time series measurementswere done with DLS after 1 h, 1 day and 1 week. The concentrationof ENPs, spiking procedure and agglomeration experiments were asdefined previously in Topuz et al. (2014) which are also quoted inSupporting Information of this study.
3. Results
3.1. Characterization of sample sites
NADUF project database provided a precise selection of themost representative surface waters for the corresponding classesin Table S1, since the water quality characterization of the samples

Fig. 2. Z-Average size levels of AgNP-PVP in different fractions of surface water samples (Error bars represents the standard deviation of triplicates).
E. Topuz et al. / Environmental Pollution 204 (2015) 313e323 317
(Tables 1 and 2) were similar to the average concentrations in theNADUF database. All filtered samples were analyzed with DLS andthe Z-average sizes and zeta potentials were between 100 and200 nm and �10: �20 mV, respectively (Table S3). LC-OCD-ONDresults for organic matter characterization are presented inTable 3 and chromatograms are provided in Figure S3e4. Averagemolecular weights of biopolymers and humic substances weremuch higher than 10 kDa and around 1 kDa, respectively. Organicmatter compounds with average molecular weights lower than1 kDa include building blocks, lowmolecular weight humics, acidsand neutrals. In all natural waters, the most abundant fractionconsisted of humic substances, whereas biopolymers and lowermolecular weight acids were present at lower concentrations.
3.2. Agglomeration behavior of ENPs in surface water andwastewater
Agglomerations of ENPs were characterized with the change in
size measured with DLS. The data quality was checked withpolydispersity indexes which were lower than 0.5 if not otherwisespecified. The sizes of AgNPs for 1 h experiments were alsochecked with NTA measurements (Table S4) and they were com-parable for most of the samples in which AgNPs had mean size upto 200 nm. Rhein-Rheinsfelden sample (having an average DOCand Ca2þ concentration) were tested with UVeVis Spectrometer(Figure S5). AgNP-Cit in Rhein-Rheinsfelden has a broader peakand smaller absorbance than in NW showing that it wasagglomerated after 1 h. AgNP-PVP resulted in almost the samepeak in NW and in Rhein-Rheinsfelden showing its stability innatural water. The results were comparable with the results of DLSand NTA. Therefore, evaluations for all samples were made withDLS measurements. Zeta potentials were in the range �10to �20 mV for all samples (Figures S6e16), and no clear trend wasobserved.
Z-average sizes of AgNPs and TiO2 in Rhein- Diepoldsau andEtang de la Gru�ere samples followed a different trend from other
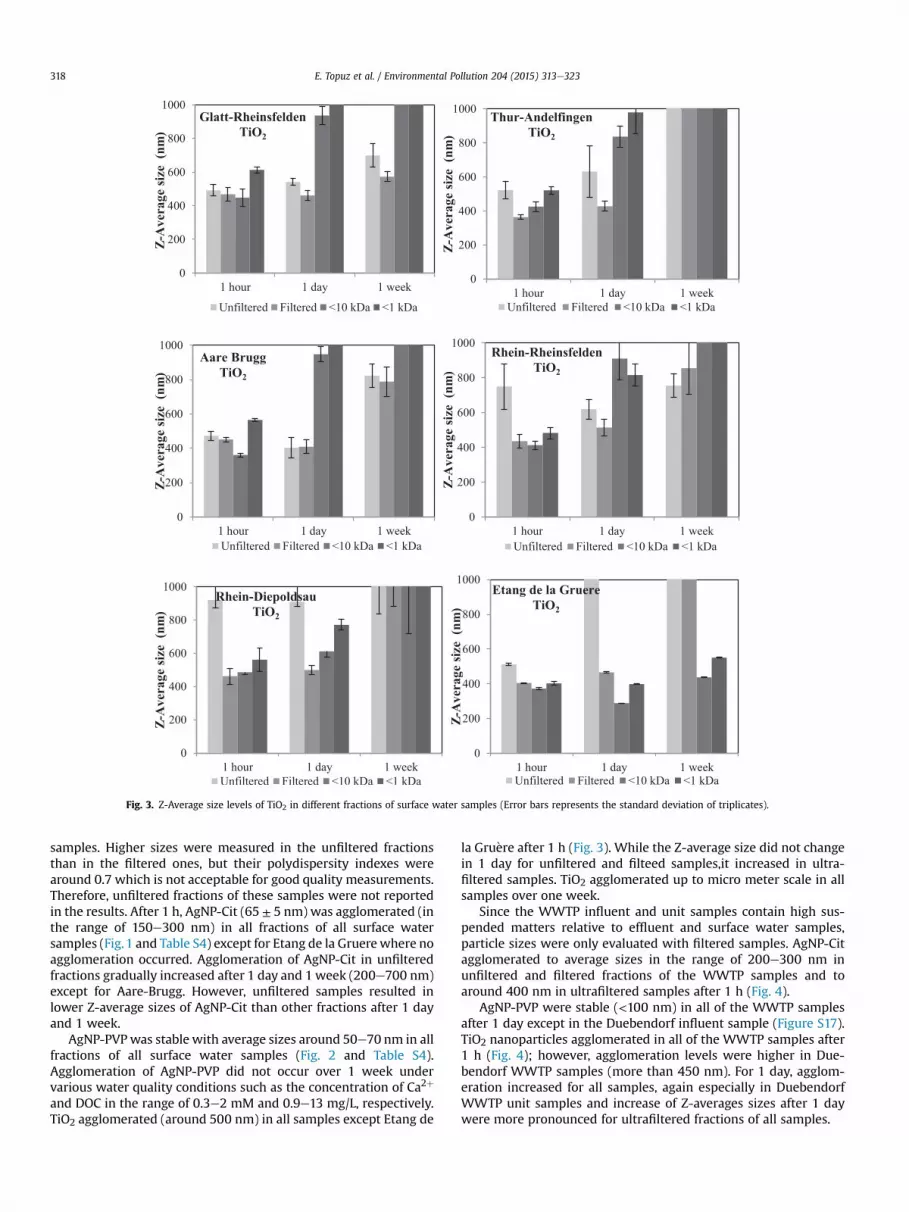
Fig. 3. Z-Average size levels of TiO2 in different fractions of surface water samples (Error bars represents the standard deviation of triplicates).
E. Topuz et al. / Environmental Pollution 204 (2015) 313e323318
samples. Higher sizes were measured in the unfiltered fractionsthan in the filtered ones, but their polydispersity indexes werearound 0.7 which is not acceptable for good quality measurements.Therefore, unfiltered fractions of these samples were not reportedin the results. After 1 h, AgNP-Cit (65 ± 5 nm) was agglomerated (inthe range of 150e300 nm) in all fractions of all surface watersamples (Fig.1 and Table S4) except for Etang de la Gruerewhere noagglomeration occurred. Agglomeration of AgNP-Cit in unfilteredfractions gradually increased after 1 day and 1 week (200e700 nm)except for Aare-Brugg. However, unfiltered samples resulted inlower Z-average sizes of AgNP-Cit than other fractions after 1 dayand 1 week.
AgNP-PVPwas stable with average sizes around 50e70 nm in allfractions of all surface water samples (Fig. 2 and Table S4).Agglomeration of AgNP-PVP did not occur over 1 week undervarious water quality conditions such as the concentration of Ca2þ
and DOC in the range of 0.3e2 mM and 0.9e13 mg/L, respectively.TiO2 agglomerated (around 500 nm) in all samples except Etang de
la Gru�ere after 1 h (Fig. 3). While the Z-average size did not changein 1 day for unfiltered and filteed samples,it increased in ultra-filtered samples. TiO2 agglomerated up to micro meter scale in allsamples over one week.
Since the WWTP influent and unit samples contain high sus-pended matters relative to effluent and surface water samples,particle sizes were only evaluated with filtered samples. AgNP-Citagglomerated to average sizes in the range of 200e300 nm inunfiltered and filtered fractions of the WWTP samples and toaround 400 nm in ultrafiltered samples after 1 h (Fig. 4).
AgNP-PVP were stable (<100 nm) in all of the WWTP samplesafter 1 day except in the Duebendorf influent sample (Figure S17).TiO2 nanoparticles agglomerated in all of the WWTP samples after1 h (Fig. 4); however, agglomeration levels were higher in Due-bendorf WWTP samples (more than 450 nm). For 1 day, agglom-eration increased for all samples, again especially in DuebendorfWWTP unit samples and increase of Z-averages sizes after 1 daywere more pronounced for ultrafiltered fractions of all samples.

Fig. 4. Z-Average size levels in different fractions of wastewater samples (Error bars represents the standard deviation of triplicates).
E. Topuz et al. / Environmental Pollution 204 (2015) 313e323 319
4. Discussion
4.1. Role of Ca2þ and dissolved organic matter concentration insurface and wastewater for the agglomeration of ENPs
Unfiltered fractions of Rhein- Diepoldsau and Etang de la Gru�eresamples reveal that surface waters with high natural suspendedmatters may result in unexpected agglomeration behavior for ENPsdue to the possibility of heteroaggregation or misleading results ofDLS due to overestimation. Z-Average sizes of ENPs were signifi-cantly higher in unfiltered fractions than in filtered ones for onlythese 2 samples (10 samples in total). Although it is known that DLSis not sensitive for the samples with high colloidal matter andpolydispersity index (>0.7) were the highest for these samples,heteroaggregation also seems to be critical for the regulation of theagglomeration behavior in natural water samples with highersuspended matter (Quik et al., 2014). In such cases, the hetero-aggregation process may be predominant and lead to higher Z-Average size levels of ENPs independently from the concentrationof Ca2þ and DOC in natural water. Therefore, heteroaggregation ofENPs in natural water, which was not in the scope of this study,should be further studied in the future to make its role clear for theagglomeration of ENPs in natural water.
For the agglomeration of AgNP-Cit in 1 h, correlations betweenZ-average size of ENPs and Ca2þ concentrations were examined infiltered fractions to be able to include Rhein Diepoldsau and Etangde la Gruere samples, since there were no significant differencesbetween average sizes in unfiltered and 0.2 mm filtered fractions ofthe other samples. Z-average sizes of AgNP-Cit in filtered surfacewater and wastewater samples (n ¼ 16) after 1 h were highlycorrelated with the concentration of Ca2þ (R2:0.741), as shown inFig. 5a. It was clear that the effect of divalent cations in electronicdouble layer suppression was the predominant factor resulting in
higher Z-average size levels and the effect of Ca2þ was more pro-nounced than of Mg2þ due to its affinity for complexation with thecitrate coating (El Badawy et al., 2010). Moreover, most of the datapoints, which slightly deviate from the regression line, wereattributed to the DOC concentration in the corresponding samples,which was thus the secondary parameter affecting the agglomer-ation of AgNP-Cit. It is known that NOM can improve the stability ofAgNP-Cit which may be due to the replacement of citrate coatingswith the natural organic matter and may lead to both steric andcharge stabilization (Cumberland and Lead, 2009). The sampleswith high DOC concentration (>3.8 mg/L) (except for Kuesnacht,Zumikon effluent and Duebendorf anaerobic tank sample) resultedin lower Z-average sizes of AgNP-Cit than expected from the cor-relation in Fig. 5a, whereas lower DOC concentration (<2 mg/L) ledto higher agglomeration than expected from correlation especiallywhen the Ca2þ concentration was also higher than 1.5 mM (Glatt-Rheinsfelden and Thur-Andelfingen).
King and Jarvie (2012) hypothesized that high DOC can suppressthe cation effect. Based on the data in Fig. 5a, DOC higher than2mg/L appears to be effective. However, AgNP-Cit agglomeration inWWTP influent samples was slightly stronger than expected inspite of their high DOC concentration which could be due to theirmore complex composition.
Z-average sizes of AgNP-Cit in surface water simulated media(Ca: 2 mM, DOC: 5 mg/L) in our previous study (Topuz et al., 2014)were also lower than expected from correlations as shown in Fig. 5(blue data point) because of the high DOC concentration (>2 mg/L).Gao et al. (2009) and Thio et al. (2012) also demonstrated that Z-average sizes of AgNP-Cit in filtered freshwater samples were lowerthan 100 nm (Ca < 0.5 mM) and around 150 nm (Ca:1 mM),respectively, which were fitting with our correlation.
For the agglomeration of AgNP-Cit in 1 day, the correlation be-tween Z-Average size levels and Ca2þ concentration were made for

Fig. 5. Correlation of Z-Average size of AgNP-Cit and Ca2þ concentration a) in filtered samples after 1 h b) in unfiltered samples after 1 day (Error bars represents the standarddeviation of triplicates. Green data points represent surface water samples and red data points represent the wastewater samples. Blue data points show Z-average size of AgNP-Citin freshwater simulated medium which was reported in Topuz et al., 2014). (For interpretation of the references to color in this figure legend, the reader is referred to the webversion of this article.)
E. Topuz et al. / Environmental Pollution 204 (2015) 313e323320
unfiltered water to be realistic since filtered fractions lead to muchhigher Z-average size levels. The correlation (Fig. 5b; R2:0.54) waslower than for 1 h showing the less pronounced effect of Ca2þ in 1day than in 1 h. After 1 week, the agglomeration trend and the roleof parameters were similar to the results of after 1 day. Stabilizationof AgNP-Cit after 1 day up to 1 week could be attributed toreplacement of citrate coating of AgNP with DOC after 1 day. Inaddition to the similarity of Z-average sizes of AgNP-Cit after1 hour,the time resolution results were also consistent with our previousstudy in which surface water simulated media were used (Topuzet al., 2014). With synthetic media including only ions, agglomer-ation of AgNP-Cit were very high (up to 1000 nm after 1 day) in thecases of Ca2þ concentration between 1.7 and 3.3 mM. On the other
hand, the agglomeration (350 nm after 1 week) of AgNP-Cit in thesurfacewater simulatedmedia including ions, NOM and surfactants(Ca: 2 mM and DOC 5 mg/L) was very slight due to the stabilizationeffect of DOC.
Owing to the steric hindrance of PVP with its bulky neutralstructure (Thio et al., 2012) and strong bonds with N atoms (Kviteket al., 2008), AgNP-PVP were stable in all of the unfiltered watersamples and kept their original size over 1 week in the presence ofCa2þ concentration up to 2.5 mM and Mg2þ concentration up to0.8 mM (Fig. 2). El Badawy et al. (2010) also stated that AgNP-PVPwas stable despite of high ionic strength. However, agglomerationof AgNP-PVP only occurred in the filtered fraction of Duebendorfinfluent sample after 1 day which had the highest Mg2þ

Fig. 6. Correlation of Z-Average size of TiO2 and Ca2þ concentration in the filteredsamples after 1 h (Error bars represents the standard deviation of triplicates. Greendata points represent surface water samples and red data points represent thewastewater samples. Blue data point shows Z-average size of TiO2 in a freshwatersimulated medium (Topuz et al., 2014). (For interpretation of the references to color inthis figure legend, the reader is referred to the web version of this article.)
E. Topuz et al. / Environmental Pollution 204 (2015) 313e323 321
concentration (0.85 mM). In our previous study, presence of Mg2þ
(>2.5 mM) also led to agglomeration of AgNP-PVP which could bedue to the specific interactions between PVP and Mg2þ, however,surface water simulated media (Mg2þ: 0.5 mM) provided stabilityover 1 week (Topuz et al., 2014). Apparently, AgNP-PVP has po-tential to be affected by the presence of high Mg2þ concentrationswhich are not commonly detected in surface or wastewatermedia.
Although Z-average size levels of TiO2 in unfiltered samples after1 h were slightly increasing with increasing concentration of Ca2þ,there was no clear correlationwith Ca2þ concentrations (R2¼ 0.274)(Fig. 6). However, TiO2 in Kuesnacht and Zumikon WWTP samplesand Thur-Andelfingen were stabilized around their original sizewhich might be due to the high DOC concentration in the samples.In a similar way as for AgNP-Cit, agglomeration effect of Ca2þ wassuppressed by high DOC concentration (DOC > 2 mg/L), whereas it
Fig. 7. A generalized scheme for the agglomeration behavior of
did not happen in the case of high Ca2þ concentration (>2.5 mM).When the correlation was applied again by omitting the sampleswith DOC >2 mg/L, it was improved significantly (R2: 0.569).Therefore, TiO2 agglomerates up to the same levels (350e550 nm)for a wide range of Ca2þ concentration (0.3e2.5 mM) and is onlystabilized in the case of low Ca2þ (<1.8 mM) and high DOC con-centration. Moreover, TiO2 agglomerated to the same levels in sur-face water simulated media including 2 mM of Ca2þ and 5 mg/L ofNOM (Topuz et al., 2014), which was similar to the correlation asshown in Fig. 6 (blue data point). (For interpretation of the refer-ences to color in this figure legend, the reader is referred to the webversion of this article.)
Shih et al. (2012) and Mukherjee and Weaver (2010) alsoshowed that Z-average size levels of TiO2 in synthetic mediabecame around 600 nm (Ca: 1e10 mM) and 450 nm (Ca: 3e5 mM),respectively. Although there was a slight increase in Z-averagelevels of TiO2 after 1 day, they were not significantly different fromthe levels after 1 h which shows that agglomeration of TiO2nanoparticles mostly occur within 1 h. However, agglomeration ofTiO2 in surface water was nearly up to micrometer scales over1week. In conclusion, TiO2 was only slightly affected by Ca2þ andDOC concentration after 1 day or 1 week.
4.2. Role of dissolved organic matter fractions for agglomeration ofENPs
The biopolymer fraction which comprises mostly poly-saccharides and proteins (Stewart et al., 2013) decreased dramati-cally for 10 kDa cut off. The humic acid fractions were lower in10 kDa cut off than in filtered sample only in the case of Etang de laGru�ere, where humic acids of terrestrial origin may be predomi-nant. Z-average sizes of ENPs in unfiltered water, 0.2 mm filtered, <10 kDa and <1 kDa cut off fractions were compared over 1 week.
As it is expected due to the strong steric stabilization of PVP forAgNP particles, AgNP-PVP were stable in all fractions over 1 week(Fig. 2). After 1 day, Z-average sizes of AgNP-Cit in unfiltered,filtered and 10 kDa cut off fractions became different for all samples(Fig. 1) except Gruere with low Ca2þ concentration and very highcontent of humic substances. Unfiltered water samples, except
AgNP-Cit, AgNP-PVP and TiO2 in surface and wastewater.

E. Topuz et al. / Environmental Pollution 204 (2015) 313e323322
Rhein-Diepoldsau, resulted in the lowest Z-average sizes of AgNP-Cit and Z-average sizes in filtered samples were significantlyhigher than in unfiltered water (Fig. 1). Moreover, 10 kDa cut off ledto high agglomeration of AgNP-Cit in Thur-Andelfingen, Rhein-Rheinsfelden and Rhein-Diepoldsau (Fig. 1) samples like the syn-thetic media including only ions (Topuz et al., 2014). It was likelydue to the fact that high molecular weight organic compounds(>10 kDa) provide stabilization after 1 day up to 1 week and thatthose compounds were removed by ultrafiltration. Aare Bruggsample has the highest concentration of biopolymers in <10 kDacut off, which might be the reason for similar Z-average sizes ofAgNP-Cit in all fractions. Although the concentration of bio-polymers were relatively low in filtered samples (>10 kDa), thesebiopolymers may be more effective in stabilizing NPs, as alsomentioned by Louie et al. (2013) for the stabilization of Au nano-particles by high molecular weight compounds at very low con-centration levels. Joshi et al. (2012) and Dimpka et al. (2011) figuredout that extracellular polymeric substances, which are a kind ofbiopolymers, caused induction of aggregation of AgNPs. Humicacids were also proved to provide more electrostatic stabilizationfor AgNP-PVP under high ionic strength conditions due to theirhigh molecular weight (Yang et al., 2014).
TiO2 had the same Z-average size levels in all fractions of thesamples after 1 h (Fig. 3) whichmight prove the previous argumentin Section 4.2 that TiO2 was not significantly affected by Ca2þ orDOC concentration in short term. However, TiO2 was usually morestable in filtered samples than in unfiltered fractions after 1 day formost of the samples (Fig. 3). This could be due to the fact that itshigher original size and low zeta potential at pH 7e8 make it morevulnerable to heteroaggregation than AgNP-Cit. Within 1 day, TiO2was more stable in filtered samples (>10 kDa) (Fig. 4), which alsoseems to be due to the presence of high molecular weight organiccompounds. TiO2 was more stabilized in Etang de la Gru�ere filteredand ultrafiltered samples with high amounts of humic substances.Thio et al. (2011) also showed that deposition of TiO2 nanoparticleswere decreased in the presence of humic acid with high molecularweight organic fractions. Gondikas et al. (2012) mentioned theimportance of molecular weight and aromaticity of organic carbonfor the aggregation process of TiO2 and accelerating effect of lowmolecular weight compounds on aggregation. Nevertheless, TiO2agglomerated up tomicrometer scale after 1 week in all fractions ofmost samples (Fig. 3). According to our study with natural watersamples, significantly higher Z-average sizes of AgNP-Cit and TiO2in filtered fractions than in unfiltered ones also indicate the role ofhigher molecular weight organic matter fractions, such as bio-polymers for stabilization over time.
5. Conclusion
A generalized scheme for the agglomeration behavior of AgNP-Cit, AgNP-PVP and TiO2 in natural waters might be proposed basedon their relation with Ca2þ, Mg2þ and DOC concentration (Fig. 7).Since AgNP-Cit was more sensitive to various natural water con-ditions, a more detailed classification approach in terms ofagglomeration is proposed in Figure S18. If the Ca2þ concentrationis lower than 0.5 mM, the agglomeration potential is not consid-ered, whereas, for higher concentrations, 7 classes with differentsize levels were developed for different Ca2þ concentrations.However, heteroaggregation potential and the pH of surface waterwhich are not tested in this study (out of 6.26e8.27) should beconsidered for the possible deviations from Fig. 7 and Figure S18.
Furthermore, it is suggested to decrease the number of samplesconsidering the results of this study and develop a scheme (if itwould be different) for lower concentrations of these ENPs (moreenvironmentally relevant) with advanced size characterization
techniques. Correlations suggested in this study can be applicablefor the environmental risk assessment studies. Firstly, they couldgive an idea in which compartment they could partition in surfacewater or wastewater treatment plants such as water column vssediment or effluent water vs sewage sludge, respectively. Espe-cially for surface water bodies, they can easily be used in fatemodels or water quality models since they provide estimationsover time which makes spatial distribution analysis possible. Inaddition, the predictions for the partition provide foresights abouttheir bioavailability to the organisms which live respective com-partments of the medium.
Agglomeration of ENPs in natural water is also affected by themolecular weight based fractions of organic matter. The high mo-lecular weight organic carbon fraction (>10 kDa), mostlycomprising biopolymers, provides stabilization of ENPs in even atvery low concentrations and this effect becomes more pronouncedin 1 day. Therefore, the studies conducted with filtered water or thestudies which omit the presence of high molecular weight organiccarbon could lead to overestimated size results of ENPs especiallyfor the long term (1 day-week). Our results showing the higherstability in unfiltered samples compared to filtered ones highlightthe importance of studying with mesocosms for both fate andtoxicity evaluations for more realistic approaches. However, morestudies should be conducted with applying molecular weightfractionation to the natural water samples to better understand themechanism of this effect. Further studies are suggested to investi-gate the kinetics of the stabilization depending on the concentra-tion levels and different structures of organic matter present insurface and wastewater media.
Acknowledgment
The authors would like to thank David Kistler and Niksa Odzakfor their support for the sampling and AUA laboratory at EAWAG forthe water quality characterization. This study was funded by theScientific and Technological Research Council of Turkey (TUBITAK)2211 and 2214 Grant Program and Istanbul Technical University,Scientific Research Projects Fund (Project # 36443). Authors wouldlike to thank to anonymous reviewers for their suggestions to revisethe manuscript.
Appendix A. Supplementary data
Supplementary data related to this article can be found at http://dx.doi.org/10.1016/j.envpol.2015.05.034.
References
Akaighe, N., MacCuspie, R.I., Navarro, D.A., Aga, D.S., Banerjee, S., Sohn, M.,Sharma, V.K., 2011. Humic acid-induced silver nanoparticle formation underenvironmentally relevant conditions. Environ. Sci. Technol. 45 (9), 3895e3901.
Al-Kattan, A., Wichser, A., Zuin, S., Arroyo, Y., Golanski, L., Ulrich, A., Nowack, B.,2014. Behavior of TiO2 released from nano-TiO2-containing paint and com-parison to pristine nano-TiO2. Environ. Sci. Technol. 48, 6710e6718.
Ali, D., Yadav, P.G., Kumar, S., Ali, H., Alarifi, S., Harrath, A.H., 2014. Sensitivity offreshwater pulmonate snail Lymnaea luteola L., to silver nanoparticles. Che-mosphere 104, 134e140.
Behra, R., Sigg, L., Clift, M.J.D., Herzog, F., Minghetti, M., Johnston, B., Alke, P.F.,Rothen-Rutishauser, B., 2013. Bioavailability of silver nanoparticles and ions:from a chemical and biochemical perspective. J. R. Soc. Interface 10, 20130396.
Chambers, B.A., Afrooz, A.R.M.N., Bae, S., Aich, N., Katz, L., Saleh, N.B., Kirisits, M.J.,2014. Effects of chloride and ionic strength on physical morphology, dissolution,and bacterial toxicity of silver nanoparticles. Environ. Sci. Technol. 48, 761e769.
Chinnapongse, S.L., MacCuspie, R.I., Hackley, V.A., 2011. Persistence of singlydispersed silver nanoparticles in natural freshwaters, synthetic seawater, andsimulated estuarine waters. Sci. Total Environ. 49, 2443e2450.
Cumberland, S.A., Lead, J.R., 2009. Particle size distributions of silver nanoparticlesat environmentally relevant conditions. J. Chromatogr. A 1216 (52), 9099e9105.
Delay, M., Dolt, T., Woellhaf, A., Sembritzki, R., Frimmel, F.H., 2011. Interactions andstability of silver nanoparticles in the aqueous phase: Influence of natural
E. Topuz et al. / Environmental Pollution 204 (2015) 313e323 323
organic matter (NOM) and ionic strength. J. Chromatogr. A 1218, 4206e4212.Dimpka, C.O., Calder, A., Gajjar, P., Merugu, S., Huang, W., Britt, D.W., McLean, J.E.,
Johnson, W.P., Anderson, A.J., 2011. Interaction of silver nanoparticles with anenvironmentally beneficial bacterium, Pseudomonas chlororaphis. J. Hazard.Mater. 188, 428e435.
Domingos, R.F., Peyrot, C., Wilkinson, K.J., 2010. Aggregation of titanium dioxidenanoparticles: role of calcium and phosphate. Environ. Chem. 7 (1), 61e66.
El Badawy, A.M., Luxton, T.P., Silva, R.G., Scheckel, K.G., Suidan, M.T., Tolaymat, T.M.,2010. Impact of environmental conditions (pH, ionic strength, and electrolytetype) on the surface charge and aggregation of silver nanoparticles suspensions.Environ. Sci. Technol. 44 (4), 1260e1266.
Gao, J., Youn, S., Hovsepyan, A., Laneza, V.L., Gabrielbitton, Y., Bonzongo, J.C., 2009.Dispersion and toxicity of selected manufactured nanomaterials in natural riverwater samples: effects of water chemical composition. Environ. Sci. Technol. 43,3322e3328.
Gondikas, A.P., Morris, A., Reinsch, B.C., Marinakos, S.M., Lowry, G.V., Hsu-Kim, H.,2012. Cysteine-induced modifications of zero-valent silver nanomaterials: im-plications for particle surface chemistry, aggregation, dissolution, and silverspeciation. Environ. Sci. Technol. 46 (13), 7037e7045.
Gondikas, A.P., von der Kammer, F., Reed, R.B., Wagner, S., Ranville, J.F., Hofmann, T.,2014. Release of TiO2 nanoparticles from sunscreens into surface waters: a one-year survey at the old Danube recreational lake. Environ. Sci. Technol. 48,5415e5422.
Gottschalk, F., Nowack, B., 2011. The release of engineered nanomaterials to theenvironment. J. Environ. Monit. 13 (5), 1145e1155.
Hammes, J., Gallego-Urrea, J.A., Hassel€ov, M., 2013. Geographically distributedclassification of surface water chemical parameters influencing fate andbehavior of nanoparticles and colloid faciliated contaminant transport. WaterRes. 47 (14), 5350e5361.
Hedberg, J., Skoglund, S., Karlsson, M.E., Wold, S., Wallinder, I.O., Hedberg, Y., 2014.Sequential studies of silver released from silver nanoparticles in aqueous mediasimulating sweat. Laund. Deterg. Solut. Surf. Water Environ. Sci. Technol. 48,7314e7322.
Huber, S.A., Balz, A., Abert, M., Pronk, W., 2011. Characterisation of aquatic humicand non-humic matter with size-exclusion chromatography e organic carbondetection e organic nitrogen detection (LC-OCD-OND). Water Res. 45, 879e885.
Joshi, N., Ngwenyaa, B.T., French, C.E., 2012. Enhanced resistance to nanoparticletoxicity is conferred by overproduction of extracellular polymeric substances.J. Hazard. Mater. 241e242, 363e370.
Kaegi, R., Voegelin, A., Ort, C., Sinnet, B., Thalmann, B., Krismer, J., Hagendorfer, H.,Elumelu, M., Mueller, E., 2013. Fate and transformation of silver nanoparticles inurban wastewater systems. Water Res. 47 (12), 3866e3877.
Keller, A.A., Wang, H., Zhou, D., Lenihan, H.S., Cherr, G., Cardinale, B.J., Miller, R., Ji, Z.,2010. Stability and aggregation of metal oxide nanoparticles in natural aqueousmatrices. Environ. Sci. Technol. 44 (6), 1962e1967.
King, K.M., Jarvie, H.P., 2012. Exploring how organic matter controls structuraltransformations in natural aquatic nanocolloidal dispersions. Environ. Sci.Technol. 46 (13), 6959e6967.
Kvitek, L., Panacek, A., Soukupova, J., Kolar, M., Vecerova, R., Prucek, R., Holecova, M.,
Zboril, R., 2008. Effect of surfactants and polymers on stability and antibacterialactivity of silver nanoparticles (NPs). J. Phys. Chem. C 112 (15), 5825e5834.
Lombi, E., Donner, E., Scheckel, K.G., Sekine, R., Lorenz, C., Von Goetz, N., Nowack, B.,2014. Silver speciation and release in commercial antimicrobial textiles asinfluenced by washing. Chemosphere 111, 352e358.
Louie, S.M., Tilton, R.D., Lowry, G.V., 2013. Effects of molecular weight distributionand chemical properties of natural organic matter on gold nanoparticle ag-gregation. Environ. Sci. Technol. 47, 4245e4254.
Mukherjee, B., Weaver, J.W., 2010. Aggregation and charge behavior of metallic andnonmetallic nanoparticles in the presence of competing similarly-chargedinorganic ions. Environ. Sci. Technol. 244 (9), 3332e3338.
NADUF (National Long Term Surreillance of Swiss Rivers), http://www.bafu.admin.ch.
Ottofuelling, S., Von der Kammer, F., Hofmann, T., 2011. Commercial titanium di-oxide nanoparticles in both natural and synthetic water: comprehensivemultidimensional testing and prediction of aggregation behavior. Environ. Sci.Technol. 45 (23), 10045e10052.
Quik, J.T.K., Velzeboer, I., Wouterse, M., Koelmans, A.A., van de Meent, D., 2014.Heteroaggregation and sedimentation rates for nanomaterials in natural wa-ters. Water Res. 48, 269e279.
Reidy, B., Haase, A., Luch, A., Dawson, K.A., Lynch, I., 2013. Mechanisms of silvernanoparticle release, transformation and toxicity: a critical review of currentknowledge and recommendations for future studies and applications. Materials6, 2295e2350.
Shih, Y.H., Liu, W.S., Su, Y.F., 2012. Aggregation of stabilized TiO2 nanoparticlesuspensions in the presence of inorganic ions. Environ. Toxicol. Chem. 31 (8),1693e1698.
Stewart, T.J., Traber, J., Kroll, A., Behra, R., Sigg, L., 2013. Characterization of extra-cellular polymeric substances (EPS) from periphyton using liquidchromatography-organic carbon detection e organic nitrogen detection (LC-OCD-OND). Environ. Sci. Pollut. Res. 20, 3214e3223.
Thio, B.J.R., Zhou, D., Keller, A.A., 2011. Influence of natural organic matter on theaggregation and deposition of titanium dioxide nanoparticles. J. Hazard. Mater.556e563.
Thio, B.J.R., Montes, M.O., Mahmoud, M.A., Lee, D.-W., Zhou, D., Keller, A.A., 2012.Mobility of capped silver nanoparticles under environmentally relevant con-ditions. Environ. Sci. Technol. 46 (13), 6985e6991.
Topuz, E., Sigg, L., Talinli, I., 2014. A systematic evaluation of agglomeration of Agand TiO2 nanoparticles under freshwater relevant conditions. Environ. Pollut.193, 37e44.
Yang, X., Jiang, C., Hsu-Kim, H., Badireddy, A.R., Dykstra, M., Wiesner, M.,Hinton, D.E., Meyer, J.N., 2014. Silver nanoparticle behavior, uptake, and toxicityin caenorhabditis elegans: effects of natural organic matter. Environ. Sci.Technol. 48, 3486e3495.
Yu, S.J., Yin, Y.G., Chao, J.B., Shen, M.H., Liu, J.F., 2014. Highly dynamic PVP-coatedsilver nanoparticles in aquatic environments: chemical and morphologychange induced by oxidation of Ag0 and reduction of Agþ. Environ. Sci. Technol.48, 403e411.


