Embed Size (px)
Citation preview
Agricultural Intensification, Market Participation,and Household Demography in the Peruvian Andes
Jorge Miguel Rocha
Published online: 5 October 2011# Springer Science+Business Media, LLC 2011
Abstract The causes of agricultural intensification in apeasant community in the north central Andes are exploredusing a methodology derived from the tradition of SystemsEcology. Hypotheses derived from different research tradi-tions—mainly development economics and anthropology—regarding the causes of intensification are integrated andevaluated for their relative effects. It is found that among thevariables, household size is better at explaining the degree ofintensity with which labor and technology are employed. Theresults suggest that technologically-driven agricultural inten-sification is generally forced upon households by thediminishing returns of their labor, and that this process isnormally accompanied by increased financial debt for thosepeasant households who remain in agriculture and do notcompletely migrate to regional urban centers.
Keywords Systems ecology . Rural development .
Sustainability . Peruvian Andes
Introduction
A long history of research and theory within economicanthropology explores how the expansion of capitalistagriculture, and the subsequent increase in market partici-pation by smallholders, affects their economic, social, andpolitical relations with the wider national society (Cancian1989; Hamaza 1987; Scott 1985). This research, however,has focused mostly on the political—and to some extent
economic—dimensions of the processes involved. In LatinAmerica the discussions surrounding these areas of researchcame to be known as the “Campesinista—DecampesinistaDebate” (Feder 1981) since they focused mostly on thepolitical and economic consequences of the eventualdisappearance of rural subsistence producers.
Another, initially less politicized approach to the studyof capitalist agriculture and its transformation of ruralsubsistence producers was taken by Robert Netting. Whilenot unaware of the economic and political aspects of theprocess, Netting, following Julian Steward (1955), focusedon the ecological dimensions of peasant households inorder to better understand their structural, economic, andpolitical behaviors (Netting 1974, 1976, 1986, 1993).
Here I present the results of a research project that,while inspired by the work of Steward, White (1949),Netting, and others, also incorporates the rigorous con-ceptual and methodological tools of systems ecology, asdeveloped by ecologist Howard T. Odum (1996) and hiscolleagues (Hall 1995).
Agricultural Intensification: Competing Models
Researchers from several disciplines have, for differentreasons, been interested in determining the factors that triggerthe more intensive use of labor, land, and technologicalresources on the part of agricultural populations. Knowingthe causes of these forms of agricultural intensification wouldallow for, on the one hand, a better understanding of themechanics of change during the dramatic transition of earlyagrarian societies to city-states (Fall et al. 2002; Sanderson1995), and on the other, for improvements in the design ofeconomic development programs oriented at increasing theproductivity of traditional peasant agriculture in manydeveloping countries (Bonnen 1990).
J. M. Rocha (*)EGADE Business School,Monterrey, NL, Mexicoe-mail: [email protected]
Hum Ecol (2011) 39:555–568DOI 10.1007/s10745-011-9426-7
The conceptual ground work for understanding theprocesses by which individuals make more intensive useof their natural, technological, and labor resources wasfirst elaborated by agricultural economist Esther Boserup(1965, 1990). She argued that cultivators intensified theirproduction as a result of increased demographic pressure.In a sense, her conceptual model posed the hypothesis thatintensification in agriculture results from the interplaybetween the local demand for food stuffs (demographicpressure) and the socially customary way of life. Peoplescould, at least in theory, lower their traditional livingstandards and, when there were more mouths to feed,make do with less. However, according to Boserup, themore common response is for individuals to increase theirefforts on several fronts, for example, more weeding,better irrigation canals, shorter fallow cycles, etc., to meet thenew demands.
At the same time that Boserup was first presenting herideas, however, several agricultural economists were offeringan alternative explanation as to what drove rural householdersto intensify their production (Staatz and Eicher 1990). Thesemodels were in part motivated by the huge economic andpolitical importance peasant populations had during theseyears in most developing countries. They were orientedtowards finding a way of structurally transforming thesepopulations so that they could not only be more productive,but also more integrated into the nation-states where theylived (de Janvry 1981; Timmer 1991). Their conceptualmodel was based on a different set of hypotheses regardingthe causes of agricultural intensification. Following thearguments of neo-classical economics, Timmer et al.articulate this model as follows:
Farm households base their consumption and produc-tion decisions on farm input prices, cash and foodcrop output prices, the prices of consumer goods fromthe market, the opportunity cost of their members’time either in outside labor markets or on farmproduction (including household work), and demandfor leisure. (1983:78)
As can be seen, this model represents cultivators asrational economic actors behaving in their own bestinterests given the information they possess (Rocha 1996).Proponents of this model argued that peasants will intensifytheir production, not when or because they need to, butrather when they realize that there is a monetary reward—aprofit, economists would say—to be made. These twomodels are referred to as “the demographic model” and “themarket model” of agricultural intensification (Kates et al.1993).
Parallel to the market-driven model of agriculturalintensification is the idea that technological innovationplays a decisive role in the transformation of traditional
peasant agriculture (Ruttan and Hayami 1990). “Boserup’smodel of intensification was revolutionary in part becauseit cast doubt on evolutionary scenarios … that madetechnology the primary, indeed the sole, engine ofagricultural change” (Netting 1993:270). Netting alsoargued that intensive agricultural practices are based onskill, as opposed to scale, and that indigenous knowledgemust actually be considered as part of the technologyavailable to peasants (1993:49). Marvin Harris (1979) alsoargued that when discussing the role of technology inagricultural intensification one must consider the ecologicalenvironment with which the technology will be interacting.We “cannot really talk about technology in an abstractmanner,” (Harris 1990:120), but rather must consider it aspart of the adaptive strategy of a population in terms of howthe diminishing returns on labor per unit of land mighttrigger the development or adoption of a new technologicaltool kit.
While some regard these two views on agriculturalintensification as opposed and incompatible, I believe theycan, indeed must, be combined under a single conceptualroof. Alan Swedlund, a historical demographer, comment-ing on the debates between proponents of the differentviews, observed that “…the argument usually involves thequestion of whether population is the dependent orindependent variable” (1978:148). Proponents of thedemographic model clearly argue for it being the indepen-dent variable while the majority of the market modelsupporters tend to hold the view that population increasesas a result of intensification.
Methodology
Emergy Analysis
One of the great advantages of the ecosystem approach totraditional anthropological fieldwork is that it helps “inves-tigators to make more and better measurements in the field…and then to investigate the interrelations of variables” (Gross1990:310). It also allows for the use of a similar metric,particularly in Systems Ecology as developed by Howard T.Odum (1994). This approach measures different types ofprocesses using the same energy based scale.
The central concept in Odum’s approach is emergy,which he defines as embedded energy, or “the availableenergy of one kind previously used up directly andindirectly to make a service or product. Its unit is theemjoule” (1996:7). Thus, for example, to know the emergyembodied in a pencil we need to account for and add theproportionate fractions of energy that were used in all of theprocesses involved in the creation of the pencil: from thetree to the factory. In this manner the emergy content of the
556 Hum Ecol (2011) 39:555–568
pencil will necessarily be higher than its energetic contentsince we are accounting for all the work involved in itscreation. Since the baseline for all these measurements issolar energy, “emergy … measures both the work of natureand that of humans in generating products or services”(1996:1) using a single scale.
To test the hypotheses of the demographic and themarket models regarding agricultural intensification, Iused the conceptual and methodological perspectives ofSystems Ecology to operationalize critical variables(Rocha 2001). I was able to measure not only the intensitywith which agricultural activities were conducted in 37randomly selected, statistically representative householdsof an Andean peasant community, but also the degree oftheir involvement in regional economic markets using thesame scale.
Households are appropriate units of analysis for this typeof research because they are “the scene of economicallocation, arranging collectively for the food, clothing,and sheltering of its members … against the uncontrollabledisruptions of the climate, the market economy, and thestate” (Netting 1993:59; cf. Wilk 1984). The households inthe research community have many of the characteristics ofpeasant households in general (Chayanov 1986; Halperin1994; Hamaza 1987; Mintz 1989; Sahlins 1972; Wolf1965).
Results
Households, Production, and Emergy Expenditure
Living at about 3,100 m above sea level, a typicalhousehold in the peasant community of Tumpa in theCallejon the Huaylas in northen Peru (9°10.480’S; 77°39.541W) has access to a small plot of land (0.548±0.06 ha) that has been passed down through severalgenerations. Its members grow a variety of crops for bothsale and household consumption; in a typical householdthis consists of some 1,957 kg of tubers annually, of whicha little over 70% is sold in local markets, while the rest isconsumed by the household members. Cereals are alsoproduced, on average some 332 kg annually, 68% of whichare sold. The money they earn by selling these goods isspent mainly on other foodstuffs which they do not produce(primarily sugar, pasta, rice, and canned tuna), as well as onfertilizers and pesticides for next season’s crop. Mosthouseholds also have some animals: half a dozen chickensor guinea pigs, a pig or goat, and if they are wealthy a cowor two.
Adult males work an average of 3.9±0.4 h per day ontheir fields, and some 3.8±0.7 h per day on some wageearning activity. Adult females, on the other hand, have a
very different schedule; they work on average some 1.9±0.4 hon their plots per day, and for the few who have any wageearning activity, an average of only 0.24±0.1 h per day wasrecorded. However, since females are traditionally assignedhousehold responsibilities, they dedicate an average of 5.8(±0.4) hours to household chores compared to their husband’s2.3±0.4 h average.
Households have an average of 4.4±0.4 members livingin the household at any given time during the year.However, households that have two or more members livingelsewhere, mostly in Lima, the capital, either permanently offor seasonal periods are very common. Considering thesmall size of their plots, these household sizes result in anaverage of 14.6±3.1 persons per hectare. Even if threeextreme, outlier cases are excluded from the calculations(a family of school teachers that only owns a small garden, afamily whose main income is not from agriculture but frommanufacturing and selling ice cream cones, and the case of asingle mother and her two children who are supported byfamily members from other households), the community’saverage demographic density is still a very high 9.6±1.0persons per hectare.
This highlights an important ecological characteristicof the field site. Since they can irrigate their fieldswith the water from the glacier at the top of the NevadoHuascarán—Peru’s highest mountain—community residentsare able to produces two harvests a year for some of theircrops, increasing their annual productivity. Ease of irrigationalso makes it possible for landholdings to be subdividedthrough inheritance into smaller sizes than elsewhere in thePeruvian Andes.
Figure 1 illustrates in an aggregated schematic way howpeasant households employ both natural as well as social andeconomic resources in the pursuit of their productiveactivities, and how these modes of usage influence theirarticulations with both their local ecosystem and the largersocial system, via different modes of market participation.
At the left hand side of the diagram, outside theboundary box of the peasant household system, are someof the renewable natural resources important for smallagricultural producers, i.e., solar radiation, rainfall, andwinds that influence growth of plants through the theireffects on the evapotranspiration of the plants. Within thesystems boundary box, on the left, are some of theresources that household members control more directlysuch as their fields, divided between fallow and productive,their irrigation canals, and the quality of their topsoil. Onthe left hand side, within the systems boundary box, is thesymbol for the household itself with all of its consumingmembers, including any animal stock. Above the householdsymbol is a storage symbol representing the goods andservices that the household acquires from the market eitherfor direct consumption or for production purposes. One
Hum Ecol (2011) 39:555–568 557
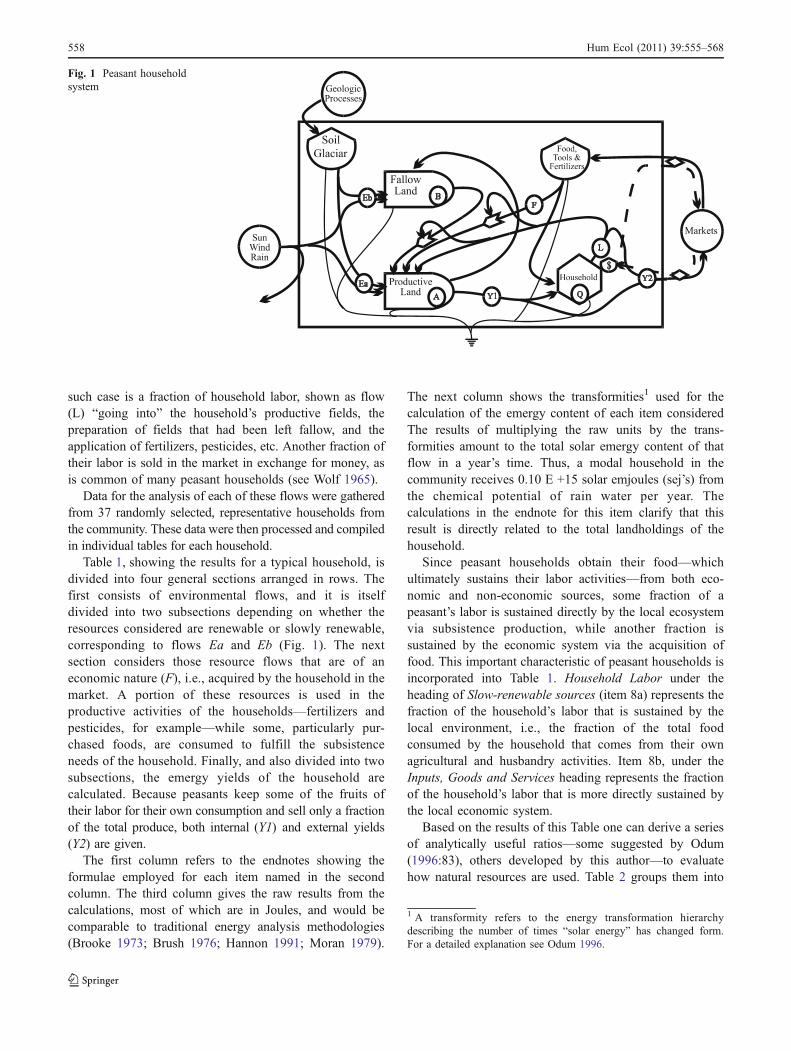
such case is a fraction of household labor, shown as flow(L) “going into” the household’s productive fields, thepreparation of fields that had been left fallow, and theapplication of fertilizers, pesticides, etc. Another fraction oftheir labor is sold in the market in exchange for money, asis common of many peasant households (see Wolf 1965).
Data for the analysis of each of these flows were gatheredfrom 37 randomly selected, representative households fromthe community. These data were then processed and compiledin individual tables for each household.
Table 1, showing the results for a typical household, isdivided into four general sections arranged in rows. Thefirst consists of environmental flows, and it is itselfdivided into two subsections depending on whether theresources considered are renewable or slowly renewable,corresponding to flows Ea and Eb (Fig. 1). The nextsection considers those resource flows that are of aneconomic nature (F), i.e., acquired by the household in themarket. A portion of these resources is used in theproductive activities of the households—fertilizers andpesticides, for example—while some, particularly pur-chased foods, are consumed to fulfill the subsistenceneeds of the household. Finally, and also divided into twosubsections, the emergy yields of the household arecalculated. Because peasants keep some of the fruits oftheir labor for their own consumption and sell only a fractionof the total produce, both internal (Y1) and external yields(Y2) are given.
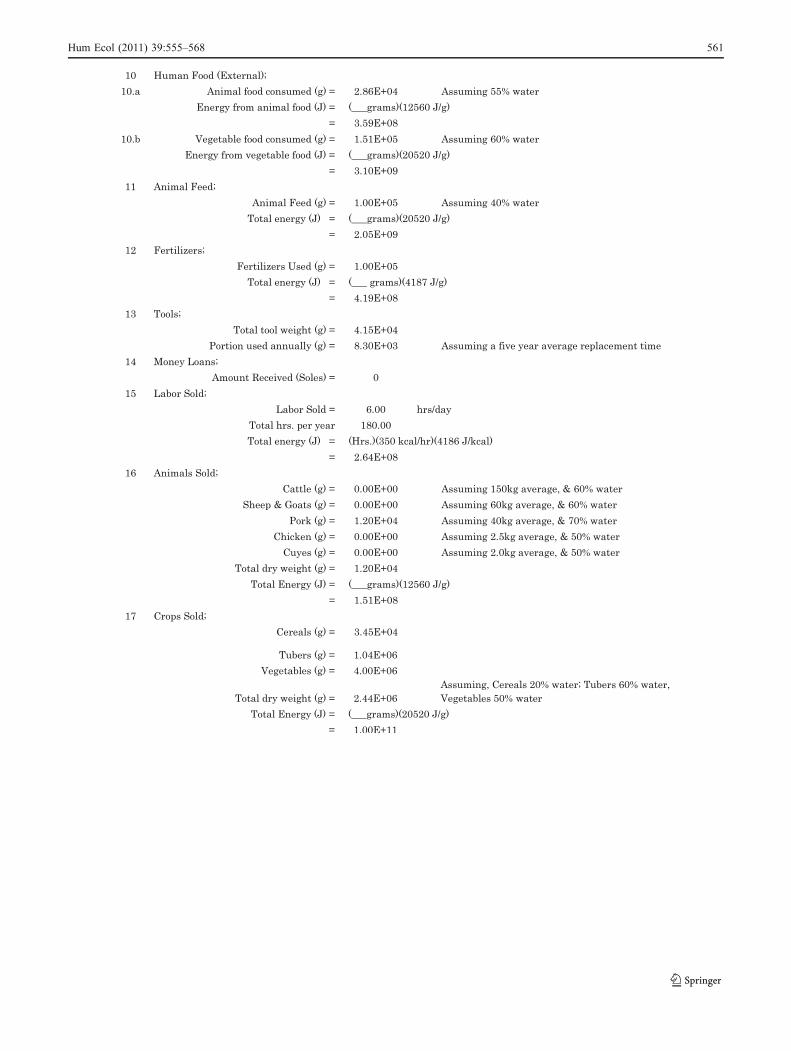
The first column refers to the endnotes showing theformulae employed for each item named in the secondcolumn. The third column gives the raw results from thecalculations, most of which are in Joules, and would becomparable to traditional energy analysis methodologies(Brooke 1973; Brush 1976; Hannon 1991; Moran 1979).
The next column shows the transformities1 used for thecalculation of the emergy content of each item consideredThe results of multiplying the raw units by the trans-formities amount to the total solar emergy content of thatflow in a year’s time. Thus, a modal household in thecommunity receives 0.10 E +15 solar emjoules (sej’s) fromthe chemical potential of rain water per year. Thecalculations in the endnote for this item clarify that thisresult is directly related to the total landholdings of thehousehold.
Since peasant households obtain their food—whichultimately sustains their labor activities—from both eco-nomic and non-economic sources, some fraction of apeasant’s labor is sustained directly by the local ecosystemvia subsistence production, while another fraction issustained by the economic system via the acquisition offood. This important characteristic of peasant households isincorporated into Table 1. Household Labor under theheading of Slow-renewable sources (item 8a) represents thefraction of the household’s labor that is sustained by thelocal environment, i.e., the fraction of the total foodconsumed by the household that comes from their ownagricultural and husbandry activities. Item 8b, under theInputs, Goods and Services heading represents the fractionof the household’s labor that is more directly sustained bythe local economic system.
Based on the results of this Table one can derive a seriesof analytically useful ratios—some suggested by Odum(1996:83), others developed by this author—to evaluatehow natural resources are used. Table 2 groups them into
1 A transformity refers to the energy transformation hierarchydescribing the number of times “solar energy” has changed form.For a detailed explanation see Odum 1996.
Fig. 1 Peasant householdsystem
558 Hum Ecol (2011) 39:555–568
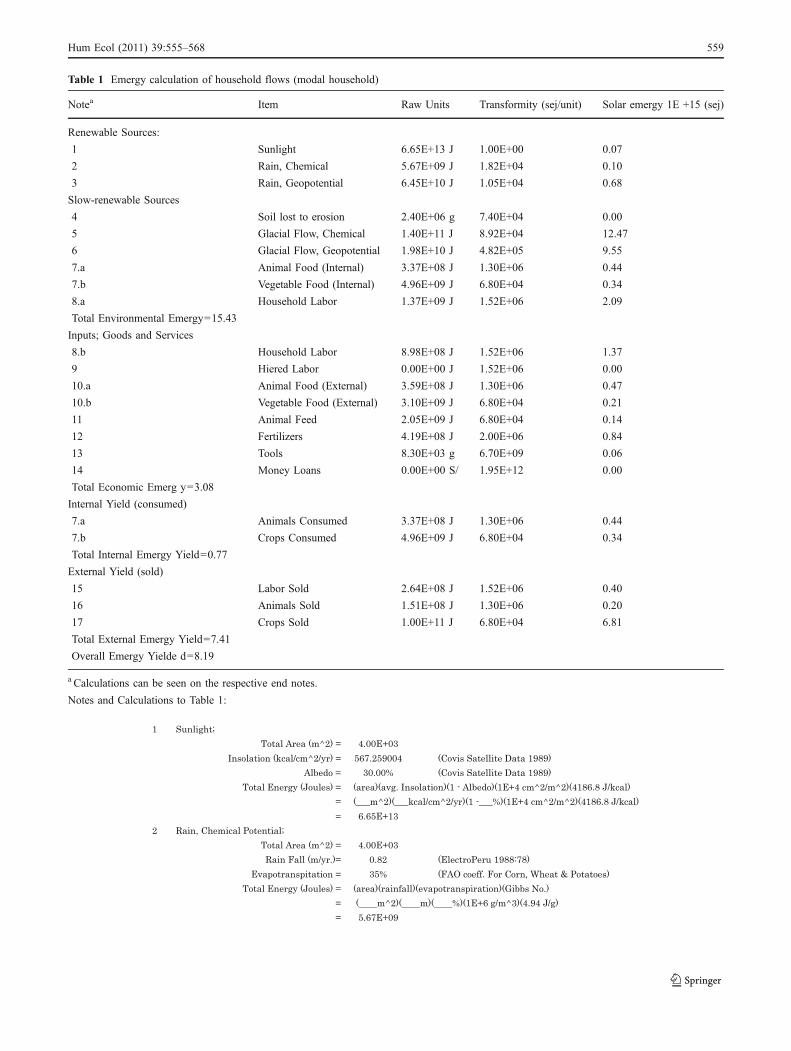
Table 1 Emergy calculation of household flows (modal household)
Notea Item Raw Units Transformity (sej/unit) Solar emergy 1E +15 (sej)
Renewable Sources:
1 Sunlight 6.65E+13 J 1.00E+00 0.07
2 Rain, Chemical 5.67E+09 J 1.82E+04 0.10
3 Rain, Geopotential 6.45E+10 J 1.05E+04 0.68
Slow-renewable Sources
4 Soil lost to erosion 2.40E+06 g 7.40E+04 0.00
5 Glacial Flow, Chemical 1.40E+11 J 8.92E+04 12.47
6 Glacial Flow, Geopotential 1.98E+10 J 4.82E+05 9.55
7.a Animal Food (Internal) 3.37E+08 J 1.30E+06 0.44
7.b Vegetable Food (Internal) 4.96E+09 J 6.80E+04 0.34
8.a Household Labor 1.37E+09 J 1.52E+06 2.09
Total Environmental Emergy=15.43
Inputs; Goods and Services
8.b Household Labor 8.98E+08 J 1.52E+06 1.37
9 Hiered Labor 0.00E+00 J 1.52E+06 0.00
10.a Animal Food (External) 3.59E+08 J 1.30E+06 0.47
10.b Vegetable Food (External) 3.10E+09 J 6.80E+04 0.21
11 Animal Feed 2.05E+09 J 6.80E+04 0.14
12 Fertilizers 4.19E+08 J 2.00E+06 0.84
13 Tools 8.30E+03 g 6.70E+09 0.06
14 Money Loans 0.00E+00 S/ 1.95E+12 0.00
Total Economic Emerg y=3.08
Internal Yield (consumed)
7.a Animals Consumed 3.37E+08 J 1.30E+06 0.44
7.b Crops Consumed 4.96E+09 J 6.80E+04 0.34
Total Internal Emergy Yield=0.77
External Yield (sold)
15 Labor Sold 2.64E+08 J 1.52E+06 0.40
16 Animals Sold 1.51E+08 J 1.30E+06 0.20
17 Crops Sold 1.00E+11 J 6.80E+04 6.81
Total External Emergy Yield=7.41
Overall Emergy Yielde d=8.19
a Calculations can be seen on the respective end notes.
Notes and Calculations to Table 1:
Hum Ecol (2011) 39:555–568 559

560 Hum Ecol (2011) 39:555–568
Hum Ecol (2011) 39:555–568 561
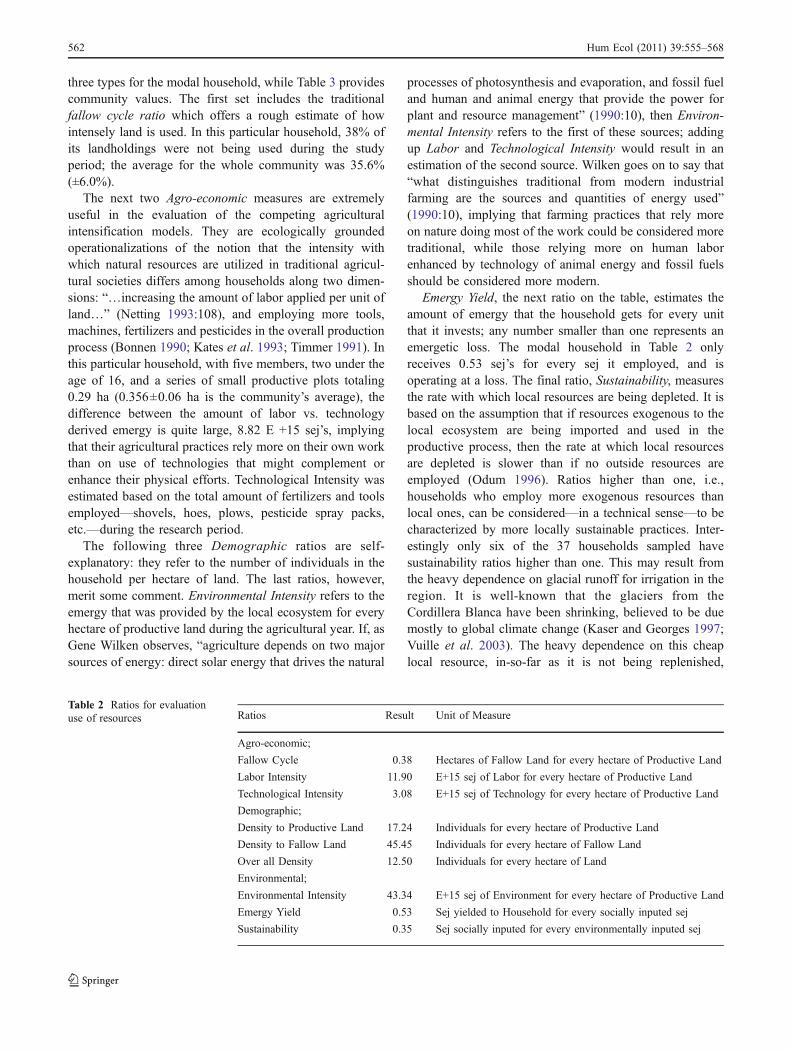
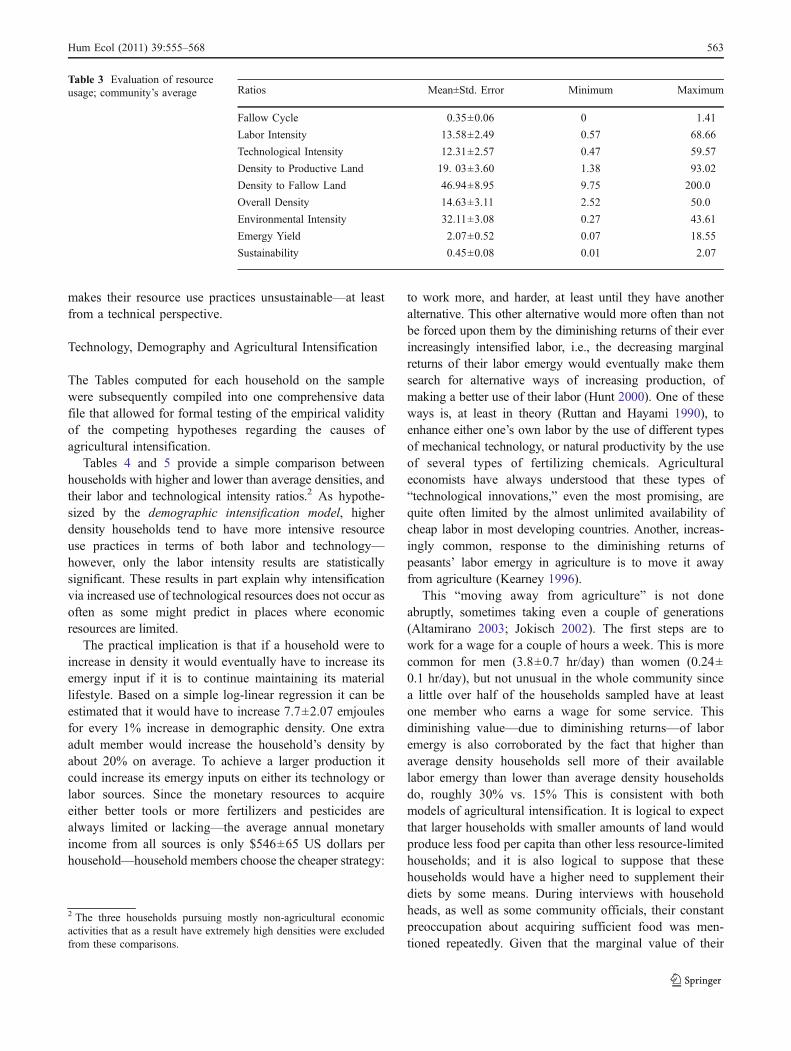
three types for the modal household, while Table 3 providescommunity values. The first set includes the traditionalfallow cycle ratio which offers a rough estimate of howintensely land is used. In this particular household, 38% ofits landholdings were not being used during the studyperiod; the average for the whole community was 35.6%(±6.0%).
The next two Agro-economic measures are extremelyuseful in the evaluation of the competing agriculturalintensification models. They are ecologically groundedoperationalizations of the notion that the intensity withwhich natural resources are utilized in traditional agricul-tural societies differs among households along two dimen-sions: “…increasing the amount of labor applied per unit ofland…” (Netting 1993:108), and employing more tools,machines, fertilizers and pesticides in the overall productionprocess (Bonnen 1990; Kates et al. 1993; Timmer 1991). Inthis particular household, with five members, two under theage of 16, and a series of small productive plots totaling0.29 ha (0.356±0.06 ha is the community’s average), thedifference between the amount of labor vs. technologyderived emergy is quite large, 8.82 E +15 sej’s, implyingthat their agricultural practices rely more on their own workthan on use of technologies that might complement orenhance their physical efforts. Technological Intensity wasestimated based on the total amount of fertilizers and toolsemployed—shovels, hoes, plows, pesticide spray packs,etc.—during the research period.
The following three Demographic ratios are self-explanatory: they refer to the number of individuals in thehousehold per hectare of land. The last ratios, however,merit some comment. Environmental Intensity refers to theemergy that was provided by the local ecosystem for everyhectare of productive land during the agricultural year. If, asGene Wilken observes, “agriculture depends on two majorsources of energy: direct solar energy that drives the natural
processes of photosynthesis and evaporation, and fossil fueland human and animal energy that provide the power forplant and resource management” (1990:10), then Environ-mental Intensity refers to the first of these sources; addingup Labor and Technological Intensity would result in anestimation of the second source. Wilken goes on to say that“what distinguishes traditional from modern industrialfarming are the sources and quantities of energy used”(1990:10), implying that farming practices that rely moreon nature doing most of the work could be considered moretraditional, while those relying more on human laborenhanced by technology of animal energy and fossil fuelsshould be considered more modern.
Emergy Yield, the next ratio on the table, estimates theamount of emergy that the household gets for every unitthat it invests; any number smaller than one represents anemergetic loss. The modal household in Table 2 onlyreceives 0.53 sej’s for every sej it employed, and isoperating at a loss. The final ratio, Sustainability, measuresthe rate with which local resources are being depleted. It isbased on the assumption that if resources exogenous to thelocal ecosystem are being imported and used in theproductive process, then the rate at which local resourcesare depleted is slower than if no outside resources areemployed (Odum 1996). Ratios higher than one, i.e.,households who employ more exogenous resources thanlocal ones, can be considered—in a technical sense—to becharacterized by more locally sustainable practices. Inter-estingly only six of the 37 households sampled havesustainability ratios higher than one. This may result fromthe heavy dependence on glacial runoff for irrigation in theregion. It is well-known that the glaciers from theCordillera Blanca have been shrinking, believed to be duemostly to global climate change (Kaser and Georges 1997;Vuille et al. 2003). The heavy dependence on this cheaplocal resource, in-so-far as it is not being replenished,
Table 2 Ratios for evaluationuse of resources Ratios Result Unit of Measure
Agro-economic;
Fallow Cycle 0.38 Hectares of Fallow Land for every hectare of Productive Land
Labor Intensity 11.90 E+15 sej of Labor for every hectare of Productive Land
Technological Intensity 3.08 E+15 sej of Technology for every hectare of Productive Land
Demographic;
Density to Productive Land 17.24 Individuals for every hectare of Productive Land
Density to Fallow Land 45.45 Individuals for every hectare of Fallow Land
Over all Density 12.50 Individuals for every hectare of Land
Environmental;
Environmental Intensity 43.34 E+15 sej of Environment for every hectare of Productive Land
Emergy Yield 0.53 Sej yielded to Household for every socially inputed sej
Sustainability 0.35 Sej socially inputed for every environmentally inputed sej
562 Hum Ecol (2011) 39:555–568
makes their resource use practices unsustainable—at leastfrom a technical perspective.
Technology, Demography and Agricultural Intensification
The Tables computed for each household on the samplewere subsequently compiled into one comprehensive datafile that allowed for formal testing of the empirical validityof the competing hypotheses regarding the causes ofagricultural intensification.
Tables 4 and 5 provide a simple comparison betweenhouseholds with higher and lower than average densities, andtheir labor and technological intensity ratios.2 As hypothe-sized by the demographic intensification model, higherdensity households tend to have more intensive resourceuse practices in terms of both labor and technology—however, only the labor intensity results are statisticallysignificant. These results in part explain why intensificationvia increased use of technological resources does not occur asoften as some might predict in places where economicresources are limited.
The practical implication is that if a household were toincrease in density it would eventually have to increase itsemergy input if it is to continue maintaining its materiallifestyle. Based on a simple log-linear regression it can beestimated that it would have to increase 7.7±2.07 emjoulesfor every 1% increase in demographic density. One extraadult member would increase the household’s density byabout 20% on average. To achieve a larger production itcould increase its emergy inputs on either its technology orlabor sources. Since the monetary resources to acquireeither better tools or more fertilizers and pesticides arealways limited or lacking—the average annual monetaryincome from all sources is only $546±65 US dollars perhousehold—household members choose the cheaper strategy:
to work more, and harder, at least until they have anotheralternative. This other alternative would more often than notbe forced upon them by the diminishing returns of their everincreasingly intensified labor, i.e., the decreasing marginalreturns of their labor emergy would eventually make themsearch for alternative ways of increasing production, ofmaking a better use of their labor (Hunt 2000). One of theseways is, at least in theory (Ruttan and Hayami 1990), toenhance either one’s own labor by the use of different typesof mechanical technology, or natural productivity by the useof several types of fertilizing chemicals. Agriculturaleconomists have always understood that these types of“technological innovations,” even the most promising, arequite often limited by the almost unlimited availability ofcheap labor in most developing countries. Another, increas-ingly common, response to the diminishing returns ofpeasants’ labor emergy in agriculture is to move it awayfrom agriculture (Kearney 1996).
This “moving away from agriculture” is not doneabruptly, sometimes taking even a couple of generations(Altamirano 2003; Jokisch 2002). The first steps are towork for a wage for a couple of hours a week. This is morecommon for men (3.8±0.7 hr/day) than women (0.24±0.1 hr/day), but not unusual in the whole community sincea little over half of the households sampled have at leastone member who earns a wage for some service. Thisdiminishing value—due to diminishing returns—of laboremergy is also corroborated by the fact that higher thanaverage density households sell more of their availablelabor emergy than lower than average density householdsdo, roughly 30% vs. 15% This is consistent with bothmodels of agricultural intensification. It is logical to expectthat larger households with smaller amounts of land wouldproduce less food per capita than other less resource-limitedhouseholds; and it is also logical to suppose that thesehouseholds would have a higher need to supplement theirdiets by some means. During interviews with householdheads, as well as some community officials, their constantpreoccupation about acquiring sufficient food was men-tioned repeatedly. Given that the marginal value of their
Table 3 Evaluation of resourceusage; community’s average Ratios Mean±Std. Error Minimum Maximum
Fallow Cycle 0.35±0.06 0 1.41
Labor Intensity 13.58±2.49 0.57 68.66
Technological Intensity 12.31±2.57 0.47 59.57
Density to Productive Land 19. 03±3.60 1.38 93.02
Density to Fallow Land 46.94±8.95 9.75 200.0
Overall Density 14.63±3.11 2.52 50.0
Environmental Intensity 32.11±3.08 0.27 43.61
Emergy Yield 2.07±0.52 0.07 18.55
Sustainability 0.45±0.08 0.01 2.07
2 The three households pursuing mostly non-agricultural economicactivities that as a result have extremely high densities were excludedfrom these comparisons.
Hum Ecol (2011) 39:555–568 563
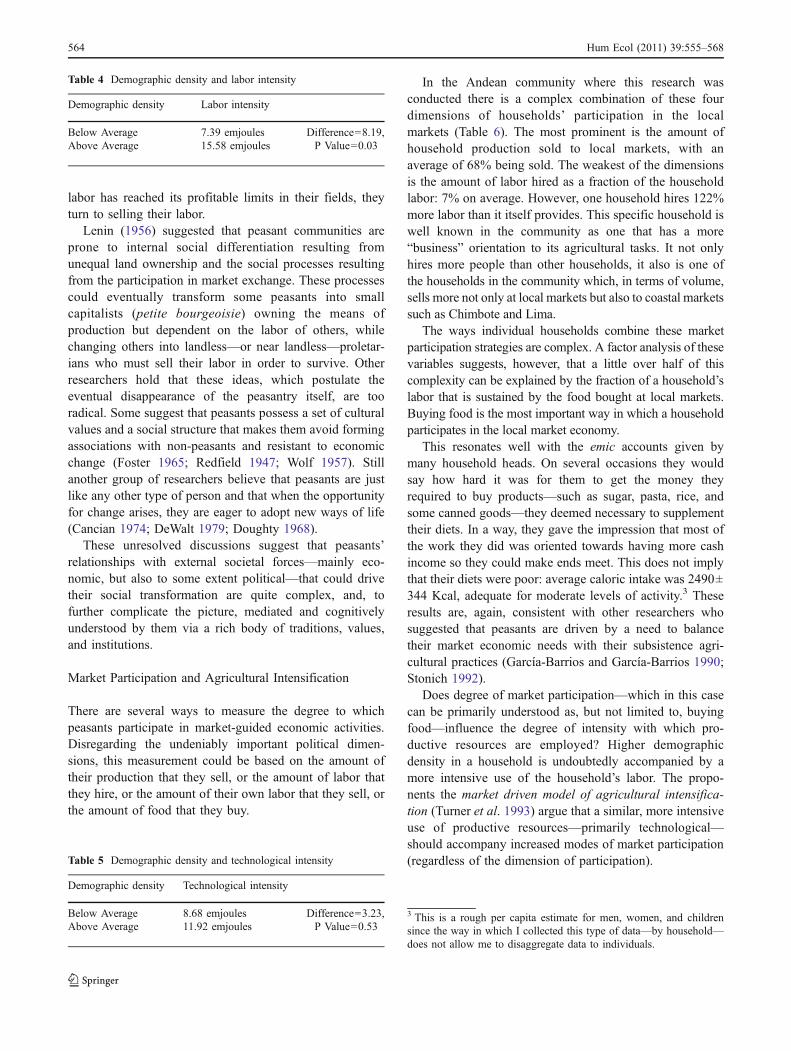
labor has reached its profitable limits in their fields, theyturn to selling their labor.
Lenin (1956) suggested that peasant communities areprone to internal social differentiation resulting fromunequal land ownership and the social processes resultingfrom the participation in market exchange. These processescould eventually transform some peasants into smallcapitalists (petite bourgeoisie) owning the means ofproduction but dependent on the labor of others, whilechanging others into landless—or near landless—proletar-ians who must sell their labor in order to survive. Otherresearchers hold that these ideas, which postulate theeventual disappearance of the peasantry itself, are tooradical. Some suggest that peasants possess a set of culturalvalues and a social structure that makes them avoid formingassociations with non-peasants and resistant to economicchange (Foster 1965; Redfield 1947; Wolf 1957). Stillanother group of researchers believe that peasants are justlike any other type of person and that when the opportunityfor change arises, they are eager to adopt new ways of life(Cancian 1974; DeWalt 1979; Doughty 1968).
These unresolved discussions suggest that peasants’relationships with external societal forces—mainly eco-nomic, but also to some extent political—that could drivetheir social transformation are quite complex, and, tofurther complicate the picture, mediated and cognitivelyunderstood by them via a rich body of traditions, values,and institutions.
Market Participation and Agricultural Intensification
There are several ways to measure the degree to whichpeasants participate in market-guided economic activities.Disregarding the undeniably important political dimen-sions, this measurement could be based on the amount oftheir production that they sell, or the amount of labor thatthey hire, or the amount of their own labor that they sell, orthe amount of food that they buy.
In the Andean community where this research wasconducted there is a complex combination of these fourdimensions of households’ participation in the localmarkets (Table 6). The most prominent is the amount ofhousehold production sold to local markets, with anaverage of 68% being sold. The weakest of the dimensionsis the amount of labor hired as a fraction of the householdlabor: 7% on average. However, one household hires 122%more labor than it itself provides. This specific household iswell known in the community as one that has a more“business” orientation to its agricultural tasks. It not onlyhires more people than other households, it also is one ofthe households in the community which, in terms of volume,sells more not only at local markets but also to coastal marketssuch as Chimbote and Lima.
The ways individual households combine these marketparticipation strategies are complex. A factor analysis of thesevariables suggests, however, that a little over half of thiscomplexity can be explained by the fraction of a household’slabor that is sustained by the food bought at local markets.Buying food is the most important way in which a householdparticipates in the local market economy.
This resonates well with the emic accounts given bymany household heads. On several occasions they wouldsay how hard it was for them to get the money theyrequired to buy products—such as sugar, pasta, rice, andsome canned goods—they deemed necessary to supplementtheir diets. In a way, they gave the impression that most ofthe work they did was oriented towards having more cashincome so they could make ends meet. This does not implythat their diets were poor: average caloric intake was 2490±344 Kcal, adequate for moderate levels of activity.3 Theseresults are, again, consistent with other researchers whosuggested that peasants are driven by a need to balancetheir market economic needs with their subsistence agri-cultural practices (García-Barrios and García-Barrios 1990;Stonich 1992).
Does degree of market participation—which in this casecan be primarily understood as, but not limited to, buyingfood—influence the degree of intensity with which pro-ductive resources are employed? Higher demographicdensity in a household is undoubtedly accompanied by amore intensive use of the household’s labor. The propo-nents the market driven model of agricultural intensifica-tion (Turner et al. 1993) argue that a similar, more intensiveuse of productive resources—primarily technological—should accompany increased modes of market participation(regardless of the dimension of participation).Table 5 Demographic density and technological intensity
Demographic density Technological intensity
Below Average 8.68 emjoules Difference=3.23,P Value=0.53Above Average 11.92 emjoules
Table 4 Demographic density and labor intensity
Demographic density Labor intensity
Below Average 7.39 emjoules Difference=8.19,P Value=0.03Above Average 15.58 emjoules
3 This is a rough per capita estimate for men, women, and childrensince the way in which I collected this type of data—by household—does not allow me to disaggregate data to individuals.
564 Hum Ecol (2011) 39:555–568
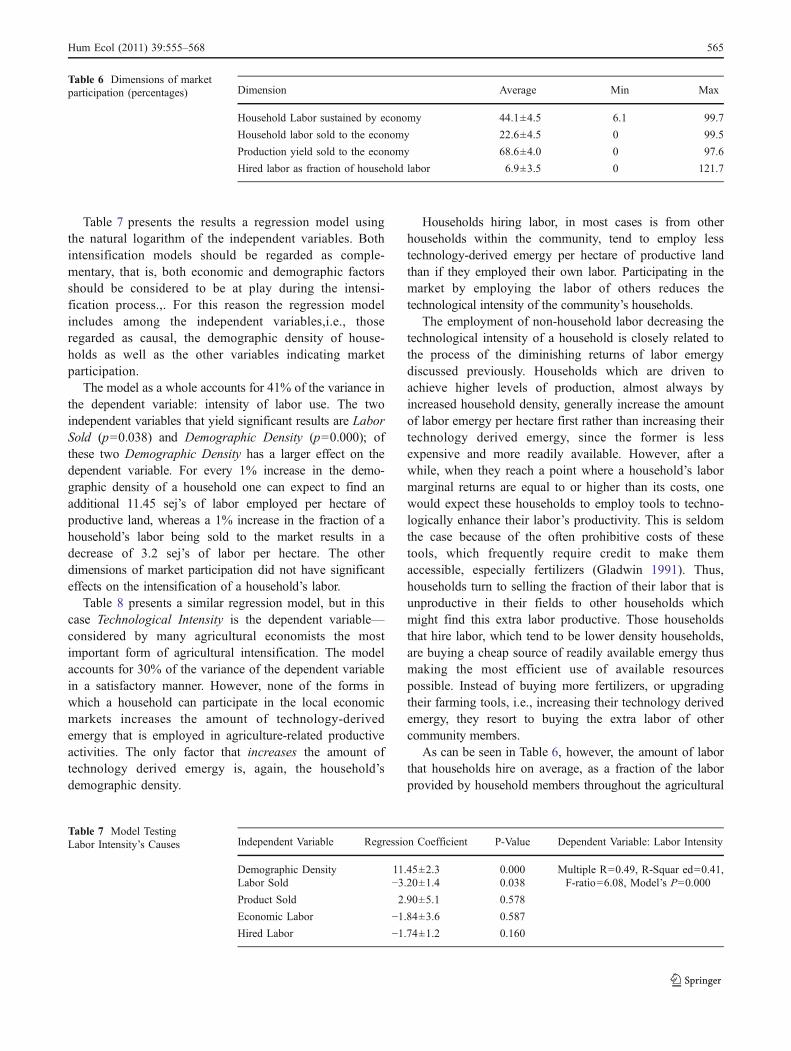
Table 7 presents the results a regression model usingthe natural logarithm of the independent variables. Bothintensification models should be regarded as comple-mentary, that is, both economic and demographic factorsshould be considered to be at play during the intensi-fication process.,. For this reason the regression modelincludes among the independent variables,i.e., thoseregarded as causal, the demographic density of house-holds as well as the other variables indicating marketparticipation.
The model as a whole accounts for 41% of the variance inthe dependent variable: intensity of labor use. The twoindependent variables that yield significant results are LaborSold (p=0.038) and Demographic Density (p=0.000); ofthese two Demographic Density has a larger effect on thedependent variable. For every 1% increase in the demo-graphic density of a household one can expect to find anadditional 11.45 sej’s of labor employed per hectare ofproductive land, whereas a 1% increase in the fraction of ahousehold’s labor being sold to the market results in adecrease of 3.2 sej’s of labor per hectare. The otherdimensions of market participation did not have significanteffects on the intensification of a household’s labor.
Table 8 presents a similar regression model, but in thiscase Technological Intensity is the dependent variable—considered by many agricultural economists the mostimportant form of agricultural intensification. The modelaccounts for 30% of the variance of the dependent variablein a satisfactory manner. However, none of the forms inwhich a household can participate in the local economicmarkets increases the amount of technology-derivedemergy that is employed in agriculture-related productiveactivities. The only factor that increases the amount oftechnology derived emergy is, again, the household’sdemographic density.
Households hiring labor, in most cases is from otherhouseholds within the community, tend to employ lesstechnology-derived emergy per hectare of productive landthan if they employed their own labor. Participating in themarket by employing the labor of others reduces thetechnological intensity of the community’s households.
The employment of non-household labor decreasing thetechnological intensity of a household is closely related tothe process of the diminishing returns of labor emergydiscussed previously. Households which are driven toachieve higher levels of production, almost always byincreased household density, generally increase the amountof labor emergy per hectare first rather than increasing theirtechnology derived emergy, since the former is lessexpensive and more readily available. However, after awhile, when they reach a point where a household’s labormarginal returns are equal to or higher than its costs, onewould expect these households to employ tools to techno-logically enhance their labor’s productivity. This is seldomthe case because of the often prohibitive costs of thesetools, which frequently require credit to make themaccessible, especially fertilizers (Gladwin 1991). Thus,households turn to selling the fraction of their labor that isunproductive in their fields to other households whichmight find this extra labor productive. Those householdsthat hire labor, which tend to be lower density households,are buying a cheap source of readily available emergy thusmaking the most efficient use of available resourcespossible. Instead of buying more fertilizers, or upgradingtheir farming tools, i.e., increasing their technology derivedemergy, they resort to buying the extra labor of othercommunity members.
As can be seen in Table 6, however, the amount of laborthat households hire on average, as a fraction of the laborprovided by household members throughout the agricultural
Table 7 Model TestingLabor Intensity’s Causes Independent Variable Regression Coefficient P-Value Dependent Variable: Labor Intensity
Demographic Density 11.45±2.3 0.000 Multiple R=0.49, R-Squar ed=0.41,F-ratio=6.08, Model’s P=0.000Labor Sold −3.20±1.4 0.038
Product Sold 2.90±5.1 0.578
Economic Labor −1.84±3.6 0.587
Hired Labor −1.74±1.2 0.160
Table 6 Dimensions of marketparticipation (percentages) Dimension Average Min Max
Household Labor sustained by economy 44.1±4.5 6.1 99.7
Household labor sold to the economy 22.6±4.5 0 99.5
Production yield sold to the economy 68.6±4.0 0 97.6
Hired labor as fraction of household labor 6.9±3.5 0 121.7
Hum Ecol (2011) 39:555–568 565
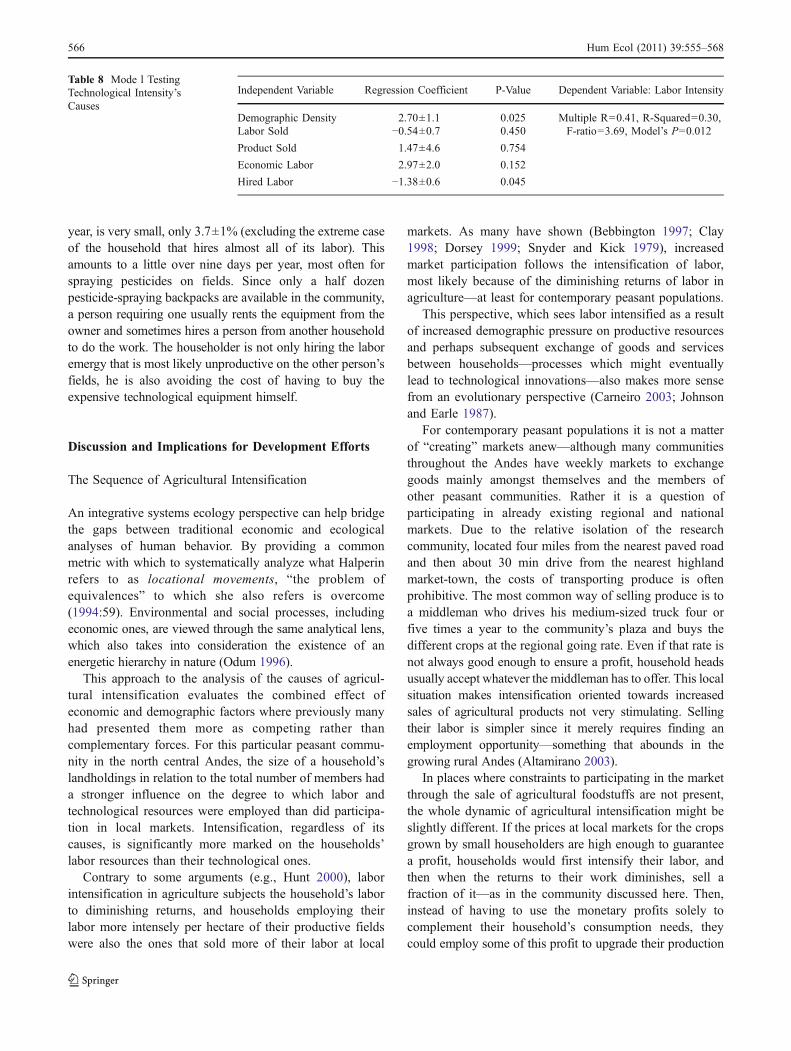
year, is very small, only 3.7±1% (excluding the extreme caseof the household that hires almost all of its labor). Thisamounts to a little over nine days per year, most often forspraying pesticides on fields. Since only a half dozenpesticide-spraying backpacks are available in the community,a person requiring one usually rents the equipment from theowner and sometimes hires a person from another householdto do the work. The householder is not only hiring the laboremergy that is most likely unproductive on the other person’sfields, he is also avoiding the cost of having to buy theexpensive technological equipment himself.
Discussion and Implications for Development Efforts
The Sequence of Agricultural Intensification
An integrative systems ecology perspective can help bridgethe gaps between traditional economic and ecologicalanalyses of human behavior. By providing a commonmetric with which to systematically analyze what Halperinrefers to as locational movements, “the problem ofequivalences” to which she also refers is overcome(1994:59). Environmental and social processes, includingeconomic ones, are viewed through the same analytical lens,which also takes into consideration the existence of anenergetic hierarchy in nature (Odum 1996).
This approach to the analysis of the causes of agricul-tural intensification evaluates the combined effect ofeconomic and demographic factors where previously manyhad presented them more as competing rather thancomplementary forces. For this particular peasant commu-nity in the north central Andes, the size of a household’slandholdings in relation to the total number of members hada stronger influence on the degree to which labor andtechnological resources were employed than did participa-tion in local markets. Intensification, regardless of itscauses, is significantly more marked on the households’labor resources than their technological ones.
Contrary to some arguments (e.g., Hunt 2000), laborintensification in agriculture subjects the household’s laborto diminishing returns, and households employing theirlabor more intensely per hectare of their productive fieldswere also the ones that sold more of their labor at local
markets. As many have shown (Bebbington 1997; Clay1998; Dorsey 1999; Snyder and Kick 1979), increasedmarket participation follows the intensification of labor,most likely because of the diminishing returns of labor inagriculture—at least for contemporary peasant populations.
This perspective, which sees labor intensified as a resultof increased demographic pressure on productive resourcesand perhaps subsequent exchange of goods and servicesbetween households—processes which might eventuallylead to technological innovations—also makes more sensefrom an evolutionary perspective (Carneiro 2003; Johnsonand Earle 1987).
For contemporary peasant populations it is not a matterof “creating” markets anew—although many communitiesthroughout the Andes have weekly markets to exchangegoods mainly amongst themselves and the members ofother peasant communities. Rather it is a question ofparticipating in already existing regional and nationalmarkets. Due to the relative isolation of the researchcommunity, located four miles from the nearest paved roadand then about 30 min drive from the nearest highlandmarket-town, the costs of transporting produce is oftenprohibitive. The most common way of selling produce is toa middleman who drives his medium-sized truck four orfive times a year to the community’s plaza and buys thedifferent crops at the regional going rate. Even if that rate isnot always good enough to ensure a profit, household headsusually accept whatever the middleman has to offer. This localsituation makes intensification oriented towards increasedsales of agricultural products not very stimulating. Sellingtheir labor is simpler since it merely requires finding anemployment opportunity—something that abounds in thegrowing rural Andes (Altamirano 2003).
In places where constraints to participating in the marketthrough the sale of agricultural foodstuffs are not present,the whole dynamic of agricultural intensification might beslightly different. If the prices at local markets for the cropsgrown by small householders are high enough to guaranteea profit, households would first intensify their labor, andthen when the returns to their work diminishes, sell afraction of it—as in the community discussed here. Then,instead of having to use the monetary profits solely tocomplement their household’s consumption needs, theycould employ some of this profit to upgrade their production
Table 8 Mode l TestingTechnological Intensity’sCauses
Independent Variable Regression Coefficient P-Value Dependent Variable: Labor Intensity
Demographic Density 2.70±1.1 0.025 Multiple R=0.41, R-Squared=0.30,F-ratio=3.69, Model’s P=0.012Labor Sold −0.54±0.7 0.450
Product Sold 1.47±4.6 0.754
Economic Labor 2.97±2.0 0.152
Hired Labor −1.38±0.6 0.045
566 Hum Ecol (2011) 39:555–568
technologies and achieve larger harvests. The internalsocioeconomic differentiation of the rural communities wherethese processes take place will, however, most likely increase.At the same time a continuous stream of “surplus” rural labormigrating to regional urban centers will continue to putpressure of the physical infrastructure of these centers, andchallenge their employment-generating capabilities and, thus,their political stability.
References
Altamirano, T. (2003). From Country to City: Internal Migration,focus on Peru. Harvard Review of Latin America 2(2): 58–61.
Bebbington, A. (1997). Social Capital and Rural Intensification: LocalOrganizations and Islands of Sustainability in the Rural Andes.The Geographical Journal 163(2): 189–198.
Bonnen, J. T. (1990). Agricultural development: transforming humancapital, technology, and institutions. In Eicher, C. K., and Staatz,J. M. (eds.), Agricultural Development in the Third World. JohnsHopkins University Press, Washington, pp. 262–279.
Boserup, E. (1965). The Conditions of Agricultural Growth: TheEconomics of Agrarian Change Under Population Pressure.Adeline Press, Chicago.
Boserup, E. (1990). Economic and Demographic Relationships inDevelopment. Johns Hopkins University Press, Washington.
Brooke, R. T. (1973). Human Adaptation to a High Andean Energy FlowSystem. Pennsylvania State University Department of Anthropolo-gy, Pennsylvania.
Brush, S. B. (1976). Man’s Use of an Andean Ecosystem. HumanEcology, An Interdisciplinary Journal 4(2): 147–166.
Cancian, F. (1974). New Patterns of Stratification in the Zinacantan CargoSystem. Journal of Anthropological Research 30(3): 164–173.
Cancian, F. (1989). Economic behavior in peasant communities. InPlattner, S. (ed.), Economic Anthropology. Stanford UniversityPress, Stanford, pp. 127–170.
Carneiro, R. (2003). Evolutionism in Cultural Anthropology: ACritical History. Westview Press, Boulder.
Chayanov, A. (1986). The Theory of Pesant Economy. WisconsinUniversity Press, Madison.
Clay, D. (1998). Sustainable Intensification in the Highland Tropics:Rwandan Farmers’ Investments in Land Conservation and SoilFertility. Economic Development and Cultural Change 46(2):351–377.
de Janvry, A. (1981). The Agrarian Question and Reformism in LatinAmerica. Johns Hopkins University Press, Baltimore.
DeWalt, B. R. (1979). Modernization in a Mexican Ejido: A study inEconomic Adaptation. Cambridge University Press, New York.
Dorsey, B. (1999). Agricultural Intensification, Diversification, andCommercial Production Among Smallholder Coffee Growers inCentral Kenya. Economic Geography 75(2): 178–189.
Doughty, P. L. (1968). Huaylas; An Andean District in Search ofProgress. Cornell University Press, Ithaca.
Fall, P. L., et al. (2002). Agricultural Intensification and the SecondaryProducts Revolution Along the Jordan Rift. Human Ecology, AnInterdisciplinary Journal 30(4): 445–482.
Feder, E. (1981). Campesinistas y Descampesinistas. In Garcia, A.(ed.), Desarrollo Agrario y la América Latina. Fondo de CulturaEconómica, México.
Foster, G. M. (1965). Peasanty Society and the Image of the LimitedGood. American Anthropologist 67(2): 293–315.
García-Barrios, R., and García-Barrios, L. (1990). Environmental andTechnological Degradation in Peasant Agriculture: A Conse-
quence of Development in México. World Development 18(11):1569–1585.
Gladwin, C. (1991). Fertilizer Subsidy Removal Programs and TheirPotential Impacts on Women Farmers in Malawi and Cameroon.In Gladwin, C. (ed.), Structural Adjustment and African WomenFarmers. University of Florida Press, Gainesville.
Gross, D. R. (1990). Ecosystems and methodological problems inecological anthropology. In Moran, E. F. (ed.), The EcosystemApporach in Anthropology: From Concept to Practice. TheUniversity of Michigan Press, Ann Arbor, pp. 309–322.
Hall, C. (1995). Maximum Power: The Ideas and Applications of HTOdum. Colorado University Press, Niwot.
Halperin, R. (1994). Cultural Economies: Past and Present. TexasUniversity Press, Austin.
Hamaza, A. (1987). Peasantry and capitalism. In Shanin, T. (ed.),Peasants and Peasant Society. Blackwell Publishers, Washington.
Hannon, B. (1991). Accounting in ecological systems. In Costanza, R.(ed.), Ecological Economics; The Science and Management ofSustainability. Columbia University Press, New York, pp. 234–252.
Harris, M. (1979). Cultural Materialism: The Struggle for a Science ofCulture. Altamira Press, Thousand Oaks, CA.
Harris, M. (1990). Emics and etics revisited; Harris’s reply to Pike;Harris’s final response. In Headland, T. N., et al. (eds.), Emics andEtics: The Insider/Outsider Debate. Sage Press, Newbury Park.
Hunt, R. C. (2000). Labor Productivity and Agricultural Development:Boserup Revisited. Human Ecology, An Interdisciplinary Journal28(2): 251–279.
Johnson, A., and Earle, T. (1987). The Evolution of Human Societies:From Foraging Group to Agrarian State. Stanford UniversityPress, Stanford.
Jokisch, B. D. (2002). Migration and Agricultural Change: The Caseof Smallholder Agriculture in Highland Ecuador. Human Ecology,An Interdisciplinary Journal 30(4): 523–550.
Kaser, G., and Georges, C. (1997). Changes of the Equilibrium-LineAltitude in the Tropical Cordillera Blanca, Peru, 1930–50, andTheir Spatial Variations. Annals of Glaciology 24: 344–349.
Kates, R., et al. (1993). Theory, evidence, study design. In TurnerII, B. L., et al. (eds.), Population Growth and AgriculturalChange in Africa. University Press of Florida, Gainesville, pp.1–40.
Kearney, M. (1996). Reconceptualizing the Peasantry: Anthropologyin Global Perspective. Westview Press, Boulder.
Lenin, V. I. (1956). The Development of Capitalism in Russia; theProcess of the Formation of a Home Market for Large-scaleIndustry. Foreign Languages Publishing House, Moscow.
Mintz, S.W. (1989). Afterword: peasantries and the rural sector –notes ona discovery. In Weller, R., and Guggenheim, S. (eds.), Power andProtest in the Countryside; Rural Unrest in Asia, Europe, and LatinAmerica. Duke University Press, Durham.
Moran, E. (1979). Human Adaptability: An Introduction to EcologicalAnthropology. Westview Press, Boulder.
Netting, R. M. (1974). Agrarian Ecology. Annual Review ofAnthropology 3: 21–56.
Netting, R. M. (1976). What Alpine Peasants Have in Common:Observations on comunal tenure in a Swiss village. HumanEcology, An Interdisciplinary Journal 4(2): 135–145.
Netting, R. M. (1986). Cultural Ecology, 2nd ed. Waveland Press, Inc,Prospect Heights.
Netting, R. M. (1993). Smallholders, Householders: Farm Familiesand the Ecology of Intensive Sustainable Agriculture. StanfordUniversity Press, Stanford.
Odum, H. T. (1994). Ecological and General Systems: AnIntroduction to Systems Ecology. Colorado University Press,Boulder.
Odum, H. T. (1996). Environmental Accounting: Emergy and Environ-mental Decision Making. John Wiley and Sons, Inc., New York.
Hum Ecol (2011) 39:555–568 567
Redfield, R. (1947). The Folk Society. The American Journal ofSociology 52(4): 293–308.
Rocha, J. M. (1996). Culture, Rationality and Decision Making. InIsaac, B. (ed.), Research in Economic Anthropology, vol. 17. J.A.I. Press, Greenwich, pp. 13–42.
Rocha, J. M. (2001). Using Emergy Analysis in Ethnographic FieldResearch. Field Methods 13(3): 244–262.
Ruttan, V., and Hayami, Y. (1990). Induced Innovation Model ofAgricultural Development. In Eicher, C., and Staatz, J. (eds.),Agricultural Development in the Third World. Johns HopkinsUniversity Press, Washington, pp. 97–114.
Sahlins, M. (1972). Stone Age Economics. Adeline de Gruyter, NewYork.
Sanderson, S. K. (1995). Social Transformations: A General Theory ofHistorical Development. Blackwell, Cambridge.
Scott, J. C. (1985). Weapons of the Weak; Every Day Forms ofPeasant Resistance. Yale University Press, New Haven.
Snyder, D., and Kick, E. L. (1979). Structural Position in the WorldSystem and Economic Growth, 1955–1970: A Multiple-networkAnalysis of Transnational Interactions. The American Journal ofSociology 84(5): 1096–1126.
Staatz, J. M., and Eicher, C. K. (1990). Agricultural developmentideas in historical perspective. In Eicher, C. K., and Staatz, J. M.(eds.), Agricultural Development in the Third World. JohnsHopkins University Press, Washington, pp. 3–40.
Steward, J. H. (1955). Theory of Culture Change: The Method-ology of Multilinear Evolution. University of Illinois Press,Urbana.
Stonich, S. C. (1992). Society and land degradation in CentralAmerica: issues in theory, methods and practice. In Poggie, J.,et al. (eds.), Anthropological Research: Process and Application.Suny Press, New York, pp. 137–158.
Swedlund, A. (1978). Historical Demography as Population Ecology.Annual Review of Anthropology 7: 137–173.
Timmer, P. (1991). The agricultural transformation. In Eicher, C., andStaatz, J. (eds.), Agricultural Development in the Third World.Johns Hopkins University Press, Washington.
Timmer, P., et al. (1983). Food Policy Analysis. Johns HopkinsUniversity Press, Washington.
Turner, B. L., et al. (eds.) (1993). Population Growth and AgriculturalChange in Africa. University of Florida Press, Gainesville.
Vuille, M., et al. (2003). 20th Century Climate Change in the TropicalAndes: Observations and Model Results. Climate Change 59(1):75–99.
White, L. A. (1949). The Science of Culture: A study of man andcivilization. Farrar, Straus and Giroux, New York, NY.
Wilk, R. (1984). Households in process: agricultural change and domestictransformation among the KekchiMaya of Belize. In Netting, R.M.,et al. (eds.), Households. University of California Press, California.
Wilken, G. C. (1990). Good Farmers: Traditional AgriculturalResource Management in Mexico and Central America. Universityof California Press, Berkeley.
Wolf, E. R. (1957). Closed Corporate Peasant Communities in Meso-america and Central Java. Southwestern Journal of Anthropology 13(1): 1–18.
Wolf, E. R. (1965). Peasants. Prentice Hall, New York.
568 Hum Ecol (2011) 39:555–568


