Embed Size (px)
Citation preview
Alcohol expectancies, conduct disorder and early-onsetalcoholism: negative alcohol expectancies are associated withless drinking in non-impulsive versus impulsive subjects
Peter R. Finn, Lyuba Bobova, Elizabeth Wehner, Susan Fargo, and Martin E. RickertDepartment of Psychology, Indiana University, Bloomington, IN, USA
AbstractAims—Research suggests that positive alcohol expectancies promote excessive alcohol use whilenegative alcohol expectancies discourage excessive alcohol use. Evidence suggests that disinhibitorycharacteristics, such as conduct disorder and impulsivity, are associated with a general neglect oflong-term negative outcomes. This study assessed whether negative expectancies would beassociated more strongly with lower levels of alcohol use for low- compared with high-impulsiveindividuals.
Design—Positive and negative alcohol expectancies, alcohol use and impulsivity were assessed ina sample of 99 young adults with alcohol dependence (AD) and conduct disorder (CD), 77 with ADand no CD and 124 controls.
Findings—AD/CD subjects had higher proximal (same day) and distal (next day) negative alcoholexpectancies, even though they drank more alcohol, compared with AD-alone and control subjects.Distal negative expectancies were associated more strongly with lower levels of drinking for low-impulsive compared with high-impulsive subjects. Proximal negative expectancies were associatedmore strongly with higher alcohol consumption for high- versus low-impulsive subjects.
Conclusions—Impulsivity and conduct disorder may be important factors in determining howmuch distal negative alcohol expectancies may discourage excessive alcohol consumption.
KeywordsAlcohol; alcoholism; expectancies; impulsivity
INTRODUCTIONPeople’s expectations about how alcohol will affect them are associated with how much theydrink and the number of alcohol-related problems they have experienced (Brown, Goldman &Christiansen 1985; Mann et al. 1987; Stacy, Widaman & Marlatt 1990; McMahon & Jones1993; Wood, Sher & Strathman 1996; Finn et al. 2000). The expectations that drinking alcoholwill result in desirable outcomes, called positive alcohol expectancies, are thought to promoteincreased alcohol use (Brown et al. 1980; Brown et al. 1985). Higher positive alcoholexpectancies have been associated with higher levels of current drinking (Brown et al. 1985;Mann et al. 1987; Sher et al. 1991; Webb et al. 1993; Henderson et al. 1994; Finn et al.2000), higher levels of future alcohol involvement in prospective studies (Bauman et al.1985; Christiansen et al. 1989; Stacy et al. 1990; Smith et al. 1995; Sher et al. 1996) and a
Correspondence to: Peter R. Finn, Department of Psychology, Indiana University, 1101 E. 10th Street, Bloomington, IN 47405-7007,USA, Tel: 812 855 9548, Fax: 812 855 4691, E-mail: [email protected].
NIH Public AccessAuthor ManuscriptAddiction. Author manuscript; available in PMC 2006 July 10.
Published in final edited form as:Addiction. 2005 July ; 100(7): 953–962.
NIH
-PA Author Manuscript
NIH
-PA Author Manuscript
NIH
-PA Author Manuscript
greater likelihood of relapse for post-treatment problem drinkers (Connors, O’Farrell &Pelcovits 1988).
The expectations that alcohol consumption will result in undesirable outcomes, called negativealcohol expectancies, are thought to discourage alcohol consumption (Ludwig 1985; Leigh1987; Sharkansky & Finn 1998). Negative expectancies have been associated with lower levelsof alcohol use (Kilbey, Downey & Breslau 1998; Leigh 1989; Weirs et al. 1997; Sharkansky& Finn 1998), a lower likelihood for relapse after treatment (Eastman & Norris 1982; Jones &McMahon 1994), and reasons to stop excessive drinking in remitted problem drinkers (Ludwig1985; Amodeo & Kurtz 1990). However, in other studies, high negative expectancies havebeen associated with heavy drinking (e.g. Mann et al. 1987; McMahon, Jones & O’Donnell1994). Still other studies report no association between negative expectancies and alcohol use(Southwick et al. 1981; Fromme et al. 1993).
The precise reasons for the inconsistencies in the association between negative expectanciesand levels of alcohol use are not clear. Some suggest that the association between negativeexpectancies and drinking may vary by population (e.g. problem versus non-problem drinkers,treatment versus non-treatment samples, etc.), by dose and by time-course, such as proximal(same-day) and distal (next day) consequences (McMahon et al. 1994; Weirs et al. 1997).McMahon et al. (1994) proposed that high negative expectancies are associated mainly withproblem drinking, because problem drinkers accumulate many negative experiences, whilenegative expectancies are either absent or inoperative for light drinkers. However, McMahonet al. 1994) also note that in treatment samples or in heavy drinkers considering change,negative expectancies are more likely to be associated with abstinence or reductions indrinking. McMahon and colleagues (McMahon & Jones 1993; McMahon et al. 1994) note theimportance of distinguishing the roles of proximal negative expectancies (i.e. the effectsexperienced the day of drinking) from distal negative expectancies (i.e. the effects experiencedthe next day). These researchers propose that proximal negative expectancies are less likely toinfluence drinking restraint (McMahon et al. 1994) and distal expectancies more likely toinfluence restraint.
We propose that the association between negative expectancies and drinking is moderated bypoor inhibitory control associated with impulsivity. Other research suggests that personalitymay moderate the association between positive expectancies and alcohol outcomes. McCarthy,Kroll & Smith (2001) found that neurotic extraversion, a construct thought to be associatedwith increased reward-seeking, moderated the association between positive expectancies anddrinking problems, but not drinking behavior. Fischer et al. (2003) found that positiveexpectancies were associated more strongly drinking level for those high in extroversioncompared with those low in extraversion. The central idea in McCarthy et al. (2001) and Fischeret al. (2003) is that increased reward-seeking moderates the association between positiveexpectancies and drinking. The key idea in the current study is that the poor inhibitory controlassociated with impulsivity moderates the association between negative expectancies anddrinking. Negative expectancies should be less likely to inhibit or discourage drinking in heavydrinkers with high levels of impulsivity, because impulsivity is associated with weakbehavioral inhibition when faced with the prospect of adverse outcomes (Finn 2002; Finn etal. 2002).
The first hypothesis tested in this study is that alcoholics with conduct disorder, who have highlevels of impulsivity, weak behavioral inhibition and severe symptoms of dependence (Finnet al. 2002), have high proximal negative alcohol expectancies even though they drinkexcessively. Based on McMahon et al.’s (1994) ideas, these subjects should accumulate morenegative experiences as a result of excessive drinking and have higher proximal, and perhapsdistal, negative alcohol expectancies compared with alcoholics without conduct disorder and
Finn et al. Page 2
Addiction. Author manuscript; available in PMC 2006 July 10.
NIH
-PA Author Manuscript
NIH
-PA Author Manuscript
NIH
-PA Author Manuscript
controls. In other words, these subjects have many alcohol-related problems, recognize thepossibility that bad things may happen when they are drunk and know that they are likely tohave a hangover the next day, yet they still drink to excess on a regular basis. Research suggeststhat alcoholics with conduct disorder are less inhibited by the prospect of negative outcomesthan controls and alcoholics without conduct disorder (Mazas, Finn & Steinmetz 2000; Finnet al. 2002) and may continue to drink excessively even though they expect negativeconsequences. Because alcohol problems and high levels of drinking covary strongly with highpositive alcohol expectancies (Mann et al. 1987; Sher et al. 1991; Henderson et al. 1994; Finnet al. 2000), we also expected that both alcoholic groups would have higher positive alcoholexpectancies compared with controls.
The second and third hypotheses tested in this study were related to our proposal thatimpulsivity moderates the association between negative expectancies and drinking. The secondhypothesis was that for high-impulsive individuals, higher proximal negative expectancies areassociated more strongly with more drinking than for low-impulsive individuals. Consistentwith McMahon et al.’s (McMahon & Jones 1993; McMahon et al. 1994) work, we expecteda positive correlation between drinking and proximal negative expectancies, because proximalnegative expectancies are thought to be less likely to influence drinking restraint in a non-treatment sample of young adult alcoholics in the early stages of alcohol dependence.Furthermore, we expected impulsivity to moderate this relationship such that proximal negativeexpectancies will be associated more strongly with higher levels of drinking for impulsivesubjects. Although we expect that the same is true for alcoholics with conduct disorder, ourmodel (Finn 2002) posits that the key moderating process is associated with the personalitytrait of impulsivity, rather than diagnostic category. The third hypothesis was that for low-impulsive individuals, higher distal (next day) negative expectancies would be associated morestrongly with lower levels of drinking compared with high-impulsive subjects. In other words,the expectation of experiencing negative consequences the day after heavy drinking should bemore likely to discourage heavy drinking in low- versus high-impulsive individuals.
METHODSParticipants
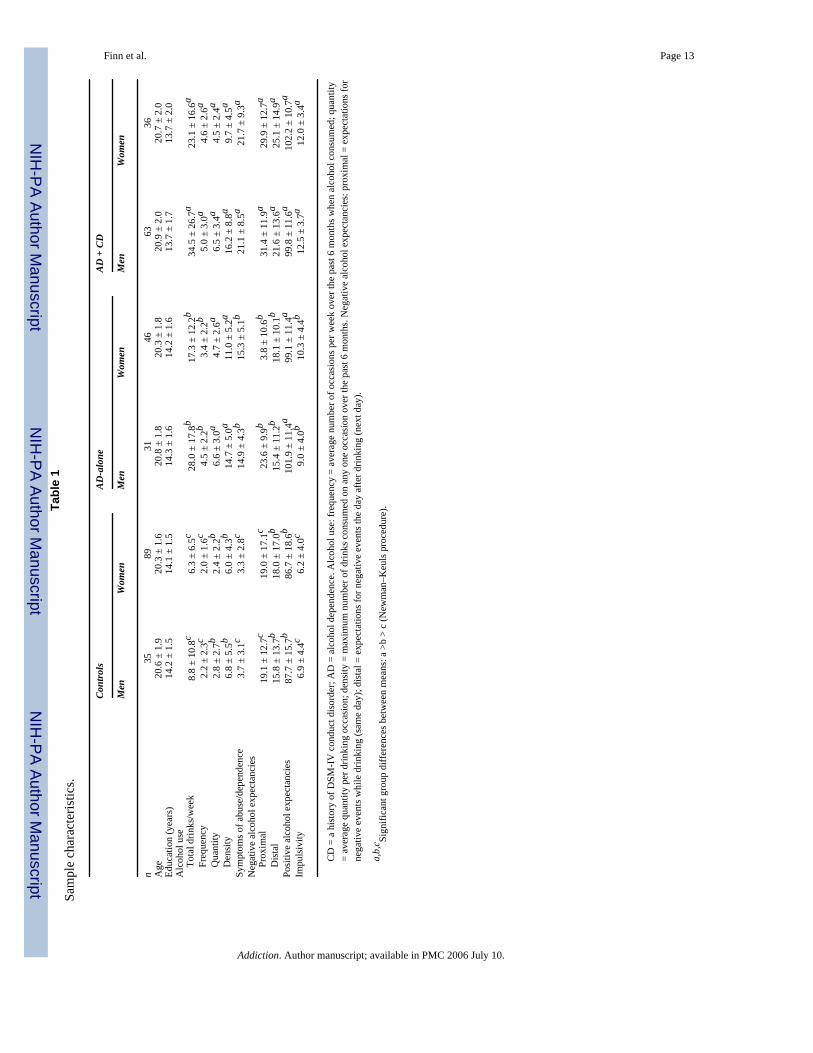
The sample consisted of 300 young adult subjects (222 white, 34 black, 10 Hispanic, 10 Asian,five Native Americans and 19 other) with a mean age of 20.6 ± 1.8 years (range 18–25 years),92% (n = 277) of whom were college students; 99 with diagnoses of alcohol dependence (AD)and a history of childhood conduct disorder (the AD/CD group), 77 with AD without childhoodCD (AD-alone group) and 124 controls with neither AD, childhood CD or any history of othersubstance abuse. The onset of alcoholism was ≤ 21 years of age for all subjects with AD. Ofthe non-college students, there were 20 white, one Native American, one Hispanic and oneother ethnicity. Table 1 displays the group characteristics on demographic and self-reportmeasures.
Recruitment—The subjects were recruited from the community using advertisements placedin local newspapers and around the local community. Advertisements were designed usingWidom’s (1977) approach to attract responses from individuals varying in terms of the levelof impulsive, disinhibited traits. Highly disinhibited subjects were targeted with advertisementsasking for responses from ‘adventurous, carefree individuals, who have led exciting andimpulsive lives’, or ‘daring, rebellious, defiant individuals’, or ‘individuals on probation orwho have been in trouble with the law’. Subjects with average or low levels of disinhibitedtraits were targeted with advertisements asking for ‘persons interested in psychologicalresearch’, or ‘quiet, reflective and introspective persons’. Subjects were excluded if they werenot between 18 and 25 years of age, were taking any psychotropic or antihistamine medications,
Finn et al. Page 3
Addiction. Author manuscript; available in PMC 2006 July 10.
NIH
-PA Author Manuscript
NIH
-PA Author Manuscript
NIH
-PA Author Manuscript
had never consumed alcohol, had a history of heart disease or psychosis, were not able to speakor read English or had less than a grade 6 education level. Prior to testing, subjects wereadministered a breath-alcohol test using an AlcoSensor-III (Intoximeters, Inc., St Louis, MO,USA) to ensure that their breath-alcohol level (BAL) was 0.00%. Subjects read and signed aninformed consent to participate, were free to refuse any procedure and were paid $10.00 perhour. The study was approved by the Institutional Review Board at Indiana University.
MeasuresPsychiatric diagnoses were ascertained by the first author, a clinical psychologist, fromresponses on the Semi-Structured Interview for the Genetics of Alcoholism (SSAGA: Bucholzet al. 1994) using criteria from the Diagnostic and Statistical Manual of Mental Disorders, 4thedition (DSM-IV, American Psychiatric Association 1994). The SSAGA assesses the onset ofeach symptom and was used to determine the onset of alcohol abuse or dependence. Thenumber of symptoms of alcohol abuse or dependence was quantified as the total number ofsymptoms endorsed by the subject on the SSAGA interview. A history of conduct disorderwas ascertained from responses to the antisocial personality section of the Diagnostic InterviewSchedule (Robins et al. 1985) using DSM-IV criteria.
Alcohol use was assessed as frequency, quantity and density measures of alcohol consumptionfor the past 6 months. Frequency of consumption was defined as the total number of occasionsalcohol was consumed in a typical week. The alcohol quantity measure was defined as theaverage amount of alcohol consumed (in standard drinks) per occasion in a typical week. Astandard drink was defined as one beer or wine cooler, one glass of wine, one shot of liquor orone 1.5-oz (45-ml) mixed drink. The density measure was the greatest number of drinksconsumed on any one occasion in the preceding 6 months. The alcohol measures were square-root transformed and used as indicator measures for an alcohol-use latent variable for structuredequation modeling analyses. The alcohol variables were not transformed for the ANOVAs.
Negative alcohol expectancies were assessed using the proximal (same day) and distal (nextday) scales from an adapted version of the Negative Alcohol Expectancy Questionnaire(NAEQ: McMahon & Jones 1993). The NAEQ was originally designed to assess theexpectations of alcoholics in treatment about what negative events might happen if they had adrink (i.e. relapsed). The scales list a series of negative events/outcomes that follow thequestion, ‘If I went for a drink now, then …’ for the proximal scale and ‘If I went for a drinknow, then tomorrow …’ for the distal next-day scale. The proximal scales assesses expectationsfor events such as having a car accident, going to jail, wetting the bed, losing your driver’slicense, becoming depressed, anxious, sleepless, boastful, argumentative, aggressive or losingcontrol. The distal scale assesses expectations for physical (sweats, shakes, ill, sick, unable toeat), emotional (depressed, anxious, guilty, afraid, restless, shy) and other hangover/withdrawal symptoms (sleepless, low self-esteem, craving, missing work). Because we wereinterested in examining negative expectancies for heavy drinking in a non-treatment sample,rather than expectancies for relapse in a treatment sample, we adapted the NAEQ by changingthe wording of the questions preceding the list of negative events. The proximal subscale waschanged to ‘if I were to go out and drink heavily this weekend, then …’. The distal subscalewas changed to ‘if I were to go out and drink heavily this weekend, then the next day …’. Highscores on each scale reflect greater negative expectancies.
We assessed negative expectancies for heavy drinking (i.e. ‘what would happen if you wereto drink heavily this weekend?’), because it is less likely that any negative events will followlight drinking. Because research suggests that the association between negative expectanciesand drinking varies by dose (Weirs et al. 1997), we wanted to include some common benchmarkto use for all subjects. Positive expectancies were assessed as proximal expectancies only,because it is hard to think of how drinking might be associated with positive next-day outcomes.
Finn et al. Page 4
Addiction. Author manuscript; available in PMC 2006 July 10.
NIH
-PA Author Manuscript
NIH
-PA Author Manuscript
NIH
-PA Author Manuscript
Positive alcohol expectancies were assessed on five of the six subscales of the AlcoholExpectancy Questionnaire (AEQ: Brown, Christiansen & Goldman 1987); global positivechange (Scale 1), sexual enhancement (Scale 2), physical/social pleasure (Scale 3), socialassertion (Scale 4) and tension reduction (Scale 5). Scale 6, aggression, was not includedbecause it is not a positive expectancy. The AEQ, which is probably the most widely usedmeasure of alcohol expectancies, has been shown to be predictive of drinking patterns (Leigh1989).
Impulsivity was assessed with the Eysenck Impulsivity–Venturesomeness scale (EIV: Eysenck& Eysenck 1978). High scores on this scale reflect lower self-control, greater spontaneity,increased recklessness and a lack of planning and reduced foresight (Luengo, Carrillo de laPena & Otero 1991; Finn et al. 2002).
Data analysesANOVAs were used to test the first set of hypotheses that AD/CD subjects would have highernegative expectancies than AD-alone and control subjects even though they drink more alcoholand that both AD groups would have higher positive expectancies than controls.
Multiple-groups structured equation models (SEM) were used to test the hypotheses that theassociation between negative expectancies and drinking would differ between high- and low-impulsive subjects. We hypothesized that for high-impulsive individuals drinking would bepositively associated more strongly with proximal negative expectancies, and that for low-impulsive subjects drinking would be associated more strongly with lower distal negativeexpectancies. AMOS 3.61 (Arbuckle 1997) was used to fit the SEM to the covariance matricesof the measures of negative expectancies (proximal and distal), total positive expectancies,impulsivity and alcohol use, which was assessed as a latent variable. In the model (see Fig. 1)measures of expectancies and impulsivity served as independent variables and the latentvariable of alcohol use was the dependent measure. We obtained a maximum likelihoodsolution for the entire sample to estimate the associations (i.e. covariance structure) amongmeasures. The sample was then divided into high- and low-impulsive subjects using a mediansplit and a multiple groups SEM was conducted to test the hypothesis concerning differencesbetween high- and low-impulsive subjects on the paths from negative expectancies to alcoholuse. The multiple-groups SEM compared the relative fit of a fully constrained model, whereall paths were constrained to be equal for high- and low-impulsive subjects, with a partiallyconstrained model that allowed the paths from proximal and distal negative expectancies toalcohol use to vary freely between high-and low-impulsive groups, but kept the paths frompositive expectancies and impulsivity to alcohol use constrained to be equal across groups.Multiple-groups SEMs were used rather than multiple regression, because the SEM approachallows greater control for testing specific hypotheses by constraining or unconstraining specificpaths.
RESULTSGroup differences in expectancies
A two-factor (group × gender) ANOVA was used to test our hypotheses about groupdifferences on each of the three expectancy measures. As hypothesized, the AD/CD group hadhigher proximal (F = 17.9, 2/294 df, P < 0.0001) and distal (F = 6.3, 2/294 df, P < 0.01) negativeexpectancies than both controls and the AD-alone group, even though they drank more alcoholper week than both groups (F = 43.5, 2/294 df, P < 0.0001). Table 1 presents these data. TheAD-alone group had significantly higher proximal negative expectancies than controls, but didnot differ from controls on distal negative expectancies. Both the AD/CD and the AD-alonegroup also had higher positive alcohol expectancies than controls (F = 27.8, 2/294 df, P <
Finn et al. Page 5
Addiction. Author manuscript; available in PMC 2006 July 10.
NIH
-PA Author Manuscript
NIH
-PA Author Manuscript
NIH
-PA Author Manuscript
0.0001). There were no significant main effects of gender or gender × group interactions forany of the expectancy measures.
Group differences in alcohol measures and impulsivityAs illustrated in Table 1, there were significant group differences in alcohol consumption levels(Fs = 34.2–43.5, 2/294 df, all Ps < 0.0001), symptoms of abuse and dependence (F = 227.6,2/294 df, P < 0.0001) and impulsivity (F = 48.2, 2/294 df, P < 0.0001). A main effect of genderon each measure revealed that men had higher levels of drinking than women (Fs = 4.0–25.8,1/294 df, Ps < 0.05–0.0001). There was a significant group × gender interaction only on thealcohol density measure (F = 5.5, 2/294 df, P < 0.01). In the two alcoholic groups, men hadhigher density measures than women, but men did not differ from women in the control group.Table 1 displays the specific pattern of group differences on each of these measures.
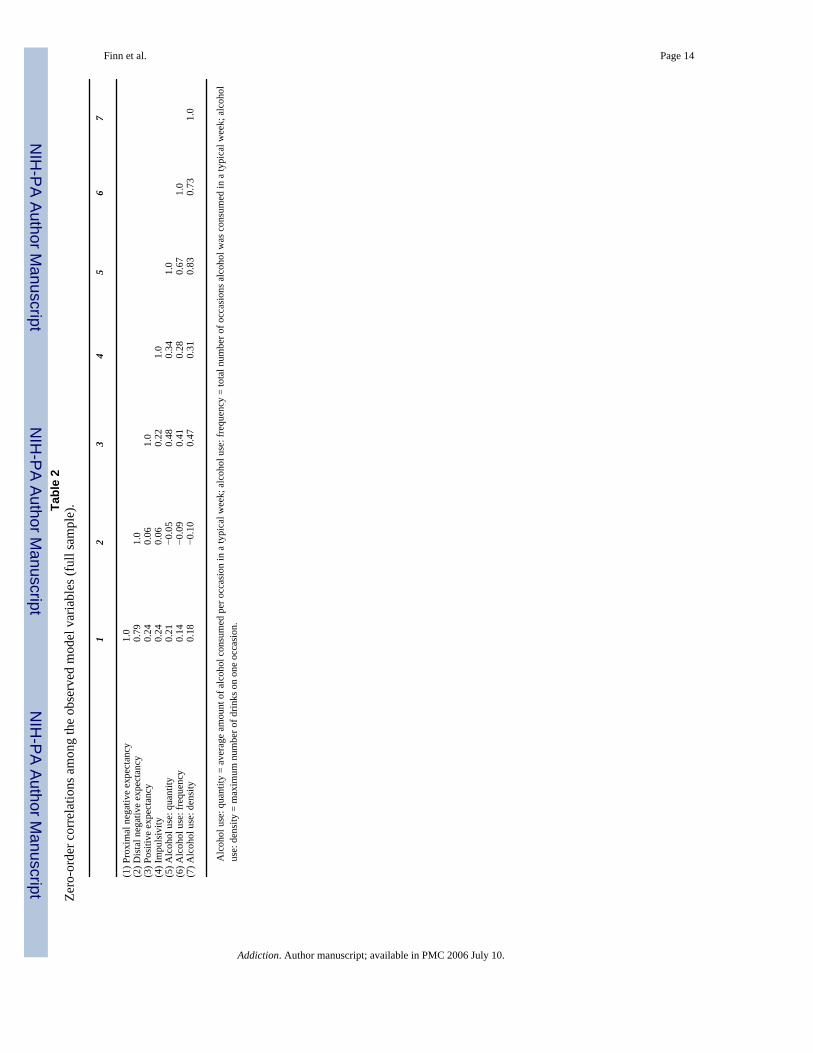
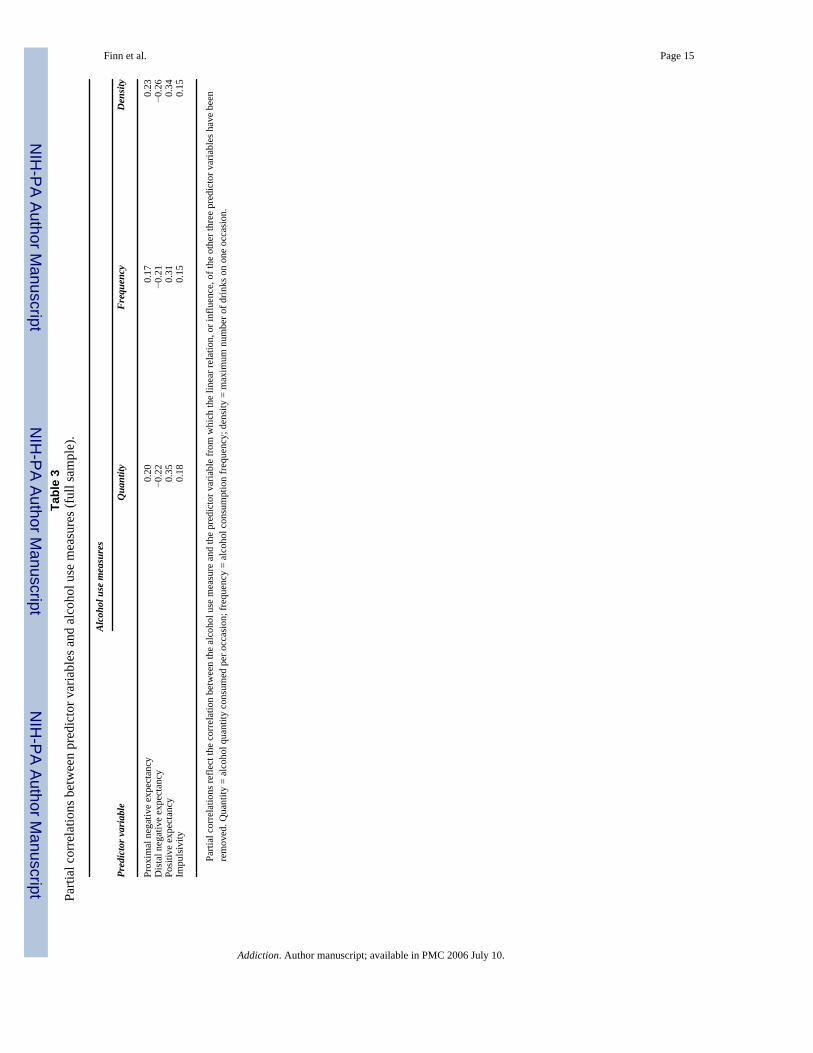
Impulsivity and the association between expectancies and drinkingFull sample analysis—The SEM for the full sample (Fig. 1: top panel) fitted the data well[χ2(8 df, n = 300) = 5.4, P = 0.71, GFI = 0.99, RMSEA = 0.0001] and accounted for 40% inthe variation in alcohol use. All path coefficients are significant in this model. As can be seenfrom Fig. 1, higher scores on measures of positive expectancies, proximal negativeexpectancies and impulsivity were significantly associated (Ps < 0.0005) with more alcoholuse, while higher scores on the distal (next day) negative alcohol expectancies were associatedwith less alcohol use. Table 2 displays the Pearson product–moment correlations among theobserved variables in the model. It is worth noting that the zero-order correlations betweendistal negative expectancies and alcohol use measures are not statistically significant. However,when the influence of proximal negative expectancies is partialled out, the first-order partialcorrelations between distal negative expectancies and the alcohol use measures are significant(r = −0.35, −0.31 and −0.38, Ps < 0.001, for quantity, frequency and density measures ofdrinking, respectively). When the joint influence of proximal negative expectancies, positiveexpectancies and impulsivity are partialled out, the correlations are still significant butsomewhat lower. Table 3 displays the partial correlations between the predictor variables andthe three alcohol use measures.
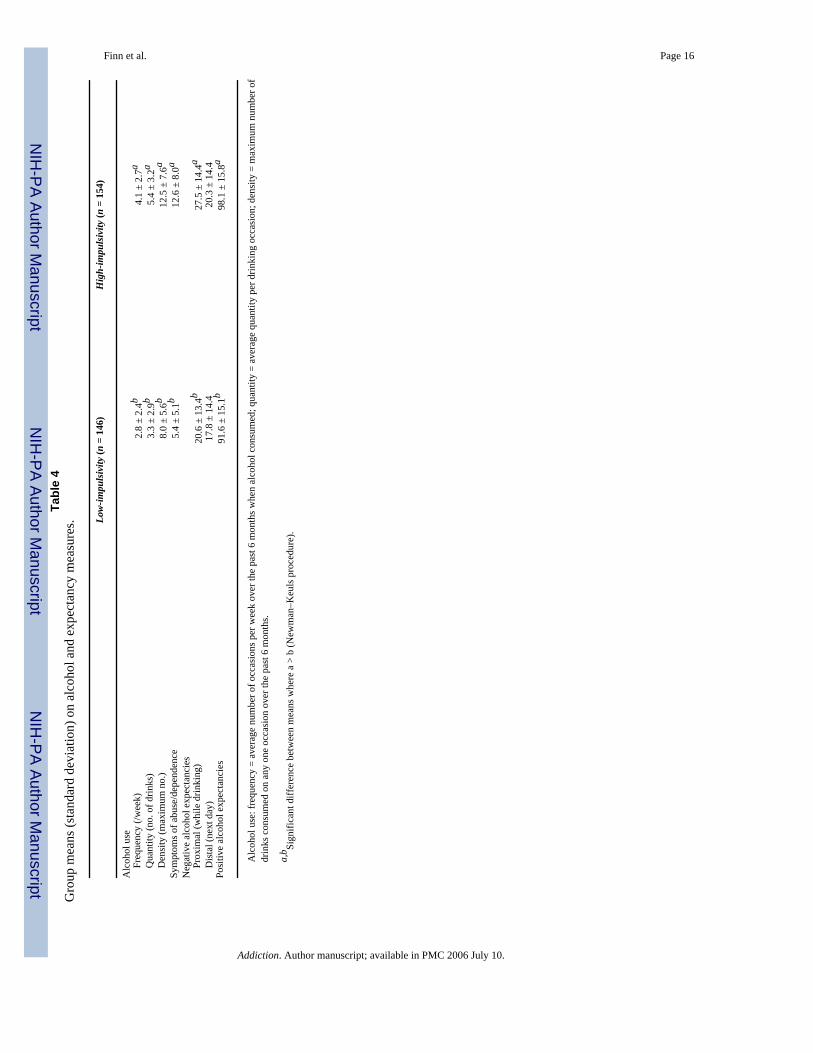
Impulsivity group differences—As described above, the sample was divided into high-and low-impulsive groups based on a median split. Multiple-groups SEM was then conductedcomparing the fit of a fully constrained model and a partially constrained model to assessimpulsivity group differences in the strength of the paths from negative expectancies to alcoholuse. In the low-impulsivity group there were 96 controls, 33 AD-alone, and 17 AD/CD subjects.In the high-impulsivity group there were 28 controls, 44 AD-alone and 82 AD/CD subjects.Table 4 displays the means for the alcohol and expectancy measures for low- and high-impulsive subjects. On the multiple groups SEM, the unconstrained model fitted the data well[χ2(18 df, n = 300) = 23.5, P = 0.173, GFI = 0.98, RMSEA = 0.03] and provided a better fitthan the constrained model [χ2(20 df, n = 300) = 31.5, P = 0.049, GFI = 0.97, RMSEA = 0.04,difference χ2 (2 df, n = 300) = 8.0, P < 0.05] indicating that the association of proximal anddistal negative expectancies with alcohol use differed between high- and low- impulsiveindividuals. The moderation effect of impulsivity is also evident using a multiple regressionapproach to analysis, where both the impulsivity × proximal and impulsivity × distalexpectancies interactions were significant for quantity [t (1) = 2.1 and 2.2; Ps < 0.05] anddensity measures [t (1) = 2.3 and 2.9; Ps < 0.05], but not the frequency measure [t (1) = 0.48and 1.4], and the impulsivity × positive expectancies interaction was not significant for any ofthe alcohol measures [ts (1) = 0.1, 0.36 and 0.97]. Figure 1 (middle and bottom panels) displaythe associations between expectancies and alcohol use for high- and low-impulsive subjects.Consistent with our hypotheses, high proximal negative expectancies were associated morestrongly with alcohol use for high-impulsive subjects (β = 0.49, P < 0.00001 versus β = 0.38,
Finn et al. Page 6
Addiction. Author manuscript; available in PMC 2006 July 10.
NIH
-PA Author Manuscript
NIH
-PA Author Manuscript
NIH
-PA Author Manuscript
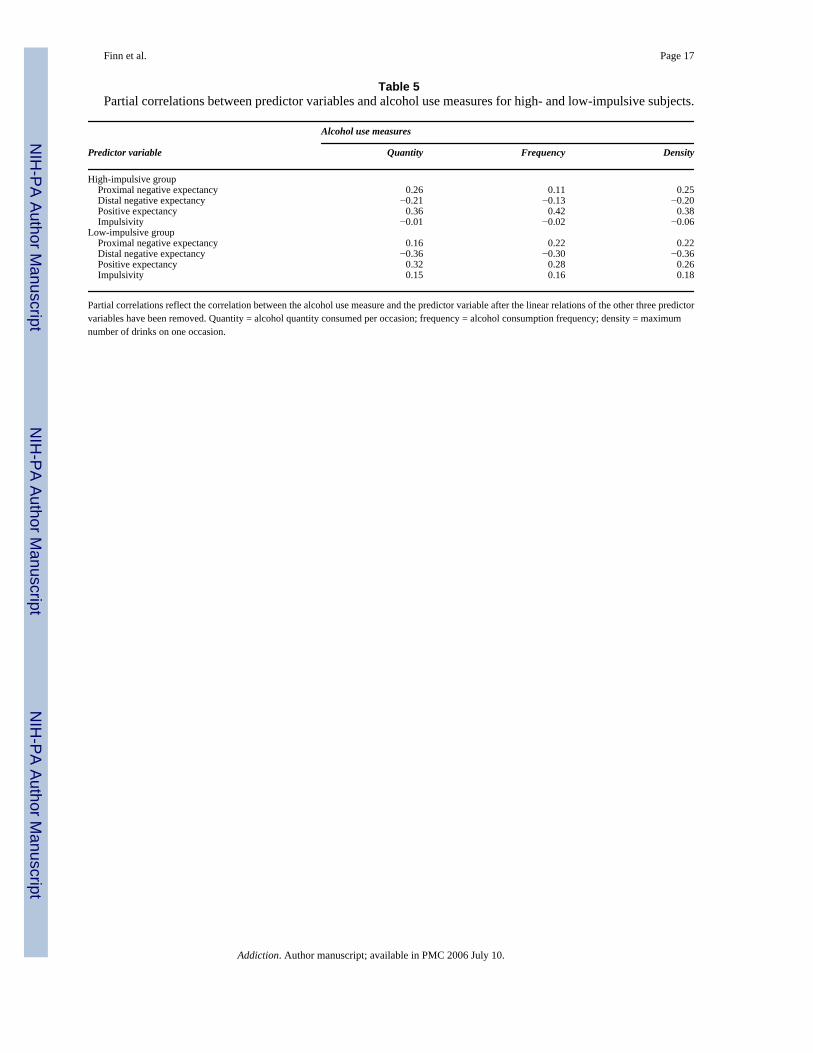
P < 0.001 for low-impulsives), and higher distal negative expectancies were associated withless drinking for low-impulsive subjects (β = −0.60, P < 0.00001 versus β = −0.38, P < 0.005for high-impulsives). The third-order partial correlations between the predictor variables andthe alcohol use measures for high- and low-impulsive subjects are displayed in Table 5.
To ensure that each of these two paths were significantly different between impulsive groups,the multiple group SEM was repeated using a partially constrained model that allowed onlyproximal negative expectancies to vary freely between groups and, again, using a partiallyconstrained model that allowed only distal negative expectancies to freely vary betweengroups. When group differences on proximal negative expectancies were isolated and tested,the multiple groups SEM remained significant [difference χ2 (1 df, n = 300) = 5.9, P < 0.05]indicating that the association between high proximal negative expectancies and high drinkinglevels was stronger for high impulsive subjects. Similarly, when group differences on distalnegative expectancies were isolated and tested, the multiple groups SEM remained significant[difference χ2 (1 df, n = 300) = 7.9, P < 0.01] indicating that the association between high distalnegative expectancies and lower drinking was stronger for low impulsive subjects.
DISCUSSIONThe results of this study are consistent with our overarching theory that negative alcoholexpectancies do not discourage drinking as much in people with high levels of impulsivity. Ina non-treatment sample, alcoholics with a history of conduct disorder (AD/CD) had higherlevels of both proximal and distal negative expectancies compared with alcoholics withoutconduct disorder (AD-alone) and controls, even though AD/CD subjects drank more than bothAD-alone and control subjects. Consistent with our hypotheses, higher proximal negativeexpectancies were associated more strongly with higher levels of alcohol consumption for high-impulsive compared with low-impulsive subjects, and higher distal negative expectancies wereassociated more strongly with lower levels of alcohol consumption in low-impulsive comparedwith high-impulsive subjects. Consistent with McMahon et al.’s (1994) findings that proximalnegative expectancies are less likely to influence drinking restraint and distal expectanciesmore likely to influence restraint, we found that proximal negative expectancies were positivelycorrelated with alcohol use while negative expectancies were negatively correlated withalcohol use.
The fact that AD/CD subjects had both higher negative alcohol expectancies and moresymptoms of alcohol abuse and dependence compared with AD-alone and control subjects,suggests that their reports of negative alcohol expectancies accurately reflect the negativeoutcomes that typically occur when they drink heavily. These results are consistent with thefindings of Mann et al. (1987) and McMahon et al. (1994) and lend credence to the McMahonand colleagues’ idea that heavy drinkers accumulate many experiences of the negativeconsequences of heavy drinking and, as a result, develop stronger negative alcoholexpectancies (McMahon & Jones 1993; McMahon et al. 1994). However, even though AD/CD subjects expect more negative outcomes after drinking, they also expect significantly morepositive drinking outcomes than controls. As expected, both alcoholic groups had significantlyhigher positive expectancies compared with controls, although it is difficult to assess whetherthey actually experience many positive outcomes after drinking. These results are consistentwith studies showing that positive alcohol expectancies are associated with heavy drinking(e.g. Sher et al. 1991; Webb et al. 1993; Henderson et al. 1994; Rather & Goldman 1994; Smithet al. 1995; Finn et al. 2000). Our results (Table 5) suggest that positive alcohol expectanciesinfluence drinking more than negative expectancies for young adults with high levels ofimpulsivity.
Finn et al. Page 7
Addiction. Author manuscript; available in PMC 2006 July 10.
NIH
-PA Author Manuscript
NIH
-PA Author Manuscript
NIH
-PA Author Manuscript
Consistent with the idea that that negative expectancies may be less likely to inhibit ordiscourage drinking in heavy drinkers with high levels of disinhibitory characteristics (Finn2002), we found that proximal negative expectancies were associated more strongly withhigher levels of drinking and distal negative expectancies were less strongly associated withlower levels of drinking in high-impulsive compared with low-impulsive subjects. Thissuggests that, rather than playing a role in discouraging drinking, proximal negativeexpectancies appear to be relatively accurate reflections of the range of adverse consequencesthat high-impulsive subjects experience as a result of heavy drinking. The results also suggestthat distal negative expectancies may influence restraint more in low- than in high-impulsivesubjects. While these results are generally consistent with a disinhibitory model of impulsivity,negative expectancies and alcohol use, two aspects of the results were unexpected. First,although the association was weaker, high proximal negative expectancies were stillsignificantly associated with more drinking in low impulsive subjects. Thus, proximal negativeexpectancies in low-impulsive college students also appear to reflect the actual negativeconsequences of excessive drinking and do not appear to influence restraint. Secondly, afterpartialling out the influence of proximal negative expectancies, distal negative expectancieswere negatively correlated with drinking in high-impulsive subjects, suggesting that expectingadverse events the next day may still influence some restraint in high-impulsive subjects.
This study had a few limitations that should be considered when interpreting the results. First,our community-based sample was recruited in a fashion that was non-random (i.e. responsesto advertisements) and therefore it is not clear how representative it is of the general populationof young adult alcoholics who are not in treatment. Although recruiting from the communityshould result in a sample that is more representative of the population of alcoholics than asample of alcoholics in treatment, this approach suffers from some self-selection biases (e.g.requires someone to see and respond to an advertisement) and is more likely to attractparticipants who are college students and who are not employed on a full-time basis. Secondly,we did not assess positive alcohol expectancies in the same fashion as negative expectancies.We assessed negative expectancies for what would happen if the subject drank heavily. Forthe assessment of positive expectancies we used the AEQ (Brown et al. 1987), which assessesexpectancies for the general effects of alcohol without specifying a specific dose or level ofalcohol consumption. The AEQ was included initially in a test battery for a large study ofdisinhibitory processes in early-onset alcoholism, and we had not considered this particularstudy when deciding to include this measure. There might be a different association betweenpositive expectancies and drinking if we had assessed positive expectancies for the effects ofheavy drinking. It seems likely that low-impulsive, or non-alcoholic, subjects would expectfewer positive effects of heavy drinking than high-impulsive individuals. Finally, these dataare cross-section in nature and no conclusions can be made about the directionality of theobserved effects. Negative and positive alcohol expectancies can influence alcoholconsumption and can develop as a result of alcohol consumption.
In summary, consistent with a disinhibitory model of alcohol use, alcoholics with a history ofconduct disorder had higher levels of both proximal and distal negative expectancies eventhough they drank more alcohol compared with alcoholics without conduct disorder andcontrols. The results also revealed that for low-impulsive subjects, distal (next day) negativeexpectancies were more strongly associated with lower levels of alcohol consumptioncompared with high-impulsive subjects, suggesting that distal negative expectancies might bemore likely to influence drinking restraint in low-impulsive compared with high-impulsivesubjects. Proximal (same day) negative alcohol expectancies were positively correlated withalcohol consumption for both high- and low-impulsive subjects; however, the association wasstronger for high-impulsive subjects. Consistent with the findings of McMahon et al. (1993)these results suggest that proximal negative alcohol expectancies do not influence restraint inyoung adult subjects and may simply reflect an accurate report of the typical negative
Finn et al. Page 8
Addiction. Author manuscript; available in PMC 2006 July 10.
NIH
-PA Author Manuscript
NIH
-PA Author Manuscript
NIH
-PA Author Manuscript
consequences of heavy drinking. This study clearly underlines the importance of studyingindividual differences in how alcohol expectancies are associated with alcohol consumption.
Acknowledgements
This work was funded by NIH/NIAAA grant no. R01 AA13650.
ReferencesAmerican Psychiatric Association (1994) Diagnostic and Statistical Manual of Mental Disorders, 4th
edn. Washington, DC: APA.Amodeo M, Kurtz N. Cognitive processes and abstinence in a treated alcoholic population. International
Journal of the Addictions 1990;25:983–1009. [PubMed: 2090638]Arbuckle, J. L. (1997) AMOS, version 3.61 [computer software]. Chicago: Smallwaters Corporation.Bauman KE, Fisher LA, Bryan ES, Chenoweth RL. Relationship between subjective expected utility and
behavior: a longitudinal study of adolescent drinking behavior. Journal of Studies on Alcohol1985;46:32–38. [PubMed: 3974233]
Brown SA, Christiansen BA, Goldman MS. The alcohol expectancy questionnaire: an instrument for theassessment of adolescent and adult alcohol expectancies. Journal of Studies on Alcohol 1987;48:483–491. [PubMed: 3669677]
Brown SA, Goldman MS, Christiansen BA. Do alcohol expectancies mediate drinking patterns of adults?Journal of Consulting and Clinical Psychology 1985;53:512–519. [PubMed: 4031207]
Brown SA, Goldman MS, Inn A, Anderson LR. Expectations of reinforcement from alcohol: their domainand relation to drinking patterns. Journal of Consulting and Clinical Psychology 1980;48:419–426.[PubMed: 7400427]
Bucholz K, Cadoret R, Cloninger CR, Dinwiddie SH, Hesselbrock VM, Nurmberger JI Jr, et al. A new,semistructured psychiatric interview for use in genetic linkage studies: a report on the reliability ofthe SSAGA. Journal of Studies on Alcohol 1994;55:149–158. [PubMed: 8189735]
Christiansen BA, Smith GT, Roehling PV, Goldman MS. Using alcohol expectancies to predictadolescent drinking behavior at one year. Journal of Consulting and Clinical Psychology 1989;57:93–99. [PubMed: 2925979]
Connors GJ, O’Farrell TJ, Pelcovits MA. Drinking outcome expectancies among male alcoholics duringrelapse situations. British Journal of Addiction 1988;83:561–566. [PubMed: 3382814]
Eastman C, Norris H. Alcohol dependence, relapse, and self-identity. Journal of Studies on Alcohol1982;43:1214–1231. [PubMed: 7182679]
Eysenck SBG, Eysenck HJ. Impulsiveness and venturesomeness: their position in a dimensional systemof personality description. Psychological Reports 1978;43:1247–1255. [PubMed: 746091]
Finn PR. Motivation, working memory, and decision making: a cognitive-motivational theory ofpersonality vulnerability to alcoholism. Behavioral and Cognitive Neuroscience Reviews2002;1:183–205. [PubMed: 17715592]
Finn PR, Mazas C, Justus A, Steinmetz JE. Early-onset alcoholism with conduct disorder: Go/No-Golearning deficits, working memory capacity, and personality. Alcoholism: Clinical and ExperimentalResearch 2002;26:186–206.
Finn PR, Sharkansky EJ, Brandt KM, Turcotte N. The effects of familial risk, personality, andexpectancies on alcohol use and abuse. Journal of Abnormal Psychology 2000;109:122–133.[PubMed: 10740943]
Fischer S, Smith GT, Anderson KG, Flory K. Expectancy influences the operation of personality onbehavior. Psychology of Addictive Behaviors 2003;17:108–114. [PubMed: 12814274]
Fromme K, Stroot EA, Kaplan D. Comprehensive effects of alcohol: development and psychometricassessment of a new expectancy questionnaire. Psychological Assessment 1993;5:19–26.
Henderson MJ, Goldman MS, Coovert MD, Carnevalla N. Covariance structure models of expectancy.Journal of Studies on Alcohol 1994;55:315–326. [PubMed: 8022180]
Finn et al. Page 9
Addiction. Author manuscript; available in PMC 2006 July 10.
NIH
-PA Author Manuscript
NIH
-PA Author Manuscript
NIH
-PA Author Manuscript
Jones BT, McMahon J. Negative and positive alcohol expectancies as predictors of abstinence afterdischarge from a residential treatment program: a one-month and three-month follow-up study inmen. Journal of Studies on Alcohol 1994;55:543–548. [PubMed: 7990464]
Kilbey MM, Downey K, Breslau N. Predicting the emergence and persistence of alcohol dependence inyoung adults: the role of expectancy and other risk factors. Experimental and ClinicalPsychopharmacology 1998;6:149–156. [PubMed: 9608346]
Leigh BC. Beliefs on the effects of alcohol on self and others. Journal of Studies on Alcohol 1987;48:467–475. [PubMed: 3669675]
Leigh BC. Attitudes and expectancies as predictors of drinking habits: a comparison of three scales.Journal of Studies on Alcohol 1989;50:432–440. [PubMed: 2779245]
Ludwig AM. Cognitive processes associated with ‘spontaneous’ recovery from alcoholism. Journal ofStudies on Alcohol 1985;46:53–58. [PubMed: 3974236]
Luengo MA, Carrillo de la Pena MT, Otero JM. The components of impulsiveness: a comparison of theI-7 Impulsiveness questionnaire and the Barratt Impulsivity Scale. Personality and IndividualDifferences 1991;12:657–667.
Mann LM, Chassin L, Sher KJ. Alcohol expectancies and risk for alcoholism. Journal of Consulting andClinical Psychology 1987;55:411–417. [PubMed: 3597957]
Mazas C, Finn PR, Steinmetz JE. Decision making biases, antisocial personality, and early-onsetalcoholism. Alcoholism: Clinical and Experimental Research 2000;24:1036–1040.
McCarthy DM, Kroll LS, Smith GT. Integrating disinhibition and learning risk for alcohol use.Experimental and Clinical Psychopharmacology 2001;9:1064–1297.
McMahon J, Jones BT. The Negative Alcohol Expectancy Questionnaire. Journal of the Association ofNurses in Substance Abuse 1993;12:17.
McMahon J, Jones BT, O’Donnell P. Comparing positive and negative alcohol expectancies in male andfemale social drinkers. Addiction Research 1994;1:349–365.
Rather BC, Goldman MS. Drinking-related differences in memory organization of alcohol expectancies.Experimental and Clinical Psychopharmacology 1994;2:167–183.
Robins, L. N., Helzer, J. E., Spitzer, R. & Williams, J. (1985) The NIMH Diagnostic InterviewSchedule, version III-A. Washington, DC: Public Health Service.
Sharkansky EJ, Finn PP. Outcome expectancies and Disinhibition on ad-lib alcohol consumption. Journalof Studies on Alcohol 1998;59:198–206. [PubMed: 9500307]
Sher KJ, Walitzer KS, Wood PK, Brent EE. Characteristics of children of alcoholics: putative risk factors,substance use and abuse and psychopathology. Journal of Abnormal Psychology 1991;100:427–448.[PubMed: 1757657]
Sher KJ, Wood MD, Wood PK, Raskin G. Alcohol outcome expectancies and alcohol use: a latent cross-lagged panel study. Journal of Abnormal Psychology 1996;105:561–574. [PubMed: 8952189]
Smith GT, Goldman MS, Greenbaum PE, Christiansen BA. The expectancy for social facilitation fromdrinking: the divergent paths of high-expectancy and low-expectancy adolescents. Journal ofAbnormal Psychology 1995;104:32–40. [PubMed: 7897051]
Southwick L, Steele CM, Marlatt GA, Lindell M. Alcohol-related expectancies: defined by phase ofintoxication and drinking experience. Journal of Consulting and Clinical Psychology 1981;49:713–721. [PubMed: 7287981]
Stacy AW, Widaman KF, Marlatt GA. Expectancy models of alcohol use. Journal of Personality andSocial Psychology 1990;58:918–928. [PubMed: 2348377]
Webb JA, Baer PE, Francis DJ, Caid CD. Relationship among social and intrapersonal risk, alcoholexpectancies, and alcohol usage among early adolescents. Addictive Behaviors 1993;18:127–134.[PubMed: 8506783]
Weirs RW, Hoogeveen KJ, Sergeant JA, Gunning WB. High- and low-dose alcohol-related expectanciesand the differential associations with drinking in male and female adolescents and young adults.Addiction 1997;92:871–888. [PubMed: 9293046]
Widom CS. A methodology for studying noninstitutionalized psychopaths. Journal of Consulting andClinical Psychology 1977;45:674–683. [PubMed: 886050]
Finn et al. Page 10
Addiction. Author manuscript; available in PMC 2006 July 10.
NIH
-PA Author Manuscript
NIH
-PA Author Manuscript
NIH
-PA Author Manuscript
Wood MD, Sher KJ, Strathman A. Alcohol outcome expectancies and alcohol use and problems. Journalof Studies on Alcohol 1996;57:283–288. [PubMed: 8709587]
Finn et al. Page 11
Addiction. Author manuscript; available in PMC 2006 July 10.
NIH
-PA Author Manuscript
NIH
-PA Author Manuscript
NIH
-PA Author Manuscript
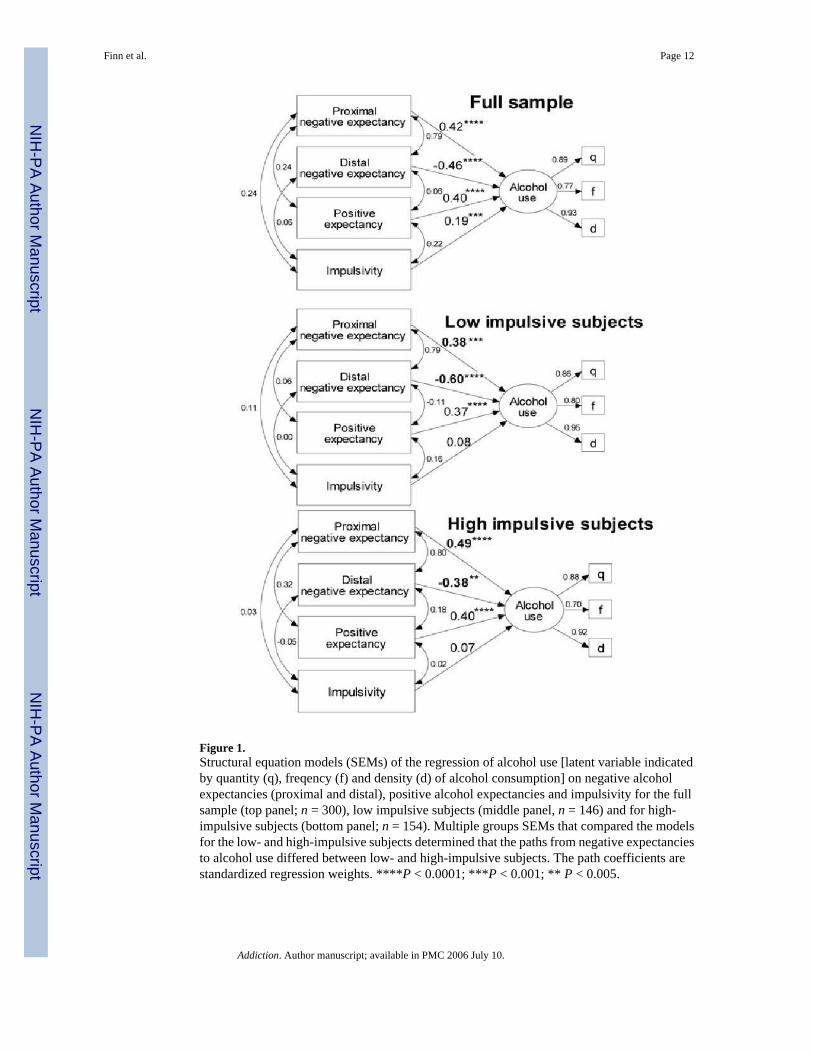
Figure 1.Structural equation models (SEMs) of the regression of alcohol use [latent variable indicatedby quantity (q), freqency (f) and density (d) of alcohol consumption] on negative alcoholexpectancies (proximal and distal), positive alcohol expectancies and impulsivity for the fullsample (top panel; n = 300), low impulsive subjects (middle panel, n = 146) and for high-impulsive subjects (bottom panel; n = 154). Multiple groups SEMs that compared the modelsfor the low- and high-impulsive subjects determined that the paths from negative expectanciesto alcohol use differed between low- and high-impulsive subjects. The path coefficients arestandardized regression weights. ****P < 0.0001; ***P < 0.001; ** P < 0.005.
Finn et al. Page 12
Addiction. Author manuscript; available in PMC 2006 July 10.
NIH
-PA Author Manuscript
NIH
-PA Author Manuscript
NIH
-PA Author Manuscript
NIH
-PA Author Manuscript
NIH
-PA Author Manuscript
NIH
-PA Author Manuscript
Finn et al. Page 13Ta
ble
1Sa
mpl
e ch
arac
teris
tics.
Cont
rols
AD-a
lone
AD +
CD
Men
Wom
enM
enW
omen
Men
Wom
en
n35
8931
4663
36A
ge20
.6 ±
1.9
20.3
± 1
.620
.8 ±
1.8
20.3
± 1
.820
.9 ±
2.0
20.7
± 2
.0Ed
ucat
ion
(yea
rs)
14.2
± 1
.514
.1 ±
1.5
14.3
± 1
.614
.2 ±
1.6
13.7
± 1
.713
.7 ±
2.0
Alc
ohol
use
To
tal d
rinks
/wee
k8.
8 ±
10.8
c6.
3 ±
6.5c
28.0
± 1
7.8b
17.3
± 1
2.2b
34.5
± 2
6.7a
23.1
± 1
6.6a
Fr
eque
ncy
2.2
± 2.
3c2.
0 ±
1.6c
4.5
± 2.
2b3.
4 ±
2.2b
5.0
± 3.
0a4.
6 ±
2.6a
Q
uant
ity2.
8 ±
2.7b
2.4
± 2.
2b6.
6 ±
3.0a
4.7
± 2.
6a6.
5 ±
3.4a
4.5
± 2.
4a
Den
sity
6.8
± 5.
5b6.
0 ±
4.3b
14.7
± 5
.0a
11.0
± 5
.2a
16.2
± 8
.8a
9.7
± 4.
5aSy
mpt
oms o
f abu
se/d
epen
denc
e3.
7 ±
3.1c
3.3
± 2.
8c14
.9 ±
4.3
b15
.3 ±
5.1
b21
.1 ±
8.5
a21
.7 ±
9.3
aN
egat
ive
alco
hol e
xpec
tanc
ies
Pr
oxim
al19
.1 ±
12.
7c19
.0 ±
17.
1c23
.6 ±
9.9
b3.
8 ±
10.6
b31
.4 ±
11.
9a29
.9 ±
12.
7a
Dis
tal
15.8
± 1
3.7b
18.0
± 1
7.0b
15.4
± 1
1.2b
18.1
± 1
0.1b
21.6
± 1
3.6a
25.1
± 1
4.9a
Posi
tive
alco
hol e
xpec
tanc
ies
87.7
± 1
5.7b
86.7
± 1
8.6b
101.
9 ±
11.4
a99
.1 ±
11.
4a99
.8 ±
11.
6a10
2.2
± 10
.7a
Impu
lsiv
ity6.
9 ±
4.4c
6.2
± 4.
0c9.
0 ±
4.0b
10.3
± 4
.4b
12.5
± 3
.7a
12.0
± 3
.4a
CD
= a
his
tory
of D
SM-I
V c
ondu
ct d
isor
der;
AD
= a
lcoh
ol d
epen
denc
e. A
lcoh
ol u
se: f
requ
ency
= a
vera
ge n
umbe
r of o
ccas
ions
per
wee
k ov
er th
e pa
st 6
mon
ths w
hen
alco
hol c
onsu
med
; qua
ntity
= av
erag
e qu
antit
y pe
r drin
king
occ
asio
n; d
ensi
ty =
max
imum
num
ber o
f drin
ks c
onsu
med
on
any
one
occa
sion
ove
r the
pas
t 6 m
onth
s. N
egat
ive
alco
hol e
xpec
tanc
ies:
pro
xim
al =
exp
ecta
tions
for
nega
tive
even
ts w
hile
drin
king
(sam
e da
y); d
ista
l = e
xpec
tatio
ns fo
r neg
ativ
e ev
ents
the
day
afte
r drin
king
(nex
t day
).
a,b,
c Sign
ifica
nt g
roup
diff
eren
ces b
etw
een
mea
ns: a
>b
> c
(New
man
–Keu
ls p
roce
dure
).
Addiction. Author manuscript; available in PMC 2006 July 10.
NIH
-PA Author Manuscript
NIH
-PA Author Manuscript
NIH
-PA Author Manuscript
Finn et al. Page 14Ta
ble
2Ze
ro-o
rder
cor
rela
tions
am
ong
the
obse
rved
mod
el v
aria
bles
(ful
l sam
ple)
.
12
34
56
7
(1) P
roxi
mal
neg
ativ
e ex
pect
ancy
1.0
(2) D
ista
l neg
ativ
e ex
pect
ancy
0.79
1.0
(3) P
ositi
ve e
xpec
tanc
y0.
240.
061.
0(4
) Im
puls
ivity
0.24
0.06
0.22
1.0
(5) A
lcoh
ol u
se: q
uant
ity0.
21−0
.05
0.48
0.34
1.0
(6) A
lcoh
ol u
se: f
requ
ency
0.14
−0.0
90.
410.
280.
671.
0(7
) Alc
ohol
use
: den
sity
0.18
−0.1
00.
470.
310.
830.
731.
0
Alc
ohol
use
: qua
ntity
= a
vera
ge a
mou
nt o
f alc
ohol
con
sum
ed p
er o
ccas
ion
in a
typi
cal w
eek;
alc
ohol
use
: fre
quen
cy =
tota
l num
ber o
f occ
asio
ns a
lcoh
ol w
as c
onsu
med
in a
typi
cal w
eek;
alc
ohol
use:
den
sity
= m
axim
um n
umbe
r of d
rinks
on
one
occa
sion
.
Addiction. Author manuscript; available in PMC 2006 July 10.
NIH
-PA Author Manuscript
NIH
-PA Author Manuscript
NIH
-PA Author Manuscript
Finn et al. Page 15Ta
ble
3Pa
rtial
cor
rela
tions
bet
wee
n pr
edic
tor v
aria
bles
and
alc
ohol
use
mea
sure
s (fu
ll sa
mpl
e).
Alco
hol u
se m
easu
res
Pred
icto
r var
iabl
eQ
uant
ityFr
eque
ncy
Den
sity
Prox
imal
neg
ativ
e ex
pect
ancy
0.20
0.17
0.23
Dis
tal n
egat
ive
expe
ctan
cy−0
.22
−0.2
1−0
.26
Posi
tive
expe
ctan
cy0.
350.
310.
34Im
puls
ivity
0.18
0.15
0.15
Parti
al c
orre
latio
ns re
flect
the
corr
elat
ion
betw
een
the
alco
hol u
se m
easu
re a
nd th
e pr
edic
tor v
aria
ble
from
whi
ch th
e lin
ear r
elat
ion,
or i
nflu
ence
, of t
he o
ther
thre
e pr
edic
tor v
aria
bles
hav
e be
enre
mov
ed. Q
uant
ity =
alc
ohol
qua
ntity
con
sum
ed p
er o
ccas
ion;
freq
uenc
y =
alco
hol c
onsu
mpt
ion
freq
uenc
y; d
ensi
ty =
max
imum
num
ber o
f drin
ks o
n on
e oc
casi
on.
Addiction. Author manuscript; available in PMC 2006 July 10.
NIH
-PA Author Manuscript
NIH
-PA Author Manuscript
NIH
-PA Author Manuscript
Finn et al. Page 16Ta
ble
4G
roup
mea
ns (s
tand
ard
devi
atio
n) o
n al
coho
l and
exp
ecta
ncy
mea
sure
s. Low-
impu
lsivi
ty (n
= 1
46)
Hig
h-im
pulsi
vity
(n =
154
)
Alc
ohol
use
Fr
eque
ncy
(/wee
k)2.
8 ±
2.4b
4.1
± 2.
7a
Qua
ntity
(no.
of d
rinks
)3.
3 ±
2.9b
5.4
± 3.
2a
Den
sity
(max
imum
no.
)8.
0 ±
5.6b
12.5
± 7
.6a
Sym
ptom
s of a
buse
/dep
ende
nce
5.4
± 5.
1b12
.6 ±
8.0
aN
egat
ive
alco
hol e
xpec
tanc
ies
Pr
oxim
al (w
hile
drin
king
)20
.6 ±
13.
4b27
.5 ±
14.
4a
Dis
tal (
next
day
)17
.8 ±
14.
420
.3 ±
14.
4Po
sitiv
e al
coho
l exp
ecta
ncie
s91
.6 ±
15.
1b98
.1 ±
15.
8a
Alc
ohol
use
: fre
quen
cy =
ave
rage
num
ber o
f occ
asio
ns p
er w
eek
over
the
past
6 m
onth
s whe
n al
coho
l con
sum
ed; q
uant
ity =
ave
rage
qua
ntity
per
drin
king
occ
asio
n; d
ensi
ty =
max
imum
num
ber o
fdr
inks
con
sum
ed o
n an
y on
e oc
casi
on o
ver t
he p
ast 6
mon
ths.
a,b Si
gnifi
cant
diff
eren
ce b
etw
een
mea
ns w
here
a >
b (N
ewm
an–K
euls
pro
cedu
re).
Addiction. Author manuscript; available in PMC 2006 July 10.
NIH
-PA Author Manuscript
NIH
-PA Author Manuscript
NIH
-PA Author Manuscript
Finn et al. Page 17
Table 5Partial correlations between predictor variables and alcohol use measures for high- and low-impulsive subjects.
Alcohol use measures
Predictor variable Quantity Frequency Density
High-impulsive group Proximal negative expectancy 0.26 0.11 0.25 Distal negative expectancy −0.21 −0.13 −0.20 Positive expectancy 0.36 0.42 0.38 Impulsivity −0.01 −0.02 −0.06Low-impulsive group Proximal negative expectancy 0.16 0.22 0.22 Distal negative expectancy −0.36 −0.30 −0.36 Positive expectancy 0.32 0.28 0.26 Impulsivity 0.15 0.16 0.18
Partial correlations reflect the correlation between the alcohol use measure and the predictor variable after the linear relations of the other three predictorvariables have been removed. Quantity = alcohol quantity consumed per occasion; frequency = alcohol consumption frequency; density = maximumnumber of drinks on one occasion.
Addiction. Author manuscript; available in PMC 2006 July 10.


