Embed Size (px)
Citation preview
'All-inclusive' imaging of the rutile TiO2(110) surface using NC-AFM
This article has been downloaded from IOPscience. Please scroll down to see the full text article.
2009 Nanotechnology 20 505703
(http://iopscience.iop.org/0957-4484/20/50/505703)
Download details:
IP Address: 150.244.36.186
The article was downloaded on 20/11/2009 at 11:27
Please note that terms and conditions apply.
The Table of Contents and more related content is available
HOME | SEARCH | PACS & MSC | JOURNALS | ABOUT | CONTACT US
IOP PUBLISHING NANOTECHNOLOGY
Nanotechnology 20 (2009) 505703 (7pp) doi:10.1088/0957-4484/20/50/505703
‘All-inclusive’ imaging of the rutileTiO2(110) surface using NC-AFMRalf Bechstein1,4, Cesar Gonzalez2, Jens Schutte1,5, Pavel Jelınek2,Ruben Perez3 and Angelika Kuhnle1,5
1 Fachbereich Physik, Universitat Osnabruck, Barbarastraße 7, D-49076 Osnabruck, Germany2 Institute of Physics, Academy of Sciences of the Czech Republic, Cukrovarnicka 10,162 53 Prague, Czech Republic3 Departamento de Fısica Teorica de la Materia Condensada, Universidad Autonoma deMadrid, E-28049 Madrid, Spain
E-mail: [email protected] and [email protected]
Received 18 August 2009, in final form 2 October 2009Published 19 November 2009Online at stacks.iop.org/Nano/20/505703
AbstractNon-contact atomic force microscopy (NC-AFM) at true atomic resolution is used to investigatethe (110) surface of rutile TiO2. We are able to simultaneously resolve both bridging oxygenand titanium atoms of this prototypical oxide surface. Furthermore, the characteristic defectspecies, i.e. bridging oxygen vacancies, single and double hydroxyls as well as subsurfacedefects, are identified in the very same frame. We employ density functional theory (DFT)calculations to obtain a comprehensive understanding of the relation between the tip apexstructure and the observed image contrast. Our results provide insight into the physicalmechanisms behind atomic-scale contrast, indicating that electrostatic interaction can lead to afar more complex contrast than commonly assumed.
(Some figures in this article are in colour only in the electronic version)
1. Introduction
Understanding the (110) surface of rutile titanium dioxidefrom direct visualization by scanning probe microscopy (SPM)techniques has been the focus of numerous publications inthe last decade [1–10] as titania is generally regarded as ‘anexcellent model oxide’ [6]. Identification of defect sites,surface reaction of water and oxygen, catalysis and molecularself-assembly have attracted considerable attention.
Usually, scanning tunneling microscopy (STM) senses thedensity of unoccupied states at titanium and defect sites [2].Hence, the bridging oxygen atoms are invisible. Non-contactatomic force microscopy (NC-AFM) is known to be capable ofimaging either the bridging oxygen atoms (hole mode) or thetitanium atoms (protrusion mode) [5]. These contrast modeshave been assigned to purely electrostatic interaction and donot, therefore, reflect the real topography of the surface. NC-AFM is sensing forces and does not, therefore, depend on the
4 Present address: Interdisciplinary Nanoscience Center (iNANO),Department of Physics and Astronomy, Aarhus University, Ny Munkegade,DK-8000 Aarhus C, Denmark.5 Present address: Institut fur Physikalische Chemie, Universitat Mainz,Jakob-Welder-Weg 11, D-55099 Mainz, Germany.
existence of adequate electronic states like in STM. However,imaging of all TiO2(110) surface atoms at the same time hasnot been demonstrated so far with SPM.
Here, we study the (110) surface of rutile TiO2 usingNC-AFM and density functional theory (DFT). We presentNC-AFM results revealing both bridging oxygen and titaniumatoms simultaneously. Furthermore, oxygen vacancies, singleand double hydroxyls, as well as further defects ascribed tosubsurface impurities, are also unambiguously imaged withinone single frame. These experimental results are supportedby DFT calculations, unraveling details of the tip–sampleinteraction. Our work indicates that electrostatic interactionexplains well simultaneous imaging of both bridging oxygenand titanium atoms when realistic tip models are taken intoaccount.
The outline of the paper is as follows: first we present theexperimental evidence for the appearance of the surface speciesin neutral and all-inclusive mode (section 2). Second we definea list of criteria the pair of tip models responsible for theobserved contrast modes has to satisfy. In order to eventuallyidentify the correct tip models we, then, present an extendedsearch by means of first-principles calculations (section 3). We
0957-4484/09/505703+07$30.00 © 2009 IOP Publishing Ltd Printed in the UK1
Nanotechnology 20 (2009) 505703 R Bechstein et al
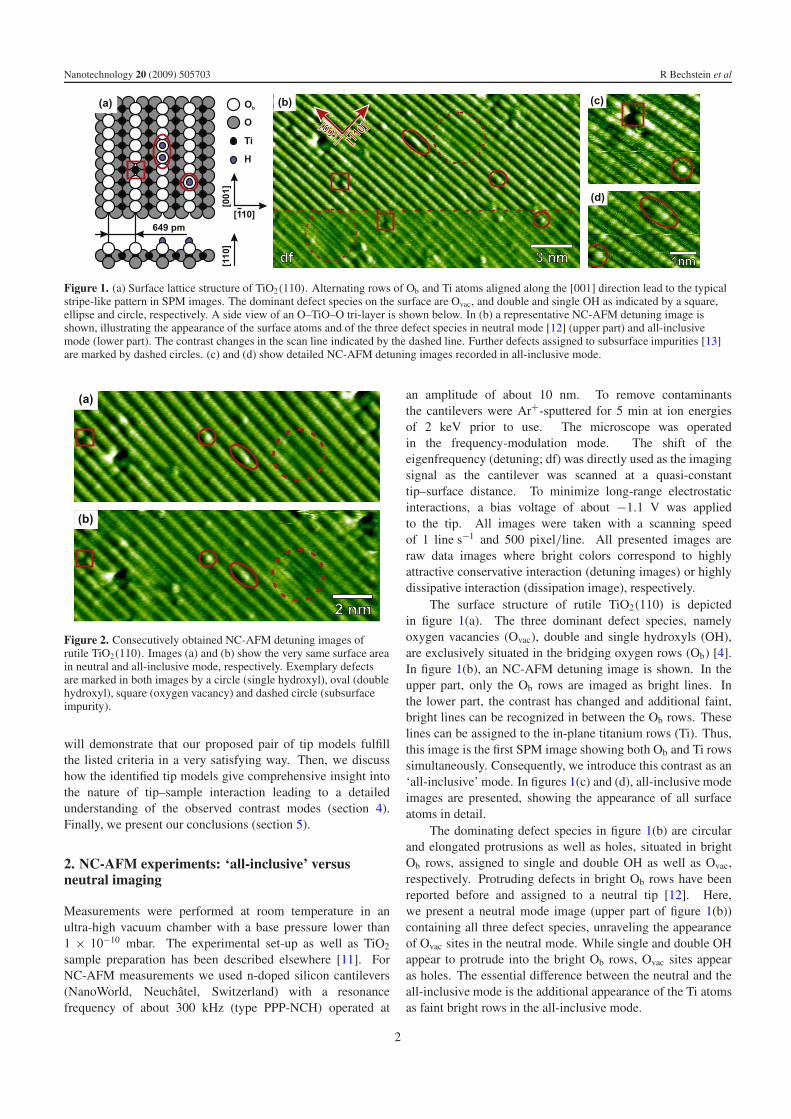
Figure 1. (a) Surface lattice structure of TiO2(110). Alternating rows of Ob and Ti atoms aligned along the [001] direction lead to the typicalstripe-like pattern in SPM images. The dominant defect species on the surface are Ovac, and double and single OH as indicated by a square,ellipse and circle, respectively. A side view of an O–TiO–O tri-layer is shown below. In (b) a representative NC-AFM detuning image isshown, illustrating the appearance of the surface atoms and of the three defect species in neutral mode [12] (upper part) and all-inclusivemode (lower part). The contrast changes in the scan line indicated by the dashed line. Further defects assigned to subsurface impurities [13]are marked by dashed circles. (c) and (d) show detailed NC-AFM detuning images recorded in all-inclusive mode.
Figure 2. Consecutively obtained NC-AFM detuning images ofrutile TiO2(110). Images (a) and (b) show the very same surface areain neutral and all-inclusive mode, respectively. Exemplary defectsare marked in both images by a circle (single hydroxyl), oval (doublehydroxyl), square (oxygen vacancy) and dashed circle (subsurfaceimpurity).
will demonstrate that our proposed pair of tip models fulfillthe listed criteria in a very satisfying way. Then, we discusshow the identified tip models give comprehensive insight intothe nature of tip–sample interaction leading to a detailedunderstanding of the observed contrast modes (section 4).Finally, we present our conclusions (section 5).
2. NC-AFM experiments: ‘all-inclusive’ versusneutral imaging
Measurements were performed at room temperature in anultra-high vacuum chamber with a base pressure lower than1 × 10−10 mbar. The experimental set-up as well as TiO2
sample preparation has been described elsewhere [11]. ForNC-AFM measurements we used n-doped silicon cantilevers(NanoWorld, Neuchatel, Switzerland) with a resonancefrequency of about 300 kHz (type PPP-NCH) operated at
an amplitude of about 10 nm. To remove contaminantsthe cantilevers were Ar+-sputtered for 5 min at ion energiesof 2 keV prior to use. The microscope was operatedin the frequency-modulation mode. The shift of theeigenfrequency (detuning; df) was directly used as the imagingsignal as the cantilever was scanned at a quasi-constanttip–surface distance. To minimize long-range electrostaticinteractions, a bias voltage of about −1.1 V was appliedto the tip. All images were taken with a scanning speedof 1 line s−1 and 500 pixel/line. All presented images areraw data images where bright colors correspond to highlyattractive conservative interaction (detuning images) or highlydissipative interaction (dissipation image), respectively.
The surface structure of rutile TiO2(110) is depictedin figure 1(a). The three dominant defect species, namelyoxygen vacancies (Ovac), double and single hydroxyls (OH),are exclusively situated in the bridging oxygen rows (Ob) [4].In figure 1(b), an NC-AFM detuning image is shown. In theupper part, only the Ob rows are imaged as bright lines. Inthe lower part, the contrast has changed and additional faint,bright lines can be recognized in between the Ob rows. Theselines can be assigned to the in-plane titanium rows (Ti). Thus,this image is the first SPM image showing both Ob and Ti rowssimultaneously. Consequently, we introduce this contrast as an‘all-inclusive’ mode. In figures 1(c) and (d), all-inclusive modeimages are presented, showing the appearance of all surfaceatoms in detail.
The dominating defect species in figure 1(b) are circularand elongated protrusions as well as holes, situated in brightOb rows, assigned to single and double OH as well as Ovac,respectively. Protruding defects in bright Ob rows have beenreported before and assigned to a neutral tip [12]. Here,we present a neutral mode image (upper part of figure 1(b))containing all three defect species, unraveling the appearanceof Ovac sites in the neutral mode. While single and double OHappear to protrude into the bright Ob rows, Ovac sites appearas holes. The essential difference between the neutral and theall-inclusive mode is the additional appearance of the Ti atomsas faint bright rows in the all-inclusive mode.
2
Nanotechnology 20 (2009) 505703 R Bechstein et al
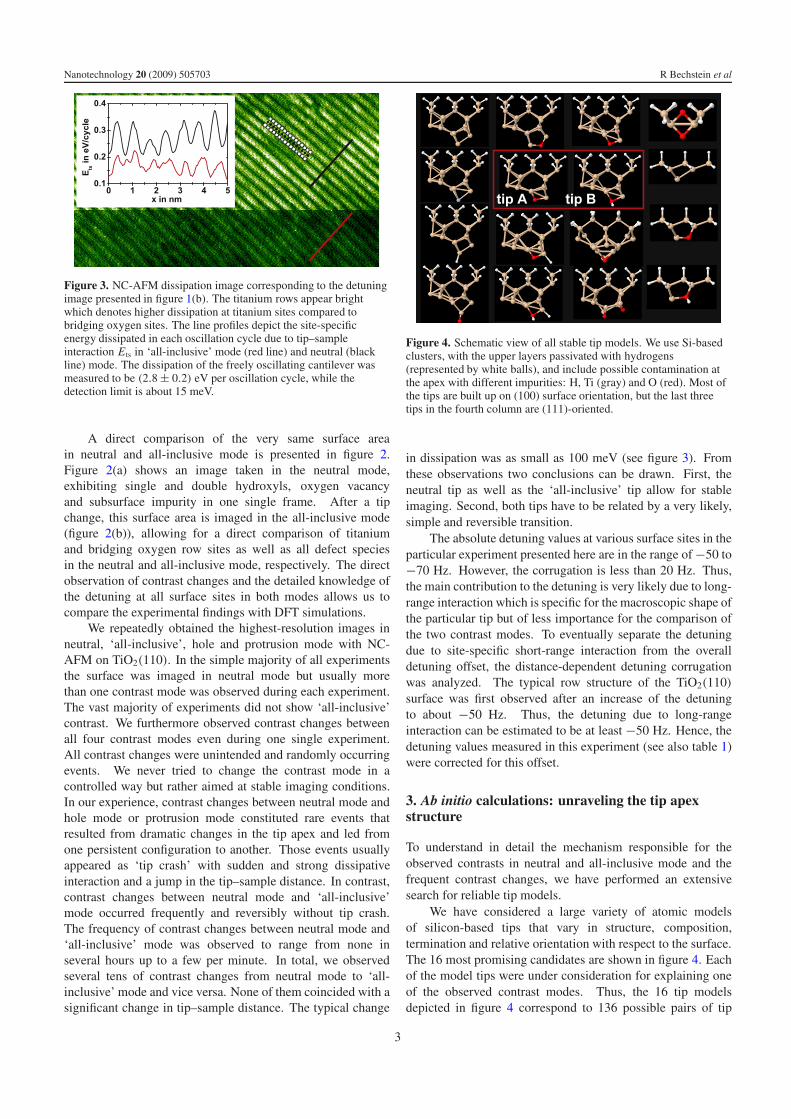
Figure 3. NC-AFM dissipation image corresponding to the detuningimage presented in figure 1(b). The titanium rows appear brightwhich denotes higher dissipation at titanium sites compared tobridging oxygen sites. The line profiles depict the site-specificenergy dissipated in each oscillation cycle due to tip–sampleinteraction Ets in ‘all-inclusive’ mode (red line) and neutral (blackline) mode. The dissipation of the freely oscillating cantilever wasmeasured to be (2.8 ± 0.2) eV per oscillation cycle, while thedetection limit is about 15 meV.
A direct comparison of the very same surface areain neutral and all-inclusive mode is presented in figure 2.Figure 2(a) shows an image taken in the neutral mode,exhibiting single and double hydroxyls, oxygen vacancyand subsurface impurity in one single frame. After a tipchange, this surface area is imaged in the all-inclusive mode(figure 2(b)), allowing for a direct comparison of titaniumand bridging oxygen row sites as well as all defect speciesin the neutral and all-inclusive mode, respectively. The directobservation of contrast changes and the detailed knowledge ofthe detuning at all surface sites in both modes allows us tocompare the experimental findings with DFT simulations.
We repeatedly obtained the highest-resolution images inneutral, ‘all-inclusive’, hole and protrusion mode with NC-AFM on TiO2(110). In the simple majority of all experimentsthe surface was imaged in neutral mode but usually morethan one contrast mode was observed during each experiment.The vast majority of experiments did not show ‘all-inclusive’contrast. We furthermore observed contrast changes betweenall four contrast modes even during one single experiment.All contrast changes were unintended and randomly occurringevents. We never tried to change the contrast mode in acontrolled way but rather aimed at stable imaging conditions.In our experience, contrast changes between neutral mode andhole mode or protrusion mode constituted rare events thatresulted from dramatic changes in the tip apex and led fromone persistent configuration to another. Those events usuallyappeared as ‘tip crash’ with sudden and strong dissipativeinteraction and a jump in the tip–sample distance. In contrast,contrast changes between neutral mode and ‘all-inclusive’mode occurred frequently and reversibly without tip crash.The frequency of contrast changes between neutral mode and‘all-inclusive’ mode was observed to range from none inseveral hours up to a few per minute. In total, we observedseveral tens of contrast changes from neutral mode to ‘all-inclusive’ mode and vice versa. None of them coincided with asignificant change in tip–sample distance. The typical change
Figure 4. Schematic view of all stable tip models. We use Si-basedclusters, with the upper layers passivated with hydrogens(represented by white balls), and include possible contamination atthe apex with different impurities: H, Ti (gray) and O (red). Most ofthe tips are built up on (100) surface orientation, but the last threetips in the fourth column are (111)-oriented.
in dissipation was as small as 100 meV (see figure 3). Fromthese observations two conclusions can be drawn. First, theneutral tip as well as the ‘all-inclusive’ tip allow for stableimaging. Second, both tips have to be related by a very likely,simple and reversible transition.
The absolute detuning values at various surface sites in theparticular experiment presented here are in the range of −50 to−70 Hz. However, the corrugation is less than 20 Hz. Thus,the main contribution to the detuning is very likely due to long-range interaction which is specific for the macroscopic shape ofthe particular tip but of less importance for the comparison ofthe two contrast modes. To eventually separate the detuningdue to site-specific short-range interaction from the overalldetuning offset, the distance-dependent detuning corrugationwas analyzed. The typical row structure of the TiO2(110)
surface was first observed after an increase of the detuningto about −50 Hz. Thus, the detuning due to long-rangeinteraction can be estimated to be at least −50 Hz. Hence, thedetuning values measured in this experiment (see also table 1)were corrected for this offset.
3. Ab initio calculations: unraveling the tip apexstructure
To understand in detail the mechanism responsible for theobserved contrasts in neutral and all-inclusive mode and thefrequent contrast changes, we have performed an extensivesearch for reliable tip models.
We have considered a large variety of atomic modelsof silicon-based tips that vary in structure, composition,termination and relative orientation with respect to the surface.The 16 most promising candidates are shown in figure 4. Eachof the model tips were under consideration for explaining oneof the observed contrast modes. Thus, the 16 tip modelsdepicted in figure 4 correspond to 136 possible pairs of tip
3
Nanotechnology 20 (2009) 505703 R Bechstein et al
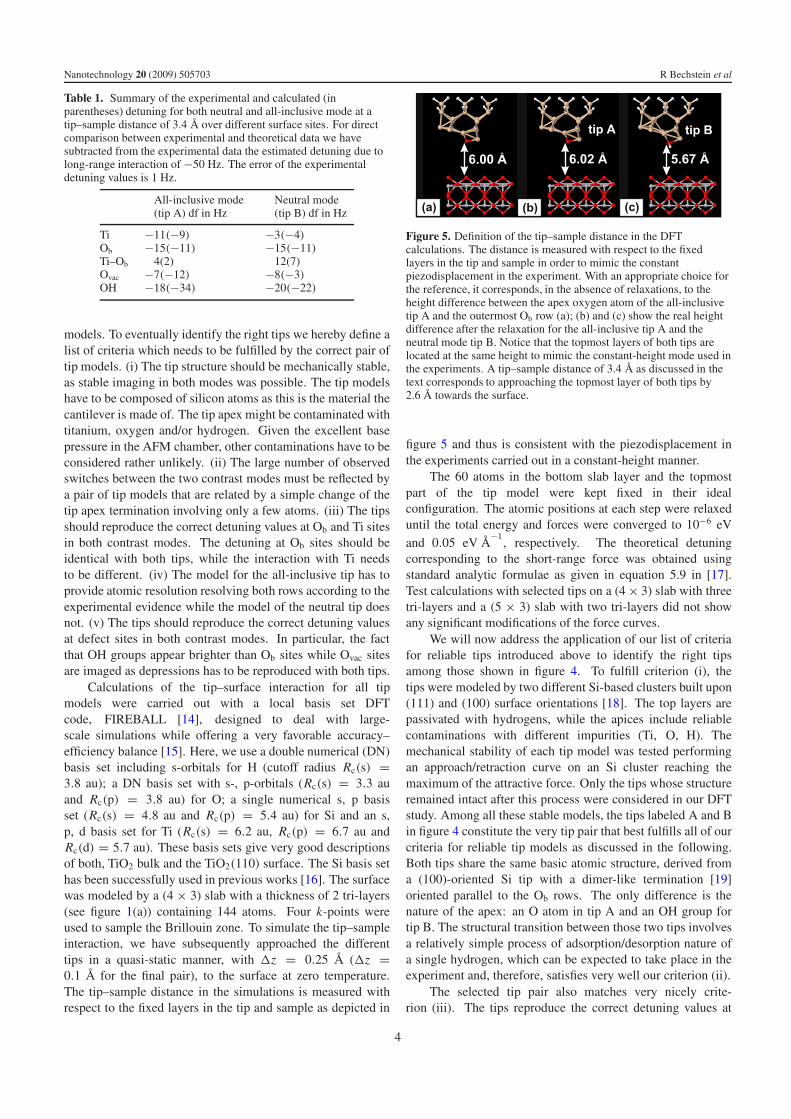
Table 1. Summary of the experimental and calculated (inparentheses) detuning for both neutral and all-inclusive mode at atip–sample distance of 3.4 A over different surface sites. For directcomparison between experimental and theoretical data we havesubtracted from the experimental data the estimated detuning due tolong-range interaction of −50 Hz. The error of the experimentaldetuning values is 1 Hz.
All-inclusive mode(tip A) df in Hz
Neutral mode(tip B) df in Hz
Ti −11(−9) −3(−4)Ob −15(−11) −15(−11)Ti–Ob 4(2) 12(7)Ovac −7(−12) −8(−3)OH −18(−34) −20(−22)
models. To eventually identify the right tips we hereby define alist of criteria which needs to be fulfilled by the correct pair oftip models. (i) The tip structure should be mechanically stable,as stable imaging in both modes was possible. The tip modelshave to be composed of silicon atoms as this is the material thecantilever is made of. The tip apex might be contaminated withtitanium, oxygen and/or hydrogen. Given the excellent basepressure in the AFM chamber, other contaminations have to beconsidered rather unlikely. (ii) The large number of observedswitches between the two contrast modes must be reflected bya pair of tip models that are related by a simple change of thetip apex termination involving only a few atoms. (iii) The tipsshould reproduce the correct detuning values at Ob and Ti sitesin both contrast modes. The detuning at Ob sites should beidentical with both tips, while the interaction with Ti needsto be different. (iv) The model for the all-inclusive tip has toprovide atomic resolution resolving both rows according to theexperimental evidence while the model of the neutral tip doesnot. (v) The tips should reproduce the correct detuning valuesat defect sites in both contrast modes. In particular, the factthat OH groups appear brighter than Ob sites while Ovac sitesare imaged as depressions has to be reproduced with both tips.
Calculations of the tip–surface interaction for all tipmodels were carried out with a local basis set DFTcode, FIREBALL [14], designed to deal with large-scale simulations while offering a very favorable accuracy–efficiency balance [15]. Here, we use a double numerical (DN)basis set including s-orbitals for H (cutoff radius Rc(s) =3.8 au); a DN basis set with s-, p-orbitals (Rc(s) = 3.3 auand Rc(p) = 3.8 au) for O; a single numerical s, p basisset (Rc(s) = 4.8 au and Rc(p) = 5.4 au) for Si and an s,p, d basis set for Ti (Rc(s) = 6.2 au, Rc(p) = 6.7 au andRc(d) = 5.7 au). These basis sets give very good descriptionsof both, TiO2 bulk and the TiO2(110) surface. The Si basis sethas been successfully used in previous works [16]. The surfacewas modeled by a (4 × 3) slab with a thickness of 2 tri-layers(see figure 1(a)) containing 144 atoms. Four k-points wereused to sample the Brillouin zone. To simulate the tip–sampleinteraction, we have subsequently approached the differenttips in a quasi-static manner, with �z = 0.25 A (�z =0.1 A for the final pair), to the surface at zero temperature.The tip–sample distance in the simulations is measured withrespect to the fixed layers in the tip and sample as depicted in
Figure 5. Definition of the tip–sample distance in the DFTcalculations. The distance is measured with respect to the fixedlayers in the tip and sample in order to mimic the constantpiezodisplacement in the experiment. With an appropriate choice forthe reference, it corresponds, in the absence of relaxations, to theheight difference between the apex oxygen atom of the all-inclusivetip A and the outermost Ob row (a); (b) and (c) show the real heightdifference after the relaxation for the all-inclusive tip A and theneutral mode tip B. Notice that the topmost layers of both tips arelocated at the same height to mimic the constant-height mode used inthe experiments. A tip–sample distance of 3.4 A as discussed in thetext corresponds to approaching the topmost layer of both tips by2.6 A towards the surface.
figure 5 and thus is consistent with the piezodisplacement inthe experiments carried out in a constant-height manner.
The 60 atoms in the bottom slab layer and the topmostpart of the tip model were kept fixed in their idealconfiguration. The atomic positions at each step were relaxeduntil the total energy and forces were converged to 10−6 eVand 0.05 eV A
−1, respectively. The theoretical detuning
corresponding to the short-range force was obtained usingstandard analytic formulae as given in equation 5.9 in [17].Test calculations with selected tips on a (4 × 3) slab with threetri-layers and a (5 × 3) slab with two tri-layers did not showany significant modifications of the force curves.
We will now address the application of our list of criteriafor reliable tips introduced above to identify the right tipsamong those shown in figure 4. To fulfill criterion (i), thetips were modeled by two different Si-based clusters built upon(111) and (100) surface orientations [18]. The top layers arepassivated with hydrogens, while the apices include reliablecontaminations with different impurities (Ti, O, H). Themechanical stability of each tip model was tested performingan approach/retraction curve on an Si cluster reaching themaximum of the attractive force. Only the tips whose structureremained intact after this process were considered in our DFTstudy. Among all these stable models, the tips labeled A and Bin figure 4 constitute the very tip pair that best fulfills all of ourcriteria for reliable tip models as discussed in the following.Both tips share the same basic atomic structure, derived froma (100)-oriented Si tip with a dimer-like termination [19]oriented parallel to the Ob rows. The only difference is thenature of the apex: an O atom in tip A and an OH group fortip B. The structural transition between those two tips involvesa relatively simple process of adsorption/desorption nature ofa single hydrogen, which can be expected to take place in theexperiment and, therefore, satisfies very well our criterion (ii).
The selected tip pair also matches very nicely crite-rion (iii). The tips reproduce the correct detuning values at
4
Nanotechnology 20 (2009) 505703 R Bechstein et al
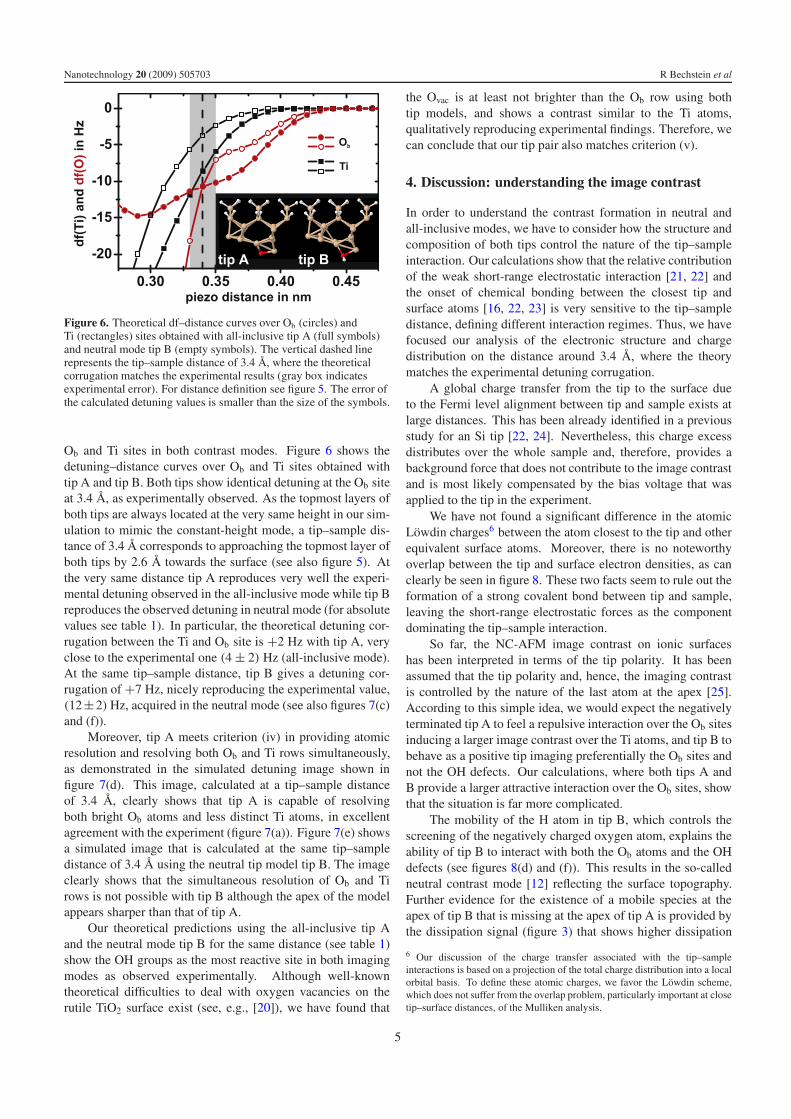
Figure 6. Theoretical df–distance curves over Ob (circles) andTi (rectangles) sites obtained with all-inclusive tip A (full symbols)and neutral mode tip B (empty symbols). The vertical dashed linerepresents the tip–sample distance of 3.4 A, where the theoreticalcorrugation matches the experimental results (gray box indicatesexperimental error). For distance definition see figure 5. The error ofthe calculated detuning values is smaller than the size of the symbols.
Ob and Ti sites in both contrast modes. Figure 6 shows thedetuning–distance curves over Ob and Ti sites obtained withtip A and tip B. Both tips show identical detuning at the Ob siteat 3.4 A, as experimentally observed. As the topmost layers ofboth tips are always located at the very same height in our sim-ulation to mimic the constant-height mode, a tip–sample dis-tance of 3.4 A corresponds to approaching the topmost layer ofboth tips by 2.6 A towards the surface (see also figure 5). Atthe very same distance tip A reproduces very well the experi-mental detuning observed in the all-inclusive mode while tip Breproduces the observed detuning in neutral mode (for absolutevalues see table 1). In particular, the theoretical detuning cor-rugation between the Ti and Ob site is +2 Hz with tip A, veryclose to the experimental one (4 ± 2) Hz (all-inclusive mode).At the same tip–sample distance, tip B gives a detuning cor-rugation of +7 Hz, nicely reproducing the experimental value,(12±2) Hz, acquired in the neutral mode (see also figures 7(c)and (f)).
Moreover, tip A meets criterion (iv) in providing atomicresolution and resolving both Ob and Ti rows simultaneously,as demonstrated in the simulated detuning image shown infigure 7(d). This image, calculated at a tip–sample distanceof 3.4 A, clearly shows that tip A is capable of resolvingboth bright Ob atoms and less distinct Ti atoms, in excellentagreement with the experiment (figure 7(a)). Figure 7(e) showsa simulated image that is calculated at the same tip–sampledistance of 3.4 A using the neutral tip model tip B. The imageclearly shows that the simultaneous resolution of Ob and Tirows is not possible with tip B although the apex of the modelappears sharper than that of tip A.
Our theoretical predictions using the all-inclusive tip Aand the neutral mode tip B for the same distance (see table 1)show the OH groups as the most reactive site in both imagingmodes as observed experimentally. Although well-knowntheoretical difficulties to deal with oxygen vacancies on therutile TiO2 surface exist (see, e.g., [20]), we have found that
the Ovac is at least not brighter than the Ob row using bothtip models, and shows a contrast similar to the Ti atoms,qualitatively reproducing experimental findings. Therefore, wecan conclude that our tip pair also matches criterion (v).
4. Discussion: understanding the image contrast
In order to understand the contrast formation in neutral andall-inclusive modes, we have to consider how the structure andcomposition of both tips control the nature of the tip–sampleinteraction. Our calculations show that the relative contributionof the weak short-range electrostatic interaction [21, 22] andthe onset of chemical bonding between the closest tip andsurface atoms [16, 22, 23] is very sensitive to the tip–sampledistance, defining different interaction regimes. Thus, we havefocused our analysis of the electronic structure and chargedistribution on the distance around 3.4 A, where the theorymatches the experimental detuning corrugation.
A global charge transfer from the tip to the surface dueto the Fermi level alignment between tip and sample exists atlarge distances. This has been already identified in a previousstudy for an Si tip [22, 24]. Nevertheless, this charge excessdistributes over the whole sample and, therefore, provides abackground force that does not contribute to the image contrastand is most likely compensated by the bias voltage that wasapplied to the tip in the experiment.
We have not found a significant difference in the atomicLowdin charges6 between the atom closest to the tip and otherequivalent surface atoms. Moreover, there is no noteworthyoverlap between the tip and surface electron densities, as canclearly be seen in figure 8. These two facts seem to rule out theformation of a strong covalent bond between tip and sample,leaving the short-range electrostatic forces as the componentdominating the tip–sample interaction.
So far, the NC-AFM image contrast on ionic surfaceshas been interpreted in terms of the tip polarity. It has beenassumed that the tip polarity and, hence, the imaging contrastis controlled by the nature of the last atom at the apex [25].According to this simple idea, we would expect the negativelyterminated tip A to feel a repulsive interaction over the Ob sitesinducing a larger image contrast over the Ti atoms, and tip B tobehave as a positive tip imaging preferentially the Ob sites andnot the OH defects. Our calculations, where both tips A andB provide a larger attractive interaction over the Ob sites, showthat the situation is far more complicated.
The mobility of the H atom in tip B, which controls thescreening of the negatively charged oxygen atom, explains theability of tip B to interact with both the Ob atoms and the OHdefects (see figures 8(d) and (f)). This results in the so-calledneutral contrast mode [12] reflecting the surface topography.Further evidence for the existence of a mobile species at theapex of tip B that is missing at the apex of tip A is provided bythe dissipation signal (figure 3) that shows higher dissipation
6 Our discussion of the charge transfer associated with the tip–sampleinteractions is based on a projection of the total charge distribution into a localorbital basis. To define these atomic charges, we favor the Lowdin scheme,which does not suffer from the overlap problem, particularly important at closetip–surface distances, of the Mulliken analysis.
5
Nanotechnology 20 (2009) 505703 R Bechstein et al
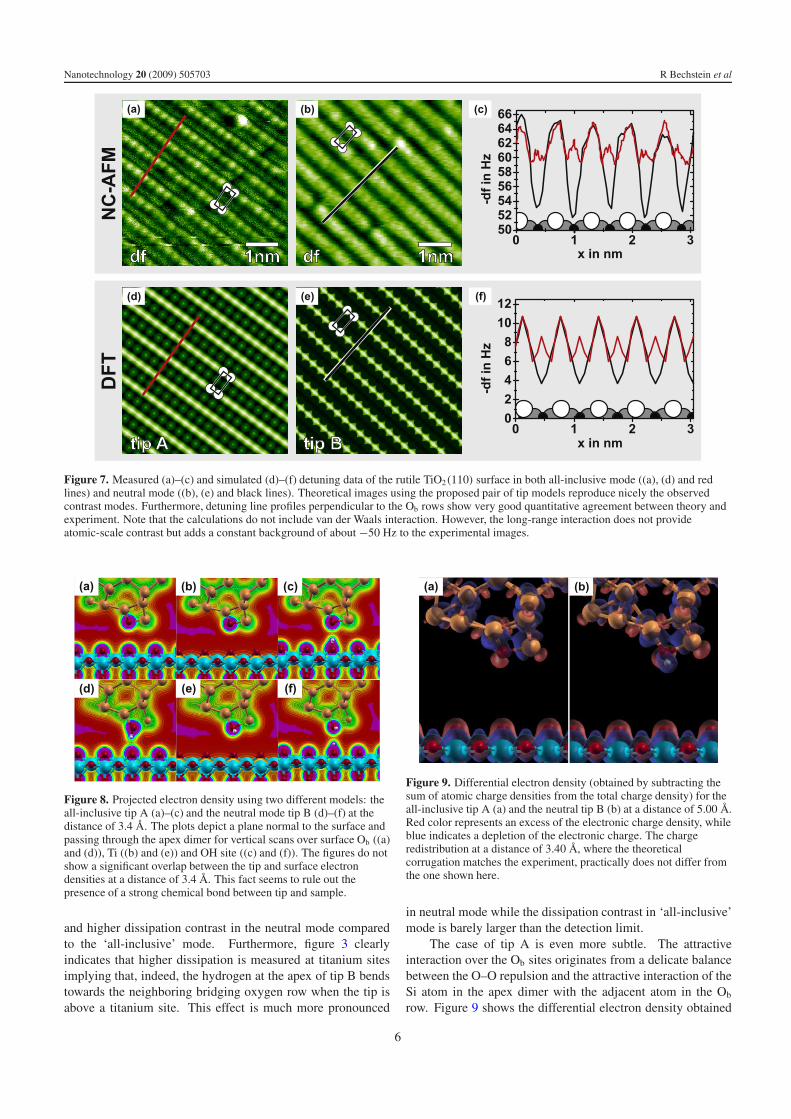
Figure 7. Measured (a)–(c) and simulated (d)–(f) detuning data of the rutile TiO2(110) surface in both all-inclusive mode ((a), (d) and redlines) and neutral mode ((b), (e) and black lines). Theoretical images using the proposed pair of tip models reproduce nicely the observedcontrast modes. Furthermore, detuning line profiles perpendicular to the Ob rows show very good quantitative agreement between theory andexperiment. Note that the calculations do not include van der Waals interaction. However, the long-range interaction does not provideatomic-scale contrast but adds a constant background of about −50 Hz to the experimental images.
Figure 8. Projected electron density using two different models: theall-inclusive tip A (a)–(c) and the neutral mode tip B (d)–(f) at thedistance of 3.4 A. The plots depict a plane normal to the surface andpassing through the apex dimer for vertical scans over surface Ob ((a)and (d)), Ti ((b) and (e)) and OH site ((c) and (f)). The figures do notshow a significant overlap between the tip and surface electrondensities at a distance of 3.4 A. This fact seems to rule out thepresence of a strong chemical bond between tip and sample.
and higher dissipation contrast in the neutral mode comparedto the ‘all-inclusive’ mode. Furthermore, figure 3 clearlyindicates that higher dissipation is measured at titanium sitesimplying that, indeed, the hydrogen at the apex of tip B bendstowards the neighboring bridging oxygen row when the tip isabove a titanium site. This effect is much more pronounced
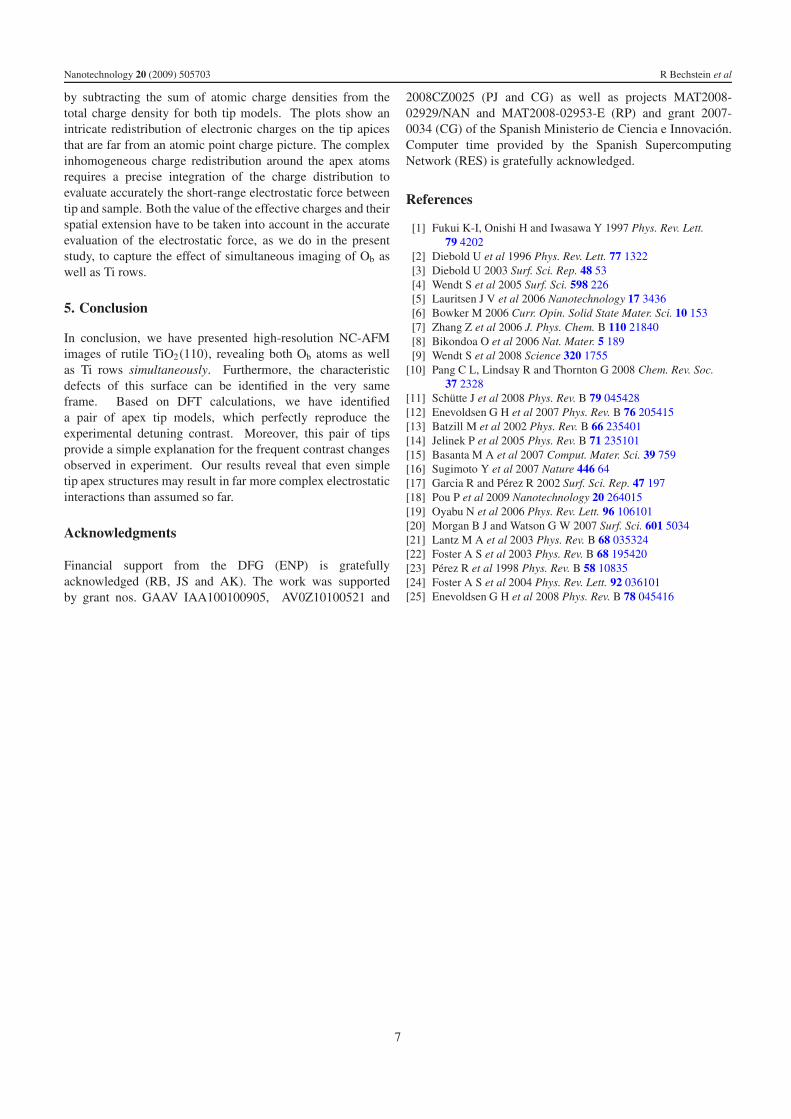
Figure 9. Differential electron density (obtained by subtracting thesum of atomic charge densities from the total charge density) for theall-inclusive tip A (a) and the neutral tip B (b) at a distance of 5.00 A.Red color represents an excess of the electronic charge density, whileblue indicates a depletion of the electronic charge. The chargeredistribution at a distance of 3.40 A, where the theoreticalcorrugation matches the experiment, practically does not differ fromthe one shown here.
in neutral mode while the dissipation contrast in ‘all-inclusive’mode is barely larger than the detection limit.
The case of tip A is even more subtle. The attractiveinteraction over the Ob sites originates from a delicate balancebetween the O–O repulsion and the attractive interaction of theSi atom in the apex dimer with the adjacent atom in the Ob
row. Figure 9 shows the differential electron density obtained
6
Nanotechnology 20 (2009) 505703 R Bechstein et al
by subtracting the sum of atomic charge densities from thetotal charge density for both tip models. The plots show anintricate redistribution of electronic charges on the tip apicesthat are far from an atomic point charge picture. The complexinhomogeneous charge redistribution around the apex atomsrequires a precise integration of the charge distribution toevaluate accurately the short-range electrostatic force betweentip and sample. Both the value of the effective charges and theirspatial extension have to be taken into account in the accurateevaluation of the electrostatic force, as we do in the presentstudy, to capture the effect of simultaneous imaging of Ob aswell as Ti rows.
5. Conclusion
In conclusion, we have presented high-resolution NC-AFMimages of rutile TiO2(110), revealing both Ob atoms as wellas Ti rows simultaneously. Furthermore, the characteristicdefects of this surface can be identified in the very sameframe. Based on DFT calculations, we have identifieda pair of apex tip models, which perfectly reproduce theexperimental detuning contrast. Moreover, this pair of tipsprovide a simple explanation for the frequent contrast changesobserved in experiment. Our results reveal that even simpletip apex structures may result in far more complex electrostaticinteractions than assumed so far.
Acknowledgments
Financial support from the DFG (ENP) is gratefullyacknowledged (RB, JS and AK). The work was supportedby grant nos. GAAV IAA100100905, AV0Z10100521 and
2008CZ0025 (PJ and CG) as well as projects MAT2008-02929/NAN and MAT2008-02953-E (RP) and grant 2007-0034 (CG) of the Spanish Ministerio de Ciencia e Innovacion.Computer time provided by the Spanish SupercomputingNetwork (RES) is gratefully acknowledged.
References
[1] Fukui K-I, Onishi H and Iwasawa Y 1997 Phys. Rev. Lett.79 4202
[2] Diebold U et al 1996 Phys. Rev. Lett. 77 1322[3] Diebold U 2003 Surf. Sci. Rep. 48 53[4] Wendt S et al 2005 Surf. Sci. 598 226[5] Lauritsen J V et al 2006 Nanotechnology 17 3436[6] Bowker M 2006 Curr. Opin. Solid State Mater. Sci. 10 153[7] Zhang Z et al 2006 J. Phys. Chem. B 110 21840[8] Bikondoa O et al 2006 Nat. Mater. 5 189[9] Wendt S et al 2008 Science 320 1755
[10] Pang C L, Lindsay R and Thornton G 2008 Chem. Rev. Soc.37 2328
[11] Schutte J et al 2008 Phys. Rev. B 79 045428[12] Enevoldsen G H et al 2007 Phys. Rev. B 76 205415[13] Batzill M et al 2002 Phys. Rev. B 66 235401[14] Jelinek P et al 2005 Phys. Rev. B 71 235101[15] Basanta M A et al 2007 Comput. Mater. Sci. 39 759[16] Sugimoto Y et al 2007 Nature 446 64[17] Garcia R and Perez R 2002 Surf. Sci. Rep. 47 197[18] Pou P et al 2009 Nanotechnology 20 264015[19] Oyabu N et al 2006 Phys. Rev. Lett. 96 106101[20] Morgan B J and Watson G W 2007 Surf. Sci. 601 5034[21] Lantz M A et al 2003 Phys. Rev. B 68 035324[22] Foster A S et al 2003 Phys. Rev. B 68 195420[23] Perez R et al 1998 Phys. Rev. B 58 10835[24] Foster A S et al 2004 Phys. Rev. Lett. 92 036101[25] Enevoldsen G H et al 2008 Phys. Rev. B 78 045416
7


](https://img.pdfslide.net/doc/110x75/6336ac0eb5f91cb18a0beec4/adsorption-of-bi-isonicotinic-acid-on-rutile-tiosub-2110.jpg)


