Embed Size (px)
Citation preview

Along-strike variation of orogenic wedges associated with vertical axis
rotations
Ruth Soto,1 Antonio M. Casas-Sainz,2 and Emilio L. Pueyo3
Received 1 December 2005; revised 1 June 2006; accepted 14 June 2006; published 20 October 2006.
[1] Analogue experiments with variable along-strike shortening were performed bypushing a rotating rigid backstop against constant thickness one-layer (sand) and two-layer(sand-silicone) cakes. Along-strike shortening differences were introduced by thevertical axis rotation of the backstop and caused lateral variations in the deformationalstyle of the accretionary wedge. Deformational fronts were diachronous and oblique withrespect to the backstop direction. Numerous oblique ramps developed in order toaccommodate the structural differences between sectors with different amounts ofshortening, individual thrust sheets rotated significantly less than the backstop, and olderthrust sheets presented higher vertical axis rotations than younger ones. Analoguemodels show the importance of strike-slip motions during thrusting and significant verticalaxis rotations in frictional and ductile basal conditions, respectively. Our modeling resultsare compared with natural examples from the southern Pyrenees, the Idaho-Wyomingthrust belt, and the Transverse Ranges, where external axis rotations are linked to obliqueramps, differential shortening, and thrust propagation in orogenic wedges.
Citation: Soto, R., A. M. Casas-Sainz, and E. L. Pueyo (2006), Along-strike variation of orogenic wedges associated with vertical
axis rotations, J. Geophys. Res., 111, B10402, doi:10.1029/2005JB004201.
1. Introduction
[2] Vertical axis rotations (VARs) are very common infold-and-thrust belts and their magnitude and timing con-stitute a first-order parameter controlling the kinematicevolution of orogenic belts and back-arc basins [e.g.,Allerton, 1998; Mattei et al., 2004]. There are numerousand recent paleomagnetic works in most orogenic areas tounravel possible VARs: Himalayas [e.g., Waldhor et al.,2001; Schill et al., 2001, 2002], Alps-Carpathian system[e.g., Collombet et al., 2002; Cairanne et al., 2002; Martonand Fodor, 2003; Thony et al., 2006] or Andes [Beck, 1998;Arriagada et al., 2000; Rapalini et al., 2000; Somoza andTomlinson, 2002; Gilder et al., 2003]. Definition of VARs isstrongly dependent on the resolution of paleomagneticanalysis and the accuracy in determining differential short-ening and displacement.[3] The significance of VARs to the geometries and
kinematics associated with thrusting has been debated inthe last years [e.g., McCaig and McClelland, 1992;Allerton, 1998; Pueyo et al., 2002; Speranza et al., 2003;Sussman et al., 2006]. Although the kinematic pathways forrotational motion of plates, crustal blocks, and oblique beltscan be described theoretically, as for arcuate parts of fold-
thrust belts [Allerton, 1998; Conder et al., 2003; Sussmanet al., 2004], processes of their formation and evolution areyet not well understood. In this paper, we analyze thegeometry and kinematics of thrust wedges and/or singlethrust sheets related to VAR processes through simpleanalogue modeling and comparison with real examples.These models permit us to understand how VARs areaccommodated within the brittle crust.[4] VARs are found in convergent settings that are
characterized both by extension or shortening. In extension-al convergent settings, overriding plate extension in theback-arc region and rotation of the arc block or microplateis driven by rollback of the subduction hinge and retreat ofthe trench (Figure 1a). This scenario has been described andmodeled for Mediterranean and western Pacific subductionsystems [Lonergan and White, 1997; Faccenna et al., 1996;Schellart et al., 2002a, 2002b, 2003; Mattei et al., 2004;Wallace et al., 2005]. In convergent settings that arecharacterized by shortening, VARs can occur in a numberof tectonic settings: (1) case I (Figure 1b), oroclinal bendingthat results from VARs of the whole or of segments of theorogen after its formation around an external pivot point(e.g., Bolivian orocline) [Isacks, 1988; Weil and Sussman,2004]; (2) case II (Figure 1c), VARs related with therotating movement of a subducting plate or basement blockduring subduction or collision, respectively (e.g., Riveraplate, western Transverse Ranges) [DeMets and Traylen,2000; Onderdonk, 2005]; (3) case III (Figure 1d), VARsassociated with differential displacements of thrust sheetsrelated to the interaction with basement massifs, strike slipsand/or lateral variations of shallow ductile decollements thatcause their impingement in the foreland (e.g., Idaho-Wyom-
JOURNAL OF GEOPHYSICAL RESEARCH, VOL. 111, B10402, doi: 10.1029/2005JB004201, 2006ClickHere
for
FullArticle
1Departamento de Fısica, Escuela Politecnica Superior, Universidad deBurgos, Burgos, Spain.
2Departamento de Ciencias de la Tierra, Universidad de Zaragoza,Zaragoza, Spain.
3Unidad de Geologıa y Geofısica, Instituto Geologico y Minero deEspana, Zaragoza, Spain.
Copyright 2006 by the American Geophysical Union.0148-0227/06/2005JB004201$09.00
B10402 1 of 22

ing thrust belt, Iberian Chain, South Pyrenean Zone–Exter-nal Sierras) [Schwartz and Van der Voo, 1984; Pueyo,2000].[5] Analogue modeling is a powerful tool to understand
geodynamic processes, because the experimenter can sys-tematically investigate the influence of a single physicalparameter on a particular process. The structures producedthrough analogue models can be subsequently comparedwith natural examples. Analogue models using a semirigidbackstop can reproduce the geological scenario of anaccretionary wedge against which sediments from theseafloor are scraped up on to the continent [e.g., Byrne etal., 1993; Storti et al., 2001]. Simplifying conditions ofanalogue models include a rigid backstop rheology andfixed backstop geometry [e.g., Liu et al., 1992; Storti et al.,2000]. Classically, two kinds of conditions can be repro-duced (Figure 2): (1) ‘‘monoverging wedges,’’ simulatingaccretion against a single usually vertical backstop [e.g.,Davis et al., 1983; Mulugeta, 1988; Koyi, 1995], and(2) ‘‘doubly verging wedges’’ in which a velocity discon-tinuity is imposed and an accretionary wedge or thrustsystem forms over it [e.g., Malavieille, 1984; Wang andDavis, 1996]. The terms ‘‘monoverging’’ and ‘‘doublyverging’’ have been used to differentiate two end-membersof thrust wedges [Storti et al., 2001]: monovergent thrustwedges are essentially proward (seaward) vergent, withminor retroward (arcward) faulting, and doubly vergentthrust wedges partition shortening into proward and retro-ward thrusting. Furthermore, some rheological constraints
can also be imposed, in which simple sand cakes with abasal low-friction decollement is the simpler rheologicalscenario [e.g., Malavieille, 1984; Mulugeta, 1988; Stortiand McClay, 1995]. Reproducing the role of detachmentlevels within the upper crust is possible by incorporatingtwo-layer, sand-silicone cakes [e.g., Cobbold et al., 1989;Weijermars et al., 1993; Costa and Vendeville, 2002].[6] In spite of their simplicity, these kinds of analogue
models can be useful in the study of tectonic VARs. VARsrelated to extensional convergent scenarios have beenmodeled successfully by previous authors [Schellart et al.,2002a, 2002b, 2003]. Regarding compressional convergentsettings, the aim of this work is not to model VARsassociated with oroclinal bending (case I), but to reproduceVARs linked to both cases II and III (Figures 1c and 1d).The kind of backstop to use (e.g., vertical or horizontalbackstop) will depend on the backstop-to-cover thicknessratio of the selected natural example and/or its vergencepartitioning [Storti et al., 2001]. In this paper, we investi-gate the development of progressively imposed rotation inoblique belts and deformational fronts studying the influ-ence of lateral variations in shortening from a pivot pointdue to the imposed VAR of the backstop against horizontal,constant thickness sand pack or sand-silicone two-layersystems. This kind of experimental configuration allowsus to better understand rotational processes in thrust beltsnot previously modeled, to infer the generalized structuresformed along with VARs, and helps to distinguish thesestructures from other structures not linked to overall rotation
Figure 1. Types of vertical axis rotation scenarios in convergent settings characterized by extension(Figure 1a) and shortening (Figures 1b, 1c, and 1d). (a) Rotations associated with rollback of thesubduction hinge and retreat of the trench with extension in the back-arc region. (b) Rotations associatedwith oroclinal bending. (c) VARs related to rotational plate or basement block movement. (d) VARsassociated with differential displacements of thrust sheets.
B10402 SOTO ET AL.: VERTICAL AXIS ROTATIONS
2 of 22
B10402

processes. The presence or absence of measurable VARs,their along-strike variability, and their timing relationshipswith thrusting can help to unravel the mechanisms causingthe obliquity of orogenic belts and/or deformational fronts.
2. Experimental Method
[7] The experimental apparatus used in our modeling wasa 90-cm-wide, 120-cm-long rigid basal plate without side-
walls (Figure 2a). A Mylar sheet with a friction coefficientof 0.34 was fixed to the basal plate. The models weredeformed by pushing the backstop against the sand packby a clockwise VAR (Figure 2). Two kinds of rigidbackstops were used; vertical and horizontal, to createmonovergent and doubly vergent thrust wedges, respec-tively. In doubly vergent thrust wedges, 1-cm-thick and0.2-cm-thick horizontal backstops were used for sand
Figure 2. (a) Experimental setup of (b) monovergent and (c) doubly vergent thrust wedges. (d and e)Maps of the models showing the characteristic parameters.
B10402 SOTO ET AL.: VERTICAL AXIS ROTATIONS
3 of 22
B10402

packs (models Z3 and Z4) and two-layer, sand-silicone(model Z6) models, respectively. The backstops used inour experiments were fixed to the basal plate by means ofa pivot point located at one end (Figures 2b and 2c), suchthat the pivot point acts as a vertical axis of rotation. Thebackstop rotation (q) was produced by pulling the freeedge of the backstop with a metallic wire connected to apiston (Appendix A). The piston was driven by a motor ata constant linear velocity of 9 cm/h in all models, andpulled perpendicular to the initial backstop position(Figure 2). The angular velocity imposed on the backstopwas 6�/hour, and can be considered constant throughoutthe experiment because of (1) the small value (30�) of themaximum rotation angle of the backstop, (2) the experi-mental apparatus dimensions, and (3) the velocity range ofthe piston (Appendix A).[8] The brittle behavior of the upper crust was simulated
by dry eolian quartz sand sieved to an average size between100 and 300 mm, a density of 1.53 g cm�3 and an angle ofinternal friction 8 = 33.5� measured in the laboratory. Itsdeformation is considered to be effectively time indepen-dent [Hubbert, 1937]. As in previous studies, the behaviorof a ductile detachment level was simulated by a siliconeputty layer [Cobbold et al., 1989; Weijermars et al., 1993].The silicone putty used is a nearly Newtonian fluid with adensity of 0.97 g cm�3 and a viscosity of 1 � 104 Pa s atroom temperature for the deformation velocity rate usedduring the experiments.[9] Models were deformed until a maximum backstop
rotation of 30� was reached, such that a maximumshortening of 40 cm was achieved in the area furthestfrom the pivot point (i.e., unhinged end), and progres-sively diminishing toward the pivot end where the short-ening was null. The length scaling factor was 10�5: 1 cmin the models represents about 1 km in nature [Hubbert,1937; McClay, 1990]. With the deformation velocityimposed (changing from a maximum of 10�5 s�1 to lessthan 10�6 s�1 at the two ends of the model) the ductilelayer is an analog for materials with viscosities between1018 and 1019 Pa s, and is reasonable for low-strengthlayers. Although the along-strike variation in linearvelocity is responsible for a change in strength of theviscous layer, we think that these changes are realisticconsidering that there is a wide range of deformation ratesand rock viscosities in nature. A 4 cm square grid ofwhite sand was traced on top of the undeformed sandpacks to help monitor the progression of deformation. Tohelp visualize the cross-sectional architecture of modelwedges, passive layers of colored and white sand werealternated in the sand packs. At the end of each experi-ment, the model was impregnated with water to give
cohesion and cut into vertical slices, perpendicular tothe initial backstop direction.
3. Model Parameters
[10] In order to have a thorough understanding of the rolethat an external rotating backstop has on differential short-ening, the models were configured to study the effect of fourprincipal variables: (1) the magnitude of VARs, (2) thegeometry of the backstop, (3) the presence or absence of abasal ductile detachment (i.e., basal silicone layer), and(4) the thickness of the sand pack. The initial configurationof models is described in Table 1. For describing doublyvergent thrust wedges (models Z3, Z4 and Z6), the geo-dynamic framework described by Willett et al. [1993] isused; the prowedge is the region where material movestoward the backstop and the retrowedge develops on theoverriding plate.[11] The evolution of growing thrust wedges in our
models is described by the following parameters (Figures2d and 2e): (1) The distance from the deformation front tothe backstop measured in map view perpendicular to thebackstop at three equidistant positions along the backstop.These distances are referred to as dPa, dPb and dPc formodels Z1, Z2, and Z5, and to the prowedge region inmodels Z4 and Z6 and dRa, dRb and dRc for models Z4 andZ6 from the backstop to the deformation front in theretrowedge region, (2) a spacing, b spacing and c spacingare the width of the frontal thrust sheet at the abovementioned equidistant points in models Z1 and Z2, (3) theobliquity of the deformation front (d) with respect tothe rotational backstop in models Z1, Z2, Z4 and Z5,(4) the rotation of different thrust sheets (l) for modelsZ1 and Z2, and finally, (5) the trajectory of passive markerswithin a thrust sheet with progressive shortening in modelsZ1, Z2 and Z5. Measurements of critical wedge taper [seeDavis et al., 1983] developed under oblique convergencesuggest that parameters deduced from the Coulomb wedgetheory are valid only when measured in the directionparallel to the convergence [Martinez et al., 2002]. In ourmodels, the direction of convergence varies as the backstoprotates and all parameters have been measured perpendicu-lar to the backstop strike (i.e., parallel to the infinitesimalconvergence direction).
4. Experimental Results
4.1. Monovergent Sand Pack Thrust WedgesWith Rotational Backstop
[12] The main geometric feature of the reference modelZ0 is that the deformation front shows rectilinear traces in
Table 1. Initial Configuration of Models
Rotating Backstop Nonrotating Backstop
MonovergentThrust Wedge
(Vertical Backstop)
Doubly VergentThrust Wedge
(Horizontal Backstop)
MonovergentThrust Wedge
(Vertical Backstop)
Doubly VergentThrust Wedge
(Horizontal Backstop)
Brittle sand pack (sand thickness) Z1 (1.5 cm), Z2 (3 cm) Z4 (1.5 cm) Z0 (1.5 cm)(reference model)
Z3 (1.5 cm)(reference model)
Ductile-brittle pack(silicone thickness/sand thickness)
Z5 (0.5 cm/1 cm) Z6 (0.5 cm/1 cm)
B10402 SOTO ET AL.: VERTICAL AXIS ROTATIONS
4 of 22
B10402

map view, which strike perpendicular to the shorteningdirection (Figure 3). Its first-order growth progressed bythe piggyback nucleation and propagation of thrusts in twomajor stages [Storti et al., 2000] (Figure 3): Stage Irepresents the fast creation of an embryonic tectonic wedgethrough nucleation of closely spaced thrusts, and stage IIrepresents the forelandward propagation of deformation anddevelopment of a mature wedge through nucleation of long-lived, widely spaced thrusts.[13] Models Z1 and Z2 display differential shortening
rates along strike, from the pivot end, where shortening iszero, to the unhinged end, where shortening is maximum(40 cm measured perpendicular to the final backstopdirection at 30� backstop rotation). Consequently, defor-mation is strongest in the unhinged end and diminishesprogressively along strike. Even though models Z1 and Z2grew by piggyback nucleation thrusts, similar to thosemodels without rotational backstops, the geometries andkinematics formed in our experiments with VARs aresignificantly different (Figures 4a and 4b). (1) Deformationis diachronous; it starts in the sector with maximumshortening and progresses laterally toward the sector withno deformation (i.e., pivot end). (2) Individual thrust tracesand the deformation front are oblique with respect to theinfinitesimal backstop direction, diverging toward the sec-tor of models with higher shortening and deformation(Figures 4a and 4b). The obliquity of the deformationfront in models Z1 and Z2 (q) is quite similar and increaseswith increasing backstop rotation, except for the last stageof model Z2 because of the nucleation of L4 (Figures 4a–4c).(3) The width and displacements of thrust sheets increasealong strike and with increasing backstop rotation. Thegraphs in Figures 4d and 4e show that the width ofthe frontal thrust sheets in positions a and b is larger in themodel with thicker sand pack (Z2) in comparison to themodel with thinner sand pack (Z1). This is consistent withthe classical relationship between increase in fault spacing
and increase in thickness of faulted layer [e.g., Mulugeta,1988; Liu et al., 1992; Marshak and Wilkerson, 1992].Furthermore, the width of individual thrust sheets formodels Z1 and Z2 diminishes along strike from theposition a to b (i.e., as shortening diminishes) (Figure 4).From angular values of 19� and 22� of backstop rotationfor Z1 and Z2, respectively, the width of the frontal thrustsheet in position a is smaller than in position b, probablybecause of the boundary effect associated with backstoprotation (Figure 4). The width of the frontal thrust sheet inposition c is not significant, because most thrust sheets donot reach this sector of the models and because measure-ments reflect preexisting thrust sheets. Measurements inposition b, without boundary effects, reveal increasingwidth of thrust sheets with increasing backstop rotationand shortening for both models (Figures 4d and 4e).Therefore thrust sheet width depends on the thickness ofthe sand pack and also on the amount of shortening.(4) The infinitesimal shortening direction varies with timeas the backstop rotates. This implies that the convergencevector is oblique to the previously created structures,resulting in a component of dextral, strike-slip thrusting.The path of passive markers on the model surface showsthat the dextral component in thrusting increases withbackstop rotation (Figures 5a and 5b). (5) When thrustsheets are active, the activity of associated back thrustsaccommodates the backstop rotational movement. Individ-ual thrust sheets passively rotate clockwise when the thrustand its associated back thrust are inactive or their activityhas decreased significantly. Consequently, older thrustsheets are more rotated than younger sheets, although allvalues of rotation are lower than the bulk rotation of thebackstop (Figures 5c and 5d). Only in model Z1 the firstnucleated thrust sheet, here called ‘‘axial zone,’’ presentsvalues of rotation close to those of the backstop (Figure 5c).(6) Most thrusts do not cut across the whole model, butusually branch with the youngest thrust by means of lateral
Figure 3. (a) Line drawing (from map view) of model Z0 (vertical backstop reference model) after 5 cmof shortening showing the onset of stage II. (b) Cross section at the central part of model Z0 after 40 cmof shortening.
B10402 SOTO ET AL.: VERTICAL AXIS ROTATIONS
5 of 22
B10402

and oblique ramps (Figures 4a and 4b). (7) An increase inthe amount of material forming the wedge and uplift of theaxial zone takes place simultaneous with the increase ofshortening rate along strike. This implies that the change inthe dynamics of the system that occurs between the twoevolutionary stages described by Storti et al. [2000] doesnot simultaneously happen throughout the length of thebackstop in our models. The change from stage I to stage IIstarts in the sector with higher shortening and then pro-gresses toward the opposite sector. In model Z1, thrusts L1,L2, L3, L4 and L5 are related to Storti et al.’s stage II
(Figure 4a). The varying and increasing length of L1, L2,L3 and L4 allows us to infer the progressive, along-strikebeginning of stage II for the wedge with backstop rotation(Figure 4a). For model Z2, only thrust sheets L3 and L4 areconsistent with stage II. The nucleation of L4 in this modelrepresents the beginning of stage II throughout the model,whereas with L3 the pivot end of the model is still in stage I(Figure 4b).[14] Although the qualitative evolution of models Z1 and
Z2 is quite similar, the proportion between sand thicknessand thrust width explains why there are more thrust sheets
Figure 4. (a and b) Line drawings (from map views) of sequential evolutionary stages of experimentsZ1 and Z2 after 10�, 20�, and 30� of backstop rotation (q) and photographs after 30� of backstop rotation.(c) Obliquity of the deformation front (d) versus backstop rotation (q) in models Z1 and Z2. (d and e)Plots showing the width of the frontal thrust sheet versus backstop rotation (q) of models Z1 and Z2.
B10402 SOTO ET AL.: VERTICAL AXIS ROTATIONS
6 of 22
B10402

and why they are more closely spaced in Z1 (Figure 4).Measurements of the distance from the deformation front tothe backstop (dPa, dPb and dPc; Figures 5e and 5f) showthe differences between Z1 and Z2. The more regular shapeof the curves of model Z1 (Figure 5e) highlights the moreuniform expansion of the wedge due to fast thrust nucle-ation related to its thinner sand pack. Conversely, the curvesobtained from model Z2 show a sawtooth shape indicating
longer periods of wedge contraction separated by rapidpulses of wedge expansion when frontal thrusts nucleated(Figure 5f).
4.2. Doubly Vergent Sand Pack Thrust WedgesWith Rotational Backstop
[15] Model Z4 consists of a horizontal sand pack with arotational backstop. Its evolution, despite its similar first-
Figure 5. (a and b) Passive marker path map of models Z1 and Z2. The paths were drawn for passivemarkers of the surface of single thrust sheets (thrust sheets L2 and L3 for models Z1 and Z2, respectively;see location in Figures 4a and 4b). We chose these thrust sheets because the passive markers of thesurface of thrust sheets formed during earlier stages of shortening are difficult to observe during theexperiment. Consequently, the paths are only drawn once the thrust sheets are formed, i.e., after 12� and14� of backstop rotation for Z1 and Z2, respectively. (c and d) Vertical axis rotation of single thrust sheetsin models Z1 and Z2. The values shown in this figure correspond with the thrust sheets indicated inFigures 4a and 4b. (e and f) Plots of the distance between the deformation front and the backstop (dP) inpositions a, b, and c versus backstop rotation (q) for models Z1 and Z2.
B10402 SOTO ET AL.: VERTICAL AXIS ROTATIONS
7 of 22
B10402

order growth when compared to Z3 (reference model;Figure 6), varies significantly (Figure 7a). After the back-stop starts its rotational movement, a pop-up structure growsover the velocity discontinuity in the unhinged end and thenprogresses toward the pivot end. A noncylindrical thrustwedge develops when both deformation fronts are welldefined. The deformation front in the prowedge rapidlypropagated toward the foreland by piggyback nucleation ofclosely spaced thrusts. The retrowedge advanced moreslowly by development of a major thrust and secondarythrusts in the unhinged end.[16] As with monovergent models (Z1 and Z2), model
Z4 presents similar lateral variations in shortening anddeformation rates, diminishing toward the pivot end andrelated to the VAR of the backstop. Analysis of thegeometries and kinematics of model Z4 allows us to pointout some analogies with models Z1 and Z2 (Figure 7):(1) The deformation front in the prowedge and retrowedgeare diachronous, as deformation starts in the sector withhighest shortening and then progresses toward the oppo-site sector. (2) Both deformation fronts are oblique withrespect to the momentary backstop direction. The curves ofFigure 7b illustrate the quantitative evolution of theirobliquity against the rotational movement of the backstop.Obliquity increases with backstop rotation movement forboth deformation fronts. This figure also shows that theobliquity of the deformation front in the retrowedge isslightly higher with respect to the prowedge. (3) The widthand displacement of single thrust sheets diminish alongstrike toward the pivot end (Figure 7a). (4) Thrust sheets inthe prowedge of model Z4 rotate clockwise when theirthrust–back thrust system is less active (as occurs in mono-vergent models). Thrust sheets in the retrowedge rotate
passively linked with backstop movement (q) (Figures 7cand 7d). (5) Thrust sheets related to stage II in the prowedge(L1 and L2) and secondary back thrusts in the retrowedgedo not nucleate all along the model. They merge with thelast thrust by oblique ramps in the prowedge. (6) Theamount of material forming the thrust wedge and the axialzone topography also diminish along strike as shortening anddeformation decrease.[17] Cross sections of model Z4 after 30� backstop
rotation show some of the above mentioned features(Figure 8). Both the width and displacement of thrustsheets increase along strike with increasing shortening anddeformation. Cross sections 1 and 2 show the along-strikedifferential displacement of thrust sheet L1 (Figure 8). Asa result the deformation front in the prowedge shows anoffset, which is more advanced, in the unhinged end.These cross sections also reflect the along-strike variationof the axial zone elevation and the volume of materialinvolved in the thrust wedges. The curves of Figures 7cand 7d show the distance from the deformation fronts tothe velocity discontinuity in the prowedge (dPa, dPb anddPc; Figure 2e) and retrowedge (dRa, dRb and dRc;Figure 2e) in model Z4. These curves illustrate that thethrust wedge is narrower in the prowedge than in theretrowedge in position a from 10� of backstop rotationonward, possibly because of boundary effects linked to therotational movement of the backstop. In position b thedistance from the deformation front to the velocity dis-continuity is similar in the retrowedge and in the prowedge(Figures 7c and 7d). This behavior differs from theevolutionary pattern of nonrotating doubly vergent thrustwedges, which are asymmetric toward the prowedge(Figures 6 and 9) [see also Storti et al., 2000], and means
Figure 6. (a) Line drawing (frommap view) of model Z3 (horizontal backstop referencemodel) after 40 cmof shortening, after a well-developed stage II. (b) Cross section of model Z3 after 40 cm of shortening.
B10402 SOTO ET AL.: VERTICAL AXIS ROTATIONS
8 of 22
B10402

Figure 7. (a) Line drawings (from map views) of sequential evolutionary stages of experiment Z4 after10�, 20�, and 30� of backstop rotation (q) and photograph after 30� of backstop rotation. (b) Obliquity ofthe retrowedge and prowedge deformation fronts (dP and dR) of model Z4. (c and d) Plots of the distancefrom the prowedge and retrowedge deformation front to the velocity discontinuity in positions a, b, and cwith backstop rotation (q) in model Z4.
B10402 SOTO ET AL.: VERTICAL AXIS ROTATIONS
9 of 22
B10402

that the growth of doubly vergent thrust wedges by thebackstop rotation favors the retroward thrust polarity.[18] In thrust wedges, vertical and horizontal rotational
backstop configurations show a qualitatively similar evolu-tion when considering the prowedge. The main difference isthe geometry and evolution of back thrusts. In models withvertical backstops retrovergent thrusting is accommodatedby numerous and very active second-order back thrusts(Figures 4a and 4b). Conversely, in doubly vergent thrustwedges, retroward thrusting is mainly accommodated bystructures located in the retrowedge region because second-ary back thrusts associated with forethrusts in the prowedgeare scarce and short-lived (Figure 7a).
4.3. Thrust Wedges Underlain by aDuctile Detachment Layer With Rotational Backstop
[19] Models Z5 and Z6 were constructed with a basalductile layer underlying the sand pack and deformed by therotational backstop. In the monovergent thrust wedgethe deformation pattern is similar to the prowedge sectorof the doubly vergent wedge. Models Z5 and Z6 arecharacterized by the presence of back thrusts parallel totheir associated forethrusts (Figures 10a and 10b). Defor-mation fronts propagate farther and individual thrust sheetsare longer and accommodate larger displacements when aductile basal layer is present. Figure 10c shows the distancefrom the deformation front to the backstop (dP) in positionsa, b and c for model Z5. Comparing with Z1, a sand packmodel with identical total thickness, model Z5 displayshigher values of dP from 18�, 22� and 8� of backstoprotation in positions a, b and c, respectively.[20] The lateral pinch-out of the silicone layer (i.e., limit
between ductile and frictional base of the model) in thesector with lower shortening is associated with out-of-sequence thrusts and back thrusts in both the monover-
gent and doubly vergent thrust wedge. In model Z5, mostthrust sheets propagate all across the model. On the otherhand, in the prowedge of model Z6, thrust sheets concen-trate in the sector with highest shortening, branching withthe last thrust sheet by means of oblique ramps, causing thedeformation front to be very oblique with respect to thebackstop direction (Figure 10b). However, the deformationfront in model Z5 is less oblique to the backstop direction(Figure 10a). The first five thrust sheets of model Z5 and allthrust sheets of the prowedge of model Z6 nucleated andremained approximately parallel to the backstop direction
Figure 8. Cross sections of model Z4. Location of cross sections is given in Figure 7a. Note theconsequences of the continuous slumping of material in the retrowedge region collapsing the thrust front.This phenomenon has been described previously by Storti et al. [2000] in doubly vergent thrust wedges.
Figure 9. Plot of the distance from the prowedge andretrowedge deformation front to the velocity discontinuitywith shortening in model Z3. L2, L3, and L4 represent threefrontal thrusts nucleated in stage II of its evolution in theprowedge region.
B10402 SOTO ET AL.: VERTICAL AXIS ROTATIONS
10 of 22
B10402

(Figures 10a and 10b). In order to maintain parallelismwith the backstop, the rotational movement of the back-stop is accommodated by along-strike differential displace-ment of the forethrusts, the largest displacement coinciding
with the sector of major shortening. This causes VAR ofthrust sheets following nucleation. The values of rotationalso vary slightly along strike (Figure 10d) in each thrustsheet. The path of the passive markers on model Z5 (Figure
Figure 10. (a and b) Line drawings (from map views) of sequential evolutionary stages of experimentsZ5 and Z6 after 10�, 20�, and 30� of backstop rotation (q) and photographs after 30� of backstop rotation.Note the normal faults that form extensional grabens in model Z6 in the axial zone from the beginning ofthe experiment and also in one of the thrust sheets after 30� of backstop rotation. (c) Plot of the distancebetween the deformation front and the backstop (dP) in positions a, b, and c versus backstop rotation (q)for model Z5. (d) Passive marker path map showing the movement during backstop rotation of passivemarkers of the surface of thrust sheet L3 of model Z5 (see location in Figure 10a).
B10402 SOTO ET AL.: VERTICAL AXIS ROTATIONS
11 of 22
B10402

10d) also indicates that the VAR of thrust sheets linked to thebackstop movement precludes the strike-slip component ofthrusting. Only in model Z6, small normal faults formingextensional grabens parallel to the former forethrust in thesector with higher shortening appear both in the axial zone ofthe model and in one of the thrust sheets in the prowedge(Figure 10b).
5. Field Evidence of Natural ExamplesInfluenced by Rotations
5.1. Wyoming Salient
[21] The Wyoming salient of the Sevier fold thrust beltextends in N-S direction for about 300 km [Dixon, 1982],with a wedge taper geometry along an overall W-E direction[Mitra, 1994]. Forethrusts dominate throughout the beltalthough some important back thrusts are present in itscentral sections [Dixon, 1982]. The deformation spans from
the Cretaceous to the Eocene, with thrusts generally gettingyounger toward the leading edge of the system although out-of-sequence motion has also been documented [Wiltschkoand Dorr, 1983]. Average thrust displacement rates are�0.5 mm/yr [Wiltschko and Dorr, 1983]. The northern andsouthern ends of the thrust system abut against the basementforeland uplifts of the Gros Ventre Range and the Uintauplift, respectively (Figure 11a), and have undergone rota-tions during thrust emplacement: pronounced counterclock-wise rotation in the northern end of the salient and smallerclockwise rotation in the south central sector inferred frompaleomagnetic data [Grubbs and Van der Voo, 1976;Schwartz and Van der Voo, 1984; Eldredge and Van derVoo, 1988; McWhinnie et al., 1990]. Thrust sheet rotationsare the consequence of differential displacement of the mainthrust sheets, progressively increasing from the two endstoward the central part of the belt (Figure 11), as calculatedby Dixon [1982]. The same displacement pattern is found in
Figure 11. (a) Structural sketch of the Idaho-Wyoming thrust belt. The location of cross sections ofFigure 11b is shown. Gray arrows indicate the counterclockwise and clockwise rotations that occurred inthe northern and southern ends, respectively [from Grubbs and Van der Voo, 1976; Schwartz and Van derVoo, 1984; Eldredge and Van der Voo, 1988; McWhinnie et al., 1990]. (b) Displacements of the mainthrusts of the thrust system. Figure 11a is simplified from Dixon [1982].
B10402 SOTO ET AL.: VERTICAL AXIS ROTATIONS
12 of 22
B10402
individual thrust sheets in the northern part of the belt[Lageson, 1984; Woodward, 1986]. The differential dis-placement associated with the main thrust sheets can beestimated at�40 km for the northern sector of the salient (forcross sections separated 64 km along the strike of the belt,sections 1-10 and 2-20 in Figure 11) and 50 km in the southernsector (for cross sections separated 160 km along the strikeof the belt, cross sections 3-30 and 4-40 in Figure 11) [Dixon,1982]. In the northern sector of the thrust belt, paleomag-netic data in some of the thrust sheets [Grubbs and Van derVoo, 1976; Eldredge and Van der Voo, 1988], indicate aclockwise rotation of about 33� in agreement with theexpected rotation deduced from the shortening difference[see Pueyo et al., 2004; Sussman et al., 2006]. However,larger-scale rotations in the area where structures changefrom a NW-SE to a N-S direction (i.e., transfer zones),indicate that other processes were likely involved duringthrust sheet emplacement. We will not consider these otherprocesses in the comparison with our analogue models.[22] The map view of the thrust system in the southern
sector (between cross sections 4-40 and 3-30, Figure 11) iscomparable with model Z2 with the magnitude of rotation
calculated from the differential displacement between thesetwo sections of about 20�, according to the differentialdisplacement obtained [Dixon, 1982]. In spite of the largeramount of rotation obtained from the cross sections, therelatively small obliquity between the inner and outermostthrust sheets (12�) can be explained by our models.Although it also depends on the thickness of the sedimen-tary wedge, the obliquity is always smaller than the amountof rotation. Strong and sharp transfers of displacementsbetween major thrusts along the trend of the belt have beenalso found in model Z2 as it occurs in some segments of theWyoming salient (Figure 11b).[23] In the northern end of the Wyoming salient, the
comparison can also be established with analogue modelZ2, with rotation values of about 30� (related to paleomag-netic data compiled by Sussman et al. [2006]). Accordingto the models, features related to thrust sheet rotation,especially the obliquity and curved map traces of thrustsheets, are clearer in the inner part of the belt [Lageson,1984], whereas the outermost thrusts and folds describe moreeven traces.
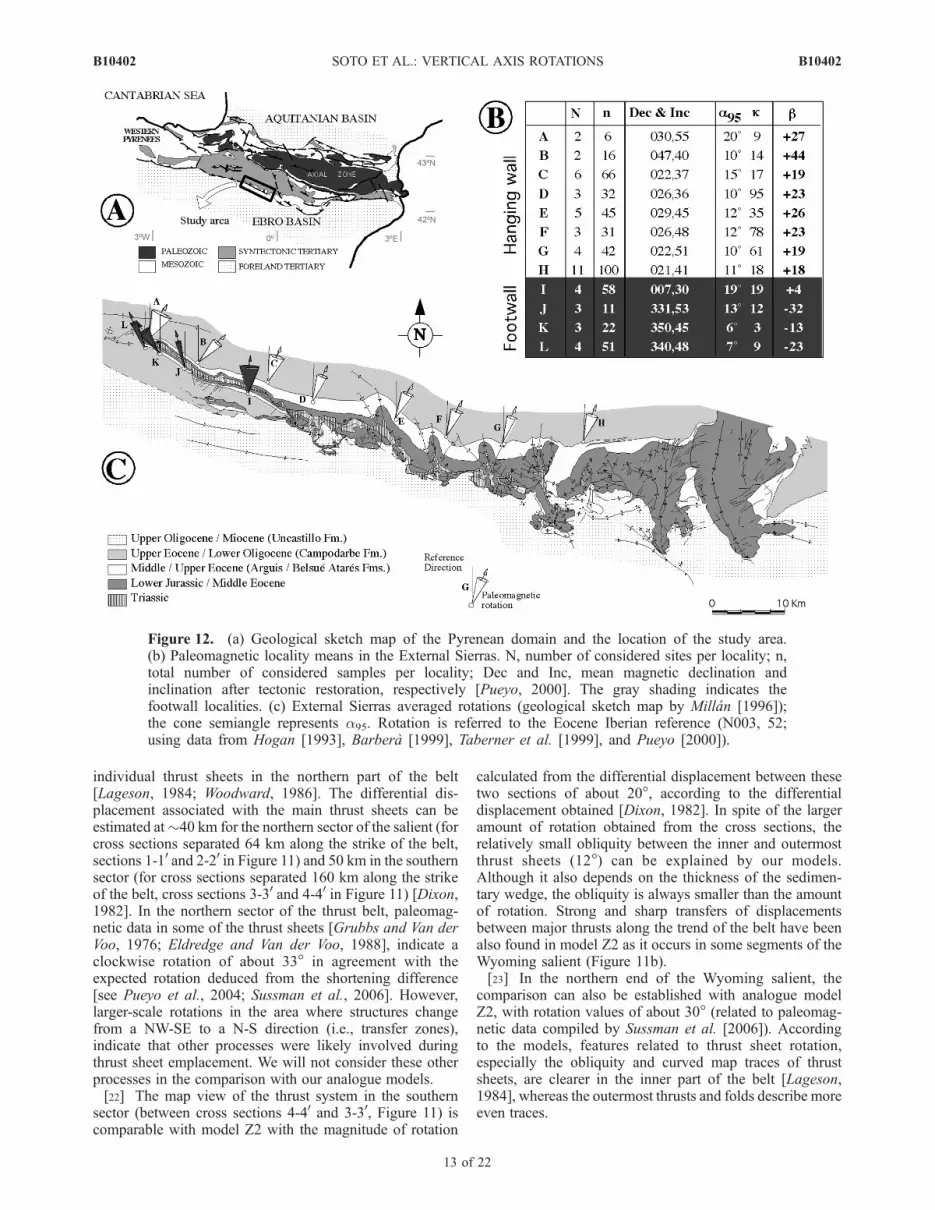
Figure 12. (a) Geological sketch map of the Pyrenean domain and the location of the study area.(b) Paleomagnetic locality means in the External Sierras. N, number of considered sites per locality; n,total number of considered samples per locality; Dec and Inc, mean magnetic declination andinclination after tectonic restoration, respectively [Pueyo, 2000]. The gray shading indicates thefootwall localities. (c) External Sierras averaged rotations (geological sketch map by Millan [1996]);the cone semiangle represents a95. Rotation is referred to the Eocene Iberian reference (N003, 52;using data from Hogan [1993], Barbera [1999], Taberner et al. [1999], and Pueyo [2000]).
B10402 SOTO ET AL.: VERTICAL AXIS ROTATIONS
13 of 22
B10402

5.2. External Sierras (Southern Pyrenees)
[24] The External Sierras represent the westernmostsegment of the Southern-Central Pyrenean thrust front(Figure 12a). Between the Early Middle Lutetian and theEarly Middle Miocene, the External Sierras progressivelyseparated the Jaca-Pamplona piggyback basin from theEbro foreland basin to the south [Seguret, 1972; Millan,1996; Pocovı et al., 2004]. The External Sierras thrustdetaches in the Upper Triassic evaporites [Puigdefabregas,1975], which form the main detachment level in thesouthern Pyrenees and disappear to the west of the ranges,as inferred from oil boreholes [Lanaja, 1987]. The thrustsystem is characterized by WNW-ESE, south vergentthrusting and oblique N-S folds in the hanging wall ofthe main thrust [Mallada, 1878] (Figure 12c). The clock-wise rotational emplacement of the External Sierras thrustfront has been inferred from paleogeographical and struc-tural evidence (i.e., along-strike differences of shortening)[Puigdefabregas, 1975; McElroy, 1990; Millan et al., 1992;Millan, 1996] and paleomagnetic data have contributed toaccurately determine the amount, age and kinematics of thisrotation [Burbank et al., 1987; Hogan, 1993; Pueyo, 2000].The External Sierras experienced a general and complexclockwise rotation synchronous with thrusting, reaching upto 45� in some areas with a mean value of 25�–30� [Pueyo,2000; Pueyo et al., 2002] (Figures 12b and 12c). Thecomplexity of the External Sierras thrust front (more than100 km long), consisting of numerous oblique and lateralstructures (plunging and conical folds, oblique ramps, etc.),explains part of the variability and adds local perturbations(caused by the noncoaxiality of the structures; Pueyo et al.[2003a, 2003b]). Major oblique ramps would articulatedifferent segments of the thrust front allowing the accom-modation of different degrees of vertical axis rotationduring the lateral propagation of the system to the west.[25] The geometries and kinematic evolution of our
models show similarities with the main features character-izing the External Sierras: (1) Shortening and displacementof the hanging wall decrease along strike toward the pivotpoint (i.e., western end of the External Sierras; Figure 12c).(2) Deformation in the External Sierras is diachronouslyprogressing from the east toward the west (i.e., toward thepivot end) in a piggyback sequence thrusting [Millan et al.,2000; Pocovı et al., 2004] as well as the rotation age[Pueyo, 2000] in a similar way as we have described inour models. (3) The External Sierras are characterized by aseries of N-S traverse folds (Figure 12c) related to initiallyNW-SE westward vergent oblique ramps [Millan et al.,2000; Pueyo et al., 2002]. Oblique structures, sometimes athigh angles with the original orientation of the backstoppopulate in our models in order to accommodate thestructural differences related to lateral variations in defor-mation and shortening. Since the natural geometries deviatefrom the ones obtained in the laboratory, other processesmust be invoked, as the probable influence of the along-strike thickness variation of the prefolding sediments [Sotoet al., 2002], diminishing in the area toward the west andsouth [Puigdefabregas, 1975], the influence of diapirism inthe nucleation and growth of early folds, or the impinge-ment of the detachment folds. (4) Break-back thrust sequen-ces are characteristic of the External Sierras [Millan, 1996;Millan et al., 2000]. These break-back thrust sequences can
be favored by syntectonic sedimentation covering the olderthrust fronts [Barrier et al., 2002]. The experimental resultsshow the importance of back thrusting and/or retrovergentthrusting related to the imposed rotational movement ofthrust sheets. This factor, added to syntectonic sedimenta-tion, could influence the formation of break-back sequen-ces. (5) Finally, mesoscopic strike-slip faults related tothrusting appear widely in the External Sierras, but theirorientation and displacement sense vary widely with respectto both their structural and stratigraphic position [Anastasioand Holl, 2001].[26] The main differences between the natural example
described here and our models lie in the lower shorteningrate in the External Sierras and the simpler structure, linkedto a single thrust instead of a series of thrusts defining anaccretionary prism occurring in our models. This differencecould be related to syntectonic sedimentation (>6000 m)derived from the erosion of the Axial Zone during theEocene and Oligocene times, which may influence thedeformation style and precluded the formation of a well-developed fold-and-thrust system. In spite of the influenceof syntectonic deposition, not considered in our models, wethink that some of the features found in the External Sierrascan be explained within the frame of vertical axis rotations.Models show the importance of strike-slip componentthrusting in absence of ductile detachments and significantvertical axis rotations. The External Sierras detach in UpperTriassic evaporites [Millan, 1996] and display importantvertical axis rotations of single thrust sheets [Pueyo, 2000]that could explain the absence of important strike-slip faults.
5.3. Western Transverse Ranges
[27] The western Transverse Ranges (WTR) are locatedto the west of the San Andreas fault in southern California,at the Pacific–North America plate boundary (Figure 13a).Since 18 Ma, the WTR has been both translated to thenorthwest along this boundary and rotated 90� clockwiseabout a pivot point located in its eastern end (Figure 13a)[Hornafius et al., 1986; Luyendyk et al., 1980; Crouch andSuppe, 1993; Nicholson et al., 1994; Onderdonk, 2005].The WTR consists of continental arc basement rocksoverlain by Jurassic through Eocene forearc sedimentaryrocks and Late Cenozoic sedimentary and volcanic rocks[Dibblee, 1982] deformed by mainly E-W striking folds andreverse faults, some of them with sinistral strike-slip com-ponent (Figure 13b) [Onderdonk, 2005]. To the north, thesouthern Coast Ranges are composed of similar depositsand NW-SE folds and reverse faults, some with dextralstrike-slip motion, truncated to the south by the E-Wstructures of the WTR (Figure 13b) [Onderdonk, 2005].The southern Coast Ranges are characterized by no signif-icant rotations deduced from both structural [e.g., Luyendyk,1991; Crouch and Suppe, 1993] and paleomagnetic data[Terres, 1984; Onderdonk, 2005]. Thus the southern CoastRanges constitutes a nonrotated crust block comparing withthe 90� clockwise rotation of the WTR block.[28] Compared to the experimental results, it is clear that
similarities exist in the deformation features of the transitionzone and the geometry and kinematics associated withanalogue models. This supports the model proposed byOnderdonk [2005] as to the deformational style at bound-aries between rotated and nonrotated crust blocks and
B10402 SOTO ET AL.: VERTICAL AXIS ROTATIONS
14 of 22
B10402

allows us to better understand how vertical axis rotations areaccommodated in the brittle crust. The structures commonin both the transition zone described by Onderdonk [2005]and the models include: (1) Displacement increases alongstrike toward the west diminishing to almost zero at its eastend (i.e., coinciding with the location of the pivot point inthe WTR) and also differential shortening occurred dimin-ishing toward the east. (2) The zone shows a fanlike fashionopening westward (from about 1 km in the east to 20 km inthe west) (Figure 13b). (3) Rotation in the transition domainis also clockwise but it is significantly less than the 90�clockwise rotation of the WTR (ranging from 30� to 75�,with an average of 51�). (4) The vergence of principalstructures located in the transition zone is north (i.e.,opposite to the rotated block movement), except the reversefault that constitutes the limit between the southern Coast
Ranges and the transition zone that shows vergence south(Figure 13b). (5) Deformation began in middle Miocene andcontinued through late Pliocene in the transition zone.Therefore most deformation in the transition zone is con-temporaneous with rotation of the WTR, as it started atabout 18 Ma [Luyendyk, 1991]. (6) All principal faults,except the fault that limits with the southern Coast Rangeswith primarily reverse component, display sinistral strike-slip component (i.e., hanging wall moving toward the east,toward the pivot end) that probably accommodates part ofthe vertical axis rotation. The structural style of this areaindicates the lack of an important detachment level. Thisfeature also coincides with the experimental results, asmodels show the importance of strike-slip component inthrusts in absence of ductile detachments to accommodatevertical axis rotation. The experimental results focusing on
Figure 13. (a) Location of the western Transverse Ranges (modified from Luyendyk [1991]) after theinferred Neogene clockwise rotation (dark shaded area). (b) Schematic structural map of thenorthwestern Transverse Ranges and southern Coast Ranges showing fold and fault orientation [afterOnderdonk, 2005]. See Onderdonk [2005] for paleomagnetic data of the rotated western TransverseRanges (light gray area), the transition zone (white area), and the nonrotated crust of the southernCoast Ranges (dark gray area).
B10402 SOTO ET AL.: VERTICAL AXIS ROTATIONS
15 of 22
B10402

vertical-backstop sand pack models can be applied satisfac-torily to this natural example, as the above enumeratedfeatures indicate.
6. Discussion
6.1. Experimental Limitations
[29] Our experimental setups include some oversim-plifications with respect to natural fold-thrust systems.(1) Natural backstops are generally nonuniform along strike[Byrne et al., 1993]. (2) The relative location of the pivotpoint within the system represents a particular case notnecessarily occurring in nature (see introduction section).(3) The relative motion in convergent margins with verticalaxis rotation rarely reaches 30� in nature, except in indentorsystems or oroclinal bendings, where VARs can reach morethan 60�, but we can consider valid our results becausesimilar first-order geometry and kinematic characteristicswere observed since the earliest stages of deformation.(4) Syntectonic sedimentation and erosion were not takeninto account in our models, although it is known that theymay influence the development of structures [e.g., Stortiand McClay, 1995; Barrier et al., 2002]. (5) Forelandflexure and isostatic compensation were not modeled inour experiments. (6) In nature other parameters are involvedduring the same process, as the changes in thickness of thesedimentary pack or the lateral variations or disappearanceof the detachment levels, especially between the trailing andleading edges of the thrust system. However, despite theseexperimental limitations our experimental setups are wellsuited to model not only the deformation of thrust sheetssequences or deformation fronts, but also to model accre-tionary processes in thrust wedges, as has been demonstrat-ed in other tectonic settings [e.g., Malavieille, 1984;Marshak and Wilkerson, 1992; Faccenna et al., 1996],provided that the results are interpreted within the limitsof the methodology of experimental tectonics.
6.2. Imposed Along-Strike Dynamic Variation
[30] The experimental configuration performed in thiswork involves an along-strike variation in shortening anddeformation that implies a lateral variation in the amount ofmaterial incorporated into the thrust wedge and axial zoneelevation. The switch from stage I to II, implying a changein the dynamics of the system, occurs when the axial zoneof the wedge reaches a critical thickness and behaves as abackstop [Storti et al., 2000]. Consequently, in rotational
backstop scenarios, the transition of the model to the secondevolutionary stage is space and time dependent, varyingalong strike as shown in these series of experiments.[31] Thrust wedges grow and advance by maintaining a
critical taper, and topography is controlled by the angle ofinternal friction, the cohesion of the cover rocks and thecoefficient of friction along the detachment horizons [Daviset al., 1983; Dahlen et al., 1984]. Sand wedges grow withthe prowedge surface slope angle ranging between 10 and20� as it incorporates new material at the toe and tempo-rarily pauses [Mulugeta and Koyi, 1992]. However, in theprowedge region, only after stage II has progressed, theprowedge slope is in good agreement with the minimumpossible critical taper predicted by Davis et al. [1983] [seeStorti et al., 2000]. The prowedge taper angle of model Z3,with a rheological profile identical to model Z4 but withoutrotational backstop, attained the steady state predicted bythe critical taper theory (about 12� of slope) after 40 cmshortening and after the nucleation of four frontal thrusts inthe stage II (see Figure 6). In model Z4, however, the steadystate evolution is not reached because after 30� of backstoprotation the prowedge region is at the beginning of stage IIwith two frontal thrusts nucleated (see Figure 7a) in theregion with higher shortening while the rest of the wedgecontinues in the stage I in the region with less shortening(i.e., pivot end).
6.3. Rotation and DifferentialDisplacement Relationship
[32] Previous workers have pointed out that differentialthrust sheet displacements and VAR are intimately associ-ated [e.g., Grubbs and Van der Voo, 1976; McCaig andMcClelland, 1992; Allerton, 1994, 1998; Pueyo et al., 2004;Sussman et al., 2004]. Our models confirm that VAR ofthrust sheets associated with differential shortening implydifferential displacements in the thrusts (Figure 14a) andthis relation can explain most rotational scenarios. However,the presence of along-strike differential displacements on athrust does not necessarily imply VAR in the thrust sheets,especially when associated back thrusts also show differen-tial displacements (Figure 14b). In this case, thrusting couldbe accompanied by an along-strike increase in the elevationof the thrust sheet and/or extensional grabens as it occurs inmodel Z6 (Figure 10b).[33] Imbricate thrust systems underlain by a ductile basal
layer show back thrusts, some of them with displacements
Figure 14. Cartoon illustrating (a) differential shortening associated with vertical axis rotation and(b) differential shortening of thrusting and back thrusting without vertical axis thrust sheet rotation.
B10402 SOTO ET AL.: VERTICAL AXIS ROTATIONS
16 of 22
B10402

equivalent to those of forethrusts [see also Davis andEngelder, 1985; Phillippe et al., 1998; Costa andVendeville, 2002]. In our models, despite the importanceof back thrusting in ductile basal detachment thrust wedges,back thrusts displacements are more important in frictionalbasal models with imposed backstop rotation. Dominantback thrusting favors the accommodation of the differentialdisplacements generated in the forethrusts by the differen-tial shortening and therefore prevents thrust sheet rotation.Consequently, under frictional basal conditions, thrustsheets show smaller rotations when compared with thrustsheets formed with basal ductile detachments, as ourmodels suggest (Figures 5a, 5b, and 10d).
6.4. Rotation Versus Strike-Slip Component Thrusting
[34] Diagnostic features for discriminating between pri-mary oblique and progressively imposed rotation structuresare (1) the presence of VARs and (2) strike-slip faulting. Inprimary-oblique scenarios the transport direction of allstructures is more or less parallel to the shortening direction(orthogonal thrusting) with no significant VARs and/orstrike-slip component thrusting. Experimental results sup-port the hypothesis stating that structures formed by theprogressively imposed rotation of the indentor or backstopdisplay both VARs and a strike-slip component thrusting.[35] The results of models described here indicate that
there is not a straightforward relationship between VARsand strike-slip faulting in oblique convergent margins.Figures 5a, 5b, and 10d show the path of the passivemarkers on the surface of models Z1, Z2 and Z5 for athrust sheet nucleated with the same backstop rotation value(q) in the three models, in order to compare the structuresformed. Basal frictional models display lower values ofthrust sheet VAR, dextral strike-slip component using thethrust surfaces being relatively important. However, incakes underlain by a ductile detachment, thrust sheets rotatemore and show less significant strike-slip component thrust-ing. The experimental results evidence the major role playedby VARs of single thrust sheets in preventing their strike-slip movement. This is because VAR of thrust sheetscontributes to reduce the obliquity between their structuresand the infinitesimal shortening direction.
6.5. Comparison With Previous Work
[36] The evolution and description of geometric andkinematic features of monovergent and doubly vergentthrust wedges (as the reference models Z0 and Z3) accretedfrom horizontal sand packs and unidirectional backstopmotion is well described in the literature [e.g., Malavieille,1984;Mulugeta, 1988;Mulugeta and Koyi, 1992; Storti andMcClay, 1995; Wang and Davis, 1996; Storti et al., 2000;Soto et al., 2003]. Also the behavior of thrust wedgesunderlain by ductile layers has been reported by previousworkers [e.g., Davis and Engelder, 1985; Phillippe et al.,1998; Cotton and Koyi, 2000; Schreurs et al., 2001; Costaand Vendeville, 2002].[37] Previous works designed to study VARs in exten-
sional convergent settings (i.e., asymmetric back-arc exten-sion related to rotating hinge line rollback of a subductingplate) have explained satisfactorily the geometry and kine-matics of structures and the deformational style of back-arcbasins and arcs [Schellart et al., 2002a, 2002b, 2003]. In
scenarios characterized by shortening, analogue models ofthrusting in brittle and brittle-ductile systems driven by arotating backstop have never been performed before. Thisimplies that our setup designed to analyze the influence oflateral variations of shortening on thrust wedges is novel.[38] One of the consequences of our configuration is that
the infinitesimal shortening direction varies with time as thebackstop rotates. This implies that the convergence vector isoblique to the previously created structures. Numerousworks have dealt with constant (i.e., not rotating) obliqueconvergence in thrust wedges [Burbidge and Braun, 1998;Martinez et al., 2002; McClay et al., 2004; Del Castello etal., 2005] to analyze the partitioning of deformation intostrike-slip faulting and orthogonal thrusting. Regardingrotations, several tectonic scenarios characterized by short-ening imply the occurrence of VARs [Allerton, 1998;Sussman et al., 2004, 2006]. Some of them have beenalready modeled, but all cases have dealt with constantdirection of convergence: (1) thrust wedges formed in frontof an indenter of limited length along strike [e.g., Marshaket al., 1992; Lu and Malavieille, 1994; Macedo andMarshak, 1999; Costa and Speranza, 2003], and (2) inter-action of thrust sheets with obstacles in the foreland [e.g.,Macedo and Marshak, 1999; Costa and Speranza, 2003].Costa and Speranza [2003] modeled these cases by ana-logue modeling and also carried out a very interestingpaleomagnetic analysis on them to better constrain VARs.
6.6. Comparison With Natural Examples
[39] Although the comparison of experimental resultswith natural examples of orogenic belts is not straightfor-ward, partly because of the limitations of experimentalanalogues and partly because of the other factors involvedin the examples studied apart from the parameter studied,there are some features that can be well defined, and thatcorroborate the applicability of the analogue models pre-sented, in spite of their apparent simplicity.[40] Rotations at the two ends of the Wyoming salient
have be inferred both from the differential displacementderived from cross sections and paleomagnetic data[Grubbs and Van der Voo, 1976; Eldredge and Van derVoo, 1988; McWhinnie et al., 1990]. The geometry of theorogenic wedge and the properties of the sedimentarysequence involved in thrusting can be compared with ourmodels without detachment level, although some importantgeometrical features, as the ramp–flat staircase geometry ofthrusts derived from decollements along flat stratigraphiccontacts, cannot be reproduced within a homogeneous sandpack, except for the basal low-friction contact with theMylar sheet. Nevertheless, the obliquity of the thrust sheetscan be compared with the models and is consistent with theamount of rotation obtained.[41] With respect to the western Transverse Ranges, the
rotated block can be simulated by a vertical backstop in theexperiments and the transition zone south of the southernCoast Ranges accommodating the rotation of the westernTransverse Ranges by the deformed sand cake (e.g., modelsZ1 and Z2). However, the analogue models do not include anonrotated crustal block as the southern Coast Ranges thatlimits deformation to a transition zone. Also the strike ofsome map-scale folds in the transition zone of the WTR(Figure 13b) differs from the expected orientation of
B10402 SOTO ET AL.: VERTICAL AXIS ROTATIONS
17 of 22
B10402

structures from the analogue models (i.e., slightly obliquewith respect to the backstop direction). However, in thenatural example, these fold orientations are more obliquewith respect to the fault trending as they are interpreted asolder structures that were rotated from original E-W ori-entations [Onderdonk, 2005]. No previous anisotropieshave been introduced in the performed experiments in orderto reproduce this phenomenon and compare with the naturalexample. Other difference between experimental modelsand this natural example lies in the absolute movement ofthe rotated block as it also experienced translation towardthe northwest. However, the structural similarities betweenthis natural example and our experimental results provide abasis for understanding how vertical axis rotations areaccommodated in the brittle crust.[42] The case of the Pyrenean External Sierras is prob-
ably the most difficult to compare with analogue models,because it consists of a unique thrust instead of a series ofthrusts defining an accretionary prism as in our models(see comments in the example description) and because ofits relationship with the backstop in the Pyrenees. Thecommonly accepted geodynamic setting for the Pyreneanorogen consists of a delaminated Iberian lower crustunderthrusted below the European crust that behaves asthe backstop of the orogenetic system [e.g., Munoz, 1992;Beaumont et al., 2000; Storti et al., 2000]. Toward thenorth of the Sierras Exteriores, the piggyback Jaca basinand the Internal Sierras are characterized by smallerclockwise vertical axis rotations (�20�; Oliva [2004]) oreven the absence of rotations toward the west [Larrasoanaet al., 2003]. Thus we cannot compare directly thesouthern Pyrenees (i.e., Internal Sierras, Jaca basin andExternal Sierras) with our models, as other processes (e.g.,lateral and frontal thickness variations, detachment levelheterogeneous distribution, backstop irregularities, etc.)must probably influence the tectonic architecture. Besides,rotational data during the convergence are still unknownand are key to reconstruct the relative plate movement ofthe Iberian and European plates. However, these valueswill be close to the paleomagnetic resolution (�10�) sincealready existent data do not support important rotationsduring Tertiary times [Van der Voo, 1993]. Instead, inorder to validate the experiments, we have selected onlythe External Sierras thrust front for which rotationalemplacement has been well constrained by structural andpaleomagnetic data.
7. Conclusions
[43] Lateral variations of shortening and deformationcan be achieved by the rotation of the backstop, indentoror overriding plate in accretionary wedges or by therotation of a single cover thrust sheet during its advancetoward the foreland. The experiments reported in thispaper illustrate that, since the earliest stages of deforma-tion (after only 5� of backstop rotation), along-strikevariations appear in the first nucleated thrust sheets. Theanalysis of the geometry and kinematics of the performedanalogue models indicates first-order common featuresbetween monovergent and doubly vergent wedges bothin one-layer (sand) and two-layer (sand-silicone) cakes.(1) Deformation fronts are diachronous progressing from
the sector with higher shortening. (2) The displacement andwidth of single thrust sheets and associated back thrustsdiminishes laterally as shortening diminishes. (3) Individualthrust sheets rotate in the same sense as the backstop whenthe thrust and associated back thrust are inactive or theiractivity has decreased notably. Thus older thrust sheetsdisplay higher VARs than younger ones. Our modelsindicate that the occurrence of differential displacementsalong a thrust are usually related to VARs but this cannot betaken as a unique feature because differential shorteningdoes not necessarily imply VAR in the thrust sheets ifassociated back thrusts also show differential displace-ments. (4) The amount of material forming the thrust wedgeand the axial zone elevation diminish along strike asshortening and deformation diminish. Consequently, thetransition of the model to the second evolutionary stagevaries laterally in space and time. (5) Deformation andsingle thrust sheet fronts are oblique with respect tobackstop direction. (6) Numerous oblique and lateralthrust ramps formed to accommodate along-strike struc-tural differences.[44] Experimental results indicate that an indirect rela-
tionship between VARs and the strain partitioning intostrike-slip and thrust faulting exists in oblique convergentmargins. Models show the importance of strike-slip com-ponent in thrusts in absence of ductile detachments andsignificant VARs. The results obtained can be appliedsatisfactorily to natural examples, including the PyreneanExternal Sierras, the northern part of the western TransverseRanges and the Wyoming salient, where the models canexplain the overall structure and VARs in the region to alarge extent.
Appendix A: Constant Angular Velocity
[45] The angular velocity imposed to the backstop is6�/hour and can be considered constant with time duringall the experiment, because of (1) the rotation angle of thebackstop, (2) the experimental apparatus dimensions, and(3) the velocity range of the piston. This assumption isimportant when a silicone putty layer is introduced in theanalogue models, because of its nearly Newtonian behaviorand in order to guarantee that its strength is constant withtime, although it can show along-strike variations.[46] In the following equations we demonstrate that with
this kind of experimental apparatus angular velocity isconstant during all the experiment, even when maintaininga constant linear velocity of the piston, if we take intoaccount the experimental apparatus and its dimensions(Figure A1). We can choose a reference frame in which xis the axis coinciding with the initial position of thebackstop (abscise), increasing from left to right, and y theordinate axis, increasing from top to bottom in Figure A1.The ordinate value yp indicates the position of the piston inrelation to the backstop (i.e., yp = 0 when the piston isreaching the backstop). Let y1 be the ordinate value of theend of the backstop opposite to the pivot point (its right sidein Figure A1). We define the variable y2 in such a way thatthe distance from the piston to the central part of thebackstop is y = y1 + y2 for any piston position. Furthermore,let a be the backstop length, L be the length of the metallicwire, e be the angle between the metallic wire direction and
B10402 SOTO ET AL.: VERTICAL AXIS ROTATIONS
18 of 22
B10402

the x axis, and q be the angle for a given time, t. Then wehave that
y1 ¼ a sin �;
y2 ¼ L sin e;
[47] Let e be the distance between the end of the backstopopposite to the pivot point and the piston direction mea-sured along the x axis. Then we have
cos e ¼ e
L;
e ¼ a cos �� a=2 ¼ a cos �� 1=2ð Þ
we have
cos e ¼ a cos �� 1=2ð ÞL
being sin2e + cos2 e = 1, we have
sin e ¼ 1� a2 cos q� 1=2ð Þ2
L2
" #1=2
¼ L2 � a2 cos2 �þ 1=4a2 � a2 cos �
L2
� �1=2
¼ 1
LL2 � a2 cos2 �� cos �þ 1=4
� �� �1=2
being y2 = L sine, then
y2 ¼ L1
LL2 � a2 cos2 �� cos �þ 1=4
� �� �1=2¼ L2 � a2 cos2 �� cos �þ 1=4
� �� �1=2;
y ¼ a sin �þ L2 � a2 cos2 �� cos �þ 1=4� �� �1=2
;
that gives the value of the ordinate (position of the piston),yp from the values of the backstop angle. The lineal andangular velocities can be obtained from the differentiationof yp (first derivative) and q with respect to time. First wehave to differentiate both members of the equation:
dy ¼ a cos �þ 1
2
�a2 �2 cos � sin �þ sin �ð ÞL2 � a2 cos2 �� cos �þ 1=4ð Þ� �1=2" #( )
d�
dy ¼ a cos �þ 1
2
a2 sin � 2 cos �� 1ð ÞL2 � a2 cos2 �� cos �þ 1=4ð Þ� �1=2 !( )
d�;
and since vlinear = dy/dt and wangular = d�/dt, we have
dy
dt¼ a cos �þ 1
2
a2 sin � 2 cos �� 1ð ÞL2 � a2 cos2 �� cos �þ 1=4ð½ �1=2
!( )d�
dt;
d�
dt¼ Vlinear
a cos �þ 1
2
a2 sin � 2 cos �� 1ð ÞL2 � a2 cos2 �� cos �þ 1=4ð Þ� �1=2 !
Figure A1. Plan view diagram of the experimental apparatus with the variables defined in Appendix A.See text for explanation.
B10402 SOTO ET AL.: VERTICAL AXIS ROTATIONS
19 of 22
B10402

and since dy/dt is the linear velocity (vlinear) and dq/dt is theangular velocity (w), then
Vlineal ¼ a cos �þ 1
2
a2 sin � 2 cos �� 1ð ÞL2 � a2 cos2 �� cos �þ 1=4ð� �1=2 !( )
d�
dt
ðA1Þ
w ¼ Vlineal
a cos �þ 1
2
a2 sin � 2 cos �� 1ð ÞL2 � a2 cos2 �� cos �þ 1=4ð Þ½ �1=2
! ðA2Þ
[48] Using equation (A1) with the possible values of q,being L and a the values of our experimental apparatus, weobtain the curve shown in Figure A2. Therefore this curveshows that for backstop rotation values (q) under 30� (thisrepresents the maximum value in our experimental set up)to maintain a constant angular velocity of 6�/hour only verysmall changes in linear velocity of the piston (less than0.5 cm/h) must be imposed.
[49] Acknowledgments. Models were performed in the AnalogueModeling Laboratory of the University of Zaragoza (Spain). This workwas supported by project BTE2002-04168 of the Direccion General deEnsenanza Superior (DGES-MEC), Spanish Ministry of Education. Finan-cial support was also given in the form of two research positions for youngscientists from the Spanish Ministry of Education and Science to the first(‘‘Juan de la Cierva’’ program) and third authors (‘‘Ramon y Cajal’’program). Teresa Roman and Belen Oliva helped us in the analogue-modeling laboratory. We are grateful to Denis Gapais, W. P. Schellart,Aviva Sussman, Nina Kukowski, and two anonymous reviewers for helpfulreviews that greatly improved the manuscript.
ReferencesAllerton, S. (1994), Vertical axis rotations associated with folding andthrusting: An example from the eastern Subbetic, southern Spain, Geol-ogy, 22, 1039–1042.
Allerton, S. (1998), Geometry and kinematics of vertical-axis rotations infold and thrust belts, Tectonophysics, 299, 15–30.
Anastasio, D. J., and J. E. Holl (2001), Transverse fold evolution in theExternal Sierra, southern Pyrenees Spain, J. Struct. Geol., 23, 379–392.
Arriagada, C., P. Roperch, and C. Mpodozis (2000), Clockwise block rota-tions along the eastern border of the Cordillera de Domeyko, northernChile (22�450–23(300S), Tectonophysics, 326, 153–171.
Barbera, X. (1999), Magnetoestratigrafia de l’Oligoce del sector sud-orien-tal de la conca de l’Ebre: Implicacions magnetocronologiques i sequen-cials, tesis doctoral, 247 pp., Univ. of Barcelona, Barcelona, Spain.
Barrier, L., T. Nalpas, D. Gapais, J. N. Proust, A. Casas, and S. Bourquin(2002), Influence of syntectonic sedimentation on thrust geometry: Fieldexamples from the Iberian Chain (Spain) and analogue modelling, Sedi-ment. Geol., 146(1–2), 91–104.
Beaumont, C., J. A. Munoz, J. Hamilton, and P. Fullsack (2000), Factorscontrolling the Alpine evolution of the central Pyrenees inferred from acomparison of observations and geodynamical models, J. Geophys. Res.,105, 8121–8145.
Beck, M. E., Jr. (1998), On the mechanism of crustal block rotations in thecentral Andes, Tectonophysics, 299, 75–92.
Burbank, K. D. W., P. Hogan, M. King, and Z. J. Jolley (1987), Preliminaryresults of magnetostratigraphic studies in the South Pyrenean forelandbasin, paper presented at Workshop of Paleomagnetism in the IberianPeninsula, Serv. Geol. de Catalunya, Barcelona, Spain.
Burbidge, D. R., and J. Braun (1998), Analogue models of obliquelyconvergent continental plate boundaries, J. Geophys. Res., 103,15,221–15,237.
Byrne, D. E., W. Wang, and D. M. Davis (1993), Mechanical role of back-stops in the growth of forearcs, Tectonics, 12, 123–144.
Cairanne, G., C. Aubourg, and J. P. Pozzi (2002), Syn-folding remagnetiza-tion and the significance of the small circle test: Examples from theVocontian trough (SE France), Phys. Chem. Earth, 27, 1151–1159.
Cobbold, P. R., E. Rossello, and B. Vendeville (1989), Some experimentson interacting sedimentation and deformation above salt horizons, Bull.Soc. Geol. Fr., 5, 453–460.
Collombet, M., J. C. Thomas, A. Chauvin, P. Tricart, J. P. Bouillin, and J. P.Gratier (2002), Counterclockwise rotation of the western Alps since theOligocene: New insights from paleomagnetic data, Tectonics, 21(4),1032, doi:10.1029/2001TC901016.
Conder, J., R. F. Butler, P. G. DeCelles, and K. Constenius (2003), Paleo-magnetic determination of vertical-axis rotations within the Charleston-Nebo salient, Utah, Geology, 31, 1113–1116.
Costa, E., and F. Speranza (2003), Paleomagnetic analysis of curved thrustbelts reproduced by physical models, J. Geodyn., 36, 633–654.
Costa, E., and B. C. Vendeville (2002), Experimental insights on the geo-metry and kinematics of fold-and-thrust belts above weak, viscous eva-poritic decollement, J. Struct. Geol., 24, 1729–1739.
Cotton, J. T., and H. A. Koyi (2000), Modeling of thrust fronts aboveductile and frictional detachments: Application to structures in the SaltRange and Potwar Plateau, Pakistan, Geol. Soc. Am. Bull., 112, 351–363.
Crouch, J., and J. Suppe (1993), Late Cenozoic tectonic evolution of theLos Angeles basin and inner California borderland: A model for corecomplex-like crustal extension, Geol. Soc. Am. Bull., 105, 1415–1434.
Dahlen, F. A., J. Suppe, and D. M. Davis (1984), Mechanics of fold-and-thrust and accretionary wedges: Cohesive Coulomb theory, J. Geophys.Res., 89, 10,087–10,101.
Davis, D. M., and T. Engelder (1985), The role of salt in fold-and thrustbelts, Tectonophysics, 119, 67–88.
Davis, D., J. Suppe, and F. A. Dahlen (1983), Mechanics of fold-and-thrustbelts and accretionary wedges, J. Geophys. Res., 88, 1153–1172.
Del Castello, M., K. R. McClay, and G. A. Pini (2005), Role of reexistingtopography and overburden on strain partitioning of oblique doubly ver-gent convergent wedges, Tectonics, 24, TC6004, doi:10.1029/2005TC001816.
DeMets, C., and S. Traylen (2000), Motion of the Rivera plate since 10 Marelative to the Pacific and North America plates and the mantle, Tecto-nophysics, 318, 119–159.
Dibblee, T., Jr. (1982), Regional geology of the Transverse Ranges Pro-vince of southern California, in Geology and Mineral Wealth of theCalifornia Transverse Ranges, edited by D. L. Fife and J. A. Minch,pp. 7–26, S. Coast Geol. Soc., Santa Ana, Calif.
Dixon, J. S. (1982), Regional structural synthesis: Wyoming salient ofWestern Overthrust Belt, AAPG Bull., 66(10), 1560–1580.
Eldredge, S., and R. Van der Voo (1988), Paleomagnetic study of thrustsheet rotations in the Helena and Wyoming salients of the northern RockyMountains, Mem. Geol. Soc. Am., 171, 319–332.
Faccenna, C., P. Davy, J. P. Brun, R. Funiciello, D. Giardini, M. Mattei, andT. Nalpas (1996), The dynamics of back-arc extension: An experimentalapproach to the opening of the Tyrrhenian Sea, Geophys. J. Int., 126,781–795.
Figure A2. Graph showing the linear velocity that shouldbe imposed on the piston (see Figure A1) to obtain anangular velocity (w) of 6�/hour. Note that it is possible toobtain a constant angular velocity with constant linearvelocity (vlinear) if the backstop rotation is less than 30�
B10402 SOTO ET AL.: VERTICAL AXIS ROTATIONS
20 of 22
B10402

Gilder, S., S. Rousse, D. Farber, B. McNulty, T. Sempere, V. Torres, andO. Palacios (2003), Post-Middle Oligocene origin of paleomagneticrotations in Upper Permian to Lower Jurassic rocks from northernand southern Peru, Earth Planet. Sci. Lett., 210, 233–248.
Grubbs, K. L., and R. Van der Voo (1976), Structural deformation of theIdaho-Wyoming overthrust belt (U.S.A.), as determined by Triassic pa-leomagnetism, Tectonophysics, 33, 321–336.
Hogan, P. J. (1993), Geocrohonologic, tectonic and stratigraphic evolutionof the Southwest Pyrenean foreland basin, northern Spain, Ph.D. thesis,219 pp., Univ. of South. Calif., Los Angeles.
Hornafius, J., B. Luyendyk, R. Terres, and M. Kamerling (1986), Timingand extent of Neogene tectonic rotation in the western TransverseRanges, California,, Geol. Soc. Am. Bull., 97, 1476–1487.
Hubbert, M. K. (1937), Theory of scale models as applied to the study ofgeologic structures, Geol. Soc. Am. Bull., 48, 1459–1520.
Isacks, B. L. (1988), Uplift of the central Andean plateau and bending ofthe Bolivian orocline, J. Geophys. Res., 93, 3211–3231.
Koyi, H. (1995), Mode of internal deformation in sand wedges, J. Struct.Geol., 17, 293–300.
Lageson, D. R. (1984), Structural geology of Stewart Peak culmination,Idaho-Wyoming thrust belt, AAPG Bull., 68(4), 401–416.
Lanaja, J. M. (1987), Contribucion de la exploracion petrolıfera al conoci-miento de la Geologıa de Espana, 465 pp., Inst. Geol. y Minero de Esp.,Madrid.
Larrasoana, J. C., J. M. Pares, H. Millan, J. del Valle, and E. L. Pueyo(2003), Paleomagnetic, structural, and stratigraphic constraints on trans-verse fault kinematics during basin inversion: The Pamplona fault (Pyr-enees, north Spain), Tectonics, 22(6), 1071, doi:10.1029/2002TC001446.
Liu, H., K. R. McClay, and D. Powell (1992), Physical models of thrustwedges, in Thrust Tectonics, edited by K. R. McClay, pp. 71–81, CRCPress, Boca Raton, Fla.
Lonergan, L., and N. White (1997), Origin of the Betic-Rif mountain belt,Tectonics, 16, 504–522.
Lu, C. Y., and J. Malavieille (1994), Oblique convergence, indentation androtation tectonics in the Taiwan Mountain Belt: Insights from experimen-tal modelling, Earth Planet. Sci. Lett., 121, 477–494.
Luyendyk, B. (1991), A model of Neogene crustal rotations, transtension,and transpression in southern California, Geol. Soc. Am. Bull., 103,1528–1536.
Luyendyk, B., M. Kamerling, and R. Terres (1980), Geometric model forNeogene crustal rotations in southern California, Geol. Soc. Am. Bull.,91, 211–217.
Macedo, J., and S. Marshak (1999), Controls on the geometry of fold-thrustbelts salients, Geol. Soc. Am. Bull., 111, 1808–1822.
Malavieille, J. (1984), Modelisation experimentale des chevauments imbri-ques: Application aux chaines de montagnes, Bull. Soc. Geol. Fr., 26,129–138.
Mallada, L. (1878), Geologıa de la provincia de Huesca, Mem. Com. MapaGeol. de Esp., Inst. Geol. y Miner. de Esp., Madrid.
Marshak, S., and M. S. Wilkerson (1992), Effect of overburden thicknesson thrust belt geometry and development, Tectonics, 11, 560–566.
Marshak, S., M. S. Wilkerson, and A. T. Hsui (1992), Generation of curvedfold-thrust belts: Insight from simple physical and analytical models, inThrust Tectonics, edited by K. R. McClay, pp. 83–93, CRC Press, BocaRaton, Fla.
Martinez, A., J. Malavieille, S. Lallemand, and J. Y. Collot (2002), Parti-tion de la deformation dans un prisme d’accretion sedimentaire enconvergence oblique: Approche experimentale, Bull. Soc. Geol. Fr.,173, 17–24.
Marton, E., and L. Fodor (2003), Tertiary paleomagnetic results and struc-tural analysis from the Transdanubian Range (Hungary): Rotational dis-integration of the Alcapa unit, Tectonophysics, 363, 201–224.
Mattei, M., V. Petrocelli, D. Lacava, and M. Schiattarella (2004), Geody-namic implications of Pleistocene ultrarapid vertical-axis rotations in thesouthern Apennines, Italy, Geology, 32, 789–792.
McCaig, A. M., and E. McClelland (1992), Palaeomagnetic techniquesapplied to thrust belts, in Thrust Tectonics, edited by K. R. McClay,pp. 209–216, CRC Press, Boca Raton, Fla.
McClay, K. (1990), Extesional fault systems in sedimentary sedimentarybasins: A review of analogue model studies, Mar. Pet. Geol., 7, 206–233.
McClay, K. R., P. S. Whitehouse, T. Dooley, and M. Richards (2004), 3Devolution of fold and thrust belts formed by oblique convergente, Mar.Pet. Geol., 21, 857–877.
McElroy, R. (1990), Thrust kinematics and syntectonic sedimentation: ThePyrenean frontal ramp, Huesca, Spain, Ph.D. thesis, 175 pp., Univ. ofCambridge, Cambridge, UK.
McWhinnie, S. T., B. A. van de Pluijm, and R. Van der Voo (1990),Remagnetizations and thrusting in the Idaho-Wyoming overthrust belt,J. Geophys. Res., 95, 4551–4559.
Millan, H. (1996), Estructura y cinematica del frente de cabalgamientosurpirenaico en las Sierras Exteriores Aragonesas, Ph.D. thesis, 330pp., Univ. of Zaragoza, Zaragoza, Spain.
Millan, H.. J. M. Pares. and A. Pocovı (1992), Modelizacion sencilla de laestructura del sector occidental de las sierras marginales aragonesas (Pre-pirineo, provincias de Huesca y Zaragoza), paper presented at III Con-greso Geologico de Espana, Salamanca, Spain.
Millan, H., E. L. Pueyo, M. Aurell, A. Luzon, B. Oliva, M. B. Martınez-Pena, and A. Pocovı (2000), Actividad tectonica registrada en los depos-itos terciarios del frente meridional del Pirineo central, Rev. Soc. Geol.Esp., 13(2), 279–300.
Mitra, G. (1994), Strain variation in thrust sheets across the Sevier fold-and-thrust belt (Idaho-Utah-Wyoming): Implications for section restorationand wedge taper evolution, J. Struct. Geol., 16, 585–602.
Mulugeta, G. (1988), Modelling the geometry of Coulomb thrust wedges,J. Struct. Geol., 10, 847–859.
Mulugeta, G., and H. Koyi (1992), Episodic accretion and strain partition-ing in a model sand wedge, Tectonophysics, 202, 319–333.
Munoz, J. A. (1992), Evolution of a continental collision belt: ECORS-Pyrenees crustal balanced cross-section, in Thrust Tectonics, edited byK. R. McClay, pp. 235–246, CRC Press, Boca Raton, Fla.
Nicholson, C., C. Sorlien, T. Atwater, C. Crowell, and B. Luyendyk (1994),Microplate capture, rotation of the western Transverse Ranges, and in-itiation of the San Andreas transform as a low-angle fault system, Geol-ogy, 22, 491–495.
Oliva, B. (2004), Geometrıa y cinematica rotacional en las Sierras Interioresy Zona Axial (sector de Bielsa) a partir del analisis estructural y paleo-magnetico, Ph.D. thesis, 290 pp., Univ. of Zaragoza, Zaragoza, Spain.
Onderdonk, N. W. (2005), Structures that accommodated differential ver-tical axis rotation of the western Transverse Ranges, California, Tec-tonics, 24, TC4018, doi:10.1029/2004TC001769.
Phillippe, Y., E. Deville, and A. Mascle (1998), Thin-skinned inversiontectonics at oblique basin margins: Example of the western Vercors andChartreuse Subalpine massifs (SE France), in Cenozoic Foreland Basinsof Western Europe, edited by A. Mascle et al., Geol. Soc. Spec. Publ.,134, 1–28.
Pocovı, A.. H. Millan, E. L. Pueyo. J. C. Larrasoana, and B. Oliva (2004),Estructura del frente surpirenaico, in Geologıa de Espana, edited by J. A.Vera, pp. 328–330, Soc. Geol. de Esp.– Inst. Geol. y Miner. de Esp.,Madrid.
Pueyo, E. L. (2000), Rotaciones paleomagneticas en sistemas de pliegues ycabalgamientos: Tipos, causas, significado y aplicaciones (ejemplos delPirineo Aragones), Ph.D. thesis, 296 pp., Univ. of Zaragoza, Zaragoza,Spain.
Pueyo, E. L., H. Millan, and A. Pocovı (2002), Rotation velocity of a thrust:A paleomagnetic study in the External Sierras (southern Pyrenees), Sedi-ment. Geol., 146(1), 191–208.
Pueyo, E. L.. J. M. Pares. H. Millan. and A. Pocovı (2003a), Conical foldsand apparent rotations in paleomagnetism (a case studied in the southernPyrenees), in Paleomagnetism Applied to Tectonics: A Tribute to Rob Vander Voo, edited by C. Mac Niocaill et al., Tectonophysics, 362, 345–366.
Pueyo, E. L., A. Pocovı, J. M. Pares, H. Millan, and J. C. Larrasoana(2003b), Thrust ramp geometry and spurious rotations of paleomagneticvectors, Stud. Geophys. Geod., 47, 331–357.
Pueyo, E. L.. A. Pocovı. H. Millan, and A. Sussman (2004), Map-viewmodels for correcting and calculating shortening estimates in rotatedthrust fronts using paleomagnetic data, in Orogenic Curvature: Integrat-ing Paleomagnetic and Structural Analyses, edited by A. J. Sussman andA. B. Weil, Spec. Pap. Geol. Soc. Am., 383, 57–71.
Puigdefabregas, C. (1975), La sedimentacion molasica en la cuenca deJaca, Monogr. Inst. Estud. Pirenaicos, vol. 104, 188 pp., Cons. Super.de Invest. Cient., Jaca, Spain.
Rapalini, A. E., O. Bordonaro, and T. S. Berquo (2000), Paleomagneticstudy of Cambrian-Ordovician rocks in the eastern Precordillera of Ar-gentina: Some constraints on the Andean uplift of this block, Tectono-physics, 326, 173–184.
Schellart, W. P., G. S. Lister, and M. W. Jessell (2002a), Analogue model-ing of arc and backarc deformation in the New Hebrides arc and NorthFiji Basin, Geology, 30, 311–314.
Schellart, W. P., G. S. Lister, and M. W. Jessell (2002b), Analogue model-ing of asymmetrical back-arc extension, J. Virtual Explorer, 7, 25–42.
Schellart, W. P., M. W. Jessell, and G. S. Lister (2003), Asymmetric de-formation in the backarc region of the Kuril arc, northwest Pacific: Newinsights from analogue modeling, Tectonics, 22(5), 1047, doi:10.1029/2002TC001473.
Schill, E., E. Appel, O. Zeh, V.K. Singh, and P. Gautam (2001), Coupling oflate-orogenic tectonics and secondary pyrrhotite remanences: Towards aseparation of different rotation processes and quantification of rotationalunderthrusting in the western Himalaya (N-India), Tectonophysics, 337,1–21.
B10402 SOTO ET AL.: VERTICAL AXIS ROTATIONS
21 of 22
B10402

Schill, E., C. Crouzet, M. P. Gautam, V. K. Singh, and E. Appel (2002),Where did rotational shortening occur in the Himalayas?: Inferences frompalaeomagnetic remagnetisations, Earth Planet. Sci. Lett., 203, 45–57.
Schreurs, G.. R. Hanni, and P. Vock (2001), Four-dimensional analysis ofanalog models: Experiments on transfer zones in fold and thrust belts, inTectonic Modeling: A Volume in Honor of Hans Ramberg, edited by H. A.Koyi and N. S. Mancktelow, Mem. Geol. Soc. Am., 193, 179–190.
Schwartz, S. Y., and R. Van der Voo (1984), Paleomagnetic study of thrustsheet rotation dufing foreland impingement in the Wyoming-Idaho over-thrust belt, J. Geophys. Res., 89, 10,077–10,086.
Seguret, M. (1972), Etude tectonique des nappes et series decollees de lapartie centrale du versant sud des Pyrenees: Caractere sedymentaire rolede la compression et de la gravite, Ser. Geol. Struct., vol. 2, 155 pp.,Univ. des Sci. et Tech. du Languedoc, Languedoc, France.
Somoza, R., and A. Tomlinson (2002), Paleomagnetism in the Precordilleraof northern Chile (220–300S): Implications for the history of tectonicrotations in the Central Andes, Earth Planet. Sci. Lett., 194, 369–381.
Soto, R., A. M. Casas, F. Storti, and C. Faccenna (2002), Role of lateralthickness variation on the development of oblique structures at thewestern end of the South Pyrenean Central Unit, Tectonophysics, 350,215–235.
Soto, R., F. Storti, A. M. Casas, and C. Faccenna (2003), Influence ofalong-strike pre-orogenic sedimentary tapering on the internal architec-ture of experimental thrust wedges, Geol. Mag., 140(3), 253–264.
Speranza, F., R. Maniscalco, and M. Grasso (2003), Pattern of orogenicrotations in central-eastern Sicily: Implications for the timing of spread-ing in the Tyrrhenian Sea, J. Geol. Soc. London, 160, 183–195.
Storti, F., and K. McClay (1995), Influence of syntectonic sedimentation onthrust wedges in analogue models, Geology, 23, 999–1002.
Storti, F., F. Salvini, and K. McClay (2000), Synchronous and velocitypartitioning thrusting, and thrust polarity reversal in experimentally pro-duced, doubly-vergent thrust wedges: Implications for natural orogens,Tectonics, 19, 378–396.
Storti, F., R. Soto-Marın, C. Faccenna, and A. Casas-Sainz (2001), Role ofthe backstop-to-cover thickness ratio on vergence partitioning in experi-mental thrust wedges, Terra Nova, 13, 413–417.
Sussman, A. J., R. F. Butler, J. Dinares-Turell, and J. Verges (2004), Ver-tical axis rotation of a foreland fold and implications for the orogeniccurvature: An example from the southern Pyrenees, Spain, Earth Planet.Sci. Lett., 218, 435–449.
Sussman, A. J., C. G. Chase, E. L. Pueyo, and A. J. Weil (2006), Theimpact of vertical-axis rotations on shortening estimates, J. Struct. Geol,in press.
Taberner, C., J. Dinares-Turell, J. Gimenez, and C. Docherty (1999), Basininfill architecture and evolution from magnetostratigraphic cross-basin
correlations in the southeastern Pyrenean foreland basin, Geol. Soc.Am. Bull., 11, 1155–1174.
Terres, R. R. (1984), Paleomagnetism and tectonics of the central and east-ern Transverse Ranges, southern California, Ph.D. thesis, 325 pp., Univ.of Calif., Santa Barbara.
Thony, W., H. Ortner, and R. Scholger (2006), Paleomagnetic evidence forlarge en-bloc rotations in the eastern Alps during Neogene orogeny,Tectonophysics, 414, 169–189.
Van der Voo, R. (1993), Paleomagnetism of the Atlantic, Tethys, and Iape-tus Oceans, 411 pp., Cambridge Univ. Press, New York.
Waldhor, M., E. Appel, W. Frisch, and A. Patzelt (2001), Palaeomagneticinvestigation in the Pamirs and its tectonic implications, J. Asian EarthSci., 19, 429–451.
Wallace, L. M., R. McCaffrey, J. Beavan, and S. Ellis (2005), Rapid micro-plate rotations and backarc rifting at the transition between collision andsubduction, Geology, 33, 857–860.
Wang, W. H., and D. M. Davis (1996), Sandbox model simulation offorearc evolution and noncritical wedges, J. Geophys. Res., 101,11,329–11,339.
Weijermars, R., M. P. A. Jackson, and B. Vendeville (1993), Rheologicaland tectonic modeling of salt provinces, Tectonophysics, 217, 143–174.
Weil, A. B.. and A. J. Sussman (2004), Classification of curved ororgensbased on the timing relationships between structural development andvertical-axis rotations, in Orogenic Curvature: Integrating Paleomag-netic and Structural Analyses, edited by A. J. Sussman and A. B. Weil,Spec. Pap. Geol. Soc. Am., 383, 1–17.
Willett, S., C. Beaumont, and P. Fullsack (1993), Mechanical model forthe tectonics of doubly-vergent compressional orogens, Geology, 21,371–374.
Wiltschko, D. V., and J. A. Dorr (1983), Timing of deformation in over-thrust belt and foreland of Idaho, Wyoming and Utah, AAPG Bull., 67(8),1304–1322.
Woodward, N. B. (1986), Thrust fault geometry of the Snake River Range,Idaho and Wyoming, Geol. Soc. Am. Bull., 97, 178–193.
�����������������������A. M. Casas-Sainz, Departamento de Ciencias de la Tierra, Universidad
de Zaragoza, C/Pedro Cerbuna, E-50009 Zaragoza, Spain.E. L. Pueyo, Unidad de Geologıa y Geofısica, IGME, Oficina de
Zaragoza, C/Fernando El Catolico, 59-4�C, E-50006 Zaragoza, Spain.R. Soto, Departamento de Fısica, Escuela Politecnica Superior,
Universidad de Burgos, Av. Cantabria S/N, E-09006 Burgos, Spain.([email protected])
B10402 SOTO ET AL.: VERTICAL AXIS ROTATIONS
22 of 22
B10402


