Embed Size (px)
Citation preview
Accepted Manuscript
Title: Alternation of adriamycin penetration kinetics in MCF-7cells from 2D to 3D culture based on P-gp expression throughthe Chk2/p53/NF-�B pathway
Author: Meng Lu Fang Zhou Kun Hao Jiali Liu QianyingChen Ping Ni Honghao Zhou Guangji Wang Jingwei Zhang
PII: S0006-2952(14)00691-1DOI: http://dx.doi.org/doi:10.1016/j.bcp.2014.11.010Reference: BCP 12141
To appear in: BCP
Received date: 20-9-2014Revised date: 17-11-2014Accepted date: 19-11-2014
Please cite this article as: Lu M, Zhou F, Hao K, Liu J, Chen Q, Ni P, Zhou H, WangG, Zhang J, Alternation of adriamycin penetration kinetics in MCF-7 cells from 2D to3D culture based on P-gp expression through the Chk2/p53/NF-rmkappaB pathway,Biochemical Pharmacology (2014), http://dx.doi.org/10.1016/j.bcp.2014.11.010
This is a PDF file of an unedited manuscript that has been accepted for publication.As a service to our customers we are providing this early version of the manuscript.The manuscript will undergo copyediting, typesetting, and review of the resulting proofbefore it is published in its final form. Please note that during the production processerrors may be discovered which could affect the content, and all legal disclaimers thatapply to the journal pertain.
Page 1 of 45
Accep
ted
Man
uscr
ipt
1
Title page
Title
Alternation of adriamycin penetration kinetics in MCF-7 cells from 2D to 3D culture
based on P-gp expression through the Chk2/p53/NF-κB pathway
Author names and affiliations
Meng Lu a,1, Fang Zhou a,b,1, Kun Hao a,b, Jiali Liu a, Qianying Chen a, Ping Ni a,
Honghao Zhou c, Guangji Wang a,b,* and Jingwei Zhang a,b,**
a Key Lab of Drug Metabolism and Pharmacokinetics, State Key Laboratory of
Natural Medicines, China Pharmaceutical University, Nanjing, Jiangsu, China.
b Jiangsu Key laboratory of drug design and optimization, China Pharmaceutical
University, Nanjing, Jiangsu, China.
c Institute of Clinical Pharmacology, Central South University, Changsha, Hunan,
China.
1 M. Lu and F. Zhou contributed equally to this work.
* Corresponding author: Professor Guangji Wang, Key Lab of Drug Metabolism and
Pharmacokinetics, China Pharmaceutical University, 24 Tong Jia Xiang, Nanjing,
Jiangsu, 210009, China. Tel: 86-25-83271128, Fax: 86-25-83271060, E-mail:
** Corresponding author: Associate Professor Jingwei Zhang, Key Lab of Drug
Metabolism and Pharmacokinetics, China Pharmaceutical University, 24 Tong Jia
Xiang, Nanjing, Jiangsu, 210009, China. Tel: 86-25-83271176, Fax: 86-25-83271060,
E-mail: [email protected]
Page 2 of 45
Accep
ted
Man
uscr
ipt
2
Authorship contribution statement
(1) Study conception and design;
G.J. Wang, F. Zhou, H.H. Zhou and J.W. Zhang
(2) Acquisition, analysis and/or interpretation of data;
M. Lu, J.L. Liu, Q.Y. Chen and P. Ni
(3) Drafting/revision of the work for intellectual content and context;
M. Lu, J.W. Zhang and K. Hao
(4) Final approval and overall responsibility for the published work.
G.J. Wang, F. Zhou and J.W. Zhang
Page 3 of 45
Accep
ted
Man
uscr
ipt
3
Abstract
Monolayer cells are largely different from tumor masses, and might misguide drug
screenings. 3D in vitro cell culture models simulate the characteristics of tumor
masses in vivo and have recently been used in many studies of anti-cancer drugs.
Among various 3D cell culture models, multi-cellular layer (MCL) models allow for
the direct quantitative assessment of the penetration of chemotherapeutic agents
through solid tissue environments without requiring the use of fluorescently labeled
drugs or imaging molecules. Therefore, in our present study, a 3D-no base and
embedded MCF-7 MCL model was successfully developed for a 14-day culture. Over
time, its thickness and cell layers increased and exhibited highly proliferative
properties and drug resistance to adriamycin (ADR) with markedly elevated IC50
values. Meanwhile, G2/M stage cycle arrest was also observed, which likely
up-regulated P-gp expression through the Chk2/p53/NF-κB pathway. The elevated
P-gp expression altered the ADR penetration kinetics in MCF-7 MCLs in vitro by
accelerating the apparent penetration of ADR through the intercellular spaces of the
MCLs. Additionally, a decreased ADR retention within tumor cells was observed, but
could be significantly reversed by a P-gp inhibitor. The attenuated ADR retention in
the deeper cells of tumor masses was confirmed in xenografted mice in vivo. This
phenomenon could be elucidated by the mathematical modeling of penetration
kinetics parameters. Our study provided a new model that evaluated and improved the
quantification of the drug penetration kinetics, revealed the relationship between P-gp
and drug penetration through tumor masses, and suggested the potential molecular
mechanisms.
Keywords
Multi-cellular layer; Penetration kinetics; P-gp; Chk2/p53/NF-κB pathway
Page 4 of 45
Accep
ted
Man
uscr
ipt
4
Chemical compounds studied in this article:
Adriamycin (PubChem CID: 31703); LY335979 (PubChem CID: 153997); AZD7762
(PubChem CID: 11152667); Nutlin-3 (PubChem CID: 216345); DMSO (PubChem
CID: 679); Propidium iodide (PubChem CID: 104981); MTT formazan (PubChem
CID: 16218671)
Page 5 of 45
Accep
ted
Man
uscr
ipt
5
Abbreviations
ADR (adriamycin); AUC (area under the concentration-time curve); ECM,
(extracellular matrix); ESI (electrospray ionization); HBSS (Hank’s balanced salt
solution); LC-MS/MS (liquid chromatography tandem mass spectrometry); MCL
(multi-cellular layer); MCR (multi-cellular resistance); MCS (multi-cellular spheroid);
MDR (multi-drug resistance); MRM (multiple reaction monitoring); P-gp
(P-glycoprotein); PI (propidium iodide); qPCR (quantitative real-time PCR); S.E.
(standard error).
Page 6 of 45
Accep
ted
Man
uscr
ipt
6
1. Introduction
In order to achieve therapeutic efficacy, sufficient concentrations of anti-cancer drugs
should thoroughly penetrate tumor masses to gain full access to all viable cancer cells.
However, most conventional anti-cancer drugs are confined to only the periphery of
tumor masses near the vasculature [1, 2], a phenomenon that is known as
multi-cellular resistance (MCR) [3, 4]. This is one of the main reasons for treatment
failure of anti-cancer drugs. The many mechanisms responsible for MCR are
interrelated and multi-faceted [5, 6] and include the over-expression of efflux pumps
through cytokine alternations [7] and cell cycle changes [8]. Therefore, new
anti-cancer agents that account for the spatial structure of tumor masses should be
developed. However, in vitro cultures of cell monolayers are still the most common
choice in conventional studies, and these differ from physiological tumor masses. The
majority of anti-cancer agents has been tested on cell monolayers and may thus
provide results and interpretations that are not applicable for clinical use.
Due to the non-physiological environments represented by monolayer cell
cultures, various 3D cell culture models have been developed for more accurate drug
evaluations. Multi-cellular layer (MCL) and multi-cellular spheroid (MCS) systems
are two important models that can reproduce the characteristics of tumor masses in
vivo and have been used widely in many pharmacokinetic and pharmacodynamic
studies of anti-cancer drugs [9, 10]. MCS systems are believed to more accurately
represent the structures and biochemical properties of tumor masses than do MCL
systems [11, 12]. However, for kinetics analyses, MCS systems have their limitations.
Accurate drug concentrations cannot be determined at different depth within a cell
spheroid or can only be achieved using semi-quantitative fluorescence-based imaging
[13-15]. MCL models provide for the direct quantitative assessment of the penetration
Page 7 of 45
Accep
ted
Man
uscr
ipt
7
of chemotherapeutic agents through solid tissue environments without the need for
fluorescent labeling. Thus, MCL models can be used to obtain the necessary
information on drug penetration and distribution properties through multi-cell barriers
for optimizing drug delivery [16-18].
In our previous studies, we analyzed the cellular pharmacokinetic mechanisms
of multi-drug resistance (MDR) of breast cancer cell MCF-7 monolayers induced by
the anti-cancer agent, adriamycin (ADR). Additionally, we screened for an effective
MDR reversal agent, ginsenoside Rh2 [19]. However, because breast cancer is a solid
tumor and presents MCR, there is a pressing need to analyze the penetration kinetics
of anti-cancer agents and explore strategies to optimize tumor tissue penetration.
Therefore, MCF-7 MCL models were developed in our present study. The penetration
kinetics of ADR on MCF-7 monolayers and MCL models were investigated,
compared and mathematically modeled. Xenograft in vivo tumor models were also
performed for confirmation. Finally, the MCR of MCF-7 MCL models and its
pharmacokinetic-related mechanisms were tentatively elucidated.
2. Materials and Methods
2.1 Materials
Adriamycin (purity > 99%) was purchased from Shenglin Chemical industry (Jiangsu,
China). LY335979 and AZD7762 were purchased from Selleckchem (Houston, Texas,
USA). 3-(4,5-Dimethyl-2-thiazolyl)-2,5-diphenyl-2H-tetrazolium bromide (MTT),
propidium iodide (PI), Nutlin-3, DMSO, HPLC-grade methanol and formic acid were
purchased from Sigma Chemical Co. (St. Louis, MO, USA). Deionized water was
prepared by a Milli-Q system (Merck Millipore, Billerica, MA, USA) and was used
throughout. Matrigel, FITC-conjugated anti-P-gp antibody and isotype antibody were
Page 8 of 45
Accep
ted
Man
uscr
ipt
8
purchased from BD Biosciences (Franklin Lakes, New Jersey, USA). Standard cell
culture inserts (CM 6.5 mm, pore size 0.4 μm) were purchased from Merck Millipore
(Billerica, MA, USA). Monoclonal antibodies against Chk2, p-Chk2, p53, p65, Lamin
B, and horseradish peroxidase-conjugated goat anti-mouse/rabbit IgG secondary
antibodies were purchased from Cell Signaling Technology (Danvers, MA, USA).
The antibody for GAPDH was purchased from Bioworld Technology (Dublin, Ohio,
USA). The SYBR Prime Script RT-PCR Kit was purchased from Takara Bio Inc.
(Otsu, Shiga, Japan).
2.2 Animal welfare and Ethical statements
Healthy female BALB/c nude mice (18-22 g and 8-10 weeks old) were obtained from
Shanghai SLAC Laboratory Animal Co., Ltd. (Shanghai, China), and were kept ten
per cage at room temperature (22 ± 1 °C) with 50-60% relative humidity and
automatic day-night rhythm (12 h-cycle) in an SPF-grade environment. Tumors were
generated by subcutaneous injections of 5×10⁶ exponentially growing MCF-7 cells
into the right flank regions of female athymic nude mice. Estrogen pellets were
implanted into the nude mice one day before injection of cells. Prior to each
experiment, the animals were fasted overnight (12 h) with free access to water. All
animal experiments were approved by the Animal Ethics Committee of China
Pharmaceutical University (Nanjing, Jiangsu, China). This study was carried out in
strict accordance with the Guidelines for Animal Experimentation of this institution.
All procedures were as humane as possible. Every effort was made to minimize
animal pain, suffering and distress and to reduce the number of animals used.
2.3 Monolayer Cell Culture
Page 9 of 45
Accep
ted
Man
uscr
ipt
9
MCF-7 human breast carcinoma cells were purchased from American Type Culture
Collection. Cells were grown in monolayers using RPMI 1640 medium supplemented
with 10% fetal bovine serum, and 100 U·ml-1 penicillin and streptomycin (Life
Technologies, Carlsbad, CA, USA). The cells were grown in an atmosphere of 5%
CO2 at 37 °C, and cell medium was changed every other day.
2.4 Multi-cellular Layer Culture
The multi-cellular layer (MCL) culture of MCF-7 cells was developed according to a
“3D-no base and embedded” model with minor modifications [20]. Briefly, cells were
suspended in serum-free medium containing 6% matrigel and seeded onto the
uncoated cell culture inserts. After incubating at 37 °C for 1 h to ensure matrigel
solidification, cell culture media was added. The cells were further incubated at 37 °C
to form MCLs; subsequently, the medium was changed daily.
2.5 Histology Assays and Packing density Measurements
Cells were fixed in 10% neutral-buffered formalin for 24 h, processed with gradient
concentrations of ethanol, placed in xylene overnight and subsequently, embedded in
paraffin. Sections were cut at a thickness of 4 μm and stained with H&E and Ki-67.
The thickness of the MCL was determined with a microscope (Leica, Wetzlar,
Germany). The packing density was calculated as the percentage of nuclear areas in
all areas of MCF-7 cells. The number of nuclei per unit surface area in each image
was quantified using Leica Qwin Lite.
2.6 Cell Cycle Analysis
Page 10 of 45
Accep
ted
Man
uscr
ipt
10
The cell cycle distribution was assayed by determining the DNA content of MCF-7
cells. Cells were fixed in 70% ethanol overnight at 4 °C, and re-suspended in a
staining solution containing RNase A and propidium iodide (PI) for 30 min. After
washing, the DNA content was determined by flow cytometry (FACS Calibur, BD,
Franklin Lakes, New Jersey, USA) and analyzed with CELLQUEST software.
2.7 Cytotoxicity Assay
MCF-7 cells were exposed to various concentrations of ADR for 72 h at 37 °C with
5% CO2. The cell sensitivities were determined by measuring cell growth inhibition
via MTT colorimetric assay. The IC50 values were calculated from survival curves
using the Bliss method.
2.8 Quantitative Real-time PCR Assay
The quantitative real-time PCR (qPCR) reactions were performed in a CFX96
Real-Time PCR Detection System (Bio-Rad, Hercules, CA, USA) using the SYBR
Premix Ex Taq II (Takara, Otsu, Shiga, Japan). The primers were synthesized by
Invitrogen (Life Technologies, Carlsbad, CA, USA) and the sequences of mdr1, bcrp,
mrp2 and reference gene β-actin were as follows:
mdr1: forward primer: GCTGGGAAGATCGCTACTGA;
reverse primer: GGTACCTGCAAACTCTGAGCA
bcrp: forward primer:AGATGGGTTTCCAAGCGTTCAT;
reverse primer: CCAGTCCCAGTACGACTGTGACA
mrp2: forward primer: ACAGAGGCTGGTGGCAACC;
reverse primer: ACCATTACCTTGTCACTGTCCATGA
β-actin: forward primer: GCGTGACATTAAGGAGAAG;
Page 11 of 45
Accep
ted
Man
uscr
ipt
11
reverse primer: GAAGGAAGGCTGGAAGAG.
qPCR conditions were 95 °C for 60 s, followed by 40 cycles of 95 °C for 5 s, 60 °C
for 30 s, and 72 °C for 30 s. The specificity of the primer was monitored using
product melting curves in each reaction well. The relative gene expressions of the
examined genes were normalized to the expression of the housekeeping gene β-actin.
2.9 P-gp Expression Assay
Cells were fixed with 4% paraformaldehyde solution, followed by washing and
blocking. Then, the cells were incubated with the FITC-conjugated anti-P-gp
polyclonal antibody or the isotype-matched negative control for 1 h at 37 °C. After
washing, cells were analyzed by flow cytometry for P-gp protein expression.
2.10 Cellular Retention Assay
Briefly, cells were incubated with Hank's Balanced Salt Solution (HBSS; 37 °C, pH
7.4) containing ADR for 2 h. The accumulation was stopped by rinsing the cells with
ice-cold HBSS. Cells were then lysed and protein concentrations were measured by
the Bradford method using the BCA protein assay kit (Beyotime, Jiangsu, China). The
ADR concentration was determined by LC-MS/MS as previously described [19]. All
experiments were conducted in triplicate.
2.11 Drug Penetration Assay
MCF-7 monolayers and MCLs were seeded on cell culture inserts and cultured for
designated times. Then, the cultures were incubated with HBSS (37 °C, pH 7.4)
containing ADR on the top chambers, and samples were collected from the bottom
chambers at each time point. At the end of the experiment, cells attached to the insert
Page 12 of 45
Accep
ted
Man
uscr
ipt
12
membranes were also collected. The concentration of ADR was determined by
LC-MS/MS as previously described, and protein concentrations were measured by the
Bradford method. All experiments were conducted in triplicate.
2.12 Mathematical Model of Drug Penetration Kinetics
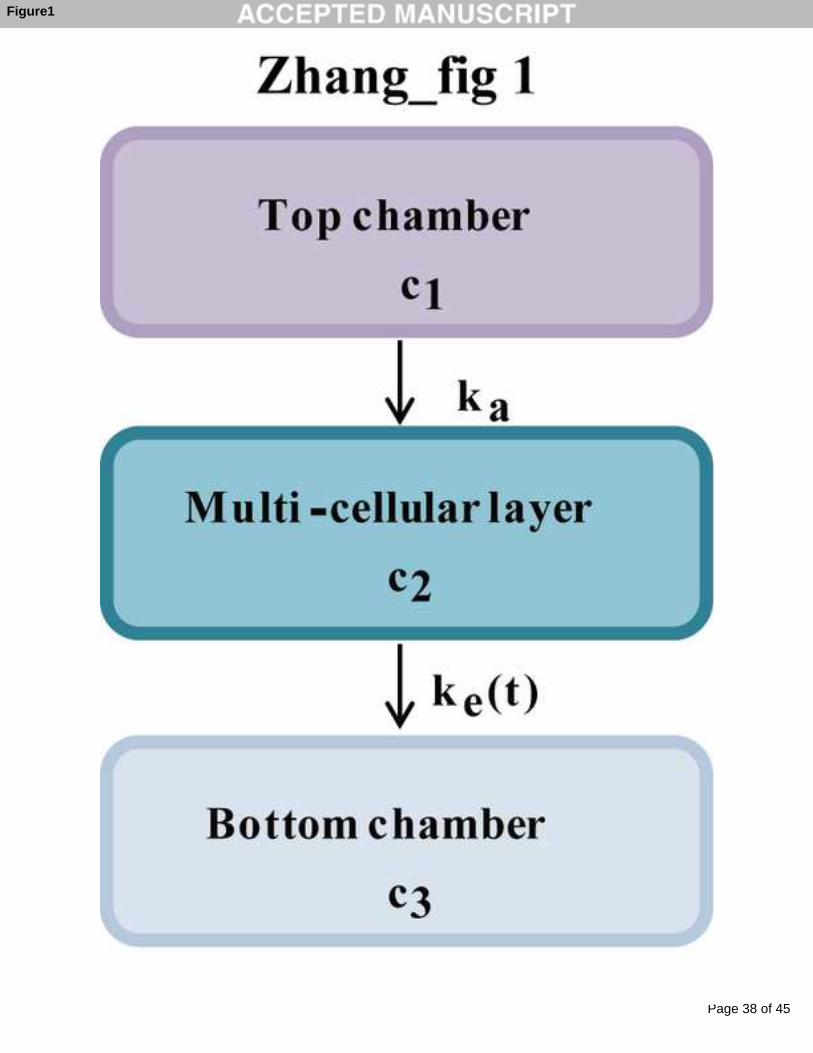
ADR penetration kinetics was modeled using a one-compartment absorption model. A
brief schematic presentation of this model is shown in Fig 1, where c1, c2, and c3 are
the concentrations of ADR in the top chamber, the multi-cellular layer and the bottom
chamber, respectively, and ka and ke are the absorption rate and elimination rate
constants. An integrated mathematical model was constructed as differential functions
in Equations (1) - (4). All parameters were estimated by ADAPT 5 software [21].
2.13 Distribution of ADR in tumors in vivo
Mice bearing MCF-7 subcutaneous tumors in right flank regions were divided
randomly into two groups (ten mice per group). One group was pre-treated with
normal saline (i.v.) followed by ADR (30 mg·kg-1, i.v.), and the other group was
pre-treated with LY335979 (25 mg·kg-1, i.v.) followed by ADR (30 mg·kg-1, i.v.).
Three hours after ADR administration, blood samples were collected via the
Page 13 of 45
Accep
ted
Man
uscr
ipt
13
retro-orbital venous sinus into heparinized tubes, mice were sacrificed by CO2
asphyxiation and cervical dislocation, and tumors were collected. The tumors were
immediately embedded in OCT compound (Sakura, Torrance, CA, USA), frozen and
stored at -80 °C. Cryosections 10 μm-thick were cut at approximately 100 μm
intervals for each tumor and mounted on glass slides.
The red fluorescence of ADR was imaged and quantified with a confocal laser
scanning microscope (Axiovert 200M, Carl Zeiss, Oberkochen, Germany). The
fluorescent intensities of ADR in tumor cryostat sections were plotted against the
distance from the periphery region (set as 0) to the central region.
2.14 Western Blotting Assay
For Western blots, nuclear, cytoplasmic and whole cell extracts were prepared as
previously described [22]. The protein samples were separated on a 10%
SDS-polyacrylamide gel and transferred onto a polyvinylidene difluoride membrane
(Bio-Rad, Hercules, CA, USA). After blocking with 5% non-fat milk, the membrane
was incubated with the primary antibodies overnight at 4 °C, followed by horseradish
peroxidase-conjugated secondary antibody for 1 h at 37 °C. The signals were detected
using an enhanced chemiluminescence kit (Thermo Fisher Scientific, Waltham, MA,
USA) and was captured using a ChemiDoc XRS+ System (Bio-Rad, Hercules, CA,
USA).
2.15 Statistical Analysis
All the data are presented as means ± S.E. of at least three independent experiments.
The statistical analyses included two-tailed Student’s t-tests and one-way analysis of
Page 14 of 45
Accep
ted
Man
uscr
ipt
14
variances. Differences were considered significant at * p<0.05, ** p<0.01, or ***
p<0.001.
3. Results
3.1 Morphology and proliferative features of MCF-7 MCLs during the culture
time
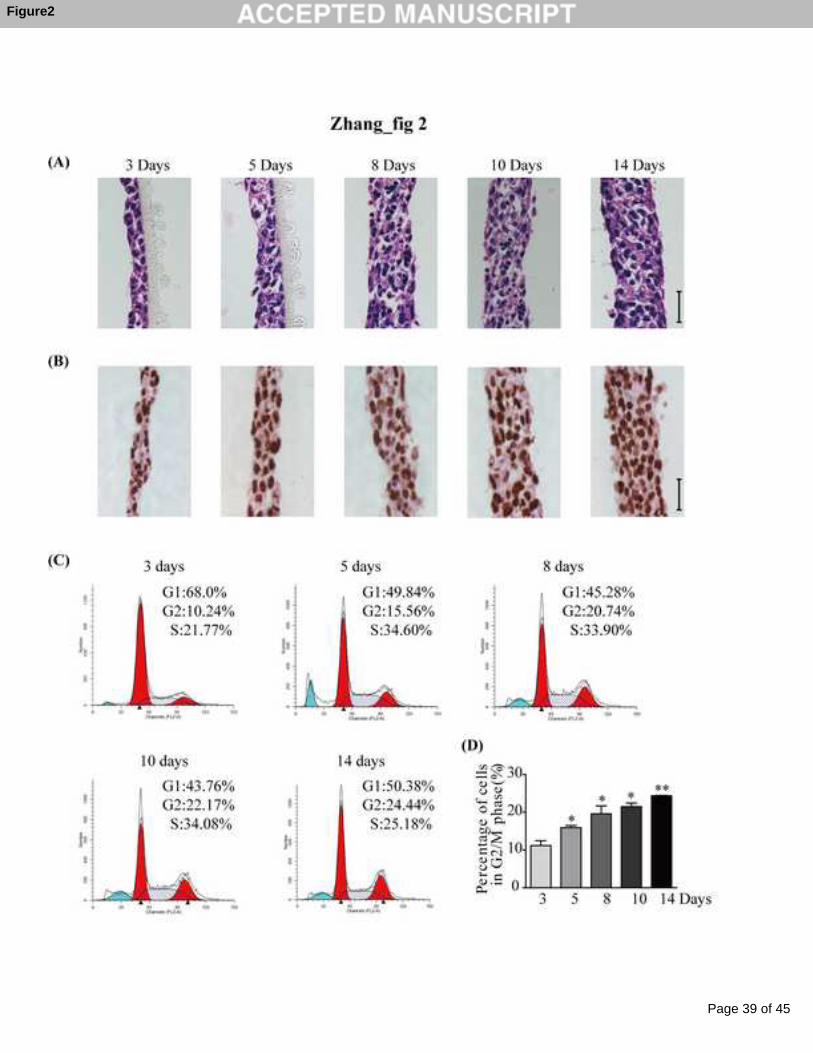
As seen in Fig 2A, the structures of the MCF-7 MCL were compact and no regions of
necrosis were found. The thickness and cell layers of the MCL increased over the
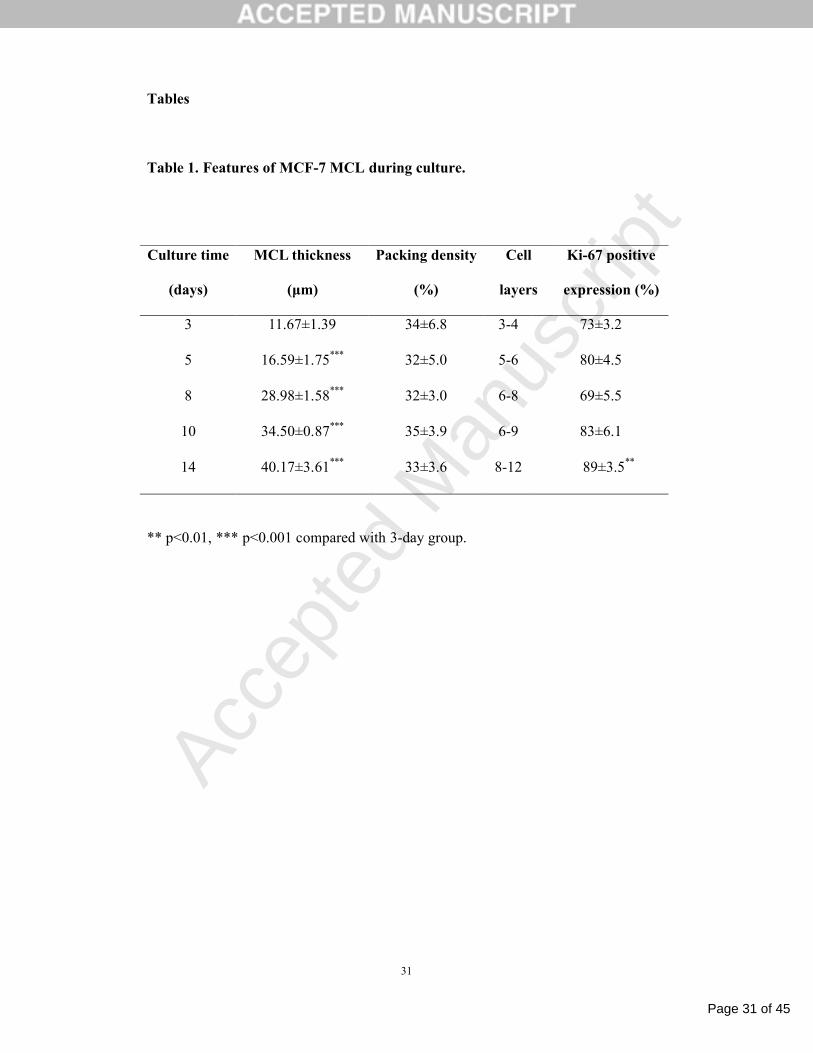
culture time, but the packing density did not significantly change (Table 1).
Furthermore, all cells within the MCF-7 MCL exhibited vigorous proliferation as
evidenced by the strong Ki-67 staining (Fig 2B). However, the cell cycle analyses
indicated a significant cell cycle arrest at the G2/M phase (Fig 2C). Relative to the 3
days group, the percentage of cells in the G2/M phase increased by 1.43-, 1.76-, 1.98-
and 2.18-fold in a time-dependent manner (Fig 2D).
3.2 ADR resistance during the growth of MCF-7 MCL
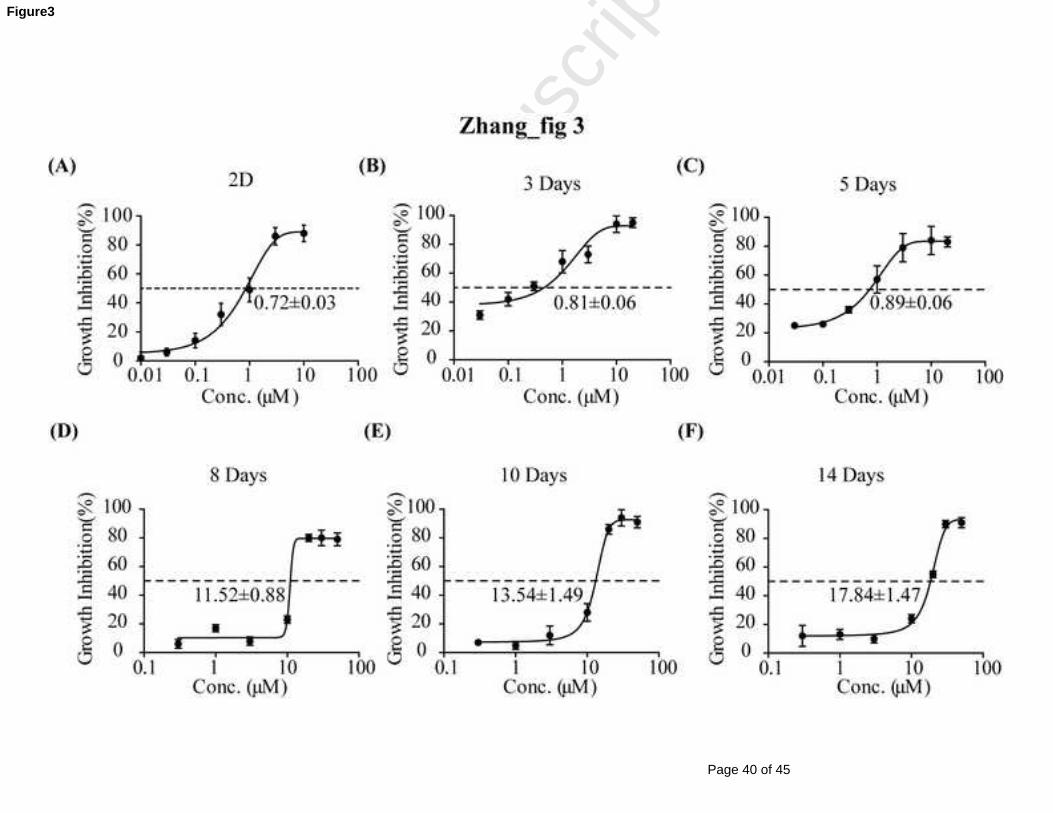
The MCF-7 monolayer cells were sensitive to ADR with an IC50 at 0.75 μM (Fig 3A).
In the earlier culture times of the MCL (3 and 5 days), the IC50 of MCF-7 cells ranged
from 0.7 to 1 μM and were not significantly different from those of the monolayer
cells (Fig 3B and 3C). However, the IC50 values markedly increased with the culture
time at 8, 10 and 14 days by 15.8-, 18.28-, and 24.11-fold, respectively, compared
with those of the monolayer cells (Fig 3D-F).
3.3 Up-regulated gene and protein expressions of P-gp during the growth of
MCL
Page 15 of 45
Accep
ted
Man
uscr
ipt
15
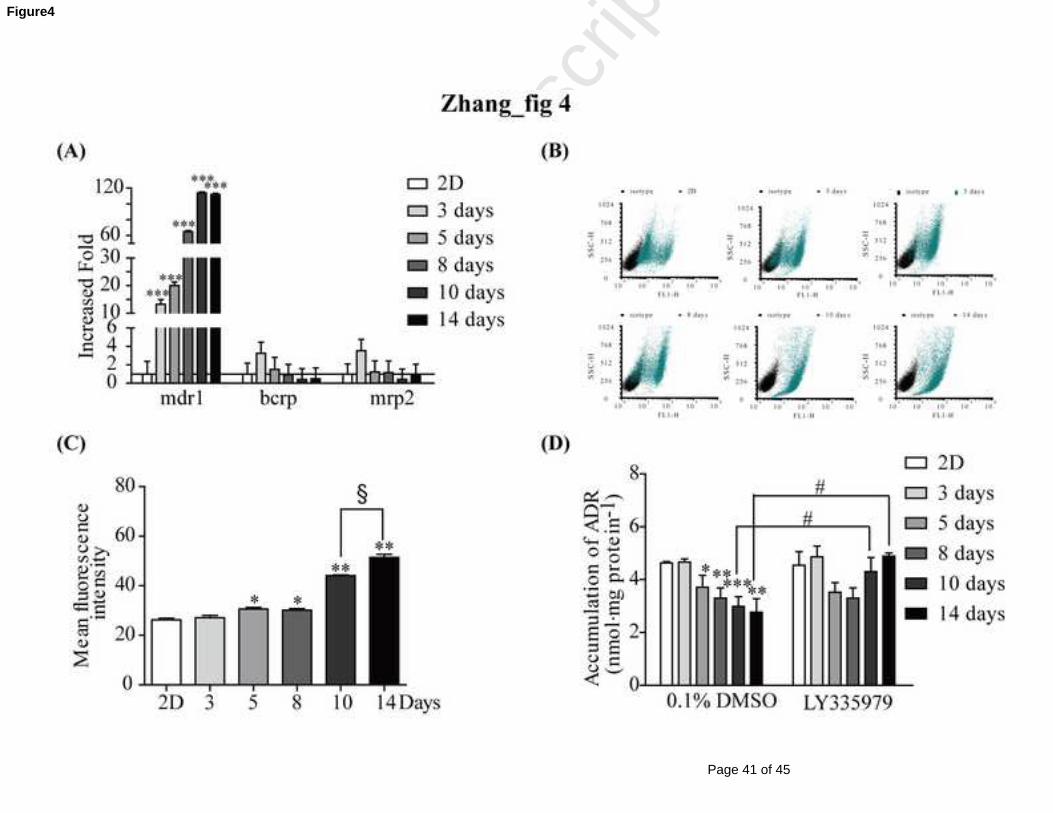
As shown in Fig 4A, there were no significant changes for the gene expressions of
bcrp and mrp2 throughout the entire culture time. However, the mdr1 gene expression
was increased in a time-dependent manner during the culture time of the MCF-7 MCL,
especially on the 10th and 14th day of the MCL culture when approximately 110-fold
increases were observed compared with those of cell monolayers. Furthermore, the
mdr1 protein levels were also markedly elevated (Fig 4B), with an approximately
1.95-fold increase in the P-gp protein level on the 14th day of the MCL culture
compared with that of the MCF-7 monolayer (Fig 4C).
3.4 Decreased intracellular retention of ADR in MCF-7 MCL and its reversal by
P-gp inhibitor
As shown in Fig 4D, the intracellular retentions of ADR in the MCF-7 MCL were
significantly decreased in a time-dependent manner compared with that in monolayer
cells. On the 10th and 14th day of the MCL culture, there were decreases of
approximately 35.4% and 40.2% compared with those in monolayer cells. These
decreases were significantly reversed by treating with the P-gp specific inhibitor
LY335979, resulting in 1.44- and 1.76-fold increases, respectively.
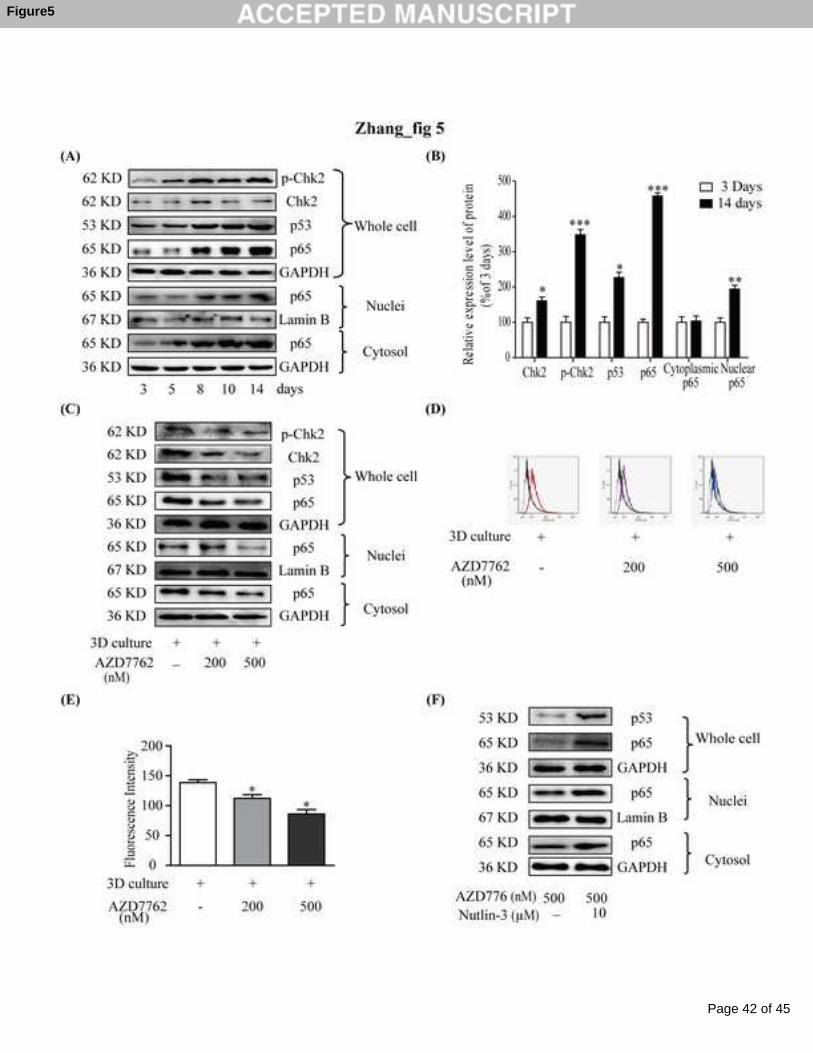
3.5 Chk2/p53/NF-κB-mediated P-gp up-regulation in MCL culture
As seen in Fig 5A, the expressions of p-Chk2, Chk2, p53 and p65 were elevated in a
time-dependent manner in the MCF-7 MCL. Especially on the 14th days of the MCL
culture, the expressions of p-Chk2, p53, and nuclear p65 increased by 348%, 227%
and 194%, respectively (Fig 5B). When checkpoint kinase inhibitor AZD7762 was
added to the MCF-7 MCL that was cultured for 14 days, the up-regulated expressions
of p-Chk2 and Chk2 were significantly lowered in concentration-dependent manners
Page 16 of 45
Accep
ted
Man
uscr
ipt
16
(Fig 5C). The expressions of p53, p65, and P-gp were also down-regulated (Fig 5D
and 5E). When p53 activator Nutlin-3 was added in combination with AZD7762 in
the MCF-7 MCL, the down-regulations of p53 and p65 caused by AZD7762 were
reversed (Fig 5F).
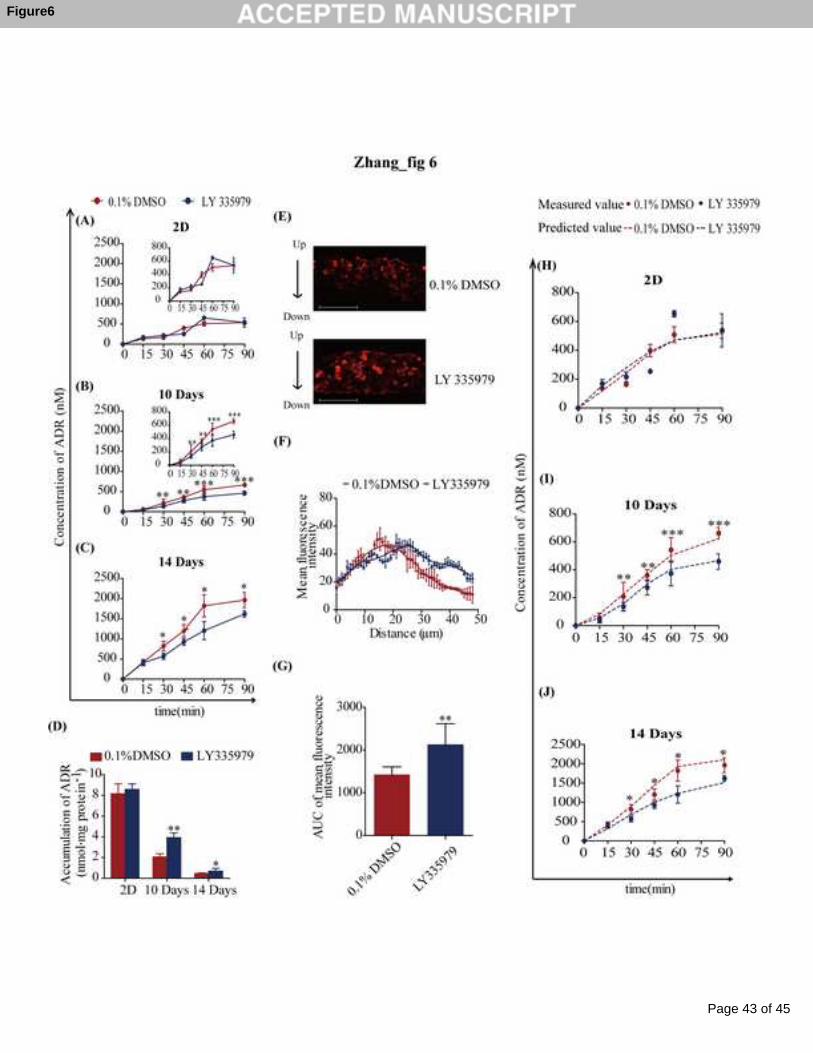
3.6 Altered ADR penetration through MCF-7 MCL and its reversal by P-gp
inhibitor
As shown in Fig 6A, the P-gp inhibitor LY335979 exhibited no effects on the
penetration of ADR in the MCF-7 monolayer. When the MCF-7 MCL was cultured
for 10 days, while the amount of ADR penetrating to the bottom chamber of the cell
culture insert did not change compared with that of the MCF-7 monolayer, it was
significantly decreased when the culture was treated with LY335979 (Fig 6B).
However, the amount of ADR penetrating the MCF-7 MCL that was cultured for 14
days was significantly greater than that of the monolayer (by approximately 4-fold).
Again, this was also markedly decreased by LY335979 (Fig 6C). The intracellular
retentions of ADR within the cells constituting the monolayer or the MCL were
sharply decreased over time to form the MCL (from 8.15 ± 0.96 to 2.06 ± 0.31 and
0.47 ± 0.06). This decrease was markedly reversed by the P-gp inhibitor (Fig 6D).
This was also demonstrated by the fluorescent imaging of the cryosections of these
cells attached to the cell culture insert (Fig 6E). The plot of fluorescent intensities
against the distance from the top of the cell culture insert revealed that much more
ADR accumulated in the bottom cells in the presence of the P-gp inhibitor. This
promoted the penetration of ADR into the deeper cells of the MCL (Fig 6F). The
AUC of this intensity-distance curve increased by 1.7-fold in the presence of the P-gp
inhibitor (Fig 6G).
Page 17 of 45
Accep
ted
Man
uscr
ipt
17
3.7 Altered kinetics parameters of ADR penetration through MCF-7 MCL due to
P-gp inhibitor
The mathematical model reasonably described the penetration kinetics of ADR
through the MCF-7 MCL with or without LY335979. As shown in Fig 6H-J, the
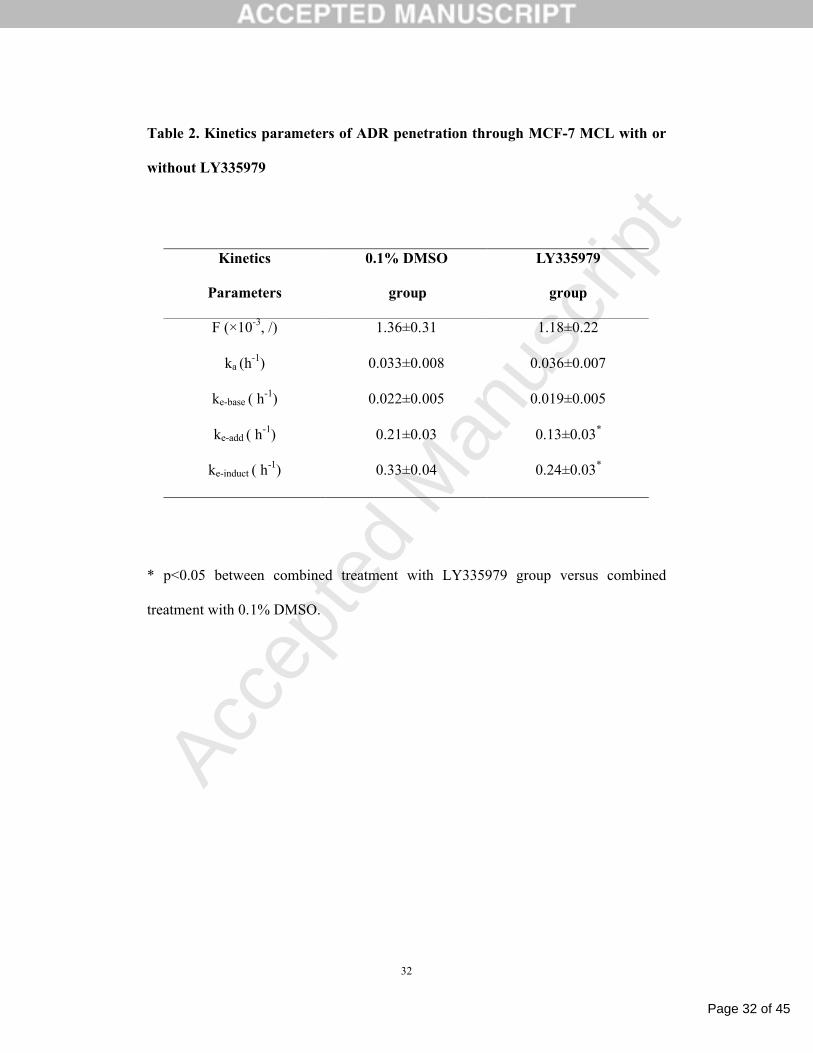
fitting results matched reasonably well with the measured values. As seen in Table 2,
when ADR treatment was combined with LY335979, the maximum additive value of
ke (ke-add) and the maximum inductive value of ke (ke-induct) were significantly lowered.
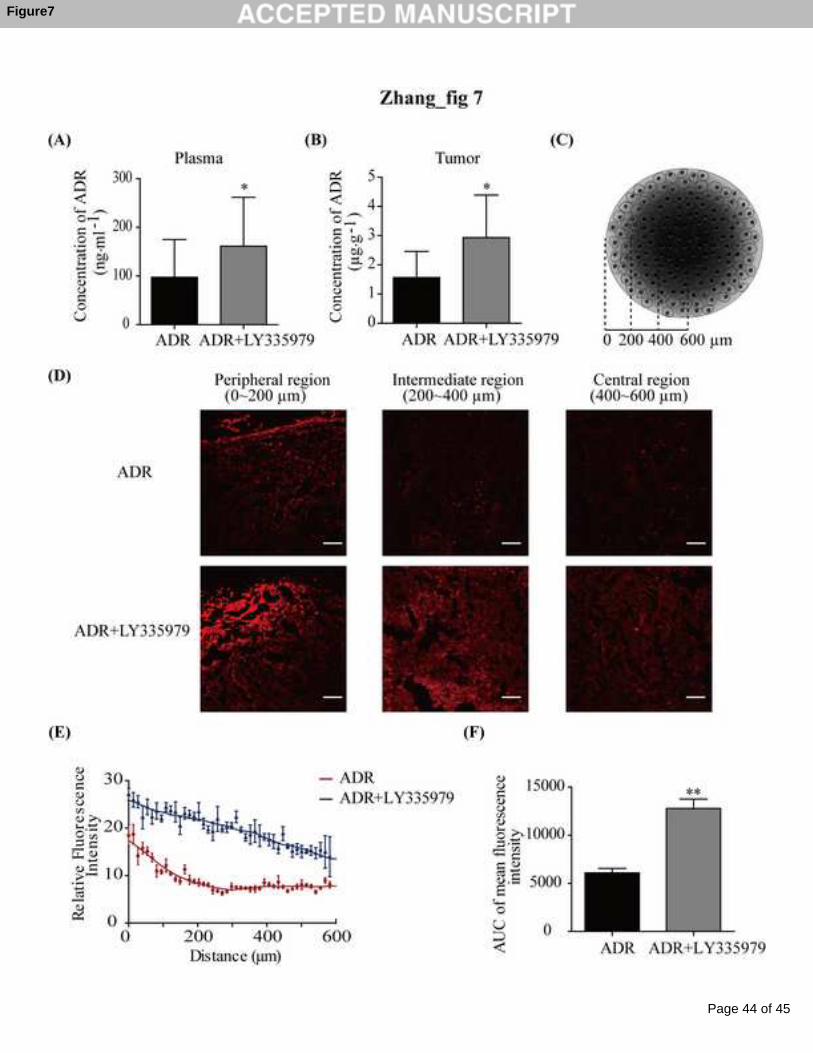
3.8 ADR penetration in MCF-7 xenografts
When MCF-7 xenografted nude mice were administered ADR (30 mg·kg-1, i.v.) in the
presence of the P-gp inhibitor, the drug concentrations in plasma (Fig 7A) and tumor
(Fig 7B) were significantly increased by 1.5- and 1.8-fold, respectively. The mean
diameter of the MCF-7 xenograft was 1.2 mm. Its cryosections were divided into
three concentric regions (Fig 7C; the edge was set as a reference): the peripheral
region (0-200 μm), the intermediate region (200-400 μm) and the central region
(400-600 μm). The representative images for each region showed that ADR primarily
accumulated at the peripheral region of the xenograft with a decreasing concentration
toward the center. Low ADR fluorescence signals were observed in the intermediate
and central regions. In the presence of the P-gp inhibitor, the fluorescence intensities
of all three regions were markedly augmented, especially for the intermediate and
central regions (Fig 7D). As shown in Fig 7E, the fluorescence intensity against the
distance from the periphery to center of the xenograft was plotted. The whole curve
was up-shifted in the presence of the P-gp inhibitor with a 2.09-fold AUC increase
(Fig 7F).
Page 18 of 45
Accep
ted
Man
uscr
ipt
18
4. Discussion and conclusions
Most studies on the resistance of anti-cancer drugs have focused on molecular
mechanisms within individual cells [23, 24]. However, the vast physiological
differences between a single cell in vitro and a tumor mass in vivo often leads to the
failure of anti-cancer drug from in vitro screening to in vivo demonstration [25-27]. A
tumor mass contains not only various single cells, but also a microenvironment
around each cell and the 3D structure of cell clusters [28]. Therefore, it is necessary to
apply a 3D cell model to evaluate new drugs and their mechanisms [3, 29, 30].
Many papers have described the MCL culture of colorectal carcinoma cells [16,
17, 31]. To the best of our knowledge, this present study is the first time breast cancer
cells MCF-7 have been cultured as MCLs using a 3D-no base and embedded model.
Hence, various cell seeding densities, cell embedding methods, and different cell
insert materials were tested and compared (data not shown). A 3D-no base and
embedded MCF-7 MCL 14-day culture was successfully developed, containing 10-12
cell layers at a 40 μm thickness (Table 1). All cells constituting the MCLs were viable
and proliferative as indicated by strong H&E and Ki-67 staining, respectively (Fig 2A
and 2B). Cell cycle analyses also indicated that most cells were at the G1 phase,
followed by the S and G2/M phases, which are common observations for cancer cells
without drug treatment (Fig 2C). Because many previous studies have reported that
3D cell cultures exhibit native resistances to chemo-therapy drugs [32, 33], the
sensitivities of the MCF-7 MCLs were evaluated using ADR as the probe drug. The
IC50 values of ADR were increased by 25-fold compared with those of 2D cells (Fig
3); MCF-7 MCLs indeed became MCR. Thus, our established MCF-7 MCL model
was credible.
Page 19 of 45
Accep
ted
Man
uscr
ipt
19
Next, we tried to find out the mechanisms that lead to MCR during the 2D to
3D transitioning culture of MCF-7 cells. It is well-known that efflux pumps are the
main causes to drug resistance. The gene expressions of three MCR-related efflux
pumps were assayed; only the mdr1 gene was significantly increased in a
time-dependent manner during culture (Fig 4A). To confirm this result, the protein
expression and functional activities of P-gp were examined, which conclusively
demonstrated high P-gp expression levels in MCF-7 MCLs (Fig 4B-D). These
observations were similar to our previous studies in that ADR induced MCF-7 cell
resistance through the up-regulation of P-gp [34]. However, in our present study,
MCF-7 MCLs were not treated with any drugs, and the increase in P-gp expression
was attributed to the 2D to 3D shift of the culture structure. Pusch et al. [35] also
observed increased P-gp expressions in 3D cultures of intestinal Caco-2 cells.
However, the specific mechanisms were not elucidated.
In our present study, G2/M arrest was observed during the growth of the MCF-7
MCLs (Fig 2D). Emerging evidence has suggested that G2/M arrest could lead to
cancer cell resistance [36-38]. Therefore, we attempted to link G2/M arrest to the
increase of P-gp in MCF-7 MCLs. The expression of Chk2, a controller of G2 arrest,
was found to have significantly increased over time in the MCLs (Fig 5A), especially
on the 14th day (Fig 5B). Chk2 has been reported to phosphorylate p53 to stabilize
p53 [39]. p53 has been described as indispensable for enhanced NF-κB transcriptional
activity [40]. The role of NF-κB in regulating P-gp expression in MCF-7 cells has
been demonstrated in our previous studies [34]. In consideration of these reports, p53
and NF-κB p65 expressions were detected for the MCF-7 MCLs. The results revealed
that the MCF-7 MCL cultures elevated p53 expression and increased p65 expression
in the nuclei (Fig 5A). Accordingly, we hypothesized that G2/M arrest caused the
Page 20 of 45
Accep
ted
Man
uscr
ipt
20
activation of Chk2, which subsequently, increased p53 and promoted p65
accumulation within the nuclei, and finally up-regulated P-gp expression. To confirm
our hypothesis, a Chk2 inhibitor AZD7762 was applied to MCF-7 MCLs to interfere
with G2/M arrest. As anticipated, Chk2, p-Chk2, p53, and p65 expressions
significantly decreased (Fig 5C). More importantly, the initially high expression of
P-gp was also markedly down-regulated (Fig 5D and 5E). Furthermore, the p53
activator Nutlin-3 was found to reverse the down-regulation of p53 and p65 caused by
AZD7762 (Fig 5F), which indicated this pathway was p53-dependent. These data
suggested that P-gp expression during the growth of MCF-7 MCLs was up-regulated
through the Chk2/p53/NF-κB pathway.
In this study, MCF-7 MCLs were used as in vitro models to analyze the
penetration kinetics of ADR to mimic tumor masses in vivo. Due to the different P-gp
expressions when MCF-7 MCLs were cultured for different days, MCF-7 monolayers
and MCLs of 10 and 14 days were chosen as low, medium and high P-gp expression
models to compare the penetration kinetics of ADR and elucidate the influence of
P-gp on drug penetration.
On the one hand, we investigated the different penetration kinetics of ADR in
different cell models. The penetration kinetics of ADR in MCF-7 MCLs of 10 days
were similar to those in MCF-7 monolayers, but were significantly lower than those in
MCF-7 MCLs of 14 days (Fig 6A-C). It was assumed that the penetration kinetics
was determined by two factors: the blocking effect due to the thickness of the
multilayer, and a delivery effect from the P-gp efflux. During the growth of MCLs,
the blocking and delivery effects of P-gp were enhanced. When the MCLs were
cultured for 10 days, these two effects were equivalent, i.e., the “net effect” was zero,
and thus, the penetration kinetics were similar to those in monolayers. When MCLs
Page 21 of 45
Accep
ted
Man
uscr
ipt
21
were cultured for 14 days, the delivery effect from the P-gp was greater than the
blocking effect, and the “net effect” was a delivery effect. Other reasons, such as lack
of oxygen and glucose, may also contribute to the “net effect” [16].
On the other hand, the P-gp inhibitor did not affect the penetration kinetics or
the accumulation of ADR in the MCF-7 monolayer due to the low basal P-gp
expression levels (Fig 6A). However, in the MCF-7 MCLs, the P-gp inhibitor
decreased drug penetration across the MCLs, increased the drug retention within the
cells (Fig 6C and 6D), and further promoted the distribution of ADR across the MCLs
as indicated in the cryosections of MCLs (Fig 6E). This action of the P-gp inhibitor
could be attributed to the high P-gp expression in the MCLs (Fig 4C). The fluorescent
intensity of ADR declined at a 20 μm distance from the top of the MCLs. In the
presence of the P-gp inhibitor, the intensity remained until a 30 μm distance from the
top of the MCLs (Fig 6F), which directly increased the AUC of ADR throughout the
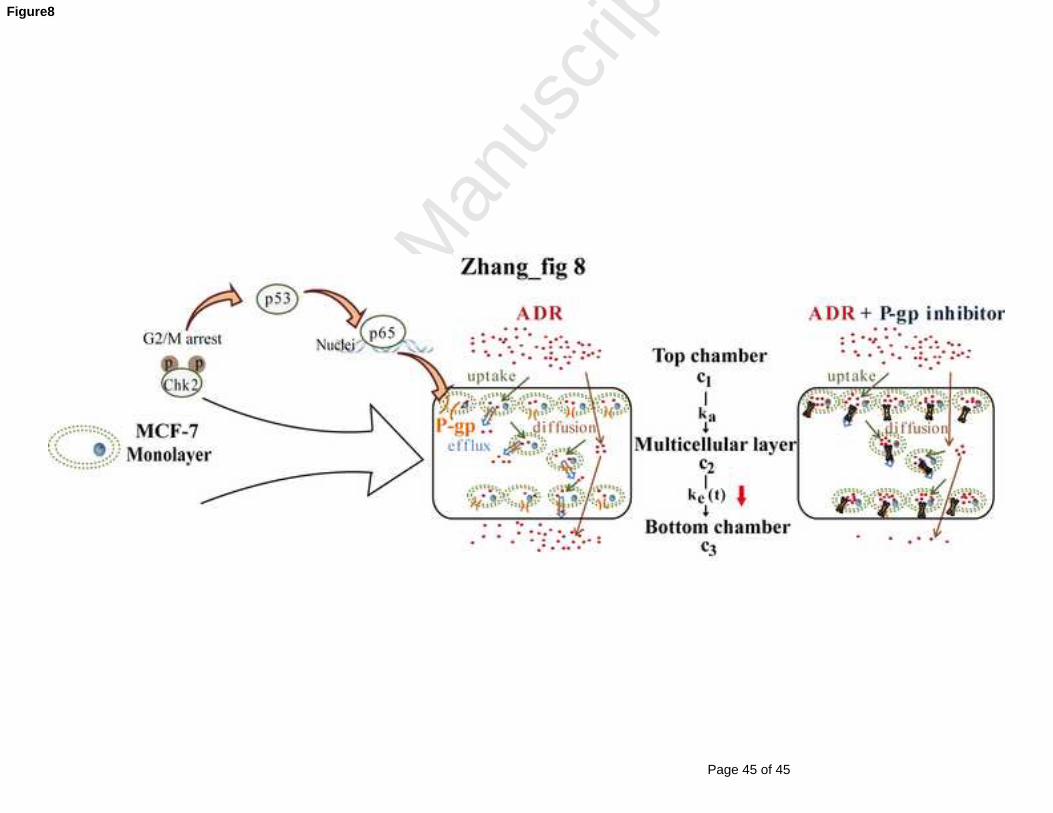
MCLs (Fig 6G). It was speculated that the P-gp aided ADR delivery: ADR entered
the cell by diffusion and was then extruded out of cell by P-gp; subsequently, ADR
was retained in the intercellular space and then diffused into the next cell. This
delivery cycle repeated until ADR reached the bottom of the MCLs. An alternative
mechanism suggests that ADR directly travels to the bottom of the MCLs after
extruding out of a cell into the intercellular space (Fig 8). The drug did not have the
opportunity to interact with its intracellular target nuclei; this may be the reason for
the development of MCR in tumor masses [41, 42]. Hence, blockaded P-gp activity
prevented the intercellular delivery of ADR to the bottom of the MCLs. This
promoted intracellular ADR retention which enabled longer ADR treatment of the
tumor cells. This situation was confirmed in MCF-7 xenografted nude mice in vivo. A
significant promotion of ADR distribution from the outer to inner tumor mass after
Page 22 of 45
Accep
ted
Man
uscr
ipt
22
using the P-gp inhibitor was observed. The P-gp inhibitor helped ADR residing within
the cells from the periphery to the inner core of the tumor mass. The inhibitor also
prevented ADR from being effluxed out of the inner cells and extruded back to the
outer core of the tumor mass through the intercellular spaces. Additionally, the
elevated plasma drug concentration might also contribute to this phenomenon (Fig
7A).
In summary, a 3D-no base and embedded MCF-7 MCL model was successfully
developed for the first time, which provided the quantification of drug penetration
kinetics. During the culture, MCF-7 MCLs gradually became resistant to ADR; this
may be attributed to the up-regulated P-gp expression via the Chk2/p53/NF-κB
pathway. The penetration kinetics of ADR through MCF-7 monolayers and MCLs
were evaluated, compared and mathematically modeled. In combination with
xenografts in vivo, the relationship between the P-gp function and the drug
penetration through the tumor mass was elucidated. Our work provided an applicable
in vitro model to quantitatively evaluate the penetration ability of anti-cancer agents,
and elucidate the role of P-gp in drug delivery through multi-cellular layers. This
model will be helpful for screening new drug candidates / preparations in future and
beneficial for exploring new strategies to overcome MCR in clinical therapy.
Page 23 of 45
Accep
ted
Man
uscr
ipt
23
Acknowledgements
The authors sincerely thank the post-graduates in the Key Lab of Drug Metabolism
and Pharmacokinetics (China Pharmaceutical University, Nanjing, China) for their
kind assistance.
This work was supported by the China National Nature Science Foundation
[No. 81202591]; the Jiangsu Province Nature Science Foundation [No. BK2012354,
BK20131308]; the Fundamental Research Funds for the Central Universities [No.
ZJ13163]; the Jiangsu Province Key Lab of Drug Metabolism and Pharmacokinetics
Projects [No. BM2012012]; the China “Creation of New Drugs” Key Technology
Projects (2015ZX09501001); the Scientific Research and Innovation Project of
College Students of Jiangsu Province [No. CXZZ13_0336]; the Program for New
Century Excellent Talents in University (NCET-11-0740); and the Open Research
Fund of State Key Laboratory of Bioelectronics, Southeast University.

Page 24 of 45
Accep
ted
Man
uscr
ipt
24
Conflicts of interest
The authors declare no conflicts of interest.
Page 25 of 45
Accep
ted
Man
uscr
ipt
25
References
[1] Minchinton AI, Tannock IF. Drug penetration in solid tumours. Nature reviews
Cancer. 2006;6:583-92.
[2] Di Paolo A, Bocci G. Drug distribution in tumors: mechanisms, role in drug
resistance, and methods for modification. Current oncology reports.
2007;9:109-14.
[3] Chitcholtan K, Sykes PH, Evans JJ. The resistance of intracellular mediators to
doxorubicin and cisplatin are distinct in 3D and 2D endometrial cancer. Journal
of translational medicine. 2012;10:38.
[4] Godugu C, Patel AR, Desai U, Andey T, Sams A, Singh M. AlgiMatrix based 3D
cell culture system as an in-vitro tumor model for anticancer studies. PloS one.
2013;8:e53708.
[5] Durand RE, Olive PL. Resistance of tumor cells to chemo- and radiotherapy
modulated by the three-dimensional architecture of solid tumors and spheroids.
Methods in cell biology. 2001;64:211-33.
[6] Solyanik GI. Multifactorial nature of tumor drug resistance. Experimental
oncology. 2010;32:181-5.
[7] Patel KJ, Tannock IF. The influence of P-glycoprotein expression and its
inhibitors on the distribution of doxorubicin in breast tumors. BMC cancer.
2009;9:356.
[8] Carduner L, Picot CR, Leroy-Dudal J, Blay L, Kellouche S, Carreiras F. Cell cycle
arrest or survival signaling through alphav integrins, activation of PKC and
ERK1/2 lead to anoikis resistance of ovarian cancer spheroids. Experimental cell
research. 2014;320:329-42.
Page 26 of 45
Accep
ted
Man
uscr
ipt
26
[9] Evans CJ, Phillips RM, Jones PF, Loadman PM, Sleeman BD, Twelves CJ, et al.
A mathematical model of doxorubicin penetration through multicellular layers.
Journal of theoretical biology. 2009;257:598-608.
[10] Patel KJ, Lee C, Tan Q, Tannock IF. Use of the proton pump inhibitor
pantoprazole to modify the distribution and activity of doxorubicin: a potential
strategy to improve the therapy of solid tumors. Clinical cancer research: an
official journal of the American Association for Cancer Research.
2013;19:6766-76.
[11] Pampaloni F, Reynaud EG, Stelzer EH. The third dimension bridges the gap
between cell culture and live tissue. Nature reviews Molecular cell biology.
2007;8:839-45.
[12] Hirschhaeuser F, Menne H, Dittfeld C, West J, Mueller-Klieser W,
Kunz-Schughart LA. Multicellular tumor spheroids: an underestimated tool is
catching up again. Journal of biotechnology. 2010;148:3-15.
[13] Friedrich J, Seidel C, Ebner R, Kunz-Schughart LA. Spheroid-based drug screen:
considerations and practical approach. Nature protocols. 2009;4:309-24.
[14] Li Q, Chen C, Kapadia A, Zhou Q, Harper MK, Schaack J, et al. 3D models of
epithelial-mesenchymal transition in breast cancer metastasis: high-throughput
screening assay development, validation, and pilot screen. Journal of
biomolecular screening. 2011;16:141-54.
[15] Reid BG, Jerjian T, Patel P, Zhou Q, Yoo BH, Kabos P, et al. Live multicellular
tumor spheroid models for high-content imaging and screening in cancer drug
discovery. Current chemical genomics and translational medicine. 2014;8:27-35.
Page 27 of 45
Accep
ted
Man
uscr
ipt
27
[16] Kyle AH, Huxham LA, Chiam AS, Sim DH, Minchinton AI. Direct assessment
of drug penetration into tissue using a novel application of three-dimensional cell
culture. Cancer research. 2004;64:6304-9.
[17] Hicks KO, Pruijn FB, Secomb TW, Hay MP, Hsu R, Brown JM, et al. Use of
three-dimensional tissue cultures to model extravascular transport and predict in
vivo activity of hypoxia-targeted anticancer drugs. Journal of the National Cancer
Institute. 2006;98:1118-28.
[18] Choi MS, Kim SH, Kuh HJ. Penetration of paclitaxel and 5-fluorouracil in
multicellular layers of human colorectal cancer cells. Oncology reports.
2011;25:863-70.
[19] Zhang J, Zhou F, Wu X, Zhang X, Chen Y, Zha BS, et al. Cellular
pharmacokinetic mechanisms of adriamycin resistance and its modulation by
20(S)-ginsenoside Rh2 in MCF-7/Adr cells. British journal of pharmacology.
2012;165:120-34.
[20] Li L, Lu Y. Optimizing a 3D Culture System to Study the Interaction between
Epithelial Breast Cancer and Its Surrounding Fibroblasts. Journal of Cancer.
2011;2:458-66.
[21] D'Argenio D, Schumitzky A, Wang X. ADAPT 5 User’s Guide:
Pharmacokinetic/Pharmacodynamic Systems Analysis Software. Los Angeles,
CA Biomedical Simulations Resource; 2009.
[22] Zhang J, Zhou F, Wu X, Gu Y, Ai H, Zheng Y, et al. 20(S)-ginsenoside Rh2
noncompetitively inhibits P-glycoprotein in vitro and in vivo: a case for
herb-drug interactions. Drug metabolism and disposition: the biological fate of
chemicals. 2010;38:2179-87.
Page 28 of 45
Accep
ted
Man
uscr
ipt
28
[23] Kim HG, Hien TT, Han EH, Hwang YP, Choi JH, Kang KW, et al. Metformin
inhibits P-glycoprotein expression via the NF-kappaB pathway and CRE
transcriptional activity through AMPK activation. British journal of
pharmacology. 2011;162:1096-108.
[24] Kanagasabai R, Krishnamurthy K, Druhan LJ, Ilangovan G. Forced expression of
heat shock protein 27 (Hsp27) reverses P-glycoprotein (ABCB1)-mediated drug
efflux and MDR1 gene expression in Adriamycin-resistant human breast cancer
cells. The Journal of biological chemistry. 2011;286:33289-300.
[25] LaBarbera DV, Reid BG, Yoo BH. The multicellular tumor spheroid model for
high-throughput cancer drug discovery. Expert opinion on drug discovery.
2012;7:819-30.
[26] Breslin S, O'Driscoll L. Three-dimensional cell culture: the missing link in drug
discovery. Drug discovery today. 2013;18:240-9.
[27] Lee JM, Mhawech-Fauceglia P, Lee N, Parsanian LC, Lin YG, Gayther SA, et al.
A three-dimensional microenvironment alters protein expression and
chemosensitivity of epithelial ovarian cancer cells in vitro. Laboratory
investigation; a journal of technical methods and pathology. 2013;93:528-42.
[28] Kim SH, Kuh HJ, Dass CR. The reciprocal interaction: chemotherapy and tumor
microenvironment. Current drug discovery technologies. 2011;8:102-6.
[29] Doublier S, Belisario DC, Polimeni M, Annaratone L, Riganti C, Allia E, et al.
HIF-1 activation induces doxorubicin resistance in MCF7 3-D spheroids via
P-glycoprotein expression: a potential model of the chemo-resistance of invasive
micropapillary carcinoma of the breast. BMC cancer. 2012;12:4.
Page 29 of 45
Accep
ted
Man
uscr
ipt
29
[30] Yip D, Cho CH. A multicellular 3D heterospheroid model of liver tumor and
stromal cells in collagen gel for anti-cancer drug testing. Biochemical and
biophysical research communications. 2013;433:327-32.
[31] Hicks KO, Siim BG, Jaiswal JK, Pruijn FB, Fraser AM, Patel R, et al.
Pharmacokinetic/pharmacodynamic modeling identifies SN30000 and SN29751
as tirapazamine analogues with improved tissue penetration and hypoxic cell
killing in tumors. Clinical cancer research: an official journal of the American
Association for Cancer Research. 2010;16:4946-57.
[32] Mellor HR, Callaghan R. Accumulation and distribution of doxorubicin in
tumour spheroids: the influence of acidity and expression of P-glycoprotein.
Cancer chemotherapy and pharmacology. 2011;68:1179-90.
[33] Oshikata A, Matsushita T, Ueoka R. Enhancement of drug efflux activity via
MDR1 protein by spheroid culture of human hepatic cancer cells. Journal of
bioscience and bioengineering. 2011;111:590-3.
[34] Zhang J, Lu M, Zhou F, Sun H, Hao G, Wu X, et al. Key role of nuclear
factor-kappaB in the cellular pharmacokinetics of adriamycin in MCF-7/Adr cells:
the potential mechanism for synergy with 20(S)-ginsenoside Rh2. Drug
metabolism and disposition: the biological fate of chemicals. 2012;40:1900-8.
[35] Pusch J, Votteler M, Gohler S, Engl J, Hampel M, Walles H, et al. The
physiological performance of a three-dimensional model that mimics the
microenvironment of the small intestine. Biomaterials. 2011;32:7469-78.
[36] Slupianek A, Hoser G, Majsterek I, Bronisz A, Malecki M, Blasiak J, et al.
Fusion tyrosine kinases induce drug resistance by stimulation of
homology-dependent recombination repair, prolongation of G(2)/M phase, and
protection from apoptosis. Molecular and cellular biology. 2002;22:4189-201.
Page 30 of 45
Accep
ted
Man
uscr
ipt
30
[37] Bao S, Wu Q, McLendon RE, Hao Y, Shi Q, Hjelmeland AB, et al. Glioma stem
cells promote radioresistance by preferential activation of the DNA damage
response. Nature. 2006;444:756-60.
[38] Cavelier C, Didier C, Prade N, Mansat-De Mas V, Manenti S, Recher C, et al.
Constitutive activation of the DNA damage signaling pathway in acute myeloid
leukemia with complex karyotype: potential importance for checkpoint targeting
therapy. Cancer research. 2009;69:8652-61.
[39] Hirao A, Kong YY, Matsuoka S, Wakeham A, Ruland J, Yoshida H, et al. DNA
damage-induced activation of p53 by the checkpoint kinase Chk2. Science.
2000;287:1824-7.
[40] Schneider G, Henrich A, Greiner G, Wolf V, Lovas A, Wieczorek M, et al. Cross
talk between stimulated NF-kappaB and the tumor suppressor p53. Oncogene.
2010;29:2795-806.
[41] Durand RE. The influence of microenvironmental factors during cancer therapy.
In Vivo. 1994;8:691-702.
[42] Primeau AJ, Rendon A, Hedley D, Lilge L, Tannock IF. The distribution of the
anticancer drug Doxorubicin in relation to blood vessels in solid tumors. Clinical
cancer research: an official journal of the American Association for Cancer
Research. 2005;11:8782-8.
Page 31 of 45
Accep
ted
Man
uscr
ipt
31
Tables
Table 1. Features of MCF-7 MCL during culture.
** p<0.01, *** p<0.001 compared with 3-day group.
Culture time
(days)
MCL thickness
(μm)
Packing density
(%)
Cell
layers
Ki-67 positive
expression (%)
3 11.67±1.39 34±6.8 3-4 73±3.2
5 16.59±1.75*** 32±5.0 5-6 80±4.5
8 28.98±1.58*** 32±3.0 6-8 69±5.5
10 34.50±0.87*** 35±3.9 6-9 83±6.1
14 40.17±3.61*** 33±3.6 8-12 89±3.5**
Page 32 of 45
Accep
ted
Man
uscr
ipt
32
Table 2. Kinetics parameters of ADR penetration through MCF-7 MCL with or
without LY335979
* p<0.05 between combined treatment with LY335979 group versus combined
treatment with 0.1% DMSO.
Kinetics
Parameters
0.1% DMSO
group
LY335979
group
F (×10-3, /) 1.36±0.31 1.18±0.22
ka (h-1) 0.033±0.008 0.036±0.007
ke-base ( h-1) 0.022±0.005 0.019±0.005
ke-add ( h-1) 0.21±0.03 0.13±0.03*
ke-induct ( h-1) 0.33±0.04 0.24±0.03*
Page 33 of 45
Accep
ted
Man
uscr
ipt
33
Figure legend
Fig 1 Schematic presentation of an integrated mathematical model describing the
penetration kinetics of ADR through MCLs. c1, c2, and c3 are the concentrations of
ADR in top chamber, multi-cellular layer and bottom chamber, respectively, and ka
and ke are the absorption and elimination rate constants.
Fig 2 Morphology and proliferative features of MCF-7 MCL during the culture time.
MCF-7 cells suspended in serum-free medium containing 6% matrigel were seeded
onto the uncoated cell culture inserts, placed into a 24-well plate and cultured for 3, 5,
8, 10, and 14 days. (A) H&E staining of MCF-7 MCL. (B) Ki-67
immunohistochemical staining of MCF-7 MCL (scale bars represent 25 μm). (C) PI
staining was used to analyze the cell cycle distribution. (D) Percentages of cells in
G2/M phase. Data are presented as means ± S.E., * p<0.05, ** p<0.01 compared with
3-day group.
Fig 3 ADR resistance during the growth of MCF-7 MCL. Cell viability was
determined by MTT assay after cells were exposed to various concentrations of ADR
for 72 h, and IC50 values were calculated. Data are expressed as means ± S.E. of three
independent experiments.
Fig 4 Gene, protein and function levels of P-gp during the growth of MCF-7 MCL. (A)
Relative gene expressions of mdr1, bcrp, and mrp2 by qPCR analysis in MCF-7
monolayer and MCL. Gene expressions were normalized to the housekeeping gene
β-actin, and fold increases was calculated as 3D level/2D level for each gene at
designated culture time. (B) P-gp protein levels were analyzed and quantified by flow
Page 34 of 45
Accep
ted
Man
uscr
ipt
34
cytometry using FITC-conjugated anti-P-gp polyclonal antibody. (C) Analysis of
mean fluorescence intensity of P-gp. (D) Effects of LY335979 on ADR accumulation
in MCF-7 monolayer and MCL. Data are presented as means ± S.E., * p<0.05, **
p<0.01, *** p<0.001 versus 2D group. § p<0.05 between 14-day versus 10-day of
MCL culture. # p<0.05 between combined treatment with LY335979 group versus
combined treatment with 0.1% DMSO for the same MCL culture time.
Fig 5 P-gp up-regulation during the growth of MCL through Chk2/p53/NF-κB
pathway. (A) Western blot assay was performed to detect the expression of p-Chk2,
Chk2, p53 and p65 from whole cell, nuclear and cytoplasmic extracts at designated
culture times. (B) Analysis of protein expression on the 14th day of MCL culture. (C)
Western blot assay was performed to detect the related protein expression on the 14th
day of MCL culture treated with 200 nM and 500 nM AZD7762 for 24 h. (D) P-gp
protein levels of MCF-7 MCL (14-day) treated with 200 nM and 500 nM AZD7762
for 24 h were analyzed and quantified by flow cytometry using FITC-conjugated
anti-P-gp polyclonal antibody. (E) Analysis of mean fluorescence intensity of P-gp. (F)
14th day of MCL culture were pretreated with or without 10 μM Nutlin-3 and then
incubated with 500 nM AZD7762 for 24 h. Western blot was performed to assay the
expression of proteins. Data are presented as means ± S.E., * p<0.05, ** p<0.01, ***
p<0.001.
Fig 6 ADR penetration kinetics evaluated on MCF-7 monolayer and MCL. ADR (10
μM) was applied to the top chamber of the cell culture insert, and samples were
collected at the bottom chamber for MCF-7 monolayer (A), MCL cultured for 10 days
(B) and 14 days (C) in the absence or presence of P-gp inhibitor LY335979. (D)
Page 35 of 45
Accep
ted
Man
uscr
ipt
35
Intracellular retention of ADR within the cells constituting the monolayer or MCL on
the cell culture inserts. (E) Fluorescence imaging of the cryosections of the MCL cells
cultured for 14 days (scale bars represent 40 μm). (F) Plot of fluorescent intensities
against the distance from the top to the bottom of the cell culture insert. (G) AUC of
the intensity-distance curves. Predicted concentration–time curves for ADR
penetration evaluated on MCF-7 monolayer (H) and MCLs cultured for 10 days (I)
and 14 days (J) in the absence or presence of P-gp inhibitor LY335979. Observations
are reported as means ± S.E. (n = 3), and the lines are depicted using the parameters
obtained from the original data. Data are presented as means ± S.E., * p<0.05, **
p<0.01, *** p<0.001 between combined treatment with LY335979 group versus
combined treatment with 0.1% DMSO.
Fig 7 ADR penetration in MCF-7 xenografted nude mice. MCF-7 xenografted nude
mice were administered ADR (30 mg·kg-1, i.v.) in the presence or absence of P-gp
inhibitor LY335979 (25 mg·kg-1, i.v.). 3 h later, concentrations of ADR in plasma (A)
and in tumor (B) were determined. For observation and quantification of ADR in
cryosections of the tumor, cryosections were prepared according to a diagram (C):
with the tumor edge set as 0, the tumor was divided into peripheral region (0-200 μm),
intermediate region (200-400 μm) and central region (400-600 μm). Representative
images (scale bars represent 40 μm) for each region in the absence or presence of
P-gp inhibitor LY335979 was recorded (D), the fluorescence intensity against the
distance was plotted (E), and AUC was calculated (F). Data are presented as means ±
S.E., * p<0.05, ** p<0.01 between ADR and LY335979 combined treatment group
versus ADR treatment group.

Page 36 of 45
Accep
ted
Man
uscr
ipt
36
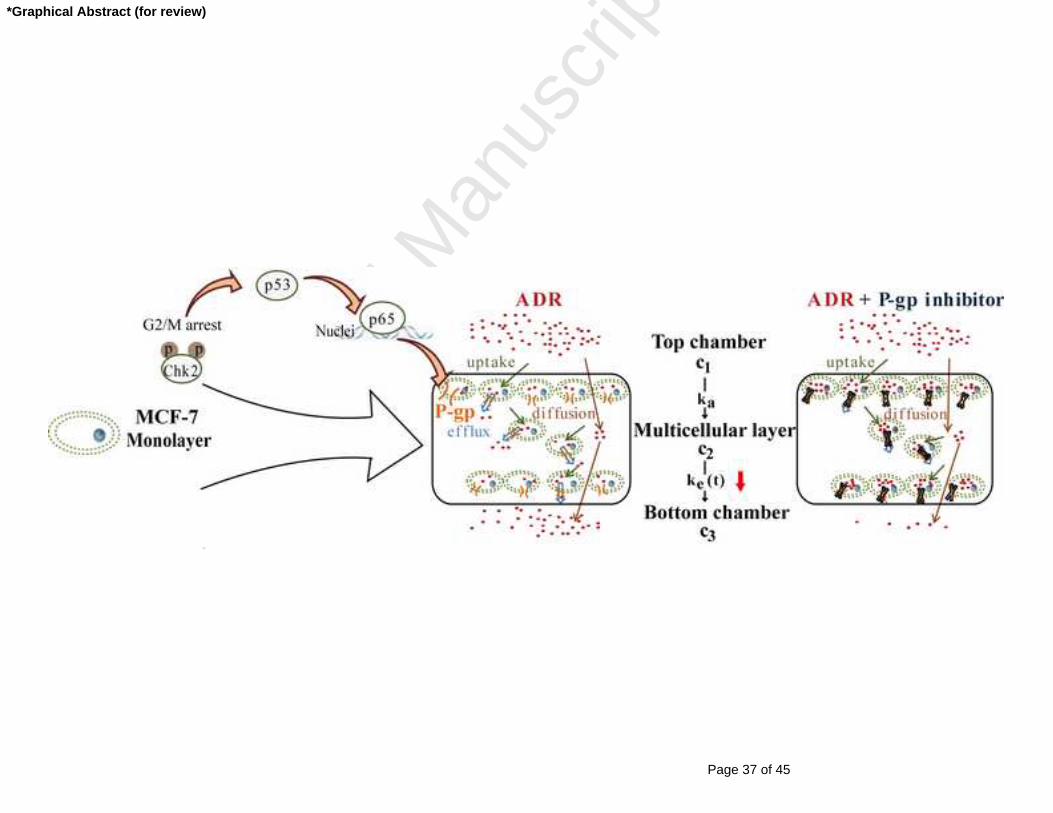
Fig 8 Schematic representation of proposed cell signal transduction pathways for P-gp
up-regulation through 2D to 3D culture and the potential mechanisms for penetration
kinetics changes of ADR when combined treatment with P-gp inhibitor.
Page 37 of 45
Accep
ted
Man
uscr
ipt
*Graphical Abstract (for review)
Page 38 of 45
Accep
ted
Man
uscr
ipt
Figure1
Page 39 of 45
Accep
ted
Man
uscr
ipt
Figure2
Page 40 of 45
Accep
ted
Man
uscr
ipt
Figure3
Page 41 of 45
Accep
ted
Man
uscr
ipt
Figure4
Page 42 of 45
Accep
ted
Man
uscr
ipt
Figure5
Page 43 of 45
Accep
ted
Man
uscr
ipt
Figure6
Page 44 of 45
Accep
ted
Man
uscr
ipt
Figure7
Page 45 of 45
Accep
ted
Man
uscr
ipt
Figure8


