Embed Size (px)
Citation preview

EUROPEAN NETWORK OF ECONOMIC POLICY RESEARCH INSTITUTES
WORKING PAPER NO. 49/FEBRUARY 2007
ALTERNATIVE TAX-BENEFIT STRATEGIES TO SUPPORT CHILDREN IN THE EUROPEAN UNION: RECENT REFORMS IN AUSTRIA, SPAIN AND THE UK
HORACIO LEVY CHRISTINE LIETZ
HOLLY SUTHERLAND
ENEPRI Working Papers constitute dissemination to a wider public of research undertaken and already published by ENEPRI partner member institutes on their own account. This paper was originally published by the Institute for Advanced Studies (IHS) in Vienna as No. 185 in its Economic Series, dated February 2006. It is reprinted by ENEPRI with kind permission of IHS. The views expressed are attributable only to the authors and not to any institution with which they are associated.
ISBN-13: 978-92-9079-689-3 AVAILABLE FOR FREE DOWNLOADING FROM THE ENEPRI WEBSITE (HTTP://WWW.ENEPRI.ORG)
OR THE CEPS WEBSITE (WWW.CEPS.BE) © COPYRIGHT 2007, HORACIO LEVY, CHRISTINE LIETZ AND HOLLY SUTHERLAND

Contact: Christine Lietz Department of Economics and Finance Institute for Advanced Studies Stumpergasse 56, 1060 Vienna
: +43/1/599 91-252 fax: +43/1/599 91-163 email: [email protected] and University of Cambridge Horacio Levy University of Essex email: [email protected] Holly Sutherland University of Essex and DIW Berlin email: [email protected]
Founded in 1963 by two prominent Austrians living in exile – the sociologist Paul F. Lazarsfeld and the economist Oskar Morgenstern – with the financial support from the Ford Foundation, the Austrian Federal Ministry of Education and the City of Vienna, the Institute for Advanced Studies (IHS) is the firstinstitution for postgraduate education and research in economics and the social sciences in Austria. The Economics Series presents research done at the Department of Economics and Finance andaims to share “work in progress” in a timely way before formal publication. As usual, authors bear fullresponsibility for the content of their contributions. Das Institut für Höhere Studien (IHS) wurde im Jahr 1963 von zwei prominenten Exilösterreichern –dem Soziologen Paul F. Lazarsfeld und dem Ökonomen Oskar Morgenstern – mit Hilfe der Ford-Stiftung, des Österreichischen Bundesministeriums für Unterricht und der Stadt Wien gegründet und ist somit die erste nachuniversitäre Lehr- und Forschungsstätte für die Sozial- und Wirtschafts-wissenschaften in Österreich. Die Reihe Ökonomie bietet Einblick in die Forschungsarbeit der Abteilung für Ökonomie und Finanzwirtschaft und verfolgt das Ziel, abteilungsinterneDiskussionsbeiträge einer breiteren fachinternen Öffentlichkeit zugänglich zu machen. Die inhaltlicheVerantwortung für die veröffentlichten Beiträge liegt bei den Autoren und Autorinnen.

Abstract
We compare three EU countries that have recently experienced substantial but very different reforms of their family support systems: Austria, Spain and the UK. The structure of these systems is different: Austria emphases universal benefits, Spain tax concessions and the UK means-tested benefits. First the paper compares the distributional implications of these three approaches. The recent reforms have reinforced existing structures while increasing the amount of spending for children. The second step is to ask: What would have happened if these countries had transformed the architecture of their systems in either of the other two directions? We use EUROMOD, the European tax-benefit microsimulation model that is designed for making cross-country comparisons and answering “what if” questions such as these. We find that the three factors that can be distinguished – the level of spending, its structure, and the way it impacts in a national context – are all important to varying degrees.
Keywords Children, European Union, policy reform, microsimulation
JEL Classification C8, I3
Comments This paper presents a further analysis of tax and transfers systems in support of child poverty reductioncarried out in the context of the UNICEF Innocenti Report Card 6 on Child Poverty in Rich Countries (2005). It is also published as Innocenti Working Paper 2005-07 and as EUROMOD Working Paper EM10/05. The research reported here was funded in part by the Nuffield Foundation and supported byactivities within the MICRESA (Micro-level Analysis of the European Social Agenda) project, financedby the Improving Human Potential programme of the European Commission (SERD-2001-00099). The authors are indebted to Martin Evans, Daniela Mantovani, Magda Mercader and Eva Jesperson andher colleagues at the Innocenti Research Centre for helpful comments as well as to all the past andcurrent members of the EUROMOD consortium. However, the results, conclusions and views that areexpressed are the sole responsibility of the authors. In particular, this applies to the interpretation of EUROMOD results and any errors in its use. EUROMOD is continually being improved and updated,and the results presented here are the best available at the time of writing.
Contents
Summary 1
Introduction 2
1 The economic well-being of children in the EU 3
2 Policies to support families with children in 1998 and 2003 7 2.1 Austria ...................................................................................................................... 7 2.2 Spain ...................................................................................................................... 11 2.3 United Kingdom ..................................................................................................... 14
3 Method, Data, Assumptions and Definitions 18
4 The impact of actual reforms 1998-2003 21
5 The effects of the three systems in Austria, Spain and the United Kingdom 24
6 The effects of the three policy strategies on child poverty 30
7 Gainers and losers from alternative systems 32
8 Concluding remarks 33
References 36


1
Summary:
We compare three EU countries that have recently experienced substantial but very different reforms of their systems to support families with children: Austria, Spain and the United Kingdom. The structure of these systems is different: Austria gives emphasis to universal benefits, Spain to tax concessions and the United Kingdom to means-tested benefits. As a first step the paper compares the distributional implications of these three approaches. The recent reforms have reinforced these existing structures while increasing the amount of public resources directed towards children. The second step is to address the question whether the chosen strategies are the best for each country. What would have happened if instead of reinforcing the existing types of policies these countries had completely transformed the architecture of their systems in either of the other two directions?
We use EUROMOD - the European tax-benefit microsimulation model that is designed for making cross-country comparisons and for answering “what if” questions such as these - to explore the effects of alternative budget-neutral reforms. In particular, in addition to assessing the effects of countries’ actual child related reforms from 1998 to 2003, we simulate the substitution (‘swap’) of child related benefits and tax concessions from one country to another. The changes in household disposable income resulting from these reforms are used to assess their impact on the position of children in the income distribution as a whole, the proportions gaining and losing and the effects on child poverty.
The analysis of the 1998 and 2003 systems reveal that, in real terms, the average spending per child increased by 31 percent in Austria (from 169 to 220 euro per month), 150 percent in Spain (from 13 to 34 euro), and 71 percent in the UK (102 to 174 euro). In Austria and the UK the increase in spending per child is relatively evenly spread over the income distribution, with a slightly lower increase at the top. In Spain the rise in per child spending in the two bottom deciles is negligible, whereas children in the top quintile receive on average more than ten times as much under the 2003 rules as under the 1998 rules. Child poverty rates fall in all countries, but the reductions are particularly significant in the UK (from 32 to 20 percent) and Austria (12 to 9 percent).
The swap of 2003 child policies allows us to draw some conclusions about the three systems regardless of the country in which they are implemented. On vertical equity grounds, UK policies are the most successful at reducing child poverty in all three countries and using a range of proportions of the median as poverty thresholds. In terms of horizontal equity, the Austrian system generates the highest redistribution from childless individuals to families with children and guarantees, in all countries, the right to a similar level of protection for all children regardless their parent’s income position. On the other hand, with a low expenditure level and a pro-rich distribution, the Spanish policies can hardly meet any equity objective.
While there are some important aspects that have not been considered in this study, for example the effect of the alternative systems on parental work incentives and on benefit take-up rates, and the role of in-kind benefits, this study demonstrates the potential of comparing systems of support by “swapping” them between countries. This method using microsimulation allows us to distinguish between the effects of level of spending, the relative importance of policy structure and design, and the differential impacts of policies in particular national contexts.

2
Introduction
Social, demographic and economic changes in recent years have modified the profile of
the groups facing higher risks of poverty and social exclusion. Most empirical evidence
shows that children are one of these groups. A recent study carried out by UNICEF states
that “the proportion of children living in poverty has risen in a majority of the world’s
developed economies” (UNICEF, 2005). These findings underpin the growing concern
about the need to support families with children.
Following that concern, many European Union member states have recently implemented
reforms. In some cases the expenditure level has increased considerably and some
improvements in indicators of the economic well-being of children have been achieved or
are anticipated. However, there are obviously limits to the amount of resources that
governments can target on children. Hence, it is essential to understand the structure of
these reforms and to establish whether they achieve their objectives and that better
alternatives are not available.
In this paper we analyse and compare three EU countries that have recently experienced
substantial but very different reforms of their systems to support families with children:
Austria, Spain and the United Kingdom. The structure of these systems is very different:
Austria gives emphasis to universal benefits, Spain to tax concessions and the United
Kingdom to means-tested benefits. Basically, the recent reforms have reinforced these
structures in each country while increasing the amount of public resources directed
towards children. However, are the chosen strategies the most adequate for each
country? What would have happened to the economic well-being of children if instead of
reinforcing the existing types of policies these countries had completely transformed the
architecture of their systems in another direction? More concretely, what would be the
effect on child poverty and on income distribution, and who would be the gainers and
losers if (for example) Austria had adopted the Spanish system, while spending the same
overall level as currently in Austria? Tax-benefit microsimulation models are designed
precisely to provide us with evidence to answer this type of “what if” question. We use
EUROMOD, a tax-benefit microsimulation model that covers all 15 “old” EU countries and
is designed for making cross-country comparisons.2 It is based on samples of households
that are representative at the national level for each country. Here we simulate and
compare the effects of the 1998 and 2003 tax-benefit systems on children’s household
2 EUROMOD currently covers the 15 Member States included in the EU before May 2004.

3
incomes. Then, we swap the parts of the 2003 systems related to children from one
country to another and reassess the impact on children after these ‘alternative’ reforms.
The paper is organized as follows. Section 1 addresses some of the issues and recent
trends that affect the economic well-being of children in the EU. Section 2 describes the
policies to support families with children and their recent reforms in Austria, Spain and
the United Kingdom. Section 3 presents some methodological issues related to the use of
the microsimulation model EUROMOD; it explains how simulations were carried out, as
well as some of the key definitions and assumptions that were used. Section 4 assesses
the impact of each reform within its country, while sections 5, 6 and 7 explore the effects
of exchanging child policies across the income distribution and on child poverty, and
examine who gains and who loses from the “borrowed” policies. Finally, section 8 offers
some concluding comments.
1 The economic well-being of children in the EU
Economic indicators of living standards, in particular household income, reveal just one of
the dimensions that affect the well-being of children. Nevertheless, there is increasing
evidence about a significant correlation (not necessarily causality) between income
poverty and problems in other dimensions of well-being, such as higher risk of education
failure, poor health, teenage pregnancy, abuse, criminal and anti-social behaviour.3
Three elements that mainly determine the economic well-being of children have been
subject to considerable change in recent years: social trends, labour market conditions
and public intervention (UNICEF, 2005).
Changes in social and cultural values and practices are transforming social needs and the
type of groups that face higher risks of poverty and social exclusion. The increasing
number of people living in ‘non traditional’ households, decline in fertility rates,
immigration, and increase in the average age and educational level of parents are
changing the patterns of well-being and the risk of poverty among children. Of course not
all of these changes pull child well-being in the wrong or in the same direction. For
example, Chen and Corak (2005) estimate that child poverty is 0.4 percentage points
lower due to the fact that in average children now live with older parents. On the other
hand, child poverty is 0.7 percentage points higher because of the increase in the
proportion of children living with only one parent. These changes also affect the cost of
policies targeted to support children. Adam, Brewer and Reed (2002) calculate that if the
3 Here and henceforth we use “poverty” to refer to the risk of relative income poverty. For a review of the principles of measuring poverty and, in particular, relative income poverty analysis in developed countries, see Atkinson (1998) and Corak (2005), among others.

4
characteristics of British families in 2003 were the same as in 1978, the average
expenditure on child support per child would be 13 percent lower in 2003 than in fact it
was.
Children’s economic well-being is also affected by the employment status of their
parents. In the past, the ‘job for a lifetime’ and the ‘male breadwinner model’ assumed
that the working male was able to earn enough to maintain his family. Increasing female
participation, labour market instability, wider wage gap between qualified and unqualified
workers, and migration of low-skilled jobs have removed the labour market foundations
of this model (Esping-Andersen, 1999). The presence of second earner in the household
has become the norm in many countries, and decisive in fully covering family economic
needs. Chen and Corak (2005) reveal that labour market changes, in particular the
increase in the employment rate and earnings of women with children, have contributed
in the fall of child poverty in the US and the UK. In that sense, the reconciliation between
work and family life has become a growing concern. This reconciliation problem
addresses a very relevant gender issue, as women are generally the most affected. Table
1 shows that in all EU-15 countries but Denmark the employment rate of women aged
20-49 is considerably lower if they have children aged under 12. In contrast, the
employment rate of men in the same age group is higher if they have children.
Table 1. Total and part-time employment rates for women and men in 2003
Women aged 20 to 49 Men aged 20 to 49
Without children With children Without children With children
Total Part-time Total Part-time Total Part-time Total Part-time Austria 83.4 16.8 72.1 32.3 91.5 2.3 95.6 1.5
Belgium 74.6 21.8 67.5 27.2 87.2 4.2 91.7 4.3
Denmark 77.1 : 79.9 : 82.8 : 93.2 :
Finland 77.9 10.2 72.0 7.8 76.6 5.0 92.4 (2.4)
France 76.6 14.1 66.3 17.6 85.4 3.3 91.4 2.5
Germany 79.5 21.3 60.0 35.1 83.1 4.3 89.7 3.0
Greece 56.5 4.9 52.7 6.7 86.8 2.1 96.5 2.4
Ireland : : : : : : : :
Italy 60.4 12.3 49.7 15.2 91.6 3.3 94.0 3.3
Luxembourg 74.8 15.5 59.3 26.1 90.7 : 96.6 (1.6)
Netherlands 81.9 33.0 69.6 54.7 88.6 7.8 93.6 4.2
Portugal 76.6 7.7 76.4 7.2 90.8 2.0 94.6 (1.0)
Spain 61.7 8.7 51.2 9.7 90.0 1.4 93.0 0.9
Sweden : : : : : : : :
United Kingdom 83.2 18.5 61.8 36.2 87.1 3.4 90.9 3.3 : Data not available or not reliable due to a small sample size ( ) Data less reliable due to a small sample size Source: Aliaga (2005)
Finally, government expenditure, particularly social protection, can be a decisive element
in guaranteeing the economic well-being of children when the previous determinants fail
to provide them the resources required to meet their needs. Table 2 shows EUROSTAT

5
estimates of social protection in general, and family benefits in particular, as a proportion
of GDP in 1998 and 2002. The table shows that the expenditure on family support follows
a similar ranking of countries as the overall expenditure on social protection. The main
exceptions are Luxembourg4 and Ireland that spend proportionally more on family
support, and the Netherlands that spends considerably less. In sum, Scandinavian
countries, Luxembourg, Germany and Austria are the countries that spend most on
family support, while Southern countries (except Greece) and the Netherlands spend
least. In recent years, expenditure on family benefits, as proportion of GDP, has
considerably increased in four countries (Austria, Germany, Ireland and Luxembourg),
and substantially fallen in two (Finland and the UK).
Table 2. Expenditure on social protection and family support as a proportion of GDP in 1998 and 2002
Social protection Family support 1998 2002 %pt change 1998 2002 %pt change
Austria 28.5 29.1 0.6 2.7 3.0 0.3 Belgium 27.6 27.8 0.2 2.4 2.2 -0.2 Denmark 30.2 30.0 -0.2 3.8 3.9 0.1 Finland 27.2 26.4 -0.8 3.4 3.0 -0.4 France 30.5 30.6 0.1 2.8 2.7 -0.1 Germany 29.3 30.5 1.2 2.8 3.1 0.3 Greece 24.2 26.6 2.4 1.9 1.8 -0.1 Ireland 15.4 16.0 0.6 1.9 2.4 0.5 Italy 25.0 26.1 1.1 0.9 1.0 0.1 Luxembourg 21.7 22.7 1.0 3.0 3.7 0.7 Netherlands 28.4 28.5 0.1 1.2 1.2 0.0 Portugal 22.1 25.4 3.3 1.0 1.1 0.1 Spain 20.6 20.2 -0.4 0.5 0.5 0.0 Sweden 32.2 32.5 0.3 3.0 3.0 0.0 UK 26.9 27.6 0.7 2.3 1.8 -0.5
Source: Eurostat (2005)
These social protection statistics do not include the value of tax concessions and some
social transfers which are of direct benefit to children but are not categorised as family
support (for example, housing and social assistance benefits). So while, according to this
table, the expenditure on family support in the UK fell by 5 percentage points between
1998 and 2002, in fact the recent reforms have shifted a considerable part of support
from social benefits to tax credits and, overall, family support has risen. This highlights
the difficultly in using a single concept to measure support over time or across
countries.5 In the analysis which follows we focus on elements of both cash benefits and
direct personal taxes which are specifically designed for the support of children and their
families.
4 The relative proportion on social expenditure for Luxembourg is driven, in part, by the high measure of GDP, which is influenced by cross-border workers.
5 Corak, Lietz and Sutherland (2005) consider a range of measures of support for children in cross-national perspective.

6
Both horizontal and vertical equity arguments justify the need for social protection for
families with children. The common horizontal equity argument is the need to
compensate parents for direct and indirect costs of children. Despite the increasing
sophistication in the theoretical and empirical literature on the measurement of the cost
of children since the early work of Rothbarth (1943), there is no clear consensus on the
appropriate methods nor on the value of the estimates.6 Corak, Lietz and Sutherland
(2005) use a pragmatic approach to assess the level of compensation of child-target
policies on the cost of children to families. This consists in comparing the equivalised
income for households with children before and after the presence of children and the net
incomes received by family members due to the presence of children. Their results,
summarized in Figure 1, reveal that there is wide variation on the average proportion of
‘cost of children’ covered by child-contingent state support. This ranges from 54 percent
in Luxembourg and 52 percent in Austria to 11 percent in Greece and Spain.
Figure 1. Percent of income needs due to children covered by child-contingent state support in the EU15, 2001
0.0
10.0
20.0
30.0
40.0
50.0
60.0
LU AT UK BE IR FI GE FR DK SW NL IT PT GR SP
Perc
ent o
f chi
ld n
eeds
cov
ered
by
stat
e su
ppor
t
Source: Corak, Lietz and Sutherland (2005)
In terms of vertical equity, children are less exposed to the debate about being deserving
or undeserving of social protection or the equity-efficiency trade-off. The claim is that
children should be protected from poverty even if childbearing is assumed to be a
deliberate rational decision since children should not face the consequences of parents’
actions. Table 3 shows that, in 2001, the risk of poverty among children was lower than
the poverty risk for the overall population in the Scandinavian countries, Greece and
6 See, among others, Deaton and Muellbauer (1986), Buhman et al (1988), Jenkins and Cowell (1994) and Bradbury (2004).

7
Belgium. On the other hand, the difference between child poverty risk and overall
poverty risk is particularly high in the Southern countries (except Greece), Luxembourg
and the UK. Finally, according to these figures calculated using two different waves of the
European Community Household Panel (ECHP), in recent years child poverty has
decreased in the UK and Sweden and increased in Ireland and Italy.
Table 3. The risk of child poverty and overall poverty in the EU-15, 1999 and 2001.
ECHP 1999 ECHP 2001 Aged 0-15 All Aged 0-15 All
Austria 14 12 13 12 Belgium 12 13 12 13 Denmark 6 11 7 10 Finland 7 11 6 11 France 17 15 18 15 Germany 13 11 14 11 Greece 17 21 18 20 Ireland 21 18 26 21 Italy 22 18 25 19 Luxembourg 19 13 18 12 Netherlands 14 11 16 11 Portugal 26 21 27 20 Spain 25 19 26 19 Sweden 10 9 7 9 UK 29 19 24 17
Sources: Dennis and Guio (2003) and Dennis and Guio (2004). Data on income from the ECHP relate to the year immediately preceding the survey (e.g. 1998 for wave conducted in 1999), whereas the household composition and the socio-demographic characteristics of household members are those registered at the moment of the survey. ECHP 2001 estimates for Denmark are from the Law Model Database and for Sweden from the Income Distribution Survey.
2 Policies to support families with children in 1998 and 2003
This section describes the policies to support families with children in Austria, Spain and
the United Kingdom in 1998 and 2003. This description highlights the policies that are
analysed in the later parts of the paper, i.e., cash benefits and tax concessions explicitly
targeted at families with children.7
2.1 Austria
Austria has one of the most generous systems for the support of children in the European
Union. In fact, Austria comes top in a ranking of ‘child benefit packages’ among 22
industrialized countries (Bradshaw and Finch, 2002). Recalling Table 2, the expenditure
on family and children social benefits as a percentage of GDP (3%) is one of the highest
in the European Union, only below Denmark, Luxembourg and Germany. Support is
mainly provided through universal benefits that are supplemented to especially
vulnerable population groups. Recent reforms have introduced new benefits and changed
7 Other policies which are sensitive to the presence of children in the family but not uniquely targeted at families with children (for instance, social assistance), in-kind benefits, and disability benefits are not included in this analysis.

8
some of the existing ones. These changes have largely reinforced the universal character
of the Austrian system. There is no standard definition of children in Austrian policies.
The conditions under which a person is considered to be a child vary slightly from policy
to policy. In general, most policies define children as people aged under 18, and also
those aged up to 25 (sometimes 26) in education and with personal income below a
certain limit.
In 1998, there were two policies available for all families with children regardless their
income: the family allowance (‘Familienbeihilfe’) and the child tax credit
(‘Kinderabsetzbetrag’). The family allowance was a universal social benefit paid for each
child in the family. Its amount increased with the age of children and also supplemented
in the case of disability.
The child tax credit was a fully refundable tax credit with an amount per child that
increased with the number of children in the family. Lone parent families were
additionally eligible for a partly refundable lone parent tax credit
(‘Alleinerzieherabsetzbetrag’).
After the maternity benefit (‘Wochengeld’), received eight weeks before and eight weeks
after birth, there was a flat rate parental leave benefit (‘Karenzgeld’) for parents of
newborn children for a period of up to one and a half years (two years if parents shared
child care duties). Mothers who were employed before the birth of the child and with
earnings after the birth below a certain limit were eligible.
Low income families receiving parental leave benefit were also eligible for a means-tested
supplement to the parental leave benefit (‘Zuschuss zum Karenzgeld’).
Low income families with children could also claim a regionally administered family bonus
(‘Familienzuschuss’).
Finally, there were two means-tested benefits for families with small children: a lump-
sum health check bonus (‘Mutter-Kind-Pass-Bonus’), and a periodically paid small
children benefit (‘Kleinkindbeihilfe’) for families with parents not receiving maternity
benefit and children aged under 1 year.
In 2003, the amount of family allowance was between 3 and 11 percent higher in real
terms than in 1998. Since 2000, family allowance has been supplemented for each child
from the second on. Moreover, since 1999, there is a means-tested supplement for every
third and further child. Since 2001 a higher income limit for children older than 17 has
applied.

9
Since 2001, the amount of child tax credit for the first and second child is equal to that
for the third and further children (representing an 85 and 31 percent real increase,
respectively, compared with 1998 amounts). The amount for the third and further
children was not uprated between 1998 and 2003. The same applies to the amount of
lone parent tax credit, but since 1999 it has been fully refundable.
In 2002, the parental leave benefit was replaced by a ‘universal’ childcare benefit
(‘Kinderbetreuungsgeld’). This new benefit is available to all parents (not only the
employed) of children aged under two and a half (3 if parents share child-care duties)
whose income is below a much more generous personal income limit (more than 4 times
higher than in the parental leave benefit). The amount of this new benefit is slightly less
in real terms than the 1998 parental leave benefit.
The supplement to the parental leave benefit (‘Zuschuss zum Kinderbetreuungsgeld’) was
in 2003 linked to the childcare benefit in place of the parental leave benefit. This means
that it is available to a greater number of families as it is not restricted to parents who
were previously employed. In real terms the amount of this benefit is lower than the
1998 parental leave supplement as the daily rate was increased by just 1 percent.
With the introduction of the childcare benefit the regionally administered family bonuses
were reduced or entirely abolished. In Vienna, for example, childcare benefit is included
in the income test of family bonus with a withdrawal rate of 100 percent.
Finally, the health-check bonus and small children benefit were abolished with the
introduction of the child care benefit.
Table 4 summarizes the policies to support families with children in 1998 and 2003 in
Austria.

10
Table 4. Austria: Support to families with children, 1998 and 2003
1998 Changes between 1998 and 2003 Family allowance - universal child benefit
- amount per child increased with age of children
- amounts updated above inflation - new supplement for second and further
children - new means-tested supplement for the
third and further children - income limit for children increased
Child tax credit - fully refundable child tax credit - amount per child increased with
the number of children in the family
- amount for first and second children is equal to the third and further children
- amount for the third and further children was not updated
Lone parent tax credit
- partly refundable tax credit for lone parents
- amount was not updated - now fully refundable
Parental leave benefit
- parental leave benefit for working parents of new born children who are below a certain personal income limit
- paid up to 1.5 (2) years
- replaced by the child care benefit
Child care benefit - benefit for all parents of new born children who are below a certain personal income limit
- paid up to 2.5 (3) years - amount increased slightly less than
inflation (comparing to 1998 parental leave benefit)
- personal income limit more than quadrupled (comparing to 1998 parental leave benefit)
Supplement to the parental leave benefit (child care benefit)
- means-tested supplement to the parental leave benefit for single parents and couples with low income spouse
- linked to the child care benefit
Family bonus - regionally administered means-tested child benefit
- new child care benefit either incompatible or included in the means-test of family bonus
Health check bonus - lump-sum means-tested benefit for new born children
- abolished
Small children benefit
- means-tested benefit for parents of 0 aged children not receiving parental leave benefit
- abolished
Figure 2 illustrates Austrian policies using three synthetic family types: a lone parent with
a child aged 1; a one-earner couple with two children aged 7 and 1 and the same couple
with two children aged 7 and 4. This gives an indication of the relative size or each
policy element and how it is targeted by parental income. The universal benefits operate
at a relatively generous level regardless of income. For one-earner couples and lone
parents not engaged significantly in paid work, a high level of support for those with
young children through the child care benefit is also evident. This does not operate once
the child reaches their fourth birthday nor if the parent(s) are all fully active in the labour
market. So, while not income-tested as such, allowing some high-income families to be
entitled, the generous system is “conditional” rather than universal. Figure 2 also shows
that the greater generosity of 2003 family-related policies to lower income families with
young children has shifted a considerable part of the social expenditure from general
social assistance to specific support for families with children. Nevertheless, social
assistance is shown as still having a role to play for low income families with older
children

11
Figure 2. Austria: 1998 and 2003 policies for two types of family, 2003 prices
Lone parent with child aged 1: 1998
FACTC
LPTCFB
SAB
0
200
400
600
800
1000
1200
1400
1600
0
400
800
1,2
00
1,6
00
2,0
00
2,4
00
2,8
00
3,2
00
3,6
00
4,0
00
4,4
00
4,8
00
5,2
00
5,6
00
6,0
00
6,4
00
6,8
00
7,2
00
7,6
00
8,0
00
euro per month
amou
nt
(euro
per
mon
th)
Lone parent with child aged 1: 2003
FACTC
LPTCCCB
FBSUPP
0
200
400
600
800
1000
1200
1400
1600
0
400
800
1,2
00
1,6
00
2,0
00
2,4
00
2,8
00
3,2
00
3,6
00
4,0
00
4,4
00
4,8
00
5,2
00
5,6
00
6,0
00
6,4
00
6,8
00
7,2
00
7,6
00
8,0
00
euro per month
amou
nt
(euro
per
mon
th)
Couple with children aged 7 and 1: 1998
FA
CTCFB
SAB
0
200
400
600
800
1000
1200
1400
1600
0
400
800
1,2
00
1,6
00
2,0
00
2,4
00
2,8
00
3,2
00
3,6
00
4,0
00
4,4
00
4,8
00
5,2
00
5,6
00
6,0
00
6,4
00
6,8
00
7,2
00
7,6
00
8,0
00
euro per month
amou
nt
(euro
per
mon
th)
Couple with children aged 7 and 1: 2003
FA
CTC
CCB
FB SUPP
SAB
0
200
400
600
800
1000
1200
1400
1600
0
400
800
1,2
00
1,6
00
2,0
00
2,4
00
2,8
00
3,2
00
3,6
00
4,0
00
4,4
00
4,8
00
5,2
00
5,6
00
6,0
00
6,4
00
6,8
00
7,2
00
7,6
00
8,0
00
euro per month
amou
nt
(euro
per
mon
th)
Couple with children aged 7 and 4: 1998
FA
CTC
SAB
0
200
400
600
800
1000
1200
1400
1600
0
400
800
1,2
00
1,6
00
2,0
00
2,4
00
2,8
00
3,2
00
3,6
00
4,0
00
4,4
00
4,8
00
5,2
00
5,6
00
6,0
00
6,4
00
6,8
00
7,2
00
7,6
00
8,0
00
euro per month
amou
nt
(euro
per
mon
th)
Couple with children aged 7 and 4: 2003
FA
CTCSAB
0
200
400
600
800
1000
1200
1400
1600
0
400
800
1,2
00
1,6
00
2,0
00
2,4
00
2,8
00
3,2
00
3,6
00
4,0
00
4,4
00
4,8
00
5,2
00
5,6
00
6,0
00
6,4
00
6,8
00
7,2
00
7,6
00
8,0
00
euro per month
amou
nt
(euro
per
mon
th)
Notes: The first family type consists of a 41 year-old, employed single mother. The second family type consists of a couple with a 41 year-old employed husband and a 41 year-old non-working wife. In both cases, individual original income is computed as the product of multiplying a fixed hourly wage (9.23 euro per hour) times an increasing number of working hours. All families are assumed to be tenants paying a rent of 400 euro per month. The amounts of the 1998 benefits where updated to 2003 levels using Eurostat’s harmonised consumer price indices (8.04 percent in the case of Austria). Shaded areas represent policies that are not uniquely targeted to families with children and that are not “swapped” to other countries in section 5. Acronyms: FA: family allowance; CTC: child tax credit; LPTC: lone parent tax credit; CCB: childcare benefit; FB: family bonus; SUP: parental leave/childcare supplement; SA: social assistance benefit; Source: EUROMOD
2.2 Spain
In contrast to Austria, Spain has one of the least generous systems to support children in
the European Union. In Bradshaw and Finch (2002), the Spanish ‘child benefit package’ is
negative: in average housing costs and charges for services exceed the values of tax and
cash benefits for children. According to the same study, only Greece, the Netherlands
and Japan are less generous than Spain. As already noted, Table 2 indicates that the
Spanish expenditure on family and children social benefits as a percentage of GDP
(0.5%) is by far the lowest in the European Union. The expenditure level in Italy, the

12
second lowest in the EU-15, is double that of Spain. Support for families with children is
mainly provided through tax concessions and a means-tested child benefit. Recent
reforms have reinforced this structure by considerably increasing the size of the tax
concessions.
In 1998, families with ‘children’ under 30 years of age were entitled to a non-refundable
child tax credit (‘deducción de cuota por hijo’). Only taxpayers whose tax liability was
greater or equal to the tax credit could fully benefit from it. The amount per child of this
tax credit increased with the number of children and was the same for all age groups.
Single parents with children aged under 18 could also benefit from joint taxation
(‘declaración conjunta’). Until 1998, the tax schedule’s exemption limit and income
brackets were larger under joint taxation than under individual taxation. Hence, one-
earner families paid considerably less tax under joint taxation.
Low-income families with children under 18 were entitled to a means-tested child benefit
(‘prestación por hijo a cargo’).
The 2003 policies reflect the changes introduced with the 1999 and 2003 income tax
reforms. The child tax credit was replaced by a more generous child tax allowance
(‘mínimo por descendientes’) for ‘children’ under 25 years of age. The amount per child
of this tax allowance increases with the number of children and is supplemented for
children aged under 3. In 2003, a working mother refundable tax credit (‘deducción por
maternidad’) was introduced for working women with children aged under 3. This tax
credit is paid as a fixed rate per child aged under 3 and cannot exceed the social
insurance contributions paid by the working mother.
Single parents are still allowed to use the joint tax if their children are aged under 18.
However, after 1999, the tax schedule under individual and joint taxation is the same.
The difference is that under joint taxation single parents (and couples) benefit from an
additional tax allowance (‘mínimo personal por declaración conjunta’).
The means-tested child benefit was uprated well above the level of inflation due to a 35
percent rise in the year 2000 (it has not been updated since then). On the other hand,
the benefit’s income limit has remained constant in real terms.
Finally, since 2001 there are two new benefits: a lump sum means-tested benefit for the
birth of a third or successive child (‘prestación por el nacimiento de tercer o sucesivos
hijos’), and a lump sum benefit for multiple births (‘prestación por parto múltiple’).

13
Table 5 summarizes the support for families with children in Spain in 1998 and 2003.8
Table 5. Spain: Support to families with children, 1998 and 2003
1998 Changes between 1998 and 2003 Child tax credit - Non refundable tax credit
- amount per child increased with the number of children
- replaced by child tax allowance
Single parent joint taxation
- tax schedule with larger exemption limit and brackets
- tax schedule is replaced by a tax allowance
Child tax allowance - non refundable tax allowance - amount per child increases with the
number of children and for children under 3
Working mother refundable tax credit
- refundable tax credit for working women with children under 3
Means-tested child benefit
- child benefit for low income families
- amount updated (once) above inflation
Lump sum one-off means-tested benefit for the birth of third child
- lump sum benefit for low income families with a newborn third child
Lump sum benefit for multiple birth
- lump sum benefit for families with two or more newborn children
Figure 3 clearly reflects the low level of expenditure on family support in Spain. While in
Austria a low-income on-earner couple with two children would receive almost 1,000
euro per month, in Spain the same family would receive 50 euro. The two graphs at the
bottom of Figure 3 also show that higher income families are the main gainers from
replacing tax credit by tax allowances. Finally, we can see that lower income working
mothers do not fully benefit from the working mother tax credit as their social
contributions are not large enough.
8 Due to lack of data on Spanish regions, regional policies to support families with children in Spain are not included here.

14
Figure 3. Spain: 1998 and 2003 policies for two types of family, 2003 prices
Lone mother with child aged 1: 1998
cbctc/cta
joint_tax
0
50
100
150
200
250
300
0
400
800
1,2
00
1,6
00
2,0
00
2,4
00
2,8
00
3,2
00
3,6
00
4,0
00
4,4
00
4,8
00
5,2
00
5,6
00
6,0
00
6,4
00
6,8
00
7,2
00
7,6
00
8,0
00
euro per month
am
ount
(euro
per
month
)
Lone mother with child aged 1: 2003
cb
wmtc
ctc/cta
joint_tax
0
50
100
150
200
250
300
0
400
800
1,2
00
1,6
00
2,0
00
2,4
00
2,8
00
3,2
00
3,6
00
4,0
00
4,4
00
4,8
00
5,2
00
5,6
00
6,0
00
6,4
00
6,8
00
7,2
00
7,6
00
8,0
00
euro per month
am
ount
(euro
per
month
)
Couple with children aged 7 and 1: 1998
cb ctc/cta0
50
100
150
200
250
300
0
400
800
1,2
00
1,6
00
2,0
00
2,4
00
2,8
00
3,2
00
3,6
00
4,0
00
4,4
00
4,8
00
5,2
00
5,6
00
6,0
00
6,4
00
6,8
00
7,2
00
7,6
00
8,0
00
euro per month
am
ount
(euro
per
month
)
Couple with children aged 7 and 1: 2003
cb
ctc/cta
0
50
100
150
200
250
300
0
400
800
1,2
00
1,6
00
2,0
00
2,4
00
2,8
00
3,2
00
3,6
00
4,0
00
4,4
00
4,8
00
5,2
00
5,6
00
6,0
00
6,4
00
6,8
00
7,2
00
7,6
00
8,0
00
euro per month
am
ount
(euro
per
month
)
Couple with children aged 7 and 4: 1998
cb ctc/cta0
50
100
150
200
250
300
0
400
800
1,2
00
1,6
00
2,0
00
2,4
00
2,8
00
3,2
00
3,6
00
4,0
00
4,4
00
4,8
00
5,2
00
5,6
00
6,0
00
6,4
00
6,8
00
7,2
00
7,6
00
8,0
00
euro per month
am
ount
(euro
per
month
)
Couple with children aged 7 and 4: 2003
cbctc/cta
0
50
100
150
200
250
300
0
400
800
1,2
00
1,6
00
2,0
00
2,4
00
2,8
00
3,2
00
3,6
00
4,0
00
4,4
00
4,8
00
5,2
00
5,6
00
6,0
00
6,4
00
6,8
00
7,2
00
7,6
00
8,0
00
euro per month
am
ount
(euro
per
month
)
Notes: The first family type consists of a 41 year-old, employed single mother. The second family type consists of a couple with a 41 year-old employed husband and a 41 year-old non-working wife. In both cases, individual original income is computed as the product of multiplying a fixed hourly wage (9.23 euro per hour) times an increasing number of working hours. All families are assumed to be tenants paying a rent of 400 euro per month. The amounts of the 1998 benefits where updated to 2003 levels using Eurostat’s harmonised consumer price indices (16.2 percent in Spain). Shaded areas represent policies that are not uniquely targeted on families with children and that are not swapped to other countries in section 5 (there are no such policies for Spain). Acronyms: cb: means-tested child benefit; wmtc: working mother tax credit; ctc/cta: child tax credit/allowance; joint_tax: tax relief due to joint taxation Source: EUROMOD
2.3 United Kingdom
When the Labour Party came to power in 1997, one in five children lived in a household
where no one was in paid work and one in three was in poverty in the UK (Gregg et al,
1999). As result, tackling child poverty was a major goal for the new government. Using
1998-1999 as baseline, the government pledged a 25 percent reduction in child poverty
by 2004-2005, 50 percent by 2010 and elimination of child poverty by 2020 (Blair,
1999). In order to achieve that, the British government has substantially reformed the

15
support for families with children. Although there has been a universal child benefit since
1976, the British system has been mainly characterised for being targeted on children
living in lower-income families. Recent reforms have maintained and even reinforced
income targeting. Although giving a stronger emphasis on in-work benefits these too are
family income-tested, having the effect of extending means-testing further up the income
distribution. The UK has a standard definition of dependent children. All child-targeted
polices in the UK consider as children individuals under 16 years of age or under 19 if in
full-time non-advanced education.
In 1998, child benefit was a universal social benefit paid for each child in the family. The
amount per child was higher for the first child and there was a complement for lone
parent families.
Low income families with children and with at least one parent working at least 16 hours
per week could also apply for family credit. The amount of this means-tested benefit
increased with the number and age of children. Parents working at least 30 hours a week
received an additional supplement.
Low income parents not working 16 hours per week or more were entitled to a
complement to their income support/jobseeker’s allowance payment. The amount per
child of this complement increased with the age of children. The complement was also
higher for the first child and for lone parent families.
The means-tested housing benefit (HB) and council tax benefit (CTB) were also higher for
families with children. The complement per child was higher for the first child and also
increased with the age of children. Lone parent families received an additional
complement.
Between 1999 and 2003 the British government has been quite active introducing
reforms and, later, re-reforming them. Our analysis compares the policies in 1998 and
2003, so the changes performed and then changed again in between are not commented
here.9
In 2003, the child benefit was 3 percent higher in real terms than in 1998. The
complement for the first child increased more (about 9%), while the complement for lone
parent families was eliminated.
9 For details about the reforms carried out after 1998 and before 2003 see Piachaud and Sutherland (2000) and Brewer et al (2001).

16
The family credit and the complement for income support/jobseeker’s allowance were
replaced by a child tax credit and a working tax credit.10 One the one hand, this reform
splits the family support and the ‘make work pay’ parts of family credit into two. On the
other, it consolidates previously separated policies to support families with children into
one. Furthermore, it extends the in-work benefit to people without children.
The child tax credit consists of two parts: a family and a child element. The family
element is a fixed amount11 paid for families with children. This amount is tapered away
above a quite generous threshold. The child element is paid as a fixed amount per child
(higher for disabled children) that is tapered away above a considerably lower income
threshold. According to Brewer (2003), around 90 percent of families with children would
be entitled to the family element, and around 50 percent to the child element.
The working tax credit is a means-tested in-work benefit for families with children with at
least one parent working at least 16 hours a week, and to individuals/couples without
children working at least 30 hours a week. There is a basic amount for single people
without children and another substantially higher for lone parents and couples with or
without children. These are complemented for those working more than 30 hours per
week, disabled, or returning to work over 50. Families with children where all adults are
working can also apply for a refund for part of their childcare costs.
The basic premia per child in housing benefit and council tax benefit were updated by a
rate considerably more than the inflation rate in the period. The complements for
younger children were increased so that the amount per child no longer varies with the
age of children. Finally, the supplement for the first child was increased and the
complement for lone parent families was abolished.
Table 6 summarizes the support to families with children in the UK in 1998 and 2003.
10 In fact, the family credit was replaced in 1999 by the working family tax credit. In 2001, a children’s tax credit and a childcare tax credit were also introduced. In 2003, these tax credits were replaced by the child tax credit and the working tax credit.
11 This amount is doubled in the case of a newborn child.

17
Table 6. United Kingdom: Support to families with children, 1998 and 2003
1998 Changes between 1998 and 2003 Child benefit - Universal child benefit
- Higher amount for first child and lone parent families
- Benefit increased twice as much as the inflation rate.
- Complement for first child increased by 40%
- Complement for lone parent families is eliminated
Family credit - Means-tested benefit for parents working more than 16 hours per week
- Eliminated
Income support/JSA - Complement for children - Rate per child increased with age
and higher for first child
- Child complement eliminated
Child tax credit - Means-tested benefit for families with children
- Amount is the sum of a fixed rate per family (family element) and a fixed rate per child (child element)
- Each element is tapered at different income thresholds and with different withdrawal rates
Working tax credit - Means-tested in-work benefit - Hours condition for parents is lower - The basic amount is higher for lone
parents and couples with or without children
- Families with children where all parents work are entitled to a refund for childcare costs
Housing benefit and Council tax benefit
- Means-tested benefits complemented for the presence of children
- The complement increased with age of children
- Additional complements for first child and lone parents
- Updated above the inflation rate - The complement is the same for all
children’s ages - Complement for lone parents is
eliminated
Additions to some insurance benefits
- Child additions to some adult benefits
- Child additions eliminated
Figure 4 illustrates the importance of means testing and how recent reforms have
considerably increased the generosity of policies to support families with children in the
UK. Although this figure is certainly more like Figure 2 (the Austrian system) than Figure
3 (the Spanish system), one can see the greater emphasis on means-tested benefits in
the UK. The comparison between 1998 and 2003 shows how the child tax credit has
consolidated and increased the support to lower-income families, extended means-tested
support higher up the income scale, and also introduced an element of “affluence testing”
at high levels of income. The systems do not distinguish by the ages of children (at least
for the ages shown in Figure 4) and are very similar for lone parents and couples: the
lone parent family receives less than the example couples because she has fewer
children.

18
Figure 4. United Kingdom: 1998 and 2003 policies for two types of family, 2003 prices
Lone mother with child aged 1: 1998
cbfcis
hb
ctb
0
200
400
600
800
1000
1200
1400
1600
0
400
800
1,2
00
1,6
00
2,0
00
2,4
00
2,8
00
3,2
00
3,6
00
4,0
00
4,4
00
4,8
00
5,2
00
5,6
00
6,0
00
6,4
00
6,8
00
7,2
00
7,6
00
8,0
00
euro per month
amou
nt
(euro
per
mon
th)
Lone mother with child aged 1: 2003
cbctc
wtcishb
ctb
0
200
400
600
800
1000
1200
1400
1600
0
400
800
1,2
00
1,6
00
2,0
00
2,4
00
2,8
00
3,2
00
3,6
00
4,0
00
4,4
00
4,8
00
5,2
00
5,6
00
6,0
00
6,4
00
6,8
00
7,2
00
7,6
00
8,0
00
euro per month
amou
nt
(euro
per
mon
th)
Couple with children aged 7 and 1: 1998
cb
fcis
hb
ctb
0
200
400
600
800
1000
1200
1400
1600
0
400
800
1,2
00
1,6
00
2,0
00
2,4
00
2,8
00
3,2
00
3,6
00
4,0
00
4,4
00
4,8
00
5,2
00
5,6
00
6,0
00
6,4
00
6,8
00
7,2
00
7,6
00
8,0
00
euro per month
amou
nt
(euro
per
mon
th)
Couple with children aged 7 and 1: 2003
cb
ctc
wtcis
hb
ctb
0
200
400
600
800
1000
1200
1400
1600
0
400
800
1,2
00
1,6
00
2,0
00
2,4
00
2,8
00
3,2
00
3,6
00
4,0
00
4,4
00
4,8
00
5,2
00
5,6
00
6,0
00
6,4
00
6,8
00
7,2
00
7,6
00
8,0
00
euro per month
amou
nt
(euro
per
mon
th)
Couple with children aged 7 and 4: 1998
cb
fcis
hb
ctb
0
200
400
600
800
1000
1200
1400
1600
0
400
800
1,2
00
1,6
00
2,0
00
2,4
00
2,8
00
3,2
00
3,6
00
4,0
00
4,4
00
4,8
00
5,2
00
5,6
00
6,0
00
6,4
00
6,8
00
7,2
00
7,6
00
8,0
00
euro per month
amou
nt
(euro
per
mon
th)
Couple with children aged 7 and 4: 2003
cb
ctc
wtcis
hb
ctb
0
200
400
600
800
1000
1200
1400
1600
0
400
800
1,2
00
1,6
00
2,0
00
2,4
00
2,8
00
3,2
00
3,6
00
4,0
00
4,4
00
4,8
00
5,2
00
5,6
00
6,0
00
6,4
00
6,8
00
7,2
00
7,6
00
8,0
00
euro per month
amou
nt
(euro
per
mon
th)
Notes: The first family type consists of a 41 year-old, employed single mother. The second family type consists of a couple with a 41 year-old employed husband and a 41 year-old non-working wife. In both cases, individual original income is computed as the product of multiplying a fixed hourly wage (9.23 euro per hour) times an increasing number of working hours. All families are assumed to be tenants paying a rent of 400 euro per month and 100 euro per month for council tax. The amounts of the 1998 benefits where updated to 2003 levels using Eurostat’s harmonised consumer price indices (6.19 percent in the UK). Shaded areas represent policies that are not uniquely targeted on families with children and that are not “swapped” to other countries in section 5. Striped areas represent 1998 policies that were clearly targeted on families with children but that also had another social protection function (social assistance in the case of IS and work incentive in the case of FC). Acronyms: cb: child benefit; fc: family credit; ctc: child tax credit; wtc: working tax credit; is: income support; hb: housing benefit; ctb: council tax benefit. Source: EUROMOD
3 Method, Data, Assumptions and Definitions
This paper makes use of the static tax-benefit microsimulation model EUROMOD.12 Tax-
benefit models simulate in detail each component of the tax-benefit system on each
12 See Immervoll et al. (1999) and Sutherland (2000) for general descriptions. Sutherland (2001) provides a description and discussion of technical issues.

19
individual/household from a representative set of micro-data, usually derived from
surveys. They calculate disposable income as the sum of elements of gross original
income taken (or imputed) from the original data combined with elements of income –
taxes and transfers - that are simulated by the model. They can be used to ask ‘what if’
questions about policy change. EUROMOD calculates taxes and transfers in detail and in a
comparable way for all 15 countries that made up the European Union prior to the
enlargement of May 2004.
The input dataset for Austria used here is an Austrian version of the ECHP collected in
1999. In the case of Spain, the dataset is the Eurostat version of the ECHP collected in
2000. The UK’s input dataset is the Family Expenditure Survey collected in 2000/1.13
The choice of dataset is based on national judgement of the most suitable dataset that is
available for scientific research. The reference time period for income variables in the UK
dataset is the current month whereas for Austria and Spain it is the previous year.
Throughout we consider as if all policies (original and simulated) were implemented on
June 30th 2003.14 The original incomes are updated to June 30th 2003 by indexing each
income component by appropriate growth factors, based on actual changes over the
relevant period.15 No adjustment is made for changes in population composition.
Section 4 compares the effects of the 1998 and the 2003 tax-benefit systems for the
three countries. The 1998 tax-benefit system is simulated as if those policies effective in
1998 were still operating in 2003. In order to maintain their real value over time, all
monetary amounts were updated to 2003 levels using Eurostat’s Harmonised Indices of
Consumer Prices (HICP).
In Section 5, 2003 child-related policies are swapped between countries. All EUROMOD
simulated policies (including tax concessions) that are targeted at children in country A
are eliminated and replaced by the child-related policies of countries B and C, and vice-
versa.16 Only policies strictly targeted at children are swapped between countries (a sub-
13 We are grateful for access to these data to the Austrian Interdisciplinary Centre for Comparative Research in the Social Sciences; to Eurostat and to the UK Office for National Statistics (ONS) (access provided through the Data Archive). Material from the FES is Crown Copyright and is used by permission. Neither the ONS nor the Data Archive bear any responsibility for the analysis or interpretation of the data reported here. An equivalent disclaimer applies for the other two data sources and their respective providers cited in this acknowledgement.
14 It is necessary to specify a precise date because the timing within the year of regular uprating and other adjustments to tax-transfer systems varies across countries.
15 This process is documented in EUROMOD Country Reports. See http://www.iser.essex.ac.uk/msu/emod/countries
16 Some child-related policies are not simulated by EUROMOD mainly due to lack of data. In all three countries this applies to non-cash transfers, indirect taxes and child disability benefits. In Spain, child benefits and child tax credits administered by regional governments are also not included in the simulations because the regional disaggregation level in the ECHP is incompatible with that for regional governments.

20
set of those shown in Tables 4-6). Policies that have other purposes and that involve
complements for children (e.g. the UK housing benefit) are not included in the swap. This
is because it is unclear how to implement them in a system with a different structure. For
example, how would the child additions to the UK housing benefit be implemented in a
country such as Spain where there is no equivalent to housing benefit?
Given that the objective of these simulations is to learn about the impact of different
policy structures rather than the expenditure level, all reforms are budget neutral.
Hence, the cost of implementing the policies from country B in country A is the same as
the cost of current policies in country A. The way this is done is first, the income
thresholds of means-tested benefits or tax credits are set relative to the countries’
median income.17 Then all the remaining monetary parameters of “borrowed” policies are
scaled up or down by a common adjustment index such that budget neutrality is
achieved. The reason for treating income thresholds differently from the size of payments
is that these have the function of determining where in the income distribution a policy
takes effect, rather than the size of the effect. Child tax allowances are also scaled
up/down by this scaling index, but no swap or adjustment is made to the tax schedule or
the tax base.
Our measure of the contribution of each policy (as well as its impact on disposable
income) is measured as the difference between the amount under the existing system
and the amount obtained by “switching off” (or setting to zero) the part of policy that is
targeted on children. Policies or elements of policies that are not targeted at children,
according to our common definition remain in place. Following the United Nations
Convention on the Rights of the Child, our definition of children is people aged under 18
(i.e. aged 0-17).18 We generally assume that income is shared within the household such
that household disposable income can be used to indicate the economic well-being of
each individual within the household (the ‘within household’ incidence issue is not
considered). The individual is taken as the unit of analysis. So our focus is generally on
each child, rather than on parents or families containing children.
Household disposable income is defined as original income added up over each household
member plus between-household transfers (e.g. maintenance and alimony), minus taxes
(income tax, social contributions and other direct personal taxes) plus cash transfers.
17 The threshold of country A’s benefit simulated in country B is tB = [tA * (mB / mA)], where ti is the threshold and mi the median equivalised household disposable income in country i.
18 Note that this diverges from the definition of a child used in the tax and transfer rules of our analysed countries (as would any common definition). Hence, our analysis does not consider part of the expenditure on these policies as support to children.

21
Cash transfers are assumed to include public pensions in payment but do not include
regulated private pensions that may substitute for these. Non-cash benefits are not
included. Household disposable incomes are equivalised using the modified OECD
equivalence scale, as recommended by Eurostat.19
Poverty is defined as living in a household with equivalised household disposable income
below 60% of the median, where the median is calculated across individuals.
We do not explicitly model non-take up of benefits, tax avoidance or evasion. Thus it is
assumed that the legal rules apply and that the costs of compliance are zero. This can
result in the over-estimation of taxes and benefits.20 More generally we make the strong
assumption that individual behaviour such as benefit take-up, tax evasion and other
relevant socio-economic decisions (e.g., labour supply, family formation) do not change
as a result of the policy changes that are modelled. Correcting for such departures from
the pure arithmetical calculations is not straightforward or simple to do in a way that is
comparable across countries. These behavioural responses depend on many factors such
as the form and administration of each tax or transfer, labour market rules and
characteristics, social values, etc. and are therefore nationally-specific.
4 The impact of actual reforms 1998-2003
As outlined above, Austrian, Spanish and UK child policies were subject to substantial
changes within the period 1998 to 2003. This section aims to illustrate the scale and
structure of these changes and to asses their impact on the distribution of household
incomes and child poverty. We base this illustration on the question “What would have
happened if no real changes in taxes and benefits had been implemented between 1998
and 2003?”. This is achieved by applying the 1998 tax benefit rules to the situation as it
existed in 2003.21
To give an initial impression of the effects of all the tax and benefit policy changes
implemented between 1998 and 2003, Table 7 shows the impact on child poverty rates
using three different proportions of the median as poverty thresholds. 22 In each case it is
the median under 2003 policies that is the reference point. So the question Table 7
19 This assumes single person=1; additional people aged 14+ = 0.5; additional people aged under 14 = 0.3.
20 It can also result in the under-estimation of poverty rates although this depends on the relationship between the level of income offered by the benefits and the poverty line (potential claimants may be poor whether or not they receive the benefits to which they are entitled).
21 1998 tax benefit parameters are updated to 2003 monetary values by applying the Harmonised Indices of Consumer Prices (HICPs) published by Eurostat. These are 8.0% for Austria, 16.2% for Spain and 6.2% for the UK.
22 Here and throughout EUROMOD estimates were obtained using version 31A.

22
addresses is “How much lower are child poverty rates under 2003 policies than they
would have been under the policies of 1998?”
Table 7: Child poverty rates, 1998 and 2003 tax benefit rules
AUSTRIA SPAIN UK
1998 2003 change 1998 2003 change 1998 2003 change
child poverty rate, 50% median pov.-line 4.3% 3.7% -0.6pp 17.6% 16.3% -1.2pp 21.3% 6.2% -15.1pp
child poverty rate, 60% median pov.-line 12.3% 8.8% -3.5pp 26.5% 25.3% -1.1pp 32.1% 19.7% -12.4pp
child poverty rate, 70% median pov.-line 23.6% 18.4% -5.1pp 34.5% 32.3% -2.2pp 40.8% 32.4% -8.4pp
overall poverty rate, 60% median pov.-line 11.0% 9.5% -1.5pp 20.1% 19.1% -1.1pp 24.1% 16.2% -7.8pp
Source: Euromod
In Austria the reforms had a considerable impact on child poverty. The child poverty rate
using the 60% threshold is 8.8% in 2003 rather than 12.3% under 1998 policies, and
falls below the overall poverty rate. The reduction is however slightly less pronounced
using the 50% threshold. As might be expected, considering the structure of additional
expenditure, Spanish child policy reforms appear to be the least effective. The child
poverty rate decreases by only 1.1 percentage points using the 60% threshold, and
remains at a high level of 25.3%. Reduction in child poverty rates is most impressive in
the UK. The child poverty rate decreases by 12.4 percentage points to 19.7% (though
this is still very high compared with Austria), also narrowing the gap with the overall
poverty rate. The decrease is even more pronounced using the 50% threshold.
These estimates take account of all changes, including those that are not targeted
particularly on children (such as changes in the income tax schedules or to social
contributions). To give an impression of the scale of the child-targeted changes, Table 8
shows the increase in total net child targeted spending resulting from the changes set out
in Tables 4, 5 and 6.
Table 8: Child targeted spending, 1998 and 2003 tax benefit rules, 2003 prices
AUSTRIA SPAIN UK
1998 2003 change 1998 2003 change 1998 2003 change
per child spending (monthly, €)
169
220
30.6%
13
33 150.3%
102
174
71.1%
total spending in % of HDI
3.6% 4.7% 1.1pp 0.4% 1.0% 0.6pp 2.2% 3.6% 1.4pp
Source: Euromod Note: For the UK an exchange rate of €1 to £ 0.70295 is used (June 2003, source: http://www.x-rates.com)
In relative terms Spanish child targeted spending increased most, expenditure under
2003 policy rules amounts to one and a half times the expenditure under 1998 rules but
at 2003 prices. However, although spending as a percentage of household disposable
income was more than doubled, it remained at a relatively low level of one percent. UK

23
spending on children also rose by a remarkable 71%, increasing its share in household
disposable income from 2.2% to 3.6%. Austrian expenditure which, in comparison with
the other two countries, was already generous was further increased by one third, from
3.6% of household disposable income to 4.7%.
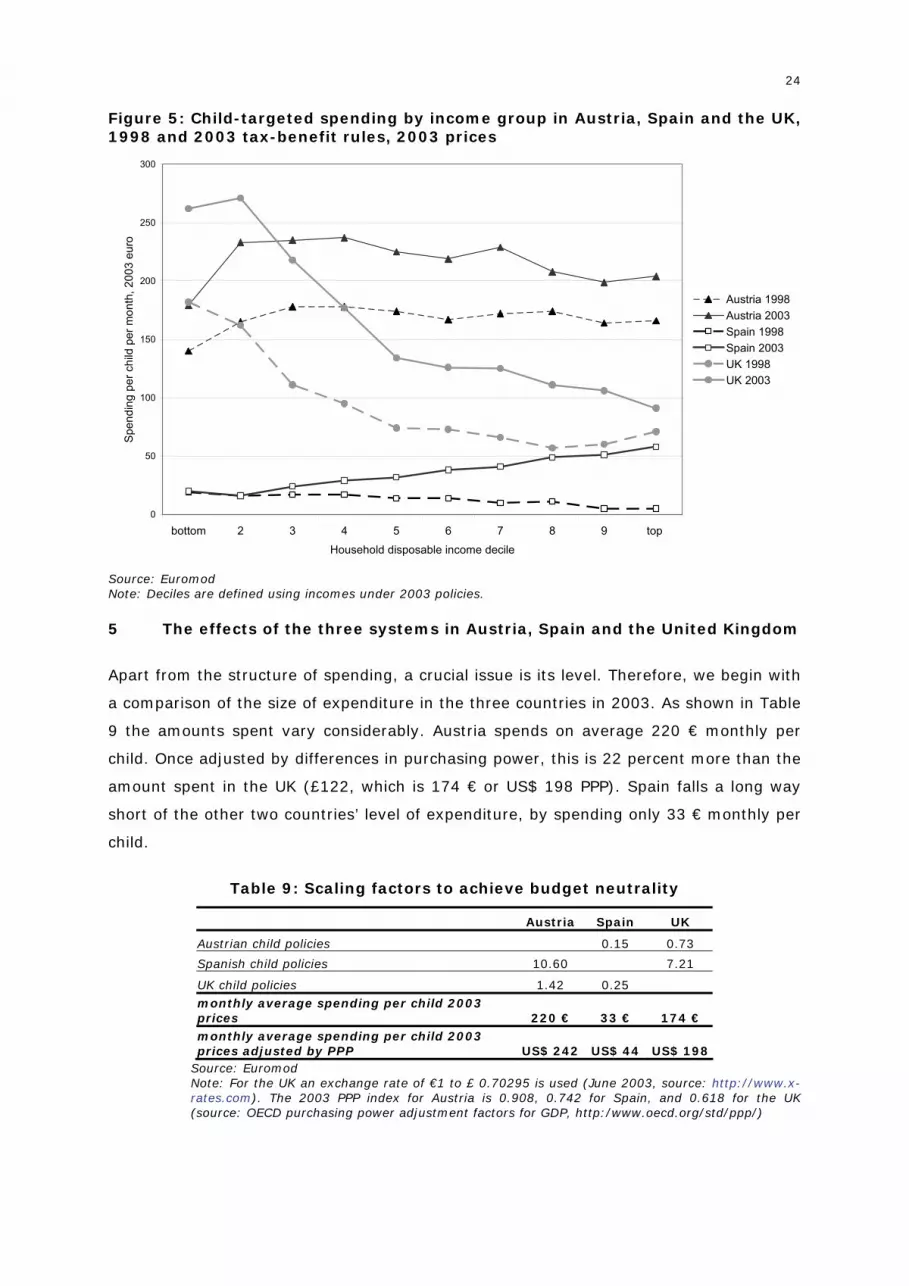
Figure 5 shows the distributional impact of child-targeted policy in terms of the average
spending per child in each decile group of the all-household income distribution before
and after the reforms.23 Spending is shown in cash terms without making adjustments
for between-country differences in purchasing power. Thus differences in level between
countries should not be the focus of attention. Rather, it is the shape of the curves across
income levels and how they change with policy regime that is of interest.24 The Austrian
system in 1998 had more or less the same effect on children at each level of household
income, with a somewhat lower amount being spent on the lowest income children.25 The
Spanish system, while rather minimal from any perspective, favoured those on lower
incomes to some extent. The UK system favoured children in low income households,
spending about three times as much on children in the bottom decile group as those in
the top group.
In Austria the increase in spending per child is relatively evenly spread over the income
distribution, with a moderate concentration in the middle and lower-middle (deciles 2-7).
More or less the same can be said for the UK, though interestingly the increase in per
child spending in the bottom decile group is considerably less than the average for the
bottom half of the UK distribution. The pattern of increase in Spain is striking. While the
rise in per child spending in the two bottom decile groups is negligible, children in the 7th
and 8th decile groups receive on average more then four times as much under the 2003
rules as under the 1998 rules and children in the top 20% of incomes more than ten
times as much.
23 This is calculated by “switching off” the child-specific policies illustrated in Figures 2-4. To some extent the estimates of size of the child-targeted spending depend on the tax-benefit system in which the child-specific components are implemented. In the case of Austria general social assistance schemes operate to mitigate the “loss” of the child-specific components, under-estimating the size of gross child payments for social assistance recipients.
24 Income deciles are based on individualised equivalised household disposable income under 2003 policies.
25 This effect is mainly due to social assistance partly replacing child-specific payments at low levels of income. It is possible that this effect is over-estimated since social assistance receipt is based on calculated entitlement, without taking account of factors leading to non-take up.
24
Figure 5: Child-targeted spending by income group in Austria, Spain and the UK, 1998 and 2003 tax-benefit rules, 2003 prices
0
50
100
150
200
250
300
bottom 2 3 4 5 6 7 8 9 top
Household disposable income decile
Spe
ndin
g pe
r chi
ld p
er m
onth
, 200
3 eu
ro
Austria 1998Austria 2003Spain 1998Spain 2003UK 1998UK 2003
Source: Euromod Note: Deciles are defined using incomes under 2003 policies.
5 The effects of the three systems in Austria, Spain and the United Kingdom
Apart from the structure of spending, a crucial issue is its level. Therefore, we begin with
a comparison of the size of expenditure in the three countries in 2003. As shown in Table
9 the amounts spent vary considerably. Austria spends on average 220 € monthly per
child. Once adjusted by differences in purchasing power, this is 22 percent more than the
amount spent in the UK (£122, which is 174 € or US$ 198 PPP). Spain falls a long way
short of the other two countries’ level of expenditure, by spending only 33 € monthly per
child.
Table 9: Scaling factors to achieve budget neutrality
Source: Euromod Note: For the UK an exchange rate of €1 to £ 0.70295 is used (June 2003, source: http://www.x-rates.com). The 2003 PPP index for Austria is 0.908, 0.742 for Spain, and 0.618 for the UK (source: OECD purchasing power adjustment factors for GDP, http:/www.oecd.org/std/ppp/)
Austria Spain UK
Austrian child policies 0.15 0.73
Spanish child policies 10.60 7.21
UK child policies 1.42 0.25 monthly average spending per child 2003 prices 220 € 33 € 174 € monthly average spending per child 2003 prices adjusted by PPP US$ 242 US$ 44 US$ 198

25
Table 9 also shows the factors used to scale up or down the payments within the child
policies in order to make them budget neutral.26 To implement the Spanish and UK child
targeted policies into the Austrian system basic amounts were increased tenfold in the
case of Spain and increased by 42 percent in the case of UK. Austrian and UK child
policies had to be scaled down considerably for implementation in Spain, in the case of
the Austrian policies to less than 1/6, and in the case of UK policies, to a quarter. Finally,
to implement the other two country’s child policies in the UK, Austrian basic amounts
were reduced by a quarter and Spanish amounts multiplied by seven. It is worth
emphasising that there is not exact symmetry between the factors to be applied when
exchanging systems, and that the budget-neutral scaling factors cannot be derived from
the ratios of the spending per child in each national system. This is because the cost of
implementing a particular system depends on the characteristics and circumstances of
the children and their families: these are clearly different across countries. In addition,
the cost depends to some extent on the way in which the child components interact with
the rest of the national tax-benefit systems. So, for example, the value of the Spanish
child tax allowances depends on the tax schedule into which they are introduced.
As explained above, not all the policy instruments that are affected by the presence of
children are included in the “swapping” exercise. We concentrate on those whose stated
aim is the support of children and Figure 6 shows the relative contribution of each of the
policy instruments considered in the spending shown in Table 9, and the proportions of
households with children who are in receipt of each policy instrument. The figure shows
the effect of each system in turn, comparing the implementation in the three countries.
26 The factors used to scale the income thresholds based on median household disposable income are Austria (1.0000) Spain (0.6710) UK (1.0015)

26
Figure 6: The contribution of each policy instrument to child targeted spending
Share of expenditure by instrument Share of households with children in receipt of instrument
59% 62% 53%
18% 13% 21%
23% 24% 22%
2%1%0%
2%1%1%
Austria Spain UK
lone parent tax creditchild tax creditfamily bonuschild care benefitfamily allowance
AUSTRIANBENEFITS
16%
2%
14%
100%
11%1%
9%
21%
7%
22%
100% 108%
fam
ilyal
low
ance
child
car
ebe
nefit
fam
ily b
onus
child
tax
cred
it
lone
par
ent
tax
cred
it
Austria
Spain
UK
10% 7%20% 10%
31%
3%
77% 80%62%
Austria Spain UK
child tax allowancemeans tested child benefitworking mother tax credit
SPANISHBENEFITS
3%
19%
85%
7%13%
80%
9%
31%
74%
wor
king
mot
her t
axcr
edit
mea
nste
sted
chi
ldbe
nefit
child
tax
allo
wan
ce
Austria
Spain
UK
64%45%
56%
0%
1%1%
54%
36%44%
Austria Spain UK
child tax creditworking tax creditchild benefit
UKBENEFITS
100%
3%
95%99%
2%
87%97%
11%
89%
child
ben
efit
wor
king
tax
cred
it
child
tax
cred
it
Austria
Spain
UK
Source: Euromod

27
Among the Austrian instruments the two universal benefits, family allowance and the
refundable child tax credit, make up three quarters or more of total spending when the
Austrian system is implemented in all three countries. They are received by all
households with children.27 While the family bonus (targeted on the poor) and the lone
parent tax credit are nearly negligible in size, the child care benefit is of considerable
importance. This is targeted on young children whose parent(s) care for them rather than
work. This benefit, as well as the lone parent credit and family bonus, play a larger role
in the UK than they do in Austria. This is because there are a larger proportion of all
children within the target groups for these benefits in the UK. They play a smaller role in
Spain than in Austria because the scaling down to Spanish levels of spending makes
them rather low in value and because there are fewer Spanish children in the target
groups: lone parent families and/or with parents at home caring for them.
The most significant Spanish instrument is the child tax allowance. As only families
paying (enough) income tax can (fully) claim this benefit a proportion of households with
children do not receive it. This proportion is higher in Austria than Spain but lower in the
UK, reflecting the extent to which parents are subject to income tax in the three
countries. The Spanish means tested child benefit is quite important too, especially in the
UK. Once the Spanish system has been scaled up to Austrian and UK levels of spending,
larger proportions of households become eligible in these two countries than they are in
Spain. The importance of the working mother tax credit depends on the extent to which
mothers of young children are in paid employment in the three countries. The proportion
of families who are eligible is highest in the UK, followed by Spain and then Austria.
Among UK instruments the universal child benefit and the means tested child tax credit
account for the bulk of spending, while the contribution of the working tax credit to
supporting children is very small.28 While child benefit is universal, children aged 16 or
more who have left secondary school are not covered. Thus the households with children
aged under 18 are not quite all covered in Spain or the UK. The age conditions for the
child tax credit are the same. Coverage rates appear rather high for a policy instrument
that is described as a means-tested benefit. This is because a relatively small component
is tested against income at a high level (“affluence testing”) removing eligibility to any
27 The Austrian child tax credit affects more than 100% of households with children in the UK. This is because the Austrian child tax credit can be received by people paying for maintenance for children living in other households. The UK data contains a variable that indicates such payments whereas the Austrian and Spanish data do not (otherwise, we would expect the percentage of households affected in these countries to also be somewhat greater than 100%).
28 In the UK only the additional components of WTC that make the scheme less restrictive for parents than others (related to the hours of work condition) are counted as being "child targeted". When implemented in the other countries without the remainder of the WTC, these components have a negligible effect, not least because the proportions of parents working part-time hours are much lower in Spain and Austria than in the UK.

28
benefit in only 11 per cent of cases in the UK. The proportion ineligible on grounds of
high income is slightly smaller in Austria.29 Most of the spending on child tax credit is
targeted on families with low and low-middle incomes (see Figure 4). There are more
qualifying families for this part in the UK than the other two countries and this is
reflected in the lower share of spending for the tax credit in both Austria and Spain.
Figure 7 shows the distributional effect of the three systems applied within its country of
origin, and applied to the other two countries. Each chart shows the share of child
targeted spending by the level of household income. Households are grouped by decile of
equivalised income under actual 2003 policies. The charts also show the share of children
belonging to the income group.
The charts on the diagonal of Figure 7 show the effects of national systems implemented
in their own country. The three pictures are consistent with the information shown for the
2003 systems in Figure 5. For Austria the share of spending in each decile group is
remarkably close to the share of children in that group, but with a lower share of
spending in the bottom decile group. This has a share of children that is low relative to
the other two countries but still higher than the share of spending under the Austrian
system. The Spanish picture shows disproportionate spending in the higher income
groups. Children are more heavily concentrated in the lower income deciles than in the
other two countries. In the UK spending is disproportionately on the lower- and lower-
middle income children resulting in higher spending per child in these groups.
The Austrian system introduced into Spain and the UK also manages to achieve a
distributional effect that matches quite closely the share of children in each income
group. For a fully universal system this would be inevitable. The departures – for
example the excess of spending over number of children shown for the second decile
group in the UK – arise from the targeting of specific groups, such as young children,
within the Austrian system. While in Austria only 7 percent of spending is received by
children in the bottom decile group the system delivers 14 and 13 percent respectively to
Spanish and British children at the bottom of their national distributions. It delivers far
more to low income Spanish children than does the Spanish system, but less to British
children in the bottom three deciles than does the UK system.
29 A plausible explanation for this is that while the threshold for affluence testing is set with reference to median incomes which are almost identical in UK and Austria, it is likely that a lower proportion of Austrian parents have very high taxable incomes than do parents in the UK, where earnings inequality is relatively high.

29
Figure 7: Three systems of child targeted spending by decile group of household disposable income
Austrian benefits
7% 15%
15%
13%
13%
11%
9% 7% 6% 5%
9%
14%
14%
12%
13%
11%
8% 8% 7%5%
1 2 3 4 5 6 7 8 9 10
share of spendingshare of children
AUSTRIA
Spanish benefits
8% 9% 10%
10%
10%
11%
10%
11%
11%
9%
9%
14%
14%
12%
13%
11%
8% 8% 7%5%
1 2 3 4 5 6 7 8 9 10
UK benefits
14%
16%
14%
12%
12%
10%
8% 6% 6% 3%
9%
14%
14%
12%
13%
11%
8% 8% 7%5%
1 2 3 4 5 6 7 8 9 10
Austrian benefits
14%
13%
10%
10%
10%
11%
8% 9% 7% 7%
14%
12%
10%
10%
10%
10%
8%
9% 8% 8%
1 2 3 4 5 6 7 8 9 10
SPAIN
Spanish benefits
8% 6% 7% 9% 10%
12%
10%
14%
13%
13%
14%
12%
10%
10%
10%
10%
8%
9% 8% 8%
1 2 3 4 5 6 7 8 9 10
UK benefits
20%
11%
11%
10%
10%
9% 8% 9% 7% 5%
14%
12%
10%
10%
10%
10%
8%
9% 8% 8%
1 2 3 4 5 6 7 8 9 10
Austrian benefits
13%
17%
12%
12%
11%
10%
8% 7% 6% 5%
11% 13
%
12%
12%
11%
11%
8% 8% 7% 6%
1 2 3 4 5 6 7 8 9 10
UK
Spanish benefits
11%
13%
8% 9% 9% 10%
9% 10%
10%
11%
11% 13
%
12%
12%
11%
11%
8% 8% 7% 6%
1 2 3 4 5 6 7 8 9 10
UK benefits
17%
21%
15%
12%
8% 8% 6% 5% 4% 3%
11% 13
%
12%
12%
11%
11%
8% 8% 7% 6%
1 2 3 4 5 6 7 8 9 10
Source: Euromod Note: “benefits” refers to both cash benefits and the value of tax concessions
As one might expect, the Spanish system delivers disproportionately to children in the
higher deciles in both Austria and the UK. Although in Spain it fails to deliver to low
income children this is not the case for children in the Austrian bottom decile group or for
British children in the bottom two deciles: the shares of spending roughly match the
30
shares of children. This is because once the small parts of the Spanish system that target
low incomes have been inflated to Austrian and UK levels of spending, they are generous
enough to make a significant difference. Nevertheless, the UK system delivers more to
these groups in both Austria and the UK, whereas the Austrian system delivers more to
the bottom two deciles in the UK than in Austria. It is children in middle income groups in
UK and Austria who lose out particularly from the Spanish system.
The UK structure of spending on children strongly favours the lower income groups –
wherever it is implemented the share of expenditure received by children in households
in the top 60% is less than their share of children. In contrast to the effect within the UK
– where children in the bottom 30% benefit disproportionately - the main effect in
Austria is concentrated in the bottom decile group and in Spain the only positive effect is
in the bottom decile group. Also, while the UK system fails to deliver proportionately to
children in the middle and top of the distribution in the UK, this is far less strongly the
case when the system is implemented in either of the other two countries, with the
exception of children in the top Spanish decile group.
6 The effects of the three policy strategies on child poverty
This section assesses the relative success of the three approaches to meeting the goal of
reducing child poverty. Figure 8 shows to what extent the three country’s child policies
are able to reduce child poverty rates compared with the (hypothetical) scenario without
any child targeted spending. To give a more comprehensive picture the comparison is
carried out using three levels of the poverty threshold: 50% of median income in the first
group of bars, 60% in the second and 70% in the third.30
It is striking that while in Austria and UK all child policy strategies are able to reduce
child poverty rates considerably (though to different extents), the reduction is very
moderate in Spain. Austrian and UK policies are slightly more successful than Spain’s
own policies, with Austrian policies achieving most. But even Austrian policies only
reduce the child poverty rate at the 60% threshold from 27% to 24%. Considering the
average per child spending in the bottom income decile group amounts to €34 with the
Austrian, €20 with the Spanish and €48 with the UK strategy, it is hardly surprising that
keeping children out of poverty is not very successful under any of them.
30 The base for calculating the poverty line in all four scenarios is the (equivalised) median income under the actual 2003 system in each country.
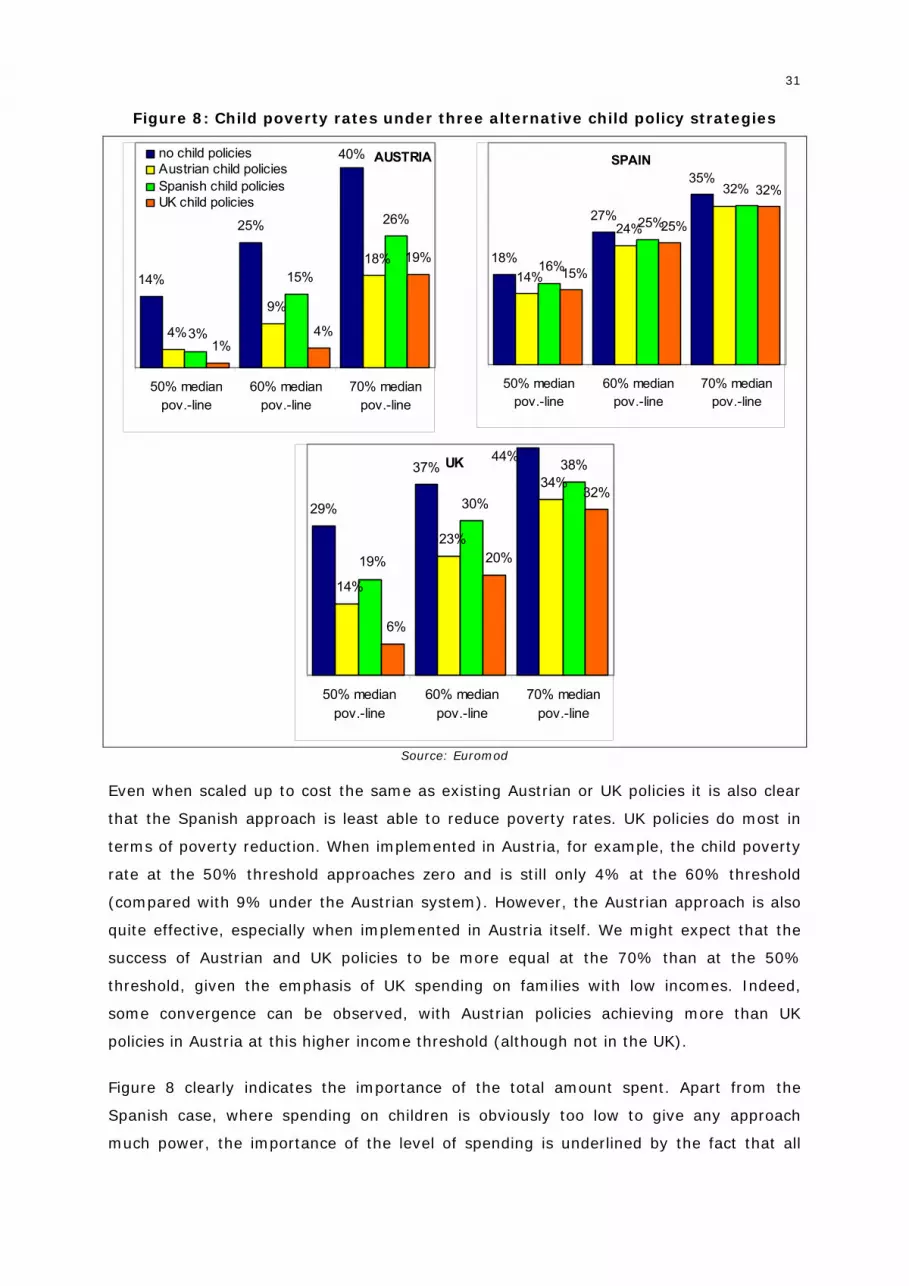
31
Figure 8: Child poverty rates under three alternative child policy strategies
AUSTRIA
14%
25%
40%
26%
19%
9%
4%
18%15%
3% 4%1%
50% medianpov.-line
60% medianpov.-line
70% medianpov.-line
no child policiesAustrian child policiesSpanish child policiesUK child policies
SPAIN
18%
27%
35%32%
24%
14%
32%
25%
16%
25%
15%
50% medianpov.-line
60% medianpov.-line
70% medianpov.-line
UK
29%
37% 38%
32%
44%
34%
14%
23%19%
30%
6%
20%
50% medianpov.-line
60% medianpov.-line
70% medianpov.-line
Source: Euromod
Even when scaled up to cost the same as existing Austrian or UK policies it is also clear
that the Spanish approach is least able to reduce poverty rates. UK policies do most in
terms of poverty reduction. When implemented in Austria, for example, the child poverty
rate at the 50% threshold approaches zero and is still only 4% at the 60% threshold
(compared with 9% under the Austrian system). However, the Austrian approach is also
quite effective, especially when implemented in Austria itself. We might expect that the
success of Austrian and UK policies to be more equal at the 70% than at the 50%
threshold, given the emphasis of UK spending on families with low incomes. Indeed,
some convergence can be observed, with Austrian policies achieving more than UK
policies in Austria at this higher income threshold (although not in the UK).
Figure 8 clearly indicates the importance of the total amount spent. Apart from the
Spanish case, where spending on children is obviously too low to give any approach
much power, the importance of the level of spending is underlined by the fact that all
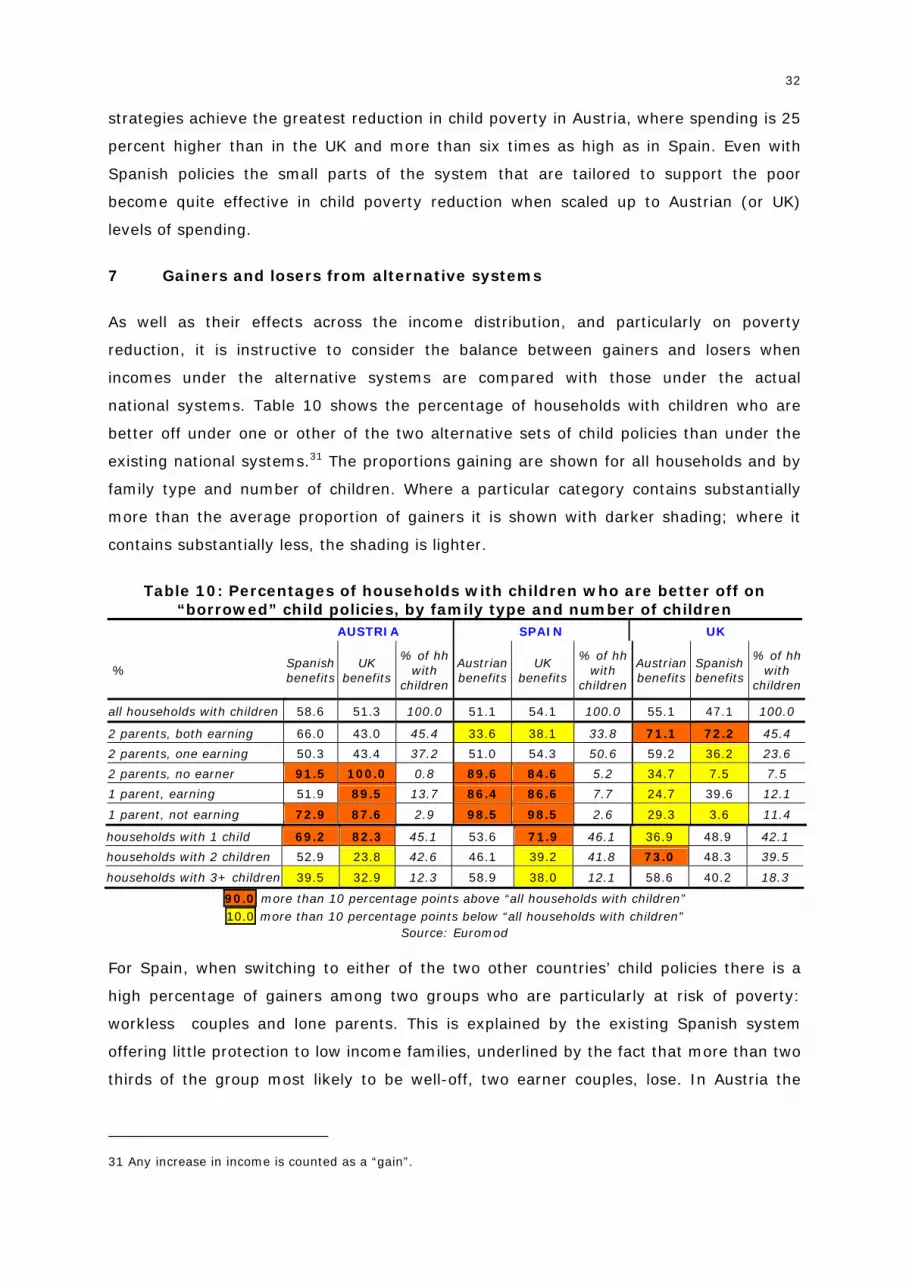
32
strategies achieve the greatest reduction in child poverty in Austria, where spending is 25
percent higher than in the UK and more than six times as high as in Spain. Even with
Spanish policies the small parts of the system that are tailored to support the poor
become quite effective in child poverty reduction when scaled up to Austrian (or UK)
levels of spending.
7 Gainers and losers from alternative systems
As well as their effects across the income distribution, and particularly on poverty
reduction, it is instructive to consider the balance between gainers and losers when
incomes under the alternative systems are compared with those under the actual
national systems. Table 10 shows the percentage of households with children who are
better off under one or other of the two alternative sets of child policies than under the
existing national systems.31 The proportions gaining are shown for all households and by
family type and number of children. Where a particular category contains substantially
more than the average proportion of gainers it is shown with darker shading; where it
contains substantially less, the shading is lighter.
Table 10: Percentages of households with children who are better off on “borrowed” child policies, by family type and number of children
AUSTRIA SPAIN UK
% Spanish benefits
UK benefits
% of hh with
children
Austrian benefits
UK benefits
% of hh with
children
Austrian benefits
Spanish benefits
% of hh with
children
all households with children 58.6 51.3 100.0 51.1 54.1 100.0 55.1 47.1 100.0
2 parents, both earning 66.0 43.0 45.4 33.6 38.1 33.8 71.1 72.2 45.4
2 parents, one earning 50.3 43.4 37.2 51.0 54.3 50.6 59.2 36.2 23.6
2 parents, no earner 91.5 100.0 0.8 89.6 84.6 5.2 34.7 7.5 7.5
1 parent, earning 51.9 89.5 13.7 86.4 86.6 7.7 24.7 39.6 12.1
1 parent, not earning 72.9 87.6 2.9 98.5 98.5 2.6 29.3 3.6 11.4
households with 1 child 69.2 82.3 45.1 53.6 71.9 46.1 36.9 48.9 42.1
households with 2 children 52.9 23.8 42.6 46.1 39.2 41.8 73.0 48.3 39.5
households with 3+ children 39.5 32.9 12.3 58.9 38.0 12.1 58.6 40.2 18.3
90.0 more than 10 percentage points above “all households with children” 10.0 more than 10 percentage points below “all households with children”
Source: Euromod
For Spain, when switching to either of the two other countries’ child policies there is a
high percentage of gainers among two groups who are particularly at risk of poverty:
workless couples and lone parents. This is explained by the existing Spanish system
offering little protection to low income families, underlined by the fact that more than two
thirds of the group most likely to be well-off, two earner couples, lose. In Austria the
31 Any increase in income is counted as a “gain”.

33
high percentage of gainers among lone parents, especially those not earning, may well
indicate that Austrian benefits could do better in protecting this highly vulnerable
group.32 A large percentage of UK two earner couples would gain with Austrian or
Spanish child policies in place, to the disadvantage of groups more likely to have low
income. With the Spanish benefits nearly everyone would lose within the workless
groups. This result again confirms the strong emphasis of UK child policies on low income
families.
Austrian and Spanish one child families are likely to gain by implementing UK benefits,
while UK one child families are more likely to lose with Austrian benefits in place. The
higher rate for the first child within the UK benefits and credits provides a likely
explanation. Table 11 shows similar information for children who are in households that
gain, by the age of the child.
Table 11: Percentages of children who are in households that gain from “borrowed” child policies, by age of child
AUSTRIA SPAIN UK
% Spanish benefits
UK benefits
% of children
Austrian benefits
UK benefits
% of children
Austrian benefits
Spanish benefits
% of children
all children 54.2 41.9 100.0 51.3 47.9 100.0 59.6 45.5 100.0
children aged 0 to 2 28.9 14.7 10.9 50.8 27.2 9.6 84.2 46.6 15.7
children aged 3 to 5 52.0 39.2 15.9 48.4 49.3 12.5 54.9 42.1 16.0
children aged 6 to 8 55.2 34.4 17.6 47.2 46.5 16.2 56.5 41.1 17.7
children aged 9 to 11 56.1 49.0 17.7 53.6 52.0 20.6 53.4 41.4 17.3
children aged 12 to 14 59.2 48.0 18.9 52.7 49.1 19.6 54.7 47.2 17.6
children aged 15 to 17 62.9 54.3 18.9 52.9 52.2 21.6 55.4 55.8 15.7
90.0 more than 10 percentage points above “all households with children” 10.0 more than 10 percentage points below “all households with children”
Source: Euromod
Many young Austrian children would lose with either of the other country’s child policies.
The same is true for young Spanish children with UK benefits in place. On the other hand
a large proportion of children aged under three in UK would be better off with Austrian
benefits. This reflects the effects of especially the Austrian but also the Spanish benefits
targeted at very young children.
8 Concluding remarks
Our aim has been to explore which aspects of the design of support for children matters
most. To do this we have focused on three countries with substantially different
32 In Austria the workless couple group is very small, making unreliable an interpretation based on just a few (nine) sample cases.

34
approaches, each of have increased child targeted spending in the recent past: Austria,
Spain and the UK.
The investigation of the 2003 structure of cash benefits and tax expenditures targeted
specifically on children confirmed our expectations about the characteristics of the three
country’s strategies: Austria makes use of relatively generous universal benefits, with
targeting restricted to especially vulnerable population groups. Thus child targeted
spending is rather evenly distributed by household income. Spanish child policy relies to
a large extent on tax concessions. Correspondingly we found a clearly “pro rich”
distribution of Spanish expenditure on children, with a very modest addition to the level
spending on the very poor. The UK puts much more weight on means testing (and
“affluence testing”) than the other two countries. This is reflected in our results by
showing higher spending on children in the lower income groups which is not confined to
the very poorest but affects children in the bottom third of the household income
distribution.
The level of child targeted spending also varies across the countries considered. Austria
spends on average 220€ per month per child. This is 26 percent more than the amount
spent in the UK (174€), or 22 percent once adjusted for purchasing power. The Spanish
system falls far short of the other countries’ level of expenditure, by spending only 33 €
monthly per child.
There are some conclusions in relation to child poverty that we can draw about the three
systems of support for children that apply regardless of which country they are
implemented in. On vertical equity grounds, UK policies are the most successful at
reducing child poverty, in all three countries and using a range of proportions of the
median as poverty thresholds. The Spanish system is the least successful, even when it
is scaled up. There is a crucial role for an adequate level of spending, regardless of its
structure. In Spain the level spending is too low to give any approach much power,
whereas all strategies achieved the best results in Austria (in the sense of both the
lowest child poverty rates and the greatest proportional reduction in poverty rates
relative to the “before child policies” scenario). Even with Spanish policies the parts
tailored to support the poor reduce child poverty effectively, once they are paid at a
sufficient level.
In terms of horizontal equity, the Austrian system generates the highest redistribution
from childless individuals to families with children and guarantees the right to a similar
level of protection for all children regardless their parent’s income position in all
countries. On the other hand, with both a low expenditure level and a distribution biased

35
towards higher income families, the Spanish policies can hardly achieve any equity
objective.
There are also factors that are different across countries that result in differential effects
from the same system of child policies. Some of these differences relate to the
circumstances of children and their families. So, for example, a benefit targeted on
working mothers of young children (as in the Spanish system) will cost less to implement
in a country where few such mothers are in work (as in Austria). This results in the
budget-neutral payment being higher for those Austrian mothers who do in fact qualify.
Some of the differences relate to the nature of the tax-benefit system into which the
borrowed policies are implemented. The value of the Spanish child tax allowances
depends on the tax schedule so in a country like the UK where the progression in the
schedule is low, the value of the allowance does not increase with income as much as it
does in Spain.
There are some particular aspects of national policies which seem to be effective in one
or both of the other two countries – suggesting directions for actual reform in these
countries. For example, the way UK policies impact on lone parent families and one-child
families in both Austria and Spain seems particularly positive (Table 10). Both Austria
and Spain have explicit policies for young children but it is only the Austrian policies –
which support parents who take leave from work to look after their own children - that
have a net positive impact on children in the UK. The Spanish approach is to support
mothers of young children who do work. Both the Spanish and Austrian systems are
better at supporting children in high and middle income households than the UK system.
Comparing the effectiveness of the Austrian and UK systems in reducing child poverty is
of particular interest. While the means-tested system is inevitably more effective at
targeting those at risk of poverty, the Austrian system, even when scaled down to be
budget-neutral, is only slightly less effective in the UK at the 60% and 70% median
poverty thresholds than the UK system (a difference of 2 and 3 percentage points on the
child poverty rate, respectively). It is also worth noting that our calculation of means-
tested benefit entitlements assumes full take-up in spite of the fact that there is evidence
that these benefits may not always be claimed due to stigma, costs of claiming or lack of
information. Thus we do not make comparisons on a “level playing field” and any
calculations which did take non-take-up into account would narrow the gap between the
poverty reduction achievements of the Austrian system and those of the UK system.33
33 Modelling of the take-up of benefits “borrowed” from another system would need to make assumptions about the administration of the benefit and the culture of claiming within the specific national context. This would be challenging.

36
Furthermore, our investigation does not take behavioural reactions into account. These
might be important in two ways. On the one hand, introduction of an alternative system
may result in some second round behavioural adjustment that is not captured in our
calculations. On the other hand, and more importantly for understanding the differential
effects of the same policies in different national contexts, the existing patterns of
behaviour and income receipt in each case have been influenced by the prevailing tax
and benefit system. As described in the introduction to this paper, this is one among
several inter-linked determinants of the economic position of children. Indeed it is well
known that income targeting can have adverse effects on work incentives. The high
poverty rates before child targeted spending of UK children shown in Figure 8 may well
be influenced by this. Long term expectations about the role of benefits in supporting
children may also have an effect. The pre-child spending poverty rates for Spain are
relatively low suggesting that Spanish parents are more likely than their British
counterparts to live in households where they are protected from poverty by the incomes
of others, or indeed that they must postpone parenthood until their own incomes are
sufficient to support their children.
We have focussed on the effects of the systems of support for children on child poverty
rates, on the groups gaining and losing from alternative systems, and on the net effects
across the whole income distribution. There are many other aspects that might be
considered, including the effect on parental work incentives of the alternative systems,
the role of benefits not specifically targeted on children but received by parents, the role
of non-cash support for parents (such as child-care subsidies) or of the incomes of other
household members (such as adult siblings or grandparents). Nevertheless, this study
has demonstrated the potential – and some of the complications – of comparing systems
of support by “swapping” them between countries. This method using microsimulation
allows us to distinguish between the effects of level of spending, the relative importance
of policy structure and design, and the differential impacts of policies in particular
national contexts.
References Adam S., M. Brewer and H. Reed (2002), “The benefits of parenting: Government financial support for families with children since 1975”, IFS Commentaries, C91, London, Institute for Fiscal Studies.
Aliaga C. (2005), “Gender gaps in the reconciliation between work and family life”, Statistics in Focus Theme 3 4/2005, Eurostat.
Atkinson, A.B. (1998), Poverty in Europe. Oxford: Blackwell Publishers.
Blair T. (1999), in R. Walker (ed.), Ending Child Poverty. London: Policy Press.
Abstract
We compare three EU countries that have recently experienced substantial but very different reforms of their family support systems: Austria, Spain and the UK. The structure of these systems is different: Austria emphases universal benefits, Spain tax concessions and the UK means-tested benefits. First the paper compares the distributional implications of these three approaches. The recent reforms have reinforced existing structures while increasing the amount of spending for children. The second step is to ask: What would have happened if these countries had transformed the architecture of their systems in either of the other two directions? We use EUROMOD, the European tax-benefit microsimulation model that is designed for making cross-country comparisons and answering “what if” questions such as these. We find that the three factors that can be distinguished – the level of spending, its structure, and the way it impacts in a national context – are all important to varying degrees.
Keywords Children, European Union, policy reform, microsimulation
JEL Classification C8, I3

37
Bradbury B. (2004), “The Price, Cost, Consumption and Value of Children”, SPRC Discussion Paper No. 132
Bradshaw J. and N. Finch (2002), A Comparison of Child Benefit Packages in 22 Countries. Department for Work and Pensions Research Report No. 174, London: CDS.
Brewer M. (2003), “The new tax credits” IFS Briefing Notes, London, Institute for Fiscal Studies.
Buhmann B., L. Rainwater, G. Schmaus, and T. Smeeding (1988), “Equivalence scales, well-being, inequality and poverty: Sensitivity estimates across ten countries using the Luxembourg Income Study (LIS) database”, Review of Income and Wealth, 34, 115-142.
Chen W-H and M. Corak (2005), “Child Poverty and Changes in Child Poverty”, Innocenti Working Paper No. 2005-02. Florence: UNICEF Innocenti Research Centre.
Corak, M (2005), ‘Principles and Practicalities in Measuring Child Poverty for the Rich Countries’. Innocenti Working Paper No. 2005-01. Florence, UNICEF Innocenti Research Centre.
Corak M., C. Lietz and H. Sutherland (2005), “The Impact of Tax and Transfer Systems on Children in the European Union”, Innocenti Working Paper No. 2005-04. Florence, UNICEF Innocenti Research Centre.
Deaton A., and J. Muellbauer (1986), “On measuring child costs: with applications to poor countries”, Journal of Political Economy, 94(4), August, pp. 720-44.
Dennis I. and A-C Guio (2003), “Poverty and Social Exclusion in the EU after Laeken- Part 1”, Statistics in Focus Theme 3 8/2003, Eurostat.
Dennis I. and A-C. Guio (2004), “Poverty and Social Exclusion in the EU”, Statistics in Focus Theme 3 16/2004, Eurostat.
Esping-Andersen G. (1999), Social foundations of post-industrial economies. Oxford: Oxford University Press.
Eurostat (2005), ‘European social statistics, Social protection, Expenditure and receipts’, Luxembourg, European Communities.
Gregg P., S. Harkness and S. Machin (1999), “Poor Kids: Trends in Child Poverty in Britain, 1968-1996”. Fiscal Studies, 20(2), pp. 163-188.
Immervoll H., C. O’Donoghue and H. Sutherland (1999), “An Introduction to EUROMOD”, EUROMOD Working Paper EM0/99. Microsimulation Unit, Department of Applied Economics, University of Cambridge.
Jenkins S.P. and F. Cowell (1994), “Parametric equivalence scales and scale relativities”, The Economic Journal, vol. 104, pp. 891-900.
Piachaud D and H Sutherland (2000), “How Effective is the British Government’s Attempt to Reduce Child Poverty?”, Innocenti Working Paper No. 2000-77. Florence, UNICEF Innocenti Research Centre.
Rothbarth E. (1943), “Note on a Method of Determining Equivalent Income for Families of Different Composition”, in Madge (ed) War-Time Pattern of Saving and Expenditure, Cambridge University Press, Cambridge.
Sutherland H. (2000), “EUROMOD: A Tax-Benefit Model for the European Union”, Transfer, 6 (2) 312-316.
Sutherland H. (2001), “EUROMOD: An Integrated European Benefit-Tax Model, Final Report”, EUROMOD Working Paper EM9/01. Microsimulation Unit, Department of Applied Economics, University of Cambridge.
UNICEF (2005), Child Poverty in Rich Countries, 2005, Innocenti Report Card No. 6. Florence: UNICEF Innocenti Research Centre.

About ENEPRI he European Network of Economic Policy Research Institutes (ENEPRI) is composed of leading socio-economic research institutes in practically all EU member states and candidate countries that are committed to working together to develop and consolidate a European agenda of research.
ENEPRI was launched in 2000 by the Brussels-based Centre for European Policy Studies (CEPS), which provides overall coordination for the initiative.
While the European construction has made gigantic steps forward in the recent past, the European dimension of research seems to have been overlooked. The provision of economic analysis at the European level, however, is a fundamental prerequisite to the successful understanding of the achievements and challenges that lie ahead. ENEPRI aims to fill this gap by pooling the research efforts of its different member institutes in their respective areas of specialisation and to encourage an explicit European-wide approach.
ENEPRI is composed of the following member institutes:
CASE Center for Social and Economic Research, Warsaw, Poland CEE Center for Economics and Econometrics, Bogazici University, Istanbul, Turkey CEPII Centre d’Études Prospectives et d’Informations Internationales, Paris, France CEPS Centre for European Policy Studies, Brussels, Belgium CERGE-EI Centre for Economic Research and Graduated Education, Charles University, Prague,
Czech Republic CPB Netherlands Bureau for Economic Policy Analysis, The Hague, The Netherlands DIW Deutsches Institut für Wirtschaftsforschung, Berlin, Germany ESRI Economic and Social Research Institute, Dublin, Ireland ETLA Research Institute for the Finnish Economy, Helsinki, Finland FEDEA Fundación de Estudios de Economía Aplicada, Madrid, Spain FPB Federal Planning Bureau, Brussels, Belgium IE-BAS Institute of Economics, Bulgarian Academy of Sciences, Sofia, Bulgaria IER Institute for Economic Research, Bratislava, Slovakia IER Institute for Economic Research, Ljubljana, Slovenia IHS Institute for Advanced Studies, Vienna, Austria ISAE Istituto di Studi e Analisi Economica, Rome, Italy NIER National Institute of Economic Research, Stockholm, Sweden NIESR National Institute of Economic and Social Research, London, UK NOBE Niezalezny Osrodek Bana Ekonomicznych, Lodz, Poland PRAXIS Center for Policy Studies, Tallinn, Estonia RCEP Romanian Centre for Economic Policies, Bucharest, Romania SSB Research Department, Statistics Norway, Oslo, Norway SFI Danish National Institute of Social Research, Copenhagen, Denmark TÁRKI Social Research Centre Inc., Budapest, Hungary ENEPRI publications include three series: Research Reports, which consist of papers presenting the findings and conclusions of research undertaken in the context of ENEPRI research projects; Working Papers, which constitute dissemination to a wider public of research undertaken and already published by ENEPRI partner institutes on their own account; and thirdly, Occasional Papers (closed series) containing a synthesis of the research presented at workshops organised during the first years of the network’s existence.
European Network of Economic Policy Research Institutes c/o Centre for European Policy Studies
Place du Congrès 1 ▪ 1000 Brussels ▪ Tel: 32(0) 229.39.11 ▪ Fax: 32(0) 219.41.51 Website: http//:www.enepri.org ▪ E-mail: [email protected]
T


