Embed Size (px)
Citation preview
Ambient Monitoring System (AMS) Program Quality Assurance Project Plan
February 2017 (Version 2.0)
Prepared by: NORTH CAROLINA DEPARTMENT OF ENVIRONMENTAL QUALITY
Division of Water Resources Water Sciences Section Ecosystems Branch

Page | i
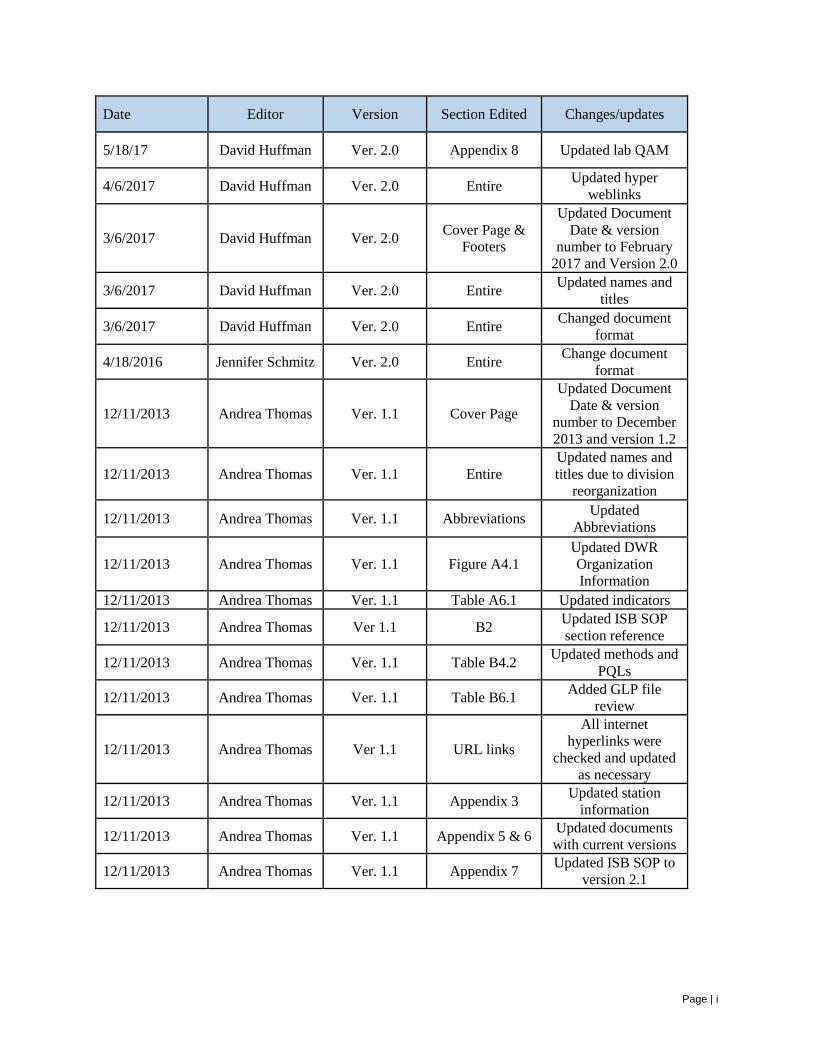
Date Editor Version Section Edited Changes/updates
5/18/17 David Huffman Ver. 2.0 Appendix 8 Updated lab QAM
4/6/2017 David Huffman Ver. 2.0 Entire Updated hyper weblinks
3/6/2017 David Huffman Ver. 2.0 Cover Page & Footers
Updated Document Date & version
number to February 2017 and Version 2.0
3/6/2017 David Huffman Ver. 2.0 Entire Updated names and titles
3/6/2017 David Huffman Ver. 2.0 Entire Changed document format
4/18/2016 Jennifer Schmitz Ver. 2.0 Entire Change document format
12/11/2013 Andrea Thomas Ver. 1.1 Cover Page
Updated Document Date & version
number to December 2013 and version 1.2
12/11/2013 Andrea Thomas Ver. 1.1 Entire Updated names and titles due to division
reorganization
12/11/2013 Andrea Thomas Ver. 1.1 Abbreviations Updated Abbreviations
12/11/2013 Andrea Thomas Ver. 1.1 Figure A4.1 Updated DWR Organization Information
12/11/2013 Andrea Thomas Ver. 1.1 Table A6.1 Updated indicators
12/11/2013 Andrea Thomas Ver 1.1 B2 Updated ISB SOP section reference
12/11/2013 Andrea Thomas Ver. 1.1 Table B4.2 Updated methods and PQLs
12/11/2013 Andrea Thomas Ver. 1.1 Table B6.1 Added GLP file review
12/11/2013 Andrea Thomas Ver 1.1 URL links
All internet hyperlinks were
checked and updated as necessary
12/11/2013 Andrea Thomas Ver. 1.1 Appendix 3 Updated station information
12/11/2013 Andrea Thomas Ver. 1.1 Appendix 5 & 6 Updated documents with current versions
12/11/2013 Andrea Thomas Ver. 1.1 Appendix 7 Updated ISB SOP to version 2.1

Page | ii
Date Editor Version Section Edited Changes/updates
12/1/2011 Andrea Thomas Ver. 1.0 Cover Page & Footers
Updated Document Date & version
number to December 2011 and version 1.1
12/1/2011 Andrea Thomas Ver. 1.0 Abbreviations Updated Abbreviations
12/1/2011 Andrea Thomas Ver. 1.0 Revision Log Added Revision Log
12/1/2011 Andrea Thomas Ver. 1.0 Table of Contents
Updated page numbers and Appendices
12/1/2011 Andrea Thomas Ver. 1.0 Entire
Updated names and titles, removed WARO lab and
NRRT and replaced PRRT with EMT
12/1/2011 Andrea Thomas Ver. 1.0 URL links
All internet hyperlinks were
checked and updated as necessary
12/1/2011 Andrea Thomas Ver. 1.0 Figure A4.1
Removed NRRT and WARO Lab,
Replaced PRRT with EMT
12/1/2011 Andrea Thomas Ver. 1.0 A6, B1 Revised active station numbers
12/1/2011 Andrea Thomas Ver. 1.0 Figures A6.1, B1.1
Updated map with active stations
12/1/2011 Andrea Thomas Ver. 1.0 Table A6.1 Updated core and
site-specific indicators
12/1/2011 Andrea Thomas Ver. 1.0 Table A6.2 Replace table with Figure A6.2
12/1/2011 Andrea Thomas Ver. 1.0 Appendix 3
Removed Appendix 3 and replaced with
reference to BPU’s website
12/1/2011 Andrea Thomas Ver. 1.0 A9 Added Environmental Indicators Report
12/1/2011 Andrea Thomas Ver. 1.0 Tables B1.1, B1.2
Updated Indicator lists and replaced action levels with
standard
12/1/2011 Andrea Thomas Ver. 1.0 Tables B2.1, B2.2
Updated tables and removed ISU column
12/1/2011 Andrea Thomas Ver. 1.0 Table B4.1 Updated ISU SOP
sections and removed reference point row
Page | iii
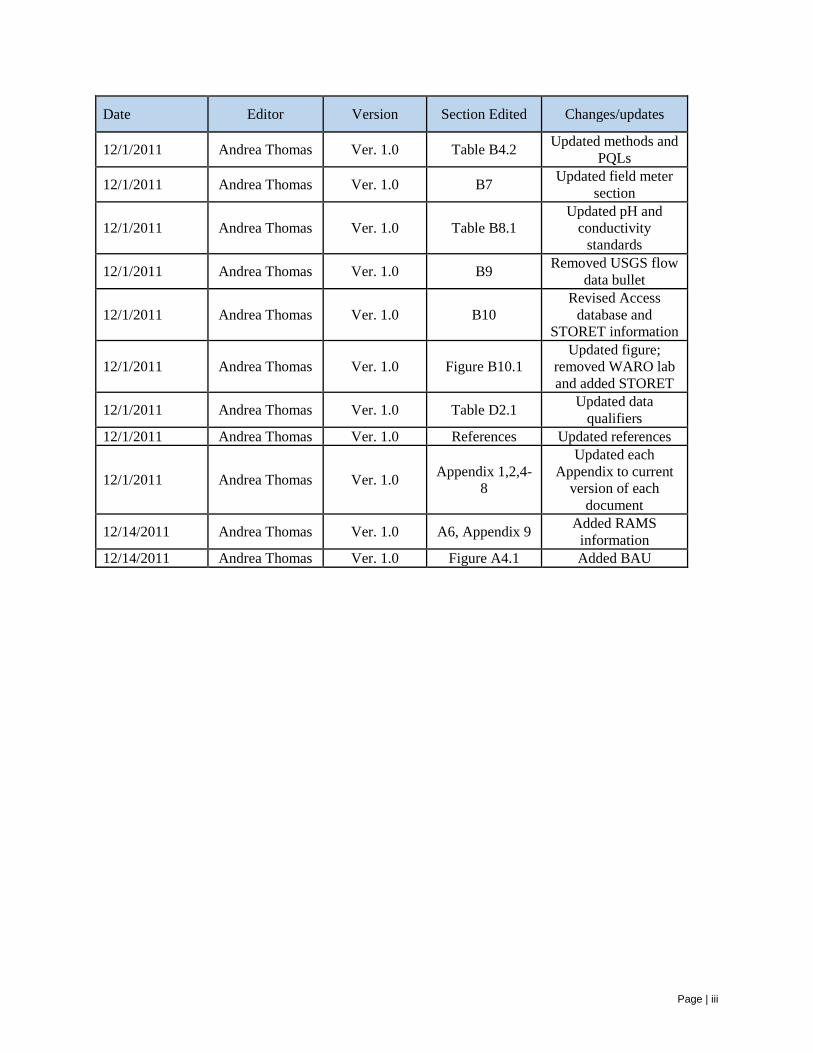
Date Editor Version Section Edited Changes/updates
12/1/2011 Andrea Thomas Ver. 1.0 Table B4.2 Updated methods and PQLs
12/1/2011 Andrea Thomas Ver. 1.0 B7 Updated field meter section
12/1/2011 Andrea Thomas Ver. 1.0 Table B8.1 Updated pH and
conductivity standards
12/1/2011 Andrea Thomas Ver. 1.0 B9 Removed USGS flow data bullet
12/1/2011 Andrea Thomas Ver. 1.0 B10 Revised Access
database and STORET information
12/1/2011 Andrea Thomas Ver. 1.0 Figure B10.1 Updated figure;
removed WARO lab and added STORET
12/1/2011 Andrea Thomas Ver. 1.0 Table D2.1 Updated data qualifiers
12/1/2011 Andrea Thomas Ver. 1.0 References Updated references
12/1/2011 Andrea Thomas Ver. 1.0 Appendix 1,2,4-8
Updated each Appendix to current
version of each document
12/14/2011 Andrea Thomas Ver. 1.0 A6, Appendix 9 Added RAMS information
12/14/2011 Andrea Thomas Ver. 1.0 Figure A4.1 Added BAU
Page | 1
1.0 PROJECT MANAGEMENT ......................................................................................................... 3
1.1 PRIMARY DISTRIBUTION LIST ....................................................................................................... 3 1.1.1 Primary Distribution ................................................................................................................. 3 1.1.2 Regional Office Supervisors ...................................................................................................... 3 1.1.3 Regional Office Ambient Monitoring Technicians .................................................................... 3 1.1.4 Water Planning Section ............................................................................................................ 4
1.2 COURTESY DISTRIBUTION LIST: ................................................................................................... 4 1.3 PROJECT ORGANIZATION .............................................................................................................. 4
1.3.1 Project Management and Oversight ......................................................................................... 5 1.3.2 Field activities ........................................................................................................................... 6 1.3.3 Laboratory analyses .................................................................................................................. 6 1.3.4 Water Planning Section ............................................................................................................ 7 1.3.5 U.S. EPA ................................................................................................................................... 7
1.4 PROBLEM DEFINITION AND BACKGROUND ................................................................................... 7 1.4.1 Introduction ............................................................................................................................... 7 1.4.2 Stream classifications and water quality standards .................................................................. 7
1.5 AMS OBJECTIVES ......................................................................................................................... 9 1.6 PROJECT/TASK DESCRIPTION AND SCHEDULE ............................................................................ 10
1.6.1 Overview ................................................................................................................................. 10 1.6.2 Water quality indicators .......................................................................................................... 11 1.6.3 Sampling schedule................................................................................................................... 12 1.6.4 Measurement methods overview ............................................................................................. 12 1.6.5 Data management ................................................................................................................... 13 1.6.6 Reporting ................................................................................................................................. 13
1.7 QUALITY OBJECTIVES AND CRITERIA ......................................................................................... 16 1.7.1 Precision, Accuracy, and Sensitivity: ...................................................................................... 16 1.7.2 Bias ......................................................................................................................................... 16 1.7.3 Representativeness .................................................................................................................. 17 1.7.4 Comparability ......................................................................................................................... 17 1.7.5 Completeness .......................................................................................................................... 17
1.8 SPECIAL TRAINING/CERTIFICATIONS .......................................................................................... 17 1.8.1 Field staff ................................................................................................................................ 17 1.8.2 Laboratory (analytical) staff ................................................................................................... 18
1.9 DOCUMENTATION AND RECORDS ............................................................................................... 18 1.9.1 Quality assurance information, SOPs, and other support documentation.............................. 18 1.9.2 Project Records ....................................................................................................................... 19 1.9.3 Electronic data storage ........................................................................................................... 19 1.9.4 Data assessment reports ......................................................................................................... 19 1.9.5 Data report package: Ambient Monitoring Reports ............................................................... 20 1.9.6 Data report package: Annual Fecal Coliform Screening ....................................................... 20 1.9.7 Data report package: Environmental Indicators Report ........................................................ 20
2.0 DATA GENERATION AND ACQUISTION ............................................................................. 21
2.1 SAMPLING PROCESS DESIGN ....................................................................................................... 21 2.1.1 Station locations ...................................................................................................................... 21 2.1.2 Indicators measured and sampling frequency ........................................................................ 22 2.1.3 Sampling and measurements ................................................................................................... 23
Page | 2
2.2 SAMPLING METHODS .................................................................................................................. 24 2.2.1 Field measurements ................................................................................................................ 24 2.2.2 Samples ................................................................................................................................... 24 2.2.3 Equipment and disposables ..................................................................................................... 25
2.3 SAMPLE HANDLING AND CUSTODY ............................................................................................ 26 2.3.1 Sample preservation ................................................................................................................ 26 2.3.2 Sample submission forms ........................................................................................................ 26 2.3.3 Sample identification tags ....................................................................................................... 27 2.3.4 Sample transport ..................................................................................................................... 28
2.4 LABORATORY .............................................................................................................................. 28 2.5 ANALYTICAL METHODS .............................................................................................................. 28
2.5.1 Field measurements ................................................................................................................ 28 2.5.2 Lab analyses ............................................................................................................................ 28
2.6 QUALITY CONTROL ..................................................................................................................... 29 2.6.1 Field activities ......................................................................................................................... 29 2.6.2 Laboratory activities ............................................................................................................... 29
2.7 INSTRUMENT/EQUIPMENT TESTING, INSPECTION, AND MAINTENANCE ..................................... 30 2.7.1 Field Equipment Maintenance ................................................................................................ 30 2.7.2 Calibration and Testing .......................................................................................................... 30 2.7.3 Laboratory analytical equipment ............................................................................................ 32
2.8 INSPECTION/ACCEPTANCE REQUIREMENTS FOR SUPPLIES AND CONSUMABLES ....................... 32 2.9 DATA MANAGEMENT .................................................................................................................. 33
3.0 ASSESSMENT AND OVERSIGHT ........................................................................................... 35
3.1 ASSESSMENTS & RESPONSE ACTIONS ........................................................................................ 35 3.2 REPORTS TO MANAGEMENT ....................................................................................................... 35
4.0 DATA VALIDATION AND USABILITY .................................................................................. 36
4.1 DATA REVIEW, VERIFICATION, AND VALIDATION ..................................................................... 36 4.2 VALIDATION AND VERIFICATION METHODS .............................................................................. 36
4.2.1 Field staff ................................................................................................................................ 36 4.2.2 Laboratories ............................................................................................................................ 36 4.2.3 AMS Coordinator .................................................................................................................... 38 4.2.4 Data end-users ........................................................................................................................ 38
4.3 RECONCILIATION WITH USER REQUIREMENTS .......................................................................... 39
5.0 REFERENCES .............................................................................................................................. 41
APPENDICES
1. Organizational Information 2. NC Water Quality Standards Summary 3. Station Information 4. Data Review Checklists and Methods 5. Intensive Survey Branch SOP 6. Laboratory Section QA Information 7. Random Ambient Monitoring System Information
Page | 3
1.0 PROJECT MANAGEMENT
1.1 Primary Distribution List
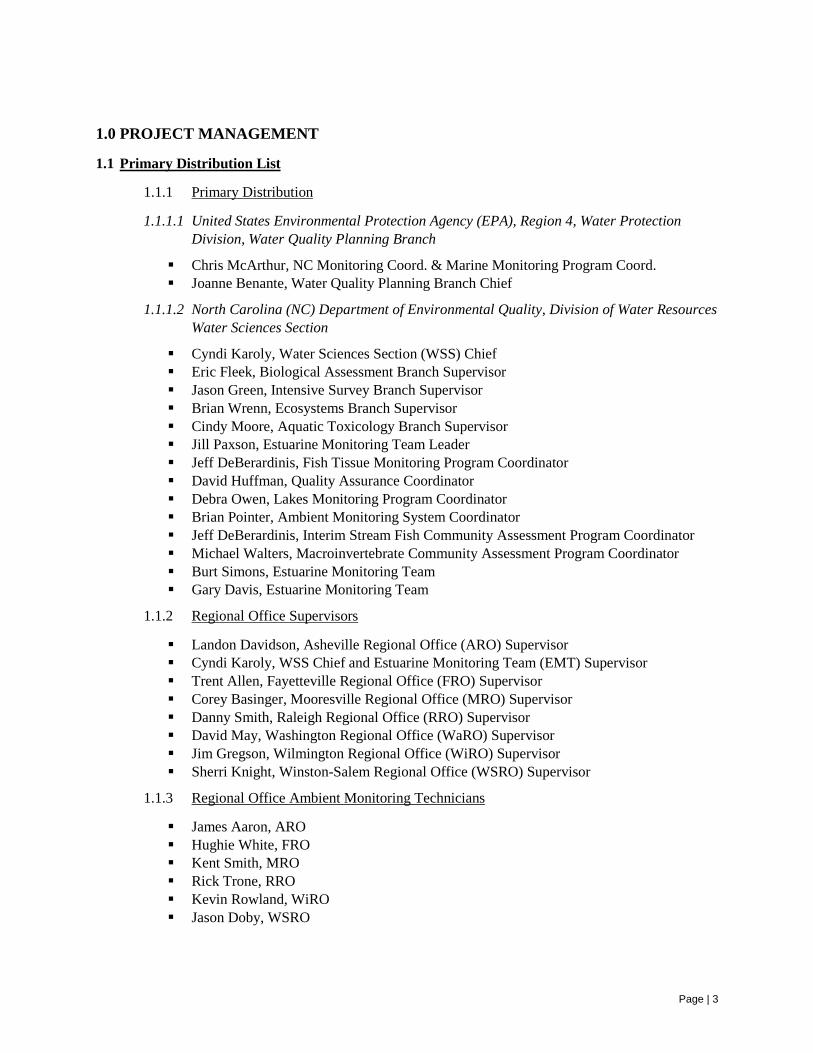
1.1.1 Primary Distribution
1.1.1.1 United States Environmental Protection Agency (EPA), Region 4, Water Protection Division, Water Quality Planning Branch
Chris McArthur, NC Monitoring Coord. & Marine Monitoring Program Coord. Joanne Benante, Water Quality Planning Branch Chief
1.1.1.2 North Carolina (NC) Department of Environmental Quality, Division of Water Resources Water Sciences Section
Cyndi Karoly, Water Sciences Section (WSS) Chief Eric Fleek, Biological Assessment Branch Supervisor Jason Green, Intensive Survey Branch Supervisor Brian Wrenn, Ecosystems Branch Supervisor Cindy Moore, Aquatic Toxicology Branch Supervisor Jill Paxson, Estuarine Monitoring Team Leader Jeff DeBerardinis, Fish Tissue Monitoring Program Coordinator David Huffman, Quality Assurance Coordinator Debra Owen, Lakes Monitoring Program Coordinator Brian Pointer, Ambient Monitoring System Coordinator Jeff DeBerardinis, Interim Stream Fish Community Assessment Program Coordinator Michael Walters, Macroinvertebrate Community Assessment Program Coordinator Burt Simons, Estuarine Monitoring Team Gary Davis, Estuarine Monitoring Team
1.1.2 Regional Office Supervisors
Landon Davidson, Asheville Regional Office (ARO) Supervisor Cyndi Karoly, WSS Chief and Estuarine Monitoring Team (EMT) Supervisor Trent Allen, Fayetteville Regional Office (FRO) Supervisor Corey Basinger, Mooresville Regional Office (MRO) Supervisor Danny Smith, Raleigh Regional Office (RRO) Supervisor David May, Washington Regional Office (WaRO) Supervisor Jim Gregson, Wilmington Regional Office (WiRO) Supervisor Sherri Knight, Winston-Salem Regional Office (WSRO) Supervisor
1.1.3 Regional Office Ambient Monitoring Technicians
James Aaron, ARO Hughie White, FRO Kent Smith, MRO Rick Trone, RRO Kevin Rowland, WiRO Jason Doby, WSRO
Page | 4
1.1.4 Water Planning Section
Tom Fransen, Water Planning Section Chief
1.2 Courtesy Distribution List
Jay Zimmerman, NC Division of Water Resources Director Linda Culpepper, NC Division of Water Resources Deputy Director Nick Jones, Laboratory Quality Assurance/Quality Control Officer Jeff Poupart, Water Quality Permitting Section Chief Jon Risgaard, Water Quality Regional Operations Section Chief Ian McMillian, Basin Planning Branch Supervisor Pam Behm, Modeling & Assessment Branch Supervisor
1.3 Project Organization
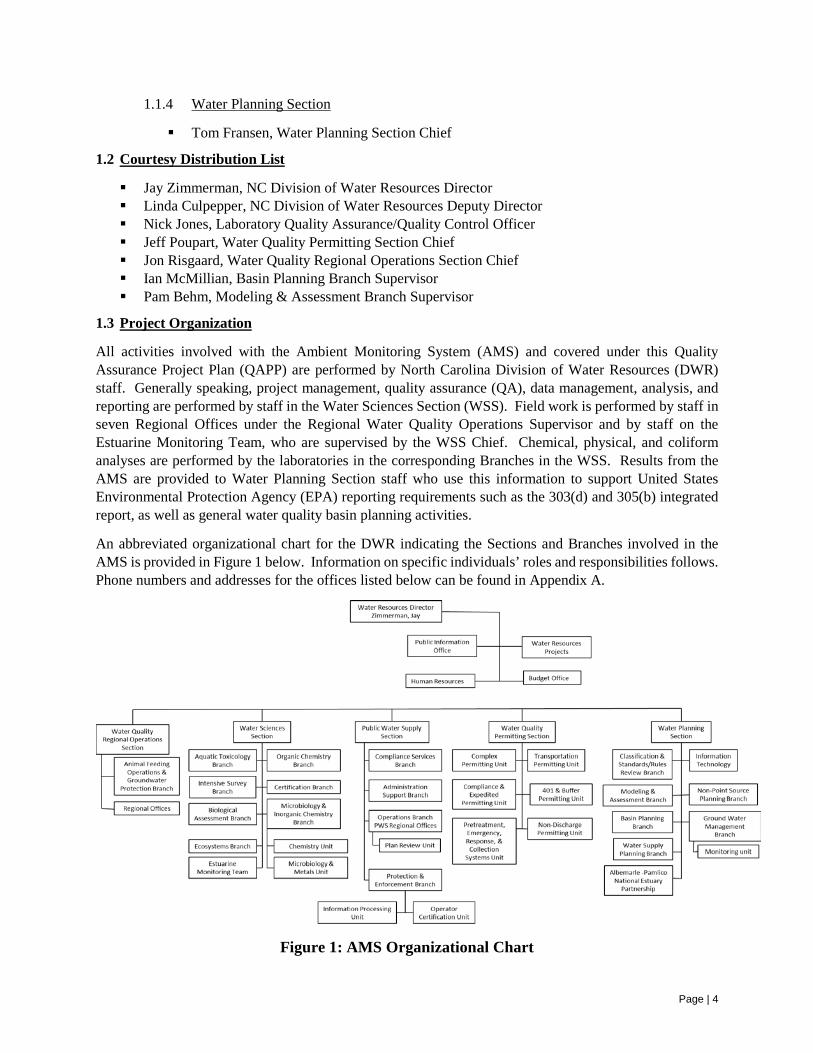
All activities involved with the Ambient Monitoring System (AMS) and covered under this Quality Assurance Project Plan (QAPP) are performed by North Carolina Division of Water Resources (DWR) staff. Generally speaking, project management, quality assurance (QA), data management, analysis, and reporting are performed by staff in the Water Sciences Section (WSS). Field work is performed by staff in seven Regional Offices under the Regional Water Quality Operations Supervisor and by staff on the Estuarine Monitoring Team, who are supervised by the WSS Chief. Chemical, physical, and coliform analyses are performed by the laboratories in the corresponding Branches in the WSS. Results from the AMS are provided to Water Planning Section staff who use this information to support United States Environmental Protection Agency (EPA) reporting requirements such as the 303(d) and 305(b) integrated report, as well as general water quality basin planning activities.
An abbreviated organizational chart for the DWR indicating the Sections and Branches involved in the AMS is provided in Figure 1 below. Information on specific individuals’ roles and responsibilities follows. Phone numbers and addresses for the offices listed below can be found in Appendix A.
Figure 1: AMS Organizational Chart
Page | 5
1.3.1 Project Management and Oversight
1.3.1.1 Project Manager – Brian Wrenn, Supervisor, Ecosystems Branch
Supervises AMS Coordinator/Data Manager, Water Quality Analyst, and QA Coordinator. Ultimately responsible for ensuring that program is conducted in accordance with this
QAPP. Reviews and approves all reports, work plans, corrective actions, QAPPs, and any other
major work products and their revisions. Approves changes to program; ensures changes comply with DWR regulations and policies
as well as data user needs. Program development. Reports to Water Sciences Section Chief.
1.3.1.2 Project Coordinator/Data Manager – Brian Pointer, AMS Coordinator, Ecosystems Branch
Acts as liaison between program management, field staff, analytical laboratory, and data users.
Coordinates logistics of program, such as maintaining sampling schedule, producing and distributing sample submission forms to field staff, maintaining station information database, providing certain supplies.
Responds to issues raised by any program participant or outside party, identifies root causes and recommends response actions to the Project Manager.
Communicates needed or suggested changes to AMS to Project Manager for approval. Performs all aspects of data management, including tracking, compilation, review,
coordinating data entry by WSS support staff, identifying and correcting errors, and upload of data to databases. Maintains in-house databases. Responsible for STORET metadata maintenance and data upload.
Fulfills requests for raw data. Assists in training field staff. Performs field staff reviews, audits, and station visits to ensure compliance with QAPP and
SOPs and communicates needed corrective actions to Project Manager and field staff supervisors when needed.
Performs annual fecal coliform data screening and analysis.
1.3.1.3 Data Analyst – Tammy Hill, Water Quality Analyst, Ecosystems Branch
Performs data analysis and prepares Ambient Monitoring Reports. Summarizes RAMS data in reports. Performs other statistical analyses as required.
1.3.1.4 Project QA Coordinator – David Huffman, WSS QA Coordinator, Ecosystems Branch
Documents QA practices of AMS. Maintains AMS QAPP. Develops and recommends QA/QC improvements.
Page | 6
1.3.2 Field activities
1.3.2.1 Regional Office and Team Supervisors
Responsible for enforcing response or corrective actions of supervised field staff as necessary:
Landon Davidson, (ARO) Supervisor Cyndi Karoly, (EMT) Supervisor Trent Allen, (FRO) Supervisor Corey Basinger, (MRO) Supervisor Danny Smith, (RRO) Supervisor David May, (WaRO) Supervisor Jim Gregson, (WiRO) Supervisor Sherri Knighting, (WSRO) Supervisor
1.3.2.2 Field staff
Regional Office Ambient Monitoring Technicians:
- James Aaron, ARO - Hughie White, FRO - Kent Smith, MRO - Rick Trone, RRO - Kevin Rowland, WiRO - Jason Doby, WSRO
Estuarine Monitoring Team Intensive Survey Branch Staff (backup field staff)
- Perform all field activities including field measurements, observations, and sampling in accordance with QAPP and SOPs.
- Notify immediate Supervisor and AMS Coordinator of any issues encountered.
1.3.3 Laboratory analyses
1.3.3.1 Laboratory Administration
Manages both DWR laboratories (Central/Raleigh and Asheville), which perform all analyses on samples taken as part of the AMS.
Responsible for oversight of all analytical activities and for ensuring that all activities are performed in accordance with the Water Sciences Section Quality Assurance Manual (Appendix 8).
1.3.3.2 Laboratory Quality Assurance –Nick Jones, QA/QC Officer, Certification Branch
Responsible for establishing, implementing and coordinating a comprehensive QA/QC program for environmental sampling and analyses performed by the North Carolina Division of Water Resources Laboratory in the Water Sciences Section, and ensuring that environmental data operations are of a quality that meet or exceed requirements for informed decision making.
Page | 7
1.3.4 Water Planning Section
1.3.4.1 Tom Fransen, Section Chief, Water Planning Section
The Water Planning Section develops standards, rules and management strategies to protect water quality, carries out water supply planning, provides guidance to local water systems and monitors drought conditions. Three of the 8 Branches in the Section use the AMS data. These Branches include the Albemarle-Pamlico Estuary Partnership, Basin Planning Branch and Modeling & Assessment Branch. These Branches include numerous staff acting as primary end users of data produced by AMS.
Staff from Basin Planning and Modeling & Assessment Branches should:
- Provide input to AMS Coordinator and Project Manager on changes needed to AMS program as part of a continuous program assessment process.
- Report any data anomalies to AMS Coordinator and Project Manager.
1.3.5 U.S. EPA
1.3.5.1 EPA Region 4, Water Protection Division
Water Quality Planning Branch
- Review, provide comments, and approve QAPP and subsequent revisions on behalf of EPA Region 4.
- Perform mid-year and end of year assessments of all DWR monitoring programs, including the AMS, to determine progress on tasks listed in the annual §106 grant workplan.
- Review, provide comments, and approve biennial 303(d) list and subsequent revisions on behalf of EPA Region 4
1.4 Problem Definition and Background
1.4.1 Introduction
As part of funding agreements between the State and the Environmental Protection Agency (EPA), North Carolina agrees to monitor the waters of the state and report findings to the EPA, in order to support the goals of the Clean Water Act (CWA). The CWA defines as its objective:
“...to restore and maintain the chemical, physical, and biological integrity of the Nation’s waters, and, where attainable, to achieve a level of water quality that
provides for the protection and propagation of fish, shellfish, and wildlife, and for recreation in and on the water”.
Major provisions of the CWA led to the development of state-based water pollution management controls, primarily based on development and enforcement of numerical and narrative water quality standards. The current numerical standards are described in the NC Administrative Code, Chapter 2, Subchapter 2B, commonly called the “Redbook” by DWR staff. Summary tables of these standards are included in Appendix 2. The full text of the code is available online at http://deq.nc.gov/about/divisions/water-resources/planning/classification-standards/rules.
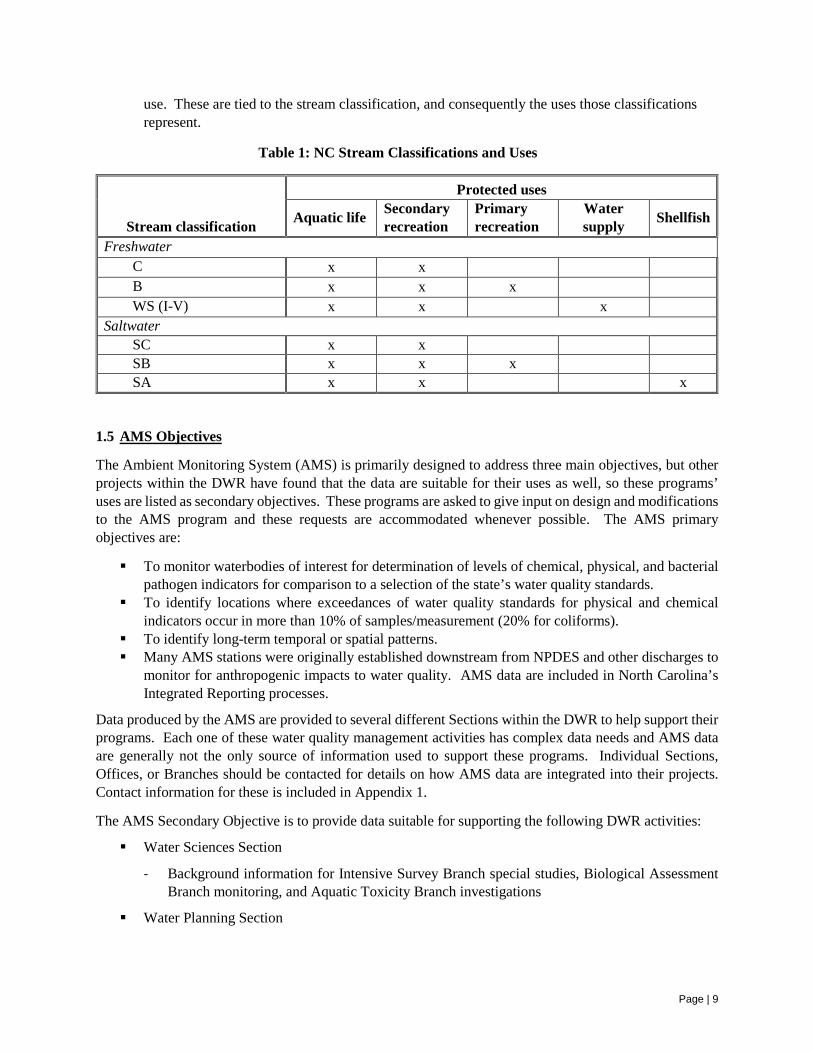
1.4.2 Stream classifications and water quality standards
Page | 8
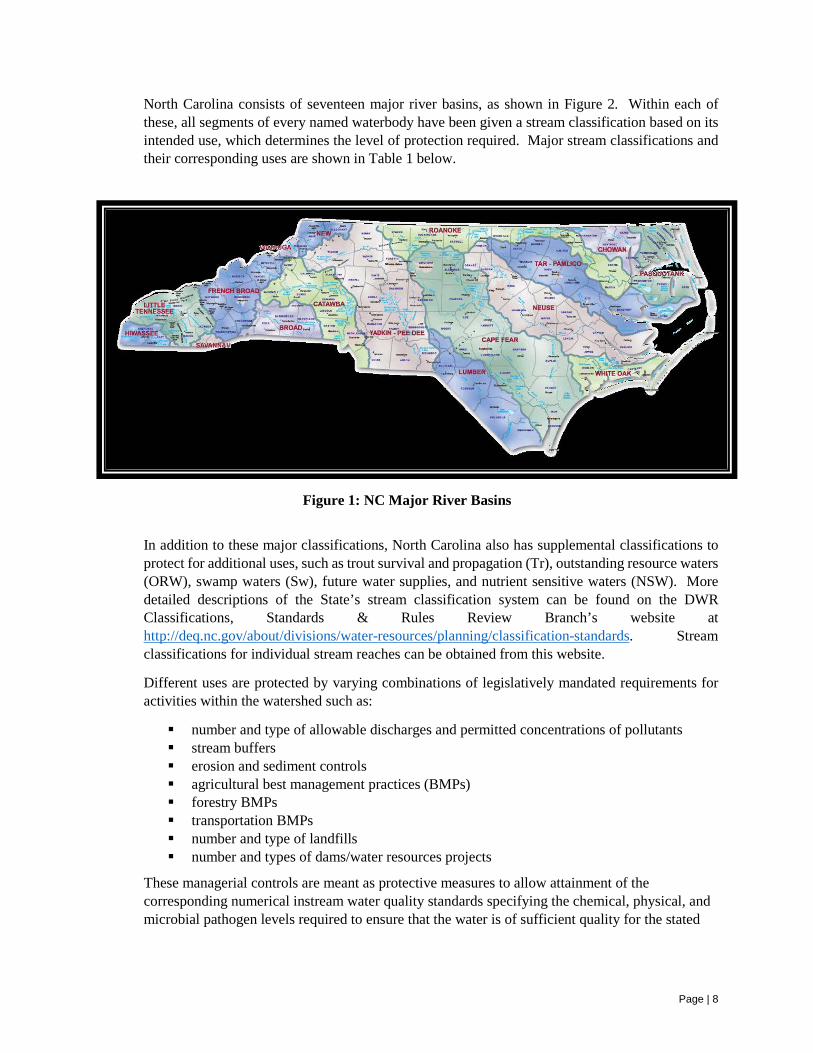
North Carolina consists of seventeen major river basins, as shown in Figure 2. Within each of these, all segments of every named waterbody have been given a stream classification based on its intended use, which determines the level of protection required. Major stream classifications and their corresponding uses are shown in Table 1 below.
In addition to these major classifications, North Carolina also has supplemental classifications to protect for additional uses, such as trout survival and propagation (Tr), outstanding resource waters (ORW), swamp waters (Sw), future water supplies, and nutrient sensitive waters (NSW). More detailed descriptions of the State’s stream classification system can be found on the DWR Classifications, Standards & Rules Review Branch’s website at http://deq.nc.gov/about/divisions/water-resources/planning/classification-standards. Stream classifications for individual stream reaches can be obtained from this website.
Different uses are protected by varying combinations of legislatively mandated requirements for activities within the watershed such as:
number and type of allowable discharges and permitted concentrations of pollutants stream buffers erosion and sediment controls agricultural best management practices (BMPs) forestry BMPs transportation BMPs number and type of landfills number and types of dams/water resources projects
These managerial controls are meant as protective measures to allow attainment of the corresponding numerical instream water quality standards specifying the chemical, physical, and microbial pathogen levels required to ensure that the water is of sufficient quality for the stated
Figure 1: NC Major River Basins
Page | 9
use. These are tied to the stream classification, and consequently the uses those classifications represent.
1.5 AMS Objectives
The Ambient Monitoring System (AMS) is primarily designed to address three main objectives, but other projects within the DWR have found that the data are suitable for their uses as well, so these programs’ uses are listed as secondary objectives. These programs are asked to give input on design and modifications to the AMS program and these requests are accommodated whenever possible. The AMS primary objectives are:
To monitor waterbodies of interest for determination of levels of chemical, physical, and bacterial pathogen indicators for comparison to a selection of the state’s water quality standards.
To identify locations where exceedances of water quality standards for physical and chemical indicators occur in more than 10% of samples/measurement (20% for coliforms).
To identify long-term temporal or spatial patterns. Many AMS stations were originally established downstream from NPDES and other discharges to
monitor for anthropogenic impacts to water quality. AMS data are included in North Carolina’s Integrated Reporting processes.
Data produced by the AMS are provided to several different Sections within the DWR to help support their programs. Each one of these water quality management activities has complex data needs and AMS data are generally not the only source of information used to support these programs. Individual Sections, Offices, or Branches should be contacted for details on how AMS data are integrated into their projects. Contact information for these is included in Appendix 1.
The AMS Secondary Objective is to provide data suitable for supporting the following DWR activities:
Water Sciences Section
- Background information for Intensive Survey Branch special studies, Biological Assessment Branch monitoring, and Aquatic Toxicity Branch investigations
Water Planning Section
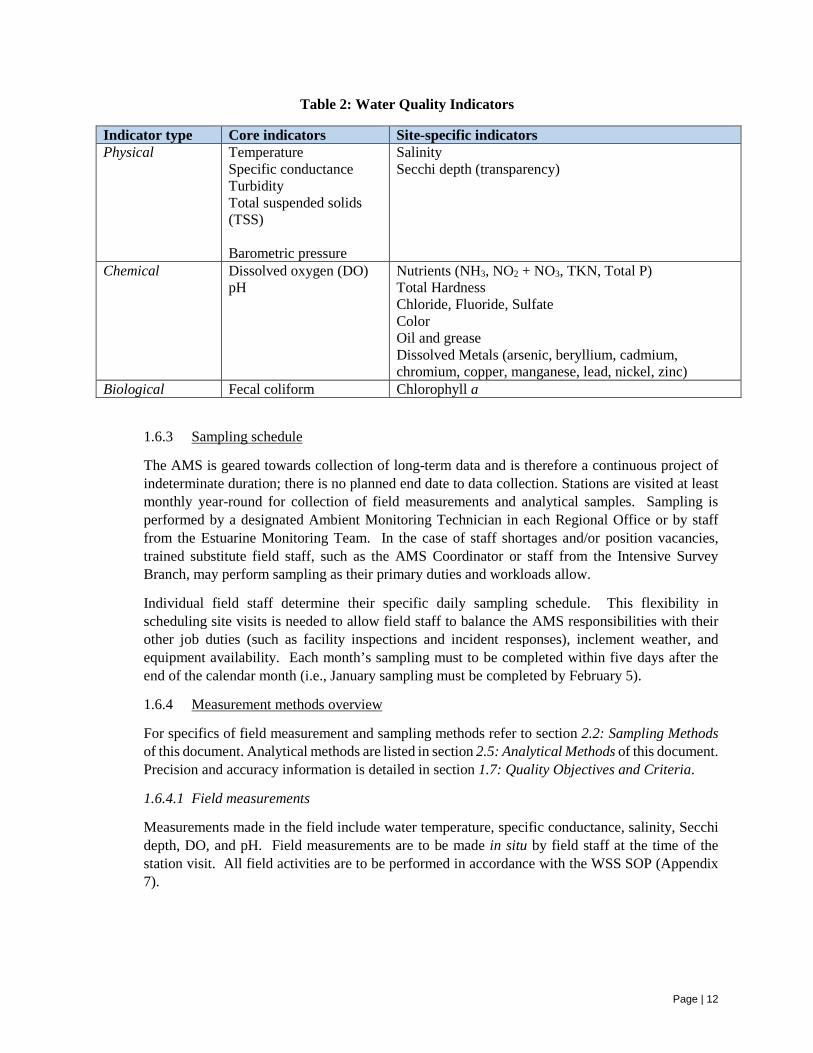
Protected uses
Stream classification Aquatic life Secondary recreation
Primary recreation
Water supply Shellfish
Freshwater C x x B x x x WS (I-V) x x x
Saltwater SC x x SB x x x SA x x x
Table 1: NC Stream Classifications and Uses
Page | 10
- Biennial 303(d) and 305(b) reporting to EPA, including identification of areas of impairment or degradation
- River Basin Water Resources Plans - TMDL development - Prioritization of restoration activities - Background information for reclassification studies - Triennial review of water quality standards
Water Quality Permitting Section, Wastewater Branches
- Identification of background levels of constituents for determination of NPDES permit limits - Identification of dischargers causing unacceptable impacts
Regional Offices
- Background information to assist with water quality management activities in each region
1.6 Project/Task Description and Schedule
1.6.1 Overview
The AMS has been active in North Carolina for over forty years. In the 1970’s and 1980’s, monitoring stations were generally located at fixed points above and below known point source dischargers to monitor their possible effects on surface water quality. With the institution of the NPDES permitting program in the late 1970’s and its self-monitoring requirements, much of this oversight became redundant. Though some of these historic stations are still active and are useful for monitoring discharges that continue to have compliance issues, in more recent years, attention has been shifted towards monitoring the effects of non-point sources of pollutants and representing the overall condition of watersheds.
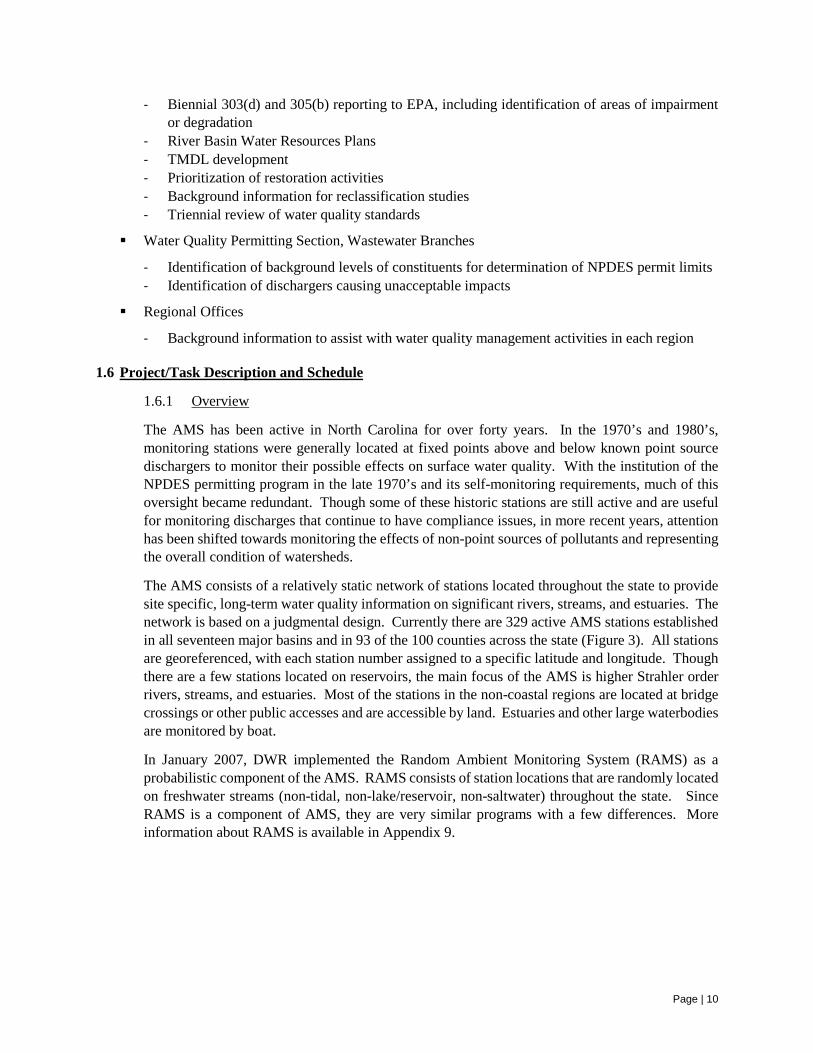
The AMS consists of a relatively static network of stations located throughout the state to provide site specific, long-term water quality information on significant rivers, streams, and estuaries. The network is based on a judgmental design. Currently there are 329 active AMS stations established in all seventeen major basins and in 93 of the 100 counties across the state (Figure 3). All stations are georeferenced, with each station number assigned to a specific latitude and longitude. Though there are a few stations located on reservoirs, the main focus of the AMS is higher Strahler order rivers, streams, and estuaries. Most of the stations in the non-coastal regions are located at bridge crossings or other public accesses and are accessible by land. Estuaries and other large waterbodies are monitored by boat.
In January 2007, DWR implemented the Random Ambient Monitoring System (RAMS) as a probabilistic component of the AMS. RAMS consists of station locations that are randomly located on freshwater streams (non-tidal, non-lake/reservoir, non-saltwater) throughout the state. Since RAMS is a component of AMS, they are very similar programs with a few differences. More information about RAMS is available in Appendix 9.
Page | 11
Figure 2: AMS Station Locations
1.6.2 Water quality indicators
The AMS focuses primarily on chemical, physical, and bacterial pathogen characteristics of the water column. The indicators are primarily selected from those chemicals that have current state water quality standards and can be cost-effectively analyzed. Additional indicators are also included that may not have specific associated standards but are useful for interpretation of other measurements. Others are, of themselves, useful for identifying long-term trends.
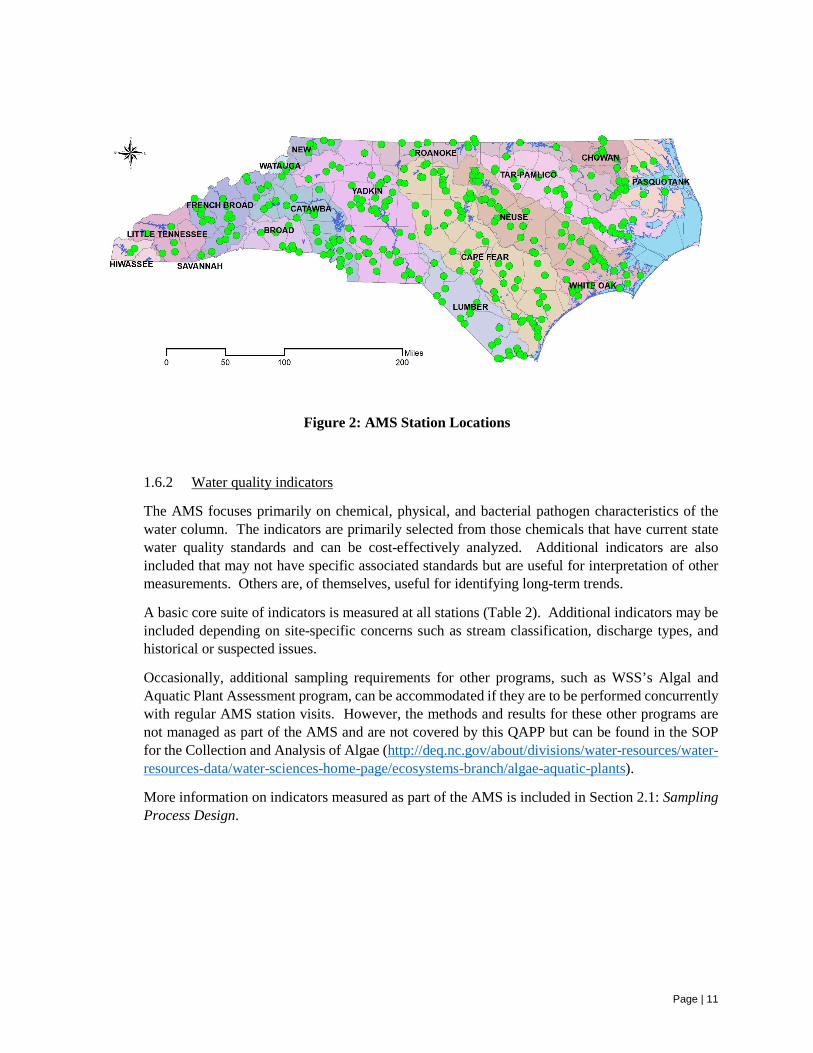
A basic core suite of indicators is measured at all stations (Table 2). Additional indicators may be included depending on site-specific concerns such as stream classification, discharge types, and historical or suspected issues.
Occasionally, additional sampling requirements for other programs, such as WSS’s Algal and Aquatic Plant Assessment program, can be accommodated if they are to be performed concurrently with regular AMS station visits. However, the methods and results for these other programs are not managed as part of the AMS and are not covered by this QAPP but can be found in the SOP for the Collection and Analysis of Algae (http://deq.nc.gov/about/divisions/water-resources/water-resources-data/water-sciences-home-page/ecosystems-branch/algae-aquatic-plants).
More information on indicators measured as part of the AMS is included in Section 2.1: Sampling Process Design.
Page | 12
Table 2: Water Quality Indicators
Indicator type Core indicators Site-specific indicators Physical Temperature
Specific conductance Turbidity Total suspended solids (TSS) Barometric pressure
Salinity Secchi depth (transparency)
Chemical Dissolved oxygen (DO) pH
Nutrients (NH3, NO2 + NO3, TKN, Total P) Total Hardness Chloride, Fluoride, Sulfate Color Oil and grease Dissolved Metals (arsenic, beryllium, cadmium, chromium, copper, manganese, lead, nickel, zinc)
Biological Fecal coliform Chlorophyll a
1.6.3 Sampling schedule
The AMS is geared towards collection of long-term data and is therefore a continuous project of indeterminate duration; there is no planned end date to data collection. Stations are visited at least monthly year-round for collection of field measurements and analytical samples. Sampling is performed by a designated Ambient Monitoring Technician in each Regional Office or by staff from the Estuarine Monitoring Team. In the case of staff shortages and/or position vacancies, trained substitute field staff, such as the AMS Coordinator or staff from the Intensive Survey Branch, may perform sampling as their primary duties and workloads allow.
Individual field staff determine their specific daily sampling schedule. This flexibility in scheduling site visits is needed to allow field staff to balance the AMS responsibilities with their other job duties (such as facility inspections and incident responses), inclement weather, and equipment availability. Each month’s sampling must to be completed within five days after the end of the calendar month (i.e., January sampling must be completed by February 5).
1.6.4 Measurement methods overview
For specifics of field measurement and sampling methods refer to section 2.2: Sampling Methods of this document. Analytical methods are listed in section 2.5: Analytical Methods of this document. Precision and accuracy information is detailed in section 1.7: Quality Objectives and Criteria.
1.6.4.1 Field measurements
Measurements made in the field include water temperature, specific conductance, salinity, Secchi depth, DO, and pH. Field measurements are to be made in situ by field staff at the time of the station visit. All field activities are to be performed in accordance with the WSS SOP (Appendix 7).
Page | 13
1.6.4.2 Analytical samples
Samples are submitted to the laboratories for analysis for turbidity, TSS, total hardness, dissolved metals, nutrients, chloride, fluoride, sulfate, color, oil and grease, fecal coliform, and chlorophyll a. All sampling, preservation and handling, and analytical methods are to be performed in accordance with the ISB SOP (Appendix 7) and the Water Sciences Section’s Chemistry Laboratories Quality Assurance Manual (QAM) (Appendix 8). Sample volumes, preservation, and other handling requirements are included in section 2.3: Sample Handling and Custody of this document.
Fecal coliform analyses are the only allowable variance from holding time requirements. Due to the distance of most Regional Offices from the laboratories, the majority of samples are shipped via courier to the Central Laboratory and consequently fecal coliform samples are already out of the required six-hour holding time when received at the laboratory. The laboratories have agreed to analyze fecal coliform samples received within 24 hours of collection but these are reported with a data qualifier code indicating that the analysis was performed outside of the required holding time. These results cannot, therefore, be used for regulatory or impairment determinations. The coliform data are used as a screening tool to identify waterbodies that may require more intensive sampling including analysis within the six-hour holding time to determine if they are meeting the NC water quality standard for fecal coliform.
In rare cases, it may be necessary for samples to be analyzed by other state government laboratories or by a private facility. These labs must provide reporting levels, analytical methods, accuracy and precision equivalent to or better than those of the DWR laboratories.
If a private laboratory is used, it must have current certification from the DWR Laboratory Certification program to perform the analysis requested.
1.6.5 Data management
All results are to be sent to the AMS Coordinator, who is responsible for the compilation, review, verification, validation, and warehousing of all data produced by the program. Field staff provide electronic versions of field measurements and observations to the AMS Coordinator by the tenth day of the month following collection (e.g., January field data are to be submitted by February 10). The laboratories will provide finalized analytical results as hard copy reports to the AMS Coordinator within approximately 30 days after sample collection. Details can be found in section 2.9: Data Management of this document.
On approximately a quarterly basis, data from all sources will be compiled, quality assured, and added to the in-house data warehouse. Data will also be uploaded to the national STORET warehouse on at least an annual basis.
1.6.6 Reporting
Two major forms of reporting are produced from the AMS program: Ambient Monitoring Reports and Annual Fecal Coliform Screening memoranda. These reports are provided to DWR management and Water Planning Section staff and the information may be incorporated into River Basin Water Resources Plans and required biennial EPA reporting for inventory and impairment (combined 303(d)/305(b) reporting). Reports are also made publicly available on the internet at
Page | 14
http://deq.nc.gov/about/divisions/water-resources/water-resources-data/water-sciences-home-page/reports-publications-data.
1.6.6.1 Ambient Monitoring Reports
The major reporting method for the AMS program involves Ambient Monitoring Reports that are made publicly available on the internet as described above. Historically, AMS data were compiled into Basin Assessment reports on a rotating cycle, such that data for each NC river basin were summarized once every five years. Beginning in 2015, AMS results from the previous five years are summarized annually for each of the seventeen major river basins in NC. For example, the 2017 Ambient Monitoring Report summarizes all AMS data from January 1, 2012 through December 31, 2016. AMS data from the five-year period are summarized for major indicators at each monitoring station, and are analyzed for violations of applicable water quality standards. Once a calendar year has ended, it usually requires three to four months to finalize the data set due to analytical reporting lag time and the time required for compilation, review, validation, and verification of all data by the AMS Coordinator. After the last quarter of data is added to the main warehouse, the AMS Coordinator will perform a data retrieval of all available data for the five-year summary period and provide it to the Water Quality Analyst. The Water Quality Analyst will summarize the data in tabular, graphical, and geographical formats to include:
Station information, including location, stream classification, and stream index Date range of results collected during the assessment period Number of results for each indicator Descriptive statistics by indicator: minimum, maximum, median, 10th percentile, 90th
percentile Applicable water quality standard for each indicator based on stream classification Number and percentage of observations exceeding the applicable standard for each
indicator Confidence levels in exceedance frequencies greater than 10 percent Spatial distribution of indicator concentrations and standards exceedances
The purpose of this analysis is to provide an historical perspective on relative levels of each indicator and to help identify areas, either spatial or temporal, that may require closer examination. Results for each indicator will be presented by individual station, and may also be grouped for analysis by the entire basin, hydrologic unit code (HUC), and/or waterbody. This approach can identify temporal patterns, such as gradual increases, decreases, or step-type changes in pollutant levels. To some extent, spatial patterns within the basin, individual HUCs, or along a specific waterbody may be discernable as well. Patterns or anomalies noted during this process are more closely examined. The Water Quality Analyst may analyze specific AMS station and/or indicator data for the entire period of record and may consult additional sources, such as Regional Office staff, Water Planning Section River Basin Water Resources Plans, or NPDES permits to determine a possible cause. Other data sources, such as the USGS National Water Quality Assessment program, may also be consulted. Description of known issues or possible sources of bias (e.g., analytical, field, climatic, significant events such as droughts or hurricanes, etc.) in the data summaries should be sufficient to give the reader adequate context for appropriate interpretation of the results.
Page | 15
The main audience for the information reported in the Ambient Monitoring Reports is staff from the DWR Water Planning Section. For each station, if >10% of results for any particular indicator exceed the applicable water quality standard, that particular stream reach (index number) may be subject to official impairment and consequent 303(d) listing. Enough information should be provided in the Ambient Monitoring Reports to allow Water Planning Section staff to make informed decisions when determining if impairment is warranted for each monitored waterbody. Impairment can lead to further actions by other DWR programs, such as intensive studies, development of TMDLs or other strategies, and implementation of additional pollutant controls, all of which can have costly impacts for NCDEQ as well as NPDES dischargers, municipalities, industries, animal operations, etc. To prevent inaccurate judgments of impairment being made, the Water Planning Section has developed basic data quality and quantity criteria (available at http://deq.nc.gov/about/divisions/water-resources/planning/modeling-assessment/water-quality-data-assessment) to determine data sources appropriate for their uses. Information contained in the Ambient Monitoring Report for each river basin allows Water Planning Section staff to easily identify whether the data set for a particular station meets these criteria.
1.6.6.2 Annual fecal coliform screening memoranda
The current bacterial pathogen water quality standard for NC is based on five fecal coliform samples taken during a thirty-day period (“5-in-30”). The current AMS sampling regime for fecal coliform consists of one to two samples taken monthly, and is therefore not appropriate for determining exceedance of the standard. The current results are, however, useful as a screening tool to identify stream reaches where the intensive 5-in-30 sampling may be warranted.
In approximately March of each year, after the previous calendar year’s data set is finalized, the AMS Coordinator analyzes fecal coliform data. Stations exceeding the following criteria are identified as candidates for 5-in-30 sampling:
For all stream classifications (15A NCAC 02B .0211(3)(e)):
Geometric mean >200 colonies/100mL >20% of results >400 colonies/100mL
For SA waters (15A NCAC 02B .0221(3)(d)):
Median >14 colonies/100mL >10% of results >43 colonies/100mL
Memoranda listing the stations that are 5-in-30 candidates and the results of analysis will be drafted by the AMS Coordinator and sent to the Basin Planning Branch Supervisor, Modeling and Assessment Branch Supervisor, and appropriate Regional Office Supervisor(s) and Ambient Monitoring Technician(s), requesting that the waterbodies undergo 5-in-30 sampling that year.
Given the significant resources required for staff and the analytical costs of such studies, it is not feasible that all waterbodies identified through this process can be sampled. Each Regional Office should assess their resources and then prioritize stations to be sampled. Suggested criteria for prioritization are as follows:
High priority should be given to waters protected for primary recreation use and/or shellfish harvesting, i.e., stream classifications B, SB, and SA.
For coastal areas with primary recreational use and/or shellfishing waters, consult with the Recreational Water Quality Monitoring program (NCDEQ, Division of Marine Fisheries
Page | 16
(DMF), Shellfish Sanitation and Recreational Water Quality Section). If the location is already monitored by DMF, obtain available data, provide to AMS Coordinator and Water Planning Section staff, and assign station a low priority for 5-in-30 sampling by the Regional Office.
If the stream segment has already been listed as impaired (303(d) listing) for fecal coliform, sampling is not required; impairment is already known.
The appropriate Regional Supervisor and Ambient Monitoring Technician should prepare a study plan in accordance with the latest Use Assessment Methodology prepared by the Water Planning Section that is available on the web at http://deq.nc.gov/about/divisions/water-resources/planning. Ideally, sampling will occur in June, July, and/or August, with more than one set of 5-in-30 samples being collected. Since the fecal coliform standard is based on human health criteria and is meant to protect for primary and secondary recreation uses, it follows that sampling during the months of highest recreational use will give a better indication of actual risks to human health. In addition to sampling at the AMS station location, the Regional Office staff may also include as part of their study plan sanitary surveys and sampling at several points along the waterbody and its tributaries, if resources allow. Not only would this process definitively determine exceedance of the numerical standard, but possible contaminant sources may also be identified.
Results of all 5-in-30 sampling should be prepared by the Regional Office and reported within 45 days of the completion of sampling via written memoranda. Copies should be sent to the AMS Coordinator, AMS Project Manager, Basin Planning Branch Supervisor, Modeling and Assessment Branch Supervisor, and appropriate county or other local public health agency. Water Planning Section will use the data to determine areas of impairment, in accordance with their current Use Assessment Methodologies.
1.7 Quality Objectives and Criteria
1.7.1 Precision, Accuracy, and Sensitivity
This information is included in Table 5.1 of the WSS Laboratories, Quality Assurance Manual (Appendix 8). Results from the AMS program will be compared to NC water quality standards (Appendix 2), so reporting limits for these indicators should be at or below these critical values. All of the reporting limits (PQLs) used by the WSS Laboratory meet these criteria.
1.7.2 Bias
The AMS is based in judgmental sampling design, so by definition bias will exist due to station locations. However, this is acceptable given that stations are generally established for targeted long-term monitoring of known or suspected areas of concern; identification of temporal patterns at these static locations are a major objective of the program.
Other sources of bias include:
Sampling is performed during the daylight only. Stations may also be sampled at different times of day from month to month, which may affect indicators such as DO, pH, and nutrients.
Extreme or acute unusual conditions, including storm events, may not be sufficiently sampled due to field staff safety concerns or station inaccessibility during these events.
Almost all inland stations are located at bridge crossings for ease of access and to avoid trespassing on private property. Field staff are instructed to sample on the upstream side
Page | 17
of the bridge whenever possible to minimize impacts, but the actual local impact of bridges on ambient water quality is unknown.
Using consistent sampling methods, SOPs, and analytical methods minimizes bias from other sources.
1.7.3 Representativeness
Environmental monitoring data generally show high variation due to natural conditions such as precipitation, seasonal and diurnal patterns, and biological activity. It is important to ensure that the variations over time and/or space that are seen in the results are truly representative of the system under study. Monitored waterbodies must have sufficient flow year-round at the specified sampling point to allow for the sampling of well-mixed areas (as required by the ISB SOP) of the waterbody. This allows the samples to represent the condition of the waterbody at that point in time. Careful selection of station locations on larger perennial waterbodies (higher-order streams and rivers, estuaries, and reservoirs) allows representative samples to be obtained year-round.
1.7.4 Comparability
Fixed station locations and standardized operating procedures for sampling and analytical methods ensure that comparable samples are taken at each site visit.
1.7.5 Completeness
It is expected that some site visits or samples will be missed due to problems such as inclement weather, temporary station inaccessibility due to bridge construction, equipment problems, and staff issues such as illness or vacant positions. Many of these impediments are unavoidable. However, under anything but extraordinary circumstances it is expected that at least 90% of scheduled station visits and samples be completed annually in each Region. For each five-year period, it is expected that at each station a minimum of 54 observations for indicators sampled monthly and 18 observations for indicators sampled quarterly be collected.
1.8 Special Training/Certifications
1.8.1 Field staff
Since new employees can vary greatly in their background, experience, and knowledge, field staff’s direct supervisor should determine training needs on a case-by-case basis and ensure that these needs are met. At a minimum, all field staff are to be trained in the methods described in the Intensive Survey Branch SOP (Appendix 7), this QAPP, and the sample submission guidance included in Section 6.0 of the Laboratory QAM (Appendix 8). This initial training in meter calibration, safety, required documentation, sampling methods, sample handling, safety and other field activities is generally performed by the AMS Coordinator, particularly concerning data management. Experienced field staff will continue to accompany all new field staff during sampling activities until the new staff member exhibits proficiency in the field, as determined by the trainer’s observations.
It is required that newly hired Ambient Monitoring Technicians attend the Laboratory WSS Sample Submission course or equivalent within six months of hire. This course gives a detailed presentation of requirements for sample volumes, containers, preservation, shipping, chain of custody documentation, and an overview of laboratory operations. The Sample Submission course is offered by the Central Laboratory on an irregular basis, based on need and number of requests
Page | 18
for the training. Laboratory staff will also travel to Regional Offices to provide the training if requested by the Regional Supervisor and current workloads allow. Contact the Central Laboratory for further information (919-733-3908).
Field staff are encouraged to be certified in First Aid and CPR. CPR/First Aid trainings are held periodically in each regional office and field staff should make it a priority to attend. Staff performing boat work should be thoroughly trained in the safe and proper handling of boats and trailers.
After initial training is completed, the following refresher training is recommended:
Annual in-field observation and review by AMS Coordinator and/or QA Coordinator. First Aid and CPR re-certification as required by agency issuing the certification. Laboratory Section’s Sample Submission Guidance training attendance or equivalent every
three years. Participation in AMS Regional Monitoring Technician workshops held by the AMS
Coordinator. These are held on an irregular basis, as changes to the program dictate and resources allow.
Participation in Regional Office training sessions in meter use, calibration, and maintenance as offered. These are offered by WSS staff on an irregular basis, upon request from the Regional Office Supervisor.
Formal training and audits are performed on a periodic basis and whenever the need for them arises. Audit reports and training certificates are kept on file with the QA Coordinator and copies are provided to the AMS coordinator and Regional Supervisor.
1.8.2 Laboratory (analytical) staff
Information on training of DWR Laboratory staff is detailed in Section 4.2: Personnel Orientation and Training of the Laboratory Quality Assurance Manual. If a private laboratory is used for any analyses, it is required that it be Certified by the NC DWR Laboratory Certification program, and staff training will be performed in accordance with the requirements inherent in this Certification. If another state agency’s laboratory is used, its training requirements shall be at least equivalent to those of a Certified laboratory.
1.9 Documentation and Records
1.9.1 Quality assurance information, SOPs, and other support documentation
Once all approval signatures have been obtained, the QA Coordinator will electronically distribute copies of the approved QAPP to persons on the distribution list in Section 1.1 of this document. Copies must be disseminated within 30 days of final approval. The original hard copy with approval signatures will be kept on file in the QA Coordinator’s office at WSS.
The QA Coordinator is to be notified of changes made to SOPs, analytical methods, or any other documentation referenced by this QAPP. The QA Coordinator will then be responsible for distributing the information, as described above. The QA Coordinator will also be responsible for keeping current copies of all these documents on file at WSS.
Since the AMS is an ongoing project, this QAPP will be reviewed on at least an annual basis and, if appropriate, any changes or updates made at that time. However, critical revisions can be made at any time. The QA Coordinator is responsible for completing revisions, obtaining signatures of
Page | 19
approval, and disseminating the revised document to those on the distribution list within 30 days of final approval. The version or revision number and date shall be easily identifiable by the document control information. A complete list of all revisions/updates will be provided with each annual update.
1.9.2 Project records
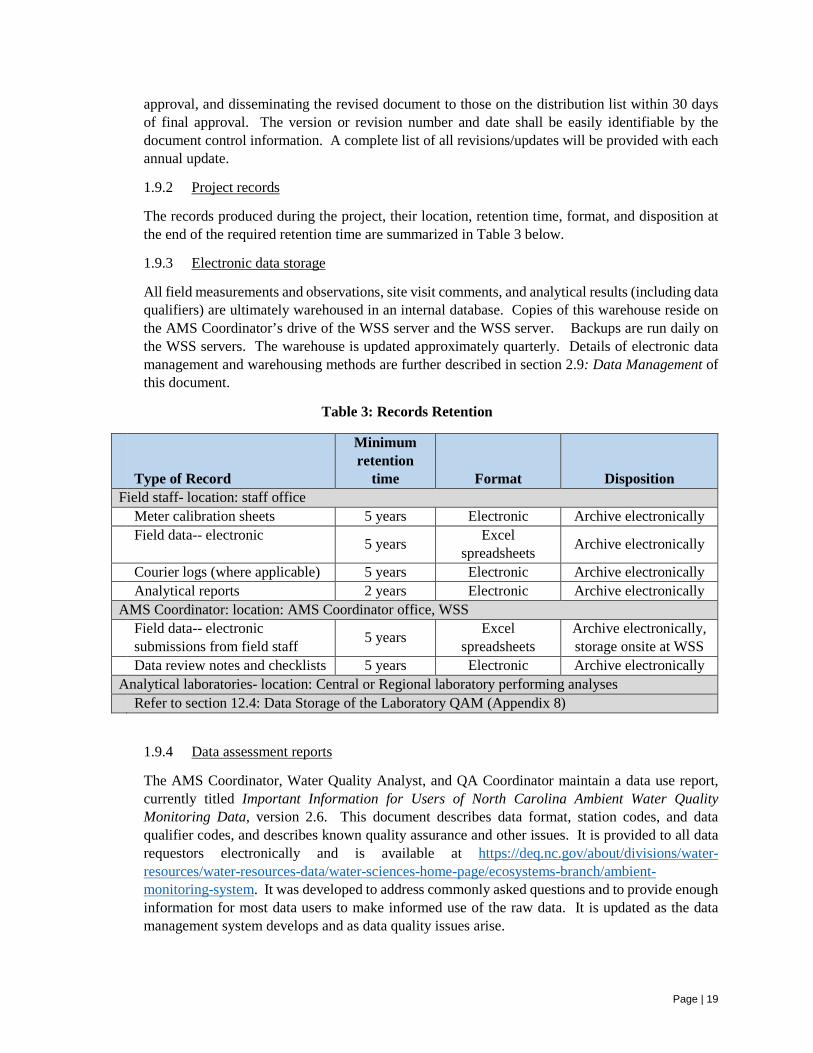
The records produced during the project, their location, retention time, format, and disposition at the end of the required retention time are summarized in Table 3 below.
1.9.3 Electronic data storage
All field measurements and observations, site visit comments, and analytical results (including data qualifiers) are ultimately warehoused in an internal database. Copies of this warehouse reside on the AMS Coordinator’s drive of the WSS server and the WSS server. Backups are run daily on the WSS servers. The warehouse is updated approximately quarterly. Details of electronic data management and warehousing methods are further described in section 2.9: Data Management of this document.
Table 3: Records Retention
Type of Record
Minimum retention
time Format Disposition Field staff- location: staff office Meter calibration sheets 5 years Electronic Archive electronically Field data-- electronic 5 years Excel
spreadsheets Archive electronically
Courier logs (where applicable) 5 years Electronic Archive electronically Analytical reports 2 years Electronic Archive electronically AMS Coordinator: location: AMS Coordinator office, WSS Field data-- electronic
submissions from field staff 5 years Excel spreadsheets
Archive electronically, storage onsite at WSS
Data review notes and checklists 5 years Electronic Archive electronically Analytical laboratories- location: Central or Regional laboratory performing analyses Refer to section 12.4: Data Storage of the Laboratory QAM (Appendix 8)
1.9.4 Data assessment reports
The AMS Coordinator, Water Quality Analyst, and QA Coordinator maintain a data use report, currently titled Important Information for Users of North Carolina Ambient Water Quality Monitoring Data, version 2.6. This document describes data format, station codes, and data qualifier codes, and describes known quality assurance and other issues. It is provided to all data requestors electronically and is available at https://deq.nc.gov/about/divisions/water-resources/water-resources-data/water-sciences-home-page/ecosystems-branch/ambient-monitoring-system. It was developed to address commonly asked questions and to provide enough information for most data users to make informed use of the raw data. It is updated as the data management system develops and as data quality issues arise.
Page | 20
1.9.5 Data report package: Ambient Monitoring Reports
As described in Section 1.6.6.1, data are analyzed and summarized annually for each of the seventeen major basins in the state for the previous five-year timeframe. All available historic and current raw data, data qualifiers, station visit comments/observations, and station information, including stream classification and index numbers, are provided by the AMS Coordinator to the Water Quality Analyst as electronic files, generally delimited text files. These data are used to produce the Ambient Monitoring Reports, which summarize all AMS monitoring activities during the appropriate assessment period. In addition to basinwide text and graphical summaries of the AMS data, the Reports also contain descriptive statistics by indicator for each station, including number and percentage of standard exceedances. The final Ambient Monitoring Reports are made publicly available via the WSS web site at https://ox.deq.prod.nc.gov/about/divisions/water-resources/water-resources-data/water-sciences-home-page/reports-publications-data. Copies of all Reports are retained electronically at WSS and are kept indefinitely.
The AMS Coordinator and Water Quality Analyst also provide raw data upon request to staff from other state and federal agencies, private consultants, academia, municipalities, private citizens, and others. This is generally provided in an electronic form (delimited text file or Microsoft Excel spreadsheet) and should contain the same information listed above for internal analysis, unless otherwise instructed by the requestor. All data requests are to be accompanied by a copy of the data assessment document described above.
1.9.6 Data report package: Annual Fecal Coliform Screening
The data report package for the annual Fecal Coliform Screening is very similar to that described for the Ambient Monitoring Reports, except that results of interest are limited to fecal coliform from the preceding calendar year. The results are reported to Regional Office Supervisors, Ambient Monitoring Technicians, and Water Planning Section staff in internal memoranda.
1.9.7 Data report package: Environmental Indicators Report
The data report package for DEQ’s Environmental Indicators Report, produced periodically, summarizes regional trends across North Carolina for DO, turbidity, and fecal coliform bacteria for a portion of AMS stations that have been identified as long term indicator sites. Long term indicator sites are those with on-going collection of data dating back to before 1980. Data are summarized and presented graphically to determine if the percentage of measurements that exceed water quality evaluation levels have changed over time. Previous State of the Environment Reports can be requested from NC DEQ Public Affairs at (919) 707-8602.
Page | 21
2.0 DATA GENERATION AND ACQUISTION
2.1 Sampling Process Design
The AMS was designed as a long-term monitoring project and has been in existence for over 40 years. It is a judgmentally designed network of stations located to monitor specific watersheds of concern as determined by DWR staff. There are currently 329 stations across the state.
AMS stations are visited at least monthly for measurement of field parameters, fecal coliform, turbidity, and any site-specific samples. Total suspended solids are sampled quarterly at all stations and total hardness is measured quarterly at most freshwater stations. Stations are sampled by designated Ambient Monitoring staff in each of the seven Regional Offices and the Estuarine Monitoring Team.
2.1.1 Station locations
Stations are established at publicly accessible, fixed locations (i.e., specific lat/long), generally at bridge crossings or areas accessible by boat. Locations and their latitude and longitude were originally identified using USGS topo maps or Maptech Terrain Navigator software. All active stations’ latitudes and longitudes have been updated using GPS technology. Stations are strategically located to monitor a specific area of concern:
overall water quality in a larger watershed effect of point source discharges effect of non-point sources of pollution (e.g., urban areas, animal operations, agriculture) effect of land use changes waters of significant ecological, recreational, political, or municipal use waters which show an impairment due to unknown causes (e.g., biological data shows possible
impairment) significant waterbodies as they leave the state
Statewide coverage is shown in Figure 3, and a station list is available in Appendix 3.
Many of the current stations have been active for over thirty years and this focus on long-term data is integral to identifying temporal patterns within a watershed and to gaining an understanding of the variability within each system. Consequently, requests from DWR staff for station establishment and/or discontinuation will be assessed on the value gained from a long-term perspective. Special study or short term monitoring (less than 2 years) is handled through other DWR programs, such as the Intensive Survey Branch. Adjustments to station locations and sampling regimens may be made with sufficient reason, such as:
safety concerns of field staff other changes to location accessibility the reason for sampling is no longer valid (e.g. a discontinued discharge) emergence of new water quality concerns resource constraints, particularly field and laboratory staff vacancies redundancy with a cooperating program (e.g. DWR Monitoring Coalition program)
If any of these concerns arise, the AMS Coordinator, Regional Office Supervisor, Regional AMS Monitor, Ecosystems Branch Supervisor, and any other involved parties (e.g., Coalition Coordinator, Water Planning Section staff, USGS, etc.) will collectively decide if it is appropriate for the station to be discontinued.
Actual sampling points are generally mid-channel, or as determined by field staff as representative of the waterbody:
Page | 22
flow should be significant enough to ensure a relatively well-mixed, homogenous sample outside of effluent mixing zones upstream side of bridge whenever possible not directly below large amounts of debris or other temporary impoundments
2.1.2 Indicators measured and sampling frequency
The selection of indicators is primarily focused on those with NC water quality standards that can be cost-effectively analyzed. Additional indicators are also included that may not have specific standards associated with them but are useful for interpretation of other measurements. Others, such as specific conductance are of themselves useful for identifying long-term trends. A summary of standards by stream classification is included in Appendix 2.
Field staff are encouraged to use their discretion to sample for any additional indicators they feel may be of concern due to unusual circumstances encountered on a station visit. Permanent changes to parametric coverage at a station may be made in response to requests from DWR staff. These changes undergo a review process similar to that for station location changes.
All measurements and samples are taken on whole water samples except dissolved metals. The following two tables list indicators measured and the minimum frequency of measurement. Table 4 lists core indicators, or those generally sampled at all stations. Table 5 lists supplemental indicators, which are only sampled at certain stations determined by discharger types, access method, waterbody type, historic or future issues, or any other considerations to monitor site-specific concerns. For a list of indicators measured at each station, refer to Appendix 3.
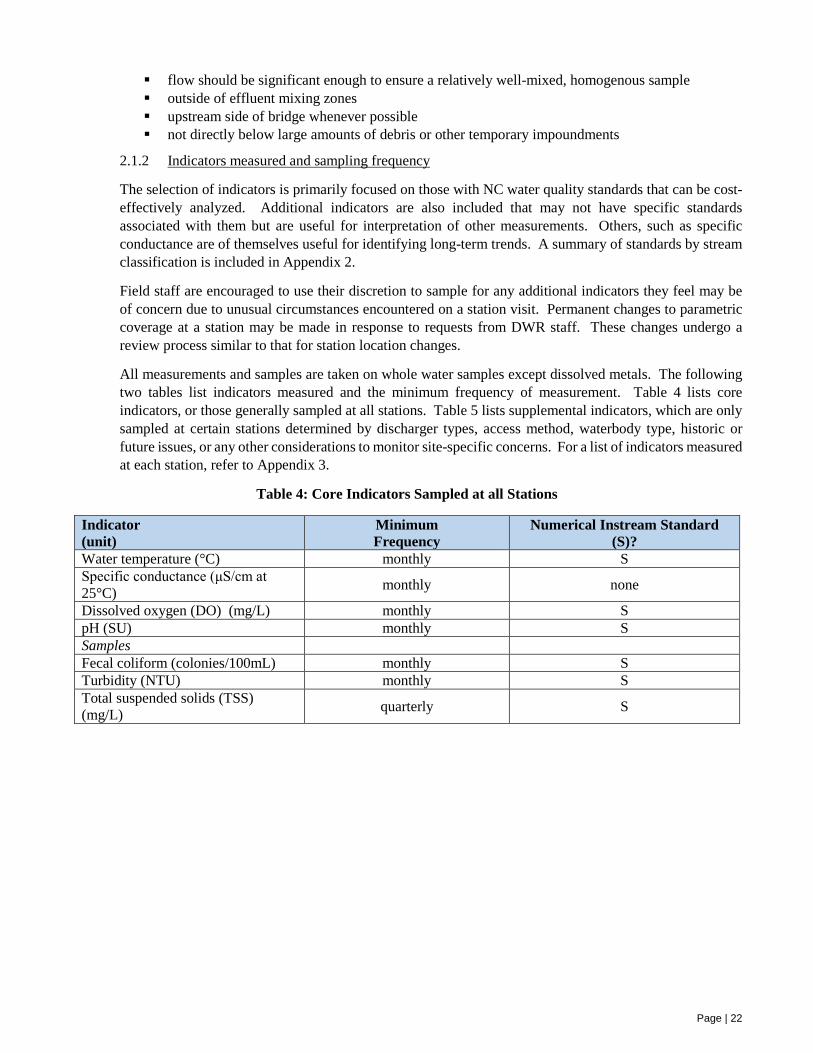
Table 4: Core Indicators Sampled at all Stations
Indicator (unit)
Minimum Frequency
Numerical Instream Standard (S)?
Water temperature (°C) monthly S
Specific conductance (μS/cm at 25°C) monthly none
Dissolved oxygen (DO) (mg/L) monthly S
pH (SU) monthly S
Samples Fecal coliform (colonies/100mL) monthly S Turbidity (NTU) monthly S Total suspended solids (TSS) (mg/L) quarterly S
Page | 23
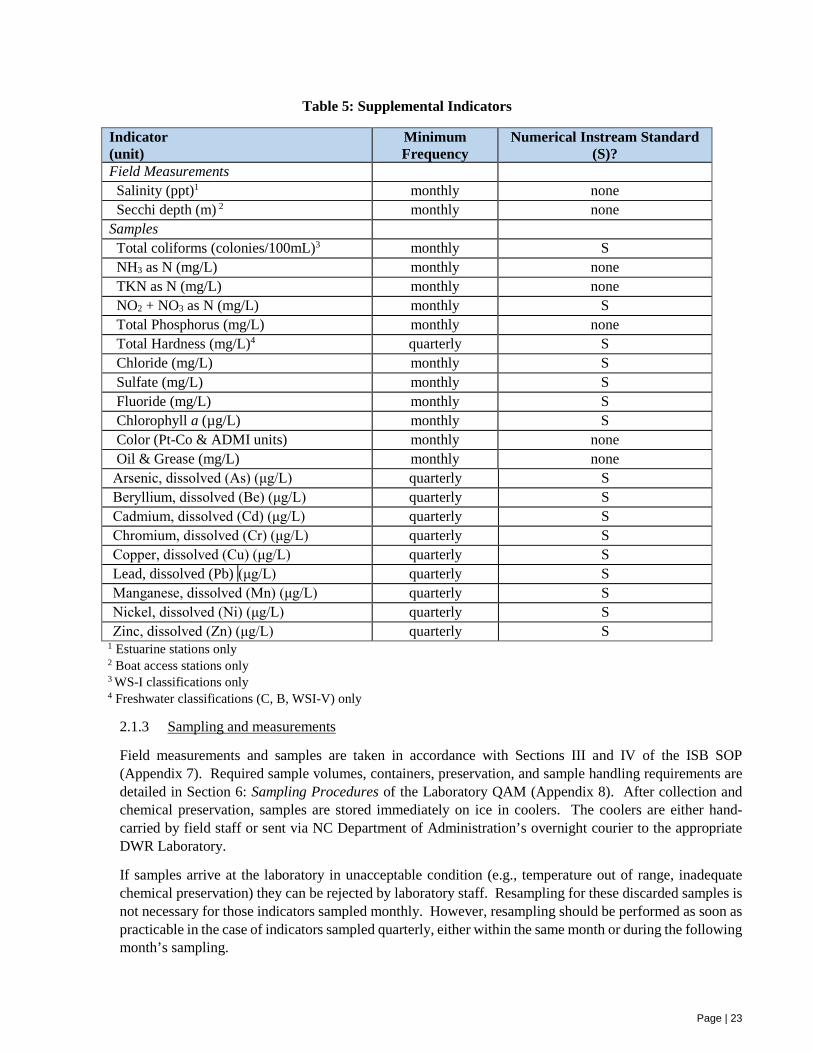
Table 5: Supplemental Indicators
Indicator (unit)
Minimum Frequency
Numerical Instream Standard (S)?
Field Measurements Salinity (ppt)1 monthly none Secchi depth (m) 2 monthly none Samples Total coliforms (colonies/100mL)3 monthly S NH3 as N (mg/L) monthly none TKN as N (mg/L) monthly none NO2 + NO3 as N (mg/L) monthly S Total Phosphorus (mg/L) monthly none Total Hardness (mg/L)4 quarterly S Chloride (mg/L) monthly S Sulfate (mg/L) monthly S Fluoride (mg/L) monthly S Chlorophyll a (µg/L) monthly S Color (Pt-Co & ADMI units) monthly none Oil & Grease (mg/L) monthly none Arsenic, dissolved (As) (μg/L) quarterly S Beryllium, dissolved (Be) (μg/L) quarterly S Cadmium, dissolved (Cd) (μg/L) quarterly S Chromium, dissolved (Cr) (μg/L) quarterly S Copper, dissolved (Cu) (μg/L) quarterly S Lead, dissolved (Pb) Pub(μg/L) quarterly S Manganese, dissolved (Mn) (μg/L) quarterly S Nickel, dissolved (Ni) (μg/L) quarterly S Zinc, dissolved (Zn) (μg/L) quarterly S 1 Estuarine stations only 2 Boat access stations only 3 WS-I classifications only 4 Freshwater classifications (C, B, WSI-V) only
2.1.3 Sampling and measurements
Field measurements and samples are taken in accordance with Sections III and IV of the ISB SOP (Appendix 7). Required sample volumes, containers, preservation, and sample handling requirements are detailed in Section 6: Sampling Procedures of the Laboratory QAM (Appendix 8). After collection and chemical preservation, samples are stored immediately on ice in coolers. The coolers are either hand-carried by field staff or sent via NC Department of Administration’s overnight courier to the appropriate DWR Laboratory.
If samples arrive at the laboratory in unacceptable condition (e.g., temperature out of range, inadequate chemical preservation) they can be rejected by laboratory staff. Resampling for these discarded samples is not necessary for those indicators sampled monthly. However, resampling should be performed as soon as practicable in the case of indicators sampled quarterly, either within the same month or during the following month’s sampling.
Page | 24
Every reasonable attempt is to be made by field staff to complete all site visits each month, though some missed visits are to be expected due to situations such as bad weather, station inaccessibility, extreme flow (either extremely low flow making sampling impossible or inappropriate due to pooling/backwaters, or flooding preventing access of normal sampling point), meter problems, staff shortages/vacancies, etc. In these cases, missed sampling is acceptable as long as the reasons are documented in the monthly field data submissions. If a station location is inaccessible at a station visit, field staff should not sample at another location, such as the next bridge crossing. Longer-term inaccessibility, most notably bridge construction, should be assessed by the AMS Coordinator for consideration of temporary suspension or permanent discontinuation of the station. It is important that stations not be moved without sufficient reason, as an uninterrupted long-term record is a primary objective of this program.
2.2 Sampling Methods
Samples and measurements are to be taken in accordance with ISB SOP (Appendix 7) and the Laboratory QAM (Appendix 8). Any irregularities or problems encountered by field staff should be communicated to the AMS Coordinator, either verbally or via email, who will assess the situation, consult with other project personnel if needed, and recommend a course of action for resolution.
The station list in Appendix 3 identifies sampling methods to be used for each indicator at each station. An overview of the different methods employed is described below.
2.2.1 Field measurements
Surface (Sur): Measurements are only taken just below the water surface (depth = 0.1m). This method is employed when sampling at bridge crossings or other land accessed stations.
Profile 1 (Pr1): Measurements are taken just below the water surface and at every meter of depth to the bottom. Method employed at estuarine (Chowan, Pasquotank, Pamlico, Roanoke, and Neuse basins) and reservoir stations accessed by boat that exhibit significant stratification.
2.2.2 Samples
Refer to Section I.3 of the ISB SOP (Appendix 7) for general information on sampling methods. Two basic methods are employed in the AMS program:
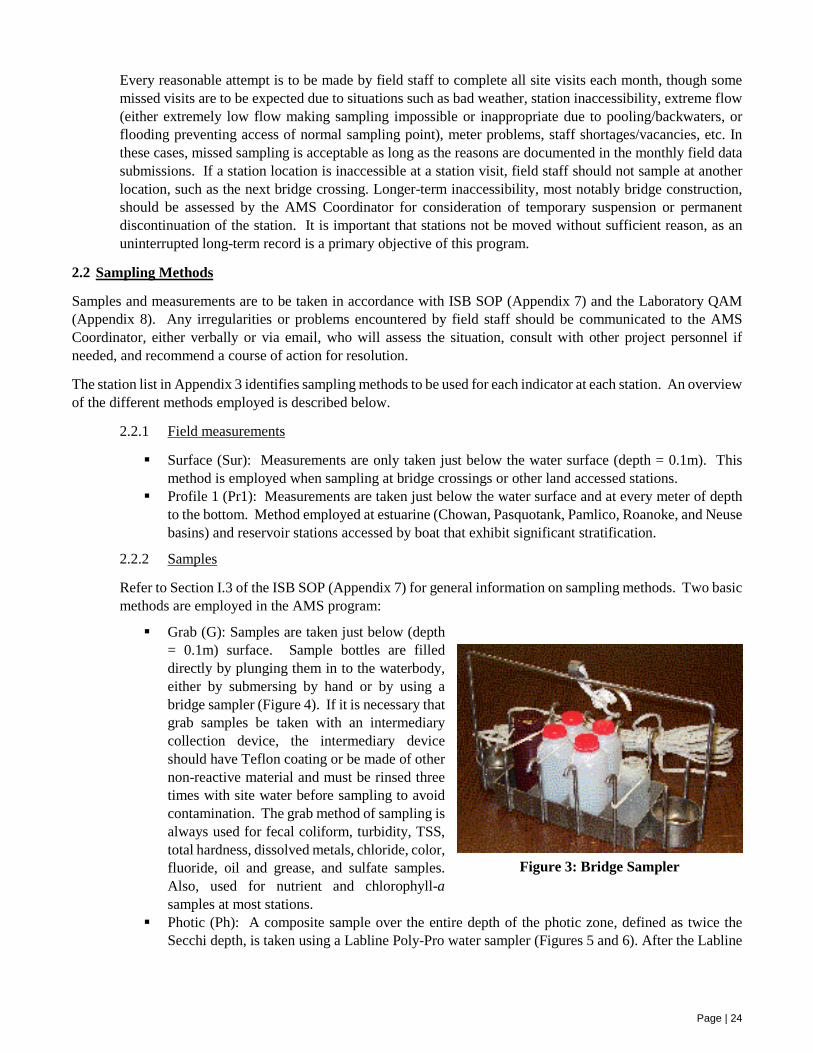
Grab (G): Samples are taken just below (depth = 0.1m) surface. Sample bottles are filled directly by plunging them in to the waterbody, either by submersing by hand or by using a bridge sampler (Figure 4). If it is necessary that grab samples be taken with an intermediary collection device, the intermediary device should have Teflon coating or be made of other non-reactive material and must be rinsed three times with site water before sampling to avoid contamination. The grab method of sampling is always used for fecal coliform, turbidity, TSS, total hardness, dissolved metals, chloride, color, fluoride, oil and grease, and sulfate samples. Also, used for nutrient and chlorophyll-a samples at most stations.
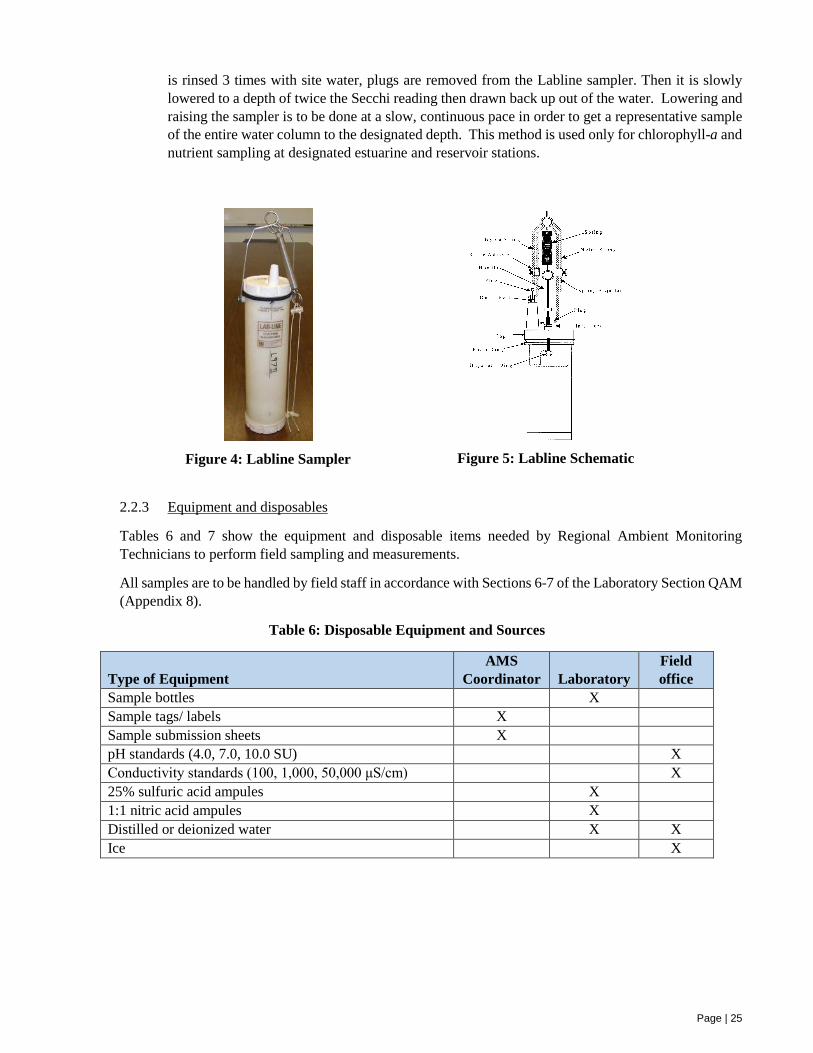
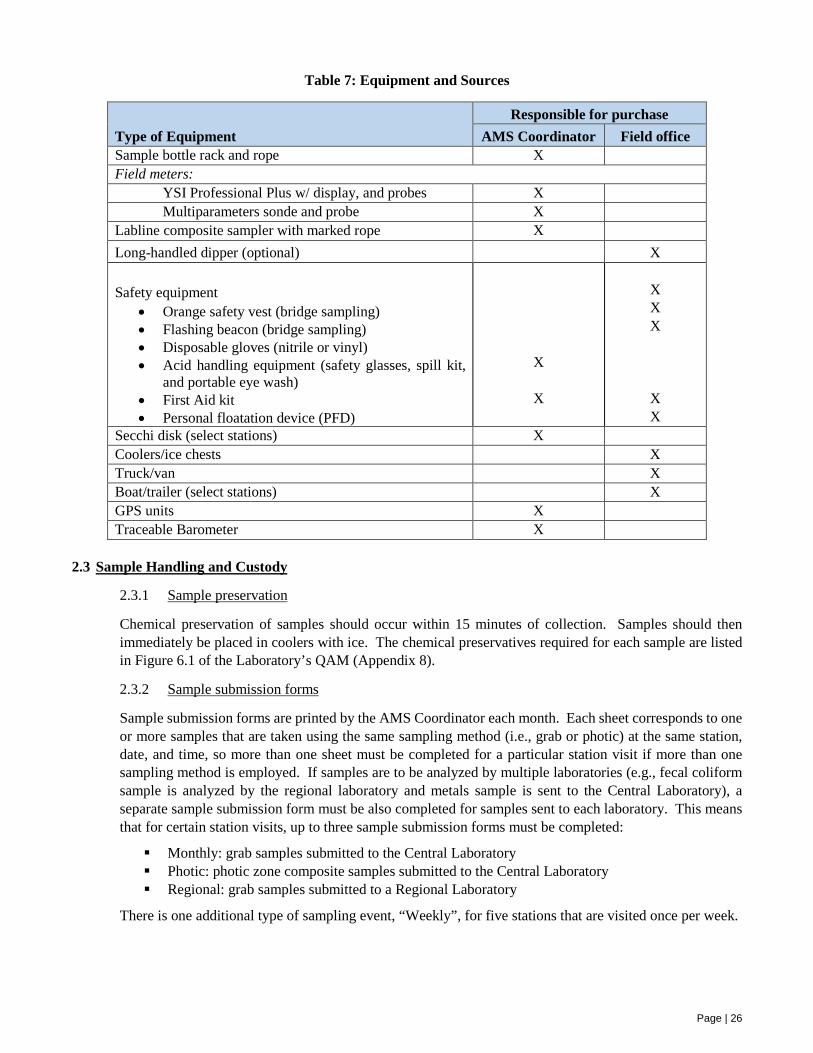
Photic (Ph): A composite sample over the entire depth of the photic zone, defined as twice the Secchi depth, is taken using a Labline Poly-Pro water sampler (Figures 5 and 6). After the Labline
Figure 3: Bridge Sampler
Page | 25
is rinsed 3 times with site water, plugs are removed from the Labline sampler. Then it is slowly lowered to a depth of twice the Secchi reading then drawn back up out of the water. Lowering and raising the sampler is to be done at a slow, continuous pace in order to get a representative sample of the entire water column to the designated depth. This method is used only for chlorophyll-a and nutrient sampling at designated estuarine and reservoir stations.
Figure 4: Labline Sampler
Figure 5: Labline Schematic
2.2.3 Equipment and disposables
Tables 6 and 7 show the equipment and disposable items needed by Regional Ambient Monitoring Technicians to perform field sampling and measurements.
All samples are to be handled by field staff in accordance with Sections 6-7 of the Laboratory Section QAM (Appendix 8).
Table 6: Disposable Equipment and Sources
Type of Equipment AMS
Coordinator Laboratory Field office
Sample bottles X Sample tags/ labels X Sample submission sheets X pH standards (4.0, 7.0, 10.0 SU) X Conductivity standards (100, 1,000, 50,000 μS/cm) X 25% sulfuric acid ampules X 1:1 nitric acid ampules X Distilled or deionized water X X Ice X
Page | 26
Table 7: Equipment and Sources
Type of Equipment Responsible for purchase
AMS Coordinator Field office Sample bottle rack and rope X Field meters:
YSI Professional Plus w/ display, and probes X Multiparameters sonde and probe X
Labline composite sampler with marked rope X Long-handled dipper (optional) X
Safety equipment • Orange safety vest (bridge sampling) • Flashing beacon (bridge sampling) • Disposable gloves (nitrile or vinyl) • Acid handling equipment (safety glasses, spill kit,
and portable eye wash) • First Aid kit • Personal floatation device (PFD)
X
X
X X X
X X
Secchi disk (select stations) X Coolers/ice chests X Truck/van X Boat/trailer (select stations) X GPS units X Traceable Barometer X
2.3 Sample Handling and Custody
2.3.1 Sample preservation
Chemical preservation of samples should occur within 15 minutes of collection. Samples should then immediately be placed in coolers with ice. The chemical preservatives required for each sample are listed in Figure 6.1 of the Laboratory’s QAM (Appendix 8).
2.3.2 Sample submission forms
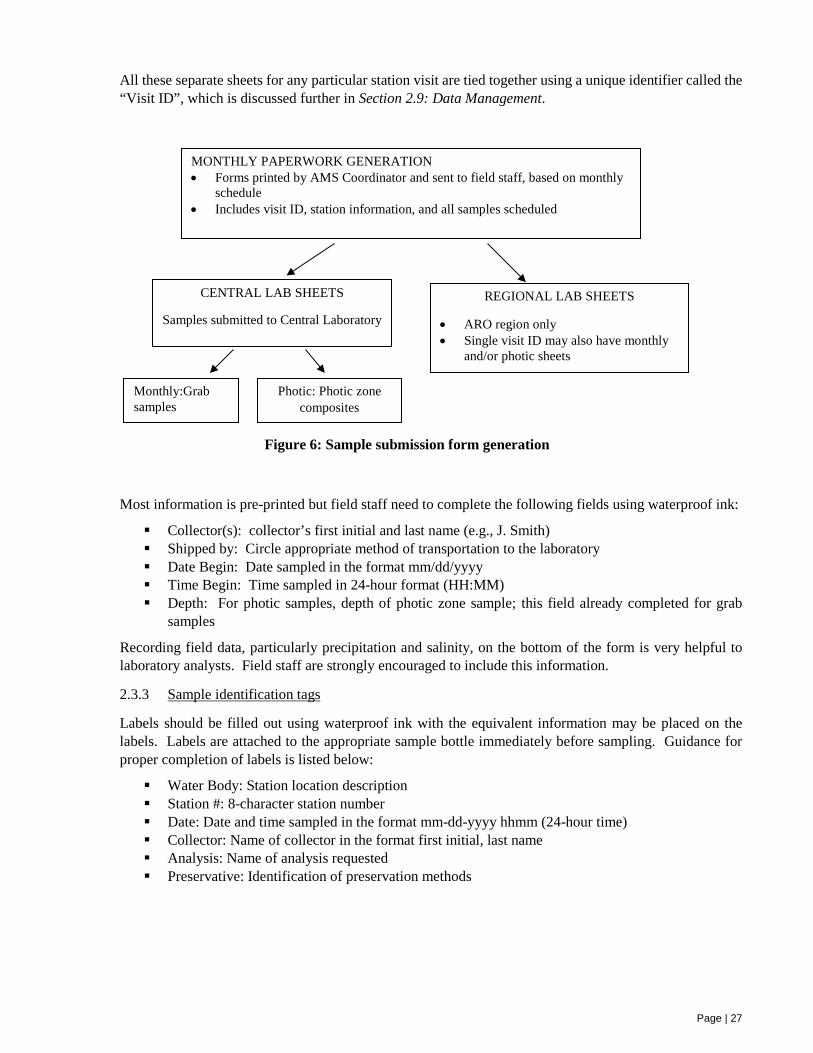
Sample submission forms are printed by the AMS Coordinator each month. Each sheet corresponds to one or more samples that are taken using the same sampling method (i.e., grab or photic) at the same station, date, and time, so more than one sheet must be completed for a particular station visit if more than one sampling method is employed. If samples are to be analyzed by multiple laboratories (e.g., fecal coliform sample is analyzed by the regional laboratory and metals sample is sent to the Central Laboratory), a separate sample submission form must be also completed for samples sent to each laboratory. This means that for certain station visits, up to three sample submission forms must be completed:
Monthly: grab samples submitted to the Central Laboratory Photic: photic zone composite samples submitted to the Central Laboratory Regional: grab samples submitted to a Regional Laboratory
There is one additional type of sampling event, “Weekly”, for five stations that are visited once per week.
Page | 27
All these separate sheets for any particular station visit are tied together using a unique identifier called the “Visit ID”, which is discussed further in Section 2.9: Data Management.
Figure 6: Sample submission form generation
Most information is pre-printed but field staff need to complete the following fields using waterproof ink:
Collector(s): collector’s first initial and last name (e.g., J. Smith) Shipped by: Circle appropriate method of transportation to the laboratory Date Begin: Date sampled in the format mm/dd/yyyy Time Begin: Time sampled in 24-hour format (HH:MM) Depth: For photic samples, depth of photic zone sample; this field already completed for grab
samples
Recording field data, particularly precipitation and salinity, on the bottom of the form is very helpful to laboratory analysts. Field staff are strongly encouraged to include this information.
2.3.3 Sample identification tags
Labels should be filled out using waterproof ink with the equivalent information may be placed on the labels. Labels are attached to the appropriate sample bottle immediately before sampling. Guidance for proper completion of labels is listed below:
Water Body: Station location description Station #: 8-character station number Date: Date and time sampled in the format mm-dd-yyyy hhmm (24-hour time) Collector: Name of collector in the format first initial, last name Analysis: Name of analysis requested Preservative: Identification of preservation methods
MONTHLY PAPERWORK GENERATION • Forms printed by AMS Coordinator and sent to field staff, based on monthly
schedule • Includes visit ID, station information, and all samples scheduled
CENTRAL LAB SHEETS
Samples submitted to Central Laboratory
REGIONAL LAB SHEETS
• ARO region only • Single visit ID may also have monthly
and/or photic sheets
Monthly:Grab samples
Photic: Photic zone composites
Page | 28
2.3.4 Sample transport
Immediately after sampling, labeling, and chemical preservation, samples are placed in coolers on ice, along with a temperature blank. Sample submission forms are placed in a sealable waterproof bag and taped to the inside lid of the cooler. Coolers are then either hand carried by field staff or sealed and shipped via the NC Department of Administration’s Courier Service to the lab.
2.4 Laboratory
Once samples arrive at the laboratory, support staff check the temperature blank (included in each cooler) to ensure that they are in appropriate temperature range (4 +/- 2ºC), assign lab tracking numbers, and distribute them to the appropriate analytical units. Any samples not meeting temperature, holding time, or preservation requirements or otherwise not submitted in accordance with the SOP are subject to rejection as per Section 13: Corrective Actions of the Laboratory Section QAM. Laboratory staff will attempt to contact collector by phone or email before rejecting. If conditionally accepted, the laboratory will document the anomaly with a Sample Condition Upon Receipt (SCUR) and/or Sample Anomaly Report (SAR) form and include copies with the final analytical report. Results from anomalous samples will be reported using the appropriate qualification code(s).
For details of laboratory protocols for sample receipt and handling, refer to Section 7: Sample Custody of the Quality Assurance Manual.
2.5 Analytical Methods
2.5.1 Field measurements
In addition to the SOP sections cited in Table 8 below, the instruction manual for the appropriate meter should also be consulted.
Table 8: Field measurement method references and reporting levels
Parameter ISB SOP section EPA method (if
applicable) Reported to nearest…
DO III.3.1; Appendices 1-4 360.1 0.1 mg/L pH III.4; Appendices 1-4 150.1 0.1 SU Water temp III.1; Appendices 1-4 170.1 0.1 ºC Specific conductance
III.5; Appendices 1-4 120.1 1 μS/cm
Salinity III.5; Appendices 1-4 0.01 ppt Secchi Depth III.6 0.1 m
2.5.2 Lab analyses
Samples are submitted for analysis to one or more of the two DWR laboratories: Central Laboratory in Raleigh or Asheville Regional Laboratory. Time sensitive samples (coliform, turbidity, TSS) collected by Asheville Regional staff should be submitted to the Asheville Regional Laboratory. All other samples should be submitted to the Central Laboratory. Results should be reported to the AMS Coordinator and Regional Ambient Monitoring Technicians within 30 days of sample submission.
A summary of methods and PQLs (the Laboratory minimum reporting limit) are listed below in Table 9. More detailed information on sample preparation methods, approved method modifications, method performance criteria, precision, accuracy, MDLs and PQLs can be found in the Laboratory Section’s QAM
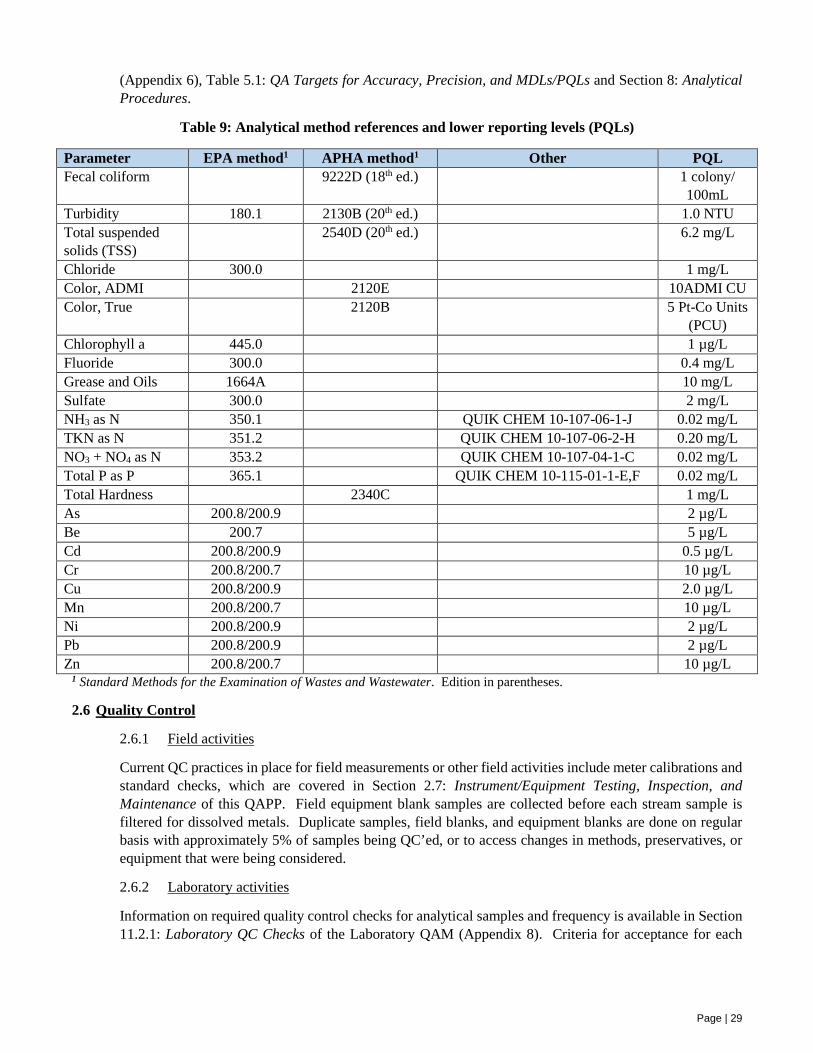
Page | 29
(Appendix 6), Table 5.1: QA Targets for Accuracy, Precision, and MDLs/PQLs and Section 8: Analytical Procedures.
Table 9: Analytical method references and lower reporting levels (PQLs)
Parameter EPA method1 APHA method1 Other PQL Fecal coliform 9222D (18th ed.) 1 colony/
100mL Turbidity 180.1 2130B (20th ed.) 1.0 NTU Total suspended solids (TSS)
2540D (20th ed.) 6.2 mg/L
Chloride 300.0 1 mg/L Color, ADMI 2120E 10ADMI CU Color, True 2120B 5 Pt-Co Units
(PCU) Chlorophyll a 445.0 1 µg/L Fluoride 300.0 0.4 mg/L Grease and Oils 1664A 10 mg/L Sulfate 300.0 2 mg/L NH3 as N 350.1 QUIK CHEM 10-107-06-1-J 0.02 mg/L TKN as N 351.2 QUIK CHEM 10-107-06-2-H 0.20 mg/L NO3 + NO4 as N 353.2 QUIK CHEM 10-107-04-1-C 0.02 mg/L Total P as P 365.1 QUIK CHEM 10-115-01-1-E,F 0.02 mg/L Total Hardness 2340C 1 mg/L As 200.8/200.9 2 µg/L Be 200.7 5 µg/L Cd 200.8/200.9 0.5 µg/L Cr 200.8/200.7 10 µg/L Cu 200.8/200.9 2.0 µg/L Mn 200.8/200.7 10 µg/L Ni 200.8/200.9 2 µg/L Pb 200.8/200.9 2 µg/L Zn 200.8/200.7 10 µg/L
1 Standard Methods for the Examination of Wastes and Wastewater. Edition in parentheses.
2.6 Quality Control
2.6.1 Field activities
Current QC practices in place for field measurements or other field activities include meter calibrations and standard checks, which are covered in Section 2.7: Instrument/Equipment Testing, Inspection, and Maintenance of this QAPP. Field equipment blank samples are collected before each stream sample is filtered for dissolved metals. Duplicate samples, field blanks, and equipment blanks are done on regular basis with approximately 5% of samples being QC’ed, or to access changes in methods, preservatives, or equipment that were being considered.
2.6.2 Laboratory activities
Information on required quality control checks for analytical samples and frequency is available in Section 11.2.1: Laboratory QC Checks of the Laboratory QAM (Appendix 8). Criteria for acceptance for each
Page | 30
analysis are presented in Table 5.1: QA Targets for Accuracy, Precision, and MDLs/PQLs of the Laboratory QAM. For inorganic analyses accuracy should be within the range 80-120% and precision should be <20% relative percent difference (RPD) unless laboratory-generated data indicate that tighter control limits can be routinely maintained.
2.7 Instrument/Equipment Testing, Inspection, and Maintenance
2.7.1 Field Equipment Maintenance
All field staff are responsible for regular cleaning, inspection, and maintenance of their assigned equipment. All equipment should be visually inspected daily for damage or dirt, and repaired or cleaned if needed before use. If meters are stored for long periods (> 1 week) without being used, it is recommended that they be calibrated and inspected at least weekly to keep them in good working order. Other required maintenance is shown in Table 10. Information on equipment maintenance is supplied in Chapters III and VI of the ISB SOP (Appendix 7) for field meters, equipment, vehicles, boats and trailers. Also refer to instruction manuals for manufacturer’s recommendations for inspection, maintenance, and repair.
2.7.2 Calibration and Testing
All field meters are to be inspected and calibrated at a minimum at the beginning and end of each day used. Field staff should record calibration information on the Water Quality Monitoring Field Meter Calibration Sheet form (ISB SOP, Figure 10) including staff name, date/time of initial calibration and post-sampling check, and meter number. The specific calibration procedures are documented in the Intensive Survey Branch’s SOP, Appendices 1-4 and in the manufacturers’ instruction manuals. For specific conductance and pH, two-point calibrations should be performed. DO meters should be calibrated using the air.
Standards should be selected so that they bracket the range of measurements expected that day. Each Regional Office is required to purchase traceable conductivity standards and pH buffers (standards). Conductivity standard concentrations of 100 and 1,000 µS/cm are commonly used for freshwater stations and concentrations of 10,000 and 50,000 µS/cm for estuary stations. Meters currently in use require pH standards of 4.0, 7.0, and 10.0 S.U.
Meters should also be checked against standards periodically throughout the day and recalibrated if needed if any of the following occur:
physical shock to meter; DO membrane is touched, fouled, or dries out (if applicable); unusual (high or low for the particular site) or erratic readings, or excessive drift; extreme readings (e.g., extremely acidic or basic pH; D.O. saturation >120%); measurements are outside of the range for which the meter was calibrated.
A post-sampling check is completed at the end of each sampling day to confirm significant drift has not occurred and that readings are accurate and representative. If post-sampling check readings are not within the acceptable QC ranges (DO= ±0.5 mg/L, Specific conductance= 10%, pH=±0.2 su) or a post-sampling check is not completed, data are determined questionable and are qualified as estimated (J12) and are not to be used for assessment.
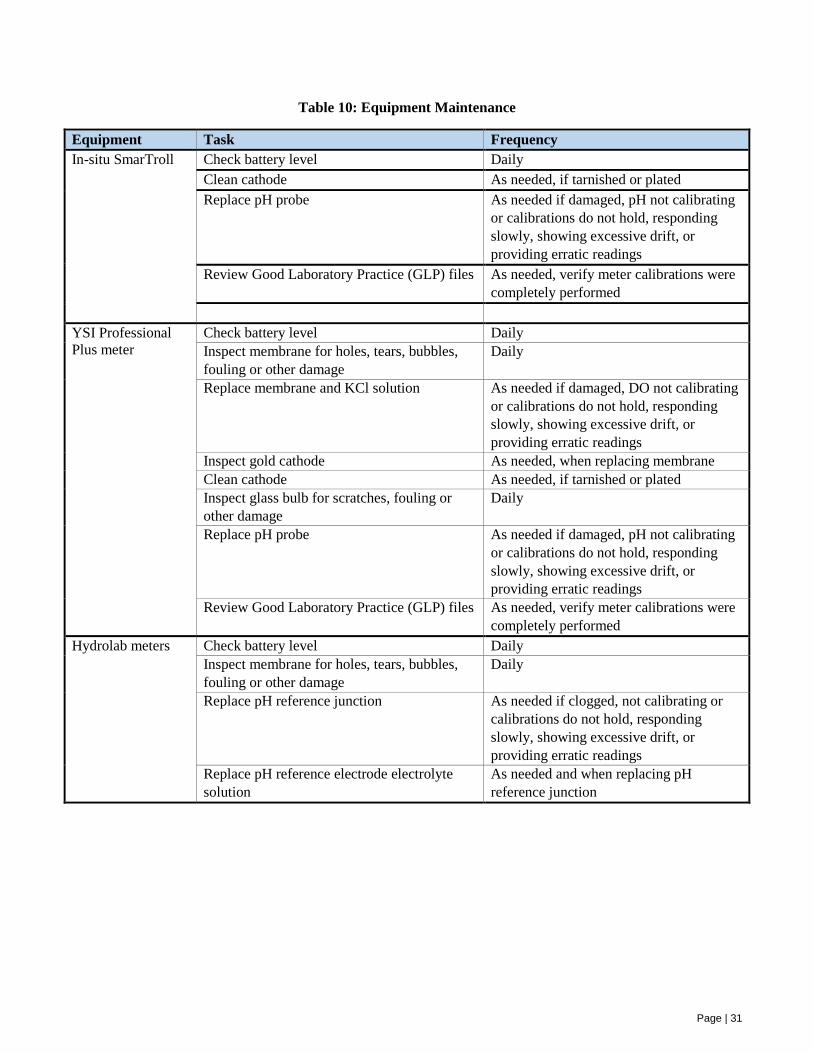
Page | 31
Table 10: Equipment Maintenance
Equipment Task Frequency In-situ SmarTroll Check battery level Daily
Clean cathode As needed, if tarnished or plated Replace pH probe As needed if damaged, pH not calibrating
or calibrations do not hold, responding slowly, showing excessive drift, or providing erratic readings
Review Good Laboratory Practice (GLP) files As needed, verify meter calibrations were completely performed
YSI Professional Plus meter
Check battery level Daily Inspect membrane for holes, tears, bubbles, fouling or other damage
Daily
Replace membrane and KCl solution As needed if damaged, DO not calibrating or calibrations do not hold, responding slowly, showing excessive drift, or providing erratic readings
Inspect gold cathode As needed, when replacing membrane Clean cathode As needed, if tarnished or plated Inspect glass bulb for scratches, fouling or other damage
Daily
Replace pH probe As needed if damaged, pH not calibrating or calibrations do not hold, responding slowly, showing excessive drift, or providing erratic readings
Review Good Laboratory Practice (GLP) files As needed, verify meter calibrations were completely performed
Hydrolab meters Check battery level Daily Inspect membrane for holes, tears, bubbles, fouling or other damage
Daily
Replace pH reference junction As needed if clogged, not calibrating or calibrations do not hold, responding slowly, showing excessive drift, or providing erratic readings
Replace pH reference electrode electrolyte solution
As needed and when replacing pH reference junction
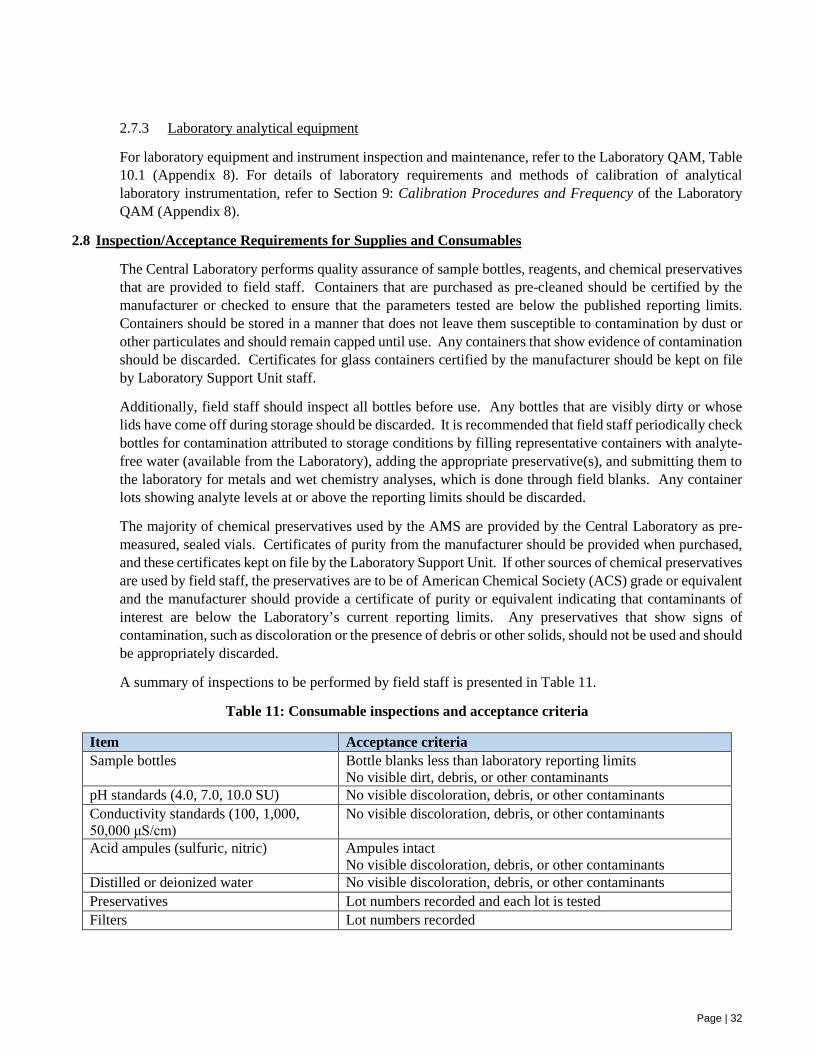
Page | 32
2.7.3 Laboratory analytical equipment
For laboratory equipment and instrument inspection and maintenance, refer to the Laboratory QAM, Table 10.1 (Appendix 8). For details of laboratory requirements and methods of calibration of analytical laboratory instrumentation, refer to Section 9: Calibration Procedures and Frequency of the Laboratory QAM (Appendix 8).
2.8 Inspection/Acceptance Requirements for Supplies and Consumables
The Central Laboratory performs quality assurance of sample bottles, reagents, and chemical preservatives that are provided to field staff. Containers that are purchased as pre-cleaned should be certified by the manufacturer or checked to ensure that the parameters tested are below the published reporting limits. Containers should be stored in a manner that does not leave them susceptible to contamination by dust or other particulates and should remain capped until use. Any containers that show evidence of contamination should be discarded. Certificates for glass containers certified by the manufacturer should be kept on file by Laboratory Support Unit staff.
Additionally, field staff should inspect all bottles before use. Any bottles that are visibly dirty or whose lids have come off during storage should be discarded. It is recommended that field staff periodically check bottles for contamination attributed to storage conditions by filling representative containers with analyte-free water (available from the Laboratory), adding the appropriate preservative(s), and submitting them to the laboratory for metals and wet chemistry analyses, which is done through field blanks. Any container lots showing analyte levels at or above the reporting limits should be discarded.
The majority of chemical preservatives used by the AMS are provided by the Central Laboratory as pre-measured, sealed vials. Certificates of purity from the manufacturer should be provided when purchased, and these certificates kept on file by the Laboratory Support Unit. If other sources of chemical preservatives are used by field staff, the preservatives are to be of American Chemical Society (ACS) grade or equivalent and the manufacturer should provide a certificate of purity or equivalent indicating that contaminants of interest are below the Laboratory’s current reporting limits. Any preservatives that show signs of contamination, such as discoloration or the presence of debris or other solids, should not be used and should be appropriately discarded.
A summary of inspections to be performed by field staff is presented in Table 11.
Table 11: Consumable inspections and acceptance criteria
Item Acceptance criteria Sample bottles Bottle blanks less than laboratory reporting limits
No visible dirt, debris, or other contaminants pH standards (4.0, 7.0, 10.0 SU) No visible discoloration, debris, or other contaminants Conductivity standards (100, 1,000, 50,000 μS/cm)
No visible discoloration, debris, or other contaminants
Acid ampules (sulfuric, nitric) Ampules intact No visible discoloration, debris, or other contaminants
Distilled or deionized water No visible discoloration, debris, or other contaminants Preservatives Lot numbers recorded and each lot is tested Filters Lot numbers recorded
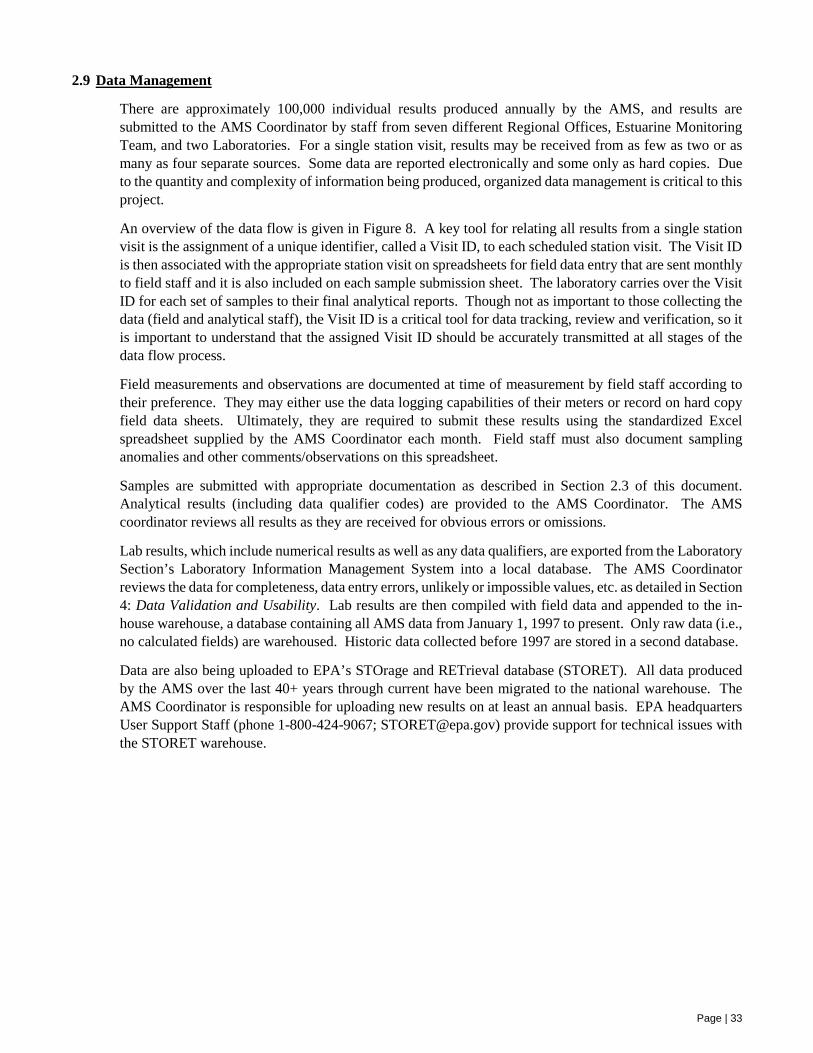
Page | 33
2.9 Data Management
There are approximately 100,000 individual results produced annually by the AMS, and results are submitted to the AMS Coordinator by staff from seven different Regional Offices, Estuarine Monitoring Team, and two Laboratories. For a single station visit, results may be received from as few as two or as many as four separate sources. Some data are reported electronically and some only as hard copies. Due to the quantity and complexity of information being produced, organized data management is critical to this project.
An overview of the data flow is given in Figure 8. A key tool for relating all results from a single station visit is the assignment of a unique identifier, called a Visit ID, to each scheduled station visit. The Visit ID is then associated with the appropriate station visit on spreadsheets for field data entry that are sent monthly to field staff and it is also included on each sample submission sheet. The laboratory carries over the Visit ID for each set of samples to their final analytical reports. Though not as important to those collecting the data (field and analytical staff), the Visit ID is a critical tool for data tracking, review and verification, so it is important to understand that the assigned Visit ID should be accurately transmitted at all stages of the data flow process.
Field measurements and observations are documented at time of measurement by field staff according to their preference. They may either use the data logging capabilities of their meters or record on hard copy field data sheets. Ultimately, they are required to submit these results using the standardized Excel spreadsheet supplied by the AMS Coordinator each month. Field staff must also document sampling anomalies and other comments/observations on this spreadsheet.
Samples are submitted with appropriate documentation as described in Section 2.3 of this document. Analytical results (including data qualifier codes) are provided to the AMS Coordinator. The AMS coordinator reviews all results as they are received for obvious errors or omissions.
Lab results, which include numerical results as well as any data qualifiers, are exported from the Laboratory Section’s Laboratory Information Management System into a local database. The AMS Coordinator reviews the data for completeness, data entry errors, unlikely or impossible values, etc. as detailed in Section 4: Data Validation and Usability. Lab results are then compiled with field data and appended to the in-house warehouse, a database containing all AMS data from January 1, 1997 to present. Only raw data (i.e., no calculated fields) are warehoused. Historic data collected before 1997 are stored in a second database.
Data are also being uploaded to EPA’s STOrage and RETrieval database (STORET). All data produced by the AMS over the last 40+ years through current have been migrated to the national warehouse. The AMS Coordinator is responsible for uploading new results on at least an annual basis. EPA headquarters User Support Staff (phone 1-800-424-9067; [email protected]) provide support for technical issues with the STORET warehouse.
Page | 34
Figure 7: Data Flow
Page | 35
3.0 ASSESSMENT AND OVERSIGHT
3.1 Assessments & Response Actions
The AMS Coordinator acts as the liaison between field staff, the Laboratory, program management, QA Coordinator, the EB Water Quality Analyst, and other data users. Issues with any aspect of the program noted by any of these should report them as soon as possible to the AMS Coordinator, who will assess the issue, consult with other parties as needed, and determine the course of action to be taken.
Within three months of hire, Regional Ambient Monitoring Technicians and Team members will be observed on a sampling run by the AMS Coordinator and/or QA Coordinator. The AMS Coordinator observes experienced Ambient Monitoring Technicians on sampling runs at least once every two years, through audits. The main purpose of these assessments is to ensure that field staff are performing activities in accordance with current SOPs and to determine if there are any other issues that need to be addressed. Concerns or irregularities noticed by the AMS Coordinator and QA Coordinator will be discussed with the Ambient Monitoring Technician or Team member. If significant issues arise, the AMS Coordinator will notify the Project Manager, Ambient Monitoring Technician, and the appropriate Regional Supervisor by written memorandum, describing the issue and providing recommendations for correcting the issue. As the Ambient Monitoring Technician’s direct supervisor, the Regional Supervisor is responsible for ensuring that these significant issues are resolved. In the case of Team members, the WSS Chief acts as direct supervisor and is responsible for ensuring issue resolution for these field staff.
Annually, the Ambient Monitoring Technicians, Team members and AMS Coordinator participate in USGS’s National Field Quality Assurance (NFQA) program. The NFQA is a yearly proficiency test for pH and specific conductance in order to provide precision data for field measurements and identify water quality analysts who need additional training. Staff who do not receive satisfactory readings are provided with additional training and retested. The QA Coordinator oversees the NFQA for WSS.
The Laboratory Section has a robust assessment program in place. Refer to Section 14: Performance and System Audits, Section 15: Quality Assurance Reports of their QAM (Appendix 8) for information.
3.2 Reports to Management
The AMS Coordinator reports significant issues to the Project Manager verbally and/or via written emails. Issues of interest to the DWR should be included in the annual WSS Update submitted by the Project Manager to the Section Head.
The AMS Coordinator, Water Quality Analyst, and QA Coordinator maintain a data assessment report, currently titled Important Information for Users of North Carolina Ambient Water Quality Monitoring Data, version 2.6 (Appendix 5). This is the main method for documenting significant quality concerns, changes in methodology, or other information vital to appropriate data interpretation. The document also accompanies all raw data requests and is incorporated into the text of the Ambient Monitoring Reports. It is updated as data quality issues arise.
Page | 36
4.0 DATA VALIDATION AND USABILITY
4.1 Data Review, Verification, and Validation
Data verification and validation occurs at every step of data generation and handling. Field staff, laboratory support staff, laboratory bench chemists, and data entry staff are each responsible for verifying that all records and results they produce or handle are completely and correctly recorded, transcribed, and transmitted. Each staff member and analytical Branch Supervisor is also responsible for ensuring that all activities performed (sampling, measurements, and analyses) comply with all requirements outlined in the following project documents:
AMS QAPP ISB SOP Laboratory QAM Laboratory SOPs
The AMS Coordinator is responsible for final verification and validation of all results.
4.2 Validation and Verification Methods
4.2.1 Field staff
Field staff will visually check the following items as produced to ensure that they are complete and correct:
Labels Sample submission documentation Field data worksheet (hard copy) Electronic field data spreadsheet submission (transcription of hard copy field worksheet)
Field staff will also review hard copy analytical results as received for completeness, accuracy, and unusual values. Any issues should be brought to the attention of the AMS Coordinator for resolution.
4.2.2 Laboratories
Data verification and validation activities performed by the Laboratory Section and applicable criteria are described in the QAM (Appendix 8). Activities involved in sample receipt are detailed in Section 7: Sample Custody and Handling. Verification of analytical results is detailed in Section 12.2: Data Verification.
If circumstances arise where samples do not meet criteria outlined in the QAM, the Laboratory will report this using their standard Sample Condition Upon Receipt (SCUR) form, Sample Anomaly Report (SAR), and flag the result using a standardized list of data qualifier codes. The most common qualifier codes used for AMS data are shown in Table 12. A full list is available in section 12.3: Reporting of the QAM. Copies of SCURs and SARs and data qualifiers will be provided along with the analytical report sent to the AMS Coordinator and Ambient Monitoring Technician.
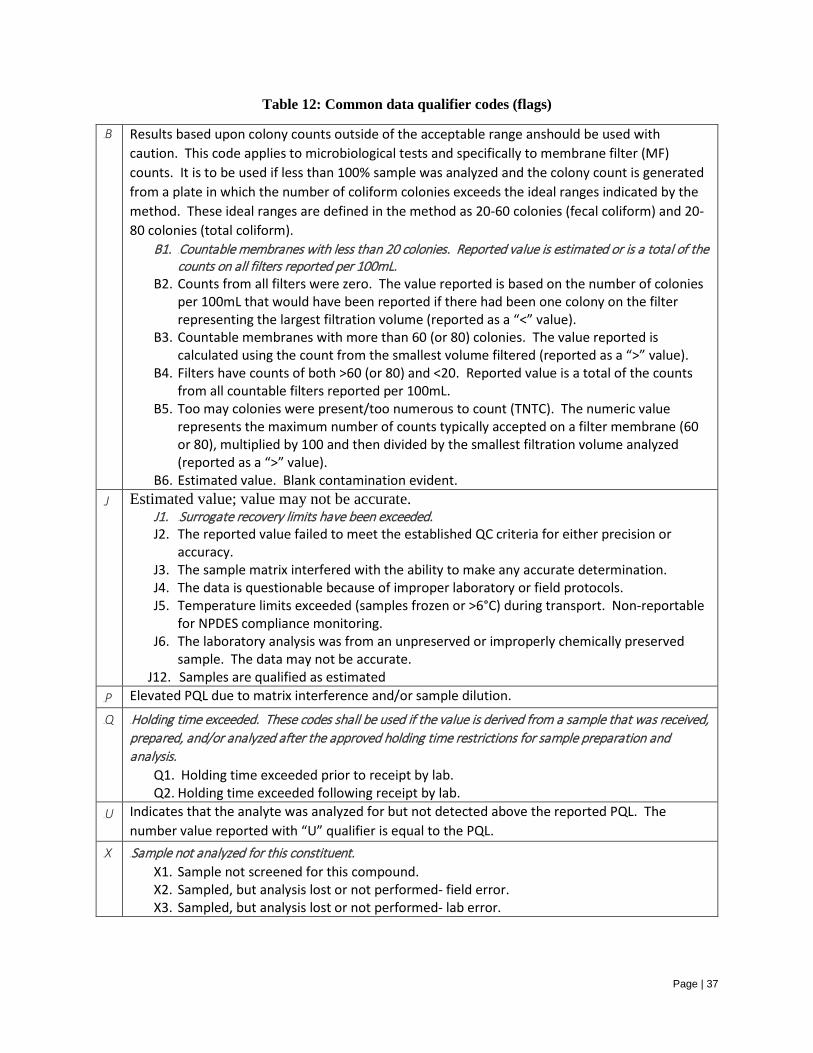
Page | 37
Table 12: Common data qualifier codes (flags)
0BB Results based upon colony counts outside of the acceptable range anshould be used with caution. This code applies to microbiological tests and specifically to membrane filter (MF) counts. It is to be used if less than 100% sample was analyzed and the colony count is generated from a plate in which the number of coliform colonies exceeds the ideal ranges indicated by the method. These ideal ranges are defined in the method as 20-60 colonies (fecal coliform) and 20-80 colonies (total coliform).
B1. 1BCountable membranes with less than 20 colonies. Reported value is estimated or is a total of the counts on all filters reported per 100mL.
B2. Counts from all filters were zero. The value reported is based on the number of colonies per 100mL that would have been reported if there had been one colony on the filter representing the largest filtration volume (reported as a “<” value).
B3. Countable membranes with more than 60 (or 80) colonies. The value reported is calculated using the count from the smallest volume filtered (reported as a “>” value).
B4. Filters have counts of both >60 (or 80) and <20. Reported value is a total of the counts from all countable filters reported per 100mL.
B5. Too may colonies were present/too numerous to count (TNTC). The numeric value represents the maximum number of counts typically accepted on a filter membrane (60 or 80), multiplied by 100 and then divided by the smallest filtration volume analyzed (reported as a “>” value).
B6. Estimated value. Blank contamination evident. 2BJ Estimated value; value may not be accurate.
J1. 3BSurrogate recovery limits have been exceeded. J2. The reported value failed to meet the established QC criteria for either precision or
accuracy. J3. The sample matrix interfered with the ability to make any accurate determination. J4. The data is questionable because of improper laboratory or field protocols. J5. Temperature limits exceeded (samples frozen or >6°C) during transport. Non-reportable
for NPDES compliance monitoring. J6. The laboratory analysis was from an unpreserved or improperly chemically preserved
sample. The data may not be accurate. J12. Samples are qualified as estimated
4BP Elevated PQL due to matrix interference and/or sample dilution.
5BQ 6BHolding time exceeded. These codes shall be used if the value is derived from a sample that was received, prepared, and/or analyzed after the approved holding time restrictions for sample preparation and analysis.
Q1. Holding time exceeded prior to receipt by lab. Q2. Holding time exceeded following receipt by lab.
7BU Indicates that the analyte was analyzed for but not detected above the reported PQL. The number value reported with “U” qualifier is equal to the PQL.
8BX 9BSample not analyzed for this constituent. X1. Sample not screened for this compound. X2. Sampled, but analysis lost or not performed- field error. X3. Sampled, but analysis lost or not performed- lab error.
Page | 38
10BY Elevated PQL due to insufficient sample size.
11BZ The sample analysis/results are not reported due to: Z1. Inability to analyze the sample. Z2. Questions concerning data reliability.
The presence of absence of the analyte cannot be verified.
4.2.3 AMS Coordinator
Final review, validation, and verification duties of results reported by Regional Monitors and the Laboratory are performed by the AMS Coordinator monthly.
Review: Data are pulled from Labworks and Laboratory staff will be consulted for clarification or corrections if needed.
Monthly: Review electronic field data submissions from Regional Monitors. Consult individual Monitors for clarification or corrections if needed.
Quarterly: All results, field and analytical, compiled, reviewed, validated, and verified.
The methods, criteria, and checklists used by the AMS Coordinator for the quarterly data verification and validation are included in Appendix 6. Most methods rely on using Microsoft Access queries and SAS JMP analysis.
When errors or omissions are found or suspected, focused verification will be conducted. The available electronic field data submissions or hard copy lab reports will be consulted to rule out transcription or data entry errors. If no errors are found in these records, the field staff that conducted the sampling/measurement or the appropriate Laboratory Chemist will be contacted so they can consult original hard copy records. If the result in question is found to be in error as compared to the original documentation, it will be corrected by the AMS Coordinator. In the case of “impossible” values (e.g., pH of 19) if a corrected value cannot be determined from original documentation, the result will be deleted. “Unusual” values (i.e., above or below the latest five-year period’s minimum or maximum for that station) that are confirmed by original documentation are left intact and unqualified.
Once these steps are completed, data and any accompanying information (comments from field staff, data qualifiers/flags) are considered finalized and are added to the data warehouse. In fulfillment of data requests, the AMS Coordinator will provide all comments, data qualifiers, and a current copy of the data assessment document (Important Information for Users of North Carolina Ambient Water Quality Monitoring Data, v. 2.6) to assist the data user with interpretation of the raw data and facilitate the data user’s assessment of the usability of the data for their project or program.
4.2.4 Data end-users
The EB Water Quality Analyst and others that request data retrievals from WSS may note odd or possibly incorrect values. These questionable data should be brought to the attention of the AMS Coordinator for focused verification. For data collected within the past five years, original lab reports and field data submissions are on file in the AMS Coordinator’s office. Lab reports between six and ten years old are stored at the State Records Center and can be accessed if necessary. These will be consulted to determine if correction or deletion of any records in the main warehouse is required, using the same criteria as described above for quarterly data reviews. Original
Page | 39
documentation for data collected before 1998 is not available and so confirmation and/or correction is not possible. This historic data will remain unchanged in the main warehouse and it is up to each data user to determine the proper handling of these results.
4.3 Reconciliation With User Requirements
When preparing the Ambient Monitoring Reports, the Water Quality Analyst will perform an additional tier of data review on results from the assessment period. This is a similar process to that performed by the AMS Coordinator. The Water Quality Analyst may use more stringent statistical validation methods in determining possible outliers or other anomalies. These may be omitted from the Ambient Monitoring Report data set for purposes of statistical analysis and reporting. The Water Quality Analyst will also review the current data assessment document and other available documentation of known issues or concerns.
One of the main objectives of the AMS is to use the data generated to determine the percentage of water quality standard violations. This information is combined with other available data by Water Planning Section staff to support their water quality management programs and reporting requirements, particularly 303(d)/305(b) reporting. For all indicators except fecal coliform, if data from a sampling station shows exceedance of the applicable water quality standard in more than 10% of samples, the reach may be subject to impairment for that indicator by the Water Planning Section. This threshold level of 10% is based on EPA guidance (U.S. EPA, 2005). However, this “raw-score” approach does not consider uncertainty, and the smaller the sample size, the greater the uncertainty.
In order to assist the Water Planning Section with making sound decisions of impairment, the AMS uses a nonparametric procedure to identify when a sufficient number of exceedances have occurred that indicate the probability of a true exceedance of greater than 10%. This method is described in detail in A Nonparametric Procedure for Listing and Delisting Impaired Waters Based on Criterion Exceedances (Lin, et al., 2000). It is partly based on the BINOMDIST function in Microsoft Excel.
For details, refer to: http://www.dep.state.fl.us/water/tmdl/docs/Supdocument.PDF.
A graphical representation of the relationships between sample size, number of exceedances, and percent confidence is shown in Figure 10. The triangles denote where the number of exceedances correspond with a sample size that provides about a 95% confidence that the population has greater than 10% of results violating a water quality standard.
When preparing the Ambient Monitoring Reports, the Water Quality Analyst will present a summary of all assessed indicators at all stations with a sample size of at least 10 and with more than 10% of samples exceeding the applicable standard. Instances in which the 10% threshold was exceeded with at least 90% confidence will be highlighted.
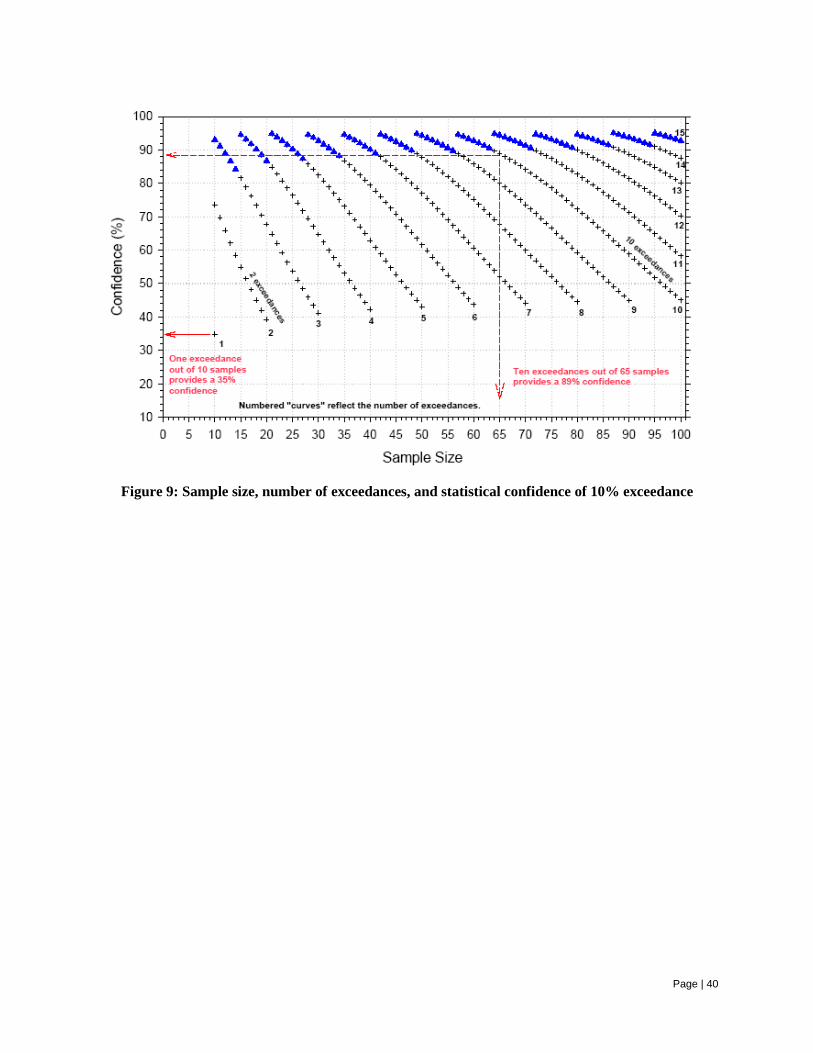
Page | 40
Figure 9: Sample size, number of exceedances, and statistical confidence of 10% exceedance
Page | 41
5.0 REFERENCES
American Public Health Association.1992. Standard Methods for the Examination of Water and Wastewater, 18th ed. Washington, D.C.: APHA.
American Public Health Association.1998. Standard Methods for the Examination of Water and
Wastewater, 20th ed. Washington, D.C.: APHA. HACH Environmental. 2006. Hydrolab DataSonde 5 and MiniSonde Water Quality Multiprobes User’s
Manual, Edition 3. Loveland, CO: HACH Environmental. Hydrolab Corporation. 1996. Surveyor 4 Water Quality Data Display User’s Manual Revision A. Austin,
TX: Hydrolab Corporation.
Hydrolab Corporation. 1999. DataSonde 4 and MiniSonde Water Quality Multiprobes User’s Manual, Revision G. Austin, TX: Hydrolab Corporation.
Hydrolab Corporation. 2001. Quanta Water Quality Monitoring System Operating Manual, Revision B.
Austin, TX: Hydrolab Corporation. Lin, Pi-Erh, Duane Meeter, and Xu-Feng Niu. 2000. A Nonparametric Procedure for Listing and
Delisting Impaired Waters Based on Criterion Exceedances. Tallahassee, FL: Florida State University, Department of Statistics.
NCDENR. 2010. North Carolina Water Quality Assessment and Impaired Waters List (2010 Integrated
305(b) and 303(d) Report). Raleigh, NC: NCDENR, Division of Water Quality, Planning Section.
NC Environmental Management Commission. 2015. Procedures for Assignment of Water Quality
Standards.15A NC Administrative Code Section 2B .0100.
NC Environmental Management Commission. 2015. Classifications and Water Quality Standards Applicable to Surface Waters and Wetlands of NC. 15A NC Administrative Code Section 2B .0200.
U.S. EPA. 2005. Guidance for 2006 Assessment, Listing and Reporting Requirements Pursuant to
Sections 303(d), 305(b) and 314 of the Clean Water Act. Washington, D.C.: U.S. EPA Office of Water.
U.S. EPA. 2002. Guidance for Quality Assurance Project Plans (QA/G-5). (EPA/240/R-02/009).
Washington, D.C.: Government Printing Office. U.S. EPA. 2002. Guidance on Choosing a Sampling Design for Environmental Data Collection (QA/G-
5S). (EPA/240/R-02/005). Washington, D.C.: Government Printing Office. U.S. EPA. 2002. Guidance on Environmental Data Verification and Data Validation (QA/G-8).
(EPA/240/R-02/004). Washington, D.C.: Government Printing Office.
Page | 42
U.S. EPA. 2001. EPA Requirements for Quality Assurance Project Plans (QA/R-5) (EPA/240/B-01/003).
Washington, D.C.: Government Printing Office. U.S. EPA. 1996. Method 1669: Sampling Ambient Water for Trace Metals at EPA Water Quality Criteria
Levels. Cincinatti, OH: U.S. EPA NCEPI. U.S. EPA. 2002. Method 1631, Revision E Mercury in Water by Oxidation, Purge and Trap, and Cold Vapor Atomic Fluorescence Spectrometry (EPA 821-R-02-019). Washington, D.C.: U.S.
EPA Office of Water. YSI, Inc. 2009. YSI Professional Plus User Manual, Revision D. Yellow Springs, OH: YSI, Inc.
NC AMS QAPP Appendix 1 EPA Approved: July 2017 Version 2.0
Appendix 1: Organizational Information
AMS Distribution List Contact Information

NC AMS QAPP Appendix 1 EPA Approved: July 2017 Version 2.0
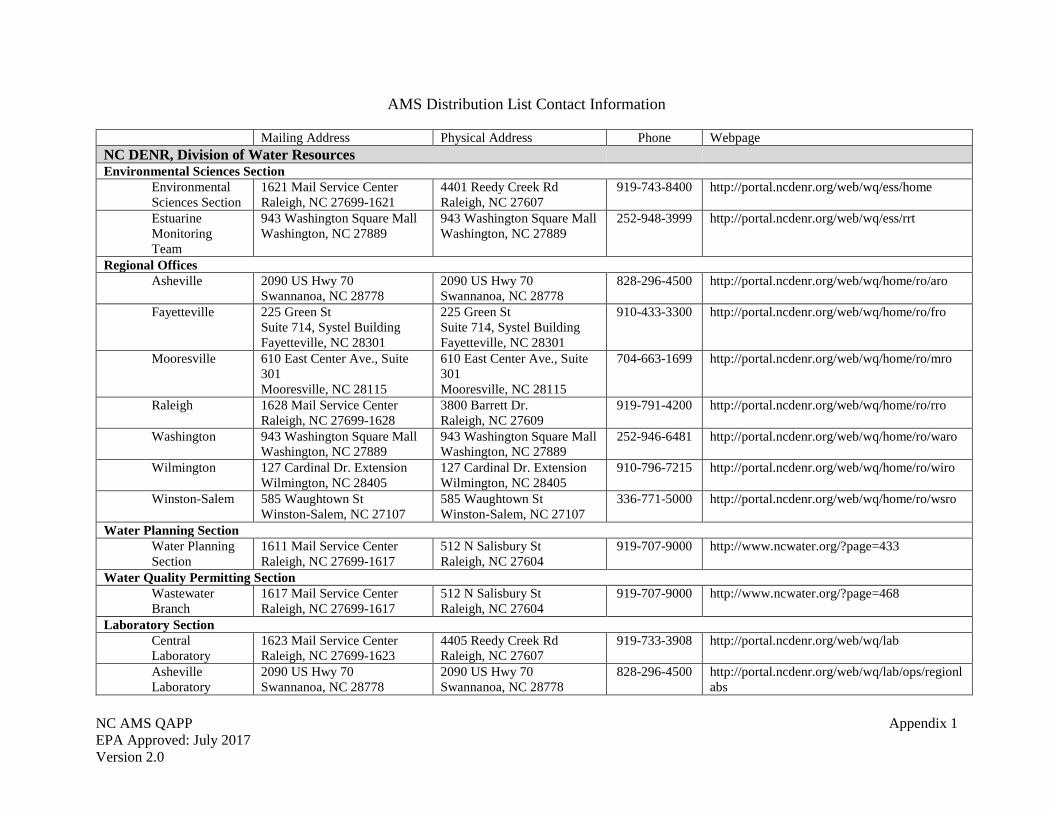
NC AMS QAPP Appendix 1 EPA Approved: July 2017 Version 2.0
AMS Distribution List Contact Information
Mailing Address Physical Address Phone Webpage NC DENR, Division of Water Resources Environmental Sciences Section
Environmental Sciences Section
1621 Mail Service Center Raleigh, NC 27699-1621
4401 Reedy Creek Rd Raleigh, NC 27607
919-743-8400 http://portal.ncdenr.org/web/wq/ess/home
Estuarine Monitoring Team
943 Washington Square Mall Washington, NC 27889
943 Washington Square Mall Washington, NC 27889
252-948-3999 http://portal.ncdenr.org/web/wq/ess/rrt
Regional Offices Asheville 2090 US Hwy 70
Swannanoa, NC 28778 2090 US Hwy 70 Swannanoa, NC 28778
828-296-4500 http://portal.ncdenr.org/web/wq/home/ro/aro
Fayetteville 225 Green St Suite 714, Systel Building Fayetteville, NC 28301
225 Green St Suite 714, Systel Building Fayetteville, NC 28301
910-433-3300 http://portal.ncdenr.org/web/wq/home/ro/fro
Mooresville 610 East Center Ave., Suite 301 Mooresville, NC 28115
610 East Center Ave., Suite 301 Mooresville, NC 28115
704-663-1699 http://portal.ncdenr.org/web/wq/home/ro/mro
Raleigh 1628 Mail Service Center Raleigh, NC 27699-1628
3800 Barrett Dr. Raleigh, NC 27609
919-791-4200 http://portal.ncdenr.org/web/wq/home/ro/rro
Washington 943 Washington Square Mall Washington, NC 27889
943 Washington Square Mall Washington, NC 27889
252-946-6481 http://portal.ncdenr.org/web/wq/home/ro/waro
Wilmington 127 Cardinal Dr. Extension Wilmington, NC 28405
127 Cardinal Dr. Extension Wilmington, NC 28405
910-796-7215 http://portal.ncdenr.org/web/wq/home/ro/wiro
Winston-Salem 585 Waughtown St Winston-Salem, NC 27107
585 Waughtown St Winston-Salem, NC 27107
336-771-5000 http://portal.ncdenr.org/web/wq/home/ro/wsro
Water Planning Section Water Planning Section
1611 Mail Service Center Raleigh, NC 27699-1617
512 N Salisbury St Raleigh, NC 27604
919-707-9000 http://www.ncwater.org/?page=433
Water Quality Permitting Section Wastewater Branch
1617 Mail Service Center Raleigh, NC 27699-1617
512 N Salisbury St Raleigh, NC 27604
919-707-9000 http://www.ncwater.org/?page=468
Laboratory Section Central Laboratory
1623 Mail Service Center Raleigh, NC 27699-1623
4405 Reedy Creek Rd Raleigh, NC 27607
919-733-3908 http://portal.ncdenr.org/web/wq/lab
Asheville Laboratory
2090 US Hwy 70 Swannanoa, NC 28778
2090 US Hwy 70 Swannanoa, NC 28778
828-296-4500 http://portal.ncdenr.org/web/wq/lab/ops/regionlabs
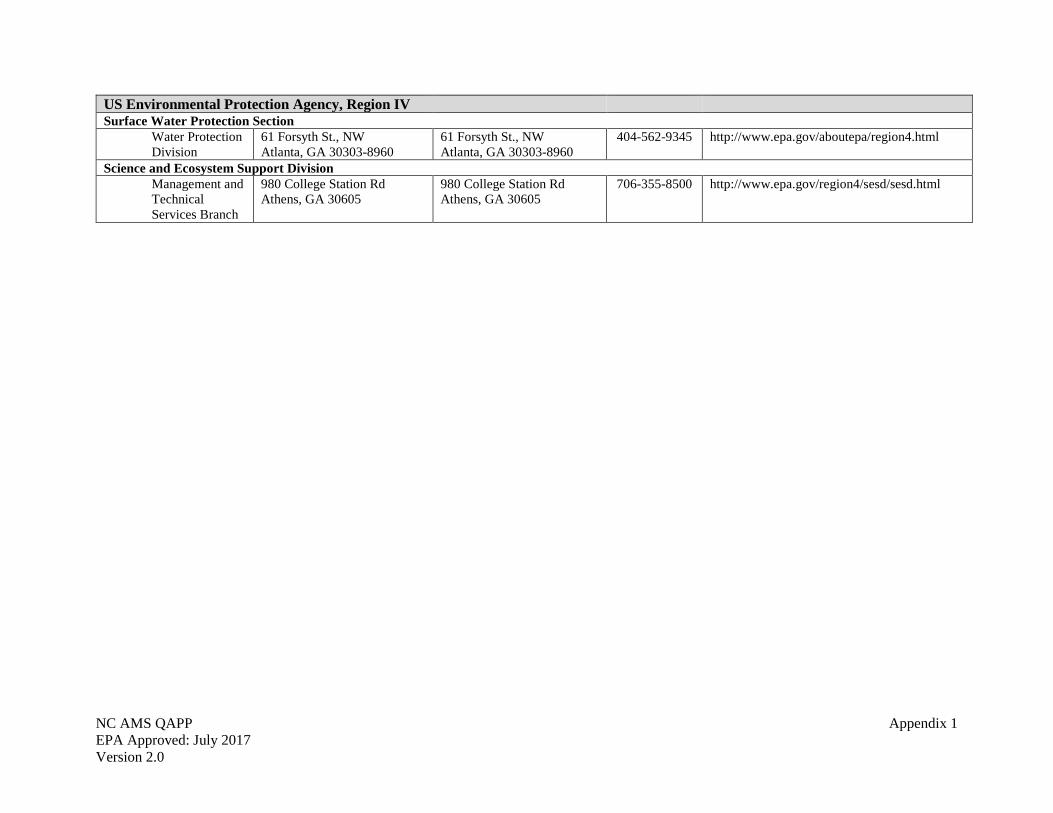
NC AMS QAPP Appendix 1 EPA Approved: July 2017 Version 2.0
US Environmental Protection Agency, Region IV Surface Water Protection Section
Water Protection Division
61 Forsyth St., NW Atlanta, GA 30303-8960
61 Forsyth St., NW Atlanta, GA 30303-8960
404-562-9345 http://www.epa.gov/aboutepa/region4.html
Science and Ecosystem Support Division Management and Technical Services Branch
980 College Station Rd Athens, GA 30605
980 College Station Rd Athens, GA 30605
706-355-8500 http://www.epa.gov/region4/sesd/sesd.html
NC AMS QAPP Appendix 2 EPA Approved: July 2017 Version 2.0
Appendix 2: NC Water Quality Standards Summary
Summary Table of Surface Water Standards

NC AMS QAPP Appendix 2 EPA Approved: July 2017 Version 2.0
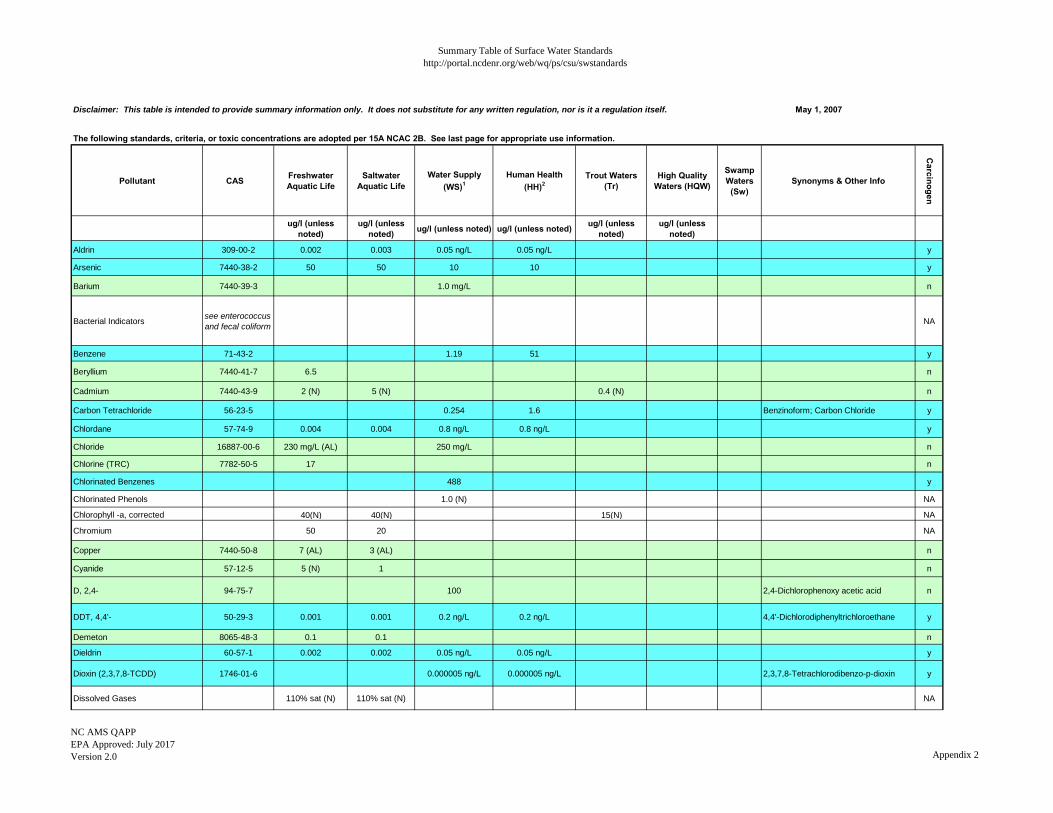
Summary Table of Surface Water Standardshttp://portal.ncdenr.org/web/wq/ps/csu/swstandards
NC AMS QAPPEPA Approved: July 2017Version 2.0 Appendix 2
Disclaimer: This table is intended to provide summary information only. It does not substitute for any written regulation, nor is it a regulation itself. May 1, 2007
The following standards, criteria, or toxic concentrations are adopted per 15A NCAC 2B. See last page for appropriate use information.
Pollutant CAS # Freshwater Aquatic Life
Saltwater Aquatic Life
Water Supply (WS)1
Human Health (HH)2
Trout Waters (Tr)
High Quality Waters (HQW)
Swamp Waters
(Sw)Synonyms & Other Info
Carcinogen
ug/l (unless noted)
ug/l (unless noted) ug/l (unless noted) ug/l (unless noted) ug/l (unless
noted)ug/l (unless
noted)
Aldrin 309-00-2 0.002 0.003 0.05 ng/L 0.05 ng/L y
Arsenic 7440-38-2 50 50 10 10 y
Barium 7440-39-3 1.0 mg/L n
Bacterial Indicators see enterococcus and fecal coliform NA
Benzene 71-43-2 1.19 51 y
Beryllium 7440-41-7 6.5 n
Cadmium 7440-43-9 2 (N) 5 (N) 0.4 (N) n
Carbon Tetrachloride 56-23-5 0.254 1.6 Benzinoform; Carbon Chloride y
Chlordane 57-74-9 0.004 0.004 0.8 ng/L 0.8 ng/L y
Chloride 16887-00-6 230 mg/L (AL) 250 mg/L n
Chlorine (TRC) 7782-50-5 17 n
Chlorinated Benzenes 488 y
Chlorinated Phenols 1.0 (N) NA
Chlorophyll -a, corrected 40(N) 40(N) 15(N) NA
Chromium 50 20 NA
Copper 7440-50-8 7 (AL) 3 (AL) n
Cyanide 57-12-5 5 (N) 1 n
D, 2,4- 94-75-7 100 2,4-Dichlorophenoxy acetic acid n
DDT, 4,4'- 50-29-3 0.001 0.001 0.2 ng/L 0.2 ng/L 4,4'-Dichlorodiphenyltrichloroethane y
Demeton 8065-48-3 0.1 0.1 n
Dieldrin 60-57-1 0.002 0.002 0.05 ng/L 0.05 ng/L y
Dioxin (2,3,7,8-TCDD) 1746-01-6 0.000005 ng/L 0.000005 ng/L 2,3,7,8-Tetrachlorodibenzo-p-dioxin y
Dissolved Gases 110% sat (N) 110% sat (N) NA
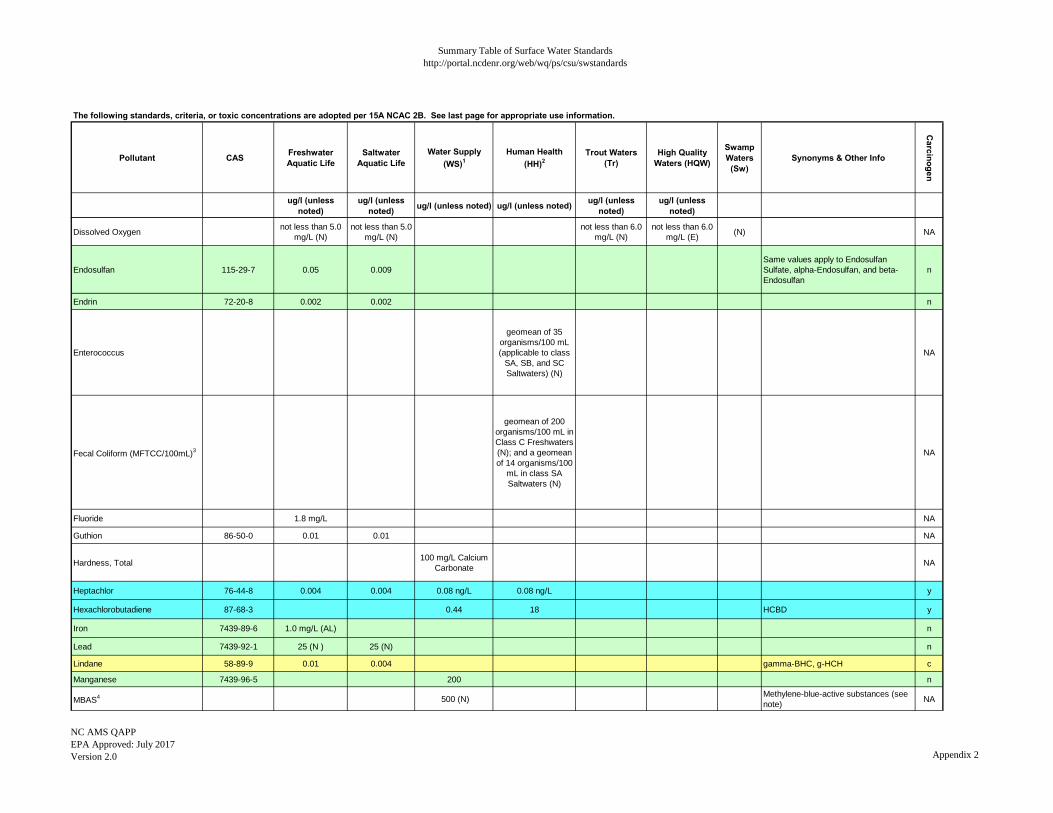
Summary Table of Surface Water Standardshttp://portal.ncdenr.org/web/wq/ps/csu/swstandards
NC AMS QAPPEPA Approved: July 2017Version 2.0 Appendix 2
The following standards, criteria, or toxic concentrations are adopted per 15A NCAC 2B. See last page for appropriate use information.
Pollutant CAS # Freshwater Aquatic Life
Saltwater Aquatic Life
Water Supply (WS)1
Human Health (HH)2
Trout Waters (Tr)
High Quality Waters (HQW)
Swamp Waters
(Sw)Synonyms & Other Info
Carcinogen
ug/l (unless noted)
ug/l (unless noted) ug/l (unless noted) ug/l (unless noted) ug/l (unless
noted)ug/l (unless
noted)
Dissolved Oxygen not less than 5.0 mg/L (N)
not less than 5.0 mg/L (N)
not less than 6.0 mg/L (N)
not less than 6.0 mg/L (E) (N) NA
Endosulfan 115-29-7 0.05 0.009Same values apply to Endosulfan Sulfate, alpha-Endosulfan, and beta-Endosulfan
n
Endrin 72-20-8 0.002 0.002 n
Enterococcus
geomean of 35 organisms/100 mL (applicable to class
SA, SB, and SC Saltwaters) (N)
NA
Fecal Coliform (MFTCC/100mL)3
geomean of 200 organisms/100 mL in Class C Freshwaters (N); and a geomean of 14 organisms/100
mL in class SA Saltwaters (N)
NA
Fluoride 1.8 mg/L NA
Guthion 86-50-0 0.01 0.01 NA
Hardness, Total 100 mg/L Calcium Carbonate NA
Heptachlor 76-44-8 0.004 0.004 0.08 ng/L 0.08 ng/L y
Hexachlorobutadiene 87-68-3 0.44 18 HCBD y
Iron 7439-89-6 1.0 mg/L (AL) n
Lead 7439-92-1 25 (N ) 25 (N) n
Lindane 58-89-9 0.01 0.004 gamma-BHC, g-HCH c
Manganese 7439-96-5 200 n
MBAS4 500 (N) Methylene-blue-active substances (see note) NA
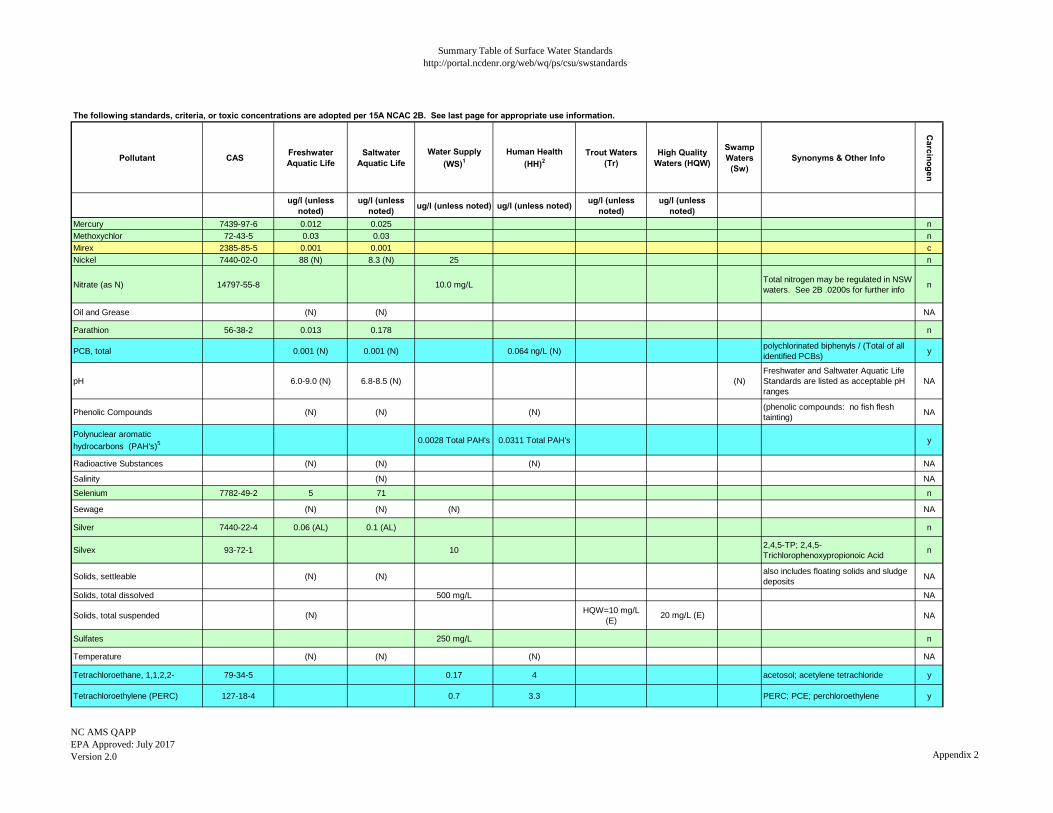
Summary Table of Surface Water Standardshttp://portal.ncdenr.org/web/wq/ps/csu/swstandards
NC AMS QAPPEPA Approved: July 2017Version 2.0 Appendix 2
The following standards, criteria, or toxic concentrations are adopted per 15A NCAC 2B. See last page for appropriate use information.
Pollutant CAS # Freshwater Aquatic Life
Saltwater Aquatic Life
Water Supply (WS)1
Human Health (HH)2
Trout Waters (Tr)
High Quality Waters (HQW)
Swamp Waters
(Sw)Synonyms & Other Info
Carcinogen
ug/l (unless noted)
ug/l (unless noted) ug/l (unless noted) ug/l (unless noted) ug/l (unless
noted)ug/l (unless
noted)Mercury 7439-97-6 0.012 0.025 nMethoxychlor 72-43-5 0.03 0.03 nMirex 2385-85-5 0.001 0.001 cNickel 7440-02-0 88 (N) 8.3 (N) 25 n
Nitrate (as N) 14797-55-8 10.0 mg/L Total nitrogen may be regulated in NSW waters. See 2B .0200s for further info n
Oil and Grease (N) (N) NA
Parathion 56-38-2 0.013 0.178 n
PCB, total 0.001 (N) 0.001 (N) 0.064 ng/L (N) polychlorinated biphenyls / (Total of all identified PCBs) y
pH 6.0-9.0 (N) 6.8-8.5 (N) (N)Freshwater and Saltwater Aquatic Life Standards are listed as acceptable pH ranges
NA
Phenolic Compounds (N) (N) (N) (phenolic compounds: no fish flesh tainting) NA
Polynuclear aromatic hydrocarbons (PAH's)5 0.0028 Total PAH's 0.0311 Total PAH's y
Radioactive Substances (N) (N) (N) NA
Salinity (N) NA
Selenium 7782-49-2 5 71 n
Sewage (N) (N) (N) NA
Silver 7440-22-4 0.06 (AL) 0.1 (AL) n
Silvex 93-72-1 10 2,4,5-TP; 2,4,5-Trichlorophenoxypropionoic Acid n
Solids, settleable (N) (N) also includes floating solids and sludge deposits NA
Solids, total dissolved 500 mg/L NA
Solids, total suspended (N) HQW=10 mg/L (E) 20 mg/L (E) NA
Sulfates 250 mg/L n
Temperature (N) (N) (N) NA
Tetrachloroethane, 1,1,2,2- 79-34-5 0.17 4 acetosol; acetylene tetrachloride y
Tetrachloroethylene (PERC) 127-18-4 0.7 3.3 PERC; PCE; perchloroethylene y
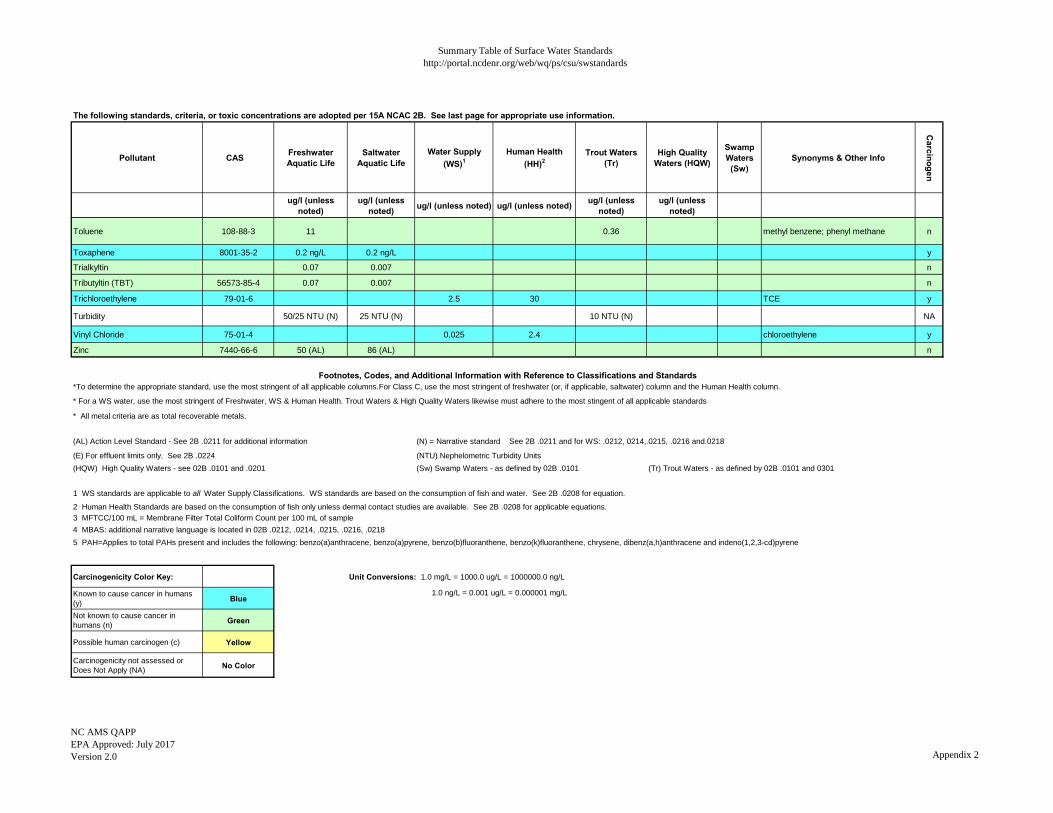
Summary Table of Surface Water Standardshttp://portal.ncdenr.org/web/wq/ps/csu/swstandards
NC AMS QAPPEPA Approved: July 2017Version 2.0 Appendix 2
The following standards, criteria, or toxic concentrations are adopted per 15A NCAC 2B. See last page for appropriate use information.
Pollutant CAS # Freshwater Aquatic Life
Saltwater Aquatic Life
Water Supply (WS)1
Human Health (HH)2
Trout Waters (Tr)
High Quality Waters (HQW)
Swamp Waters
(Sw)Synonyms & Other Info
Carcinogen
ug/l (unless noted)
ug/l (unless noted) ug/l (unless noted) ug/l (unless noted) ug/l (unless
noted)ug/l (unless
noted)
Toluene 108-88-3 11 0.36 methyl benzene; phenyl methane n
Toxaphene 8001-35-2 0.2 ng/L 0.2 ng/L y
Trialkyltin 0.07 0.007 n
Tributyltin (TBT) 56573-85-4 0.07 0.007 n
Trichloroethylene 79-01-6 2.5 30 TCE y
Turbidity 50/25 NTU (N) 25 NTU (N) 10 NTU (N) NA
Vinyl Chloride 75-01-4 0.025 2.4 chloroethylene y
Zinc 7440-66-6 50 (AL) 86 (AL) n
Footnotes, Codes, and Additional Information with Reference to Classifications and Standards*To determine the appropriate standard, use the most stringent of all applicable columns.For Class C, use the most stringent of freshwater (or, if applicable, saltwater) column and the Human Health column.
* For a WS water, use the most stringent of Freshwater, WS & Human Health. Trout Waters & High Quality Waters likewise must adhere to the most stingent of all applicable standards
* All metal criteria are as total recoverable metals.
(AL) Action Level Standard - See 2B .0211 for additional information (N) = Narrative standard See 2B .0211 and for WS: .0212, 0214,.0215, .0216 and.0218
(E) For effluent limits only. See 2B .0224 (NTU) Nephelometric Turbidity Units(HQW) High Quality Waters - see 02B .0101 and .0201 (Sw) Swamp Waters - as defined by 02B .0101 (Tr) Trout Waters - as defined by 02B .0101 and 0301
1 WS standards are applicable to all Water Supply Classifications. WS standards are based on the consumption of fish and water. See 2B .0208 for equation.
2 Human Health Standards are based on the consumption of fish only unless dermal contact studies are available. See 2B .0208 for applicable equations.3 MFTCC/100 mL = Membrane Filter Total Coliform Count per 100 mL of sample4 MBAS: additional narrative language is located in 02B .0212, .0214, .0215, .0216, .02185 PAH=Applies to total PAHs present and includes the following: benzo(a)anthracene, benzo(a)pyrene, benzo(b)fluoranthene, benzo(k)fluoranthene, chrysene, dibenz(a,h)anthracene and indeno(1,2,3-cd)pyrene
Carcinogenicity Color Key: Unit Conversions: 1.0 mg/L = 1000.0 ug/L = 1000000.0 ng/L
Known to cause cancer in humans (y) Blue
1.0 ng/L = 0.001 ug/L = 0.000001 mg/L
Not known to cause cancer in humans (n) Green
Possible human carcinogen (c) Yellow
Carcinogenicity not assessed or Does Not Apply (NA) No Color
NC AMS QAPP Appendix 3 EPA Approved: July 2017 Version 2.0
Appendix 3: Station Information
Station list, including location, indicators measured, and sampling frequency

NC AMS QAPP Appendix 3 EPA Approved: July 2017 Version 2.0
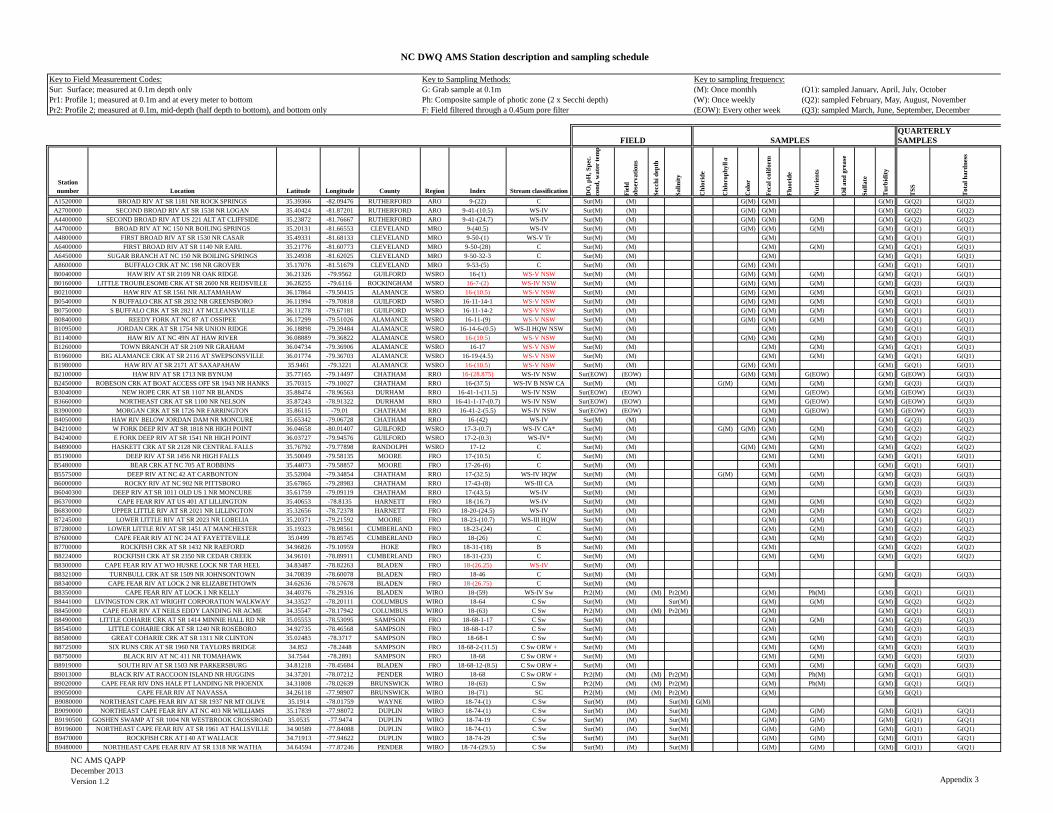
NC DWQ AMS Station description and sampling schedule
NC AMS QAPPDecember 2013Version 1.2 Appendix 3
Key to Field Measurement Codes: Key to Sampling Methods: Key to sampling frequency:Sur: Surface; measured at 0.1m depth only G: Grab sample at 0.1m (M): Once monthly (Q1): sampled January, April, July, OctoberPr1: Profile 1; measured at 0.1m and at every meter to bottom Ph: Composite sample of photic zone (2 x Secchi depth) (W): Once weekly (Q2): sampled February, May, August, NovemberPr2: Profile 2; measured at 0.1m, mid-depth (half depth to bottom), and bottom only F: Field filtered through a 0.45um pore filter (EOW): Every other week (Q3): sampled March, June, September, December
QUARTERLY FIELD SAMPLES SAMPLES
Station number Location Latitude Longitude County Region Index Stream classification D
O, p
H, S
pec.
co
nd, w
ater
tem
p
Fiel
d ob
serv
atio
ns
Secc
hi d
epth
Salin
ity
Chl
orid
e
Chl
orop
hyll
a
Col
or
F eca
l col
iform
Fluo
ride
Nut
rien
ts
Oil
and
grea
se
Sulfa
te
Turb
idity
TSS
Tota
l har
dnes
s
A1520000 BROAD RIV AT SR 1181 NR ROCK SPRINGS 35.39366 -82.09476 RUTHERFORD ARO 9-(22) C Sur(M) (M) G(M) G(M) G(M) G(Q2) G(Q2)A2700000 SECOND BROAD RIV AT SR 1538 NR LOGAN 35.40424 -81.87201 RUTHERFORD ARO 9-41-(10.5) WS-IV Sur(M) (M) G(M) G(M) G(M) G(Q2) G(Q2)A4400000 SECOND BROAD RIV AT US 221 ALT AT CLIFFSIDE 35.23872 -81.76667 RUTHERFORD ARO 9-41-(24.7) WS-IV Sur(M) (M) G(M) G(M) G(M) G(M) G(Q2) G(Q2)A4700000 BROAD RIV AT NC 150 NR BOILING SPRINGS 35.20131 -81.66553 CLEVELAND MRO 9-(40.5) WS-IV Sur(M) (M) G(M) G(M) G(M) G(M) G(Q1) G(Q1)A4800000 FIRST BROAD RIV AT SR 1530 NR CASAR 35.49331 -81.68133 CLEVELAND MRO 9-50-(1) WS-V Tr Sur(M) (M) G(M) G(M) G(Q1) G(Q1)A6400000 FIRST BROAD RIV AT SR 1140 NR EARL 35.21776 -81.60773 CLEVELAND MRO 9-50-(28) C Sur(M) (M) G(M) G(M) G(M) G(Q1) G(Q1)A6450000 SUGAR BRANCH AT NC 150 NR BOILING SPRINGS 35.24938 -81.62025 CLEVELAND MRO 9-50-32-3 C Sur(M) (M) G(M) G(M) G(Q1) G(Q1)A8600000 BUFFALO CRK AT NC 198 NR GROVER 35.17076 -81.51679 CLEVELAND MRO 9-53-(5) C Sur(M) (M) G(M) G(M) G(M) G(Q1) G(Q1)B0040000 HAW RIV AT SR 2109 NR OAK RIDGE 36.21326 -79.9562 GUILFORD WSRO 16-(1) WS-V NSW Sur(M) (M) G(M) G(M) G(M) G(M) G(Q1) G(Q1)B0160000 LITTLE TROUBLESOME CRK AT SR 2600 NR REIDSVILLE 36.28255 -79.6116 ROCKINGHAM WSRO 16-7-(2) WS-IV NSW Sur(M) (M) G(M) G(M) G(M) G(M) G(Q3) G(Q3)B0210000 HAW RIV AT SR 1561 NR ALTAMAHAW 36.17864 -79.50415 ALAMANCE WSRO 16-(10.5) WS-V NSW Sur(M) (M) G(M) G(M) G(M) G(M) G(Q1) G(Q1)B0540000 N BUFFALO CRK AT SR 2832 NR GREENSBORO 36.11994 -79.70818 GUILFORD WSRO 16-11-14-1 WS-V NSW Sur(M) (M) G(M) G(M) G(M) G(M) G(Q1) G(Q1)B0750000 S BUFFALO CRK AT SR 2821 AT MCLEANSVILLE 36.11278 -79.67181 GUILFORD WSRO 16-11-14-2 WS-V NSW Sur(M) (M) G(M) G(M) G(M) G(M) G(Q1) G(Q1)B0840000 REEDY FORK AT NC 87 AT OSSIPEE 36.17299 -79.51026 ALAMANCE WSRO 16-11-(9) WS-V NSW Sur(M) (M) G(M) G(M) G(M) G(M) G(Q1) G(Q1)B1095000 JORDAN CRK AT SR 1754 NR UNION RIDGE 36.18898 -79.39484 ALAMANCE WSRO 16-14-6-(0.5) WS-II HQW NSW Sur(M) (M) G(M) G(M) G(Q1) G(Q1)B1140000 HAW RIV AT NC 49N AT HAW RIVER 36.08889 -79.36822 ALAMANCE WSRO 16-(10.5) WS-V NSW Sur(M) (M) G(M) G(M) G(M) G(M) G(Q1) G(Q1)B1260000 TOWN BRANCH AT SR 2109 NR GRAHAM 36.04734 -79.36906 ALAMANCE WSRO 16-17 WS-V NSW Sur(M) (M) G(M) G(M) G(M) G(Q1) G(Q1)B1960000 BIG ALAMANCE CRK AT SR 2116 AT SWEPSONSVILLE 36.01774 -79.36703 ALAMANCE WSRO 16-19-(4.5) WS-V NSW Sur(M) (M) G(M) G(M) G(M) G(Q1) G(Q1)B1980000 HAW RIV AT SR 2171 AT SAXAPAHAW 35.9461 -79.3221 ALAMANCE WSRO 16-(10.5) WS-V NSW Sur(M) (M) G(M) G(M) G(M) G(Q1) G(Q1)B2100000 HAW RIV AT SR 1713 NR BYNUM 35.77165 -79.14497 CHATHAM RRO 16-(28.875) WS-IV NSW Sur(EOW) (EOW) G(M) G(M) G(EOW) G(M) G(EOW) G(Q3)B2450000 ROBESON CRK AT BOAT ACCESS OFF SR 1943 NR HANKS 35.70315 -79.10027 CHATHAM RRO 16-(37.5) WS-IV B NSW CA Sur(M) (M) G(M) G(M) G(M) G(M) G(Q3) G(Q3)B3040000 NEW HOPE CRK AT SR 1107 NR BLANDS 35.88474 -78.96563 DURHAM RRO 16-41-1-(11.5) WS-IV NSW Sur(EOW) (EOW) G(M) G(EOW) G(M) G(EOW) G(Q3)B3660000 NORTHEAST CRK AT SR 1100 NR NELSON 35.87243 -78.91322 DURHAM RRO 16-41-1-17-(0.7) WS-IV NSW Sur(EOW) (EOW) G(M) G(EOW) G(M) G(EOW) G(Q3)B3900000 MORGAN CRK AT SR 1726 NR FARRINGTON 35.86115 -79.01 CHATHAM RRO 16-41-2-(5.5) WS-IV NSW Sur(EOW) (EOW) G(M) G(EOW) G(M) G(EOW) G(Q3)B4050000 HAW RIV BELOW JORDAN DAM NR MONCURE 35.65342 -79.06728 CHATHAM RRO 16-(42) WS-IV Sur(M) (M) G(M) G(M) G(Q3) G(Q3)B4210000 W FORK DEEP RIV AT SR 1818 NR HIGH POINT 36.04658 -80.01407 GUILFORD WSRO 17-3-(0.7) WS-IV CA* Sur(M) (M) G(M) G(M) G(M) G(M) G(M) G(Q2) G(Q2)B4240000 E FORK DEEP RIV AT SR 1541 NR HIGH POINT 36.03727 -79.94576 GUILFORD WSRO 17-2-(0.3) WS-IV* Sur(M) (M) G(M) G(M) G(M) G(Q2) G(Q2)B4890000 HASKETT CRK AT SR 2128 NR CENTRAL FALLS 35.76792 -79.77898 RANDOLPH WSRO 17-12 C Sur(M) (M) G(M) G(M) G(M) G(M) G(Q2) G(Q2)B5190000 DEEP RIV AT SR 1456 NR HIGH FALLS 35.50049 -79.58135 MOORE FRO 17-(10.5) C Sur(M) (M) G(M) G(M) G(M) G(Q1) G(Q1)B5480000 BEAR CRK AT NC 705 AT ROBBINS 35.44073 -79.58857 MOORE FRO 17-26-(6) C Sur(M) (M) G(M) G(M) G(Q1) G(Q1)B5575000 DEEP RIV AT NC 42 AT CARBONTON 35.52004 -79.34854 CHATHAM RRO 17-(32.5) WS-IV HQW Sur(M) (M) G(M) G(M) G(M) G(M) G(Q3) G(Q3)B6000000 ROCKY RIV AT NC 902 NR PITTSBORO 35.67865 -79.28983 CHATHAM RRO 17-43-(8) WS-III CA Sur(M) (M) G(M) G(M) G(M) G(Q3) G(Q3)B6040300 DEEP RIV AT SR 1011 OLD US 1 NR MONCURE 35.61759 -79.09119 CHATHAM RRO 17-(43.5) WS-IV Sur(M) (M) G(M) G(M) G(Q3) G(Q3)B6370000 CAPE FEAR RIV AT US 401 AT LILLINGTON 35.40653 -78.8135 HARNETT FRO 18-(16.7) WS-IV Sur(M) (M) G(M) G(M) G(M) G(Q2) G(Q2)B6830000 UPPER LITTLE RIV AT SR 2021 NR LILLINGTON 35.32656 -78.72378 HARNETT FRO 18-20-(24.5) WS-IV Sur(M) (M) G(M) G(M) G(M) G(Q2) G(Q2)B7245000 LOWER LITTLE RIV AT SR 2023 NR LOBELIA 35.20371 -79.21592 MOORE FRO 18-23-(10.7) WS-III HQW Sur(M) (M) G(M) G(M) G(M) G(Q1) G(Q1)B7280000 LOWER LITTLE RIV AT SR 1451 AT MANCHESTER 35.19323 -78.98561 CUMBERLAND FRO 18-23-(24) C Sur(M) (M) G(M) G(M) G(M) G(Q2) G(Q2)B7600000 CAPE FEAR RIV AT NC 24 AT FAYETTEVILLE 35.0499 -78.85745 CUMBERLAND FRO 18-(26) C Sur(M) (M) G(M) G(M) G(M) G(Q2) G(Q2)B7700000 ROCKFISH CRK AT SR 1432 NR RAEFORD 34.96826 -79.10959 HOKE FRO 18-31-(18) B Sur(M) (M) G(M) G(M) G(Q2) G(Q2)B8224000 ROCKFISH CRK AT SR 2350 NR CEDAR CREEK 34.96101 -78.89911 CUMBERLAND FRO 18-31-(23) C Sur(M) (M) G(M) G(M) G(M) G(Q2) G(Q2)B8300000 CAPE FEAR RIV AT WO HUSKE LOCK NR TAR HEEL 34.83487 -78.82263 BLADEN FRO 18-(26.25) WS-IV Sur(M) (M)B8321000 TURNBULL CRK AT SR 1509 NR JOHNSONTOWN 34.70839 -78.60078 BLADEN FRO 18-46 C Sur(M) (M) G(M) G(M) G(Q3) G(Q3)B8340000 CAPE FEAR RIV AT LOCK 2 NR ELIZABETHTOWN 34.62636 -78.57678 BLADEN FRO 18-(26.75) C Sur(M) (M)B8350000 CAPE FEAR RIV AT LOCK 1 NR KELLY 34.40376 -78.29316 BLADEN WIRO 18-(59) WS-IV Sw Pr2(M) (M) (M) Pr2(M) G(M) Ph(M) G(M) G(Q1) G(Q1)B8441000 LIVINGSTON CRK AT WRIGHT CORPORATION WALKWAY
34.33527 -78.20111 COLUMBUS WIRO 18-64 C Sw Sur(M) (M) Sur(M) G(M) G(M) G(M) G(Q2) G(Q2)
B8450000 CAPE FEAR RIV AT NEILS EDDY LANDING NR ACME 34.35547 -78.17942 COLUMBUS WIRO 18-(63) C Sw Pr2(M) (M) (M) Pr2(M) G(M) G(M) G(Q1) G(Q1)B8490000 LITTLE COHARIE CRK AT SR 1414 MINNIE HALL RD NR 35.05553 -78.53095 SAMPSON FRO 18-68-1-17 C Sw Sur(M) (M) G(M) G(M) G(M) G(Q3) G(Q3)B8545000 LITTLE COHARIE CRK AT SR 1240 NR ROSEBORO 34.92735 -78.46568 SAMPSON FRO 18-68-1-17 C Sw Sur(M) (M) G(M) G(M) G(Q3) G(Q3)B8580000 GREAT COHARIE CRK AT SR 1311 NR CLINTON 35.02483 -78.3717 SAMPSON FRO 18-68-1 C Sw Sur(M) (M) G(M) G(M) G(M) G(Q3) G(Q3)B8725000 SIX RUNS CRK AT SR 1960 NR TAYLORS BRIDGE 34.852 -78.2448 SAMPSON FRO 18-68-2-(11.5) C Sw ORW + Sur(M) (M) G(M) G(M) G(M) G(Q3) G(Q3)B8750000 BLACK RIV AT NC 411 NR TOMAHAWK 34.7544 -78.2891 SAMPSON FRO 18-68 C Sw ORW + Sur(M) (M) G(M) G(M) G(M) G(Q3) G(Q3)B8919000 SOUTH RIV AT SR 1503 NR PARKERSBURG 34.81218 -78.45684 BLADEN FRO 18-68-12-(8.5) C Sw ORW + Sur(M) (M) G(M) G(M) G(M) G(Q3) G(Q3)B9013000 BLACK RIV AT RACCOON ISLAND NR HUGGINS 34.37201 -78.07212 PENDER WIRO 18-68 C Sw ORW + Pr2(M) (M) (M) Pr2(M) G(M) Ph(M) G(M) G(Q1) G(Q1)B9020000 CAPE FEAR RIV DNS HALE PT LANDING NR PHOENIX 34.31808 -78.02639 BRUNSWICK WIRO 18-(63) C Sw Pr2(M) (M) (M) Pr2(M) G(M) Ph(M) G(M) G(Q1) G(Q1)B9050000 CAPE FEAR RIV AT NAVASSA 34.26118 -77.98907 BRUNSWICK WIRO 18-(71) SC Pr2(M) (M) (M) Pr2(M) G(M) G(M) G(Q1)B9080000 NORTHEAST CAPE FEAR RIV AT SR 1937 NR MT OLIVE 35.1914 -78.01759 WAYNE WIRO 18-74-(1) C Sw Sur(M) (M) Sur(M) G(M)B9090000 NORTHEAST CAPE FEAR RIV AT NC 403 NR WILLIAMS 35.17839 -77.98072 DUPLIN WIRO 18-74-(1) C Sw Sur(M) (M) Sur(M) G(M) G(M) G(M) G(Q1) G(Q1)B9190500 GOSHEN SWAMP AT SR 1004 NR WESTBROOK CROSSROAD 35.0535 -77.9474 DUPLIN WIRO 18-74-19 C Sw Sur(M) (M) Sur(M) G(M) G(M) G(M) G(Q1) G(Q1)B9196000 NORTHEAST CAPE FEAR RIV AT SR 1961 AT HALLSVILLE 34.90589 -77.84088 DUPLIN WIRO 18-74-(1) C Sw Sur(M) (M) Sur(M) G(M) G(M) G(M) G(Q1) G(Q1)B9470000 ROCKFISH CRK AT I 40 AT WALLACE 34.71913 -77.94622 DUPLIN WIRO 18-74-29 C Sw Sur(M) (M) Sur(M) G(M) G(M) G(M) G(Q1) G(Q1)B9480000 NORTHEAST CAPE FEAR RIV AT SR 1318 NR WATHA 34.64594 -77.87246 PENDER WIRO 18-74-(29.5) C Sw Sur(M) (M) Sur(M) G(M) G(M) G(M) G(Q1) G(Q1)
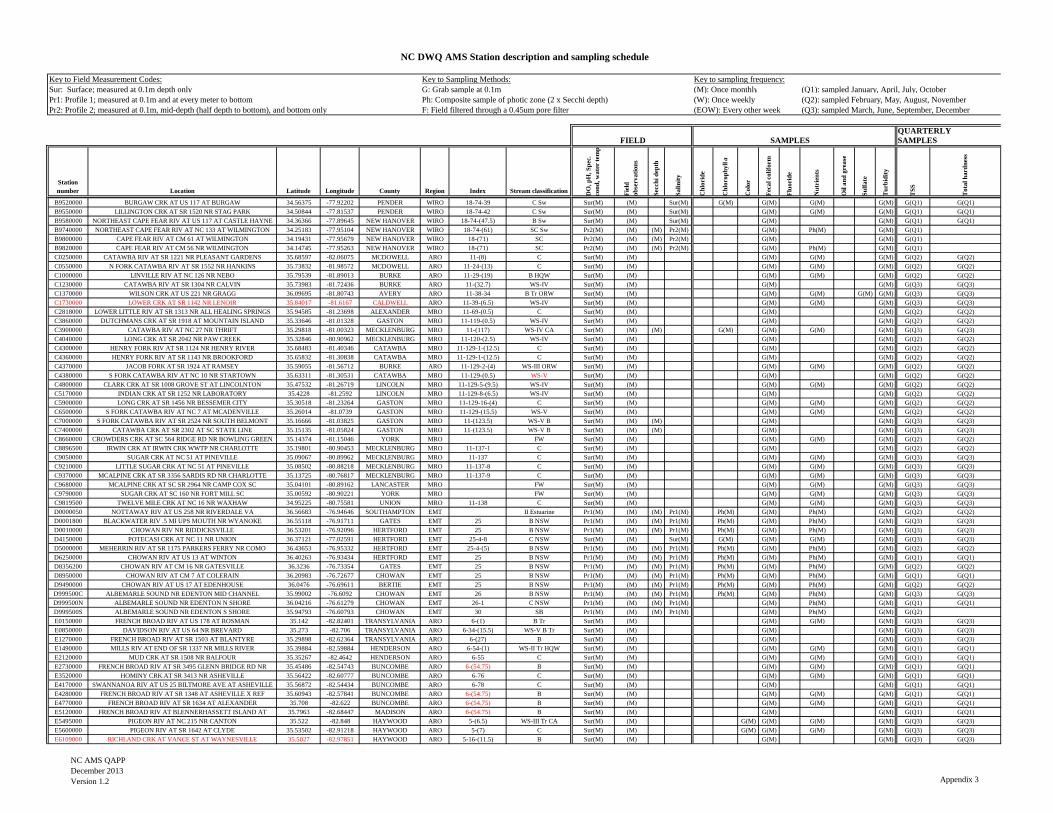
NC DWQ AMS Station description and sampling schedule
NC AMS QAPPDecember 2013Version 1.2 Appendix 3
Key to Field Measurement Codes: Key to Sampling Methods: Key to sampling frequency:Sur: Surface; measured at 0.1m depth only G: Grab sample at 0.1m (M): Once monthly (Q1): sampled January, April, July, OctoberPr1: Profile 1; measured at 0.1m and at every meter to bottom Ph: Composite sample of photic zone (2 x Secchi depth) (W): Once weekly (Q2): sampled February, May, August, NovemberPr2: Profile 2; measured at 0.1m, mid-depth (half depth to bottom), and bottom only F: Field filtered through a 0.45um pore filter (EOW): Every other week (Q3): sampled March, June, September, December
QUARTERLY FIELD SAMPLES SAMPLES
Station number Location Latitude Longitude County Region Index Stream classification D
O, p
H, S
pec.
co
nd, w
ater
tem
p
Fiel
d ob
serv
atio
ns
Secc
hi d
epth
Salin
ity
Chl
orid
e
Chl
orop
hyll
a
Col
or
Feca
l col
iform
Fluo
ride
Nut
rien
ts
Oil
and
grea
se
Sulfa
te
Turb
idity
TSS
Tota
l har
dnes
s
B9520000 BURGAW CRK AT US 117 AT BURGAW 34.56375 -77.92202 PENDER WIRO 18-74-39 C Sw Sur(M) (M) Sur(M) G(M) G(M) G(M) G(M) G(Q1) G(Q1)B9550000 LILLINGTON CRK AT SR 1520 NR STAG PARK 34.50844 -77.81537 PENDER WIRO 18-74-42 C Sw Sur(M) (M) Sur(M) G(M) G(M) G(M) G(Q1) G(Q1)B9580000 NORTHEAST CAPE FEAR RIV AT US 117 AT CASTLE HAYNE 34.36366 -77.89645 NEW HANOVER WIRO 18-74-(47.5) B Sw Sur(M) (M) Sur(M) G(M) G(M) G(Q1) G(Q1)B9740000 NORTHEAST CAPE FEAR RIV AT NC 133 AT WILMINGTON 34.25183 -77.95104 NEW HANOVER WIRO 18-74-(61) SC Sw Pr2(M) (M) (M) Pr2(M) G(M) Ph(M) G(M) G(Q1)B9800000 CAPE FEAR RIV AT CM 61 AT WILMINGTON 34.19431 -77.95679 NEW HANOVER WIRO 18-(71) SC Pr2(M) (M) (M) Pr2(M) G(M) G(M) G(Q1)B9820000 CAPE FEAR RIV AT CM 56 NR WILMINGTON 34.14745 -77.95263 NEW HANOVER WIRO 18-(71) SC Pr2(M) (M) (M) Pr2(M) G(M) Ph(M) G(M) G(Q1)C0250000 CATAWBA RIV AT SR 1221 NR PLEASANT GARDENS 35.68597 -82.06075 MCDOWELL ARO 11-(8) C Sur(M) (M) G(M) G(M) G(M) G(Q2) G(Q2)C0550000 N FORK CATAWBA RIV AT SR 1552 NR HANKINS 35.73832 -81.98572 MCDOWELL ARO 11-24-(13) C Sur(M) (M) G(M) G(M) G(M) G(Q2) G(Q2)C1000000 LINVILLE RIV AT NC 126 NR NEBO 35.79539 -81.89013 BURKE ARO 11-29-(19) B HQW Sur(M) (M) G(M) G(M) G(M) G(Q2) G(Q2)C1230000 CATAWBA RIV AT SR 1304 NR CALVIN 35.73983 -81.72436 BURKE ARO 11-(32.7) WS-IV Sur(M) (M) G(M) G(M) G(Q3) G(Q3)C1370000 WILSON CRK AT US 221 NR GRAGG 36.09695 -81.80743 AVERY ARO 11-38-34 B Tr ORW Sur(M) (M) G(M) G(M) G(M) G(M) G(Q3) G(Q3)C1730000 LOWER CRK AT SR 1142 NR LENOIR 35.84017 -81.6167 CALDWELL ARO 11-39-(6.5) WS-IV Sur(M) (M) G(M) G(M) G(M) G(Q3) G(Q3)C2818000 LOWER LITTLE RIV AT SR 1313 NR ALL HEALING SPRINGS 35.94585 -81.23698 ALEXANDER MRO 11-69-(0.5) C Sur(M) (M) G(M) G(M) G(Q2) G(Q2)C3860000 DUTCHMANS CRK AT SR 1918 AT MOUNTAIN ISLAND 35.33646 -81.01328 GASTON MRO 11-119-(0.5) WS-IV Sur(M) (M) G(M) G(M) G(Q2) G(Q2)C3900000 CATAWBA RIV AT NC 27 NR THRIFT 35.29818 -81.00323 MECKLENBURG MRO 11-(117) WS-IV CA Sur(M) (M) (M) G(M) G(M) G(M) G(M) G(Q3) G(Q3)C4040000 LONG CRK AT SR 2042 NR PAW CREEK 35.32846 -80.90962 MECKLENBURG MRO 11-120-(2.5) WS-IV Sur(M) (M) G(M) G(M) G(Q2) G(Q2)C4300000 HENRY FORK RIV AT SR 1124 NR HENRY RIVER 35.68483 -81.40346 CATAWBA MRO 11-129-1-(12.5) C Sur(M) (M) G(M) G(M) G(Q2) G(Q2)C4360000 HENRY FORK RIV AT SR 1143 NR BROOKFORD 35.65832 -81.30838 CATAWBA MRO 11-129-1-(12.5) C Sur(M) (M) G(M) G(M) G(Q2) G(Q2)C4370000 JACOB FORK AT SR 1924 AT RAMSEY 35.59055 -81.56712 BURKE ARO 11-129-2-(4) WS-III ORW Sur(M) (M) G(M) G(M) G(M) G(Q2) G(Q2)C4380000 S FORK CATAWBA RIV AT NC 10 NR STARTOWN 35.63311 -81.30531 CATAWBA MRO 11-129-(0.5) WS-V Sur(M) (M) G(M) G(M) G(Q2) G(Q2)C4800000 CLARK CRK AT SR 1008 GROVE ST AT LINCOLNTON 35.47532 -81.26719 LINCOLN MRO 11-129-5-(9.5) WS-IV Sur(M) (M) G(M) G(M) G(M) G(Q2) G(Q2)C5170000 INDIAN CRK AT SR 1252 NR LABORATORY 35.4228 -81.2592 LINCOLN MRO 11-129-8-(6.5) WS-IV Sur(M) (M) G(M) G(M) G(Q2) G(Q2)C5900000 LONG CRK AT SR 1456 NR BESSEMER CITY 35.30518 -81.23264 GASTON MRO 11-129-16-(4) C Sur(M) (M) G(M) G(M) G(M) G(Q2) G(Q2)C6500000 S FORK CATAWBA RIV AT NC 7 AT MCADENVILLE 35.26014 -81.0739 GASTON MRO 11-129-(15.5) WS-V Sur(M) (M) G(M) G(M) G(M) G(Q2) G(Q2)C7000000 S FORK CATAWBA RIV AT SR 2524 NR SOUTH BELMONT 35.16666 -81.03825 GASTON MRO 11-(123.5) WS-V B Sur(M) (M) (M) G(M) G(M) G(Q3) G(Q3)C7400000 CATAWBA CRK AT SR 2302 AT SC STATE LINE 35.15135 -81.05824 GASTON MRO 11-(123.5) WS-V B Sur(M) (M) (M) G(M) G(M) G(Q3) G(Q3)C8660000 CROWDERS CRK AT SC 564 RIDGE RD NR BOWLING GREEN 35.14374 -81.15046 YORK MRO FW Sur(M) (M) G(M) G(M) G(M) G(Q2) G(Q2)C8896500 IRWIN CRK AT IRWIN CRK WWTP NR CHARLOTTE 35.19801 -80.90453 MECKLENBURG MRO 11-137-1 C Sur(M) (M) G(M) G(M) G(Q2) G(Q2)C9050000 SUGAR CRK AT NC 51 AT PINEVILLE 35.09067 -80.89962 MECKLENBURG MRO 11-137 C Sur(M) (M) G(M) G(M) G(M) G(Q3) G(Q3)C9210000 LITTLE SUGAR CRK AT NC 51 AT PINEVILLE 35.08502 -80.88218 MECKLENBURG MRO 11-137-8 C Sur(M) (M) G(M) G(M) G(M) G(Q3) G(Q3)C9370000 MCALPINE CRK AT SR 3356 SARDIS RD NR CHARLOTTE 35.13725 -80.76817 MECKLENBURG MRO 11-137-9 C Sur(M) (M) G(M) G(M) G(M) G(Q3) G(Q3)C9680000 MCALPINE CRK AT SC SR 2964 NR CAMP COX SC 35.04101 -80.89162 LANCASTER MRO FW Sur(M) (M) G(M) G(M) G(M) G(Q3) G(Q3)C9790000 SUGAR CRK AT SC 160 NR FORT MILL SC 35.00592 -80.90221 YORK MRO FW Sur(M) (M) G(M) G(M) G(M) G(Q3) G(Q3)C9819500 TWELVE MILE CRK AT NC 16 NR WAXHAW 34.95225 -80.75581 UNION MRO 11-138 C Sur(M) (M) G(M) G(M) G(M) G(Q3) G(Q3)D0000050 NOTTAWAY RIV AT US 258 NR RIVERDALE VA 36.56683 -76.94646 SOUTHAMPTON EMT II Estuarine Pr1(M) (M) (M) Pr1(M) Ph(M) G(M) Ph(M) G(M) G(Q2) G(Q2)D0001800 BLACKWATER RIV .5 MI UPS MOUTH NR WYANOKE 36.55118 -76.91711 GATES EMT 25 B NSW Pr1(M) (M) (M) Pr1(M) Ph(M) G(M) Ph(M) G(M) G(Q3) G(Q3)D0010000 CHOWAN RIV NR RIDDICKSVILLE 36.53201 -76.92096 HERTFORD EMT 25 B NSW Pr1(M) (M) (M) Pr1(M) Ph(M) G(M) Ph(M) G(M) G(Q3) G(Q3)D4150000 POTECASI CRK AT NC 11 NR UNION 36.37121 -77.02591 HERTFORD EMT 25-4-8 C NSW Sur(M) (M) Sur(M) G(M) G(M) G(M) G(M) G(Q3) G(Q3)D5000000 MEHERRIN RIV AT SR 1175 PARKERS FERRY NR COMO 36.43653 -76.95332 HERTFORD EMT 25-4-(5) B NSW Pr1(M) (M) (M) Pr1(M) Ph(M) G(M) Ph(M) G(M) G(Q2) G(Q2)D6250000 CHOWAN RIV AT US 13 AT WINTON 36.40263 -76.93434 HERTFORD EMT 25 B NSW Pr1(M) (M) (M) Pr1(M) Ph(M) G(M) Ph(M) G(M) G(Q1) G(Q1)D8356200 CHOWAN RIV AT CM 16 NR GATESVILLE 36.3236 -76.73354 GATES EMT 25 B NSW Pr1(M) (M) (M) Pr1(M) Ph(M) G(M) Ph(M) G(M) G(Q2) G(Q2)D8950000 CHOWAN RIV AT CM 7 AT COLERAIN 36.20983 -76.72677 CHOWAN EMT 25 B NSW Pr1(M) (M) (M) Pr1(M) Ph(M) G(M) Ph(M) G(M) G(Q1) G(Q1)D9490000 CHOWAN RIV AT US 17 AT EDENHOUSE 36.0476 -76.69611 BERTIE EMT 25 B NSW Pr1(M) (M) (M) Pr1(M) Ph(M) G(M) Ph(M) G(M) G(Q2) G(Q2)D999500C ALBEMARLE SOUND NR EDENTON MID CHANNEL 35.99002 -76.6092 CHOWAN EMT 26 B NSW Pr1(M) (M) (M) Pr1(M) Ph(M) G(M) Ph(M) G(M) G(Q3) G(Q3)D999500N ALBEMARLE SOUND NR EDENTON N SHORE 36.04216 -76.61279 CHOWAN EMT 26-1 C NSW Pr1(M) (M) (M) Pr1(M) G(M) Ph(M) G(M) G(Q1) G(Q1)D999500S ALBEMARLE SOUND NR EDENTON S SHORE 35.94793 -76.60793 CHOWAN EMT 30 SB Pr1(M) (M) (M) Pr1(M) G(M) Ph(M) G(M) G(Q2)E0150000 FRENCH BROAD RIV AT US 178 AT ROSMAN 35.142 -82.82401 TRANSYLVANIA ARO 6-(1) B Tr Sur(M) (M) G(M) G(M) G(M) G(Q3) G(Q3)E0850000 DAVIDSON RIV AT US 64 NR BREVARD 35.273 -82.706 TRANSYLVANIA ARO 6-34-(15.5) WS-V B Tr Sur(M) (M) G(M) G(M) G(Q3) G(Q3)E1270000 FRENCH BROAD RIV AT SR 1503 AT BLANTYRE 35.29898 -82.62364 TRANSYLVANIA ARO 6-(27) B Sur(M) (M) G(M) G(M) G(Q3) G(Q3)E1490000 MILLS RIV AT END OF SR 1337 NR MILLS RIVER 35.39884 -82.59884 HENDERSON ARO 6-54-(1) WS-II Tr HQW Sur(M) (M) G(M) G(M) G(M) G(Q1) G(Q1)E2120000 MUD CRK AT SR 1508 NR BALFOUR 35.35267 -82.4642 HENDERSON ARO 6-55 C Sur(M) (M) G(M) G(M) G(M) G(Q1) G(Q1)E2730000 FRENCH BROAD RIV AT SR 3495 GLENN BRIDGE RD NR 35.45486 -82.54743 BUNCOMBE ARO 6-(54.75) B Sur(M) (M) G(M) G(M) G(M) G(Q1) G(Q1)E3520000 HOMINY CRK AT SR 3413 NR ASHEVILLE 35.56422 -82.60777 BUNCOMBE ARO 6-76 C Sur(M) (M) G(M) G(M) G(M) G(Q1) G(Q1)E4170000 SWANNANOA RIV AT US 25 BILTMORE AVE AT ASHEVILLE 35.56872 -82.54434 BUNCOMBE ARO 6-78 C Sur(M) (M) G(M) G(M) G(Q1) G(Q1)E4280000 FRENCH BROAD RIV AT SR 1348 AT ASHEVILLE X REF 35.60943 -82.57841 BUNCOMBE ARO 6-(54.75) B Sur(M) (M) G(M) G(M) G(M) G(Q1) G(Q1)E4770000 FRENCH BROAD RIV AT SR 1634 AT ALEXANDER 35.708 -82.622 BUNCOMBE ARO 6-(54.75) B Sur(M) (M) G(M) G(M) G(M) G(Q1) G(Q1)E5120000 FRENCH BROAD RIV AT BLENNERHASSETT ISLAND AT 35.7963 -82.68447 MADISON ARO 6-(54.75) B Sur(M) (M) G(M) G(M) G(Q1) G(Q1)E5495000 PIGEON RIV AT NC 215 NR CANTON 35.522 -82.848 HAYWOOD ARO 5-(6.5) WS-III Tr CA Sur(M) (M) G(M) G(M) G(M) G(M) G(Q3) G(Q3)E5600000 PIGEON RIV AT SR 1642 AT CLYDE 35.53502 -82.91218 HAYWOOD ARO 5-(7) C Sur(M) (M) G(M) G(M) G(M) G(M) G(Q3) G(Q3)E6109000 RICHLAND CRK AT VANCE ST AT WAYNESVILLE 35.5027 -82.97851 HAYWOOD ARO 5-16-(11.5) B Sur(M) (M) G(M) G(M) G(Q3) G(Q3)
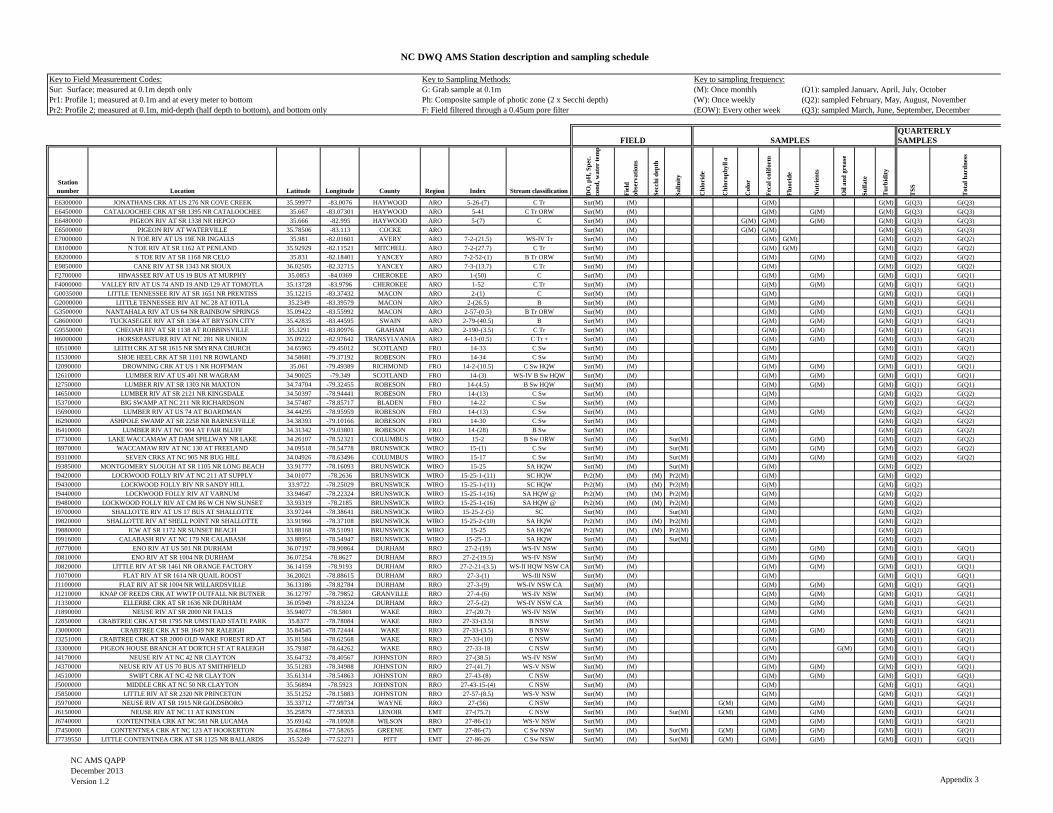
NC DWQ AMS Station description and sampling schedule
NC AMS QAPPDecember 2013Version 1.2 Appendix 3
Key to Field Measurement Codes: Key to Sampling Methods: Key to sampling frequency:Sur: Surface; measured at 0.1m depth only G: Grab sample at 0.1m (M): Once monthly (Q1): sampled January, April, July, OctoberPr1: Profile 1; measured at 0.1m and at every meter to bottom Ph: Composite sample of photic zone (2 x Secchi depth) (W): Once weekly (Q2): sampled February, May, August, NovemberPr2: Profile 2; measured at 0.1m, mid-depth (half depth to bottom), and bottom only F: Field filtered through a 0.45um pore filter (EOW): Every other week (Q3): sampled March, June, September, December
QUARTERLY FIELD SAMPLES SAMPLES
Station number Location Latitude Longitude County Region Index Stream classification D
O, p
H, S
pec.
co
nd, w
ater
tem
p
Fiel
d ob
serv
atio
ns
Secc
hi d
epth
Salin
ity
Chl
orid
e
Chl
orop
hyll
a
Col
or
Feca
l col
iform
Fluo
ride
Nut
rien
ts
Oil
and
grea
se
Sulfa
te
Turb
idity
TSS
Tota
l har
dnes
s
E6300000 JONATHANS CRK AT US 276 NR COVE CREEK 35.59977 -83.0076 HAYWOOD ARO 5-26-(7) C Tr Sur(M) (M) G(M) G(M) G(Q3) G(Q3)E6450000 CATALOOCHEE CRK AT SR 1395 NR CATALOOCHEE 35.667 -83.07301 HAYWOOD ARO 5-41 C Tr ORW Sur(M) (M) G(M) G(M) G(M) G(Q3) G(Q3)E6480000 PIGEON RIV AT SR 1338 NR HEPCO 35.666 -82.995 HAYWOOD ARO 5-(7) C Sur(M) (M) G(M) G(M) G(M) G(M) G(Q3) G(Q3)E6500000 PIGEON RIV AT WATERVILLE 35.78506 -83.113 COCKE ARO Sur(M) (M) G(M) G(M) G(M) G(Q3) G(Q3)E7000000 N TOE RIV AT US 19E NR INGALLS 35.981 -82.01601 AVERY ARO 7-2-(21.5) WS-IV Tr Sur(M) (M) G(M) G(M) G(M) G(Q2) G(Q2)E8100000 N TOE RIV AT SR 1162 AT PENLAND 35.92929 -82.11521 MITCHELL ARO 7-2-(27.7) C Tr Sur(M) (M) G(M) G(M) G(M) G(Q2) G(Q2)E8200000 S TOE RIV AT SR 1168 NR CELO 35.831 -82.18401 YANCEY ARO 7-2-52-(1) B Tr ORW Sur(M) (M) G(M) G(M) G(M) G(Q2) G(Q2)E9850000 CANE RIV AT SR 1343 NR SIOUX 36.02505 -82.32715 YANCEY ARO 7-3-(13.7) C Tr Sur(M) (M) G(M) G(M) G(Q2) G(Q2)F2700000 HIWASSEE RIV AT US 19 BUS AT MURPHY 35.0853 -84.0369 CHEROKEE ARO 1-(50) C Sur(M) (M) G(M) G(M) G(M) G(Q1) G(Q1)F4000000 VALLEY RIV AT US 74 AND 19 AND 129 AT TOMOTLA 35.13728 -83.9796 CHEROKEE ARO 1-52 C Tr Sur(M) (M) G(M) G(M) G(M) G(Q1) G(Q1)G0035000 LITTLE TENNESSEE RIV AT SR 1651 NR PRENTISS 35.12215 -83.37432 MACON ARO 2-(1) C Sur(M) (M) G(M) G(M) G(Q1) G(Q1)G2000000 LITTLE TENNESSEE RIV AT NC 28 AT IOTLA 35.2349 -83.39579 MACON ARO 2-(26.5) B Sur(M) (M) G(M) G(M) G(M) G(Q1) G(Q1)G3500000 NANTAHALA RIV AT US 64 NR RAINBOW SPRINGS 35.09422 -83.55992 MACON ARO 2-57-(0.5) B Tr ORW Sur(M) (M) G(M) G(M) G(M) G(Q1) G(Q1)G8600000 TUCKASEGEE RIV AT SR 1364 AT BRYSON CITY 35.42835 -83.44595 SWAIN ARO 2-79-(40.5) B Sur(M) (M) G(M) G(M) G(M) G(Q1) G(Q1)G9550000 CHEOAH RIV AT SR 1138 AT ROBBINSVILLE 35.3291 -83.80976 GRAHAM ARO 2-190-(3.5) C Tr Sur(M) (M) G(M) G(M) G(M) G(Q1) G(Q1)H6000000 HORSEPASTURE RIV AT NC 281 NR UNION 35.09222 -82.97642 TRANSYLVANIA ARO 4-13-(0.5) C Tr + Sur(M) (M) G(M) G(M) G(M) G(Q3) G(Q3)I0510000 LEITH CRK AT SR 1615 NR SMYRNA CHURCH 34.65965 -79.45012 SCOTLAND FRO 14-33 C Sw Sur(M) (M) G(M) G(M) G(Q1) G(Q1)I1530000 SHOE HEEL CRK AT SR 1101 NR ROWLAND 34.58681 -79.37192 ROBESON FRO 14-34 C Sw Sur(M) (M) G(M) G(M) G(Q2) G(Q2)I2090000 DROWNING CRK AT US 1 NR HOFFMAN 35.061 -79.49389 RICHMOND FRO 14-2-(10.5) C Sw HQW Sur(M) (M) G(M) G(M) G(M) G(Q1) G(Q1)I2610000 LUMBER RIV AT US 401 NR WAGRAM 34.90025 -79.349 SCOTLAND FRO 14-(3) WS-IV B Sw HQW Sur(M) (M) G(M) G(M) G(M) G(Q1) G(Q1)I2750000 LUMBER RIV AT SR 1303 NR MAXTON 34.74704 -79.32455 ROBESON FRO 14-(4.5) B Sw HQW Sur(M) (M) G(M) G(M) G(M) G(Q1) G(Q1)I4650000 LUMBER RIV AT SR 2121 NR KINGSDALE 34.50397 -78.94441 ROBESON FRO 14-(13) C Sw Sur(M) (M) G(M) G(M) G(Q2) G(Q2)I5370000 BIG SWAMP AT NC 211 NR RICHARDSON 34.57487 -78.85717 BLADEN FRO 14-22 C Sw Sur(M) (M) G(M) G(M) G(Q2) G(Q2)I5690000 LUMBER RIV AT US 74 AT BOARDMAN 34.44295 -78.95959 ROBESON FRO 14-(13) C Sw Sur(M) (M) G(M) G(M) G(M) G(Q2) G(Q2)I6290000 ASHPOLE SWAMP AT SR 2258 NR BARNESVILLE 34.38393 -79.10166 ROBESON FRO 14-30 C Sw Sur(M) (M) G(M) G(M) G(Q2) G(Q2)I6410000 LUMBER RIV AT NC 904 AT FAIR BLUFF 34.31342 -79.03801 ROBESON FRO 14-(28) B Sw Sur(M) (M) G(M) G(M) G(Q2) G(Q2)I7730000 LAKE WACCAMAW AT DAM SPILLWAY NR LAKE 34.26107 -78.52321 COLUMBUS WIRO 15-2 B Sw ORW Sur(M) (M) Sur(M) G(M) G(M) G(M) G(Q2) G(Q2)I8970000 WACCAMAW RIV AT NC 130 AT FREELAND 34.09518 -78.54778 BRUNSWICK WIRO 15-(1) C Sw Sur(M) (M) Sur(M) G(M) G(M) G(M) G(Q2) G(Q2)I9310000 SEVEN CRKS AT NC 905 NR BUG HILL 34.04926 -78.63496 COLUMBUS WIRO 15-17 C Sw Sur(M) (M) Sur(M) G(M) G(M) G(M) G(Q2) G(Q2)I9385000 MONTGOMERY SLOUGH AT SR 1105 NR LONG BEACH 33.91777 -78.16093 BRUNSWICK WIRO 15-25 SA HQW Sur(M) (M) Sur(M) G(M) G(M) G(Q2)I9420000 LOCKWOOD FOLLY RIV AT NC 211 AT SUPPLY 34.01077 -78.2636 BRUNSWICK WIRO 15-25-1-(11) SC HQW Pr2(M) (M) (M) Pr2(M) G(M) G(M) G(Q2)I9430000 LOCKWOOD FOLLY RIV NR SANDY HILL 33.9722 -78.25029 BRUNSWICK WIRO 15-25-1-(11) SC HQW Pr2(M) (M) (M) Pr2(M) G(M) G(M) G(Q2)I9440000 LOCKWOOD FOLLY RIV AT VARNUM 33.94647 -78.22324 BRUNSWICK WIRO 15-25-1-(16) SA HQW @ Pr2(M) (M) (M) Pr2(M) G(M) G(M) G(Q2)I9480000 LOCKWOOD FOLLY RIV AT CM R6 W CH NW SUNSET 33.93319 -78.2185 BRUNSWICK WIRO 15-25-1-(16) SA HQW @ Pr2(M) (M) (M) Pr2(M) G(M) G(M) G(Q2)I9700000 SHALLOTTE RIV AT US 17 BUS AT SHALLOTTE 33.97244 -78.38641 BRUNSWICK WIRO 15-25-2-(5) SC Sur(M) (M) Sur(M) G(M) G(M) G(Q2)I9820000 SHALLOTTE RIV AT SHELL POINT NR SHALLOTTE 33.91966 -78.37108 BRUNSWICK WIRO 15-25-2-(10) SA HQW Pr2(M) (M) (M) Pr2(M) G(M) G(M) G(Q2)I9880000 ICW AT SR 1172 NR SUNSET BEACH 33.88168 -78.51091 BRUNSWICK WIRO 15-25 SA HQW Pr2(M) (M) (M) Pr2(M) G(M) G(M) G(Q2)I9916000 CALABASH RIV AT NC 179 NR CALABASH 33.88951 -78.54947 BRUNSWICK WIRO 15-25-13 SA HQW Sur(M) (M) Sur(M) G(M) G(M) G(Q2)J0770000 ENO RIV AT US 501 NR DURHAM 36.07197 -78.90864 DURHAM RRO 27-2-(19) WS-IV NSW Sur(M) (M) G(M) G(M) G(M) G(Q1) G(Q1)J0810000 ENO RIV AT SR 1004 NR DURHAM 36.07254 -78.8627 DURHAM RRO 27-2-(19.5) WS-IV NSW Sur(M) (M) G(M) G(M) G(M) G(Q1) G(Q1)J0820000 LITTLE RIV AT SR 1461 NR ORANGE FACTORY 36.14159 -78.9193 DURHAM RRO 27-2-21-(3.5) WS-II HQW NSW CA Sur(M) (M) G(M) G(M) G(M) G(Q1) G(Q1)J1070000 FLAT RIV AT SR 1614 NR QUAIL ROOST 36.20021 -78.88615 DURHAM RRO 27-3-(1) WS-III NSW Sur(M) (M) G(M) G(M) G(Q1) G(Q1)J1100000 FLAT RIV AT SR 1004 NR WILLARDSVILLE 36.13186 -78.82784 DURHAM RRO 27-3-(9) WS-IV NSW CA Sur(M) (M) G(M) G(M) G(M) G(Q1) G(Q1)J1210000 KNAP OF REEDS CRK AT WWTP OUTFALL NR BUTNER 36.12797 -78.79852 GRANVILLE RRO 27-4-(6) WS-IV NSW Sur(M) (M) G(M) G(M) G(M) G(Q1) G(Q1)J1330000 ELLERBE CRK AT SR 1636 NR DURHAM 36.05949 -78.83224 DURHAM RRO 27-5-(2) WS-IV NSW CA Sur(M) (M) G(M) G(M) G(M) G(Q1) G(Q1)J1890000 NEUSE RIV AT SR 2000 NR FALLS 35.94077 -78.5801 WAKE RRO 27-(20.7) WS-IV NSW Sur(M) (M) G(M) G(M) G(M) G(Q1) G(Q1)J2850000 CRABTREE CRK AT SR 1795 NR UMSTEAD STATE PARK 35.8377 -78.78084 WAKE RRO 27-33-(3.5) B NSW Sur(M) (M) G(M) G(M) G(Q1) G(Q1)J3000000 CRABTREE CRK AT SR 1649 NR RALEIGH 35.84545 -78.72444 WAKE RRO 27-33-(3.5) B NSW Sur(M) (M) G(M) G(M) G(M) G(Q1) G(Q1)J3251000 CRABTREE CRK AT SR 2000 OLD WAKE FOREST RD AT 35.81584 -78.62568 WAKE RRO 27-33-(10) C NSW Sur(M) (M) G(M) G(M) G(Q1) G(Q1)J3300000 PIGEON HOUSE BRANCH AT DORTCH ST AT RALEIGH 35.79387 -78.64262 WAKE RRO 27-33-18 C NSW Sur(M) (M) G(M) G(M) G(M) G(Q1) G(Q1)J4170000 NEUSE RIV AT NC 42 NR CLAYTON 35.64732 -78.40567 JOHNSTON RRO 27-(38.5) WS-IV NSW Sur(M) (M) G(M) G(M) G(Q1) G(Q1)J4370000 NEUSE RIV AT US 70 BUS AT SMITHFIELD 35.51283 -78.34988 JOHNSTON RRO 27-(41.7) WS-V NSW Sur(M) (M) G(M) G(M) G(M) G(Q1) G(Q1)J4510000 SWIFT CRK AT NC 42 NR CLAYTON 35.61314 -78.54863 JOHNSTON RRO 27-43-(8) C NSW Sur(M) (M) G(M) G(M) G(M) G(Q1) G(Q1)J5000000 MIDDLE CRK AT NC 50 NR CLAYTON 35.56894 -78.5923 JOHNSTON RRO 27-43-15-(4) C NSW Sur(M) (M) G(M) G(M) G(Q1) G(Q1)J5850000 LITTLE RIV AT SR 2320 NR PRINCETON 35.51252 -78.15883 JOHNSTON RRO 27-57-(8.5) WS-V NSW Sur(M) (M) G(M) G(M) G(Q1) G(Q1)J5970000 NEUSE RIV AT SR 1915 NR GOLDSBORO 35.33712 -77.99734 WAYNE RRO 27-(56) C NSW Sur(M) (M) G(M) G(M) G(M) G(M) G(Q1) G(Q1)J6150000 NEUSE RIV AT NC 11 AT KINSTON 35.25879 -77.58353 LENOIR EMT 27-(75.7) C NSW Sur(M) (M) Sur(M) G(M) G(M) G(M) G(M) G(Q1) G(Q1)J6740000 CONTENTNEA CRK AT NC 581 NR LUCAMA 35.69142 -78.10928 WILSON RRO 27-86-(1) WS-V NSW Sur(M) (M) G(M) G(M) G(M) G(Q1) G(Q1)J7450000 CONTENTNEA CRK AT NC 123 AT HOOKERTON 35.42864 -77.58265 GREENE EMT 27-86-(7) C Sw NSW Sur(M) (M) Sur(M) G(M) G(M) G(M) G(M) G(Q1) G(Q1)J7739550 LITTLE CONTENTNEA CRK AT SR 1125 NR BALLARDS 35.5249 -77.52271 PITT EMT 27-86-26 C Sw NSW Sur(M) (M) Sur(M) G(M) G(M) G(M) G(M) G(Q1) G(Q1)
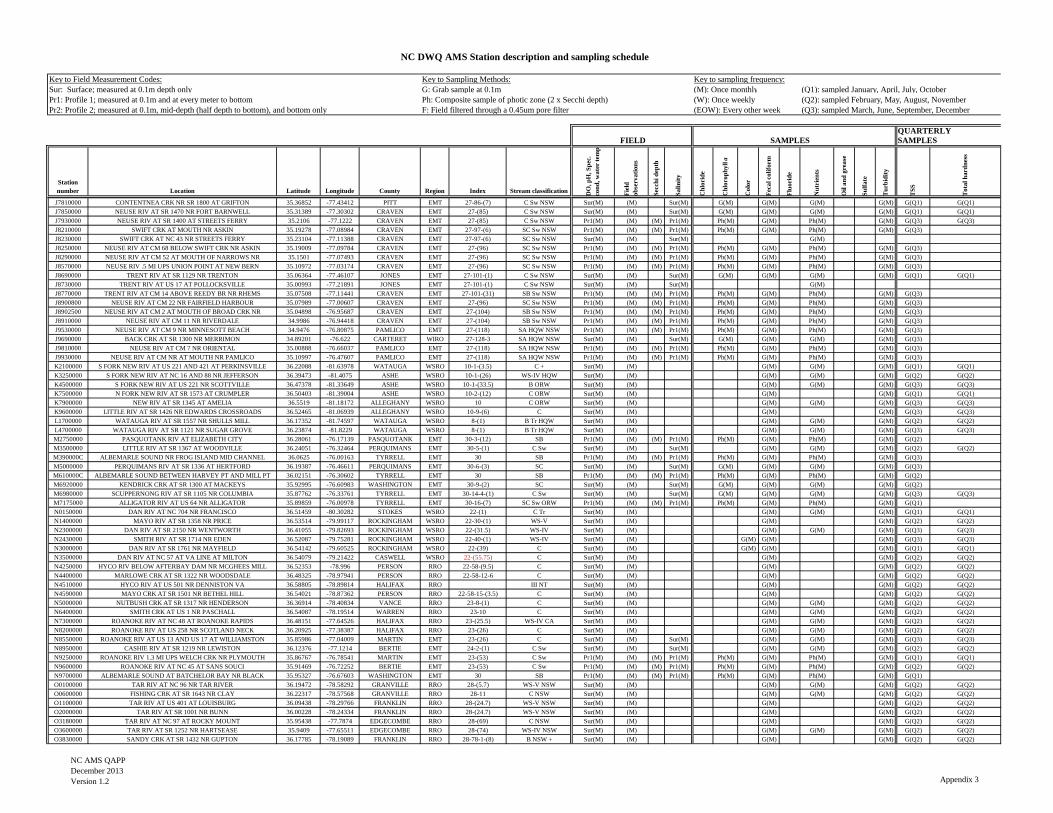
NC DWQ AMS Station description and sampling schedule
NC AMS QAPPDecember 2013Version 1.2 Appendix 3
Key to Field Measurement Codes: Key to Sampling Methods: Key to sampling frequency:Sur: Surface; measured at 0.1m depth only G: Grab sample at 0.1m (M): Once monthly (Q1): sampled January, April, July, OctoberPr1: Profile 1; measured at 0.1m and at every meter to bottom Ph: Composite sample of photic zone (2 x Secchi depth) (W): Once weekly (Q2): sampled February, May, August, NovemberPr2: Profile 2; measured at 0.1m, mid-depth (half depth to bottom), and bottom only F: Field filtered through a 0.45um pore filter (EOW): Every other week (Q3): sampled March, June, September, December
QUARTERLY FIELD SAMPLES SAMPLES
Station number Location Latitude Longitude County Region Index Stream classification D
O, p
H, S
pec.
co
nd, w
ater
tem
p
Fiel
d ob
serv
atio
ns
Secc
hi d
epth
Salin
ity
Chl
orid
e
Chl
orop
hyll
a
Col
or
Feca
l col
iform
Fluo
ride
Nut
rien
ts
Oil
and
grea
se
Sulfa
te
Turb
idity
TSS
Tota
l har
dnes
s
J7810000 CONTENTNEA CRK NR SR 1800 AT GRIFTON 35.36852 -77.43412 PITT EMT 27-86-(7) C Sw NSW Sur(M) (M) Sur(M) G(M) G(M) G(M) G(M) G(Q1) G(Q1)J7850000 NEUSE RIV AT SR 1470 NR FORT BARNWELL 35.31389 -77.30302 CRAVEN EMT 27-(85) C Sw NSW Sur(M) (M) Sur(M) G(M) G(M) G(M) G(M) G(Q1) G(Q1)J7930000 NEUSE RIV AT SR 1400 AT STREETS FERRY 35.2106 -77.1222 CRAVEN EMT 27-(85) C Sw NSW Pr1(M) (M) (M) Pr1(M) Ph(M) G(M) Ph(M) G(M) G(Q3) G(Q3)J8210000 SWIFT CRK AT MOUTH NR ASKIN 35.19278 -77.08984 CRAVEN EMT 27-97-(6) SC Sw NSW Pr1(M) (M) (M) Pr1(M) Ph(M) G(M) Ph(M) G(M) G(Q3)J8230000 SWIFT CRK AT NC 43 NR STREETS FERRY 35.23104 -77.11388 CRAVEN EMT 27-97-(6) SC Sw NSW Sur(M) (M) Sur(M) G(M)J8250000 NEUSE RIV AT CM 68 BELOW SWIFT CRK NR ASKIN 35.19009 -77.09784 CRAVEN EMT 27-(96) SC Sw NSW Pr1(M) (M) (M) Pr1(M) Ph(M) G(M) Ph(M) G(M) G(Q3)J8290000 NEUSE RIV AT CM 52 AT MOUTH OF NARROWS NR
35.1501 -77.07493 CRAVEN EMT 27-(96) SC Sw NSW Pr1(M) (M) (M) Pr1(M) Ph(M) G(M) Ph(M) G(M) G(Q3)
J8570000 NEUSE RIV .5 MI UPS UNION POINT AT NEW BERN 35.10972 -77.03174 CRAVEN EMT 27-(96) SC Sw NSW Pr1(M) (M) (M) Pr1(M) Ph(M) G(M) Ph(M) G(M) G(Q3)J8690000 TRENT RIV AT SR 1129 NR TRENTON 35.06364 -77.46107 JONES EMT 27-101-(1) C Sw NSW Sur(M) (M) Sur(M) G(M) G(M) G(M) G(M) G(Q1) G(Q1)J8730000 TRENT RIV AT US 17 AT POLLOCKSVILLE 35.00993 -77.21891 JONES EMT 27-101-(1) C Sw NSW Sur(M) (M) Sur(M) G(M)J8770000 TRENT RIV AT CM 14 ABOVE REEDY BR NR RHEMS 35.07508 -77.11441 CRAVEN EMT 27-101-(31) SB Sw NSW Pr1(M) (M) (M) Pr1(M) Ph(M) G(M) Ph(M) G(M) G(Q3)J8900800 NEUSE RIV AT CM 22 NR FAIRFIELD HARBOUR 35.07989 -77.00607 CRAVEN EMT 27-(96) SC Sw NSW Pr1(M) (M) (M) Pr1(M) Ph(M) G(M) Ph(M) G(M) G(Q3)J8902500 NEUSE RIV AT CM 2 AT MOUTH OF BROAD CRK NR 35.04898 -76.95687 CRAVEN EMT 27-(104) SB Sw NSW Pr1(M) (M) (M) Pr1(M) Ph(M) G(M) Ph(M) G(M) G(Q3)J8910000 NEUSE RIV AT CM 11 NR RIVERDALE 34.9986 -76.94418 CRAVEN EMT 27-(104) SB Sw NSW Pr1(M) (M) (M) Pr1(M) Ph(M) G(M) Ph(M) G(M) G(Q3)J9530000 NEUSE RIV AT CM 9 NR MINNESOTT BEACH 34.9476 -76.80875 PAMLICO EMT 27-(118) SA HQW NSW Pr1(M) (M) (M) Pr1(M) Ph(M) G(M) Ph(M) G(M) G(Q3)J9690000 BACK CRK AT SR 1300 NR MERRIMON 34.89201 -76.622 CARTERET WIRO 27-128-3 SA HQW NSW Sur(M) (M) Sur(M) G(M) G(M) G(M) G(M) G(Q3)J9810000 NEUSE RIV AT CM 7 NR ORIENTAL 35.00888 -76.66037 PAMLICO EMT 27-(118) SA HQW NSW Pr1(M) (M) (M) Pr1(M) Ph(M) G(M) Ph(M) G(M) G(Q3)J9930000 NEUSE RIV AT CM NR AT MOUTH NR PAMLICO 35.10997 -76.47607 PAMLICO EMT 27-(118) SA HQW NSW Pr1(M) (M) (M) Pr1(M) Ph(M) G(M) Ph(M) G(M) G(Q3)K2100000 S FORK NEW RIV AT US 221 AND 421 AT PERKINSVILLE 36.22088 -81.63978 WATAUGA WSRO 10-1-(3.5) C + Sur(M) (M) G(M) G(M) G(M) G(Q1) G(Q1)K3250000 S FORK NEW RIV AT NC 16 AND 88 NR JEFFERSON 36.39473 -81.4075 ASHE WSRO 10-1-(26) WS-IV HQW Sur(M) (M) G(M) G(M) G(M) G(Q2) G(Q2)K4500000 S FORK NEW RIV AT US 221 NR SCOTTVILLE 36.47378 -81.33649 ASHE WSRO 10-1-(33.5) B ORW Sur(M) (M) G(M) G(M) G(M) G(Q3) G(Q3)K7500000 N FORK NEW RIV AT SR 1573 AT CRUMPLER 36.50403 -81.39004 ASHE WSRO 10-2-(12) C ORW Sur(M) (M) G(M) G(M) G(Q1) G(Q1)K7900000 NEW RIV AT SR 1345 AT AMELIA 36.5519 -81.18172 ALLEGHANY WSRO 10 C ORW Sur(M) (M) G(M) G(M) G(M) G(Q3) G(Q3)K9600000 LITTLE RIV AT SR 1426 NR EDWARDS CROSSROADS 36.52465 -81.06939 ALLEGHANY WSRO 10-9-(6) C Sur(M) (M) G(M) G(M) G(Q3) G(Q3)L1700000 WATAUGA RIV AT SR 1557 NR SHULLS MILL 36.17352 -81.74597 WATAUGA WSRO 8-(1) B Tr HQW Sur(M) (M) G(M) G(M) G(M) G(Q2) G(Q2)L4700000 WATAUGA RIV AT SR 1121 NR SUGAR GROVE 36.23874 -81.8229 WATAUGA WSRO 8-(1) B Tr HQW Sur(M) (M) G(M) G(M) G(M) G(Q3) G(Q3)M2750000 PASQUOTANK RIV AT ELIZABETH CITY 36.28061 -76.17139 PASQUOTANK EMT 30-3-(12) SB Pr1(M) (M) (M) Pr1(M) Ph(M) G(M) Ph(M) G(M) G(Q2)M3500000 LITTLE RIV AT SR 1367 AT WOODVILLE 36.24051 -76.32464 PERQUIMANS EMT 30-5-(1) C Sw Sur(M) (M) Sur(M) G(M) G(M) G(M) G(Q2) G(Q2)M390000C ALBEMARLE SOUND NR FROG ISLAND MID CHANNEL 36.0625 -76.00163 TYRRELL EMT 30 SB Pr1(M) (M) (M) Pr1(M) Ph(M) G(M) Ph(M) G(M) G(Q3)M5000000 PERQUIMANS RIV AT SR 1336 AT HERTFORD 36.19387 -76.46611 PERQUIMANS EMT 30-6-(3) SC Sur(M) (M) Sur(M) G(M) G(M) G(M) G(M) G(Q3)M610000C ALBEMARLE SOUND BETWEEN HARVEY PT AND MILL PT
36.02151 -76.30602 TYRRELL EMT 30 SB Pr1(M) (M) (M) Pr1(M) Ph(M) G(M) Ph(M) G(M) G(Q2)
M6920000 KENDRICK CRK AT SR 1300 AT MACKEYS 35.92995 -76.60983 WASHINGTON EMT 30-9-(2) SC Sur(M) (M) Sur(M) G(M) G(M) G(M) G(M) G(Q2)M6980000 SCUPPERNONG RIV AT SR 1105 NR COLUMBIA 35.87762 -76.33761 TYRRELL EMT 30-14-4-(1) C Sw Sur(M) (M) Sur(M) G(M) G(M) G(M) G(M) G(Q3) G(Q3)M7175000 ALLIGATOR RIV AT US 64 NR ALLIGATOR 35.89859 -76.00978 TYRRELL EMT 30-16-(7) SC Sw ORW Pr1(M) (M) (M) Pr1(M) Ph(M) G(M) Ph(M) G(M) G(Q1)N0150000 DAN RIV AT NC 704 NR FRANCISCO 36.51459 -80.30282 STOKES WSRO 22-(1) C Tr Sur(M) (M) G(M) G(M) G(M) G(Q1) G(Q1)N1400000 MAYO RIV AT SR 1358 NR PRICE 36.53514 -79.99117 ROCKINGHAM WSRO 22-30-(1) WS-V Sur(M) (M) G(M) G(M) G(Q2) G(Q2)N2300000 DAN RIV AT SR 2150 NR WENTWORTH 36.41055 -79.82693 ROCKINGHAM WSRO 22-(31.5) WS-IV Sur(M) (M) G(M) G(M) G(M) G(Q3) G(Q3)N2430000 SMITH RIV AT SR 1714 NR EDEN 36.52087 -79.75281 ROCKINGHAM WSRO 22-40-(1) WS-IV Sur(M) (M) G(M) G(M) G(M) G(Q3) G(Q3)N3000000 DAN RIV AT SR 1761 NR MAYFIELD 36.54142 -79.60525 ROCKINGHAM WSRO 22-(39) C Sur(M) (M) G(M) G(M) G(M) G(Q1) G(Q1)N3500000 DAN RIV AT NC 57 AT VA LINE AT MILTON 36.54079 -79.21422 CASWELL WSRO 22-(55.75) C Sur(M) (M) G(M) G(M) G(Q2) G(Q2)N4250000 HYCO RIV BELOW AFTERBAY DAM NR MCGHEES MILL 36.52353 -78.996 PERSON RRO 22-58-(9.5) C Sur(M) (M) G(M) G(M) G(Q2) G(Q2)N4400000 MARLOWE CRK AT SR 1322 NR WOODSDALE 36.48325 -78.97941 PERSON RRO 22-58-12-6 C Sur(M) (M) G(M) G(M) G(Q2) G(Q2)N4510000 HYCO RIV AT US 501 NR DENNISTON VA 36.58805 -78.89814 HALIFAX RRO III NT Sur(M) (M) G(M) G(M) G(Q2) G(Q2)N4590000 MAYO CRK AT SR 1501 NR BETHEL HILL 36.54021 -78.87362 PERSON RRO 22-58-15-(3.5) C Sur(M) (M) G(M) G(M) G(Q2) G(Q2)N5000000 NUTBUSH CRK AT SR 1317 NR HENDERSON 36.36914 -78.40834 VANCE RRO 23-8-(1) C Sur(M) (M) G(M) G(M) G(M) G(Q2) G(Q2)N6400000 SMITH CRK AT US 1 NR PASCHALL 36.54087 -78.19514 WARREN RRO 23-10 C Sur(M) (M) G(M) G(M) G(M) G(Q2) G(Q2)N7300000 ROANOKE RIV AT NC 48 AT ROANOKE RAPIDS 36.48151 -77.64526 HALIFAX RRO 23-(25.5) WS-IV CA Sur(M) (M) G(M) G(M) G(M) G(Q2) G(Q2)N8200000 ROANOKE RIV AT US 258 NR SCOTLAND NECK 36.20925 -77.38387 HALIFAX RRO 23-(26) C Sur(M) (M) G(M) G(M) G(M) G(Q2) G(Q2)N8550000 ROANOKE RIV AT US 13 AND US 17 AT WILLIAMSTON 35.85986 -77.04009 MARTIN EMT 23-(26) C Sur(M) (M) Sur(M) G(M) G(M) G(M) G(Q3) G(Q3)N8950000 CASHIE RIV AT SR 1219 NR LEWISTON 36.12376 -77.1214 BERTIE EMT 24-2-(1) C Sw Sur(M) (M) Sur(M) G(M) G(M) G(M) G(Q2) G(Q2)N9250000 ROANOKE RIV 1.3 MI UPS WELCH CRK NR PLYMOUTH 35.86767 -76.78541 MARTIN EMT 23-(53) C Sw Pr1(M) (M) (M) Pr1(M) Ph(M) G(M) Ph(M) G(M) G(Q1) G(Q1)N9600000 ROANOKE RIV AT NC 45 AT SANS SOUCI 35.91469 -76.72252 BERTIE EMT 23-(53) C Sw Pr1(M) (M) (M) Pr1(M) Ph(M) G(M) Ph(M) G(M) G(Q2) G(Q2)N9700000 ALBEMARLE SOUND AT BATCHELOR BAY NR BLACK 35.95327 -76.67603 WASHINGTON EMT 30 SB Pr1(M) (M) (M) Pr1(M) Ph(M) G(M) Ph(M) G(M) G(Q1)O0100000 TAR RIV AT NC 96 NR TAR RIVER 36.19472 -78.58292 GRANVILLE RRO 28-(5.7) WS-V NSW Sur(M) (M) G(M) G(M) G(M) G(Q2) G(Q2)O0600000 FISHING CRK AT SR 1643 NR CLAY 36.22317 -78.57568 GRANVILLE RRO 28-11 C NSW Sur(M) (M) G(M) G(M) G(M) G(Q2) G(Q2)O1100000 TAR RIV AT US 401 AT LOUISBURG 36.09438 -78.29766 FRANKLIN RRO 28-(24.7) WS-V NSW Sur(M) (M) G(M) G(M) G(Q2) G(Q2)O2000000 TAR RIV AT SR 1001 NR BUNN 36.00228 -78.24334 FRANKLIN RRO 28-(24.7) WS-V NSW Sur(M) (M) G(M) G(M) G(Q2) G(Q2)O3180000 TAR RIV AT NC 97 AT ROCKY MOUNT 35.95438 -77.7874 EDGECOMBE RRO 28-(69) C NSW Sur(M) (M) G(M) G(M) G(Q2) G(Q2)O3600000 TAR RIV AT SR 1252 NR HARTSEASE 35.9409 -77.65511 EDGECOMBE RRO 28-(74) WS-IV NSW Sur(M) (M) G(M) G(M) G(M) G(Q2) G(Q2)O3830000 SANDY CRK AT SR 1432 NR GUPTON 36.17785 -78.19089 FRANKLIN RRO 28-78-1-(8) B NSW + Sur(M) (M) G(M) G(M) G(Q2) G(Q2)
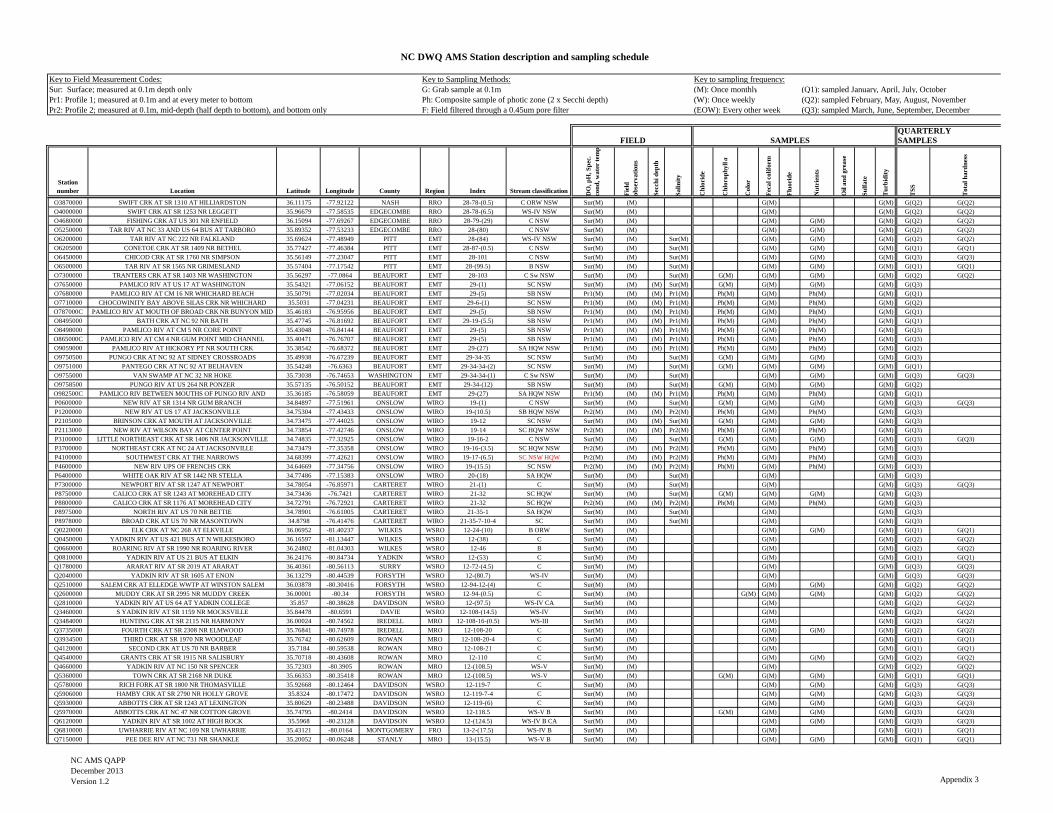
NC DWQ AMS Station description and sampling schedule
NC AMS QAPPDecember 2013Version 1.2 Appendix 3
Key to Field Measurement Codes: Key to Sampling Methods: Key to sampling frequency:Sur: Surface; measured at 0.1m depth only G: Grab sample at 0.1m (M): Once monthly (Q1): sampled January, April, July, OctoberPr1: Profile 1; measured at 0.1m and at every meter to bottom Ph: Composite sample of photic zone (2 x Secchi depth) (W): Once weekly (Q2): sampled February, May, August, NovemberPr2: Profile 2; measured at 0.1m, mid-depth (half depth to bottom), and bottom only F: Field filtered through a 0.45um pore filter (EOW): Every other week (Q3): sampled March, June, September, December
QUARTERLY FIELD SAMPLES SAMPLES
Station number Location Latitude Longitude County Region Index Stream classification D
O, p
H, S
pec.
co
nd, w
ater
tem
p
Fiel
d ob
serv
atio
ns
Secc
hi d
epth
Salin
ity
Chl
orid
e
Chl
orop
hyll
a
Col
or
Feca
l col
iform
Fluo
ride
Nut
rien
ts
Oil
and
grea
se
Sulfa
te
Turb
idity
TSS
Tota
l har
dnes
s
O3870000 SWIFT CRK AT SR 1310 AT HILLIARDSTON 36.11175 -77.92122 NASH RRO 28-78-(0.5) C ORW NSW Sur(M) (M) G(M) G(M) G(Q2) G(Q2)O4000000 SWIFT CRK AT SR 1253 NR LEGGETT 35.96679 -77.58535 EDGECOMBE RRO 28-78-(6.5) WS-IV NSW Sur(M) (M) G(M) G(M) G(Q2) G(Q2)O4680000 FISHING CRK AT US 301 NR ENFIELD 36.15094 -77.69267 EDGECOMBE RRO 28-79-(29) C NSW Sur(M) (M) G(M) G(M) G(M) G(Q2) G(Q2)O5250000 TAR RIV AT NC 33 AND US 64 BUS AT TARBORO 35.89352 -77.53233 EDGECOMBE RRO 28-(80) C NSW Sur(M) (M) G(M) G(M) G(M) G(Q2) G(Q2)O6200000 TAR RIV AT NC 222 NR FALKLAND 35.69624 -77.48949 PITT EMT 28-(84) WS-IV NSW Sur(M) (M) Sur(M) G(M) G(M) G(M) G(Q2) G(Q2)O6205000 CONETOE CRK AT SR 1409 NR BETHEL 35.77427 -77.46384 PITT EMT 28-87-(0.5) C NSW Sur(M) (M) Sur(M) G(M) G(M) G(M) G(Q1) G(Q1)O6450000 CHICOD CRK AT SR 1760 NR SIMPSON 35.56149 -77.23047 PITT EMT 28-101 C NSW Sur(M) (M) Sur(M) G(M) G(M) G(M) G(Q3) G(Q3)O6500000 TAR RIV AT SR 1565 NR GRIMESLAND 35.57404 -77.17542 PITT EMT 28-(99.5) B NSW Sur(M) (M) Sur(M) G(M) G(M) G(M) G(Q1) G(Q1)O7300000 TRANTERS CRK AT SR 1403 NR WASHINGTON 35.56297 -77.0864 BEAUFORT EMT 28-103 C Sw NSW Sur(M) (M) Sur(M) G(M) G(M) G(M) G(M) G(Q2) G(Q2)O7650000 PAMLICO RIV AT US 17 AT WASHINGTON 35.54321 -77.06152 BEAUFORT EMT 29-(1) SC NSW Sur(M) (M) (M) Sur(M) G(M) G(M) G(M) G(M) G(Q3)O7680000 PAMLICO RIV AT CM 16 NR WHICHARD BEACH 35.50791 -77.02034 BEAUFORT EMT 29-(5) SB NSW Pr1(M) (M) (M) Pr1(M) Ph(M) G(M) Ph(M) G(M) G(Q1)O7710000 CHOCOWINITY BAY ABOVE SILAS CRK NR WHICHARD 35.5031 -77.04231 BEAUFORT EMT 29-6-(1) SC NSW Pr1(M) (M) (M) Pr1(M) Ph(M) G(M) Ph(M) G(M) G(Q2)O787000C PAMLICO RIV AT MOUTH OF BROAD CRK NR BUNYON MID 35.46183 -76.95956 BEAUFORT EMT 29-(5) SB NSW Pr1(M) (M) (M) Pr1(M) Ph(M) G(M) Ph(M) G(M) G(Q1)O8495000 BATH CRK AT NC 92 NR BATH 35.47745 -76.81692 BEAUFORT EMT 29-19-(5.5) SB NSW Pr1(M) (M) (M) Pr1(M) Ph(M) G(M) Ph(M) G(M) G(Q1)O8498000 PAMLICO RIV AT CM 5 NR CORE POINT 35.43048 -76.84144 BEAUFORT EMT 29-(5) SB NSW Pr1(M) (M) (M) Pr1(M) Ph(M) G(M) Ph(M) G(M) G(Q3)O865000C PAMLICO RIV AT CM 4 NR GUM POINT MID CHANNEL 35.40471 -76.76707 BEAUFORT EMT 29-(5) SB NSW Pr1(M) (M) (M) Pr1(M) Ph(M) G(M) Ph(M) G(M) G(Q3)O9059000 PAMLICO RIV AT HICKORY PT NR SOUTH CRK 35.38542 -76.68372 BEAUFORT EMT 29-(27) SA HQW NSW Pr1(M) (M) (M) Pr1(M) Ph(M) G(M) Ph(M) G(M) G(Q2)O9750500 PUNGO CRK AT NC 92 AT SIDNEY CROSSROADS 35.49938 -76.67239 BEAUFORT EMT 29-34-35 SC NSW Sur(M) (M) Sur(M) G(M) G(M) G(M) G(M) G(Q3)O9751000 PANTEGO CRK AT NC 92 AT BELHAVEN 35.54248 -76.6363 BEAUFORT EMT 29-34-34-(2) SC NSW Sur(M) (M) Sur(M) G(M) G(M) G(M) G(M) G(Q1)O9755000 VAN SWAMP AT NC 32 NR HOKE 35.73038 -76.74653 WASHINGTON EMT 29-34-34-(1) C Sw NSW Sur(M) (M) Sur(M) G(M) G(M) G(M) G(Q3) G(Q3)O9758500 PUNGO RIV AT US 264 NR PONZER 35.57135 -76.50152 BEAUFORT EMT 29-34-(12) SB NSW Sur(M) (M) Sur(M) G(M) G(M) G(M) G(M) G(Q2)O982500C PAMLICO RIV BETWEEN MOUTHS OF PUNGO RIV AND
35.36185 -76.58059 BEAUFORT EMT 29-(27) SA HQW NSW Pr1(M) (M) (M) Pr1(M) Ph(M) G(M) Ph(M) G(M) G(Q1)
P0600000 NEW RIV AT SR 1314 NR GUM BRANCH 34.84897 -77.51961 ONSLOW WIRO 19-(1) C NSW Sur(M) (M) Sur(M) G(M) G(M) G(M) G(M) G(Q3) G(Q3)P1200000 NEW RIV AT US 17 AT JACKSONVILLE 34.75304 -77.43433 ONSLOW WIRO 19-(10.5) SB HQW NSW Pr2(M) (M) (M) Pr2(M) Ph(M) G(M) Ph(M) G(M) G(Q3)P2105000 BRINSON CRK AT MOUTH AT JACKSONVILLE 34.73475 -77.44025 ONSLOW WIRO 19-12 SC NSW Sur(M) (M) (M) Sur(M) G(M) G(M) G(M) G(M) G(Q3)P2113000 NEW RIV AT WILSON BAY AT CENTER POINT 34.73854 -77.42746 ONSLOW WIRO 19-14 SC HQW NSW Pr2(M) (M) (M) Pr2(M) Ph(M) G(M) Ph(M) G(M) G(Q3)P3100000 LITTLE NORTHEAST CRK AT SR 1406 NR JACKSONVILLE 34.74835 -77.32925 ONSLOW WIRO 19-16-2 C NSW Sur(M) (M) Sur(M) G(M) G(M) G(M) G(M) G(Q3) G(Q3)P3700000 NORTHEAST CRK AT NC 24 AT JACKSONVILLE 34.73479 -77.35358 ONSLOW WIRO 19-16-(3.5) SC HQW NSW Pr2(M) (M) (M) Pr2(M) Ph(M) G(M) Ph(M) G(M) G(Q3)P4100000 SOUTHWEST CRK AT THE NARROWS 34.68399 -77.42621 ONSLOW WIRO 19-17-(6.5) SC NSW HQW Pr2(M) (M) (M) Pr2(M) Ph(M) G(M) Ph(M) G(M) G(Q3)P4600000 NEW RIV UPS OF FRENCHS CRK 34.64669 -77.34756 ONSLOW WIRO 19-(15.5) SC NSW Pr2(M) (M) (M) Pr2(M) Ph(M) G(M) Ph(M) G(M) G(Q3)P6400000 WHITE OAK RIV AT SR 1442 NR STELLA 34.77486 -77.15383 ONSLOW WIRO 20-(18) SA HQW Sur(M) (M) Sur(M) G(M) G(M) G(Q3)P7300000 NEWPORT RIV AT SR 1247 AT NEWPORT 34.78054 -76.85971 CARTERET WIRO 21-(1) C Sur(M) (M) Sur(M) G(M) G(M) G(Q3) G(Q3)P8750000 CALICO CRK AT SR 1243 AT MOREHEAD CITY 34.73436 -76.7421 CARTERET WIRO 21-32 SC HQW Sur(M) (M) Sur(M) G(M) G(M) G(M) G(M) G(Q3)P8800000 CALICO CRK AT SR 1176 AT MOREHEAD CITY 34.72791 -76.72921 CARTERET WIRO 21-32 SC HQW Pr2(M) (M) (M) Pr2(M) Ph(M) G(M) Ph(M) G(M) G(Q3)P8975000 NORTH RIV AT US 70 NR BETTIE 34.78901 -76.61005 CARTERET WIRO 21-35-1 SA HQW Sur(M) (M) Sur(M) G(M) G(M) G(Q3)P8978000 BROAD CRK AT US 70 NR MASONTOWN 34.8798 -76.41476 CARTERET WIRO 21-35-7-10-4 SC Sur(M) (M) Sur(M) G(M) G(M) G(Q3)Q0220000 ELK CRK AT NC 268 AT ELKVILLE 36.06952 -81.40237 WILKES WSRO 12-24-(10) B ORW Sur(M) (M) G(M) G(M) G(M) G(Q1) G(Q1)Q0450000 YADKIN RIV AT US 421 BUS AT N WILKESBORO 36.16597 -81.13447 WILKES WSRO 12-(38) C Sur(M) (M) G(M) G(M) G(Q2) G(Q2)Q0660000 ROARING RIV AT SR 1990 NR ROARING RIVER 36.24802 -81.04303 WILKES WSRO 12-46 B Sur(M) (M) G(M) G(M) G(Q2) G(Q2)Q0810000 YADKIN RIV AT US 21 BUS AT ELKIN 36.24176 -80.84734 YADKIN WSRO 12-(53) C Sur(M) (M) G(M) G(M) G(Q1) G(Q1)Q1780000 ARARAT RIV AT SR 2019 AT ARARAT 36.40361 -80.56113 SURRY WSRO 12-72-(4.5) C Sur(M) (M) G(M) G(M) G(Q3) G(Q3)Q2040000 YADKIN RIV AT SR 1605 AT ENON 36.13279 -80.44539 FORSYTH WSRO 12-(80.7) WS-IV Sur(M) (M) G(M) G(M) G(Q3) G(Q3)Q2510000 SALEM CRK AT ELLEDGE WWTP AT WINSTON SALEM 36.03878 -80.30416 FORSYTH WSRO 12-94-12-(4) C Sur(M) (M) G(M) G(M) G(M) G(Q2) G(Q2)Q2600000 MUDDY CRK AT SR 2995 NR MUDDY CREEK 36.00001 -80.34 FORSYTH WSRO 12-94-(0.5) C Sur(M) (M) G(M) G(M) G(M) G(M) G(Q2) G(Q2)Q2810000 YADKIN RIV AT US 64 AT YADKIN COLLEGE 35.857 -80.38628 DAVIDSON WSRO 12-(97.5) WS-IV CA Sur(M) (M) G(M) G(M) G(Q2) G(Q2)Q3460000 S YADKIN RIV AT SR 1159 NR MOCKSVILLE 35.84478 -80.6591 DAVIE WSRO 12-108-(14.5) WS-IV Sur(M) (M) G(M) G(M) G(Q2) G(Q2)Q3484000 HUNTING CRK AT SR 2115 NR HARMONY 36.00024 -80.74562 IREDELL MRO 12-108-16-(0.5) WS-III Sur(M) (M) G(M) G(M) G(Q2) G(Q2)Q3735000 FOURTH CRK AT SR 2308 NR ELMWOOD 35.76841 -80.74978 IREDELL MRO 12-108-20 C Sur(M) (M) G(M) G(M) G(M) G(Q2) G(Q2)Q3934500 THIRD CRK AT SR 1970 NR WOODLEAF 35.76742 -80.62609 ROWAN MRO 12-108-20-4 C Sur(M) (M) G(M) G(M) G(Q1) G(Q1)Q4120000 SECOND CRK AT US 70 NR BARBER 35.7184 -80.59538 ROWAN MRO 12-108-21 C Sur(M) (M) G(M) G(M) G(Q1) G(Q1)Q4540000 GRANTS CRK AT SR 1915 NR SALISBURY 35.70718 -80.43608 ROWAN MRO 12-110 C Sur(M) (M) G(M) G(M) G(M) G(Q2) G(Q2)Q4660000 YADKIN RIV AT NC 150 NR SPENCER 35.72303 -80.3905 ROWAN MRO 12-(108.5) WS-V Sur(M) (M) G(M) G(M) G(Q2) G(Q2)Q5360000 TOWN CRK AT SR 2168 NR DUKE 35.66353 -80.35418 ROWAN MRO 12-(108.5) WS-V Sur(M) (M) G(M) G(M) G(M) G(M) G(Q1) G(Q1)Q5780000 RICH FORK AT SR 1800 NR THOMASVILLE 35.92668 -80.12464 DAVIDSON WSRO 12-119-7 C Sur(M) (M) G(M) G(M) G(M) G(Q3) G(Q3)Q5906000 HAMBY CRK AT SR 2790 NR HOLLY GROVE 35.8324 -80.17472 DAVIDSON WSRO 12-119-7-4 C Sur(M) (M) G(M) G(M) G(M) G(Q3) G(Q3)Q5930000 ABBOTTS CRK AT SR 1243 AT LEXINGTON 35.80629 -80.23488 DAVIDSON WSRO 12-119-(6) C Sur(M) (M) G(M) G(M) G(M) G(Q3) G(Q3)Q5970000 ABBOTTS CRK AT NC 47 NR COTTON GROVE 35.74795 -80.2414 DAVIDSON WSRO 12-118.5 WS-V B Sur(M) (M) G(M) G(M) G(M) G(M) G(Q3) G(Q3)Q6120000 YADKIN RIV AT SR 1002 AT HIGH ROCK 35.5968 -80.23128 DAVIDSON WSRO 12-(124.5) WS-IV B CA Sur(M) (M) G(M) G(M) G(M) G(Q3) G(Q3)Q6810000 UWHARRIE RIV AT NC 109 NR UWHARRIE 35.43121 -80.0164 MONTGOMERY FRO 13-2-(17.5) WS-IV B Sur(M) (M) G(M) G(M) G(Q1) G(Q1)Q7150000 PEE DEE RIV AT NC 731 NR SHANKLE 35.20052 -80.06248 STANLY MRO 13-(15.5) WS-V B Sur(M) (M) G(M) G(M) G(M) G(Q1) G(Q1)
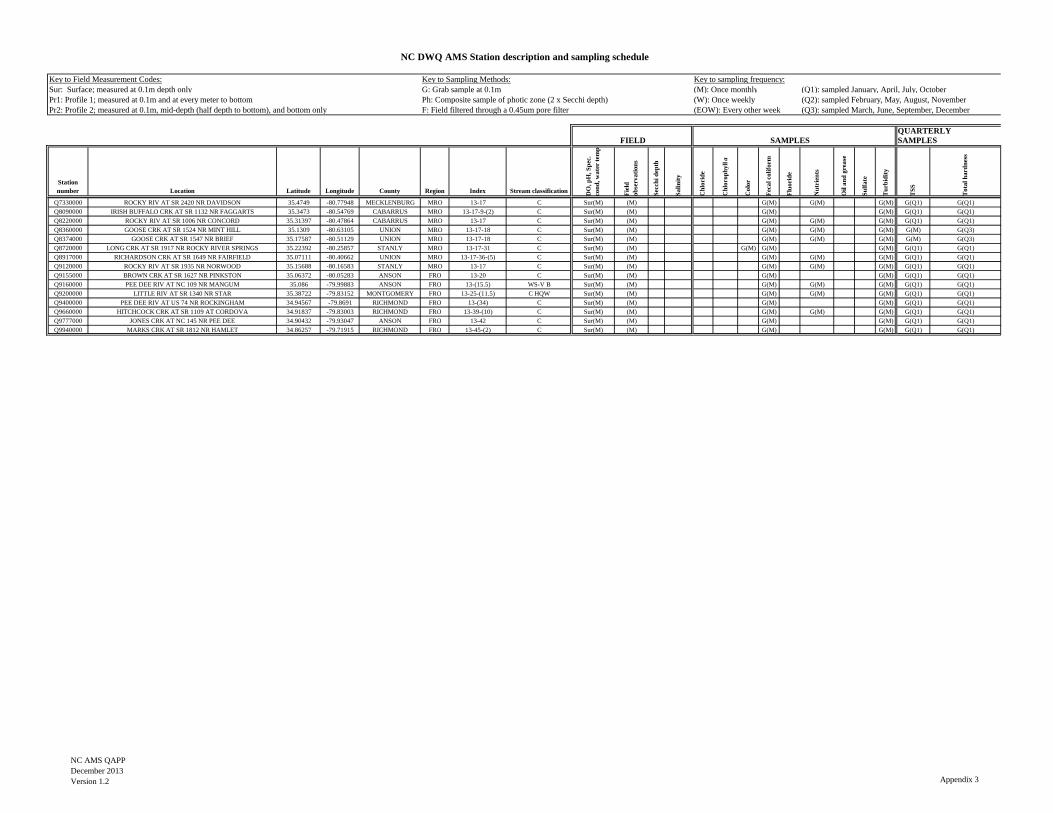
NC DWQ AMS Station description and sampling schedule
NC AMS QAPPDecember 2013Version 1.2 Appendix 3
Key to Field Measurement Codes: Key to Sampling Methods: Key to sampling frequency:Sur: Surface; measured at 0.1m depth only G: Grab sample at 0.1m (M): Once monthly (Q1): sampled January, April, July, OctoberPr1: Profile 1; measured at 0.1m and at every meter to bottom Ph: Composite sample of photic zone (2 x Secchi depth) (W): Once weekly (Q2): sampled February, May, August, NovemberPr2: Profile 2; measured at 0.1m, mid-depth (half depth to bottom), and bottom only F: Field filtered through a 0.45um pore filter (EOW): Every other week (Q3): sampled March, June, September, December
QUARTERLY FIELD SAMPLES SAMPLES
Station number Location Latitude Longitude County Region Index Stream classification D
O, p
H, S
pec.
co
nd, w
ater
tem
p
Fiel
d ob
serv
atio
ns
Secc
hi d
epth
Salin
ity
Chl
orid
e
Chl
orop
hyll
a
Col
or
Feca
l col
iform
Fluo
ride
Nut
rien
ts
Oil
and
grea
se
Sulfa
te
Turb
idity
TSS
Tota
l har
dnes
s
Q7330000 ROCKY RIV AT SR 2420 NR DAVIDSON 35.4749 -80.77948 MECKLENBURG MRO 13-17 C Sur(M) (M) G(M) G(M) G(M) G(Q1) G(Q1)Q8090000 IRISH BUFFALO CRK AT SR 1132 NR FAGGARTS 35.3473 -80.54769 CABARRUS MRO 13-17-9-(2) C Sur(M) (M) G(M) G(M) G(Q1) G(Q1)Q8220000 ROCKY RIV AT SR 1006 NR CONCORD 35.31397 -80.47864 CABARRUS MRO 13-17 C Sur(M) (M) G(M) G(M) G(M) G(Q1) G(Q1)Q8360000 GOOSE CRK AT SR 1524 NR MINT HILL 35.1309 -80.63105 UNION MRO 13-17-18 C Sur(M) (M) G(M) G(M) G(M) G(M) G(Q3)Q8374000 GOOSE CRK AT SR 1547 NR BRIEF 35.17587 -80.51129 UNION MRO 13-17-18 C Sur(M) (M) G(M) G(M) G(M) G(M) G(Q3)Q8720000 LONG CRK AT SR 1917 NR ROCKY RIVER SPRINGS 35.22392 -80.25857 STANLY MRO 13-17-31 C Sur(M) (M) G(M) G(M) G(M) G(Q1) G(Q1)Q8917000 RICHARDSON CRK AT SR 1649 NR FAIRFIELD 35.07111 -80.40662 UNION MRO 13-17-36-(5) C Sur(M) (M) G(M) G(M) G(M) G(Q1) G(Q1)Q9120000 ROCKY RIV AT SR 1935 NR NORWOOD 35.15688 -80.16583 STANLY MRO 13-17 C Sur(M) (M) G(M) G(M) G(M) G(Q1) G(Q1)Q9155000 BROWN CRK AT SR 1627 NR PINKSTON 35.06372 -80.05283 ANSON FRO 13-20 C Sur(M) (M) G(M) G(M) G(Q1) G(Q1)Q9160000 PEE DEE RIV AT NC 109 NR MANGUM 35.086 -79.99883 ANSON FRO 13-(15.5) WS-V B Sur(M) (M) G(M) G(M) G(M) G(Q1) G(Q1)Q9200000 LITTLE RIV AT SR 1340 NR STAR 35.38722 -79.83152 MONTGOMERY FRO 13-25-(11.5) C HQW Sur(M) (M) G(M) G(M) G(M) G(Q1) G(Q1)Q9400000 PEE DEE RIV AT US 74 NR ROCKINGHAM 34.94567 -79.8691 RICHMOND FRO 13-(34) C Sur(M) (M) G(M) G(M) G(Q1) G(Q1)Q9660000 HITCHCOCK CRK AT SR 1109 AT CORDOVA 34.91837 -79.83003 RICHMOND FRO 13-39-(10) C Sur(M) (M) G(M) G(M) G(M) G(Q1) G(Q1)Q9777000 JONES CRK AT NC 145 NR PEE DEE 34.90432 -79.93047 ANSON FRO 13-42 C Sur(M) (M) G(M) G(M) G(Q1) G(Q1)Q9940000 MARKS CRK AT SR 1812 NR HAMLET 34.86257 -79.71915 RICHMOND FRO 13-45-(2) C Sur(M) (M) G(M) G(M) G(Q1) G(Q1)
NC AMS QAPP Appendix 4 EPA Approved: July 2017 Version 2.0
Appendix 4: Data review checklists and methods
Field data review checklist and review steps Lab data review checklist and review steps Warehouse checklist and review steps

NC AMS QAPP Appendix 4 EPA Approved: July 2017 Version 2.0
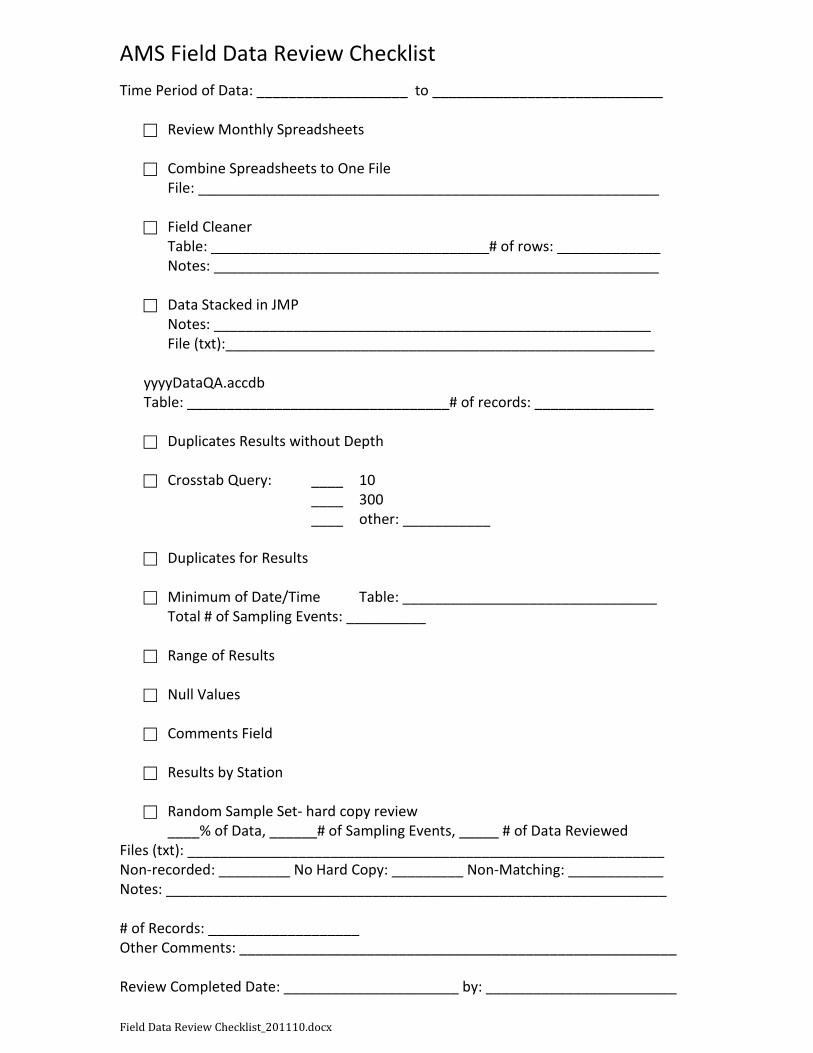
Field Data Review Checklist_201110.docx
AMS Field Data Review Checklist
Time Period of Data: ___________________ to _____________________________ Review Monthly Spreadsheets
Combine Spreadsheets to One File
File: __________________________________________________________ Field Cleaner
Table: ___________________________________# of rows: _____________ Notes: ________________________________________________________
Data Stacked in JMP
Notes: _______________________________________________________ File (txt):______________________________________________________
yyyyDataQA.accdb Table: _________________________________# of records: _______________ Duplicates Results without Depth Crosstab Query: ____ 10
____ 300 ____ other: ___________ Duplicates for Results
Minimum of Date/Time Table: ________________________________
Total # of Sampling Events: __________
Range of Results Null Values
Comments Field
Results by Station
Random Sample Set- hard copy review
____% of Data, ______# of Sampling Events, _____ # of Data Reviewed Files (txt): ____________________________________________________________ Non-recorded: _________ No Hard Copy: _________ Non-Matching: ____________ Notes: _______________________________________________________________ # of Records: ___________________ Other Comments: _______________________________________________________ Review Completed Date: ______________________ by: ________________________
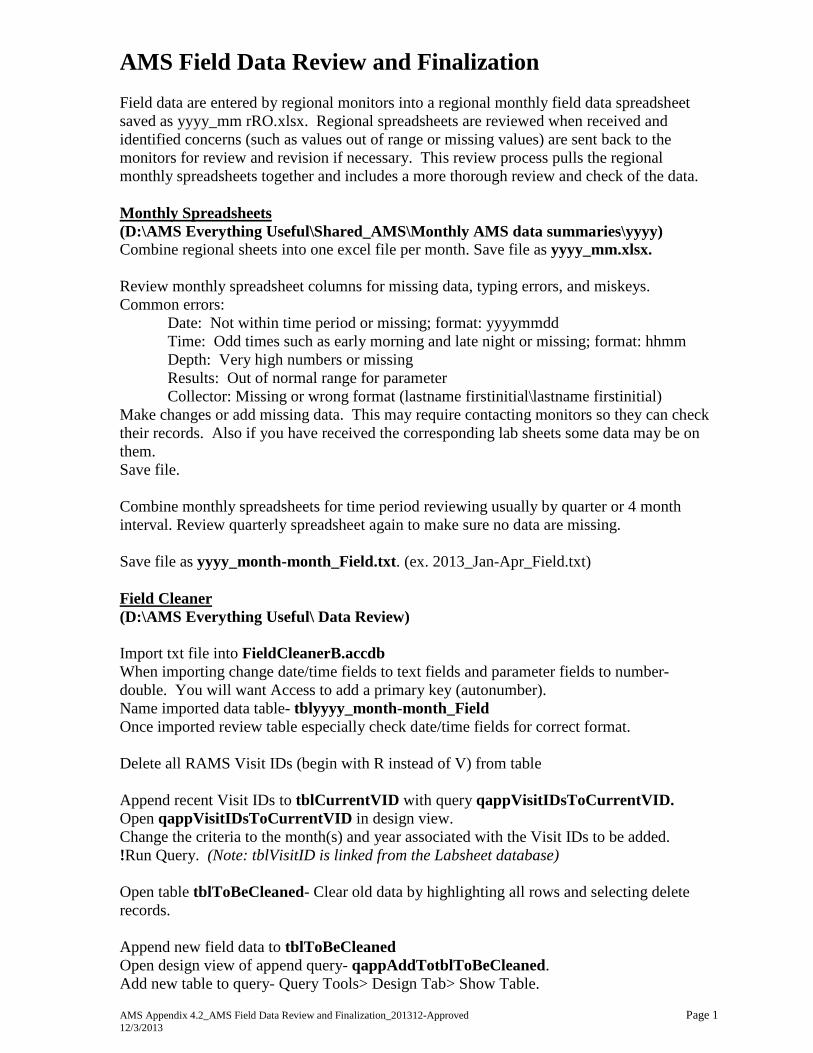
AMS Appendix 4.2_AMS Field Data Review and Finalization_201312-Approved Page 1 12/3/2013
AMS Field Data Review and Finalization Field data are entered by regional monitors into a regional monthly field data spreadsheet saved as yyyy_mm rRO.xlsx. Regional spreadsheets are reviewed when received and identified concerns (such as values out of range or missing values) are sent back to the monitors for review and revision if necessary. This review process pulls the regional monthly spreadsheets together and includes a more thorough review and check of the data. Monthly Spreadsheets (D:\AMS Everything Useful\Shared_AMS\Monthly AMS data summaries\yyyy) Combine regional sheets into one excel file per month. Save file as yyyy_mm.xlsx. Review monthly spreadsheet columns for missing data, typing errors, and miskeys. Common errors:
Date: Not within time period or missing; format: yyyymmdd Time: Odd times such as early morning and late night or missing; format: hhmm Depth: Very high numbers or missing Results: Out of normal range for parameter Collector: Missing or wrong format (lastname firstinitial\lastname firstinitial)
Make changes or add missing data. This may require contacting monitors so they can check their records. Also if you have received the corresponding lab sheets some data may be on them. Save file. Combine monthly spreadsheets for time period reviewing usually by quarter or 4P
Pmonth
interval. Review quarterly spreadsheet again to make sure no data are missing. Save file as yyyy_month-month_Field.txt. (ex. 2013_Jan-Apr_Field.txt) Field Cleaner (D:\AMS Everything Useful\ Data Review) Import txt file into FieldCleanerB.accdb When importing change date/time fields to text fields and parameter fields to number- double. You will want Access to add a primary key (autonumber). Name imported data table- tblyyyy_month-month_Field Once imported review table especially check date/time fields for correct format. Delete all RAMS Visit IDs (begin with R instead of V) from table Append recent Visit IDs to tblCurrentVID with query qappVisitIDsToCurrentVID. Open qappVisitIDsToCurrentVID in design view. Change the criteria to the month(s) and year associated with the Visit IDs to be added. !Run Query. (Note: tblVisitID is linked from the Labsheet database) Open table tblToBeCleaned- Clear old data by highlighting all rows and selecting delete records. Append new field data to tblToBeCleaned Open design view of append query- qappAddTotblToBeCleaned. Add new table to query- Query Tools> Design Tab> Show Table.
AMS Appendix 4.2_AMS Field Data Review and Finalization_201312-Approved Page 2 12/3/2013
Change Table source in query fields to new table and then remove old table from query. **Make sure you have changed all applicable columns or you may end up losing a column when you remove the old table.
!Run query- should say appending ## of rows Check table tblToBeCleaned to make sure all data were included and no columns were lost. !Run macros mcrRunErrorChecks- enter start date, end date for time period of field data being reviewed. Check table tblErrors. Go through table to verify or change errors generated by macros. Main errors will be: Mismatch VID, Duplicate VID, Bad date/time, Duplicate Record, and Null Header Info. Append records back to main table by running- qappFixedErrorsToMainTable. Rerun mcrRunErrorChecks until satisfied that no more changes need to be made. Append records back to main table (tblToBeCleaned) each time after checking errors. Stacking Data in JMP (D:\AMS Everything Useful\ Data Review) Open JMP. Open Stack Field Data Script- StackFieldDataRev.JSL Run Script. You will be asked to select which table to open –select tblToBeCleaned. Check the final table that pops up especially the date/time field. Save file as yyyyField_month-month.txt. (ex. 2013Field_Jan-Apr.txt) **The SQL StackFieldDataRev should stack the field data for you but if not, here are the step by step directions. Open JMP Open Database Table- Connect to Access- find FieldCleanerB.accdb/tblToBeCleaned Check imported data especially dtmDateTime for blanks. Delete extra date/time fields. Stack Tables Table>Stack UWithout depthU- stack columns= 20, 32, 35, 36, 45, 78, 1351 Stacked Data column= result Source Label column= methodcode Click Stack Delete other method code columns Table>Stack UWith DepthU- stack columns= 10, 94, 300, 400, 480 Stacked Data Column= result Source Label Column= methodcode Click Stack Delete other method code columns
AMS Appendix 4.2_AMS Field Data Review and Finalization_201312-Approved Page 3 12/3/2013
Concatenate Results tables Tables>Concatenate Place both of the newly created tables into selected data table Click Concatenate Check newly created table with both “without depth” and “with depth”. Tables>Summary Group by results, statistics by N Select rows with “.” in result Delete selected rows from concatenated table. Save joined table as yyyyField_month-month.txt. (ex. 2013Field_Jan-Apr.txt) **This completes JMP process. Open text file in Excel to check for “.” in fields- Depth, Comments, Collector, etc. This also keeps time in 24hr format when imported into Access. Save file. Data QA (D:\AMS Everything Useful\ Data Review\yyyy\yyyyDataQA.accdb) Import saved text file (yyyyField_month-month.txt) into database. Change the following fields to the listed data type: Date/Time- text, result/depth- double, methodcode- text Have Access add a primary key (autonumber). Name imported data table- tblyyyyField_month-month. (ex. tbl2013Field_Jan-Apr) Once imported review table especially check date/time fields for correct format. Add a field for Month (strMonth) to the table. Save Table. Import updated tblCurrentVID from FieldCleanerB.accdb into database. Update the month column in data table through an update query using tblCurrentVID- qupMonthToData. Check for duplicate Results without Depth Create a find duplicates query that looks for duplicate visit ID and methodcode. Review duplicates- this will be for rows with depth. Change criteria in depth field to “is null” to check data without a depth. Review duplicates. Make changes if necessary and delete duplicate rows due to depth profiles. Make Crosstab Query Row Heading- Station, methodcode Column Heading- strMonth Count(result) !Run query Change criteria in query to run for individual method codes Such as 300- Dissolved Oxygen, 10- Water Temperature
AMS Appendix 4.2_AMS Field Data Review and Finalization_201312-Approved Page 4 12/3/2013
Check each query to see if the correct number of results show up for each month. If there are discrepancies then verify there is no result for that station that month. Update missing or incorrect entries. Check for duplicate Results Create a find duplicates query that looks for duplicate visit ID, methodcode or duplicate visit ID, methodcode, depth, or duplicate visit ID, methocode, depth, result. Review and make necessary changes. Minimum of DateTime field (with Collector) Create a query with Visit ID, station, collector and dtmDateTime(min). Change query type to make-table query Name table- tblyyyyField_month-month_MinDTCol !Run Query- will ask if you want to append to new table- click yes. Update DateTime to Minimum DateTime (not always necessary) Make a backup copy of field data table- save as tblyyyyField_month-month_Copy. Create an update query with table tblyyyyField_month-month_MinDT and Field data table tblField_month-month. Relate tables by strVisitID. Use DateTime field from Field data- update to minOfdtmDateTime field. !Run query Check Range of Result values- (This is done in basic check of monthly spreadsheets but another look does not hurt.) Create a query with max, min and count of results for each method code Columns- methodcode, displayname, result(count), result(min), result(max) Look for appropriate ranges of data, i.e. at or above detection limits, decimal places Check for null values Create a query with each column in the results table included. In the criteria start on the first line for the first column and type “is null”. Continue this for the other columns except the comments and depth fields but go down one line each time. This should let you know if something is missing. Check Comments field Review comments- remove any unnecessary comments that should not carry on with the data. For all dissolved oxygen (300) readings with “LDO” comments, replace methocode 300 with LDO. Remove LDO comments from all comments. Compare Results by Station to previous 5 years of data Create a min, max, count table for each station by methodcode based off the historical data (last 5 or more years). (current table tblStationDataRanges_2008-2012) Compare min/max to new data. Open design view of qryCompareResultsToMinMaxField Add new data table (tblyyyyField_month-month) to query and change Table source to new table -then remove old table from query. Create relationships between tables to include stationcode=strStation and methodcode=methodcode. !Run Query
AMS Appendix 4.2_AMS Field Data Review and Finalization_201312-Approved Page 5 12/3/2013
Review results that have a “!!!” in either the min or max column. Check with monitors for verification of results that don’t seem reasonable. Random Sample Set- Compare against field data hard copies Open the table tblyyyyField_month-month in JMP Tables> Summary Group by VisitID, station, datetime, collector Statistics- blank Create a random subset from the summary table Tables>Subset>Random sampling rate- enter a % (eg 0.05). Percentage will depend on number of results and feasibility to review. Click- Link to original data table. Click OK. Save subset table as Subset of ‘tblyyyyField_month-month’ RandomReview.txt Select all records in the subset table. Go back to the original table tblyyyyField_month-month in JMP and create a subset table from the selected rows. Tables>Subset>Selected rows Click- Link to original data table. Save subset table as Subset of ‘tblyyyyField_month-month’ RandomReviewData.txt. This table will include the individual data points related to the first random subset table. Split the data from the selected rows subset table for reviewing convenience. Tables>Split Split columns- result Split by- methodcode Group by- strVisitID, strStation, dtmDateTime, dblDepth Check “Keep all remaining columns” Click Ok. Rearrange order of methodcodes to match field data spreadsheet.
- 94, 10, 300, 400, 20, 480, 45, 32, 36, 1351, 35, 78 Save as Subset of ‘tblyyyyField_month-month’ RandomReviewData_Split.txt Open table in Excel and format for review purposes. Open file Subset of ‘tblyyyyField_month-month’ RandomReview.txt in Excel. Sort sampling events by regional office (by collector) and format table. Save file as Subset of tblyyyyField_month-month_#.xlsx. (ex. Subset of tbl2013Field_Jan-Apr_60.xlsx) Send email to regional office monitors and request copies of the original hard copies for the selected sampling events. Review field data hard copies against file Subset of ‘tblyyyyField_month-month’ RandomReviewData_Split.txt. Note any values that were not recorded on the hard copy but appear in the electronic version, no original hard copy could be found, and those where the hard copy version does not match the electronic version. Remove values that were not recorded on the hard copy or no hard copy is available. Revise values to hard copy versions for those that do not match.
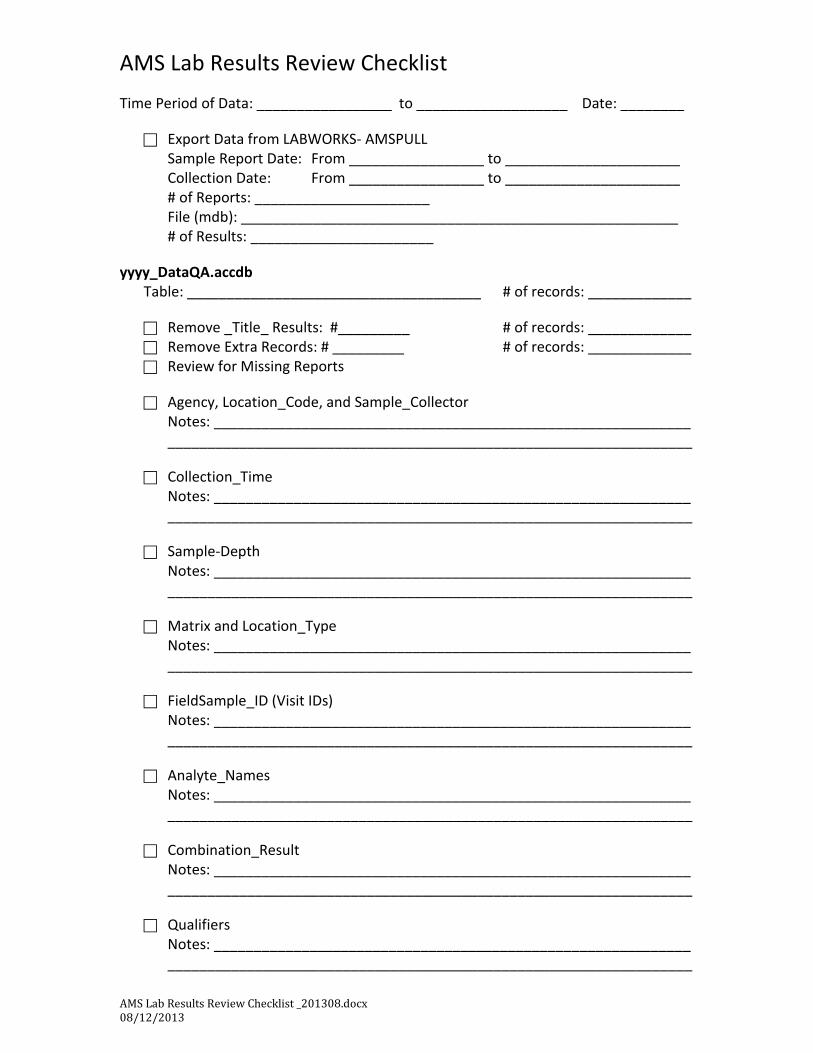
AMS Lab Results Review Checklist _201308.docx 08/12/2013
AMS Lab Results Review Checklist Time Period of Data: _________________ to ___________________ Date: ________ Export Data from LABWORKS- AMSPULL
Sample Report Date: From _________________ to ______________________ Collection Date: From _________________ to ______________________ # of Reports: ______________________ File (mdb): _______________________________________________________ # of Results: _______________________
yyyy_DataQA.accdb Table: _____________________________________ # of records: _____________
Remove _Title_ Results: #_________ # of records: _____________ Remove Extra Records: # _________ # of records: _____________ Review for Missing Reports
Agency, Location_Code, and Sample_Collector
Notes: ____________________________________________________________ __________________________________________________________________
Collection_Time Notes: ____________________________________________________________ __________________________________________________________________
Sample-Depth Notes: ____________________________________________________________ __________________________________________________________________
Matrix and Location_Type Notes: ____________________________________________________________ __________________________________________________________________
FieldSample_ID (Visit IDs) Notes: ____________________________________________________________ __________________________________________________________________
Analyte_Names
Notes: ____________________________________________________________ __________________________________________________________________
Combination_Result Notes: ____________________________________________________________ __________________________________________________________________
Qualifiers Notes: ____________________________________________________________ __________________________________________________________________
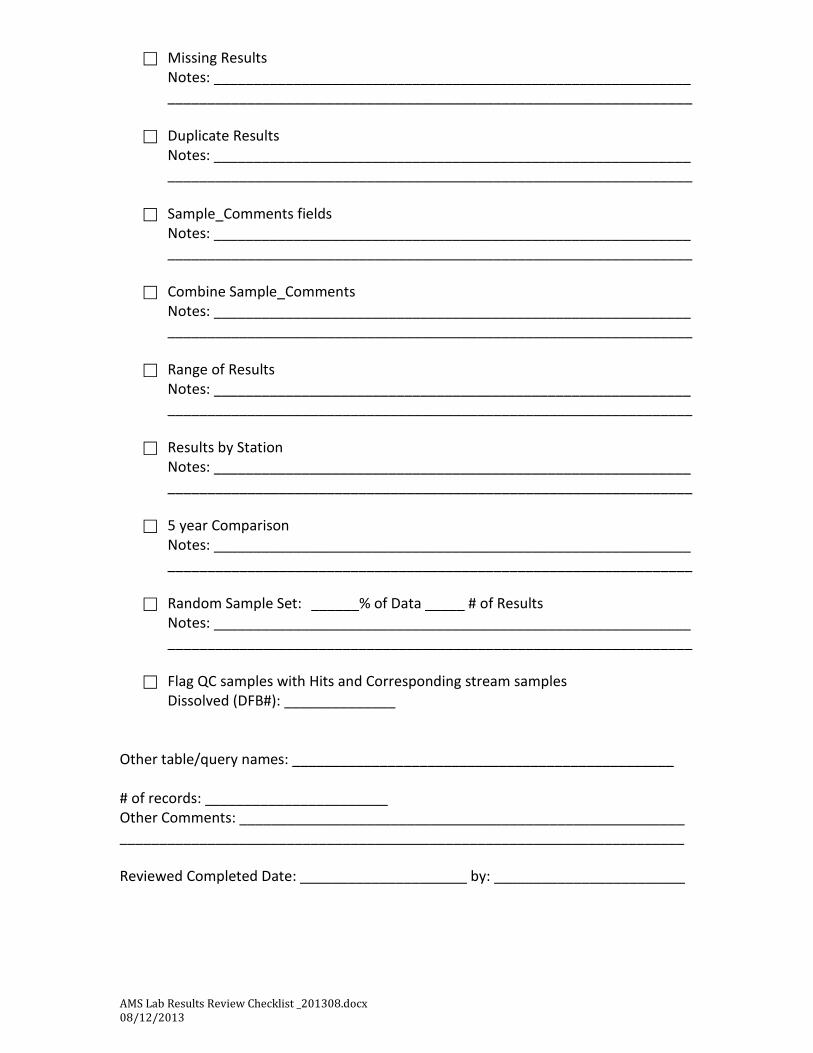
AMS Lab Results Review Checklist _201308.docx 08/12/2013
Missing Results Notes: ____________________________________________________________ __________________________________________________________________
Duplicate Results
Notes: ____________________________________________________________ __________________________________________________________________
Sample_Comments fields
Notes: ____________________________________________________________ __________________________________________________________________
Combine Sample_Comments Notes: ____________________________________________________________ __________________________________________________________________
Range of Results
Notes: ____________________________________________________________ __________________________________________________________________
Results by Station Notes: ____________________________________________________________ __________________________________________________________________
5 year Comparison Notes: ____________________________________________________________ __________________________________________________________________
Random Sample Set: ______% of Data _____ # of Results
Notes: ____________________________________________________________ __________________________________________________________________
Flag QC samples with Hits and Corresponding stream samples
Dissolved (DFB#): ______________
Other table/query names: ________________________________________________ # of records: _______________________ Other Comments: ________________________________________________________ _______________________________________________________________________ Reviewed Completed Date: _____________________ by: ________________________
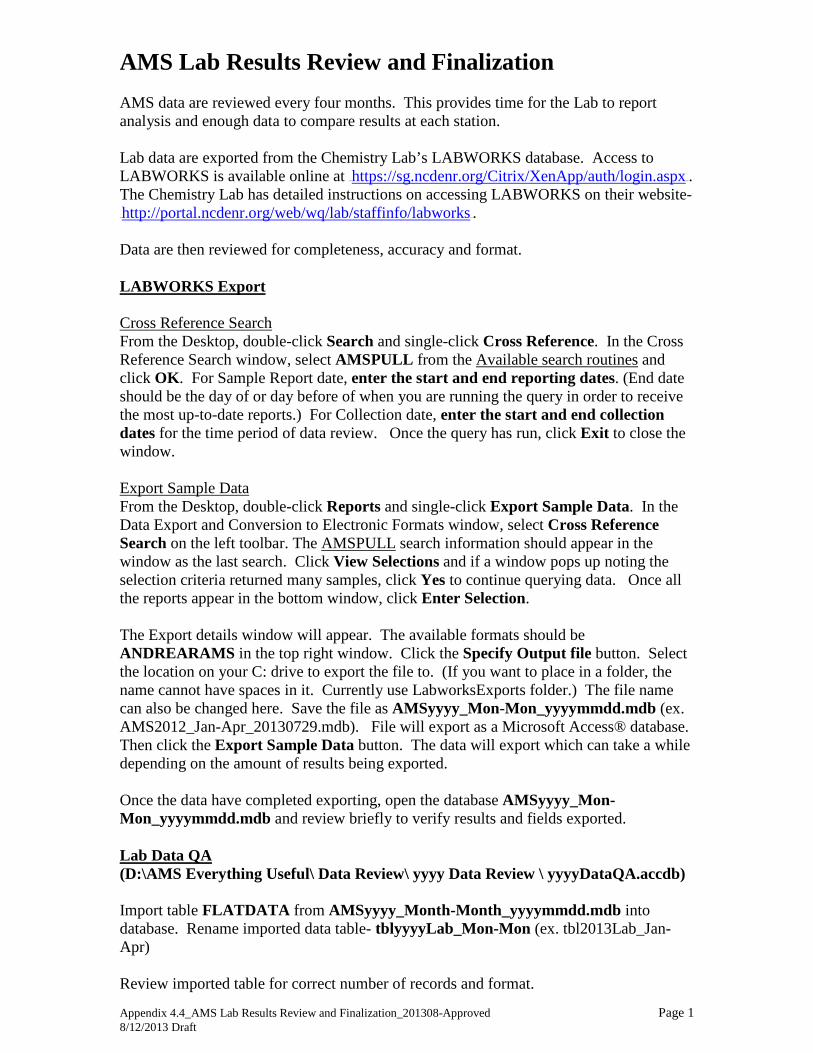
Appendix 4.4_AMS Lab Results Review and Finalization_201308-Approved Page 1 8/12/2013 Draft
AMS Lab Results Review and Finalization AMS data are reviewed every four months. This provides time for the Lab to report analysis and enough data to compare results at each station. Lab data are exported from the Chemistry Lab’s LABWORKS database. Access to LABWORKS is available online at 26TUhttps://sg.ncdenr.org/Citrix/XenApp/auth/login.aspxU26T. The Chemistry Lab has detailed instructions on accessing LABWORKS on their website- 26Thttp://portal.ncdenr.org/web/wq/lab/staffinfo/labworks26T. Data are then reviewed for completeness, accuracy and format. LABWORKS Export Cross Reference Search From the Desktop, double-click Search and single-click Cross Reference. In the Cross Reference Search window, select AMSPULL from the Available search routines and click OK. For Sample Report date, enter the start and end reporting dates. (End date should be the day of or day before of when you are running the query in order to receive the most up-to-date reports.) For Collection date, enter the start and end collection dates for the time period of data review. Once the query has run, click Exit to close the window. Export Sample Data From the Desktop, double-click Reports and single-click Export Sample Data. In the Data Export and Conversion to Electronic Formats window, select Cross Reference Search on the left toolbar. The AMSPULL search information should appear in the window as the last search. Click View Selections and if a window pops up noting the selection criteria returned many samples, click Yes to continue querying data. Once all the reports appear in the bottom window, click Enter Selection. The Export details window will appear. The available formats should be ANDREARAMS in the top right window. Click the Specify Output file button. Select the location on your C: drive to export the file to. (If you want to place in a folder, the name cannot have spaces in it. Currently use LabworksExports folder.) The file name can also be changed here. Save the file as AMSyyyy_Mon-Mon_yyyymmdd.mdb (ex. AMS2012_Jan-Apr_20130729.mdb). File will export as a Microsoft Access® database. Then click the Export Sample Data button. The data will export which can take a while depending on the amount of results being exported. Once the data have completed exporting, open the database AMSyyyy_Mon-Mon_yyyymmdd.mdb and review briefly to verify results and fields exported. Lab Data QA (D:\AMS Everything Useful\ Data Review\ yyyy Data Review \ yyyyDataQA.accdb) Import table FLATDATA from AMSyyyy_Month-Month_yyyymmdd.mdb into database. Rename imported data table- tblyyyyLab_Mon-Mon (ex. tbl2013Lab_Jan-Apr) Review imported table for correct number of records and format.
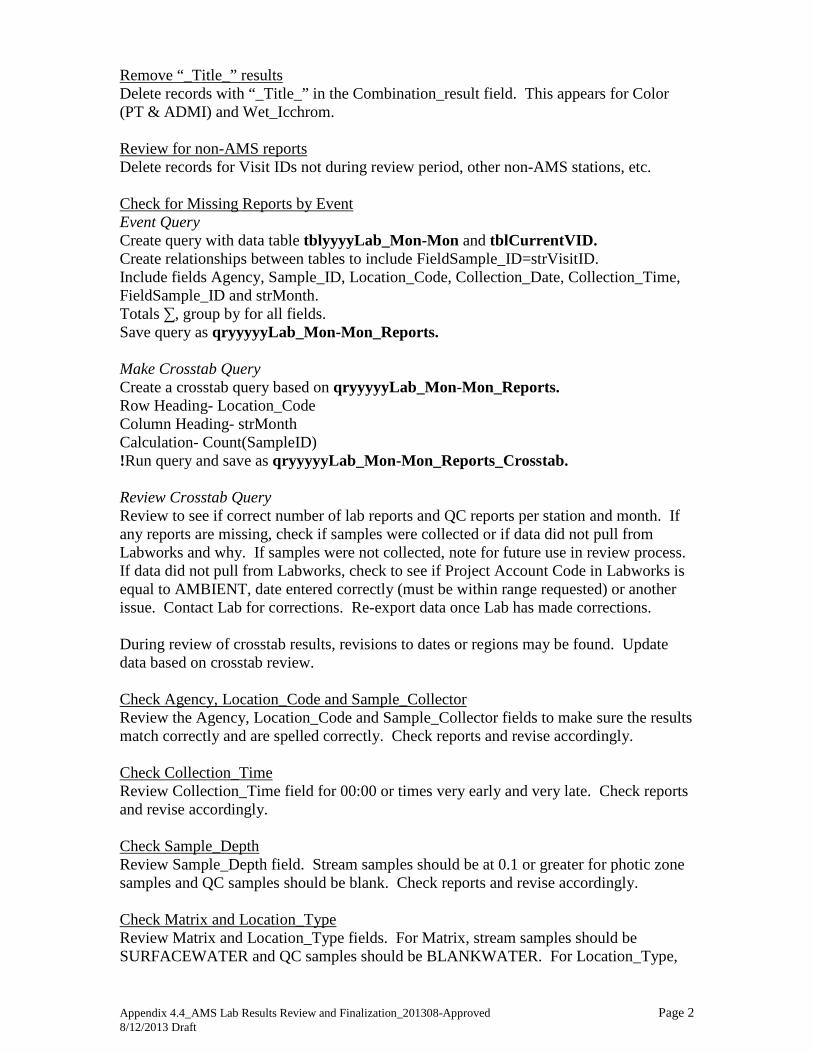
Appendix 4.4_AMS Lab Results Review and Finalization_201308-Approved Page 2 8/12/2013 Draft
Remove “_Title_” results Delete records with “_Title_” in the Combination_result field. This appears for Color (PT & ADMI) and Wet_Icchrom. Review for non-AMS reports Delete records for Visit IDs not during review period, other non-AMS stations, etc. Check for Missing Reports by Event Event Query Create query with data table tblyyyyLab_Mon-Mon and tblCurrentVID. Create relationships between tables to include FieldSample_ID=strVisitID. Include fields Agency, Sample_ID, Location_Code, Collection_Date, Collection_Time, FieldSample_ID and strMonth. Totals ∑, group by for all fields. Save query as qryyyyyLab_Mon-Mon_Reports. Make Crosstab Query Create a crosstab query based on qryyyyyLab_Mon-Mon_Reports. Row Heading- Location_Code Column Heading- strMonth Calculation- Count(SampleID) !Run query and save as qryyyyyLab_Mon-Mon_Reports_Crosstab. Review Crosstab Query Review to see if correct number of lab reports and QC reports per station and month. If any reports are missing, check if samples were collected or if data did not pull from Labworks and why. If samples were not collected, note for future use in review process. If data did not pull from Labworks, check to see if Project Account Code in Labworks is equal to AMBIENT, date entered correctly (must be within range requested) or another issue. Contact Lab for corrections. Re-export data once Lab has made corrections. During review of crosstab results, revisions to dates or regions may be found. Update data based on crosstab review. Check Agency, Location_Code and Sample_Collector Review the Agency, Location_Code and Sample_Collector fields to make sure the results match correctly and are spelled correctly. Check reports and revise accordingly. Check Collection_Time Review Collection_Time field for 00:00 or times very early and very late. Check reports and revise accordingly. Check Sample_Depth Review Sample_Depth field. Stream samples should be at 0.1 or greater for photic zone samples and QC samples should be blank. Check reports and revise accordingly. Check Matrix and Location_Type Review Matrix and Location_Type fields. For Matrix, stream samples should be SURFACEWATER and QC samples should be BLANKWATER. For Location_Type,
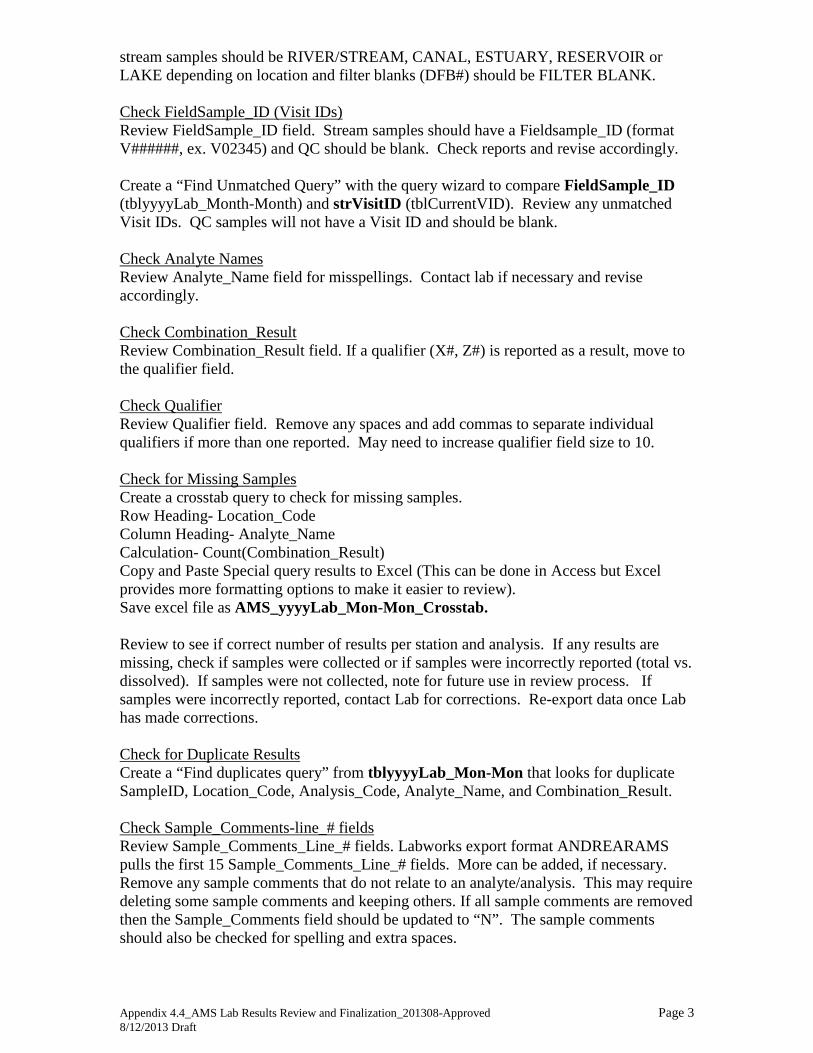
Appendix 4.4_AMS Lab Results Review and Finalization_201308-Approved Page 3 8/12/2013 Draft
stream samples should be RIVER/STREAM, CANAL, ESTUARY, RESERVOIR or LAKE depending on location and filter blanks (DFB#) should be FILTER BLANK. Check FieldSample_ID (Visit IDs) Review FieldSample_ID field. Stream samples should have a Fieldsample_ID (format V######, ex. V02345) and QC should be blank. Check reports and revise accordingly. Create a “Find Unmatched Query” with the query wizard to compare FieldSample_ID (tblyyyyLab_Month-Month) and strVisitID (tblCurrentVID). Review any unmatched Visit IDs. QC samples will not have a Visit ID and should be blank. Check Analyte Names Review Analyte_Name field for misspellings. Contact lab if necessary and revise accordingly. Check Combination_Result Review Combination_Result field. If a qualifier (X#, Z#) is reported as a result, move to the qualifier field. Check Qualifier Review Qualifier field. Remove any spaces and add commas to separate individual qualifiers if more than one reported. May need to increase qualifier field size to 10. Check for Missing Samples Create a crosstab query to check for missing samples. Row Heading- Location_Code Column Heading- Analyte_Name Calculation- Count(Combination_Result) Copy and Paste Special query results to Excel (This can be done in Access but Excel provides more formatting options to make it easier to review). Save excel file as AMS_yyyyLab_Mon-Mon_Crosstab. Review to see if correct number of results per station and analysis. If any results are missing, check if samples were collected or if samples were incorrectly reported (total vs. dissolved). If samples were not collected, note for future use in review process. If samples were incorrectly reported, contact Lab for corrections. Re-export data once Lab has made corrections. Check for Duplicate Results Create a “Find duplicates query” from tblyyyyLab_Mon-Mon that looks for duplicate SampleID, Location_Code, Analysis_Code, Analyte_Name, and Combination_Result. Check Sample_Comments-line_# fields Review Sample_Comments_Line_# fields. Labworks export format ANDREARAMS pulls the first 15 Sample_Comments_Line_# fields. More can be added, if necessary. Remove any sample comments that do not relate to an analyte/analysis. This may require deleting some sample comments and keeping others. If all sample comments are removed then the Sample_Comments field should be updated to “N”. The sample comments should also be checked for spelling and extra spaces.
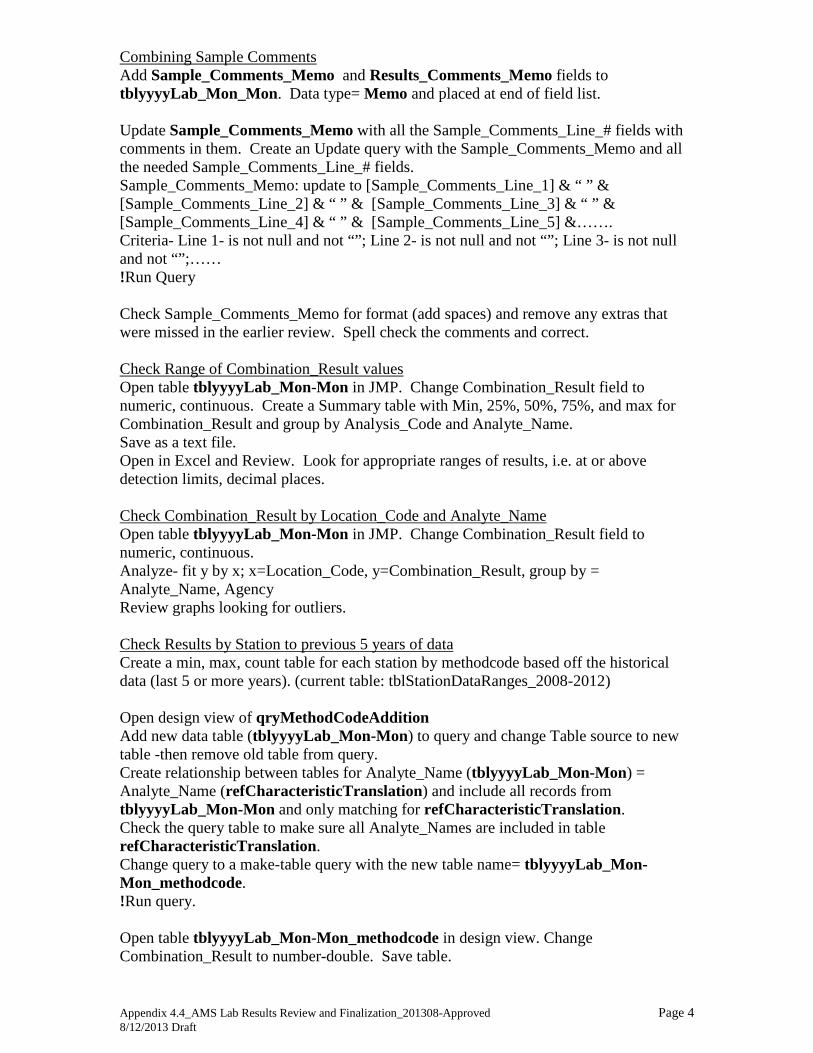
Appendix 4.4_AMS Lab Results Review and Finalization_201308-Approved Page 4 8/12/2013 Draft
Combining Sample Comments Add Sample_Comments_Memo and Results_Comments_Memo fields to tblyyyyLab_Mon_Mon. Data type= Memo and placed at end of field list. Update Sample_Comments_Memo with all the Sample_Comments_Line_# fields with comments in them. Create an Update query with the Sample_Comments_Memo and all the needed Sample_Comments_Line_# fields. Sample_Comments_Memo: update to [Sample_Comments_Line_1] & “ ” & [Sample_Comments_Line_2] & “ ” & [Sample_Comments_Line_3] & “ ” & [Sample_Comments_Line_4] & “ ” & [Sample_Comments_Line_5] &……. Criteria- Line 1- is not null and not “”; Line 2- is not null and not “”; Line 3- is not null and not “”;…… !Run Query Check Sample_Comments_Memo for format (add spaces) and remove any extras that were missed in the earlier review. Spell check the comments and correct. Check Range of Combination_Result values Open table tblyyyyLab_Mon-Mon in JMP. Change Combination_Result field to numeric, continuous. Create a Summary table with Min, 25%, 50%, 75%, and max for Combination_Result and group by Analysis_Code and Analyte_Name. Save as a text file. Open in Excel and Review. Look for appropriate ranges of results, i.e. at or above detection limits, decimal places. Check Combination_Result by Location_Code and Analyte_Name Open table tblyyyyLab_Mon-Mon in JMP. Change Combination_Result field to numeric, continuous. Analyze- fit y by x; x=Location_Code, y=Combination_Result, group by = Analyte_Name, Agency Review graphs looking for outliers. Check Results by Station to previous 5 years of data Create a min, max, count table for each station by methodcode based off the historical data (last 5 or more years). (current table: tblStationDataRanges_2008-2012) Open design view of qryMethodCodeAddition Add new data table (tblyyyyLab_Mon-Mon) to query and change Table source to new table -then remove old table from query. Create relationship between tables for Analyte_Name (tblyyyyLab_Mon-Mon) = Analyte_Name (refCharacteristicTranslation) and include all records from tblyyyyLab_Mon-Mon and only matching for refCharacteristicTranslation. Check the query table to make sure all Analyte_Names are included in table refCharacteristicTranslation. Change query to a make-table query with the new table name= tblyyyyLab_Mon-Mon_methodcode. !Run query. Open table tblyyyyLab_Mon-Mon_methodcode in design view. Change Combination_Result to number-double. Save table.
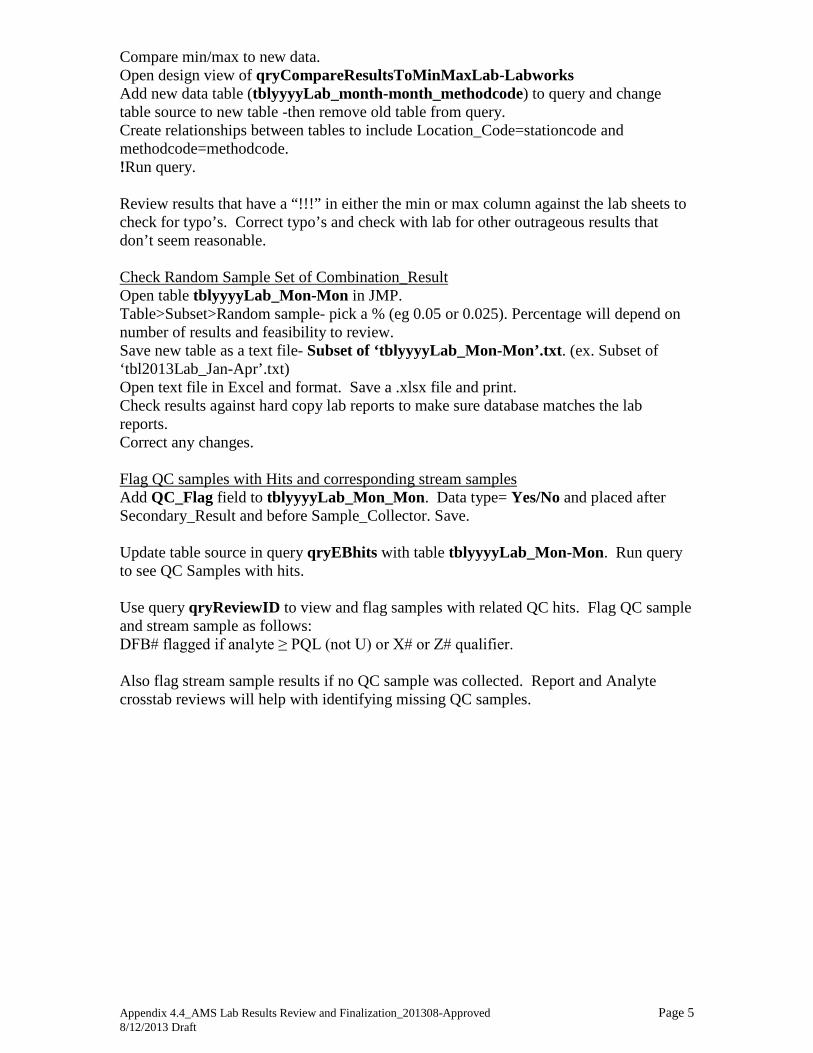
Appendix 4.4_AMS Lab Results Review and Finalization_201308-Approved Page 5 8/12/2013 Draft
Compare min/max to new data. Open design view of qryCompareResultsToMinMaxLab-Labworks Add new data table (tblyyyyLab_month-month_methodcode) to query and change table source to new table -then remove old table from query. Create relationships between tables to include Location_Code=stationcode and methodcode=methodcode. !Run query. Review results that have a “!!!” in either the min or max column against the lab sheets to check for typo’s. Correct typo’s and check with lab for other outrageous results that don’t seem reasonable. Check Random Sample Set of Combination_Result Open table tblyyyyLab_Mon-Mon in JMP. Table>Subset>Random sample- pick a % (eg 0.05 or 0.025). Percentage will depend on number of results and feasibility to review. Save new table as a text file- Subset of ‘tblyyyyLab_Mon-Mon’.txt. (ex. Subset of ‘tbl2013Lab_Jan-Apr’.txt) Open text file in Excel and format. Save a .xlsx file and print. Check results against hard copy lab reports to make sure database matches the lab reports. Correct any changes. Flag QC samples with Hits and corresponding stream samples Add QC_Flag field to tblyyyyLab_Mon_Mon. Data type= Yes/No and placed after Secondary_Result and before Sample_Collector. Save. Update table source in query qryEBhits with table tblyyyyLab_Mon-Mon. Run query to see QC Samples with hits. Use query qryReviewID to view and flag samples with related QC hits. Flag QC sample and stream sample as follows: DFB# flagged if analyte ≥ PQL (not U) or X# or Z# qualifier. Also flag stream sample results if no QC sample was collected. Report and Analyte crosstab reviews will help with identifying missing QC samples.
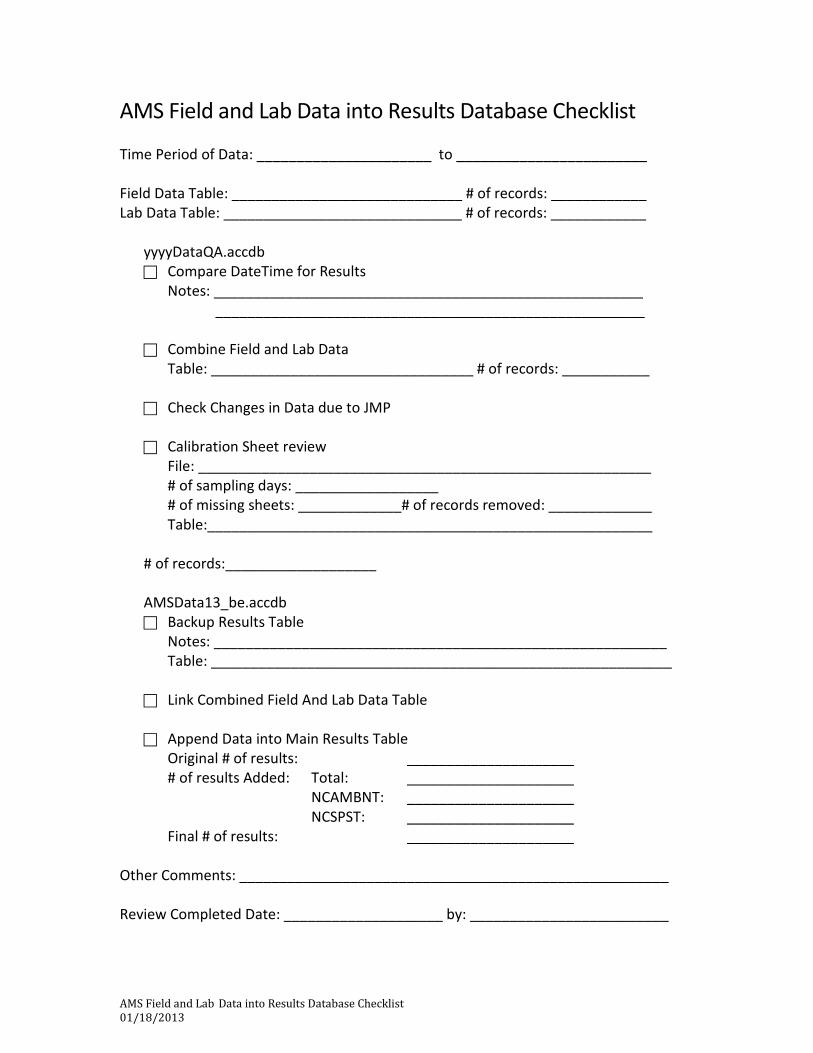
AMS Field and Lab Data into Results Database Checklist 01/18/2013
AMS Field and Lab Data into Results Database Checklist Time Period of Data: ______________________ to ________________________ Field Data Table: _____________________________ # of records: ____________ Lab Data Table: ______________________________ # of records: ____________
yyyyDataQA.accdb Compare DateTime for Results
Notes: ______________________________________________________ ______________________________________________________
Combine Field and Lab Data
Table: _________________________________ # of records: ___________ Check Changes in Data due to JMP
Calibration Sheet review
File: _________________________________________________________ # of sampling days: __________________ # of missing sheets: _____________# of records removed: _____________
Table:________________________________________________________ # of records:___________________
AMSData13_be.accdb Backup Results Table
Notes: _________________________________________________________ Table: __________________________________________________________
Link Combined Field And Lab Data Table
Append Data into Main Results Table
Original # of results: _____________________ # of results Added: Total: _____________________
NCAMBNT: _____________________ NCSPST: _____________________
Final # of results: _____________________ Other Comments: ______________________________________________________ Review Completed Date: ____________________ by: _________________________
AMS Appendix 4.6_AMS Field and Lab Data to Main Database_201312-Approved 1 01/18/2013
AMS Field and Lab Data to Main Results Database Data QA (D:\AMS Everything Useful\ Data Review\yyyy\yyyyData QA.accdb) Compare datetime for both lab and field data Open query qryCompareDateTime_Lab-Field in design view. Add both the new lab and field data tables to query- Query Tools>Design Tab>ShowTable. Create relationships between the tables to include strStation(Field) = Station(Lab), strVisitID(Field) = VisitID(Lab), and Station(Lab) = strStoretNumb(tblStation). Change table sources in query fields to match new tables and then remove old tables from query.
**Make sure you have changed all applicable columns or you may end up losing a column when you remove the old tables.
!Run query. This query will let you know which date times do not match in both the field and lab data. Check all “!!!” entries for the correct values. This will require reviewing field data and lab sheets. Common errors are:
Wrong date on lab sheet- can look at receiving date if there is a question Wrong date in field data- monitor sampled on different date than originally planned or miskeyed data.
Contact monitor if necessary for confirmation of revisions. Correct any mistakes. Combine Field and Lab data Copy Lab data table and change name of table to tblyyyy_month-month (ex. tbl2012_Jan-Apr). Create an append query to append the field data (tblyyyyField_month-month) to table tblyyyy_month-month. The field types will need to match in both tables. !Run query- will ask if you want to append to table- click yes. Round depth field JMP likes to change the number of decimal points for depth and results- may need to round fields- Create Update query- update depth field to round([depth_m],1) !Run query Calibration Sheet Review Open query qrySamplingDatesByRegion in design view. Add table tblyyyy_month-month to query- Query Tools>Design Tab>ShowTable. Create relationships between the tables to include Station(combined) = strStoretNumb(tblStation). Change table sources in query fields to match new table and then remove old table from query.
**Make sure you have changed all applicable columns or you may end up losing a column when you remove the old tables.
!Run query. This will provide a list sampling dates by collector for the time period reviewed.
AMS Appendix 4.6_AMS Field and Lab Data to Main Database_201312-Approved 2 01/18/2013
Copy table to Excel and paste special as text. Save as yyyy_month-month_CalibrationCompare.xlsx (ex. 2012_Jan-Apr_CalibrationCompare.xlsx). Open Calibration database (R:\AMS\AMS Calibration Log) and query qryUniqueRegionCollectorDateMeter. Enter start date and end date for time period of data review. Copy and paste table into yyyy_month-month_CalibrationCompare.xlsx in columns next to the values from yyyyData QA.accdb. Go through spreadsheet and match entries. Add spaces to the appropriate fields when matching values are not included. This could be due to no calibration sheet for a sampling event or no AMS sampling event for a calibration sheet since the calibration database has all sampling events including AMS. Review rows with blanks especially sampling events without calibration sheets. Contact regional monitors about missing calibration sheets and if available, add information to database and spreadsheet. Once all available calibration sheets are entered, review the reports in the Calibration database for DO, specific conductance, and pH. When post-sampling checks were not completed, not within QC accept criteria, or no calibration sheet is available, then data for associated dates, stations and parameters are flagged in the comments field of tblyyyy_month-month with “to be removed”. Review hard copy calibration sheets to verify failure. Create a make table query with tblyyyy_month-month. Pull all fields and under the Comments field add the criteria “to be removed*”. Name the new table – tblyyyy_month-month_ToBeRemoved. !Run query. Once the data have been added to the new table, change the query type to delete query. !Run query to remove associated data from table tblyyyy_month-month. UAMS Database (D:\AMS Everything Useful\ AMS data\AMSData13.accdb Backup Main Results Table Copy the main Results table- tblAMSResults Save table. (example- tblAMSResultspre2011JFMAData) Import Combined Table Export combined table tblyyyy_month-month as a tab delimited text file from yyyyDataQA.accdb. Import combined Field and Lab data table (tblyyyy_month-month) to database.
AMS Appendix 4.6_AMS Field and Lab Data to Main Database_201312-Approved 3 01/18/2013
Append New Data to tblAMSResults Create an append query- use the combined Field and Lab data table and tblCurrentVID. May need to import or link tblCurrentVID to this database also. Connect the tables by Visit ID and join properties to include all rows from combined Field and Lab data table and only those in tblCurrentVID. For agencycode column- the agency field will need to be created and assigned to “NCAMBNT” or “NCSPST” depending on the criteria (see below). Add station number, DateTime, depth, methodcode, result, remark, collector, comment fields from combined field and lab data table. Match to fields in tblResults From tblCurrentVID- add lngSamplingCode. UNCAMBNT criteria Currently all data except Chronic Special Studies UNCSPST criteria (Chronic Special Studies) Station- VisitID- is null !Run query Check tblAMSResults for new results and correct formatting.
NC AMS QAPP Appendix 5 EPA Approved: July 2017 Version 2.0
Appendix 5: Intensive Survey Branch SOP
Intensive Survey Branch Standard Operating Procedures Manual: Physical and Chemical Monitoring, version 2.1, December 2013

NC AMS QAPP Appendix 5 EPA Approved: July 2017 Version 2.0

ISB STANDARD OPERATING PROCEDURES Page 2 Revised 12/10/2013
INTENTIONALLY BLANK
ISB STANDARD OPERATING PROCEDURES Page 3 Revised 12/10/2013
INTRODUCTION
This manual contains the standard operating procedures (SOP) employed by the North Carolina Division of Water Resources (DWR) to evaluate water quality. It is intended to encompass all aspects of routine physical and chemical water quality monitoring with the occasional sediment samples. Therefore, this manual is to be considered a working, dynamic guideline for DWR personnel. Efforts to improve current procedures will continue, and the manual will be revised periodically, as needs dictate. The primary goal of the manual is to promote the use of procedures that are consistent and reliable during field operations. All employees of the DWR staff are expected to be familiar with and to utilize these procedures as appropriate tools for water quality data collection. Because the procedures have been presented to cover a broad range of applications encountered in water quality monitoring, modifications may be necessary for specific conditions. Deviations from the procedures outlined in this manual, however, should be documented at time of collection. These standard operating procedures apply to surface water, waste water, and sediment. The manual details procedures for sample collection and handling, as well as methods for parameters that must be measured in situ. Procedures are referenced at the end of each section. In addition, all references are compiled in Section XIII. Mention of trade names or commercial products does not constitute endorsement or recommendation for use by the Division of Water Resources. These standard operating procedures will assist the Division of Water Resources in its efforts to monitor the waters of the state with increased accuracy and confidence.
ISB STANDARD OPERATING PROCEDURES Page 4 Revised 12/10/2013
TABLE OF CONTENTS INTENSIVE SURVEY BRANCH PROCEDURES DOCUMENT REVIEW LOG ............... 8
INTENSIVE SURVEY BRANCH SOP REVISION LOG....................................................... 9
I. CONSIDERATIONS FOR WATER QUALITY SAMPLING ............................................ 11
1. GENERAL WATER QUALITY SAMPLING CONSIDERATIONS .......................... 11 2. SURFACE WATER SAMPLE SITE SELECTION ..................................................... 13 3. SAMPLE COLLECTION TYPES .............................................................................. 13 4. AUTOMATIC SAMPLERS ....................................................................................... 17 5. MANUAL SAMPLING .............................................................................................. 19 6. SPECIAL SAMPLE COLLECTION PROCEDURES ................................................. 20 7. WASTEWATER SAMPLING .................................................................................... 21
II. FIELD MONITORING ........................................................................................................ 23
1. DATA SHEETS ......................................................................................................... 23 2. SAMPLE TAGS ......................................................................................................... 25 3. CHAIN-OF-CUSTODY PROCEDURES...................................................................... 26 4. FIELD INSTRUMENTS ............................................................................................ 30
III. FIELD PARAMETER MEASUREMENTS ...................................................................... 33
1. WATER TEMPERATURE ......................................................................................... 33 2. AIR TEMPERATURE ................................................................................................ 33 3. DISSOLVED OXYGEN ............................................................................................. 33 4. PH (ELECTROMETRIC METHOD) .......................................................................... 36 5. SPECIFIC CONDUCTIVITY/SALINITY .................................................................. 37 6. SECCHI DISK TRANSPARENCY ............................................................................ 37 7. LIGHT ATTENUATION ........................................................................................... 38 8. REFERENCE POINT-TAPE-DOWN MEASUREMENT ........................................... 39 9. STAGE MEASUREMENTS ...................................................................................... 39
IV. WATER SAMPLE COLLECTION AND PRESERVATION .......................................... 41
1. BOTTLES AND PRESERVATION ........................................................................... 41 2. COLLECTION METHODS FOR CONVENTIONAL PARAMETERS ...................... 41 3. PESTICIDES AND ORGANICS ................................................................................ 59
V. SEDIMENT COLLECTION AND PRESERVATION ...................................................... 61
1. COLLECTING SUSPENDED SEDIMENT ................................................................ 61 2. COLLECTING BOTTOM SEDIMENT ...................................................................... 62 3. BOTTOM SEDIMENT SAMPLERS, APPLICATIONS, AND PROCEDURES ......... 63 4. BOTTOM CORE SAMPLERS, APPLICATIONS, AND PROCEDURES .................. 66
VI. STANDARD CLEANING PROCEDURES ..................................................................... 68
1. GENERAL ................................................................................................................. 68 2. AUTOMATIC SAMPLING EQUIPMENT................................................................. 69 3. MISCELLANEOUS SAMPLING AND FLOW MEASURING EQUIPMENT ........... 72 4. STAINLESS STEEL SAMPLING EQUIPMENT ....................................................... 72 5. OTHER FIELD INSTRUMENTATION ..................................................................... 72 6. ICE CHESTS AND SHIPPING CONTAINERS ......................................................... 72 7. FIELD CLEANING PROCEDURES .......................................................................... 73 8. VEHICLES ................................................................................................................ 73
ISB STANDARD OPERATING PROCEDURES Page 5 Revised 12/10/2013
9. DISPOSABLE SAMPLE CONTAINERS ................................................................... 73 VII. TIME-OF-TRAVEL & DYE TRACING ........................................................................... 74
1. FLUORESCENT DYE ............................................................................................... 74 2. PRE-SURVEY ........................................................................................................... 75 3. DYE REQUIREMENTS (ESTIMATING DOSAGE) ................................................. 76 4. INJECTION OF DYE ................................................................................................. 77 5. COLLECTION OF WATER SAMPLES ..................................................................... 77 6. FLUOROMETER USE............................................................................................... 80
VIII. FLOW MEASUREMENT ............................................................................................... 82
1. INTRODUCTION ...................................................................................................... 82 2. ESTABLISHING AND USING A REFERENCE POINT ........................................... 84 3. FLOW EQUIPMENT ................................................................................................. 84 4. FLOW MEASUREMENT PROCEDURE .................................................................. 85 5. BRIDGE BOARD METHOD ..................................................................................... 87 6. BOAT FLOW MEASUREMENT METHOD .............................................................. 89 7. V-NOTCH WEIR METHOD ...................................................................................... 90 8. VOLUMETRIC METHOD ......................................................................................... 92 9. MARSH MCBIRNEY MODEL 201 CURRENT METER ........................................... 92 10. FLOW SHEET CALCULATIONS ............................................................................. 92 11. OPEN CHANNEL FLOW MEASUREMNT METHOD ............................................ 93
IX. BATHYMETRY ................................................................................................................. 95
1. PROCEDURES .......................................................................................................... 95 2. EQUIPMENT AVAILABLE ...................................................................................... 95 3. SPECIFIC EQUIPMENT QUALITY CONTROL PROCEDURES ............................. 95
X. WATER QUALITY VESSEL OPERATION..................................................................... 96
1. BOAT SAFETY ......................................................................................................... 96 2. FIXED MOUNT/CONSOLE TYPE BOATS .............................................................. 97 3. SMALL BOATS WITH PORTABLE MOTORS ...................................................... 100 4. TROUBLESHOOTING: FOR ALL BOATS ............................................................ 101
XI. LAKES SAMPLING ....................................................................................................... 102
1. FIELD PREPARATION ........................................................................................... 102 2. LAKE DATA COLLECTION .................................................................................. 106 3. LAKE DATA MANAGEMENT ............................................................................... 108
XII. SEDIMENT OXYGEN DEMAND ................................................................................. 110
1. GENERAL DESCRIPTION OF SOD TEST ............................................................. 110 2. FIELD CALIBRATION DISSOLVED OXYGEN METERS .................................... 111 3. QUALITY ASSURANCE ........................................................................................ 115 4. CHAMBER DEPLOYMENT ................................................................................... 118 5. RECORDING SOD FIELD DATA. .......................................................................... 121 6. METER AND PROBE PREPARATION .................................................................. 123 7. SOD CHAMBER VELOCITY TEST ........................................................................ 123 8. LEAK TEST FOR SOD CHAMBERS ...................................................................... 124 9. THREE POINT ANCHOR TECHNIQUE ................................................................. 125
XIII. REFERENCES ............................................................................................................. 128
XIV. ADDITIONAL RESOURCES ...................................................................................... 130

ISB STANDARD OPERATING PROCEDURES Page 6 Revised 12/10/2013
APPENDICES ...................................................................................................................... 132
ISB STANDARD OPERATING PROCEDURES Page 7 Revised 12/10/2013
FIGURES
FIGURE 1. POLYETHYLENE DIPPER TYPICALLY USED BY DWR. ......................... 14
FIGURE 2. LABLINE SAMPLER FOR PHOTIC ZONE (VERTICAL SPATIAL) COMPOSITES. ................................................................................................ 15
FIGURE 3. ISCO AUTOMATED SAMPLERS. ................................................................ 18
FIGURE 4. CAGE SAMPLER USED IN THE DWR AMBIENT MONITORING PROGRAM ...................................................................................................... 19
FIGURE 5. STRATIFIED FIELD DATA SHEET............................................................. 24
FIGURE 6. SURFACE WATER LAB SHEET .................................................................. 25
FIGURE 7. COMPLETED SAMPLE TAG ....................................................................... 26
FIGURE 8. DWR CHAIN OF CUSTODY SECURITY SEAL ......................................... 28
FIGURE 9. SURFACE WATER SECTION CHAIN OF CUSTODY FORM ................. 29
FIGURE 10. METER CALIBRATION SHEET .................................................................. 32
FIGURE 11. SECCHI DISK ................................................................................................. 38
FIGURE 12. EKMAN GRAB SAMPLERS ........................................................................... 63
FIGURE 13. PETERSON GRAB SAMPLER ....................................................................... 64
FIGURE 14. PONAR GRAB SAMPLER .............................................................................. 65
FIGURE 15. PHLEGER CORER DIAGRAM ...................................................................... 66
FIGURE 16. NOMOGRAPH FOR DETERMINING VOLUME OF DYE NECESSARY TO PRODUCE PEAK CONCENTRATION .................................................. 76
FIGURE 17. DYE TRACER STUDY FIELD SHEET ......................................................... 79
FIGURE 18. INSTREAM FLOW MEASUREMENT ........................................................... 83
FIGURE 19. FIELD OBSERVATIONS FORM .................................................................. 104
FIGURE 20. SOD EQUIPMENT ......................................................................................... 110
FIGURE 21. SOD EQUIPMENT LIST: .............................................................................. 112
FIGURE 22. SOD SITE EVALUATION FORM ............................................................... 113
FIGURE 23. SEDIMENT OXYGEN DEMAND CALIBRATION WORKSHEET .......... 117
FIGURE 24. SOD FIELD SHEET ....................................................................................... 126
FIGURE 25. EXAMPLE OF SOD EXCEL WORKSHEET FOR DETERMINING AVERAGE SOD RATES............................................................................... 127
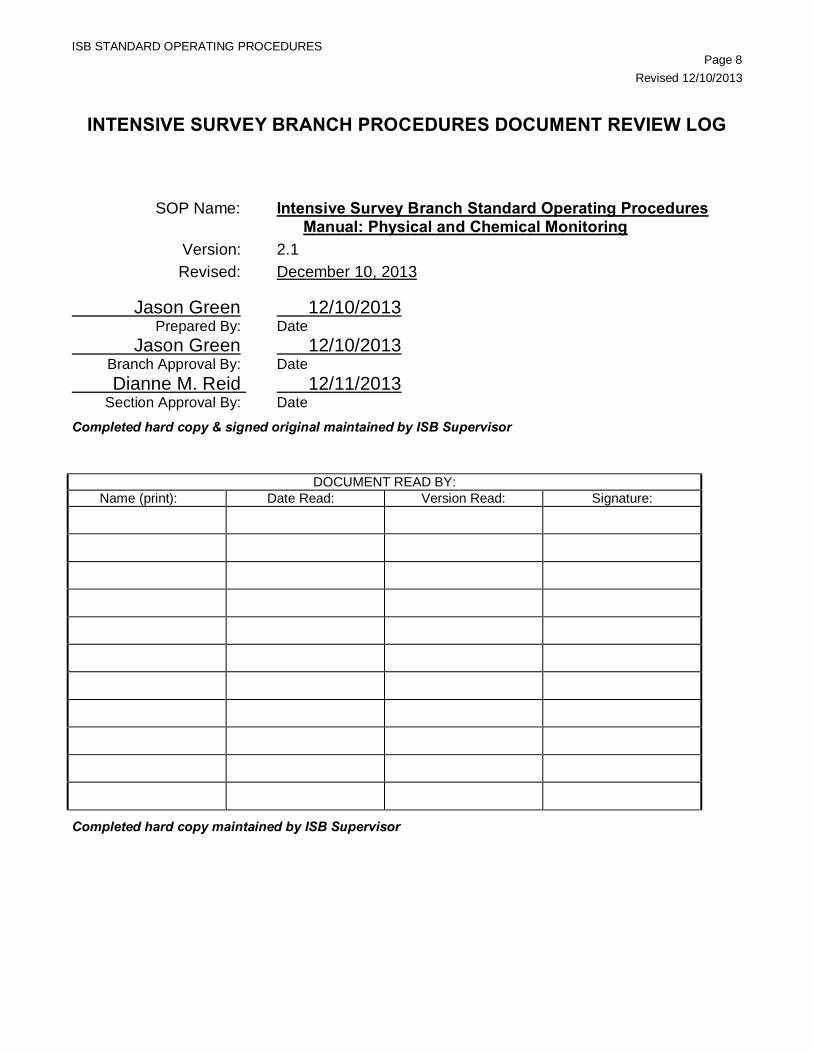
ISB STANDARD OPERATING PROCEDURES Page 8 Revised 12/10/2013
INTENSIVE SURVEY BRANCH PROCEDURES DOCUMENT REVIEW LOG
SOP Name: Intensive Survey Branch Standard Operating Procedures Manual: Physical and Chemical Monitoring
Version: 2.1 Revised: December 10, 2013 Jason Green 12/10/2013 Prepared By: Date Jason Green 12/10/2013 Branch Approval By: Date Dianne M. Reid 12/11/2013 Section Approval By: Date Completed hard copy & signed original maintained by ISB Supervisor
DOCUMENT READ BY: Name (print): Date Read: Version Read: Signature:
Completed hard copy maintained by ISB Supervisor
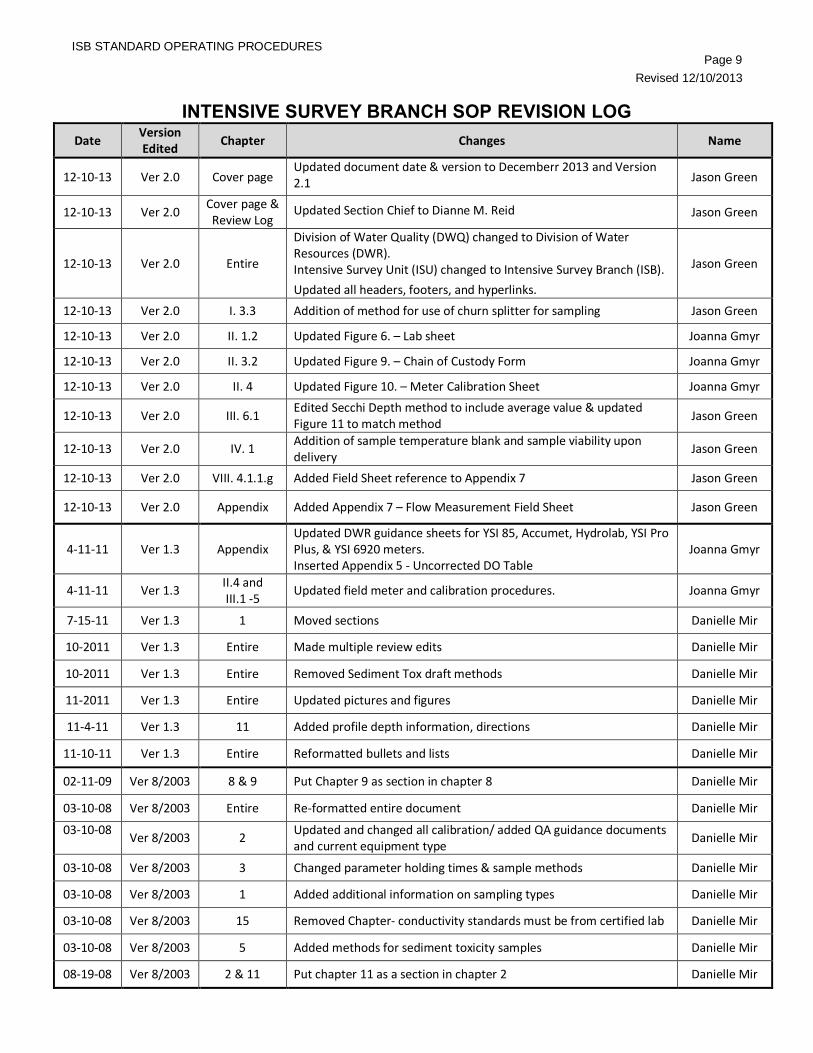
ISB STANDARD OPERATING PROCEDURES Page 9 Revised 12/10/2013
INTENSIVE SURVEY BRANCH SOP REVISION LOG Date Version
Edited Chapter Changes Name
12-10-13 Ver 2.0 Cover page Updated document date & version to Decemberr 2013 and Version 2.1 Jason Green
12-10-13 Ver 2.0 Cover page & Review Log
Updated Section Chief to Dianne M. Reid Jason Green
12-10-13 Ver 2.0 Entire
Division of Water Quality (DWQ) changed to Division of Water Resources (DWR). Intensive Survey Unit (ISU) changed to Intensive Survey Branch (ISB). Updated all headers, footers, and hyperlinks.
Jason Green
12-10-13 Ver 2.0 I. 3.3 Addition of method for use of churn splitter for sampling Jason Green
12-10-13 Ver 2.0 II. 1.2 Updated Figure 6. – Lab sheet Joanna Gmyr
12-10-13 Ver 2.0 II. 3.2 Updated Figure 9. – Chain of Custody Form Joanna Gmyr
12-10-13 Ver 2.0 II. 4 Updated Figure 10. – Meter Calibration Sheet Joanna Gmyr
12-10-13 Ver 2.0 III. 6.1 Edited Secchi Depth method to include average value & updated Figure 11 to match method Jason Green
12-10-13 Ver 2.0 IV. 1 Addition of sample temperature blank and sample viability upon delivery Jason Green
12-10-13 Ver 2.0 VIII. 4.1.1.g Added Field Sheet reference to Appendix 7 Jason Green
12-10-13 Ver 2.0 Appendix Added Appendix 7 – Flow Measurement Field Sheet Jason Green
4-11-11 Ver 1.3 Appendix Updated DWR guidance sheets for YSI 85, Accumet, Hydrolab, YSI Pro Plus, & YSI 6920 meters. Inserted Appendix 5 - Uncorrected DO Table
Joanna Gmyr
4-11-11 Ver 1.3 II.4 and III.1 -5 Updated field meter and calibration procedures. Joanna Gmyr
7-15-11 Ver 1.3 1 Moved sections Danielle Mir
10-2011 Ver 1.3 Entire Made multiple review edits Danielle Mir
10-2011 Ver 1.3 Entire Removed Sediment Tox draft methods Danielle Mir
11-2011 Ver 1.3 Entire Updated pictures and figures Danielle Mir
11-4-11 Ver 1.3 11 Added profile depth information, directions Danielle Mir
11-10-11 Ver 1.3 Entire Reformatted bullets and lists Danielle Mir
02-11-09 Ver 8/2003 8 & 9 Put Chapter 9 as section in chapter 8 Danielle Mir
03-10-08 Ver 8/2003 Entire Re-formatted entire document Danielle Mir
03-10-08 Ver 8/2003 2 Updated and changed all calibration/ added QA guidance documents
and current equipment type Danielle Mir
03-10-08 Ver 8/2003 3 Changed parameter holding times & sample methods Danielle Mir
03-10-08 Ver 8/2003 1 Added additional information on sampling types Danielle Mir
03-10-08 Ver 8/2003 15 Removed Chapter- conductivity standards must be from certified lab Danielle Mir
03-10-08 Ver 8/2003 5 Added methods for sediment toxicity samples Danielle Mir
08-19-08 Ver 8/2003 2 & 11 Put chapter 11 as a section in chapter 2 Danielle Mir
ISB STANDARD OPERATING PROCEDURES Page 10 Revised 12/10/2013
12-10-08 Ver 8/2003 Entire Changed all Figure numbers Danielle Mir
ISB STANDARD OPERATING PROCEDURES Page 11 Revised 12/10/2013
I. CONSIDERATIONS FOR WATER QUALITY SAMPLING
I. CONSIDERATIONS FOR WATER QUALITY SAMPLING
The purpose for collecting water samples is to obtain a representative portion of the material or medium being evaluated. Valid results depend upon:
• Ensuring that the sample obtained is a true representative of the material or medium being evaluated;
• Employing proper sampling, handling, and preservation techniques; • Properly identifying the collected samples and documenting their collection in
permanent field records; • Maintaining sample chain-of-custody procedures, if necessary; • Protecting the collected samples by properly packing and transporting (shipping)
them to the appropriate laboratory for analysis.
1. GENERAL WATER QUALITY SAMPLING CONSIDERATIONS The following factors and procedures shall be considered and/or implemented in planning and conducting all water quality sampling operations. All of these factors and procedures should be considered in view of the specific objectives and scope of each individual field investigation. It is advisable to discuss sampling with the DWR Chemistry Lab during the planning process to verify and coordinate methodologies, analytical capabilities and timing of sample submittal. 1.1. Selection of parameters to be measured
The parameters to be measured are usually dictated by the purpose of an investigation and should be selected based upon required monitoring conditions (NPDES permits for example) or upon the investigator's knowledge of the problem.
1.2. Dissolved and particulate sample fractions A sample is generally composed of dissolved and particulate fractions. When it is necessary to analyze samples for individual fractions, it is necessary to filter the sample in the field (i.e. dissolved phosphorous).
1.3. Required sample volumes The volume of sample obtained should be sufficient to perform all the required analyses with an additional amount collected to provide for any quality control needs such as split samples or repeat examinations. DWR Laboratory sample submitting guidance document can be found at: http://portal.ncdenr.org/c/document_library/get_file?uuid=92a278e5-f75a-4e42-9be5-282ac0216b2a&groupId=38364.
1.4. Sample handling After collection, all samples should be handled as little as possible. All personnel should use extreme care to ensure that samples are not contaminated. If samples are placed in an ice chest, personnel should ensure that the ice does not submerge the sample containers, thereby preventing cross-contamination. This is extremely important, especially if the samples are to be used in an enforcement action. Alternatives that can be used to prevent contamination include the use of frozen water
ISB STANDARD OPERATING PROCEDURES Page 12 Revised 12/10/2013
I. CONSIDERATIONS FOR WATER QUALITY SAMPLING
containers instead of ice or double wrapping the sample containers in trash bags surrounded with ice.
1.5. Special precautions for sampling trace amounts of contaminants Most contaminant compounds are detected in the range of parts per billion or parts per trillion; therefore, extreme care must be taken to prevent contamination of samples. The following precautions shall be taken when trace contaminants are of concern:
1.5.1. When sampling surface waters, the aqueous sample should always be collected prior to any sediment sample collection. Sample collection should always be performed using cleaned equipment and proper collection technique.
1.5.2. Sample collection activities should proceed progressively from the least contaminated area to the most contaminated area (if this fact is known).
1.5.3. When possible, samples should be collected facing upstream to avoid contamination from sampling activities.
1.6. Procedures for identifying potentially hazardous samples. 1.6.1. Samples that are either known or thought to be hazardous should
be identified clearly on both the sample tag and field sample sheet. 1.6.2. Information explaining the hazard, i.e., corrosive, flammable, poison,
etc., shall also be listed. 1.6.3. If a sampling hazard is identified, only continue if a properly trained
staff member is present and if appropriate safety equipment are available.
1.6.4. Follow procedures found on the ESS Fish Kill web page when sampling fish kill events: http://portal.ncdenr.org/web/wq/ess/fishkills
1.7. Collection of auxiliary data All auxiliary data, such as flow measurements, photographs of sampling sites, meteorological conditions, and other observations, shall be entered into field records at the time samples are collected.
1.8. Time records All records of time shall be kept utilizing local time in the military (2400 hour) time format and shall be recorded to the nearest five (5) minutes unless more precise measurements are dictated.
1.9. Transporting and shipping of samples Samples may be hand delivered to the appropriate laboratory, or they may be shipped by common carrier. Chain of custody may be necessary during and after sample collection (Chapter II.3). All personnel must be aware that certain samples could be classified as hazardous materials and as such, could be regulated by the U.S. Department of Transportation under the Transportation Safety Act of l974. These regulations are contained in Title 49, CFR, Parts ll0-ll9 (An example would be concentrated acid, azide, etc.). A copy of these regulations is available online at: http://www.gpoaccess.gov/cfr/index.html.
ISB STANDARD OPERATING PROCEDURES Page 13 Revised 12/10/2013
I. CONSIDERATIONS FOR WATER QUALITY SAMPLING
2. SURFACE WATER SAMPLE SITE SELECTION Selection of a surface water sampling location for water quality studies is based on many factors. These include but are not limited to, study objective, water use, point source discharges, non point source discharges, tributaries, changes in stream characteristics, types of stream bed, stream depth, turbulence, presence of structures (weirs, dams), accessibility, safety concerns, and personnel. When such sampling locations are located in estuarine systems, tidal effects must be considered when determining sampling locations. Before sampling is conducted, a site assessment should be conducted to locate suitable sampling locations. Bridges and piers are normally good choices as they provide ready access and permit water sampling at any point across the width of the water body. When sampling from bridges, samples should be taken from the upstream side; however, this may alter the nature of water flow and cause sediment deposition. Additionally, bridges and piers are not always located in desirable locations with reference to waste sources, tributaries, etc. Wading for water samples is not recommended in lakes, ponds, and slow-moving rivers and streams. However, when wading for sample collections in slow-moving water bodies, it is best to work from downstream stations to upstream sampling points, especially when samples are taken in close proximity. In slow-moving or deep water, a boat is usually required for sample collections and sampling should allow for the possible presence of stratification.
3. SAMPLE COLLECTION TYPES 3.1. Grab sample
A grab sample is a sample collected over a period of time not exceeding 15 minutes. A grab sample is normally associated with water or wastewater sampling. However, soil, sediment, liquid hazardous waste samples, etc., may also be considered grab samples; no particular time limit would apply for the collection of such samples. These samples are used to characterize the medium at a particular point in time; and are generally associated with instantaneous water or wastewater flow data.
3.1.1. Conditions when a grab sample is conducted a. Water or wastewater stream is not continuous (e.g., batch discharges or
intermittent flow); b. Characteristics of the water or waste stream are known to be constant; c. Sample is to be analyzed for parameters whose characteristics are
likely to change significantly with time (i.e., dissolved gases, bacteria, etc.);
d. Sample is to be collected for analysis of a parameter such as oil and grease where the compositing process could significantly affect the observed concentrations;
e. Data on maximum/minimum concentration are desired for a continuous water or wastewater stream;
f. When NPDES permit effluent monitoring specifies grab collections.
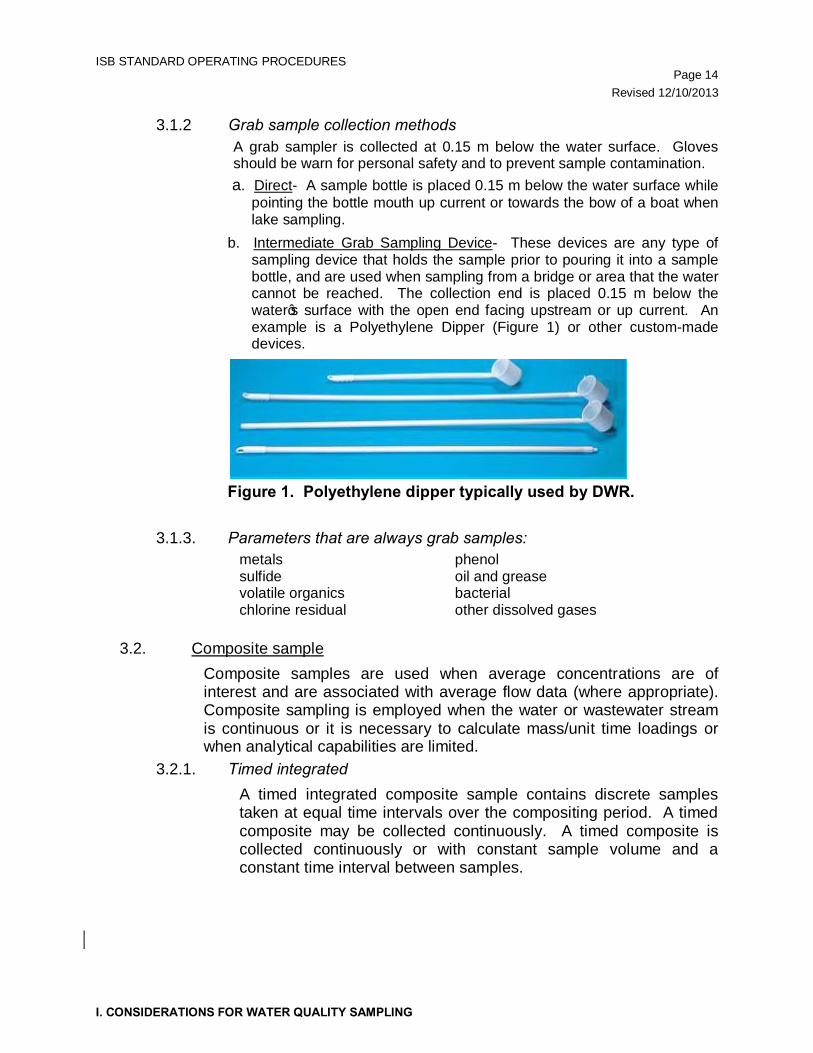
ISB STANDARD OPERATING PROCEDURES Page 14 Revised 12/10/2013
I. CONSIDERATIONS FOR WATER QUALITY SAMPLING
3.1.2 Grab sample collection methods A grab sampler is collected at 0.15 m below the water surface. Gloves should be warn for personal safety and to prevent sample contamination.
a. Direct- A sample bottle is placed 0.15 m below the water surface while pointing the bottle mouth up current or towards the bow of a boat when lake sampling.
b. Intermediate Grab Sampling Device- These devices are any type of sampling device that holds the sample prior to pouring it into a sample bottle, and are used when sampling from a bridge or area that the water cannot be reached. The collection end is placed 0.15 m below the water’s surface with the open end facing upstream or up current. An example is a Polyethylene Dipper (Figure 1) or other custom-made devices.
Figure 1. Polyethylene dipper typically used by DWR.
3.1.3. Parameters that are always grab samples: metals phenol sulfide oil and grease volatile organics bacterial chlorine residual other dissolved gases
3.2. Composite sample Composite samples are used when average concentrations are of interest and are associated with average flow data (where appropriate). Composite sampling is employed when the water or wastewater stream is continuous or it is necessary to calculate mass/unit time loadings or when analytical capabilities are limited.
3.2.1. Timed integrated A timed integrated composite sample contains discrete samples taken at equal time intervals over the compositing period. A timed composite may be collected continuously. A timed composite is collected continuously or with constant sample volume and a constant time interval between samples.
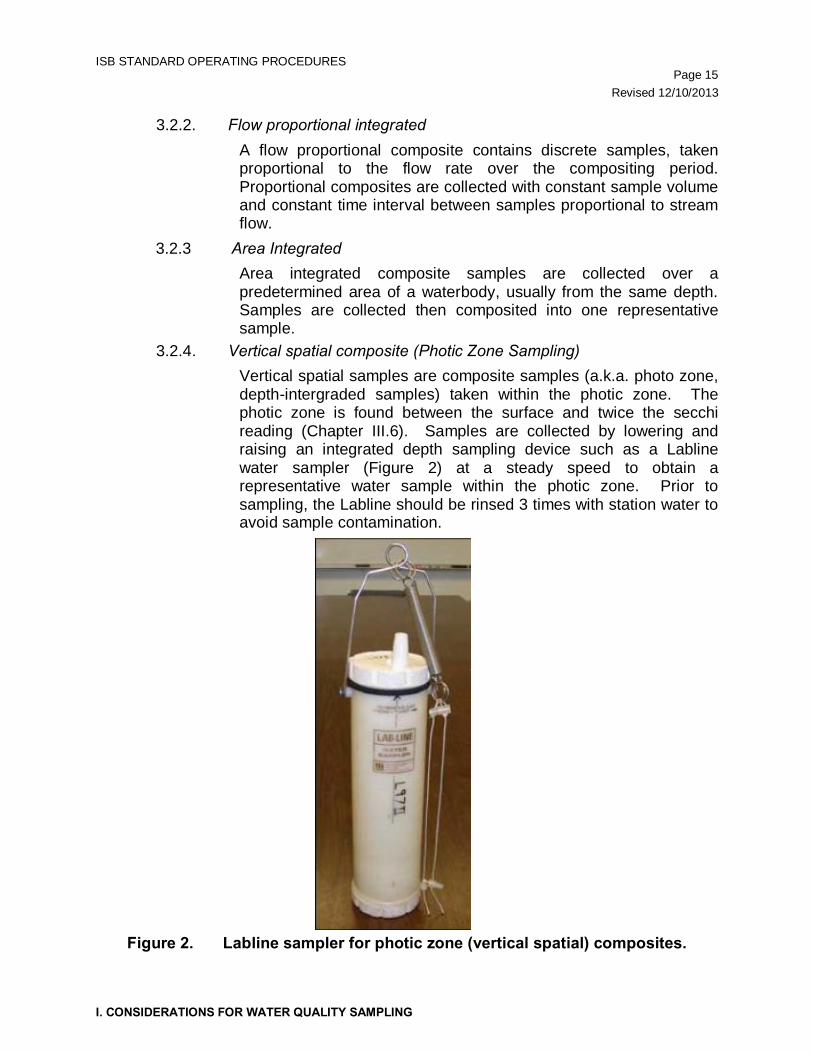
ISB STANDARD OPERATING PROCEDURES Page 15 Revised 12/10/2013
I. CONSIDERATIONS FOR WATER QUALITY SAMPLING
3.2.2. Flow proportional integrated A flow proportional composite contains discrete samples, taken proportional to the flow rate over the compositing period. Proportional composites are collected with constant sample volume and constant time interval between samples proportional to stream flow.
3.2.3 Area Integrated Area integrated composite samples are collected over a predetermined area of a waterbody, usually from the same depth. Samples are collected then composited into one representative sample.
3.2.4. Vertical spatial composite (Photic Zone Sampling) Vertical spatial samples are composite samples (a.k.a. photo zone, depth-intergraded samples) taken within the photic zone. The photic zone is found between the surface and twice the secchi reading (Chapter III.6). Samples are collected by lowering and raising an integrated depth sampling device such as a Labline water sampler (Figure 2) at a steady speed to obtain a representative water sample within the photic zone. Prior to sampling, the Labline should be rinsed 3 times with station water to avoid sample contamination.
Figure 2. Labline sampler for photic zone (vertical spatial) composites.
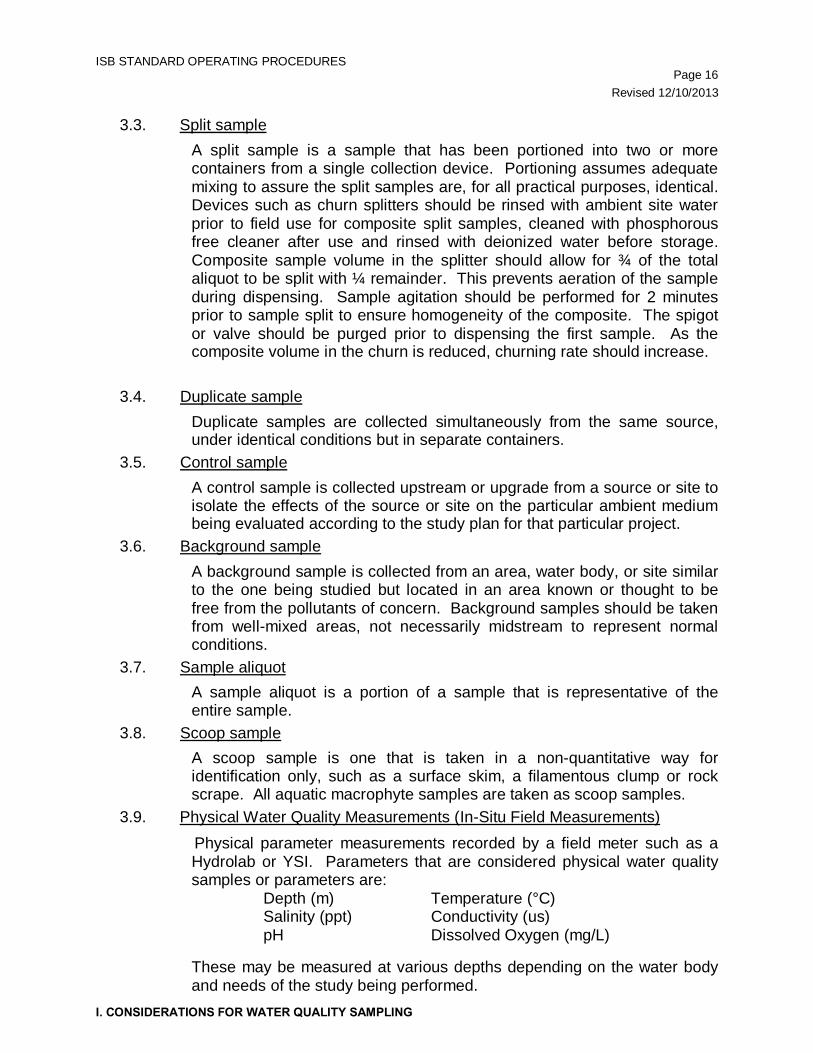
ISB STANDARD OPERATING PROCEDURES Page 16 Revised 12/10/2013
I. CONSIDERATIONS FOR WATER QUALITY SAMPLING
3.3. Split sample A split sample is a sample that has been portioned into two or more containers from a single collection device. Portioning assumes adequate mixing to assure the split samples are, for all practical purposes, identical. Devices such as churn splitters should be rinsed with ambient site water prior to field use for composite split samples, cleaned with phosphorous free cleaner after use and rinsed with deionized water before storage. Composite sample volume in the splitter should allow for ¾ of the total aliquot to be split with ¼ remainder. This prevents aeration of the sample during dispensing. Sample agitation should be performed for 2 minutes prior to sample split to ensure homogeneity of the composite. The spigot or valve should be purged prior to dispensing the first sample. As the composite volume in the churn is reduced, churning rate should increase.
3.4. Duplicate sample
Duplicate samples are collected simultaneously from the same source, under identical conditions but in separate containers.
3.5. Control sample A control sample is collected upstream or upgrade from a source or site to isolate the effects of the source or site on the particular ambient medium being evaluated according to the study plan for that particular project.
3.6. Background sample A background sample is collected from an area, water body, or site similar to the one being studied but located in an area known or thought to be free from the pollutants of concern. Background samples should be taken from well-mixed areas, not necessarily midstream to represent normal conditions.
3.7. Sample aliquot A sample aliquot is a portion of a sample that is representative of the entire sample.
3.8. Scoop sample A scoop sample is one that is taken in a non-quantitative way for identification only, such as a surface skim, a filamentous clump or rock scrape. All aquatic macrophyte samples are taken as scoop samples.
3.9. Physical Water Quality Measurements (In-Situ Field Measurements) Physical parameter measurements recorded by a field meter such as a
Hydrolab or YSI. Parameters that are considered physical water quality samples or parameters are:
Depth (m) Temperature (°C) Salinity (ppt) Conductivity (us) pH Dissolved Oxygen (mg/L)
These may be measured at various depths depending on the water body and needs of the study being performed.
ISB STANDARD OPERATING PROCEDURES Page 17 Revised 12/10/2013
I. CONSIDERATIONS FOR WATER QUALITY SAMPLING
4. AUTOMATIC SAMPLERS The Instrumentation Specialties Company (ISCO) model 2700 (Figure 3) and model 3700 wastewater samplers are portable devices designed to collect up to 24 separate sequential samples or can be programmed for composite sampling. More complex sampling such as multiplexing, storm spaced sampling, interfacing with a variety of equipment such as flow meters, field printers, and lap top computers can also be accomplished with the 3700 model. Both sampler models must be supplied with 12 VDC power from one of four sources: an ISCO AC power pack, an ISCO nickel-cadmium battery pack, an ISCO sealed lead acid battery, or an external 12 V direct current source (such as an automotive or marine battery). Refer to the ISCO 2700 and 3700 instruction manuals for detailed description of operating procedures. It is important to verify the configuration of these samplers prior to placing them in the field (Instrument Specialties Company 1988, 1991).
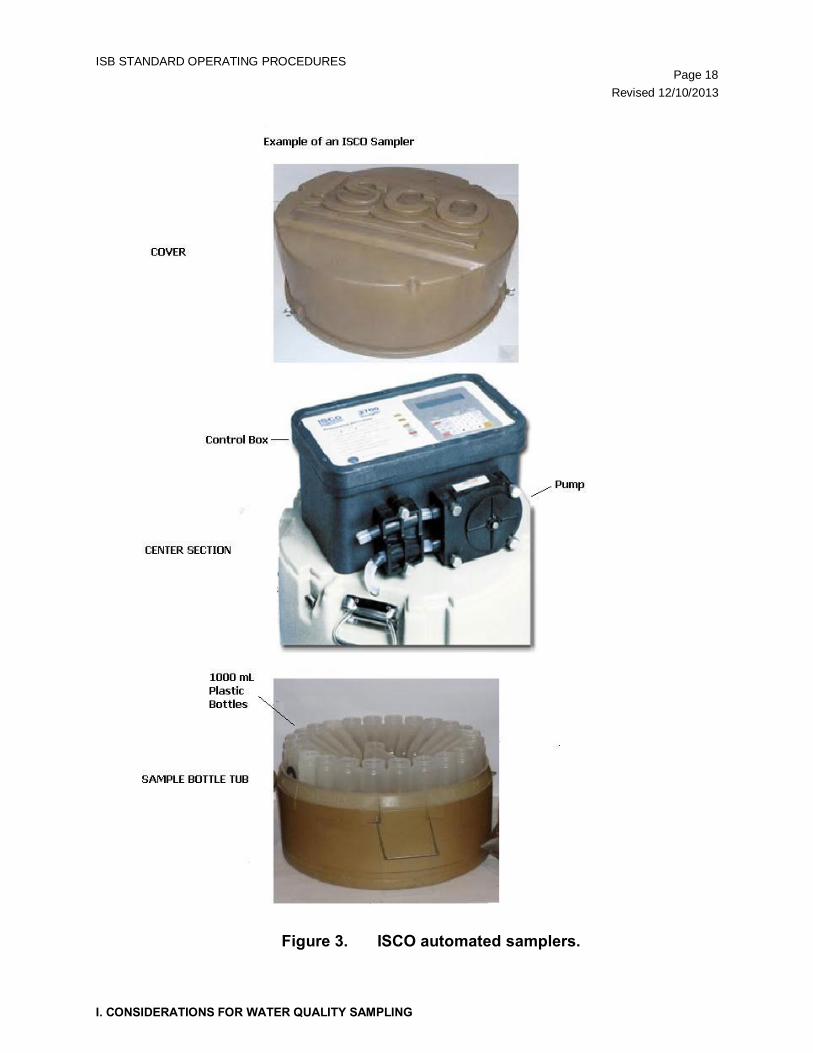
ISB STANDARD OPERATING PROCEDURES Page 18 Revised 12/10/2013
I. CONSIDERATIONS FOR WATER QUALITY SAMPLING
Figure 3. ISCO automated samplers.
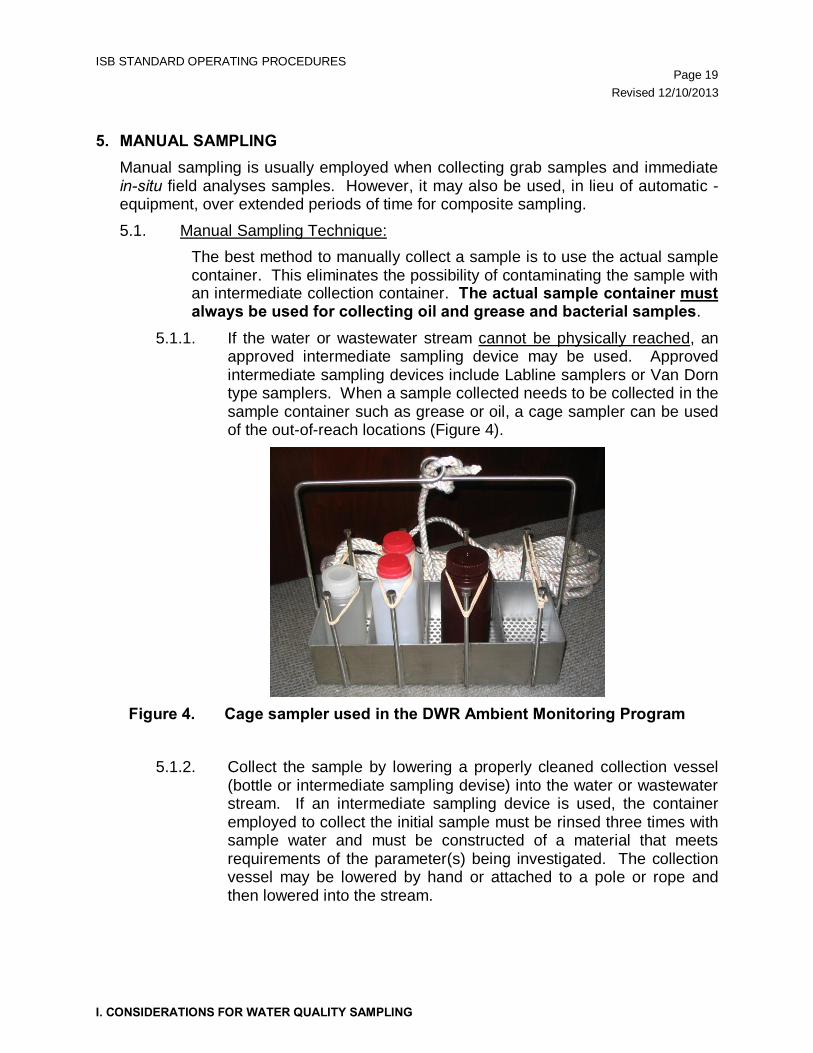
ISB STANDARD OPERATING PROCEDURES Page 19 Revised 12/10/2013
I. CONSIDERATIONS FOR WATER QUALITY SAMPLING
5. MANUAL SAMPLING Manual sampling is usually employed when collecting grab samples and immediate in-situ field analyses samples. However, it may also be used, in lieu of automatic -equipment, over extended periods of time for composite sampling. 5.1. Manual Sampling Technique:
The best method to manually collect a sample is to use the actual sample container. This eliminates the possibility of contaminating the sample with an intermediate collection container. The actual sample container must always be used for collecting oil and grease and bacterial samples.
5.1.1. If the water or wastewater stream cannot be physically reached, an approved intermediate sampling device may be used. Approved intermediate sampling devices include Labline samplers or Van Dorn type samplers. When a sample collected needs to be collected in the sample container such as grease or oil, a cage sampler can be used of the out-of-reach locations (Figure 4).
Figure 4. Cage sampler used in the DWR Ambient Monitoring Program
5.1.2. Collect the sample by lowering a properly cleaned collection vessel
(bottle or intermediate sampling devise) into the water or wastewater stream. If an intermediate sampling device is used, the container employed to collect the initial sample must be rinsed three times with sample water and must be constructed of a material that meets requirements of the parameter(s) being investigated. The collection vessel may be lowered by hand or attached to a pole or rope and then lowered into the stream.
ISB STANDARD OPERATING PROCEDURES Page 20 Revised 12/10/2013
I. CONSIDERATIONS FOR WATER QUALITY SAMPLING
5.1.3. Some types of analyses require the use of a pump when sampling. If a pump is used, it is imperative that it be pre-purged and all components of the pump that come into contact with the liquid be properly cleaned to ensure the integrity of the sample.
5.1.4. Tip the collection container into the water or wastewater stream so that the mouth of the container faces upstream.
5.1.5. Rinse out the container via this procedure at least twice before the sample is collected (exceptions to this rinsing procedure may exist if preservatives are present in the sampling container and for certain analyses such as oil and grease).
6. SPECIAL SAMPLE COLLECTION PROCEDURES 6.1. Priority pollutants
6.1.1. Priority pollutant detection limits are usually in the range of parts per billion, thus extreme care must be exercised to ensure sample integrity.
6.1.2. All containers, composite bottles, tubing, etc., used in priority pollutant sample collection should be cleaned as described in Chapter VI.
6.1.3. When possible, the sample should be collected directly into the appropriate sample container. If the material to be sampled cannot be physically reached, an intermediate collection device may be used. This device should be a Teflon, glass or stainless steel vessel or Teflon tubing via a peristaltic type pump. The device should be cleaned as described in Chapter VI.
6.1.4. When an automatic sampler is employed for priority pollutant collection, the procedures described in Chapter I concerning collection of organic and metal samples with automatic samplers should be used.
6.2. Bacterial sampling Samples for bacterial analysis should always be collected directly into the prepared glass or plastic sample container. Everything possible must be done to avoid contamination through physical contact with the inside of the cap or bottle and mouth of the bottle.
6.2.1. Hold the bottle near the base. 6.2.2. With cap still on, plunge the bottle, neck downward, below the
surface and turn until the neck points slightly upward. The mouth should be directed toward the current.
6.2.3. Uncap the bottle and fill to within one inch of the top without rinsing 6.2.4. Recap immediately while underwater.
ISB STANDARD OPERATING PROCEDURES Page 21 Revised 12/10/2013
I. CONSIDERATIONS FOR WATER QUALITY SAMPLING
6.3. Immiscible liquids/oil and grease Oil and grease may be present in wastewater as a surface film, an emulsion, a solution, or as a combination of these forms. The designated sample container must always be used for collecting oil and grease samples. As it is very difficult to collect a representative oil and grease sample, the inspector must carefully evaluate the location of the sampling point. The most desirable sampling location is the point where greatest mixing occurs. Quiescent areas should be avoided. Because losses of oil and grease will occur onto the sampling equipment, the collection of a composite sample is impractical. Individual portions collected at prescribed time intervals must be analyzed separately to obtain the average concentrations over an extended period.
6.4. Volatile Organics Analyses (VOA) Samples to be analyzed for volatile organics should be stored in the appropriate vials to prevent contamination and loss of sample. To verify proper sample container requirements, consult the DWR Chemistry Laboratory website (http://portal.ncdenr.org/web/wq/lab/staffinfo). The current methodology calls for 40 ml screw cap septum vials with a Teflon-silicone disk in the cap. The disks should be placed in the caps (Teflon side down) in the laboratory prior to the initiation of the sampling activities. Extra disks should be carried during field sampling in case of loss of the disks previously placed in the caps. When there is no chlorine present in the sampled waterbody a 40ml VOA vial pre-preserved with 1:1 HCL by the Central Laboratory should be used for collection. A VOA sample should be preserved with ascorbic acid and 1:1 HCL whenever there is chlorine present or if it is not known if chlorine is present. Chapter 4 section 3.3.2 describes collection method used.
7. WASTEWATER SAMPLING 7.1 General considerations
Important procedures for obtaining a representative wastewater sample include: a. Collecting the sample at a location where the wastewater is mixed.
Therefore, the sample should be collected near the center of the flow channel, at a depth between 0.4 - 0.6 m total depth, where the turbulence is at a maximum and the possibility of solids settling is minimized. Skimming the water surface or dragging the channel bottom should be avoided.
b. Doing cross-sectional sampling when sampling from wide conduits or within a mixing zone. Dye may be used as an aid in determining the most representative sampling point(s).
c. If manually compositing a sample, thoroughly mix individual samples before pouring the individual aliquots into the composite container.
ISB STANDARD OPERATING PROCEDURES Page 22 Revised 12/10/2013
I. CONSIDERATIONS FOR WATER QUALITY SAMPLING
7.1.1. Site selection Where applicable, wastewater samples should be collected at the location specified in the NPDES permit.
a. Influent - Influent wastewaters are preferably sampled at points of highly turbulent flow in order to ensure adequate mixing.
b. Effluent - Effluent samples should be collected at the site specified in the permit, or if no site is specified, below all treatment units including post aeration.
c. Pond and lagoon sampling - Generally, composite samples should be employed for the collection of wastewater samples from ponds and lagoons. Even if the ponds and lagoons have a long retention time, composite sampling is necessary because of the tendency of ponds and lagoons to short circuit. However, if dye studies or past experience indicate a homogenous discharge, a grab sample may be taken as representative of the waste stream; but in all cases, sampling should be consistent with permit requirements.
7.1.2 Sampling techniques All techniques are covered in Section IV ISB Standard Operating Procedures and in the NPDES Compliance Sampling Inspection Manual. http://www.epa.gov/compliance/resources/publications/monitoring/cwa/inspections/npdesinspect/npdesmanual.html
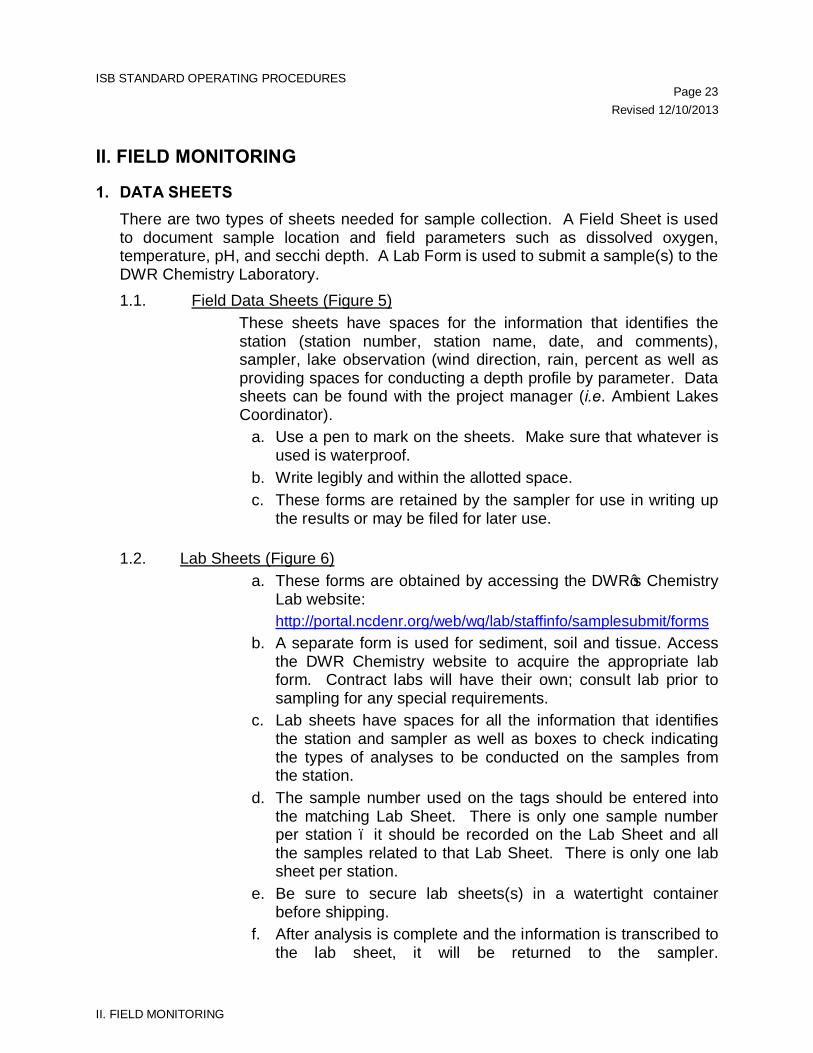
ISB STANDARD OPERATING PROCEDURES Page 23 Revised 12/10/2013
II. FIELD MONITORING
II. FIELD MONITORING
1. DATA SHEETS There are two types of sheets needed for sample collection. A Field Sheet is used to document sample location and field parameters such as dissolved oxygen, temperature, pH, and secchi depth. A Lab Form is used to submit a sample(s) to the DWR Chemistry Laboratory. 1.1. Field Data Sheets (Figure 5)
These sheets have spaces for the information that identifies the station (station number, station name, date, and comments), sampler, lake observation (wind direction, rain, percent as well as providing spaces for conducting a depth profile by parameter. Data sheets can be found with the project manager (i.e. Ambient Lakes Coordinator).
a. Use a pen to mark on the sheets. Make sure that whatever is used is waterproof.
b. Write legibly and within the allotted space. c. These forms are retained by the sampler for use in writing up
the results or may be filed for later use.
1.2. Lab Sheets (Figure 6) a. These forms are obtained by accessing the DWR’s Chemistry
Lab website: http://portal.ncdenr.org/web/wq/lab/staffinfo/samplesubmit/forms b. A separate form is used for sediment, soil and tissue. Access
the DWR Chemistry website to acquire the appropriate lab form. Contract labs will have their own; consult lab prior to sampling for any special requirements.
c. Lab sheets have spaces for all the information that identifies the station and sampler as well as boxes to check indicating the types of analyses to be conducted on the samples from the station.
d. The sample number used on the tags should be entered into the matching Lab Sheet. There is only one sample number per station – it should be recorded on the Lab Sheet and all the samples related to that Lab Sheet. There is only one lab sheet per station.
e. Be sure to secure lab sheets(s) in a watertight container before shipping.
f. After analysis is complete and the information is transcribed to the lab sheet, it will be returned to the sampler.
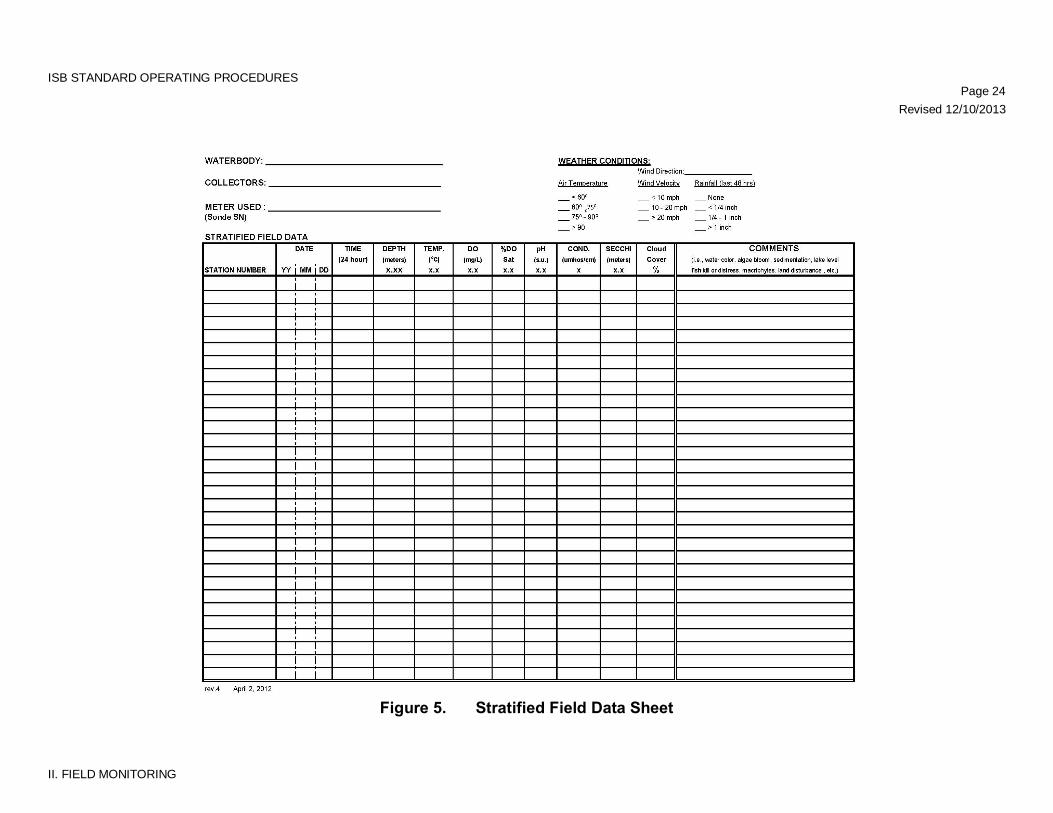
ISB STANDARD OPERATING PROCEDURES Page 24 Revised 12/10/2013
II. FIELD MONITORING
Figure 5. Stratified Field Data Sheet
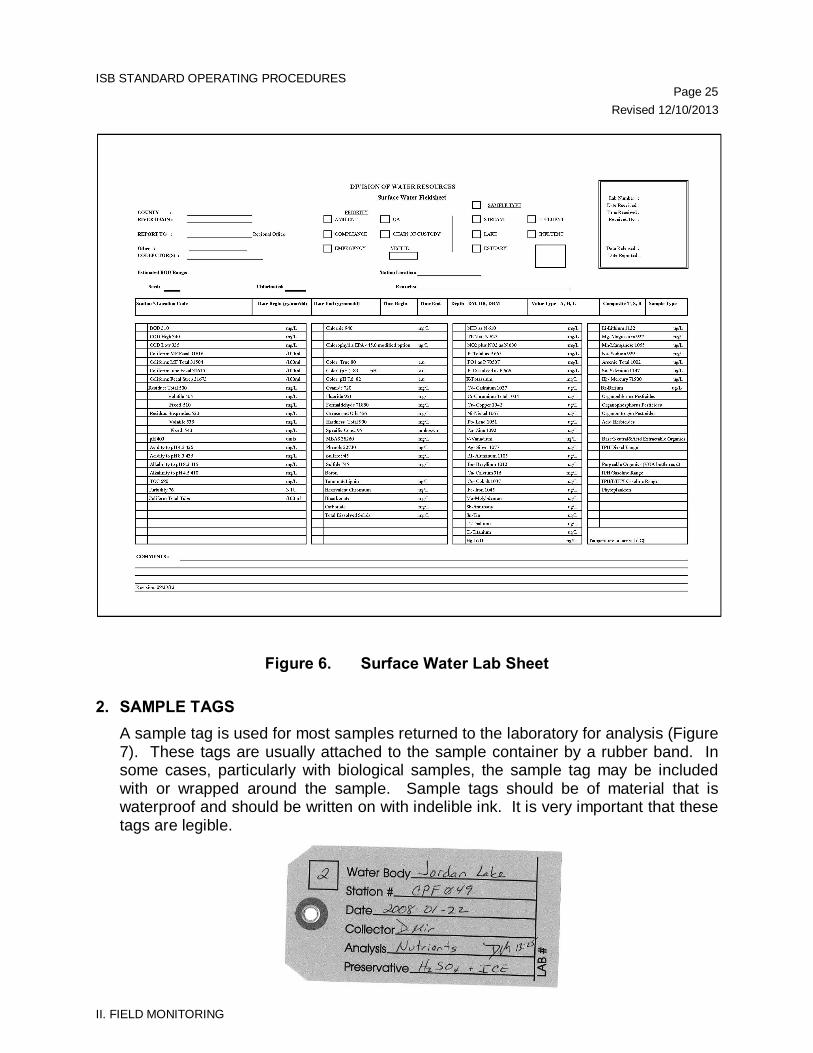
ISB STANDARD OPERATING PROCEDURES Page 25 Revised 12/10/2013
II. FIELD MONITORING
Figure 6. Surface Water Lab Sheet
2. SAMPLE TAGS A sample tag is used for most samples returned to the laboratory for analysis (Figure 7). These tags are usually attached to the sample container by a rubber band. In some cases, particularly with biological samples, the sample tag may be included with or wrapped around the sample. Sample tags should be of material that is waterproof and should be written on with indelible ink. It is very important that these tags are legible.
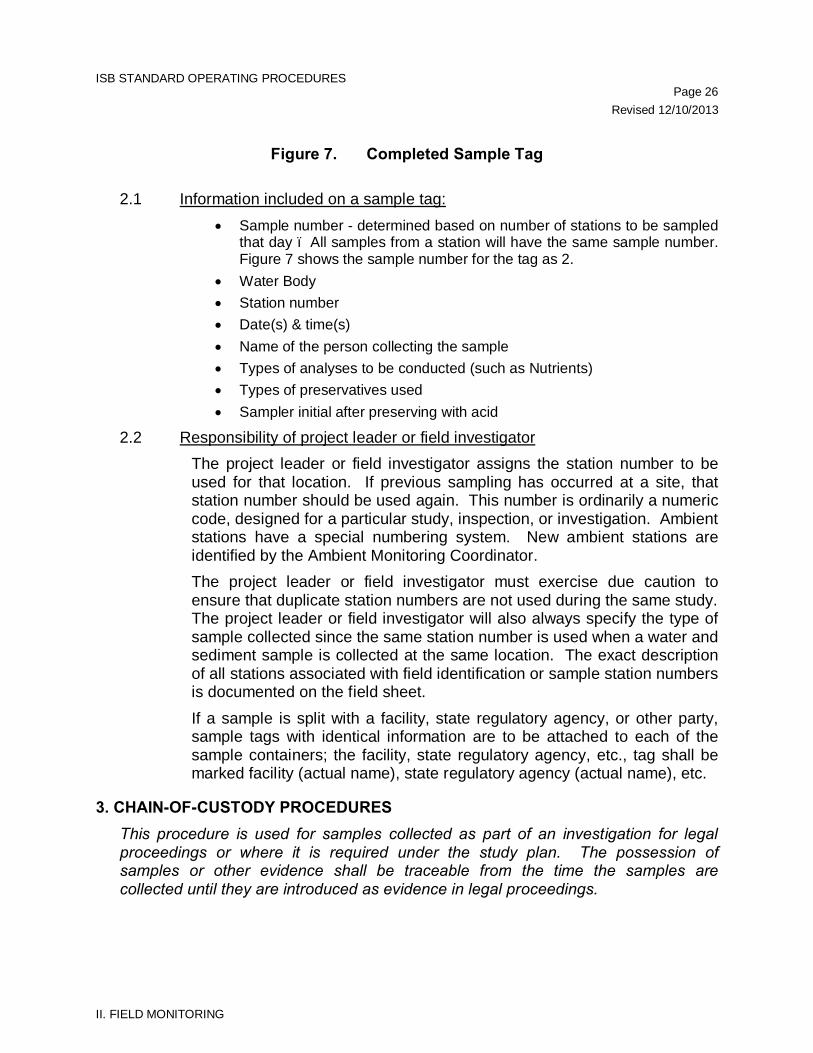
ISB STANDARD OPERATING PROCEDURES Page 26 Revised 12/10/2013
II. FIELD MONITORING
Figure 7. Completed Sample Tag
2.1 Information included on a sample tag:
• Sample number - determined based on number of stations to be sampled that day – All samples from a station will have the same sample number. Figure 7 shows the sample number for the tag as 2.
• Water Body • Station number • Date(s) & time(s) • Name of the person collecting the sample • Types of analyses to be conducted (such as Nutrients) • Types of preservatives used • Sampler initial after preserving with acid
2.2 Responsibility of project leader or field investigator The project leader or field investigator assigns the station number to be used for that location. If previous sampling has occurred at a site, that station number should be used again. This number is ordinarily a numeric code, designed for a particular study, inspection, or investigation. Ambient stations have a special numbering system. New ambient stations are identified by the Ambient Monitoring Coordinator. The project leader or field investigator must exercise due caution to ensure that duplicate station numbers are not used during the same study. The project leader or field investigator will also always specify the type of sample collected since the same station number is used when a water and sediment sample is collected at the same location. The exact description of all stations associated with field identification or sample station numbers is documented on the field sheet. If a sample is split with a facility, state regulatory agency, or other party, sample tags with identical information are to be attached to each of the sample containers; the facility, state regulatory agency, etc., tag shall be marked facility (actual name), state regulatory agency (actual name), etc.
3. CHAIN-OF-CUSTODY PROCEDURES This procedure is used for samples collected as part of an investigation for legal proceedings or where it is required under the study plan. The possession of samples or other evidence shall be traceable from the time the samples are collected until they are introduced as evidence in legal proceedings.
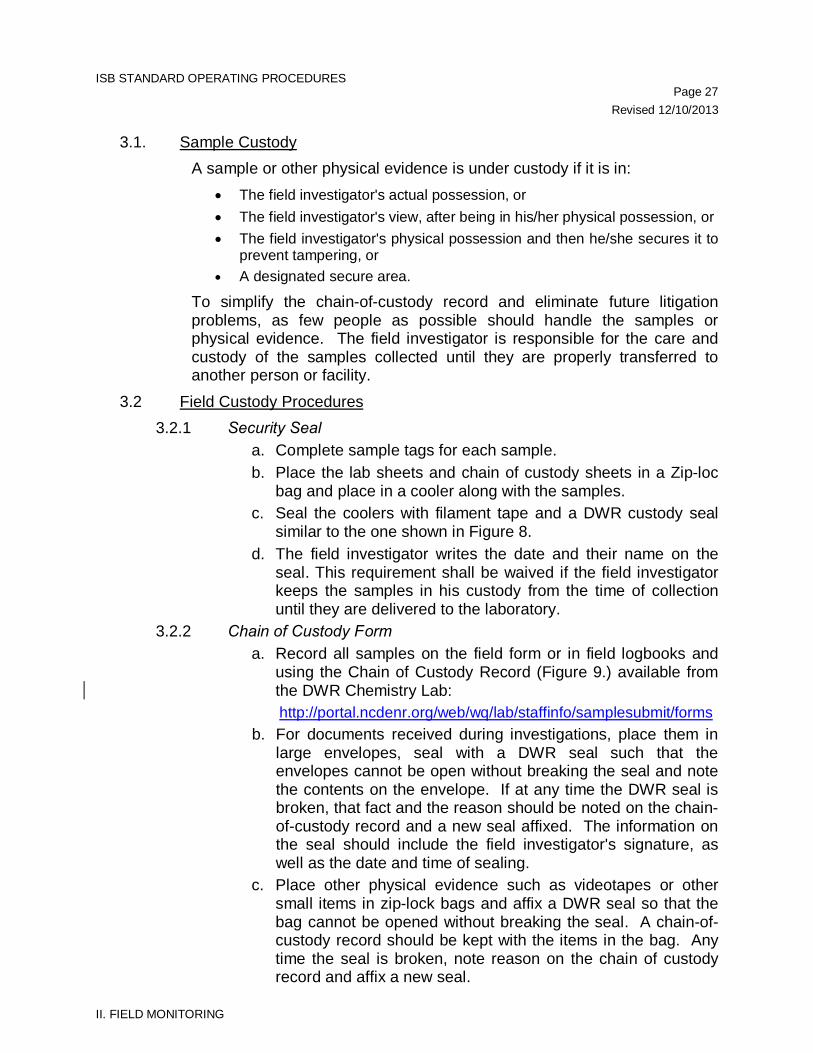
ISB STANDARD OPERATING PROCEDURES Page 27 Revised 12/10/2013
II. FIELD MONITORING
3.1. Sample Custody A sample or other physical evidence is under custody if it is in:
• The field investigator's actual possession, or • The field investigator's view, after being in his/her physical possession, or • The field investigator's physical possession and then he/she secures it to
prevent tampering, or • A designated secure area.
To simplify the chain-of-custody record and eliminate future litigation problems, as few people as possible should handle the samples or physical evidence. The field investigator is responsible for the care and custody of the samples collected until they are properly transferred to another person or facility.
3.2 Field Custody Procedures 3.2.1 Security Seal
a. Complete sample tags for each sample. b. Place the lab sheets and chain of custody sheets in a Zip-loc
bag and place in a cooler along with the samples. c. Seal the coolers with filament tape and a DWR custody seal
similar to the one shown in Figure 8. d. The field investigator writes the date and their name on the
seal. This requirement shall be waived if the field investigator keeps the samples in his custody from the time of collection until they are delivered to the laboratory.
3.2.2 Chain of Custody Form a. Record all samples on the field form or in field logbooks and
using the Chain of Custody Record (Figure 9.) available from the DWR Chemistry Lab: http://portal.ncdenr.org/web/wq/lab/staffinfo/samplesubmit/forms
b. For documents received during investigations, place them in large envelopes, seal with a DWR seal such that the envelopes cannot be open without breaking the seal and note the contents on the envelope. If at any time the DWR seal is broken, that fact and the reason should be noted on the chain-of-custody record and a new seal affixed. The information on the seal should include the field investigator's signature, as well as the date and time of sealing.
c. Place other physical evidence such as videotapes or other small items in zip-lock bags and affix a DWR seal so that the bag cannot be opened without breaking the seal. A chain-of-custody record should be kept with the items in the bag. Any time the seal is broken, note reason on the chain of custody record and affix a new seal.
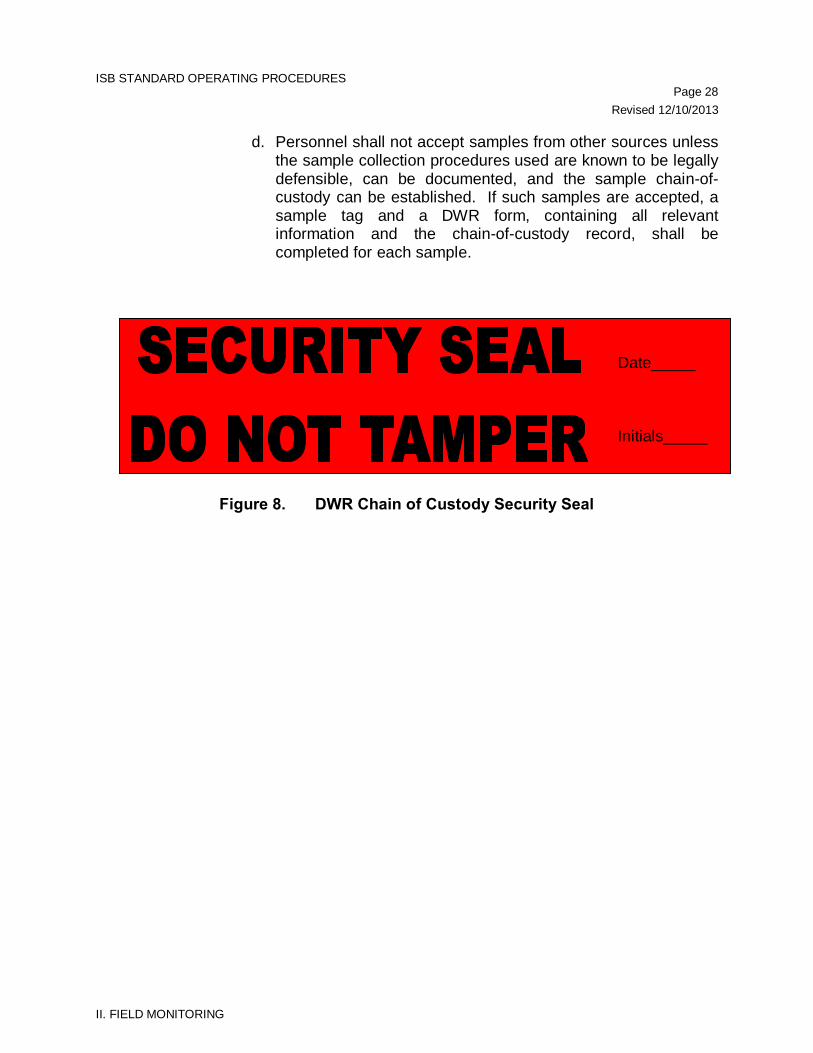
ISB STANDARD OPERATING PROCEDURES Page 28 Revised 12/10/2013
II. FIELD MONITORING
d. Personnel shall not accept samples from other sources unless the sample collection procedures used are known to be legally defensible, can be documented, and the sample chain-of-custody can be established. If such samples are accepted, a sample tag and a DWR form, containing all relevant information and the chain-of-custody record, shall be completed for each sample.
Figure 8. DWR Chain of Custody Security Seal
Date_____ Initials______
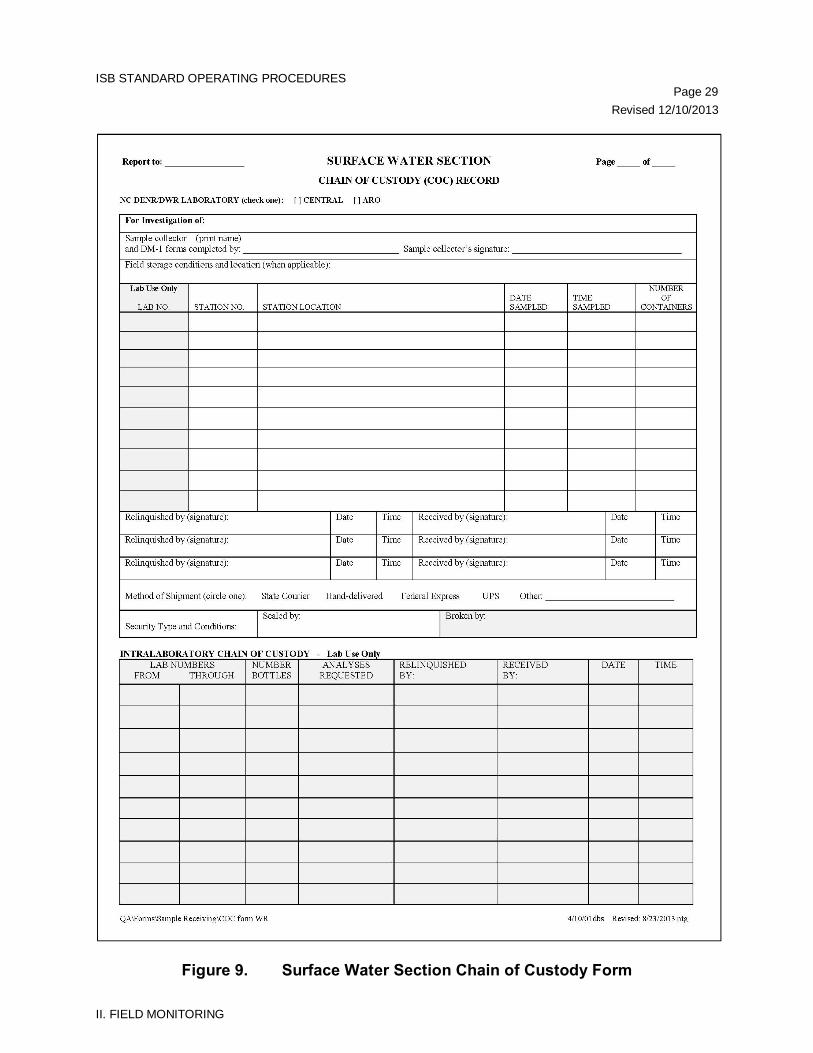
ISB STANDARD OPERATING PROCEDURES Page 29 Revised 12/10/2013
II. FIELD MONITORING
Figure 9. Surface Water Section Chain of Custody Form
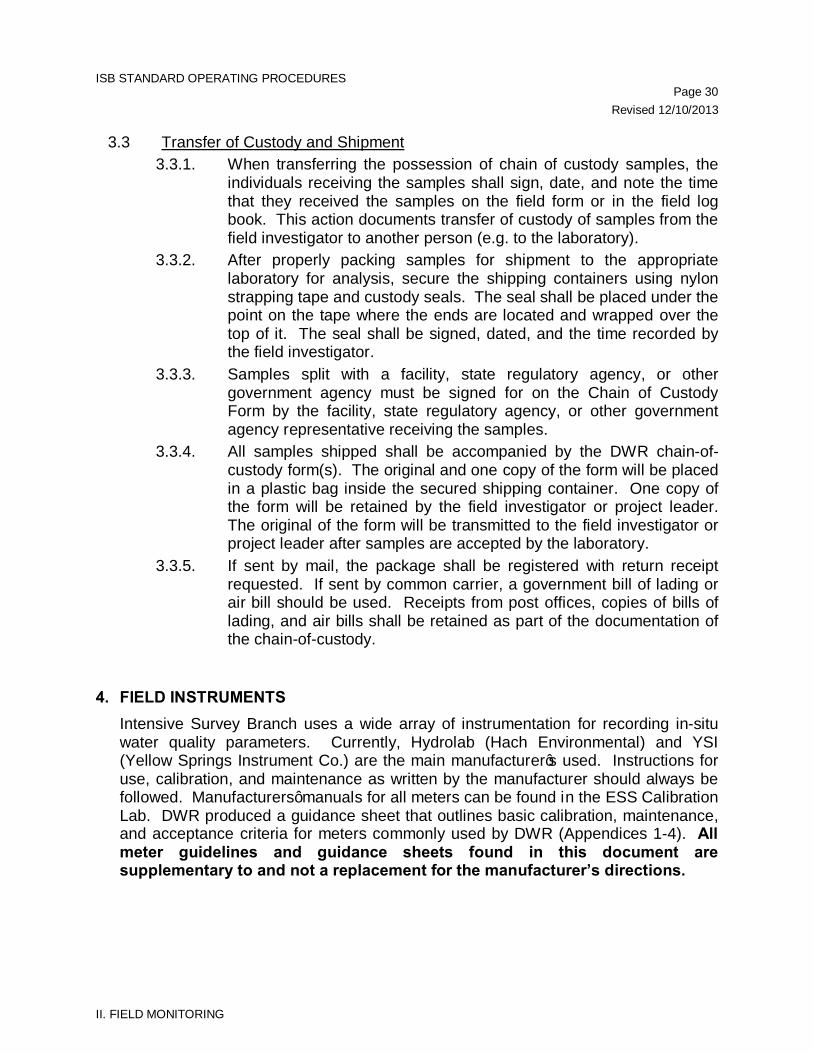
ISB STANDARD OPERATING PROCEDURES Page 30 Revised 12/10/2013
II. FIELD MONITORING
3.3 Transfer of Custody and Shipment 3.3.1. When transferring the possession of chain of custody samples, the
individuals receiving the samples shall sign, date, and note the time that they received the samples on the field form or in the field log book. This action documents transfer of custody of samples from the field investigator to another person (e.g. to the laboratory).
3.3.2. After properly packing samples for shipment to the appropriate laboratory for analysis, secure the shipping containers using nylon strapping tape and custody seals. The seal shall be placed under the point on the tape where the ends are located and wrapped over the top of it. The seal shall be signed, dated, and the time recorded by the field investigator.
3.3.3. Samples split with a facility, state regulatory agency, or other government agency must be signed for on the Chain of Custody Form by the facility, state regulatory agency, or other government agency representative receiving the samples.
3.3.4. All samples shipped shall be accompanied by the DWR chain-of-custody form(s). The original and one copy of the form will be placed in a plastic bag inside the secured shipping container. One copy of the form will be retained by the field investigator or project leader. The original of the form will be transmitted to the field investigator or project leader after samples are accepted by the laboratory.
3.3.5. If sent by mail, the package shall be registered with return receipt requested. If sent by common carrier, a government bill of lading or air bill should be used. Receipts from post offices, copies of bills of lading, and air bills shall be retained as part of the documentation of the chain-of-custody.
4. FIELD INSTRUMENTS Intensive Survey Branch uses a wide array of instrumentation for recording in-situ water quality parameters. Currently, Hydrolab (Hach Environmental) and YSI (Yellow Springs Instrument Co.) are the main manufacturer’s used. Instructions for use, calibration, and maintenance as written by the manufacturer should always be followed. Manufacturers’ manuals for all meters can be found in the ESS Calibration Lab. DWR produced a guidance sheet that outlines basic calibration, maintenance, and acceptance criteria for meters commonly used by DWR (Appendices 1-4). All meter guidelines and guidance sheets found in this document are supplementary to and not a replacement for the manufacturer’s directions.
ISB STANDARD OPERATING PROCEDURES Page 31 Revised 12/10/2013
II. FIELD MONITORING
4.1. All field meters should be calibrated before and checked after sampling activities daily. Calibration data should be documented on a Water Quality Monitoring Field Meter Calibration Sheet (Figure 10).
4.2 In-situ field parameter measurements
4.2.1. Parameters typically measured: a. Conductivity (μS/cm @ 25 °C) b. Dissolved Oxygen (DO- mg/L) c. pH (Standard Units) d. Temperature (°C) e. Light Attenuation (μE/m2/s)
Additional Calibrations and Use of multiparameter Meters
4.2.2. Battery Voltage a. Use the correct battery source for the particular instrument in
use. b. Battery voltage must be in an acceptable range before
calibrating and using the meter (see respective manual). c. Record both initial and terminal battery voltage on the Meter
Calibration sheet (Figure 10). 4.2.3. Depth
a. Some meters can be calibrated to read depth by entering the number zero on the keypad while the sonde sensors are at the surface during field measurements.
b. Record all field depth measurements to the nearest tenth of a meter (if needed).
4.3 Calibrated Backup Field Meters Although meters are maintained, failure can occur at anytime. Calibrated backup meters, meter manuals, batteries and calibration buffers/ standards are required during sampling. Inability to collect data due to a meter failure is unacceptable. See Appendices 1 – 4 for detailed guidance on using, maintaining, and storage field meters commonly used by DWR.
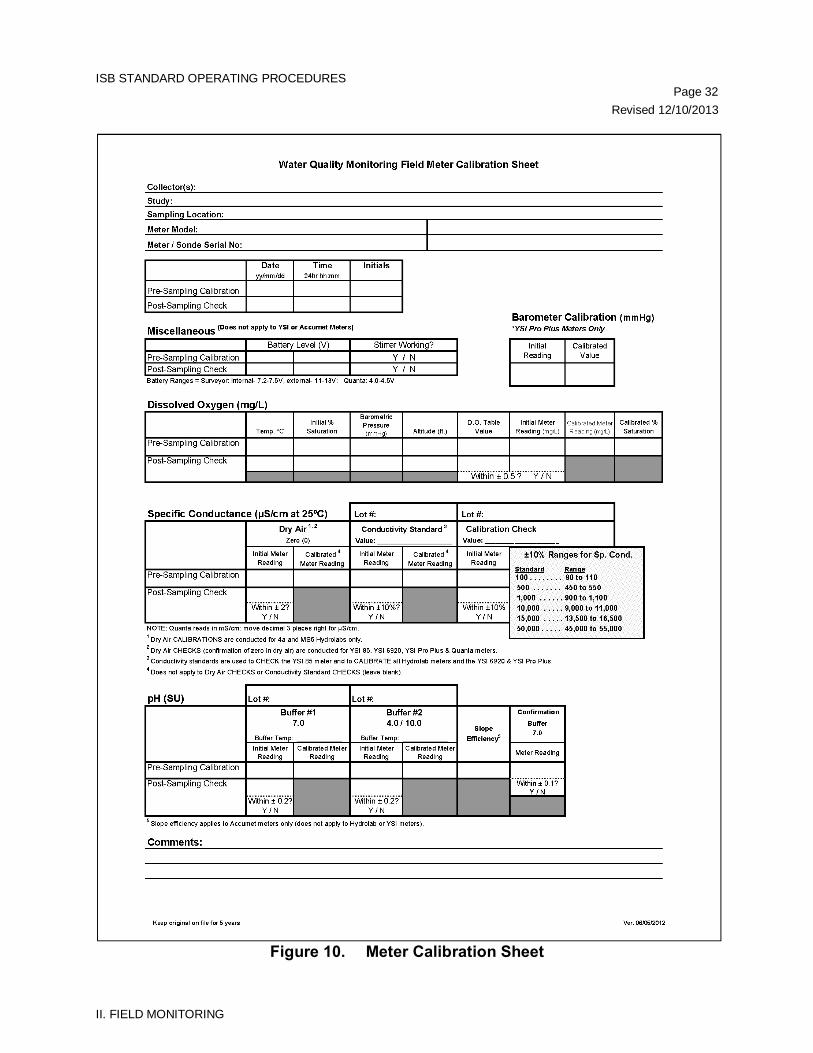
ISB STANDARD OPERATING PROCEDURES Page 32 Revised 12/10/2013
II. FIELD MONITORING
Figure 10. Meter Calibration Sheet
ISB STANDARD OPERATING PROCEDURES Page 33 Revised 12/10/2013
III. FIELD PARAMETER MEASUREMENTS
III. FIELD PARAMETER MEASUREMENTS
1. WATER TEMPERATURE Temperature measurements are taken by a multiparameter meter (Hydrolab or YSI) or dial Celsius-thermometer or a thermister. Below are some general considerations while collecting water temperature data.
• The meter should have a scale marked for every 0.1°C. • Make readings with the mulitparameter meter or thermometer in water long
enough to permit equilibrium. • Temperature sensors on the Hydrolab and YSI meters are factory set and do
not require recalibration. • At least once a year check the meter thermometer against a precision
thermometer certified by the National Institute of Standards and Technology (NIST).
• Temperature readings must be record as degrees Centigrade (°C) to the nearest tenth of a degree. During field use, the temperature readings should always be read when they are stable and before the other parameters are read to ensure stable readings for all parameters.
2. AIR TEMPERATURE Refer to previous procedure, except measure the ambient air temperature above the water surface to be sampled. Do not use immersion thermometers to measure air temperature.
3. DISSOLVED OXYGEN Dissolved oxygen analysis measures the amount of gaseous oxygen dissolved in an aqueous solution. Dissolved oxygen may be measured by electrometric methods (e.g. Hydrolab or YSI) or by chemical methods (Winkler Method). Testing must be done immediately at the sampling location, as a grab sample, which is why electrometric methods are favored. See Appendices 1 – 4 for detailed guidance on using, maintaining, and storage of meters and probes commonly used by DWR. This SOP and the attached meter guidance sheets are supplementary to and not a replacement for the manufacturer’s instructions manual. Manufacturer’s operations manuals for all meters are kept in the ESS Calibration Lab.
ISB STANDARD OPERATING PROCEDURES Page 34 Revised 12/10/2013
III. FIELD PARAMETER MEASUREMENTS
3.1 Electrometric Method Calibration All field meters should be calibrated before and checked after sampling activities (at least daily). The calibration data should be entered on a meter calibration sheet (Figure 10). Detailed guidance for calibrating dissolved oxygen is provided in Appendices 1 – 4.
3.1.1 Acceptance Criteria For DO calibration • Calibrated meters should be compared to the DO table to ensure
calibration was done correctly. • Appendix 5 describes the calculations needed to correct for
elevation and a table used at sea-level. • Dissolved oxygen concentrations need to be calibrated within
0.5mg/L of the elevation corrected table concentration for a given temperature.
3.2. Winkler Method - azide modification (Standard Methods, 18th edition)
The azide modification effectively removes interference caused by nitrite, which is the most common interference in biologically treated effluents and incubated BOD samples. The azide modification is not applicable under the following conditions:
• Samples containing sulfite, thiosulfate, polythionate, appreciable quantities of free chlorine or hypochlorite;
• Samples high in suspended solids; • Samples containing organic substances which are readily
oxidized in a highly alkaline solution or which are oxidized by free iodine in an acid solution;
• Untreated domestic sewage; • Biological flocs; • Where sample color interferes with endpoint detection.
In instances where the azide modification is not applicable, electrometric methods should be employed. Below are some general considerations while collecting dissolved oxygen data using the Winkler Method:
• Collect surface water samples in narrow-mouth glass-stoppered BOD bottles of 300 ml capacity with tapered and pointed ground-glass stoppers and flared mouths. Once analysis is complete and the information is transcribed to the lab sheet, it will be returned to the sampler.
• Avoid entrapping or dissolving atmospheric oxygen. Do not allow the sample to remain in contact with air or be agitated, because either condition may result in a change to its gaseous content.
ISB STANDARD OPERATING PROCEDURES Page 35 Revised 12/10/2013
III. FIELD PARAMETER MEASUREMENTS
• Where samples are collected from shallow depths (less than 5 feet) use of an APHA-type sampler is recommended. Use of a Kemmerer type sampler is recommended for samples from depths greater than 5 feet. Bleed sample from bottom of samplers through a tube extending to the bottom of a BOD bottle. Fill bottle to overflowing.
• Record sample temperature to nearest degree Celsius or more precisely.
• Reagents - Manganous sulfate solution - Alkaline iodide-sodium azide solution. - Sulfuric acid (H2SO4) concentration - Sodium thiosulfate solution 0.025 N - Starch solution
• Analysis Steps: 1. Add 2 mL of manganous sulfate solution to sample
container by holding the tip of the pipette below the surface of the liquid.
2. Add 2 mL of alkaline iodide-sodium azide solution by holding the tip of the pipette below the surface of the liquid.
3. Replace BOD bottle stopper, avoid trapping air bubbles, and shake well by inversion.
4. When the precipitate settles, leaving a clear supernatant above the manganese hydroxide floc, shake again.
5. Allow floc to settle again, at least 200 mL of clear supernate should be above the floc.
6. Remove the stopper and add 2 mL of concentrated sulfuric acid by holding the pipette above the surface of the liquid and allowing the acid to run down the neck of the bottle, re-stopper, and mix by inversion until no floc is visible.
7. Withdraw 203 mL of the solution into an Erlenmeyer flask. 8. Titrate with 0.025 N sodium thiosulfate solution to a pale
straw color. 9. Add 1 mL of starch solution and continue titration to the
first disappearance of blue color. 10. Record the # of mL of thiosulfate used; where 1 mL
thiosulfate = 1 mg/L DO.
ISB STANDARD OPERATING PROCEDURES Page 36 Revised 12/10/2013
III. FIELD PARAMETER MEASUREMENTS
4. pH (ELECTROMETRIC METHOD) 4.1. Information on pH
4.1.1. Precision and accuracy: ±0.2 pH unit represents the limit of accuracy under normal conditions for measurements of water and poorly buffered solutions. For this reason, report pH values to the nearest 0.1 pH unit. Calibrate instrument within 0.2 pH units of the standard pH buffer value.
4.1.2. Calibration Reagents - Calibrate the electrode system against standard buffer solutions of known pH. Always use fresh commercially made buffers to calibrate field meters. Buffer solution and samples should be stored in polyethylene bottles. Never pour decanted or used buffer solution back into the original bottle.
4.1.3 Procedure - Always follow the manufacturer's instructions for pH meter storage and preparation of electrodes. Recommended short-term storage of electrodes varies with type of electrode and manufacturer. See Appendices 1 – 4 for detailed guidance on using, maintaining, and storage of pH meters and probes commonly used by ISB. Never store probes in DI water; tap water or pH buffer 4.0 is preferred.
Note: All field meters should be calibrated before and checked after sampling activities daily. The calibration data should be entered on a meter calibration sheet (Figure 10).
4.2. Multiparameter YSI or Hydrolab Meters The Hydrolab and YSI meters used by ISB all have the same basic method for calibration. A training outline for each meter used by ISB is listed in Appendices 1 - 4. Copies of the manufacturer’s instruction manual are located in the ISB calibration room.
4.3. Accumet AP Series (Fisher Scientific) Handheld pH Meters
The Accumet handheld pH meter is a stand-alone pH meter (it does not measure any other parameters beyond pH). See Appendix 2 for detailed guidance on using, maintaining, and storage of the Accumet AP61 pH meter which is typically used in conjunction with the YSI 85 meter. A copy of the manufacturer’s instruction manual is located in the ISB calibration room.
ISB STANDARD OPERATING PROCEDURES Page 37 Revised 12/10/2013
III. FIELD PARAMETER MEASUREMENTS
5. SPECIFIC CONDUCTIVITY/SALINITY The specific conductance (conductivity) of a solution is a measure of its ability to carry an electrical current. This ability depends on the presence of ions, their total concentration, mobility, valence, and relative concentrations, and on the temperature of measurement. Specific conductance is the conductance afforded by 1 cc (ml) of a solution of electrolyte and is reported in micromhos per centimeter (µmhos/cm). Specific conductance measurements are used in water analysis to obtain a rapid estimate of the dissolved solids content of a water sample.
5.1 Specific Conductivity Meter Calibration - Detailed meter guidelines for calibrations are listed in Appendices 1 - 4. Copies of manufacturer’s instruction manuals are found in the ISB calibration room.
Note: All field meters should be calibrated before and checked after sampling activities daily. The calibration data should be entered on a meter calibration sheet (Figure 10).
5.2 Additional Calibration Information • Acceptance Criteria: Calibrate instrument within ±10% of the
calibration standard’s true value. • Always calibrate with fresh, certified conductivity standards.
6. SECCHI DISK TRANSPARENCY A measurement of water transparency obtained by observing a specially marked, circular disk which is lowered through the water column until it is not visible. This measure of the point at which the disk is non-visible is considered the secchi depth.
6.1. Secchi disk use (Figure 11) 6.1.1. Conditions for secchi disk readings
a. Shaded, protected side of boat. b. Minimal waves or ripples, if possible. c. Do not wear sunglasses while taking the secchi depth reading.
NOTE: Any departure from these conditions should be specifically stated on the field sheet.
6.1.2. Method a. Rope should be accurately graduated in meters, 0.1 meter
graduations for the first meter, 0.5 m graduations thereafter. At a minimum of annually verification of correct graduation is necessary as rope may stretch with continued use.
b. Observer's eye should be 1 meter above the water surface. c. Lower the disk into the water to the depth at which the disk
disappears. d. Lift the disk and record the depth at which it just reappears. e. Record the average reading from previous 2 steps on field
sheet as Secchi depth reading to the nearest tenth of a meter.
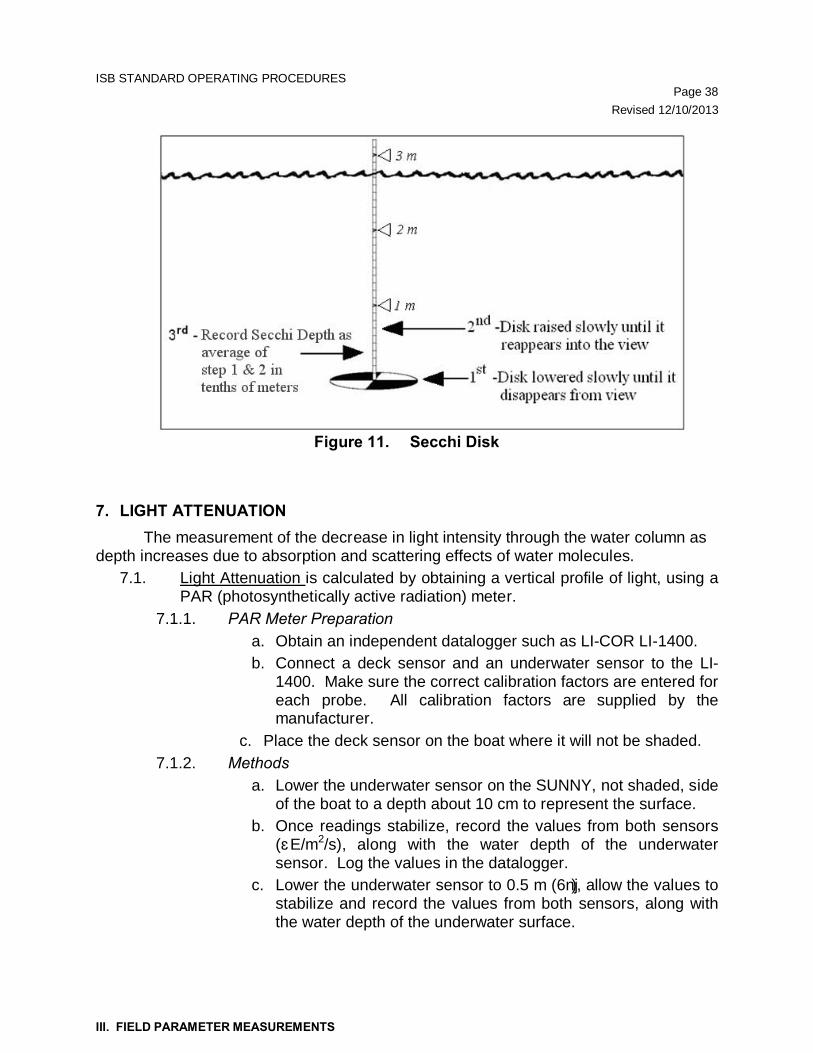
ISB STANDARD OPERATING PROCEDURES Page 38 Revised 12/10/2013
III. FIELD PARAMETER MEASUREMENTS
Figure 11. Secchi Disk
7. LIGHT ATTENUATION The measurement of the decrease in light intensity through the water column as depth increases due to absorption and scattering effects of water molecules.
7.1. Light Attenuation is calculated by obtaining a vertical profile of light, using a PAR (photosynthetically active radiation) meter.
7.1.1. PAR Meter Preparation a. Obtain an independent datalogger such as LI-COR LI-1400. b. Connect a deck sensor and an underwater sensor to the LI-
1400. Make sure the correct calibration factors are entered for each probe. All calibration factors are supplied by the manufacturer.
c. Place the deck sensor on the boat where it will not be shaded. 7.1.2. Methods
a. Lower the underwater sensor on the SUNNY, not shaded, side of the boat to a depth about 10 cm to represent the surface.
b. Once readings stabilize, record the values from both sensors (μE/m2/s), along with the water depth of the underwater sensor. Log the values in the datalogger.
c. Lower the underwater sensor to 0.5 m (6″), allow the values to stabilize and record the values from both sensors, along with the water depth of the underwater surface.
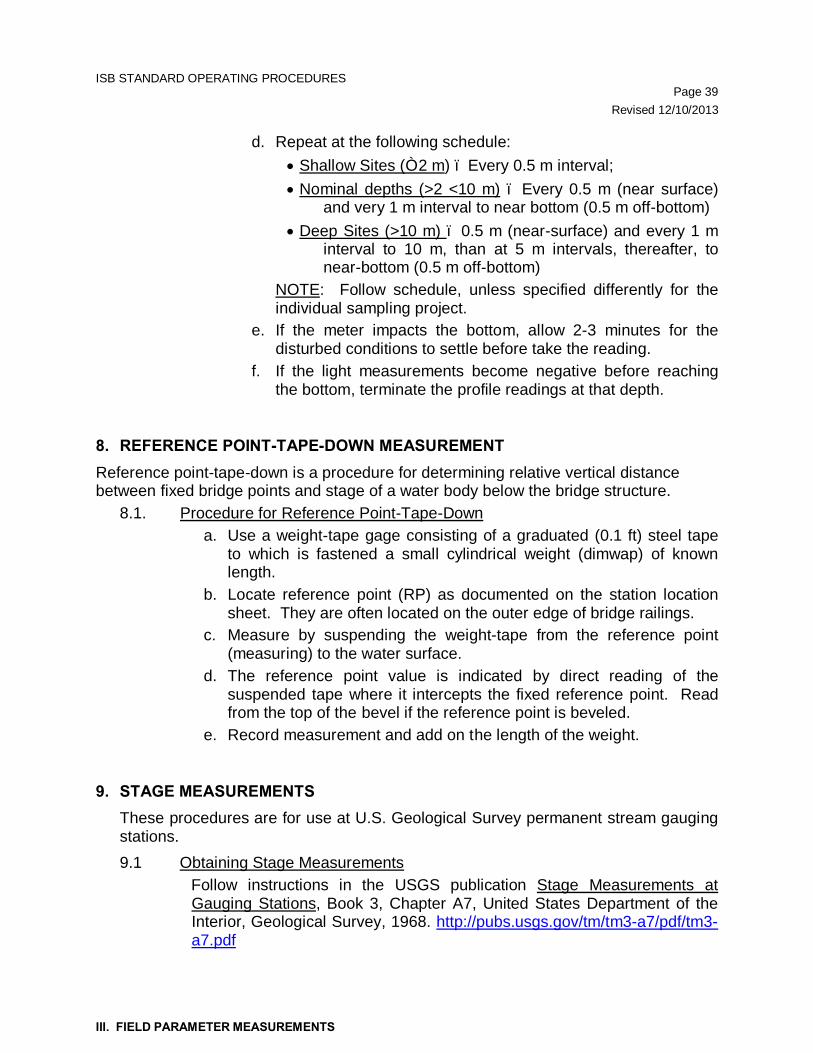
ISB STANDARD OPERATING PROCEDURES Page 39 Revised 12/10/2013
III. FIELD PARAMETER MEASUREMENTS
d. Repeat at the following schedule: • Shallow Sites (≤ 2 m) – Every 0.5 m interval; • Nominal depths (>2 <10 m) – Every 0.5 m (near surface)
and very 1 m interval to near bottom (0.5 m off-bottom) • Deep Sites (>10 m) – 0.5 m (near-surface) and every 1 m
interval to 10 m, than at 5 m intervals, thereafter, to near-bottom (0.5 m off-bottom)
NOTE: Follow schedule, unless specified differently for the individual sampling project.
e. If the meter impacts the bottom, allow 2-3 minutes for the disturbed conditions to settle before take the reading.
f. If the light measurements become negative before reaching the bottom, terminate the profile readings at that depth.
8. REFERENCE POINT-TAPE-DOWN MEASUREMENT Reference point-tape-down is a procedure for determining relative vertical distance between fixed bridge points and stage of a water body below the bridge structure.
8.1. Procedure for Reference Point-Tape-Down a. Use a weight-tape gage consisting of a graduated (0.1 ft) steel tape
to which is fastened a small cylindrical weight (dimwap) of known length.
b. Locate reference point (RP) as documented on the station location sheet. They are often located on the outer edge of bridge railings.
c. Measure by suspending the weight-tape from the reference point (measuring) to the water surface.
d. The reference point value is indicated by direct reading of the suspended tape where it intercepts the fixed reference point. Read from the top of the bevel if the reference point is beveled.
e. Record measurement and add on the length of the weight.
9. STAGE MEASUREMENTS These procedures are for use at U.S. Geological Survey permanent stream gauging stations. 9.1 Obtaining Stage Measurements
Follow instructions in the USGS publication Stage Measurements at Gauging Stations, Book 3, Chapter A7, United States Department of the Interior, Geological Survey, 1968. http://pubs.usgs.gov/tm/tm3-a7/pdf/tm3-a7.pdf
ISB STANDARD OPERATING PROCEDURES Page 40 Revised 12/10/2013
III. FIELD PARAMETER MEASUREMENTS
9.1.1 Prior to Sampling a. Obtain permission from the USGS district chief to read the
stage measuring devices in the instrument shelters. b. Obtain on the job training by USGS personnel as to how to
read the stage measuring devices. 9.1.2 Stage Measuring Devices
• Staff gage • Wire weight gage • Electric-tape instrument • Automatic digital recorder • Graphic recorder (bubble meters)
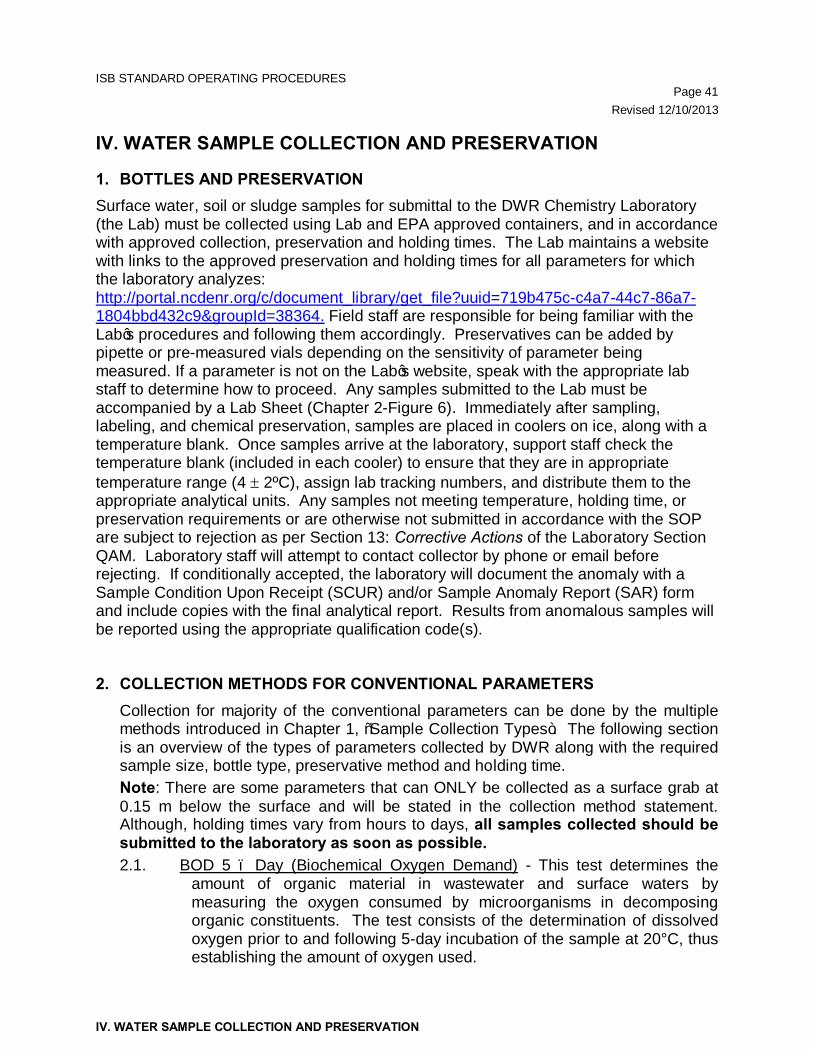
ISB STANDARD OPERATING PROCEDURES Page 41 Revised 12/10/2013
IV. WATER SAMPLE COLLECTION AND PRESERVATION
IV. WATER SAMPLE COLLECTION AND PRESERVATION
1. BOTTLES AND PRESERVATION Surface water, soil or sludge samples for submittal to the DWR Chemistry Laboratory (the Lab) must be collected using Lab and EPA approved containers, and in accordance with approved collection, preservation and holding times. The Lab maintains a website with links to the approved preservation and holding times for all parameters for which the laboratory analyzes: http://portal.ncdenr.org/c/document_library/get_file?uuid=719b475c-c4a7-44c7-86a7-1804bbd432c9&groupId=38364. Field staff are responsible for being familiar with the Lab’s procedures and following them accordingly. Preservatives can be added by pipette or pre-measured vials depending on the sensitivity of parameter being measured. If a parameter is not on the Lab’s website, speak with the appropriate lab staff to determine how to proceed. Any samples submitted to the Lab must be accompanied by a Lab Sheet (Chapter 2-Figure 6). Immediately after sampling, labeling, and chemical preservation, samples are placed in coolers on ice, along with a temperature blank. Once samples arrive at the laboratory, support staff check the temperature blank (included in each cooler) to ensure that they are in appropriate temperature range (4 ± 2ºC), assign lab tracking numbers, and distribute them to the appropriate analytical units. Any samples not meeting temperature, holding time, or preservation requirements or are otherwise not submitted in accordance with the SOP are subject to rejection as per Section 13: Corrective Actions of the Laboratory Section QAM. Laboratory staff will attempt to contact collector by phone or email before rejecting. If conditionally accepted, the laboratory will document the anomaly with a Sample Condition Upon Receipt (SCUR) and/or Sample Anomaly Report (SAR) form and include copies with the final analytical report. Results from anomalous samples will be reported using the appropriate qualification code(s). 2. COLLECTION METHODS FOR CONVENTIONAL PARAMETERS
Collection for majority of the conventional parameters can be done by the multiple methods introduced in Chapter 1, “Sample Collection Types”. The following section is an overview of the types of parameters collected by DWR along with the required sample size, bottle type, preservative method and holding time. Note: There are some parameters that can ONLY be collected as a surface grab at 0.15 m below the surface and will be stated in the collection method statement. Although, holding times vary from hours to days, all samples collected should be submitted to the laboratory as soon as possible. 2.1. BOD 5 – Day (Biochemical Oxygen Demand) - This test determines the
amount of organic material in wastewater and surface waters by measuring the oxygen consumed by microorganisms in decomposing organic constituents. The test consists of the determination of dissolved oxygen prior to and following 5-day incubation of the sample at 20°C, thus establishing the amount of oxygen used.
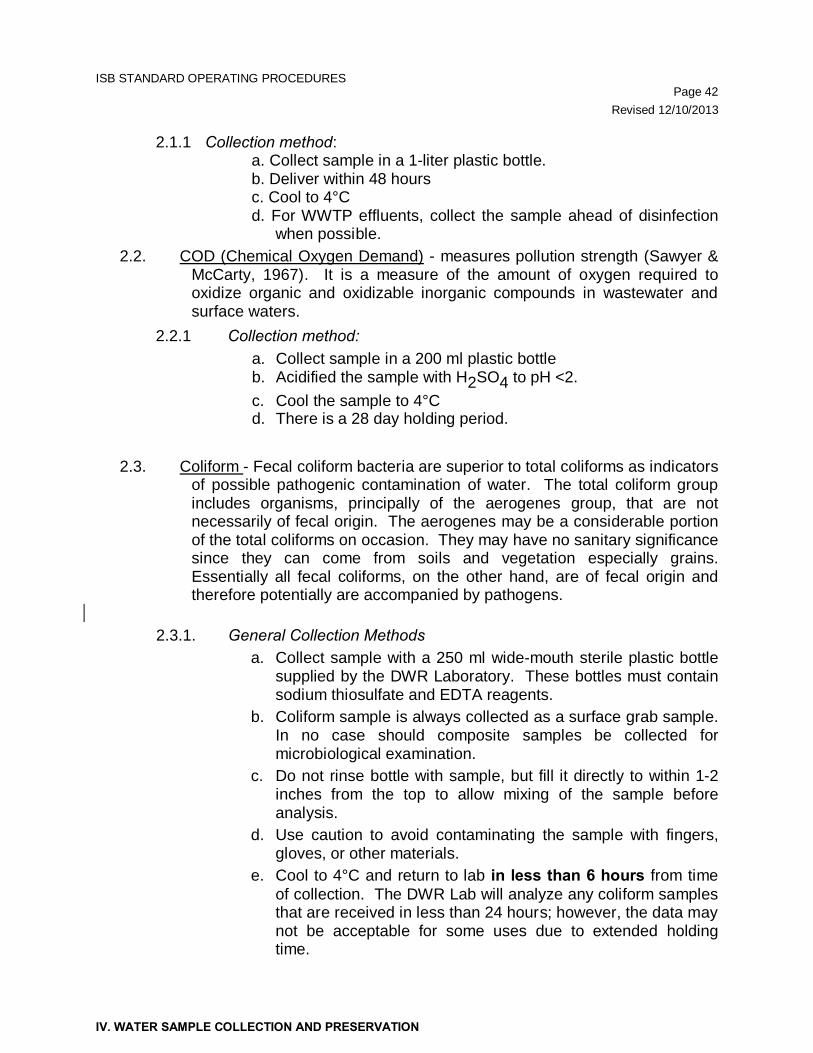
ISB STANDARD OPERATING PROCEDURES Page 42 Revised 12/10/2013
IV. WATER SAMPLE COLLECTION AND PRESERVATION
2.1.1 Collection method: a. Collect sample in a 1-liter plastic bottle. b. Deliver within 48 hours c. Cool to 4°C d. For WWTP effluents, collect the sample ahead of disinfection
when possible. 2.2. COD (Chemical Oxygen Demand) - measures pollution strength (Sawyer &
McCarty, 1967). It is a measure of the amount of oxygen required to oxidize organic and oxidizable inorganic compounds in wastewater and surface waters.
2.2.1 Collection method: a. Collect sample in a 200 ml plastic bottle b. Acidified the sample with H2SO4 to pH <2. c. Cool the sample to 4°C d. There is a 28 day holding period.
2.3. Coliform - Fecal coliform bacteria are superior to total coliforms as indicators
of possible pathogenic contamination of water. The total coliform group includes organisms, principally of the aerogenes group, that are not necessarily of fecal origin. The aerogenes may be a considerable portion of the total coliforms on occasion. They may have no sanitary significance since they can come from soils and vegetation especially grains. Essentially all fecal coliforms, on the other hand, are of fecal origin and therefore potentially are accompanied by pathogens.
2.3.1. General Collection Methods
a. Collect sample with a 250 ml wide-mouth sterile plastic bottle supplied by the DWR Laboratory. These bottles must contain sodium thiosulfate and EDTA reagents.
b. Coliform sample is always collected as a surface grab sample. In no case should composite samples be collected for microbiological examination.
c. Do not rinse bottle with sample, but fill it directly to within 1-2 inches from the top to allow mixing of the sample before analysis.
d. Use caution to avoid contaminating the sample with fingers, gloves, or other materials.
e. Cool to 4°C and return to lab in less than 6 hours from time of collection. The DWR Lab will analyze any coliform samples that are received in less than 24 hours; however, the data may not be acceptable for some uses due to extended holding time.
ISB STANDARD OPERATING PROCEDURES Page 43 Revised 12/10/2013
IV. WATER SAMPLE COLLECTION AND PRESERVATION
2.3.2. Surface Sampling By-Hand
a. Grab sample should be collected directly into the sample bottle.
b. Remove the bottle top to protect bottle and cap from contamination; avoid touching the inside of the bottle and cap.
c. Grasp the bottle securely near the base with one hand and plunge the bottle mouth down into the water to avoid surface scum. Position the bottle towards the current flow and away from the hand of the collector, the shore, the side of the sampling platform, or boat. The sampling depth should be 0.15m below the water surface.
d. If the water body is static, create an artificial current by moving the bottle away from the sampler while tipping the bottle slightly to allow water to enter.
e. Tip the bottle slightly upwards to allow air to exit and the bottle. Fill the bottle to within 1-2 inches of the top.
f. After removal of the bottle from the stream, tightly stopper and label the bottle.
2.3.3. Surface Sampling by Weighted/Cage Bottle Frame (Figure 4, pg. 19)
a. Remove the cover and lower the device to the water. b. It is preferable to use nylon rope which does not absorb water
and will not rot. c. Swing the sampling device downstream and then allow it to
drop into the water while pulling on the rope so as to direct the bottle upstream.
d. Pull the sample device rapidly upstream and out of the water, simulating the scooping motion of grab sampling.
e. Take care not to dislodge dirt or other material from the sampling platform.
2.4. Residue (Solids) - Residue refers to solid matter suspended or dissolved in
water or wastewater. 2.4.1. Residue Types
a. Total Residue - is the term applied to the material left after evaporation of a water sample, and its subsequent drying in an oven at a defined temperature. Total residue includes nonfilterable residue and filterable residue. Also known as Total Solids.
b. Nonfilterable Residue (Suspended) - the portion of total residue retained by a filter. The concentration of other water quality parameters is related to suspended solids since the
ISB STANDARD OPERATING PROCEDURES Page 44 Revised 12/10/2013
IV. WATER SAMPLE COLLECTION AND PRESERVATION
solid structure may contain biochemical and chemical oxygen demand materials, trace metals, nutrients, pesticides, and toxic or hazardous materials absorbed on the surface. Also, known as Total Suspended Solids.
c. Filterable Residue (Dissolved) - the portion of total residue that passes through the filter. Dissolved solids consist mainly of inorganic salts, small amounts of organic matter, and dissolved gasses. Also called Total Dissolved Solids.
d. Volatile and Fixed Residue - the residue remaining after ignition for 1 hour at 550°C represents the ash or fixed solids, and the weight loss incurred is a reasonably accurate measure of organic matter or volatile solids.
2.4.2. Collection method: Use a 500 ml plastic bottle to collect each type of residue sample and cool to 4°C. The sample has a holding time of 7 days.
2.5. Alkalinity/Acidity - Alkalinity is a measure of the buffering capacity of water - the power of the water to neutralize hydrogen ions - and it is expressed in terms of an equivalent amount of calcium carbonate. Alkalinity is caused by the presence of carbonates, bicarbonates, and hydroxides. Acidity is the power of the water to neutralize hydroxy ions - and it is expressed in terms of an equivalent amount of calcium carbonate. Acidity is a result of the presence of free carbon dioxide, strong mineral acids, weakly dissociated acids, salts of strong acids, and weak bases.
2.5.1 Collection method: Collect sample with a 200 ml (for each parameter) plastic bottle, cool to 4°C. Holding time is 14 days.
2.6. TOC (Total Organic Carbon) - Measures the organic carbon present in water. When an empirical relationship can be established between TOC, BOD, and COD, the TOC provides a quick and convenient way of estimating the other parameters that express the degree of organic contamination.
2.6.1 Collection method: Collect sample with a 200 ml plastic bottle, add H3PO4 to pH <2 and cool to 4°C. Holding time is 28 days.
2.7. Turbidity (Clarity of Water) – measured in Nephelometric Turbidity Units (NTU). Turbidity is an expression of the optical property that causes light to be scattered and absorbed rather than transmitted in straight lines. Turbidity in waters is a result of suspended matter such as clay, silt, finely divided organic and inorganic matter, soluble colored organic compounds, and plankton and other microscopic organisms.
2.7.1 Collection method: Collect sample in a 200 ml plastic bottle, cool to 4°C. The sample should be protected from light. The sample must be received by the lab in less than 48 hours.
2.8. Chloride - Chlorides are found in most natural waters. They may be of natural mineral origin or artificially introduced. Chloride concentrations are higher in wastewater than in raw water because sodium chloride (NaCl) is
ISB STANDARD OPERATING PROCEDURES Page 45 Revised 12/10/2013
IV. WATER SAMPLE COLLECTION AND PRESERVATION
a common article of diet and passes unchanged through the digestive system (American Public Health Association, 1992). Industrial processes also increase chlorides in wastewater effluents.
2.8.1. Collection method: Collect sample in a 500 ml plastic bottle, typically collected directly from the water body as a surface grab (0.15m deep). Cool to 4°C. Holding time is 28 days.
2.9. Chlorophyll a and Algal Biomass 2.9.1. Chlorophyll a - Chlorophyll a is the photosynthetic green,
photosynthetic pigment contained in plants. The measurement of this pigment provides an estimate of algal biomass.
Collection method: Use a 500 ml wide-mouth opaque plastic bottle to collect the sample. Cool to 4°C. Sample must be received by the laboratory in less than 24 hours.
2.9.2. Algae - Algae are used as biological indicators of water quality. By
determining the types and quantity of algae present in a water body and utilizing physical and chemical data collected at the same time, inferences can be made concerning the trophic state of a water body. Algae are sampled from the water column (phytoplankton), attached to rocks and debris (periphyton), and from floating mats (filamentous/nuisance growths). The primary type sampled by DWR is phytoplankton, although all forms of algae can be sent to the Ecosystems Branch Laboratory of the Environmental Sciences Section for analyses.
Collection method: Samples for phytoplankton should be taken with an integrated depth sampling device (Labline water sampler). a) This device should be lowered to twice the secchi depth
(approximately 1% light penetration) and slowly raised to the surface.
b) Pour sample into a 500 ml plastic disposable bottle and preserve with approximately 2.5ml of modified Lugol's solution or until a dark straw color is reached.
c) If a Labline is unavailable, a surface grab sample can be taken.
d) Scoop samples are taken only when no quantitative methods are possible or as an additional sample for ease in identification. Live samples are taken as above (Labline preferred) but are not preserved. Cool to 4°C. Send to the Lab or EU lab in less than 24 hours.
2.9.3. Chlorophyll a and Algal Sample Submittal Procedure a. Samples should then be sent to the Central Laboratory along
with nutrient and chemical samples.
ISB STANDARD OPERATING PROCEDURES Page 46 Revised 12/10/2013
IV. WATER SAMPLE COLLECTION AND PRESERVATION
b. Bloom samples should include one preserved and one unpreserved (live) phytoplankton sample along with chlorophyll a and nutrient samples and a completed bloom form. Bloom forms and modified Lugol's solution (for preservation) are obtained from the Ecosystems Branch in Raleigh.
c. After samples are logged in at the Central Lab and with the Ecosystems Group, they are analyzed per the Ecosystems Branch's SOP manual.
2.9.4. Parameters collected in conjunction with phytoplankton samples.
a. Physical Parameters- Are measured at the surface and at every meter or half meter from the surface to bottom according to depth. Parameters include:
1. Temperature 2. Dissolved Oxygen 3. pH 4. Secchi Depth 5. Conductivity 6. Salinity should be taken where appropriate.
b. Chemical samples- Include ammonia/ammonium, nitrate/nitrite, total Kjeldahl nitrogen, orthophosphate, total phosphorous, and chlorophyll a are required to accompany phytoplankton samples.
NOTE: Check with the lab prior to sampling for orthophosphate to ensure analysis capabilities.
c. Map showing the location of the sampling site and/ or GPS coordinates.
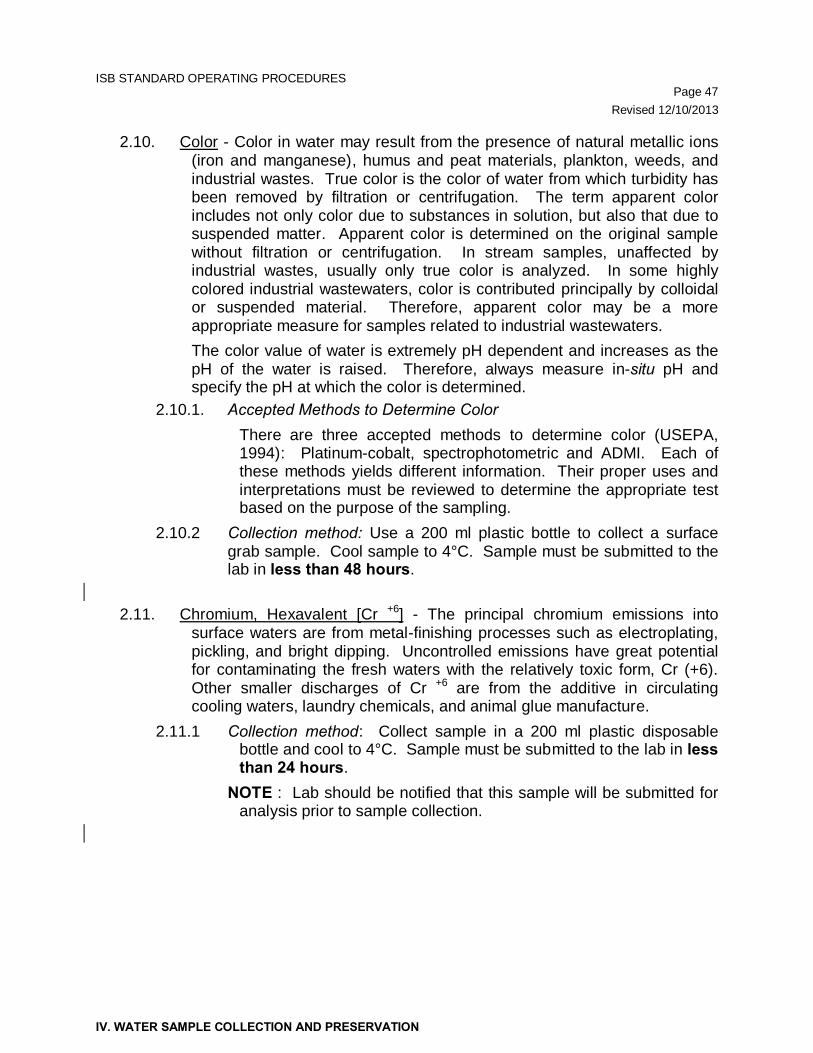
ISB STANDARD OPERATING PROCEDURES Page 47 Revised 12/10/2013
IV. WATER SAMPLE COLLECTION AND PRESERVATION
2.10. Color - Color in water may result from the presence of natural metallic ions (iron and manganese), humus and peat materials, plankton, weeds, and industrial wastes. True color is the color of water from which turbidity has been removed by filtration or centrifugation. The term apparent color includes not only color due to substances in solution, but also that due to suspended matter. Apparent color is determined on the original sample without filtration or centrifugation. In stream samples, unaffected by industrial wastes, usually only true color is analyzed. In some highly colored industrial wastewaters, color is contributed principally by colloidal or suspended material. Therefore, apparent color may be a more appropriate measure for samples related to industrial wastewaters. The color value of water is extremely pH dependent and increases as the pH of the water is raised. Therefore, always measure in-situ pH and specify the pH at which the color is determined.
2.10.1. Accepted Methods to Determine Color There are three accepted methods to determine color (USEPA, 1994): Platinum-cobalt, spectrophotometric and ADMI. Each of these methods yields different information. Their proper uses and interpretations must be reviewed to determine the appropriate test based on the purpose of the sampling.
2.10.2 Collection method: Use a 200 ml plastic bottle to collect a surface grab sample. Cool sample to 4°C. Sample must be submitted to the lab in less than 48 hours.
2.11. Chromium, Hexavalent [Cr +6] - The principal chromium emissions into
surface waters are from metal-finishing processes such as electroplating, pickling, and bright dipping. Uncontrolled emissions have great potential for contaminating the fresh waters with the relatively toxic form, Cr (+6). Other smaller discharges of Cr +6 are from the additive in circulating cooling waters, laundry chemicals, and animal glue manufacture.
2.11.1 Collection method: Collect sample in a 200 ml plastic disposable bottle and cool to 4°C. Sample must be submitted to the lab in less than 24 hours.
NOTE : Lab should be notified that this sample will be submitted for analysis prior to sample collection.
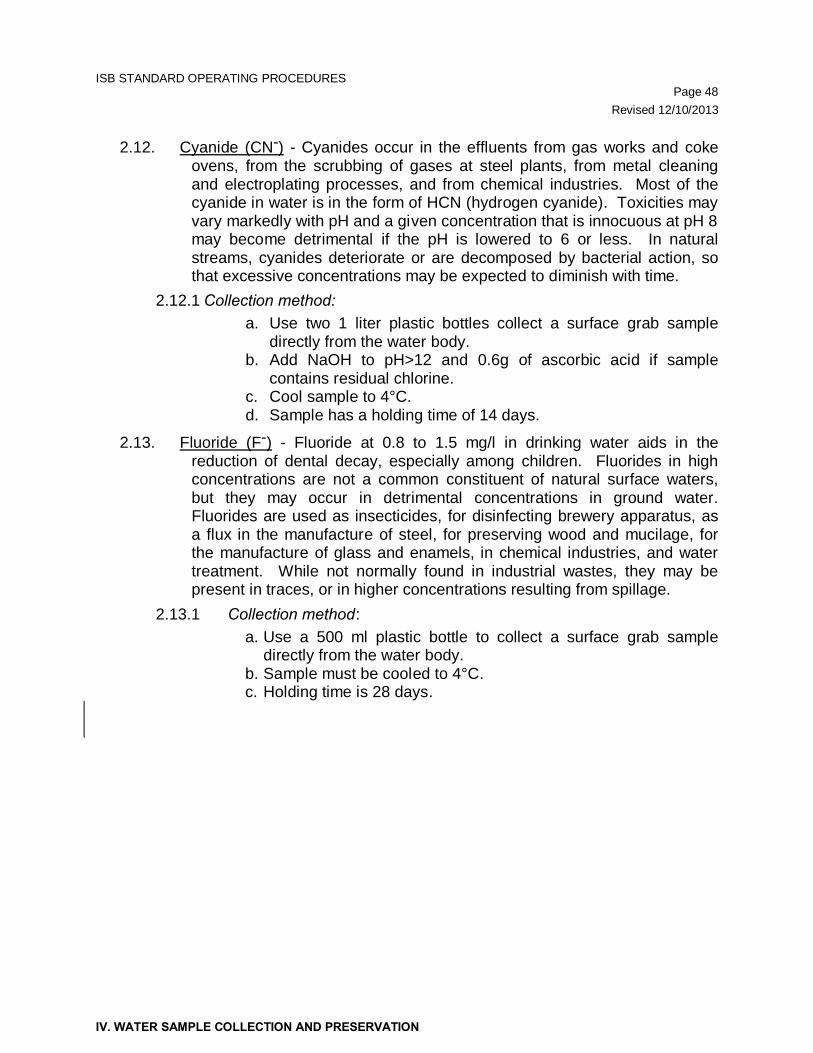
ISB STANDARD OPERATING PROCEDURES Page 48 Revised 12/10/2013
IV. WATER SAMPLE COLLECTION AND PRESERVATION
2.12. Cyanide (CN-) - Cyanides occur in the effluents from gas works and coke ovens, from the scrubbing of gases at steel plants, from metal cleaning and electroplating processes, and from chemical industries. Most of the cyanide in water is in the form of HCN (hydrogen cyanide). Toxicities may vary markedly with pH and a given concentration that is innocuous at pH 8 may become detrimental if the pH is lowered to 6 or less. In natural streams, cyanides deteriorate or are decomposed by bacterial action, so that excessive concentrations may be expected to diminish with time.
2.12.1 Collection method: a. Use two 1 liter plastic bottles collect a surface grab sample
directly from the water body. b. Add NaOH to pH>12 and 0.6g of ascorbic acid if sample
contains residual chlorine. c. Cool sample to 4°C. d. Sample has a holding time of 14 days.
2.13. Fluoride (F-) - Fluoride at 0.8 to 1.5 mg/l in drinking water aids in the reduction of dental decay, especially among children. Fluorides in high concentrations are not a common constituent of natural surface waters, but they may occur in detrimental concentrations in ground water. Fluorides are used as insecticides, for disinfecting brewery apparatus, as a flux in the manufacture of steel, for preserving wood and mucilage, for the manufacture of glass and enamels, in chemical industries, and water treatment. While not normally found in industrial wastes, they may be present in traces, or in higher concentrations resulting from spillage.
2.13.1 Collection method: a. Use a 500 ml plastic bottle to collect a surface grab sample
directly from the water body. b. Sample must be cooled to 4°C. c. Holding time is 28 days.
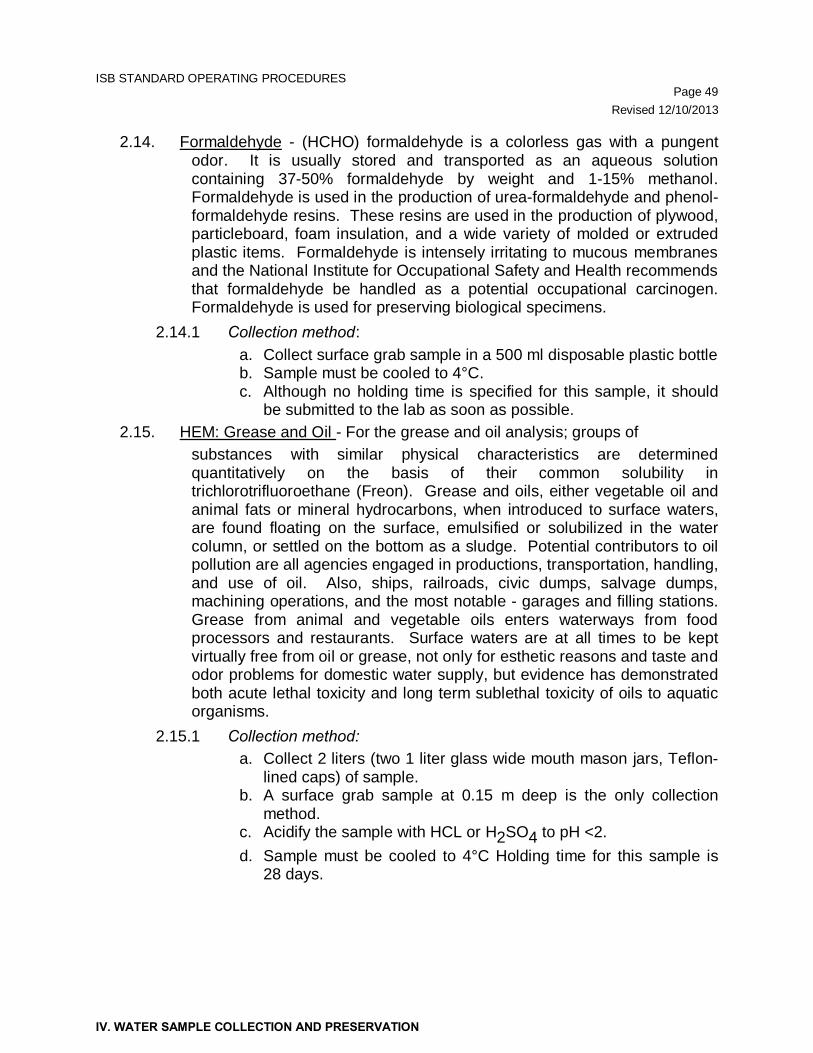
ISB STANDARD OPERATING PROCEDURES Page 49 Revised 12/10/2013
IV. WATER SAMPLE COLLECTION AND PRESERVATION
2.14. Formaldehyde - (HCHO) formaldehyde is a colorless gas with a pungent odor. It is usually stored and transported as an aqueous solution containing 37-50% formaldehyde by weight and 1-15% methanol. Formaldehyde is used in the production of urea-formaldehyde and phenol-formaldehyde resins. These resins are used in the production of plywood, particleboard, foam insulation, and a wide variety of molded or extruded plastic items. Formaldehyde is intensely irritating to mucous membranes and the National Institute for Occupational Safety and Health recommends that formaldehyde be handled as a potential occupational carcinogen. Formaldehyde is used for preserving biological specimens.
2.14.1 Collection method: a. Collect surface grab sample in a 500 ml disposable plastic bottle b. Sample must be cooled to 4°C. c. Although no holding time is specified for this sample, it should
be submitted to the lab as soon as possible. 2.15. HEM: Grease and Oil - For the grease and oil analysis; groups of
substances with similar physical characteristics are determined quantitatively on the basis of their common solubility in trichlorotrifluoroethane (Freon). Grease and oils, either vegetable oil and animal fats or mineral hydrocarbons, when introduced to surface waters, are found floating on the surface, emulsified or solubilized in the water column, or settled on the bottom as a sludge. Potential contributors to oil pollution are all agencies engaged in productions, transportation, handling, and use of oil. Also, ships, railroads, civic dumps, salvage dumps, machining operations, and the most notable - garages and filling stations. Grease from animal and vegetable oils enters waterways from food processors and restaurants. Surface waters are at all times to be kept virtually free from oil or grease, not only for esthetic reasons and taste and odor problems for domestic water supply, but evidence has demonstrated both acute lethal toxicity and long term sublethal toxicity of oils to aquatic organisms.
2.15.1 Collection method: a. Collect 2 liters (two 1 liter glass wide mouth mason jars, Teflon-
lined caps) of sample. b. A surface grab sample at 0.15 m deep is the only collection
method. c. Acidify the sample with HCL or H2SO4 to pH <2. d. Sample must be cooled to 4°C Holding time for this sample is
28 days.

ISB STANDARD OPERATING PROCEDURES Page 50 Revised 12/10/2013
IV. WATER SAMPLE COLLECTION AND PRESERVATION
2.16. Total Hardness - Hard waters are generally considered to be those waters that require considerable amounts of soap to produce a foam or lather and that also produce scale in hot water pipes, heaters, boilers, and other units in which the temperature of water is increased materially. In general, surface waters are softer than ground waters. The hardness of water reflects the nature of the geological formations with which it has been in contact. Natural sources of hardness principally are limestone that are dissolved by percolating rainwater made acid by dissolved carbon dioxide. Industrial and industrially related sources include the inorganic chemical industry and discharges from operating and abandoned mines. Classification of water by hardness content (Conc., mg/l CaCO3) (USEPA, 1976).
Soft 0 - 75 Moderately Hard 75 - 150 Hard 150 - 300 Very Hard 300 and Up
The constituents that impart hardness to water are polyvalent cations, chiefly calcium (Ca++) and magnesium (Mg++). These form insoluble complexes with a variety of anions (HCO3-, SO4-, Cl-, NO3
-, SiO3-). By
convention, hardness is reported on the basis of equivalence as mg/l calcium carbonate (CaCO3).
The DWR Lab is no longer analyzing samples for Total Hardness, therefore, when a total hardness sample is required, a nitric acid (HNO3)-preserved sample must be submitted for Ca and Mg (see section 2.23). Once the Ca and Mg results are received from the lab, total hardness is calculated using the following formula:
Total Hardness, mg/L = 2.497[Ca, mg/L] + 4.118[Mg, mg/L] 2.16.1. Collection method:
a. Sample must be collected as a surface grab (0.15 m from the surface) in a 500 ml plastic bottle.
b. Acidify the sample with HNO3 to pH <2 and cool to 4°C. c. Holding time is 6 months.
2.17. Specific conductance (Specific Electrical Conductance) - The specific
conductance (conductivity) of a solution is a measure of its ability to carry an electrical current. This ability depends on the presence of ions, their total concentration, mobility, valence, and relative concentrations, and on the temperature of measurement. Specific conductance is the conductance afforded by 1 cc (ml) of a solution of electrolyte and is reported in micromhos per centimeter (µmhos/cm). Specific conductance measurements are used in water analysis to obtain a rapid estimate of the dissolved solids content of a water sample. This measurement is normally
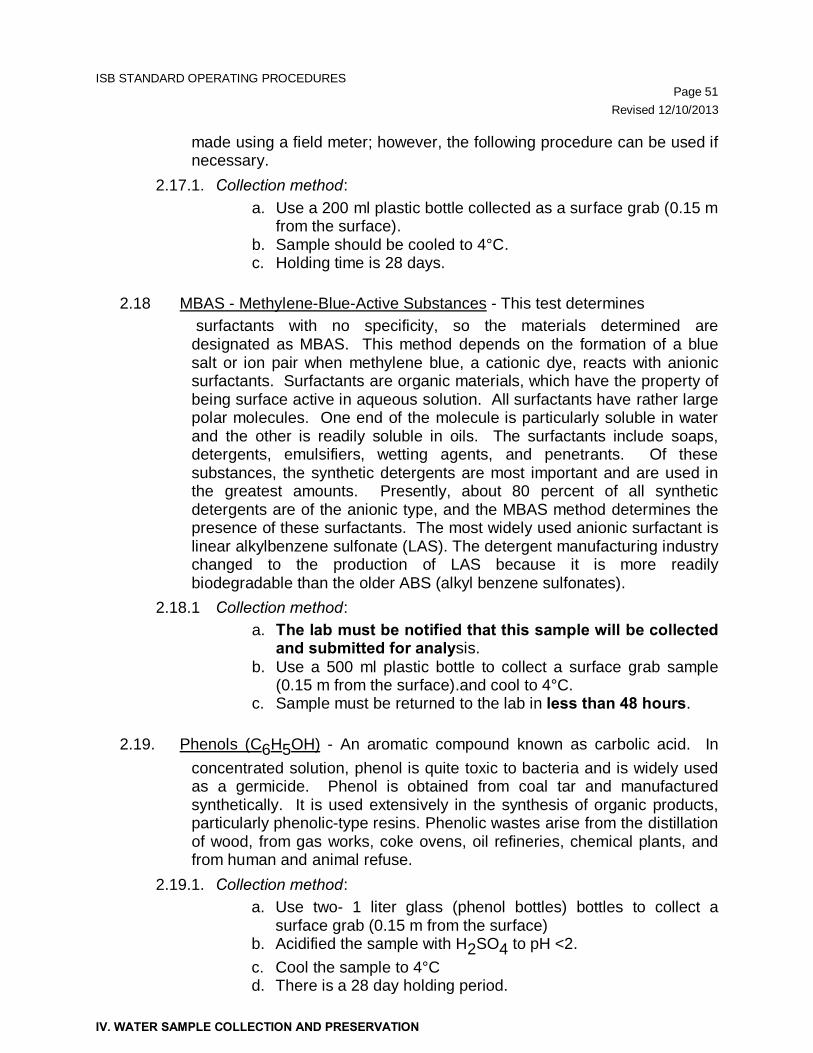
ISB STANDARD OPERATING PROCEDURES Page 51 Revised 12/10/2013
IV. WATER SAMPLE COLLECTION AND PRESERVATION
made using a field meter; however, the following procedure can be used if necessary.
2.17.1. Collection method: a. Use a 200 ml plastic bottle collected as a surface grab (0.15 m
from the surface). b. Sample should be cooled to 4°C. c. Holding time is 28 days.
2.18 MBAS - Methylene-Blue-Active Substances - This test determines
surfactants with no specificity, so the materials determined are designated as MBAS. This method depends on the formation of a blue salt or ion pair when methylene blue, a cationic dye, reacts with anionic surfactants. Surfactants are organic materials, which have the property of being surface active in aqueous solution. All surfactants have rather large polar molecules. One end of the molecule is particularly soluble in water and the other is readily soluble in oils. The surfactants include soaps, detergents, emulsifiers, wetting agents, and penetrants. Of these substances, the synthetic detergents are most important and are used in the greatest amounts. Presently, about 80 percent of all synthetic detergents are of the anionic type, and the MBAS method determines the presence of these surfactants. The most widely used anionic surfactant is linear alkylbenzene sulfonate (LAS). The detergent manufacturing industry changed to the production of LAS because it is more readily biodegradable than the older ABS (alkyl benzene sulfonates).
2.18.1 Collection method: a. The lab must be notified that this sample will be collected
and submitted for analysis. b. Use a 500 ml plastic bottle to collect a surface grab sample
(0.15 m from the surface).and cool to 4°C. c. Sample must be returned to the lab in less than 48 hours.
2.19. Phenols (C6H5OH) - An aromatic compound known as carbolic acid. In
concentrated solution, phenol is quite toxic to bacteria and is widely used as a germicide. Phenol is obtained from coal tar and manufactured synthetically. It is used extensively in the synthesis of organic products, particularly phenolic-type resins. Phenolic wastes arise from the distillation of wood, from gas works, coke ovens, oil refineries, chemical plants, and from human and animal refuse.
2.19.1. Collection method: a. Use two- 1 liter glass (phenol bottles) bottles to collect a
surface grab (0.15 m from the surface) b. Acidified the sample with H2SO4 to pH <2. c. Cool the sample to 4°C d. There is a 28 day holding period.
ISB STANDARD OPERATING PROCEDURES Page 52 Revised 12/10/2013
IV. WATER SAMPLE COLLECTION AND PRESERVATION
2.20. Sulfate (SO4) - The sulfate ion is one of the major anions occurring in natural waters. Sulfates occur as the final oxidized state of sulfides, sulfites, and thiosulfates. Sulfates may also occur as the oxidized stage of organic matter in the sulfur cycle. Sulfates may be discharged in numerous industrial wastes, tanneries, sulfate-pulp mills, textile mills, and other plants that use sulfates or sulfuric acid. Sulfate is important to public water supplies because of its cathartic effect upon humans when it is present in excessive amounts (upper limit-250 mg/l U.S.P.H.S.). Sulfates are of considerable concern to wastewater treatment plants because of odor and sewer corrosion problems resulting from the reduction of sulfates to hydrogen sulfide (H2S or hydrosulfuric acid in an aqueous solution).
2.20.1. Collection method: a. Sample should only be collected as a surface grab sample. b. Collect a surface grab (0.15 m from the surface) in a 500 ml
plastic bottle c. Cool the sample to 4°C. d. Sample has a hold time of 28 days
2.21. Sulfide (S-) - Sulfides are constituents of many industrial wastes tanneries, paper mills, chemical plants, and gas works. Sulfides are also generated in sewage and some natural waters by the anaerobic decomposition of organic matter. Sulfides react with hydrogen ions to form HS- or H2S. The toxicity of sulfides derives primarily from H2S rather than from the
hydrosulfide (HS-) or sulfide (S-2) ions. H2S is very toxic and has claimed the lives of numerous workmen in sewers, but owing to the unpleasant taste and odor (rotten eggs), most persons or animals avoid consuming a harmful dose.
2.21.1. Collection method: a. Samples should only be collect as a surface grab. b. Collect three- 40 ml glass VOA vials with Teflon-lined septum
directly as a surface grab (0.15 m from the surface) c. Allow the sample to overflow the vial. d. Add 0.1 ml of 2N zinc acetate plus 6N NaOH to pH >9. e. cap the vial when sample is overflowing ,leaving no air space f. Cool the sample to 4° g. Holding time is 7 days.
ISB STANDARD OPERATING PROCEDURES Page 53 Revised 12/10/2013
IV. WATER SAMPLE COLLECTION AND PRESERVATION
2.22. Phosphorous and Nitrogen (Nutrients) - Phosphorus occurs in natural waters and in wastewater almost solely as phosphates. Evidence indicates that high phosphorus concentrations are associated with accelerated eutrophication of waters when other growth promoting factors are present, and aquatic plant problems develop in reservoirs and other standing waters at phosphorus values lower than those critical in flowing streams. Nitrogen is one of the fertilizing elements essential to the growth of algae. Such growth is often stimulated to an undesirable extent in bodies of water that receive excess inputs of nitrogen from either point or nonpoint sources.
2.22.1 Nutrient Types a. NH3 (Ammonia) - In surface or ground waters, ammonia
results from the decomposition of nitrogenous organic matter. It may also result from the discharge of industrial wastes from chemical or gas plants, from ice plants, or from scouring and cleaning operations where ammonia water is used. The conversion of ammonia to nitrites and nitrates by bacteria requires oxygen, and so the discharge of ammonia nitrogen and its subsequent oxidation can seriously reduce the dissolved oxygen levels in rivers and estuaries.
b. TKN (Total Kjeldahl Nitrogen) - Analytically, organic nitrogen and ammonia can be determined together and are referred to as Kjeldahl nitrogen, a term that reflects the technique used in their determination.
c. NO2 + NO3 (Nitrites + Nitrates) - Nitrites are quickly oxidized to nitrates. Nitrates are the end product of the aerobic stabilization of organic nitrogen. Nitrates also occur in percolating ground waters as a result of excessive application of fertilizer or leaching from septic tanks. Nitrates are seldom abundant in natural surface waters because of uptake by plants.
d. Total P (Phosphorus) - Phosphorus occurs in natural waters and in wastewater almost solely as phosphates. High phosphorus concentrations are associated with accelerated eutrophication of waters when other growth promoting factors are present.
e. PO4 (Orthophosphate) - Orthophosphate is used as fertilizer and is applied to agricultural and residential cultivated land where it is carried into surface waters with storm runoff.
ISB STANDARD OPERATING PROCEDURES Page 54 Revised 12/10/2013
IV. WATER SAMPLE COLLECTION AND PRESERVATION
2.22.2 Collection Methods for Unfiltered Nutrients (NH3, TKN, NO2+NO3, and Total P)
a. Use a 500 ml plastic disposable bottle for sample collected. b. Acidify the sample with H2SO4 to pH<2 (to 500 ml sample add
2.0 ml 25% H2SO4 Note: Addition of an excessive amount of acid will interfere with the sample analysis
c. Cool the sample to 4°C. d. Holding time is 28 days.
2.22.3. Collection Method for PO4 and Dissolved P (Filtered Nutrients) This water sample must be filtered in the field. A detailed Standard Operating Procedure for field filtering using a vacuum pump can be found in Appendix 6. Be careful- do not allow filter residue to touch filter apparatus or forceps.
a. Use a 200 ml plastic bottle for each sample. b. Dissolved P sample is acidized to pH <2 by adding 25%
H2SO4. c. Dissolved P and PO4 samples must be cooled to 4°C d. Holding time for PO4 is less than 48 hours e. The holding time for Dissolved P is 28 days.
NOTE: For Turbid Samples - change filters during process. 2.23. METALS- The following metal parameters are collected in one bottle: Cd,
Cr, Cu, Ni, Pb, Zn, Ag, Al, Be, Ca, Co, Fe, Li, Mg, Mn, Na, K, Ba, As, Se, Hg. Whenever metal samples are collected the collection of field pH is essential. Metals are always collected as a surface grab Collection method:
a. Collect 500 ml of sample in a plastic disposable bottle directly from the water body as a surface grab (0.15 from the surface).
b. Add HNO3 to pH <2. c. Cool the sample to 4°C. d. Metals have a 6 month holding time with the exception of
Mercury (Hg) which is 28 days. 2.23.1. Cadmium (Cd) - In the elemental form, cadmium is insoluble in water.
It occurs in nature largely as the sulfide salt, greenockite or cadmium blend, often as an impurity in zinc-lead ores. Cadmium is used in metallurgy to alloy with copper, lead, silver, aluminum, and nickel. It is also used in electroplating, ceramics, pigmentation, photography, and nuclear reactors. Cadmium salts are sometimes employed as insecticides and antihelminthics. Cadmium salts may be found in wastes from electroplating plants, pigment works, textile printing, lead mines, and chemical industries. Cadmium has been shown to be toxic to man when ingested or inhaled.
ISB STANDARD OPERATING PROCEDURES Page 55 Revised 12/10/2013
IV. WATER SAMPLE COLLECTION AND PRESERVATION
2.23.2. Chromium (Total Cr) - The principal chromium emissions into surface waters are from metal finishing processes such as electroplating, pickling, and bright dipping. Other smaller discharges of chromium are from the additive in circulating cooling waters, laundry chemicals and animal glue manufacture, leather tanning, and textile dyeing. Chromium is one of the least toxic of the trace elements. Chromium is not acutely toxic to humans.
2.23.3. Copper (Cu) - Copper salts in natural waters are generally the result of pollution attributable to the corrosive action of water on copper and brass tubing, to industrial effluents, and algaecide. Copper salts are used in textile processes, pigmentation, tanning, photography, engraving, electroplating, insecticides, and fungicides. Because copper in concentrations high enough to be dangerous to human beings renders water disagreeable to taste, it is believed that copper is probably not a hazard in domestic water supplies. However, copper in water may be disadvantageous or detrimental for certain industrial uses. In trace amounts, copper may be beneficial or even essential for the growth of living organisms. In excessive quantities it has been found toxic to a wide variety of aquatic forms, from bacteria to fish.
2.23.4. Nickel (Ni) - Nickel toxicity to man is believed to be very low. Systemic poisoning of human beings by nickel or nickel salts is almost unknown. Nickel does not merit serious consideration as a water pollutant, but nickel ions may be detrimental to beneficial uses. Nickel is toxic to some plants. Nickel is used in metal plating, batteries, as a catalyst in the preparation of edible oils, and in solar energy equipment.
2.23.5. Lead (Pb) - Lead is a cumulative poison. The poisoning usually results from the cumulative toxic effects of lead after continuous, long-term consumption rather than from occasional small doses. Lead exists in nature mainly as the sulfide (galena). Some natural waters contain lead in solution where mountain limestone and galena are found. Lead may also be introduced into water as a constituent of various industrial and mining effluents or as a result of the action of the water on lead in pipes. Atmospheric fallout and rainout of particulate lead are considered the most significant sources of lead input into natural surface waters, especially in urban areas. Storm runoff originating in urban areas will tend to be high in lead concentration. The low solubility of lead in the aqueous phase of natural systems and the formation of stable complexes with organic matter are manifested in the low uptake by some plants and animals. There are extremely low concentrations of lead in natural bodies of water in proportion to the concentration in the beds of lakes and streams. The net effect of these sluggish dynamics is a high degree of accumulation with prolonged exposure.
ISB STANDARD OPERATING PROCEDURES Page 56 Revised 12/10/2013
IV. WATER SAMPLE COLLECTION AND PRESERVATION
2.23.6. Zinc (Zn) - Zinc is used extensively for galvanizing, in alloys, for electrical purposes, in printing plates, for dye manufacture, and dyeing processes. Zinc salts are used in paint pigments, cosmetics, pharmaceutics, dyes, and insecticides. Zinc is found in high concentrations in natural waters in zinc mining areas and in effluents from metal plating works. In most surface and ground waters it is present only in trace amounts. There is some evidence that zinc ions are absorbed strongly and permanently on silt with a resultant inactivation of the zinc. Zinc has no known adverse physiological effects upon man except at very high concentrations. For esthetic considerations, high concentrations of zinc in domestic water are undesirable. At 30 mg/l, zinc gives water a milky appearance and causes a greasy film on boiling. It is toward fish and aquatic organisms that zinc exhibits its greatest toxicity at much lower concentrations.
2.23.7. Silver (Ag) - Silver metal is used in jewelry and silverware, in alloys, for electroplating, and in the processing of food and beverages. Silver nitrate is used in photography, ink manufacture, electroplating, coloring porcelain, and as an antiseptic. Traces of silver can be expected to reach natural waters from such sources. Silver is bactericidal and toxic at low concentrations.
2.23.8. Aluminum (Al) - Aluminum is the third most abundant element of the earth's crust. Aluminum occurs in many rocks and ores and clays, but never as a pure metal in nature. The metal itself is insoluble, but many of its salts are readily soluble. Aluminum is not likely to occur for long in surface waters because it precipitates and settles, or is absorbed as aluminum hydroxide or aluminum carbonate. In streams the presence of aluminum ions may result from industrial wastes or more likely from wash water containing alum from water treatment plants.
2.23.9. Beryllium (Be) - A relatively rare element, found chiefly in the mineral beryl, this substance is not likely to occur in natural waters. Although the chloride and nitrate forms are very soluble in water and the sulfate form moderately so, the carbonate and hydroxide forms are almost insoluble in cold water. Beryllium is used primarily in metallurgy to produce special alloys, in the manufacture of X-ray diffraction tubes and electrodes for neon signs, and in nuclear reactors. Beryllium is not harmful when taken internally through the digestive tract but has been incriminated in pulmonary ailments of workers exposed to beryllium dusts.
ISB STANDARD OPERATING PROCEDURES Page 57 Revised 12/10/2013
IV. WATER SAMPLE COLLECTION AND PRESERVATION
2.23.10. Calcium (Ca) - Calcium is the most abundant dissolved cationic constituent of natural fresh waters. This element is widely distributed in the minerals of rocks and soils. Calcium carbonate is frequently found as a cementing agent between mineral particles of sandstone and other detrital rocks. Calcium is one of the constituents of hard water and is a scale former in hot water systems. Prevention of corrosion of cast iron water distribution systems may be obtained through controlled precipitation of calcium carbonate. Lime (CaOH2), and dolomite [CaMg(CO3)2] are frequently employed as neutralizing agents in water and wastewater treatment.
2.23.11. Cobalt (Co) - Cobalt and its salts are used for making alloys, in nuclear technology, as pigment in the china and glass industry, and as binders in the tungsten-carbide tool industry. Cobalt has a relatively low toxicity to man, and traces of cobalt are essential to nutrition.
2.23.12. Iron (Fe) - Iron interferes with laundering operations, imparts objectionable stains to porcelain fixtures, and causes difficulties in distribution systems by supporting growths of iron bacteria. Iron also imparts a taste to water, which is detectable at very low concentrations. In addition to corrosion products, natural waters may be polluted by iron-bearing ground water.
2.23.13. Lithium (Li) - An alkali metal, it is not widely distributed in nature, being found in a few minerals and in certain spring waters. Lithium is used in metallurgy, medicinal waters, some types of glass, and, as lithium hydroxide, in storage batteries. Lithium is toxic at high concentrations.
2.23.14. Magnesium (Mg) - Magnesium ions are of particular importance in that they occur in significant concentration in natural waters, and along with calcium, form the bulk of the hardness reaction. Magnesium is considered relatively non-toxic to man and not a public health hazard because, before toxic concentrations are reached in water, the taste becomes quite unpleasant. At high concentrations, magnesium salts have a laxative effect, particularly upon new users, although the human body can develop a tolerance to magnesium over a period of time.
2.23.15. Manganese (Mn) - Manganese is essential for the nutrition of both plants and animals. Manganese is undesirable in domestic water supplies because it causes an unpleasant taste, deposits on food during cooking, stains, and discolors laundry and plumbing fixtures, and fosters the growth of some microorganisms in reservoirs, filters, and distribution systems. Manganese frequently appears in surface waters as the result of decaying vegetation, in waters with acid pH values, and acidic waters from coal mine drainage. In ground water subject to reducing conditions, manganese can be leached from the soil and occur in high concentrations.
ISB STANDARD OPERATING PROCEDURES Page 58 Revised 12/10/2013
IV. WATER SAMPLE COLLECTION AND PRESERVATION
2.23.16. Sodium (Na) - Sodium salts are extremely soluble in water; any sodium that is leached from soil or discharged to streams by industrial wastes will remain in solution. Sodium is the cation of many salts used in industry and as such is one of the most common ions in process wastes. Sodium in drinking water may be harmful to persons suffering from cardiac, renal, and circulatory diseases.
2.23.17. Potassium (K) - One of the more common elements, potassium is one of the most active metals, and for that reason it is not found free in nature but only in the ionized or molecular form. Potassium is used for fertilizers and some varieties of glass. It is an essential nutritional element, but in excessive quantities it acts as a cathartic.
2.23.18. Barium (Ba) - Barium ions are not normally present in natural surface or ground waters in measurable concentrations although they have been detected in a few springs and in effluents from areas where barytes, BaSO4, or witherite, BaCO3, are mined. Barium and its salts are used in the metallurgical industry for special alloys, in the paint industry, in cements designed to withstand salt water, and in the ceramic and glass industries. Because of possible toxic effects on the heart, blood vessels and nerves a surface water supply standard of 1.0 mg/l was established.
2.23.19. Arsenic (As) - Arsenic may occur in water as a result of mineral dissolution, industrial discharges, or the application of insecticides. Arsenic is toxic to humans and accumulates in the body.
2.23.20. Selenium (Se) - Elemental selenium is practically nontoxic, but hydrogen selenide and other selenium compounds are extremely toxic and resemble arsenic in their physiological reactions. Selenium poisoning occurs mostly among livestock, and the toxic effects appear to be associated with the consumption of high concentrations of selenium in food, such as locoweed or grains grown in soils with high concentrations of selenium, rather than from water consumption. Selenium occurs in sulfur deposits, sulfides of metals, volcanic emissions, sedimentary rocks, organic-rich soils, and coal. Selenium is used in the electronics industry, xerographic copying machines, photoelectric cells, glass and ceramics, pigment manufacture to color plastics, paints, enamels, inks, and rubber. It is also used as a component of plating solutions. It can also be found in discharges from coal-fired power plants.
2.23.21. Mercury (Hg) - Mercury and mercuric salts are considered to be highly toxic to humans and aquatic life. Elemental mercury is inert chemically and insoluble in water, and is not likely to occur as a water pollutant. Mercuric salts occur in nature chiefly as the sulfide HgS, known as cinnabar, but numerous synthetic organic and inorganic salts of mercury are used commercially and industrially. They are used in medicinal products, disinfectants, detonators,
ISB STANDARD OPERATING PROCEDURES Page 59 Revised 12/10/2013
IV. WATER SAMPLE COLLECTION AND PRESERVATION
pigments, and photoengraving. Many of the mercuric and mercurous salts are highly soluble in water.
3. PESTICIDES AND ORGANICS 3.1. Pesticides - Pesticides are any substance or mixture of substances intended
for preventing, destroying, repelling, or mitigating insects, rodents, fungi, viruses, or weeds, and other forms of plant or animal life considered to be pests. Pesticides are categorized into three groups:
• Inorganic - arsenicals, mercurials, borates, and fluorides • Synthetic organic - chlorinated hydrocarbons, organic phosphates,
and thiocarbamates • Natural organic - rotenone, pyrethrum, and nicotine
Pesticides may also be classified by their biological usefulness as algaecides, acaricides, fungicides, and herbicides.
3.2. Organics - All organic compounds contain carbon in combination with one or more elements.
3.3. Collection Methods 3.3.1. Pesticides, semivolatile organics, and acid herbicides
a. Collect each sample (Pesticides, semivolatile organic & acid herbicides) into a separate 1 gallon amber glass jug with a Teflon-lined cap.
b. The sample is collected directly from the water body as a surface grab (0.15m deep).
c. Add sodium thiosulfate and cool to 4°C. d. Holding time is 7 days.
3.3.2. Purgeable Organics (VOA) a. Collect sample into three-40 ml Teflon vials, remove cap
underwater. b. When collecting in waters with no chlorine, use vials pre-
preserved by the Central Laboratory with sodium bisulfate (NaHSO4).
c. The vial should be filled and capped underwater (0.15m deep) with no air space in the vial. While keeping lid and bottle under water gently rock the lid and bottle to remove air bubbles (unless bottle is pre-preserved). The volatile organics vials should be completely filled to prevent volatilization, and extreme caution should be exercised when filling a vial to avoid any turbulence that could also produce volatilization.
d. When collecting in waters where chlorine is present, first preserve an empty vial with 0.6 g of ascorbic acid before filling and capping the vial underwater. After capping the vial, remove the vial above water, uncap, and add 0.25 g of sodium bisulfate leaving no air space before recapping the vial.
ISB STANDARD OPERATING PROCEDURES Page 60 Revised 12/10/2013
IV. WATER SAMPLE COLLECTION AND PRESERVATION
e. The three vials should be placed in a Ziploc bag in the cooler. A trip blank is also required. This is a vial filled at the laboratory with appropriate bottled water and placed in a Ziploc bag in the same cooler with the other VOA vials.
f. A separate laboratory sheet is filled out for the trip blank and this sample is used to determine if any contamination has occurred of the VOA samples.
h. Cool to 4°C.
3.3. Instructions for requesting a pesticide or organic analysis When a particular pesticide or organic is suspected or known to be present in a sample, its name should be entered on the laboratory form. With this information, the laboratory can focus immediately on the analytical methodology for determining the presence and concentration of the suspected pollutant and as a result possibly decrease the analysis time. A list of specific pesticides and organics currently analyzed at the Laboratory is available online: http://portal.ncdenr.org/web/wq/lab/ops/org .
ISB STANDARD OPERATING PROCEDURES Page 61 Revised 12/10/2013
V. SEDIMENT COLLECTION AND PRESERVATION
V. SEDIMENT COLLECTION AND PRESERVATION
1. COLLECTING SUSPENDED SEDIMENT 1.1. Samplers and Applications For more descriptive information about these samplers see references (Inter-Agency Committee on Water Resources 1965).
1.1.1. U.S. DH-48 – When in wadable streams 1.1.2. U.S. DH-59 [Equal Width Increment Method (E.W.I.)]
1.1.2.1 Used When a. Too deep for wading but less than 15 feet deep. b. From low bridges. c. Velocities less than approximately 5 ft/ sec.
1.1.2.2 Sampling Tips a. Set out safety equipment (cones, high visibility vests,
etc.) as necessary and assemble sampling equipment. Note: Prior to using any sampler, it should be thoroughly cleaned and inspected.
b. Rinse sampler with distilled water before the first station and between stations to wash away any contaminants.
c. Use the upstream side of bridges if possible. d. Go to midstream or the area where most of the flow is
occurring. First sampling point must be made where the flow is greatest.
e. Lower and raise the sampler at a consistent rate with the nozzle oriented upstream to the bottom, immediately reverse it and raise to above the water surface. Repeat until jar is filled within approximately 3 inches of the top of the jar (350-440 cc). Rate must not exceed 0.4 times the mean velocity and must be fast enough to keep from overfilling.
f. If bottle overfills - discard sample, rinse bottle, and collect again. Use a smaller nozzle or a faster transit rate.
g. Raise the sampler and pour contents into a cleaned sample splitter. For cleaning instructions see USGS references. The sample splitter should be rinsed with distilled water before the first station and between stations.
h. Sample at the next sampling point and place contents into a mixing churn.
ISB STANDARD OPERATING PROCEDURES Page 62 Revised 12/10/2013
V. SEDIMENT COLLECTION AND PRESERVATION
i. Ideally try for 3 sampling points, midstream and quarter points, but the situation might indicate otherwise (if maximum flow is not midstream). Sampling points should be equally spaced.
j. If more sample is needed for the churn, take a second set of samples at the same transit rate at all verticals.
k. Churn sample at a uniform rate of about nine inches per second. Disc should touch the bottom of the tank on every stroke and the stroke length should be as long as possible without breaking the water surface.
l. After churning for about l0 strokes, withdraw sub-samples and place in ½ liter bottles. As sub-samples are withdrawn, maintain churning rate. If there is a break in withdrawals, the stirring rate must be re-established before withdrawals can continue.
1.2. Variations on Suspended Sediment Sampling
1.2.1. When suspended materials in the stream are uniformly distributed, a representative sample can be obtained by sampling vertically at one location near the center of the flow.
1.2.2. Use surface or dip sampling instead of depth integrated sampling when:
• Stream velocity is too high. • Large floating and moving submerged debris is in the stream. • A depth-integrated sampler is not available. • The depth of the stream is very shallow.
2. COLLECTING BOTTOM SEDIMENT 2.1. Containers and Volumes
2.1.1. Sample Containers a. Use certified jars for sediment samples or as indicated by
Chemistry Laboratory. b. Use Teflon lid or parafilm between jar and lid for nutrients and
all metals. c. Tin foil can be used between jar and lid for all metals except
aluminum. d. Use Teflon lid or tinfoil for pesticides.
2.1.2 Required volume • One pint of sample must be obtained for analyses of metals,
nutrients, and organics.
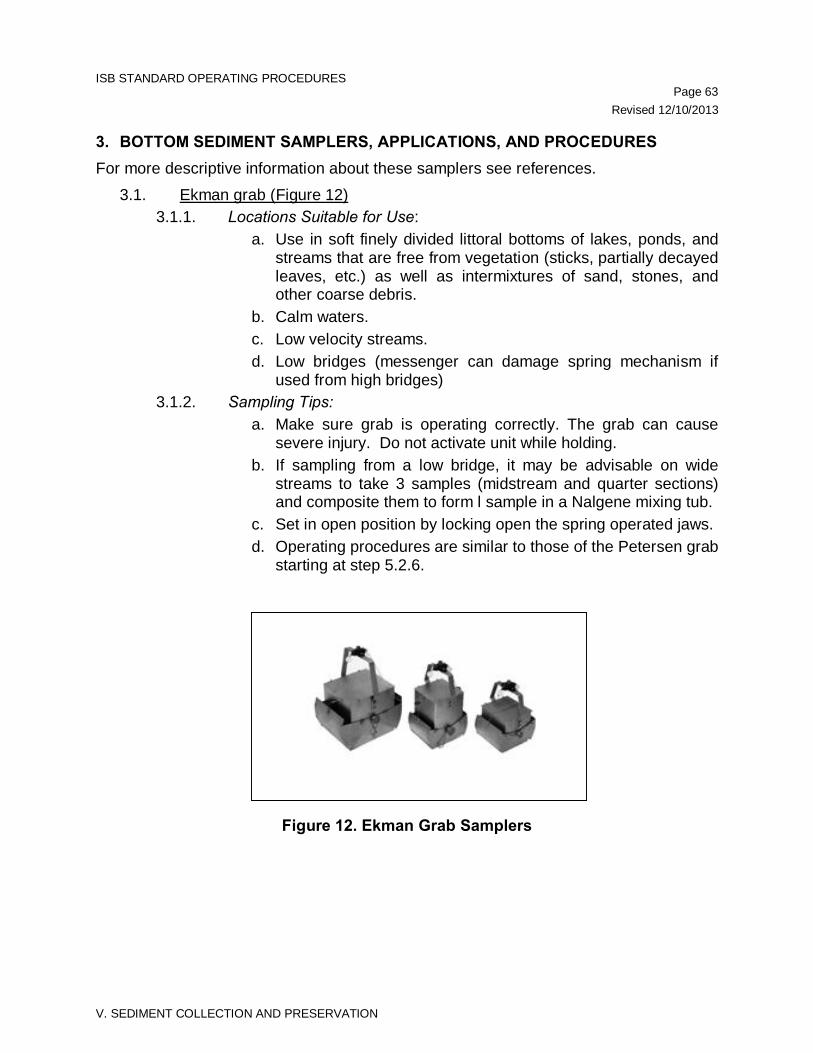
ISB STANDARD OPERATING PROCEDURES Page 63 Revised 12/10/2013
V. SEDIMENT COLLECTION AND PRESERVATION
3. BOTTOM SEDIMENT SAMPLERS, APPLICATIONS, AND PROCEDURES For more descriptive information about these samplers see references.
3.1. Ekman grab (Figure 12) 3.1.1. Locations Suitable for Use:
a. Use in soft finely divided littoral bottoms of lakes, ponds, and streams that are free from vegetation (sticks, partially decayed leaves, etc.) as well as intermixtures of sand, stones, and other coarse debris.
b. Calm waters. c. Low velocity streams. d. Low bridges (messenger can damage spring mechanism if
used from high bridges) 3.1.2. Sampling Tips:
a. Make sure grab is operating correctly. The grab can cause severe injury. Do not activate unit while holding.
b. If sampling from a low bridge, it may be advisable on wide streams to take 3 samples (midstream and quarter sections) and composite them to form l sample in a Nalgene mixing tub.
c. Set in open position by locking open the spring operated jaws. d. Operating procedures are similar to those of the Petersen grab
starting at step 5.2.6.
Figure 12. Ekman Grab Samplers
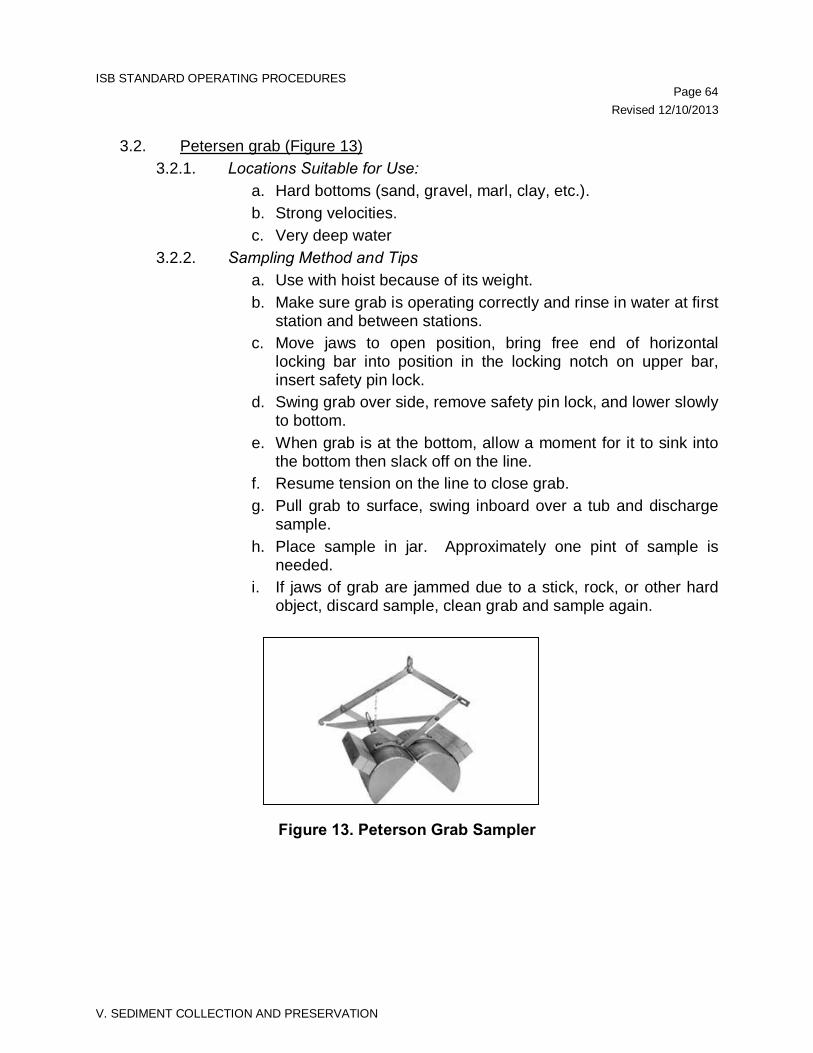
ISB STANDARD OPERATING PROCEDURES Page 64 Revised 12/10/2013
V. SEDIMENT COLLECTION AND PRESERVATION
3.2. Petersen grab (Figure 13) 3.2.1. Locations Suitable for Use:
a. Hard bottoms (sand, gravel, marl, clay, etc.). b. Strong velocities. c. Very deep water
3.2.2. Sampling Method and Tips a. Use with hoist because of its weight. b. Make sure grab is operating correctly and rinse in water at first
station and between stations. c. Move jaws to open position, bring free end of horizontal
locking bar into position in the locking notch on upper bar, insert safety pin lock.
d. Swing grab over side, remove safety pin lock, and lower slowly to bottom.
e. When grab is at the bottom, allow a moment for it to sink into the bottom then slack off on the line.
f. Resume tension on the line to close grab. g. Pull grab to surface, swing inboard over a tub and discharge
sample. h. Place sample in jar. Approximately one pint of sample is
needed. i. If jaws of grab are jammed due to a stick, rock, or other hard
object, discard sample, clean grab and sample again.
Figure 13. Peterson Grab Sampler
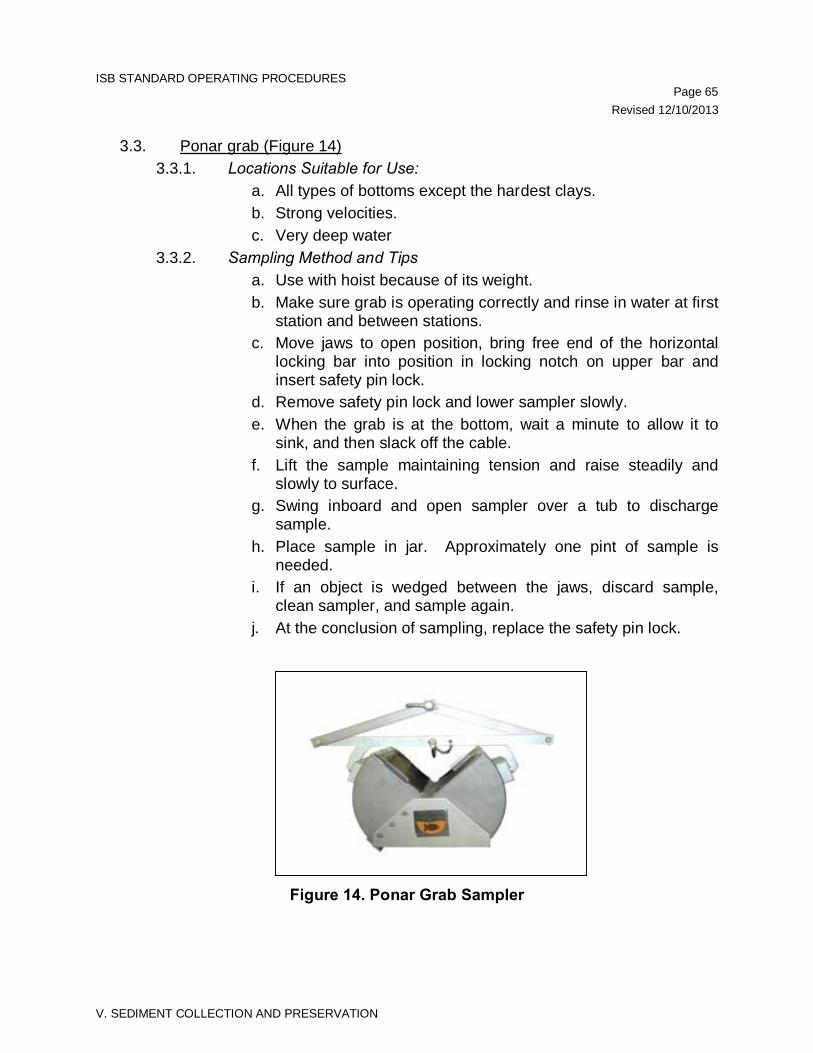
ISB STANDARD OPERATING PROCEDURES Page 65 Revised 12/10/2013
V. SEDIMENT COLLECTION AND PRESERVATION
3.3. Ponar grab (Figure 14) 3.3.1. Locations Suitable for Use:
a. All types of bottoms except the hardest clays. b. Strong velocities. c. Very deep water
3.3.2. Sampling Method and Tips a. Use with hoist because of its weight. b. Make sure grab is operating correctly and rinse in water at first
station and between stations. c. Move jaws to open position, bring free end of the horizontal
locking bar into position in locking notch on upper bar and insert safety pin lock.
d. Remove safety pin lock and lower sampler slowly. e. When the grab is at the bottom, wait a minute to allow it to
sink, and then slack off the cable. f. Lift the sample maintaining tension and raise steadily and
slowly to surface. g. Swing inboard and open sampler over a tub to discharge
sample. h. Place sample in jar. Approximately one pint of sample is
needed. i. If an object is wedged between the jaws, discard sample,
clean sampler, and sample again. j. At the conclusion of sampling, replace the safety pin lock.
Figure 14. Ponar Grab Sampler
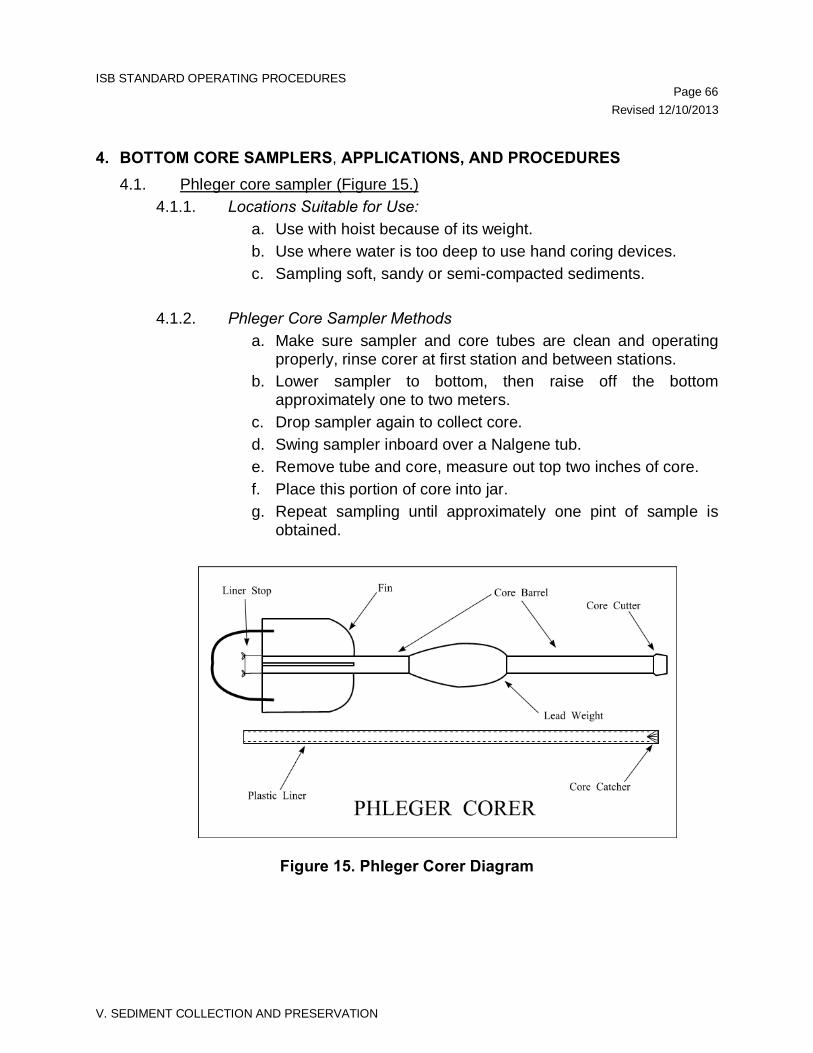
ISB STANDARD OPERATING PROCEDURES Page 66 Revised 12/10/2013
V. SEDIMENT COLLECTION AND PRESERVATION
4. BOTTOM CORE SAMPLERS, APPLICATIONS, AND PROCEDURES 4.1. Phleger core sampler (Figure 15.)
4.1.1. Locations Suitable for Use: a. Use with hoist because of its weight. b. Use where water is too deep to use hand coring devices. c. Sampling soft, sandy or semi-compacted sediments.
4.1.2. Phleger Core Sampler Methods
a. Make sure sampler and core tubes are clean and operating properly, rinse corer at first station and between stations.
b. Lower sampler to bottom, then raise off the bottom approximately one to two meters.
c. Drop sampler again to collect core. d. Swing sampler inboard over a Nalgene tub. e. Remove tube and core, measure out top two inches of core. f. Place this portion of core into jar. g. Repeat sampling until approximately one pint of sample is
obtained.
Figure 15. Phleger Corer Diagram
ISB STANDARD OPERATING PROCEDURES Page 67 Revised 12/10/2013
V. SEDIMENT COLLECTION AND PRESERVATION
4.2. Wildco Light Duty Model 2414 Core Sampler 4.2.1. Locations Suitable for Use:
a. Use by hand or on the end of a line. b. Where sediment is relatively soft.
4.2.2. Wildco Light Duty Model 2414 Core Sampler Methods a. Make sure sampler and core tubes are clean and operating
properly, rinse corer at first station and between stations. b. Lower sampler to bottom, raise again and drop if necessary to
take sample. c. Remove plastic core, measure out top two inches of core. d. Place this portion of core into jar. e. Repeat sampling until approximately one pint of sample is
obtained. 4.3. Hand coring device– for shallow water use.
4.3.1 Procedure for hand coring device: a. Make sure sampler is clean before using. Rinse before first
station and between stations. b. Take sample by turning sampler into sediment. c. Remove sampler and core. d. Measure out top two inches of core. e. Place this into jar. f. Repeat sampling until approximately one pint of sample is
obtained. 4.4. Hand Sampling Method
a. Face upstream in shallow, wadable streams. b. Make sure that spoon or scoop has been thoroughly cleaned. c. Scoop the sample directly into the jar and get a representative
sample. It may be advisable to take several samples and consolidate (midstream and quarter points).
ISB STANDARD OPERATING PROCEDURES Page 68 Revised 12/10/2013
VI. STANDARD CLEANING PROCEDURES
VI. STANDARD CLEANING PROCEDURES
1. GENERAL The procedures outlined in this section are to be used by all personnel to clean sampling equipment and sample containers prior to field use. These procedures assure the standard operating procedures (SOP) for the Section; any deviation from them must be documented in field records and investigative reports. All equipment and sample containers that are cleaned using these procedures will be tagged, labeled or marked with the following information:
• Name of person cleaning equipment or containers
• Date equipment or containers were cleaned
• Any deviation from SOP that was employed
All equipment and reusable sample containers used to collect samples will be identified at the conclusion of sampling activities. Any problems encountered with the equipment or needed repairs will also be noted. Equipment or reusable sample containers needing cleaning or repairs should not be stored with clean equipment, sample tubing or sample containers. Equipment, reusable sample containers, disposable sample containers, and sample tubing that are not used during the course of an investigation may not be replaced in storage without being re-cleaned if these materials are transported to a facility or study site where herbicides, pesticides, organic or other toxic materials are present or suspected of being present. All portions of unused coils of tubing that are returned shall be re-cleaned before being restocked. If these materials are transported to a facility in connection with a routine inspection or study where toxic or organic materials are not known or not suspected of being present, they may be placed back in storage without being cleaned. Sufficiently clean equipment and sample containers should be transported to the field so that an entire study can be conducted without the need for cleaning equipment in the field. However, this will not always be possible when using coring equipment, dredges, buckets, water samplers, pumps and other such equipment. Field cleaning procedures are included to cover these special problems. Emergency field sample container cleaning procedures are also included; however, they should not be used unless absolutely necessary. Specific cleaning procedures are included in the following paragraphs.
ISB STANDARD OPERATING PROCEDURES Page 69 Revised 12/10/2013
VI. STANDARD CLEANING PROCEDURES
2. AUTOMATIC SAMPLING EQUIPMENT 2.1. General Cleaning
2.1.1. For All Automatic Samplers a. The exterior and accessible interior (excluding the waterproof
timing mechanism) portions of automatic samplers will be washed with phosphate free laboratory detergent and rinsed with tap water.
b. The face of the timing case mechanism will be cleaned with a damp cloth.
c. All sample intake tubing will be discarded after use. Pump tubing should be cleaned with pesticide grade solvents.
d. New pre-cleaned, silicone pump tubing (see section on cleaning tubing) will be installed with the aluminum or Teflon tubing caps intact.
f. When using the samplers for collecting samples for metals and/or organic samples, the metal distributor tubes should not be used for this purpose.
g. The automatic samplers should not be used for collecting samples for organic analyses in the individual bottle mode since there is no way to properly clean the distributor plate to remove any residual organic compounds. The sample tubing headers may not be used to collect samples for organic analyses for the same reason.
2.2. ISCO Specific Cleaning Procedures 2.2.1. Automatic sampler rotary funnel, distributor and metal tube
a. Use only for non-organic sample collection using individual sequential bottles.
b. Clean with hot water, phosphate free laboratory detergent and a brush.
c. Rinse thoroughly with hot tap water. d. Rinse thoroughly with distilled water. e. Replace in sampler.
2.2.2. Automatic sampler headers a. Rinse entire header with hot water, a bottle brush, and
phosphate free laboratory detergent. b. Disassemble header and rinse thoroughly with hot tap water,
using a brush to remove particulate matter and surface films. c. Rinse plastic portion of the header with 20 percent nitric acid.
Do not use acid on metal parts. d. Rinse thoroughly with tap water. e. Reassemble header and rinse with distilled water. f. Let dry thoroughly and wrap with aluminum foil.
ISB STANDARD OPERATING PROCEDURES Page 70 Revised 12/10/2013
VI. STANDARD CLEANING PROCEDURES
g. Headers may not be used when collecting samples for organic analyses.
2.2.3. Glass reusable composite containers (2 ½, 3 and 5 gallon capacities) a. After using, rinse with water in the field, seal with aluminum foil
to keep the interior of the container wet and return to the laboratory.
b. Wash thoroughly with hot tap water and phosphate free laboratory detergent, using a bottle brush to remove particulate matter and surface film.
c. Rinse thoroughly with hot tap water. d. Wash with 10 percent nitric acid. e. Rinse thoroughly with tap water (at least 3 times). f. Rinse thoroughly with distilled water (at least 3 times). g. Rinse thoroughly with acetone (pesticide grade). Caution:
Acetone must be removed before using. Residual acetone will interfere with certain analyses.
h. Rinse twice with distilled H20. Allow to air dry,
i. Cap with aluminum foil or Teflon film. j. Do not use composite containers used to collect samples at
facilities manufacturing pesticides, herbicides or other toxic or noxious compounds. These are to be properly disposed of at the DWR Chemistry Laboratory.
k. Glass composite containers used to collect in-process wastewater samples at industrial facilities will be discarded after sampling.
l. Any bottles that have a visible film scale or discoloration remaining after this cleaning procedure are to be discarded.
2.2.4. Glass sequential sample bottles (automatic sampler base for sequential mode)
a. Rinse bottles in the field after using with tap water and seal with aluminum foil or cap for return to laboratory.
b. Rinse thoroughly with hot tap water. c. Wash with 20 percent nitric acid. d. Rinse thoroughly with tap water. e. Place in dishwasher - phosphate free detergent cycle followed
by tap and distilled water rinse cycles. f. Replace in covered, automatic sampler base; cover with
aluminum foil for storage. 2.2.5. Bottle siphons
a. Use a new siphon for each sampling location. b. Pre-rinse the 3/8 inch Teflon tubing (used to make siphons for
organic analyses) as in Teflon tubing cleaning instructions.
ISB STANDARD OPERATING PROCEDURES Page 71 Revised 12/10/2013
VI. STANDARD CLEANING PROCEDURES
c. Flush the PVC 3/8 inch tubing used for samples other than those collected for organic analyses with sample before use.
2.2.6. Teflon composite mixer rods - Use the sample cleaning procedure outlined for glass reusable
composite containers above. 2.2.7. Automatic sampler rubber pump tubing
- Only new pre-rinsed tubing should be used for each automatic sampler set up a. Rinse tubing with hot tap water for five minutes. b. Rinse outside of tubing with hexane. c. Install in automatic sampler. d. Cap both ends of tubing with aluminum foil or Teflon film.
2.2.8. Teflon sampler tubing (pure Teflon or Teflon lined) a. If required length is known pre-cut Teflon tubing or clean l00
feet coil intact. b. Rinse outside of tubing with hexane. c. Flush interior of tubing with hexane. d. Air dry. e. Cap each end of tubing with aluminum foil or Teflon tape and
completely wrap the coil of Teflon tubing with aluminum foil to prevent contamination.
2.2.9. Polyvinyl chloride sample (PVC) tubing (1/18, l/l4, or 3/8 Inch) a. Use only new tubing. b. Use in selective sampling where organics are not of concern. c. Flush the tube with sample immediately after the sampler is
set up at the sampling site to remove any residues from the manufacturing or extruding process.
d. Store tubing in original container and do not removed from this container until needed.
2.2.10. Stainless steel tubing Tubing will be flushed in the field with tap water after use and cleaned as follows upon return to the laboratory: a. Wash with phosphate free laboratory detergent and a long
bottle brush. b. Rinse with hot water for 5 minutes. c. Rinse with acetone. d. Rinse with distilled water for one minute. e. Air dry. f. Rinse with hexane. g. Completely wrap tubing, including ends, with aluminum foil to
prevent contamination during storage.
ISB STANDARD OPERATING PROCEDURES Page 72 Revised 12/10/2013
VI. STANDARD CLEANING PROCEDURES
3. MISCELLANEOUS SAMPLING AND FLOW MEASURING EQUIPMENT Miscellaneous flow measuring and sampling equipment should be washed with phosphate free laboratory detergent and rinsed with hot tap water before being stored. For Lablines, rinse at least three times with distilled deionized water and cover the top of the Labline with foil to prevent contamination and to show that the Labline has been cleaned. A different procedure is used for any equipment utilized in organic or toxics sampling.
4. STAINLESS STEEL SAMPLING EQUIPMENT For collecting samples for organic analyses:
4.1. Follow the procedures given in the Automatic Sampler Section, Glass Reusable Composite Containers, but omit acid rinse.
4.2. Wrap equipment completely in aluminum foil to prevent contamination during storage.
5. OTHER FIELD INSTRUMENTATION NOTE: Where available, always follow the manufacturer’s recommendations for cleaning the device (see Appendices 1-4). The exterior of sealed, watertight equipment such as Labline Samplers and field meters should be washed with a mild detergent (liquid dishwashing detergent, for example) and rinsed with tap water before storage. The interior of such equipment may be wiped with a damp cloth if necessary. Other field instrumentation should be wiped with a damp cloth. Probes for pH, conductivity, DO, etc. should be rinsed with distilled water before storage. The desiccant in flow meters and other equipment should be checked and replaced if necessary each time the equipment is cleaned. Keep meters clean and in good operating condition. Probes should be rinsed at the end of each sampling day, properly stored and cleaned on a regular basis.
6. ICE CHESTS AND SHIPPING CONTAINERS All ice chests and reusable shipping containers will be washed with a mild detergent (interior and exterior) and rinsed with tap water and air dried before storage.
ISB STANDARD OPERATING PROCEDURES Page 73 Revised 12/10/2013
VI. STANDARD CLEANING PROCEDURES
7. FIELD CLEANING PROCEDURES For routine operations involving classic parameter analyses, water quality sampling equipment such as Kemmerers, buckets, DO dunkers, dredges, etc. may be cleaned with sample or tap water between sampling locations. A brush may be used to remove deposits of material or sediment if necessary. Flow measuring equipment such as weirs, staff gages, velocity meters, and other stream gauging equipment should be cleaned with tap water after use and between measuring locations. When sampling equipment (not tubing) is to be utilized for collecting organic or toxic samples, the following cleaning procedure is to be used between sampling locations:
• Clean with tap water and brush if necessary. • Rinse with pesticide grade acetone. • Rinse thoroughly with tap water (if available). • Rinse with distilled water.
It must be emphasized that these procedures are only to be used in the field. All equipment will be cleaned before storage at the laboratory utilizing the procedures previously outlined.
8. VEHICLES All vehicles used by staff should be washed on a routine basis. This routine maintenance should minimize any chance of contamination of equipment or samples due to contamination of vehicles. When vehicles are used in conjunction with hazardous waste site inspections, or on studies where pesticides, herbicides, organic materials or other toxic matter are known or suspected to be present, a thorough interior and exterior cleaning is mandatory at the conclusion of such investigations. All vehicles shall be equipped with trash bags and/or trash containers to facilitate vehicle cleaning. All contaminated trash and equipment must be kept separate from ordinary trash and must be disposed of properly on-site or on return to the facility.
9. DISPOSABLE SAMPLE CONTAINERS All disposable sample containers will be stored in their original packing containers in a clean, dust free environment. When any packing container is opened, all disposable sample containers inside should be immediately capped if they are found uncapped.
ISB STANDARD OPERATING PROCEDURES Page 74 Revised 12/10/2013
VII. TIME-OF-TRAVEL & DYE TRACING
VII. TIME-OF-TRAVEL & DYE TRACING
1. FLUORESCENT DYE The preferred dye for use in time-of travel studies by the North Carolina Division of Water Resources is Rhodamine W. T. (20%) solution. This is a red fluorescent dye which mixes well with water and is easily detected through visual means under high concentrations and through the use of a fluorometer for concentrations to as low as 0.01 parts per billion. Rhodamine WT has properties essential for water tracing studies. Rhodamine WT is:
• water soluble, • highly detectable-strongly fluorescent, • fluorescent in a part of the spectrum not common to materials generally
found in water, thereby reducing the problem of background fluorescence,
• harmless in low concentrations, • inexpensive, and • reasonably stable in a normal water environment (Wilson, Cobb &
Kilpatrick, 1986). Rhodamine dye can also be used to determine such things as short-circuiting in wastewater treatment plants, outlets from storm drains, septic tank leakage, etc. Most of ISB’s dye studies are performed as part of a waste-load allocation model. This model requires that a stream be segmented into different reaches based upon predicted stream velocities, stream morphology, total distance of the study area, and major inputs from dischargers and tributaries. A dye sampling station is required in each of these reaches. 1.1. Safety
(MSDS is kept with dye container) 1.1.1. Personal Protection
a. Latex or vinyl gloves (in lab and field). b. Goggles c. Ventilated room d. Apron
ISB STANDARD OPERATING PROCEDURES Page 75 Revised 12/10/2013
VII. TIME-OF-TRAVEL & DYE TRACING
1.1.2. Emergency and First Aid Procedure a. Inhalation:
- move to fresh air. - Give oxygen and medical help if breathing is difficult.
b. Eye contact: - Flush eyes with flowing water for at least 15 minutes, holding
eyelids apart to irrigate thoroughly. - Get medical attention right away.
c. Skin contact: - Wash affected skin areas thoroughly with soap and water. - If irritation develops, consult a physician.
d. Ingestion: - If swallowed, dilute with water and induce vomiting. - Get immediate medical attention. - Never give fluids or induce vomiting if patient is unconscious
or has convulsions. 1.2. Equipment - Fluorometer
1.2.1. Turner Designs Model 110 - reads dye concentrations directly in ppb. Operating instructions are contained in the Turner Designs Model 10 Operators manual, section 3-operations.
1.2.2. Turner Model 10-AU - reads dye concentrations in ppb. Operating instructions are contained in the Turner Designs Model 10-AU operating manual.
2. PRE-SURVEY 2.1. Surface Water Supplies
2.1.1. Identify all surface water supplies in or downstream from the study area.
2.1.2. Notify each water supply operator that may be affected in the study area, the DENR - Division of Water Resources regional water quality supervisor that a dye study is scheduled to be performed. Explain the reason for the study and inform the water treatment operator that DWR personnel will monitor dye concentrations at their water intake. If dye concentrations in the river exceed 10 ppb, the facility will be informed to shutdown their operation until river dye concentrations fall below 10 ppb. All efforts should be made to calculate a dye dosage that will result in a dye concentration at a water supply significantly below the 10 ppb.
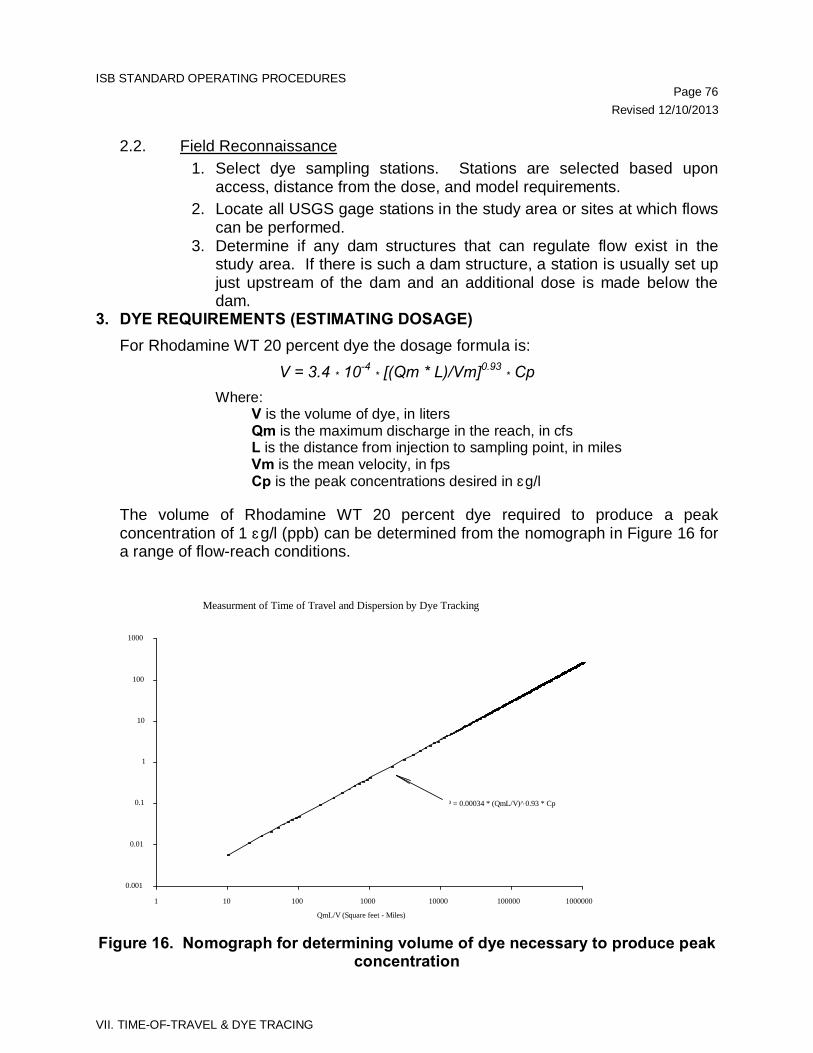
ISB STANDARD OPERATING PROCEDURES Page 76 Revised 12/10/2013
VII. TIME-OF-TRAVEL & DYE TRACING
2.2. Field Reconnaissance 1. Select dye sampling stations. Stations are selected based upon
access, distance from the dose, and model requirements. 2. Locate all USGS gage stations in the study area or sites at which flows
can be performed. 3. Determine if any dam structures that can regulate flow exist in the
study area. If there is such a dam structure, a station is usually set up just upstream of the dam and an additional dose is made below the dam.
3. DYE REQUIREMENTS (ESTIMATING DOSAGE) For Rhodamine WT 20 percent dye the dosage formula is:
V = 3.4 * 10-4 * [(Qm * L)/Vm]0.93 * Cp Where:
V is the volume of dye, in liters Qm is the maximum discharge in the reach, in cfs L is the distance from injection to sampling point, in miles Vm is the mean velocity, in fps Cp is the peak concentrations desired in μg/l
The volume of Rhodamine WT 20 percent dye required to produce a peak concentration of 1 μg/l (ppb) can be determined from the nomograph in Figure 16 for a range of flow-reach conditions.
Measurment of Time of Travel and Dispersion by Dye Tracking
QmL/V (Square feet - Miles)
0.001
0.01
0.1
1
10
100
1000
1 10 100 1000 10000 100000 1000000
³ = 0.00034 * (QmL/V) ̂0.93 * Cp
Figure 16. Nomograph for determining volume of dye necessary to produce peak
concentration
ISB STANDARD OPERATING PROCEDURES Page 77 Revised 12/10/2013
VII. TIME-OF-TRAVEL & DYE TRACING
4. INJECTION OF DYE 4.1. Injection Types
4.1.1. Single Slug Injection a. A single slug injection of dye is usually made in the center of
the thread of flow. b. The desired quantity of dye as calculated in part 3 (above) can
be poured into the stream from a container. 4.1.2. Continuous injection
a. The desired quantity of dye is pumped into the water column at a fixed rate for a fixed time using an ISCO sampler or a peristaltic pump. Tubing is run from the pump to the desired dye injection point. Contaminated pump lines are first flushed with stream water and then placed in plastic bags for shipment back to the lab.
5. COLLECTION OF WATER SAMPLES Samples should be taken in pre-numbered glass bottles by a hand sampler or by ISCO samplers. Care should be taken to collect samples in the peak concentration of the dye cloud, i.e. do not sample midstream if the dye cloud is along one stream bank. 5.1. Dye Sample Collection
5.1.1. Data recorded on field sheets (Figure 17) a. Station Location-Sampling Point b. Date c. Sample Bottle Number d. Time e. Name of Sampler
5.1.2. Methods and Guidance a. At least one background sample is needed for measurement
of background fluorescence at each site in the study reach before the dye arrives.
b. Sampling should begin early enough to determine the true dye peak.
c. Sampling should continue until a peak has been determined; and until a decreasing trend has been clearly established.
5.5.1. Sampling Schedule a. The schedule for collecting samples at each sampling site is
the most uncertain aspect of the plan.
ISB STANDARD OPERATING PROCEDURES Page 78 Revised 12/10/2013
VII. TIME-OF-TRAVEL & DYE TRACING
b. Estimates of the time to begin sampling, time intervals between samples, and the duration of sampling must be made, which will ensure adequate definition of the dye cloud passing each site. It is better to start with more frequent sampling and decrease frequency based on sampling results when travel times are unknown.
c. An estimate of the time-of-travel between sampling sites is usually based on the cloud's movement to the first sampling site downstream of the injection site.
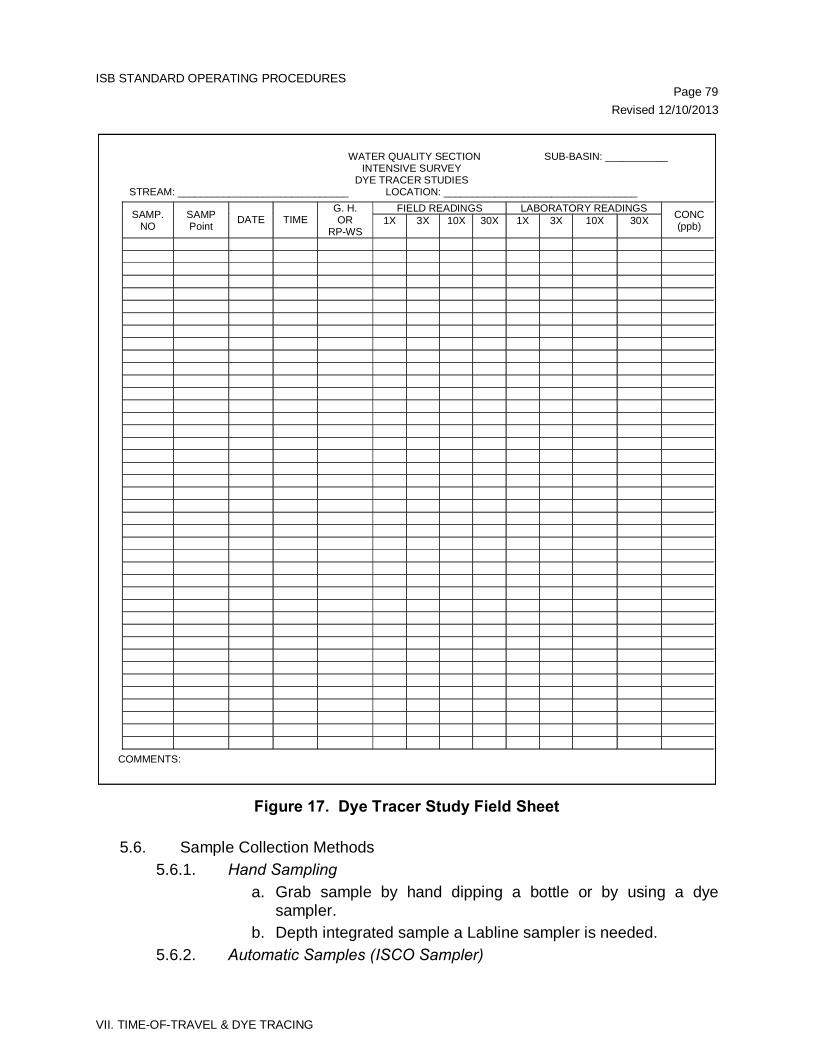
ISB STANDARD OPERATING PROCEDURES Page 79 Revised 12/10/2013
VII. TIME-OF-TRAVEL & DYE TRACING
Figure 17. Dye Tracer Study Field Sheet
5.6. Sample Collection Methods 5.6.1. Hand Sampling
a. Grab sample by hand dipping a bottle or by using a dye sampler.
b. Depth integrated sample a Labline sampler is needed. 5.6.2. Automatic Samples (ISCO Sampler)
WATER QUALITY SECTION SUB-BASIN: ___________
INTENSIVE SURVEY DYE TRACER STUDIES
STREAM: ______________________________ LOCATION: __________________________________
SAMP. NO
SAMP Point DATE TIME
G. H. OR
RP-WS
FIELD READINGS LABORATORY READINGS CONC (ppb) 1X 3X 10X 30X 1X 3X 10X 30X
COMMENTS:
ISB STANDARD OPERATING PROCEDURES Page 80 Revised 12/10/2013
VII. TIME-OF-TRAVEL & DYE TRACING
a. Samples can be analyzed directly from the ISCO bottles, however, if the ISCO bottles are needed to continue sampling the samples can be transferred to numbered glass bottles.
b. Label bottle racks. c. To reuse ISCO bottle, rinse three times using tap water or if
tap water is unavailable uncontaminated stream water can be used.
6. FLUOROMETER USE Refer to fluorometer manufacturer’s operating instructions for specific procedures and service instructions. The Turner Designs Model 10 Fluorometer has two main scales; an X1 and an X100. When the fluorometer is in the X1 position, the sensitivity of the instrument is as indicated by the range lights. When the fluorometer is in the X100 position, the sensitivity of the instrument is 100 times that indicated by the range lights. The scale for the Turner Designs Model 10 Fluorometer is:
Scale Range Concentration (ppb) X100 X10 0-1 X100 minimum sensitivity 1-10 X1 X10 10-100 X1 minimum sensitivity 100-1000
6.1. Fluorometer Usage 6.1.1. Calibration-
(Fluorometric Procedures for Dye Tracing, Book 3, Chapter A12, Revised 1986.)
a. Use a range of dye concentrations (ex. 1 μg/l, 10 μg/l, 50 μg/l, 100 μg/l with μg/l=ppb) to calibrate the fluorometer prior to a dye study.
b. Calibrate all fluorometer at 1 ppb – DWR preference. c. Calibrate fluorometer prior to taking out in the field, before
running samples in the field, and before running samples in the lab
ISB STANDARD OPERATING PROCEDURES Page 81 Revised 12/10/2013
VII. TIME-OF-TRAVEL & DYE TRACING
6.1.2. Sample Collection a. Prepare solution standards- Dye standards of known
concentrations should be prepared in accordance with the U. S. Geological Survey’s dye tracing procedures contained in Turn the fluorometer on and allow it to stabilize for at least 10 minutes.
b. Use a distilled water blank to zero the instrument. c. Rinse the cuvette with water from the sample bottle before
running that sample. Wipe off moisture from the outside of the cuvette.
d. Run samples. e. Record measurements on the field sheet. f. Keep samples for future analysis, especially if peak
concentration is questionable.
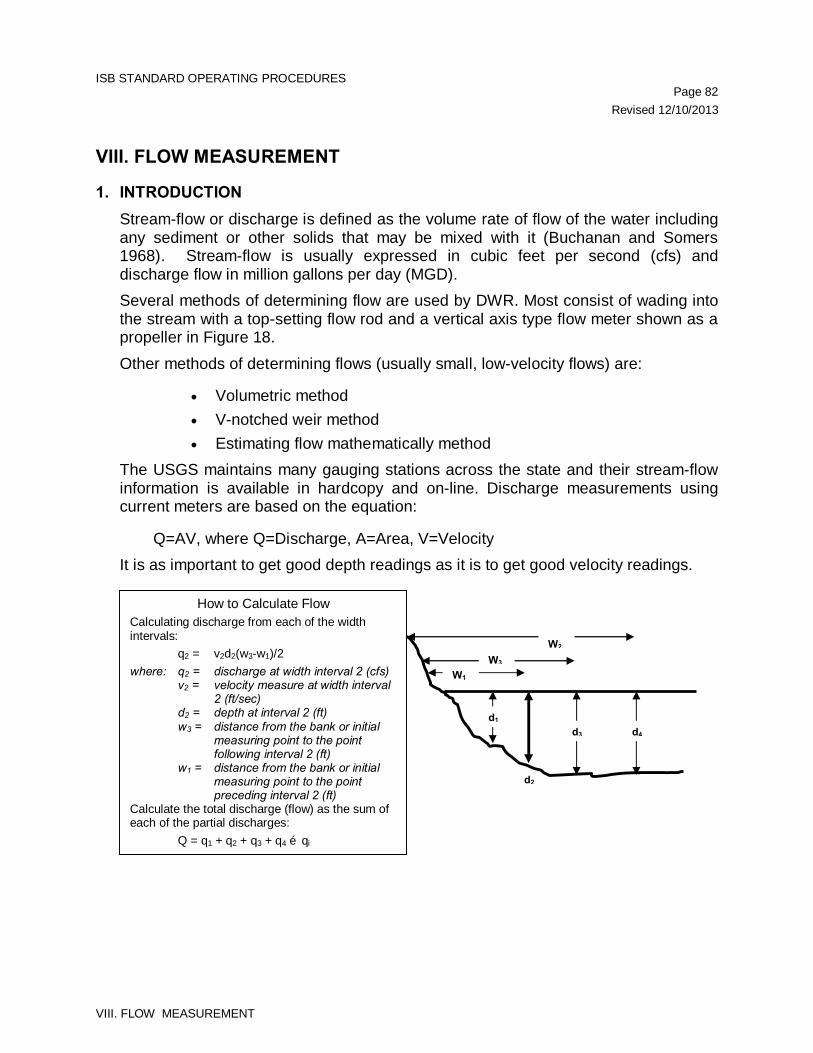
ISB STANDARD OPERATING PROCEDURES Page 82 Revised 12/10/2013
VIII. FLOW MEASUREMENT
VIII. FLOW MEASUREMENT
1. INTRODUCTION Stream-flow or discharge is defined as the volume rate of flow of the water including any sediment or other solids that may be mixed with it (Buchanan and Somers 1968). Stream-flow is usually expressed in cubic feet per second (cfs) and discharge flow in million gallons per day (MGD). Several methods of determining flow are used by DWR. Most consist of wading into the stream with a top-setting flow rod and a vertical axis type flow meter shown as a propeller in Figure 18. Other methods of determining flows (usually small, low-velocity flows) are:
• Volumetric method • V-notched weir method • Estimating flow mathematically method
The USGS maintains many gauging stations across the state and their stream-flow information is available in hardcopy and on-line. Discharge measurements using current meters are based on the equation:
Q=AV, where Q=Discharge, A=Area, V=Velocity It is as important to get good depth readings as it is to get good velocity readings.
How to Calculate Flow Calculating discharge from each of the width intervals: q2 = v2d2(w3-w1)/2 where: q2 = discharge at width interval 2 (cfs) v2 = velocity measure at width interval
2 (ft/sec) d2 = depth at interval 2 (ft) w3 = distance from the bank or initial
measuring point to the point following interval 2 (ft)
w1 = distance from the bank or initial measuring point to the point preceding interval 2 (ft)
Calculate the total discharge (flow) as the sum of each of the partial discharges: Q = q1 + q2 + q3 + q4 …qi
W3 W2
W1
d2
d1 d3 d4
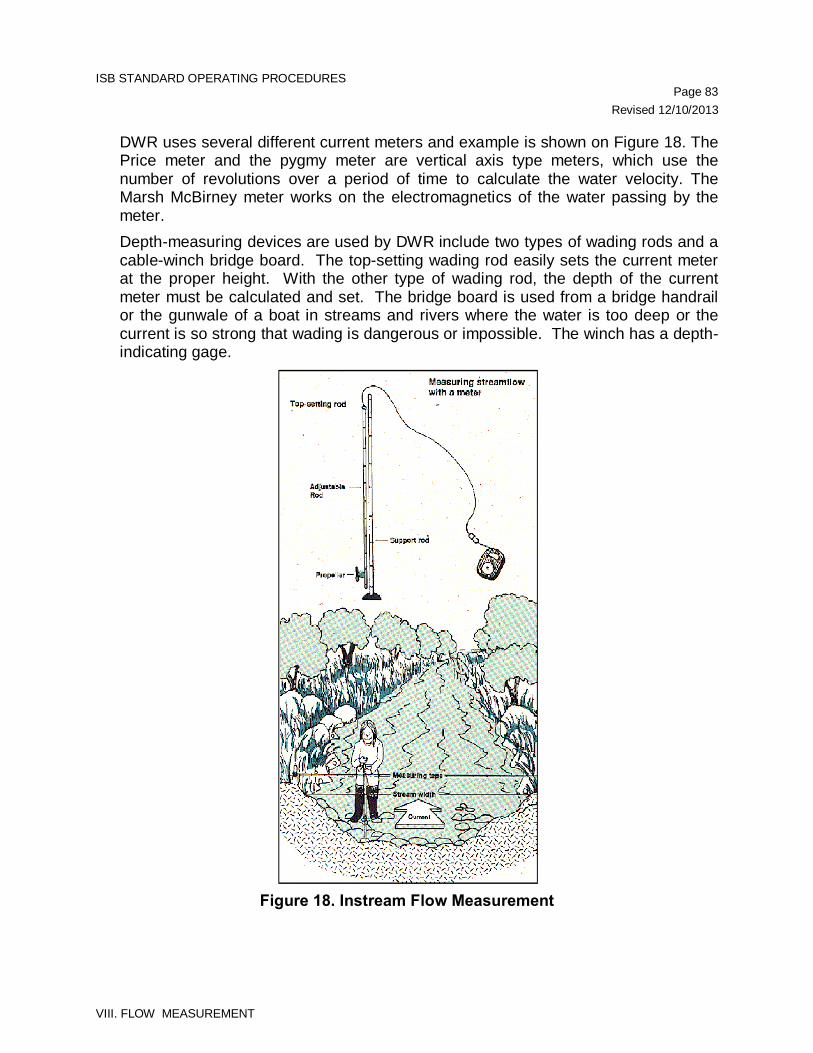
ISB STANDARD OPERATING PROCEDURES Page 83 Revised 12/10/2013
VIII. FLOW MEASUREMENT
DWR uses several different current meters and example is shown on Figure 18. The Price meter and the pygmy meter are vertical axis type meters, which use the number of revolutions over a period of time to calculate the water velocity. The Marsh McBirney meter works on the electromagnetics of the water passing by the meter. Depth-measuring devices are used by DWR include two types of wading rods and a cable-winch bridge board. The top-setting wading rod easily sets the current meter at the proper height. With the other type of wading rod, the depth of the current meter must be calculated and set. The bridge board is used from a bridge handrail or the gunwale of a boat in streams and rivers where the water is too deep or the current is so strong that wading is dangerous or impossible. The winch has a depth-indicating gage.
Figure 18. Instream Flow Measurement
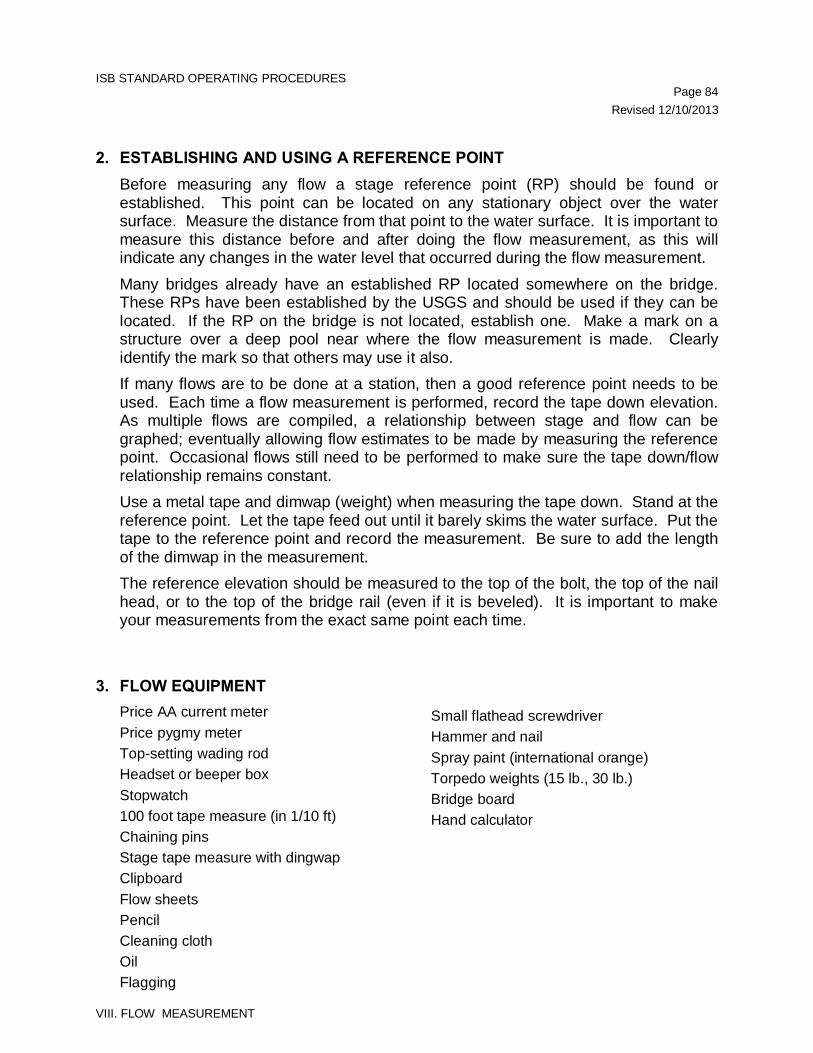
ISB STANDARD OPERATING PROCEDURES Page 84 Revised 12/10/2013
VIII. FLOW MEASUREMENT
2. ESTABLISHING AND USING A REFERENCE POINT Before measuring any flow a stage reference point (RP) should be found or established. This point can be located on any stationary object over the water surface. Measure the distance from that point to the water surface. It is important to measure this distance before and after doing the flow measurement, as this will indicate any changes in the water level that occurred during the flow measurement. Many bridges already have an established RP located somewhere on the bridge. These RPs have been established by the USGS and should be used if they can be located. If the RP on the bridge is not located, establish one. Make a mark on a structure over a deep pool near where the flow measurement is made. Clearly identify the mark so that others may use it also. If many flows are to be done at a station, then a good reference point needs to be used. Each time a flow measurement is performed, record the tape down elevation. As multiple flows are compiled, a relationship between stage and flow can be graphed; eventually allowing flow estimates to be made by measuring the reference point. Occasional flows still need to be performed to make sure the tape down/flow relationship remains constant. Use a metal tape and dimwap (weight) when measuring the tape down. Stand at the reference point. Let the tape feed out until it barely skims the water surface. Put the tape to the reference point and record the measurement. Be sure to add the length of the dimwap in the measurement. The reference elevation should be measured to the top of the bolt, the top of the nail head, or to the top of the bridge rail (even if it is beveled). It is important to make your measurements from the exact same point each time.
3. FLOW EQUIPMENT Price AA current meter Price pygmy meter Top-setting wading rod Headset or beeper box Stopwatch 100 foot tape measure (in 1/10 ft) Chaining pins Stage tape measure with dingwap Clipboard Flow sheets
Pencil Cleaning cloth Oil Flagging
Small flathead screwdriver Hammer and nail Spray paint (international orange) Torpedo weights (15 lb., 30 lb.) Bridge board Hand calculator
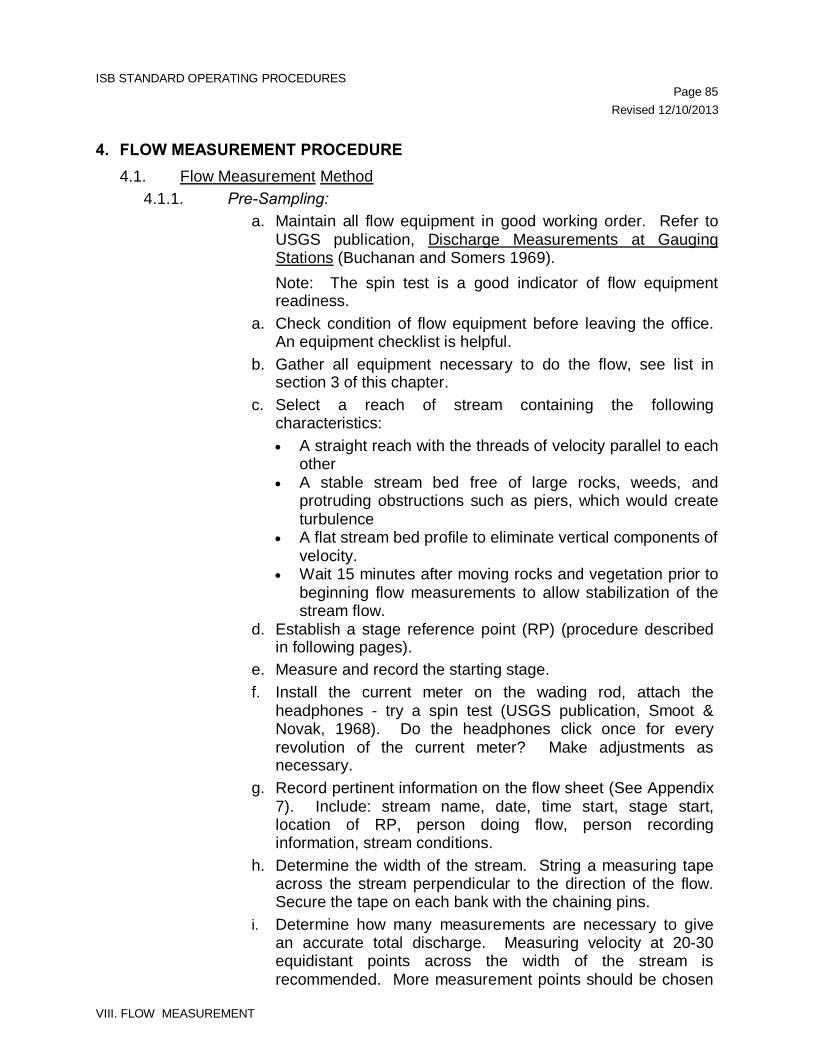
ISB STANDARD OPERATING PROCEDURES Page 85 Revised 12/10/2013
VIII. FLOW MEASUREMENT
4. FLOW MEASUREMENT PROCEDURE 4.1. Flow Measurement Method
4.1.1. Pre-Sampling: a. Maintain all flow equipment in good working order. Refer to
USGS publication, Discharge Measurements at Gauging Stations (Buchanan and Somers 1969). Note: The spin test is a good indicator of flow equipment readiness.
a. Check condition of flow equipment before leaving the office. An equipment checklist is helpful.
b. Gather all equipment necessary to do the flow, see list in section 3 of this chapter.
c. Select a reach of stream containing the following characteristics: • A straight reach with the threads of velocity parallel to each
other • A stable stream bed free of large rocks, weeds, and
protruding obstructions such as piers, which would create turbulence
• A flat stream bed profile to eliminate vertical components of velocity.
• Wait 15 minutes after moving rocks and vegetation prior to beginning flow measurements to allow stabilization of the stream flow.
d. Establish a stage reference point (RP) (procedure described in following pages).
e. Measure and record the starting stage. f. Install the current meter on the wading rod, attach the
headphones - try a spin test (USGS publication, Smoot & Novak, 1968). Do the headphones click once for every revolution of the current meter? Make adjustments as necessary.
g. Record pertinent information on the flow sheet (See Appendix 7). Include: stream name, date, time start, stage start, location of RP, person doing flow, person recording information, stream conditions.
h. Determine the width of the stream. String a measuring tape across the stream perpendicular to the direction of the flow. Secure the tape on each bank with the chaining pins.
i. Determine how many measurements are necessary to give an accurate total discharge. Measuring velocity at 20-30 equidistant points across the width of the stream is recommended. More measurement points should be chosen
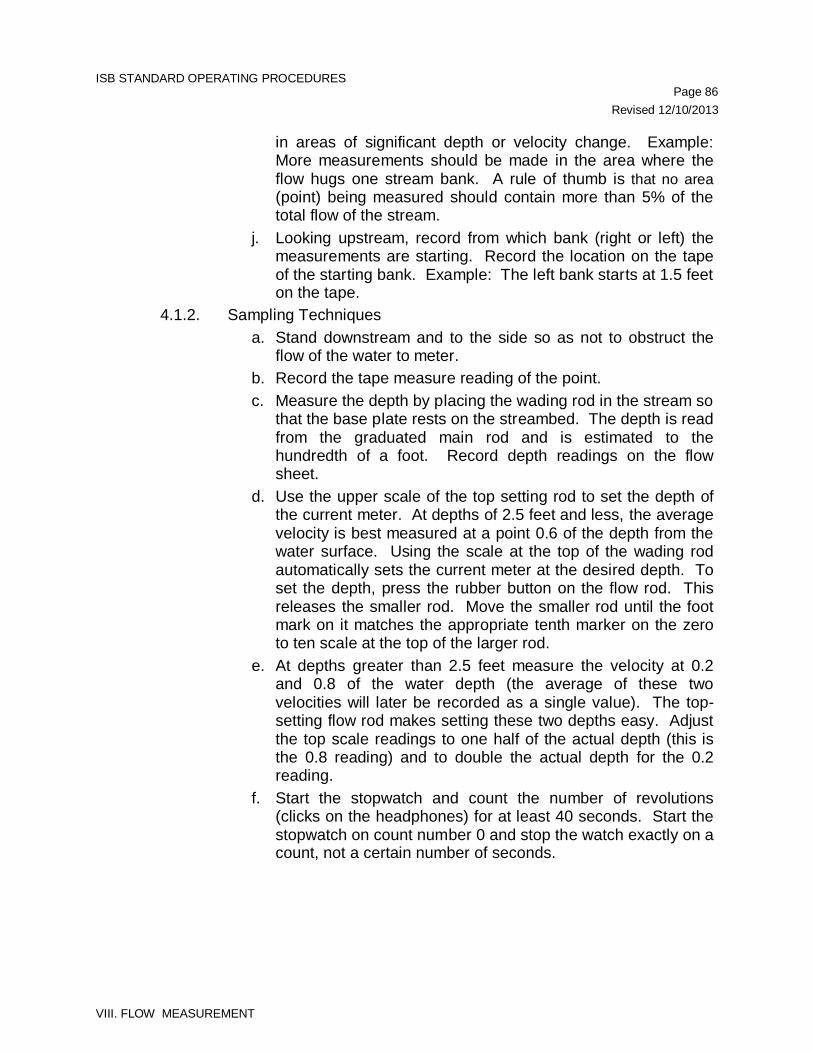
ISB STANDARD OPERATING PROCEDURES Page 86 Revised 12/10/2013
VIII. FLOW MEASUREMENT
in areas of significant depth or velocity change. Example: More measurements should be made in the area where the flow hugs one stream bank. A rule of thumb is that no area (point) being measured should contain more than 5% of the total flow of the stream.
j. Looking upstream, record from which bank (right or left) the measurements are starting. Record the location on the tape of the starting bank. Example: The left bank starts at 1.5 feet on the tape.
4.1.2. Sampling Techniques a. Stand downstream and to the side so as not to obstruct the
flow of the water to meter. b. Record the tape measure reading of the point. c. Measure the depth by placing the wading rod in the stream so
that the base plate rests on the streambed. The depth is read from the graduated main rod and is estimated to the hundredth of a foot. Record depth readings on the flow sheet.
d. Use the upper scale of the top setting rod to set the depth of the current meter. At depths of 2.5 feet and less, the average velocity is best measured at a point 0.6 of the depth from the water surface. Using the scale at the top of the wading rod automatically sets the current meter at the desired depth. To set the depth, press the rubber button on the flow rod. This releases the smaller rod. Move the smaller rod until the foot mark on it matches the appropriate tenth marker on the zero to ten scale at the top of the larger rod.
e. At depths greater than 2.5 feet measure the velocity at 0.2 and 0.8 of the water depth (the average of these two velocities will later be recorded as a single value). The top-setting flow rod makes setting these two depths easy. Adjust the top scale readings to one half of the actual depth (this is the 0.8 reading) and to double the actual depth for the 0.2 reading.
f. Start the stopwatch and count the number of revolutions (clicks on the headphones) for at least 40 seconds. Start the stopwatch on count number 0 and stop the watch exactly on a count, not a certain number of seconds.
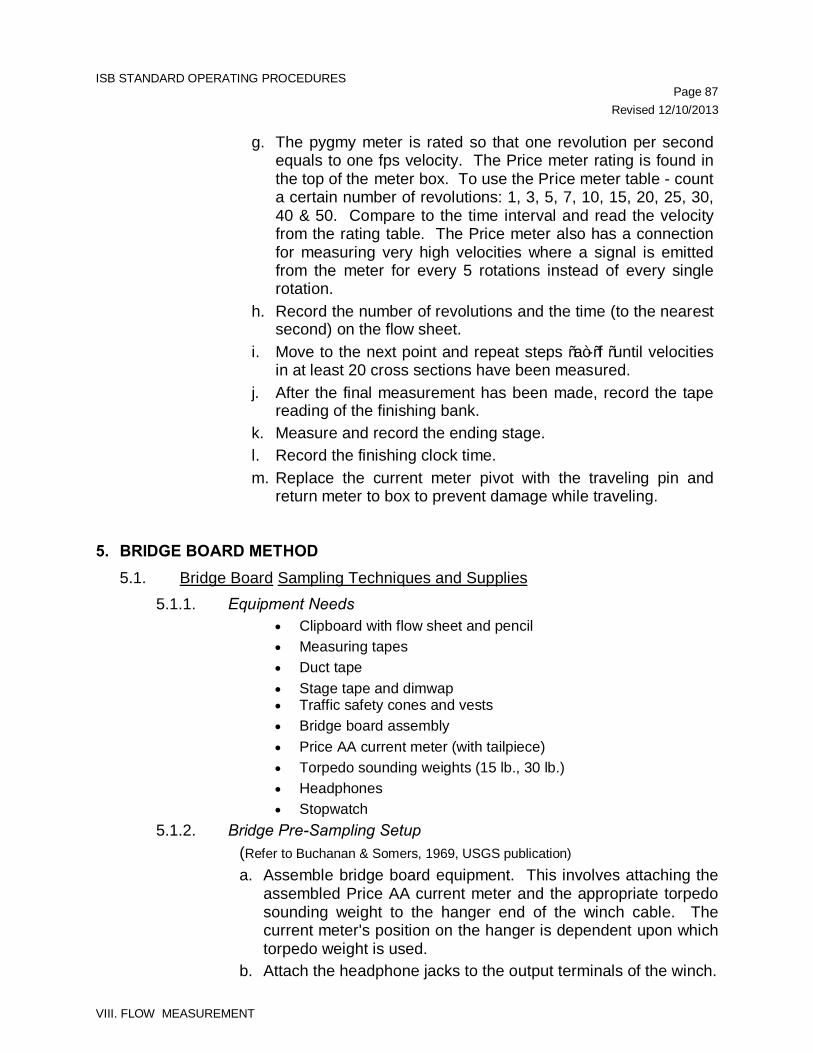
ISB STANDARD OPERATING PROCEDURES Page 87 Revised 12/10/2013
VIII. FLOW MEASUREMENT
g. The pygmy meter is rated so that one revolution per second equals to one fps velocity. The Price meter rating is found in the top of the meter box. To use the Price meter table - count a certain number of revolutions: 1, 3, 5, 7, 10, 15, 20, 25, 30, 40 & 50. Compare to the time interval and read the velocity from the rating table. The Price meter also has a connection for measuring very high velocities where a signal is emitted from the meter for every 5 rotations instead of every single rotation.
h. Record the number of revolutions and the time (to the nearest second) on the flow sheet.
i. Move to the next point and repeat steps “a”-“f “until velocities in at least 20 cross sections have been measured.
j. After the final measurement has been made, record the tape reading of the finishing bank.
k. Measure and record the ending stage. l. Record the finishing clock time. m. Replace the current meter pivot with the traveling pin and
return meter to box to prevent damage while traveling.
5. BRIDGE BOARD METHOD 5.1. Bridge Board Sampling Techniques and Supplies
5.1.1. Equipment Needs • Clipboard with flow sheet and pencil • Measuring tapes • Duct tape • Stage tape and dimwap • Traffic safety cones and vests • Bridge board assembly • Price AA current meter (with tailpiece) • Torpedo sounding weights (15 lb., 30 lb.) • Headphones • Stopwatch
5.1.2. Bridge Pre-Sampling Setup (Refer to Buchanan & Somers, 1969, USGS publication)
a. Assemble bridge board equipment. This involves attaching the assembled Price AA current meter and the appropriate torpedo sounding weight to the hanger end of the winch cable. The current meter's position on the hanger is dependent upon which torpedo weight is used.
b. Attach the headphone jacks to the output terminals of the winch.
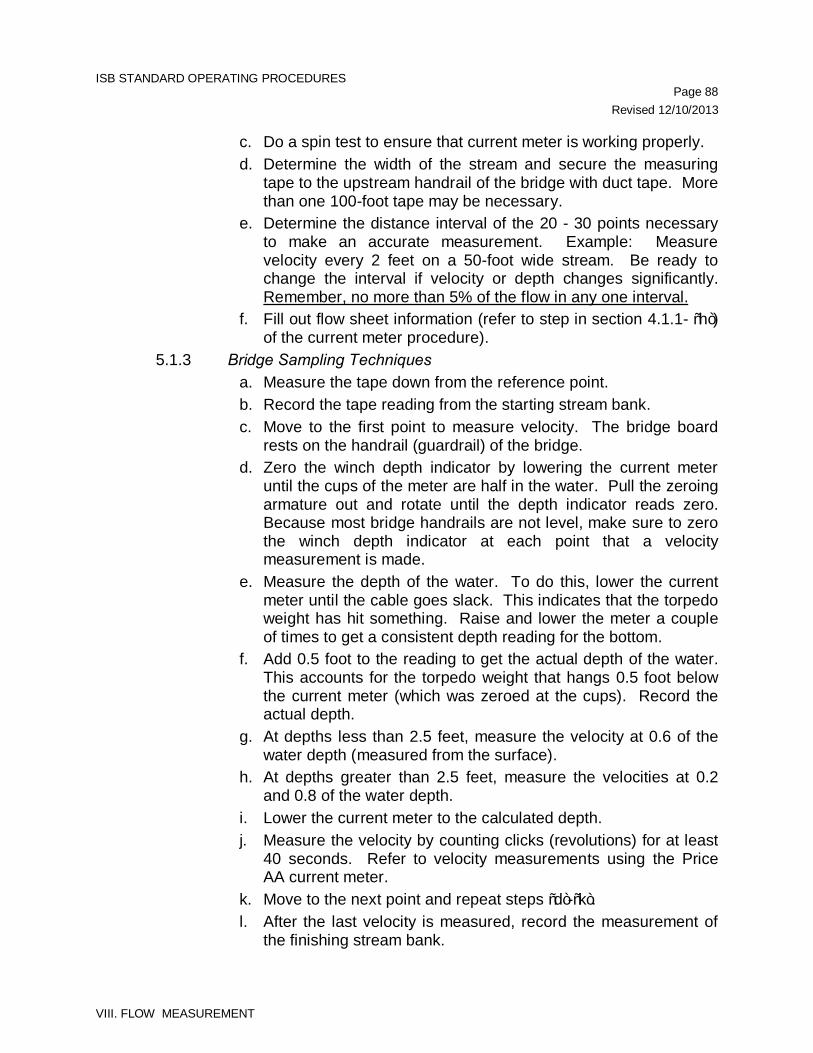
ISB STANDARD OPERATING PROCEDURES Page 88 Revised 12/10/2013
VIII. FLOW MEASUREMENT
c. Do a spin test to ensure that current meter is working properly. d. Determine the width of the stream and secure the measuring
tape to the upstream handrail of the bridge with duct tape. More than one 100-foot tape may be necessary.
e. Determine the distance interval of the 20 - 30 points necessary to make an accurate measurement. Example: Measure velocity every 2 feet on a 50-foot wide stream. Be ready to change the interval if velocity or depth changes significantly. Remember, no more than 5% of the flow in any one interval.
f. Fill out flow sheet information (refer to step in section 4.1.1- “h”) of the current meter procedure).
5.1.3 Bridge Sampling Techniques a. Measure the tape down from the reference point. b. Record the tape reading from the starting stream bank. c. Move to the first point to measure velocity. The bridge board
rests on the handrail (guardrail) of the bridge. d. Zero the winch depth indicator by lowering the current meter
until the cups of the meter are half in the water. Pull the zeroing armature out and rotate until the depth indicator reads zero. Because most bridge handrails are not level, make sure to zero the winch depth indicator at each point that a velocity measurement is made.
e. Measure the depth of the water. To do this, lower the current meter until the cable goes slack. This indicates that the torpedo weight has hit something. Raise and lower the meter a couple of times to get a consistent depth reading for the bottom.
f. Add 0.5 foot to the reading to get the actual depth of the water. This accounts for the torpedo weight that hangs 0.5 foot below the current meter (which was zeroed at the cups). Record the actual depth.
g. At depths less than 2.5 feet, measure the velocity at 0.6 of the water depth (measured from the surface).
h. At depths greater than 2.5 feet, measure the velocities at 0.2 and 0.8 of the water depth.
i. Lower the current meter to the calculated depth. j. Measure the velocity by counting clicks (revolutions) for at least
40 seconds. Refer to velocity measurements using the Price AA current meter.
k. Move to the next point and repeat steps “d”-“k”. l. After the last velocity is measured, record the measurement of
the finishing stream bank.
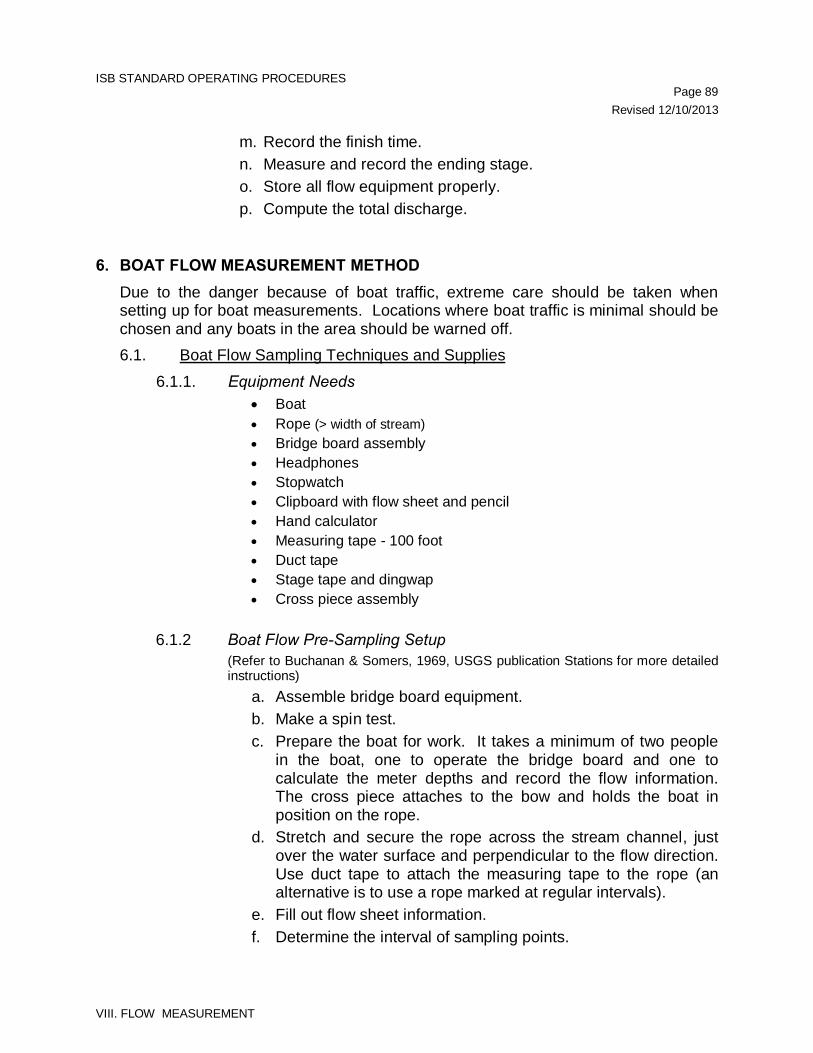
ISB STANDARD OPERATING PROCEDURES Page 89 Revised 12/10/2013
VIII. FLOW MEASUREMENT
m. Record the finish time. n. Measure and record the ending stage. o. Store all flow equipment properly. p. Compute the total discharge.
6. BOAT FLOW MEASUREMENT METHOD Due to the danger because of boat traffic, extreme care should be taken when setting up for boat measurements. Locations where boat traffic is minimal should be chosen and any boats in the area should be warned off. 6.1. Boat Flow Sampling Techniques and Supplies
6.1.1. Equipment Needs • Boat • Rope (> width of stream) • Bridge board assembly • Headphones • Stopwatch • Clipboard with flow sheet and pencil • Hand calculator • Measuring tape - 100 foot • Duct tape • Stage tape and dingwap • Cross piece assembly
6.1.2 Boat Flow Pre-Sampling Setup (Refer to Buchanan & Somers, 1969, USGS publication Stations for more detailed instructions)
a. Assemble bridge board equipment. b. Make a spin test. c. Prepare the boat for work. It takes a minimum of two people
in the boat, one to operate the bridge board and one to calculate the meter depths and record the flow information. The cross piece attaches to the bow and holds the boat in position on the rope.
d. Stretch and secure the rope across the stream channel, just over the water surface and perpendicular to the flow direction. Use duct tape to attach the measuring tape to the rope (an alternative is to use a rope marked at regular intervals).
e. Fill out flow sheet information. f. Determine the interval of sampling points.
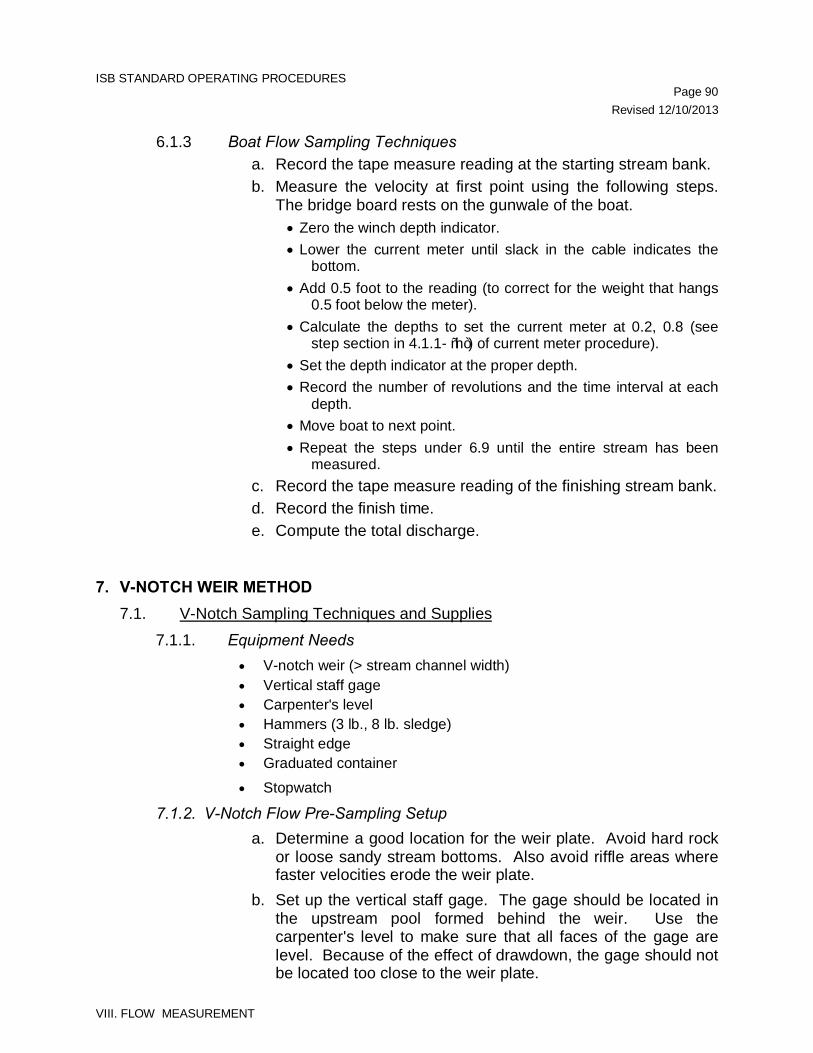
ISB STANDARD OPERATING PROCEDURES Page 90 Revised 12/10/2013
VIII. FLOW MEASUREMENT
6.1.3 Boat Flow Sampling Techniques a. Record the tape measure reading at the starting stream bank. b. Measure the velocity at first point using the following steps.
The bridge board rests on the gunwale of the boat. • Zero the winch depth indicator. • Lower the current meter until slack in the cable indicates the
bottom. • Add 0.5 foot to the reading (to correct for the weight that hangs
0.5 foot below the meter). • Calculate the depths to set the current meter at 0.2, 0.8 (see
step section in 4.1.1- “h”) of current meter procedure). • Set the depth indicator at the proper depth. • Record the number of revolutions and the time interval at each
depth. • Move boat to next point. • Repeat the steps under 6.9 until the entire stream has been
measured. c. Record the tape measure reading of the finishing stream bank. d. Record the finish time. e. Compute the total discharge.
7. V-NOTCH WEIR METHOD 7.1. V-Notch Sampling Techniques and Supplies
7.1.1. Equipment Needs • V-notch weir (> stream channel width) • Vertical staff gage • Carpenter's level • Hammers (3 lb., 8 lb. sledge) • Straight edge • Graduated container
• Stopwatch
7.1.2. V-Notch Flow Pre-Sampling Setup a. Determine a good location for the weir plate. Avoid hard rock
or loose sandy stream bottoms. Also avoid riffle areas where faster velocities erode the weir plate.
b. Set up the vertical staff gage. The gage should be located in the upstream pool formed behind the weir. Use the carpenter's level to make sure that all faces of the gage are level. Because of the effect of drawdown, the gage should not be located too close to the weir plate.
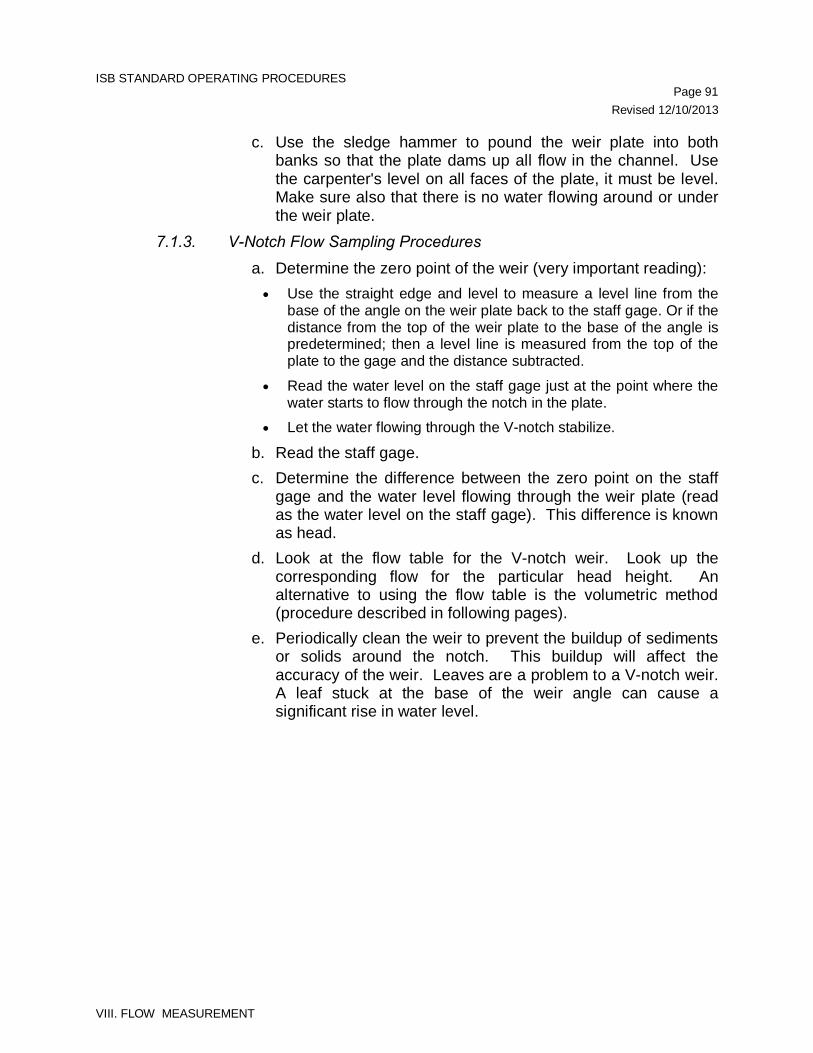
ISB STANDARD OPERATING PROCEDURES Page 91 Revised 12/10/2013
VIII. FLOW MEASUREMENT
c. Use the sledge hammer to pound the weir plate into both banks so that the plate dams up all flow in the channel. Use the carpenter's level on all faces of the plate, it must be level. Make sure also that there is no water flowing around or under the weir plate.
7.1.3. V-Notch Flow Sampling Procedures
a. Determine the zero point of the weir (very important reading): • Use the straight edge and level to measure a level line from the
base of the angle on the weir plate back to the staff gage. Or if the distance from the top of the weir plate to the base of the angle is predetermined; then a level line is measured from the top of the plate to the gage and the distance subtracted.
• Read the water level on the staff gage just at the point where the water starts to flow through the notch in the plate.
• Let the water flowing through the V-notch stabilize.
b. Read the staff gage. c. Determine the difference between the zero point on the staff
gage and the water level flowing through the weir plate (read as the water level on the staff gage). This difference is known as head.
d. Look at the flow table for the V-notch weir. Look up the corresponding flow for the particular head height. An alternative to using the flow table is the volumetric method (procedure described in following pages).
e. Periodically clean the weir to prevent the buildup of sediments or solids around the notch. This buildup will affect the accuracy of the weir. Leaves are a problem to a V-notch weir. A leaf stuck at the base of the weir angle can cause a significant rise in water level.
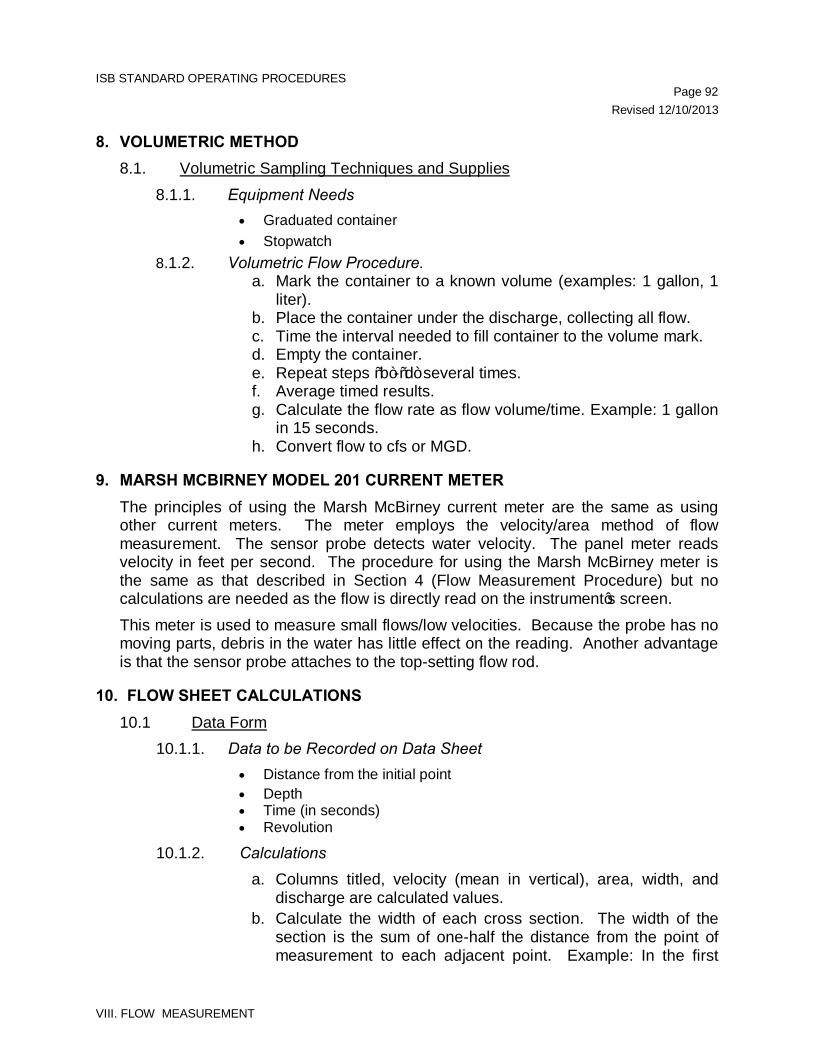
ISB STANDARD OPERATING PROCEDURES Page 92 Revised 12/10/2013
VIII. FLOW MEASUREMENT
8. VOLUMETRIC METHOD 8.1. Volumetric Sampling Techniques and Supplies
8.1.1. Equipment Needs • Graduated container • Stopwatch
8.1.2. Volumetric Flow Procedure. a. Mark the container to a known volume (examples: 1 gallon, 1
liter). b. Place the container under the discharge, collecting all flow. c. Time the interval needed to fill container to the volume mark. d. Empty the container. e. Repeat steps “b”-“d” several times. f. Average timed results. g. Calculate the flow rate as flow volume/time. Example: 1 gallon
in 15 seconds. h. Convert flow to cfs or MGD.
9. MARSH MCBIRNEY MODEL 201 CURRENT METER The principles of using the Marsh McBirney current meter are the same as using other current meters. The meter employs the velocity/area method of flow measurement. The sensor probe detects water velocity. The panel meter reads velocity in feet per second. The procedure for using the Marsh McBirney meter is the same as that described in Section 4 (Flow Measurement Procedure) but no calculations are needed as the flow is directly read on the instrument’s screen. This meter is used to measure small flows/low velocities. Because the probe has no moving parts, debris in the water has little effect on the reading. Another advantage is that the sensor probe attaches to the top-setting flow rod.
10. FLOW SHEET CALCULATIONS 10.1 Data Form
10.1.1. Data to be Recorded on Data Sheet • Distance from the initial point • Depth • Time (in seconds) • Revolution
10.1.2. Calculations a. Columns titled, velocity (mean in vertical), area, width, and
discharge are calculated values. b. Calculate the width of each cross section. The width of the
section is the sum of one-half the distance from the point of measurement to each adjacent point. Example: In the first
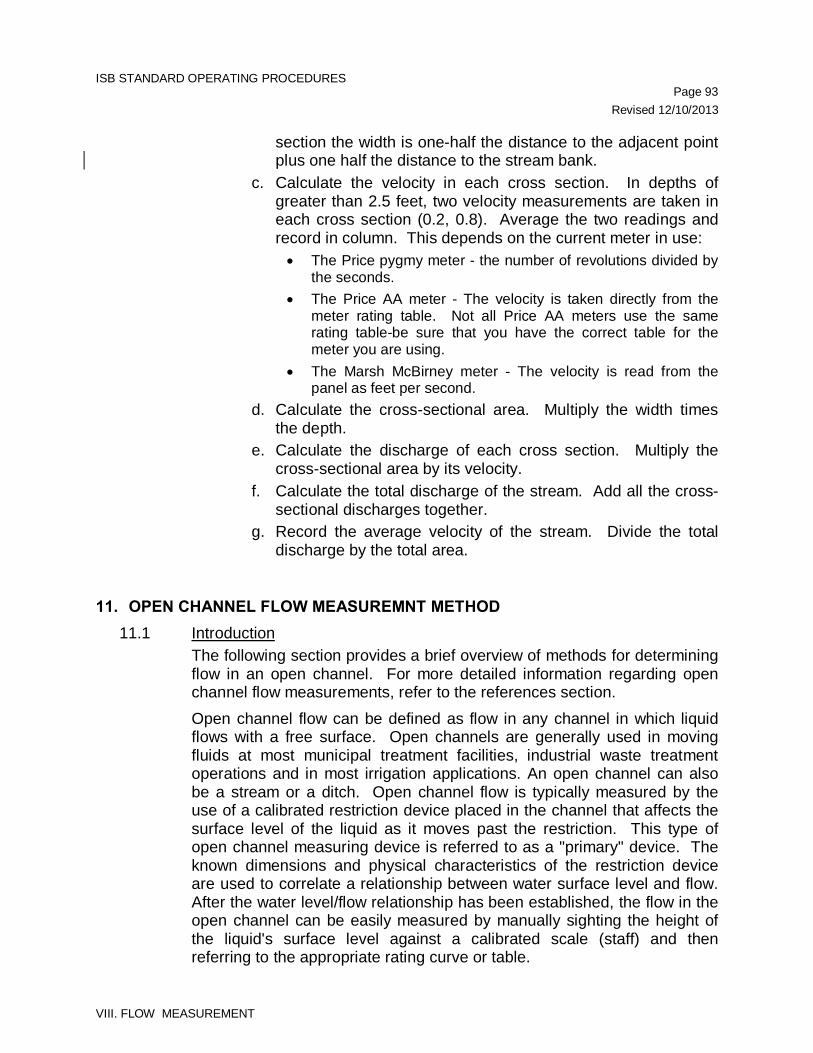
ISB STANDARD OPERATING PROCEDURES Page 93 Revised 12/10/2013
VIII. FLOW MEASUREMENT
section the width is one-half the distance to the adjacent point plus one half the distance to the stream bank.
c. Calculate the velocity in each cross section. In depths of greater than 2.5 feet, two velocity measurements are taken in each cross section (0.2, 0.8). Average the two readings and record in column. This depends on the current meter in use:
• The Price pygmy meter - the number of revolutions divided by the seconds.
• The Price AA meter - The velocity is taken directly from the meter rating table. Not all Price AA meters use the same rating table-be sure that you have the correct table for the meter you are using.
• The Marsh McBirney meter - The velocity is read from the panel as feet per second.
d. Calculate the cross-sectional area. Multiply the width times the depth.
e. Calculate the discharge of each cross section. Multiply the cross-sectional area by its velocity.
f. Calculate the total discharge of the stream. Add all the cross-sectional discharges together.
g. Record the average velocity of the stream. Divide the total discharge by the total area.
11. OPEN CHANNEL FLOW MEASUREMNT METHOD 11.1 Introduction
The following section provides a brief overview of methods for determining flow in an open channel. For more detailed information regarding open channel flow measurements, refer to the references section. Open channel flow can be defined as flow in any channel in which liquid flows with a free surface. Open channels are generally used in moving fluids at most municipal treatment facilities, industrial waste treatment operations and in most irrigation applications. An open channel can also be a stream or a ditch. Open channel flow is typically measured by the use of a calibrated restriction device placed in the channel that affects the surface level of the liquid as it moves past the restriction. This type of open channel measuring device is referred to as a "primary" device. The known dimensions and physical characteristics of the restriction device are used to correlate a relationship between water surface level and flow. After the water level/flow relationship has been established, the flow in the open channel can be easily measured by manually sighting the height of the liquid's surface level against a calibrated scale (staff) and then referring to the appropriate rating curve or table.
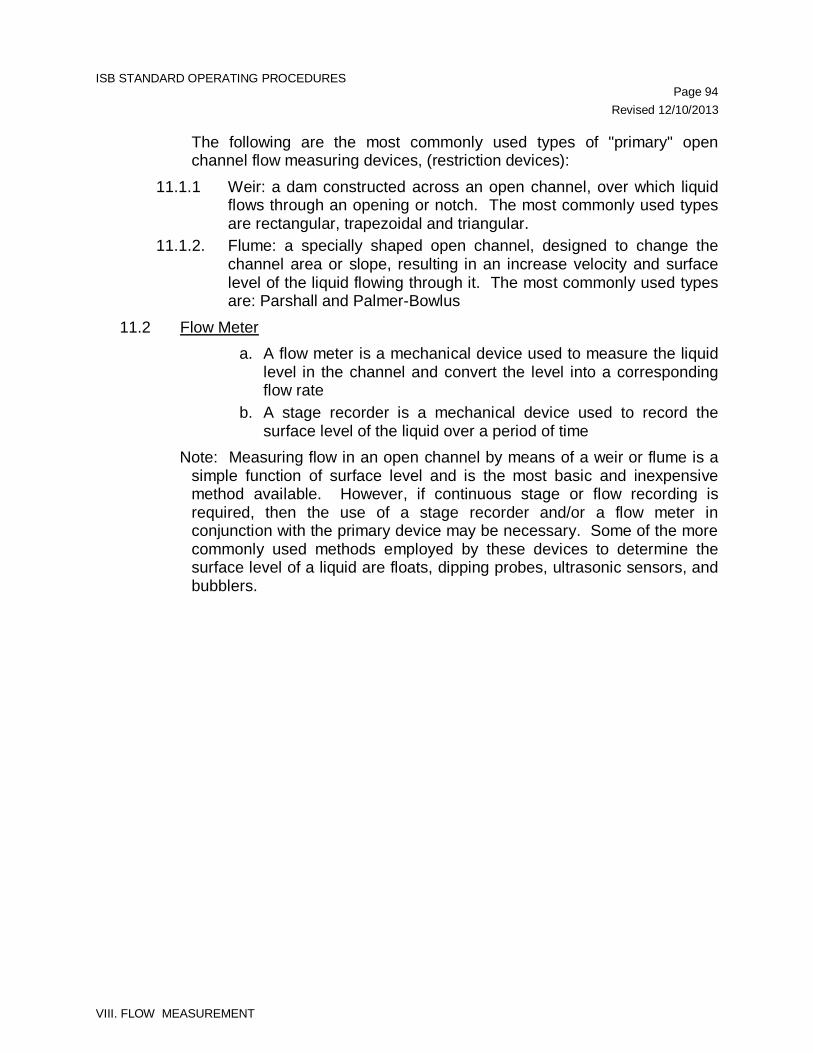
ISB STANDARD OPERATING PROCEDURES Page 94 Revised 12/10/2013
VIII. FLOW MEASUREMENT
The following are the most commonly used types of "primary" open channel flow measuring devices, (restriction devices):
11.1.1 Weir: a dam constructed across an open channel, over which liquid flows through an opening or notch. The most commonly used types are rectangular, trapezoidal and triangular.
11.1.2. Flume: a specially shaped open channel, designed to change the channel area or slope, resulting in an increase velocity and surface level of the liquid flowing through it. The most commonly used types are: Parshall and Palmer-Bowlus
11.2 Flow Meter a. A flow meter is a mechanical device used to measure the liquid
level in the channel and convert the level into a corresponding flow rate
b. A stage recorder is a mechanical device used to record the surface level of the liquid over a period of time
Note: Measuring flow in an open channel by means of a weir or flume is a simple function of surface level and is the most basic and inexpensive method available. However, if continuous stage or flow recording is required, then the use of a stage recorder and/or a flow meter in conjunction with the primary device may be necessary. Some of the more commonly used methods employed by these devices to determine the surface level of a liquid are floats, dipping probes, ultrasonic sensors, and bubblers.
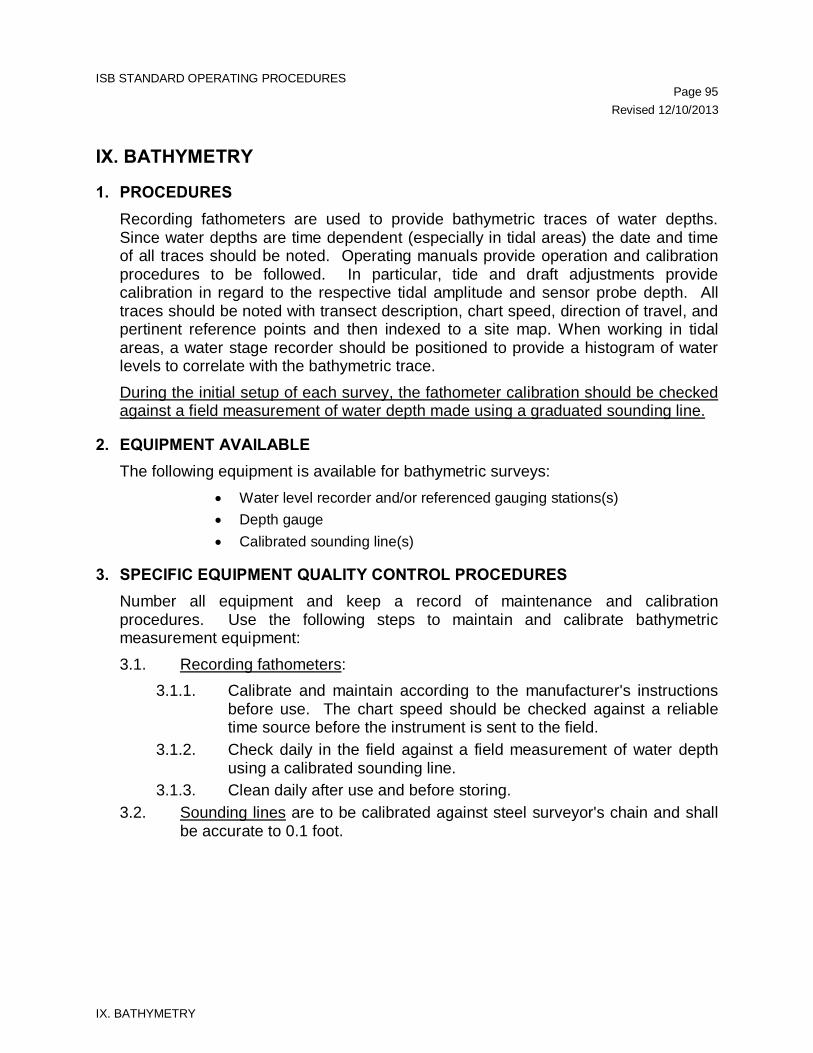
ISB STANDARD OPERATING PROCEDURES Page 95 Revised 12/10/2013
IX. BATHYMETRY
IX. BATHYMETRY
1. PROCEDURES Recording fathometers are used to provide bathymetric traces of water depths. Since water depths are time dependent (especially in tidal areas) the date and time of all traces should be noted. Operating manuals provide operation and calibration procedures to be followed. In particular, tide and draft adjustments provide calibration in regard to the respective tidal amplitude and sensor probe depth. All traces should be noted with transect description, chart speed, direction of travel, and pertinent reference points and then indexed to a site map. When working in tidal areas, a water stage recorder should be positioned to provide a histogram of water levels to correlate with the bathymetric trace. During the initial setup of each survey, the fathometer calibration should be checked against a field measurement of water depth made using a graduated sounding line.
2. EQUIPMENT AVAILABLE The following equipment is available for bathymetric surveys:
• Water level recorder and/or referenced gauging stations(s) • Depth gauge • Calibrated sounding line(s)
3. SPECIFIC EQUIPMENT QUALITY CONTROL PROCEDURES Number all equipment and keep a record of maintenance and calibration procedures. Use the following steps to maintain and calibrate bathymetric measurement equipment: 3.1. Recording fathometers:
3.1.1. Calibrate and maintain according to the manufacturer's instructions before use. The chart speed should be checked against a reliable time source before the instrument is sent to the field.
3.1.2. Check daily in the field against a field measurement of water depth using a calibrated sounding line.
3.1.3. Clean daily after use and before storing. 3.2. Sounding lines are to be calibrated against steel surveyor's chain and shall
be accurate to 0.1 foot.
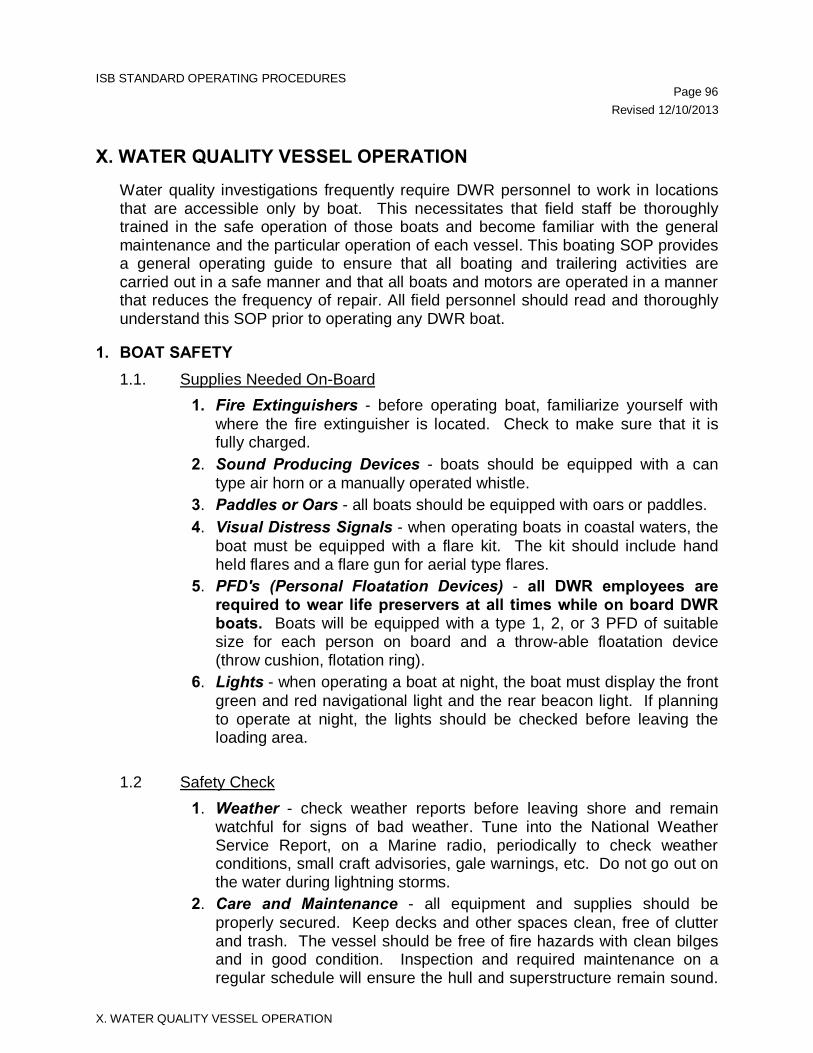
ISB STANDARD OPERATING PROCEDURES Page 96 Revised 12/10/2013
X. WATER QUALITY VESSEL OPERATION
X. WATER QUALITY VESSEL OPERATION
Water quality investigations frequently require DWR personnel to work in locations that are accessible only by boat. This necessitates that field staff be thoroughly trained in the safe operation of those boats and become familiar with the general maintenance and the particular operation of each vessel. This boating SOP provides a general operating guide to ensure that all boating and trailering activities are carried out in a safe manner and that all boats and motors are operated in a manner that reduces the frequency of repair. All field personnel should read and thoroughly understand this SOP prior to operating any DWR boat.
1. BOAT SAFETY 1.1. Supplies Needed On-Board
1. Fire Extinguishers - before operating boat, familiarize yourself with where the fire extinguisher is located. Check to make sure that it is fully charged.
2. Sound Producing Devices - boats should be equipped with a can type air horn or a manually operated whistle.
3. Paddles or Oars - all boats should be equipped with oars or paddles. 4. Visual Distress Signals - when operating boats in coastal waters, the
boat must be equipped with a flare kit. The kit should include hand held flares and a flare gun for aerial type flares.
5. PFD's (Personal Floatation Devices) - all DWR employees are required to wear life preservers at all times while on board DWR boats. Boats will be equipped with a type 1, 2, or 3 PFD of suitable size for each person on board and a throw-able floatation device (throw cushion, flotation ring).
6. Lights - when operating a boat at night, the boat must display the front green and red navigational light and the rear beacon light. If planning to operate at night, the lights should be checked before leaving the loading area.
1.2 Safety Check
1. Weather - check weather reports before leaving shore and remain watchful for signs of bad weather. Tune into the National Weather Service Report, on a Marine radio, periodically to check weather conditions, small craft advisories, gale warnings, etc. Do not go out on the water during lightning storms.
2. Care and Maintenance - all equipment and supplies should be properly secured. Keep decks and other spaces clean, free of clutter and trash. The vessel should be free of fire hazards with clean bilges and in good condition. Inspection and required maintenance on a regular schedule will ensure the hull and superstructure remain sound.
ISB STANDARD OPERATING PROCEDURES Page 97 Revised 12/10/2013
X. WATER QUALITY VESSEL OPERATION
Ensure all repairs are made properly and with marine rated parts. Always carry a toolbox and know how to make minor repairs.
3. Communications - when operating in remote areas it is always a good idea to bring along a cellular phone for cases in which assistance may be needed. Two-way radios should be used when operating with two or more boats. When operating in coastal waters always bring along either a hand-held portable marine radio or a fixed mounted marine radio.
2. FIXED MOUNT/CONSOLE TYPE BOATS 2.1. Trailering
2.1.1. Pre-Trip Check and Preparation a. Install 1 ⅞ or 2" trailer ball to trailer hitch depending on the
trailer. b. Unscrew clamping mechanism on boat trailer tongue. c. Back vehicle up to boat trailer, with trailer tongue directly over
the center of the trailer ball. d. Lower trailer jack so that the trailer tongue fits over the trailer
ball. e. Screw down, or tighten, the clamping mechanism (all the way)
onto the trailer ball. Lock with a 2640 Master Lock. f. Hook up both safety chains by crossing the chains and
hooking to holes on the trailer hitch. Do not tow boat without safety chains.
h. Hook up brake line cable to eye bolt attached to the vehicle. i. Plug in trailer lights and check the lights for proper operation. j. Secure gunwhale boat strap. k. Check the bow eye to make sure safety chain is hooked up
and winch is locked down securely. l. Periodically check the clamping mechanism on the trailer
tongue to assure that it is screwed down all the way. m. Conduct an inspection walk around the boat and trailer:
1) Test to see if the boat motor starts before traveling. 2) Check level of the engine oil on 4-cycle boat motors. 3) Check the trailer tire pressure and adjust if necessary. 4) Check the condition of the axel grease. Add grease
as needed. n. When traveling, stop and check the trailer and boat; retighten
boat straps as needed. Feel the trailer bearings to see if they are hot. If hot, they probably need to be greased or replaced.
o. Trailer slowly over speed bumps and holes.
ISB STANDARD OPERATING PROCEDURES Page 98 Revised 12/10/2013
X. WATER QUALITY VESSEL OPERATION
p. When backing into parking areas, do not let back of trailer come in contact with curb to avoid damaging license plate bracket or trailer lights.
2.2. Boat Launching 2.2.1. Unloading
a. Upon arrival at the boat ramp check the ramp to make sure it is suitable for launching including checking that the water level is high enough for proper launching.
b. Install all the boat plugs; check inside the bilge to make sure that the plug is installed.
c. Remove the boat strap. d. Load the boat with equipment. e. Unplug trailer lights f. Make sure the motor is in the "up" position before launching
the boat. g. Keep winch "locked" until boat is in the water. h. When the boat is in the water lower the motor and then start
the motor (see motor operating instructions). i. While one person is operating the boat another person should
be manning the trailer winch. j. Unhook winch cable from bow eye, but do not remove safety
chain until the boat is running and idling. k. If needed, back the vehicle up slightly and press the brake to
bump the boat off the trailer. l. When boat is clear from the trailer, pull the vehicle out of the
ramp slowly and park it. 2.2.2. Loading
a. Slowly back the trailer into the water so that the center "guide roller" is visible above water.
b. Line up the boat with the trailer and very slowly ease the bow of the boat onto the center roller. If boat is off center of the trailer, back up and try again.
c. Do not approach trailer at a speed that will damage the boat hull or trailer if the center roller is missed!
d. The person manning the trailer winch should signal the boat operator to go left or right, or to tell the boat driver to back off if they are going to miss the center roller.
e. Once the bow is on the center roller, slowly advance the boat up onto the trailer as far as it will go. If it does not reach the stanchion then hold the boat in position until the person manning the winch can get out enough cable to hook to the bow eye.
ISB STANDARD OPERATING PROCEDURES Page 99 Revised 12/10/2013
X. WATER QUALITY VESSEL OPERATION
f. Once the cable is hooked and tension is maintained then power down the motor and cut it off.
g. Winch the boat onto the trailer until the bow is snug against the stanchion.
h. Lock down the winch gear. i. Raise the motor to the "up" position and flip down the tilt lock
bar, then lower the motor until it presses against the tilt lock bar.
j. Slowly drive out of the boat ramp to the parking lot. k. Remove the boat plugs. l. Unload the boat. m. Hook up boat strap. n. Plug in trailer lights. o. Make sure that all aerials and/or bimini tops are down. p. Walk around trailer and double check everything!
2.3. Boat Operation 2.3.1. Fueling
a. Fill oil reservoir to required fill level with appropriate motor oil. b. When fueling boats with 2 cycle outboard motors without an oil
reservoir add one pint of 2 cycle outboard motor oil to the gas tank for every six gallons of gasoline. Use marine fuel stabilizer in all fuel tanks.
c. Fill tanks to their maximum fill level. 2.3.2. Motor Operation
a. Switch the battery "PERKO" switch to the "ALL" position. b. Pump the gas primer ball until it is tight. c. Lower motor into the water using hydraulic trim switch on the
throttle lever. d. When starting "cold" the choke must be engaged. To engage
choke, push the ignition key in as far as it will go, then turn the key clockwise until the motor starts. If motor does not start within five seconds do not continue to engage the starter. Re-pump the primer ball and try again.
e. Once the motor starts disengage the choke and let the motor idle.
f. Once the motor has been given ample time to warm up, back the boat off the trailer.
g. Let motor idle down before changing from reverse to forward. Between forward and reverse, make a brief stop in neutral.
h. If working in open water with ample depth for boat running, advance the throttle to plane out the boat, adjusting the trim if necessary.
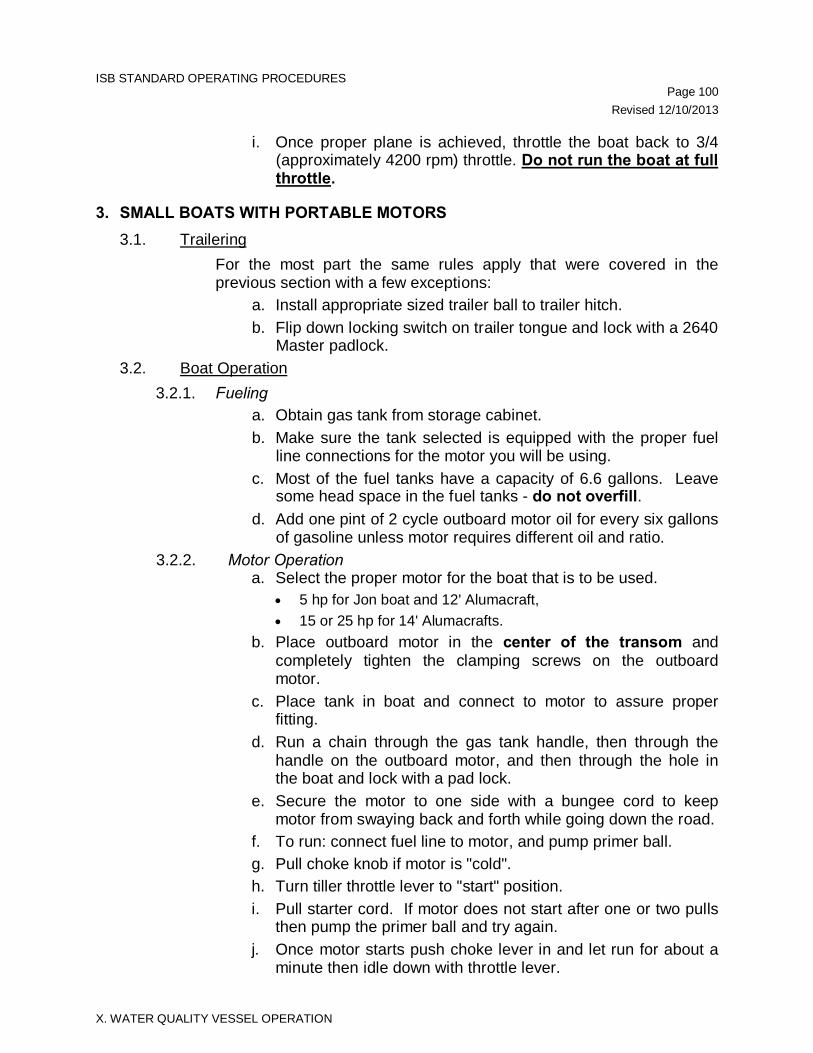
ISB STANDARD OPERATING PROCEDURES Page 100 Revised 12/10/2013
X. WATER QUALITY VESSEL OPERATION
i. Once proper plane is achieved, throttle the boat back to 3/4 (approximately 4200 rpm) throttle. Do not run the boat at full throttle.
3. SMALL BOATS WITH PORTABLE MOTORS 3.1. Trailering
For the most part the same rules apply that were covered in the previous section with a few exceptions:
a. Install appropriate sized trailer ball to trailer hitch. b. Flip down locking switch on trailer tongue and lock with a 2640
Master padlock. 3.2. Boat Operation
3.2.1. Fueling a. Obtain gas tank from storage cabinet. b. Make sure the tank selected is equipped with the proper fuel
line connections for the motor you will be using. c. Most of the fuel tanks have a capacity of 6.6 gallons. Leave
some head space in the fuel tanks - do not overfill. d. Add one pint of 2 cycle outboard motor oil for every six gallons
of gasoline unless motor requires different oil and ratio. 3.2.2. Motor Operation
a. Select the proper motor for the boat that is to be used. • 5 hp for Jon boat and 12' Alumacraft, • 15 or 25 hp for 14' Alumacrafts.
b. Place outboard motor in the center of the transom and completely tighten the clamping screws on the outboard motor.
c. Place tank in boat and connect to motor to assure proper fitting.
d. Run a chain through the gas tank handle, then through the handle on the outboard motor, and then through the hole in the boat and lock with a pad lock.
e. Secure the motor to one side with a bungee cord to keep motor from swaying back and forth while going down the road.
f. To run: connect fuel line to motor, and pump primer ball. g. Pull choke knob if motor is "cold". h. Turn tiller throttle lever to "start" position. i. Pull starter cord. If motor does not start after one or two pulls
then pump the primer ball and try again. j. Once motor starts push choke lever in and let run for about a
minute then idle down with throttle lever.
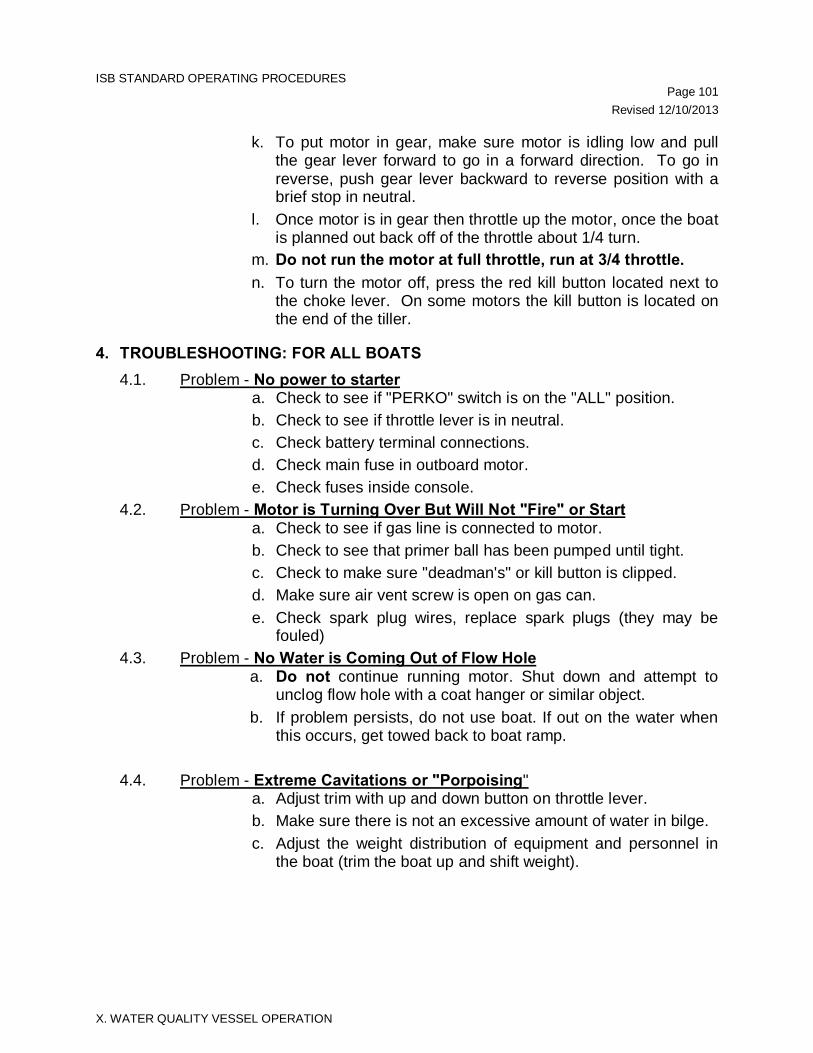
ISB STANDARD OPERATING PROCEDURES Page 101 Revised 12/10/2013
X. WATER QUALITY VESSEL OPERATION
k. To put motor in gear, make sure motor is idling low and pull the gear lever forward to go in a forward direction. To go in reverse, push gear lever backward to reverse position with a brief stop in neutral.
l. Once motor is in gear then throttle up the motor, once the boat is planned out back off of the throttle about 1/4 turn.
m. Do not run the motor at full throttle, run at 3/4 throttle. n. To turn the motor off, press the red kill button located next to
the choke lever. On some motors the kill button is located on the end of the tiller.
4. TROUBLESHOOTING: FOR ALL BOATS 4.1. Problem - No power to starter
a. Check to see if "PERKO" switch is on the "ALL" position. b. Check to see if throttle lever is in neutral. c. Check battery terminal connections. d. Check main fuse in outboard motor. e. Check fuses inside console.
4.2. Problem - Motor is Turning Over But Will Not "Fire" or Start a. Check to see if gas line is connected to motor. b. Check to see that primer ball has been pumped until tight. c. Check to make sure "deadman's" or kill button is clipped. d. Make sure air vent screw is open on gas can. e. Check spark plug wires, replace spark plugs (they may be
fouled) 4.3. Problem - No Water is Coming Out of Flow Hole
a. Do not continue running motor. Shut down and attempt to unclog flow hole with a coat hanger or similar object.
b. If problem persists, do not use boat. If out on the water when this occurs, get towed back to boat ramp.
4.4. Problem - Extreme Cavitations or "Porpoising"
a. Adjust trim with up and down button on throttle lever. b. Make sure there is not an excessive amount of water in bilge. c. Adjust the weight distribution of equipment and personnel in
the boat (trim the boat up and shift weight).
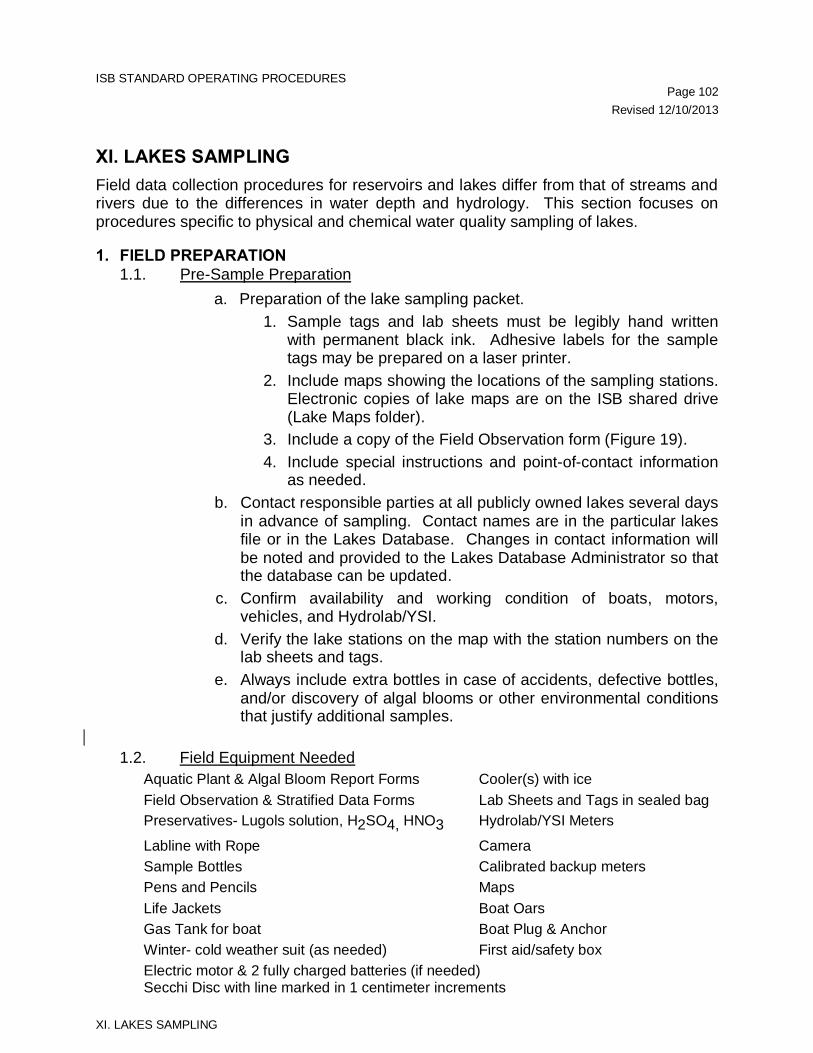
ISB STANDARD OPERATING PROCEDURES Page 102 Revised 12/10/2013
XI. LAKES SAMPLING
XI. LAKES SAMPLING Field data collection procedures for reservoirs and lakes differ from that of streams and rivers due to the differences in water depth and hydrology. This section focuses on procedures specific to physical and chemical water quality sampling of lakes.
1. FIELD PREPARATION 1.1. Pre-Sample Preparation
a. Preparation of the lake sampling packet. 1. Sample tags and lab sheets must be legibly hand written
with permanent black ink. Adhesive labels for the sample tags may be prepared on a laser printer.
2. Include maps showing the locations of the sampling stations. Electronic copies of lake maps are on the ISB shared drive (Lake Maps folder).
3. Include a copy of the Field Observation form (Figure 19). 4. Include special instructions and point-of-contact information
as needed. b. Contact responsible parties at all publicly owned lakes several days
in advance of sampling. Contact names are in the particular lakes file or in the Lakes Database. Changes in contact information will be noted and provided to the Lakes Database Administrator so that the database can be updated.
c. Confirm availability and working condition of boats, motors, vehicles, and Hydrolab/YSI.
d. Verify the lake stations on the map with the station numbers on the lab sheets and tags.
e. Always include extra bottles in case of accidents, defective bottles, and/or discovery of algal blooms or other environmental conditions that justify additional samples.
1.2. Field Equipment Needed Aquatic Plant & Algal Bloom Report Forms Cooler(s) with ice Field Observation & Stratified Data Forms Lab Sheets and Tags in sealed bag Preservatives- Lugols solution, H2SO4, HNO3 Hydrolab/YSI Meters
Labline with Rope Camera Sample Bottles Calibrated backup meters Pens and Pencils Maps Life Jackets Boat Oars Gas Tank for boat Boat Plug & Anchor Winter- cold weather suit (as needed) First aid/safety box Electric motor & 2 fully charged batteries (if needed) Secchi Disc with line marked in 1 centimeter increments
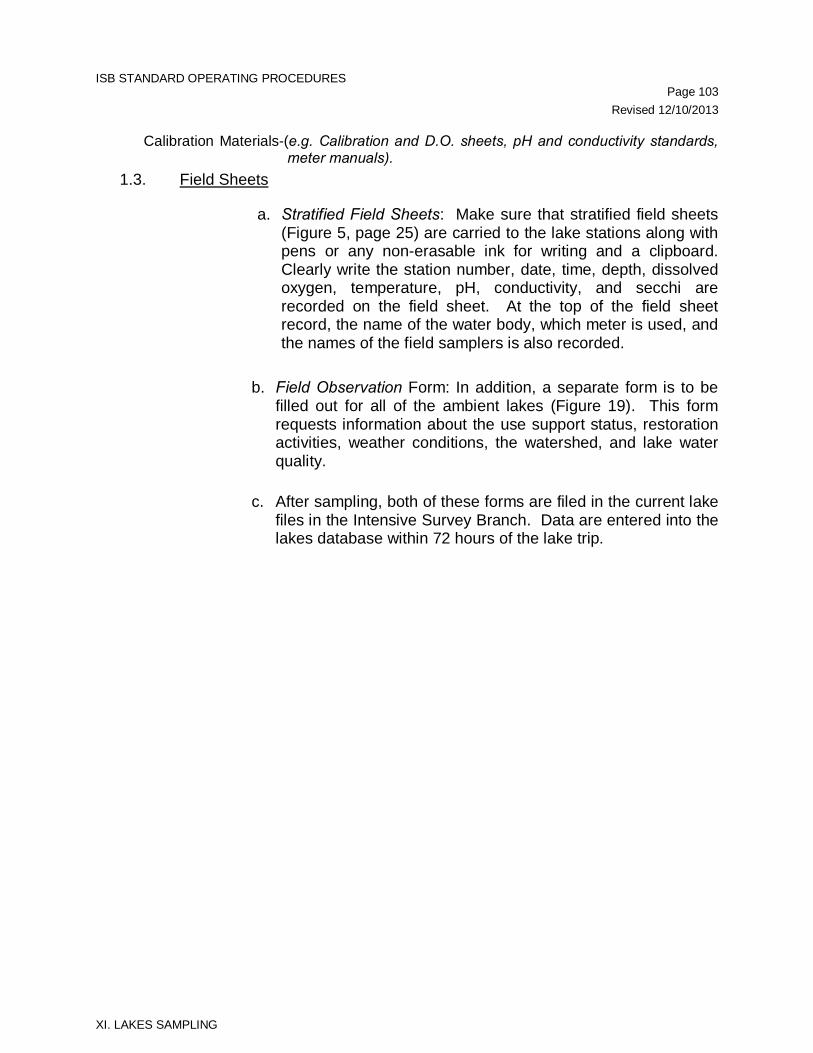
ISB STANDARD OPERATING PROCEDURES Page 103 Revised 12/10/2013
XI. LAKES SAMPLING
Calibration Materials-(e.g. Calibration and D.O. sheets, pH and conductivity standards, meter manuals).
1.3. Field Sheets
a. Stratified Field Sheets: Make sure that stratified field sheets (Figure 5, page 25) are carried to the lake stations along with pens or any non-erasable ink for writing and a clipboard. Clearly write the station number, date, time, depth, dissolved oxygen, temperature, pH, conductivity, and secchi are recorded on the field sheet. At the top of the field sheet record, the name of the water body, which meter is used, and the names of the field samplers is also recorded.
b. Field Observation Form: In addition, a separate form is to be filled out for all of the ambient lakes (Figure 19). This form requests information about the use support status, restoration activities, weather conditions, the watershed, and lake water quality.
c. After sampling, both of these forms are filed in the current lake
files in the Intensive Survey Branch. Data are entered into the lakes database within 72 hours of the lake trip.
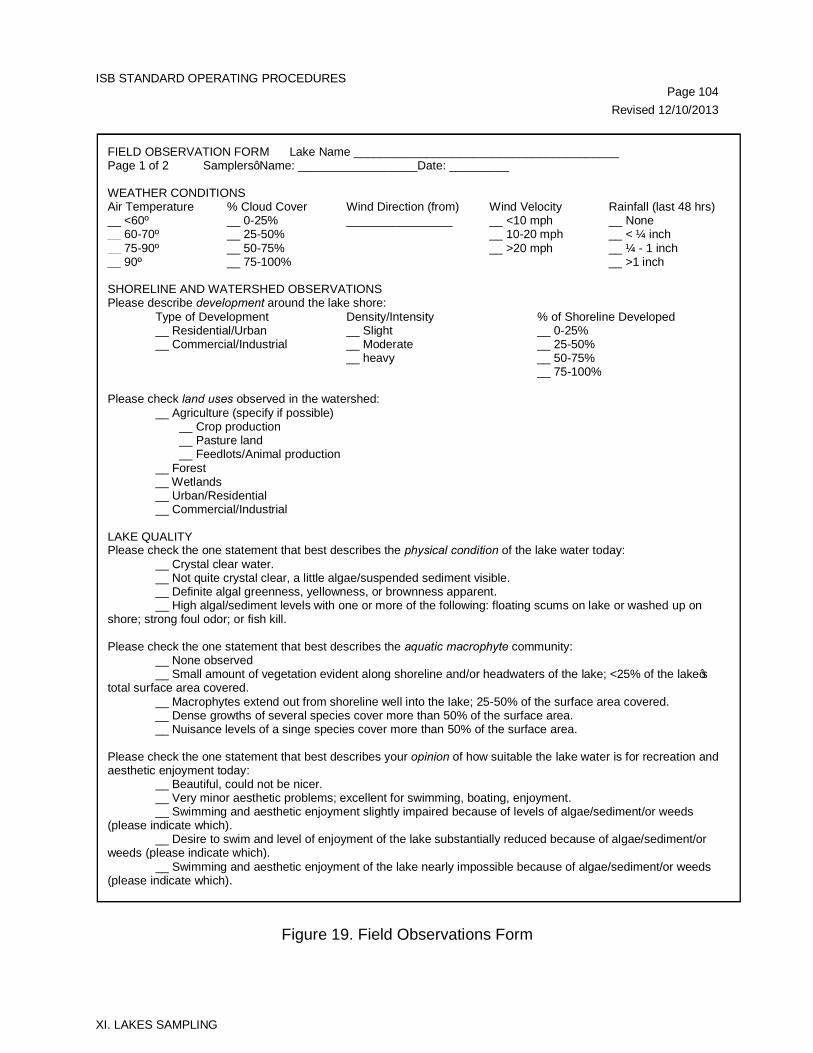
ISB STANDARD OPERATING PROCEDURES Page 104 Revised 12/10/2013
XI. LAKES SAMPLING
Figure 19. Field Observations Form
FIELD OBSERVATION FORM Lake Name ________________________________________ Page 1 of 2 Samplers’ Name: __________________Date: _________ WEATHER CONDITIONS Air Temperature % Cloud Cover Wind Direction (from) Wind Velocity Rainfall (last 48 hrs) __ <60º __ 0-25% ________________ __ <10 mph __ None __ 60-70º __ 25-50% __ 10-20 mph __ < ¼ inch __ 75-90º __ 50-75% __ >20 mph __ ¼ - 1 inch __ 90º __ 75-100% __ >1 inch SHORELINE AND WATERSHED OBSERVATIONS Please describe development around the lake shore: Type of Development Density/Intensity % of Shoreline Developed __ Residential/Urban __ Slight __ 0-25% __ Commercial/Industrial __ Moderate __ 25-50% __ heavy __ 50-75% __ 75-100% Please check land uses observed in the watershed: __ Agriculture (specify if possible) __ Crop production __ Pasture land __ Feedlots/Animal production __ Forest __ Wetlands __ Urban/Residential __ Commercial/Industrial LAKE QUALITY Please check the one statement that best describes the physical condition of the lake water today: __ Crystal clear water. __ Not quite crystal clear, a little algae/suspended sediment visible. __ Definite algal greenness, yellowness, or brownness apparent. __ High algal/sediment levels with one or more of the following: floating scums on lake or washed up on shore; strong foul odor; or fish kill. Please check the one statement that best describes the aquatic macrophyte community: __ None observed __ Small amount of vegetation evident along shoreline and/or headwaters of the lake; <25% of the lake’s total surface area covered. __ Macrophytes extend out from shoreline well into the lake; 25-50% of the surface area covered. __ Dense growths of several species cover more than 50% of the surface area. __ Nuisance levels of a singe species cover more than 50% of the surface area. Please check the one statement that best describes your opinion of how suitable the lake water is for recreation and aesthetic enjoyment today: __ Beautiful, could not be nicer. __ Very minor aesthetic problems; excellent for swimming, boating, enjoyment. __ Swimming and aesthetic enjoyment slightly impaired because of levels of algae/sediment/or weeds (please indicate which). __ Desire to swim and level of enjoyment of the lake substantially reduced because of algae/sediment/or weeds (please indicate which). __ Swimming and aesthetic enjoyment of the lake nearly impossible because of algae/sediment/or weeds (please indicate which).
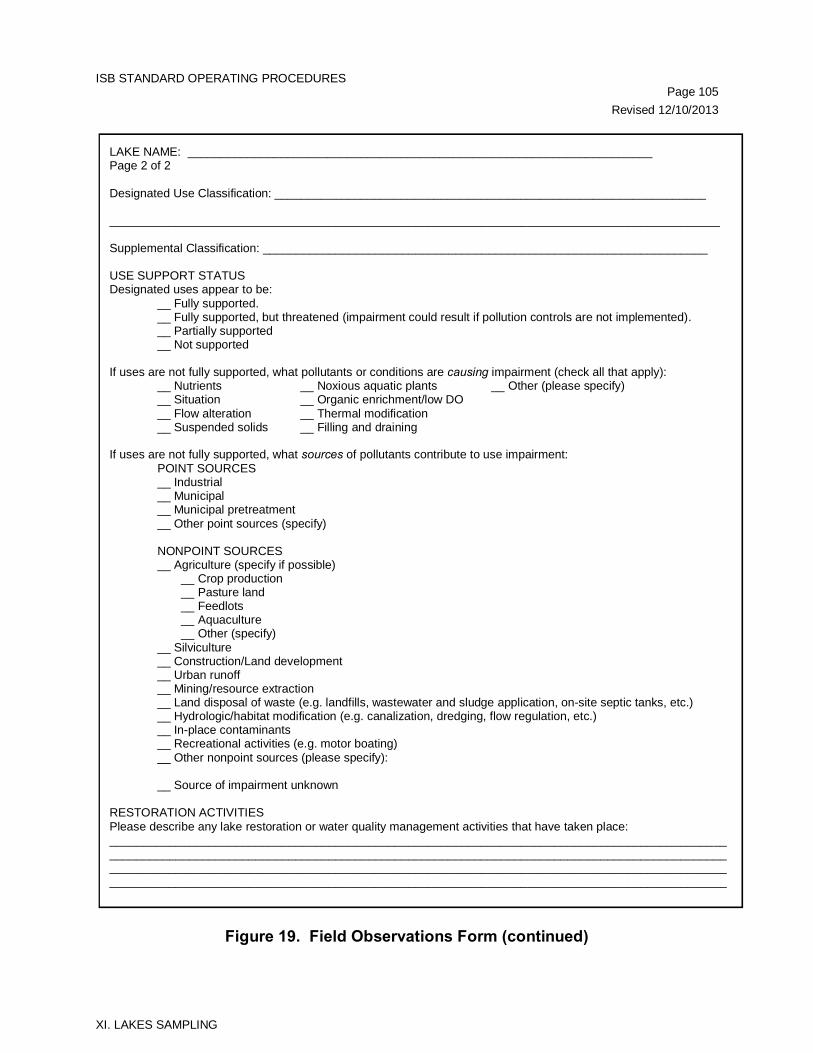
ISB STANDARD OPERATING PROCEDURES Page 105 Revised 12/10/2013
XI. LAKES SAMPLING
Figure 19. Field Observations Form (continued)
LAKE NAME: ______________________________________________________________________ Page 2 of 2 Designated Use Classification: _________________________________________________________________ ____________________________________________________________________________________________ Supplemental Classification: ___________________________________________________________________ USE SUPPORT STATUS Designated uses appear to be: __ Fully supported. __ Fully supported, but threatened (impairment could result if pollution controls are not implemented). __ Partially supported __ Not supported If uses are not fully supported, what pollutants or conditions are causing impairment (check all that apply): __ Nutrients __ Noxious aquatic plants __ Other (please specify) __ Situation __ Organic enrichment/low DO __ Flow alteration __ Thermal modification __ Suspended solids __ Filling and draining If uses are not fully supported, what sources of pollutants contribute to use impairment: POINT SOURCES __ Industrial __ Municipal __ Municipal pretreatment __ Other point sources (specify) NONPOINT SOURCES __ Agriculture (specify if possible) __ Crop production __ Pasture land __ Feedlots __ Aquaculture __ Other (specify) __ Silviculture __ Construction/Land development __ Urban runoff __ Mining/resource extraction __ Land disposal of waste (e.g. landfills, wastewater and sludge application, on-site septic tanks, etc.) __ Hydrologic/habitat modification (e.g. canalization, dredging, flow regulation, etc.) __ In-place contaminants __ Recreational activities (e.g. motor boating) __ Other nonpoint sources (please specify): __ Source of impairment unknown RESTORATION ACTIVITIES Please describe any lake restoration or water quality management activities that have taken place: ____________________________________________________________________________________________________________________________________________________________________________________________________________________________________________________________________________________________________________________________________________________________________________________
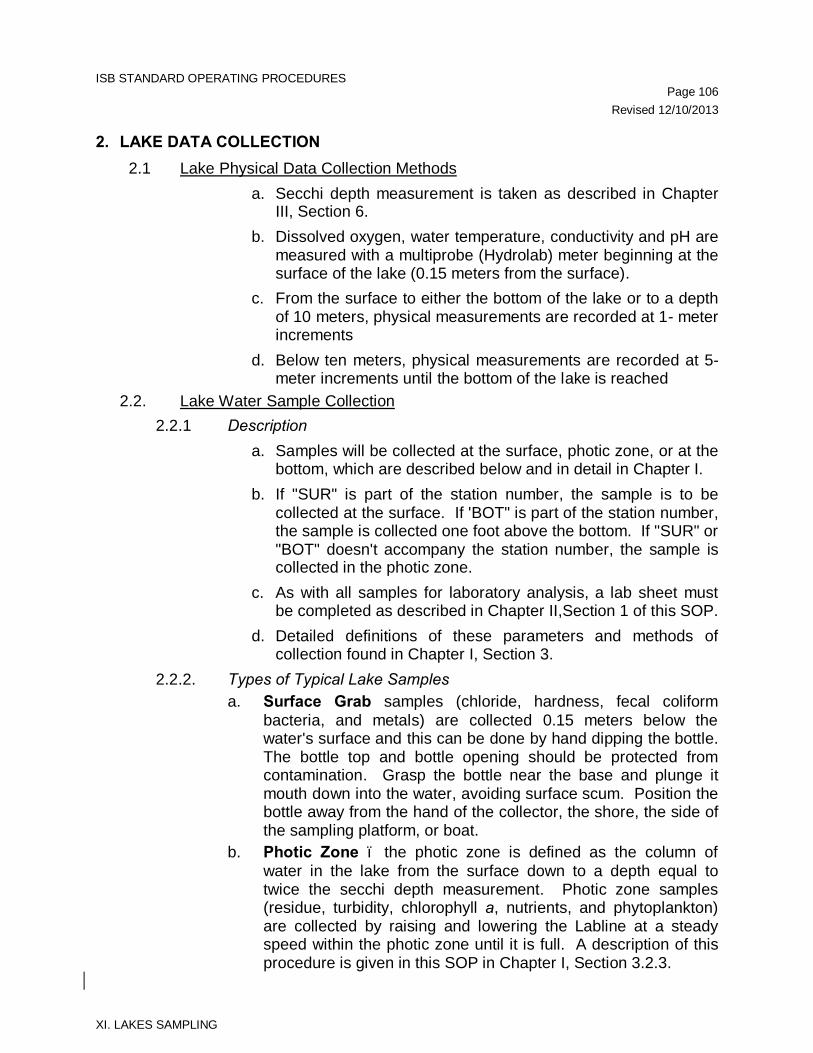
ISB STANDARD OPERATING PROCEDURES Page 106 Revised 12/10/2013
XI. LAKES SAMPLING
2. LAKE DATA COLLECTION 2.1 Lake Physical Data Collection Methods
a. Secchi depth measurement is taken as described in Chapter III, Section 6.
b. Dissolved oxygen, water temperature, conductivity and pH are measured with a multiprobe (Hydrolab) meter beginning at the surface of the lake (0.15 meters from the surface).
c. From the surface to either the bottom of the lake or to a depth of 10 meters, physical measurements are recorded at 1- meter increments
d. Below ten meters, physical measurements are recorded at 5-meter increments until the bottom of the lake is reached
2.2. Lake Water Sample Collection 2.2.1 Description
a. Samples will be collected at the surface, photic zone, or at the bottom, which are described below and in detail in Chapter I.
b. If "SUR" is part of the station number, the sample is to be collected at the surface. If 'BOT" is part of the station number, the sample is collected one foot above the bottom. If "SUR" or "BOT" doesn't accompany the station number, the sample is collected in the photic zone.
c. As with all samples for laboratory analysis, a lab sheet must be completed as described in Chapter II,Section 1 of this SOP.
d. Detailed definitions of these parameters and methods of collection found in Chapter I, Section 3.
2.2.2. Types of Typical Lake Samples a. Surface Grab samples (chloride, hardness, fecal coliform
bacteria, and metals) are collected 0.15 meters below the water's surface and this can be done by hand dipping the bottle. The bottle top and bottle opening should be protected from contamination. Grasp the bottle near the base and plunge it mouth down into the water, avoiding surface scum. Position the bottle away from the hand of the collector, the shore, the side of the sampling platform, or boat.
b. Photic Zone – the photic zone is defined as the column of water in the lake from the surface down to a depth equal to twice the secchi depth measurement. Photic zone samples (residue, turbidity, chlorophyll a, nutrients, and phytoplankton) are collected by raising and lowering the Labline at a steady speed within the photic zone until it is full. A description of this procedure is given in this SOP in Chapter I, Section 3.2.3.
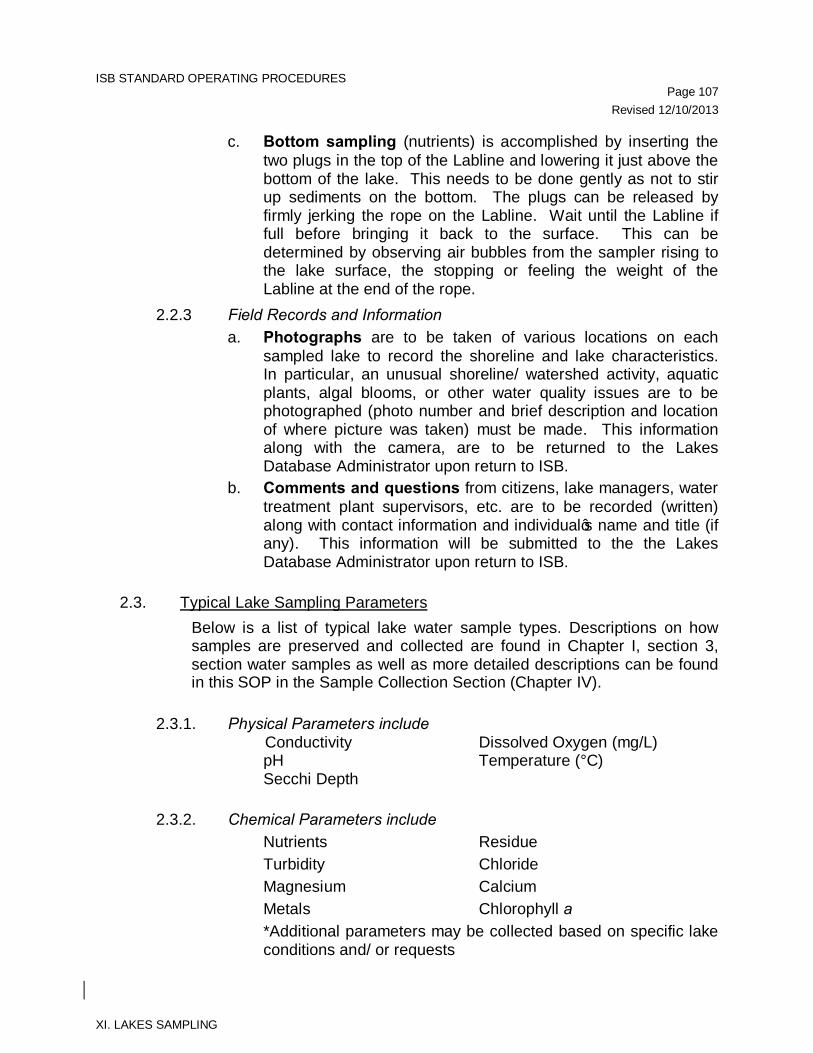
ISB STANDARD OPERATING PROCEDURES Page 107 Revised 12/10/2013
XI. LAKES SAMPLING
c. Bottom sampling (nutrients) is accomplished by inserting the two plugs in the top of the Labline and lowering it just above the bottom of the lake. This needs to be done gently as not to stir up sediments on the bottom. The plugs can be released by firmly jerking the rope on the Labline. Wait until the Labline if full before bringing it back to the surface. This can be determined by observing air bubbles from the sampler rising to the lake surface, the stopping or feeling the weight of the Labline at the end of the rope.
2.2.3 Field Records and Information a. Photographs are to be taken of various locations on each
sampled lake to record the shoreline and lake characteristics. In particular, an unusual shoreline/ watershed activity, aquatic plants, algal blooms, or other water quality issues are to be photographed (photo number and brief description and location of where picture was taken) must be made. This information along with the camera, are to be returned to the Lakes Database Administrator upon return to ISB.
b. Comments and questions from citizens, lake managers, water treatment plant supervisors, etc. are to be recorded (written) along with contact information and individual’s name and title (if any). This information will be submitted to the the Lakes Database Administrator upon return to ISB.
2.3. Typical Lake Sampling Parameters
Below is a list of typical lake water sample types. Descriptions on how samples are preserved and collected are found in Chapter I, section 3, section water samples as well as more detailed descriptions can be found in this SOP in the Sample Collection Section (Chapter IV).
2.3.1. Physical Parameters include Conductivity Dissolved Oxygen (mg/L)
pH Temperature (°C) Secchi Depth
2.3.2. Chemical Parameters include Nutrients Residue Turbidity Chloride Magnesium Calcium Metals Chlorophyll a *Additional parameters may be collected based on specific lake
conditions and/ or requests
ISB STANDARD OPERATING PROCEDURES Page 108 Revised 12/10/2013
XI. LAKES SAMPLING
2.3.3. Biological Parameters a. Fecal coliform bacteria: Water samples are collected at the
surface of the lake. b. Phytoplankton: Water samples are generally collected as a
photic zone sample. Bloom samples may be collected at the surface of the lake, as needed.
c. Aquatic Plants: Use the Aquatic Plant Report Form supplied by the Ecosystems Branch of the Environmental Sciences Branch and submit it along with a specimen if there appears to be problematic aquatic plants or for identification. Refer to the Aquatic Plant Report Form for collection and preservation of aquatic weeds. Include a map of the location showing where the plant specimen(s) were collected.
d. AGPT (Algal Growth Potential Test): These samples are collected after consultation with EPA since they perform the tests. The bottles (1 liter) are furnished by EPA as are the tags and coolers. The samples are collected in the photic zone and no preservative is used. The samples are shipped back to the EPA Athens, GA laboratory for analysis. The address and telephone number is: Bob Quinn, U.S. EPA, Region IV, Environmental Services Division, Athens, Georgia 30613, (706) 546-2420.
2.3.4 Lab and Field Sheets: All lab and field sheets should be legibly filled out with applicable dates, times, depths, etc.
a. The same time is recorded on both field and lab sheets for the same station. A field observation sheet should also be filled out and any other notable features recorded.
b. Any notes of unusual observations of lake water quality or shoreline activities that could impact water quality should also be submitted.
c. Field sheets and filed observations sheets along with camera are to be submitted to the Lakes Database Manager upon return from the field.
3. LAKE DATA MANAGEMENT 3.1 Data specific to the Intensive Survey Branch Lake Monitoring Program are
warehoused in the Lakes Database. This database is maintained by the Lake Database Administrator. The responsibility of the Lake Database Administrator includes entry of data, verification data entry accuracy and reporting issues related to the functioning of the database to the ESS IT staff.
a. Physical field data are entered into the ISB’s Lakes Database within 24 hours of receipt from the field sampling team.
ISB STANDARD OPERATING PROCEDURES Page 109 Revised 12/10/2013
XI. LAKES SAMPLING
b. Chemistry results from the DWR laboratory are entered into the Lakes Database within 72 hours of receipt from the laboratory.
c. Lake data which have been entered into the Lakes Database but not checked for input accuracy and/or completeness are designated ‘P’ for ‘Provisional’.
d. Lake data which has been reviewed and verified for input accuracy and completeness are indicated with the designation ‘A’ for ‘Accepted’.
.
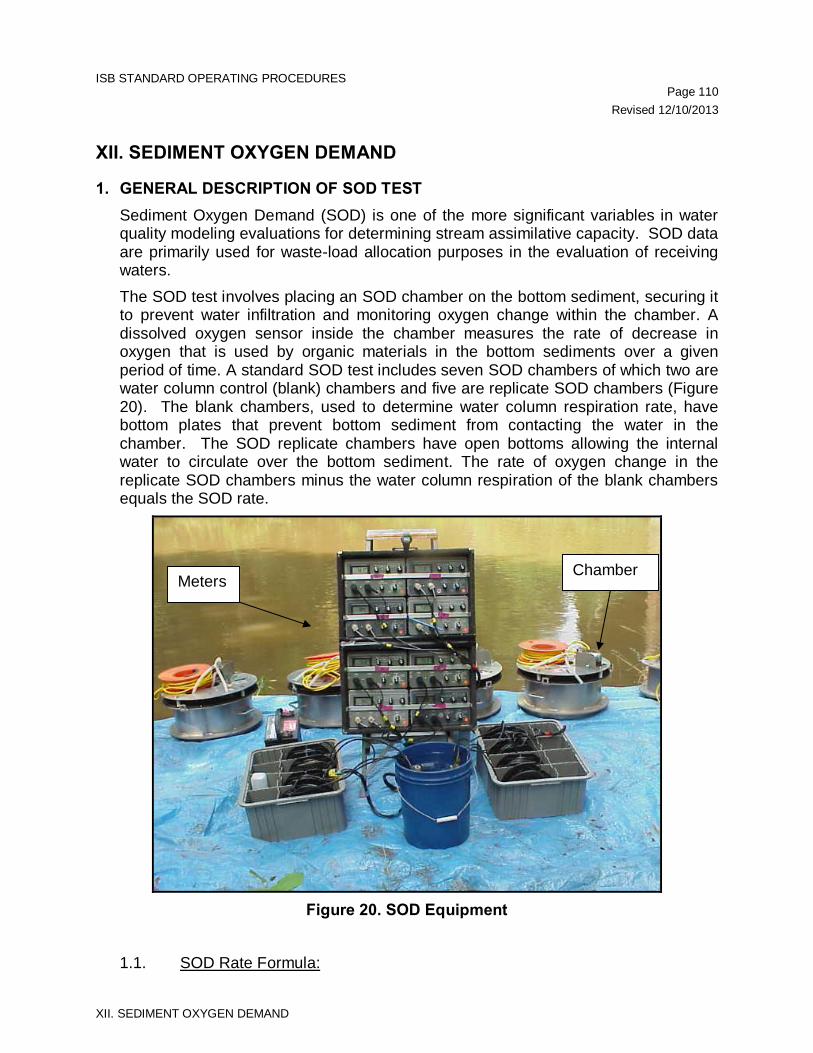
ISB STANDARD OPERATING PROCEDURES Page 110 Revised 12/10/2013
XII. SEDIMENT OXYGEN DEMAND
XII. SEDIMENT OXYGEN DEMAND
1. GENERAL DESCRIPTION OF SOD TEST Sediment Oxygen Demand (SOD) is one of the more significant variables in water quality modeling evaluations for determining stream assimilative capacity. SOD data are primarily used for waste-load allocation purposes in the evaluation of receiving waters. The SOD test involves placing an SOD chamber on the bottom sediment, securing it to prevent water infiltration and monitoring oxygen change within the chamber. A dissolved oxygen sensor inside the chamber measures the rate of decrease in oxygen that is used by organic materials in the bottom sediments over a given period of time. A standard SOD test includes seven SOD chambers of which two are water column control (blank) chambers and five are replicate SOD chambers (Figure 20). The blank chambers, used to determine water column respiration rate, have bottom plates that prevent bottom sediment from contacting the water in the chamber. The SOD replicate chambers have open bottoms allowing the internal water to circulate over the bottom sediment. The rate of oxygen change in the replicate SOD chambers minus the water column respiration of the blank chambers equals the SOD rate.
Figure 20. SOD Equipment
1.1. SOD Rate Formula:
Chamber Meters
ISB STANDARD OPERATING PROCEDURES Page 111 Revised 12/10/2013
XII. SEDIMENT OXYGEN DEMAND
The SOD rate for any study location is then calculated by using the SOD rate formula:
ß x (K x V) ÷ A = gr 02/m2/hr. where: ß = rate of change in D.O. as mg 02/L/min. V = chamber volume in liters A = chamber area in meters square K = 0.06 (constant) converts liters to square meters
SOD rates are dependent on benthic metabolic processes, sediment particle size, stream velocity and other factors. SOD rates from 77 in-situ tests performed at locations with various substrate compositions are presented in Sediment Oxygen Demand, Processes, Modeling and Measurement (Murphy and Hicks, 1986, p. 318). An example SOD Excel Worksheet is provided at the end of this section for reference.
1.2. SOD Equipment List – Due to the amount of gear and equipment necessary to successfully complete SOD tests, a checklist is recommended when preparing for testing. See Figure 21.
1.3. Site Evaluation – Each site should be visited and checked out to determine if sediment is suitable in the area under investigation. Figure 22 is the SOD Site Evaluation Form that should be completed for each location.
2. FIELD CALIBRATION DISSOLVED OXYGEN METERS An initial calibration is performed on the YSI 58 meters prior to the SOD test and a terminal calibration is performed on the meters after the test is completed. All calibration data is recorded on the SOD Calibration Forms (Figure 23). The need for accuracy is paramount for SOD evaluations due to the extremely small increments of change in D.O. measured during the test (+/- 0.01 mg/L). Because of the number of meters being calibrated on site and the extreme accuracy required for SOD testing, initial and terminal calibration procedures in this section vary from other D.O. meter calibration methods in this document. SOD meters are calibrated using the Modified Winkler Azide method as opposed to saturated air calibration methods.
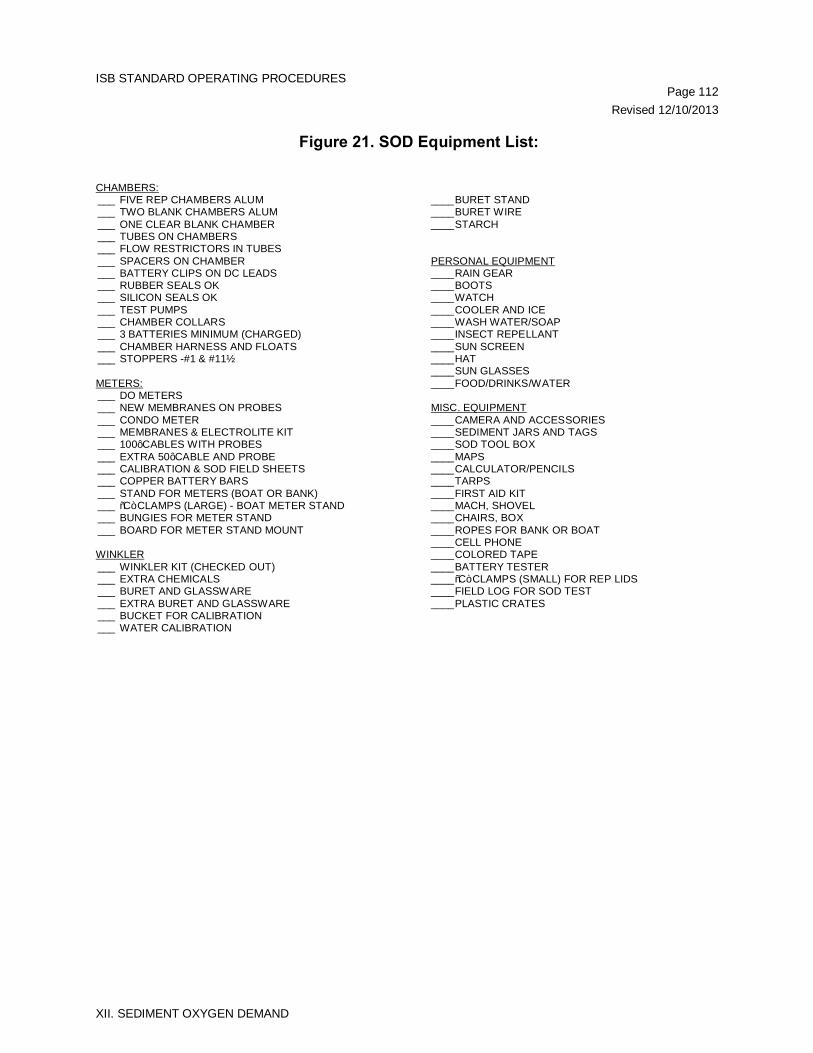
ISB STANDARD OPERATING PROCEDURES Page 112 Revised 12/10/2013
XII. SEDIMENT OXYGEN DEMAND
Figure 21. SOD Equipment List: CHAMBERS: ___ FIVE REP CHAMBERS ALUM ___ TWO BLANK CHAMBERS ALUM ___ ONE CLEAR BLANK CHAMBER ___ TUBES ON CHAMBERS ___ FLOW RESTRICTORS IN TUBES ___ SPACERS ON CHAMBER ___ BATTERY CLIPS ON DC LEADS ___ RUBBER SEALS OK ___ SILICON SEALS OK ___ TEST PUMPS ___ CHAMBER COLLARS ___ 3 BATTERIES MINIMUM (CHARGED) ___ CHAMBER HARNESS AND FLOATS ___ STOPPERS -#1 & #11½ METERS: ___ DO METERS ___ NEW MEMBRANES ON PROBES ___ CONDO METER ___ MEMBRANES & ELECTROLITE KIT ___ 100’ CABLES WITH PROBES ___ EXTRA 50’ CABLE AND PROBE ___ CALIBRATION & SOD FIELD SHEETS ___ COPPER BATTERY BARS ___ STAND FOR METERS (BOAT OR BANK) ___ “C” CLAMPS (LARGE) - BOAT METER STAND ___ BUNGIES FOR METER STAND ___ BOARD FOR METER STAND MOUNT WINKLER ___ WINKLER KIT (CHECKED OUT) ___ EXTRA CHEMICALS ___ BURET AND GLASSWARE ___ EXTRA BURET AND GLASSWARE ___ BUCKET FOR CALIBRATION ___ WATER CALIBRATION
____ BURET STAND ____ BURET WIRE ____ STARCH PERSONAL EQUIPMENT ____ RAIN GEAR ____ BOOTS ____ WATCH ____ COOLER AND ICE ____ WASH WATER/SOAP ____ INSECT REPELLANT ____ SUN SCREEN ____ HAT ____ SUN GLASSES ____ FOOD/DRINKS/WATER MISC. EQUIPMENT ____ CAMERA AND ACCESSORIES ____ SEDIMENT JARS AND TAGS ____ SOD TOOL BOX ____ MAPS ____ CALCULATOR/PENCILS ____ TARPS ____ FIRST AID KIT ____ MACH, SHOVEL ____ CHAIRS, BOX ____ ROPES FOR BANK OR BOAT ____ CELL PHONE ____ COLORED TAPE ____ BATTERY TESTER ____ “C” CLAMPS (SMALL) FOR REP LIDS ____ FIELD LOG FOR SOD TEST ____ PLASTIC CRATES
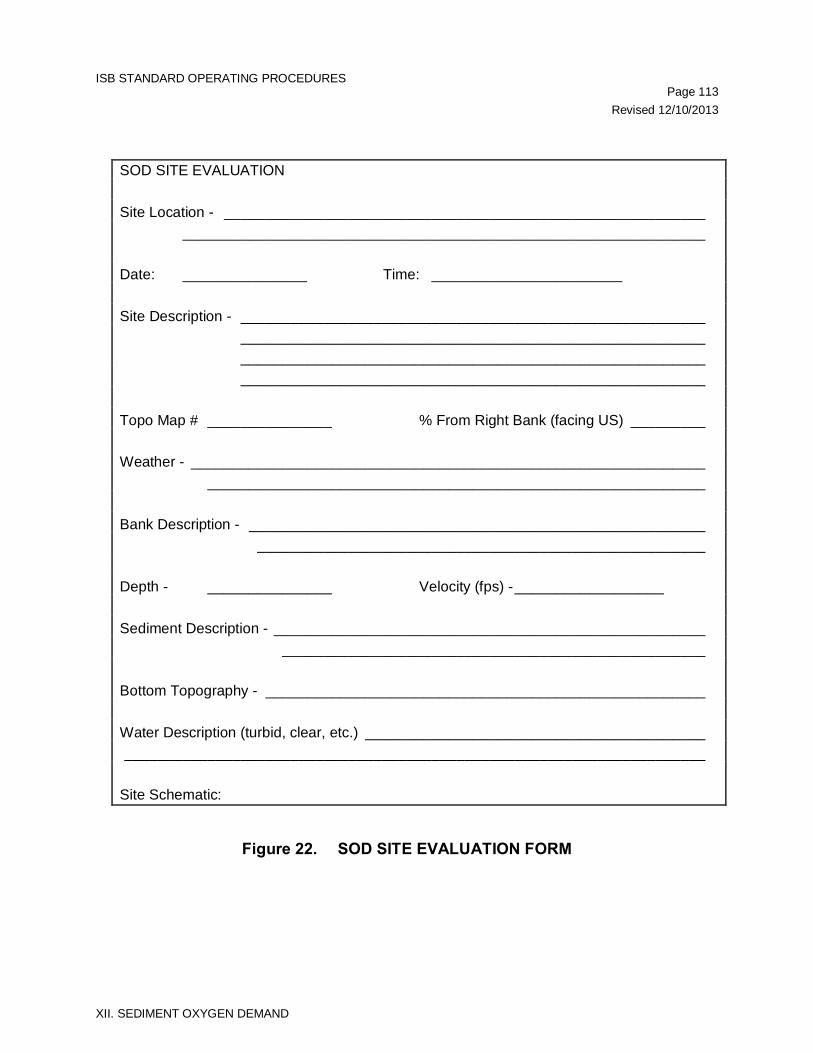
ISB STANDARD OPERATING PROCEDURES Page 113 Revised 12/10/2013
XII. SEDIMENT OXYGEN DEMAND
SOD SITE EVALUATION Site Location - __________________________________________________________ _______________________________________________________________ Date: _______________ Time: _______________________ Site Description - ________________________________________________________ ________________________________________________________ ________________________________________________________ ________________________________________________________ Topo Map # _______________ % From Right Bank (facing US) _________ Weather - ______________________________________________________________ ____________________________________________________________ Bank Description - _______________________________________________________ ______________________________________________________ Depth - _______________ Velocity (fps) - __________________ Sediment Description - ____________________________________________________ ___________________________________________________ Bottom Topography - _____________________________________________________ Water Description (turbid, clear, etc.) _________________________________________ ______________________________________________________________________ Site Schematic:
Figure 22. SOD SITE EVALUATION FORM
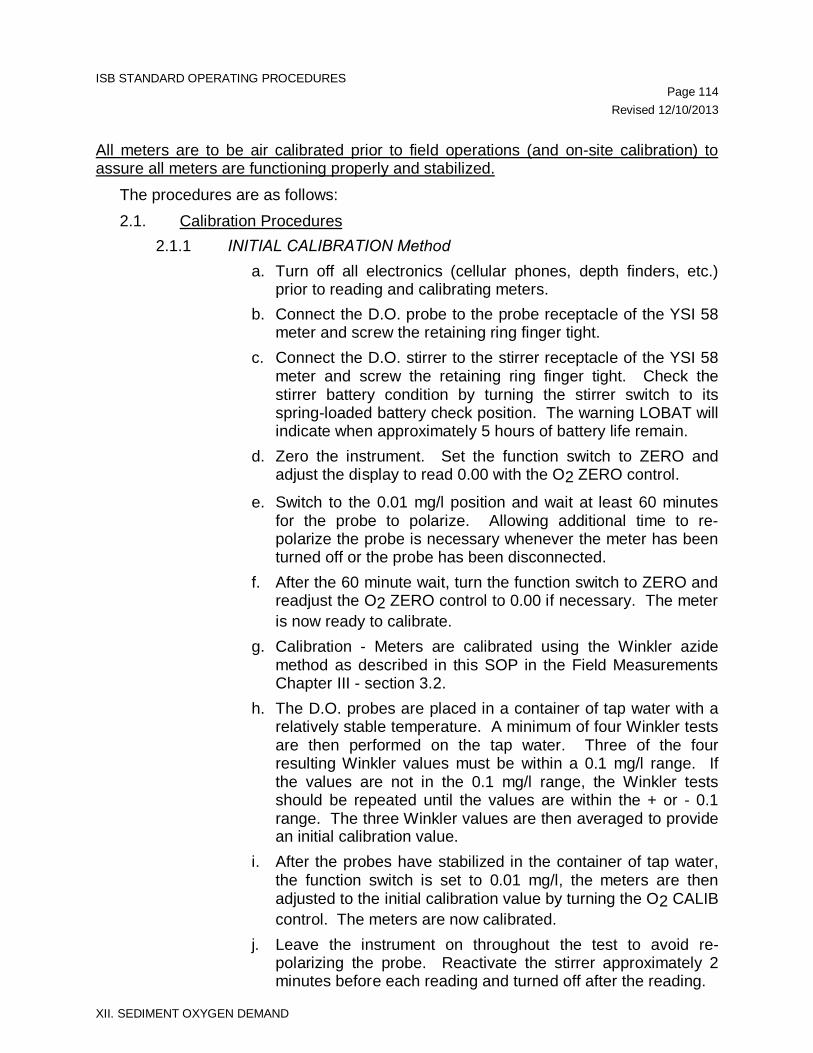
ISB STANDARD OPERATING PROCEDURES Page 114 Revised 12/10/2013
XII. SEDIMENT OXYGEN DEMAND
All meters are to be air calibrated prior to field operations (and on-site calibration) to assure all meters are functioning properly and stabilized.
The procedures are as follows: 2.1. Calibration Procedures
2.1.1 INITIAL CALIBRATION Method a. Turn off all electronics (cellular phones, depth finders, etc.)
prior to reading and calibrating meters. b. Connect the D.O. probe to the probe receptacle of the YSI 58
meter and screw the retaining ring finger tight. c. Connect the D.O. stirrer to the stirrer receptacle of the YSI 58
meter and screw the retaining ring finger tight. Check the stirrer battery condition by turning the stirrer switch to its spring-loaded battery check position. The warning LOBAT will indicate when approximately 5 hours of battery life remain.
d. Zero the instrument. Set the function switch to ZERO and adjust the display to read 0.00 with the O2 ZERO control.
e. Switch to the 0.01 mg/l position and wait at least 60 minutes for the probe to polarize. Allowing additional time to re-polarize the probe is necessary whenever the meter has been turned off or the probe has been disconnected.
f. After the 60 minute wait, turn the function switch to ZERO and readjust the O2 ZERO control to 0.00 if necessary. The meter is now ready to calibrate.
g. Calibration - Meters are calibrated using the Winkler azide method as described in this SOP in the Field Measurements Chapter III - section 3.2.
h. The D.O. probes are placed in a container of tap water with a relatively stable temperature. A minimum of four Winkler tests are then performed on the tap water. Three of the four resulting Winkler values must be within a 0.1 mg/l range. If the values are not in the 0.1 mg/l range, the Winkler tests should be repeated until the values are within the + or - 0.1 range. The three Winkler values are then averaged to provide an initial calibration value.
i. After the probes have stabilized in the container of tap water, the function switch is set to 0.01 mg/l, the meters are then adjusted to the initial calibration value by turning the O2 CALIB control. The meters are now calibrated.
j. Leave the instrument on throughout the test to avoid re-polarizing the probe. Reactivate the stirrer approximately 2 minutes before each reading and turned off after the reading.
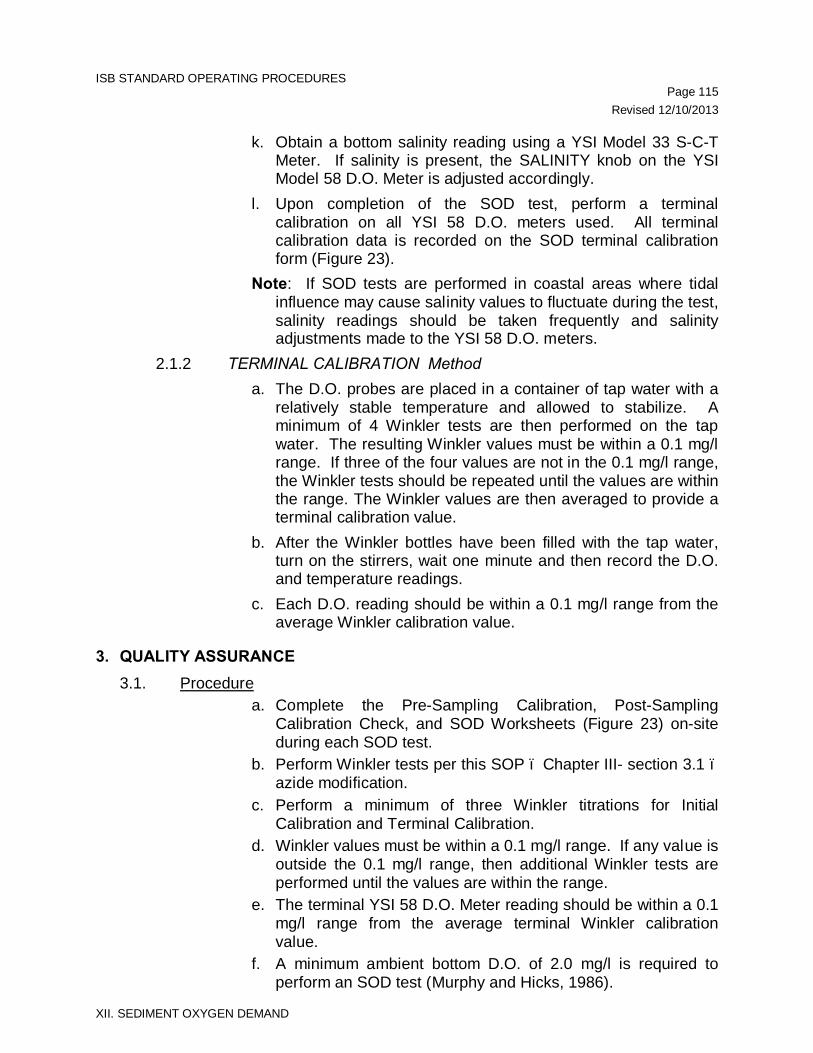
ISB STANDARD OPERATING PROCEDURES Page 115 Revised 12/10/2013
XII. SEDIMENT OXYGEN DEMAND
k. Obtain a bottom salinity reading using a YSI Model 33 S-C-T Meter. If salinity is present, the SALINITY knob on the YSI Model 58 D.O. Meter is adjusted accordingly.
l. Upon completion of the SOD test, perform a terminal calibration on all YSI 58 D.O. meters used. All terminal calibration data is recorded on the SOD terminal calibration form (Figure 23).
Note: If SOD tests are performed in coastal areas where tidal influence may cause salinity values to fluctuate during the test, salinity readings should be taken frequently and salinity adjustments made to the YSI 58 D.O. meters.
2.1.2 TERMINAL CALIBRATION Method a. The D.O. probes are placed in a container of tap water with a
relatively stable temperature and allowed to stabilize. A minimum of 4 Winkler tests are then performed on the tap water. The resulting Winkler values must be within a 0.1 mg/l range. If three of the four values are not in the 0.1 mg/l range, the Winkler tests should be repeated until the values are within the range. The Winkler values are then averaged to provide a terminal calibration value.
b. After the Winkler bottles have been filled with the tap water, turn on the stirrers, wait one minute and then record the D.O. and temperature readings.
c. Each D.O. reading should be within a 0.1 mg/l range from the average Winkler calibration value.
3. QUALITY ASSURANCE 3.1. Procedure
a. Complete the Pre-Sampling Calibration, Post-Sampling Calibration Check, and SOD Worksheets (Figure 23) on-site during each SOD test.
b. Perform Winkler tests per this SOP – Chapter III- section 3.1 – azide modification.
c. Perform a minimum of three Winkler titrations for Initial Calibration and Terminal Calibration.
d. Winkler values must be within a 0.1 mg/l range. If any value is outside the 0.1 mg/l range, then additional Winkler tests are performed until the values are within the range.
e. The terminal YSI 58 D.O. Meter reading should be within a 0.1 mg/l range from the average terminal Winkler calibration value.
f. A minimum ambient bottom D.O. of 2.0 mg/l is required to perform an SOD test (Murphy and Hicks, 1986).
ISB STANDARD OPERATING PROCEDURES Page 116 Revised 12/10/2013
XII. SEDIMENT OXYGEN DEMAND
g. Chamber velocities must be in a 0.08 to 0.12 ft/sec. range (Howard, 1988).
h. Take detailed field notes during the SOD test including a site description.
i. Conduct a pre-check to each SOD study to provide information on the study feasibility and station characteristics. During the -check sediment samples are generally collected to determine bottom characteristics.
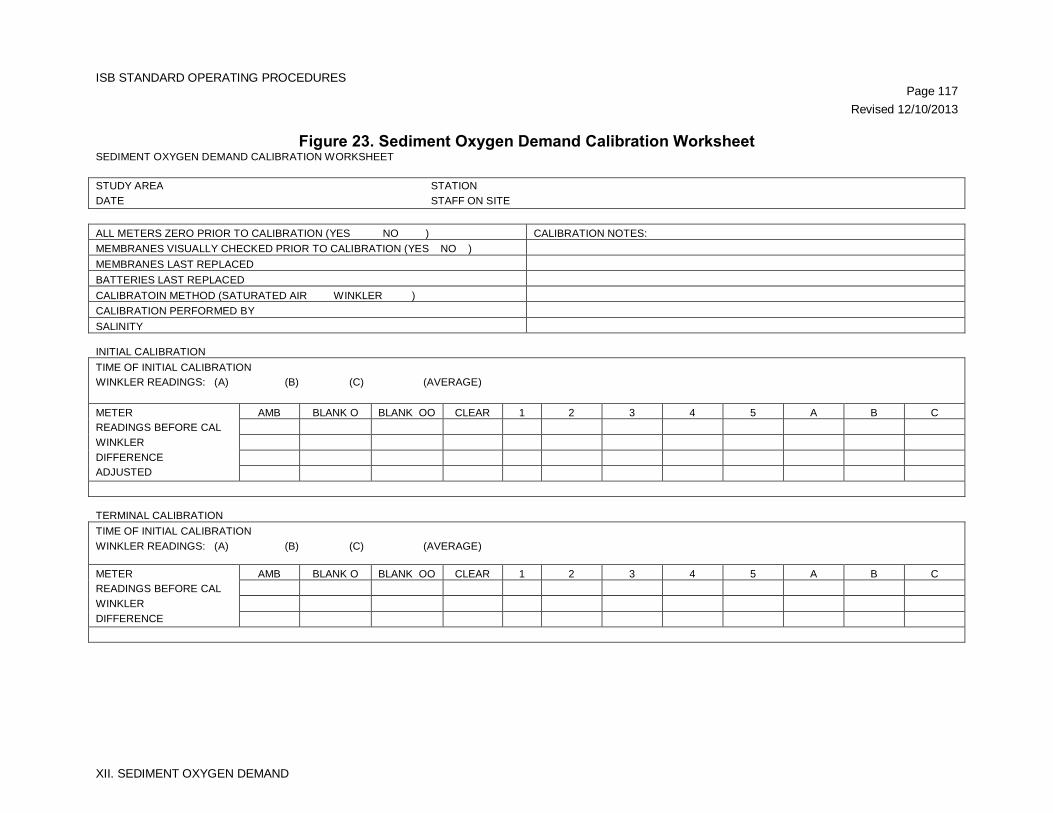
ISB STANDARD OPERATING PROCEDURES Page 117 Revised 12/10/2013
XII. SEDIMENT OXYGEN DEMAND
Figure 23. Sediment Oxygen Demand Calibration Worksheet SEDIMENT OXYGEN DEMAND CALIBRATION WORKSHEET STUDY AREA STATION DATE STAFF ON SITE ALL METERS ZERO PRIOR TO CALIBRATION (YES NO ) CALIBRATION NOTES: MEMBRANES VISUALLY CHECKED PRIOR TO CALIBRATION (YES NO ) MEMBRANES LAST REPLACED BATTERIES LAST REPLACED CALIBRATOIN METHOD (SATURATED AIR WINKLER ) CALIBRATION PERFORMED BY SALINITY INITIAL CALIBRATION TIME OF INITIAL CALIBRATION WINKLER READINGS: (A) (B) (C) (AVERAGE) METER READINGS BEFORE CAL WINKLER DIFFERENCE ADJUSTED
AMB BLANK O BLANK OO CLEAR 1 2 3 4 5 A B C
TERMINAL CALIBRATION TIME OF INITIAL CALIBRATION WINKLER READINGS: (A) (B) (C) (AVERAGE) METER READINGS BEFORE CAL WINKLER DIFFERENCE
AMB BLANK O BLANK OO CLEAR 1 2 3 4 5 A B C
ISB STANDARD OPERATING PROCEDURES Page 118 Last Revised 12/11/13
XII. SEDIMENT OXYGEN DEMAND
4. CHAMBER DEPLOYMENT After the D.O. meter calibration procedure is complete, the SOD chambers are prepared for the test. All chambers are prepared as follows prior to being placed into the water (Lawhorn, 1988). 4.1. Setting up Chambers
4.1.1. Chamber Preparation a. Place the lids on replicate chambers in the up position with
spacers located between the lid and lid companion ring. Wing nuts should be tight enough to hold the spacers in place but not so tight as to hamper removal after the chamber has been set in place on the bottom.
b. Insert the water sampling port stoppers on each chamber lid (size #1, two on each lid).
c. Open the monitoring probe port on all chamber lids (no stoppers).
d. Inspect the replicate chamber lid gaskets for damage or debris that could prevent a watertight seal.
e. Inspect the seals on the blank chambers for damage. f. Clip the harness ropes to each chamber. g. Open the water intake ports located on the bottom of the blank
chambers (no stoppers). h. Disconnect the return pump tubing from the chamber lid male
connectors. 4.2. Boat operation only:
a. Hang the chambers in sequential order along the gunwale with the chamber lids several inches below the surface of the water.
b. Tie the chamber harness to a gunwale cleat. c. Situate the boat over the bottom where the chambers will be
placed. d. Do not allow the chambers to disturb the bottom sediment.
4.3. Land operation: Chambers are placed on the stream bank in the order that they will be deployed. This will prevent harness ropes, pump cables and probe cables from becoming tangled during the chamber deployment and the SOD test.
4.4. Chamber deployment:
a. Blank chambers are deployed first because sufficient time is required to replace surface water trapped inside the chamber with ambient bottom water prior to initiating the SOD test.
ISB STANDARD OPERATING PROCEDURES Page 119 Last Revised 12/11/13
XII. SEDIMENT OXYGEN DEMAND
b. When deploying blank chambers in soft sediment, place the chambers in an area away from the area that the replicate chambers will be deployed in order to avoid stirred up sediments from being drawn into the chamber through the open probe port.
c. One clear polycarbonate and acrylic blank chamber is used in addition to the conventional aluminum blank chambers to provide an indication of whether or not photosynthesis is occurring in the water column. The mechanical functions and the deployment procedure for the clear blank chamber are identical to that of the aluminum blank chambers. In cases of high flow a weighted band should be placed around the clear chamber to prevent it from being washed away.
d. Each blank chamber must be filled with surface water that enters through the two filling ports located on the bottom plate of the chamber.
e. After the blank chamber is filled at the surface and prior to lowering the chamber, two #11½ stoppers must be inserted into the filling ports. Surface water is used to fill the blank chamber to create negative buoyancy so the chamber can be lowered to the bottom.
f. After the filling port stoppers are in place, the chamber is agitated to dislodge any air that is trapped under the lid. The trapped air will exit through the probe port.
g. The chamber is then lowered to the bottom. h. When the blank chamber is on the bottom, the pump is turned on.
Unlike the replicate chambers, the lid and bottom of the blank chambers are permanently sealed thus no water exchange occurs when the chamber is lowered to the bottom. Surface water must be purged from the chambers by operating the pump with the tubing disconnected from the male adapters on the lid while the chamber is on the bottom. Bottom water is drawn into the chamber through the open probe port while the surface water is purged through the disconnected return tubing. With the two return pump tubes disconnected, the chamber will purge surface water and draw in bottom water.
i. A light tapping on the pump housing and tubing will dislodge air bubbles trapped in the pump system.
j. The pump is then allowed to run while the other chambers are being deployed.
k. This procedure is repeated for each blank chamber. 4.5. Replicate Chamber Deployment
a. After the blank chambers are deployed, each replicate chamber is slowly lowered to the bottom substrate prior to setting the chamber.
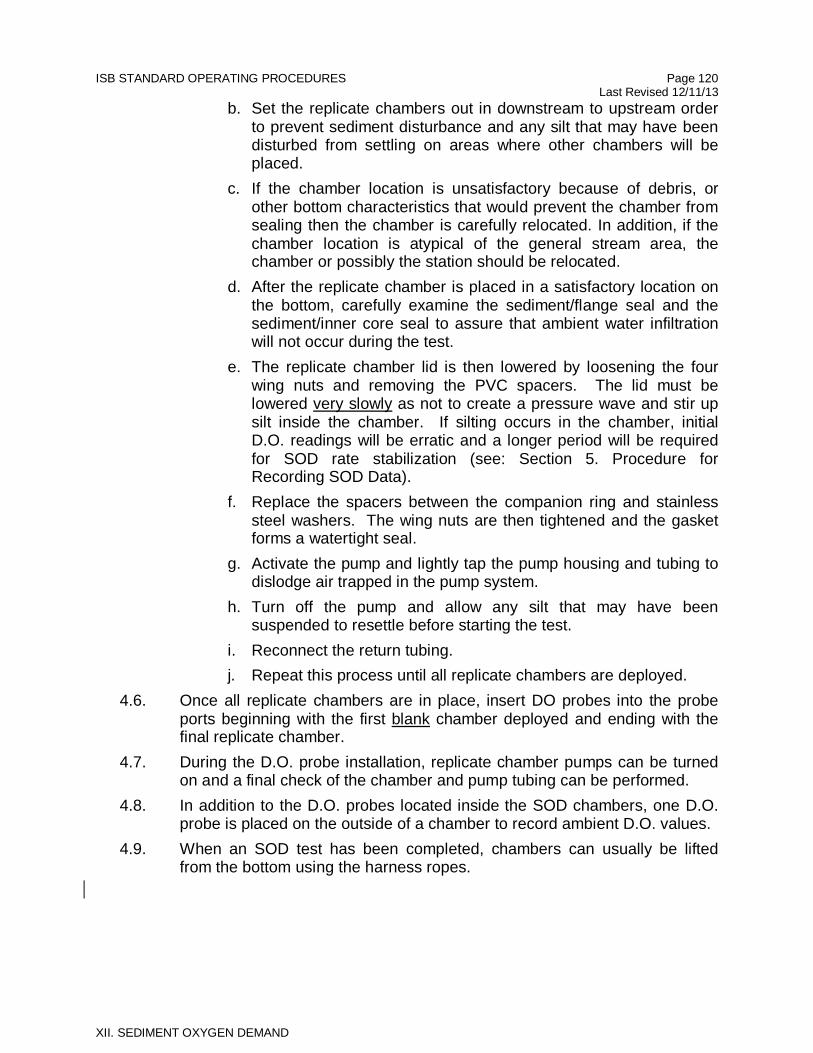
ISB STANDARD OPERATING PROCEDURES Page 120 Last Revised 12/11/13
XII. SEDIMENT OXYGEN DEMAND
b. Set the replicate chambers out in downstream to upstream order to prevent sediment disturbance and any silt that may have been disturbed from settling on areas where other chambers will be placed.
c. If the chamber location is unsatisfactory because of debris, or other bottom characteristics that would prevent the chamber from sealing then the chamber is carefully relocated. In addition, if the chamber location is atypical of the general stream area, the chamber or possibly the station should be relocated.
d. After the replicate chamber is placed in a satisfactory location on the bottom, carefully examine the sediment/flange seal and the sediment/inner core seal to assure that ambient water infiltration will not occur during the test.
e. The replicate chamber lid is then lowered by loosening the four wing nuts and removing the PVC spacers. The lid must be lowered very slowly as not to create a pressure wave and stir up silt inside the chamber. If silting occurs in the chamber, initial D.O. readings will be erratic and a longer period will be required for SOD rate stabilization (see: Section 5. Procedure for Recording SOD Data).
f. Replace the spacers between the companion ring and stainless steel washers. The wing nuts are then tightened and the gasket forms a watertight seal.
g. Activate the pump and lightly tap the pump housing and tubing to dislodge air trapped in the pump system.
h. Turn off the pump and allow any silt that may have been suspended to resettle before starting the test.
i. Reconnect the return tubing. j. Repeat this process until all replicate chambers are deployed.
4.6. Once all replicate chambers are in place, insert DO probes into the probe ports beginning with the first blank chamber deployed and ending with the final replicate chamber.
4.7. During the D.O. probe installation, replicate chamber pumps can be turned on and a final check of the chamber and pump tubing can be performed.
4.8. In addition to the D.O. probes located inside the SOD chambers, one D.O. probe is placed on the outside of a chamber to record ambient D.O. values.
4.9. When an SOD test has been completed, chambers can usually be lifted from the bottom using the harness ropes.
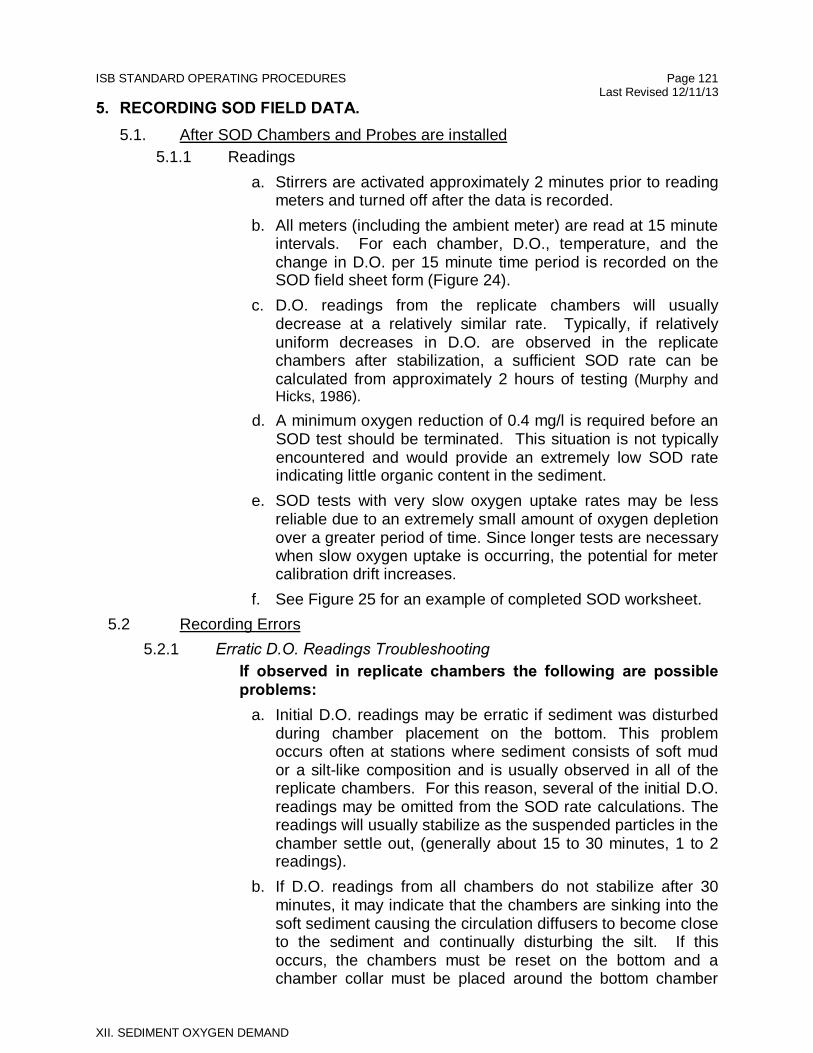
ISB STANDARD OPERATING PROCEDURES Page 121 Last Revised 12/11/13
XII. SEDIMENT OXYGEN DEMAND
5. RECORDING SOD FIELD DATA. 5.1. After SOD Chambers and Probes are installed
5.1.1 Readings a. Stirrers are activated approximately 2 minutes prior to reading
meters and turned off after the data is recorded. b. All meters (including the ambient meter) are read at 15 minute
intervals. For each chamber, D.O., temperature, and the change in D.O. per 15 minute time period is recorded on the SOD field sheet form (Figure 24).
c. D.O. readings from the replicate chambers will usually decrease at a relatively similar rate. Typically, if relatively uniform decreases in D.O. are observed in the replicate chambers after stabilization, a sufficient SOD rate can be calculated from approximately 2 hours of testing (Murphy and Hicks, 1986).
d. A minimum oxygen reduction of 0.4 mg/l is required before an SOD test should be terminated. This situation is not typically encountered and would provide an extremely low SOD rate indicating little organic content in the sediment.
e. SOD tests with very slow oxygen uptake rates may be less reliable due to an extremely small amount of oxygen depletion over a greater period of time. Since longer tests are necessary when slow oxygen uptake is occurring, the potential for meter calibration drift increases.
f. See Figure 25 for an example of completed SOD worksheet. 5.2 Recording Errors
5.2.1 Erratic D.O. Readings Troubleshooting If observed in replicate chambers the following are possible problems:
a. Initial D.O. readings may be erratic if sediment was disturbed during chamber placement on the bottom. This problem occurs often at stations where sediment consists of soft mud or a silt-like composition and is usually observed in all of the replicate chambers. For this reason, several of the initial D.O. readings may be omitted from the SOD rate calculations. The readings will usually stabilize as the suspended particles in the chamber settle out, (generally about 15 to 30 minutes, 1 to 2 readings).
b. If D.O. readings from all chambers do not stabilize after 30 minutes, it may indicate that the chambers are sinking into the soft sediment causing the circulation diffusers to become close to the sediment and continually disturbing the silt. If this occurs, the chambers must be reset on the bottom and a chamber collar must be placed around the bottom chamber
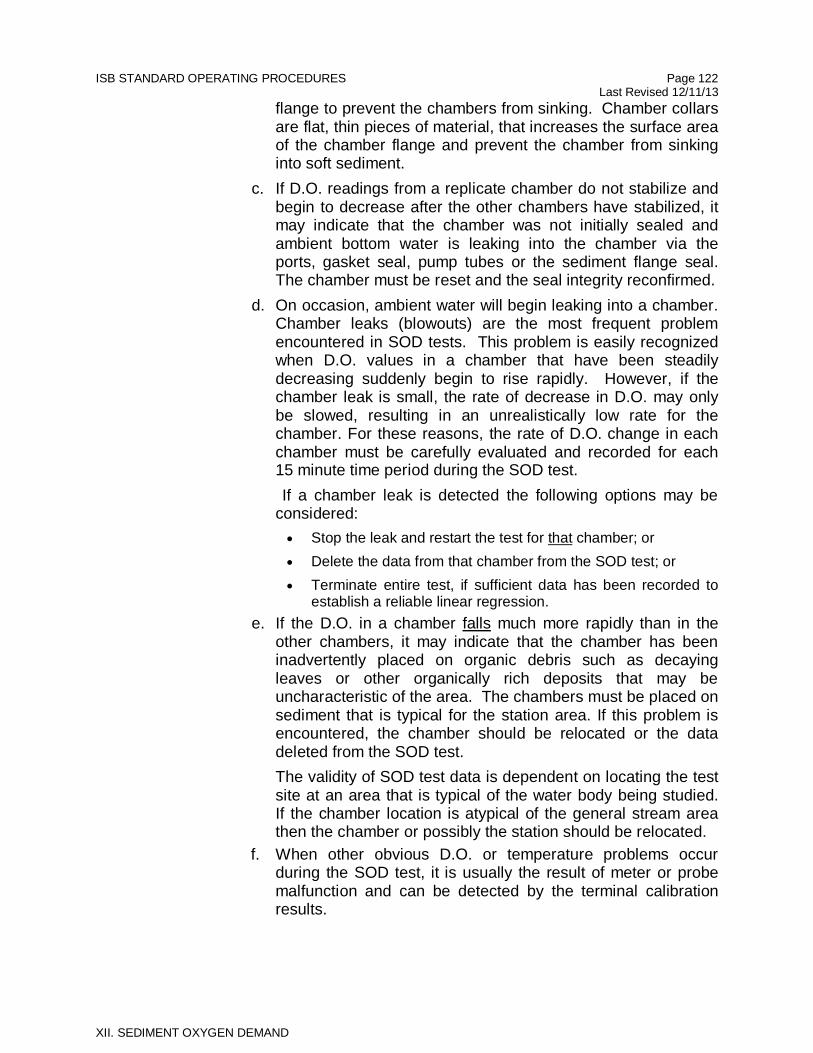
ISB STANDARD OPERATING PROCEDURES Page 122 Last Revised 12/11/13
XII. SEDIMENT OXYGEN DEMAND
flange to prevent the chambers from sinking. Chamber collars are flat, thin pieces of material, that increases the surface area of the chamber flange and prevent the chamber from sinking into soft sediment.
c. If D.O. readings from a replicate chamber do not stabilize and begin to decrease after the other chambers have stabilized, it may indicate that the chamber was not initially sealed and ambient bottom water is leaking into the chamber via the ports, gasket seal, pump tubes or the sediment flange seal. The chamber must be reset and the seal integrity reconfirmed.
d. On occasion, ambient water will begin leaking into a chamber. Chamber leaks (blowouts) are the most frequent problem encountered in SOD tests. This problem is easily recognized when D.O. values in a chamber that have been steadily decreasing suddenly begin to rise rapidly. However, if the chamber leak is small, the rate of decrease in D.O. may only be slowed, resulting in an unrealistically low rate for the chamber. For these reasons, the rate of D.O. change in each chamber must be carefully evaluated and recorded for each 15 minute time period during the SOD test.
If a chamber leak is detected the following options may be considered:
• Stop the leak and restart the test for that chamber; or • Delete the data from that chamber from the SOD test; or • Terminate entire test, if sufficient data has been recorded to
establish a reliable linear regression. e. If the D.O. in a chamber falls much more rapidly than in the
other chambers, it may indicate that the chamber has been inadvertently placed on organic debris such as decaying leaves or other organically rich deposits that may be uncharacteristic of the area. The chambers must be placed on sediment that is typical for the station area. If this problem is encountered, the chamber should be relocated or the data deleted from the SOD test. The validity of SOD test data is dependent on locating the test site at an area that is typical of the water body being studied. If the chamber location is atypical of the general stream area then the chamber or possibly the station should be relocated.
f. When other obvious D.O. or temperature problems occur during the SOD test, it is usually the result of meter or probe malfunction and can be detected by the terminal calibration results.
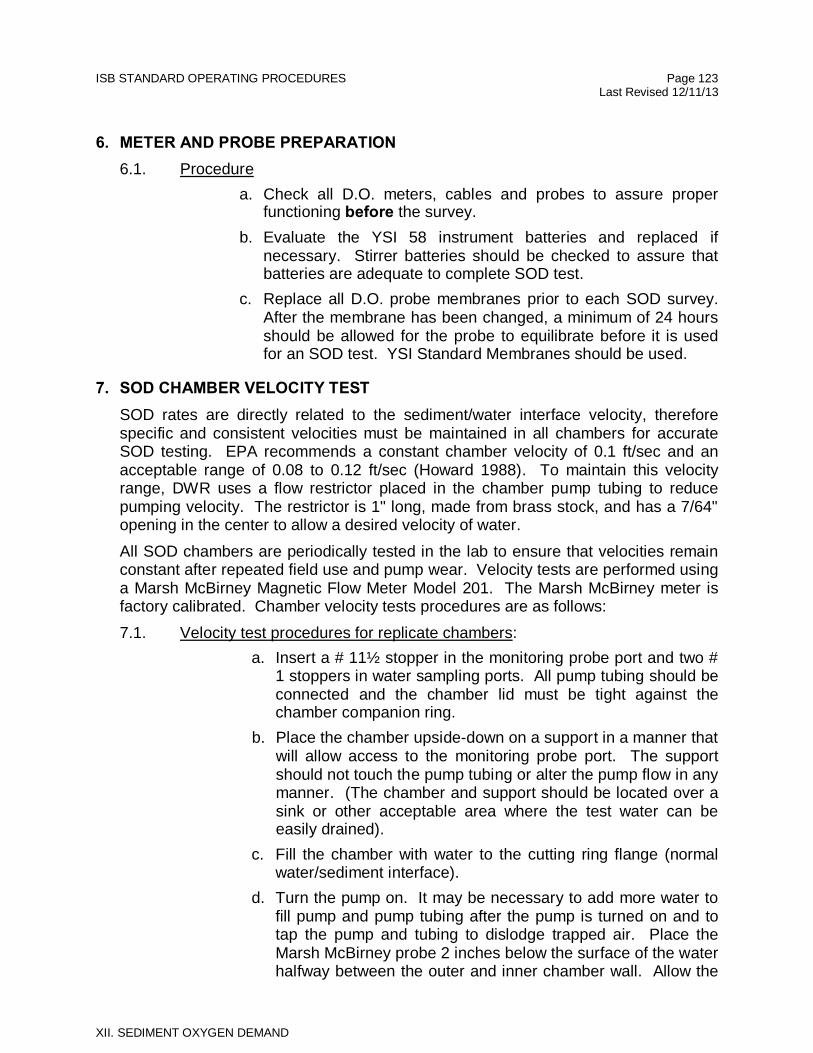
ISB STANDARD OPERATING PROCEDURES Page 123 Last Revised 12/11/13
XII. SEDIMENT OXYGEN DEMAND
6. METER AND PROBE PREPARATION 6.1. Procedure
a. Check all D.O. meters, cables and probes to assure proper functioning before the survey.
b. Evaluate the YSI 58 instrument batteries and replaced if necessary. Stirrer batteries should be checked to assure that batteries are adequate to complete SOD test.
c. Replace all D.O. probe membranes prior to each SOD survey. After the membrane has been changed, a minimum of 24 hours should be allowed for the probe to equilibrate before it is used for an SOD test. YSI Standard Membranes should be used.
7. SOD CHAMBER VELOCITY TEST SOD rates are directly related to the sediment/water interface velocity, therefore specific and consistent velocities must be maintained in all chambers for accurate SOD testing. EPA recommends a constant chamber velocity of 0.1 ft/sec and an acceptable range of 0.08 to 0.12 ft/sec (Howard 1988). To maintain this velocity range, DWR uses a flow restrictor placed in the chamber pump tubing to reduce pumping velocity. The restrictor is 1" long, made from brass stock, and has a 7/64" opening in the center to allow a desired velocity of water. All SOD chambers are periodically tested in the lab to ensure that velocities remain constant after repeated field use and pump wear. Velocity tests are performed using a Marsh McBirney Magnetic Flow Meter Model 201. The Marsh McBirney meter is factory calibrated. Chamber velocity tests procedures are as follows: 7.1. Velocity test procedures for replicate chambers:
a. Insert a # 11½ stopper in the monitoring probe port and two # 1 stoppers in water sampling ports. All pump tubing should be connected and the chamber lid must be tight against the chamber companion ring.
b. Place the chamber upside-down on a support in a manner that will allow access to the monitoring probe port. The support should not touch the pump tubing or alter the pump flow in any manner. (The chamber and support should be located over a sink or other acceptable area where the test water can be easily drained).
c. Fill the chamber with water to the cutting ring flange (normal water/sediment interface).
d. Turn the pump on. It may be necessary to add more water to fill pump and pump tubing after the pump is turned on and to tap the pump and tubing to dislodge trapped air. Place the Marsh McBirney probe 2 inches below the surface of the water halfway between the outer and inner chamber wall. Allow the
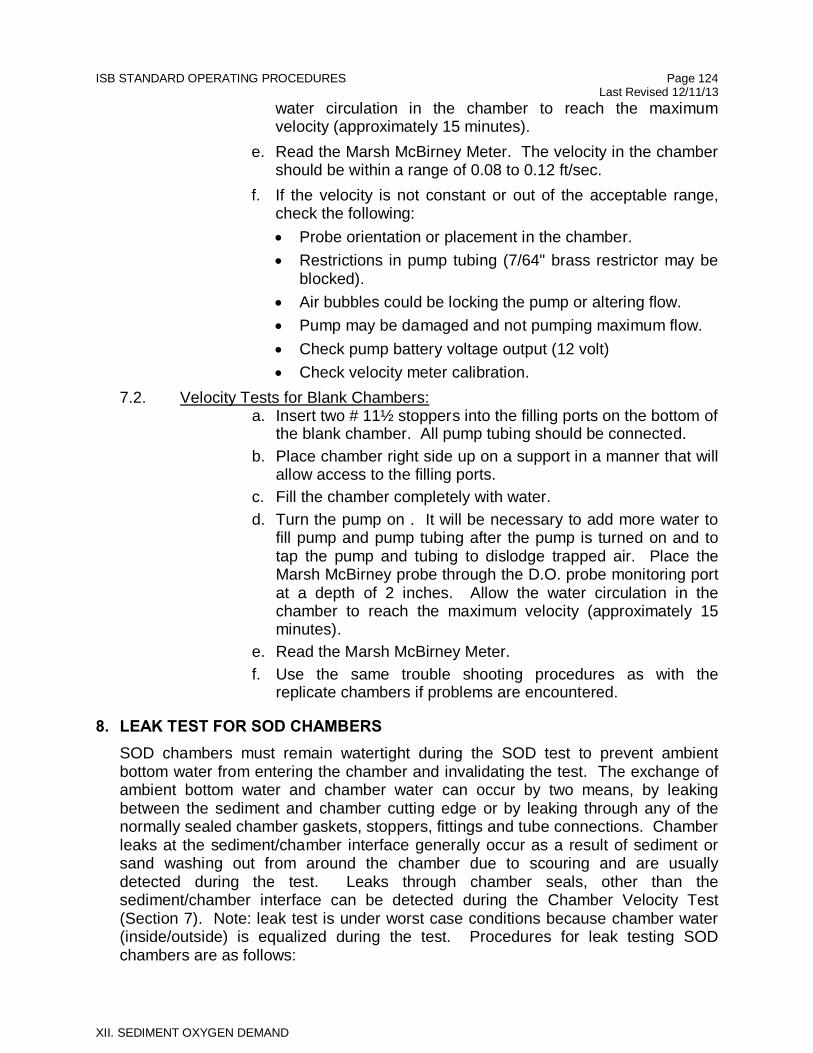
ISB STANDARD OPERATING PROCEDURES Page 124 Last Revised 12/11/13
XII. SEDIMENT OXYGEN DEMAND
water circulation in the chamber to reach the maximum velocity (approximately 15 minutes).
e. Read the Marsh McBirney Meter. The velocity in the chamber should be within a range of 0.08 to 0.12 ft/sec.
f. If the velocity is not constant or out of the acceptable range, check the following: • Probe orientation or placement in the chamber. • Restrictions in pump tubing (7/64" brass restrictor may be
blocked). • Air bubbles could be locking the pump or altering flow. • Pump may be damaged and not pumping maximum flow. • Check pump battery voltage output (12 volt) • Check velocity meter calibration.
7.2. Velocity Tests for Blank Chambers: a. Insert two # 11½ stoppers into the filling ports on the bottom of
the blank chamber. All pump tubing should be connected. b. Place chamber right side up on a support in a manner that will
allow access to the filling ports. c. Fill the chamber completely with water. d. Turn the pump on . It will be necessary to add more water to
fill pump and pump tubing after the pump is turned on and to tap the pump and tubing to dislodge trapped air. Place the Marsh McBirney probe through the D.O. probe monitoring port at a depth of 2 inches. Allow the water circulation in the chamber to reach the maximum velocity (approximately 15 minutes).
e. Read the Marsh McBirney Meter. f. Use the same trouble shooting procedures as with the
replicate chambers if problems are encountered.
8. LEAK TEST FOR SOD CHAMBERS SOD chambers must remain watertight during the SOD test to prevent ambient bottom water from entering the chamber and invalidating the test. The exchange of ambient bottom water and chamber water can occur by two means, by leaking between the sediment and chamber cutting edge or by leaking through any of the normally sealed chamber gaskets, stoppers, fittings and tube connections. Chamber leaks at the sediment/chamber interface generally occur as a result of sediment or sand washing out from around the chamber due to scouring and are usually detected during the test. Leaks through chamber seals, other than the sediment/chamber interface can be detected during the Chamber Velocity Test (Section 7). Note: leak test is under worst case conditions because chamber water (inside/outside) is equalized during the test. Procedures for leak testing SOD chambers are as follows:
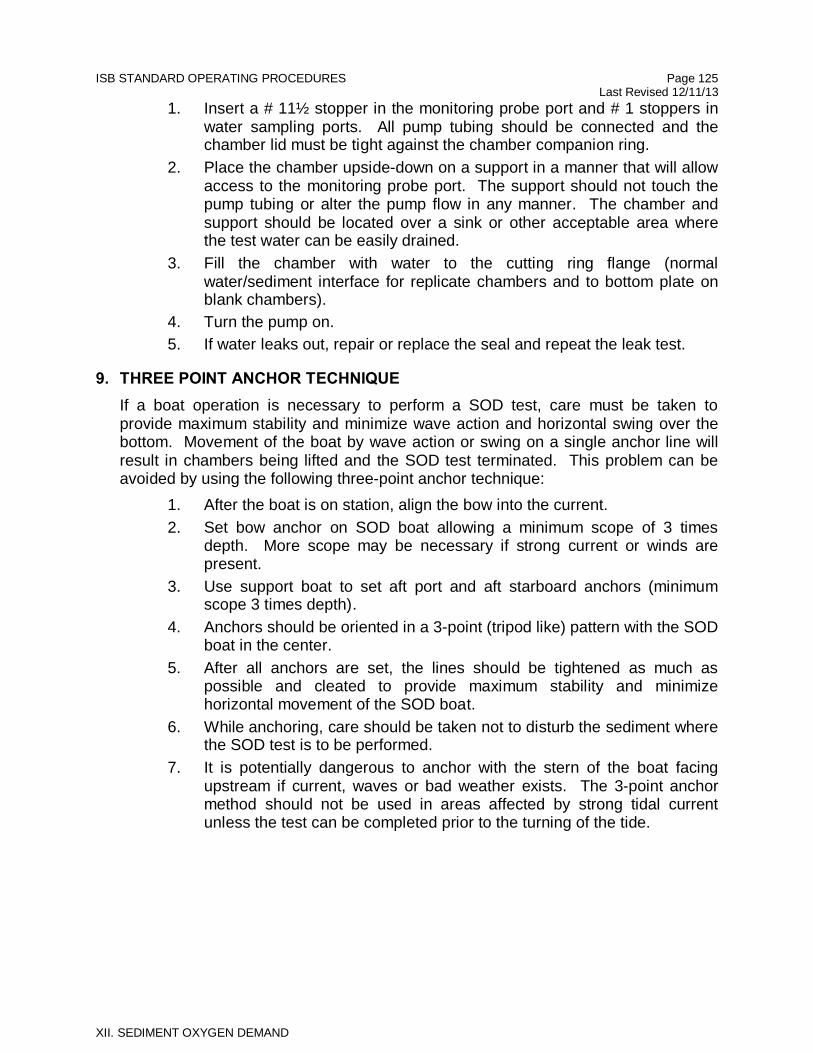
ISB STANDARD OPERATING PROCEDURES Page 125 Last Revised 12/11/13
XII. SEDIMENT OXYGEN DEMAND
1. Insert a # 11½ stopper in the monitoring probe port and # 1 stoppers in water sampling ports. All pump tubing should be connected and the chamber lid must be tight against the chamber companion ring.
2. Place the chamber upside-down on a support in a manner that will allow access to the monitoring probe port. The support should not touch the pump tubing or alter the pump flow in any manner. The chamber and support should be located over a sink or other acceptable area where the test water can be easily drained.
3. Fill the chamber with water to the cutting ring flange (normal water/sediment interface for replicate chambers and to bottom plate on blank chambers).
4. Turn the pump on. 5. If water leaks out, repair or replace the seal and repeat the leak test.
9. THREE POINT ANCHOR TECHNIQUE If a boat operation is necessary to perform a SOD test, care must be taken to provide maximum stability and minimize wave action and horizontal swing over the bottom. Movement of the boat by wave action or swing on a single anchor line will result in chambers being lifted and the SOD test terminated. This problem can be avoided by using the following three-point anchor technique:
1. After the boat is on station, align the bow into the current. 2. Set bow anchor on SOD boat allowing a minimum scope of 3 times
depth. More scope may be necessary if strong current or winds are present.
3. Use support boat to set aft port and aft starboard anchors (minimum scope 3 times depth).
4. Anchors should be oriented in a 3-point (tripod like) pattern with the SOD boat in the center.
5. After all anchors are set, the lines should be tightened as much as possible and cleated to provide maximum stability and minimize horizontal movement of the SOD boat.
6. While anchoring, care should be taken not to disturb the sediment where the SOD test is to be performed.
7. It is potentially dangerous to anchor with the stern of the boat facing upstream if current, waves or bad weather exists. The 3-point anchor method should not be used in areas affected by strong tidal current unless the test can be completed prior to the turning of the tide.
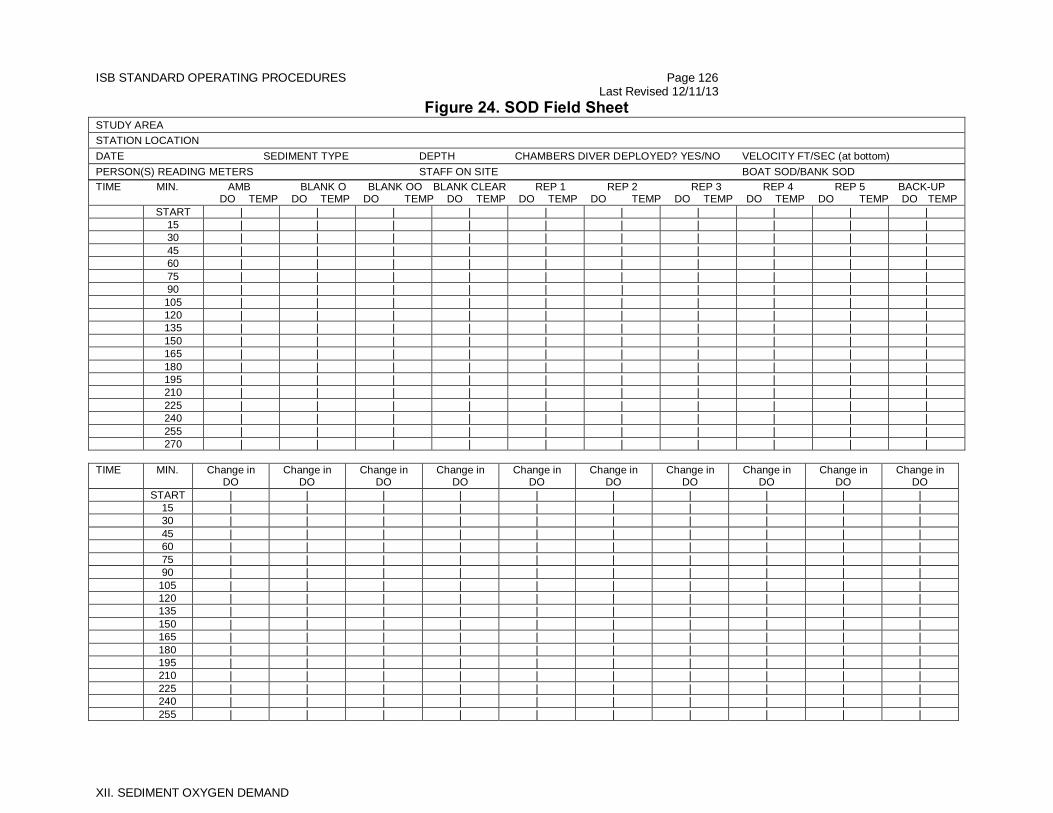
ISB STANDARD OPERATING PROCEDURES Page 126 Last Revised 12/11/13
XII. SEDIMENT OXYGEN DEMAND
Figure 24. SOD Field Sheet STUDY AREA STATION LOCATION DATE SEDIMENT TYPE DEPTH CHAMBERS DIVER DEPLOYED? YES/NO VELOCITY FT/SEC (at bottom) PERSON(S) READING METERS STAFF ON SITE BOAT SOD/BANK SOD TIME MIN. AMB BLANK O BLANK OO BLANK CLEAR REP 1 REP 2 REP 3 REP 4 REP 5 BACK-UP DO TEMP DO TEMP DO TEMP DO TEMP DO TEMP DO TEMP DO TEMP DO TEMP DO TEMP DO TEMP START | | | | | | | | | | 15 | | | | | | | | | | 30 | | | | | | | | | | 45 | | | | | | | | | | 60 | | | | | | | | | | 75 | | | | | | | | | | 90 | | | | | | | | | | 105 | | | | | | | | | | 120 | | | | | | | | | | 135 | | | | | | | | | | 150 | | | | | | | | | | 165 | | | | | | | | | | 180 | | | | | | | | | | 195 | | | | | | | | | | 210 | | | | | | | | | | 225 | | | | | | | | | | 240 | | | | | | | | | | 255 | | | | | | | | | | 270 | | | | | | | | | | TIME MIN. Change in
DO Change in
DO Change in
DO Change in
DO Change in
DO Change in
DO Change in
DO Change in
DO Change in
DO Change in
DO START | | | | | | | | | | 15 | | | | | | | | | | 30 | | | | | | | | | | 45 | | | | | | | | | | 60 | | | | | | | | | | 75 | | | | | | | | | | 90 | | | | | | | | | | 105 | | | | | | | | | | 120 | | | | | | | | | | 135 | | | | | | | | | | 150 | | | | | | | | | | 165 | | | | | | | | | | 180 | | | | | | | | | | 195 | | | | | | | | | | 210 | | | | | | | | | | 225 | | | | | | | | | | 240 | | | | | | | | | | 255 | | | | | | | | | |
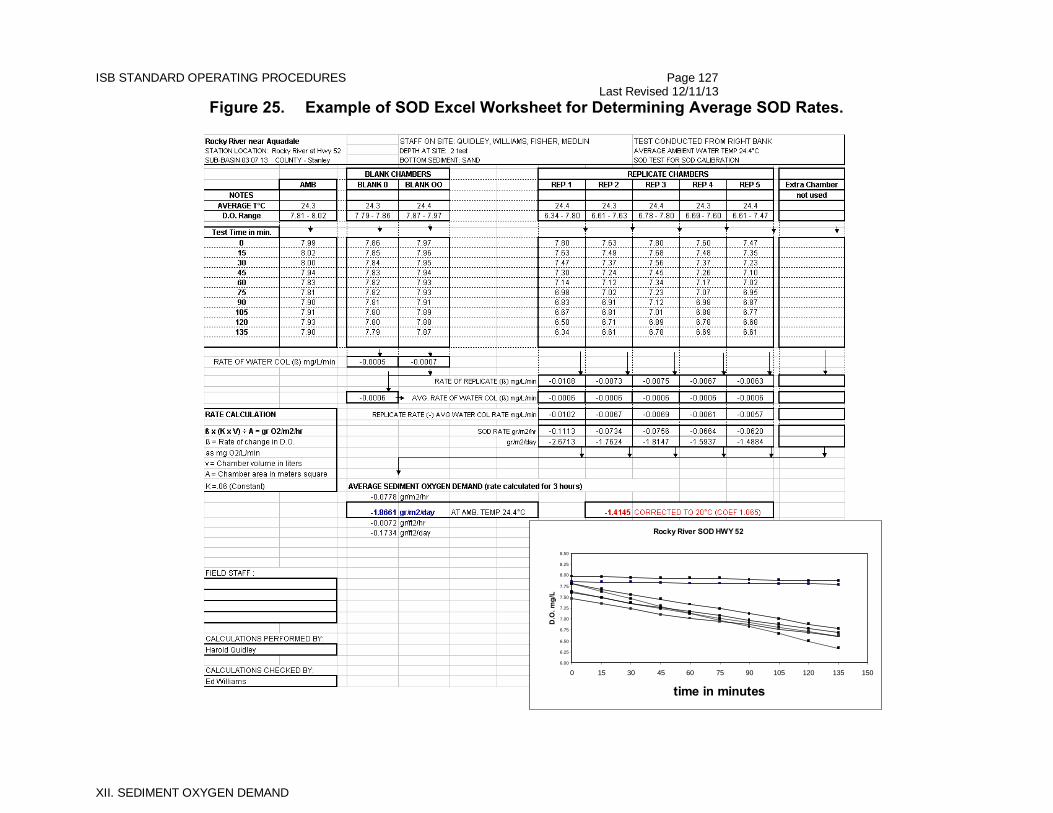
ISB STANDARD OPERATING PROCEDURES Page 127 Last Revised 12/11/13
XII. SEDIMENT OXYGEN DEMAND
Figure 25. Example of SOD Excel Worksheet for Determining Average SOD Rates.
Rocky River SOD HWY 52
6.00
6.25
6.50
6.75
7.00
7.25
7.50
7.75
8.00
8.25
8.50
0 15 30 45 60 75 90 105 120 135 150
time in minutes
D.O
. mg/
L
ISB STANDARD OPERATING PROCEDURES Page 128 Last Revised 12/11/13
XiII. References
XIII. REFERENCES
American Public Health Association. 1992. Standard Methods for the Examination of
Water and Wastewater, 18th edition. Washington, D.C. Buchanan, T.J., and W.P. Somers. 1969. Stage Measurement at Gauging Stations.
Techniques of Water-Resources Investigations of the United States Geological Survey, Book 3, Chapter A7. United States Geological Survey.
------. 1973. Discharge Measurements at Gauging Stations. Techniques of Water-Resources Investigations of the United States Geological Survey, Book 3, Chapter A8. United States Geological Survey.
Howard, H., 1988. U.S. Environmental Protection Agency, Region IV, Athens Ga. personal communication.
Hutchinson, G.E. 1975. A Treatise on Limnology. John Wiley and Sons, Inc., New York. Instrument Specialties Company. 1988. Instruction Manual Model 2700 Sampler.
Lincoln, Nebraska. Instrument Specialties Company. 1991. 3700 Portable Sampler. Instruction Manual.
Lincoln, Nebraska. Inter-Agency Committee on Water Resources. 1965. Instructions for sampling with
depth integrating suspended-sediment samplers, US DH-48 and DH-59. Measurement and Analysis of Sediment Loads in Streams, Report J. St. Anthony Falls Hydraulic Laboratory, Minneapolis, Minnesota.
Kittrell, F.W. 1969. A Practical Guide to Water Quality Studies of Streams. United States Department of the Interior. Federal Water Pollution Control Administration. 135 pp.
Lawhorn, D., 1988. U.S. Environmental Protection Agency, Region IV, Athens Ga. personal communication.
Murphy, P. J. , Hicks D. B., 1986. In-Situ Method for Measuring Sediment Oxygen Demand. Pages 307-322. Sediment Oxygen Demand. Processes, Modeling and Measurement. Institute of Natural Resources, University of Georgia.
Sawyer, Clair N. and Perry L. McCarty. 1967. Chemistry for Sanitary Engineers. McGraw Hill, New York. 518 pp.
Smoot, G. F., and C. E. Novak. 1968. Calibration and maintenance of vertical-axis type current meters. Techniques of Water-Resources Investigations of the United States Geological Survey, Book 8, Chapter B2. United States Geological Survey.
United States Environmental Protection Agency. 1976. Quality Criteria for Water. Washington, D.C. 256 pp.
------. 1980. Standard Operating Procedures and Quality Assurance Manual. Athens, Georgia.
------. 1994. Federal Register. Volume 59, No. 20. 40 CFR Part 136. Guidelines Establishing Test Procedures for the Analysis of Pollutants Under the Clean Water Act; Technical Amendments.
ISB STANDARD OPERATING PROCEDURES Page 129 Last Revised 12/11/13
XiII. References
United States Geological Survey. 1977. National Handbook of Recommended Methods for Water-Data Acquisition. Reston, Virginia.
------. 1992. Selected Water Quality and Biological Characteristics of Streams in Some Forested Basins of North Carolina, 1985-88, United States Geological Survey Water-Resources Investigations Report 92-4129. Raleigh, N.C.
Wilson, Jr., James F. 1968. Fluorometric Procedures for Dye Tracing. Techniques of Water-Resources Investigations of the United States Geological Survey, Book 3, Chapter A12. United States Geological Survey.
ISB STANDARD OPERATING PROCEDURES Page 130 Last Revised 12/11/13
xiv. Additional Resources
XIV. ADDITIONAL RESOURCES
American Fisheries Society, Water Quality Section. 1979. A Review of the E.P.A. Red Book: Quality Criteria for Water. Bethesda, Maryland. 313 pp.
Arthur H. Thomas Co. 1981. Scientific Apparatus Catalog. Philadelphia, Pennsylvania. 1544 pp.
Babbitt, Harold E., James J. Doland and John L. Cleasby. 1967. Water Supply Engineering. McGraw Hill, New York. 672 pp.
California State University. 1991. Operation of Wastewater Treatment Plants - A Field Study Training Program, 3rd Edition. Sacramento, CA. 666 pp.
Corning Glass Works. 1979. pH/Temp Meter 4 Instruction Manual. Medfield, Massachusetts.
Grant, Douglas M. 1978. Isco Open Channel Flow Measurement Handbook, 1st edition. Instrument Specialties Company. Lincoln, Nebraska. 221 pp.
Guy, Harold P. and Vernon W. Norman. 1970. Field Methods for Measurement of Fluvial Sediment. Techniques of Water-Resources Investigations of the United States Geological Survey, Book 3, Chapter C2. United States Geological Survey.
Hydrolab Corporation. 1984. Operation and Maintenance Manual for Hydrolab Surveyor II. Austin Texas.
------. 1991. H20 Multiparameter Water Quality Data System Operating Manual. Austin, Texas.
------. 1991. Scout 2 Multiparameter Water Quality Data Transmitter Operating Manual. Austin, Texas.
Kahl Scientific Instrument Corporation. 1980. Catalog. El Cajon, California. Leupold & Stevens, Inc. 1974. Stevens Water Resources Data Book, 2nd Edition.
Beaverton, Oregon. 200 pp. Marsh-McBirney, Inc. Instruction Manual Model 201 Portable Water Current Meter.
Gaithersburg, Maryland. 15pp. McKee, Jack E. and Harold W. Wolf, eds. 1963. Water Quality Criteria. California State
Water Resources Control Board, Publication 3-A. 548 pp. New York State Department of Health. Manual of Instruction for Sewage Treatment
Plant Operators. Health Education Service, Albany, New York. 243 pp. North Carolina Division of Environmental Management. 1986. Administrative Code
Section: 15NCAC2B .0100-Procedures for Assignment of Water Quality Standards, 15NCAC 2B:0200-Classifications and Water Quality Standards Applicable to Surface Waters of North Carolina. Raleigh, N.C.
Simmons, Clyde E. 1981. Quality Assurance Plan for Water Quality Activities of the North Carolina District. United States Geological Survey. Reston, Virginia. 53 pp.
Simmons, Clyde E. and Ralph C. Heath. 1979. Water Quality Characteristics of Streams in Forested and Rural Areas of North Carolina. U.S. Geological Survey Water Resources Investigations 79-108. United States Geological Survey.
ISB STANDARD OPERATING PROCEDURES Page 131 Last Revised 12/11/13
xiv. Additional Resources
Smoot, George F. and Charles E. Novak. 1968. Calibration and Maintenance of Vertical-Axis Type Current Meters. Techniques of Water-Resources Investigations of the United States Geological Survey, Book 8, Chapter B2. United States Geological Survey.
United States Environmental Protection Agency. 1974. Methods for Chemical Analysis of Water and Wastes. Cincinatti, Ohio. 312 pp.
------. 1989. Short Term Methods for Estimating the Chronic Toxicity of Effluents and Receiving Waters to Freshwater Organisms. Second Edition. EPA/600/4-89/001. 249 pp.
------. 1991. Methods for Measuring the Acute Toxicity of Effluents to Freshwater and Marine Organisms. Fourth Edition. EPA/600/4-90/027. 216pp.
United States Geological Survey. 1982. Water Quality of North Carolina Streams, United States Geological Survey Water-Supply Paper 2185 A-D. Washington, D.C.
Water Pollution Control Federation. 1970. Operation of Wastewater Treatment Plants. Lancaster Press, Inc., Lancaster, PA. 193 pp.
------. 1971. Simplified Laboratory Procedures for Wastewater Examination. WPCF Publication No. 18.
Welch, P.S. 1948. Limnological Methods. McGraw Hill, New York. 381 pp. Wildco. Petersen and Ponar Bottom Samplers. Trippensee Publishing Co., Saginaw,
Michigan. 19 pp. ------. Wildco-Eckman Bottom Samplers. Trippensee Publishing Co., Saginaw, Michigan.
15 pp. ------. 1974. Wildco Instruments and Aquatic Sampling Supplies, Catalog No. 77.
Saginaw, Michigan. 110 pp. Wilson, James F., Ernest D. Cobb, and Frederick A, Kilpatrick . 1986. Fluorometric
Procedures for Dye Tracing. Techniques of Water-Resources Investigations of the United States Geological Survey, Book 3, Chapter A12. United States Geological Survey.
Yellow Springs Instrument Co., Inc. 1982. Instruction Manual YSI Model 58 Dissolved Oxygen Meter. Yellow Springs, Ohio. 28 pp.
------. 1983. Instructions for YSI Model 33 and 33M S-C-T Meters. Yellow Springs, Ohio. 16 pp.
ISB STANDARD OPERATING PROCEDURES Page 132 Last Revised 12/11/13
APPENDIX
APPENDICES
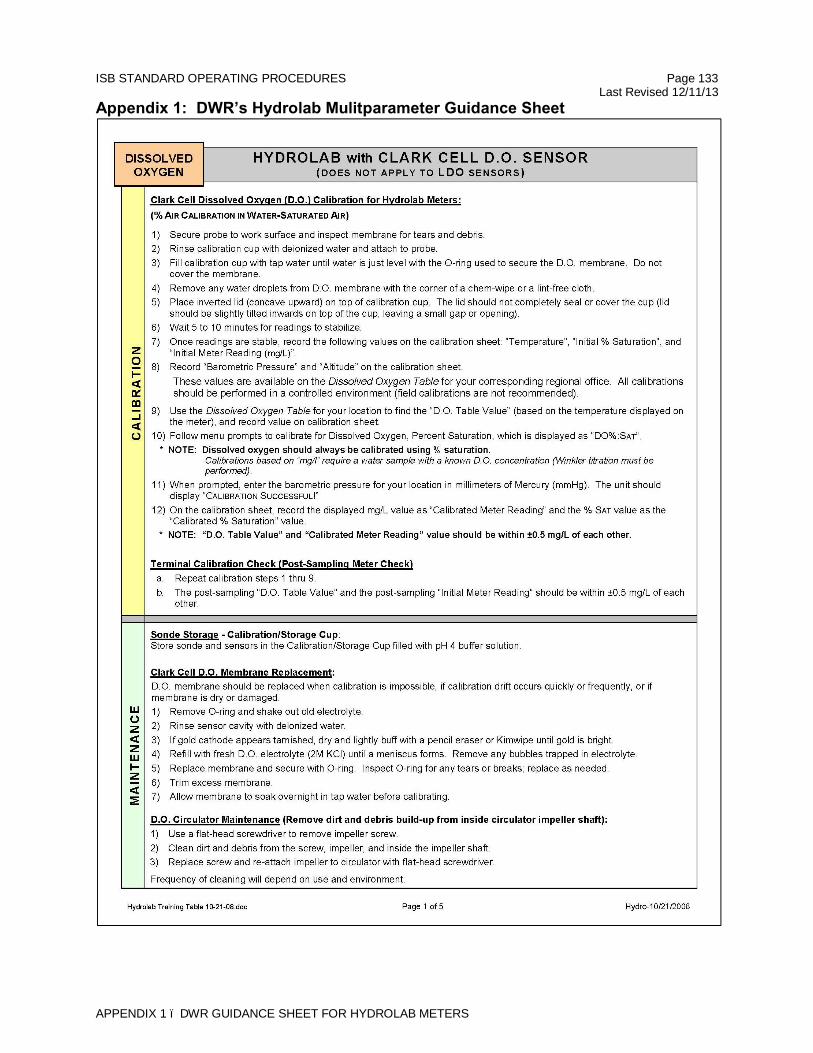
ISB STANDARD OPERATING PROCEDURES Page 133 Last Revised 12/11/13
APPENDIX 1 – DWR GUIDANCE SHEET FOR HYDROLAB METERS
Appendix 1: DWR’s Hydrolab Mulitparameter Guidance Sheet
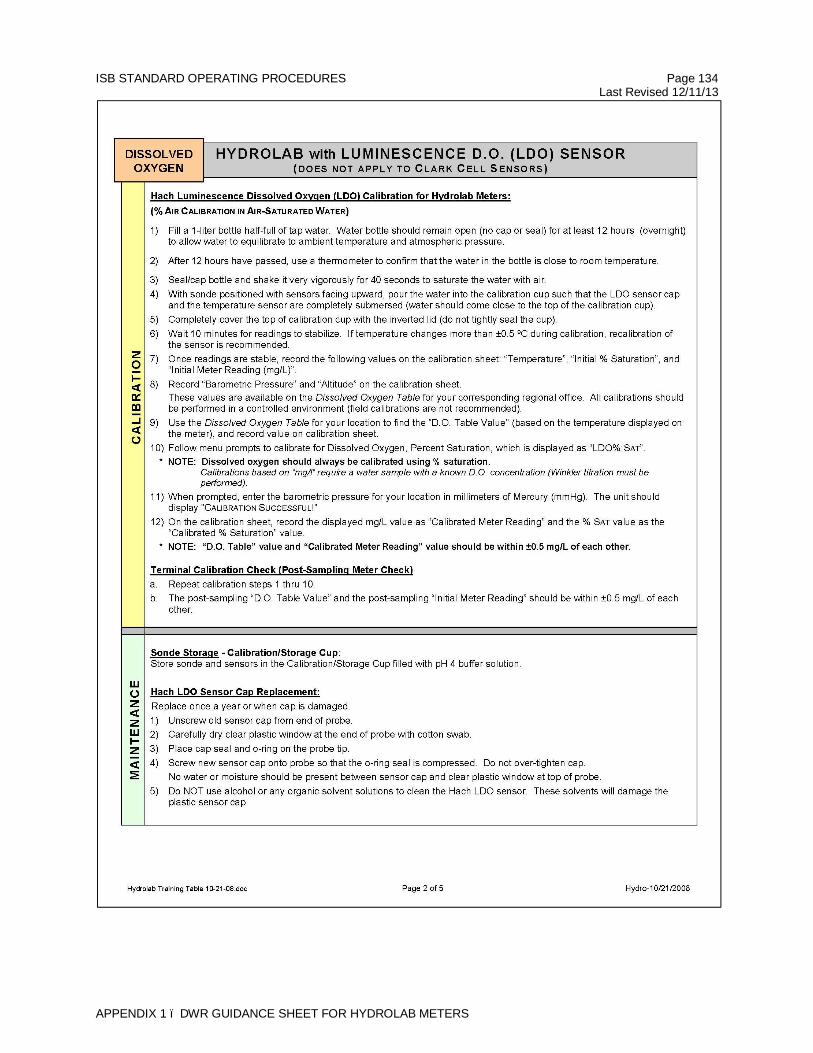
ISB STANDARD OPERATING PROCEDURES Page 134 Last Revised 12/11/13
APPENDIX 1 – DWR GUIDANCE SHEET FOR HYDROLAB METERS
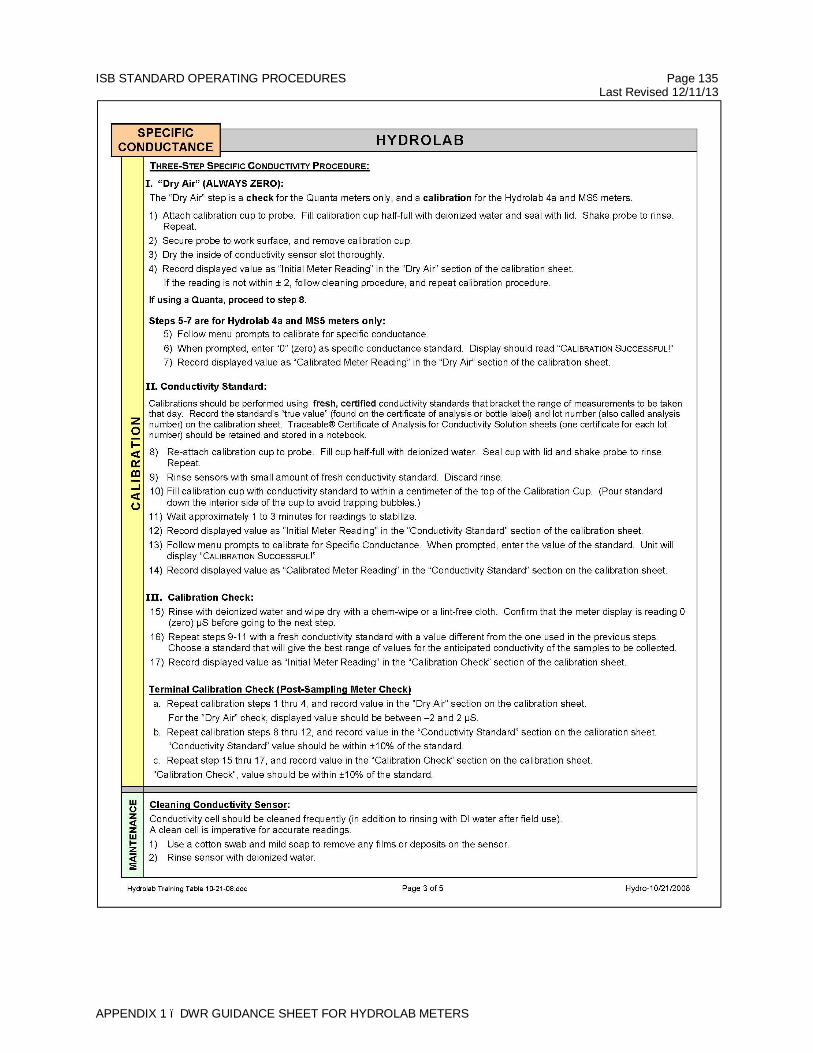
ISB STANDARD OPERATING PROCEDURES Page 135 Last Revised 12/11/13
APPENDIX 1 – DWR GUIDANCE SHEET FOR HYDROLAB METERS
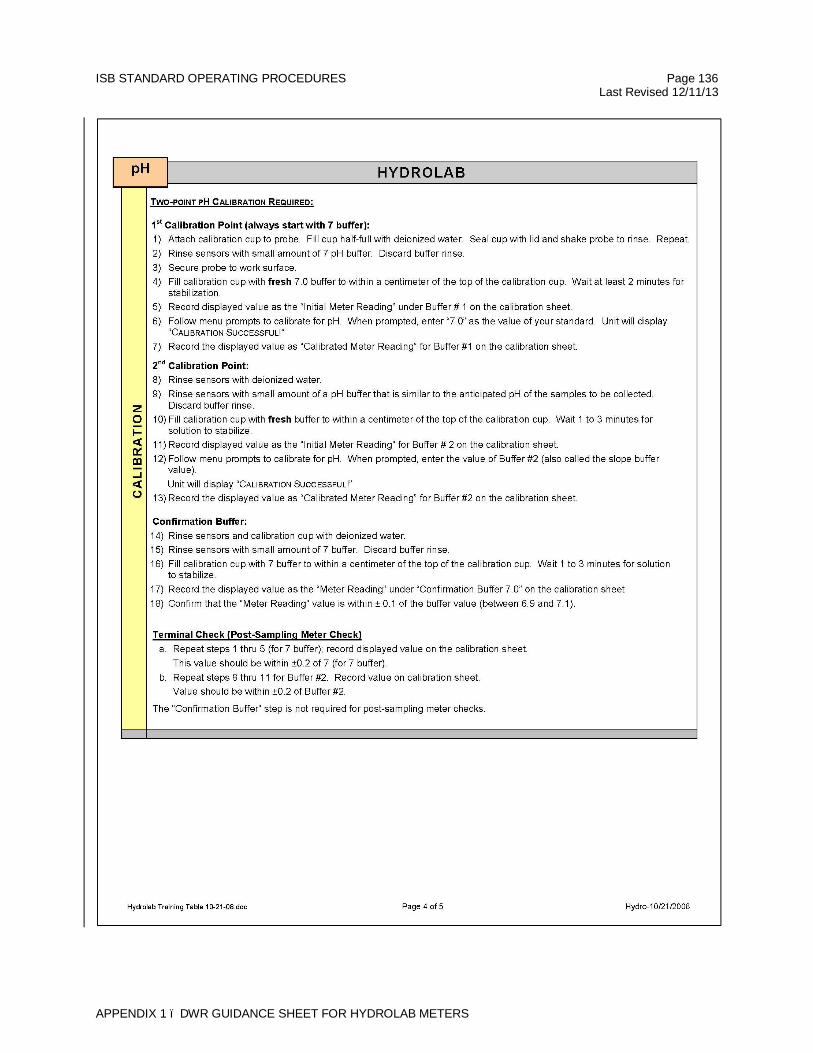
ISB STANDARD OPERATING PROCEDURES Page 136 Last Revised 12/11/13
APPENDIX 1 – DWR GUIDANCE SHEET FOR HYDROLAB METERS
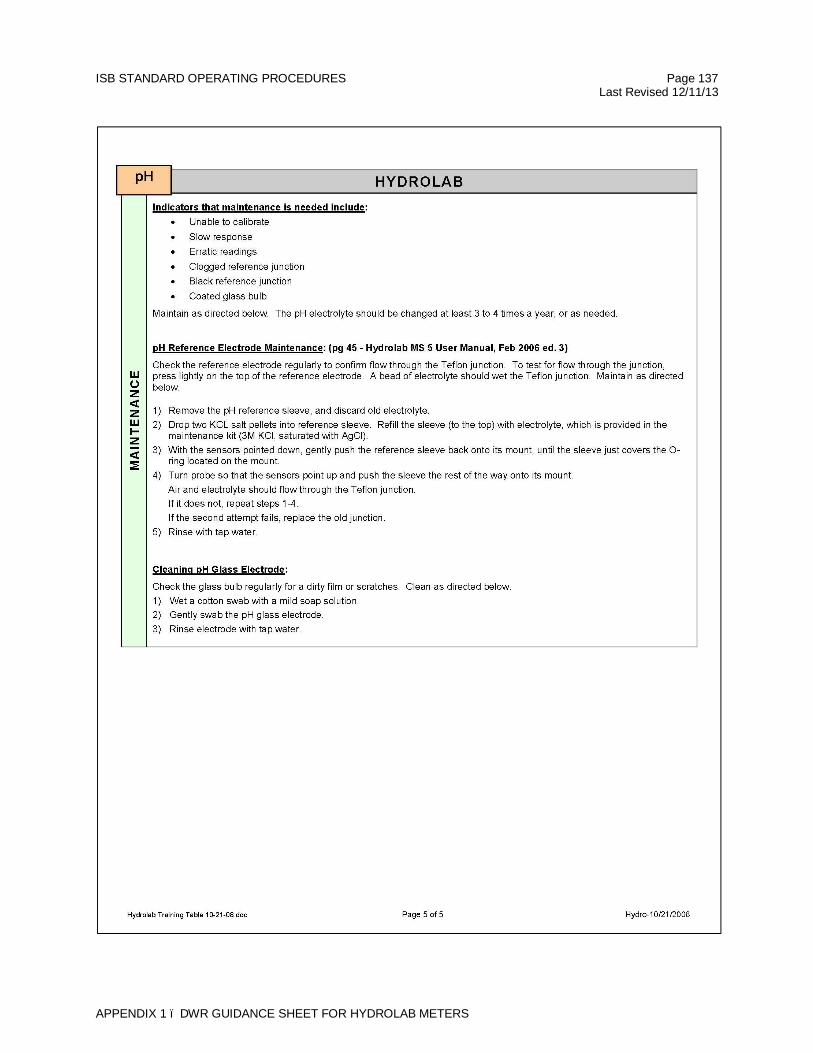
ISB STANDARD OPERATING PROCEDURES Page 137 Last Revised 12/11/13
APPENDIX 1 – DWR GUIDANCE SHEET FOR HYDROLAB METERS
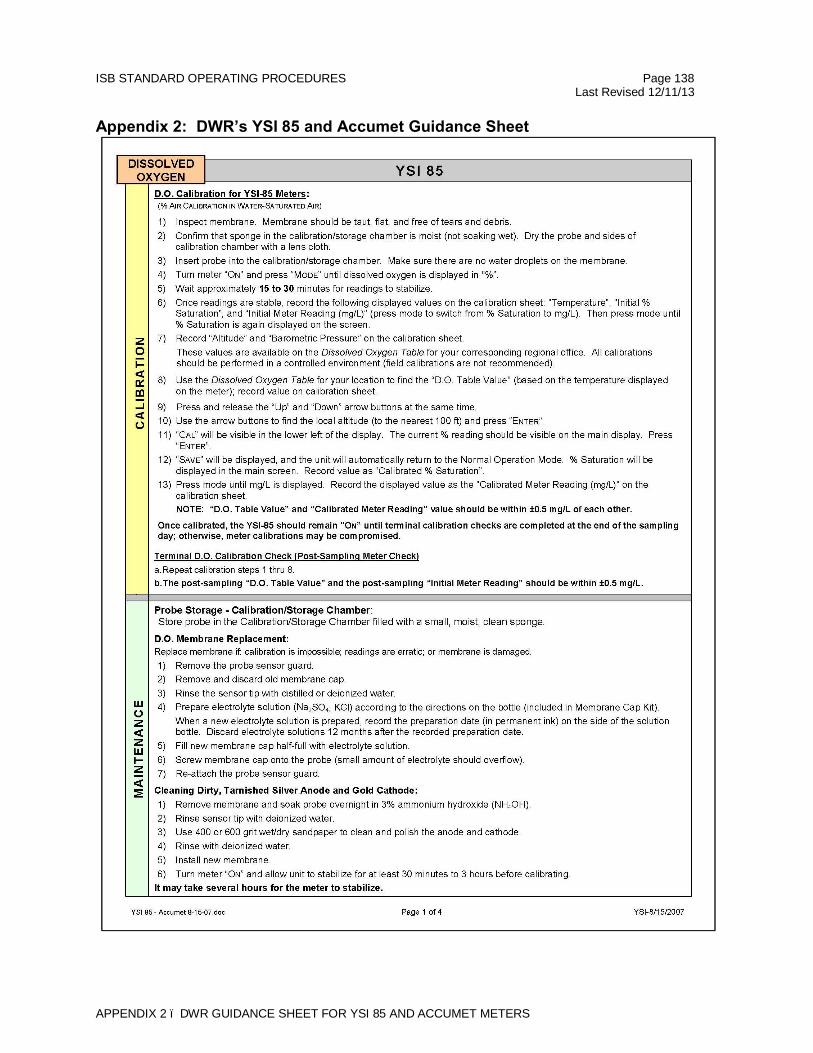
ISB STANDARD OPERATING PROCEDURES Page 138 Last Revised 12/11/13
APPENDIX 2 – DWR GUIDANCE SHEET FOR YSI 85 AND ACCUMET METERS
Appendix 2: DWR’s YSI 85 and Accumet Guidance Sheet
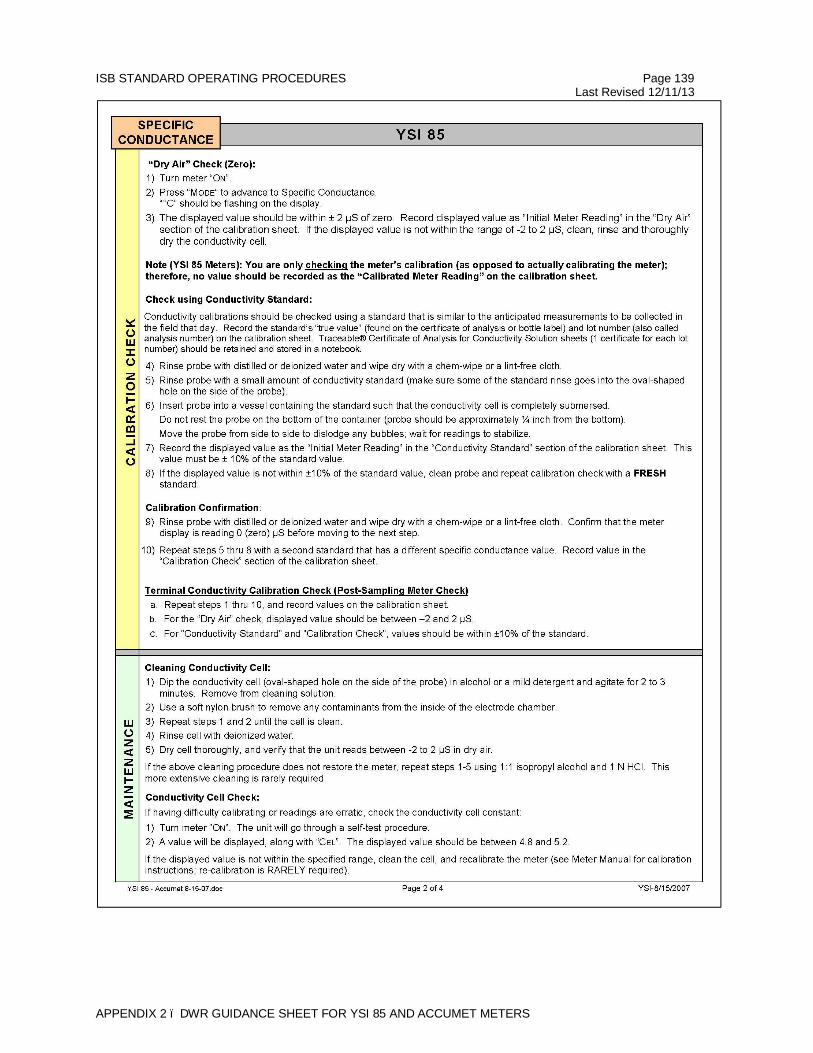
ISB STANDARD OPERATING PROCEDURES Page 139 Last Revised 12/11/13
APPENDIX 2 – DWR GUIDANCE SHEET FOR YSI 85 AND ACCUMET METERS
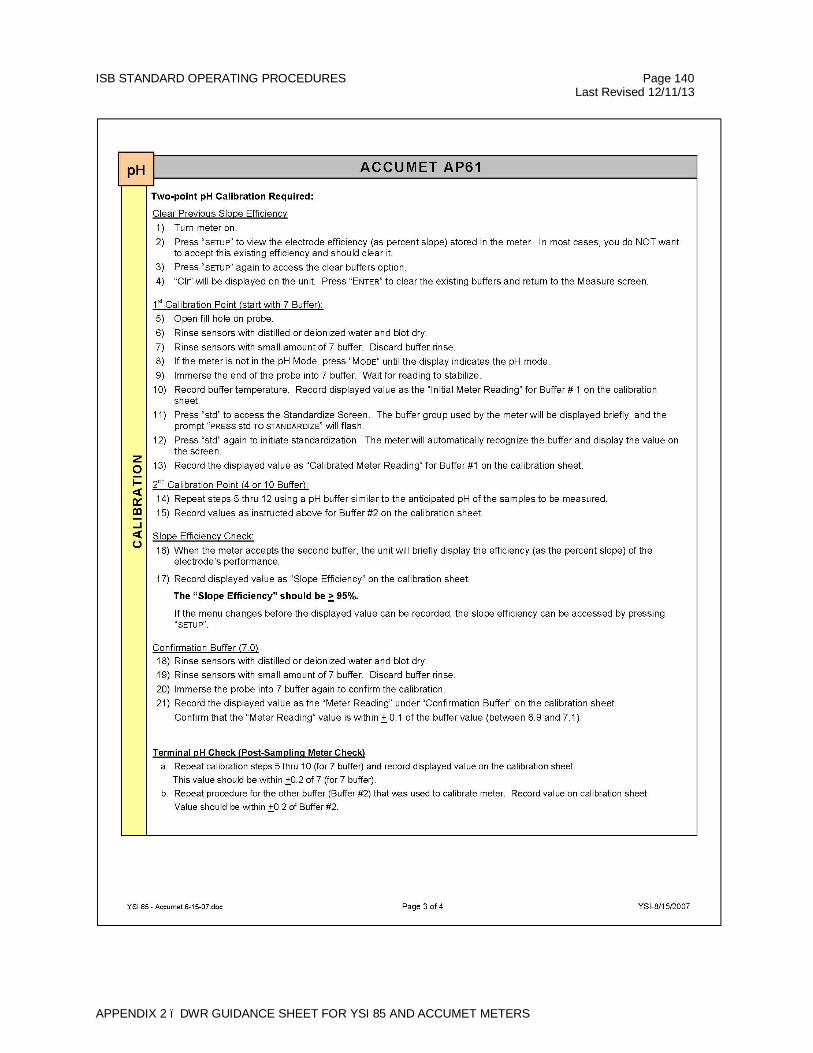
ISB STANDARD OPERATING PROCEDURES Page 140 Last Revised 12/11/13
APPENDIX 2 – DWR GUIDANCE SHEET FOR YSI 85 AND ACCUMET METERS
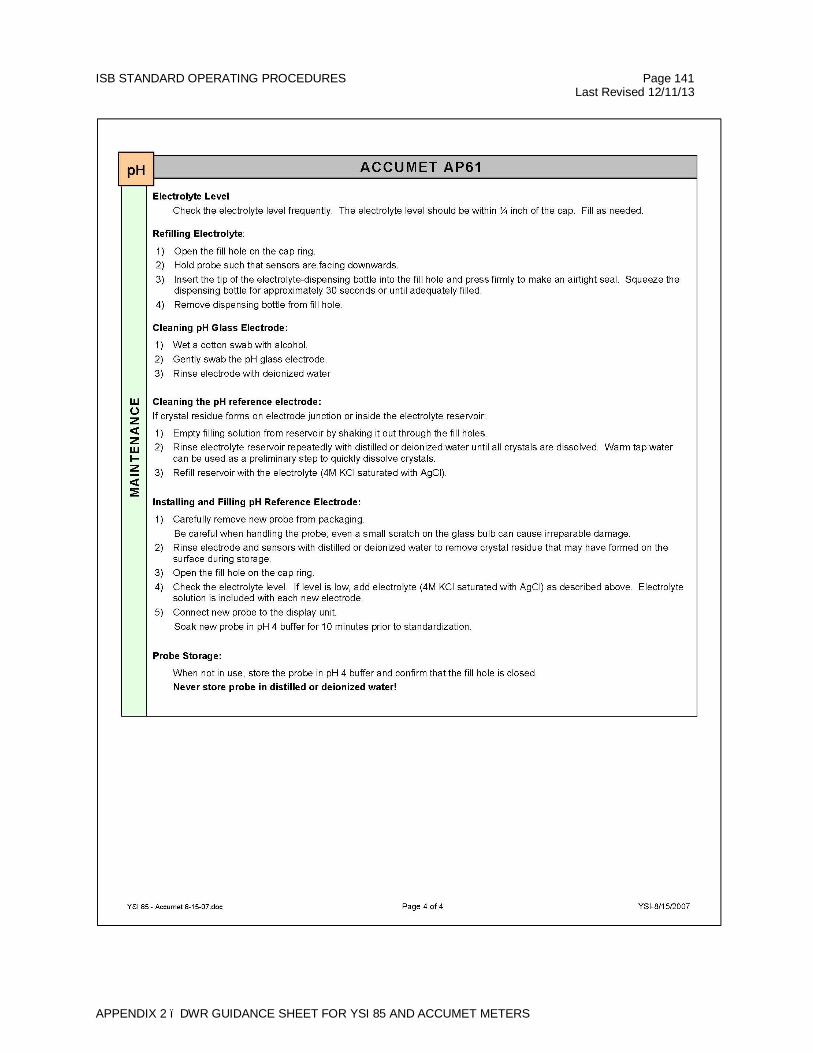
ISB STANDARD OPERATING PROCEDURES Page 141 Last Revised 12/11/13
APPENDIX 2 – DWR GUIDANCE SHEET FOR YSI 85 AND ACCUMET METERS
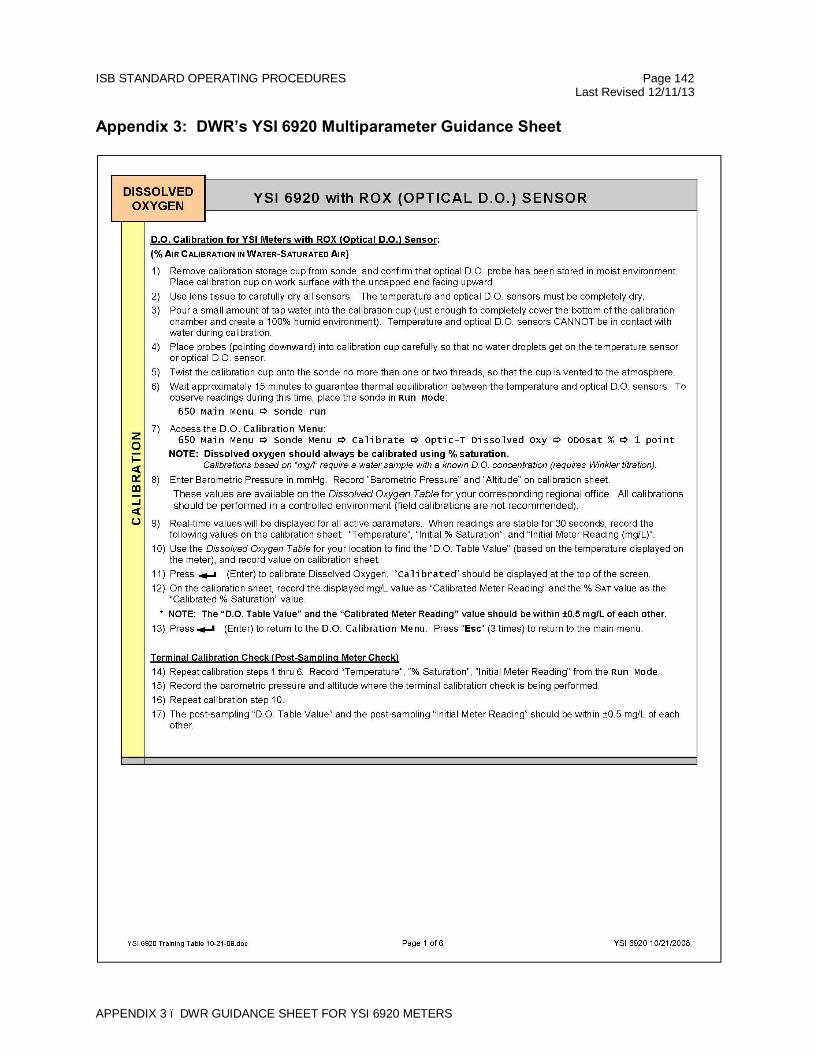
ISB STANDARD OPERATING PROCEDURES Page 142 Last Revised 12/11/13
APPENDIX 3 – DWR GUIDANCE SHEET FOR YSI 6920 METERS
Appendix 3: DWR’s YSI 6920 Multiparameter Guidance Sheet
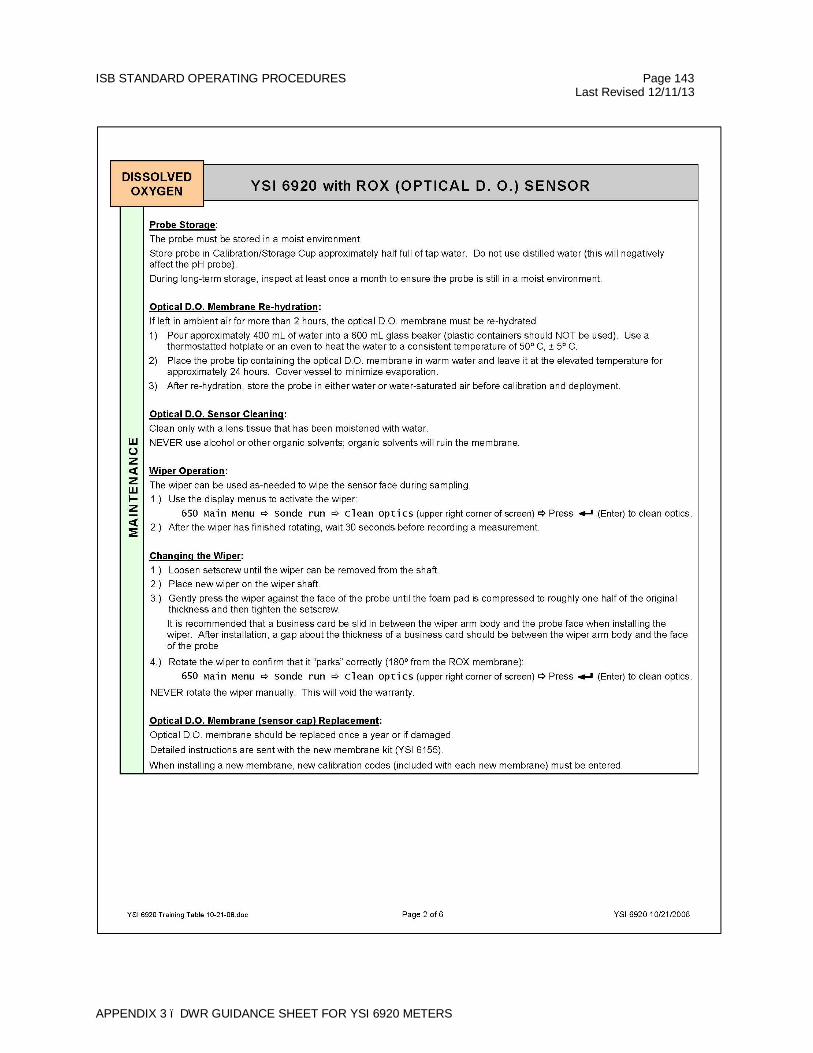
ISB STANDARD OPERATING PROCEDURES Page 143 Last Revised 12/11/13
APPENDIX 3 – DWR GUIDANCE SHEET FOR YSI 6920 METERS
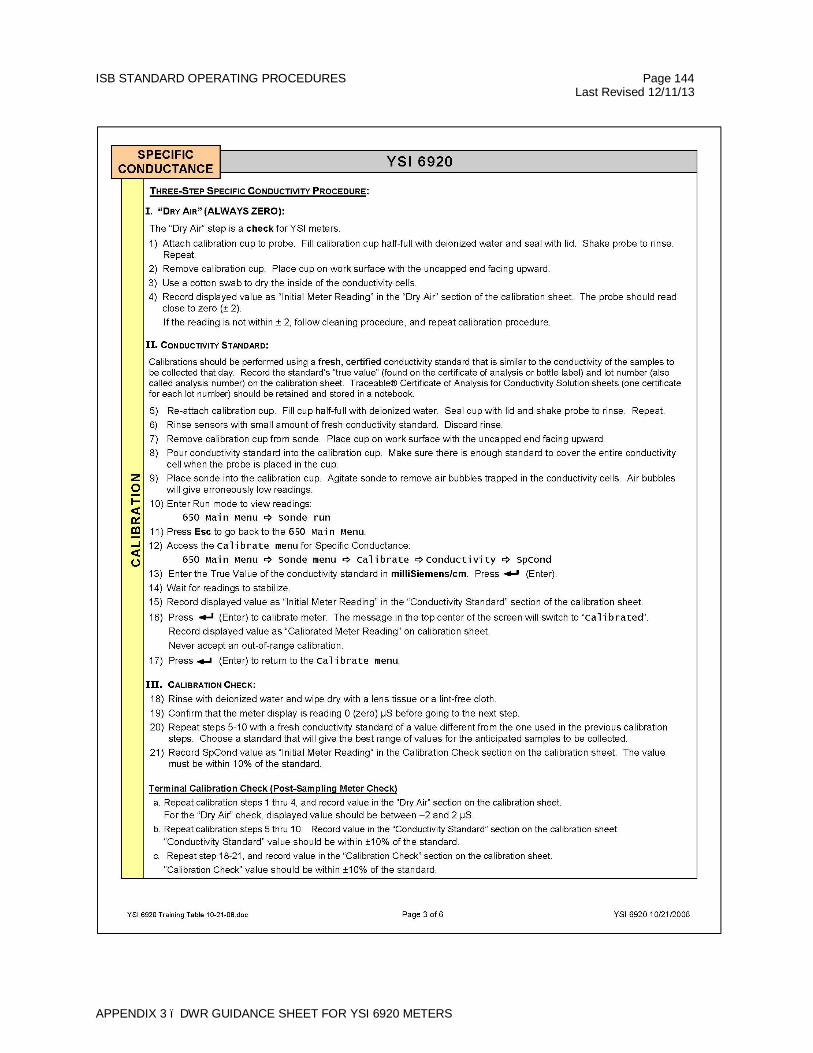
ISB STANDARD OPERATING PROCEDURES Page 144 Last Revised 12/11/13
APPENDIX 3 – DWR GUIDANCE SHEET FOR YSI 6920 METERS
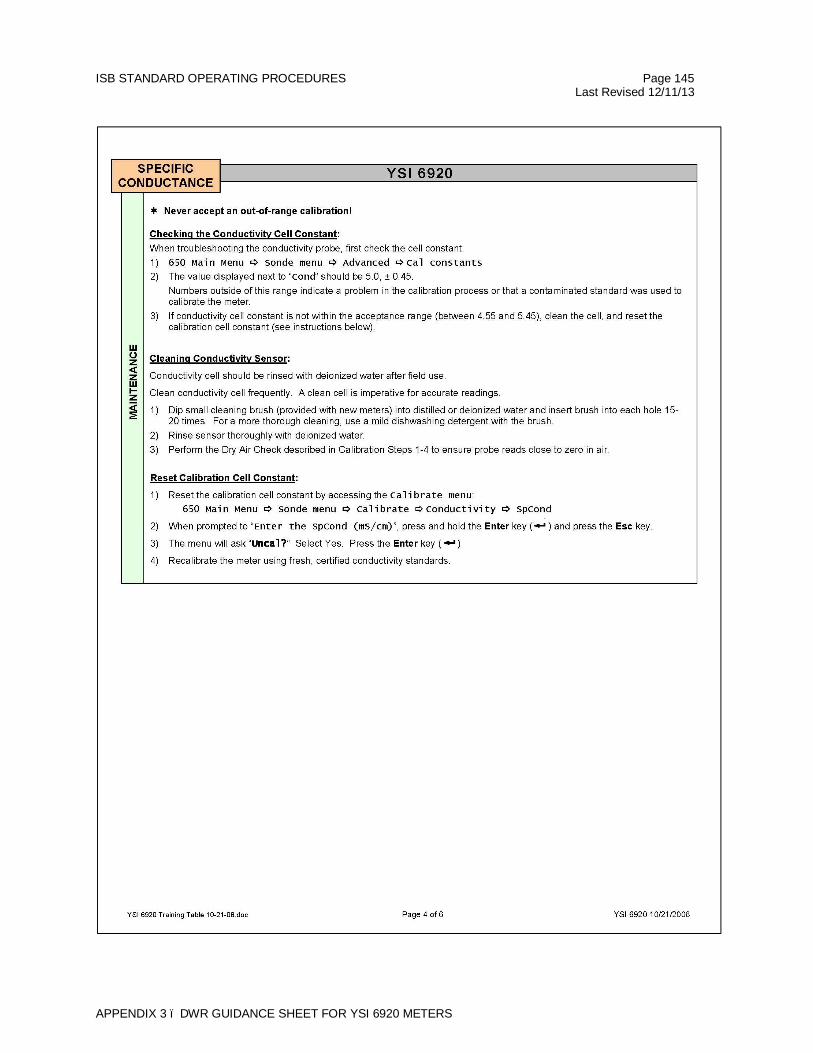
ISB STANDARD OPERATING PROCEDURES Page 145 Last Revised 12/11/13
APPENDIX 3 – DWR GUIDANCE SHEET FOR YSI 6920 METERS
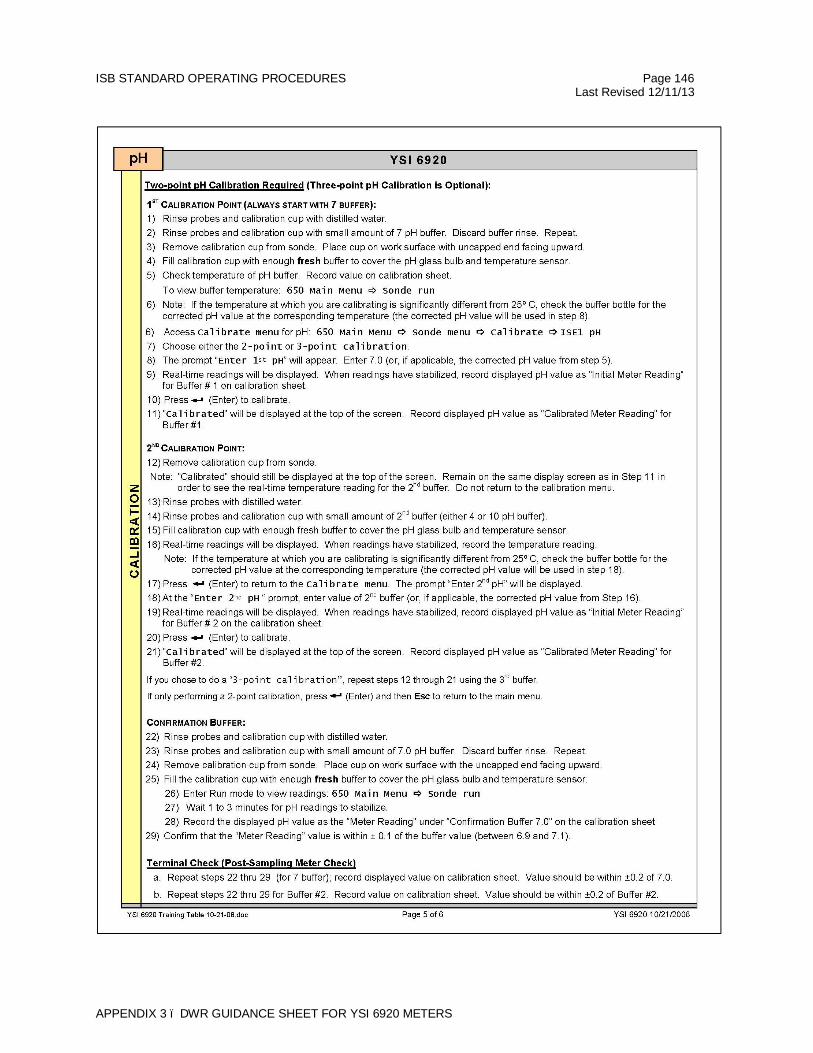
ISB STANDARD OPERATING PROCEDURES Page 146 Last Revised 12/11/13
APPENDIX 3 – DWR GUIDANCE SHEET FOR YSI 6920 METERS
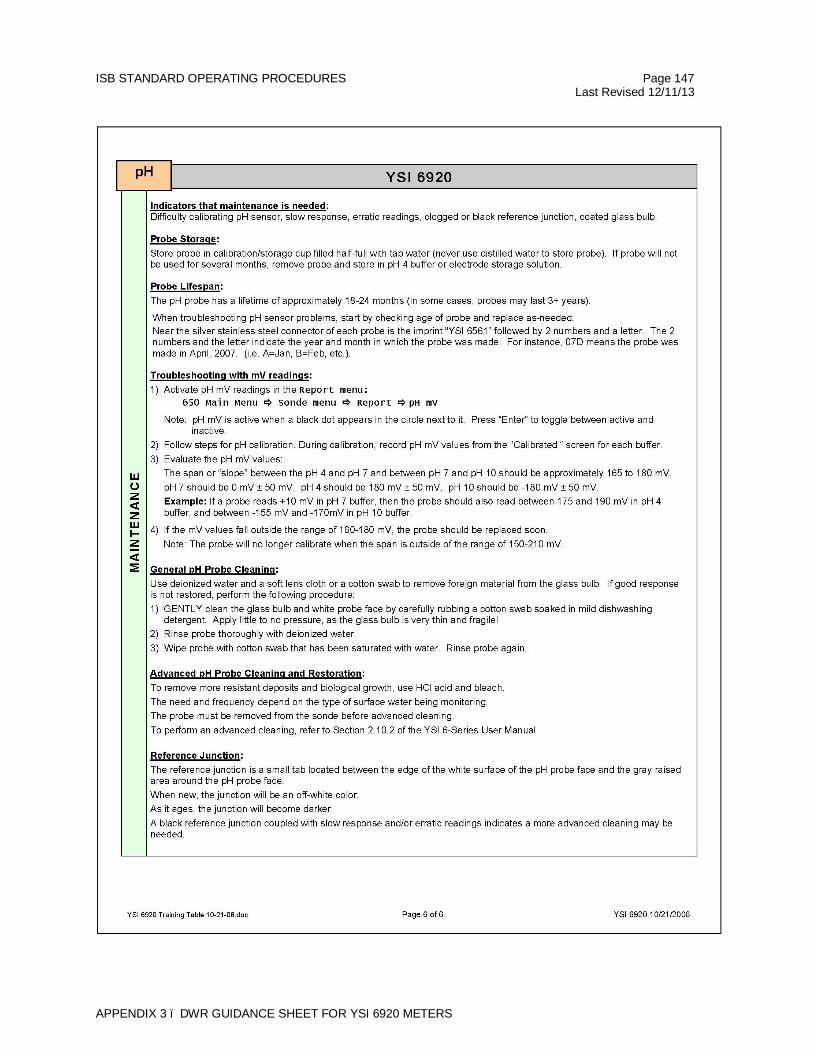
ISB STANDARD OPERATING PROCEDURES Page 147 Last Revised 12/11/13
APPENDIX 3 – DWR GUIDANCE SHEET FOR YSI 6920 METERS
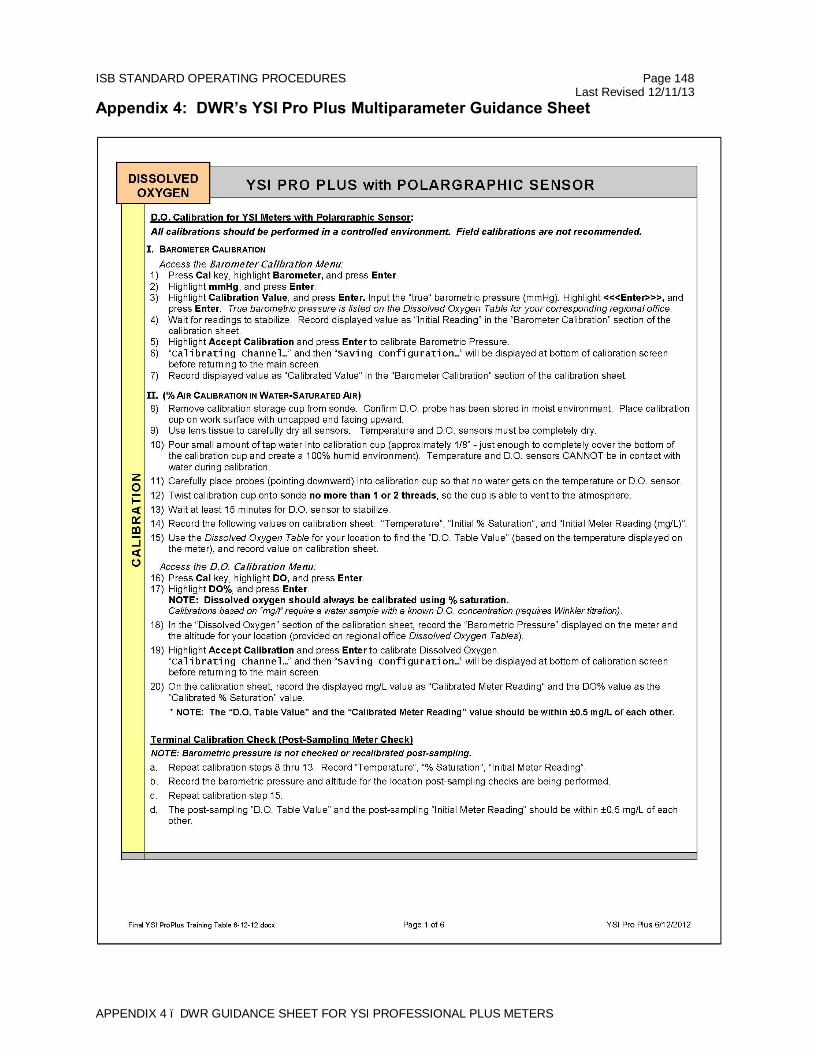
ISB STANDARD OPERATING PROCEDURES Page 148 Last Revised 12/11/13
APPENDIX 4 – DWR GUIDANCE SHEET FOR YSI PROFESSIONAL PLUS METERS
Appendix 4: DWR’s YSI Pro Plus Multiparameter Guidance Sheet
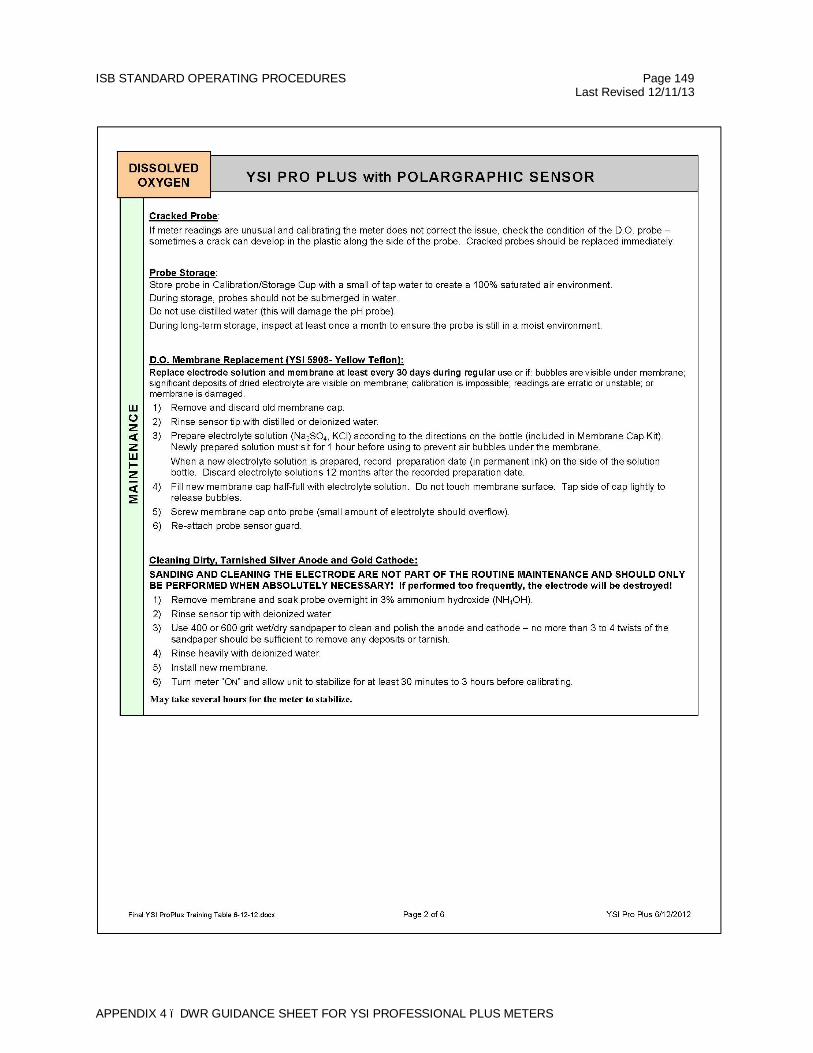
ISB STANDARD OPERATING PROCEDURES Page 149 Last Revised 12/11/13
APPENDIX 4 – DWR GUIDANCE SHEET FOR YSI PROFESSIONAL PLUS METERS
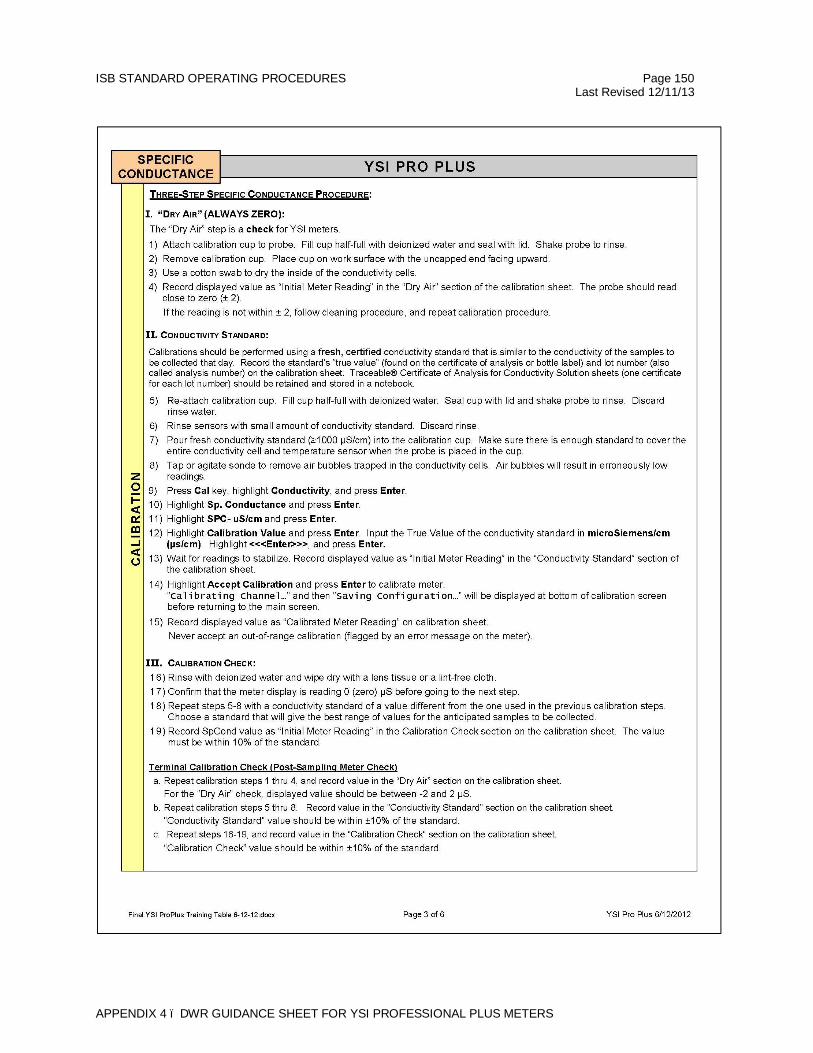
ISB STANDARD OPERATING PROCEDURES Page 150 Last Revised 12/11/13
APPENDIX 4 – DWR GUIDANCE SHEET FOR YSI PROFESSIONAL PLUS METERS
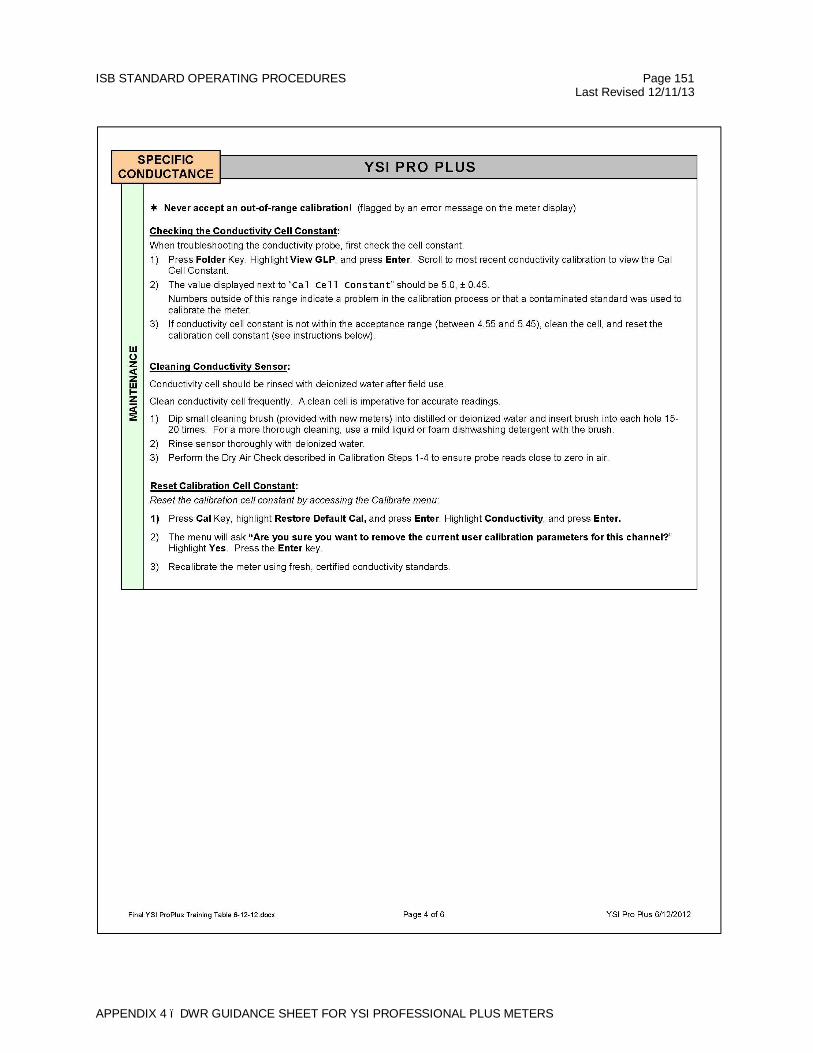
ISB STANDARD OPERATING PROCEDURES Page 151 Last Revised 12/11/13
APPENDIX 4 – DWR GUIDANCE SHEET FOR YSI PROFESSIONAL PLUS METERS
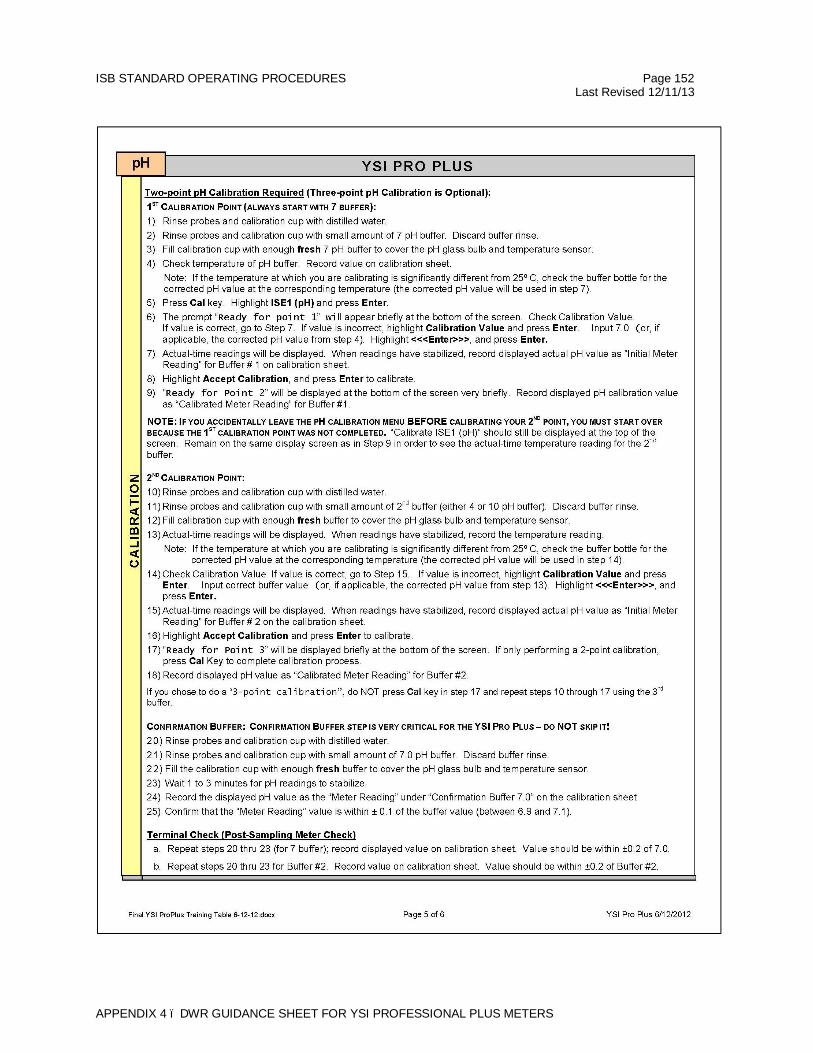
ISB STANDARD OPERATING PROCEDURES Page 152 Last Revised 12/11/13
APPENDIX 4 – DWR GUIDANCE SHEET FOR YSI PROFESSIONAL PLUS METERS
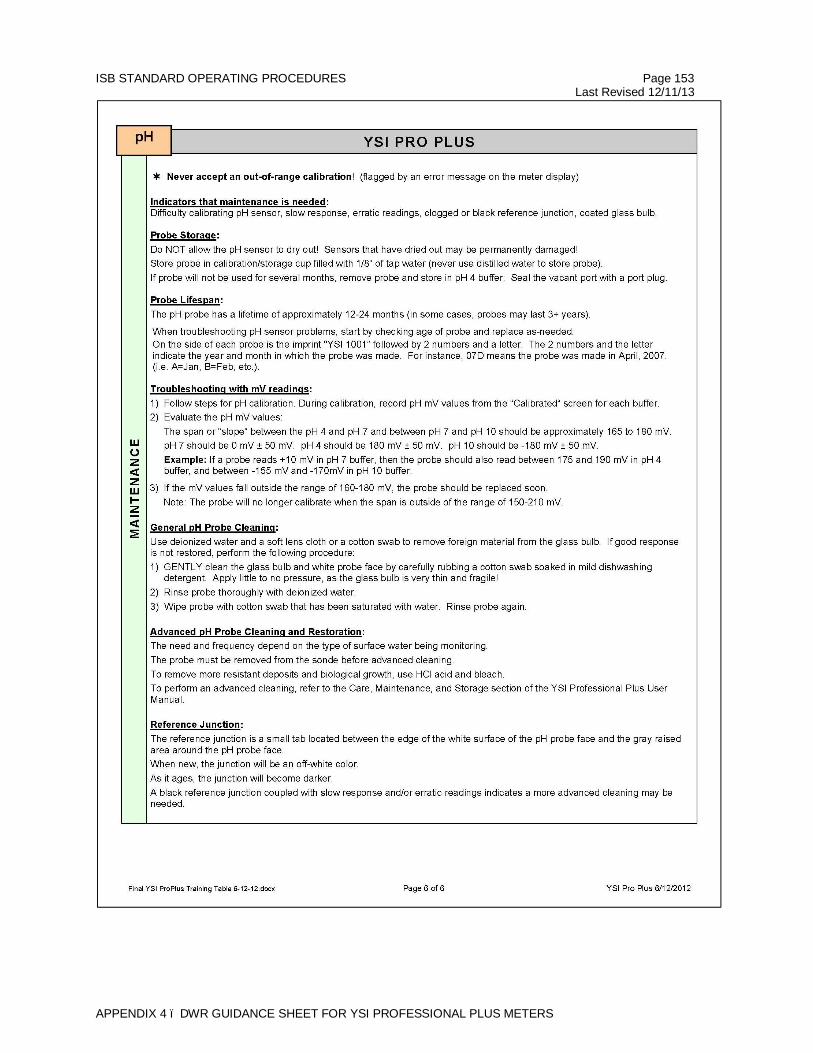
ISB STANDARD OPERATING PROCEDURES Page 153 Last Revised 12/11/13
APPENDIX 4 – DWR GUIDANCE SHEET FOR YSI PROFESSIONAL PLUS METERS
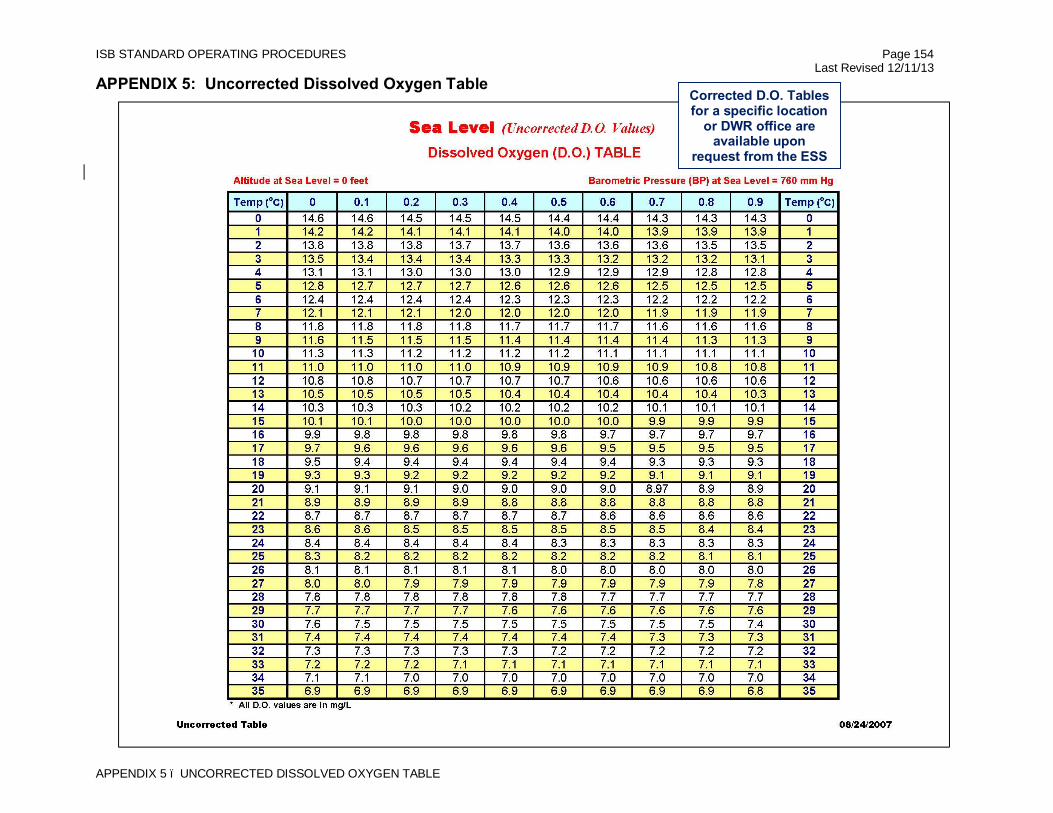
ISB STANDARD OPERATING PROCEDURES Page 154 Last Revised 12/11/13
APPENDIX 5 – UNCORRECTED DISSOLVED OXYGEN TABLE
APPENDIX 5: Uncorrected Dissolved Oxygen Table
Corrected D.O. Tables for a specific location
or DWR office are available upon
request from the ESS
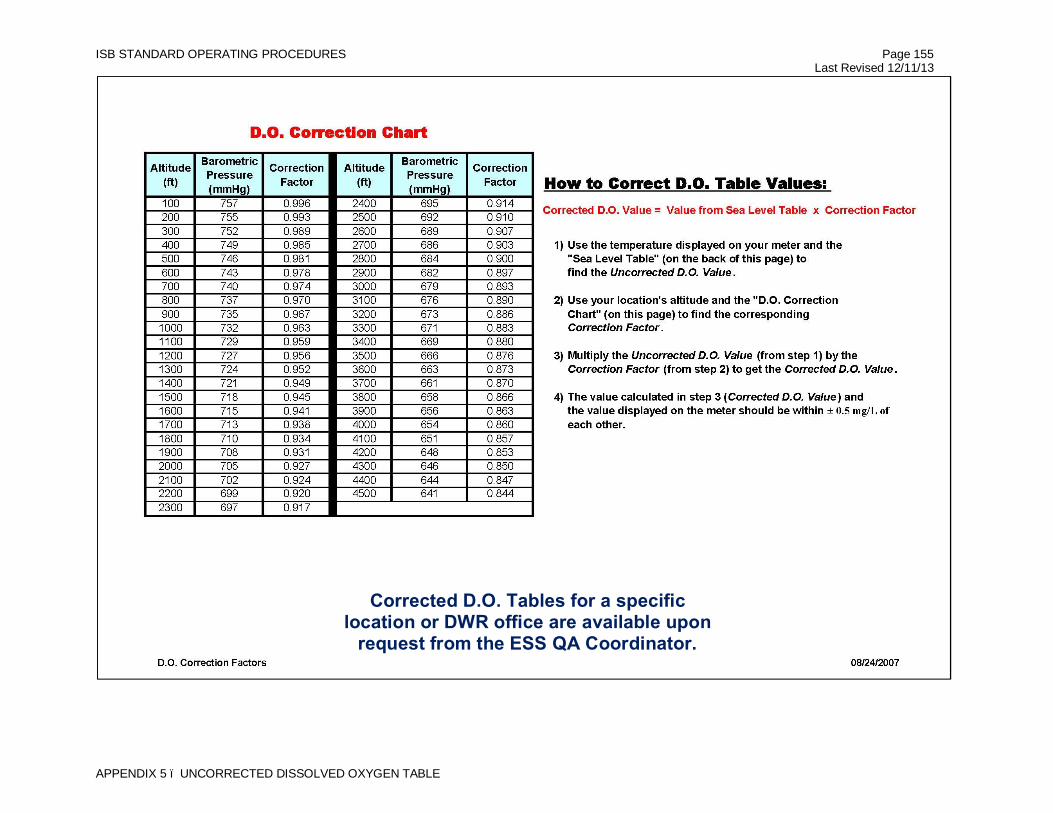
ISB STANDARD OPERATING PROCEDURES Page 155 Last Revised 12/11/13
APPENDIX 5 – UNCORRECTED DISSOLVED OXYGEN TABLE
Corrected D.O. Tables for a specific location or DWR office are available upon
request from the ESS QA Coordinator.
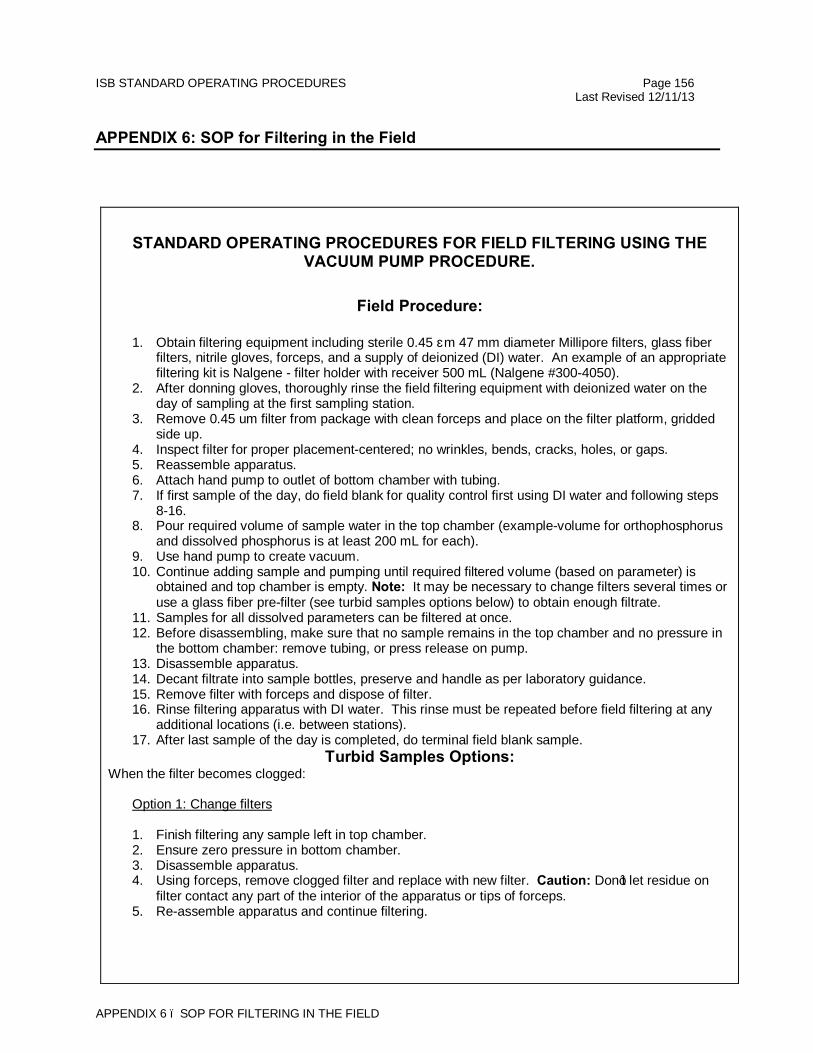
ISB STANDARD OPERATING PROCEDURES Page 156 Last Revised 12/11/13
APPENDIX 6 – SOP FOR FILTERING IN THE FIELD
APPENDIX 6: SOP for Filtering in the Field
STANDARD OPERATING PROCEDURES FOR FIELD FILTERING USING THE
VACUUM PUMP PROCEDURE.
Field Procedure:
1. Obtain filtering equipment including sterile 0.45 μm 47 mm diameter Millipore filters, glass fiber filters, nitrile gloves, forceps, and a supply of deionized (DI) water. An example of an appropriate filtering kit is Nalgene - filter holder with receiver 500 mL (Nalgene #300-4050).
2. After donning gloves, thoroughly rinse the field filtering equipment with deionized water on the day of sampling at the first sampling station.
3. Remove 0.45 um filter from package with clean forceps and place on the filter platform, gridded side up.
4. Inspect filter for proper placement-centered; no wrinkles, bends, cracks, holes, or gaps. 5. Reassemble apparatus. 6. Attach hand pump to outlet of bottom chamber with tubing. 7. If first sample of the day, do field blank for quality control first using DI water and following steps
8-16. 8. Pour required volume of sample water in the top chamber (example-volume for orthophosphorus
and dissolved phosphorus is at least 200 mL for each). 9. Use hand pump to create vacuum. 10. Continue adding sample and pumping until required filtered volume (based on parameter) is
obtained and top chamber is empty. Note: It may be necessary to change filters several times or use a glass fiber pre-filter (see turbid samples options below) to obtain enough filtrate.
11. Samples for all dissolved parameters can be filtered at once. 12. Before disassembling, make sure that no sample remains in the top chamber and no pressure in
the bottom chamber: remove tubing, or press release on pump. 13. Disassemble apparatus. 14. Decant filtrate into sample bottles, preserve and handle as per laboratory guidance. 15. Remove filter with forceps and dispose of filter. 16. Rinse filtering apparatus with DI water. This rinse must be repeated before field filtering at any
additional locations (i.e. between stations). 17. After last sample of the day is completed, do terminal field blank sample.
Turbid Samples Options: When the filter becomes clogged:
Option 1: Change filters
1. Finish filtering any sample left in top chamber. 2. Ensure zero pressure in bottom chamber. 3. Disassemble apparatus. 4. Using forceps, remove clogged filter and replace with new filter. Caution: Don’t let residue on
filter contact any part of the interior of the apparatus or tips of forceps. 5. Re-assemble apparatus and continue filtering.
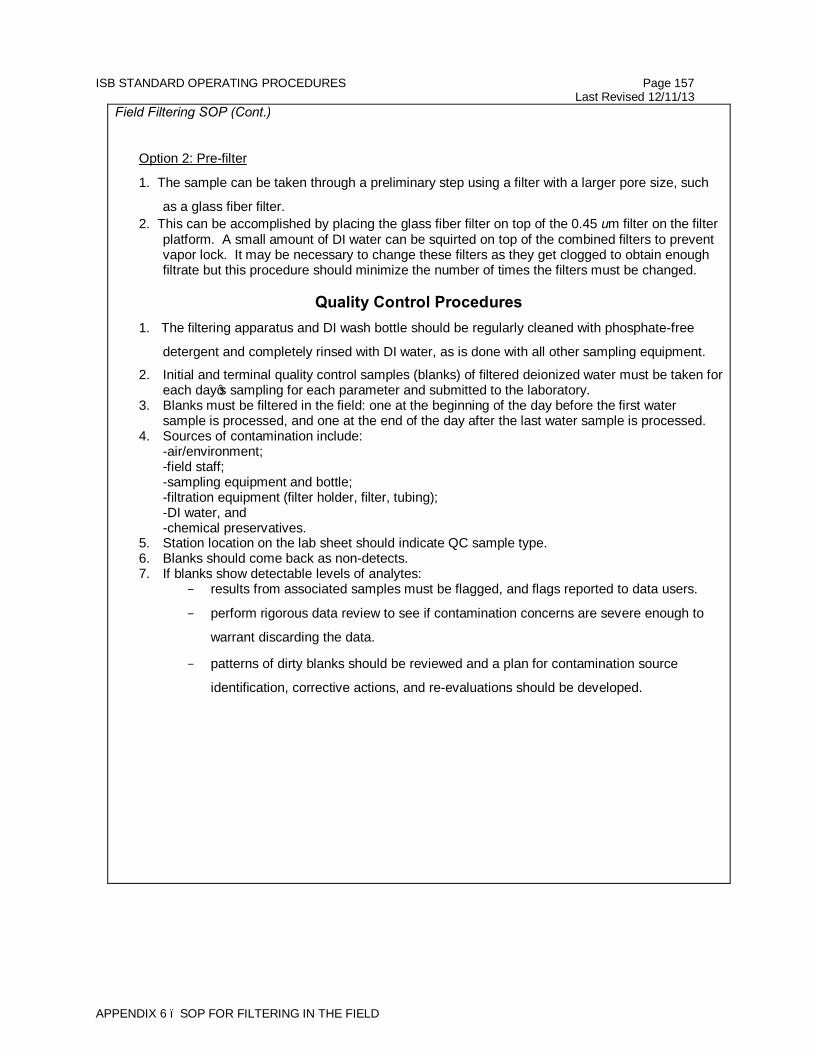
ISB STANDARD OPERATING PROCEDURES Page 157 Last Revised 12/11/13
APPENDIX 6 – SOP FOR FILTERING IN THE FIELD
Field Filtering SOP (Cont.)
Option 2: Pre-filter
1. The sample can be taken through a preliminary step using a filter with a larger pore size, such
as a glass fiber filter. 2. This can be accomplished by placing the glass fiber filter on top of the 0.45 um filter on the filter
platform. A small amount of DI water can be squirted on top of the combined filters to prevent vapor lock. It may be necessary to change these filters as they get clogged to obtain enough filtrate but this procedure should minimize the number of times the filters must be changed.
Quality Control Procedures
1. The filtering apparatus and DI wash bottle should be regularly cleaned with phosphate-free
detergent and completely rinsed with DI water, as is done with all other sampling equipment.
2. Initial and terminal quality control samples (blanks) of filtered deionized water must be taken for each day’s sampling for each parameter and submitted to the laboratory.
3. Blanks must be filtered in the field: one at the beginning of the day before the first water sample is processed, and one at the end of the day after the last water sample is processed.
4. Sources of contamination include: -air/environment; -field staff; -sampling equipment and bottle; -filtration equipment (filter holder, filter, tubing); -DI water, and -chemical preservatives. 5. Station location on the lab sheet should indicate QC sample type. 6. Blanks should come back as non-detects. 7. If blanks show detectable levels of analytes:
- results from associated samples must be flagged, and flags reported to data users.
- perform rigorous data review to see if contamination concerns are severe enough to
warrant discarding the data.
- patterns of dirty blanks should be reviewed and a plan for contamination source
identification, corrective actions, and re-evaluations should be developed.
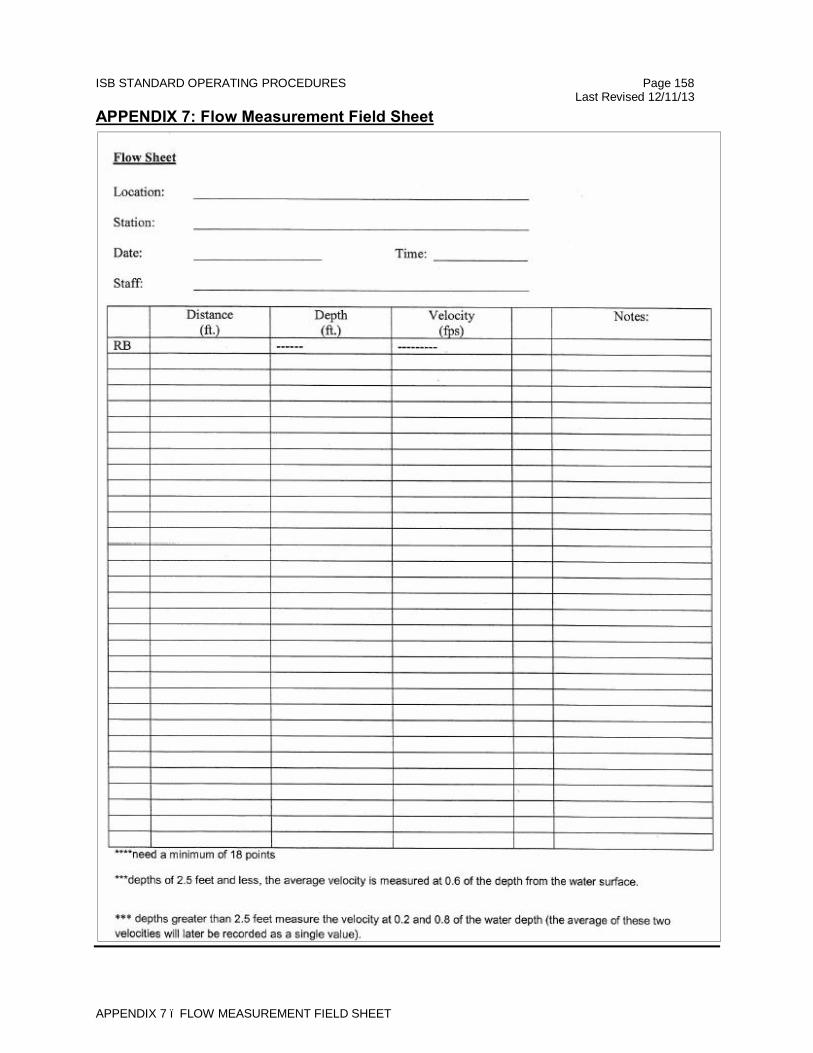
ISB STANDARD OPERATING PROCEDURES Page 158 Last Revised 12/11/13
APPENDIX 7 – FLOW MEASUREMENT FIELD SHEET
APPENDIX 7: Flow Measurement Field Sheet
NC AMS QAPP Appendix 6 EPA Approved: July 2017 Version 2.0
Appendix 6: Laboratory Section QA Information
Quality Assurance Manual for the North Carolina Division of Water Quality Laboratory Section, June 2015
Date: June 30, 2015 Revision No:
Author: D. Satterwhite Revision Author: N. Good
Page 1 of 221
Quality Assurance Manual for the
North Carolina Division of Water Resources
Water Sciences Section Chemistry Laboratories
Original Adopted November 2004
Revision 1 June 30, 2015
Date: June 30, 2015 Revision No:
Author: D. Satterwhite Revision Author: N. Good
Page 2 of 221
Quality Assurance Manual
for the
North Carolina Division of Water Resources
Water Sciences Section Chemistry Laboratories Central Laboratory 4405 Reedy Creek Road Raleigh, NC 27607 (919) 733-3908 Asheville Region Laboratory 2090 US Highway 70 Swannanoa, NC 28778 (828) 296-4500 ____________________________________________________________ _____________________ Cyndi Karoly, Section Chief (Date) ____________________________________________________________ _____________________ Dana Satterwhite, Certification Environmental Program Supervisor (Date) ____________________________________________________________ _____________________ Chris Johnson, Organics Environmental Program Supervisor (Date) ____________________________________________________________ _____________________ Roy Byrd, Microbiology and Inorganic Environmental Program Supervisor (Date) ____________________________________________________________ _____________________ Norma T. Good, Quality Assurance Officer (Date)
Date: June 30, 2015 Revision No:
Author: D. Satterwhite Revision Author: N. Good
Page 3 of 221
1.0 Review-Tracking Form
Revision Revision Revision Summary Number Date
1 06/30/15 Revised division and section names
1 06/30/15 Updated laboratory program names and unit names
1 06/30/15 References to Washington Regional Office Laboratory were removed.
1 06/30/15 Star LIMs was replaced with Labworks™ throughout document. Update of Login process with Labworks™ was added. Section 7.0
1 04/01/5 References to Laserfiche® were added throughout document.
1 06/30/15 Revised Table of Contents Section 2.0
1 06/30/15 Added review tracking form
1 06/30/15 Central Laboratory Major Equipment List was removed from the QAM.
1 06/30/15 Updated NC DENR mission statement. Section 1.0
1 06/30/15 Updated DWR WSS Laboratory positions, responsibilities and organizational chart. Section 4.0
1 06/30/15 Updated Safety Orientation and Training documents. Section 4.0
1 06/30/15 Added Certification Modular Building Schematic. Section 4.0
1 06/30/15 Updated Table 5.1 - 5.10 EXAMPLES of QA Targets for Accuracy, Precision and MDLs/PQLs. Section 5.0
1 06/30/15 Bottle testing procedure was added to Section 6.0
1 06/30/15 Updated Lab Reagent Water .Section 8.6, QC protocol and Table 9.1 Calibration Frequency, Procedures, Standards, and Acceptance Criteria for Support Equipment. Section 9.0
1 06/30/15 Update Table 10.1 Laboratory Equipment Preventive Maintenance Schedule. Section 10
1 06/30/15 Updated preservation tables (Tables 6.1 and 6.2) documents content to reflect 40 CFR 136 2012 Method Rule Update. Section 6.0
1 06/30/15 Added memo dated 10/13/2013 from S. Jay Zimmerman, P.G. to Aquifer Protection Section Supervisors. Subject: Aquifer Protection Section Policy for Metals Determination Required by Title 15A, NC Administrative Code, Subchapter 21. Section 8.0
1 06/30/15 Removed memo dated 05/25/2001 to Steve Tedder Lab Section Chief in 2001 from Arthur Mouberry Ground Water Section Chief in 2001 Subject: Request to change Ground water Section’s Metal Policy.
1 06/30/15 Updated Lab Report document. Section 12.0 1 06/30/15 Updated Sample Condition Upon Receipt (SCUR) and Sample Anomaly (SAR) forms. Section 13.0 1 06/30/15 Added QA Semi-annual Report to Management format. Section15.0
1 06/30/15 Added Access Record File to section 3.3 and revised Confidentiality of section 3.1
1 06/30/15 Updated DWR WSS and Asheville Regional Office ,Added Underground Storage Tank WQ Sediment,Soil and Tissue Field sheets Section 7.0
1 06/30/15 Added U.S. EPA Memorandum Recommended Approved Modification to EPA 625. Section 8.0
1 06/30/15 Added Corrective Action Report (CAR) Form as Appendix I
1 06/30/15 Revised Qualifier codes A & V.,PQL definition and added Minimum Level and Method Detection Limit definitions Section 12.3.1
1 06/30/15 Added Qualifier Codes as Appendix II 1 06/30/15 Old Safety Orientation and Training documents as Appendix III 1 06/30/15 Added DWR WSS Laboratory Data Retention Policy as Appendix IV 1 06/30/15 Updated QC protocol in section 9.0 1 06/30/15 Added Nexion-350 and calibration information to Section 9. 1 06/30/15 Added Section 17 to indicate where Appendices begin 1 06/30/15 Editorial Revisions 2
Disclaimer The mention of trade names or commercial products in this manual is for illustration purposes only and does not constitute endorsement or recommendation for use by the DWR.
Date: June 30, 2015 Revision No: 2
Author: D. Satterwhite Revision Author: N. Good
Page 4 of 221
2.0 Table of Contents
34T1.034T 34TReview-Tracking Form34T .............................................................................................................................................. 3 34T2.034T 34TTable of Contents34T ....................................................................................................................................................... 4 34T3.034T 34TStatement of Policy34T .................................................................................................................................................... 8
34T3.134T 34TAnalytical Laboratory Services34T.............................................................................................................................. 9 34T3.234T 34TEthics34T ..................................................................................................................................................................... 9 34T3.334T 34TConfidentiality34T ..................................................................................................................................................... 10
34TFigure 3.1. Code of Ethics Statement Form34T ................................................................................................................. 11 34TFigure 3.2. File Access Record Form34T ........................................................................................................................... 12
34T4.034T 34TOrganization, Facilities and Equipment34T ................................................................................................................... 13 34T4.134T 34TResponsibilities of Key Positions Pertinent to this QAM34T .................................................................................... 13 34T4.234T 34TPersonnel Training34T ............................................................................................................................................... 16 34T4.334T 34TFacilities34T ............................................................................................................................................................... 19 34T4.434T 34TEquipment34T ............................................................................................................................................................ 20
34TFigure 4.1. North Carolina Division of Water Resources Water Sciences Section Organization Chart34T ....................... 22 34TFigure 4.2. Certification of Unit Training Form34T ............................................................................................................ 23 34TFigure 4.3. New Employee Safety Orientation and Training Form34T ............................................................................... 24 34TFigure 4.4. SOP/Method Training Summary Form34T ....................................................................................................... 25 34TFigure 4.5. IDOC Summary Form34T ................................................................................................................................. 26 34TFigure 4.6. MDL Summary Form34T.................................................................................................................................. 27 34TFigure 4.7. Statement of Capability Form34T ..................................................................................................................... 28 34TFigure 4.8. Central Laboratory Floorplan34T ...................................................................................................................... 29 34TFigure 4.9. Asheville Regional Laboratory Floor Plan34T .................................................................................................. 31 34TFigure 4.10. Lab Certification Modular Building Floorplan34T ......................................................................................... 32
34T5.034T 34TQA Targets for Precision, Accuracy and MDLs/PQLs34T ............................................................................................ 33 34T5.134T 34TQuality Assurance Objectives34T .............................................................................................................................. 33 34T5.234T 34TQA Targets34T........................................................................................................................................................... 34 34T5.334T 34TStatistically Derived Limits34T ................................................................................................................................. 34 34T5.434T 34TMethod Detection Limits34T ..................................................................................................................................... 34 34T5.534T 34TPractical Quantitation Limits34T ............................................................................................................................... 35 34T5.634T 34TQA Target Tables34T ................................................................................................................................................ 35
34TTable 5.1 EXAMPLES of QA Targets for METALS Accuracy, Precision and MDLs/PQLs34T ..................................... 37 34TTable 5.2 EXAMPLES of QA Targets for NUTRIENTS Accuracy, Precision and MDLs/PQLs34T ............................... 43 34TTable 5.3 EXAMPLES of QA Targets for MICROBIOLOGY Accuracy, Precision and MDLs/PQLs34T ....................... 44 34TTable 5.4 EXAMPLES of QA Targets for WET CHEMISTRY Accuracy, Precision and MDLs/PQLs34T .................... 45 34TTable 5.5 EXAMPLES of QA Targets for VOLATILES Accuracy, Precision and MDLs/PQLs34T ................................ 47 34TTable 5.6 EXAMPLES of QA Targets for SEMIVOLATILES Accuracy, Precision and MDLs/PQLs34T ...................... 54 34TTable 5.7 EXAMPLES of QA Targets for CHLORINATED ACID HERBICIDES Accuracy, Precision, and MDLs/PQLs34T ................................................................................................................................................................... 60
Date: June 30, 2015 Revision No: 2
Author: D. Satterwhite Revision Author: N. Good
Page 5 of 221
34TTable 5.8 EXAMPLES of QA targets for ORGANOCHLORINE PESTICIDES Accuracy, Precision, and MDLs/PQLs34T ................................................................................................................................................................... 61 34TTable 5.9 EXAMPLES of QA targets for ORGANONITROGEN PESTICIDES Accuracy, Precision, and MDLs/PQLs34T ................................................................................................................................................................... 65 34TTable 5.10 EXAMPLES of QA targets for ORGANOPHOSPHORUS PESTICIDES Accuracy, Precision, and MDLs/PQLs34T ................................................................................................................................................................... 69
34T6.034T 34TSampling Procedures34T ................................................................................................................................................ 72 34T6.134T 34TSampling Containers34T ............................................................................................................................................ 72 34T6.234T 34TPreservatives34T ........................................................................................................................................................ 73 34T6.334T 34TReuse of Bottles and Bottle Cleaning34T .................................................................................................................. 74 34T6.434T 34TSampling Containers, Preservatives and Holding Times34T ..................................................................................... 74 34T6.534T 34TScheduling Laboratory Capacity34T .......................................................................................................................... 75 34T6.634T 34TProcessing Time-Sensitive Samples34T .................................................................................................................... 75
34TTable 6.1. Required Containers, Preservation Techniques and Holding Times (Surface Water Samples)34T ................... 77 34TTable 6.2. Required Containers, Preservation Techniques and Holding Times (Groundwater & Underground Storage Tank Sampling)34T .............................................................................................................................................................. 86
34T7.034T 34TSample Custody and Handling34T ................................................................................................................................. 94 34T7.134T 34TObjective34T .............................................................................................................................................................. 94 34T7.2.34T 34TSample Custody Procedures34T ................................................................................................................................ 94 34T7.334T 34TSample Receipt Protocol34T ...................................................................................................................................... 96 34T7.434T 34TProcedure to Assess Capability to Meet Workload Requirements34T....................................................................... 99 34T7.534T 34TStorage conditions34T ............................................................................................................................................... 99 34T7.634T 34TSample Disposal34T ................................................................................................................................................ 100 34T7.734T 34TSample Custodians34T ............................................................................................................................................. 100 34T7.834T 34TInter-laboratory Custody34T .................................................................................................................................... 100 34T7.934T 34TDWR LABWORKS™ LIMS34T ............................................................................................................................ 100
34TFigure 7.1. NC DWR Central Laboratory (WSS) Field Sheet.34T .................................................................................... 101 34TFigure 7.2. NC DWR (WSS) Asheville Regional Office Laboratory Field Sheet.34T ...................................................... 102 34TFigure 7.3. Underground Storage Tank Field Sheet34T .................................................................................................... 103 34TFigure 7.4. Water Quality Sediment, Soil and Tissue Field Sheet34T .............................................................................. 104 34TFigure 7.5. Water Quality Section Surface Water Chain of Custody Form34T ................................................................ 105
34TLab Use Only34T ...................................................................................................................................................................... 105 34T8.034T 34TANALYTICAL PROCEDURES34T ........................................................................................................................... 106
34T8.134T 34TReference Methods34T ............................................................................................................................................ 106 34T8.234T 34TMethod Modifications34T........................................................................................................................................ 106 34T8.334T 34TAlternative or New Methods34T .............................................................................................................................. 108 34T8.434T 34TStandard Operating Procedures34T.......................................................................................................................... 109 34T8.534T 34TRequirements for Methods Start-up 34T ................................................................................................................... 109 34T8.634T 34TLaboratory Reagent Water34T ................................................................................................................................. 111 34T8.734T 34TReagents and Standards34T ..................................................................................................................................... 111
Date: June 30, 2015 Revision No: 2
Author: D. Satterwhite Revision Author: N. Good
Page 6 of 221
34T8.834T 34TWaste Disposal Methods34T ................................................................................................................................... 113 34T8.934T 34TLabware34T ............................................................................................................................................................. 114
34TTable 8.1. Labware Cleaning Protocols.34T ..................................................................................................................... 115 34TFigure 8.1 U.S. EPA Memorandum Recommended Approved Modification to EPA Method 62534T ............................ 116 34TFigure 8.2. Memorandum from the Aquifer Protection Section rescinding the policy for using Method 3030C for the preparation of Groundwater monitoring well samples.34T ................................................................................................ 118 34TFigure 8.3. EPA Region 4 approval to use EPA Method 200.2.34T ................................................................................. 120 34TFigure 8.4. EPA Region 4 approval for EPA Method 200.8.34T ...................................................................................... 121 34TFigure 8.5. Electronic mail clarification from EPA Region 4 regarding 200.8 approval.34T ........................................... 122 34TFigure 8.6. EPA Region 4 approval for EPA Method 200.9.34T ...................................................................................... 123 34TFigure 8.7. EPA Region 4 alternate procedure request for spectrophotometric determination of Platinum Cobalt color.34T
...................................................................................................................................................................................... 124 34TFigure 8.8. EPA Region 4 approval for spectrophotometric determination of Platinum Cobalt Color34T ....................... 125
34T9.034T 34TCalibration Procedures and Frequency34T ................................................................................................................... 126 34T9.134T 34TStandards Receipt, Preparation and Traceability34T ............................................................................................... 126 34T9.234T 34TLaboratory Instrument Calibration34T .................................................................................................................... 127 34T9.334T 34TGeneral Calibration Procedures34T ......................................................................................................................... 127 34T9.434T 34TInstrument-Specific Calibration Procedures34T ...................................................................................................... 135 34T9.534T 34TStandardization of titrating solutions34T ................................................................................................................. 147
34TTable 9.1. Calibration Frequency, Procedures, Standards, and Acceptance Criteria for Support Equipment34T ............. 148 34TTable 9.2. Calibration Frequency, Procedures, Standards, and Acceptance Criteria for Operational Equipment34T ....... 149 34TTable 9.3. Standardization of Titrating Solutions. 34T ....................................................................................................... 151
34T10.034T 34TPreventive Maintenance34T ......................................................................................................................................... 152 34T10.134T 34TDocumentation34T ................................................................................................................................................... 152 34T10.234T 34TContingency Plan34T ............................................................................................................................................... 152 34T10.334T 34TUninterruptible Power Supply34T ........................................................................................................................... 153
34TTable 10.1. Laboratory Equipment Preventive Maintenance Schedule34T ....................................................................... 154 34T11.034T 34TQuality Control Checks to Assess Precision and Accuracy and Calculation of Method Detection Limits34T ............ 167
34T11.134T 34TQuality Control (QC) Checks34T ............................................................................................................................ 167 34T11.234T 34TMethods of Calculations for QC34T ........................................................................................................................ 171 34T11.334T 34TStatistical Outlier Tests34T ...................................................................................................................................... 175
34TTable 11.1. Critical values for Grubb's T 34T .................................................................................................................... 176 34T11.434T 34TMethod Detection Limits (MDL) and Practical Quantitation Limits (PQL) 34T ...................................................... 176
34TTable 11.2. Students' t-Values at the 99% Confidence Level34T ...................................................................................... 178 34T11.534T 34TMDL Reporting34T ................................................................................................................................................. 178 34T11.634T 34TBlind QC Check Sample Analysis34T ..................................................................................................................... 179
34TFigure 11.1. Example MDL Reporting Format34T ........................................................................................................... 180 34T12.034T 34TData Reduction, Verification and Reporting34T .......................................................................................................... 181
34T12.134T 34TData Reduction34T .................................................................................................................................................. 181 34T12.234T 34TData Verification34T ............................................................................................................................................... 188
Date: June 30, 2015 Revision No: 2
Author: D. Satterwhite Revision Author: N. Good
Page 7 of 221
34T12.334T 34TReporting34T ........................................................................................................................................................... 190 34T12.434T 34TData Storage34T....................................................................................................................................................... 191
34TFigure 12.1. Example report.34T ....................................................................................................................................... 194 34TFigure 12.2. Schematic of Analytical Data Review and Reporting34T ............................................................................. 195
34T13.034T 34TCorrective Actions34T ................................................................................................................................................. 196 34T13.134T 34TProcedures for Reporting Exceptions34T ................................................................................................................ 196 34T13.234T 34TQuality Control Batch Problems34T ........................................................................................................................ 197 34T13.334T 34TSample Collection Problems34T .............................................................................................................................. 197 34T13.434T 34TSystematic Problems34T .......................................................................................................................................... 197 34T13.534T 34TDepartures from Documented Policies or Procedures34T ....................................................................................... 197 34T13.634T 34TExternal Corrective Actions34T ............................................................................................................................... 197 34T13.734T 34TComplaint Handling34T ........................................................................................................................................... 198 34T13.834T 34TImmediate vs. Long Term Corrective Action34T .................................................................................................... 198
34TTable 13.1. Guide to Corrective actions for QC elements monitored by the Water Sciences Section.34T ....................... 199 34TFigure 13.1. Sample Anomaly Report (SAR) Form34T .................................................................................................... 201 34TFigure 13.2. Sample Condition Upon Receipt (SCUR) Report (Example)34T ................................................................. 202
34T14.034T 34TPerformance and Systems Audits34T ........................................................................................................................... 203 34T14.134T 34TSystem Audits34T .................................................................................................................................................... 203 34T14.234T 34TProficiency Testing and Round Robin Samples34T ................................................................................................ 205 34T14.334T 34TQuality Systems Management Review34T .............................................................................................................. 206 34T14.434T 34TCorrective Actions34T ............................................................................................................................................. 207 34T14.534T 34TReport Audits34T ..................................................................................................................................................... 207
34T15.034T 34TQuality Assurance Reports34T ..................................................................................................................................... 208 34T15.134T 34TInternal Reports34T ................................................................................................................................................. 208 34T15.234T 34TExternal Reports34T ................................................................................................................................................ 208
34TFigure 15.1. Semi Annual QA Report to Management Format34T ................................................................................... 209 34T16.034T 34TSelected References34T ............................................................................................................................................... 210 34T17.034T 34TAppendices34T ............................................................................................................................................................. 211
34TAppendix I. Corrective Action Report Form34T ................................................................................................................... 211 34TAppendix II. NC DWR WSS Laboratory Qualifier Codes34T .............................................................................................. 212 34TAppendix III. CHP Orientation Training Form34T ............................................................................................................... 215 34TAppendix IV. DWR WSS Laboratory Program Records Retention and Disposition Schedule34T ...................................... 216 34TAppendix V. NC DWR Water Sciences Section (WSS) Laboratory Prioritization Policy - 201534T .................................. 220
Date: June 30, 2015 Revision No: 2
Author: D. Satterwhite Revision Author: N. Good
Page 8 of 221
3.0 Statement of Policy It is the mission of the North Carolina Department of Environment and Natural Resources (NCDENR) to provide leadership, education and advocacy for the responsible stewardship of North Carolina's environment and natural resources. It is recognized that the N.C. Department of Environment and Natural Resources’ primary mission is to protect North Carolina’s environment and natural resources The mission of the Water Sciences Section is to provide the Division with accurate information pertaining to waters of the state. Excellent service along with water quality monitoring and certification programs and analytical laboratory analyses that provide scientifically defensible data are the section’s main avenues for accomplishing this mission. These activities support the management and protection of North Carolina’s water resources for the health and welfare of the citizens of North Carolina and the economic well-being of the state. The Water Sciences Section provides analytical and technical support to the divisions and programs within the Department of Environment and Natural Resources. To ensure that the results produced and reported meet the requirements of the data users and comply with state and federal regulations, a quality management system has been implemented that is clear, effective, well-communicated, and supported at all levels of the Division. The Quality Assurance Manual (QAM) details the quality assurance (QA) program in effect at the DWR laboratories. The primary purpose of this document is to establish and maintain uniform operational and quality control procedures and to ensure data is of a known and documented quality. A well-conceived QA program provides a sound framework for the generation of laboratory data that is scientifically valid, representative and legally defensible. The validity and reliability of the data generated by the Water Sciences Section are assured by adherence to rigorous quality assurance/quality control (QA/QC) protocols. The application of sound QA/QC principles, beginning with initial planning and continuing through all field and laboratory activities, including the final report, are designed to meet that goal. The fundamental elements of the Water Sciences Section's QA program include Standard Operating Procedures (SOPs), quality control practices, performance testing samples, internal audits, external audits and an ethics policy. This manual and the quality control procedures described within are not to be viewed as complete. Rather, they serve as a basic foundation on which to build a stronger, more viable Quality Assurance Management Plan (QAMP) within the Section. Other documents that may detail or affect the quality management program include the Chemical Hygiene Plan (CHP), quality guidance documents, memoranda, work instructions, standard operating procedures and periodic reports. These documents may further define or guide the implementation of quality standards within the Water Sciences Section, but shall not conflict with the QAMP or diminish the effectiveness of the program. Adherence to the practices described in this manual is required of all employees. All employees are required to familiarize themselves with the sections of this manual that pertain to their operations and are encouraged to comment on its contents and make recommendations for more efficient procedures. The QAM when revised is printed and a hard copy presented to each unit as well as and electronic copy placed on the server for employee access. Each employee is asked to read the QAM and, upon completion, submit to their unit supervisor a signed email stating that they have read and understand the QAM. Following is a list of documents used to develop the Water Sciences Section Chemistry Laboratory's QAMP:
• UEPA Requirements for Quality Management PlansU, U.S. Environmental Protection Agency, EPA QA/R-2, March 2001, et seq.
• UEPA Requirements for Quality Assurance Project PlansU, USEPA QA/R-5, et seq. • USpecifications and Guidelines for Quality Systems for Environmental Data Collection and Environmental
Technology ProgramsU, American Society for Quality Control, Energy and Environmental Quality Division, Environmental Issues Group, ANSI/ASQC E4-1994 (Formerly EQA-1), January 1994, et seq.
• UQuality Management and Quality System Elements for Laboratories - GuidelinesU, American National Standard, American Society for Quality Control, ANSI/ASQC Q2-1991, et seq.
• The North Carolina Administrative Code, 15A NCAC 2H .0800, governing Laboratory Certification.
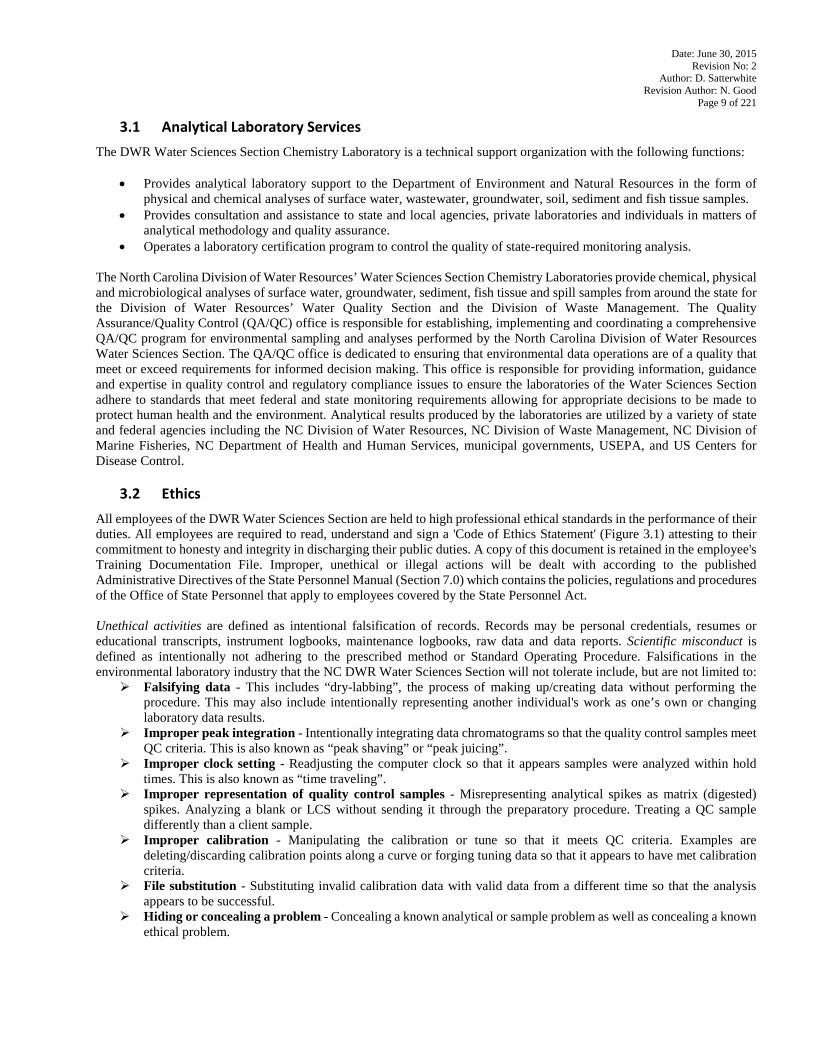
Date: June 30, 2015 Revision No: 2
Author: D. Satterwhite Revision Author: N. Good
Page 9 of 221
3.1 Analytical Laboratory Services The DWR Water Sciences Section Chemistry Laboratory is a technical support organization with the following functions:
• Provides analytical laboratory support to the Department of Environment and Natural Resources in the form of physical and chemical analyses of surface water, wastewater, groundwater, soil, sediment and fish tissue samples.
• Provides consultation and assistance to state and local agencies, private laboratories and individuals in matters of analytical methodology and quality assurance.
• Operates a laboratory certification program to control the quality of state-required monitoring analysis. The North Carolina Division of Water Resources’ Water Sciences Section Chemistry Laboratories provide chemical, physical and microbiological analyses of surface water, groundwater, sediment, fish tissue and spill samples from around the state for the Division of Water Resources’ Water Quality Section and the Division of Waste Management. The Quality Assurance/Quality Control (QA/QC) office is responsible for establishing, implementing and coordinating a comprehensive QA/QC program for environmental sampling and analyses performed by the North Carolina Division of Water Resources Water Sciences Section. The QA/QC office is dedicated to ensuring that environmental data operations are of a quality that meet or exceed requirements for informed decision making. This office is responsible for providing information, guidance and expertise in quality control and regulatory compliance issues to ensure the laboratories of the Water Sciences Section adhere to standards that meet federal and state monitoring requirements allowing for appropriate decisions to be made to protect human health and the environment. Analytical results produced by the laboratories are utilized by a variety of state and federal agencies including the NC Division of Water Resources, NC Division of Waste Management, NC Division of Marine Fisheries, NC Department of Health and Human Services, municipal governments, USEPA, and US Centers for Disease Control.
3.2 Ethics
All employees of the DWR Water Sciences Section are held to high professional ethical standards in the performance of their duties. All employees are required to read, understand and sign a 'Code of Ethics Statement' (Figure 3.1) attesting to their commitment to honesty and integrity in discharging their public duties. A copy of this document is retained in the employee's Training Documentation File. Improper, unethical or illegal actions will be dealt with according to the published Administrative Directives of the State Personnel Manual (Section 7.0) which contains the policies, regulations and procedures of the Office of State Personnel that apply to employees covered by the State Personnel Act. Unethical activities are defined as intentional falsification of records. Records may be personal credentials, resumes or educational transcripts, instrument logbooks, maintenance logbooks, raw data and data reports. Scientific misconduct is defined as intentionally not adhering to the prescribed method or Standard Operating Procedure. Falsifications in the environmental laboratory industry that the NC DWR Water Sciences Section will not tolerate include, but are not limited to:
Falsifying data - This includes “dry-labbing”, the process of making up/creating data without performing the procedure. This may also include intentionally representing another individual's work as one’s own or changing laboratory data results.
Improper peak integration - Intentionally integrating data chromatograms so that the quality control samples meet QC criteria. This is also known as “peak shaving” or “peak juicing”.
Improper clock setting - Readjusting the computer clock so that it appears samples were analyzed within hold times. This is also known as “time traveling”.
Improper representation of quality control samples - Misrepresenting analytical spikes as matrix (digested) spikes. Analyzing a blank or LCS without sending it through the preparatory procedure. Treating a QC sample differently than a client sample.
Improper calibration - Manipulating the calibration or tune so that it meets QC criteria. Examples are deleting/discarding calibration points along a curve or forging tuning data so that it appears to have met calibration criteria.
File substitution - Substituting invalid calibration data with valid data from a different time so that the analysis appears to be successful.
Hiding or concealing a problem - Concealing a known analytical or sample problem as well as concealing a known ethical problem.
Date: June 30, 2015 Revision No: 2
Author: D. Satterwhite Revision Author: N. Good
Page 10 of 221
Such actions are considered personal conduct violations under State disciplinary policy. Disciplinary action for ethics violations may include verbal or written reprimand, reassignment, or termination depending on the number of infractions observed, the severity of the infraction, or the impact it may cause to the environment and human health.
3.3 Confidentiality
All records and documents generated by the DWR Water Sciences Section, except those associated with active criminal investigations, are public records and may be subject to disclosure according to the guidelines and exceptions published in Chapter 132 of the North Carolina General Statutes. The DWR WSS Laboratory has the responsibility to the public to safeguard these records and to carry out our day-to-day program obligations. The staff of the Water Sciences Section Laboratory is dedicated to making public records in our custody readily available to the public for review and copying. The following guidelines must be followed when reviewing laboratory files. The guidelines for reviewing laboratory files are presented on the File Access Record Form (Figure 3.2). The reviewer’s name, identification of the files reviewed, analytical unit, date of review, signature of reviewer and whether any copies were made are documented on the File Access Log (File Access Record Form - Figure 3.2). These completed logs are maintained by the Quality Assurance Office
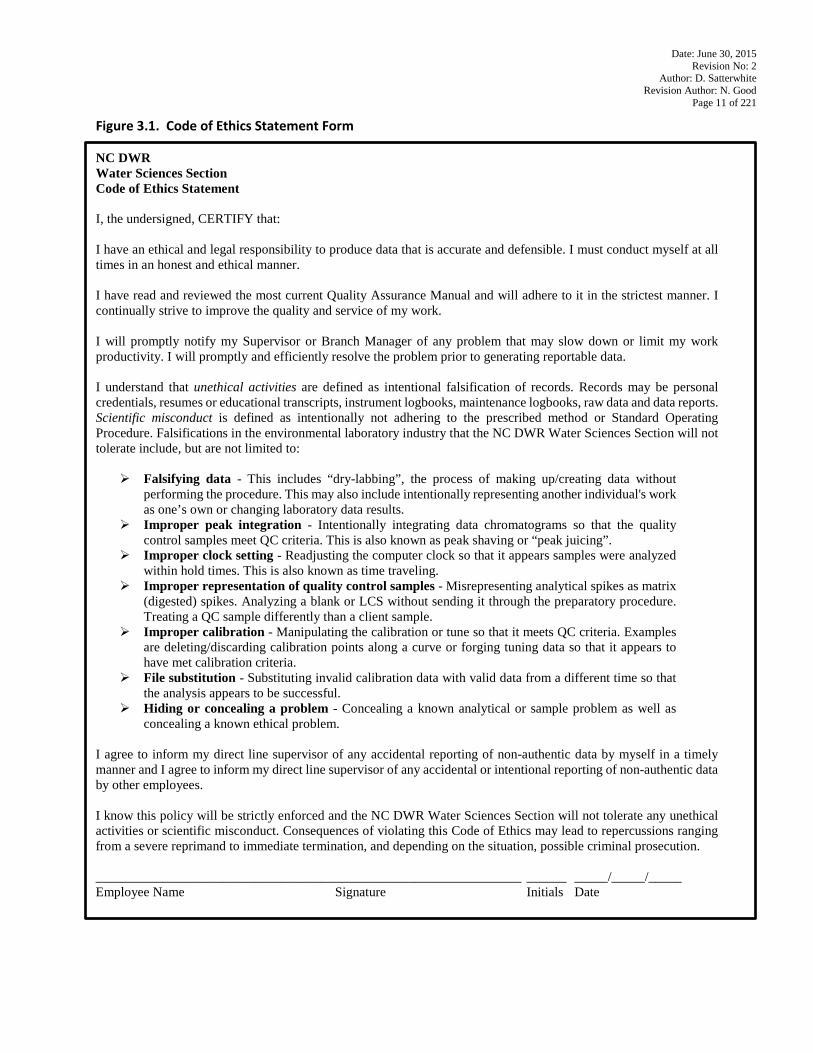
Date: June 30, 2015 Revision No: 2
Author: D. Satterwhite Revision Author: N. Good
Page 11 of 221
Figure 3.1. Code of Ethics Statement Form
NC DWR Water Sciences Section Code of Ethics Statement I, the undersigned, CERTIFY that: I have an ethical and legal responsibility to produce data that is accurate and defensible. I must conduct myself at all times in an honest and ethical manner. I have read and reviewed the most current Quality Assurance Manual and will adhere to it in the strictest manner. I continually strive to improve the quality and service of my work. I will promptly notify my Supervisor or Branch Manager of any problem that may slow down or limit my work productivity. I will promptly and efficiently resolve the problem prior to generating reportable data. I understand that unethical activities are defined as intentional falsification of records. Records may be personal credentials, resumes or educational transcripts, instrument logbooks, maintenance logbooks, raw data and data reports. Scientific misconduct is defined as intentionally not adhering to the prescribed method or Standard Operating Procedure. Falsifications in the environmental laboratory industry that the NC DWR Water Sciences Section will not tolerate include, but are not limited to:
Falsifying data - This includes “dry-labbing”, the process of making up/creating data without
performing the procedure. This may also include intentionally representing another individual's work as one’s own or changing laboratory data results.
Improper peak integration - Intentionally integrating data chromatograms so that the quality control samples meet QC criteria. This is also known as peak shaving or “peak juicing”.
Improper clock setting - Readjusting the computer clock so that it appears samples were analyzed within hold times. This is also known as time traveling.
Improper representation of quality control samples - Misrepresenting analytical spikes as matrix (digested) spikes. Analyzing a blank or LCS without sending it through the preparatory procedure. Treating a QC sample differently than a client sample.
Improper calibration - Manipulating the calibration or tune so that it meets QC criteria. Examples are deleting/discarding calibration points along a curve or forging tuning data so that it appears to have met calibration criteria.
File substitution - Substituting invalid calibration data with valid data from a different time so that the analysis appears to be successful.
Hiding or concealing a problem - Concealing a known analytical or sample problem as well as concealing a known ethical problem.
I agree to inform my direct line supervisor of any accidental reporting of non-authentic data by myself in a timely manner and I agree to inform my direct line supervisor of any accidental or intentional reporting of non-authentic data by other employees. I know this policy will be strictly enforced and the NC DWR Water Sciences Section will not tolerate any unethical activities or scientific misconduct. Consequences of violating this Code of Ethics may lead to repercussions ranging from a severe reprimand to immediate termination, and depending on the situation, possible criminal prosecution. ________________________________________________________________ ______ _____/_____/_____ Employee Name Signature Initials Date
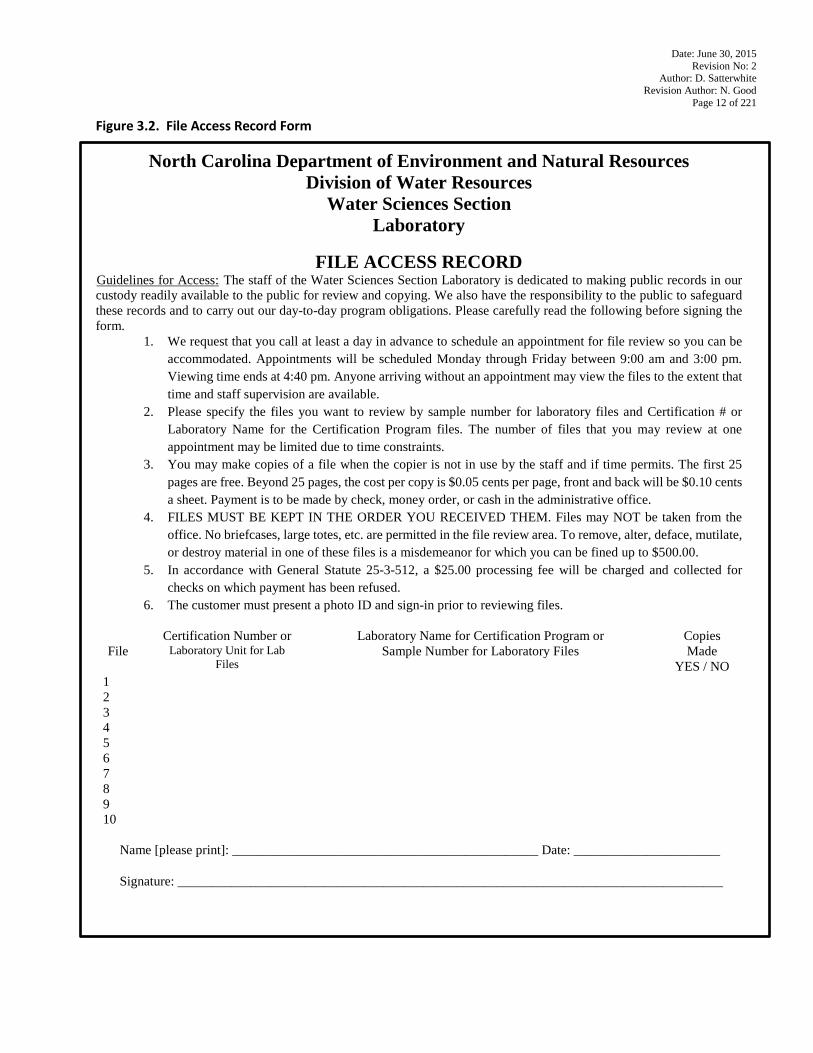
Date: June 30, 2015 Revision No: 2
Author: D. Satterwhite Revision Author: N. Good
Page 12 of 221
Figure 3.2. File Access Record Form
North Carolina Department of Environment and Natural Resources Division of Water Resources
Water Sciences Section Laboratory
FILE ACCESS RECORD
UGuidelines for Access:U The staff of the Water Sciences Section Laboratory is dedicated to making public records in our custody readily available to the public for review and copying. We also have the responsibility to the public to safeguard these records and to carry out our day-to-day program obligations. Please carefully read the following before signing the form.
1. We request that you call at least a day in advance to schedule an appointment for file review so you can be accommodated. Appointments will be scheduled Monday through Friday between 9:00 am and 3:00 pm. Viewing time ends at 4:40 pm. Anyone arriving without an appointment may view the files to the extent that time and staff supervision are available.
2. Please specify the files you want to review by sample number for laboratory files and Certification # or Laboratory Name for the Certification Program files. The number of files that you may review at one appointment may be limited due to time constraints.
3. You may make copies of a file when the copier is not in use by the staff and if time permits. The first 25 pages are free. Beyond 25 pages, the cost per copy is $0.05 cents per page, front and back will be $0.10 cents a sheet. Payment is to be made by check, money order, or cash in the administrative office.
4. FILES MUST BE KEPT IN THE ORDER YOU RECEIVED THEM. Files may NOT be taken from the office. No briefcases, large totes, etc. are permitted in the file review area. To remove, alter, deface, mutilate, or destroy material in one of these files is a misdemeanor for which you can be fined up to $500.00.
5. In accordance with General Statute 25-3-512, a $25.00 processing fee will be charged and collected for checks on which payment has been refused.
6. The customer must present a photo ID and sign-in prior to reviewing files.
File
Certification Number or Laboratory Unit for Lab
Files
Laboratory Name for Certification Program or Sample Number for Laboratory Files
Copies Made
YES / NO 1 2 3 4 5 6 7 8 9 10
Name [please print]: ______________________________________________ Date: ______________________
Signature: __________________________________________________________________________________
Date: June 30, 2015 Revision No: 2
Author: D. Satterwhite Revision Author: N. Good
Page 13 of 221
4.0 Organization, Facilities and Equipment The Water Sciences Section is a section of the Division of Water Resources of the North Carolina Department of Environment and Natural Resources. The Water Sciences Section Chemistry Laboratory is comprised of managers, chemists, technicians, and support personnel. The main laboratory (referred to as the Central Laboratory) is located in Raleigh, NC. One satellite laboratory is strategically located in western (Swannanoa, NC) region of the state to provide assistance with time-sensitive tests. The lab is referred to as the Asheville Regional Office (ARO) Laboratory.
The Central Laboratory is divided into two analytical programs: the Organic Chemistry Branch and the Microbiology & Inorganic Chemistry Branch. The Organic Chemistry Branch is subdivided into two analytical units: Volatile Organics and Pesticides/Semi-volatile/Sample Preparation. The Microbiology & Inorganic Chemistry Branch is subdivided into three units and a regional laboratory: Chemistry Unit, Microbiology and Metals Unit, Support Unit and the ARO Regional Lab. The Chemistry Unit is further subdivided into two analytical units: Wet Chemistry and Nutrients. The Microbiology and Metals unit is further subdivided into Microbiology and Metals. The Certification Branch is responsible for certifying commercial, industrial, municipal and field laboratories engaged in wastewater analyses and monitoring for North Carolina facilities.
The Water Sciences Section (WSS) is headed by the Section Chief, who is responsible for both the technical and administrative direction of the Section and is committed to the Quality Assurance program described in this manual. The Section Chief is supported by the Environmental Program Supervisors. The Quality Assurance/Quality Control (QA/QC) Coordinator (also referred to as QA Officer) has the responsibility of establishing, implementing and coordinating all activities related to the quality assurance program. The QA/QC Coordinator works independently from groups generating, compiling, and evaluating environmental data and reports directly to the Certification Branch Environmental Program Supervisor III. The QA/QC Coordinator manages the QA/QC program for the two laboratories, including working with lab management and staff to identify improvements to QA systems, and establishing policy for the Water Sciences Section's QA program. The QA/QC Coordinator documents these objectives in the Quality Assurance Manual (QAM) which includes procedures for sample handling, method validation, statistical analyses, and data verification. Quality assurance procedures for other branches of WSS are available online.
An organization chart of the Water Sciences Section is provided in Figure 4.1.
4.1 Responsibilities of Key Positions Pertinent to this QAM
4.1.1 Section Chief - Environmental Program Supervisor IV Responsible for both the technical and administrative direction of the Water Sciences Section. Responsible for the direction of the activities of the Water Sciences Section which includes various water programs, the WSS Certification Program and the WSS Laboratory. Responsibilities to the WSS Laboratory include providing direction to the various laboratory branches and units regarding actions related to, but not limited to, direction in daily laboratory operations, laboratory accounting and procurement, QA/QC, and customer service. Section Chief’s general duties involve budgeting, making decisions on equipment, the development of policies as needed, mediating personnel issues and signatory authority for all Laboratory Certification actions. Water Sciences Section Chief works with clients on various matters. Any significant changes to the Quality Assurance Manual must be authorized, in writing by the Section Chief.
4.1.2 Certification Branch Supervisor - Environmental Program Supervisor III
Directs Water Sciences Section certification program of certified laboratories; both in-state and out-of-state, which perform environmental analyses. Directs staff, provides administrative program management and future planning for program development. Oversees the Central and Regional Lab Quality Assurance Program. Serves as the section’s liaison to commercial labs, private labs and other programs supported by the WSS Lab. Oversees invoicing and collection of laboratory certification fees, staff training, scheduling, recruitment, hiring, and personnel actions. Assists the Section Chief with budget planning. Establishes work plan documents describing responsibilities, communicates expectations for performance and identifies tracking sources and frequencies. Monitors performance progress toward performance expectations. Designs positions and prepares job descriptions. Reviews and approves audit reports, tracks inspections, and consults with external and internal customers on analytical issues, determines and develops future policies and rules as necessary for the strategic benefit of the laboratory certification program, and issues
Date: June 30, 2015 Revision No: 2
Author: D. Satterwhite Revision Author: N. Good
Page 14 of 221
de-certifications and other enforcement actions as necessary. Serves as EPA’s delegated authority for EPA’s DMR QA Proficiency Testing program since the certification program has been deemed to be equivalent. Assures adherence and consistency with existing rules. Develops and promulgates modified rules as needed to maintain the certification program. Responsible for the ensuring that audits of N.C. certified laboratories both field and conventional are performed in a timely manner. Plans and provides for program enhancements through reviews of other state environmental laboratory programs.
4.1.3 Quality Assurance/Quality Control Coordinator - Chemist III
Plans, implements and assesses the Water Sciences Section QA program. Manages the laboratory's blind proficiency program. Manages the QA/QC program for the laboratories, including working with lab management and staff to identify improvements to QA systems, and establishing policy for the labs’ QA program. The QA/QC Coordinator documents these objectives in a Quality Assurance Manual (QAM) which includes procedures for sample handling, method validation, statistical analyses, and data verification. Copies of the QAM are made available to all personnel and training in its interpretation is provided. Ensures all routinely used procedures that impact data quality are documented in standard operating procedures (SOPs) that are complete and have been reviewed and approved by both management and the staff responsible for implementing those procedures. Coordinates audits/reviews to assure adherence to the QAM and to identify deficiencies in the QA/QC systems. The QA/QC Coordinator subsequently makes appropriate recommendations for correction and improvement of QA/QC activities by means of written reports. Ensures adequate follow-through actions are implemented in response to audit/review findings. Coordinates external audits and serves as the primary liaison with regulatory agencies to ensure the laboratories’ compliance with all pertinent regulatory and accreditation requirements.
4.1.4 Organic Chemistry Branch Supervisor - Environmental Program Supervisor III
Supervises and oversees the daily operation of the Volatile Organics, Pesticides/Semi-volatiles/Extractions Organics units of the Central Laboratory. Responsible for training of staff, developing daily work plan for routine analytical work to ensure that sample holding time requirements and turnaround commitments are met; resolving analytical and instrumental problems; maintaining protocols to meet QA/QC objectives of the laboratory; offering customer support and consulting; supervising chemists and chemistry technicians in their duties; ensuring subordinates are following proper laboratory safety and waste management procedures; and implementing new or modified analytical procedures and instruments. Responsible for technical conduct, evaluation and reporting of all analytical tasks associated with results generated on water, soil, tissue and waste samples submitted for organic analyses. Ensures that only approved procedures are documented and followed, that all data are recorded and verified, and that all deviations from approved procedures are documented. Ensures compliance with quality control objectives and laboratory quality assurance in the organic subsection. Assists Unit Lead Chemists in correcting problems revealed by QA audits and in bringing out-of-control methods back to within established protocol. Certifies analytical reports for release to clients. Performs work performance reviews of the unit chemists and technicians.
4.1.5 Microbiological and Inorganic Chemistry Branch Supervisor - Environmental Program
Supervisor III Supervises the Bio/Chemistry, Metals, and Support units of the Central Laboratory and the Regional Lab. Responsible for technical conduct, evaluation and reporting of all analytical tasks associated with results generated on water, soil, tissue and waste samples submitted for inorganic analyses including trace metal content, minerals, nutrients, and microbiological determinations. Ensures that approved procedures are documented and followed and that all data are recorded and verified, and that all deviations from approved procedures are documented. Ensures compliance with quality control objectives and laboratory quality assurance in the Microbiology and Inorganic Chemistry Branch. Assists Unit Supervisors in correcting problems revealed by QA audits and in bringing out-of-control methods back to within established protocol. Ensures that samples are properly received and documented into both Laserfiche a document management system, and Labworks™ LIMs Data System. Manages the WSS Laboratory Laserfiche system and assists with the WSS Laboratory LIMS system Labworks™. Certifies analytical reports for release to clients. Performs work performance reviews of the unit supervisors.
Date: June 30, 2015 Revision No: 2
Author: D. Satterwhite Revision Author: N. Good
Page 15 of 221
4.1.6 Chemistry Unit Supervisor - Environmental Program Supervisor II Oversees the daily operation of the Wet Chemistry and Nutrients units of the Chemistry Unit. Responsible for training of staff, monitoring daily work plan for routine analytical work to ensure that sample holding time requirements and turnaround commitments are met; resolving analytical and instrumental problems; maintaining protocols to meet QA/QC objectives of the laboratory; offering customer support and consulting; supervising chemists and chemistry technicians in their duties; ensuring subordinates are following proper laboratory safety and waste management procedures; and implementing new or modified analytical procedures and instruments. Validates all analytical reports. Performs work performance reviews.
4.1.7 Microbiology and Metals Unit Supervisor - Environmental Program Supervisor II
Oversees the daily operation of the Metals Unit and Microbiology Unit. Responsible for results generated for metals analyses of water, soil, tissue and waste samples submitted to the laboratory. Ensures compliance with quality control objectives and laboratory quality assurance in the Metals Unit. Responsible for training of staff, developing daily work plan for routine analytical work to ensure that sample holding time requirements and turnaround commitments are met; resolving analytical and instrumental problems; maintaining protocols to meet QA/QC objectives of the laboratory; offering customer support and consulting; supervising chemists and chemistry technicians in their duties; ensuring subordinates are following proper laboratory safety and waste management procedures; and implementing new or modified analytical procedures and instruments. Validates all analytical reports. Performs work performance reviews.
4.1.8 Chemists/Chemistry Technicians
These positions involve sample preparation and routine microbiological, chemical and physical analyses of environmental samples including maintenance and troubleshooting of assigned instrumentation. They must adhere to the daily schedule provided by the Supervisor for sample priorities and utilize SOPs for assigned tasks. Perform a variety of routine analyses or preparation procedures to determine and evaluate chemical and physical properties of laboratory samples. Verify proper preservation of samples. Carry out detailed preparation and analysis steps according to published analytical methods and standard operating procedures. Report and review data, and handles routine maintenance of instrumentation. Work under direct supervision of the Unit Supervisor or Environmental Program Supervisor and performs any additional tasks that are assigned. Comply with all policies established in the QA manual and Chemical Hygiene Plan. Perform routine analytical techniques and sample preparation procedures with well-defined standards and SOPs, such as organic extractions, metals digestion, or wet chemistry. Chemists/Chemistry Technicians may have a role in customer support and consultation.
4.1.10 Support Unit Staff
Serve as contact persons to clients at point of sample receipt. Enters sample information into the computerized Labworks™ and Laserfiche systems. Conduct sample receiving procedures including unloading coolers, organizing samples, comparing samples to chain-of-custody documentation, taking sample temperatures, and labeling and archiving samples. Perform routine tasks such as shipping, bottle preparation, acting as liaison with the state and private courier services, and performing sample disposal. The Support Unit Staff References materials regarding hold times, containers, and preservatives. Prepare receipt non-conformance reports and manage sample distribution. Report to the Section Chief. Perform additional tasks as requested such as glassware cleaning. Comply with all policies in the QA manual and Chemical Hygiene Plan.
4.1.11 Administrative Assistant (AAII)
Serves as the requisitioner and receiver on the North Carolina Accounting System (NCAS) for purchasing analytical supplies and instrumentation needed to support seven analytical units and one regional laboratory. Responsible for building maintenance which includes heating and air units, extraction hoods, preventive maintenance, monitoring and maintaining walk in coolers and incubators. Responsible for contact with Facility Management. Manages Water Sciences Section Chemistry Laboratory and regional office fixed assets.
Date: June 30, 2015 Revision No: 2
Author: D. Satterwhite Revision Author: N. Good
Page 16 of 221
4.1.12 Processing Assistant (PAV) Checks data entry and reviews final reports for completeness. Receives guest into building assuring that guests sign in when entering and out when leaving the building. Directs phone calls and assists Support Unit when necessary.
4.2 Personnel Training
All activities performed by the Water Sciences Section will be accomplished by qualified personnel. Each individual engaged in the conduct of, or responsible for the supervision of, sample handling and analysis will have education, training, and experience, or a combination thereof, to enable that individual to perform the assigned functions. Each operating unit will have job descriptions for all positions. These job descriptions will specify the minimum qualifications for education, experience, knowledge and skills that are necessary to perform at a satisfactory level. All staff will be encouraged to perform at a level which exceeds expectation. .
4.2.1 Orientation Each new permanent employee receives a three part orientation including 1) a human resources orientation, 2) a safety orientation and 3) a supervisory orientation. Temporary employees receive all but the human resources orientation.
4.2.1.1 Human Resources Orientation
The human resources orientation provides information on departmental policies, procedures and benefits. New employees also participate in a 6-hour course entitled Introduction to Organizational Excellence or equivalent training. This program provides information about the Agency's mission, vision and values; organizational structure; DENR's Quality Program; the expectations of public service, and provides an opportunity for employees to learn how their work contributes to the Agency's mission.
4.2.1.2 Safety Orientation
Safety comes first for DWR WSS Laboratory. The Laboratory has a safety committee composed of an employee from each unit and a Laboratory Safety Officer. The Safety Committee meets once a month or more if needed to discuss safety issues or concerns. The Laboratory Safety Officer along with another Safety Committee member conducts a laboratory safety inspection at least once a year.
Each new employee will take part in a two-tiered safety orientation process that will include a Laboratory safety orientation with the Water Sciences Section Chemistry Laboratory Safety Officer (or safety committee member) and a Laboratory Unit orientation with the employee's Supervisor or unit lead chemist.
The WSS Laboratory safety orientation will include providing the new employee with a copy of the Laboratory Chemical Hygiene Plan (CHP) for the employee to read prior to further training. There will be a follow-up orientation to items covered in the CHP including general safety guidelines for the laboratory (emergency evacuations, eyewashes, personal protective equipment, etc.). In addition, the employee will be provided with an overview of OSHA's Hazard Communication Standard (29 CFR 1910.1200) and the Occupational Exposure to Hazardous Chemicals in Laboratories Standard (29 CFR 1910.1450). This safety orientation is documented on the New Employee Safety Orientation and Training form (Figure 4.3) and placed in the employee's Training Documentation File and the Department Training files.
The Water Sciences Section Chemistry Laboratory Unit safety orientation provides additional training specific to the new employee’s job duties and chemical analyses. This training is normally conducted by the unit supervisor or unit lead chemist, and includes information on chemical hazards involved with the unit’s duties and location of Safety Data Sheets (SDS). The employee is required to sign a statement (see Certification of Unit Training form in Figure 4.2) indicating that laboratory unit orientation information was made available and that they understand the information. The Unit
Date: June 30, 2015 Revision No: 2
Author: D. Satterwhite Revision Author: N. Good
Page 17 of 221
Supervisor will allow adequate time, before beginning work, for the new employee to read the unit’s standard operating procedures (SOP’s) and any other pertinent safety documents, and clarify any areas that are not understood.
The safety orientations will, at a minimum, include:
• Use of chemicals and equipment in the laboratory, the hazards associated with those chemicals and equipment, and appropriate chemical waste disposal procedures.
• Accident/Incident prevention and reporting procedures. • Laboratory fire safety and evacuation plans. • A tour of the Laboratory facility. • Use of Personal Protective Equipment (PPE).
4.2.1.3 Supervisory Orientation
During the supervisory orientation, the new employee's Supervisor provides the employee with a basic understanding of the role of the laboratory within the Division of Water Resources and the basic elements of that individual's position within the laboratory.
Orientations for new employees should be scheduled within the first two weeks of employment, where possible, to allow new employees time to select their benefits and become acquainted with administrative and safety polices prior to beginning analytical duties.
4.2.2 Training
4.2.2.1 Safety and Chemical Hygiene Training Employees will be apprised of the hazards present in the workplace upon initial assignment to the analytical unit or whenever new chemicals or processes are introduced into the work area. Environmental Program Supervisors, Supervisors, Lead Chemists or Unit Safety Committee member will be responsible for unit-specific chemical hygiene training for new employees. Unit safety training is documented on a Certification of Unit Training form (Figure 4.2). A copy is kept in the employee's Training Documentation File and a copy forwarded to the DENR Safety Officer for inclusion in the Department Training files.
At a minimum, employees are to be trained in the following areas:
• The contents of the laboratory Chemical Hygiene Plan (CHP) and how it applies to the
analytical unit to which the employee is assigned. • The location and general contents of the unit Safety Data Sheet (SDS) file. This training can
be handled on a hazard class basis for normal chemicals; however, particularly hazardous chemicals must be covered in detail to ensure employees are aware of the chemical's hazardous properties.
• The current Permissible Exposure Limits (PELs) for exposure to chemicals in the analytical unit.
• The detection of leaks or releases of chemicals in the unit and specific cleanup procedures to be used.
• The personal protective equipment (PPE) required to be used in the analytical unit. • Proper disposal protocol for chemical and sample waste.
Additional safety training courses will be made available from time to time. These courses may be mandatory or optional, depending on the topic. Employees are required to attend all mandatory training and are encouraged to take part in any optional training. Optional training may include such training as First Aid or CPR training. Mandatory and optional training will also be documented and filed in the employee's Training Documentation File or in the
Date: June 30, 2015 Revision No: 2
Author: D. Satterwhite Revision Author: N. Good
Page 18 of 221
online NC Learning Center, which is accessed through BEACON, the North Carolina state employee human resources and payroll portal.
Any time substantial changes are made to the CHP, all Water Sciences Section employees will receive an updated plan or training in the changes made to the plan and the process will be documented.
4.2.2.2 Analytical Training
The analytical training of a new employee concentrates on his/her scientific background and work experience to provide the employee with a level of competence so that the individual will be able to function within the defined responsibilities of his/her position as soon as possible. Training is a process used to assist laboratory personnel in their professional development. Training is usually conducted "on-the-job", teaming a qualified analyst with one in training. Supervisors shall be responsible for providing documentation of training and proficiency for each employee under their supervision. The employee's Training Documentation File indicates what procedures (SOPs) a chemist/chemistry technician is capable of performing either independently or only with supervision. The file should include, at a minimum, the following:
• Job description • Code of Ethics Statement form • Value in Performance (VIP) Work Plan • Orientation forms • Certificates of coursework completion • Training forms and associated Initial Demonstration of Capability and Method Detection
Limit Studies (IDOCs and MDLs) • Proficiency testing results • Audit reports and corrective action responses • SEmergency contact information
Each Supervisor is responsible for keeping a Training Documentation file for staff under his or her supervision that is up-to-date and current. If a supervisor relinquishes their duties as supervisor, the Training Documentation Files shall be passed to the new supervisor. New laboratory personnel are trained in basic lab techniques, safety and chemical hygiene, chemistry theory of the test procedures employed, quality control procedures, the LABWORKS™ LIMS system, record keeping and the operating principles and regulations governing the methods employed by the Water Sciences Section. A designated chemist/technician or the appropriate supervisor closely monitors every new employee until they exhibit proficiency in accepted laboratory techniques. This process includes reading specific SOPs and other associated references. Once a chemist/ technician demonstrates a technological aptitude within the framework of the Quality Assurance program, they will perform an Initial Demonstration of Capability (IDOC) study and a Method Detection Limit (MDL) study (if applicable). This training process is documented (see SOP/Method Training Summary form - Figure 4.4, IDOC template - Figure 4.5, and MDL template - Figure 4.6) for each chemist and each method and is retained in the employee's Training Documentation File. Upon completion of analytical or QA/QC training, the supervisor will certify that the person is qualified to independently perform the procedures. Additional training techniques utilized may include:
Lectures Programmed learning Conferences and seminars Short courses Specialized training by instrument manufacturers
Date: June 30, 2015 Revision No: 2
Author: D. Satterwhite Revision Author: N. Good
Page 19 of 221
Participation in check-sample or proficiency sample programs
All laboratory personnel are required to review and update all Standard Operating Procedures(SOPs) any time changes are made to procedure that pertain to the work they perform within the laboratory. Personnel will refer to the Guidance for Preparing Standard Operation Procedures located on the DENR intranet portal (34TUhttp://portal.nc.org/group/wq/chemlabsopsU34T) when preparing or updating SOPs. To insure SOPs are accurate, up-to-date and approved in a timely manner, a WSS Laboratory SOP Committee was formed to review both initial and revised SOPs. The Committee consists of members from the analytical units, and all Branch Supervisors and lead by the QA/QC Coordinator. In the WSS laboratories, SOPs are generally written by the Technician, Chemist or Lead Chemist involved in carrying-out the procedure. The Unit Supervisor is responsible for the first tier of review, followed by the each supervisor and finally the Quality Assurance/Quality Control (QA/QC) Coordinator or SOP Review Committee for final signature. The QA/QC Coordinator will serve as SOP custodian and will keep a controlled list of the all current SOPs and revisions. The latest official signed SOPs will be placed onto the DENR Intranet Portal website at (34Thttp://portal.ncdenr.org/group/wq/chemlabsops34T) and are accessible to all analysts and technicians throughout the Water Sciences Section. These versions are either in .pdf format or are write-protected so changes cannot be made without going through the proper approval process. It is the responsibility of the Environmental Program Supervisor to ensure that documentation demonstrating that their employees have read, understand and are using the latest version (including drafts) of SOPs is current and on file.
As an initial and continuing demonstration of proficiency, laboratory analysts are required to successfully analyze annually (at least once per calendar year) either 1) a blind sample, 2) a blind PT sample, 3) at least four consecutive laboratory quality control samples, 4) an authentic sample that has been analyzed by another trained analyst or 5) another acceptable demonstration of capability (e.g., round robins, side-by-side analysis schemes, etc.). Results of initial and continuing proficiency are maintained by laboratory supervisors. Employees are encouraged to participate in advanced training courses, seminars, and professional organizations and meetings as opportunities and funding become available. Additionally, meetings may be held to discuss procedures, work schedules and problems requiring immediate attention. At the discretion of the analyst's supervisor, an analyst may demonstrate proficiency in a test method without going through the formal training process. A Statement of Capability form (Figure 4.7) may be used to document the process of “grandfathering" analysts currently performing a procedure or method of analysis. This decision will be based on the analyst's experience, ongoing training workshops, acceptable PT results, or an IDOC study. The completed form will be maintained in the analyst's Training Documentation File. Review of individual training, IDOC and MDL records are reviewed as they occur and record books are reviewed annually by QA to ensure completeness.
4.3 Facilities The Central Laboratory building (4405 Reedy Creek Road) was completed and occupied in 1991. The single-story facility includes a full service analytical laboratory operation with all supporting equipment and space. The total facility consists of approximately 18,000 square feet. This includes 3 organic laboratories, 4 inorganic laboratories, a shipping/receiving area, storage areas and office space for staff. Operation and maintenance of the facility is the responsibility of the Division of Facility Management of the Department of Administration. The facility is equipped with centralized water purification and HVAC systems. A floor plan of the Central Laboratory is presented in Figure 4.8.
The Asheville Region Laboratory is housed in the Asheville Regional Office. The total laboratory area consists of approximately 1007 square feet with approximately 61 linear feet of bench space. This includes a main laboratory, a bacteria lab, a small storage area and office space. A floor plan of the ARO Laboratory is presented in Figure 4.9.
Date: June 30, 2015 Revision No: 2
Author: D. Satterwhite Revision Author: N. Good
Page 20 of 221
Some members of the Laboratory Certification Unit are housed in a Modular building located outside the main Central laboratory building. The total facility consists of approximately 1200 square feet. This includes two main offices, copier room, conference room, six cubicles for staff, storage area and two rest rooms. Operation and maintenance of the facility is the responsibility of the Division of Facility Management of the Department of Administration. The facility is equipped with HVAC system. A floor plan of the Certification Modular is presented in Figure 4.10. All other members are in the Central Laboratory building.
4.3.1 Environment Laboratory accommodations, test areas, energy sources, lighting, heating and ventilation must be adequate to facilitate proper performance of tests. The environment in which these activities are undertaken shall not invalidate the results or adversely affect the required accuracy of measurement. The laboratory shall provide for the effective monitoring, control and recording of environmental conditions as appropriate. Such environmental conditions may include biological sterility, humidity, and temperature. In instances where monitoring or control of any of the above-mentioned items is specified in a test method or by regulation, the laboratory shall meet and document adherence to those laboratory facility requirements.
4.3.2 Work Areas
There shall be effective separation between neighboring areas when the activities therein are incompatible (e.g., volatile organic chemicals handling and analytical areas). Access to and use of all areas affecting the quality of these activities shall be defined and controlled. Adequate measures will be taken to ensure good housekeeping in the laboratory and to ensure that any contamination does not adversely affect data quality or staff safety.
4.3.3 Building Security
Persons not in the employ of the Water Sciences Section are considered to be visitors to each site. Each visitor to the laboratory must sign in and out in a visitor's logbook and must be escorted by staff while in the laboratory. The buildings are always locked and keys are distributed to all permanent employees. At the Central Laboratory, the main entrance and the Receiving Room (G-098) doors are equipped with an electric lock that can be released by lab personnel. The entrance opposite the main entrance is equipped with a coded lock as well as key lock. Codes are only shared with Water Sciences Section staff. At the Asheville Regional Office Laboratory, the main entrance has a holding area between the front office and the lab area. An Administrative staff person must release an electric lock to allow access to staff offices and the laboratory. Under special circumstances, sample storage coolers may be locked as well and assigned custodians will control access to each. The Certification Program Modular is equipped with a coded lock and consists only of office spaces and conference room. No samples are taken to Certification modular building.
The regional laboratory stores Chain-of-Custody samples in secure or locked areas within the laboratory itself.
4.4 Equipment
4.4.1 Inventory The laboratories are equipped with advanced analytical equipment including gas chromatographs, gas chromatograph/mass spectrometers, atomic absorption spectrometers, inductively coupled plasma-atomic emission spectrometers, ion chromatograph, flow injection analyzers, fluorometer, UV-VIS spectrophotometers and ancillary analytical equipment and software essential to a quality environmental laboratory. The equipment and software used for testing, calibration and sampling shall be capable of achieving the accuracy required and shall comply with specifications relevant to the environmental tests or calibrations concerned. Instrument serial numbers or assigned ID numbers (for individual instruments or analytical systems) are recorded on the appropriate laboratory data.
Before being placed into service, equipment shall be calibrated or checked to establish that it meets the laboratory's specification requirements and complies with the relevant standard specifications. Similar restrictions apply to devices that may not be the actual test instrument, but are necessary to support laboratory operations. These include,
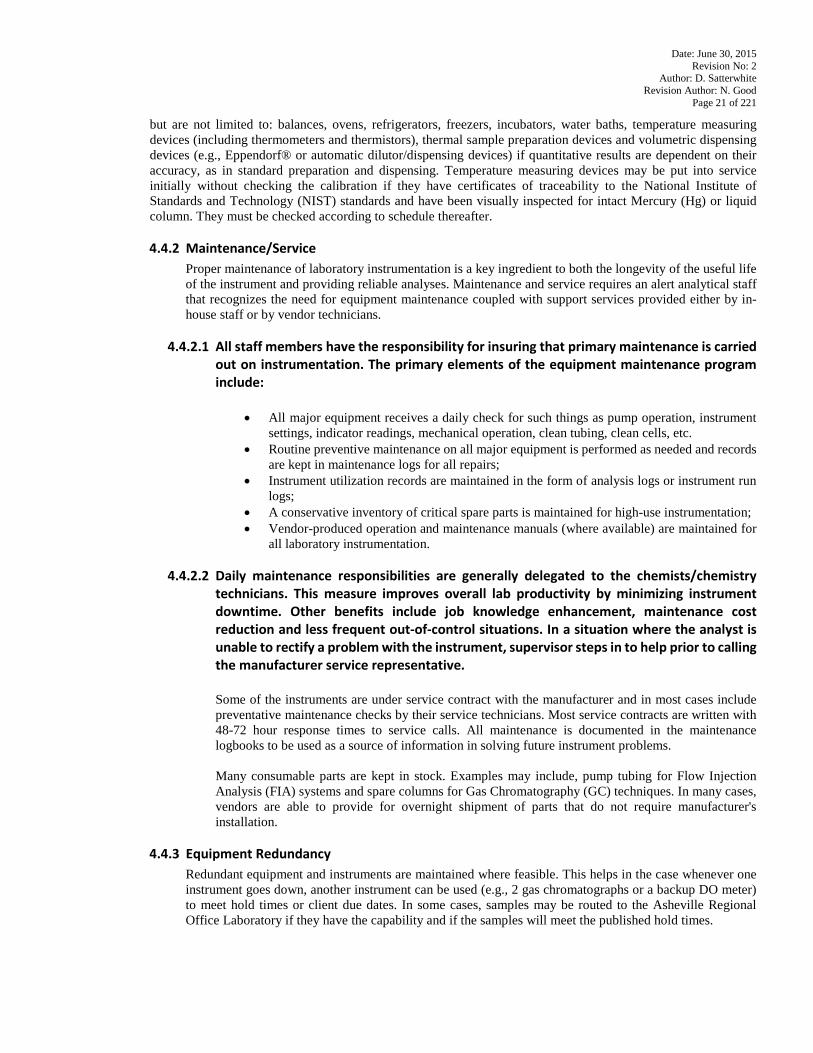
Date: June 30, 2015 Revision No: 2
Author: D. Satterwhite Revision Author: N. Good
Page 21 of 221
but are not limited to: balances, ovens, refrigerators, freezers, incubators, water baths, temperature measuring devices (including thermometers and thermistors), thermal sample preparation devices and volumetric dispensing devices (e.g., Eppendorf® or automatic dilutor/dispensing devices) if quantitative results are dependent on their accuracy, as in standard preparation and dispensing. Temperature measuring devices may be put into service initially without checking the calibration if they have certificates of traceability to the National Institute of Standards and Technology (NIST) standards and have been visually inspected for intact Mercury (Hg) or liquid column. They must be checked according to schedule thereafter.
4.4.2 Maintenance/Service
Proper maintenance of laboratory instrumentation is a key ingredient to both the longevity of the useful life of the instrument and providing reliable analyses. Maintenance and service requires an alert analytical staff that recognizes the need for equipment maintenance coupled with support services provided either by in-house staff or by vendor technicians.
4.4.2.1 All staff members have the responsibility for insuring that primary maintenance is carried
out on instrumentation. The primary elements of the equipment maintenance program include:
• All major equipment receives a daily check for such things as pump operation, instrument settings, indicator readings, mechanical operation, clean tubing, clean cells, etc.
• Routine preventive maintenance on all major equipment is performed as needed and records are kept in maintenance logs for all repairs;
• Instrument utilization records are maintained in the form of analysis logs or instrument run logs;
• A conservative inventory of critical spare parts is maintained for high-use instrumentation; • Vendor-produced operation and maintenance manuals (where available) are maintained for
all laboratory instrumentation.
4.4.2.2 Daily maintenance responsibilities are generally delegated to the chemists/chemistry technicians. This measure improves overall lab productivity by minimizing instrument downtime. Other benefits include job knowledge enhancement, maintenance cost reduction and less frequent out-of-control situations. In a situation where the analyst is unable to rectify a problem with the instrument, supervisor steps in to help prior to calling the manufacturer service representative.
Some of the instruments are under service contract with the manufacturer and in most cases include preventative maintenance checks by their service technicians. Most service contracts are written with 48-72 hour response times to service calls. All maintenance is documented in the maintenance logbooks to be used as a source of information in solving future instrument problems.
Many consumable parts are kept in stock. Examples may include, pump tubing for Flow Injection Analysis (FIA) systems and spare columns for Gas Chromatography (GC) techniques. In many cases, vendors are able to provide for overnight shipment of parts that do not require manufacturer's installation.
4.4.3 Equipment Redundancy
Redundant equipment and instruments are maintained where feasible. This helps in the case whenever one instrument goes down, another instrument can be used (e.g., 2 gas chromatographs or a backup DO meter) to meet hold times or client due dates. In some cases, samples may be routed to the Asheville Regional Office Laboratory if they have the capability and if the samples will meet the published hold times.
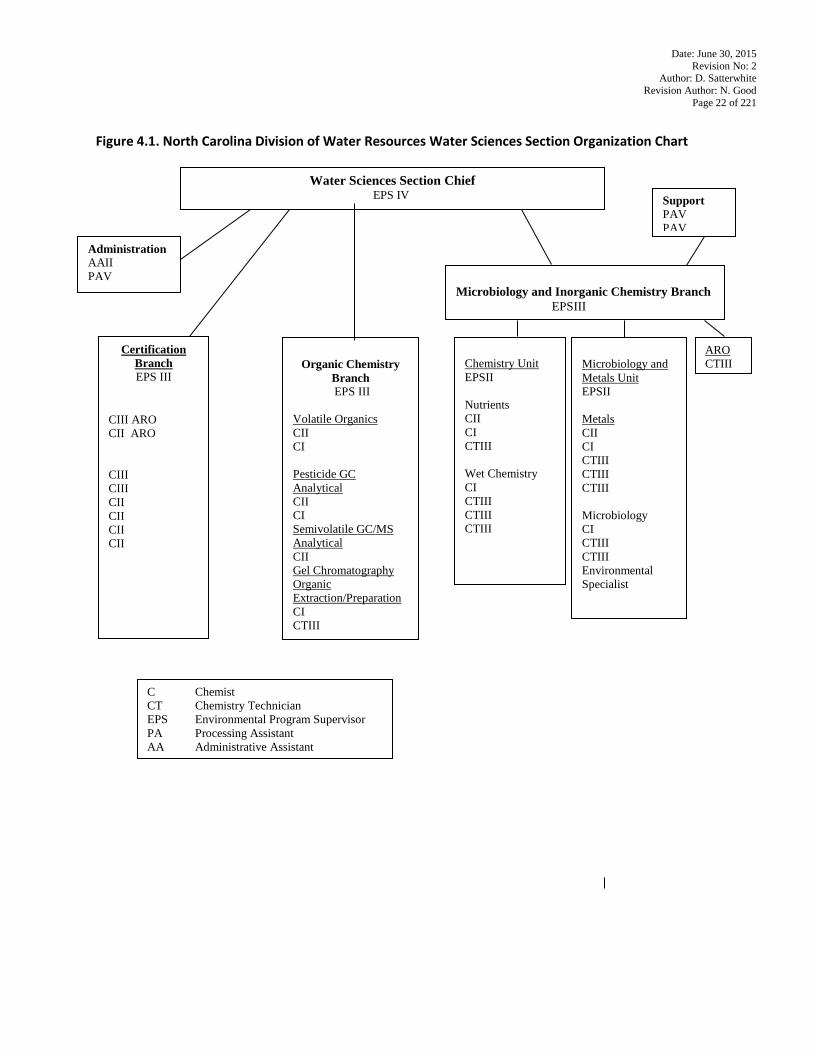
Date: June 30, 2015 Revision No: 2
Author: D. Satterwhite Revision Author: N. Good
Page 22 of 221
Figure 4.1. North Carolina Division of Water Resources Water Sciences Section Organization Chart
Water Sciences Section Chief EPS IV
Organic Chemistry
Branch EPS III
Volatile Organics CII CI Pesticide GC Analytical CII CI Semivolatile GC/MS Analytical CII Gel Chromatography Organic Extraction/Preparation CI CTIII
Administration AAII PAV
Certification Branch EPS III
CIII ARO CII ARO CIII CIII CII CII CII CII
Chemistry Unit EPSII Nutrients CII CI CTIII Wet Chemistry CI CTIII CTIII CTIII
Microbiology and Metals Unit EPSII Metals CII CI CTIII CTIII CTIII Microbiology CI CTIII CTIII Environmental Specialist
ARO CTIII
Support PAV PAV
Microbiology and Inorganic Chemistry Branch EPSIII
C Chemist CT Chemistry Technician EPS Environmental Program Supervisor PA Processing Assistant AA Administrative Assistant
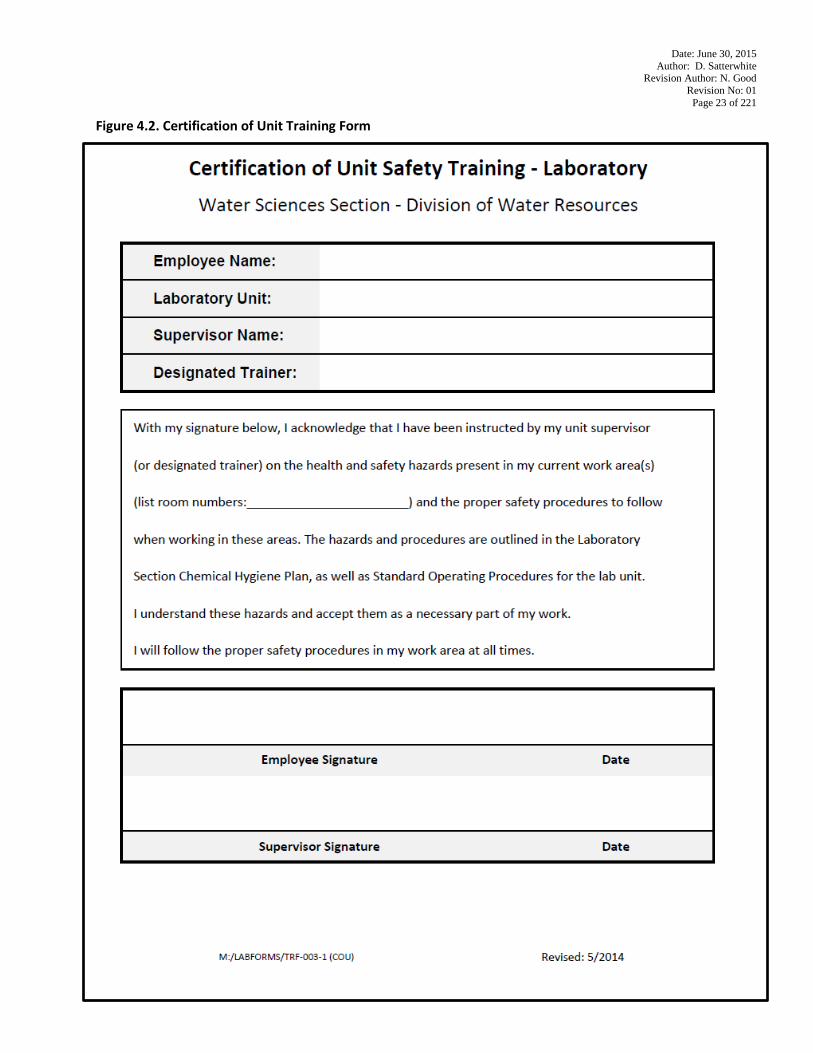
Date: June 30, 2015 Author: D. Satterwhite
Revision Author: N. Good Revision No: 01
Page 23 of 221
Figure 4.2. Certification of Unit Training Form
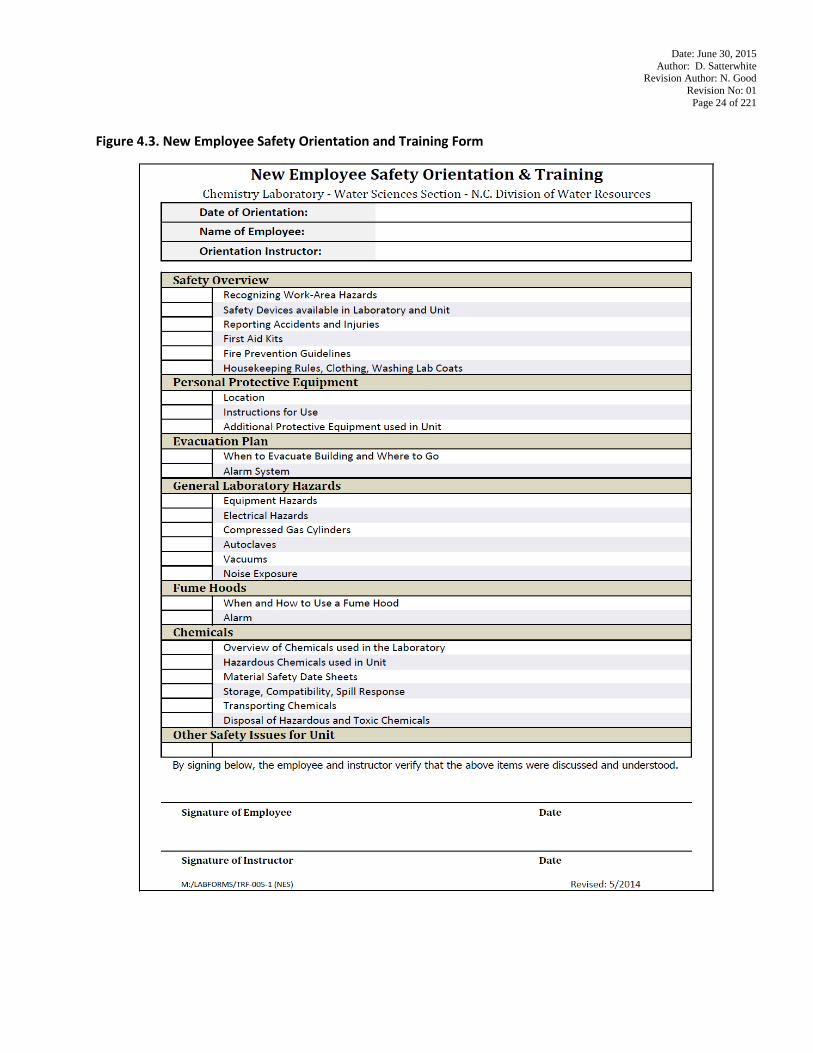
Date: June 30, 2015 Author: D. Satterwhite
Revision Author: N. Good Revision No: 01
Page 24 of 221
Figure 4.3. New Employee Safety Orientation and Training Form
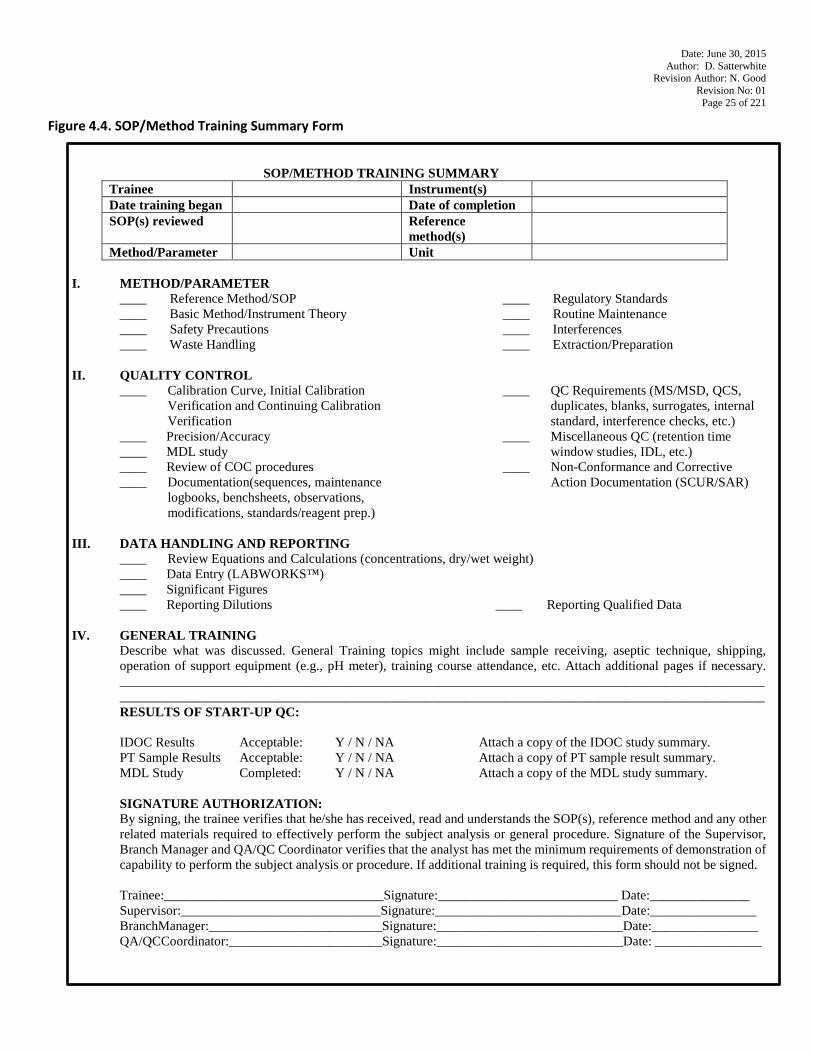
Date: June 30, 2015 Author: D. Satterwhite
Revision Author: N. Good Revision No: 01
Page 25 of 221
Figure 4.4. SOP/Method Training Summary Form
SOP/METHOD TRAINING SUMMARY Trainee Instrument(s) Date training began Date of completion SOP(s) reviewed Reference
method(s)
Method/Parameter Unit I. METHOD/PARAMETER
____ Reference Method/SOP ____ Basic Method/Instrument Theory ____ Safety Precautions ____ Waste Handling
____ Regulatory Standards ____ Routine Maintenance ____ Interferences ____ Extraction/Preparation
II. QUALITY CONTROL
____ Calibration Curve, Initial Calibration Verification and Continuing Calibration Verification
____ Precision/Accuracy ____ MDL study ____ Review of COC procedures ____ Documentation(sequences, maintenance
logbooks, benchsheets, observations, modifications, standards/reagent prep.)
____ QC Requirements (MS/MSD, QCS, duplicates, blanks, surrogates, internal standard, interference checks, etc.)
____ Miscellaneous QC (retention time window studies, IDL, etc.)
____ Non-Conformance and Corrective Action Documentation (SCUR/SAR)
III. DATA HANDLING AND REPORTING
____ Review Equations and Calculations (concentrations, dry/wet weight) ____ Data Entry (LABWORKS™) ____ Significant Figures ____ Reporting Dilutions ____ Reporting Qualified Data
IV. GENERAL TRAINING Describe what was discussed. General Training topics might include sample receiving, aseptic technique, shipping, operation of support equipment (e.g., pH meter), training course attendance, etc. Attach additional pages if necessary. _________________________________________________________________________________________________ _________________________________________________________________________________________________RESULTS OF START-UP QC: IDOC Results Acceptable: Y / N / NA Attach a copy of the IDOC study summary. PT Sample Results Acceptable: Y / N / NA Attach a copy of PT sample result summary. MDL Study Completed: Y / N / NA Attach a copy of the MDL study summary.
SIGNATURE AUTHORIZATION: By signing, the trainee verifies that he/she has received, read and understands the SOP(s), reference method and any other related materials required to effectively perform the subject analysis or general procedure. Signature of the Supervisor, Branch Manager and QA/QC Coordinator verifies that the analyst has met the minimum requirements of demonstration of capability to perform the subject analysis or procedure. If additional training is required, this form should not be signed. Trainee:_________________________________Signature:___________________________ Date:_______________ Supervisor:______________________________Signature:____________________________Date:________________ BranchManager:__________________________Signature:____________________________Date:________________ QA/QCCoordinator:_______________________Signature:____________________________Date: ________________
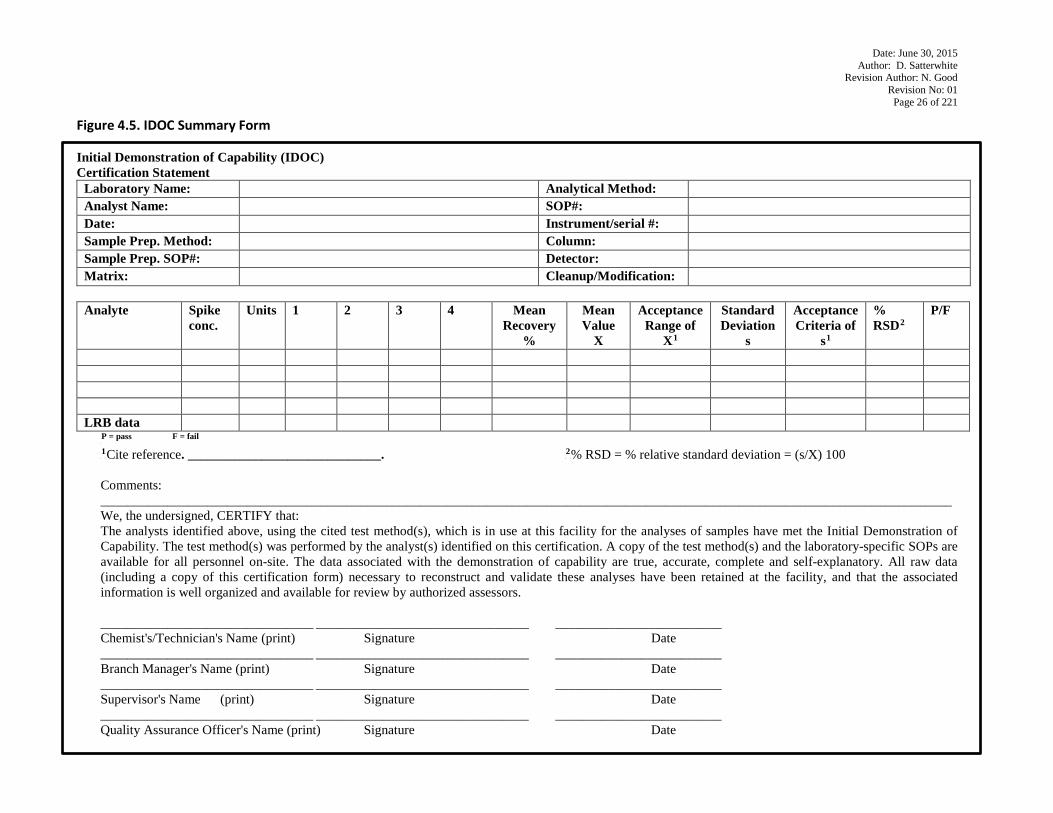
Date: June 30, 2015 Author: D. Satterwhite
Revision Author: N. Good Revision No: 01
Page 26 of 221
Figure 4.5. IDOC Summary Form Initial Demonstration of Capability (IDOC) Certification Statement
Laboratory Name: Analytical Method: Analyst Name: SOP#: Date: Instrument/serial #: Sample Prep. Method: Column: Sample Prep. SOP#: Detector: Matrix: Cleanup/Modification:
Analyte Spike
conc. Units 1 2 3 4 Mean
Recovery %
Mean Value
X
Acceptance Range of
XP
1
Standard Deviation
s
Acceptance Criteria of
sP
1
% RSDP
2 P/F
LRB data
P
P = pass F = fail
P
1PCite reference. _____________________________. P
2P% RSD = % relative standard deviation = (s/X) 100
Comments: ________________________________________________________________________________________________________________________________ We, the undersigned, CERTIFY that: The analysts identified above, using the cited test method(s), which is in use at this facility for the analyses of samples have met the Initial Demonstration of Capability. The test method(s) was performed by the analyst(s) identified on this certification. A copy of the test method(s) and the laboratory-specific SOPs are available for all personnel on-site. The data associated with the demonstration of capability are true, accurate, complete and self-explanatory. All raw data (including a copy of this certification form) necessary to reconstruct and validate these analyses have been retained at the facility, and that the associated information is well organized and available for review by authorized assessors. ________________________________ ________________________________ _________________________ Chemist's/Technician's Name (print) Signature Date ________________________________ ________________________________ _________________________ Branch Manager's Name (print) Signature Date ________________________________ ________________________________ _________________________ Supervisor's Name (print) Signature Date ________________________________ ________________________________ _________________________ Quality Assurance Officer's Name (print) Signature Date
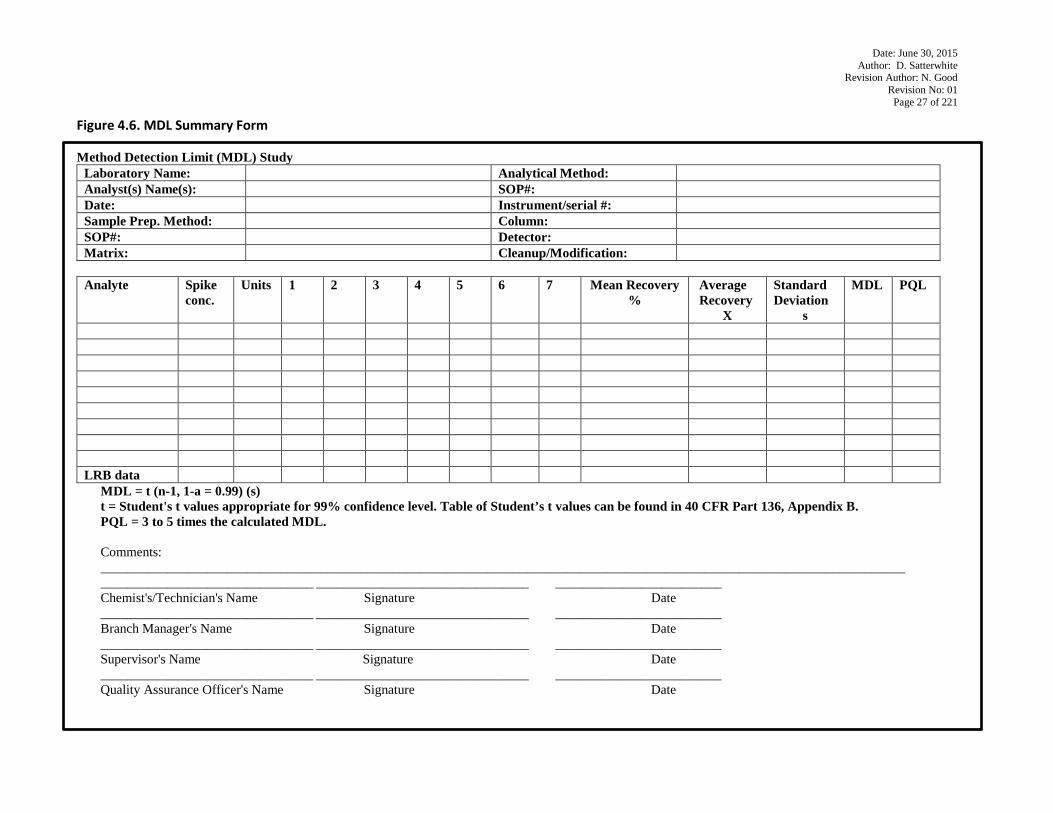
Date: June 30, 2015 Author: D. Satterwhite
Revision Author: N. Good Revision No: 01
Page 27 of 221
Figure 4.6. MDL Summary Form Method Detection Limit (MDL) Study
Laboratory Name: Analytical Method: Analyst(s) Name(s): SOP#: Date: Instrument/serial #: Sample Prep. Method: Column: SOP#: Detector: Matrix: Cleanup/Modification:
Analyte Spike
conc. Units 1 2 3 4 5 6 7 Mean Recovery
% Average Recovery
X
Standard Deviation
s
MDL PQL
LRB data
MDL = t (n-1, 1-a = 0.99) (s) t = Student's t values appropriate for 99% confidence level. Table of Student’s t values can be found in 40 CFR Part 136, Appendix B. PQL = 3 to 5 times the calculated MDL. Comments: _________________________________________________________________________________________________________________________ ________________________________ ________________________________ _________________________ Chemist's/Technician's Name Signature Date ________________________________ ________________________________ _________________________ Branch Manager's Name Signature Date ________________________________ ________________________________ _________________________ Supervisor's Name Signature Date ________________________________ ________________________________ _________________________ Quality Assurance Officer's Name Signature Date
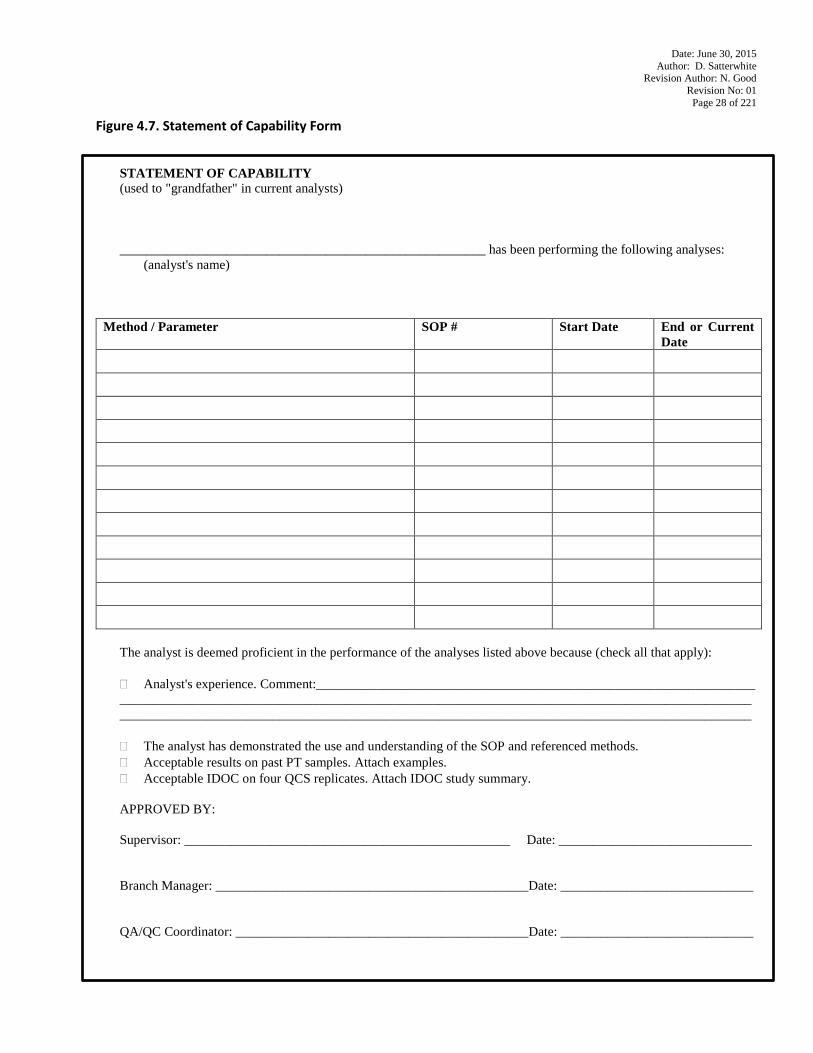
Date: June 30, 2015 Author: D. Satterwhite
Revision Author: N. Good Revision No: 01
Page 28 of 221
Figure 4.7. Statement of Capability Form STATEMENT OF CAPABILITY (used to "grandfather" in current analysts) _______________________________________________________ has been performing the following analyses: (analyst's name)
Method / Parameter SOP # Start Date End or Current Date
The analyst is deemed proficient in the performance of the analyses listed above because (check all that apply): � Analyst's experience. Comment:__________________________________________________________________ ______________________________________________________________________________________________________________________________________________________________________________________________ � The analyst has demonstrated the use and understanding of the SOP and referenced methods. � Acceptable results on past PT samples. Attach examples. � Acceptable IDOC on four QCS replicates. Attach IDOC study summary. APPROVED BY: Supervisor: _________________________________________________ Date: _____________________________ Branch Manager: _______________________________________________Date: _____________________________ QA/QC Coordinator: ____________________________________________Date: _____________________________
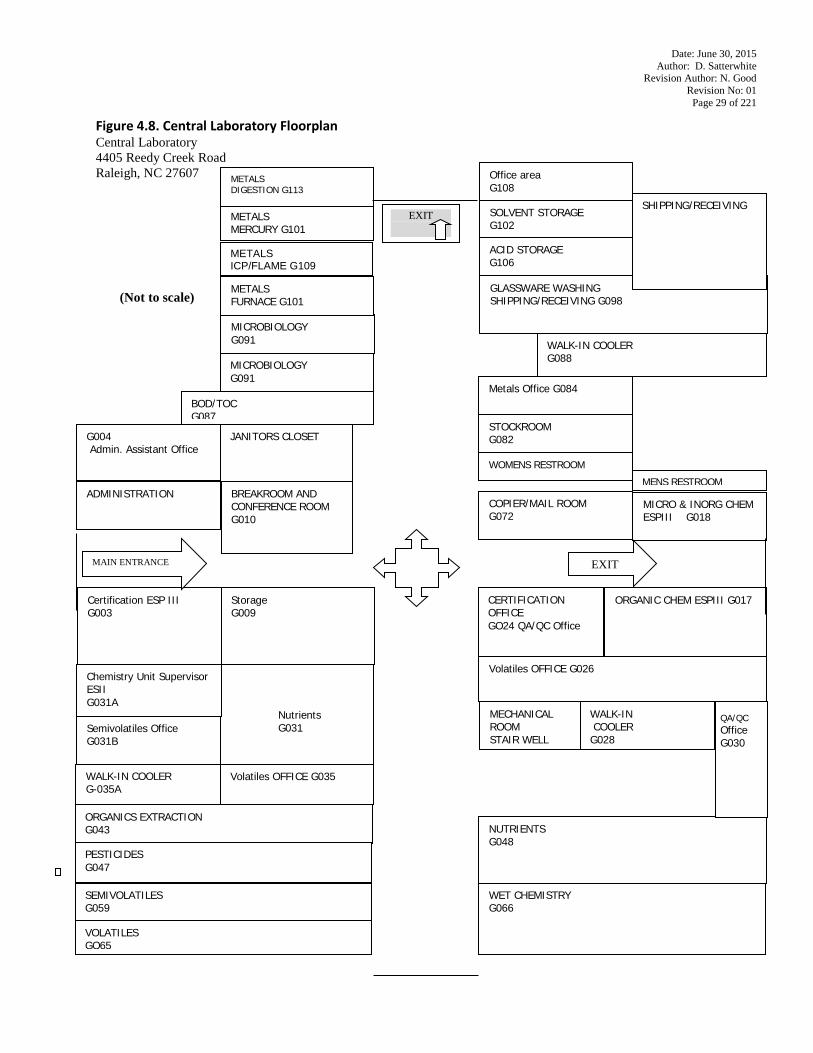
Date: June 30, 2015 Author: D. Satterwhite
Revision Author: N. Good Revision No: 01
Page 29 of 221
Figure 4.8. Central Laboratory Floorplan Central Laboratory 4405 Reedy Creek Road Raleigh, NC 27607
(Not to scale)
METALS ICP/FLAME G109
METALS MERCURY G101
Certification ESP III G003
WALK-IN COOLER G088
ADMINISTRATION
MICROBIOLOGY G091
METALS FURNACE G101
MICROBIOLOGY G091
BOD/TOC G087
JANITORS CLOSET
BREAKROOM AND CONFERENCE ROOM G010
Metals Office G084
STOCKROOM G082
WOMENS RESTROOM
GLASSWARE WASHING SHIPPING/RECEIVING G098
COPIER/MAIL ROOM G072
MICRO & INORG CHEM ESPIII G018
Storage G009
MENS RESTROOM
SOLVENT STORAGE G102
Nutrients G031
Volatiles OFFICE G026
CERTIFICATION OFFICE GO24 QA/QC Office
ORGANIC CHEM ESPIII G017
Volatiles OFFICE G035
ORGANICS EXTRACTION G043
WALK-IN COOLER G028
NUTRIENTS G048
MECHANICAL ROOM STAIR WELL
PESTICIDES G047
SEMIVOLATILES G059
VOLATILES GO65
WET CHEMISTRY G066
ACID STORAGE G106
QA/QC Office G030
SHIPPING/RECEIVING
G004 Admin. Assistant Office
Chemistry Unit Supervisor ESII G031A
METALS DIGESTION G113
Office area G108
EXIT
MAIN ENTRANCE
Semivolatiles Office G031B
EXIT
WALK-IN COOLER G-035A
Date: June 30, 2015 Author: D. Satterwhite
Revision Author: N. Good Revision No: 01
Page 30 of 221
WET CHEMISTRY G066
EXIT
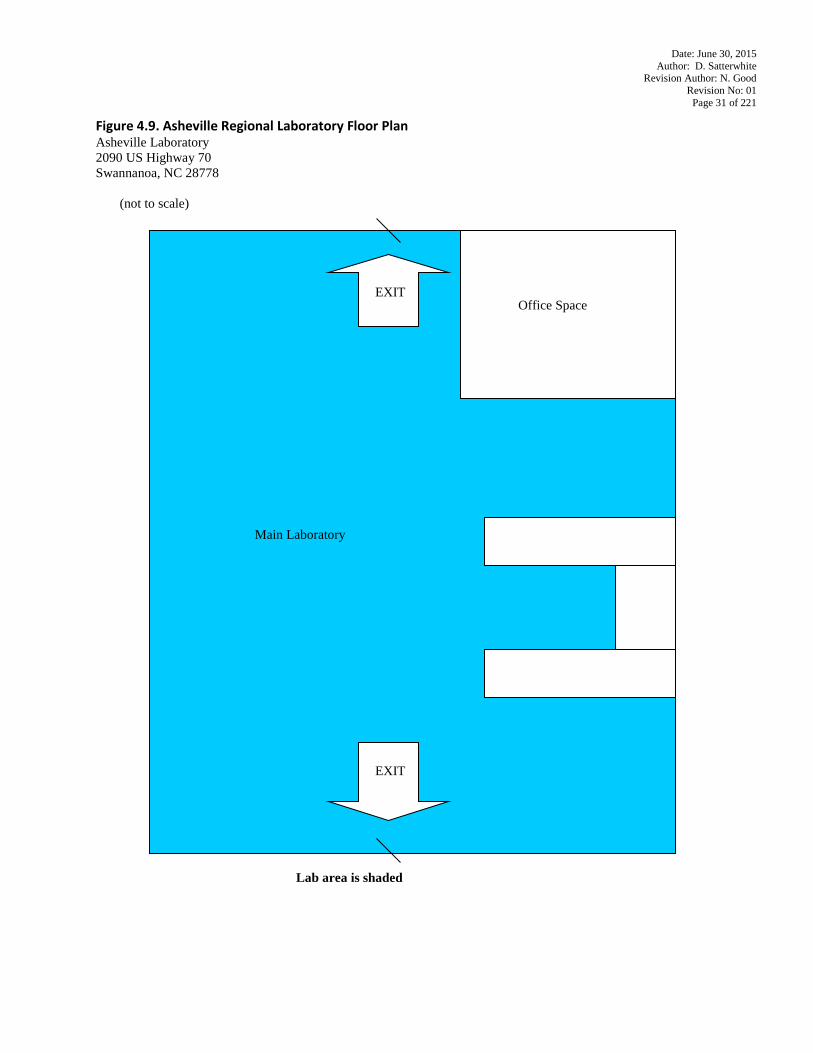
Date: June 30, 2015 Author: D. Satterwhite
Revision Author: N. Good Revision No: 01
Page 31 of 221
Figure 4.9. Asheville Regional Laboratory Floor Plan Asheville Laboratory 2090 US Highway 70 Swannanoa, NC 28778
(not to scale)
Lab area is shaded
Main Laboratory
EXIT
EXIT
Office Space
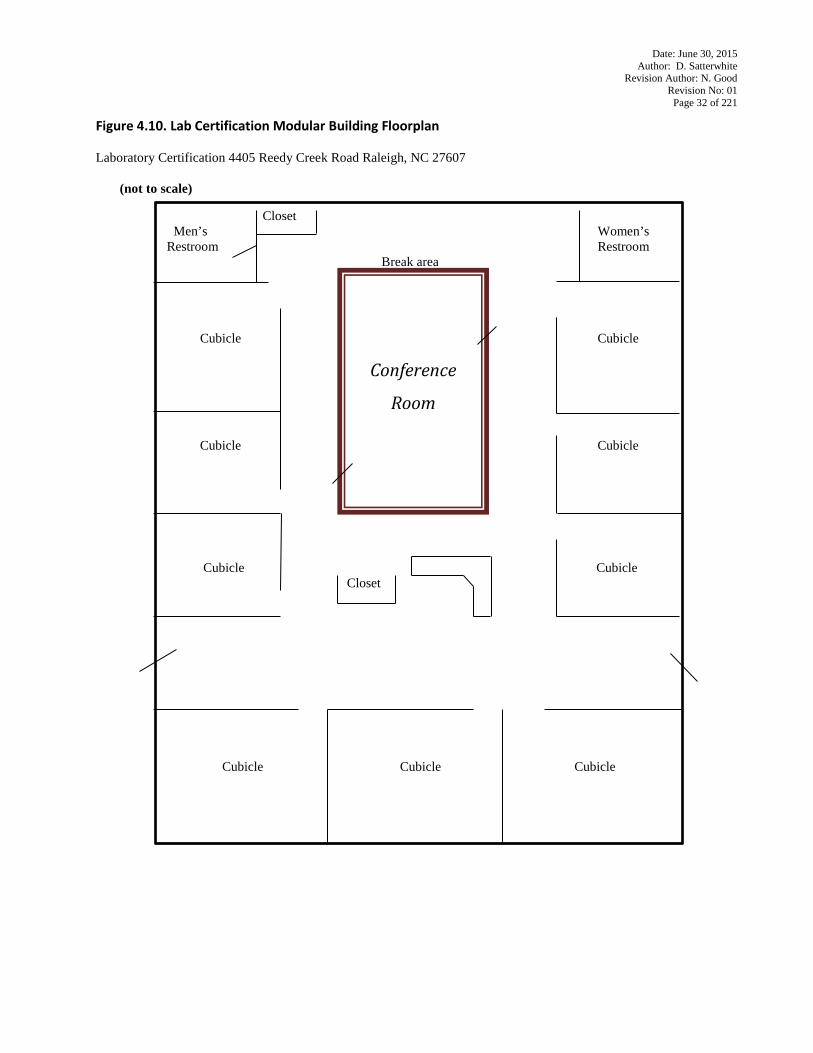
Date: June 30, 2015 Author: D. Satterwhite
Revision Author: N. Good Revision No: 01
Page 32 of 221
Figure 4.10. Lab Certification Modular Building Floorplan Laboratory Certification 4405 Reedy Creek Road Raleigh, NC 27607
(not to scale)
Closet Men’s Women’s Restroom Restroom Break area Cubicle Cubicle Cubicle Cubicle Cubicle Cubicle Closet
Cubicle Cubicle Cubicle
Conference
Room
Date: June 30, 2015 Author: D. Satterwhite
Revision Author: N. Good Revision No: 01
Page 33 of 221
5.0 QA Targets for Precision, Accuracy and MDLs/PQLs The DWR Water Sciences Section quality assurance objectives are described in terms of precision, accuracy, representativeness, and comparability. Criteria for data quality indicators such as matrix spikes, laboratory control samples and duplicate sample precision are specified in this section.
5.1 Quality Assurance Objectives
5.1.1 Precision The laboratory objective for precision is to meet the precision required by or demonstrated for the analytical methods on similar samples (i.e., limits generated from historical data) and to meet data for the analyses published by the US EPA or state regulatory requirements. Precision is defined as the degree of reproducibility of repetitive measurements under a given set of analytical conditions (exclusive of field sampling variability). It is the degree of mutual agreement among independent measurements as the result of repeated application of the same process under similar conditions. Precision is documented on the basis of replicate analysis, usually duplicate or matrix spike duplicate samples. Limits are based on historical data or in some cases default limits until enough data points are generated to calculate statistically valid in house limits. Limits are in some cases dictated by method.
5.1.2 Accuracy
The laboratory objective for accuracy is to meet the performance for accuracy required by or demonstrated for the analytical methods on similar samples (i.e., limits generated from historical data) and to meet the recovery data published by the US EPA or state regulatory requirements. Accuracy is defined as the degree agreement of a measured value with the true or expected value of the quantity of concern (per John K. Taylor, in Quality Assurance of Chemistry Measurements). It is a statistical measurement of correctness and includes components of random error (variability due to imprecision) and systematic error. It reflects the error associated with a measurement. A measurement is accurate when the value reported does not differ from the true value or known concentration of the spike or standard. Analytical accuracy is typically measured by determining the percent recovery of known target analytes that are spiked into a field sample (i.e., a surrogate or matrix spike) or reagent water (i.e., laboratory control sample or QC check sample). Surrogate compound recovery is reported and is used to assess method performance for each sample analyzed for volatile and semivolatile organic compounds. A statement of accuracy is expressed as an interval of acceptance recovery about the mean recovery. Limits are based on historical data or in some cases default limits until enough data points are generated to calculate statistically valid in house limits. Limits are in some cases dictated by method. Limits are in some cases also generated from historical data as compared to EPA CLP SOW guidelines.
5.1.3 Representativeness
The laboratory objective for representativeness is to provide data which is representative of the sampled medium. Representativeness is defined as the degree to which data represent a characteristic of a population or set of samples and is measurement of both analytical and field sampling precision. The representativeness of the analytical data is a function of the procedures used in procuring and processing the samples and subsequent sub samples. The representativeness can be documented by the relative percent difference between separately procured, but otherwise identical samples or sample aliquots.
5.1.4 Comparability The comparability objective is to provide analytical data for which the accuracy, precision, representativeness and reporting limits statistics are similar to these quality indicators generated by other laboratories for similar samples, and data generated by the Water Sciences Section Chemistry Laboratory over time.
Date: June 30, 2015 Author: D. Satterwhite
Revision Author: N. Good Revision No: 01
Page 34 of 221
The comparability objective is documented by inter-laboratory studies carried out by regulatory agencies or carried out for specific projects, by comparison of periodically generated statements of accuracy, precision and reporting limits with those of other laboratories and by the degree to which approval from the US EPA or other pertinent regulatory agencies is obtained for any procedure for which significant modifications have been made.
5.2 QA Targets Examples of analytes, preparative and analytical methods, matrices, accuracy and precision targets, MDLs and PQLs for analyses performed by the Water Sciences Section Chemistry Laboratories are presented in Tables 5.1 through 5.10. Unless otherwise noted, the limits in these tables are examples of laboratory generated limits. Some acceptability limits are derived from US EPA methods when they are provided. Where US EPA limits are not provided, the Water Sciences Section Chemistry Laboratories have adopted interim limits or developed limits from general laboratory practice or evaluation of data from similar matrices. Acceptability of QC will be determined as compared to these tables. Data may be accepted where QC falls outside these limits if probable cause can be attributed to the matrix and laboratory control samples show that the method is in control. Deviations are to be fully documented in the final report. In instances where a LCS limit is not available, a limit of 70-130% recovery is acceptable until in-house limits can be generated. In some cases, wider default limits may be set with the QA/QC Officer and ESPIII approval. In the absence of in-house or method-defined limits, the following guidelines may be used to determine interim limits for matrix spike and matrix spike/matrix spike duplicates:
MS 60-140% MS/MSD 20% RPD
Some criteria may need to be wider based on prior knowledge of the compound (e.g., phenols in EPA 8270D).
5.3 Statistically Derived Limits Statistically derived precision and accuracy limits are required by selected methods and programs. The Water Sciences Section will routinely utilize statistically derived and the lowest calibration standard concentration must be equivalent to the PQL, (based upon laboratory derived data) to evaluate method performance and determine when corrective action may be appropriate. These limits must be equal to or more restrictive than the limits specified in the referenced method. The laboratory may periodically update the limits. The analysts are instructed to use the current limits posted in the laboratory (dated and approved by the Quality Assurance Officer) and entered into a master log. The Quality Assurance Officer or each analytical unit maintains an archive of the limits used within the laboratory.
Where EPA acceptability criteria does not exist for a given method being utilized for the first time, the laboratories will establish control limits derived from a minimum of four data points. Until verified by a statistically significant data population, a reasonable interim value will be assigned and the control limits will be considered as advisory limits only and will not automatically initiate a corrective action if they are not met. Where in-house limits are generated, limits cannot be less stringent than method defined limits. Most stringent QC is adopted where methods are combined for analyses. Exceptions will be noted in the parameter analysis SOP.
5.4 Method Detection Limits
Method Detection Limits (MDLs) are set such that the constituent concentration, when processed through the complete method, produces a signal with a 99% probability that it is different from the blank. MDLs are determined using the method specified in the Federal Register, 40 CFR Part 136 Appendix B. MDLs are based on the latest MDL study available at the time this document was published and may be superseded by the results from new studies. MDLs are updated annually for some parameters (depending on method requirement), every other year for others or any time there is a significant change in laboratory operations, or instrument performance. Analysis may be spread out over a period of time or analyzed at one time.
Date: June 30, 2015 Author: D. Satterwhite
Revision Author: N. Good Revision No: 01
Page 35 of 221
MDL study is not required for the following analyses: BOD-CBOD, COD, TOC, Coliform (Total and fecal), Specific Conductivity, pH, Color and Solids,
5.5 Practical Quantitation Limits
The Practical Quantitation Limit (PQL) is defined as the lowest concentration that can be reliably achieved within specified limits of precision and accuracy during routine laboratory operating conditions. PQLs are subjectively set at some multiple of typical MDLs for reagent water (generally 3 to 10 times the MDL depending upon the parameter or analyte and based on the analyst’s best professional judgement, the quality and age of the instrument and the nature of the samples) rather than explicitly determined. PQLs may be nominally chosen within these guidelines to simplify data reporting and, where applicable, are generally equal to the concentration of the lowest non-zero standard in the calibration curve. PQLs are adjusted for sample size, dilution and % moisture. For parameters that are not amenable to MDL studies, the PQL may be defined by the sample volume and buret graduations for titrations or by minimum measurement values set by the method for method-defined parameters (e.g., BOD requires a minimum DO depletion of 2.0 mg/L, fecal coliform requires a minimum plate count of 20 cfu, total suspended residue requires a minimum weight gain of 2.5 mg, etc.). Additionally, some EPA methods prescribe Minimum Levels (MLs) and the lab may set the PQL equal to this method-stated ML. Determination of PQL is fully described in the laboratory’s analytical Standard Operating Procedure (SOP) document. Published PQLs may be set higher than experimentally determined PQLs3) at a concentration elevated to a level greater than 3 to 5 times the calculated MDL.to: 1) avoid observed positive interferences from matrix effects or common reagent contaminants, or 2) for reporting convenience (i.e., to group common compounds with similar but slightly different experimentally determined PQLs)
Values between the MDL and PQL are currently not reported; however, can be reported as required by a client; these values, when reported, are always reported with a qualifier code (N3). Additionally, non-detected analytes are always reported as less than the PQL.
Note: Qualifier Codes and their definitions are found in Appendix II. 5.6 QA Target Tables
The QA targets’ table list EXAMPLEs of each parameter’s QC acceptance criteria. Updated PQL limits are available at: Tables 5.1 thru 5.10 are ONLY EXAMPLEs of the online tables and should not be used for verification of accuracy.
Note that MDLs and PQLs for soil/sediment matrices are based on method-specific sample dry weights. Detection limits may vary from that published, due to moisture content, dilution effects, interferences, special reporting requirements, etc. The QA targets for most inorganic analyses are within the range of 90 - 110 % for accuracy for aqueous samples, unless other limits are stated in the method. For inorganic matrix spiked duplicates (MSD) the acceptable precision limit is <20% RPD, unless laboratory-generated data indicate that tighter control limits can be met. Exceptions would be for solid samples due to complex matrices and low level standards at the PQL is (75%-125%), unless other limits are stated in the method or historical data indicates these limits cannot be met based on calculated control limits. The organic QA target are statutory in nature; warning and control limits for organic analyses are initially set for groups of compounds based on preliminary method validation data or in some cases default limits until enough data points are generated to calculate statistically valid in house limits. When additional data is available, the QA targets may be reconsidered. QA targets are routinely re-evaluated at least annually and generally semi-annually and updated if necessary against laboratory generated data. In some cases they may be compared to EPA CLP SOW to insure targets continue to reflect realistic methodologically achievable goals.
Date: June 30, 2015 Author: D. Satterwhite
Revision Author: N. Good Revision No: 01
Page 36 of 221
Each table in this section is formatted in the same way and the following conventions apply to all of them:
• Matrices are denoted as follows: W: surface, ground and waste water S: soil, sediment, solid
T: tissue • Acronyms used in the method citations are: • EPA refers to methods published in Methods for Chemical Analysis of Water and Wastes, EPA 600/4-79-020,
March 1983, 40 CFR Part 136, Appendices A-D and Test Methods for Evaluating Solid Waste: Physical/Chemical Methods, SW-846 (3P
rdP Edition) as amended by Updates I, II, IIA, III and IV.
• SM## refers to methods published in Standard Methods for the Examination of Water and Wastewater, APHA. Each citation is followed by year of approval by Standard Methods Committee. For example, SM5210B – 2001; SM5210 is the method and 2001 refers to the accepted year of approval by the Standard Methods Committee for a method.
• ASTM refers to methods published in the Annual Book of ASTM standards, Vols. 11.01 and 11.02, 1999 (2012),(2014)
• HACH refers to methods published in Hach Water Analysis Handbook, 3P
rdP (5P
thP Edition) Edition, Hach Company
Loveland, CO, 1997 (2012). • QuikChem refers to methods published by Lachat Instruments, Milwaukee, WI. • USGS refers to Methods for Analysis of Inorganic Substances in Water and Fluvial Sediments, U.S. Department
of the Interior, Techniques of Water-Resource Investigation of the U.S. Geological Survey, Denver, CO, Revised 1989.
• Modified methods are designated with an "M" after the method number.
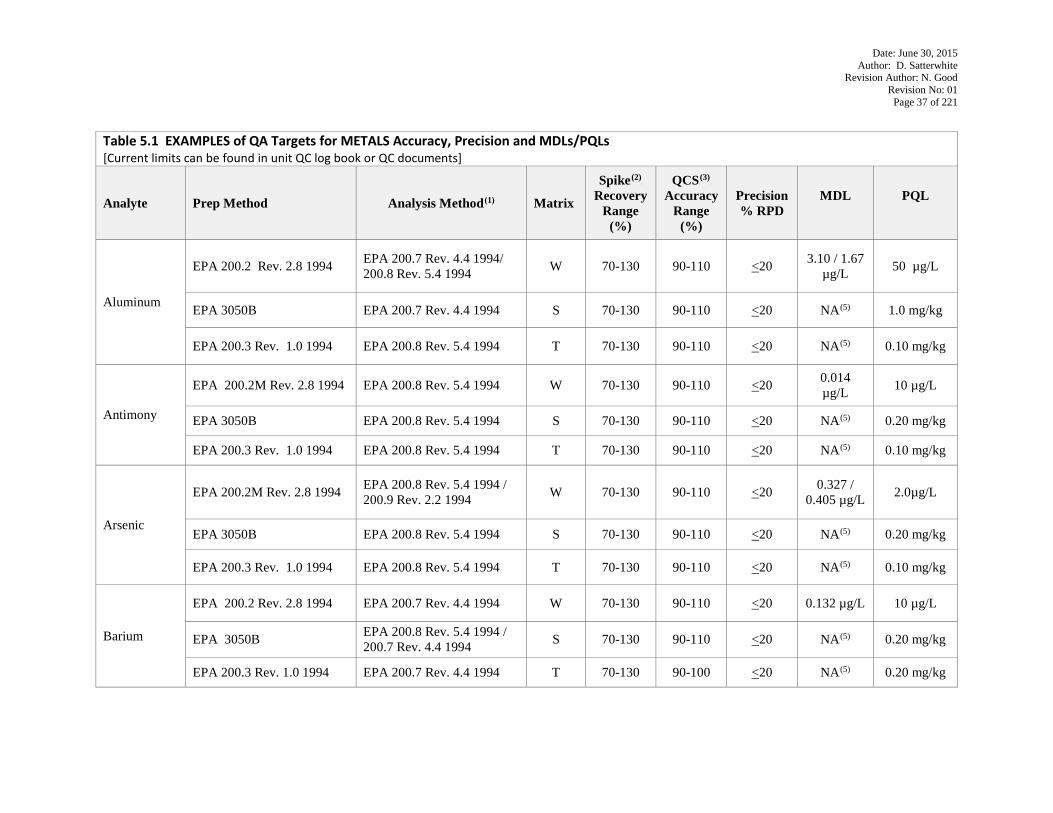
Date: June 30, 2015 Author: D. Satterwhite
Revision Author: N. Good Revision No: 01
Page 37 of 221
Table 5.1 EXAMPLES of QA Targets for METALS Accuracy, Precision and MDLs/PQLs [Current limits can be found in unit QC log book or QC documents]
Analyte Prep Method Analysis MethodP
(1) Matrix
SpikeP
(2)P
Recovery Range
(%)
QCSP
(3)P
Accuracy Range
(%)
Precision % RPD
MDL
PQL
Aluminum
EPA 200.2 Rev. 2.8 1994 EPA 200.7 Rev. 4.4 1994/ 200.8 Rev. 5.4 1994 W 70-130 90-110 <20 3.10 / 1.67
µg/L 50 µg/L
EPA 3050B EPA 200.7 Rev. 4.4 1994 S 70-130 90-110 <20 NAP
(5) 1.0 mg/kg
EPA 200.3 Rev. 1.0 1994 EPA 200.8 Rev. 5.4 1994 T 70-130 90-110 <20 NAP
(5) 0.10 mg/kg
Antimony
EPA 200.2M Rev. 2.8 1994 EPA 200.8 Rev. 5.4 1994 W 70-130 90-110 <20 0.014 µg/L 10 µg/L
EPA 3050B EPA 200.8 Rev. 5.4 1994 S 70-130 90-110 <20 NAP
(5) 0.20 mg/kg
EPA 200.3 Rev. 1.0 1994 EPA 200.8 Rev. 5.4 1994 T 70-130 90-110 <20 NAP
(5) 0.10 mg/kg
Arsenic
EPA 200.2M Rev. 2.8 1994 EPA 200.8 Rev. 5.4 1994 / 200.9 Rev. 2.2 1994 W 70-130 90-110 <20 0.327 /
0.405 µg/L 2.0µg/L
EPA 3050B EPA 200.8 Rev. 5.4 1994 S 70-130 90-110 <20 NAP
(5) 0.20 mg/kg
EPA 200.3 Rev. 1.0 1994 EPA 200.8 Rev. 5.4 1994 T 70-130 90-110 <20 NAP
(5) 0.10 mg/kg
Barium
EPA 200.2 Rev. 2.8 1994 EPA 200.7 Rev. 4.4 1994 W 70-130 90-110 <20 0.132 µg/L 10 µg/L
EPA 3050B EPA 200.8 Rev. 5.4 1994 / 200.7 Rev. 4.4 1994 S 70-130 90-110 <20 NAP
(5) 0.20 mg/kg
EPA 200.3 Rev. 1.0 1994 EPA 200.7 Rev. 4.4 1994 T 70-130 90-100 <20 NAP
(5) 0.20 mg/kg
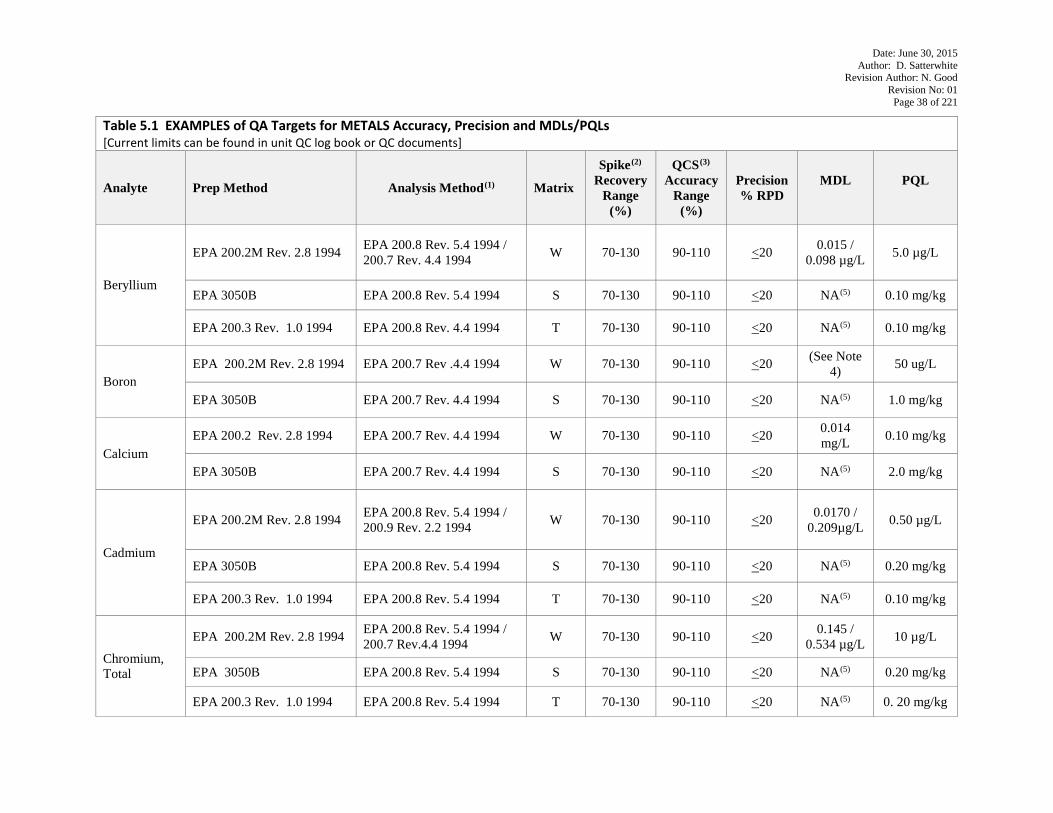
Date: June 30, 2015 Author: D. Satterwhite
Revision Author: N. Good Revision No: 01
Page 38 of 221
Table 5.1 EXAMPLES of QA Targets for METALS Accuracy, Precision and MDLs/PQLs [Current limits can be found in unit QC log book or QC documents]
Analyte Prep Method Analysis MethodP
(1) Matrix
SpikeP
(2)P
Recovery Range
(%)
QCSP
(3)P
Accuracy Range
(%)
Precision % RPD
MDL
PQL
Beryllium
EPA 200.2M Rev. 2.8 1994 EPA 200.8 Rev. 5.4 1994 / 200.7 Rev. 4.4 1994 W 70-130 90-110 <20 0.015 /
0.098 µg/L 5.0 µg/L
EPA 3050B EPA 200.8 Rev. 5.4 1994 S 70-130 90-110 <20 NAP
(5) 0.10 mg/kg
EPA 200.3 Rev. 1.0 1994 EPA 200.8 Rev. 4.4 1994 T 70-130 90-110 <20 NAP
(5) 0.10 mg/kg
Boron EPA 200.2M Rev. 2.8 1994 EPA 200.7 Rev .4.4 1994 W 70-130 90-110 <20 (See Note
4) 50 ug/L
EPA 3050B EPA 200.7 Rev. 4.4 1994 S 70-130 90-110 <20 NAP
(5) 1.0 mg/kg
Calcium EPA 200.2 Rev. 2.8 1994 EPA 200.7 Rev. 4.4 1994 W 70-130 90-110 <20 0.014
mg/L 0.10 mg/kg
EPA 3050B EPA 200.7 Rev. 4.4 1994 S 70-130 90-110 <20 NAP
(5) 2.0 mg/kg
Cadmium
EPA 200.2M Rev. 2.8 1994 EPA 200.8 Rev. 5.4 1994 / 200.9 Rev. 2.2 1994 W 70-130 90-110 <20 0.0170 /
0.209µg/L 0.50 µg/L
EPA 3050B EPA 200.8 Rev. 5.4 1994 S 70-130 90-110 <20 NAP
(5) 0.20 mg/kg
EPA 200.3 Rev. 1.0 1994 EPA 200.8 Rev. 5.4 1994 T 70-130 90-110 <20 NAP
(5) 0.10 mg/kg
Chromium, Total
EPA 200.2M Rev. 2.8 1994 EPA 200.8 Rev. 5.4 1994 / 200.7 Rev.4.4 1994 W 70-130 90-110 <20 0.145 /
0.534 µg/L 10 µg/L
EPA 3050B EPA 200.8 Rev. 5.4 1994 S 70-130 90-110 <20 NAP
(5) 0.20 mg/kg
EPA 200.3 Rev. 1.0 1994 EPA 200.8 Rev. 5.4 1994 T 70-130 90-110 <20 NAP
(5) 0. 20 mg/kg
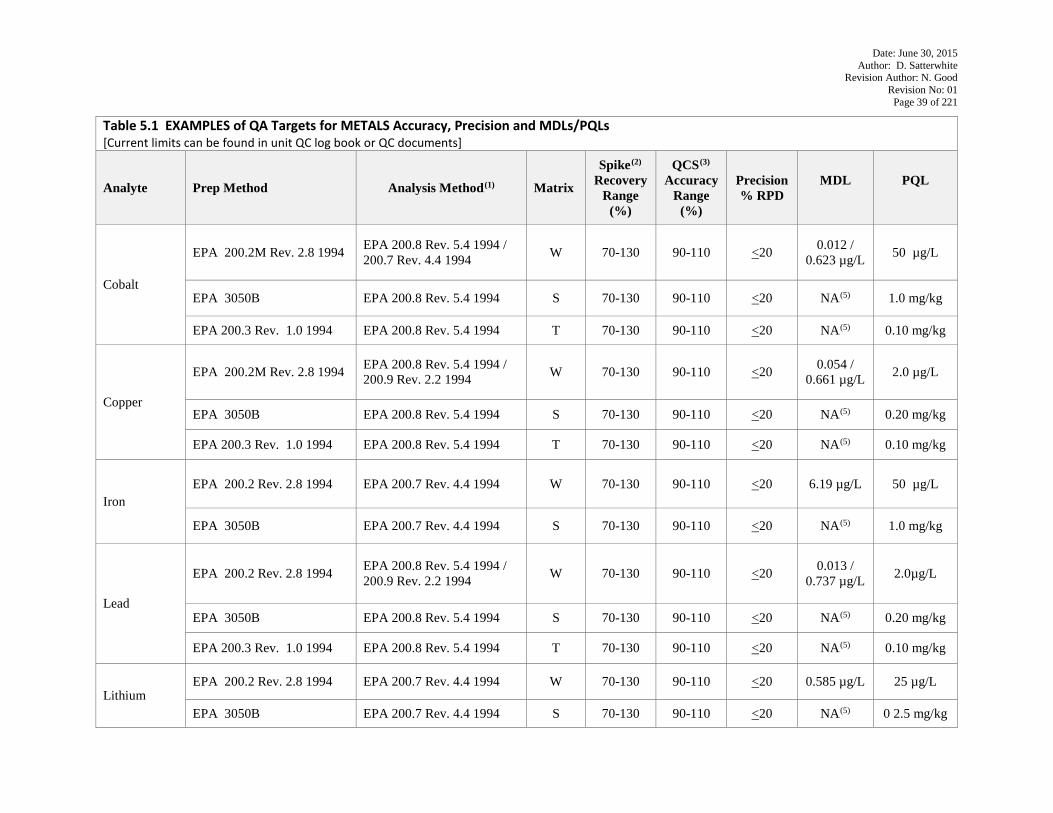
Date: June 30, 2015 Author: D. Satterwhite
Revision Author: N. Good Revision No: 01
Page 39 of 221
Table 5.1 EXAMPLES of QA Targets for METALS Accuracy, Precision and MDLs/PQLs [Current limits can be found in unit QC log book or QC documents]
Analyte Prep Method Analysis MethodP
(1) Matrix
SpikeP
(2)P
Recovery Range
(%)
QCSP
(3)P
Accuracy Range
(%)
Precision % RPD
MDL
PQL
Cobalt
EPA 200.2M Rev. 2.8 1994 EPA 200.8 Rev. 5.4 1994 / 200.7 Rev. 4.4 1994 W 70-130 90-110 <20 0.012 /
0.623 µg/L 50 µg/L
EPA 3050B EPA 200.8 Rev. 5.4 1994 S 70-130 90-110 <20 NAP
(5) 1.0 mg/kg
EPA 200.3 Rev. 1.0 1994 EPA 200.8 Rev. 5.4 1994 T 70-130 90-110 <20 NAP
(5) 0.10 mg/kg
Copper
EPA 200.2M Rev. 2.8 1994 EPA 200.8 Rev. 5.4 1994 / 200.9 Rev. 2.2 1994 W 70-130 90-110 <20 0.054 /
0.661 µg/L 2.0 µg/L
EPA 3050B EPA 200.8 Rev. 5.4 1994 S 70-130 90-110 <20 NAP
(5) 0.20 mg/kg
EPA 200.3 Rev. 1.0 1994 EPA 200.8 Rev. 5.4 1994 T 70-130 90-110 <20 NAP
(5) 0.10 mg/kg
Iron EPA 200.2 Rev. 2.8 1994 EPA 200.7 Rev. 4.4 1994 W 70-130 90-110 <20 6.19 µg/L 50 µg/L
EPA 3050B EPA 200.7 Rev. 4.4 1994 S 70-130 90-110 <20 NAP
(5) 1.0 mg/kg
Lead
EPA 200.2 Rev. 2.8 1994 EPA 200.8 Rev. 5.4 1994 / 200.9 Rev. 2.2 1994 W 70-130 90-110 <20 0.013 /
0.737 µg/L 2.0µg/L
EPA 3050B EPA 200.8 Rev. 5.4 1994 S 70-130 90-110 <20 NAP
(5) 0.20 mg/kg
EPA 200.3 Rev. 1.0 1994 EPA 200.8 Rev. 5.4 1994 T 70-130 90-110 <20 NAP
(5) 0.10 mg/kg
Lithium EPA 200.2 Rev. 2.8 1994 EPA 200.7 Rev. 4.4 1994 W 70-130 90-110 <20 0.585 µg/L 25 µg/L
EPA 3050B EPA 200.7 Rev. 4.4 1994 S 70-130 90-110 <20 NAP
(5) 0 2.5 mg/kg
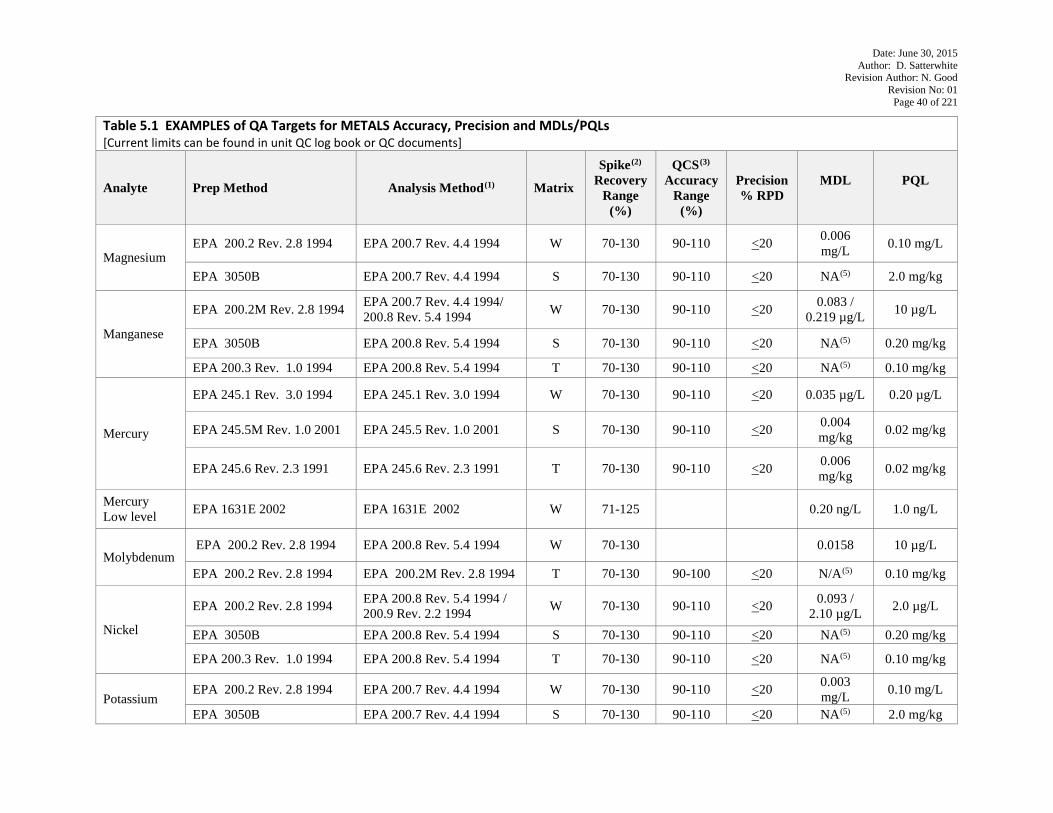
Date: June 30, 2015 Author: D. Satterwhite
Revision Author: N. Good Revision No: 01
Page 40 of 221
Table 5.1 EXAMPLES of QA Targets for METALS Accuracy, Precision and MDLs/PQLs [Current limits can be found in unit QC log book or QC documents]
Analyte Prep Method Analysis MethodP
(1) Matrix
SpikeP
(2)P
Recovery Range
(%)
QCSP
(3)P
Accuracy Range
(%)
Precision % RPD
MDL
PQL
Magnesium EPA 200.2 Rev. 2.8 1994 EPA 200.7 Rev. 4.4 1994 W 70-130 90-110 <20 0.006
mg/L 0.10 mg/L
EPA 3050B EPA 200.7 Rev. 4.4 1994 S 70-130 90-110 <20 NAP
(5) 2.0 mg/kg
Manganese
EPA 200.2M Rev. 2.8 1994 EPA 200.7 Rev. 4.4 1994/ 200.8 Rev. 5.4 1994 W 70-130 90-110 <20 0.083 /
0.219 µg/L 10 µg/L
EPA 3050B EPA 200.8 Rev. 5.4 1994 S 70-130 90-110 <20 NAP
(5) 0.20 mg/kg
EPA 200.3 Rev. 1.0 1994 EPA 200.8 Rev. 5.4 1994 T 70-130 90-110 <20 NAP
(5) 0.10 mg/kg
Mercury
EPA 245.1 Rev. 3.0 1994 EPA 245.1 Rev. 3.0 1994 W 70-130 90-110 <20 0.035 µg/L 0.20 µg/L
EPA 245.5M Rev. 1.0 2001 EPA 245.5 Rev. 1.0 2001 S 70-130 90-110 <20 0.004 mg/kg 0.02 mg/kg
EPA 245.6 Rev. 2.3 1991 EPA 245.6 Rev. 2.3 1991 T 70-130 90-110 <20 0.006 mg/kg 0.02 mg/kg
Mercury Low level EPA 1631E 2002 EPA 1631E 2002 W 71-125 0.20 ng/L 1.0 ng/L
Molybdenum EPA 200.2 Rev. 2.8 1994 EPA 200.8 Rev. 5.4 1994 W 70-130 0.0158 10 µg/L
EPA 200.2 Rev. 2.8 1994 EPA 200.2M Rev. 2.8 1994 T 70-130 90-100 <20 N/AP
(5) 0.10 mg/kg
Nickel
EPA 200.2 Rev. 2.8 1994 EPA 200.8 Rev. 5.4 1994 / 200.9 Rev. 2.2 1994 W 70-130 90-110 <20 0.093 /
2.10 µg/L 2.0 µg/L
EPA 3050B EPA 200.8 Rev. 5.4 1994 S 70-130 90-110 <20 NAP
(5) 0.20 mg/kg
EPA 200.3 Rev. 1.0 1994 EPA 200.8 Rev. 5.4 1994 T 70-130 90-110 <20 NAP
(5) 0.10 mg/kg
Potassium EPA 200.2 Rev. 2.8 1994 EPA 200.7 Rev. 4.4 1994 W 70-130 90-110 <20 0.003
mg/L 0.10 mg/L
EPA 3050B EPA 200.7 Rev. 4.4 1994 S 70-130 90-110 <20 NAP
(5) 2.0 mg/kg
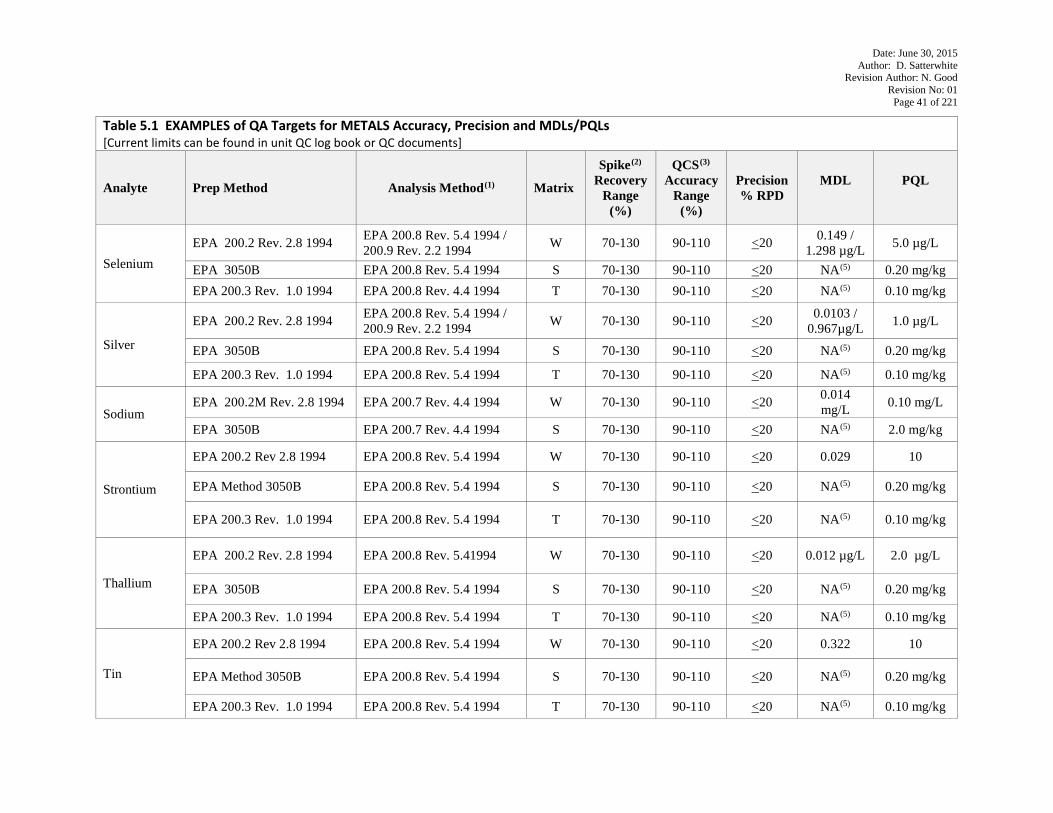
Date: June 30, 2015 Author: D. Satterwhite
Revision Author: N. Good Revision No: 01
Page 41 of 221
Table 5.1 EXAMPLES of QA Targets for METALS Accuracy, Precision and MDLs/PQLs [Current limits can be found in unit QC log book or QC documents]
Analyte Prep Method Analysis MethodP
(1) Matrix
SpikeP
(2)P
Recovery Range
(%)
QCSP
(3)P
Accuracy Range
(%)
Precision % RPD
MDL
PQL
Selenium EPA 200.2 Rev. 2.8 1994 EPA 200.8 Rev. 5.4 1994 /
200.9 Rev. 2.2 1994 W 70-130 90-110 <20 0.149 / 1.298 µg/L 5.0 µg/L
EPA 3050B EPA 200.8 Rev. 5.4 1994 S 70-130 90-110 <20 NAP
(5) 0.20 mg/kg EPA 200.3 Rev. 1.0 1994 EPA 200.8 Rev. 4.4 1994 T 70-130 90-110 <20 NAP
(5) 0.10 mg/kg
Silver
EPA 200.2 Rev. 2.8 1994 EPA 200.8 Rev. 5.4 1994 / 200.9 Rev. 2.2 1994 W 70-130 90-110 <20 0.0103 /
0.967µg/L 1.0 µg/L
EPA 3050B EPA 200.8 Rev. 5.4 1994 S 70-130 90-110 <20 NAP
(5) 0.20 mg/kg
EPA 200.3 Rev. 1.0 1994 EPA 200.8 Rev. 5.4 1994 T 70-130 90-110 <20 NAP
(5) 0.10 mg/kg
Sodium EPA 200.2M Rev. 2.8 1994 EPA 200.7 Rev. 4.4 1994 W 70-130 90-110 <20 0.014
mg/L 0.10 mg/L
EPA 3050B EPA 200.7 Rev. 4.4 1994 S 70-130 90-110 <20 NAP
(5) 2.0 mg/kg
Strontium
EPA 200.2 Rev 2.8 1994 EPA 200.8 Rev. 5.4 1994 W 70-130 90-110 <20 0.029 10
EPA Method 3050B EPA 200.8 Rev. 5.4 1994 S 70-130 90-110 <20 NAP
(5) 0.20 mg/kg
EPA 200.3 Rev. 1.0 1994 EPA 200.8 Rev. 5.4 1994 T 70-130 90-110 <20 NAP
(5) 0.10 mg/kg
Thallium
EPA 200.2 Rev. 2.8 1994 EPA 200.8 Rev. 5.41994 W 70-130 90-110 <20 0.012 µg/L 2.0 µg/L
EPA 3050B EPA 200.8 Rev. 5.4 1994 S 70-130 90-110 <20 NAP
(5) 0.20 mg/kg
EPA 200.3 Rev. 1.0 1994 EPA 200.8 Rev. 5.4 1994 T 70-130 90-110 <20 NAP
(5) 0.10 mg/kg
Tin
EPA 200.2 Rev 2.8 1994 EPA 200.8 Rev. 5.4 1994 W 70-130 90-110 <20 0.322 10
EPA Method 3050B EPA 200.8 Rev. 5.4 1994 S 70-130 90-110 <20 NAP
(5) 0.20 mg/kg
EPA 200.3 Rev. 1.0 1994 EPA 200.8 Rev. 5.4 1994 T 70-130 90-110 <20 NAP
(5) 0.10 mg/kg
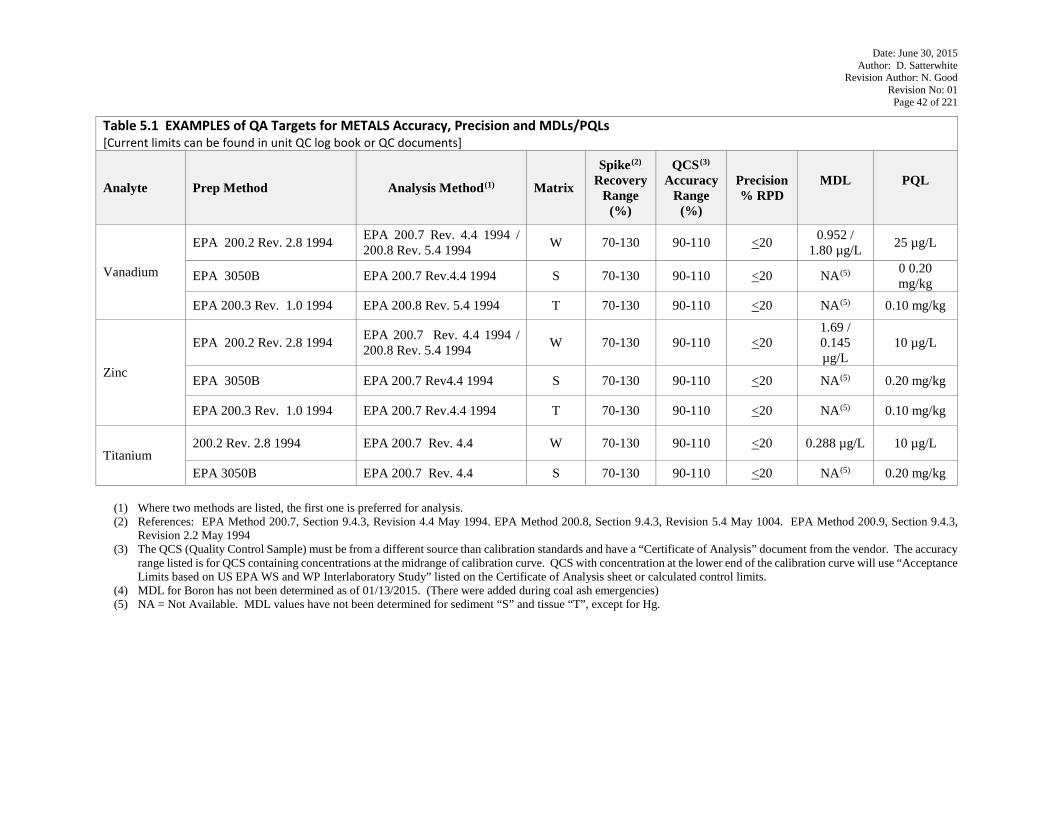
Date: June 30, 2015 Author: D. Satterwhite
Revision Author: N. Good Revision No: 01
Page 42 of 221
Table 5.1 EXAMPLES of QA Targets for METALS Accuracy, Precision and MDLs/PQLs [Current limits can be found in unit QC log book or QC documents]
Analyte Prep Method Analysis MethodP
(1) Matrix
SpikeP
(2)P
Recovery Range
(%)
QCSP
(3)P
Accuracy Range
(%)
Precision % RPD
MDL
PQL
Vanadium
EPA 200.2 Rev. 2.8 1994 EPA 200.7 Rev. 4.4 1994 / 200.8 Rev. 5.4 1994 W 70-130 90-110 <20 0.952 /
1.80 µg/L 25 µg/L
EPA 3050B EPA 200.7 Rev.4.4 1994 S 70-130 90-110 <20 NAP
(5) 0 0.20 mg/kg
EPA 200.3 Rev. 1.0 1994 EPA 200.8 Rev. 5.4 1994 T 70-130 90-110 <20 NAP
(5) 0.10 mg/kg
Zinc
EPA 200.2 Rev. 2.8 1994 EPA 200.7 Rev. 4.4 1994 / 200.8 Rev. 5.4 1994 W 70-130 90-110 <20
1.69 / 0.145 µg/L
10 µg/L
EPA 3050B EPA 200.7 Rev4.4 1994 S 70-130 90-110 <20 NAP
(5) 0.20 mg/kg
EPA 200.3 Rev. 1.0 1994 EPA 200.7 Rev.4.4 1994 T 70-130 90-110 <20 NAP
(5) 0.10 mg/kg
Titanium 200.2 Rev. 2.8 1994 EPA 200.7 Rev. 4.4 W 70-130 90-110 <20 0.288 µg/L 10 µg/L
EPA 3050B EPA 200.7 Rev. 4.4 S 70-130 90-110 <20 NAP
(5) 0.20 mg/kg
(1) Where two methods are listed, the first one is preferred for analysis. (2) References: EPA Method 200.7, Section 9.4.3, Revision 4.4 May 1994. EPA Method 200.8, Section 9.4.3, Revision 5.4 May 1004. EPA Method 200.9, Section 9.4.3,
Revision 2.2 May 1994 (3) The QCS (Quality Control Sample) must be from a different source than calibration standards and have a “Certificate of Analysis” document from the vendor. The accuracy
range listed is for QCS containing concentrations at the midrange of calibration curve. QCS with concentration at the lower end of the calibration curve will use “Acceptance Limits based on US EPA WS and WP Interlaboratory Study” listed on the Certificate of Analysis sheet or calculated control limits.
(4) MDL for Boron has not been determined as of 01/13/2015. (There were added during coal ash emergencies) (5) NA = Not Available. MDL values have not been determined for sediment “S” and tissue “T”, except for Hg.
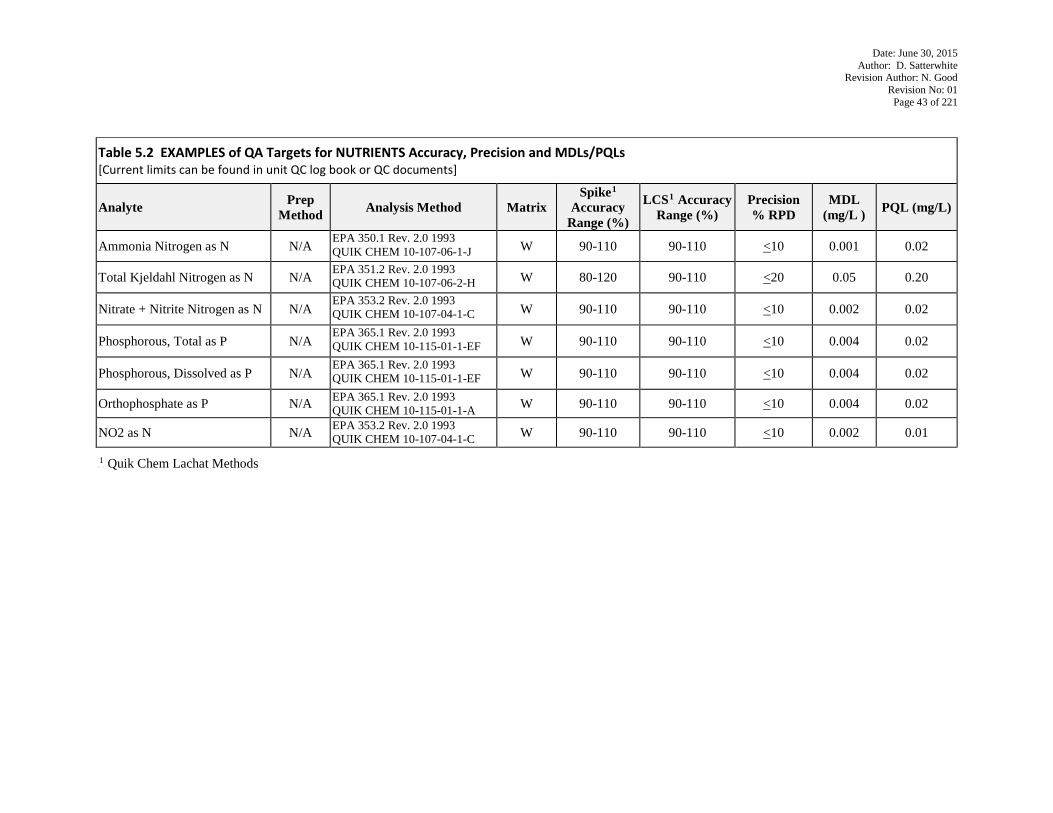
Date: June 30, 2015 Author: D. Satterwhite
Revision Author: N. Good Revision No: 01
Page 43 of 221
Table 5.2 EXAMPLES of QA Targets for NUTRIENTS Accuracy, Precision and MDLs/PQLs [Current limits can be found in unit QC log book or QC documents]
Analyte Prep Method Analysis Method Matrix
SpikeP
1
Accuracy Range (%)
LCSP
1P Accuracy
Range (%) Precision % RPD
MDL (mg/L ) PQL (mg/L)
Ammonia Nitrogen as N N/A EPA 350.1 Rev. 2.0 1993 QUIK CHEM 10-107-06-1-J W 90-110 90-110 <10 0.001 0.02
Total Kjeldahl Nitrogen as N N/A EPA 351.2 Rev. 2.0 1993 QUIK CHEM 10-107-06-2-H W 80-120 90-110 <20 0.05 0.20
Nitrate + Nitrite Nitrogen as N N/A EPA 353.2 Rev. 2.0 1993 QUIK CHEM 10-107-04-1-C W 90-110 90-110 <10 0.002 0.02
Phosphorous, Total as P N/A EPA 365.1 Rev. 2.0 1993 QUIK CHEM 10-115-01-1-EF W 90-110 90-110 <10 0.004 0.02
Phosphorous, Dissolved as P N/A EPA 365.1 Rev. 2.0 1993 QUIK CHEM 10-115-01-1-EF W 90-110 90-110 <10 0.004 0.02
Orthophosphate as P N/A EPA 365.1 Rev. 2.0 1993 QUIK CHEM 10-115-01-1-A W 90-110 90-110 <10 0.004 0.02
NO2 as N N/A EPA 353.2 Rev. 2.0 1993 QUIK CHEM 10-107-04-1-C W 90-110 90-110 <10 0.002 0.01
P
1P Quik Chem Lachat Methods
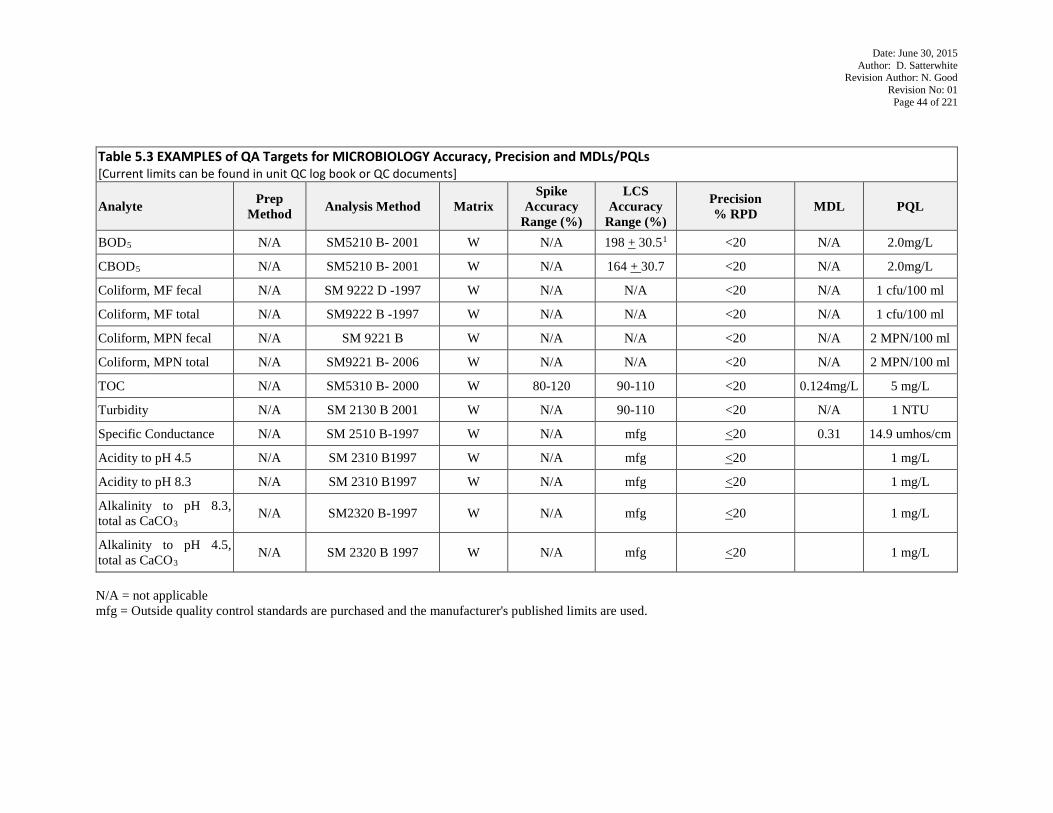
Date: June 30, 2015 Author: D. Satterwhite
Revision Author: N. Good Revision No: 01
Page 44 of 221
Table 5.3 EXAMPLES of QA Targets for MICROBIOLOGY Accuracy, Precision and MDLs/PQLs [Current limits can be found in unit QC log book or QC documents]
Analyte Prep Method Analysis Method Matrix
Spike Accuracy
Range (%)
LCS Accuracy
Range (%)
Precision % RPD MDL PQL
BODR5 N/A SM5210 B- 2001 W N/A 198 + 30.5P
1 <20 N/A 2.0mg/L
CBODR5 N/A SM5210 B- 2001 W N/A 164 + 30.7 <20 N/A 2.0mg/L
Coliform, MF fecal N/A SM 9222 D -1997 W N/A N/A <20 N/A 1 cfu/100 ml
Coliform, MF total N/A SM9222 B -1997 W N/A N/A <20 N/A 1 cfu/100 ml
Coliform, MPN fecal N/A SM 9221 B W N/A N/A <20 N/A 2 MPN/100 ml
Coliform, MPN total N/A SM9221 B- 2006 W N/A N/A <20 N/A 2 MPN/100 ml
TOC N/A SM5310 B- 2000 W 80-120 90-110 <20 0.124mg/L 5 mg/L
Turbidity N/A SM 2130 B 2001 W N/A 90-110 <20 N/A 1 NTU
Specific Conductance N/A SM 2510 B-1997 W N/A mfg <20 0.31 14.9 umhos/cm
Acidity to pH 4.5 N/A SM 2310 B1997 W N/A mfg <20 1 mg/L
Acidity to pH 8.3 N/A SM 2310 B1997 W N/A mfg <20 1 mg/L
Alkalinity to pH 8.3, total as CaCOR3
N/A SM2320 B-1997 W N/A mfg <20 1 mg/L
Alkalinity to pH 4.5, total as CaCOR3
N/A SM 2320 B 1997 W N/A mfg <20 1 mg/L
N/A = not applicable mfg = Outside quality control standards are purchased and the manufacturer's published limits are used.
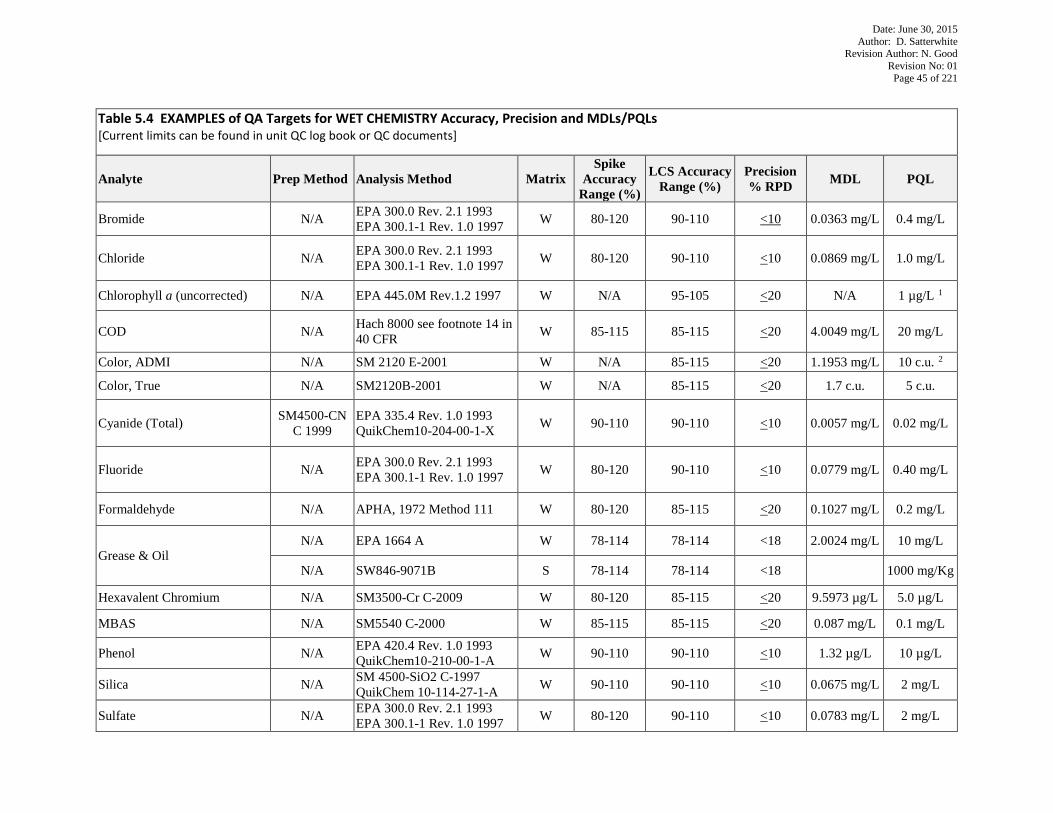
Date: June 30, 2015 Author: D. Satterwhite
Revision Author: N. Good Revision No: 01
Page 45 of 221
Table 5.4 EXAMPLES of QA Targets for WET CHEMISTRY Accuracy, Precision and MDLs/PQLs [Current limits can be found in unit QC log book or QC documents]
Analyte Prep Method Analysis Method Matrix Spike
Accuracy Range (%)
LCS Accuracy Range (%)
Precision % RPD MDL PQL
Bromide N/A EPA 300.0 Rev. 2.1 1993 EPA 300.1-1 Rev. 1.0 1997 W 80-120 90-110 <10 0.0363 mg/L 0.4 mg/L
Chloride N/A EPA 300.0 Rev. 2.1 1993 EPA 300.1-1 Rev. 1.0 1997 W 80-120 90-110 <10 0.0869 mg/L 1.0 mg/L
Chlorophyll a (uncorrected) N/A EPA 445.0M Rev.1.2 1997 W N/A 95-105 <20 N/A 1 µg/L P
1
COD N/A Hach 8000 see footnote 14 in 40 CFR W 85-115 85-115 <20 4.0049 mg/L 20 mg/L
Color, ADMI N/A SM 2120 E-2001 W N/A 85-115 <20 1.1953 mg/L 10 c.u. P
2
Color, True N/A SM2120B-2001 W N/A 85-115 <20 1.7 c.u. 5 c.u.
Cyanide (Total) SM4500-CN C 1999
EPA 335.4 Rev. 1.0 1993 QuikChem10-204-00-1-X W 90-110 90-110 <10 0.0057 mg/L 0.02 mg/L
Fluoride N/A EPA 300.0 Rev. 2.1 1993 EPA 300.1-1 Rev. 1.0 1997 W 80-120 90-110 <10 0.0779 mg/L 0.40 mg/L
Formaldehyde N/A APHA, 1972 Method 111 W 80-120 85-115 <20 0.1027 mg/L 0.2 mg/L
Grease & Oil N/A EPA 1664 A W 78-114 78-114 <18 2.0024 mg/L 10 mg/L
N/A SW846-9071B S 78-114 78-114 <18 1000 mg/Kg
Hexavalent Chromium N/A SM3500-Cr C-2009 W 80-120 85-115 <20 9.5973 µg/L 5.0 µg/L
MBAS N/A SM5540 C-2000 W 85-115 85-115 <20 0.087 mg/L 0.1 mg/L
Phenol N/A EPA 420.4 Rev. 1.0 1993 QuikChem10-210-00-1-A W 90-110 90-110 <10 1.32 µg/L 10 µg/L
Silica N/A SM 4500-SiO2 C-1997 QuikChem 10-114-27-1-A W 90-110 90-110 <10 0.0675 mg/L 2 mg/L
Sulfate N/A EPA 300.0 Rev. 2.1 1993 EPA 300.1-1 Rev. 1.0 1997 W 80-120 90-110 <10 0.0783 mg/L 2 mg/L
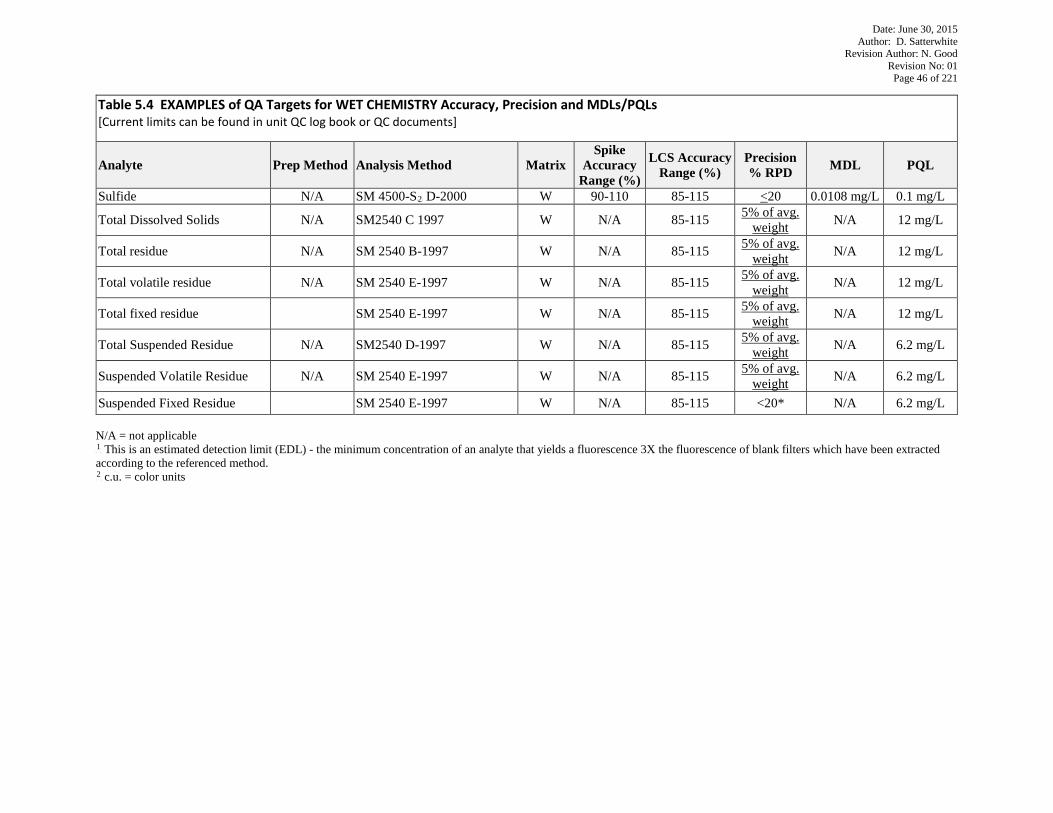
Date: June 30, 2015 Author: D. Satterwhite
Revision Author: N. Good Revision No: 01
Page 46 of 221
Table 5.4 EXAMPLES of QA Targets for WET CHEMISTRY Accuracy, Precision and MDLs/PQLs [Current limits can be found in unit QC log book or QC documents]
Analyte Prep Method Analysis Method Matrix Spike
Accuracy Range (%)
LCS Accuracy Range (%)
Precision % RPD MDL PQL
Sulfide N/A SM 4500-SR2R D-2000 W 90-110 85-115 <20 0.0108 mg/L 0.1 mg/L
Total Dissolved Solids N/A SM2540 C 1997 W N/A 85-115 5% of avg. weight N/A 12 mg/L
Total residue N/A SM 2540 B-1997 W N/A 85-115 5% of avg. weight N/A 12 mg/L
Total volatile residue N/A SM 2540 E-1997 W N/A 85-115 5% of avg. weight N/A 12 mg/L
Total fixed residue SM 2540 E-1997 W N/A 85-115 5% of avg. weight N/A 12 mg/L
Total Suspended Residue N/A SM2540 D-1997 W N/A 85-115 5% of avg. weight N/A 6.2 mg/L
Suspended Volatile Residue N/A SM 2540 E-1997 W N/A 85-115 5% of avg. weight N/A 6.2 mg/L
Suspended Fixed Residue SM 2540 E-1997 W N/A 85-115 <20* N/A 6.2 mg/L N/A = not applicable P
1P This is an estimated detection limit (EDL) - the minimum concentration of an analyte that yields a fluorescence 3X the fluorescence of blank filters which have been extracted
according to the referenced method. P
2P c.u. = color units
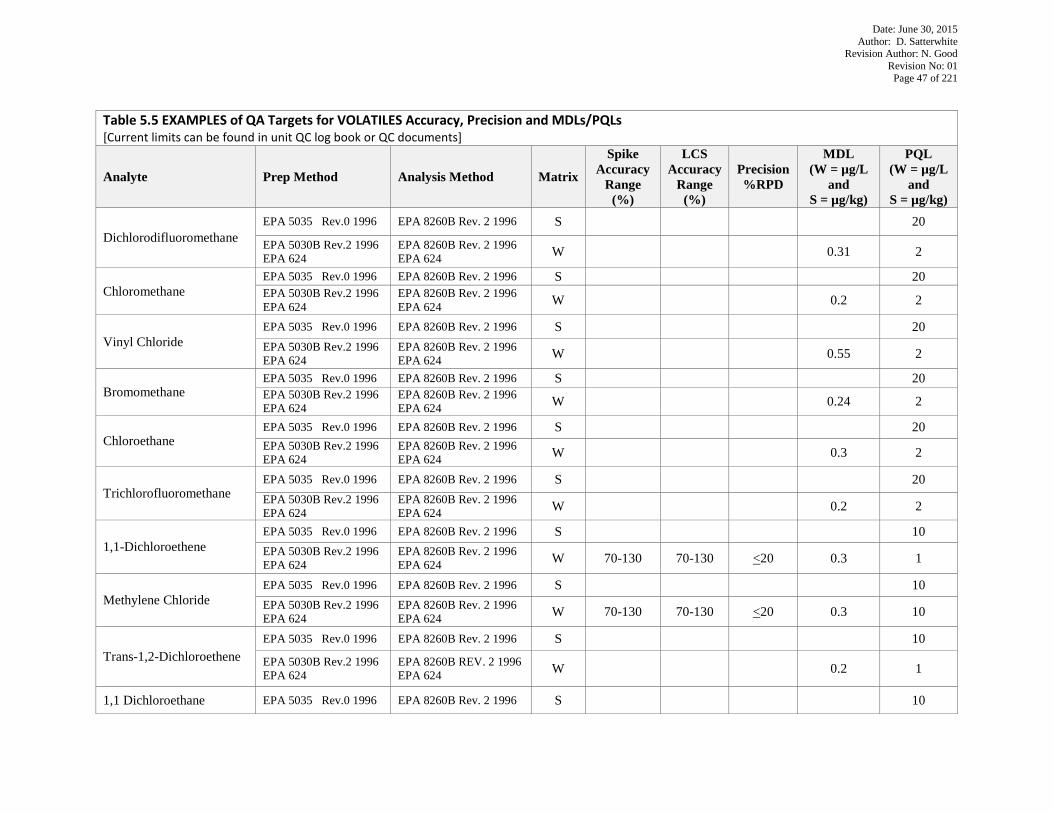
Date: June 30, 2015 Author: D. Satterwhite
Revision Author: N. Good Revision No: 01
Page 47 of 221
Table 5.5 EXAMPLES of QA Targets for VOLATILES Accuracy, Precision and MDLs/PQLs [Current limits can be found in unit QC log book or QC documents]
Analyte Prep Method Analysis Method Matrix
Spike Accuracy
Range (%)
LCS Accuracy
Range (%)
Precision %RPD
MDL (W = µg/L
and S = µg/kg)
PQL (W = µg/L
and S = µg/kg)
Dichlorodifluoromethane EPA 5035 Rev.0 1996 EPA 8260B Rev. 2 1996 S 20
EPA 5030B Rev.2 1996 EPA 624
EPA 8260B Rev. 2 1996 EPA 624 W 0.31 2
Chloromethane EPA 5035 Rev.0 1996 EPA 8260B Rev. 2 1996 S 20 EPA 5030B Rev.2 1996 EPA 624
EPA 8260B Rev. 2 1996 EPA 624 W 0.2 2
Vinyl Chloride EPA 5035 Rev.0 1996 EPA 8260B Rev. 2 1996 S 20 EPA 5030B Rev.2 1996 EPA 624
EPA 8260B Rev. 2 1996 EPA 624 W 0.55 2
Bromomethane EPA 5035 Rev.0 1996 EPA 8260B Rev. 2 1996 S 20 EPA 5030B Rev.2 1996 EPA 624
EPA 8260B Rev. 2 1996 EPA 624 W 0.24 2
Chloroethane EPA 5035 Rev.0 1996 EPA 8260B Rev. 2 1996 S 20 EPA 5030B Rev.2 1996 EPA 624
EPA 8260B Rev. 2 1996 EPA 624 W 0.3 2
Trichlorofluoromethane EPA 5035 Rev.0 1996 EPA 8260B Rev. 2 1996 S 20 EPA 5030B Rev.2 1996 EPA 624
EPA 8260B Rev. 2 1996 EPA 624 W 0.2 2
1,1-Dichloroethene EPA 5035 Rev.0 1996 EPA 8260B Rev. 2 1996 S 10 EPA 5030B Rev.2 1996 EPA 624
EPA 8260B Rev. 2 1996 EPA 624 W 70-130 70-130 <20 0.3 1
Methylene Chloride EPA 5035 Rev.0 1996 EPA 8260B Rev. 2 1996 S 10 EPA 5030B Rev.2 1996 EPA 624
EPA 8260B Rev. 2 1996 EPA 624 W 70-130 70-130 <20 0.3 10
Trans-1,2-Dichloroethene EPA 5035 Rev.0 1996 EPA 8260B Rev. 2 1996 S 10
EPA 5030B Rev.2 1996 EPA 624
EPA 8260B REV. 2 1996 EPA 624 W 0.2 1
1,1 Dichloroethane EPA 5035 Rev.0 1996 EPA 8260B Rev. 2 1996 S 10
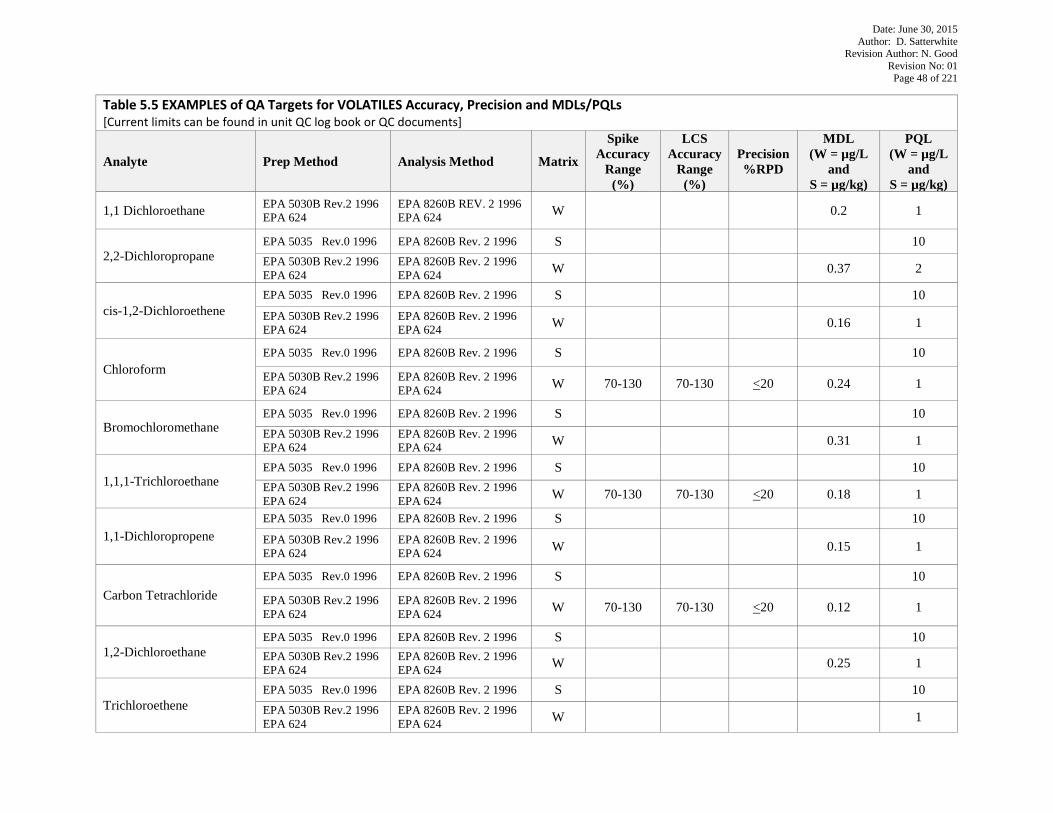
Date: June 30, 2015 Author: D. Satterwhite
Revision Author: N. Good Revision No: 01
Page 48 of 221
Table 5.5 EXAMPLES of QA Targets for VOLATILES Accuracy, Precision and MDLs/PQLs [Current limits can be found in unit QC log book or QC documents]
Analyte Prep Method Analysis Method Matrix
Spike Accuracy
Range (%)
LCS Accuracy
Range (%)
Precision %RPD
MDL (W = µg/L
and S = µg/kg)
PQL (W = µg/L
and S = µg/kg)
1,1 Dichloroethane EPA 5030B Rev.2 1996 EPA 624
EPA 8260B REV. 2 1996 EPA 624 W 0.2 1
2,2-Dichloropropane EPA 5035 Rev.0 1996 EPA 8260B Rev. 2 1996 S 10 EPA 5030B Rev.2 1996 EPA 624
EPA 8260B Rev. 2 1996 EPA 624 W 0.37 2
cis-1,2-Dichloroethene EPA 5035 Rev.0 1996 EPA 8260B Rev. 2 1996 S 10 EPA 5030B Rev.2 1996 EPA 624
EPA 8260B Rev. 2 1996 EPA 624 W 0.16 1
Chloroform EPA 5035 Rev.0 1996 EPA 8260B Rev. 2 1996 S 10
EPA 5030B Rev.2 1996 EPA 624
EPA 8260B Rev. 2 1996 EPA 624 W 70-130 70-130 <20 0.24 1
Bromochloromethane EPA 5035 Rev.0 1996 EPA 8260B Rev. 2 1996 S 10 EPA 5030B Rev.2 1996 EPA 624
EPA 8260B Rev. 2 1996 EPA 624 W 0.31 1
1,1,1-Trichloroethane EPA 5035 Rev.0 1996 EPA 8260B Rev. 2 1996 S 10 EPA 5030B Rev.2 1996 EPA 624
EPA 8260B Rev. 2 1996 EPA 624 W 70-130 70-130 <20 0.18 1
1,1-Dichloropropene EPA 5035 Rev.0 1996 EPA 8260B Rev. 2 1996 S 10 EPA 5030B Rev.2 1996 EPA 624
EPA 8260B Rev. 2 1996 EPA 624 W 0.15 1
Carbon Tetrachloride EPA 5035 Rev.0 1996 EPA 8260B Rev. 2 1996 S 10
EPA 5030B Rev.2 1996 EPA 624
EPA 8260B Rev. 2 1996 EPA 624 W 70-130 70-130 <20 0.12 1
1,2-Dichloroethane EPA 5035 Rev.0 1996 EPA 8260B Rev. 2 1996 S 10 EPA 5030B Rev.2 1996 EPA 624
EPA 8260B Rev. 2 1996 EPA 624 W 0.25 1
Trichloroethene EPA 5035 Rev.0 1996 EPA 8260B Rev. 2 1996 S 10 EPA 5030B Rev.2 1996 EPA 624
EPA 8260B Rev. 2 1996 EPA 624 W 1
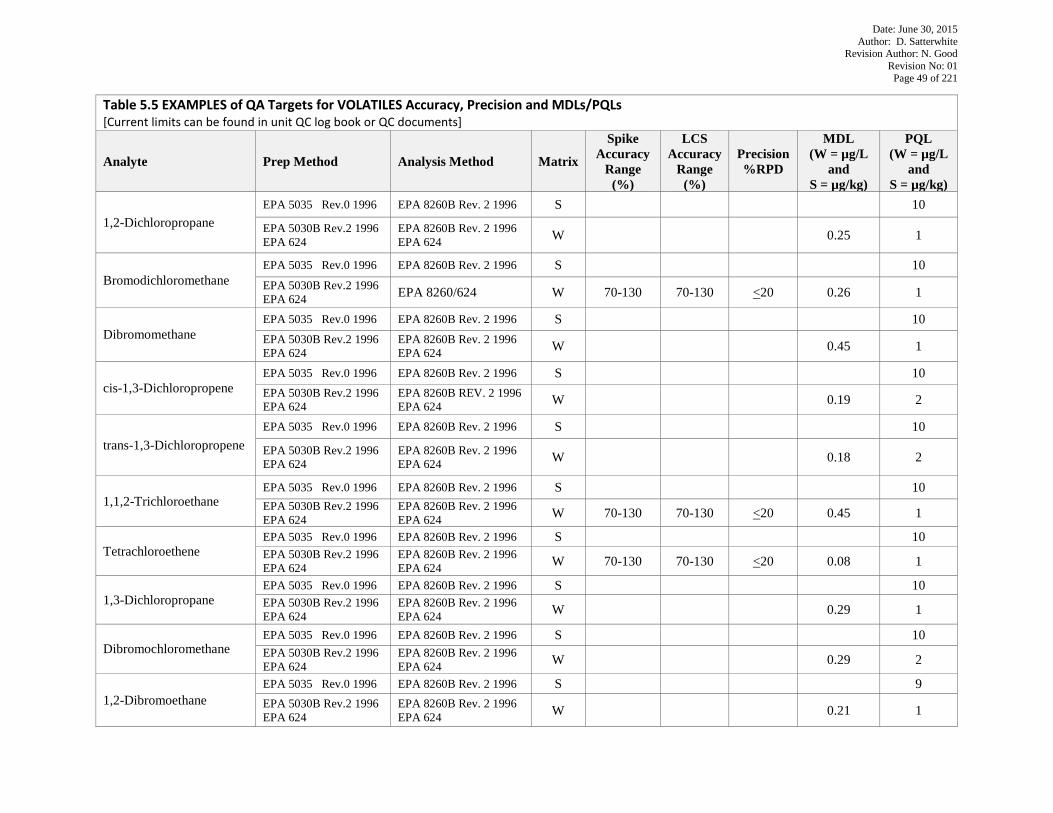
Date: June 30, 2015 Author: D. Satterwhite
Revision Author: N. Good Revision No: 01
Page 49 of 221
Table 5.5 EXAMPLES of QA Targets for VOLATILES Accuracy, Precision and MDLs/PQLs [Current limits can be found in unit QC log book or QC documents]
Analyte Prep Method Analysis Method Matrix
Spike Accuracy
Range (%)
LCS Accuracy
Range (%)
Precision %RPD
MDL (W = µg/L
and S = µg/kg)
PQL (W = µg/L
and S = µg/kg)
1,2-Dichloropropane EPA 5035 Rev.0 1996 EPA 8260B Rev. 2 1996 S 10
EPA 5030B Rev.2 1996 EPA 624
EPA 8260B Rev. 2 1996 EPA 624 W 0.25 1
Bromodichloromethane EPA 5035 Rev.0 1996 EPA 8260B Rev. 2 1996 S 10 EPA 5030B Rev.2 1996 EPA 624 EPA 8260/624 W 70-130 70-130 <20 0.26 1
Dibromomethane EPA 5035 Rev.0 1996 EPA 8260B Rev. 2 1996 S 10 EPA 5030B Rev.2 1996 EPA 624
EPA 8260B Rev. 2 1996 EPA 624 W 0.45 1
cis-1,3-Dichloropropene EPA 5035 Rev.0 1996 EPA 8260B Rev. 2 1996 S 10 EPA 5030B Rev.2 1996 EPA 624
EPA 8260B REV. 2 1996 EPA 624 W 0.19 2
trans-1,3-Dichloropropene EPA 5035 Rev.0 1996 EPA 8260B Rev. 2 1996 S 10
EPA 5030B Rev.2 1996 EPA 624
EPA 8260B Rev. 2 1996 EPA 624 W 0.18 2
1,1,2-Trichloroethane EPA 5035 Rev.0 1996 EPA 8260B Rev. 2 1996 S 10 EPA 5030B Rev.2 1996 EPA 624
EPA 8260B Rev. 2 1996 EPA 624 W 70-130 70-130 <20 0.45 1
Tetrachloroethene EPA 5035 Rev.0 1996 EPA 8260B Rev. 2 1996 S 10 EPA 5030B Rev.2 1996 EPA 624
EPA 8260B Rev. 2 1996 EPA 624 W 70-130 70-130 <20 0.08 1
1,3-Dichloropropane EPA 5035 Rev.0 1996 EPA 8260B Rev. 2 1996 S 10 EPA 5030B Rev.2 1996 EPA 624
EPA 8260B Rev. 2 1996 EPA 624 W 0.29 1
Dibromochloromethane EPA 5035 Rev.0 1996 EPA 8260B Rev. 2 1996 S 10 EPA 5030B Rev.2 1996 EPA 624
EPA 8260B Rev. 2 1996 EPA 624 W 0.29 2
1,2-Dibromoethane EPA 5035 Rev.0 1996 EPA 8260B Rev. 2 1996 S 9 EPA 5030B Rev.2 1996 EPA 624
EPA 8260B Rev. 2 1996 EPA 624 W 0.21 1
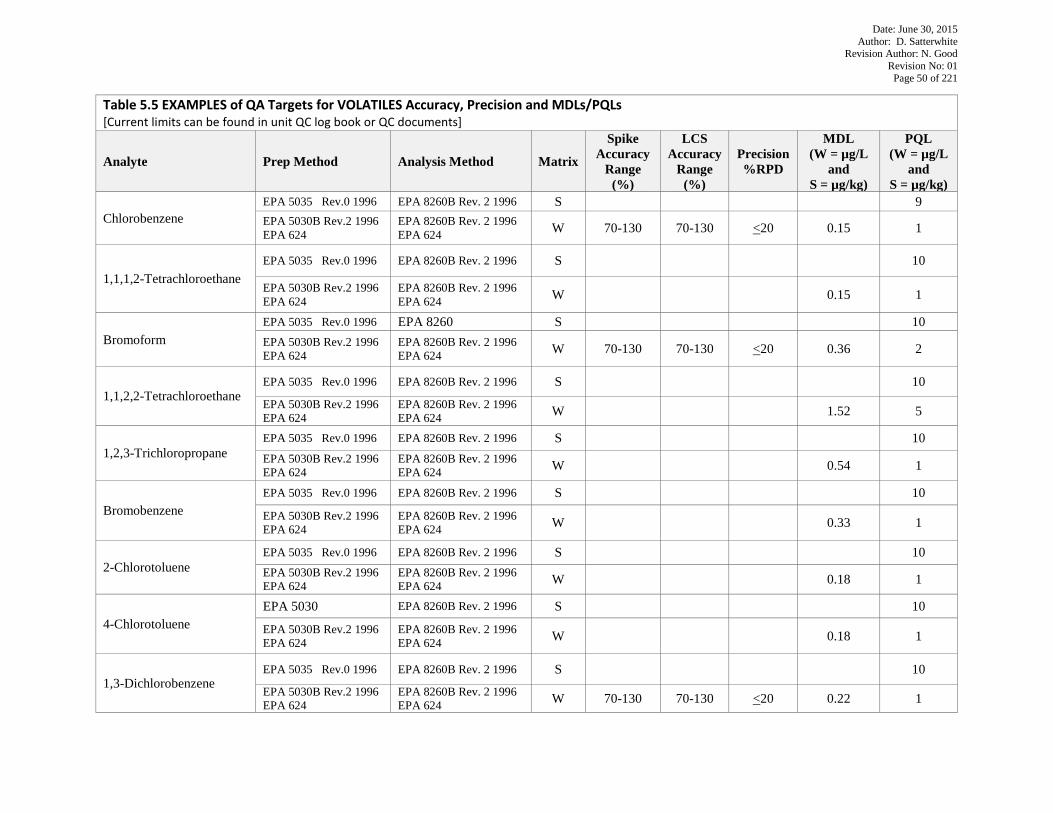
Date: June 30, 2015 Author: D. Satterwhite
Revision Author: N. Good Revision No: 01
Page 50 of 221
Table 5.5 EXAMPLES of QA Targets for VOLATILES Accuracy, Precision and MDLs/PQLs [Current limits can be found in unit QC log book or QC documents]
Analyte Prep Method Analysis Method Matrix
Spike Accuracy
Range (%)
LCS Accuracy
Range (%)
Precision %RPD
MDL (W = µg/L
and S = µg/kg)
PQL (W = µg/L
and S = µg/kg)
Chlorobenzene EPA 5035 Rev.0 1996 EPA 8260B Rev. 2 1996 S 9 EPA 5030B Rev.2 1996 EPA 624
EPA 8260B Rev. 2 1996 EPA 624 W 70-130 70-130 <20 0.15 1
1,1,1,2-Tetrachloroethane EPA 5035 Rev.0 1996 EPA 8260B Rev. 2 1996 S 10
EPA 5030B Rev.2 1996 EPA 624
EPA 8260B Rev. 2 1996 EPA 624 W 0.15 1
Bromoform EPA 5035 Rev.0 1996 EPA 8260 S 10 EPA 5030B Rev.2 1996 EPA 624
EPA 8260B Rev. 2 1996 EPA 624 W 70-130 70-130 <20 0.36 2
1,1,2,2-Tetrachloroethane EPA 5035 Rev.0 1996 EPA 8260B Rev. 2 1996 S 10
EPA 5030B Rev.2 1996 EPA 624
EPA 8260B Rev. 2 1996 EPA 624 W 1.52 5
1,2,3-Trichloropropane EPA 5035 Rev.0 1996 EPA 8260B Rev. 2 1996 S 10 EPA 5030B Rev.2 1996 EPA 624
EPA 8260B Rev. 2 1996 EPA 624 W 0.54 1
Bromobenzene EPA 5035 Rev.0 1996 EPA 8260B Rev. 2 1996 S 10
EPA 5030B Rev.2 1996 EPA 624
EPA 8260B Rev. 2 1996 EPA 624 W 0.33 1
2-Chlorotoluene EPA 5035 Rev.0 1996 EPA 8260B Rev. 2 1996 S 10 EPA 5030B Rev.2 1996 EPA 624
EPA 8260B Rev. 2 1996 EPA 624 W 0.18 1
4-Chlorotoluene EPA 5030 EPA 8260B Rev. 2 1996 S 10
EPA 5030B Rev.2 1996 EPA 624
EPA 8260B Rev. 2 1996 EPA 624 W 0.18 1
1,3-Dichlorobenzene EPA 5035 Rev.0 1996 EPA 8260B Rev. 2 1996 S 10
EPA 5030B Rev.2 1996 EPA 624
EPA 8260B Rev. 2 1996 EPA 624 W 70-130 70-130 <20 0.22 1
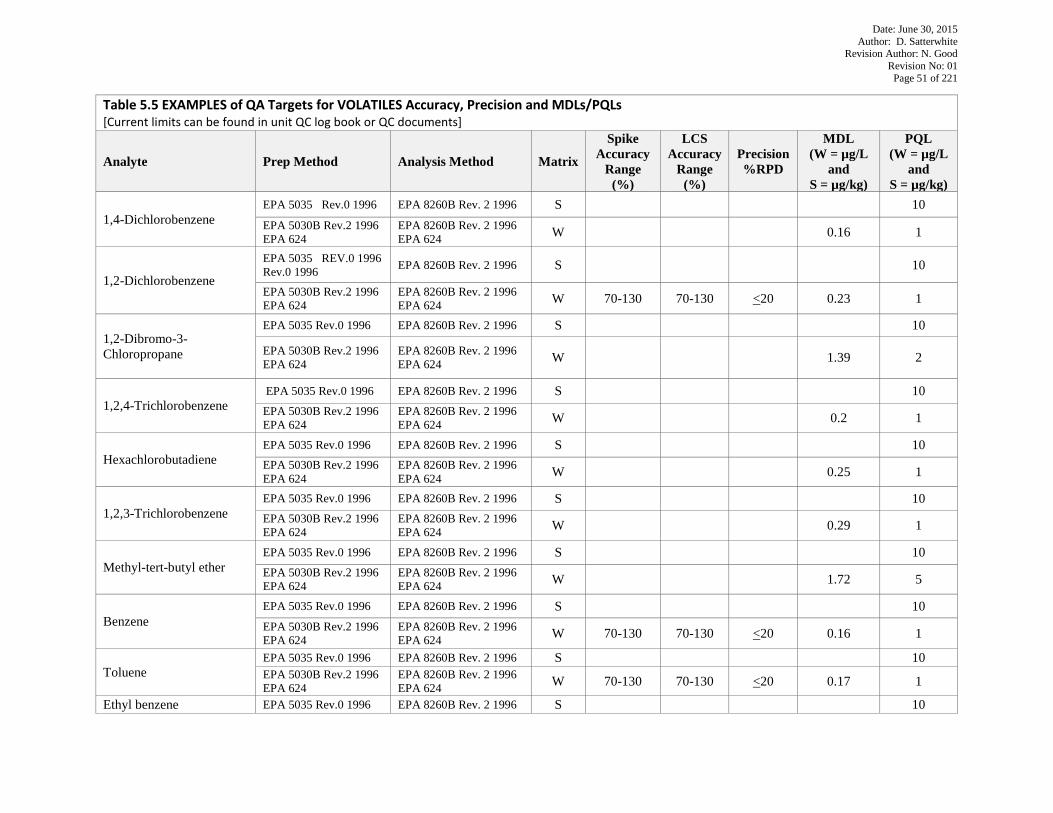
Date: June 30, 2015 Author: D. Satterwhite
Revision Author: N. Good Revision No: 01
Page 51 of 221
Table 5.5 EXAMPLES of QA Targets for VOLATILES Accuracy, Precision and MDLs/PQLs [Current limits can be found in unit QC log book or QC documents]
Analyte Prep Method Analysis Method Matrix
Spike Accuracy
Range (%)
LCS Accuracy
Range (%)
Precision %RPD
MDL (W = µg/L
and S = µg/kg)
PQL (W = µg/L
and S = µg/kg)
1,4-Dichlorobenzene EPA 5035 Rev.0 1996 EPA 8260B Rev. 2 1996 S 10 EPA 5030B Rev.2 1996 EPA 624
EPA 8260B Rev. 2 1996 EPA 624 W 0.16 1
1,2-Dichlorobenzene
EPA 5035 REV.0 1996 Rev.0 1996 EPA 8260B Rev. 2 1996 S 10
EPA 5030B Rev.2 1996 EPA 624
EPA 8260B Rev. 2 1996 EPA 624 W 70-130 70-130 <20 0.23 1
1,2-Dibromo-3-Chloropropane
EPA 5035 Rev.0 1996 EPA 8260B Rev. 2 1996 S 10
EPA 5030B Rev.2 1996 EPA 624
EPA 8260B Rev. 2 1996 EPA 624 W 1.39 2
1,2,4-Trichlorobenzene EPA 5035 Rev.0 1996 EPA 8260B Rev. 2 1996 S 10 EPA 5030B Rev.2 1996 EPA 624
EPA 8260B Rev. 2 1996 EPA 624 W 0.2 1
Hexachlorobutadiene EPA 5035 Rev.0 1996 EPA 8260B Rev. 2 1996 S 10 EPA 5030B Rev.2 1996 EPA 624
EPA 8260B Rev. 2 1996 EPA 624 W 0.25 1
1,2,3-Trichlorobenzene EPA 5035 Rev.0 1996 EPA 8260B Rev. 2 1996 S 10 EPA 5030B Rev.2 1996 EPA 624
EPA 8260B Rev. 2 1996 EPA 624 W 0.29 1
Methyl-tert-butyl ether EPA 5035 Rev.0 1996 EPA 8260B Rev. 2 1996 S 10 EPA 5030B Rev.2 1996 EPA 624
EPA 8260B Rev. 2 1996 EPA 624 W 1.72 5
Benzene EPA 5035 Rev.0 1996 EPA 8260B Rev. 2 1996 S 10 EPA 5030B Rev.2 1996 EPA 624
EPA 8260B Rev. 2 1996 EPA 624 W 70-130 70-130 <20 0.16 1
Toluene EPA 5035 Rev.0 1996 EPA 8260B Rev. 2 1996 S 10 EPA 5030B Rev.2 1996 EPA 624
EPA 8260B Rev. 2 1996 EPA 624 W 70-130 70-130 <20 0.17 1
Ethyl benzene EPA 5035 Rev.0 1996 EPA 8260B Rev. 2 1996 S 10
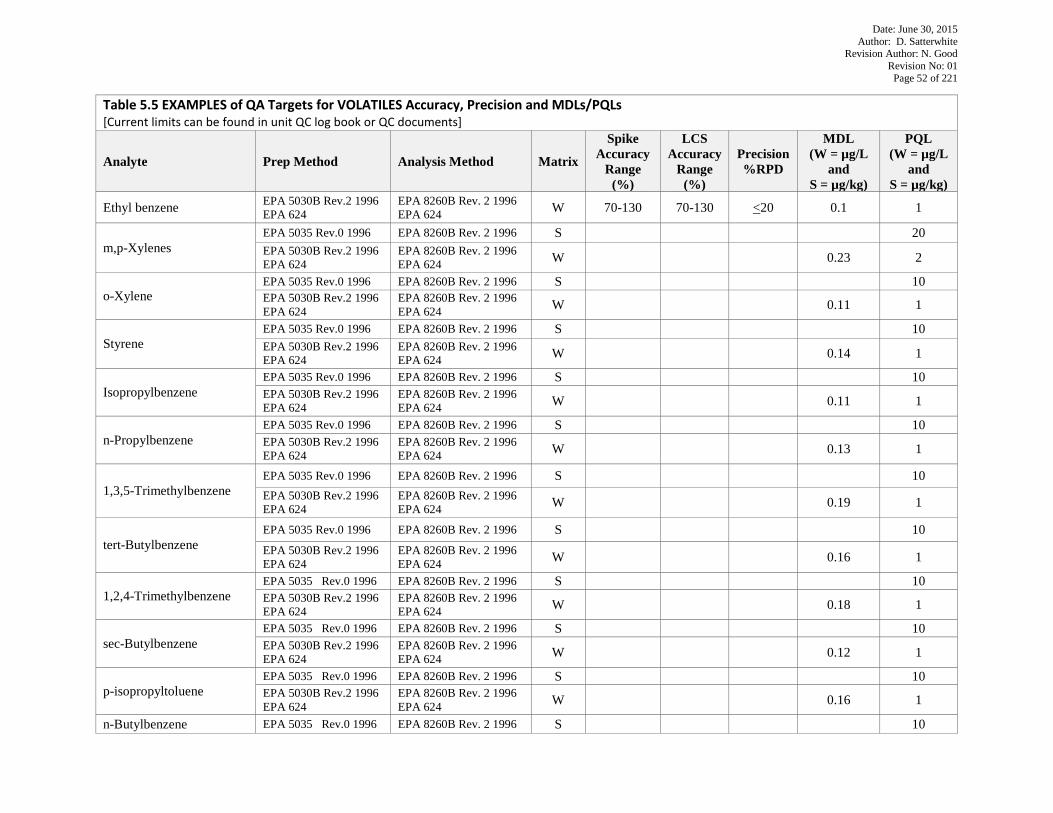
Date: June 30, 2015 Author: D. Satterwhite
Revision Author: N. Good Revision No: 01
Page 52 of 221
Table 5.5 EXAMPLES of QA Targets for VOLATILES Accuracy, Precision and MDLs/PQLs [Current limits can be found in unit QC log book or QC documents]
Analyte Prep Method Analysis Method Matrix
Spike Accuracy
Range (%)
LCS Accuracy
Range (%)
Precision %RPD
MDL (W = µg/L
and S = µg/kg)
PQL (W = µg/L
and S = µg/kg)
Ethyl benzene EPA 5030B Rev.2 1996 EPA 624
EPA 8260B Rev. 2 1996 EPA 624 W 70-130 70-130 <20 0.1 1
m,p-Xylenes EPA 5035 Rev.0 1996 EPA 8260B Rev. 2 1996 S 20 EPA 5030B Rev.2 1996 EPA 624
EPA 8260B Rev. 2 1996 EPA 624 W 0.23 2
o-Xylene EPA 5035 Rev.0 1996 EPA 8260B Rev. 2 1996 S 10 EPA 5030B Rev.2 1996 EPA 624
EPA 8260B Rev. 2 1996 EPA 624 W 0.11 1
Styrene EPA 5035 Rev.0 1996 EPA 8260B Rev. 2 1996 S 10 EPA 5030B Rev.2 1996 EPA 624
EPA 8260B Rev. 2 1996 EPA 624 W 0.14 1
Isopropylbenzene EPA 5035 Rev.0 1996 EPA 8260B Rev. 2 1996 S 10 EPA 5030B Rev.2 1996 EPA 624
EPA 8260B Rev. 2 1996 EPA 624 W 0.11 1
n-Propylbenzene EPA 5035 Rev.0 1996 EPA 8260B Rev. 2 1996 S 10 EPA 5030B Rev.2 1996 EPA 624
EPA 8260B Rev. 2 1996 EPA 624 W 0.13 1
1,3,5-Trimethylbenzene EPA 5035 Rev.0 1996 EPA 8260B Rev. 2 1996 S 10 EPA 5030B Rev.2 1996 EPA 624
EPA 8260B Rev. 2 1996 EPA 624 W 0.19 1
tert-Butylbenzene EPA 5035 Rev.0 1996 EPA 8260B Rev. 2 1996 S 10 EPA 5030B Rev.2 1996 EPA 624
EPA 8260B Rev. 2 1996 EPA 624 W 0.16 1
1,2,4-Trimethylbenzene EPA 5035 Rev.0 1996 EPA 8260B Rev. 2 1996 S 10 EPA 5030B Rev.2 1996 EPA 624
EPA 8260B Rev. 2 1996 EPA 624 W 0.18 1
sec-Butylbenzene EPA 5035 Rev.0 1996 EPA 8260B Rev. 2 1996 S 10 EPA 5030B Rev.2 1996 EPA 624
EPA 8260B Rev. 2 1996 EPA 624 W 0.12 1
p-isopropyltoluene EPA 5035 Rev.0 1996 EPA 8260B Rev. 2 1996 S 10 EPA 5030B Rev.2 1996 EPA 624
EPA 8260B Rev. 2 1996 EPA 624 W 0.16 1
n-Butylbenzene EPA 5035 Rev.0 1996 EPA 8260B Rev. 2 1996 S 10
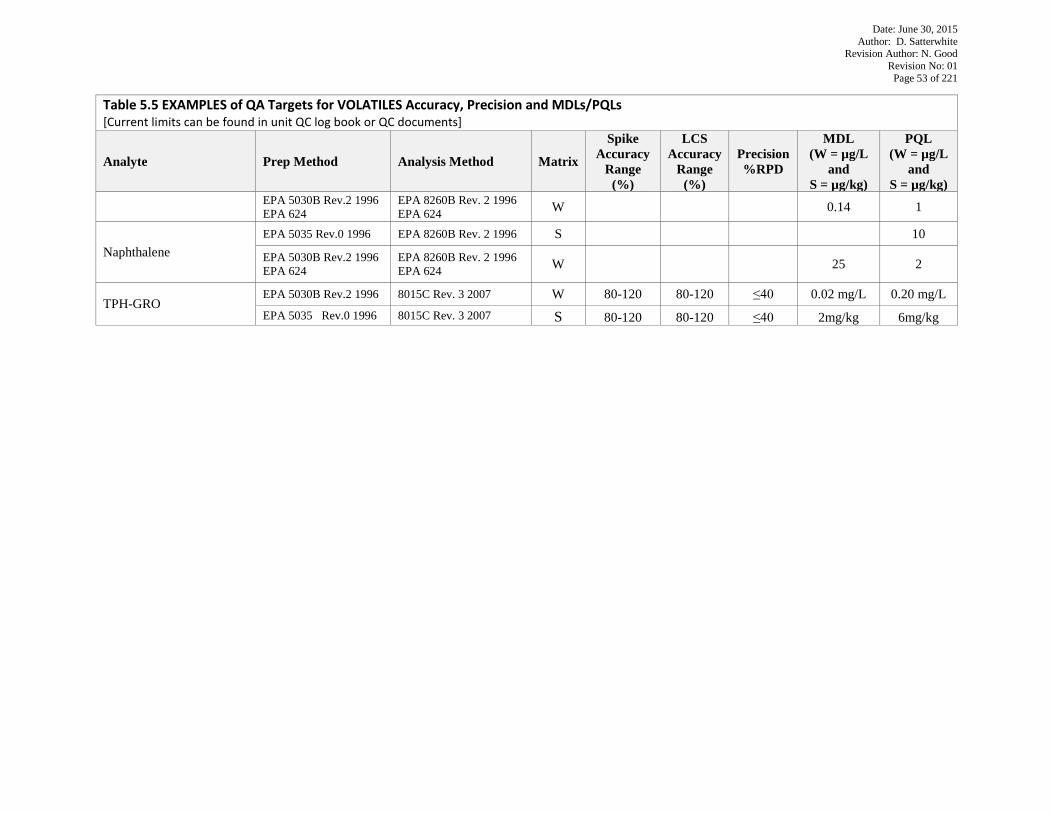
Date: June 30, 2015 Author: D. Satterwhite
Revision Author: N. Good Revision No: 01
Page 53 of 221
Table 5.5 EXAMPLES of QA Targets for VOLATILES Accuracy, Precision and MDLs/PQLs [Current limits can be found in unit QC log book or QC documents]
Analyte Prep Method Analysis Method Matrix
Spike Accuracy
Range (%)
LCS Accuracy
Range (%)
Precision %RPD
MDL (W = µg/L
and S = µg/kg)
PQL (W = µg/L
and S = µg/kg)
EPA 5030B Rev.2 1996 EPA 624
EPA 8260B Rev. 2 1996 EPA 624 W 0.14 1
Naphthalene EPA 5035 Rev.0 1996 EPA 8260B Rev. 2 1996 S 10
EPA 5030B Rev.2 1996 EPA 624
EPA 8260B Rev. 2 1996 EPA 624 W 25 2
TPH-GRO EPA 5030B Rev.2 1996 8015C Rev. 3 2007 W 80-120 80-120 ≤40 0.02 mg/L 0.20 mg/L EPA 5035 Rev.0 1996 8015C Rev. 3 2007 S 80-120 80-120 ≤40 2mg/kg 6mg/kg
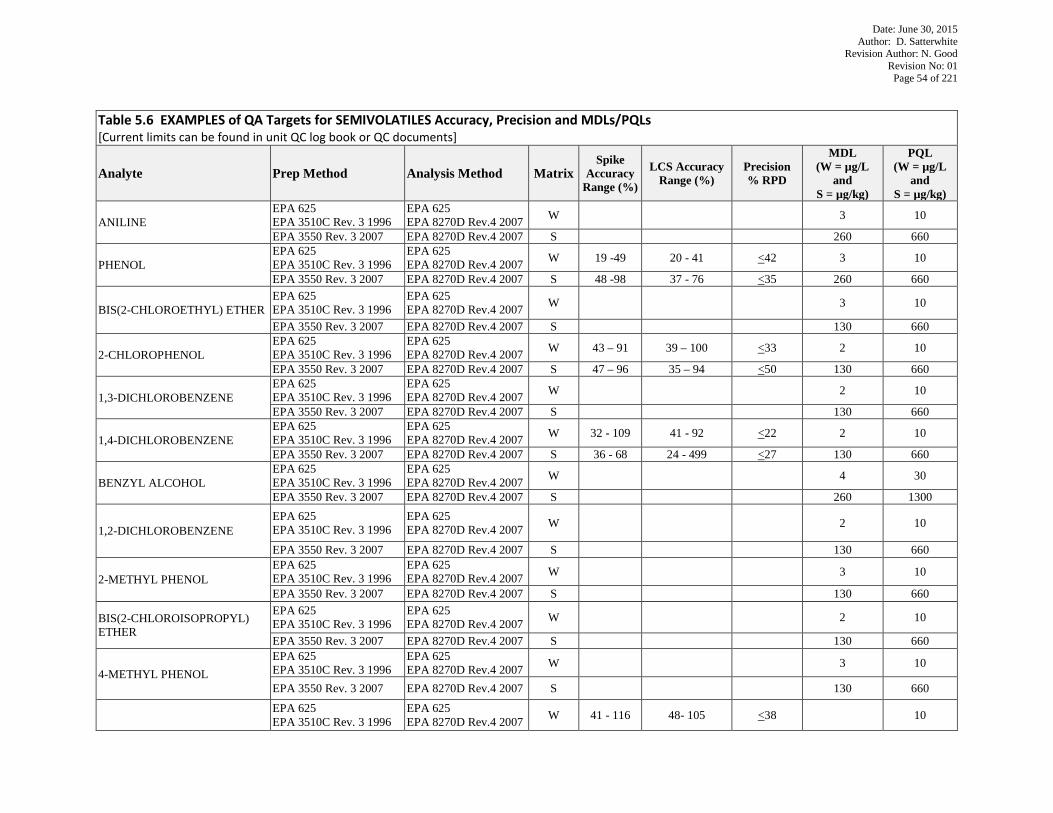
Date: June 30, 2015 Author: D. Satterwhite
Revision Author: N. Good Revision No: 01
Page 54 of 221
Table 5.6 EXAMPLES of QA Targets for SEMIVOLATILES Accuracy, Precision and MDLs/PQLs [Current limits can be found in unit QC log book or QC documents]
Analyte Prep Method Analysis Method Matrix Spike
Accuracy Range (%)
LCS Accuracy Range (%)
Precision % RPD
MDL (W = µg/L
and S = µg/kg)
PQL (W = µg/L
and S = µg/kg)
ANILINE EPA 625 EPA 3510C Rev. 3 1996
EPA 625 EPA 8270D Rev.4 2007 W 3 10
EPA 3550 Rev. 3 2007 EPA 8270D Rev.4 2007 S 260 660
PHENOL EPA 625 EPA 3510C Rev. 3 1996
EPA 625 EPA 8270D Rev.4 2007 W 19 -49 20 - 41 <42 3 10
EPA 3550 Rev. 3 2007 EPA 8270D Rev.4 2007 S 48 -98 37 - 76 <35 260 660
BIS(2-CHLOROETHYL) ETHER EPA 625 EPA 3510C Rev. 3 1996
EPA 625 EPA 8270D Rev.4 2007 W 3 10
EPA 3550 Rev. 3 2007 EPA 8270D Rev.4 2007 S 130 660
2-CHLOROPHENOL EPA 625 EPA 3510C Rev. 3 1996
EPA 625 EPA 8270D Rev.4 2007 W 43 – 91 39 – 100 <33 2 10
EPA 3550 Rev. 3 2007 EPA 8270D Rev.4 2007 S 47 – 96 35 – 94 <50 130 660
1,3-DICHLOROBENZENE EPA 625 EPA 3510C Rev. 3 1996
EPA 625 EPA 8270D Rev.4 2007 W 2 10
EPA 3550 Rev. 3 2007 EPA 8270D Rev.4 2007 S 130 660
1,4-DICHLOROBENZENE EPA 625 EPA 3510C Rev. 3 1996
EPA 625 EPA 8270D Rev.4 2007 W 32 - 109 41 - 92 <22 2 10
EPA 3550 Rev. 3 2007 EPA 8270D Rev.4 2007 S 36 - 68 24 - 499 <27 130 660
BENZYL ALCOHOL EPA 625 EPA 3510C Rev. 3 1996
EPA 625 EPA 8270D Rev.4 2007 W 4 30
EPA 3550 Rev. 3 2007 EPA 8270D Rev.4 2007 S 260 1300
1,2-DICHLOROBENZENE EPA 625 EPA 3510C Rev. 3 1996
EPA 625 EPA 8270D Rev.4 2007 W 2 10
EPA 3550 Rev. 3 2007 EPA 8270D Rev.4 2007 S 130 660
2-METHYL PHENOL EPA 625 EPA 3510C Rev. 3 1996
EPA 625 EPA 8270D Rev.4 2007 W 3 10
EPA 3550 Rev. 3 2007 EPA 8270D Rev.4 2007 S 130 660
BIS(2-CHLOROISOPROPYL) ETHER
EPA 625 EPA 3510C Rev. 3 1996
EPA 625 EPA 8270D Rev.4 2007 W 2 10
EPA 3550 Rev. 3 2007 EPA 8270D Rev.4 2007 S 130 660
4-METHYL PHENOL EPA 625 EPA 3510C Rev. 3 1996
EPA 625 EPA 8270D Rev.4 2007 W 3 10
EPA 3550 Rev. 3 2007 EPA 8270D Rev.4 2007 S 130 660
EPA 625 EPA 3510C Rev. 3 1996
EPA 625 EPA 8270D Rev.4 2007 W 41 - 116 48- 105 <38 10
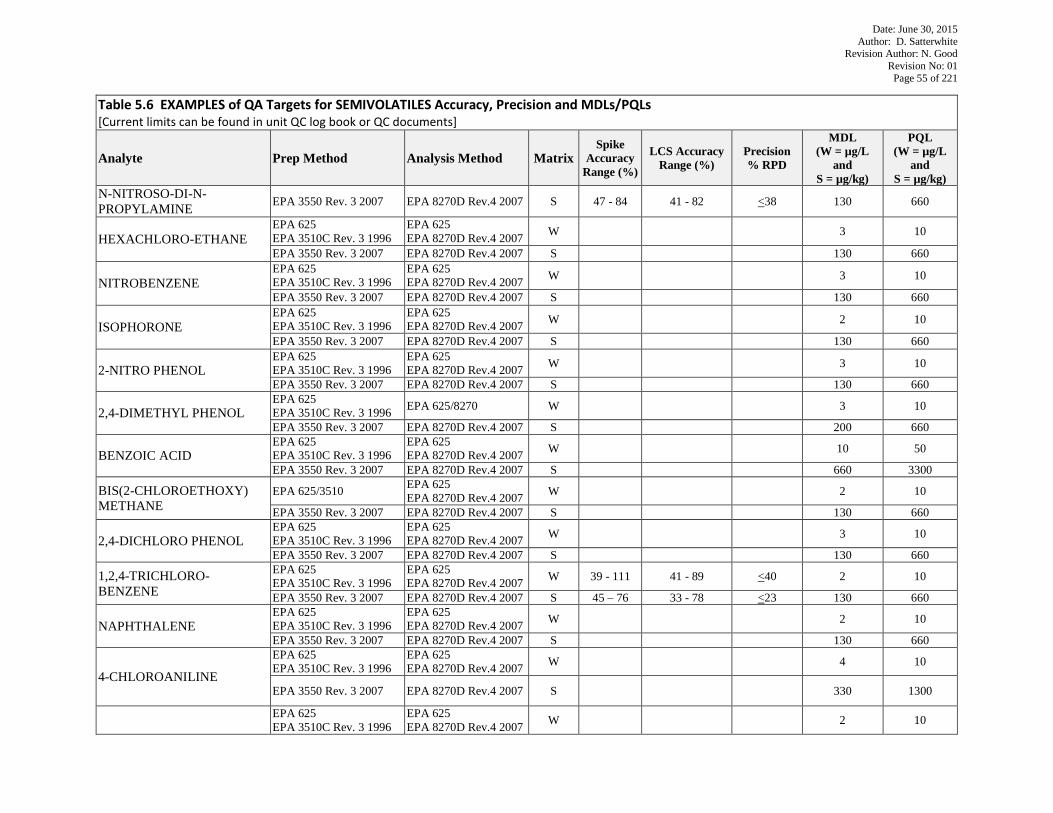
Date: June 30, 2015 Author: D. Satterwhite
Revision Author: N. Good Revision No: 01
Page 55 of 221
Table 5.6 EXAMPLES of QA Targets for SEMIVOLATILES Accuracy, Precision and MDLs/PQLs [Current limits can be found in unit QC log book or QC documents]
Analyte Prep Method Analysis Method Matrix Spike
Accuracy Range (%)
LCS Accuracy Range (%)
Precision % RPD
MDL (W = µg/L
and S = µg/kg)
PQL (W = µg/L
and S = µg/kg)
N-NITROSO-DI-N-PROPYLAMINE EPA 3550 Rev. 3 2007 EPA 8270D Rev.4 2007 S 47 - 84 41 - 82 <38 130 660
HEXACHLORO-ETHANE EPA 625 EPA 3510C Rev. 3 1996
EPA 625 EPA 8270D Rev.4 2007 W 3 10
EPA 3550 Rev. 3 2007 EPA 8270D Rev.4 2007 S 130 660
NITROBENZENE EPA 625 EPA 3510C Rev. 3 1996
EPA 625 EPA 8270D Rev.4 2007 W 3 10
EPA 3550 Rev. 3 2007 EPA 8270D Rev.4 2007 S 130 660
ISOPHORONE EPA 625 EPA 3510C Rev. 3 1996
EPA 625 EPA 8270D Rev.4 2007 W 2 10
EPA 3550 Rev. 3 2007 EPA 8270D Rev.4 2007 S 130 660
2-NITRO PHENOL EPA 625 EPA 3510C Rev. 3 1996
EPA 625 EPA 8270D Rev.4 2007 W 3 10
EPA 3550 Rev. 3 2007 EPA 8270D Rev.4 2007 S 130 660
2,4-DIMETHYL PHENOL EPA 625 EPA 3510C Rev. 3 1996 EPA 625/8270 W 3 10
EPA 3550 Rev. 3 2007 EPA 8270D Rev.4 2007 S 200 660
BENZOIC ACID EPA 625 EPA 3510C Rev. 3 1996
EPA 625 EPA 8270D Rev.4 2007 W 10 50
EPA 3550 Rev. 3 2007 EPA 8270D Rev.4 2007 S 660 3300
BIS(2-CHLOROETHOXY) METHANE
EPA 625/3510 EPA 625 EPA 8270D Rev.4 2007 W 2 10
EPA 3550 Rev. 3 2007 EPA 8270D Rev.4 2007 S 130 660
2,4-DICHLORO PHENOL EPA 625 EPA 3510C Rev. 3 1996
EPA 625 EPA 8270D Rev.4 2007 W 3 10
EPA 3550 Rev. 3 2007 EPA 8270D Rev.4 2007 S 130 660
1,2,4-TRICHLORO-BENZENE
EPA 625 EPA 3510C Rev. 3 1996
EPA 625 EPA 8270D Rev.4 2007 W 39 - 111 41 - 89 <40 2 10
EPA 3550 Rev. 3 2007 EPA 8270D Rev.4 2007 S 45 – 76 33 - 78 <23 130 660
NAPHTHALENE EPA 625 EPA 3510C Rev. 3 1996
EPA 625 EPA 8270D Rev.4 2007 W 2 10
EPA 3550 Rev. 3 2007 EPA 8270D Rev.4 2007 S 130 660
4-CHLOROANILINE
EPA 625 EPA 3510C Rev. 3 1996
EPA 625 EPA 8270D Rev.4 2007 W 4 10
EPA 3550 Rev. 3 2007 EPA 8270D Rev.4 2007 S 330 1300
EPA 625 EPA 3510C Rev. 3 1996
EPA 625 EPA 8270D Rev.4 2007 W 2 10
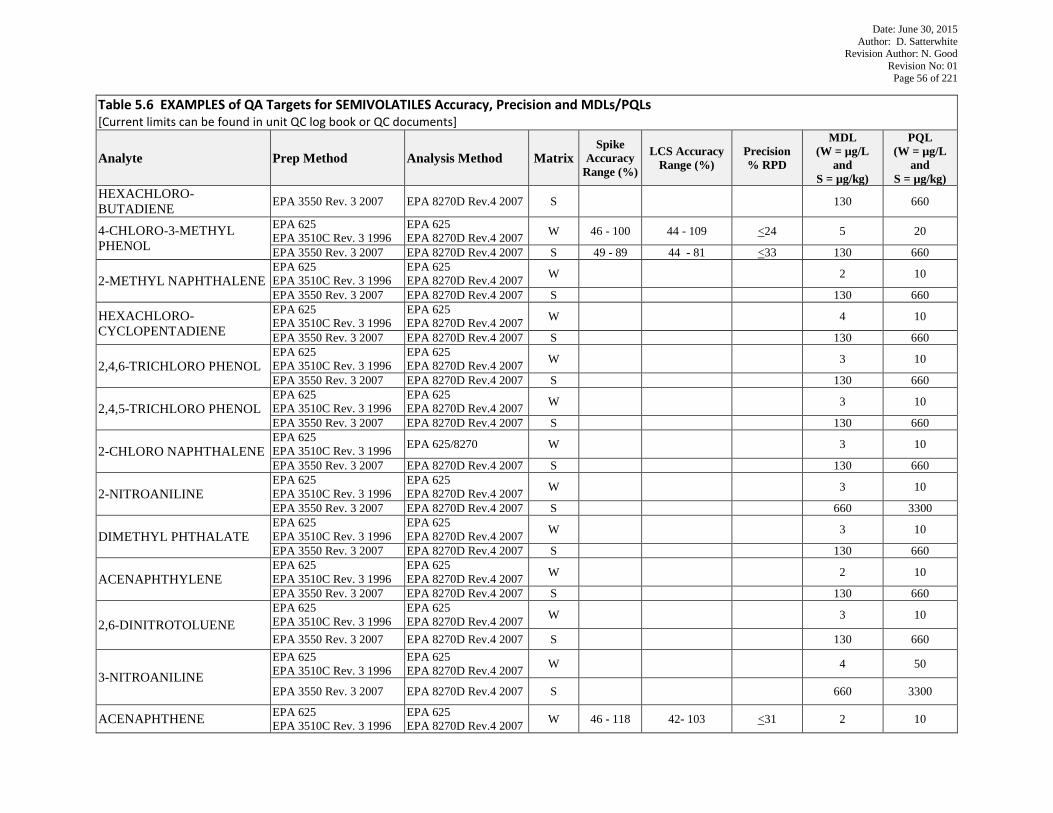
Date: June 30, 2015 Author: D. Satterwhite
Revision Author: N. Good Revision No: 01
Page 56 of 221
Table 5.6 EXAMPLES of QA Targets for SEMIVOLATILES Accuracy, Precision and MDLs/PQLs [Current limits can be found in unit QC log book or QC documents]
Analyte Prep Method Analysis Method Matrix Spike
Accuracy Range (%)
LCS Accuracy Range (%)
Precision % RPD
MDL (W = µg/L
and S = µg/kg)
PQL (W = µg/L
and S = µg/kg)
HEXACHLORO-BUTADIENE EPA 3550 Rev. 3 2007 EPA 8270D Rev.4 2007 S 130 660
4-CHLORO-3-METHYL PHENOL
EPA 625 EPA 3510C Rev. 3 1996
EPA 625 EPA 8270D Rev.4 2007 W 46 - 100 44 - 109 <24 5 20
EPA 3550 Rev. 3 2007 EPA 8270D Rev.4 2007 S 49 - 89 44 - 81 <33 130 660
2-METHYL NAPHTHALENE EPA 625 EPA 3510C Rev. 3 1996
EPA 625 EPA 8270D Rev.4 2007 W 2 10
EPA 3550 Rev. 3 2007 EPA 8270D Rev.4 2007 S 130 660
HEXACHLORO-CYCLOPENTADIENE
EPA 625 EPA 3510C Rev. 3 1996
EPA 625 EPA 8270D Rev.4 2007 W 4 10
EPA 3550 Rev. 3 2007 EPA 8270D Rev.4 2007 S 130 660
2,4,6-TRICHLORO PHENOL EPA 625 EPA 3510C Rev. 3 1996
EPA 625 EPA 8270D Rev.4 2007 W 3 10
EPA 3550 Rev. 3 2007 EPA 8270D Rev.4 2007 S 130 660
2,4,5-TRICHLORO PHENOL EPA 625 EPA 3510C Rev. 3 1996
EPA 625 EPA 8270D Rev.4 2007 W 3 10
EPA 3550 Rev. 3 2007 EPA 8270D Rev.4 2007 S 130 660
2-CHLORO NAPHTHALENE EPA 625 EPA 3510C Rev. 3 1996 EPA 625/8270 W 3 10
EPA 3550 Rev. 3 2007 EPA 8270D Rev.4 2007 S 130 660
2-NITROANILINE EPA 625 EPA 3510C Rev. 3 1996
EPA 625 EPA 8270D Rev.4 2007 W 3 10
EPA 3550 Rev. 3 2007 EPA 8270D Rev.4 2007 S 660 3300
DIMETHYL PHTHALATE EPA 625 EPA 3510C Rev. 3 1996
EPA 625 EPA 8270D Rev.4 2007 W 3 10
EPA 3550 Rev. 3 2007 EPA 8270D Rev.4 2007 S 130 660
ACENAPHTHYLENE EPA 625 EPA 3510C Rev. 3 1996
EPA 625 EPA 8270D Rev.4 2007 W 2 10
EPA 3550 Rev. 3 2007 EPA 8270D Rev.4 2007 S 130 660
2,6-DINITROTOLUENE EPA 625 EPA 3510C Rev. 3 1996
EPA 625 EPA 8270D Rev.4 2007 W 3 10
EPA 3550 Rev. 3 2007 EPA 8270D Rev.4 2007 S 130 660
3-NITROANILINE EPA 625 EPA 3510C Rev. 3 1996
EPA 625 EPA 8270D Rev.4 2007 W 4 50
EPA 3550 Rev. 3 2007 EPA 8270D Rev.4 2007 S 660 3300
ACENAPHTHENE EPA 625 EPA 3510C Rev. 3 1996
EPA 625 EPA 8270D Rev.4 2007 W 46 - 118 42- 103 <31 2 10
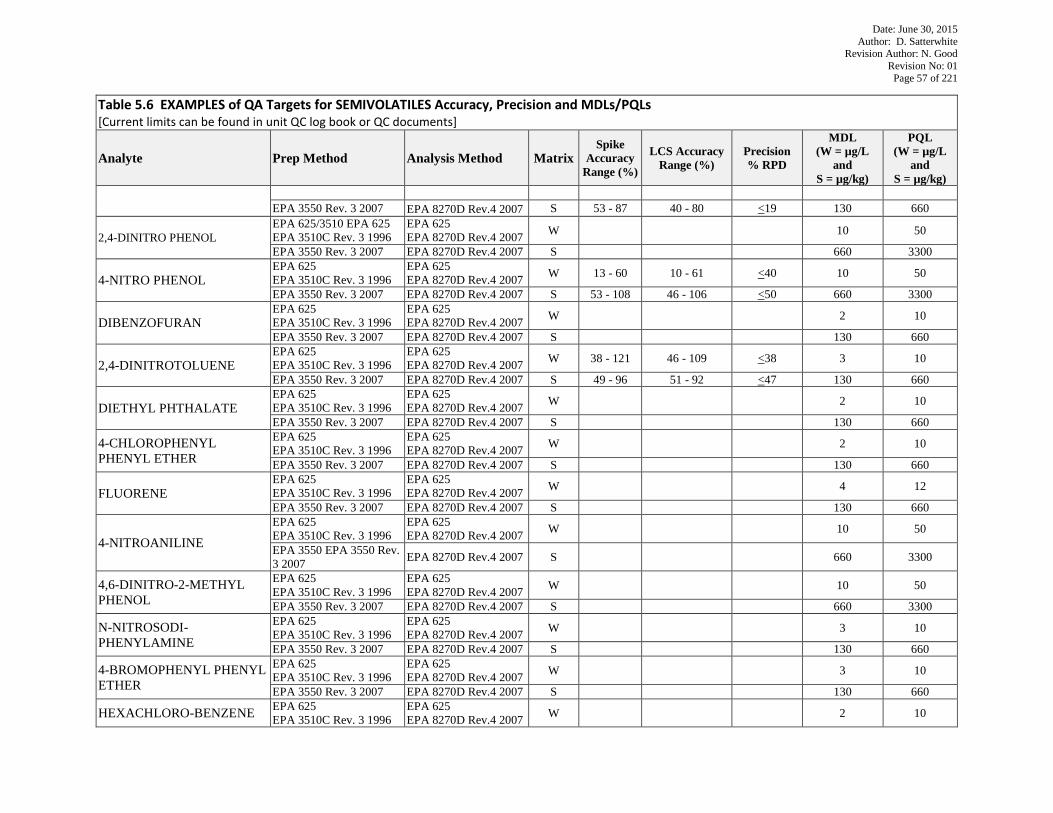
Date: June 30, 2015 Author: D. Satterwhite
Revision Author: N. Good Revision No: 01
Page 57 of 221
Table 5.6 EXAMPLES of QA Targets for SEMIVOLATILES Accuracy, Precision and MDLs/PQLs [Current limits can be found in unit QC log book or QC documents]
Analyte Prep Method Analysis Method Matrix Spike
Accuracy Range (%)
LCS Accuracy Range (%)
Precision % RPD
MDL (W = µg/L
and S = µg/kg)
PQL (W = µg/L
and S = µg/kg)
EPA 3550 Rev. 3 2007 EPA 8270D Rev.4 2007 S 53 - 87 40 - 80 <19 130 660
2,4-DINITRO PHENOL EPA 625/3510 EPA 625 EPA 3510C Rev. 3 1996
EPA 625 EPA 8270D Rev.4 2007 W 10 50
EPA 3550 Rev. 3 2007 EPA 8270D Rev.4 2007 S 660 3300
4-NITRO PHENOL EPA 625 EPA 3510C Rev. 3 1996
EPA 625 EPA 8270D Rev.4 2007 W 13 - 60 10 - 61 <40 10 50
EPA 3550 Rev. 3 2007 EPA 8270D Rev.4 2007 S 53 - 108 46 - 106 <50 660 3300
DIBENZOFURAN EPA 625 EPA 3510C Rev. 3 1996
EPA 625 EPA 8270D Rev.4 2007 W 2 10
EPA 3550 Rev. 3 2007 EPA 8270D Rev.4 2007 S 130 660
2,4-DINITROTOLUENE EPA 625 EPA 3510C Rev. 3 1996
EPA 625 EPA 8270D Rev.4 2007 W 38 - 121 46 - 109 <38 3 10
EPA 3550 Rev. 3 2007 EPA 8270D Rev.4 2007 S 49 - 96 51 - 92 <47 130 660
DIETHYL PHTHALATE EPA 625 EPA 3510C Rev. 3 1996
EPA 625 EPA 8270D Rev.4 2007 W 2 10
EPA 3550 Rev. 3 2007 EPA 8270D Rev.4 2007 S 130 660
4-CHLOROPHENYL PHENYL ETHER
EPA 625 EPA 3510C Rev. 3 1996
EPA 625 EPA 8270D Rev.4 2007 W 2 10
EPA 3550 Rev. 3 2007 EPA 8270D Rev.4 2007 S 130 660
FLUORENE EPA 625 EPA 3510C Rev. 3 1996
EPA 625 EPA 8270D Rev.4 2007 W 4 12
EPA 3550 Rev. 3 2007 EPA 8270D Rev.4 2007 S 130 660
4-NITROANILINE EPA 625 EPA 3510C Rev. 3 1996
EPA 625 EPA 8270D Rev.4 2007 W 10 50
EPA 3550 EPA 3550 Rev. 3 2007 EPA 8270D Rev.4 2007 S 660 3300
4,6-DINITRO-2-METHYL PHENOL
EPA 625 EPA 3510C Rev. 3 1996
EPA 625 EPA 8270D Rev.4 2007 W 10 50
EPA 3550 Rev. 3 2007 EPA 8270D Rev.4 2007 S 660 3300
N-NITROSODI-PHENYLAMINE
EPA 625 EPA 3510C Rev. 3 1996
EPA 625 EPA 8270D Rev.4 2007 W 3 10
EPA 3550 Rev. 3 2007 EPA 8270D Rev.4 2007 S 130 660
4-BROMOPHENYL PHENYL ETHER
EPA 625 EPA 3510C Rev. 3 1996
EPA 625 EPA 8270D Rev.4 2007 W 3 10
EPA 3550 Rev. 3 2007 EPA 8270D Rev.4 2007 S 130 660
HEXACHLORO-BENZENE EPA 625 EPA 3510C Rev. 3 1996
EPA 625 EPA 8270D Rev.4 2007 W 2 10
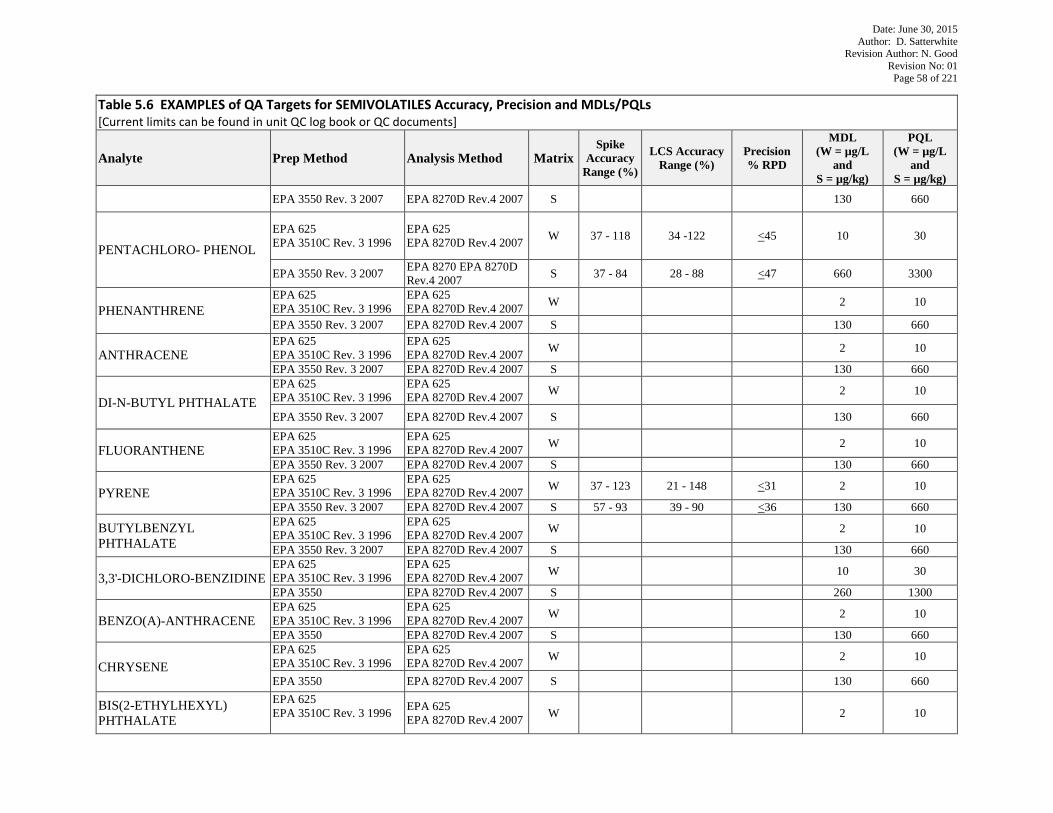
Date: June 30, 2015 Author: D. Satterwhite
Revision Author: N. Good Revision No: 01
Page 58 of 221
Table 5.6 EXAMPLES of QA Targets for SEMIVOLATILES Accuracy, Precision and MDLs/PQLs [Current limits can be found in unit QC log book or QC documents]
Analyte Prep Method Analysis Method Matrix Spike
Accuracy Range (%)
LCS Accuracy Range (%)
Precision % RPD
MDL (W = µg/L
and S = µg/kg)
PQL (W = µg/L
and S = µg/kg)
EPA 3550 Rev. 3 2007 EPA 8270D Rev.4 2007 S 130 660
PENTACHLORO- PHENOL EPA 625 EPA 3510C Rev. 3 1996
EPA 625 EPA 8270D Rev.4 2007 W 37 - 118 34 -122 <45 10 30
EPA 3550 Rev. 3 2007 EPA 8270 EPA 8270D Rev.4 2007 S 37 - 84 28 - 88 <47 660 3300
PHENANTHRENE EPA 625 EPA 3510C Rev. 3 1996
EPA 625 EPA 8270D Rev.4 2007 W 2 10
EPA 3550 Rev. 3 2007 EPA 8270D Rev.4 2007 S 130 660
ANTHRACENE EPA 625 EPA 3510C Rev. 3 1996
EPA 625 EPA 8270D Rev.4 2007 W 2 10
EPA 3550 Rev. 3 2007 EPA 8270D Rev.4 2007 S 130 660
DI-N-BUTYL PHTHALATE EPA 625 EPA 3510C Rev. 3 1996
EPA 625 EPA 8270D Rev.4 2007 W 2 10
EPA 3550 Rev. 3 2007 EPA 8270D Rev.4 2007 S 130 660
FLUORANTHENE EPA 625 EPA 3510C Rev. 3 1996
EPA 625 EPA 8270D Rev.4 2007 W 2 10
EPA 3550 Rev. 3 2007 EPA 8270D Rev.4 2007 S 130 660
PYRENE EPA 625 EPA 3510C Rev. 3 1996
EPA 625 EPA 8270D Rev.4 2007 W 37 - 123 21 - 148 <31 2 10
EPA 3550 Rev. 3 2007 EPA 8270D Rev.4 2007 S 57 - 93 39 - 90 <36 130 660
BUTYLBENZYL PHTHALATE
EPA 625 EPA 3510C Rev. 3 1996
EPA 625 EPA 8270D Rev.4 2007 W 2 10
EPA 3550 Rev. 3 2007 EPA 8270D Rev.4 2007 S 130 660
3,3'-DICHLORO-BENZIDINE EPA 625 EPA 3510C Rev. 3 1996
EPA 625 EPA 8270D Rev.4 2007 W 10 30
EPA 3550 EPA 8270D Rev.4 2007 S 260 1300
BENZO(A)-ANTHRACENE EPA 625 EPA 3510C Rev. 3 1996
EPA 625 EPA 8270D Rev.4 2007 W 2 10
EPA 3550 EPA 8270D Rev.4 2007 S 130 660
CHRYSENE EPA 625 EPA 3510C Rev. 3 1996
EPA 625 EPA 8270D Rev.4 2007 W 2 10
EPA 3550 EPA 8270D Rev.4 2007 S 130 660
BIS(2-ETHYLHEXYL) PHTHALATE
EPA 625 EPA 3510C Rev. 3 1996
EPA 625 EPA 8270D Rev.4 2007 W 2 10
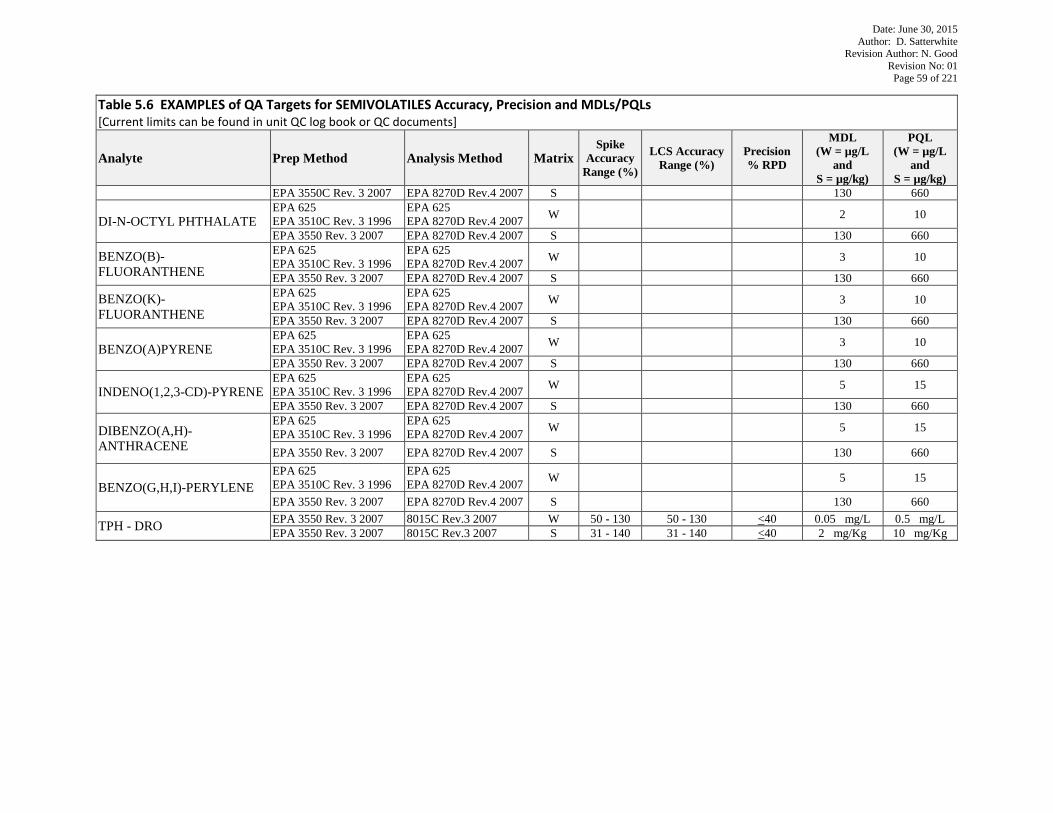
Date: June 30, 2015 Author: D. Satterwhite
Revision Author: N. Good Revision No: 01
Page 59 of 221
Table 5.6 EXAMPLES of QA Targets for SEMIVOLATILES Accuracy, Precision and MDLs/PQLs [Current limits can be found in unit QC log book or QC documents]
Analyte Prep Method Analysis Method Matrix Spike
Accuracy Range (%)
LCS Accuracy Range (%)
Precision % RPD
MDL (W = µg/L
and S = µg/kg)
PQL (W = µg/L
and S = µg/kg)
EPA 3550C Rev. 3 2007 EPA 8270D Rev.4 2007 S 130 660
DI-N-OCTYL PHTHALATE EPA 625 EPA 3510C Rev. 3 1996
EPA 625 EPA 8270D Rev.4 2007 W 2 10
EPA 3550 Rev. 3 2007 EPA 8270D Rev.4 2007 S 130 660
BENZO(B)-FLUORANTHENE
EPA 625 EPA 3510C Rev. 3 1996
EPA 625 EPA 8270D Rev.4 2007 W 3 10
EPA 3550 Rev. 3 2007 EPA 8270D Rev.4 2007 S 130 660
BENZO(K)-FLUORANTHENE
EPA 625 EPA 3510C Rev. 3 1996
EPA 625 EPA 8270D Rev.4 2007 W 3 10
EPA 3550 Rev. 3 2007 EPA 8270D Rev.4 2007 S 130 660
BENZO(A)PYRENE EPA 625 EPA 3510C Rev. 3 1996
EPA 625 EPA 8270D Rev.4 2007 W 3 10
EPA 3550 Rev. 3 2007 EPA 8270D Rev.4 2007 S 130 660
INDENO(1,2,3-CD)-PYRENE EPA 625 EPA 3510C Rev. 3 1996
EPA 625 EPA 8270D Rev.4 2007 W 5 15
EPA 3550 Rev. 3 2007 EPA 8270D Rev.4 2007 S 130 660
DIBENZO(A,H)-ANTHRACENE
EPA 625 EPA 3510C Rev. 3 1996
EPA 625 EPA 8270D Rev.4 2007 W 5 15
EPA 3550 Rev. 3 2007 EPA 8270D Rev.4 2007 S 130 660
BENZO(G,H,I)-PERYLENE EPA 625 EPA 3510C Rev. 3 1996
EPA 625 EPA 8270D Rev.4 2007 W 5 15
EPA 3550 Rev. 3 2007 EPA 8270D Rev.4 2007 S 130 660
TPH - DRO EPA 3550 Rev. 3 2007 8015C Rev.3 2007 W 50 - 130 50 - 130 <40 0.05 mg/L 0.5 mg/L EPA 3550 Rev. 3 2007 8015C Rev.3 2007 S 31 - 140 31 - 140 <40 2 mg/Kg 10 mg/Kg
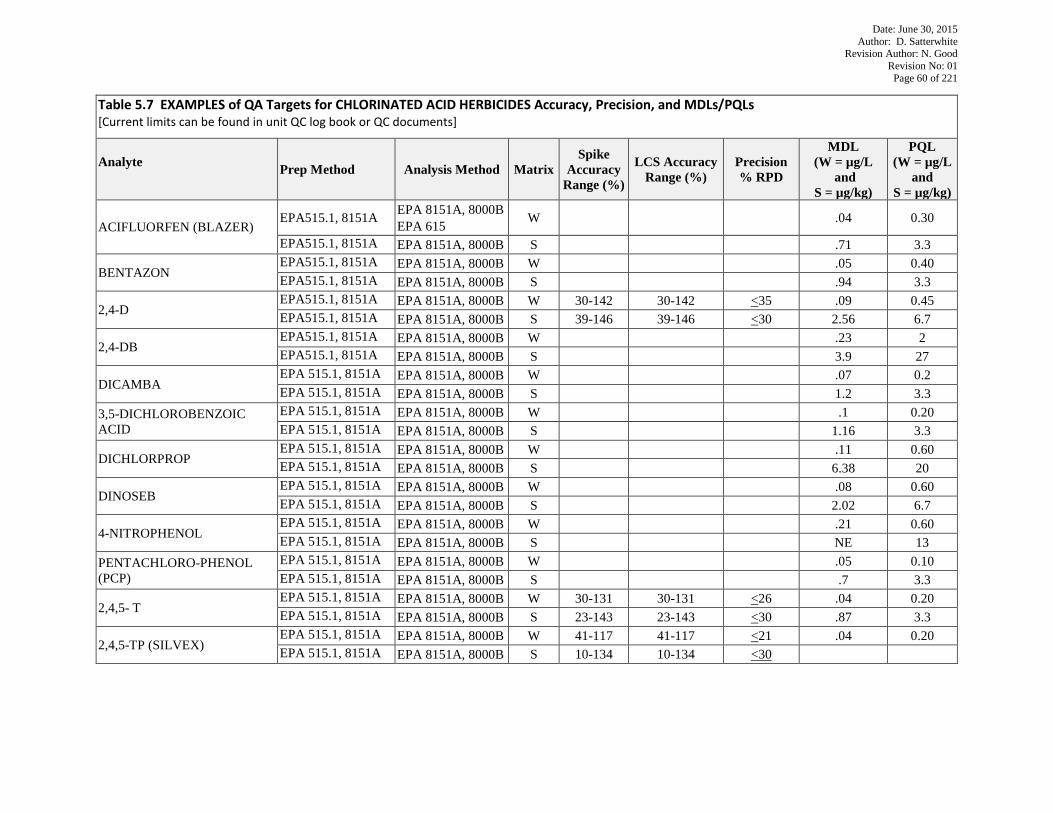
Date: June 30, 2015 Author: D. Satterwhite
Revision Author: N. Good Revision No: 01
Page 60 of 221
Table 5.7 EXAMPLES of QA Targets for CHLORINATED ACID HERBICIDES Accuracy, Precision, and MDLs/PQLs [Current limits can be found in unit QC log book or QC documents]
Analyte Prep Method Analysis Method Matrix
Spike Accuracy
Range (%)
LCS Accuracy Range (%)
Precision % RPD
MDL (W = µg/L
and S = µg/kg)
PQL (W = µg/L
and S = µg/kg)
ACIFLUORFEN (BLAZER) EPA515.1, 8151A EPA 8151A, 8000B
EPA 615 W .04 0.30
EPA515.1, 8151A EPA 8151A, 8000B S .71 3.3
BENTAZON EPA515.1, 8151A EPA 8151A, 8000B W .05 0.40 EPA515.1, 8151A EPA 8151A, 8000B S .94 3.3
2,4-D EPA515.1, 8151A EPA 8151A, 8000B W 30-142 30-142 <35 .09 0.45 EPA515.1, 8151A EPA 8151A, 8000B S 39-146 39-146 <30 2.56 6.7
2,4-DB EPA515.1, 8151A EPA 8151A, 8000B W .23 2 EPA515.1, 8151A EPA 8151A, 8000B S 3.9 27
DICAMBA EPA 515.1, 8151A EPA 8151A, 8000B W .07 0.2 EPA 515.1, 8151A EPA 8151A, 8000B S 1.2 3.3
3,5-DICHLOROBENZOIC ACID
EPA 515.1, 8151A EPA 8151A, 8000B W .1 0.20 EPA 515.1, 8151A EPA 8151A, 8000B S 1.16 3.3
DICHLORPROP EPA 515.1, 8151A EPA 8151A, 8000B W .11 0.60 EPA 515.1, 8151A EPA 8151A, 8000B S 6.38 20
DINOSEB EPA 515.1, 8151A EPA 8151A, 8000B W .08 0.60 EPA 515.1, 8151A EPA 8151A, 8000B S 2.02 6.7
4-NITROPHENOL EPA 515.1, 8151A EPA 8151A, 8000B W .21 0.60 EPA 515.1, 8151A EPA 8151A, 8000B S NE 13
PENTACHLORO-PHENOL (PCP)
EPA 515.1, 8151A EPA 8151A, 8000B W .05 0.10 EPA 515.1, 8151A EPA 8151A, 8000B S .7 3.3
2,4,5- T EPA 515.1, 8151A EPA 8151A, 8000B W 30-131 30-131 <26 .04 0.20 EPA 515.1, 8151A EPA 8151A, 8000B S 23-143 23-143 <30 .87 3.3
2,4,5-TP (SILVEX) EPA 515.1, 8151A EPA 8151A, 8000B W 41-117 41-117 <21 .04 0.20 EPA 515.1, 8151A EPA 8151A, 8000B S 10-134 10-134 <30
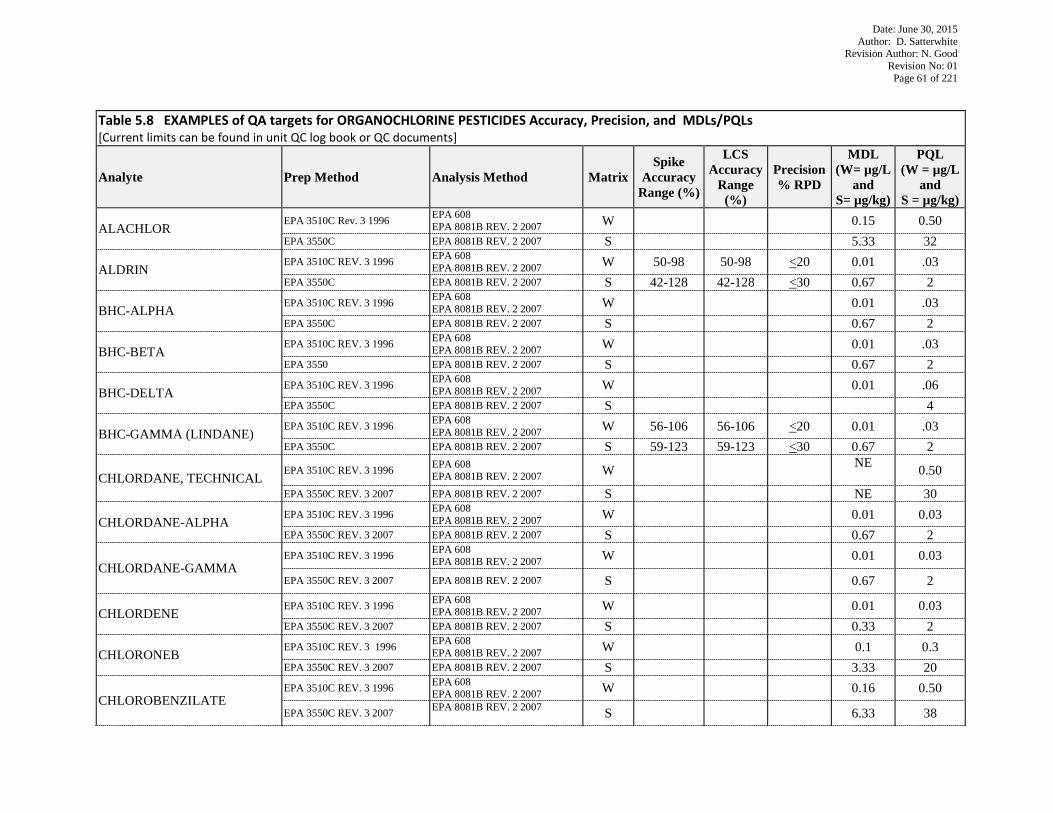
Date: June 30, 2015 Author: D. Satterwhite
Revision Author: N. Good Revision No: 01
Page 61 of 221
Table 5.8 EXAMPLES of QA targets for ORGANOCHLORINE PESTICIDES Accuracy, Precision, and MDLs/PQLs [Current limits can be found in unit QC log book or QC documents]
Analyte Prep Method Analysis Method Matrix Spike
Accuracy Range (%)
LCS Accuracy
Range (%)
Precision % RPD
MDL (W= µg/L
and S= µg/kg)
PQL (W = µg/L
and S = µg/kg)
ALACHLOR EPA 3510C Rev. 3 1996 EPA 608
EPA 8081B REV. 2 2007 W 0.15 0.50 EPA 3550C EPA 8081B REV. 2 2007 S 5.33 32
ALDRIN EPA 3510C REV. 3 1996 EPA 608
EPA 8081B REV. 2 2007 W 50-98 50-98 <20 0.01 .03 EPA 3550C EPA 8081B REV. 2 2007 S 42-128 42-128 <30 0.67 2
BHC-ALPHA EPA 3510C REV. 3 1996 EPA 608
EPA 8081B REV. 2 2007 W 0.01 .03 EPA 3550C EPA 8081B REV. 2 2007 S 0.67 2
BHC-BETA EPA 3510C REV. 3 1996 EPA 608
EPA 8081B REV. 2 2007 W 0.01 .03 EPA 3550 EPA 8081B REV. 2 2007 S 0.67 2
BHC-DELTA EPA 3510C REV. 3 1996 EPA 608
EPA 8081B REV. 2 2007 W 0.01 .06 EPA 3550C EPA 8081B REV. 2 2007 S 4
BHC-GAMMA (LINDANE) EPA 3510C REV. 3 1996 EPA 608
EPA 8081B REV. 2 2007 W 56-106 56-106 <20 0.01 .03 EPA 3550C EPA 8081B REV. 2 2007 S 59-123 59-123 <30 0.67 2
CHLORDANE, TECHNICAL EPA 3510C REV. 3 1996 EPA 608
EPA 8081B REV. 2 2007 W NE 0.50
EPA 3550C REV. 3 2007 EPA 8081B REV. 2 2007 S NE 30
CHLORDANE-ALPHA EPA 3510C REV. 3 1996 EPA 608
EPA 8081B REV. 2 2007 W 0.01 0.03 EPA 3550C REV. 3 2007 EPA 8081B REV. 2 2007 S 0.67 2
CHLORDANE-GAMMA EPA 3510C REV. 3 1996 EPA 608
EPA 8081B REV. 2 2007 W 0.01 0.03
EPA 3550C REV. 3 2007 EPA 8081B REV. 2 2007 S 0.67 2
CHLORDENE EPA 3510C REV. 3 1996 EPA 608
EPA 8081B REV. 2 2007 W 0.01 0.03 EPA 3550C REV. 3 2007 EPA 8081B REV. 2 2007 S 0.33 2
CHLORONEB EPA 3510C REV. 3 1996 EPA 608
EPA 8081B REV. 2 2007 W 0.1 0.3 EPA 3550C REV. 3 2007 EPA 8081B REV. 2 2007 S 3.33 20
CHLOROBENZILATE EPA 3510C REV. 3 1996 EPA 608
EPA 8081B REV. 2 2007 W 0.16 0.50
EPA 3550C REV. 3 2007 EPA 8081B REV. 2 2007 S 6.33 38
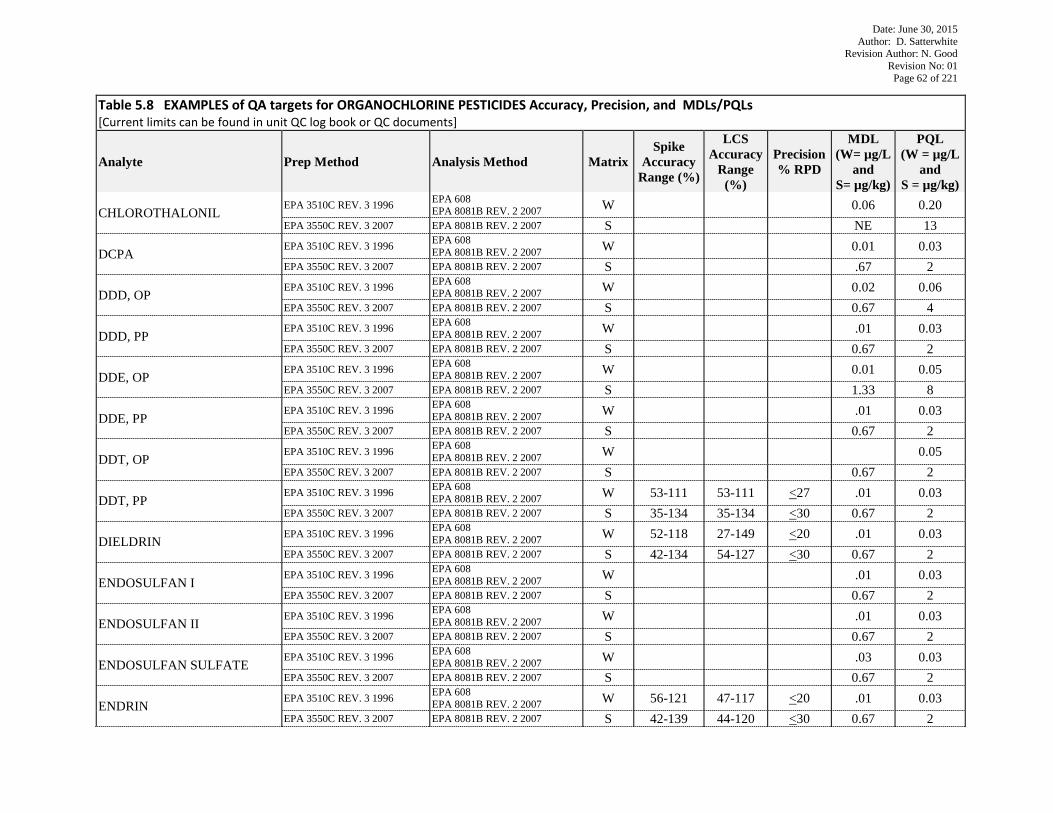
Date: June 30, 2015 Author: D. Satterwhite
Revision Author: N. Good Revision No: 01
Page 62 of 221
Table 5.8 EXAMPLES of QA targets for ORGANOCHLORINE PESTICIDES Accuracy, Precision, and MDLs/PQLs [Current limits can be found in unit QC log book or QC documents]
Analyte Prep Method Analysis Method Matrix Spike
Accuracy Range (%)
LCS Accuracy
Range (%)
Precision % RPD
MDL (W= µg/L
and S= µg/kg)
PQL (W = µg/L
and S = µg/kg)
CHLOROTHALONIL EPA 3510C REV. 3 1996 EPA 608
EPA 8081B REV. 2 2007 W 0.06 0.20 EPA 3550C REV. 3 2007 EPA 8081B REV. 2 2007 S NE 13
DCPA EPA 3510C REV. 3 1996 EPA 608
EPA 8081B REV. 2 2007 W 0.01 0.03 EPA 3550C REV. 3 2007 EPA 8081B REV. 2 2007 S .67 2
DDD, OP EPA 3510C REV. 3 1996 EPA 608
EPA 8081B REV. 2 2007 W 0.02 0.06 EPA 3550C REV. 3 2007 EPA 8081B REV. 2 2007 S 0.67 4
DDD, PP EPA 3510C REV. 3 1996 EPA 608
EPA 8081B REV. 2 2007 W .01 0.03 EPA 3550C REV. 3 2007 EPA 8081B REV. 2 2007 S 0.67 2
DDE, OP EPA 3510C REV. 3 1996 EPA 608
EPA 8081B REV. 2 2007 W 0.01 0.05 EPA 3550C REV. 3 2007 EPA 8081B REV. 2 2007 S 1.33 8
DDE, PP EPA 3510C REV. 3 1996 EPA 608
EPA 8081B REV. 2 2007 W .01 0.03 EPA 3550C REV. 3 2007 EPA 8081B REV. 2 2007 S 0.67 2
DDT, OP EPA 3510C REV. 3 1996 EPA 608
EPA 8081B REV. 2 2007 W 0.05 EPA 3550C REV. 3 2007 EPA 8081B REV. 2 2007 S 0.67 2
DDT, PP EPA 3510C REV. 3 1996 EPA 608
EPA 8081B REV. 2 2007 W 53-111 53-111 <27 .01 0.03 EPA 3550C REV. 3 2007 EPA 8081B REV. 2 2007 S 35-134 35-134 <30 0.67 2
DIELDRIN EPA 3510C REV. 3 1996 EPA 608
EPA 8081B REV. 2 2007 W 52-118 27-149 <20 .01 0.03 EPA 3550C REV. 3 2007 EPA 8081B REV. 2 2007 S 42-134 54-127 <30 0.67 2
ENDOSULFAN I EPA 3510C REV. 3 1996 EPA 608
EPA 8081B REV. 2 2007 W .01 0.03 EPA 3550C REV. 3 2007 EPA 8081B REV. 2 2007 S 0.67 2
ENDOSULFAN II EPA 3510C REV. 3 1996 EPA 608
EPA 8081B REV. 2 2007 W .01 0.03 EPA 3550C REV. 3 2007 EPA 8081B REV. 2 2007 S 0.67 2
ENDOSULFAN SULFATE EPA 3510C REV. 3 1996 EPA 608
EPA 8081B REV. 2 2007 W .03 0.03 EPA 3550C REV. 3 2007 EPA 8081B REV. 2 2007 S 0.67 2
ENDRIN EPA 3510C REV. 3 1996 EPA 608
EPA 8081B REV. 2 2007 W 56-121 47-117 <20 .01 0.03 EPA 3550C REV. 3 2007 EPA 8081B REV. 2 2007 S 42-139 44-120 <30 0.67 2
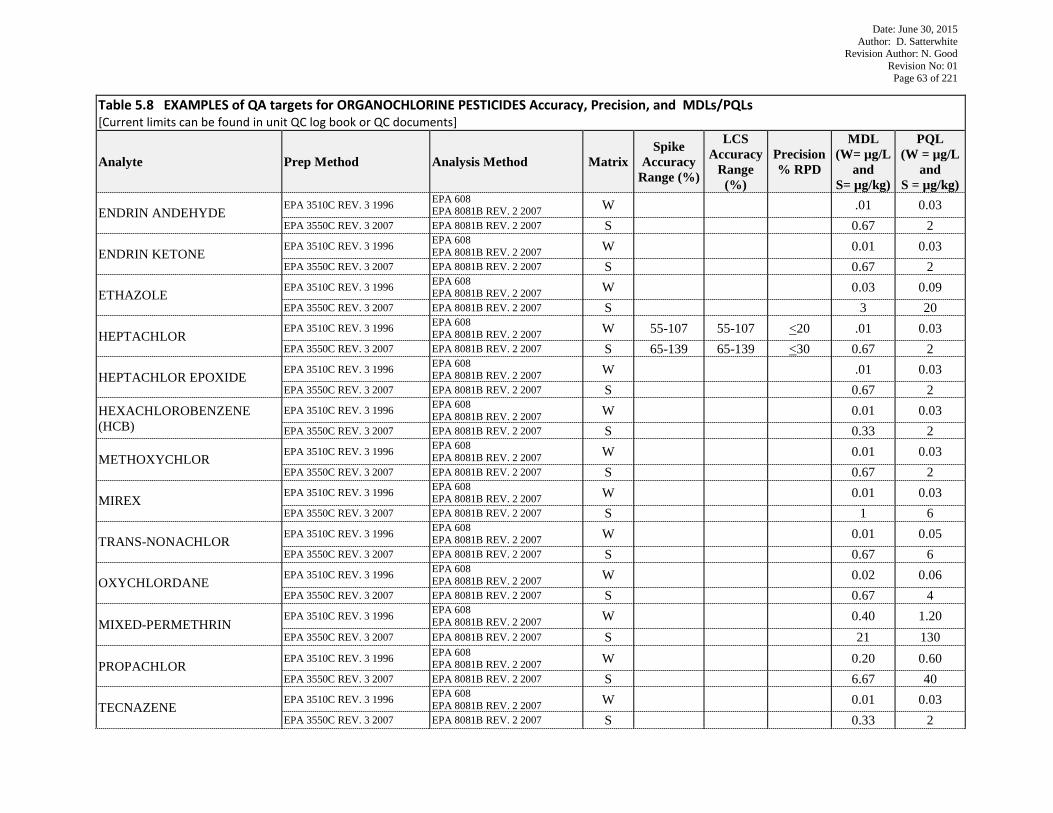
Date: June 30, 2015 Author: D. Satterwhite
Revision Author: N. Good Revision No: 01
Page 63 of 221
Table 5.8 EXAMPLES of QA targets for ORGANOCHLORINE PESTICIDES Accuracy, Precision, and MDLs/PQLs [Current limits can be found in unit QC log book or QC documents]
Analyte Prep Method Analysis Method Matrix Spike
Accuracy Range (%)
LCS Accuracy
Range (%)
Precision % RPD
MDL (W= µg/L
and S= µg/kg)
PQL (W = µg/L
and S = µg/kg)
ENDRIN ANDEHYDE EPA 3510C REV. 3 1996 EPA 608
EPA 8081B REV. 2 2007 W .01 0.03 EPA 3550C REV. 3 2007 EPA 8081B REV. 2 2007 S 0.67 2
ENDRIN KETONE EPA 3510C REV. 3 1996 EPA 608
EPA 8081B REV. 2 2007 W 0.01 0.03 EPA 3550C REV. 3 2007 EPA 8081B REV. 2 2007 S 0.67 2
ETHAZOLE EPA 3510C REV. 3 1996 EPA 608
EPA 8081B REV. 2 2007 W 0.03 0.09 EPA 3550C REV. 3 2007 EPA 8081B REV. 2 2007 S 3 20
HEPTACHLOR EPA 3510C REV. 3 1996 EPA 608
EPA 8081B REV. 2 2007 W 55-107 55-107 <20 .01 0.03 EPA 3550C REV. 3 2007 EPA 8081B REV. 2 2007 S 65-139 65-139 <30 0.67 2
HEPTACHLOR EPOXIDE EPA 3510C REV. 3 1996 EPA 608
EPA 8081B REV. 2 2007 W .01 0.03 EPA 3550C REV. 3 2007 EPA 8081B REV. 2 2007 S 0.67 2
HEXACHLOROBENZENE (HCB)
EPA 3510C REV. 3 1996 EPA 608 EPA 8081B REV. 2 2007 W 0.01 0.03
EPA 3550C REV. 3 2007 EPA 8081B REV. 2 2007 S 0.33 2
METHOXYCHLOR EPA 3510C REV. 3 1996 EPA 608
EPA 8081B REV. 2 2007 W 0.01 0.03 EPA 3550C REV. 3 2007 EPA 8081B REV. 2 2007 S 0.67 2
MIREX EPA 3510C REV. 3 1996 EPA 608
EPA 8081B REV. 2 2007 W 0.01 0.03 EPA 3550C REV. 3 2007 EPA 8081B REV. 2 2007 S 1 6
TRANS-NONACHLOR EPA 3510C REV. 3 1996 EPA 608
EPA 8081B REV. 2 2007 W 0.01 0.05 EPA 3550C REV. 3 2007 EPA 8081B REV. 2 2007 S 0.67 6
OXYCHLORDANE EPA 3510C REV. 3 1996 EPA 608
EPA 8081B REV. 2 2007 W 0.02 0.06 EPA 3550C REV. 3 2007 EPA 8081B REV. 2 2007 S 0.67 4
MIXED-PERMETHRIN EPA 3510C REV. 3 1996 EPA 608
EPA 8081B REV. 2 2007 W 0.40 1.20 EPA 3550C REV. 3 2007 EPA 8081B REV. 2 2007 S 21 130
PROPACHLOR EPA 3510C REV. 3 1996 EPA 608
EPA 8081B REV. 2 2007 W 0.20 0.60 EPA 3550C REV. 3 2007 EPA 8081B REV. 2 2007 S 6.67 40
TECNAZENE EPA 3510C REV. 3 1996 EPA 608
EPA 8081B REV. 2 2007 W 0.01 0.03 EPA 3550C REV. 3 2007 EPA 8081B REV. 2 2007 S 0.33 2
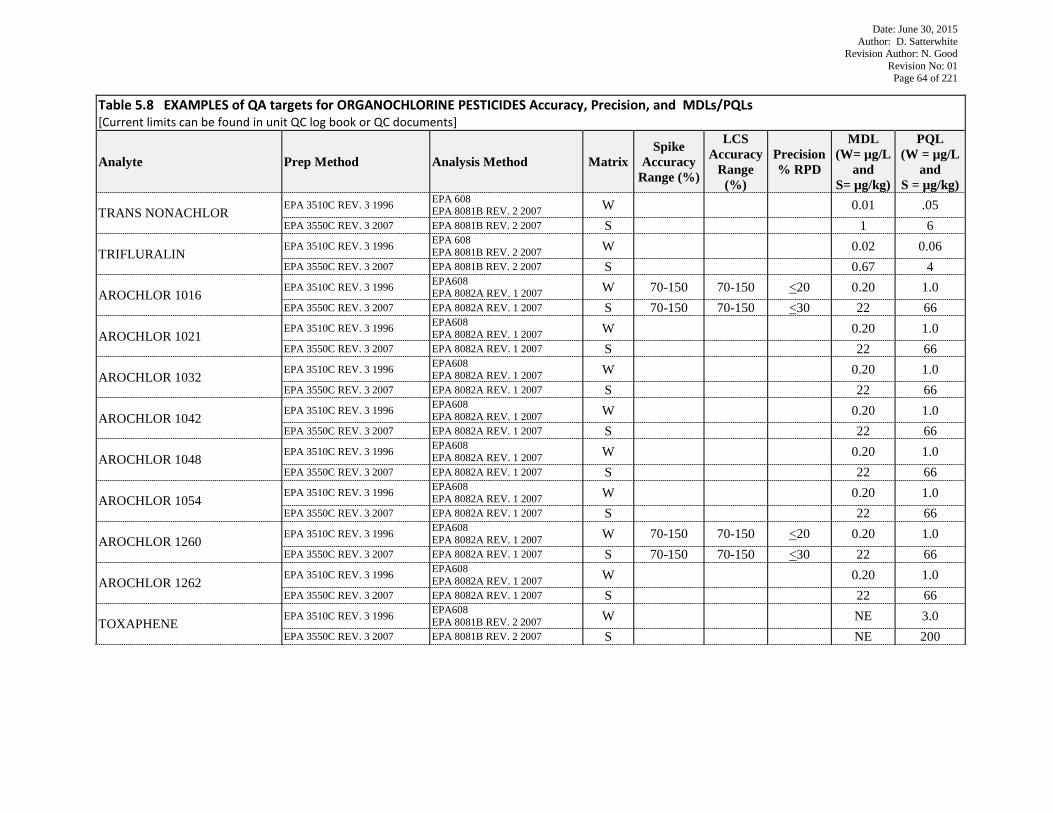
Date: June 30, 2015 Author: D. Satterwhite
Revision Author: N. Good Revision No: 01
Page 64 of 221
Table 5.8 EXAMPLES of QA targets for ORGANOCHLORINE PESTICIDES Accuracy, Precision, and MDLs/PQLs [Current limits can be found in unit QC log book or QC documents]
Analyte Prep Method Analysis Method Matrix Spike
Accuracy Range (%)
LCS Accuracy
Range (%)
Precision % RPD
MDL (W= µg/L
and S= µg/kg)
PQL (W = µg/L
and S = µg/kg)
TRANS NONACHLOR EPA 3510C REV. 3 1996 EPA 608
EPA 8081B REV. 2 2007 W 0.01 .05 EPA 3550C REV. 3 2007 EPA 8081B REV. 2 2007 S 1 6
TRIFLURALIN EPA 3510C REV. 3 1996 EPA 608
EPA 8081B REV. 2 2007 W 0.02 0.06 EPA 3550C REV. 3 2007 EPA 8081B REV. 2 2007 S 0.67 4
AROCHLOR 1016 EPA 3510C REV. 3 1996 EPA608
EPA 8082A REV. 1 2007 W 70-150 70-150 <20 0.20 1.0 EPA 3550C REV. 3 2007 EPA 8082A REV. 1 2007 S 70-150 70-150 <30 22 66
AROCHLOR 1021 EPA 3510C REV. 3 1996 EPA608
EPA 8082A REV. 1 2007 W 0.20 1.0 EPA 3550C REV. 3 2007 EPA 8082A REV. 1 2007 S 22 66
AROCHLOR 1032 EPA 3510C REV. 3 1996 EPA608
EPA 8082A REV. 1 2007 W 0.20 1.0 EPA 3550C REV. 3 2007 EPA 8082A REV. 1 2007 S 22 66
AROCHLOR 1042 EPA 3510C REV. 3 1996 EPA608
EPA 8082A REV. 1 2007 W 0.20 1.0 EPA 3550C REV. 3 2007 EPA 8082A REV. 1 2007 S 22 66
AROCHLOR 1048 EPA 3510C REV. 3 1996 EPA608
EPA 8082A REV. 1 2007 W 0.20 1.0 EPA 3550C REV. 3 2007 EPA 8082A REV. 1 2007 S 22 66
AROCHLOR 1054 EPA 3510C REV. 3 1996 EPA608
EPA 8082A REV. 1 2007 W 0.20 1.0 EPA 3550C REV. 3 2007 EPA 8082A REV. 1 2007 S 22 66
AROCHLOR 1260 EPA 3510C REV. 3 1996 EPA608
EPA 8082A REV. 1 2007 W 70-150 70-150 <20 0.20 1.0 EPA 3550C REV. 3 2007 EPA 8082A REV. 1 2007 S 70-150 70-150 <30 22 66
AROCHLOR 1262 EPA 3510C REV. 3 1996 EPA608
EPA 8082A REV. 1 2007 W 0.20 1.0 EPA 3550C REV. 3 2007 EPA 8082A REV. 1 2007 S 22 66
TOXAPHENE EPA 3510C REV. 3 1996 EPA608
EPA 8081B REV. 2 2007 W NE 3.0 EPA 3550C REV. 3 2007 EPA 8081B REV. 2 2007 S NE 200
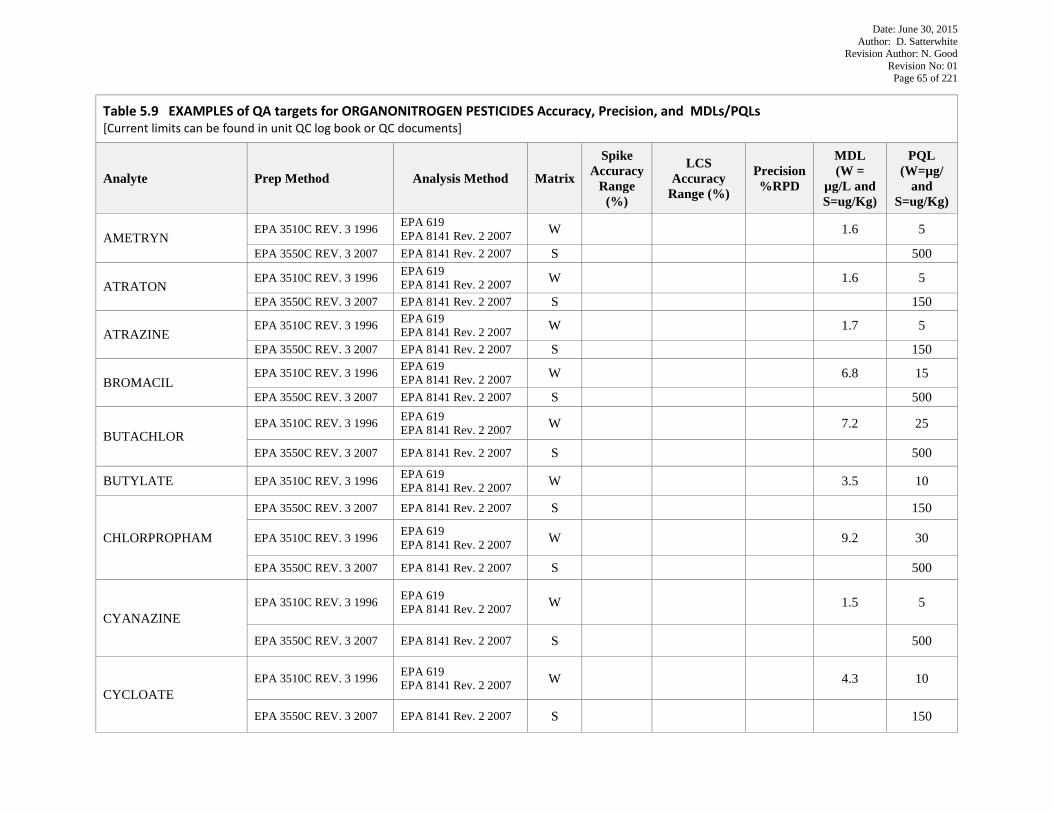
Date: June 30, 2015 Author: D. Satterwhite
Revision Author: N. Good Revision No: 01
Page 65 of 221
Table 5.9 EXAMPLES of QA targets for ORGANONITROGEN PESTICIDES Accuracy, Precision, and MDLs/PQLs [Current limits can be found in unit QC log book or QC documents]
Analyte Prep Method Analysis Method Matrix
Spike Accuracy
Range (%)
LCS Accuracy
Range (%)
Precision %RPD
MDL (W =
µg/L and S=ug/Kg)
PQL (W=µg/
and S=ug/Kg)
AMETRYN EPA 3510C REV. 3 1996 EPA 619
EPA 8141 Rev. 2 2007 W 1.6 5
EPA 3550C REV. 3 2007 EPA 8141 Rev. 2 2007 S 500
ATRATON EPA 3510C REV. 3 1996 EPA 619
EPA 8141 Rev. 2 2007 W 1.6 5
EPA 3550C REV. 3 2007 EPA 8141 Rev. 2 2007 S 150
ATRAZINE EPA 3510C REV. 3 1996 EPA 619
EPA 8141 Rev. 2 2007 W 1.7 5
EPA 3550C REV. 3 2007 EPA 8141 Rev. 2 2007 S 150
BROMACIL EPA 3510C REV. 3 1996 EPA 619
EPA 8141 Rev. 2 2007 W 6.8 15
EPA 3550C REV. 3 2007 EPA 8141 Rev. 2 2007 S 500
BUTACHLOR EPA 3510C REV. 3 1996 EPA 619
EPA 8141 Rev. 2 2007 W 7.2 25
EPA 3550C REV. 3 2007 EPA 8141 Rev. 2 2007 S 500
BUTYLATE EPA 3510C REV. 3 1996 EPA 619 EPA 8141 Rev. 2 2007 W 3.5 10
CHLORPROPHAM
EPA 3550C REV. 3 2007 EPA 8141 Rev. 2 2007 S 150
EPA 3510C REV. 3 1996 EPA 619 EPA 8141 Rev. 2 2007 W 9.2 30
EPA 3550C REV. 3 2007 EPA 8141 Rev. 2 2007 S 500
CYANAZINE EPA 3510C REV. 3 1996 EPA 619
EPA 8141 Rev. 2 2007 W 1.5 5
EPA 3550C REV. 3 2007 EPA 8141 Rev. 2 2007 S 500
CYCLOATE EPA 3510C REV. 3 1996 EPA 619
EPA 8141 Rev. 2 2007 W 4.3 10
EPA 3550C REV. 3 2007 EPA 8141 Rev. 2 2007 S 150
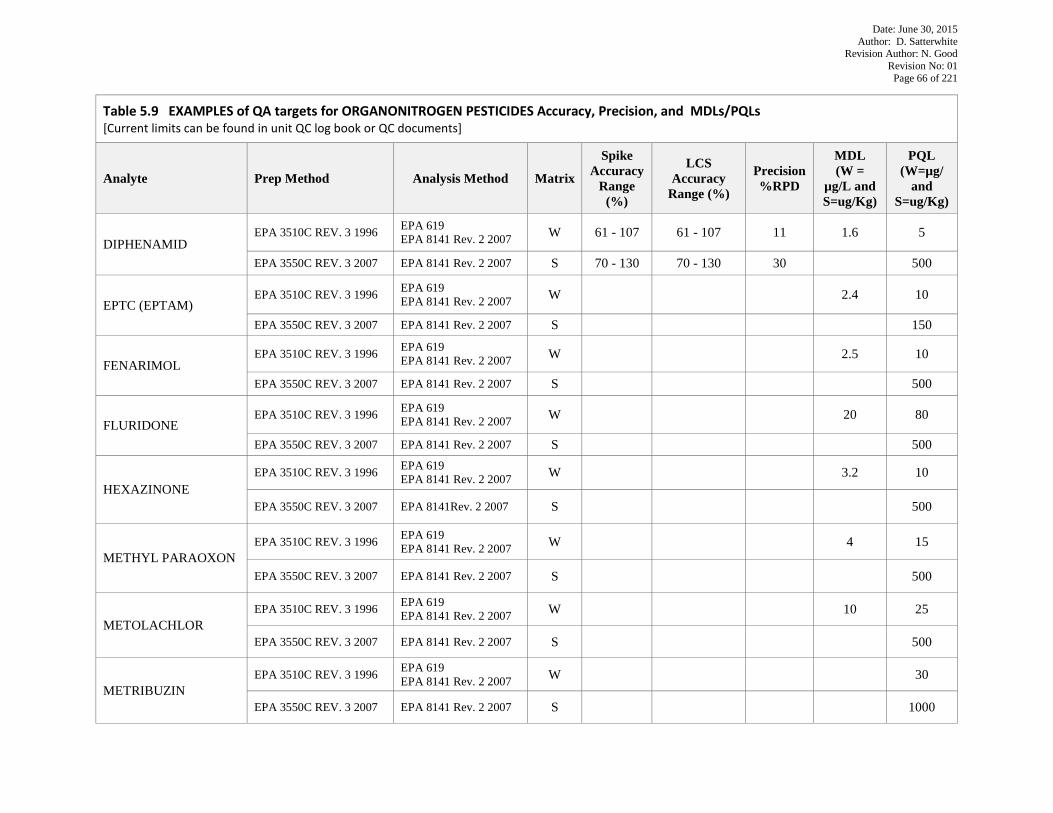
Date: June 30, 2015 Author: D. Satterwhite
Revision Author: N. Good Revision No: 01
Page 66 of 221
Table 5.9 EXAMPLES of QA targets for ORGANONITROGEN PESTICIDES Accuracy, Precision, and MDLs/PQLs [Current limits can be found in unit QC log book or QC documents]
Analyte Prep Method Analysis Method Matrix
Spike Accuracy
Range (%)
LCS Accuracy
Range (%)
Precision %RPD
MDL (W =
µg/L and S=ug/Kg)
PQL (W=µg/
and S=ug/Kg)
DIPHENAMID EPA 3510C REV. 3 1996 EPA 619
EPA 8141 Rev. 2 2007 W 61 - 107 61 - 107 11 1.6 5
EPA 3550C REV. 3 2007 EPA 8141 Rev. 2 2007 S 70 - 130 70 - 130 30 500
EPTC (EPTAM) EPA 3510C REV. 3 1996 EPA 619
EPA 8141 Rev. 2 2007 W 2.4 10
EPA 3550C REV. 3 2007 EPA 8141 Rev. 2 2007 S 150
FENARIMOL EPA 3510C REV. 3 1996 EPA 619
EPA 8141 Rev. 2 2007 W 2.5 10
EPA 3550C REV. 3 2007 EPA 8141 Rev. 2 2007 S 500
FLURIDONE EPA 3510C REV. 3 1996 EPA 619
EPA 8141 Rev. 2 2007 W 20 80
EPA 3550C REV. 3 2007 EPA 8141 Rev. 2 2007 S 500
HEXAZINONE EPA 3510C REV. 3 1996 EPA 619
EPA 8141 Rev. 2 2007 W 3.2 10
EPA 3550C REV. 3 2007 EPA 8141Rev. 2 2007 S 500
METHYL PARAOXON EPA 3510C REV. 3 1996 EPA 619
EPA 8141 Rev. 2 2007 W 4 15
EPA 3550C REV. 3 2007 EPA 8141 Rev. 2 2007 S 500
METOLACHLOR EPA 3510C REV. 3 1996 EPA 619
EPA 8141 Rev. 2 2007 W 10 25
EPA 3550C REV. 3 2007 EPA 8141 Rev. 2 2007 S 500
METRIBUZIN EPA 3510C REV. 3 1996 EPA 619
EPA 8141 Rev. 2 2007 W 30
EPA 3550C REV. 3 2007 EPA 8141 Rev. 2 2007 S 1000
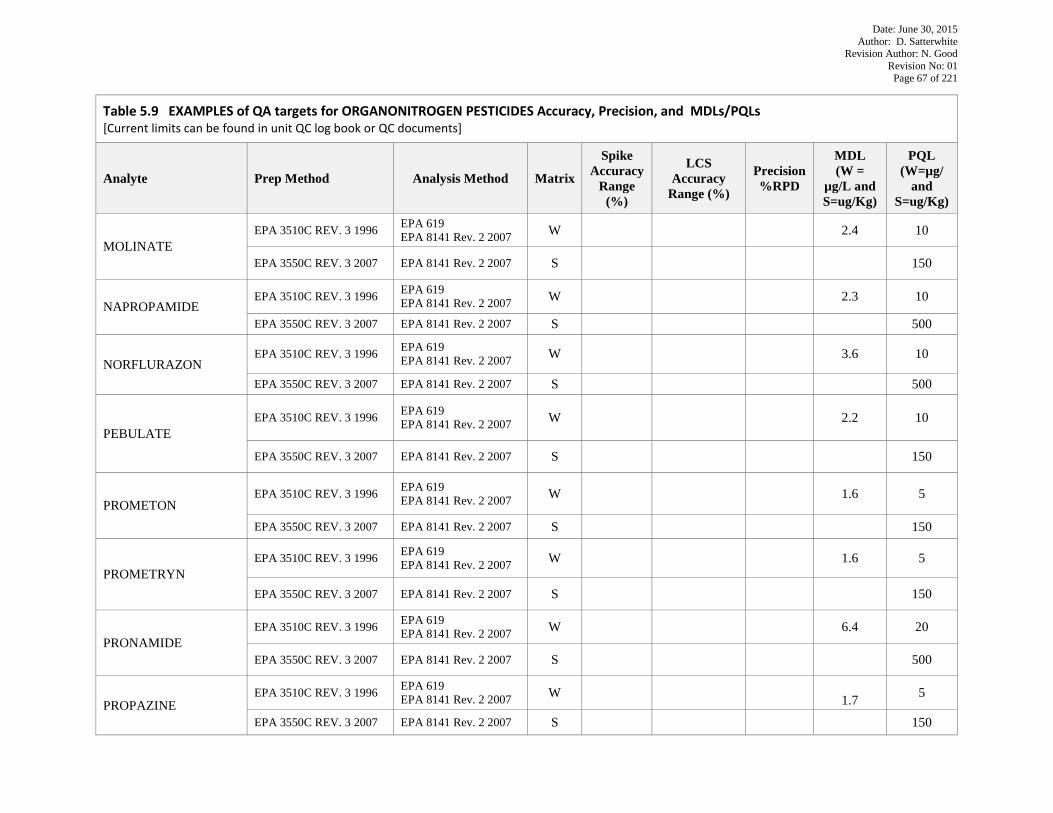
Date: June 30, 2015 Author: D. Satterwhite
Revision Author: N. Good Revision No: 01
Page 67 of 221
Table 5.9 EXAMPLES of QA targets for ORGANONITROGEN PESTICIDES Accuracy, Precision, and MDLs/PQLs [Current limits can be found in unit QC log book or QC documents]
Analyte Prep Method Analysis Method Matrix
Spike Accuracy
Range (%)
LCS Accuracy
Range (%)
Precision %RPD
MDL (W =
µg/L and S=ug/Kg)
PQL (W=µg/
and S=ug/Kg)
MOLINATE EPA 3510C REV. 3 1996 EPA 619
EPA 8141 Rev. 2 2007 W 2.4 10
EPA 3550C REV. 3 2007 EPA 8141 Rev. 2 2007 S 150
NAPROPAMIDE EPA 3510C REV. 3 1996 EPA 619
EPA 8141 Rev. 2 2007 W 2.3 10
EPA 3550C REV. 3 2007 EPA 8141 Rev. 2 2007 S 500
NORFLURAZON EPA 3510C REV. 3 1996 EPA 619
EPA 8141 Rev. 2 2007 W 3.6 10
EPA 3550C REV. 3 2007 EPA 8141 Rev. 2 2007 S 500
PEBULATE EPA 3510C REV. 3 1996 EPA 619
EPA 8141 Rev. 2 2007 W 2.2 10
EPA 3550C REV. 3 2007 EPA 8141 Rev. 2 2007 S 150
PROMETON EPA 3510C REV. 3 1996 EPA 619
EPA 8141 Rev. 2 2007 W 1.6 5
EPA 3550C REV. 3 2007 EPA 8141 Rev. 2 2007 S 150
PROMETRYN EPA 3510C REV. 3 1996 EPA 619
EPA 8141 Rev. 2 2007 W 1.6 5
EPA 3550C REV. 3 2007 EPA 8141 Rev. 2 2007 S 150
PRONAMIDE EPA 3510C REV. 3 1996 EPA 619
EPA 8141 Rev. 2 2007 W 6.4 20
EPA 3550C REV. 3 2007 EPA 8141 Rev. 2 2007 S 500
PROPAZINE EPA 3510C REV. 3 1996 EPA 619
EPA 8141 Rev. 2 2007 W 1.7 5
EPA 3550C REV. 3 2007 EPA 8141 Rev. 2 2007 S 150
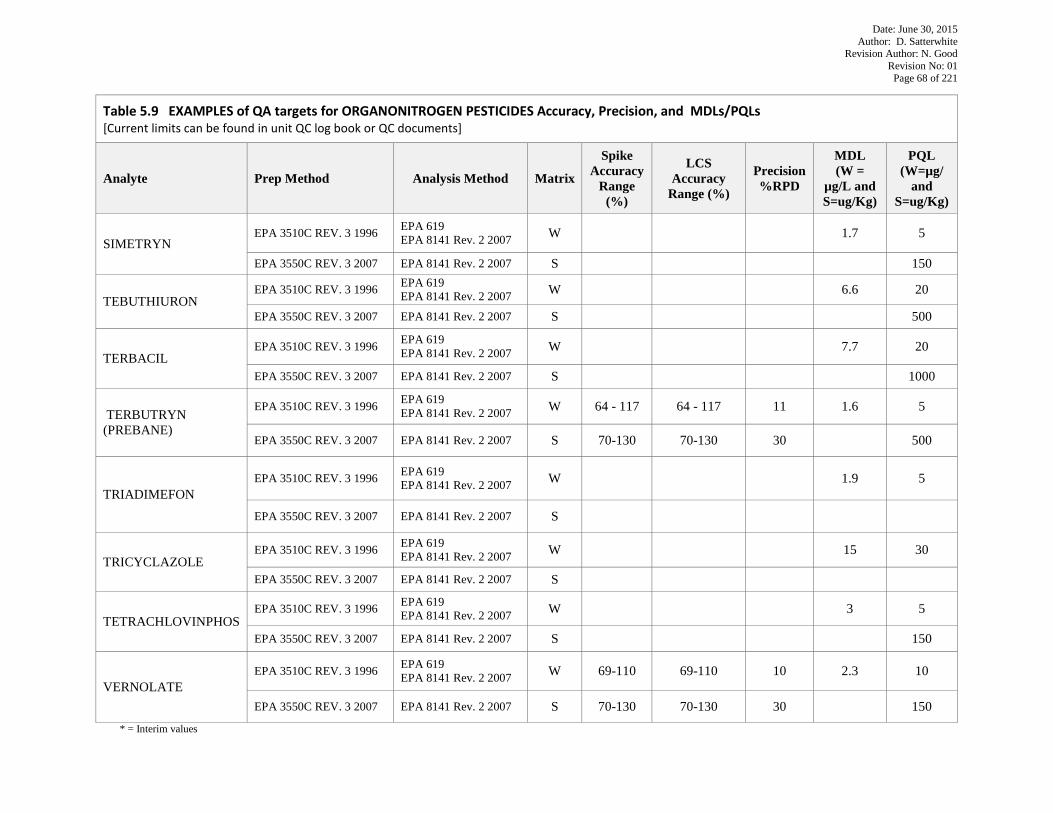
Date: June 30, 2015 Author: D. Satterwhite
Revision Author: N. Good Revision No: 01
Page 68 of 221
Table 5.9 EXAMPLES of QA targets for ORGANONITROGEN PESTICIDES Accuracy, Precision, and MDLs/PQLs [Current limits can be found in unit QC log book or QC documents]
Analyte Prep Method Analysis Method Matrix
Spike Accuracy
Range (%)
LCS Accuracy
Range (%)
Precision %RPD
MDL (W =
µg/L and S=ug/Kg)
PQL (W=µg/
and S=ug/Kg)
SIMETRYN EPA 3510C REV. 3 1996 EPA 619
EPA 8141 Rev. 2 2007 W 1.7 5
EPA 3550C REV. 3 2007 EPA 8141 Rev. 2 2007 S 150
TEBUTHIURON EPA 3510C REV. 3 1996 EPA 619
EPA 8141 Rev. 2 2007 W 6.6 20
EPA 3550C REV. 3 2007 EPA 8141 Rev. 2 2007 S 500
TERBACIL EPA 3510C REV. 3 1996 EPA 619
EPA 8141 Rev. 2 2007 W 7.7 20
EPA 3550C REV. 3 2007 EPA 8141 Rev. 2 2007 S 1000
TERBUTRYN (PREBANE)
EPA 3510C REV. 3 1996 EPA 619 EPA 8141 Rev. 2 2007 W 64 - 117 64 - 117 11 1.6 5
EPA 3550C REV. 3 2007 EPA 8141 Rev. 2 2007 S 70-130 70-130 30 500
TRIADIMEFON EPA 3510C REV. 3 1996 EPA 619
EPA 8141 Rev. 2 2007 W 1.9 5
EPA 3550C REV. 3 2007 EPA 8141 Rev. 2 2007 S
TRICYCLAZOLE EPA 3510C REV. 3 1996 EPA 619
EPA 8141 Rev. 2 2007 W 15 30
EPA 3550C REV. 3 2007 EPA 8141 Rev. 2 2007 S
TETRACHLOVINPHOS EPA 3510C REV. 3 1996 EPA 619
EPA 8141 Rev. 2 2007 W 3 5
EPA 3550C REV. 3 2007 EPA 8141 Rev. 2 2007 S 150
VERNOLATE EPA 3510C REV. 3 1996 EPA 619
EPA 8141 Rev. 2 2007 W 69-110 69-110 10 2.3 10
EPA 3550C REV. 3 2007 EPA 8141 Rev. 2 2007 S 70-130 70-130 30 150 * = Interim values
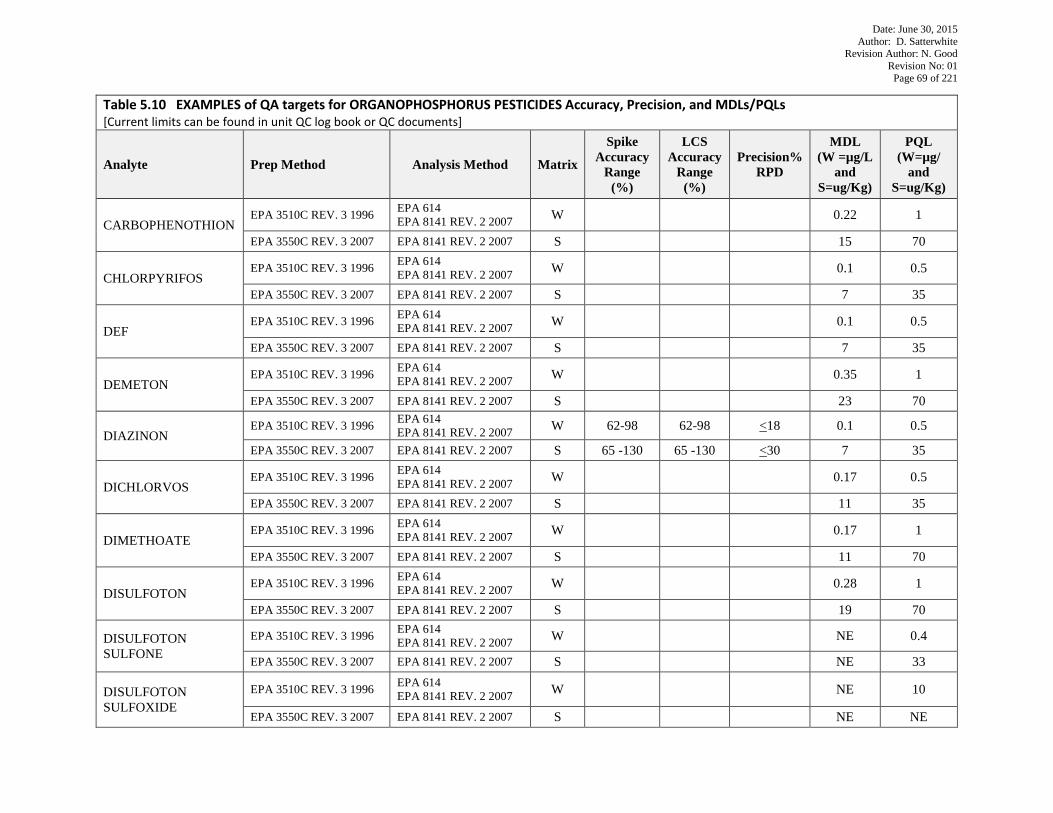
Date: June 30, 2015 Author: D. Satterwhite
Revision Author: N. Good Revision No: 01
Page 69 of 221
Table 5.10 EXAMPLES of QA targets for ORGANOPHOSPHORUS PESTICIDES Accuracy, Precision, and MDLs/PQLs [Current limits can be found in unit QC log book or QC documents]
Analyte Prep Method Analysis Method Matrix
Spike Accuracy
Range (%)
LCS Accuracy
Range (%)
Precision% RPD
MDL (W =µg/L
and S=ug/Kg)
PQL (W=µg/
and S=ug/Kg)
CARBOPHENOTHION EPA 3510C REV. 3 1996 EPA 614
EPA 8141 REV. 2 2007 W 0.22 1
EPA 3550C REV. 3 2007 EPA 8141 REV. 2 2007 S 15 70
CHLORPYRIFOS EPA 3510C REV. 3 1996 EPA 614
EPA 8141 REV. 2 2007 W 0.1 0.5
EPA 3550C REV. 3 2007 EPA 8141 REV. 2 2007 S 7 35
DEF EPA 3510C REV. 3 1996 EPA 614
EPA 8141 REV. 2 2007 W 0.1 0.5
EPA 3550C REV. 3 2007 EPA 8141 REV. 2 2007 S 7 35
DEMETON EPA 3510C REV. 3 1996 EPA 614
EPA 8141 REV. 2 2007 W 0.35 1
EPA 3550C REV. 3 2007 EPA 8141 REV. 2 2007 S 23 70
DIAZINON EPA 3510C REV. 3 1996 EPA 614
EPA 8141 REV. 2 2007 W 62-98 62-98 <18 0.1 0.5
EPA 3550C REV. 3 2007 EPA 8141 REV. 2 2007 S 65 -130 65 -130 <30 7 35
DICHLORVOS EPA 3510C REV. 3 1996 EPA 614
EPA 8141 REV. 2 2007 W 0.17 0.5
EPA 3550C REV. 3 2007 EPA 8141 REV. 2 2007 S 11 35
DIMETHOATE EPA 3510C REV. 3 1996 EPA 614
EPA 8141 REV. 2 2007 W 0.17 1
EPA 3550C REV. 3 2007 EPA 8141 REV. 2 2007 S 11 70
DISULFOTON EPA 3510C REV. 3 1996 EPA 614
EPA 8141 REV. 2 2007 W 0.28 1
EPA 3550C REV. 3 2007 EPA 8141 REV. 2 2007 S 19 70
DISULFOTON SULFONE
EPA 3510C REV. 3 1996 EPA 614 EPA 8141 REV. 2 2007 W NE 0.4
EPA 3550C REV. 3 2007 EPA 8141 REV. 2 2007 S NE 33
DISULFOTON SULFOXIDE
EPA 3510C REV. 3 1996 EPA 614 EPA 8141 REV. 2 2007 W NE 10
EPA 3550C REV. 3 2007 EPA 8141 REV. 2 2007 S NE NE
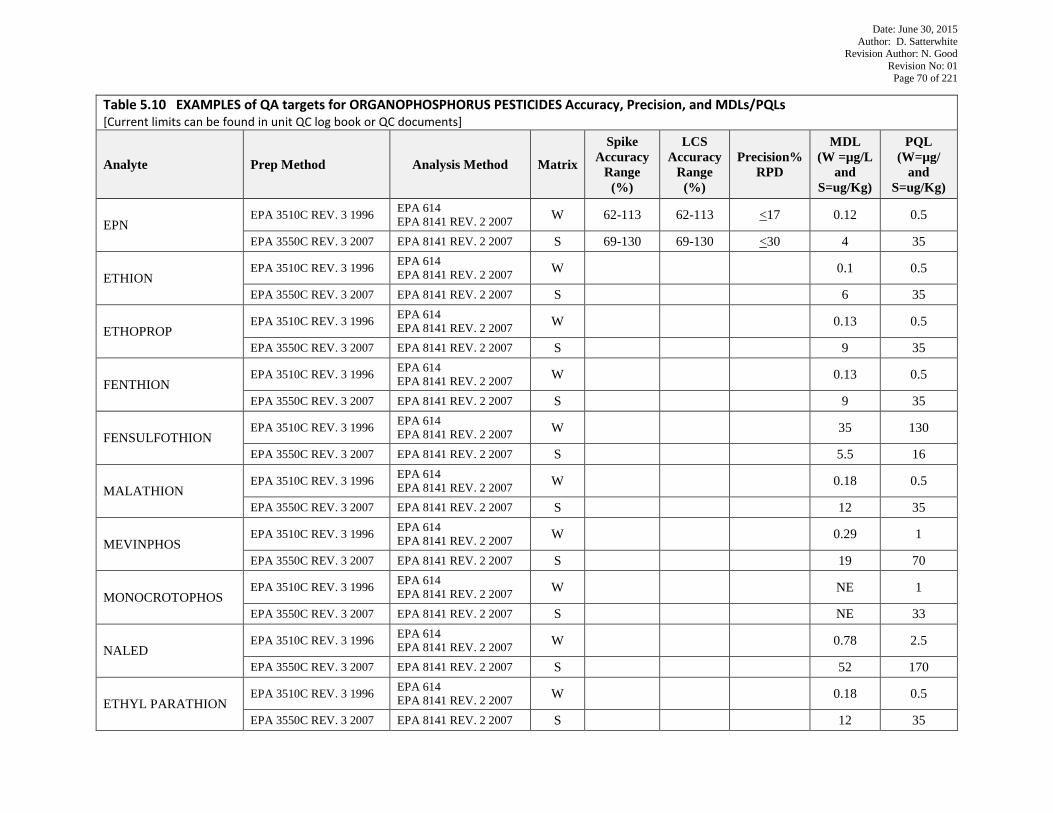
Date: June 30, 2015 Author: D. Satterwhite
Revision Author: N. Good Revision No: 01
Page 70 of 221
Table 5.10 EXAMPLES of QA targets for ORGANOPHOSPHORUS PESTICIDES Accuracy, Precision, and MDLs/PQLs [Current limits can be found in unit QC log book or QC documents]
Analyte Prep Method Analysis Method Matrix
Spike Accuracy
Range (%)
LCS Accuracy
Range (%)
Precision% RPD
MDL (W =µg/L
and S=ug/Kg)
PQL (W=µg/
and S=ug/Kg)
EPN EPA 3510C REV. 3 1996 EPA 614
EPA 8141 REV. 2 2007 W 62-113 62-113 <17 0.12 0.5
EPA 3550C REV. 3 2007 EPA 8141 REV. 2 2007 S 69-130 69-130 <30 4 35
ETHION EPA 3510C REV. 3 1996 EPA 614
EPA 8141 REV. 2 2007 W 0.1 0.5
EPA 3550C REV. 3 2007 EPA 8141 REV. 2 2007 S 6 35
ETHOPROP EPA 3510C REV. 3 1996 EPA 614
EPA 8141 REV. 2 2007 W 0.13 0.5
EPA 3550C REV. 3 2007 EPA 8141 REV. 2 2007 S 9 35
FENTHION EPA 3510C REV. 3 1996 EPA 614
EPA 8141 REV. 2 2007 W 0.13 0.5
EPA 3550C REV. 3 2007 EPA 8141 REV. 2 2007 S 9 35
FENSULFOTHION EPA 3510C REV. 3 1996 EPA 614
EPA 8141 REV. 2 2007 W 35 130
EPA 3550C REV. 3 2007 EPA 8141 REV. 2 2007 S 5.5 16
MALATHION EPA 3510C REV. 3 1996 EPA 614
EPA 8141 REV. 2 2007 W 0.18 0.5
EPA 3550C REV. 3 2007 EPA 8141 REV. 2 2007 S 12 35
MEVINPHOS EPA 3510C REV. 3 1996 EPA 614
EPA 8141 REV. 2 2007 W 0.29 1
EPA 3550C REV. 3 2007 EPA 8141 REV. 2 2007 S 19 70
MONOCROTOPHOS EPA 3510C REV. 3 1996 EPA 614
EPA 8141 REV. 2 2007 W NE 1
EPA 3550C REV. 3 2007 EPA 8141 REV. 2 2007 S NE 33
NALED EPA 3510C REV. 3 1996 EPA 614
EPA 8141 REV. 2 2007 W 0.78 2.5
EPA 3550C REV. 3 2007 EPA 8141 REV. 2 2007 S 52 170
ETHYL PARATHION EPA 3510C REV. 3 1996 EPA 614
EPA 8141 REV. 2 2007 W 0.18 0.5
EPA 3550C REV. 3 2007 EPA 8141 REV. 2 2007 S 12 35
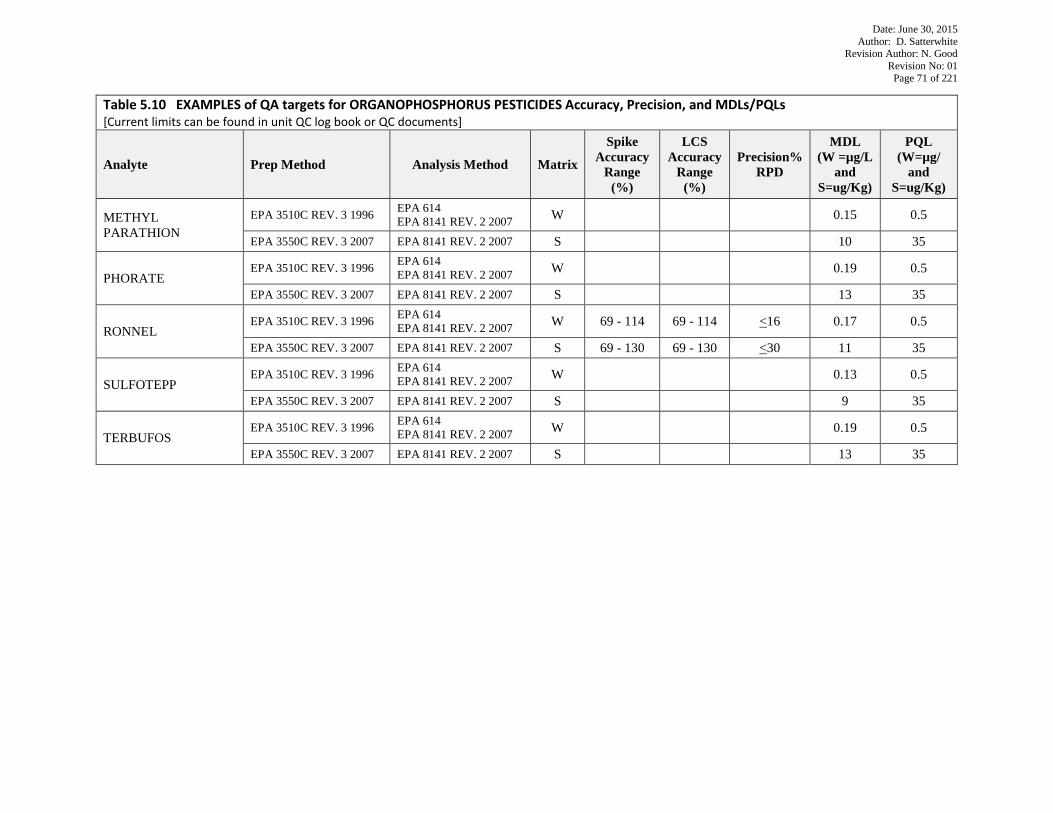
Date: June 30, 2015 Author: D. Satterwhite
Revision Author: N. Good Revision No: 01
Page 71 of 221
Table 5.10 EXAMPLES of QA targets for ORGANOPHOSPHORUS PESTICIDES Accuracy, Precision, and MDLs/PQLs [Current limits can be found in unit QC log book or QC documents]
Analyte Prep Method Analysis Method Matrix
Spike Accuracy
Range (%)
LCS Accuracy
Range (%)
Precision% RPD
MDL (W =µg/L
and S=ug/Kg)
PQL (W=µg/
and S=ug/Kg)
METHYL PARATHION
EPA 3510C REV. 3 1996 EPA 614 EPA 8141 REV. 2 2007 W 0.15 0.5
EPA 3550C REV. 3 2007 EPA 8141 REV. 2 2007 S 10 35
PHORATE EPA 3510C REV. 3 1996 EPA 614
EPA 8141 REV. 2 2007 W 0.19 0.5
EPA 3550C REV. 3 2007 EPA 8141 REV. 2 2007 S 13 35
RONNEL EPA 3510C REV. 3 1996 EPA 614
EPA 8141 REV. 2 2007 W 69 - 114 69 - 114 <16 0.17 0.5
EPA 3550C REV. 3 2007 EPA 8141 REV. 2 2007 S 69 - 130 69 - 130 <30 11 35
SULFOTEPP EPA 3510C REV. 3 1996 EPA 614
EPA 8141 REV. 2 2007 W 0.13 0.5
EPA 3550C REV. 3 2007 EPA 8141 REV. 2 2007 S 9 35
TERBUFOS EPA 3510C REV. 3 1996 EPA 614
EPA 8141 REV. 2 2007 W 0.19 0.5
EPA 3550C REV. 3 2007 EPA 8141 REV. 2 2007 S 13 35
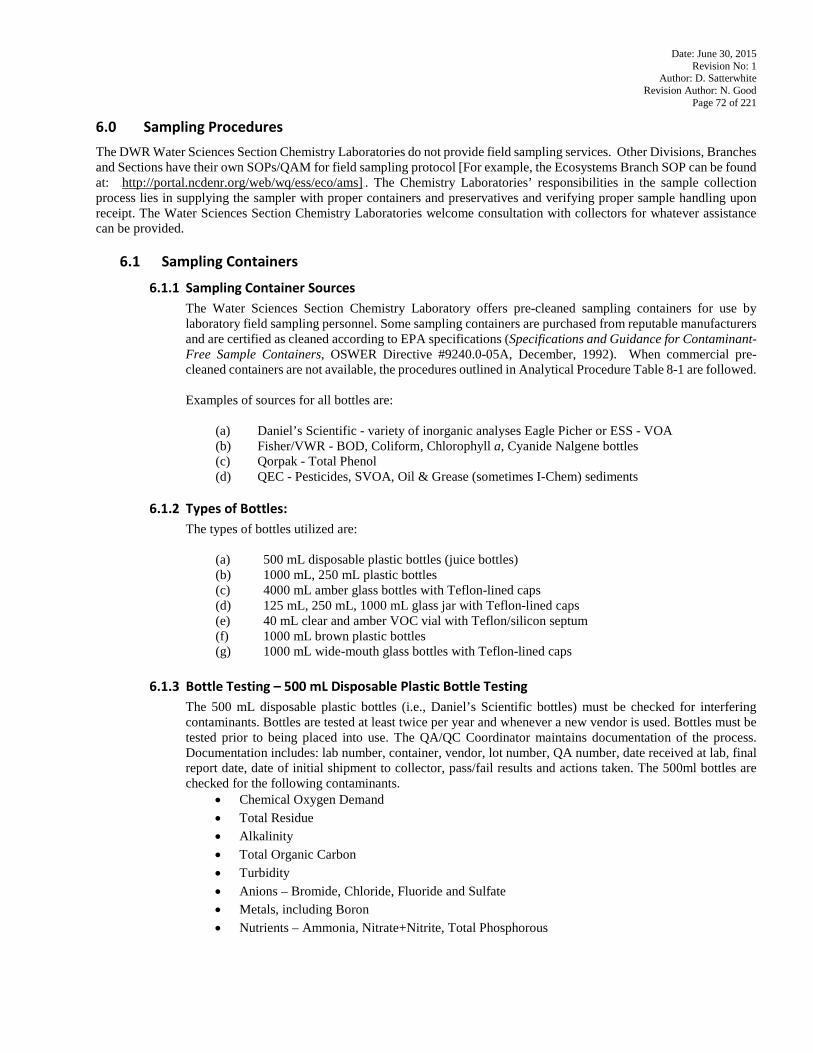
Date: June 30, 2015 Revision No: 1
Author: D. Satterwhite Revision Author: N. Good
Page 72 of 221
6.0 Sampling Procedures The DWR Water Sciences Section Chemistry Laboratories do not provide field sampling services. Other Divisions, Branches and Sections have their own SOPs/QAM for field sampling protocol [For example, the Ecosystems Branch SOP can be found at: 34Thttp://portal.ncdenr.org/web/wq/ess/eco/ams]34T. The Chemistry Laboratories’ responsibilities in the sample collection process lies in supplying the sampler with proper containers and preservatives and verifying proper sample handling upon receipt. The Water Sciences Section Chemistry Laboratories welcome consultation with collectors for whatever assistance can be provided.
6.1 Sampling Containers
6.1.1 Sampling Container Sources The Water Sciences Section Chemistry Laboratory offers pre-cleaned sampling containers for use by laboratory field sampling personnel. Some sampling containers are purchased from reputable manufacturers and are certified as cleaned according to EPA specifications (Specifications and Guidance for Contaminant-Free Sample Containers, OSWER Directive #9240.0-05A, December, 1992). When commercial pre-cleaned containers are not available, the procedures outlined in Analytical Procedure Table 8-1 are followed. Examples of sources for all bottles are:
(a) Daniel’s Scientific - variety of inorganic analyses Eagle Picher or ESS - VOA (b) Fisher/VWR - BOD, Coliform, Chlorophyll a, Cyanide Nalgene bottles (c) Qorpak - Total Phenol (d) QEC - Pesticides, SVOA, Oil & Grease (sometimes I-Chem) sediments
6.1.2 Types of Bottles:
The types of bottles utilized are:
(a) 500 mL disposable plastic bottles (juice bottles) (b) 1000 mL, 250 mL plastic bottles (c) 4000 mL amber glass bottles with Teflon-lined caps (d) 125 mL, 250 mL, 1000 mL glass jar with Teflon-lined caps (e) 40 mL clear and amber VOC vial with Teflon/silicon septum (f) 1000 mL brown plastic bottles (g) 1000 mL wide-mouth glass bottles with Teflon-lined caps
6.1.3 Bottle Testing – 500 mL Disposable Plastic Bottle Testing
The 500 mL disposable plastic bottles (i.e., Daniel’s Scientific bottles) must be checked for interfering contaminants. Bottles are tested at least twice per year and whenever a new vendor is used. Bottles must be tested prior to being placed into use. The QA/QC Coordinator maintains documentation of the process. Documentation includes: lab number, container, vendor, lot number, QA number, date received at lab, final report date, date of initial shipment to collector, pass/fail results and actions taken. The 500ml bottles are checked for the following contaminants.
• Chemical Oxygen Demand • Total Residue • Alkalinity • Total Organic Carbon • Turbidity • Anions – Bromide, Chloride, Fluoride and Sulfate • Metals, including Boron • Nutrients – Ammonia, Nitrate+Nitrite, Total Phosphorous
Date: June 30, 2015 Revision No: 1
Author: D. Satterwhite Revision Author: N. Good
Page 73 of 221
Reusable containers will also be tested once or twice per year for contamination following the same procedure outlined above. Only 1000 mL plastic amber bottles, 1000 mL glass bottles, 1000 mL plastic bottles, and 250 mL plastic bottles are cleaned and reused. In order to certify that the re-used containers are clean, random bottles are periodically analyzed for the target constituent when controls are not built into the analytical process. An outline of the cleaning procedures can be found in Analytical Procedures Table 8-1. The cleaned bottles are stored in the Sample Shipping/Receiving area (G-098) of the laboratory away from laboratory activities. Note: Approximately once a month, 250 mL plastic fecal bottles are randomly tested for contamination from each sterilized batch. Please refer to Microbiology SOP for the Analysis of Fecal Coliform.
6.1.4 Certified Containers Testing
A baseline for certified containers (such as 40 ml VOA vials for volatiles and sulfide analyses) will be established by the procedure described in Section 6.1.3. Certified containers will be tested periodically or when a new vendor or bottle type is used.
6.1.5 Non Certified Containers Testing A baseline for non-certified containers (such as 1 liter jugs for Pesticides and Semivolatile analyses) will be established by the procedure described in Section 6.1.3 Bottle Testing. Non Certified containers will be tested when a new vendor or bottle type is used.
6.2 Preservatives Upon request, preservatives are provided to field sampling personnel in bottles or in sealed pre-scored ampoules. Preservatives from new lots, such as Nitric Acid, a preservative for metals testing, are tested for contamination prior to shipping. Test results are logged into a spreadsheet by unit supervisor. In some cases, preservatives supplied directly from a private vendor are drop-shipped to the regional offices. The sodium thiosulfate and EDTA preservatives for coliform samples are prepared in the Microbiology Unit and delivered to the Support Unit. The sodium thiosulfate and EDTA preservatives are then added to the microbiology sample containers. Whether prepared by the laboratory or bought pre-preserved, the grades of the preservatives are, at a minimum:
• Nitric Acid - ACS grade or equivalent • Sodium Bisulfate - ACS grade or equivalent • Sodium Hydroxide - ACS grade or equivalent • Sulfuric Acid - ACS grade or equivalent • Sodium Thiosulfate - ACS grade or equivalent • Ascorbic Acid - ACS grade or equivalent • Zinc Acetate - ACS grade or equivalent • Phosphoric Acid - ACS grade or equivalent • Ferrous Ammonium Sulfate - ACS grade or equivalent • Hydrochloric Acid – ACS grade or equivalent • EDTA – ACS grade or equivalent
The Water Sciences Section Chemistry Laboratory also provides the following supplies used during sample collection activities:
• Security seals • Total residual chlorine test strips • Wide range pH test strips • Narrow range pH test strips
Date: June 30, 2015 Revision No: 1
Author: D. Satterwhite Revision Author: N. Good
Page 74 of 221
6.3 Reuse of Bottles and Bottle Cleaning Only 1000 mL plastic amber bottles, 1000 mL glass bottles, 1000 mL plastic bottles, and 250 mL plastic bottles are cleaned and reused. In order to certify that the re-used containers are clean, random bottles are periodically analyzed for the target constituent when controls are not built into the analytical process. An outline of the cleaning procedures can be found in Analytical Procedures Table 8-1. The cleaned bottles are stored in the Sample Shipping/Receiving area (G-098) of the laboratory away from laboratory activities in a cabinet with lids secured. The following parameters utilize bottles that are cleaned and reused:
• Chlorophyll-a • BOD • Coliform • Phenol 6.4 Sampling Containers, Preservatives and Holding Times
The sampling container types, preservation techniques and holding times for the parameters analyzed by the laboratory are summarized in Tables 6.1 (Water Sciences Section Water Quality) and 6.2 (Water Sciences Section Groundwater). These tables are adapted from 40 CFR, Chapter 1, Part 136, Table II; however, any time there is a federal register update, lab procedures will follow the updated protocol. The QAO has a licensed copy of ASTM D7365-09a, which details sampling, preservation and mitigating interferences in water samples for analysis of Cyanide. Special attention should be paid to the footnotes for any deviations. The information for soil/sediment samples is adapted from Test Methods for Evaluating Solid Waste, SW-846, Revision IV. Tissue samples are collected, filleted and frozen in metal tins prior to submission to the laboratory. Tissue samples are frozen up to one year until analysis. If the container, preservative or holding time requirements are not met for a sample, the sample may be rejected by the laboratory or the reports will be qualified using a data qualifier code and accompanied by a Sample Condition Upon Receipt (SCUR) report, Sample Anomaly Report (SAR) or Sample Comments on the final report. If criteria are not specified in a source document, internal DWR Water Sciences Section guidelines will be used. These guidelines are footnoted in Tables 6.1 and 6.2. The Water Sciences Section Chemistry Laboratories do not perform field analyses.
6.4.1 Definition of Holding Time The date and time of sampling documented on the field sheet establishes the date and time zero. For composite samples, the date and time the 24-hour compositing cycle ended establishes the date and time zero. When the maximum allowable holding time is expressed in days, the holding time is based on day measured. Holding times, expressed in 72 hours or less, are measured from date and time zero. The first day of holding time ends twenty-four hours after sampling. Holding times for analyses include preparation, quantitation and any necessary reanalysis except as noted below.
6.4.1.1 SVOA/Pesticides
Holding times for sample preparation for semi-volatile organics are measured from the date and time of sampling until the solvent contacts the sample. If a sample is to be extracted on the day of expiration, the actual time of extraction must be recorded on the sample preparation worksheet. Holding times for analysis are measured from the date and time of initiation of extraction to the time of injection into the gas chromatograph.
6.4.1.2 VOA
Holding times for volatile organics are measured from the date and time of sampling to the date and time of injection into the gas chromatograph. The time of initiation of purging is considered the injection time, but data systems record the start of the chromatographic run rather than the start of purging. Hence, if a sample is so near expiration that the start-of-purging time rather than the chromatographic run time is needed to document the integrity of the sample, the analyst must record
Date: June 30, 2015 Revision No: 1
Author: D. Satterwhite Revision Author: N. Good
Page 75 of 221
the start-of-purging time in the instrument log or be able to back calculate the start-of-purging time based on the purge time recorded in the instrument method files.
6.4.1.3 Inorganics and Metals
For inorganics and metals analysis, the preparation/digestion/distillation must be started in time to allow the analysis step to be initiated as documented in the instrument log, instrument output, or analysis worksheet, within the maximum allowable holding time as measured from the sampling date and time.
6.4.1.4 Microbiologicals
For microbiological analyses such as coliform and BOD, the holding time is measured from the date and time of sampling to the date and time when filtration and incubation begins, respectively.
6.5 Scheduling Laboratory Capacity
Major sampling events must be scheduled with the laboratory prior to formal acceptance of the samples by the laboratory. Samples are accepted for analysis by logging them into DWR LABWORKS™ LIMS. Field sheets, SCURs, and final reports are also scanned into Laserfiche®. The supervisors are responsible for scheduling samples by assessing the capacity and previously scheduled workload of the laboratory and makes decisions regarding work assignments whenever laboratory capacity for any work group may be exceeded.
6.6 Processing Time-Sensitive Samples
With a continuing focus on data quality assurance, staffing and scheduling constraints, the Laboratory has provided the following guidance on the submission of time-sensitive samples in Tables 6.1 and 6.2, as well as, on the Water Sciences Section website. 34T http://portal.ncdenr.org/web/wq/lab/ops/samples#Time_Sensitive_Samples In order to properly process samples and keep overtime to a minimum, the following limitations on submission of these analyses should be observed. Should emergencies arise, sample collectors have been instructed to call the appropriate analytical Branch Head.
• Samples for Chlorophyll a, BODR5R, POR4R, Turbidity, Color: ADMI and Platinum Cobalt (PtCo), MBAS, NO2-Nitrite; NO3-Nitrate (unless as NO3NO2), hexavalent chromium, Fecal Coliform and Total coliform analysis will not be accepted after 3:00 PM Monday thru Thursday and 1:00 PM on Fridays.
• Samples for POR4R, Color: ADMI and Platinum Cobalt (PtCo), MBAS, NO2-Nitrite; NO3-Nitrate (unless as NO3NO2), hexavalent chromium, Fecal Coliform and Total coliform analysis will not be accepted on a workday that immediately precedes a holiday or holiday weekend.
• Samples for BODR5R will not be accepted on work days that would result in the five day test ending on a Holiday or Holiday weekend.
• Samples for Chlorophyll a and Turbidity may be submitted for analysis until 1:00 P.M. on a workday that immediately precedes a holiday or holiday weekend.
• Staff planning to submit more than five samples for these parameters should contact the laboratory to schedule these samples in advance. If fewer than five samples are to be submitted for these parameters, we ask that you please simply notify the laboratory that short hold samples are coming 48 hours prior to submitting whenever possible.
• Coliform bacteria samples that need to meet the eight-hour holding time required by the Clean Water Act will not be accepted after 3:00 PM on normal Monday through Thursday workdays. (Please have samples to lab within 6 hours to meet the CWA holding time)
• All tube coliform samples must be scheduled in advance by contacting the Bio/Metals Unit Supervisor or the Microbiology Unit Lead Chemist.
• Unpreserved samples for individual analysis of nitrate or nitrite should be scheduled with the Nutrients/ Wet Chemistry Unit Supervisor or the Nutrients group prior to submittal. With 48-hour hold times for these samples, analytical runs need to be specially scheduled to accommodate these samples. NOTE: A concurrent preserved nutrients sample should be submitted for which nitrate+nitrite analysis has been requested.
Date: June 30, 2015 Revision No: 1
Author: D. Satterwhite Revision Author: N. Good
Page 76 of 221
The Asheville Regional Laboratory has provided the following guidance on submission of time-sensitive samples.
• Samples for BOD, Turbidity, and MF coliform analysis will not be accepted after 3:00 PM on Fridays or workdays
that immediately precede a holiday. Staff planning to submit more than three samples on these days for these parameters should contact the laboratory to schedule these samples in advance.
• Coliform bacteria samples that need to meet the eight-hour holding time required by the Clean Water Act will not be accepted after 4:00 PM on normal Monday through Thursday workdays. (Please have samples to lab within 6 hours to meet the CWA holding time)
• All tube coliform samples must be scheduled in advance by contacting the laboratory. The web site also offers up-to-date guidance for specific limitations on sample submission established to allow Water Sciences Section Chemistry Laboratory staff to observe state holidays. 34Thttp://www.ncdenr.gov/web/wq/lab/ops/sample34T
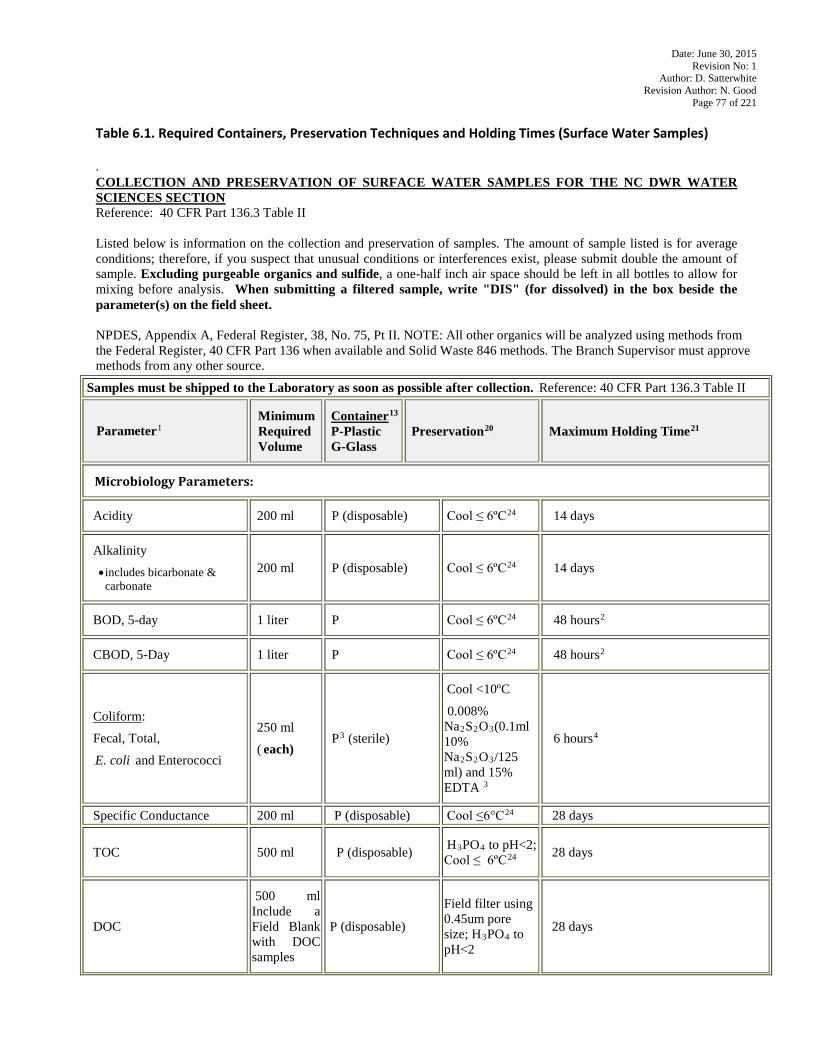
Date: June 30, 2015 Revision No: 1
Author: D. Satterwhite Revision Author: N. Good
Page 77 of 221
Table 6.1. Required Containers, Preservation Techniques and Holding Times (Surface Water Samples) . COLLECTION AND PRESERVATION OF SURFACE WATER SAMPLES FOR THE NC DWR WATER SCIENCES SECTION Reference: 40 CFR Part 136.3 Table II Listed below is information on the collection and preservation of samples. The amount of sample listed is for average conditions; therefore, if you suspect that unusual conditions or interferences exist, please submit double the amount of sample. Excluding purgeable organics and sulfide, a one-half inch air space should be left in all bottles to allow for mixing before analysis. When submitting a filtered sample, write "DIS" (for dissolved) in the box beside the parameter(s) on the field sheet. NPDES, Appendix A, Federal Register, 38, No. 75, Pt II. NOTE: All other organics will be analyzed using methods from the Federal Register, 40 CFR Part 136 when available and Solid Waste 846 methods. The Branch Supervisor must approve methods from any other source.
45TSamples must be shipped to the Laboratory as soon as possible after collection. 45TReference: 40 CFR Part 136.3 Table II
ParameterP
1 Minimum Required Volume
ContainerP
13P
P-Plastic G-Glass
PreservationP
20P Maximum Holding TimeP
21
Microbiology Parameters:
Acidity 200 ml P (disposable) Cool ≤ 6ºCP
24P 14 days
Alkalinity • includes bicarbonate &
carbonate 200 ml P (disposable) Cool ≤ 6ºCP
24 14 days
BOD, 5-day 1 liter P Cool ≤ 6ºCP
24 48 hoursP
2P
CBOD, 5-Day 1 liter P Cool ≤ 6ºCP
24 48 hoursP
2P
Coliform:
Fecal, Total,
17TE. coli 17Tand Enterococci
250 ml
(45Teach) PP
3P (sterile)
Cool <10ºC
0.008% NaR2RSR2ROR3R(0.1ml 10% NaR2RSR2ROR3R/125 ml) and 15% EDTA P
3
6 hoursP
4P
Specific Conductance 200 ml P (disposable) Cool ≤6°CP
24 28 days
TOC 500 ml P (disposable) HR3RPOR4R to pH<2; Cool ≤ 6ºCP
24 28 days
DOC
500 ml Include a Field Blank with DOC samples
P (disposable)
Field filter using 0.45um pore size; HR3RPOR4R to pH<2
28 days
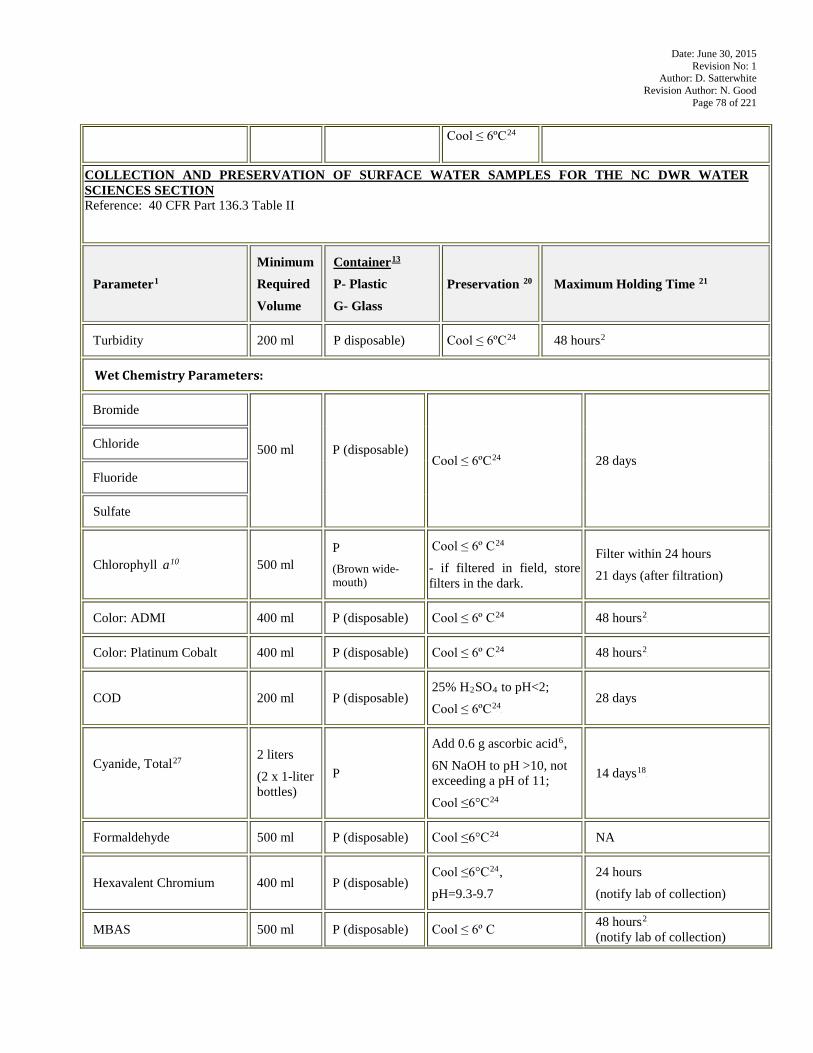
Date: June 30, 2015 Revision No: 1
Author: D. Satterwhite Revision Author: N. Good
Page 78 of 221
Cool ≤ 6ºCP
24
COLLECTION AND PRESERVATION OF SURFACE WATER SAMPLES FOR THE NC DWR WATER SCIENCES SECTION Reference: 40 CFR Part 136.3 Table II
ParameterP
1
Minimum Required
Volume
ContainerP
13 P- Plastic
G- Glass Preservation P
20 Maximum Holding Time P
21
Turbidity 200 ml P disposable) Cool ≤ 6ºCP
24 48 hoursP
2
Wet Chemistry Parameters:
Bromide
500 ml
P (disposable)
Cool ≤ 6ºCP
24 28 days Chloride
Fluoride
Sulfate
Chlorophyll 17TaP
10P 500 ml
P (Brown wide-mouth)
Cool ≤ 6º CP
24
- if filtered in field, store filters in the dark.
Filter within 24 hours
21 days (after filtration)
Color: ADMI 400 ml P (disposable) Cool ≤ 6º CP
24 48 hoursP
2P
Color: Platinum Cobalt 400 ml P (disposable) Cool ≤ 6º CP
24 48 hoursP
2P
COD 200 ml P (disposable) 25% HR2RSOR4R to pH<2;
Cool ≤ 6ºCP
24P
28 days
Cyanide, TotalP
27
2 liters
(2 x 1-liter bottles)
P
Add 0.6 g ascorbic acidP
6P,
6N NaOH to pH >10, not exceeding a pH of 11;
Cool ≤6°CP
24
14 daysP
18P
Formaldehyde 500 ml P (disposable) Cool ≤6°CP
24 NA
Hexavalent Chromium 400 ml P (disposable) Cool ≤6°CP
24P,
pH=9.3-9.7
24 hours
(notify lab of collection)
MBAS 500 ml P (disposable) Cool ≤ 6º C 48 hoursP
2P
(notify lab of collection)
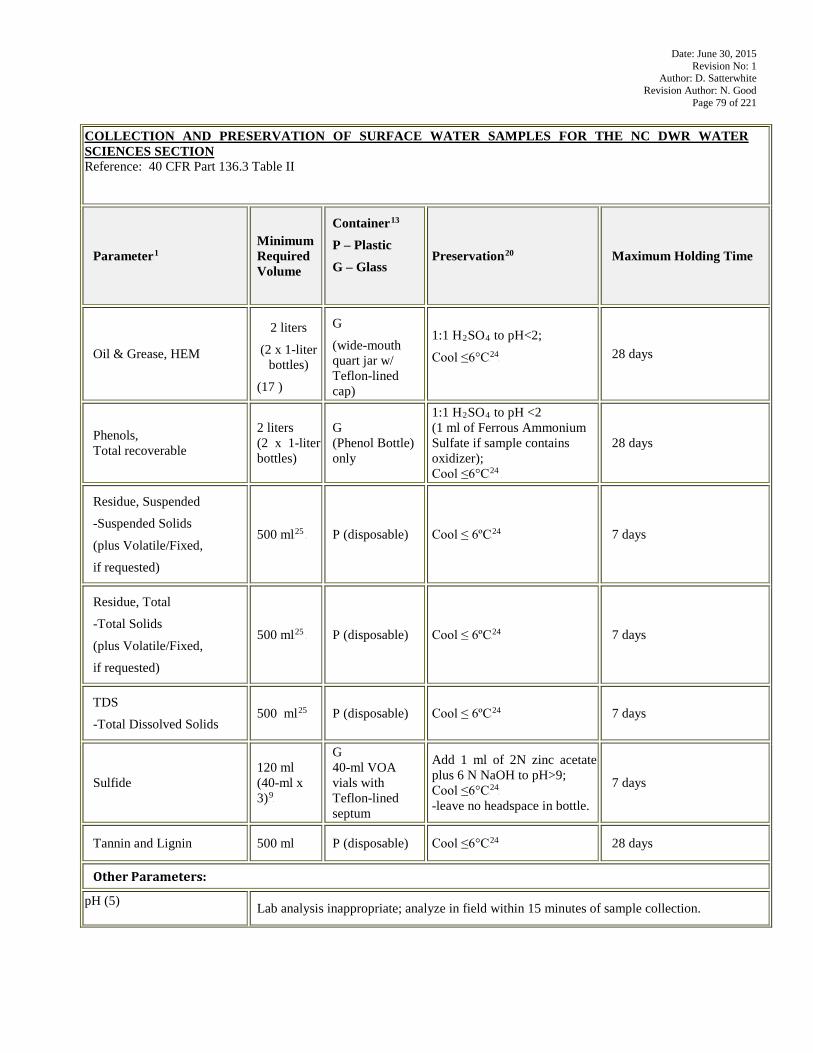
Date: June 30, 2015 Revision No: 1
Author: D. Satterwhite Revision Author: N. Good
Page 79 of 221
COLLECTION AND PRESERVATION OF SURFACE WATER SAMPLES FOR THE NC DWR WATER SCIENCES SECTION Reference: 40 CFR Part 136.3 Table II
ParameterP
1 Minimum Required Volume
ContainerP
13 P – Plastic
G – Glass
PreservationP
20
Maximum Holding Time
Oil & Grease, HEM
2 liters
(2 x 1-liter bottles)
(17 )
G
(wide-mouth quart jar w/ Teflon-lined cap)
1:1 HR2RSOR4R to pH<2;
Cool ≤6°CP
24P
28 days
Phenols, Total recoverable
2 liters (2 x 1-liter bottles)
G (Phenol Bottle) only
1:1 HR2RSOR4R to pH <2 (1 ml of Ferrous Ammonium Sulfate if sample contains oxidizer); Cool ≤6°CP
24 P
28 days
Residue, Suspended
-Suspended Solids
(plus Volatile/Fixed,
if requested)
500 mlP
25 P P (disposable) Cool ≤ 6ºCP
24 7 days
Residue, Total
-Total Solids
(plus Volatile/Fixed,
if requested)
500 mlP
25 P P (disposable) Cool ≤ 6ºCP
24 7 days
TDS
-Total Dissolved Solids 500 mlP
25 P (disposable) Cool ≤ 6ºCP
24 7 days
Sulfide 120 ml (40-ml x 3)P
9P
G 40-ml VOA vials with Teflon-lined septum
Add 1 ml of 2N zinc acetate plus 6 N NaOH to pH>9; Cool ≤6°CP
24P
-leave no headspace in bottle.
7 days
Tannin and Lignin 500 ml P (disposable) Cool ≤6°CP
24 28 days
Other Parameters:
pH (5) Lab analysis inappropriate; analyze in field within 15 minutes of sample collection.
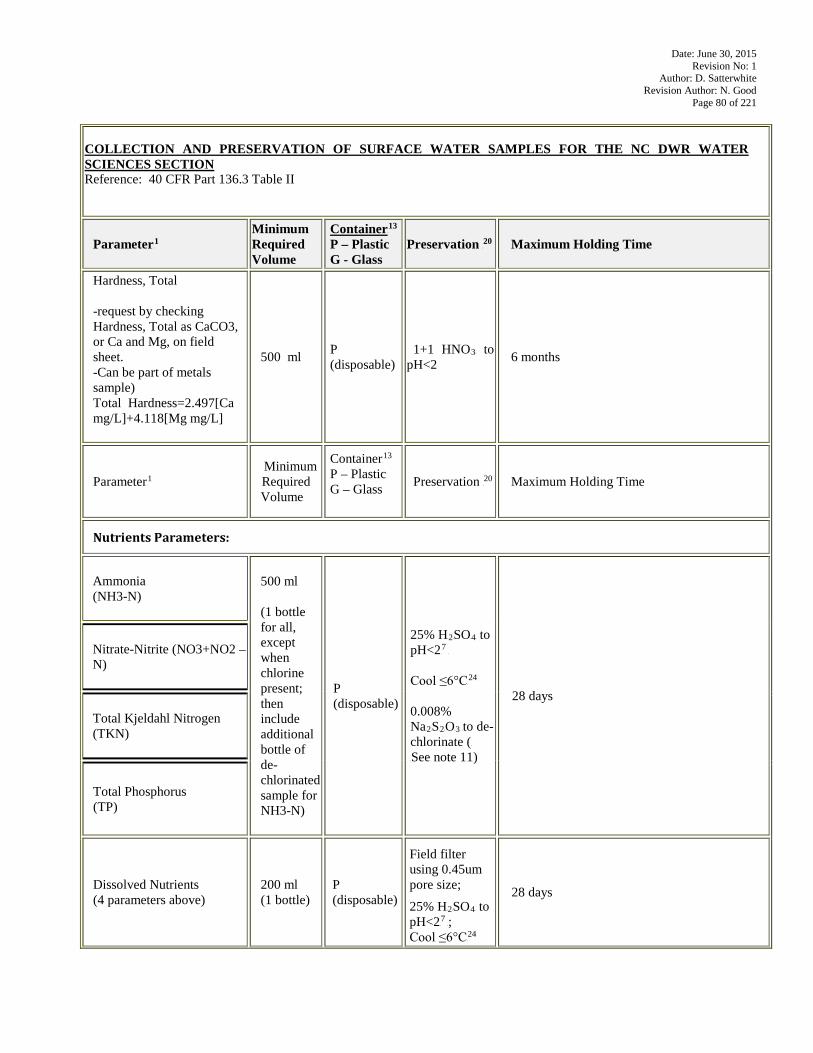
Date: June 30, 2015 Revision No: 1
Author: D. Satterwhite Revision Author: N. Good
Page 80 of 221
COLLECTION AND PRESERVATION OF SURFACE WATER SAMPLES FOR THE NC DWR WATER SCIENCES SECTION Reference: 40 CFR Part 136.3 Table II
ParameterP
1 Minimum Required Volume
ContainerP
13 P – Plastic G - Glass
Preservation P
20 Maximum Holding Time
Hardness, Total
-request by checking Hardness, Total as CaCO3, or Ca and Mg, on field sheet. -Can be part of metals sample) Total Hardness=2.497[Ca mg/L]+4.118[Mg mg/L]
500 ml P (disposable)
1+1 HNOR3R to pH<2 6 months
ParameterP
1 Minimum Required Volume
ContainerP
13 P – Plastic G – Glass
Preservation P
20 Maximum Holding Time
Nutrients Parameters:
Ammonia (NH3-N)
500 ml (1 bottle for all, except when chlorine present; then include additional bottle of de-chlorinated sample for NH3-N)
P (disposable)
25% HR2RSOR4R to pH<2P
7 P
Cool ≤6°CP
24 0.008% NaR2RSR2ROR3 Rto de-chlorinate (R RSee note 11)
28 days
Nitrate-Nitrite (NO3+NO2 – N)
Total Kjeldahl Nitrogen (TKN)
Total Phosphorus (TP)
Dissolved Nutrients (4 parameters above)
200 ml (1 bottle)
P (disposable)
Field filter using 0.45um pore size;
25% HR2RSOR4R to pH<2P
7 P;
Cool ≤6°CP
24
28 days
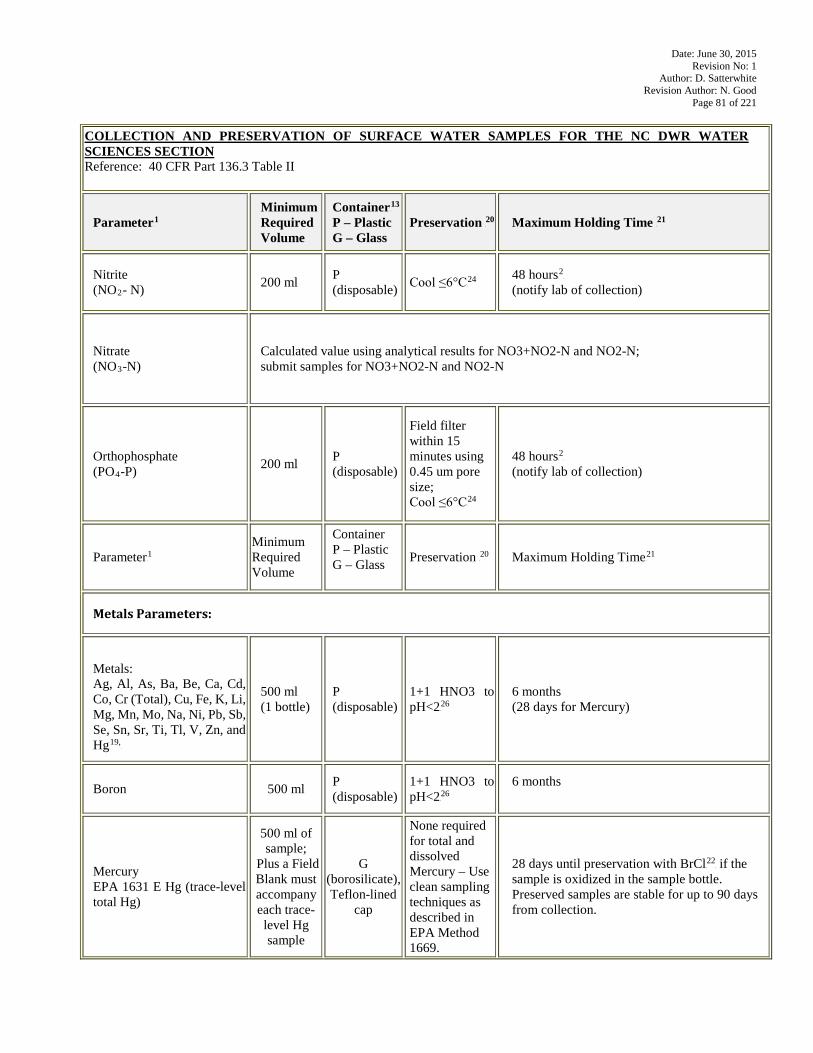
Date: June 30, 2015 Revision No: 1
Author: D. Satterwhite Revision Author: N. Good
Page 81 of 221
COLLECTION AND PRESERVATION OF SURFACE WATER SAMPLES FOR THE NC DWR WATER SCIENCES SECTION Reference: 40 CFR Part 136.3 Table II
ParameterP
1 Minimum Required Volume
ContainerP
13 P – Plastic G – Glass
Preservation P
20 Maximum Holding Time P
21
Nitrite (NOR2R- N) 200 ml P
(disposable) Cool ≤6°CP
24 48 hoursP
2P
(notify lab of collection)
Nitrate (NOR3R-N)
Calculated value using analytical results for NO3+NO2-N and NO2-N; submit samples for NO3+NO2-N and NO2-N
Orthophosphate (POR4R-P) 200 ml P
(disposable)
Field filter within 15 minutes using 0.45 um pore size; Cool ≤6°CP
24
48 hoursP
2P
(notify lab of collection)
ParameterP
1 Minimum Required Volume
Container P – Plastic G – Glass
Preservation P
20 Maximum Holding TimeP
21
Metals Parameters:
Metals: Ag, Al, As, Ba, Be, Ca, Cd, Co, Cr (Total), Cu, Fe, K, Li, Mg, Mn, Mo, Na, Ni, Pb, Sb, Se, Sn, Sr, Ti, Tl, V, Zn, and HgP
19,P
500 ml (1 bottle)
P (disposable)
1+1 HNO3 to pH<2P
26 6 months (28 days for Mercury)
Boron
500 ml P (disposable)
1+1 HNO3 to pH<2P
26 6 months
Mercury EPA 1631 E Hg (trace-level total Hg)
500 ml of sample;
Plus a Field Blank must accompany each trace-level Hg sample
G (borosilicate), Teflon-lined
cap
None required for total and dissolved Mercury – Use clean sampling techniques as described in EPA Method 1669.
28 days until preservation with BrClP
22P if the
sample is oxidized in the sample bottle. Preserved samples are stable for up to 90 days from collection.
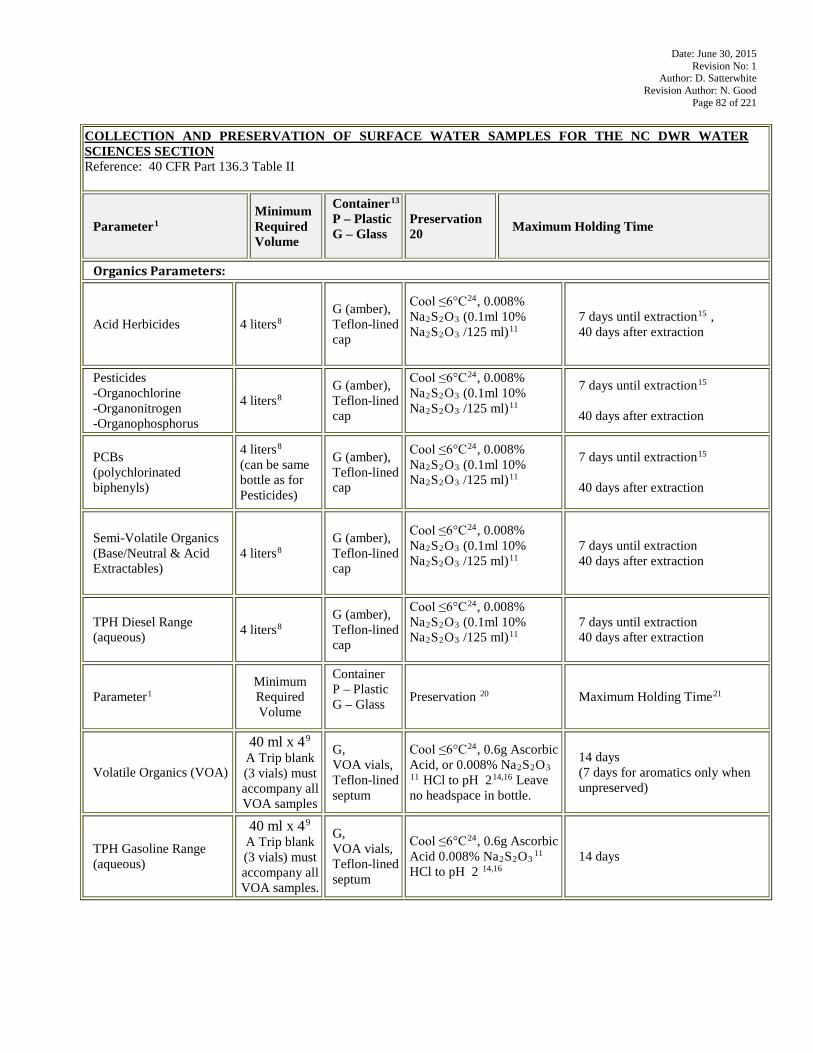
Date: June 30, 2015 Revision No: 1
Author: D. Satterwhite Revision Author: N. Good
Page 82 of 221
COLLECTION AND PRESERVATION OF SURFACE WATER SAMPLES FOR THE NC DWR WATER SCIENCES SECTION Reference: 40 CFR Part 136.3 Table II
ParameterP
1 Minimum Required Volume
ContainerP
13 P – Plastic G – Glass
Preservation 20 Maximum Holding Time
Organics Parameters:
Acid Herbicides 4 litersP
8 G (amber), Teflon-lined cap
Cool ≤6°CP
24P, 0.008%
NaR2RSR2ROR3R (0.1ml 10% NaR2RSR2ROR3R /125 ml)P
11
7 days until extractionP
15P ,
40 days after extraction
Pesticides -Organochlorine -Organonitrogen -Organophosphorus
4 litersP
8 G (amber), Teflon-lined cap
Cool ≤6°CP
24P, 0.008%
NaR2RSR2ROR3R (0.1ml 10% NaR2RSR2ROR3R /125 ml)P
11P
7 days until extractionP
15 40 days after extraction
PCBs (polychlorinated biphenyls)
4 litersP
8 (can be same bottle as for Pesticides)
G (amber), Teflon-lined cap
Cool ≤6°CP
24P, 0.008%
NaR2RSR2ROR3R (0.1ml 10% NaR2RSR2ROR3R /125 ml)P
11P
7 days until extractionP
15 40 days after extraction
Semi-Volatile Organics (Base/Neutral & Acid Extractables)
4 litersP
8 G (amber), Teflon-lined cap
Cool ≤6°CP
24P, 0.008%
NaR2RSR2ROR3R (0.1ml 10% NaR2RSR2ROR3R /125 ml)P
11P
7 days until extraction 40 days after extraction
TPH Diesel Range (aqueous) 4 litersP
8 G (amber), Teflon-lined cap
Cool ≤6°CP
24P, 0.008%
NaR2RSR2ROR3R (0.1ml 10% NaR2RSR2ROR3R /125 ml)P
11P
7 days until extraction 40 days after extraction
ParameterP
1 Minimum Required Volume
Container P – Plastic G – Glass
Preservation P
20 Maximum Holding TimeP
21
Volatile Organics (VOA)
40 ml x 4P
9P
A Trip blank (3 vials) must accompany all VOA samples
G, VOA vials, Teflon-lined septum
Cool ≤6°CP
24P, 0.6g Ascorbic
Acid, or 0.008% NaR2RSR2ROR3R P
11P HCl to pH 2P
14,16P Leave
no headspace in bottle.
14 days (7 days for aromatics only when unpreserved)
TPH Gasoline Range (aqueous)
40 ml x 4P
9P
A Trip blank (3 vials) must accompany all VOA samples.
G, VOA vials, Teflon-lined septum
Cool ≤6°CP
24P, 0.6g Ascorbic
Acid 0.008% NaR2RSR2ROR3RP
11P
HCl to pH 2 P
14,16 14 days
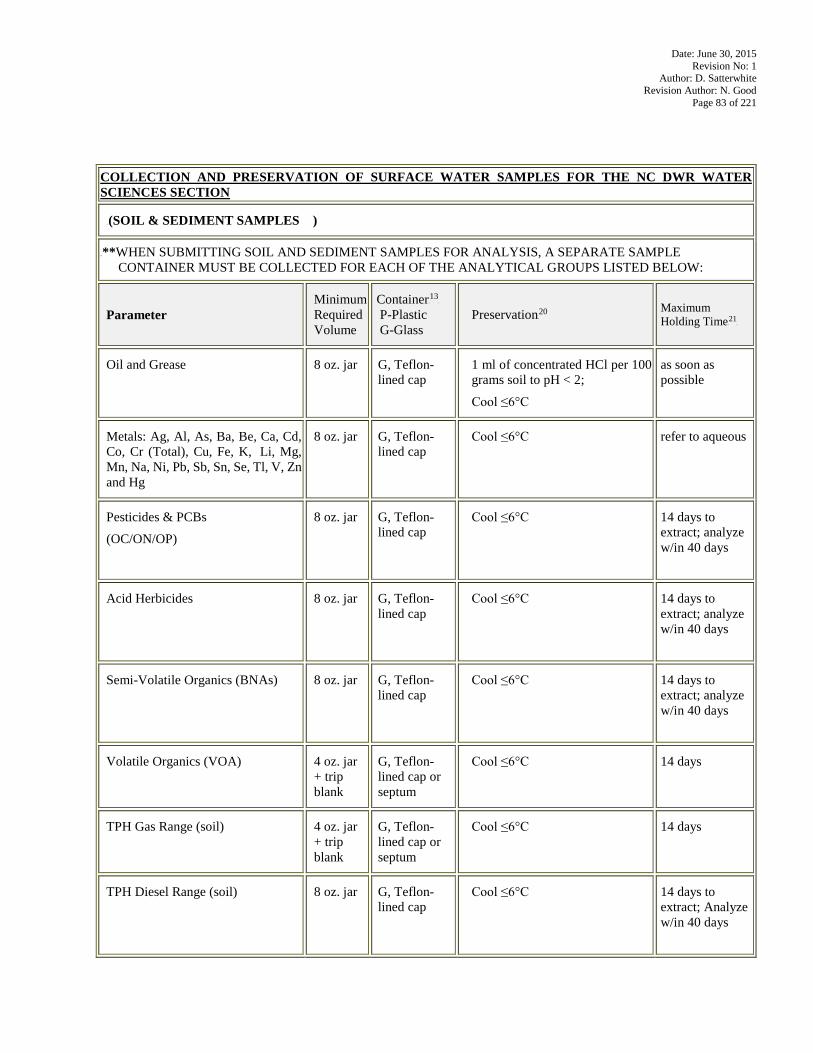
Date: June 30, 2015 Revision No: 1
Author: D. Satterwhite Revision Author: N. Good
Page 83 of 221
COLLECTION AND PRESERVATION OF SURFACE WATER SAMPLES FOR THE NC DWR WATER SCIENCES SECTION
45T(SOIL & SEDIMENT SAMPLES )
45T**WHEN SUBMITTING SOIL AND SEDIMENT SAMPLES FOR ANALYSIS, A SEPARATE SAMPLE CONTAINER MUST BE COLLECTED FOR EACH OF THE ANALYTICAL GROUPS LISTED BELOW:
Parameter Minimum Required Volume
ContainerP
13P
P-Plastic G-Glass
PreservationP
20 Maximum Holding TimeP
21P
Oil and Grease 8 oz. jar G, Teflon-lined cap
1 ml of concentrated HCl per 100 grams soil to pH < 2;
Cool ≤6°C
as soon as possible
Metals: Ag, Al, As, Ba, Be, Ca, Cd, Co, Cr (Total), Cu, Fe, K, Li, Mg, Mn, Na, Ni, Pb, Sb, Sn, Se, Tl, V, Zn and Hg
8 oz. jar G, Teflon-lined cap
Cool ≤6°C refer to aqueous
Pesticides & PCBs
(OC/ON/OP)
8 oz. jar G, Teflon-lined cap
Cool ≤6°C 14 days to extract; analyze w/in 40 days
Acid Herbicides 8 oz. jar G, Teflon-lined cap
Cool ≤6°C 14 days to extract; analyze w/in 40 days
Semi-Volatile Organics (BNAs) 8 oz. jar G, Teflon-lined cap
Cool ≤6°C 14 days to extract; analyze w/in 40 days
Volatile Organics (VOA) 4 oz. jar + trip blank
G, Teflon-lined cap or septum
Cool ≤6°C 14 days
TPH Gas Range (soil) 4 oz. jar + trip blank
G, Teflon-lined cap or septum
Cool ≤6°C 14 days
TPH Diesel Range (soil) 8 oz. jar G, Teflon-lined cap
Cool ≤6°C 14 days to extract; Analyze w/in 40 days
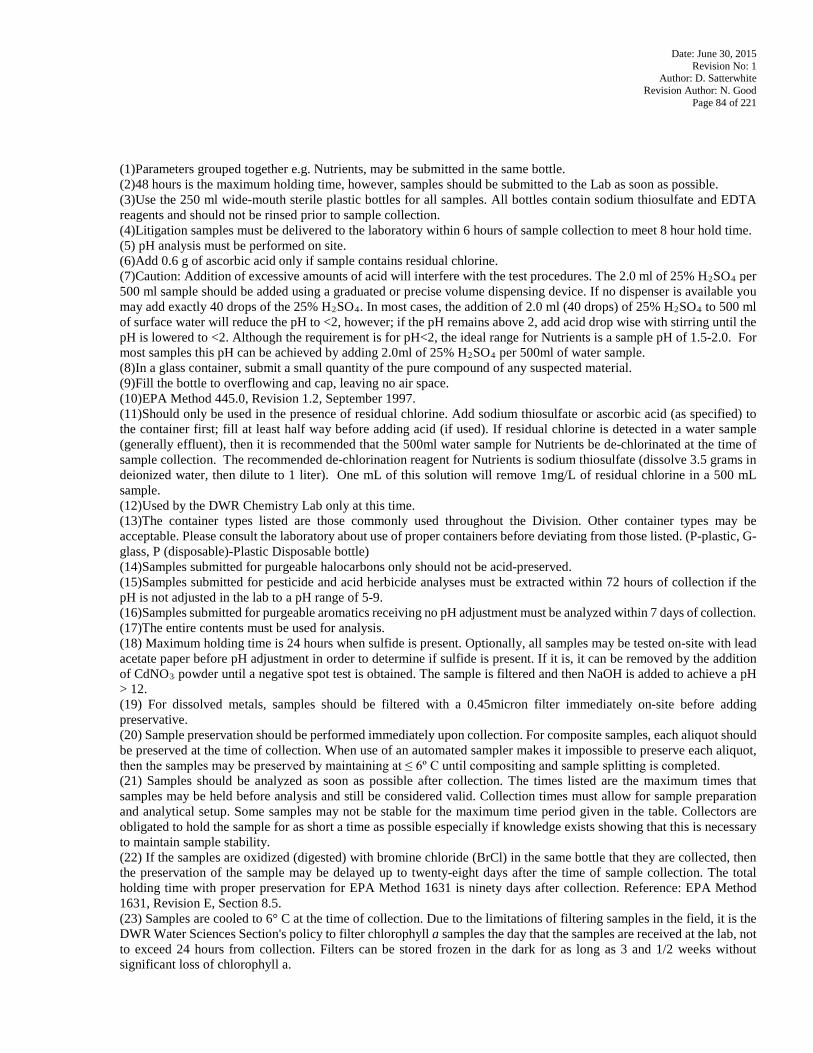
Date: June 30, 2015 Revision No: 1
Author: D. Satterwhite Revision Author: N. Good
Page 84 of 221
(1)Parameters grouped together e.g. Nutrients, may be submitted in the same bottle. (2)48 hours is the maximum holding time, however, samples should be submitted to the Lab as soon as possible. (3)Use the 250 ml wide-mouth sterile plastic bottles for all samples. All bottles contain sodium thiosulfate and EDTA reagents and should not be rinsed prior to sample collection. (4)Litigation samples must be delivered to the laboratory within 6 hours of sample collection to meet 8 hour hold time. (5) pH analysis must be performed on site. (6)Add 0.6 g of ascorbic acid only if sample contains residual chlorine. (7)Caution: Addition of excessive amounts of acid will interfere with the test procedures. The 2.0 ml of 25% HR2RSOR4R per 500 ml sample should be added using a graduated or precise volume dispensing device. If no dispenser is available you may add exactly 40 drops of the 25% HR2RSOR4R. In most cases, the addition of 2.0 ml (40 drops) of 25% HR2RSOR4R to 500 ml of surface water will reduce the pH to <2, however; if the pH remains above 2, add acid drop wise with stirring until the pH is lowered to <2. Although the requirement is for pH<2, the ideal range for Nutrients is a sample pH of 1.5-2.0. For most samples this pH can be achieved by adding 2.0ml of 25% HR2RSOR4R per 500ml of water sample. (8)In a glass container, submit a small quantity of the pure compound of any suspected material. (9)Fill the bottle to overflowing and cap, leaving no air space. (10)EPA Method 445.0, Revision 1.2, September 1997. (11)Should only be used in the presence of residual chlorine. Add sodium thiosulfate or ascorbic acid (as specified) to the container first; fill at least half way before adding acid (if used). If residual chlorine is detected in a water sample (generally effluent), then it is recommended that the 500ml water sample for Nutrients be de-chlorinated at the time of sample collection. The recommended de-chlorination reagent for Nutrients is sodium thiosulfate (dissolve 3.5 grams in deionized water, then dilute to 1 liter). One mL of this solution will remove 1mg/L of residual chlorine in a 500 mL sample. (12)Used by the DWR Chemistry Lab only at this time. (13)The container types listed are those commonly used throughout the Division. Other container types may be acceptable. Please consult the laboratory about use of proper containers before deviating from those listed. (P-plastic, G-glass, P (disposable)-Plastic Disposable bottle) (14)Samples submitted for purgeable halocarbons only should not be acid-preserved. (15)Samples submitted for pesticide and acid herbicide analyses must be extracted within 72 hours of collection if the pH is not adjusted in the lab to a pH range of 5-9. (16)Samples submitted for purgeable aromatics receiving no pH adjustment must be analyzed within 7 days of collection. (17)The entire contents must be used for analysis. (18) Maximum holding time is 24 hours when sulfide is present. Optionally, all samples may be tested on-site with lead acetate paper before pH adjustment in order to determine if sulfide is present. If it is, it can be removed by the addition of CdNOR3R powder until a negative spot test is obtained. The sample is filtered and then NaOH is added to achieve a pH > 12. (19) For dissolved metals, samples should be filtered with a 0.45micron filter immediately on-site before adding preservative. (20) Sample preservation should be performed immediately upon collection. For composite samples, each aliquot should be preserved at the time of collection. When use of an automated sampler makes it impossible to preserve each aliquot, then the samples may be preserved by maintaining at ≤ 6º C until compositing and sample splitting is completed. (21) Samples should be analyzed as soon as possible after collection. The times listed are the maximum times that samples may be held before analysis and still be considered valid. Collection times must allow for sample preparation and analytical setup. Some samples may not be stable for the maximum time period given in the table. Collectors are obligated to hold the sample for as short a time as possible especially if knowledge exists showing that this is necessary to maintain sample stability. (22) If the samples are oxidized (digested) with bromine chloride (BrCl) in the same bottle that they are collected, then the preservation of the sample may be delayed up to twenty-eight days after the time of sample collection. The total holding time with proper preservation for EPA Method 1631 is ninety days after collection. Reference: EPA Method 1631, Revision E, Section 8.5. (23) Samples are cooled to 6° C at the time of collection. Due to the limitations of filtering samples in the field, it is the DWR Water Sciences Section's policy to filter chlorophyll a samples the day that the samples are received at the lab, not to exceed 24 hours from collection. Filters can be stored frozen in the dark for as long as 3 and 1/2 weeks without significant loss of chlorophyll a.
Date: June 30, 2015 Revision No: 1
Author: D. Satterwhite Revision Author: N. Good
Page 85 of 221
(24) Aqueous samples must be preserved ≤ 6º C, and should not be frozen unless data demonstrating that sample freezing does not adversely impact sample integrity is maintained on file and accepted a valid by the regulatory authority. Also, for purposes of NPDES monitoring, the specification “≤ ºC” is used in place of the “4 ºC” and “< 4 ºC” sample temperature requirements listed in some methods. The preservation temperature does not apply to samples that are analyzed immediately (less than 15 minutes). (25) Larger sample volumes may need to be submitted to achieve lower PQLs. (26) If sample is not field preserved, HNO3 must be added 24 hours prior to analysis. (27) The QAO has a licensed copy of ASTM D7365-09a, which details sampling, preservation and mitigating interferences in water samples for analysis of Cyanide. Special attention should be paid to the footnotes for any deviations.
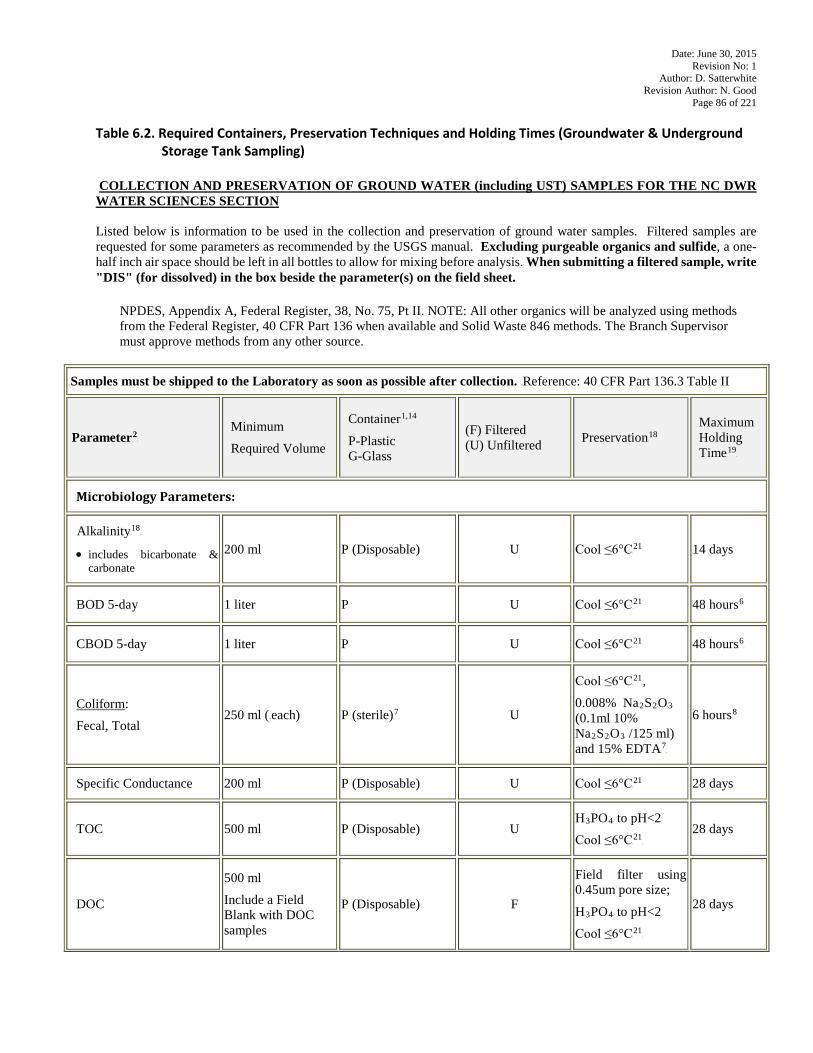
Date: June 30, 2015 Revision No: 1
Author: D. Satterwhite Revision Author: N. Good
Page 86 of 221
Table 6.2. Required Containers, Preservation Techniques and Holding Times (Groundwater & Underground Storage Tank Sampling)
COLLECTION AND PRESERVATION OF GROUND WATER (including UST) SAMPLES FOR THE NC DWR WATER SCIENCES SECTION Listed below is information to be used in the collection and preservation of ground water samples. Filtered samples are requested for some parameters as recommended by the USGS manual. Excluding purgeable organics and sulfide, a one-half inch air space should be left in all bottles to allow for mixing before analysis. When submitting a filtered sample, write "DIS" (for dissolved) in the box beside the parameter(s) on the field sheet.
NPDES, Appendix A, Federal Register, 38, No. 75, Pt II. NOTE: All other organics will be analyzed using methods from the Federal Register, 40 CFR Part 136 when available and Solid Waste 846 methods. The Branch Supervisor must approve methods from any other source.
45TSamples must be shipped to the Laboratory as soon as possible after collection. 45TReference: 40 CFR Part 136.3 Table II
ParameterP
2P
Minimum
Required Volume
ContainerP
1,14P
P-Plastic G-Glass
(F) Filtered (U) Unfiltered PreservationP
18 Maximum Holding TimeP
19P
Microbiology Parameters:
AlkalinityP
18P
• includes bicarbonate & carbonate
200 ml P (Disposable) U Cool ≤6°CP
21 14 days
BOD 5-day 1 liter P U Cool ≤6°CP
21 48 hoursP
6
CBOD 5-day 1 liter P U Cool ≤6°CP
21 48 hoursP
6P
Coliform:
Fecal, Total 250 ml (45Teach) P (sterile)P
7P U
Cool ≤6°CP
21P,
0.008% NaR2RSR2ROR3R (0.1ml 10% NaR2RSR2ROR3R /125 ml) and 15% EDTAP
7P
6 hoursP
8
Specific Conductance 200 ml P (Disposable) U Cool ≤6°CP
21 28 days
TOC 500 ml P (Disposable) U HR3RPOR4R to pH<2
Cool ≤6°CP
21P
28 days
DOC
500 ml
Include a Field Blank with DOC samples
P (Disposable) F
Field filter using 0.45um pore size;
HR3RPOR4R to pH<2
Cool ≤6°CP
21P
28 days
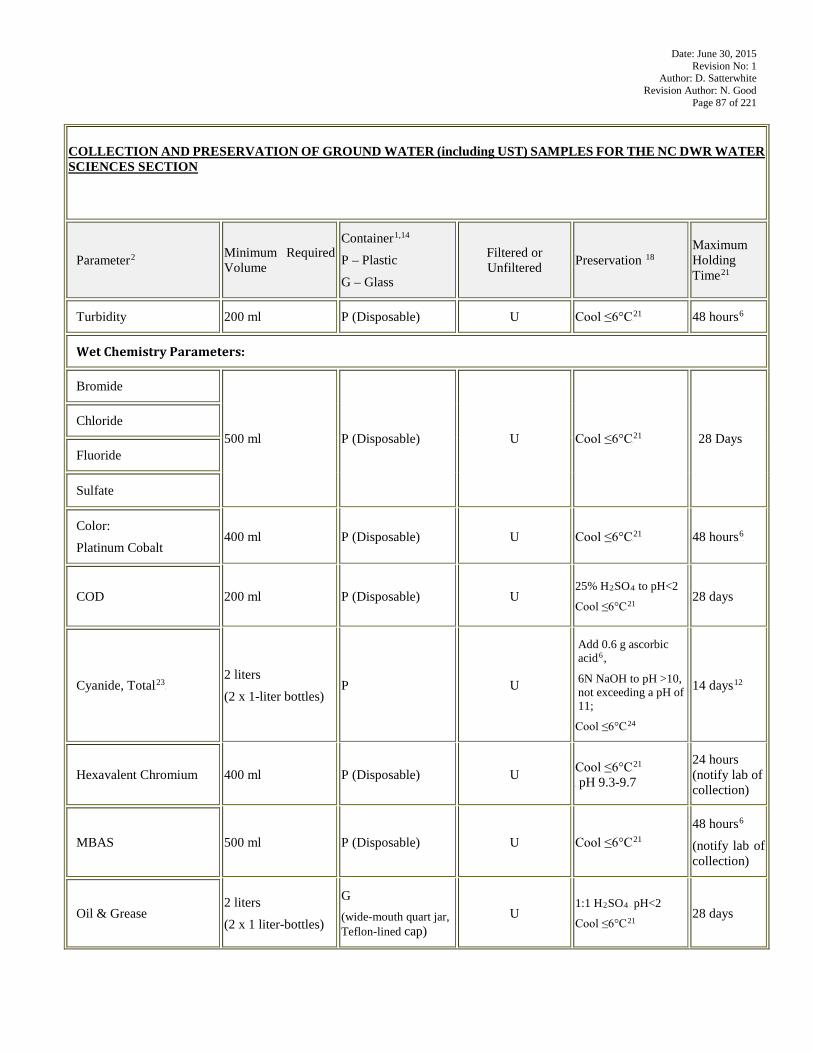
Date: June 30, 2015 Revision No: 1
Author: D. Satterwhite Revision Author: N. Good
Page 87 of 221
COLLECTION AND PRESERVATION OF GROUND WATER (including UST) SAMPLES FOR THE NC DWR WATER SCIENCES SECTION
ParameterP
2 Minimum Required Volume
ContainerP
1,14
P – Plastic
G – Glass
Filtered or Unfiltered Preservation P
18 Maximum Holding TimeP
21
Turbidity 200 ml P (Disposable) U Cool ≤6°CP
21 48 hoursP
6
Wet Chemistry Parameters:
Bromide
500 ml P (Disposable) U Cool ≤6°CP
21 28 Days Chloride
Fluoride
Sulfate
Color:
Platinum Cobalt 400 ml P (Disposable) U Cool ≤6°CP
21 48 hoursP
6P
COD 200 ml P (Disposable) U 25% HR2RSOR4R to pH<2
Cool ≤6°CP
21 28 days
Cyanide, TotalP
23P
2 liters
(2 x 1-liter bottles) P U
Add 0.6 g ascorbic acidP
6P,
6N NaOH to pH >10, not exceeding a pH of 11;
Cool ≤6°CP
24
14 daysP
12
Hexavalent Chromium 400 ml P (Disposable) U Cool ≤6°CP
21
P
PpH 9.3-9.7
24 hours (notify lab of collection)
MBAS 500 ml P (Disposable) U Cool ≤6°CP
21 48 hoursP
6
(notify lab of collection)
Oil & Grease 2 liters
(2 x 1 liter-bottles)
G (wide-mouth quart jar, Teflon-lined cap)
U 1:1 HR2RSOR4 R pH<2
Cool ≤6°CP
21 28 days
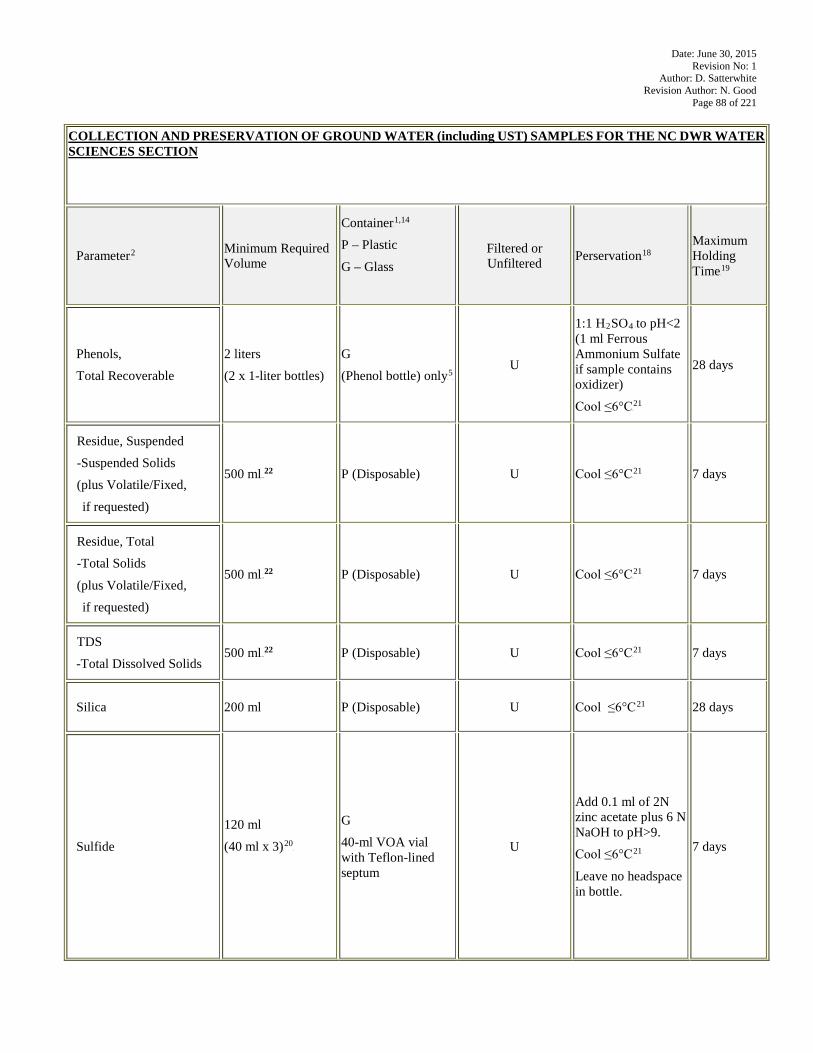
Date: June 30, 2015 Revision No: 1
Author: D. Satterwhite Revision Author: N. Good
Page 88 of 221
COLLECTION AND PRESERVATION OF GROUND WATER (including UST) SAMPLES FOR THE NC DWR WATER SCIENCES SECTION
ParameterP
2 Minimum Required Volume
ContainerP
1,14
P – Plastic
G – Glass
Filtered or Unfiltered PerservationP
18 Maximum Holding TimeP
19
Phenols,
Total Recoverable
2 liters
(2 x 1-liter bottles)
G
(Phenol bottle) onlyP
5P
U
1:1 HR2RSOR4 Rto pH<2 (1 ml Ferrous Ammonium Sulfate if sample contains oxidizer)
Cool ≤6°CP
21
28 days
Residue, Suspended
-Suspended Solids
(plus Volatile/Fixed,
if requested)
500 ml45TP
22 P (Disposable) U Cool ≤6°CP
21 7 days
Residue, Total
-Total Solids
(plus Volatile/Fixed,
if requested)
500 ml45TP
22 P (Disposable) U Cool ≤6°CP
21 7 days
TDS
-Total Dissolved Solids 500 ml45TP
22 P (Disposable) U Cool ≤6°CP
21 7 days
Silica 200 ml P (Disposable) U Cool ≤6°CP
21 28 days
Sulfide
120 ml
(40 ml x 3)P
20P
G
40-ml VOA vial with Teflon-lined septum
U
Add 0.1 ml of 2N zinc acetate plus 6 N NaOH to pH>9.
Cool ≤6°CP
21
Leave no headspace in bottle.
7 days
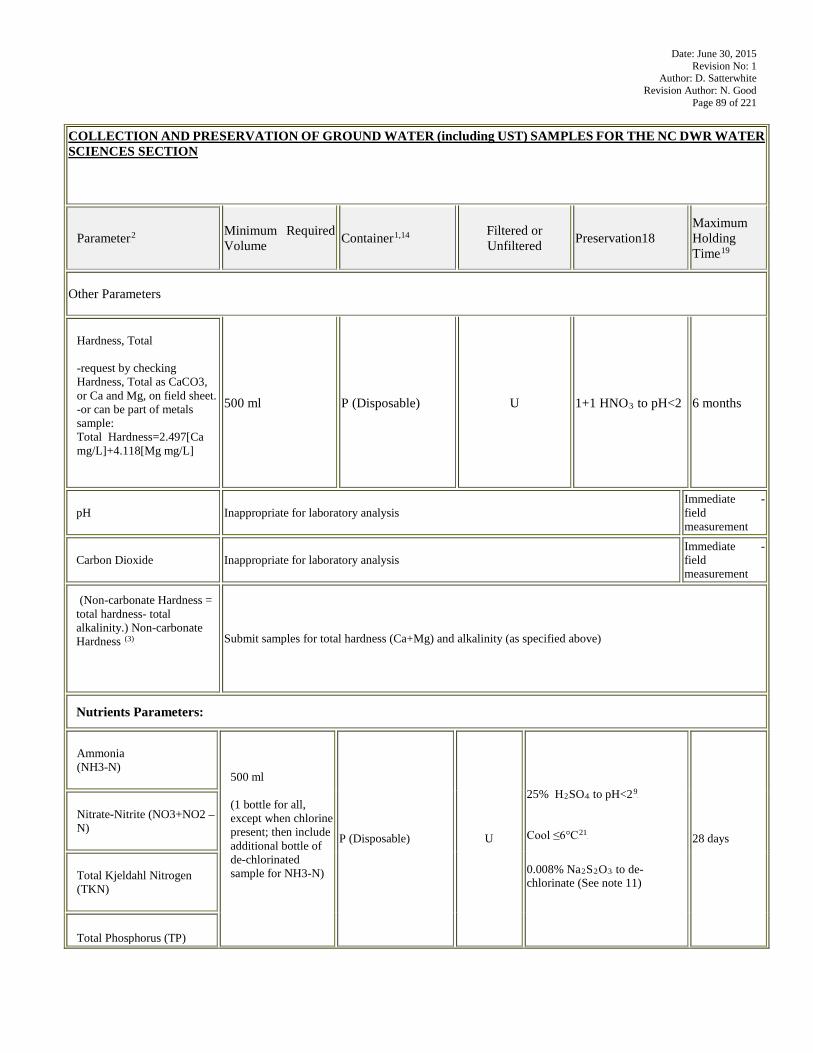
Date: June 30, 2015 Revision No: 1
Author: D. Satterwhite Revision Author: N. Good
Page 89 of 221
COLLECTION AND PRESERVATION OF GROUND WATER (including UST) SAMPLES FOR THE NC DWR WATER SCIENCES SECTION
ParameterP
2 Minimum Required Volume ContainerP
1,14 Filtered or Unfiltered Preservation18
Maximum Holding TimeP
19
Other Parameters
Hardness, Total
-request by checking Hardness, Total as CaCO3, or Ca and Mg, on field sheet. -or can be part of metals sample: Total Hardness=2.497[Ca mg/L]+4.118[Mg mg/L]
500 ml P (Disposable) U 1+1 HNOR3R to pH<2 6 months
pH Inappropriate for laboratory analysis Immediate - field measurement
Carbon Dioxide Inappropriate for laboratory analysis Immediate - field measurement
(Non-carbonate Hardness = total hardness- total alkalinity.) Non-carbonate Hardness P
(3)P
Submit samples for total hardness (Ca+Mg) and alkalinity (as specified above)
Nutrients Parameters:
Ammonia (NH3-N) 500 ml
(1 bottle for all, except when chlorine present; then include additional bottle of de-chlorinated sample for NH3-N)
P (Disposable) US
25% HR2RSOR4R to pH<2P
9P
Cool ≤6°CP
21P
0.008% NaR2RSR2ROR3R to de-chlorinate (See note 11)
28 days
Nitrate-Nitrite (NO3+NO2 – N) Total Kjeldahl Nitrogen (TKN)
Total Phosphorus (TP)
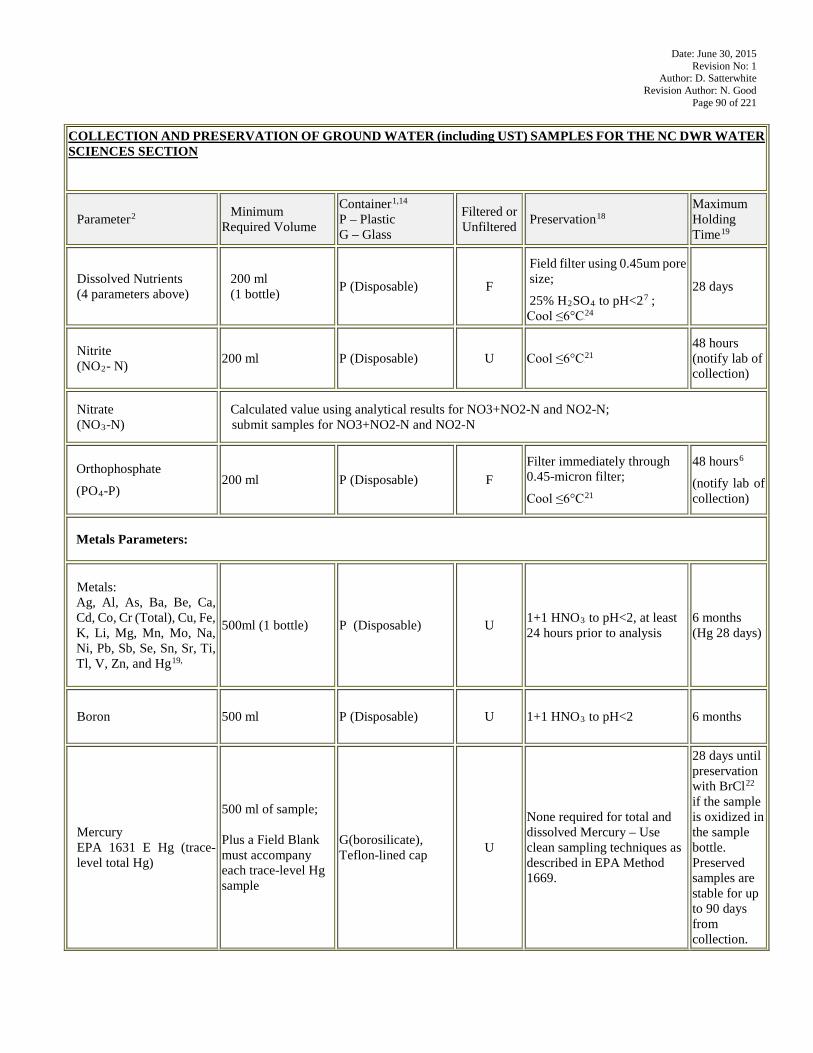
Date: June 30, 2015 Revision No: 1
Author: D. Satterwhite Revision Author: N. Good
Page 90 of 221
COLLECTION AND PRESERVATION OF GROUND WATER (including UST) SAMPLES FOR THE NC DWR WATER SCIENCES SECTION
ParameterP
2 Minimum Required Volume
ContainerP
1,14
P – Plastic G – Glass
Filtered or Unfiltered PreservationP
18 Maximum Holding TimeP
19
Dissolved Nutrients (4 parameters above)
200 ml (1 bottle) P (Disposable) F
Field filter using 0.45um pore size;
25% HR2RSOR4R to pH<2P
7 P;
Cool ≤6°CP
24
28 days
Nitrite (NOR2R- N) 200 ml P (Disposable) U Cool ≤6°CP
21 48 hours (notify lab of collection)
Nitrate (NOR3R-N)
Calculated value using analytical results for NO3+NO2-N and NO2-N; submit samples for NO3+NO2-N and NO2-N
Orthophosphate
(POR4R-P) 200 ml P (Disposable) F
Filter immediately through 0.45-micron filter;
Cool ≤6°CP
21
48 hoursP
6P
(notify lab of collection)
Metals Parameters:
Metals: Ag, Al, As, Ba, Be, Ca, Cd, Co, Cr (Total), Cu, Fe, K, Li, Mg, Mn, Mo, Na, Ni, Pb, Sb, Se, Sn, Sr, Ti, Tl, V, Zn, and HgP
19,
500ml (1 bottle) P (Disposable) U 1+1 HNOR3R to pH<2, at least 24 hours prior to analysis
6 months (Hg 28 days)
Boron 500 ml P (Disposable) U 1+1 HNOR3R to pH<2 6 months
Mercury EPA 1631 E Hg (trace-level total Hg)
500 ml of sample; Plus a Field Blank must accompany each trace-level Hg sample
G(borosilicate), Teflon-lined cap U
None required for total and dissolved Mercury – Use clean sampling techniques as described in EPA Method 1669.
28 days until preservation with BrClP
22P
if the sample is oxidized in the sample bottle. Preserved samples are stable for up to 90 days from collection.
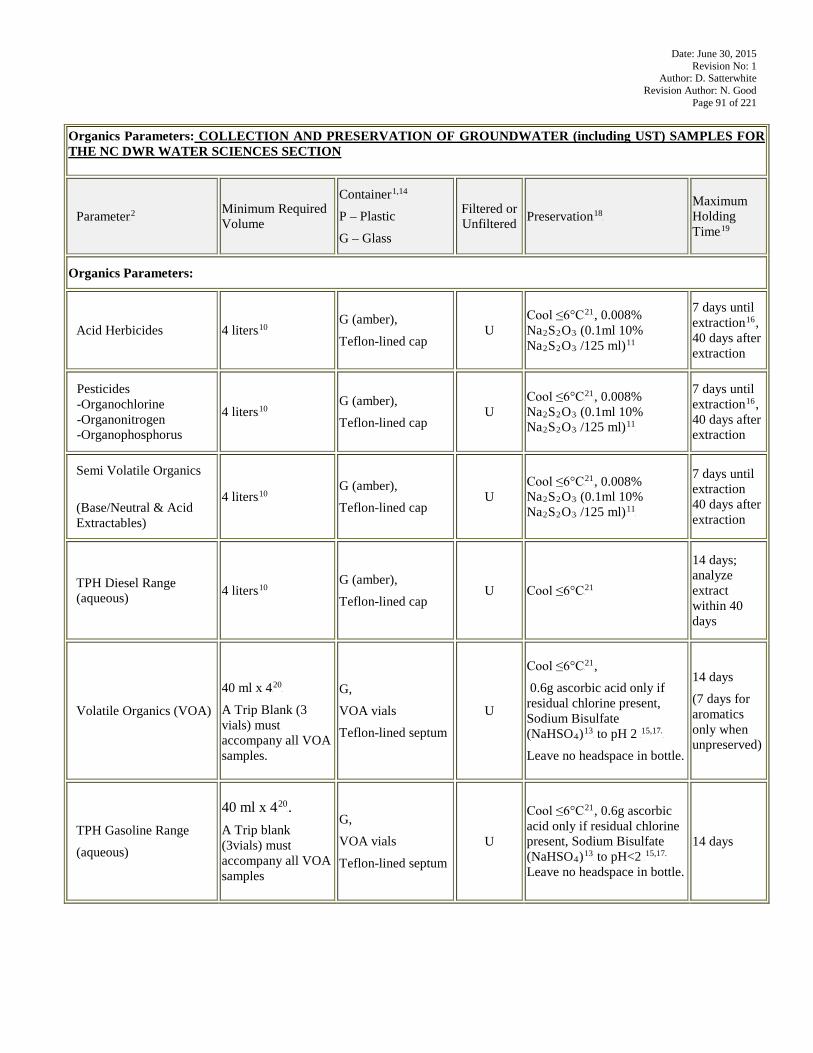
Date: June 30, 2015 Revision No: 1
Author: D. Satterwhite Revision Author: N. Good
Page 91 of 221
Organics Parameters: COLLECTION AND PRESERVATION OF GROUNDWATER (including UST) SAMPLES FOR THE NC DWR WATER SCIENCES SECTION
ParameterP
2 Minimum Required Volume
ContainerP
1,14
P – Plastic
G – Glass
Filtered or Unfiltered PreservationP
18P
Maximum Holding TimeP
19
Organics Parameters:
Acid Herbicides 4 litersP
10 G (amber),
Teflon-lined cap U
Cool ≤6°CP
21P, 0.008%
NaR2RSR2ROR3R (0.1ml 10% NaR2RSR2ROR3R /125 ml)P
11
7 days until extractionP
16P,
40 days after extraction
Pesticides -Organochlorine -Organonitrogen -Organophosphorus
4 litersP
10 G (amber),
Teflon-lined cap U
Cool ≤6°CP
21P, 0.008%
NaR2RSR2ROR3R (0.1ml 10% NaR2RSR2ROR3R /125 ml)P
11P
7 days until extractionP
16P,
40 days after extraction
Semi Volatile Organics
(Base/Neutral & Acid Extractables)
4 litersP
10 G (amber),
Teflon-lined cap U
Cool ≤6°CP
21P, 0.008%
NaR2RSR2ROR3R (0.1ml 10% NaR2RSR2ROR3R /125 ml)P
11P
7 days until extraction 40 days after extraction
TPH Diesel Range (aqueous) 4 litersP
10 G (amber),
Teflon-lined cap U Cool ≤6°CP
21
14 days; analyze extract within 40 days
Volatile Organics (VOA)
40 ml x 4P
20P
A Trip Blank (3 vials) must accompany all VOA samples.
G,
VOA vials
Teflon-lined septum
U
Cool ≤6°CP
21P,
0.6g ascorbic acid only if residual chlorine present, Sodium Bisulfate (NaHSOR4R)P
13P to pH 2 P
15,17.P
Leave no headspace in bottle.
14 days
(7 days for aromatics only when unpreserved)
TPH Gasoline Range
(aqueous)
40 ml x 4P
20P.
A Trip blank (3vials) must accompany all VOA samples
G,
VOA vials
Teflon-lined septum
U
Cool ≤6°CP
21P, 0.6g ascorbic
acid only if residual chlorine present, Sodium Bisulfate (NaHSOR4R)P
13P to pH<2 P
15,17.P
Leave no headspace in bottle.
14 days
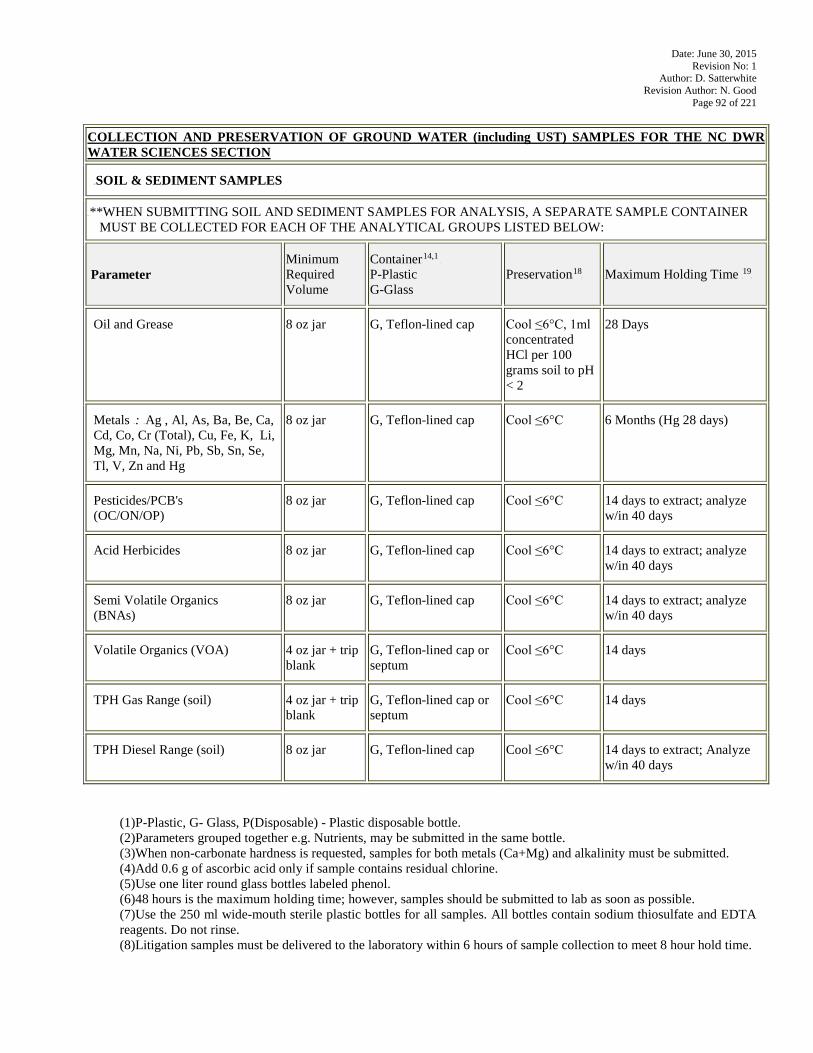
Date: June 30, 2015 Revision No: 1
Author: D. Satterwhite Revision Author: N. Good
Page 92 of 221
COLLECTION AND PRESERVATION OF GROUND WATER (including UST) SAMPLES FOR THE NC DWR WATER SCIENCES SECTION
45TSOIL & SEDIMENT SAMPLES
45T**WHEN SUBMITTING SOIL AND SEDIMENT SAMPLES FOR ANALYSIS, A SEPARATE SAMPLE CONTAINER MUST BE COLLECTED FOR EACH OF THE ANALYTICAL GROUPS LISTED BELOW:
Parameter Minimum Required Volume
ContainerP
14,1 P
P-Plastic G-Glass
PreservationP
18P Maximum Holding Time P
19P
Oil and Grease 8 oz jar G, Teflon-lined cap Cool ≤6°C, 1ml concentrated HCl per 100 grams soil to pH < 2
28 Days
Metals 17T: 17TAg , Al, As, Ba, Be, Ca, Cd, Co, Cr (Total), Cu, Fe, K, Li, Mg, Mn, Na, Ni, Pb, Sb, Sn, Se, Tl, V, Zn and Hg
8 oz jar G, Teflon-lined cap Cool ≤6°C 6 Months (Hg 28 days)
Pesticides/PCB's (OC/ON/OP)
8 oz jar G, Teflon-lined cap Cool ≤6°C 14 days to extract; analyze w/in 40 days
Acid Herbicides 8 oz jar G, Teflon-lined cap Cool ≤6°C 14 days to extract; analyze w/in 40 days
Semi Volatile Organics (BNAs)
8 oz jar G, Teflon-lined cap Cool ≤6°C 14 days to extract; analyze w/in 40 days
Volatile Organics (VOA) 4 oz jar + trip blank
G, Teflon-lined cap or septum
Cool ≤6°C 14 days
TPH Gas Range (soil) 4 oz jar + trip blank
G, Teflon-lined cap or septum
Cool ≤6°C 14 days
TPH Diesel Range (soil) 8 oz jar G, Teflon-lined cap Cool ≤6°C 14 days to extract; Analyze w/in 40 days
(1)P-Plastic, G- Glass, P(Disposable) - Plastic disposable bottle. (2)Parameters grouped together e.g. Nutrients, may be submitted in the same bottle. (3)When non-carbonate hardness is requested, samples for both metals (Ca+Mg) and alkalinity must be submitted. (4)Add 0.6 g of ascorbic acid only if sample contains residual chlorine. (5)Use one liter round glass bottles labeled phenol. (6)48 hours is the maximum holding time; however, samples should be submitted to lab as soon as possible. (7)Use the 250 ml wide-mouth sterile plastic bottles for all samples. All bottles contain sodium thiosulfate and EDTA reagents. Do not rinse. (8)Litigation samples must be delivered to the laboratory within 6 hours of sample collection to meet 8 hour hold time.
Date: June 30, 2015 Revision No: 1
Author: D. Satterwhite Revision Author: N. Good
Page 93 of 221
(9) Caution: Addition of excessive amounts of acid will interfere with the test procedures. The 2.0 ml of 25% HR2RSOR4R per 500 ml sample should be added using a graduated or precise volume dispensing device. If no dispenser is available, you may add exactly 40 drops of the 25% HR2RSOR4R. In most cases, the addition of 2.0 ml (~40 drops) of 25% HR2RSOR4R to 500 ml of groundwater will reduce the pH to <2; however, if the pH remains above 2, add acid dropwise with stirring until the pH is lowered to <2. For nutrient samples, the pH range of 1.5-2.0 is ideal to insure best possible recovery of analytes. Although the requirement is for pH<2, the ideal range for Nutrients is a sample pH of 1.5-2.0. For most samples this pH can be achieved by adding 2.0ml of 25% HR2RSOR4R per 500ml of water sample. (10)In a glass container, submit a small quantity of the pure compound of any suspected material. (11Should only be used in the presence of residual chlorine. Add sodium thiosulfate or ascorbic acid (as specified) to the container first; fill at least half way before adding acid (if used). If residual chlorine is detected in a water sample (generally effluent), then it is recommended that the 500ml water sample for Nutrients be dechlorinated at the time of sample collection. The recommended de-chlorination reagent is sodium thiosulfate (dissolve 3.5 grams in deionized water, then dilute to 1 liter). One mL of this solution will remove 1mg/L of residual chlorine in a 500 mL sample. (12)Maximum holding time is 24 hours when sulfide is present. Optionally, all samples may be tested on-site with lead acetate paper before pH adjustment in order to determine if sulfide is present. If sulfide is present, it can be removed by the addition of cadmium nitrate powder until a negative spot test is obtained. The sample is filtered and then NaOH is added to pH >12. (13)Used by the DWR Chemistry Lab only at this time. (14)The container types listed are those commonly used throughout the Division. Other container types may be acceptable. Please consult the laboratory about use of proper containers before deviating from those listed above. (15)Samples submitted for purgeable halocarbons only should not be acid-preserved. (16)Samples submitted for pesticide and acid herbicide analyses must be extracted within 72 hours of collection if the pH is not adjusted in the lab to a pH range of 5-9. (17)Samples submitted for purgeable aromatics receiving no pH adjustment must be analyzed within 7 days of collection. (18) Sample preservation should be performed immediately upon collection. For composite sample, each aliquot should be preserved at the time of collection. When use of an automated sampler makes it impossible to preserve each aliquot, then the samples may be preserved by maintaining at 6ºC until compositing and sample splitting is completed. (19) Samples should be analyzed as soon as possible after collection. The times listed are the maximum times that samples may be held before analysis and still be considered valid. Collection times must allow for sample preparation and analytical setup. Some samples may not be stable for the maximum time period given in the table. Collectors are obligated to hold the sample for as short a time as possible especially if knowledge exists showing that this is necessary to maintain sample stability. (20) Fill the bottle to overflowing and cap, leaving no air space. (21) Aqueous samples must be preserved ≤ 6º C, and should not be frozen unless data demonstrating that sample freezing does not adversely impact sample integrity is maintained on file and accepted a valid by the regulatory authority. Also, for purposes of NPDES monitoring, the specification “≤ ºC” is used in place of the “4 ºC” and “< 4 ºC” sample temperature requirements listed in some methods. The preservation temperature does not apply to samples that are analyzed immediately (less than 15 minutes). (22) Larger sample volumes may need to be submitted to achieve lower PQLs. (23) The QAO has a licensed copy of ASTM D7365-09a, which details sampling, preservation and mitigating interferences in water samples for analysis of Cyanide. Special attention should be paid to the footnotes for any deviations.
Date: June 30, 2015 Revision No: 1
Author: D. Satterwhite Revision: N. Good
Page 94 of 221
7.0 Sample Custody and Handling Many of the inaccuracies in environmental analysis result from incorrect sample handling and lack of supporting documentation. Four factors that may ultimately affect the integrity of reported data include 1) obtaining a representative sample, 2) preventing contamination of the sample, 3) providing legal documentation of the sampling event, and 4) protecting the sample from chemical, physical or biological change prior to analysis.
7.1 Objective The primary objective of sample custody is to maintain the integrity of samples and to generate documentation sufficient to trace a sample from its point of origin, through receipt in the laboratory, then analysis, reporting and disposal. While the laboratory may not have control of field sampling activities, the laboratory has incorporated the following into its Quality Management Plan to ensure the validity of the laboratory's data.
The laboratory has established guidelines and procedures for the transportation, receipt, handling, protection, storage, retention or disposal of samples including all provisions necessary to protect the integrity of the sample and to protect the interests of the laboratory and the client. These procedures are communicated to Water Sciences Section personnel and its clients in the Sample Submission Guidance document. This document is available for viewing on the Water Sciences Section website at: 34Thttp://portal.ncdenr.org/web/wq/lab/ops/samples34T
The laboratory has adopted a system for identifying and tracking samples. This identification is retained throughout the life of the sample in the laboratory and ensures that samples cannot be confused physically or when referred to in records or other documents.
The sample management procedures used by the DWR Water Sciences Section Chemistry Laboratories are designed to ensure that sample integrity is maintained and documented. This documentation includes:
• Sample transmittal forms (fieldsheets and Chain-of-Custody) • Sample preparation logs or worksheets • Sample analysis logs or worksheets • Calibration and quality control data associated with a sample set • Instrument maintenance logs • Sample disposal logs • Final reports
7.2. Sample Custody Procedures
The Water Sciences Section follows both routine and legal chain-of-custody (COC) procedures, depending on the requirements of the client submitting the samples. The DWR Water Sciences Section has adopted a policy of maintaining formal COC records on samples collected during enforcement or other investigations suspected to involve litigation. All samples processed by the Water Sciences Section Chemistry Laboratory are kept discrete by assigning an individual laboratory number.
7.2.1. Routine Sample Custody Samples are collected by field personnel utilizing procedures identified within their field SOPs or Quality Assurance Plans. The sample collection personnel must first consider the analyses to be performed so that proper shipping containers and sample containers with the appropriate preservatives are assembled. Holding times and field quality control measures must also be considered. All records required for documentation of field collection, including the pertinent data on sample labels/tags and applicable fieldsheets must be completed by the field personnel. Samples are packed so that they are segregated by site, sampling location, sample analysis type or by sample priority. A sample transmittal form (fieldsheet) must accompany all samples that are submitted to the Water Sciences Section. This record serves as a documented summary of the sample collection event and includes all records necessary to trace a sample from its point of origin through the final report. Each event or procedure to which
Date: June 30, 2015 Revision No: 1
Author: D. Satterwhite Revision: N. Good
Page 95 of 221
the sample is subjected is recorded including sample collection, field preservation, sample receipt and sample log in. Example fieldsheet supplied by the Central Laboratory are shown in Figures 7.1 through 7.4 covering submissions to the Central Laboratory, Asheville Laboratory, Underground Storage Tank sampling, and Sediment, Soil & Tissue sampling. The minimum information required on these records includes:
(a) a unique sample location/field ID combination for that date/time/collector. (b) the date and time of sample collection (beginning and ending for composite samples) (c) the collector's name (d) the submitting entity (who to report to) (e) the sample matrix (f) the analyses requested (g) sample priority (h) method of shipment
If any of the above information is not present, an effort is made to reach the collector by phone. If the information cannot be obtained in a timely manner, the sample is subject to rejection. After collection, the samples are shipped to the laboratory by state courier, common carrier or are hand-delivered by the field staff.
Additional documentation recorded on the field sheets may include:
♦ Ambient field conditions ♦ Type of composite ♦ Temperature of samples in the field ♦ Field measurement data ♦ Field instrument calibration information
7.2.2. Legal Chain of Custody
Legal chain of custody is a special type of sample custody in which documentation is kept of all events (i.e., possession, transport, storage, and disposal) and time intervals associated with a specific sample. Legal chain of custody documentation includes chain-of-custody (COC) forms that have adequate space for dated, original signatures of all individuals who handled the samples, from the time of collection through laboratory receipt and distribution to the analytical unit. The custody of a sample is defined as one of the following:
(a) It is in the sampler's or transferee's actual possession; (b) It is in the sampler's or transferee's view, after being in his/her physical possession; (c) It was in the sampler's or transferee's physical possession and then he/she secured it or placed in a
designated secure area to prevent tampering.
The purpose of the COC is to supply a detailed record of the sample description, collection information, and any transfer of custody from sample collection through sample receipt into the laboratory. The sample collector is responsible for the care, custody and paper trail documentation of the sample until properly dispatched to the analytical laboratory via State courier or turned over to a sample custodian or designee. The sample collector must assure that each container is in his/her physical possession or in his/her view at all times, or stored in such a place and manner to preclude tampering. Samples must be delivered to the laboratory as soon as possible after collection.
NOTE: The State couriers and independent couriers are not required to sign the COC form. The samples and COC are kept in the sealed sample cooler with the associated samples. The condition of the security seal is noted upon receipt at the lab. The freight bill from independent couriers is kept with the chain-of-custody documentation.
Date: June 30, 2015 Revision No: 1
Author: D. Satterwhite Revision: N. Good
Page 96 of 221
Chain of custody records shall include the following information either by direct entry or by linkage to the fieldsheet:
♦ Time of day and calendar date of each transfer or handling procedure ♦ Signatures of transferors and transferees ♦ Location and security conditions of samples (when stored in the field) ♦ Storage conditions for sample including thermal preservation ♦ Unique lab ID for all samples ♦ Common carrier documents ♦ Sampling site description ♦ Date and time of sample collection ♦ Unique field ID code (optional) ♦ Collector's name ♦ Number of sample containers ♦ Requested analyses
Entries into all records must be written legibly and must be made with waterproof ink. All documentation entries shall be signed or initialed by responsible staff. Erasures or markings shall not obliterate entries in records. All corrections to record-keeping shall be made by one line marked through the error leaving the original record visible. The individual making the correction shall sign or initial and date the correction. An example COC form is given in Figure 7.5 (Water Quality Section Surface Water Chain of Custody Form). A copy of this record is sent to the customer while the original is kept in the sample report file.
7.3 Sample Receipt Protocol Sample acceptance, receipt, tracking and storage procedures are fully detailed in sample management SOPs. These procedures are summarized in the following sections. The chemists at the Regional Laboratory and the Support Unit personnel at the Central Laboratory are responsible for receiving samples shipped or delivered by field personnel that collect water, soil or tissue samples throughout the state. Laboratory staffs receive deliveries of all samples and initiate the first in-house records for a sample. When samples arrive at the laboratory, laboratory personnel inspect the coolers and samples. The integrity of each sample must be determined by comparing sample labels or tags with the fieldsheet and COC (when applicable) and by visual checks of the container for possible damage or tampering. Any problems or anomalies are recorded on a Sample Condition Upon Receipt (SCUR) form and the sampler is notified. A course of action is determined and documented and the SCUR form is scanned into Laserfiche and the shared drive Chem Lab folder along with the fieldsheets in the Fieldsheets folder. Copies of the SCURs are scanned and stored on the server at S:\ChemLab\Fieldsheets and also in Laserfiche. A copy of the SCUR is filed with the printed final report. A copy of this form is sent with the final report to the collector.
7.3.1 Procedure
Laboratory staffs remove the samples from the container or cooler and organize the sample bottles according to sample location and fieldsheet. A sample may be composed of greater than one bottle since different preservatives, collection or handling techniques may be required to perform all analyses requested. (Sample integrity and condition of all sample containers is verified for leakage, broken bottles, contaminated coolers, odors, etc.)
Inspection of samples, at the time of receipt, includes checking:
(a) Complete documentation to include sample identification, location, date and time of collection, collector's name, preservation type, sample type and any additional comments concerning the samples.
(b) Complete sample labels to include unique identification, preservation, analysis requested, date and time of collection and collector in indelible ink.
Date: June 30, 2015 Revision No: 1
Author: D. Satterwhite Revision: N. Good
Page 97 of 221
(c) Use of appropriate sample containers. (d) Adherence to holding times as specified in the test method or summarized in Section 6. (e) Adequate sample volume for the required analyses. (f) Damage or signs of contamination to the sample container. Volatile organics vials and other highly
volatile samples (e.g., sulfide) are also inspected for headspace. (g) Checking and recording the temperature of samples that require thermal preservation.
Verification of chemical sample preservation, as specified in 40 CFR Part 136 or the test method, is performed immediately upon receipt in the analytical units after login and distribution and the process is documented on appropriate logs or bench sheets. Exceptions include volatile organics, sulfide and coliform samples. The preservations of these samples are checked after an aliquot is taken for analysis in order to avoid volatilization or contamination. Wide range and narrow-range pH test strips are used to verify chemical preservation. If anomalies are noted or if adjustments have to be made, the process is documented on a Sample Anomaly Report (SAR) and the sample results are qualified accordingly. When the pH of a sample is adjusted in the laboratory, the observed and adjusted pHs must be recorded as well as the amount of acid or base the was used to make the adjustment. When an analyst is unable to confirm proper preservation using the test strips, a pH meter and electrode shall be used to document an actual pH value for the sample. Otherwise, the pH may be documented as “less than” or “greater than” the published criteria (for example, <2 or >10).
At the time of receipt, laboratory staff checks the temperature of the samples by measuring the temperature of the temperature blank using an IR gun thermometer. The IR gun thermometers are checked daily against a calibrated thermometer and the results documented on the IR Daily Calibration Check log. The IR thermometer must be within +/- 1 degree C of the calibrated thermometer. Corrective action must be taken if the temperatures differ by greater than 1 degree C. The IR thermometers are checked annually against a blackbody reference standard. If there is no temperature blank present and if it does not compromise the integrity of the sample, the temperature of a representative sample is measured by pouring a small aliquot into a separate container, taking the temperature of this portion and then discarding it or checking temperature with the calibrated IR thermometer. Samples shall be deemed acceptable if arrival temperature is either within 0.1 to 6°C (with no evidence of freezing), 0.1 to <10°C for bacteriologicals or the method specific range. Samples that are hand-delivered immediately after collection may not be at the required temperatures; however, if there is evidence that the chilling process has begun, such as the arrival on ice or ice slurry and a downward trend in temperature is documented, the sample shall be considered acceptable. For samples with short transport times, samplers are asked to document a field temperature. Documentation of the actual sample temperature at the time of collection and upon receipt (and demonstrating a downward trend) will complete the preservation documentation requirements. For COC samples, shipping documents are set aside and the shipping container examined, noting the presence and condition of any custody seals on the outside of the container before the sample is accepted for analysis. Any internal custody seals are then examined. Observations are recorded in the space provided on the COC form. The shipping container is opened fully and the sample custody documentation removed. If there is no COC or if it is improperly filled out, the deviation is documented on a SCUR form and chain of custody procedures areconsent generally discontinued at this point. Carrier, freight bill or other tracking numbers in shipping documentation are recorded on or retained with the COC. Any deviations from the checks above that question the suitability of the sample for analysis, or incomplete documentation of the tests required will be resolved by consultation with the sampler. If the sample acceptance criteria are not met, the laboratory will:
1. Notify the customer of any non-conformance that may affect the integrity of the data. The samples may be rejected unless the client requests otherwise. Data from compromised samples is flagged with the appropriate data qualifier code(s) or comments and Sample Anomaly Report is issued with the report.
Date: June 30, 2015 Revision No: 1
Author: D. Satterwhite Revision: N. Good
Page 98 of 221
2. Fully document any decision to proceed with sample analysis that does not meet sample acceptance criteria. The condition of these samples shall be documented on the SCUR. The analytical results shall be appropriately qualified on the final report.
3. Retain all correspondence or records of communications with the sampler regarding the disposition of rejected samples.
The custodian then assigns a chronological lab number thru LIMS entry to each sample and records their initials, shipment method and the date and time of receipt. The lab number is recorded on each sample label or tag and on the COC form when applicable. Each sample is assigned a unique sample identification number of the format XXWYYYY or XXGYYYY where X is the number denoting the year, then either W (representing Water Quality Surface Water) ,G (representing Water Quality Ground Water) or U (representing Underground Storage Tank, UST) represents the type of sample and YYYY is an accession number beginning with '0001'. If samples are identified for legal/evidentiary purposes on the fieldsheet, laboratory staffs will retain the shipping record with the COC, initiate an internal COC for laboratory use by analysts and a sample disposal record. When a sample is removed from the Receiving Room, the custody is transferred from the sample custodian to an analyst. This person may be one and the same at the regional laboratories. The transaction is recorded in the "lab use only" section of the COC form by date, time and user. Samples designated as 'Emergency' receive priority handling. Colored stickers denote their priority status for quick identification and all other work or sample analyses are often preempted by these samples. Appendix V of this document states WSS Laboratory Sample Prioritization Policy. Copies of the fieldsheets are scanned and stored on the server at S:\ChemLab\Fieldsheets and also in Laserfiche®. The originals are sent to a Processing Assistant for entry into the laboratory data management system. All samples received by the Water Sciences Section are assigned an AD, AE etc. number and logged into the LABWORKS™ LIMS. The samples are logged into the LABWORKS™ LIMS with the following information.
(a) lab number (ADxxxxx,AExxxxx etc) (b) sample location/id/description (c) county (d) sorting number (e) station number (as appropriate) (f) location code (g) the program or region to report the data to (h) sample collector (i) date and time collected (j) date and time received (k) sample type (l) sample priority (m) analyses requested (n) initials of the sample receipt person (o) person releasing the report (p) date report released
This information must be unequivocally linked to the sample record or included as part of the record. If such information is recorded or documented elsewhere, the records shall be part of the lab's permanent records, easily retrievable upon request and readily available to individuals who will process the sample. Note: Information placed or recorded on the sample container or tag is not considered permanent record.
All log-in information is cross-checked by a second Processing Assistant, after which login of the sample is authorized in the LABWORKS™ LIMS. The fieldsheets are placed in a notebook or central location to await final report generation.
Date: June 30, 2015 Revision No: 1
Author: D. Satterwhite Revision: N. Good
Page 99 of 221
7.4 Procedure to Assess Capability to Meet Workload Requirements It is the primary responsibility of the Section Chief, through the Environmental Program Supervisors, Supervisors and Lead Chemists, to manage workload in the lab. Availability of capability in the lab is contingent on both labor and instrumentation. All samples are logged into the LABWORKS™ LIMS and given a unique lab number (AD) as well as an ID number associating the sample with Water Quality Program Surface Water (WQ), and Groundwater (GW) as well as UST (U). It is the responsibility of the Lead Chemist for each analytical unit to review the incomplete work list daily with the chemists/technicians and report any problems with scheduling to the Environmental Program Supervisor. The Environmental Program Supervisor maintains a detailed status report, which provides information on all samples that are logged into the lab. This information includes due date and incomplete summary. Scheduling and instrument issues on a unit by unit basis are discussed and resolved. The Lead Chemists track analytical units with limited capacity or scheduling issues and passes this information to the Environmental Program Supervisor to notify samplers. Sample collection dates/times are entered during sample login. The holding time deadline is calculated from this information and noted on the backlog report. For a grab sample, the holding time begins at the time of collection. For a composite sample collected automatically over time (e.g., using a 24-hour composite sampler) the holding time begins at the time of the end of collection of the composite samples. Environmental Program Supervisors have the responsibility to ensure all analyses under their supervision are prepared and analyzed within the holding times. Chemists and technicians who schedule their work priority from backlog reports have the responsibility to complete analytical work within the holding time.
7.5 Storage conditions After receipt and check-in, samples are transferred from the sample receiving area to the analytical units or sample storage areas. Storage areas must not contribute to deterioration, contamination, loss or damage to the sample. When samples must be stored under specified environmental conditions, these conditions shall be maintained monitored and recorded. The primary considerations for sample storage are temperature, holding times, contamination and security.
Samples are stored in the following areas within the Central Laboratory:
(a) air conditioned room (G-113): aqueous metal samples (b) walk-in refrigerator (G035A): organic samples (SVOA, pesticides) (c) walk-in refrigerator (G028): nutrients and wet chemistry samples (d) walk-in refrigerator (G088): sediment metal and microbiology samples (e) VOA lab refrigerator #1 (G065): VOA sample secondary aliquots (f) VOA lab refrigerator #2 (G065): aqueous and sediment VOA samples (g) lab freezer (G113): tissues and other samples requiring freezing (h) lab freezer (G066): filtered chlorophyll a samples (i) lab freezer (G035A): Pesticide tissue samples
The regional laboratory stores samples in refrigerators located in the analytical areas. Section 6.0 summarizes the temperature and holding time protocols for various analyses. Samples, sample fractions, extracts, digestates or other sample preparation products that require thermal preservation shall be kept at +/- 2°C of the test method requirements. Those samples that have a specified storage temperature of 6°C may be stored at 0.1 to 6°C as long as there is no evidence of freezing. The temperature of cold storage areas are monitored and recorded daily and corrective action is taken as necessary. All samples distributed into the laboratory are stored separately from standards and reagents used for analyses to prevent cross-contamination. Samples are also stored away from food and other potentially contaminating sources. Sample fractions, extracts, digestates, and other sample preparation products are stored according to Section 6.0 (or according to the specifications in the test method) in controlled storage areas in the analytical unit. The Water Sciences Section laboratories are limited access, secure facilities. Only authorized personnel are permitted within the laboratory areas where sample access is possible. Access to the laboratory is controlled such that sample storage need not be locked at all times unless a particular case demands it. Samples are accessible to DWR Water Sciences Section Laboratory personnel only. Visitors to the laboratory are prohibited from entering the refrigerator and laboratory areas unless
Date: June 30, 2015 Revision No: 1
Author: D. Satterwhite Revision: N. Good
Page 100 of 221
accompanied by an employee of the Water Sciences Section. Samples are returned to the appropriate refrigerator after sufficient sample has been obtained to complete the analysis.
7.6 Sample Disposal Samples are normally maintained in the lab no longer than three months from receipt unless otherwise requested. If the sample is part of litigation, the affected legal authority, data user, or sample submitter must participate in the decision about the sample's disposal. Disposal is performed in accordance with local, state, US EPA-approved methods and in accordance with the Laboratory Chemical Hygiene Plans. All documentation and correspondence concerning the disposal decision process must be kept on file. Pertinent information includes:
• Date of disposal • Nature of disposal (e.g., sample depletion) • Names of individuals who conducted arrangements and physically completed the task.
Sample disposal may be handled in the following manner:
1) The sample may be consumed completely during analysis, or 2) If samples meet established disposal guidelines, they are discarded by pouring down sink drains. The laboratory’s
sanitary sewer system is equipped with a limestone pit for normalizing pH.
7.7 Sample Custodians Personnel working in the sample receiving room or sample receiving area are designated as sample custodians. The supervisors, chemists, technicians and QA/QC Coordinator may also be designated as sample custodians.
7.8 Inter-laboratory Custody Samples that need to be subcontracted or routed to another laboratory within the Water Sciences Section will show transfer to that lab on a sample transmittal form, which lists sample ID numbers and requested analyses. It will include the date/time it was sent out and the identity of the custodian responsible. For chain of custody samples, the COC form is completed and scanned onto S:\ChemLab\Fieldsheets and Laserfiche with the associated samples for review. The delivery technician and the recipient at the receiving lab must sign the COC indicating the transfer dates and times.
7.9 DWR LABWORKS™ LIMS
The laboratory uses LABWORKS™ LIMS. The main server, the applications and hardware are maintained by NC IT. LABWORKS™ is a commercial LIMS product purchased from Perkin Elmer (the server is maintained at Street, Raleigh, NC 27603). To gain access to Labworks™ LIMS, users must provide valid network and LIMS usernames and passwords. When all the analyses for a sample are complete, data generated is entered into LABWORKS™ LIMS, peer reviewed and senior reviewed the sample is authorized for released. The Supervisors or the Section Chief certifies the reports by initialing them. One report is retained with the field data sheets in the laboratory. The other report is mailed with a copy of the fieldsheet to certain clients. Other clients access the report via LABWORKS™ LIMS. The LIMS software is being modified on a continuing basis by the section. The revisions of the codes are documented in the project history file of each application. The verification of the performance of the LIMS software or hardware is performed each time when any part of it is used. Any abnormalities are reported to the Microbiology and Inorganic Chemistry Branch Supervisor or Wet Chemistry/ Nutrients Unit Supervisor immediately for quick corrective action(s).
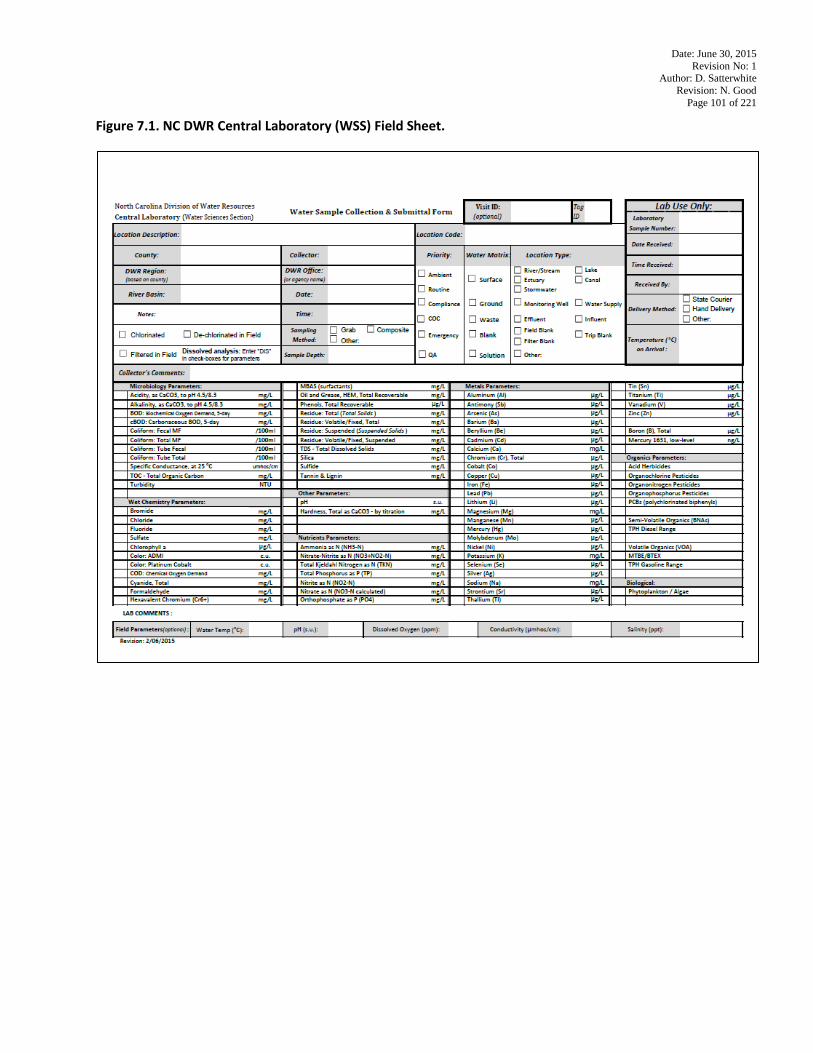
Date: June 30, 2015 Revision No: 1
Author: D. Satterwhite Revision: N. Good
Page 101 of 221
Figure 7.1. NC DWR Central Laboratory (WSS) Field Sheet.
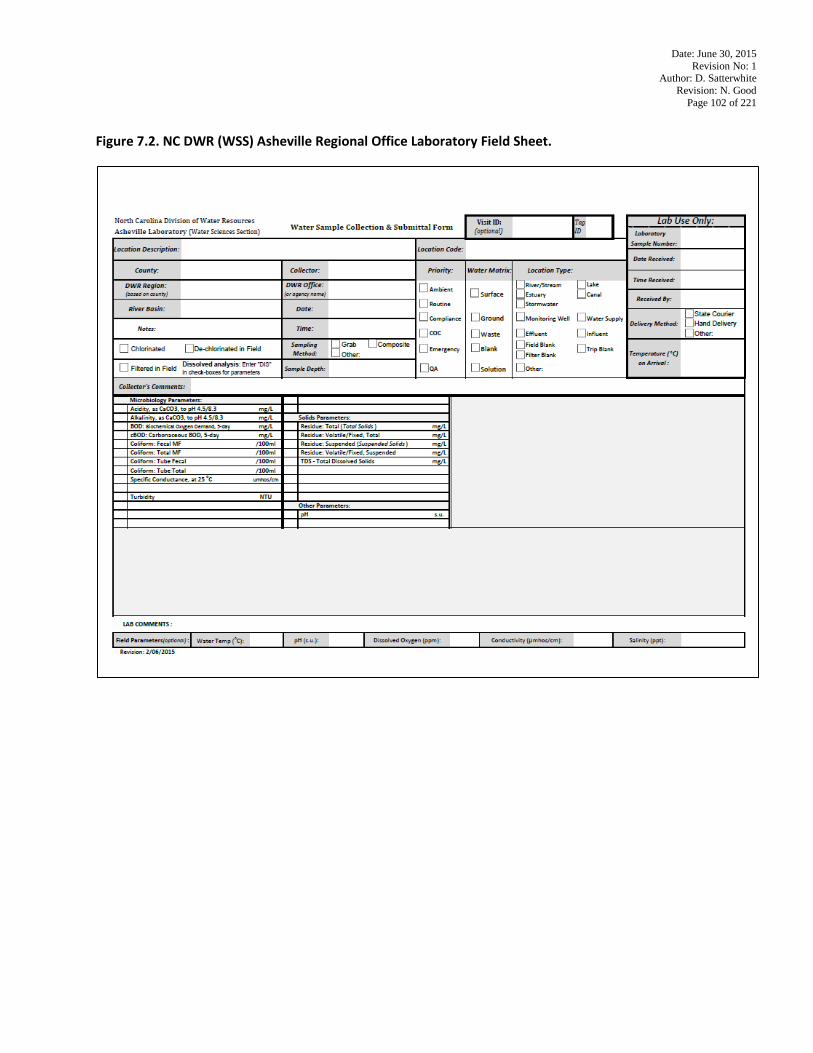
Date: June 30, 2015 Revision No: 1
Author: D. Satterwhite Revision: N. Good
Page 102 of 221
Figure 7.2. NC DWR (WSS) Asheville Regional Office Laboratory Field Sheet.
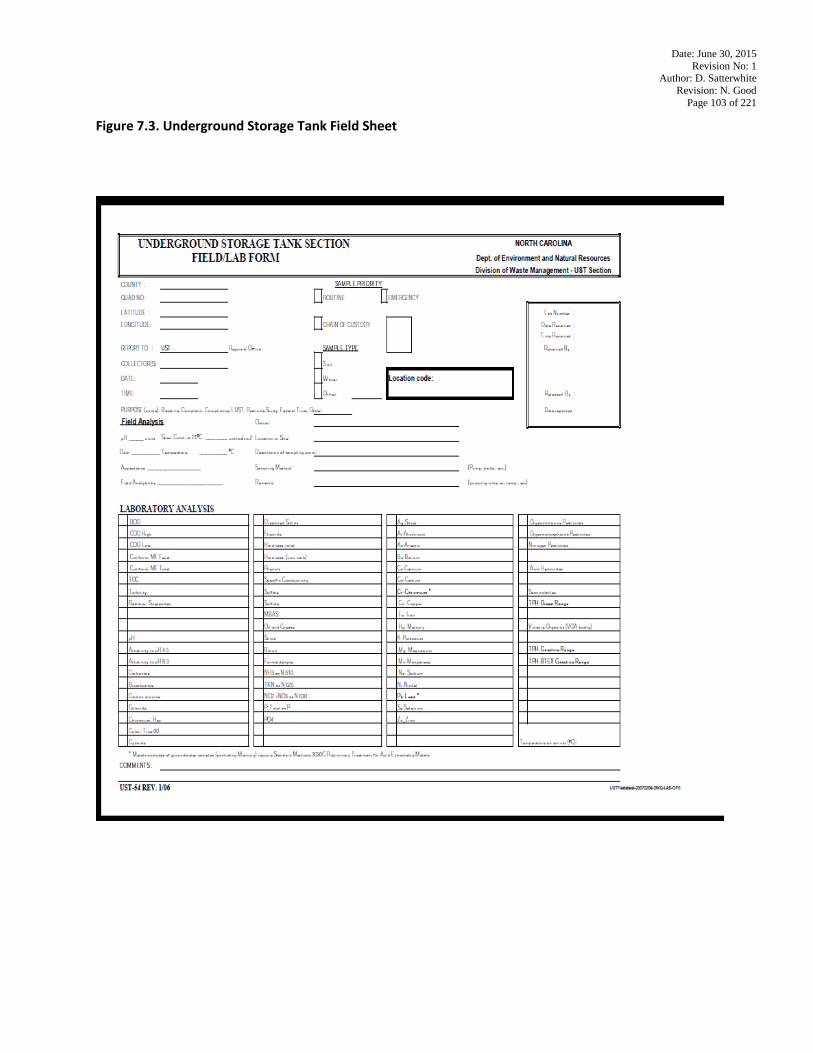
Date: June 30, 2015 Revision No: 1
Author: D. Satterwhite Revision: N. Good
Page 103 of 221
Figure 7.3. Underground Storage Tank Field Sheet
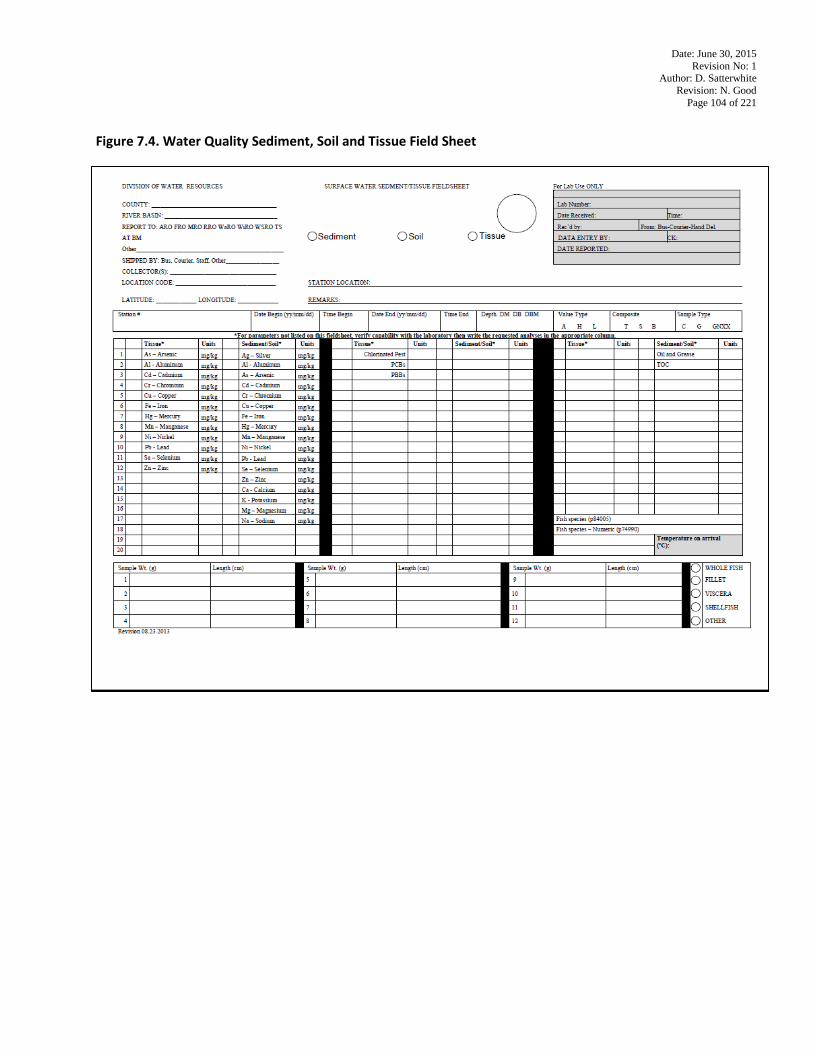
Date: June 30, 2015 Revision No: 1
Author: D. Satterwhite Revision: N. Good
Page 104 of 221
Figure 7.4. Water Quality Sediment, Soil and Tissue Field Sheet
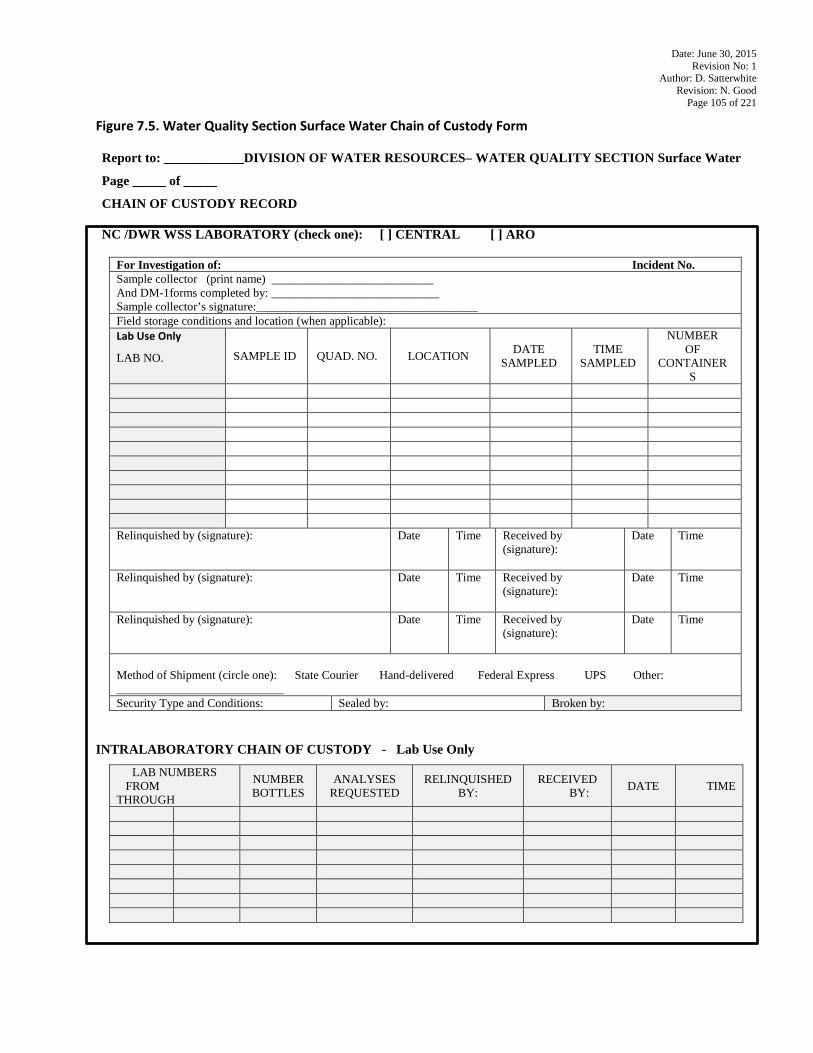
Date: June 30, 2015 Revision No: 1
Author: D. Satterwhite Revision: N. Good
Page 105 of 221
Figure 7.5. Water Quality Section Surface Water Chain of Custody Form Report to: ____________DIVISION OF WATER RESOURCES– WATER QUALITY SECTION Surface Water
Page _____ of _____
CHAIN OF CUSTODY RECORD NC /DWR WSS LABORATORY (check one): [ ] CENTRAL [ ] ARO
For Investigation of: Incident No. Sample collector (print name) ___________________________ And DM-1forms completed by: ____________________________ Sample collector’s signature:_____________________________________ Field storage conditions and location (when applicable): Lab Use Only
LAB NO. SAMPLE ID QUAD. NO. LOCATION DATE SAMPLED
TIME SAMPLED
NUMBER OF
CONTAINERS
Relinquished by (signature): Date Time Received by
(signature):
Date Time
Relinquished by (signature): Date Time Received by (signature):
Date Time
Relinquished by (signature): Date Time Received by (signature):
Date Time
Method of Shipment (circle one): State Courier Hand-delivered Federal Express UPS Other: ____________________________ Security Type and Conditions: Sealed by: Broken by:
INTRALABORATORY CHAIN OF CUSTODY - Lab Use Only
LAB NUMBERS FROM THROUGH
NUMBER BOTTLES
ANALYSES REQUESTED
RELINQUISHED BY:
RECEIVED BY: DATE TIME
Date: June 30, 2015 Author: D. Satterwhite
Revision Author: N. Good Revision No: 01 Page 106 of 221
8.0 ANALYTICAL PROCEDURES The analytical methods utilized by the laboratory are listed in Section 5.0 of this QAM. Whenever possible, only EPA-approved methods are used. The reference methods are also documented in the laboratory’s Standard Operating Procedures (SOPs). For information about the documentation and maintenance of laboratory SOPs, refer to SOP# QAG001 - Guidance for Preparing Standard Operating Procedures.
8.1 Reference Methods
The following compilations encompass the individual methods listed in Section 5.0 (listed by acronym designation as used in Section 5.0 tables).
8.1.1 EPA • Methods for Chemical Analysis of Water and Wastes; USEPA Office of Research and Development,
Cincinnati, OH, 3/83; EPA 600/4-79-020.
• Methods for the Determination of Metals in Environmental Samples, USEPA Office of Research and Development, Washington DC, 6/91, EPA/600/4-91/010.
• Test Methods for Evaluating Solid Wastes, Physical/Chemical Methods, SW-846; 3rd edition (9/86), with Final Updates I (7/92), II (9/94), IIA (9/93), IIB (1/95) ,III (12/96);and IV(2007) USEPA Office of Solid Waste and Emergency Response, Washington, D.C.
• Method for the Determination of Organic Compounds in Drinking Water, Supplement I, EPA 500/4-90/020, July 1990.
• Code of Federal Regulations, Title 40, Part 136; U.S. Government Printing Office, Washington, D.C., July 1993. [
• Standard Methods – Examination of Water and Waste Water On-Line
8.1.3 Other Reference Procedures Other reference procedures for non-routine analyses may include methods established by a specific state or by a vendor company such as HACH, QUIK CHEM or by organizations such as USGS or ASTM. Sample type, source, instrumentation and the governing regulatory agency requiring the analysis will determine the method utilized.
8.2 Method Modifications
Many of the environmental sample analysis methods were written using the best available technology at the time of their publication. However, some of these methods have not been updated since that time and therefore do not reflect advances in technology. Additionally, 40 CFR Part 136.6 allows for method modifications that lower detection levels, improve precision, reduce interferences, lower lab costs and promote environmental stewardship by reducing generation of lab wastes. The Water Sciences Section has modified some methods to accomplish these goals and to take advantage of technological advances. The majority of these modifications are minor, do not have any impact on the quality of the data, and are included here for the sake of completeness. Some published methods are also not clear or are ambiguous about their requirements. Clarifications are made about these methods in this Section. All modified methods are verified by performing an MDL and IDOC study and are closely monitored for precision, accuracy and bias attributed to matrix. If the method performance is equivalent to that published in the method, the modification is adopted for routine use in the laboratory. The modification is summarized in the QAM and is described in detail in the SOP.
The following modifications (8.2.1 – 8.2.10) have been made to the methods in Table 5.1:
Date: June 30, 2015 Author: D. Satterwhite
Revision Author: N. Good Revision No: 01 Page 107 of 221
8.2.1 EPA 200.2 Method 200.2 (hot plate) is modified and validated for use with a block digester. 0.50 mL of nitric acid and 0.50 mL of 1+1 hydrochloric acid is added to 50 mL of sample in either a Teflon or disposable polypropylene tube and heated at 95°C for approximately 6 hrs. The sample is then brought back to a volume of 50 mL with deionized water. U.S. EPA Region 4 has provided written approval for the use of EPA Method 200.2 with this modification.
8.2.2 EPA 245.1
The QCS is not used to fortify an aliquot of LRB or sample matrix (ref. EPA Method 245.1, Section 3.11). Hydrochloric acid is used instead of sulfuric acid to prepare the stannous chloride solution as stated in Section 7.10. Stannous chloride is prepared per instructions from the instrument manufacturer. The lab is analyzing an LFM and LFMD to monitor precision (instead of LDR1R and LDR2R as stated in EPA Method 245.1, Section 3.5). The relative percent difference will determine if precision is acceptable.
8.2.3 EPA 245.6
An aqueous QCS is analyzed in addition to the SRM (ref. EPA Method 245.6, Section 3.10). Hydrochloric acid is used instead of sulfuric acid to prepare the stannous chloride solution as stated in Section 7.7. Stannous chloride is prepared per instructions from the instrument manufacturer. The "Stock Standard Solution" defined in Section 4.3 of SOP# MTA005R0 is equivalent to the "Mercury Stock Standard" required in EPA Method 245.6, Section 7.3. Calibration standards are prepared by diluting the stock standards solution and not by fortifying tissue samples as stated in Section 9. Potassium persulfate is not used in digesting tissue samples, as stated in Section 11.2. This deviation is based on historical data and percent recovery from analysis of a SRM.
8.2.4 EPA 245.5 An aqueous QCS is analyzed in addition to the SRM (ref. EPA Method 245.5, Section 3.10). Hydrochloric acid is used instead of sulfuric acid to prepare the stannous chloride solution as stated in Section 7.7. Stannous chloride is prepared per instructions from the instrument manufacturer. The "Stock Standard Solution" defined in Section 4.3 of SOP# MTA006R0 is equivalent to the "Mercury Stock Standard" required in EPA Method 245.5, Section 7.3. Sediment samples are not preserved with nitric acid as stated in EPA Method 245.5, Section 8.2. This is to comply with preparation of sediment samples for other metals using EPA Method 200.2, Section 8.2.
8.2.5 Standard Methods 5220 D-1997 Standard Methods 5220 D-1997 allows the use of alternative digestion vessels and reagents (see Standard Methods 5220 D-1997 2 (a) and 5220 C-1997 2 (a)). Hach Company's digestion vessels, reagents and reactor are used to digest samples. The sample digestates are transferred from the Hach reaction tubes to 1.0-cm spectrophotometer cells for colorimetric determination on the Shimadzu spectrophotometer. The modification has been validated through MDL and IDOC studies and ongoing digested QC standards.
8.2.6 ASTM D 6303-98 ASTM D 6303-98 Section 8.6.1.8 requires replicate measurements to agree to within 0.3%. This criterion would not allow a drop difference. The laboratory believes this to be a typographical error and has written the SOP to state “Replicates should agree to within 0.3 ml.”
8.2.7 EPA Method 445.0
The pigments are extracted from the phytoplankton using 10 ml 90% acetone solution (rather than 4 ml as specified in the method section 11.1.1) with the aid of a mechanical tissue grinder and allowed to steep (refrigerated) for a minimum of 2 hours, but not to exceed 24 hours, to ensure thorough extraction of the chlorophyll a.
Date: June 30, 2015 Author: D. Satterwhite
Revision Author: N. Good Revision No: 01 Page 108 of 221
8.2.8 EPA Method 625 Extracts of Base Neutrals and Acids are combined during extraction. The pH extraction sequence is reversed to better separate acid and neutral components. Alternate calibration curve other than those specified in the method is utilized. U.S. EPA Region 4 has provided written recommended approved Modification to EPA Method 625. Please see figure 8.1 EPA Memorandum Recommended Approved Modification to EPA Method 625 – November 1, 2006
8.2.9 SW-846 Methods 8081B and 8082A
GC/MS confirmation is applied for doubtful identification only and additional parameters have been added to the analyte list.
8.2.10 SW-846 Method 8141B
The expiration date for standards is one year and additional parameters have been added to the analyte list.
8.2.11 SW-846 Method 3550C Extraction of Fish Tissues for Organochlorine Pesticides and PCBs uses five grams of homogenized, ground tissue is mixed with sodium sulfate, then soxhlet extracted with methylene chloride. The extract is concentrated and cleaned-up by Gel Permeation Chromatography (GPC).The resulting extract is analyzed by capillary GC using electron capture detection (ECD).
8.3 Alternative or New Methods
When alternative procedures are employed or in cases where a test method is not mandated by regulation, the lab may choose to incorporate a new method or new instrumentation. Prior to sample analysis; however, the lab must meet the relevant start-up, calibration and ongoing validation and QC requirements. For regulated monitoring, an alternate test must be procured from EPA Region 4. An alternate test procedure is one that differs from a method previously approved by the U.S. EPA for determining the constituent of interest in National Pollutant Discharge Elimination System (NPDES) monitoring. The methods developed in-house and either validated or approved by Region 4 are outlined below:
8.3.1 ASTM D 6303-98
This method covers the determination of the formaldehyde monomer concentration in water and wastewater.
8.3.2 SM 3030C-2004 This method is no longer used for digesting Groundwater Section’s monitoring well samples per memoranda, “Aquifer Protection Section Policy for Metals Determinations Required by 15A NCAC 2L”, May 13, 2013, Jay Zimmerman, PG, Aquifer Protection Section Chief. A copy of this memorandum is included as Figure 8.2.
8.3.3 EPA 200.2 U.S. EPA Region 4 has provided written approval to the NC DWR Water Sciences Section for the use of EPA 200.2 for NPDES compliance monitoring. A copy of this document is included as Figure 8.3.
8.3.4 EPA 200.8 U.S. EPA Region 4 has provided written approval to the NC DWR Water Sciences Section for the use of EPA 200.8 for NPDES compliance monitoring. A copy of this document is included in Figure 8.4 and an electronic mail notice of clarification regarding this approval is included as Figure 8.5.
8.3.5 EPA 200.9 U.S. EPA Region 4 has provided written approval to the NC DWR Water Sciences Section for the use of EPA 200.9 on wastewater. A copy of this document is included as Figure 8.6.
Date: June 30, 2015 Author: D. Satterwhite
Revision Author: N. Good Revision No: 01 Page 109 of 221
8.3.6 Platinum-Cobalt Color (SM2120 B-2001) U.S. EPA Region 4 has provided written approval to the NC DWR Water Sciences Section for the use of a spectrophotometer operating at a wavelength of 460 nm in place of the visual comparison method for wastewater samples. A copy of the request for approval and EPA’s approval document are included as Figures 8.7 and 8.8.
8.4 Standard Operating Procedures The DWR Water Sciences Section Laboratories have developed Standard Operating Procedures (SOPs) for all analytical procedures and laboratory operations. The analytical SOPs are derived from the most recently promulgated/approved published method. SOPs are an integral part of a successful quality system and facilitate consistency in the reliability and integrity of an end result. A SOP should describe the activity or analytical method used in the laboratory in sufficient detail that a competent analyst unfamiliar with the method could conduct a reliable review or obtain acceptable results. Each analytical test method SOP contains the following (where applicable): method title and reference method, authorization signatures and approval dates, applicable matrices, scope and application, components to be analyzed, procedure summary, deviations from referenced method, definitions, interferences, safety and waste handling, apparatus and equipment, reagents and standards, sample collection, preservation, shipment and storage, calibration and standardization, sample preparation, sample procedure, calculations, quality control, data validation procedures, preventive maintenance, troubleshooting and corrective actions for out-of-control or unacceptable data, referenced documents, personnel qualifications, attachments (including tables, diagrams, flowcharts, benchsheets, etc.), and revision history. Non-analytical SOPs follow a similar format where possible.
General quality assurance SOPs are approved by the Environmental Program Supervisors and the QAO or a member of the SOP Committee. All SOPs are controlled in the laboratory: numbered sequentially, approved and signed by the Environmental Program Supervisor and QAO or SOP Committee member after review, dated with an effective date, placed in controlled manuals or placed in a read-only format on the network, and archived when updated. The procedures for document control shall also apply to SOPs that are being used, but are designated as ‘DRAFT’ versions. Procedures for preparation, review, revision and control of SOPs are incorporated by reference to current revision of SOP# QAG001, Guidance for Preparing Standard Operation Procedures (SOPs) SOPs are dynamic documents and may supersede some requirements in this document until the QAM annual update. SOPs must accurately reflect the operations of the Water Sciences Section Laboratories at any given time. They must be updated, verified and re-approved anytime procedures change. If no changes have taken place, SOPs must be reviewed at least annually. Any revisions must follow the prescribed approval process.
8.5 Requirements for Methods Start-up
Before the laboratory may institute a new method and begin reporting results, it must write a SOP, demonstrate satisfactory performance, and conduct a method detection limit study. There may be other requirements as stated within the published method or regulations (i.e., retention time window study, IDL, ATP approval from EPA R4, etc.). In some instances a situation may arise where a client requests that an unusual analyte be reported using a method where this analyte is not normally reported. If the analyte is being reported for regulatory purposes, the method must meet all procedures outlined within this QAM (i.e., SOP, MDL, and IDOC). If the sample is not for legal or regulatory purposes, the result may be reported as long as the following criteria are met: 1) the instrument is calibrated for the analyte to be reported using the criteria for the method and ICV/CV criteria are met, 2) the reporting limit is set at or above the first standard of the curve for the analyte and 3) the process is documented.
8.5.1 Initial Demonstration of Capability (IDOC) An initial demonstration of capability (IDOC) must be made prior to using any test method to report results, and at any time there is a significant change in instrument type, personnel or test method. Note: In laboratories with specialized "analytical units" (a well-defined group of analysts that together perform the method analysis), the group as a unit may meet the above criteria and this demonstration must be fully documented.
Date: June 30, 2015 Author: D. Satterwhite
Revision Author: N. Good Revision No: 01 Page 110 of 221
In general, this demonstration does not test the performance of the method in real world samples, but in the applicable and available clean matrix, e.g., water, solids or biological tissue. Actual sample spikes may also be used for this purpose, but only prior to reporting analytical results and only if the data was generated within the last twelve months. For analytes that do not lend themselves to spiking, e.g., TSS, the demonstration of capability may be performed using quality control samples or other predetermined regiment for demonstrating proficiency in a given test method. Specific guidance on demonstration of capability may be included in the methods or as required by the analytical unit. Demonstrations shall be documented through the use of the IDOC Certification Statement form in Figure 4.5 or similar format. Summary results should include analyst, date, method, matrix, instrument identification or serial number, preparatory method or clean-up procedures used, SOP numbers, any method specific criteria, analyte(s), spike concentration, units of measurement, replicate values, mean % recovery, mean value, population (n-1) standard deviation of recovery, % relative standard deviation of recovery, acceptance criteria, a reference for this criteria, laboratory reagent blank data and approval signatures. The following steps, which are adapted from the EPA test methods published in 40 CFR Part 136, Appendix A, shall be performed for IDOC certification.
a) A quality control sample shall be obtained from an outside source (i.e., standard/certified reference materials). If not available, the spiking standard may be prepared by the laboratory using stock standards that are prepared independently from those used in instrument calibration (e.g., matrix spike or laboratory control spike).
b) The analyte(s) shall be diluted in a volume of clean matrix sufficient to prepare at least four aliquots at a concentration (1) specified by a method; or if unspecified; (2) approximately 5 to 50 times the method-stated or laboratory-calculated practical quantitation limit (PQL); or (3) at approximately mid-range in the calibration curve.
c) At least 4 aliquots shall be prepared and analyzed according to the test method either concurrently or over a period of days. Each analyst performing the IDOC must perform each of the steps required to perform the method (except in specialized analytical units as described above). Non-routine procedures (e.g., specialized clean-up procedures) should also be demonstrated for each analyte and each method where applicable.
d) Using all of the results (generally the raw data results are used without rounding as when reporting), calculate the mean recovery in the appropriate reporting units and the standard deviations of the population sample (n-1), in the same units, for each parameter of interest. When it is not possible to determine mean and standard deviations, such as for presence, absence and logarithmic values, the laboratory will assess performance against criteria described in the Method SOP.
e) Compare the information obtained from (d) above to the corresponding mandated acceptance criteria for precision and accuracy in the test method (if applicable) or to laboratory-generated acceptance criteria (LCS or interim criteria) if there is no mandatory criteria established. If any one of the parameters do not meet the acceptance criteria, the performance is unacceptable for that parameter.
f) When one or more of the tested parameters fail at least one of the acceptance criteria, the analyst must either: • Locate and correct the source of the problem and repeat the test for all parameters of interest
beginning with c) above; or • Beginning with c) above, repeat the test for all parameters that failed to meet criteria. Repeated
failure; however, will confirm a general problem with the measurement system. If this occurs, locate and correct the source of the problem and repeat the test for all compounds of interest beginning with c) above.
g) At least one Laboratory Reagent Blank (LRB) shall be included with the IDOC study data. When data is gathered over a period of days, the associated LRB for each day’s analysis shall be included.
h) A Certification Statement shall be used to document the completion of each IDOC. A copy of the certification is archived in a method/instrument folder and a copy is archived in the analyst's training folder.
i) Methods on line prior to the effective date of this Section shall be updated to the procedures outlined above as new analysts perform their demonstration of capability. A copy of the new record will

Date: June 30, 2015 Author: D. Satterwhite
Revision Author: N. Good Revision No: 01 Page 111 of 221
replace that which was used for documentation in the past. At a minimum the precision and accuracy of four mid-level laboratory control samples must have been compared to the laboratory quality control acceptance limits.
8.6 Laboratory Reagent Water Laboratory reagent water is used for the preparation of reagents and standards (e.g., calibration standards, spike solutions, standard reference solutions), the dilution of samples, and blank analysis. Reagent water should have no detectable concentration of the compound or element to be analyzed at detection limit of the analytical method. Reagent water must be free of substances that interfere with analytical methods. Laboratory reagent water is prepared by passing tap water (City of Raleigh) through a system of filters to produce deionized water, which should consistently meet or exceed the American Society for Testing and Materials (ASTM) Type II Reagent Grade Water requirements. The deionized water system is comprised of a fibrous pre-filter, 1 carbon tank, and 3 resin tanks; the system is serviced on a monthly basis by an outside vendor. The parameter measured to verify the quality of the deionized water is conductivity. The conductivity is checked and recorded at least monthly and must be <1 megohm-cm at 25ºC; in addition, the deionized water system includes a conductivity indicator light which is checked and recorded daily. If the water's conductivity does not meet the specified requirement, or the indicator light is not illuminated, then the Support Unit must be notified immediately in order to initiate arrangements for service of the system and correction of the issue. Reagent water used in the Volatile Organics Unit is obtained from a non-chlorinated well and passed through an activated charcoal filter. Semivolatiles Organics Unit reagent water is from a non-chlorinated well. For certain analytical parameters, additional treatment of the deionized water is necessary and is accomplished by use of counter-top water purification systems. These systems consist of a series of four treatment cartridges and a fiber filter through which deionized water is fed, and re-circulate every 15 minutes. The systems measure and display the resistivity of the produced water, which is read and recorded on a daily basis. The acceptable range for produced water is 17.9 to 18.3 megohm-cm. Filters should be replaced as needed, or at a minimum prior to the expiration date printed on the cartridges.
8.7 Reagents and Standards The nature of the analytical laboratory demands that all material used in any of the procedures is of a known quality. All standards and reagents are prepared from reagent grade materials, primary standards. Standards may also be purchased from a reputable vendor at a known concentration. Standards and reagents are prepared using balances in which the calibration is verified daily or on date of use, Class A volumetric glassware or pipettors which have been calibrated in accordance with ISO 8655-6, and ASTM Type II reagent water. The wide variety of materials and reagents available makes it advisable to specify the name, brand, and grade of materials to be used in any determination. This information is contained in the method SOP. The material is dated and initialed upon receipt and upon opening. Safety Data Sheets (SDS) are kept in a central location known to all personnel. Anyone may review these for relevant information on the safe handling and emergency precautions of chemicals used and stored on-site. Each analytical unit keeps a notebook of pertinent SDS for all chemicals used in that unit for immediate access. In addition, laboratory SOPs describe precautionary measures (listed in the Safety and Waste Handling section and at the critical steps in the procedure) for particularly hazardous chemicals and known or suspect carcinogens.
8.7.1 Specifications There are many different grades of analytical reagents available to the analyst and most methods in use in the laboratory specify the grade of reagent that must be used in the procedure. If the quality of the reagent is not specified, it may be assumed that it is not significant in that procedure and; therefore, any grade reagent may be used. It is the responsibility of the analyst to check the procedure carefully for the suitability of the reagent grade. Records of manufacturer's certification and traceability statements are maintained in files or binders in each analytical unit. These records include date of receipt, lot number (when applicable) and expiration date (when applicable). Commercial materials purchased for preparation of calibration solutions, spike solution, etc., are usually accompanied with an assay certificate or the purity is noted on the label. If the assay purity is 96% or better, the weight provided by the vendor may be used without correction. If the assay purity is less than 96% a correction will be made to concentrations applied to solutions prepared from the stock
Date: June 30, 2015 Author: D. Satterwhite
Revision Author: N. Good Revision No: 01 Page 112 of 221
commercial material. Wherever possible, standards must be traceable to NBS/NIST standards. Records to that effect are maintained in the area in which the standard is to be used. Logbooks are utilized to document all information needed to maintain proper traceability of all standards and reagents prepared or purchased by the Laboratory. Logbooks document the date of preparation or opening of purchased material, expiration date, a list of standards/reagents or solutions used, lot numbers and the preparer's name. Calibrated instruments (e.g., balance or auto pipette) used in the preparation of standards must be identified in the logbook by serial or assigned ID number. Additional information, such as pH, may also be recorded. For purchased standards/reagents, the logbook is used to record the vendor, date opened, lot number and expiration date. Reagents or working standards that are prepared in-house shall be recorded in a logbook, dated, initialed by the analyst preparing the reagent or standard, and is assigned a unique designation for tracking purposes. All reagents and solutions in the laboratory areas shall be labeled to indicate; at a minimum, identity, titer or concentration, solvent (when applicable), preparation date, preparer’s initials and expiration date. If a vial or container is too small for all the information listed above, use an ID number to link the vial to the logbook entry containing this information. Deteriorated or outdated reagents and solutions shall not be used. Expiration dates for standards and reagents are usually specified in the methods or by the manufacturer and are adhered to unless degradation prior to this date is observed. Deterioration may be recognizable by changes in physical appearance such as a change in color or clarity, a change in volume, clumping or the formation of solids. Purchased materials are labeled with the date received and the date opened. Reagents are stored according to method or manufacturer's instructions and discarded per the appropriate SOP or the laboratory Chemical Hygiene Plan upon expiration. When expiration dates are not specified, the following guidelines are used:
• Stock Standards for calibration can be used for up to one year if properly preserved and stored. Standard solutions, such as ammonia and TKN standards, may need to be prepared more frequently. Mixed stock standards such as those used for metals analyzed by EPA Methods 200.7 and 200.8 are prepared every six months.
• Titrating solutions need to be either restandardized or a new bottle of vendor-certified standard opened each month. Titrating solutions used by the Water Sciences Section include 0.02N sulfuric acid (alkalinity), EDTA (hardness), 0.025N sodium thiosulfate (phenol), and 0.1N HCl (formaldehyde).
• Calibration or spiking standards are dilutions of stock standards used to calibrate an instrument. These standards are to be prepared daily unless specified otherwise in the method SOP.
• Acids can be used for up to three years; however, additional care must be taken with nitric and sulfuric acid, as exposure to sun and heat will accelerate decomposition.
• Organic solvents may be used for up to one year. • Dry, inorganic reagents and specially denatured alcohol formulations may be used for up to five
years.
All other solutions for which no expiration date is specified are used for no more than a year. They are valid for that length of time only if evaporation is minimized and proper preservation and storage techniques are used. If a bottle is opened often or is much less than half full more frequent replacement may be required. If a solution, such as a buffer, is expected to degrade rapidly after opening, it will be labeled with the date opened and an adjusted expiration date based on the date opened. Solutions are always poured off from the original bottle and unused portions are never returned to the original bottle. If degradation becomes apparent the solution is discarded immediately and the time period of valid use (holding time) for that solution is reduced. The stability of standard solutions can be demonstrated by comparing the analysis of freshly prepared solutions periodically with older preparations. The age of the standards must be limited using expiration dating so that no significant difference can be detected between older solutions and freshly prepared
Date: June 30, 2015 Author: D. Satterwhite
Revision Author: N. Good Revision No: 01 Page 113 of 221
solutions. The lab analyst may also refer to the decomposition data available on a chemical's Safety Data Sheet. Attempts should be made to control the quality of chemicals by purchasing in quantities fitting for the volume to be used. Smaller containers are appropriate for low-volume use and for products that have short shelf life while larger containers may be appropriate for high-volume use and products with indefinite shelf life.
8.7.2 Chemical Storage
All reagents and solvents are dated upon receipt. (See Section 8.7.1 for procedures) All manufacturer expiration dates are observed. If an expiration date is not specifically stated on the manufacturer's label, a holding time may be assigned and the expiration date written on the label. The date the reagent was opened is also written on the label. All reagents and solvents must be stored based on safety and storage considerations, as well as ease of access and proximity to primary location of use. Safety and storage guidelines for a chemical can be found in the Safety Data Sheet (SDS) and container labels. In addition, specific safety and storage information is included in all laboratory SOP’s. Chemical compatibility must be reviewed prior to storing chemicals in close proximity to each other. Proper storage of chemicals may include refrigeration, storage in darkness or in an amber glass container, protection from moisture (desiccator), specialized cabinets (flammables or acids), or ventilation. Proper storage of chemicals helps to prevent degradation of the chemical or solution and reduce potential hazards. Acids, except portions that are dispensed into small, labeled containers for immediate use, are stored in the original containers in the operational area in an acid cabinet or in the chemical supply room separate from alkaline bases and other unsuitable chemicals as stated in the SDS. Bases, except portions that are dispensed into small, labeled containers for immediate use, are stored in the original containers in the operational area or in the chemical supply room separate from acids. Solvents, except portions that are dispensed into small, labeled containers for immediate use, are stored in the original containers in a separate area of the chemical supply room designated for solvent storage or in vented, explosion-proof cabinets in the operational area.
Dry reagents and vendor-prepared solutions are stored in designated areas in each laboratory unit. The general storage areas in the lab units are maintained at room temperature; some cabinets below fume hoods are ventilated.
Organic extracts and stock solutions are stored in a freezer in the appropriate operational unit. Working solutions are refrigerated or frozen as necessary. Neat standards are stored at room temperature in the analytical area. Inorganic digestates, distillates and stock and working solutions may either be refrigerated or stored at room temperature. Instructions are detailed in the analytical SOP.
8.8 Waste Disposal Methods
The Water Sciences Section Chemistry Laboratory collects and disposes of wastes in a manner which ensures compliance with all federal, state, and local laws, regulation, and ordinances. Procedures are designed to minimize employee exposure to hazards associated with laboratory-generated wastes and to afford maximum environmental protection. Waste handling procedures are detailed in the laboratory SOPs and Chemical Hygiene Plan (CHP). A waste is a hazardous waste if it is listed in 40 CFR Part 261.30-261.33 or fails any of the criteria in 40 CFR Part 261 Subpart C. Personal knowledge of the waste's characteristics must also be considered. Hazardous wastes must be segregated, labeled appropriately, stored in a designated waste disposal area, and disposed of by a commercial waste disposal company. The Laboratory Safety Officer is responsible for maintaining the on-site system to prepare the wastes for disposal, scheduling
Date: June 30, 2015 Author: D. Satterwhite
Revision Author: N. Good Revision No: 01 Page 114 of 221
removal by the contractor, maintaining records, and assuring that the contractor is permitted by the NC Division of Waste Management. The selection of a waste disposal contractor must be predicated on their being permitted to transport hazardous wastes coupled with an absence of RCRA/DOT violations and a proven record of successful performance. Processes generating organic solvent wastes in the laboratory include semi-volatile, herbicide, and pesticide sample extractions and preparations, sample extractions for Wet Chemistry parameters (e.g., chlorophyll a, MBAS, Oil and Grease), and standard/reagent preparation. Laboratory solvent wastes are stored in labeled four-liter or 2.5 liter glass bottles. These containers are stored closed in fume hoods or flammable liquids cabinets in the appropriate analytical units. At the Central Laboratory, the contents of solvent waste bottles are periodically transferred into a 55-gallon drum labeled "Hazardous Waste” and “Flammable Liquid.” The solvent waste drum is located in the solvent storage room, (G102) and maintained by the laboratory in compliance with RCRA regulations for disposal of waste solvents. All records of waste disposal are maintained, and include solvent waste drum logs, waste disposal manifests, correspondence from disposal firms and any other information necessary to document the disposal of laboratory wastes. Organic solvents containing PCBs are segregated for separate disposal with the appropriate manifest. Solvent extracts are stored chronologically in appropriate refrigerators in the laboratory units. Upon expiration of required holding times, sample extracts are disposed of by pouring the extract into the appropriate solvent storage container and placing the empty extract container into the appropriate solid waste container. Other chemicals and hazardous wastes are collected and stored in the acid storage room (G106) or solvent storage room. Chemicals and waste are segregated by hazardous class and held until removed for disposal by a commercial waste disposal company. Only completed samples (including raw samples, extracts, and digestates) with authorized reports (checked from DWR LABWORKS™ LIMS) are disposed. The Central Laboratory has a two-stage sewage system. Laboratory drains are separated from the sanitary drains. The sink and fume hood drains in the laboratory rooms converge and the water waste passes through a fiberglass tank filled with 9,000 pounds of limestone (calcium carbonate). The limestone serves to neutralize acidic and basic water wastes prior to entering the City of Raleigh’s sanitary sewer system. The sanitary drains bypass this pretreatment phase and drain directly to the sanitary sewer system. Non-hazardous, aqueous samples are discarded into laboratory sink drains while flushing with tap water. Non-hazardous solid samples are disposed of in the city garbage. Biological wastes are placed in an autoclavable biohazard bag and sterilized prior to disposal in the city garbage.
8.9 Labware
8.9.1 Labware specifications All volumetric glassware must be Class A. Pyrex glass or equivalent should be used where possible. For safety purposes, thick-wall glassware should be used where available.
8.9.2 Labware cleaning The proper technique for cleaning labware depends upon the intended use of the labware being cleaned. The goal is to remove all substances from the labware that might interfere with the analysis. Generally, water-soluble substances can be removed with tap water followed with multiple rinses with laboratory-grade water. In some instances, detergent may be required. Detergent washing should be followed by a series of analyte-free water rinses. In many cases it is appropriate for labware to be cleaned by support staff using the automatic glassware washer that is located in the receiving room. Each unit brings their rinsed glassware to receiving in white polypropylene bins. To prevent cross contamination each unit’s glassware is washed separately. A heavy duty alkaline machine detergent is used in the glassware washer for cleaning the glassware. The glassware washing cycles (total time approximately 30 minutes) are as follows: prewash cycle, wash cycle, rinse cycle and finally pure rinse cycle using deionized water.
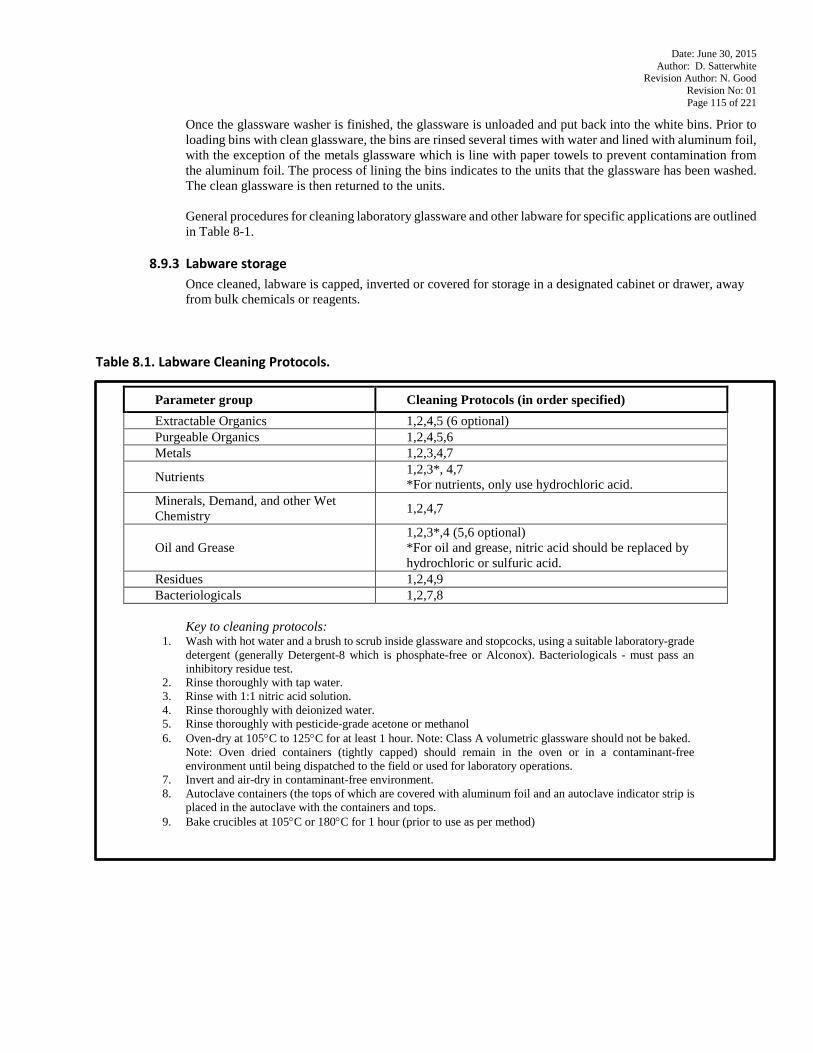
Date: June 30, 2015 Author: D. Satterwhite
Revision Author: N. Good Revision No: 01 Page 115 of 221
Once the glassware washer is finished, the glassware is unloaded and put back into the white bins. Prior to loading bins with clean glassware, the bins are rinsed several times with water and lined with aluminum foil, with the exception of the metals glassware which is line with paper towels to prevent contamination from the aluminum foil. The process of lining the bins indicates to the units that the glassware has been washed. The clean glassware is then returned to the units. General procedures for cleaning laboratory glassware and other labware for specific applications are outlined in Table 8-1.
8.9.3 Labware storage
Once cleaned, labware is capped, inverted or covered for storage in a designated cabinet or drawer, away from bulk chemicals or reagents.
Table 8.1. Labware Cleaning Protocols.
Parameter group Cleaning Protocols (in order specified) Extractable Organics 1,2,4,5 (6 optional) Purgeable Organics 1,2,4,5,6 Metals 1,2,3,4,7
Nutrients 1,2,3*, 4,7 *For nutrients, only use hydrochloric acid.
Minerals, Demand, and other Wet Chemistry 1,2,4,7
Oil and Grease 1,2,3*,4 (5,6 optional) *For oil and grease, nitric acid should be replaced by hydrochloric or sulfuric acid.
Residues 1,2,4,9 Bacteriologicals 1,2,7,8
Key to cleaning protocols:
1. Wash with hot water and a brush to scrub inside glassware and stopcocks, using a suitable laboratory-grade detergent (generally Detergent-8 which is phosphate-free or Alconox). Bacteriologicals - must pass an inhibitory residue test.
2. Rinse thoroughly with tap water. 3. Rinse with 1:1 nitric acid solution. 4. Rinse thoroughly with deionized water. 5. Rinse thoroughly with pesticide-grade acetone or methanol 6. Oven-dry at 105°C to 125°C for at least 1 hour. Note: Class A volumetric glassware should not be baked.
Note: Oven dried containers (tightly capped) should remain in the oven or in a contaminant-free environment until being dispatched to the field or used for laboratory operations.
7. Invert and air-dry in contaminant-free environment. 8. Autoclave containers (the tops of which are covered with aluminum foil and an autoclave indicator strip is
placed in the autoclave with the containers and tops. 9. Bake crucibles at 105°C or 180°C for 1 hour (prior to use as per method)
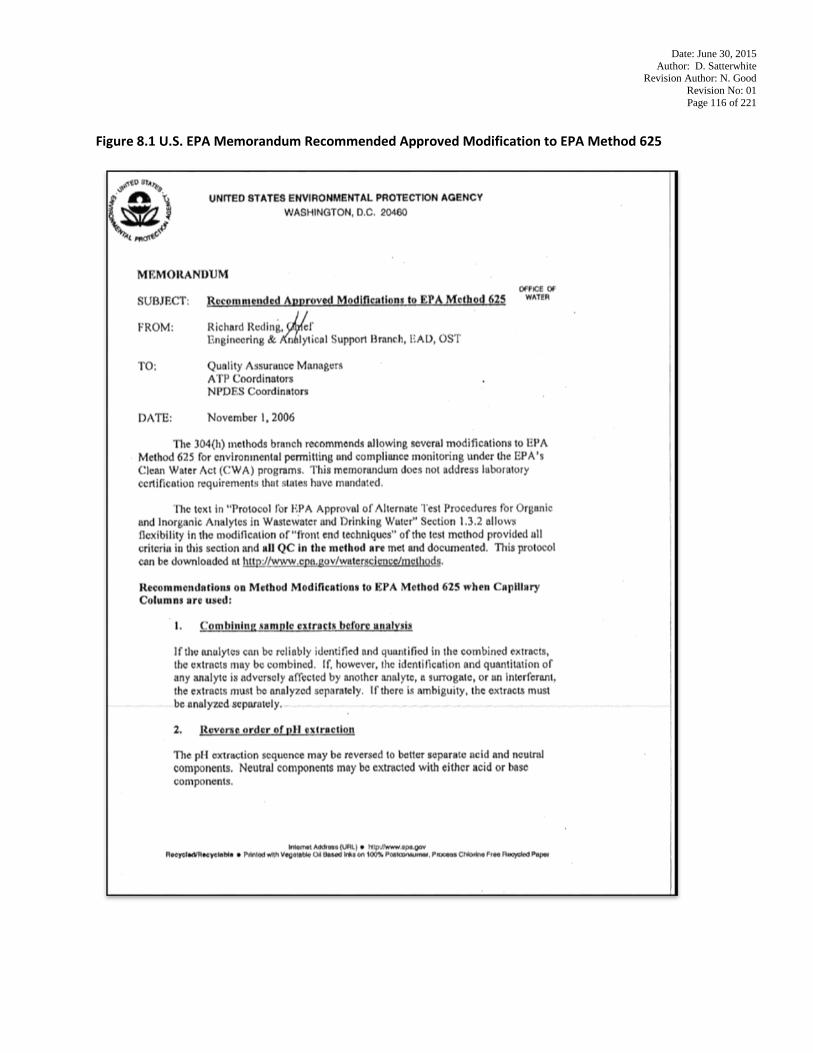
Date: June 30, 2015 Author: D. Satterwhite
Revision Author: N. Good Revision No: 01 Page 116 of 221
Figure 8.1 U.S. EPA Memorandum Recommended Approved Modification to EPA Method 625
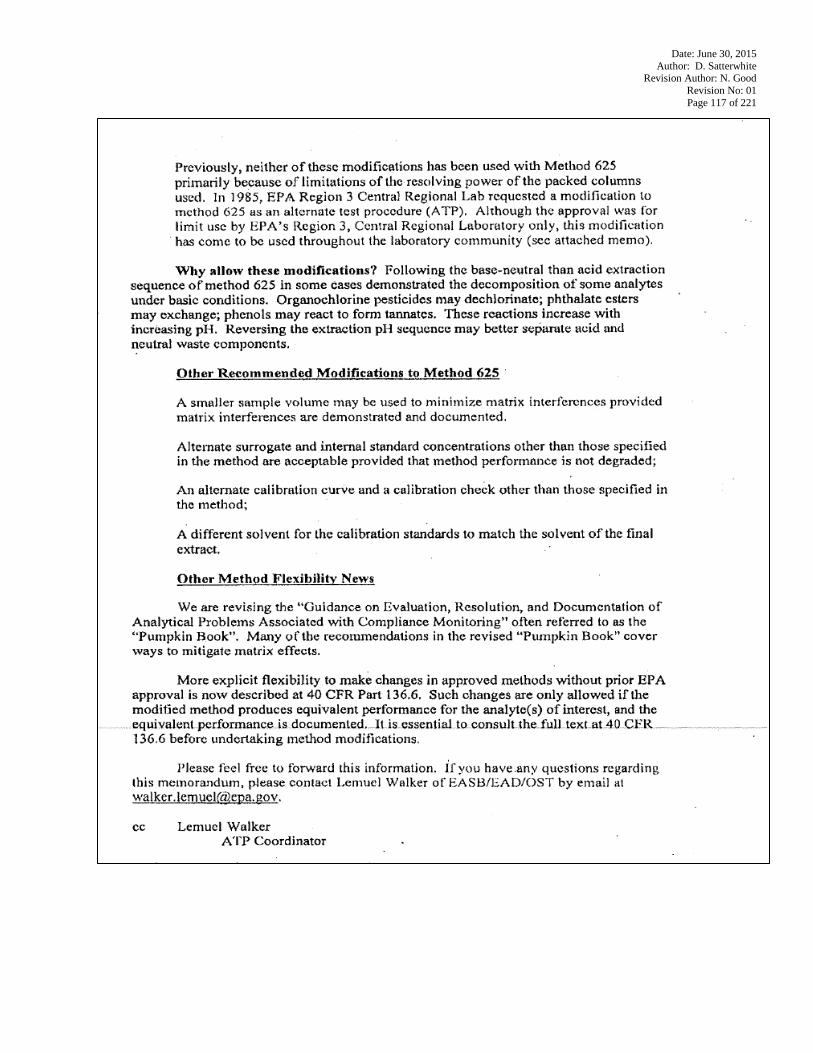
Date: June 30, 2015 Author: D. Satterwhite
Revision Author: N. Good Revision No: 01 Page 117 of 221
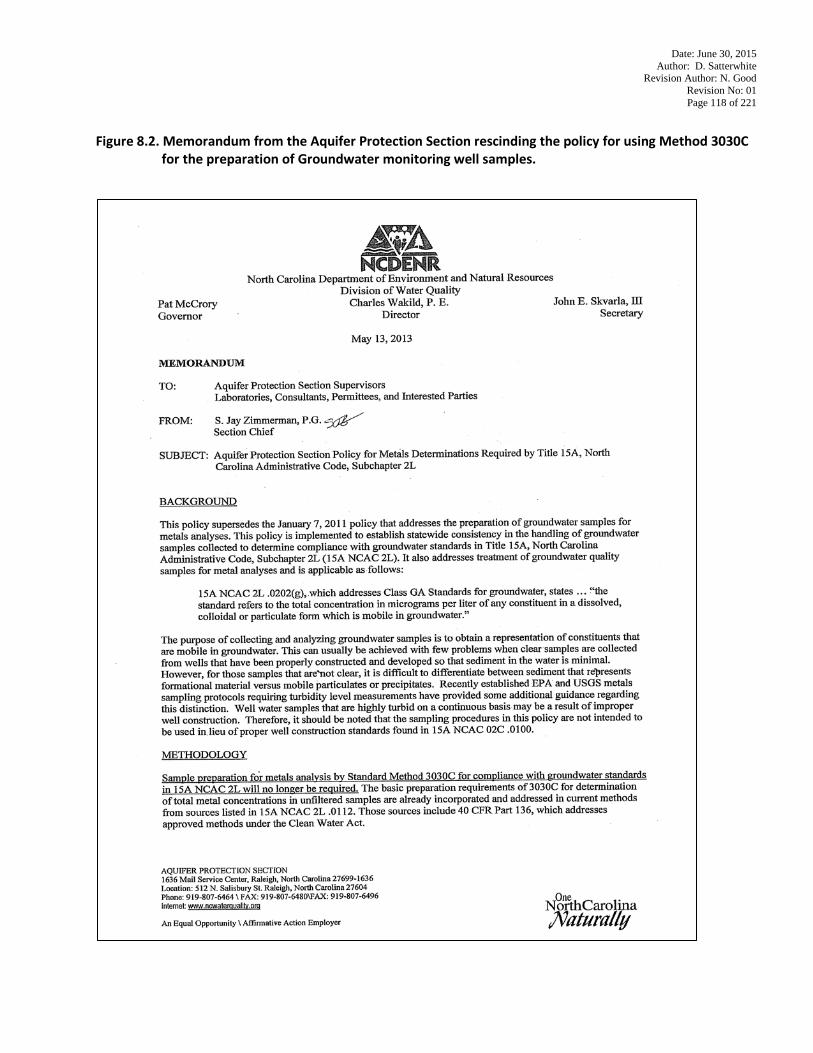
Date: June 30, 2015 Author: D. Satterwhite
Revision Author: N. Good Revision No: 01 Page 118 of 221
Figure 8.2. Memorandum from the Aquifer Protection Section rescinding the policy for using Method 3030C
for the preparation of Groundwater monitoring well samples.

Date: June 30, 2015 Author: D. Satterwhite
Revision Author: N. Good Revision No: 01 Page 119 of 221
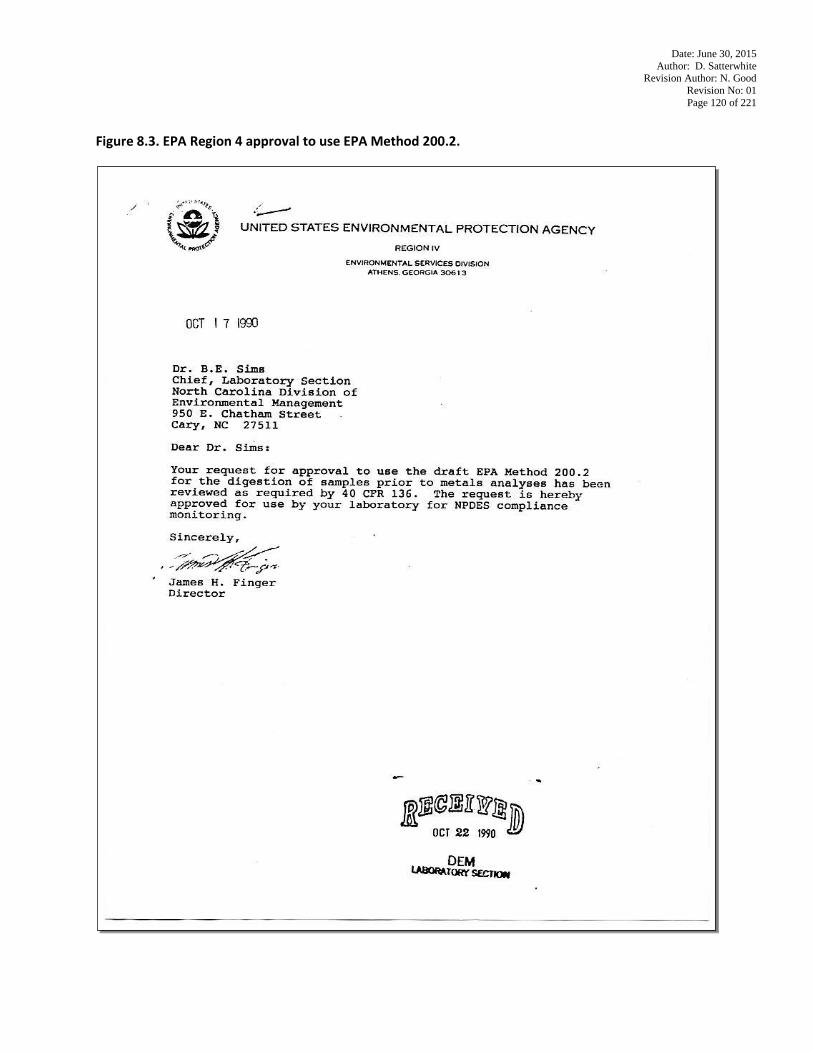
Date: June 30, 2015 Author: D. Satterwhite
Revision Author: N. Good Revision No: 01 Page 120 of 221
Figure 8.3. EPA Region 4 approval to use EPA Method 200.2.
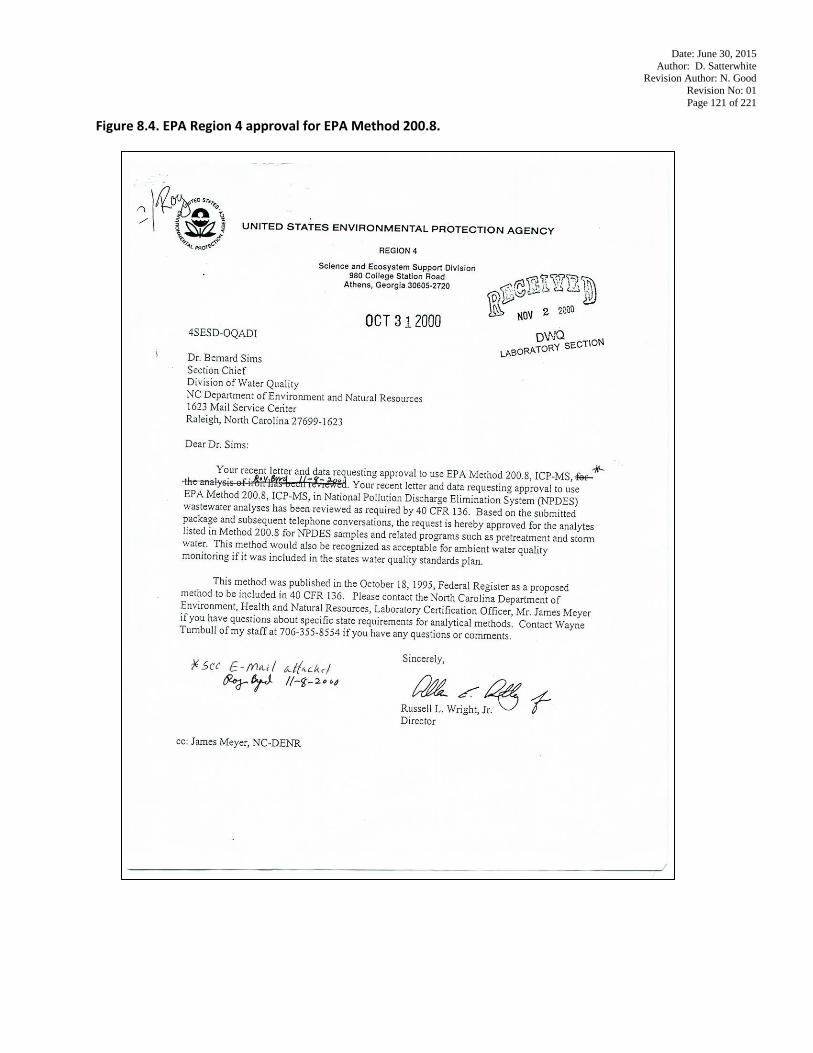
Date: June 30, 2015 Author: D. Satterwhite
Revision Author: N. Good Revision No: 01 Page 121 of 221
Figure 8.4. EPA Region 4 approval for EPA Method 200.8.
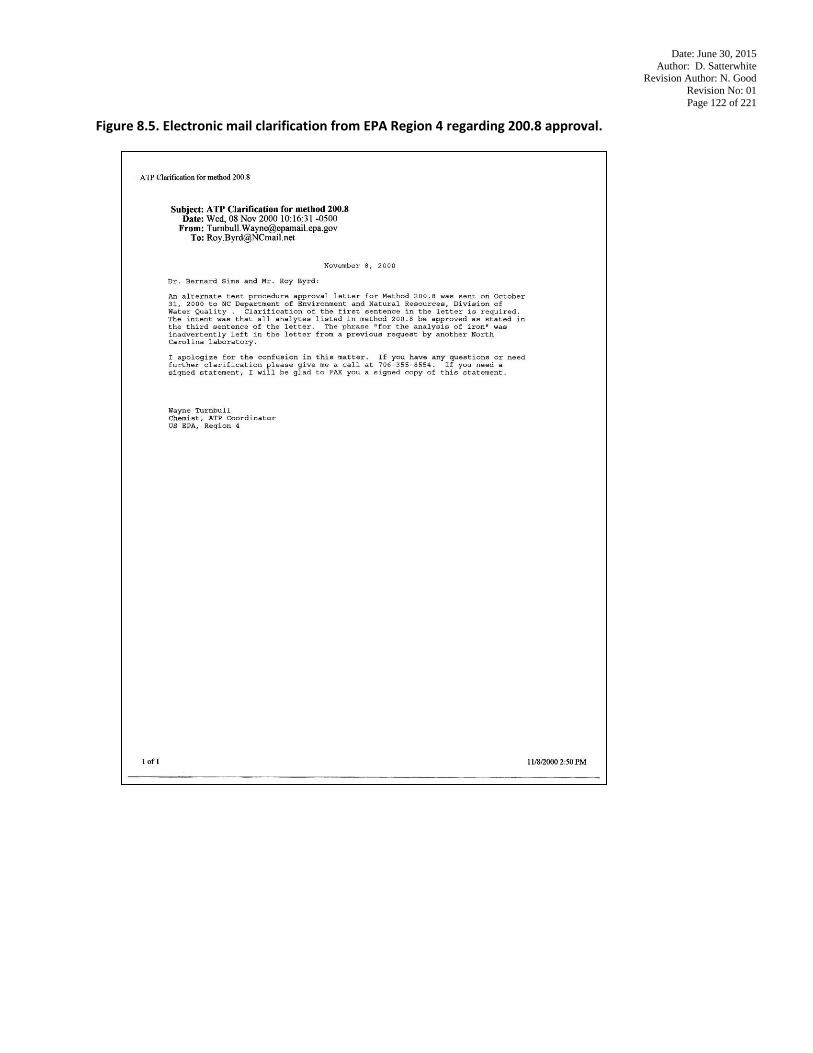
Date: June 30, 2015 Author: D. Satterwhite
Revision Author: N. Good Revision No: 01 Page 122 of 221
Figure 8.5. Electronic mail clarification from EPA Region 4 regarding 200.8 approval.
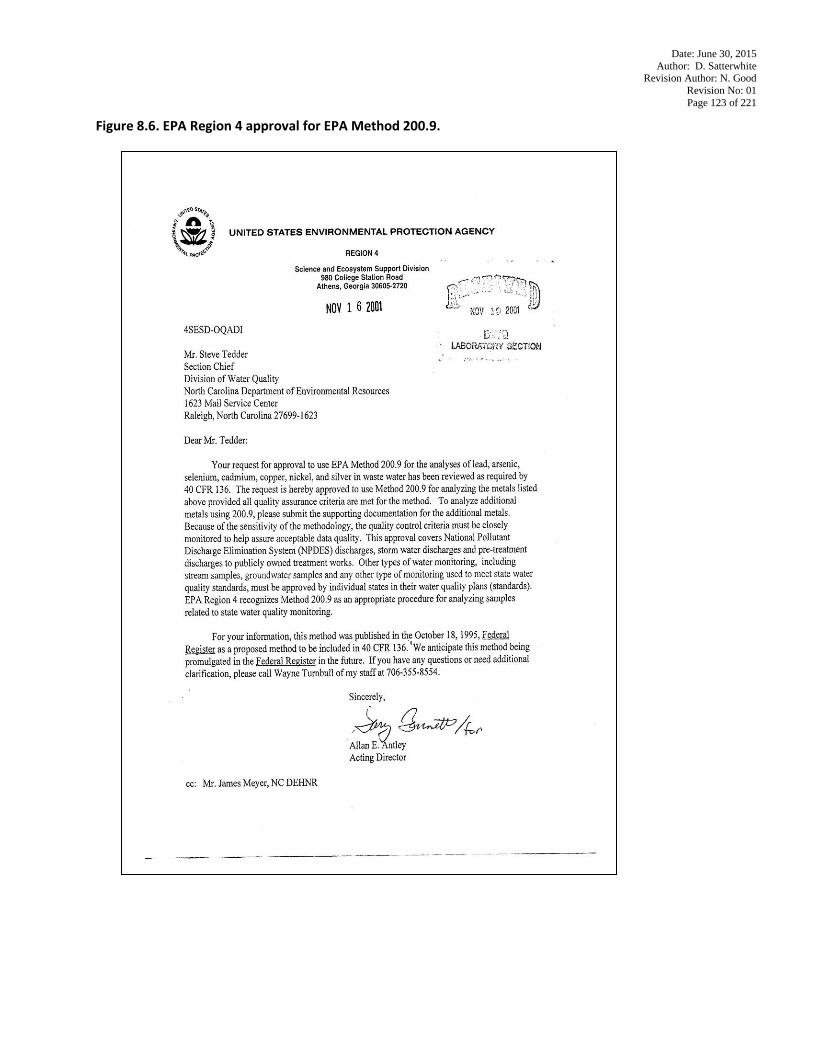
Date: June 30, 2015 Author: D. Satterwhite
Revision Author: N. Good Revision No: 01 Page 123 of 221
Figure 8.6. EPA Region 4 approval for EPA Method 200.9.
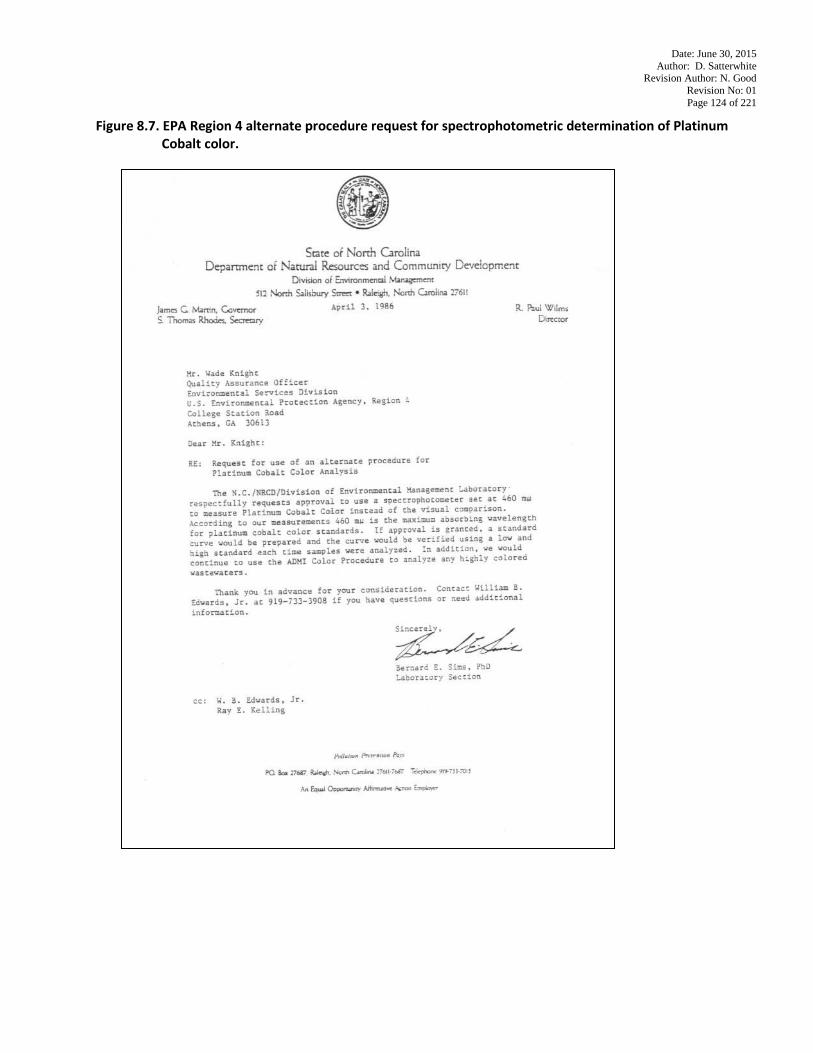
Date: June 30, 2015 Author: D. Satterwhite
Revision Author: N. Good Revision No: 01 Page 124 of 221
Figure 8.7. EPA Region 4 alternate procedure request for spectrophotometric determination of Platinum Cobalt color.
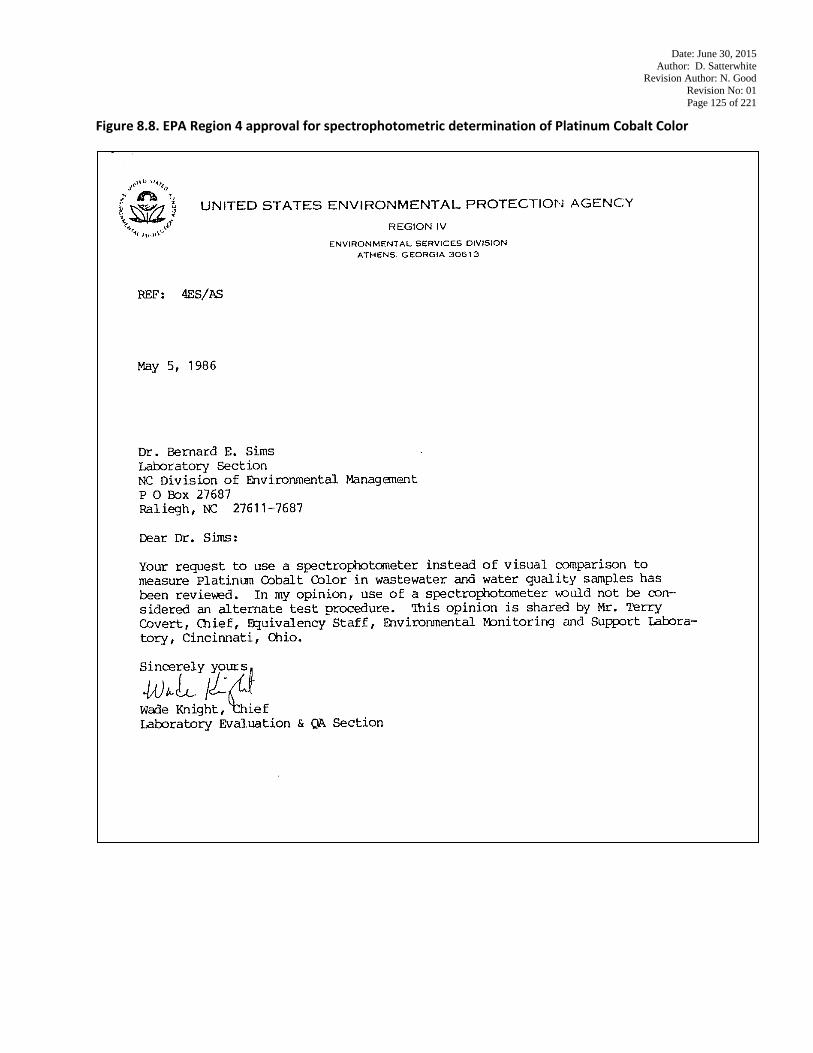
Date: June 30, 2015 Author: D. Satterwhite
Revision Author: N. Good Revision No: 01 Page 125 of 221
Figure 8.8. EPA Region 4 approval for spectrophotometric determination of Platinum Cobalt Color
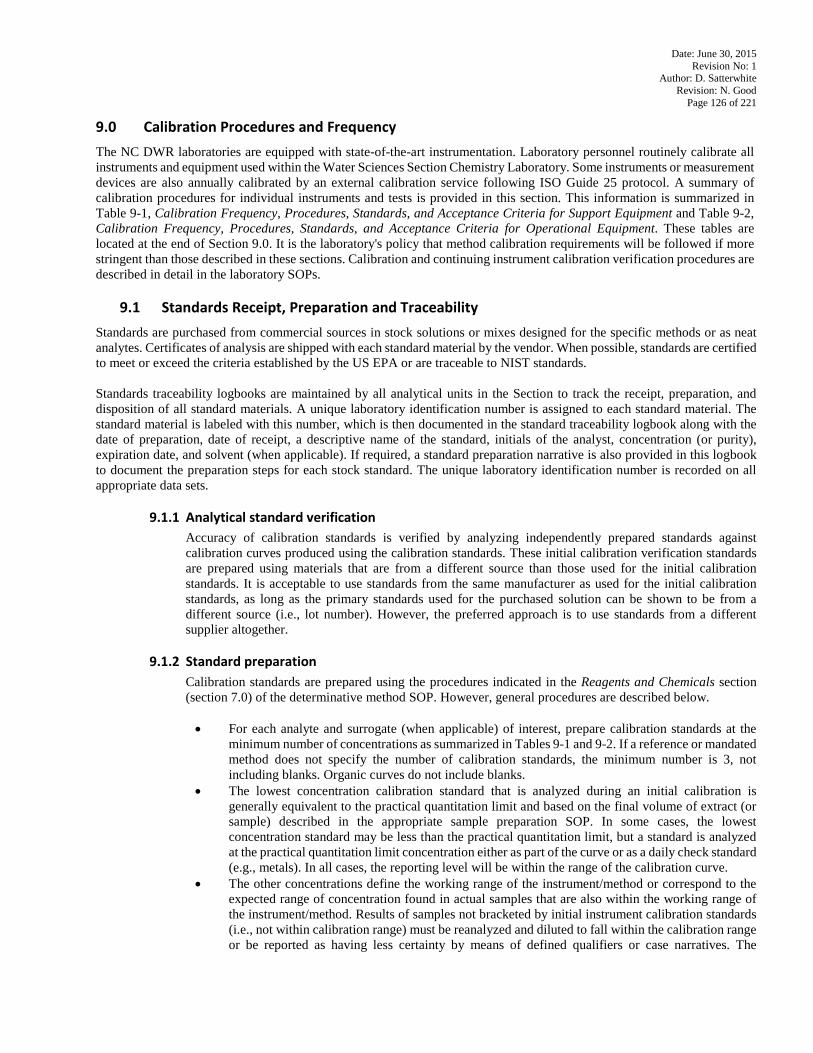
Date: June 30, 2015 Revision No: 1
Author: D. Satterwhite Revision: N. Good
Page 126 of 221
9.0 Calibration Procedures and Frequency The NC DWR laboratories are equipped with state-of-the-art instrumentation. Laboratory personnel routinely calibrate all instruments and equipment used within the Water Sciences Section Chemistry Laboratory. Some instruments or measurement devices are also annually calibrated by an external calibration service following ISO Guide 25 protocol. A summary of calibration procedures for individual instruments and tests is provided in this section. This information is summarized in Table 9-1, Calibration Frequency, Procedures, Standards, and Acceptance Criteria for Support Equipment and Table 9-2, Calibration Frequency, Procedures, Standards, and Acceptance Criteria for Operational Equipment. These tables are located at the end of Section 9.0. It is the laboratory's policy that method calibration requirements will be followed if more stringent than those described in these sections. Calibration and continuing instrument calibration verification procedures are described in detail in the laboratory SOPs.
9.1 Standards Receipt, Preparation and Traceability Standards are purchased from commercial sources in stock solutions or mixes designed for the specific methods or as neat analytes. Certificates of analysis are shipped with each standard material by the vendor. When possible, standards are certified to meet or exceed the criteria established by the US EPA or are traceable to NIST standards. Standards traceability logbooks are maintained by all analytical units in the Section to track the receipt, preparation, and disposition of all standard materials. A unique laboratory identification number is assigned to each standard material. The standard material is labeled with this number, which is then documented in the standard traceability logbook along with the date of preparation, date of receipt, a descriptive name of the standard, initials of the analyst, concentration (or purity), expiration date, and solvent (when applicable). If required, a standard preparation narrative is also provided in this logbook to document the preparation steps for each stock standard. The unique laboratory identification number is recorded on all appropriate data sets.
9.1.1 Analytical standard verification
Accuracy of calibration standards is verified by analyzing independently prepared standards against calibration curves produced using the calibration standards. These initial calibration verification standards are prepared using materials that are from a different source than those used for the initial calibration standards. It is acceptable to use standards from the same manufacturer as used for the initial calibration standards, as long as the primary standards used for the purchased solution can be shown to be from a different source (i.e., lot number). However, the preferred approach is to use standards from a different supplier altogether.
9.1.2 Standard preparation Calibration standards are prepared using the procedures indicated in the Reagents and Chemicals section (section 7.0) of the determinative method SOP. However, general procedures are described below. • For each analyte and surrogate (when applicable) of interest, prepare calibration standards at the
minimum number of concentrations as summarized in Tables 9-1 and 9-2. If a reference or mandated method does not specify the number of calibration standards, the minimum number is 3, not including blanks. Organic curves do not include blanks.
• The lowest concentration calibration standard that is analyzed during an initial calibration is generally equivalent to the practical quantitation limit and based on the final volume of extract (or sample) described in the appropriate sample preparation SOP. In some cases, the lowest concentration standard may be less than the practical quantitation limit, but a standard is analyzed at the practical quantitation limit concentration either as part of the curve or as a daily check standard (e.g., metals). In all cases, the reporting level will be within the range of the calibration curve.
• The other concentrations define the working range of the instrument/method or correspond to the expected range of concentration found in actual samples that are also within the working range of the instrument/method. Results of samples not bracketed by initial instrument calibration standards (i.e., not within calibration range) must be reanalyzed and diluted to fall within the calibration range or be reported as having less certainty by means of defined qualifiers or case narratives. The
Date: June 30, 2015 Revision No: 1
Author: D. Satterwhite Revision: N. Good
Page 127 of 221
exception is ICP methods or other methods where the referenced method does not specify two or more standards and the instrument’s linear dynamic range has been determined.
• Given the number of target compounds addressed by some of the organic methods, it may be necessary to prepare several sets of calibration standards, each set consisting of the appropriate number of solutions at different concentrations. The initial calibration will then involve the analysis of each of these sets of the appropriate number of standards.
• All initial calibrations are verified with a standard obtained from a second source and traceable to a national standard when available.
• Spiking solutions are prepared according to method specifications. If no specifications are provided, they are prepared at a concentration near the middle of the calibration range such that the spiking volume is not excessive. If the unspiked sample result is in the top 40% of the calibration range, the sample should be diluted and the spike prepared using the diluted sample. The volume of spike solution used must in all cases be ≤ 5% of the total spiked sample volume so as not to change the sample matrix significantly with spiking solution. It is preferable that the spike solution constitutes ≤1% of the total spiked sample volume so that the spiked sample can be considered a whole volume sample with no adjustment by calculation necessary. When the spike solution volume constitutes >1% of the total spiked sample volume, the sample concentration or spike concentration must be adjusted by calculation per method.
9.2 Laboratory Instrument Calibration
Calibration requirements are divided into two parts: requirements for analytical support equipment and requirements for operational instrument calibration.
9.2.1 Analytical Support Equipment Calibration
This section applies to all devices that may not be the actual test instrument, but are necessary to support laboratory operations. These include, but are not limited to, balances, ovens, refrigerators, freezers, incubators, water baths, autoclaves, temperature measuring devices, and volumetric dispensing devices if quantitative results are dependent on their accuracy (as in standard preparation and dispensing or dilution into a specified volume). Support equipment requiring calibration checks can be found in Table 9-1.
Table 9-1 also includes calibration check frequency and acceptance limits. Records of these calibration checks must be documented and include (when applicable):
• Instrument model number or specific lab identification. • Identification of standards used for the calibration check. • Performance tolerances. • Results of the calibration checks, the initials of the individual making the check, and the date
of the check. • A reference for the procedure used to perform the calibration check.
9.2.2 Operational Instrument Calibration
The frequency and acceptance criteria of instrument calibration and standardization are summarized in Table 9-2. Method specific SOPs expand on the following general discussion.
9.3 General Calibration Procedures
Instrument calibration and reagent standardization for the analyses performed in the lab are in accordance with the procedures specified in the referenced method (see Section 5).
9.3.1 Calibration Documentation
All calibration records including raw data, response factors, standard concentrations, curves, reduced data, and instrument settings or conditions are stored and archived as hard or electronic copy according to laboratory standard operating procedures. Current chromatograms, curves, and results transcribed onto
Date: June 30, 2015 Revision No: 1
Author: D. Satterwhite Revision: N. Good
Page 128 of 221
forms are kept at the analysts' work areas and periodically archived into a data storage area. Initial and continuing calibrations are sorted by date for ease of location. All standard assigned unique identification numbers appear on graphs, plots, chromatograms, or curves for traceability purposes.
9.3.2 Protocol for Determining the Test Method Range of Applicability During the development of new test methods and during initial demonstrations of capability (method validation studies), a cursory evaluation will be made of the dynamic range over which the method is applicable. That evaluation will take into consideration the type of calibration protocol (linear, nonlinear), the change in sensitivity over the tested calibration region, the detection limit of the method and the practical quantitation limit. Once a valid range of applicability is established, calibration standards will be used to bracket the range of quantitation. Results reported from data that were generated outside the determined range of applicability will be flagged as estimates (unless the sample was diluted prior to analysis in order to bring concentrations within the established test method range of applicability). During the establishment of the test method range of applicability, calibration standards will be prepared and analyzed over the estimated or published range of applicability. For inorganic parameters, if a linear calibration protocol is to be used, the correlation coefficient of the calibration values plotted against their respective responses (absorbance, concentration, etc.), must be greater than or equal to 0.995. For organic parameters, if a linear calibration protocol is to be used, either a) the correlation coefficient of the calibration values plotted against their respective response factors must be greater than or equal to 0.99, b) the relative response factors (response factor/calibration value) over the range of calibration must meet the relative standard deviation criterion of the applied method or c) other conditions for linearity specified in the applied, published method must be met. If the above conditions are not met, either the linear dynamic range must be decreased until those conditions are met or, in some cases, a non-linear calibration protocol may be used. Whenever a non-linear calibration protocol is utilized, a minimum of 5 calibration points must be defined for a second order fit; a third order fit requires a minimum of 6 calibration points. When using non-linear calibration procedures, loss in sensitivity (∆ response/∆ concentration) can occur at high concentrations. To ensure that signals are not quantified in regions of poor sensitivity, control standards must be analyzed at the highest point of the nonlinear calibration curve during method validation and must meet the reference method acceptance criteria for calibration. The lower limit of the test method range of applicability is normally established at the practical quantitation limit. The initial demonstration of capability includes establishment of the method detection limit and practical quantitation limit which is generally set at three to five times the calculated method detection limit.
9.3.3 General GC Calibration Procedures
General calibration procedures are described below for GC procedures using non-Mass Spectrometer (MS) detection. The calibration procedures for other techniques are described within the applicable method SOP.
9.3.3.1 External Standard Calibration Procedure
External standard calibration involves comparison of instrument responses from the sample to the responses from the target compounds in the calibration standards. Sample peak areas (or peak heights) are compared to peak areas (or peak heights) of the standards. The ratio of the detector response to the amount (mass) of analyte in the calibration standard is defined as the calibration factor (CF).
CF = Peak Area (or Height) of the Compound in the Standard Mass of the Compound Injected (in nanograms)
For multi-component analytes, see the appropriate method SOP for information on calibration.
Date: June 30, 2015 Revision No: 1
Author: D. Satterwhite Revision: N. Good
Page 129 of 221
The CF can also be calculated using the concentration of the standard rather than the mass in the denominator of the equation above. However, the use of concentrations in CFs will require changes to the equations that are used to calculate sample concentrations. Some analytical systems use software programs that perform these calculations automatically. These programs should be checked periodically by manual calculation comparison to test for accuracy.
9.3.3.2 Internal Standard Calibration Procedure Internal standard calibration involves the comparison of instrument responses from the target compounds in the sample to the responses of specific standards added to the sample or sample extract prior to injection. The ratio of the peak area (or peak height) of the target compound in the sample or sample extract to the peak area (or peak height) of the internal standard in the sample or sample extract is compared to a similar ratio derived for each calibration standard. The ratio is termed the response factor (RF), and may also be known as a relative response factor in other methods. In many cases, internal standards are recommended. These recommended internal standards are often brominated, fluorinated, or stable isotopically labeled analogs of specific target compounds, or are closely related compounds whose presence in environmental samples is highly unlikely. If internal standards are not recommended in the method, then the analyst needs to select one or more internal standards that are similar in analytical behavior to the compounds of interest, and not expected to be found in the sample otherwise. The use of specific internal standards is available in the method SOP. Whichever internal standards are employed, the analyst needs to demonstrate that the measurement of the internal standard is not affected by method analytes and surrogates or by matrix interferences. In general, internal standard calibration is not as useful for GC methods with non-MS detectors because of the inability to chromatographically resolve many internal standards from the target compounds. The use of MS detectors makes internal standard calibration practical because the masses of the internal standards can be resolved from those of the target compounds even when chromatographic resolution cannot be achieved. When preparing calibration standards for use with internal standard calibration, add the same amount of the internal standard solution to each calibration standard, such that the concentration of each internal standard is constant across all of the calibration standards, whereas the concentrations of the target analytes will vary. The internal standard solution will contain one or more internal standards and the concentration of the individual internal standards may differ within the spiking solution (e.g., not all internal standards need to be at the same concentration in this solution). The mass of each internal standard added to each sample extract immediately prior to injection into the instrument or to each sample prior to purging must be the same as the mass of the internal standard in each calibration standard. The volume of the solution spiked into sample extracts should be such that minimal dilution of the extract occurs (e.g., 10 µL of solution added to a 1 mL final extract results in only a negligible 1% change in the final extract volume which can be ignored in the calculations). An ideal internal standard concentration would yield a response factor of 1 for each analyte. However, this is not practical when dealing with more than a few target analytes. Therefore, as a general rule, the amount of internal standard should produce an instrument response (e.g., area counts) that is no more than 100 times that produced by the lowest concentration of the least responsive target analyte associated with the internal standard. This should result in a minimum response factor of approximately 0.01 for the least responsive target compound.
Date: June 30, 2015 Revision No: 1
Author: D. Satterwhite Revision: N. Good
Page 130 of 221
For each of the initial calibration standards, calculate the RF values for each target compound relative to one of the internal standards as follows:
𝑅𝑅𝑅𝑅 = 𝐴𝐴(𝑠𝑠) ∗ 𝐶𝐶(𝑖𝑖𝑠𝑠)𝐴𝐴(𝑖𝑖𝑠𝑠) ∗ 𝐶𝐶(𝑠𝑠)
Where: A(s) = Peak area (or height) of the analyte or surrogate A(is) = Peak area (or height) of the internal standard C(s) = Concentration of the analyte or surrogate, in µg/L C(is) = Concentration of the internal standard, in µg/L
Note that in the equation above, RF is unitless, i.e., the units from the two area terms and the two concentration terms cancel out. Therefore, units other than µg/L may be used for the concentrations of the analyte, surrogate, and internal standard, provided that both C(s) and C(is) are expressed in the same units. The mass of the analyte and internal standard may also be used in calculating the RF value.
9.3.3.3 Evaluating the Linearity of the Initial Calibration
To evaluate the linearity of the initial calibration, calculate the mean CF (external standard calibration) or RF (internal standard calibration), the standard deviation (SD) and the RSD as follows:
𝑀𝑀𝑀𝑀𝑀𝑀𝑀𝑀 𝐶𝐶𝑅𝑅 = 𝐶𝐶𝑅𝑅���� = ∑ (𝐶𝐶𝑅𝑅(𝑖𝑖))𝑛𝑛𝑖𝑖=1
𝑀𝑀
𝑀𝑀𝑀𝑀𝑀𝑀𝑀𝑀 𝑅𝑅𝑅𝑅 = 𝑅𝑅𝑅𝑅���� = ∑ (𝑅𝑅𝑅𝑅(𝑖𝑖))𝑛𝑛𝑖𝑖=1
𝑀𝑀
The variance and standard deviation of a data set measures the spread of the data about the mean of the data set.
The variance of a sample of size n represented by sP
2P is given by:
sP
2P = ∑(𝑋𝑋−𝑋𝑋�)2
𝑛𝑛−1
The standard deviation (SD) can be calculated by taking the square root of the variance.
𝑆𝑆𝑆𝑆 = �∑(𝑋𝑋 − 𝑋𝑋�)2
𝑀𝑀 − 1
If the RSD of the calibration or response factors is less than or equal to the acceptance limit stated in Table 9-2 over the calibration range, then linearity through the origin may be assumed, and the average calibration response factor may be used to determine sample concentrations.
𝑅𝑅𝑆𝑆𝑆𝑆 = �𝑆𝑆𝑆𝑆
𝑚𝑚𝑀𝑀𝑀𝑀𝑀𝑀 𝐶𝐶𝑅𝑅� 𝑥𝑥 100
𝑅𝑅𝑆𝑆𝑆𝑆 = �𝑆𝑆𝑆𝑆
𝑚𝑚𝑀𝑀𝑀𝑀𝑀𝑀 𝑅𝑅𝑅𝑅� 𝑥𝑥 100
Date: June 30, 2015 Revision No: 1
Author: D. Satterwhite Revision: N. Good
Page 131 of 221
9.3.4 Percent RSD Corrective Action Given the potentially large numbers of analytes that may be analyzed in some methods, it is likely that some analytes may exceed the acceptance limit for the RSD for a given calibration. In those instances, the following steps are recommended, but not required. The first step is generally to check the instrument operating conditions. This option will apply in those
instances where a linear instrument response is expected. It may involve some trade-offs to optimize performance across all target analytes. For instance, changes to the operating conditions necessary to achieve linearity for problem compounds may cause the RSD for other compounds to increase, but as long as all analytes meet the RSD limits for linearity, the calibration is acceptable.
If the RSD for any analyte is greater than the applicable acceptance criteria in Table 9-2, the analyst
may wish to review the results (area counts, calibration or response factors, and RSD) for those analytes to ensure that the problem is not associated with just one of the initial calibration standards. If the problem appears to be associated with a single standard, that one standard may be reanalyzed and the RSD recalculated. Replacing the standard may be necessary in some cases.
A third alternative is to narrow the calibration range by replacing one or more of the calibration standards with standards that cover a narrower range. If linearity can be achieved using a narrower calibration range, document the calibration linearity, and proceed with analyses. Note: Changes to the upper end of the calibration range will affect the need to dilute sample above the range, while changes to the lower end will affect the overall sensitivity of the method. Consider the regulatory limits or action levels associated with the target analytes when adjusting the lower end of the range.
NOTE: As noted in Section 9.3.2, the practical quantitation limit is equal to the concentration of the lowest standard analyzed during the initial calibration. Hence, narrowing the calibration range by changing the concentration of the lowest standard will change the practical quantitation limit. When the purpose of the analysis is to demonstrate compliance with a specific regulatory limit or action level, the laboratory must ensure that the practical quantitation limit is at least as low as the regulatory limit or action level. In those instances where the RSD for one or more analytes exceeds the acceptance criteria, the initial calibration may still be acceptable if the following conditions are met:
• The mean of the RSD values for all analytes in the calibration is less than or equal to the acceptance
criteria. The mean RSD is calculated by summing the RSD value for each analyte and dividing by the total number of analytes. If no analyte has an RSD above the acceptance criteria, then the mean RSD calculation need not be performed.
• The mean RSD criterion applies to all analytes in the standards, regardless of whether or not they
are of interest for a specific sample. In other words, if the target analyte is part of the calibration standard, its RSD value is included in the evaluation.
• The data user must be provided with either a summary of the initial calibration data or a specific
list of those compounds for which the RSD exceeded the acceptance criteria and the results of the mean RSD calculation.
NOTE: The analyst and the data user should be aware that the mean RSD approach described above will lead to greater uncertainty for those analytes for which the RSD is greater than the acceptance criteria. The analyst and the data user should review the associated quality control results carefully, with particular attention to the matrix spike and the laboratory control sample results, to determine if the calibration linearity poses a significant concern. If this approach is not acceptable for a particular application, then the analyst may need to employ another calibration approach or adjust the instrument operating conditions or the calibration range until the RSD meets the acceptance criteria.
Date: June 30, 2015 Revision No: 1
Author: D. Satterwhite Revision: N. Good
Page 132 of 221
• If all of the conditions above are met, then the average calibration or response factor may be used
to determine sample concentrations.
Use of other types of calibration (i.e., linear calibration using a least squares regression or non-linear calibration) may be described in manufacturer's manuals or within a published method. These procedures must be reviewed, incorporated into the appropriate SOP and approved by the QA/QC Coordinator prior to their use.
9.3.5 Retention Time Windows
Retention time windows are crucial to the identification of target compounds. Absolute retention times are used for compound identification in all GC methods that do not employ internal standard calibration. Retention time windows are established to compensate for minor shifts in absolute retention times as a result of sample loadings and normal chromatographic variability. The width of the retention time window should be carefully established to minimize the occurrence of both false positive and false negative results. Tight retention time windows may result in false negatives or may cause unnecessary reanalysis of sample when surrogates or spiked compounds are not identified or are erroneously identified. Overly wide retention time windows may result in false positive results that cannot be confirmed upon further analysis. The following subsection describes the approach used to establish retention time windows for GC methods. Note: The criteria listed in this section are provided for GC procedures using non-MS detection. Identification procedures are different for GC/MS and are detailed in the analytical SOPs.
Before establishing retention time windows, make sure that the chromatographic system is operating reliably and that the system conditions have been optimized for the target analytes and surrogates in the sample matrix to be analyzed. Make three injections of all single component standard mixtures and multi-component analytes (such as PCBs) over the course of a 72-hour period. Serial injections or injections over a period of less than 72 hours may result in retention time windows that are too tight. Record the retention time for each single component analyte and surrogate to three decimal places (e.g., 0.007). Calculate the mean and standard deviation of the three absolute retention times for each single component analyte and surrogate. For multi-component analytes, choose three to five major peaks (see the determinative methods for more details) and calculate the mean and standard deviation of those peaks. If the standard deviation of the retention times for a target compound is 0.000 (i.e., no difference between the absolute retention times), then the laboratory may either collect data from additional injections of standards or use a default standard deviation of 0.01 minutes. (Recording retention times to three decimal places rather than only two should minimize the instances in which the standard deviation is calculated as 0.000). The width of the retention time window for each analyte, surrogate, and major constituent in multi-component analytes is defined as +/- 3 times the standard deviation of the mean absolute retention time established during the 72 hour period. If the default standard deviation in the above example is employed, the width of the window will be 0.03 minutes. Establish the center of the retention time window for each analyte and surrogate by using the absolute retention time for each analyte and surrogate from the calibration verification standard at the beginning of the analytical shift. For samples run during the same shift as an initial calibration, use the retention time of the mid-point standard of the initial calibration. The laboratory must calculate absolute retention time windows for each analyte and surrogate on each chromatographic column and instrument. New retention time windows must be established when a new GC column is installed or more frequently as detailed in the analytical SOP.
Date: June 30, 2015 Revision No: 1
Author: D. Satterwhite Revision: N. Good
Page 133 of 221
If the instrument data system is not capable of employing compound-specific retention time windows, then the analyst may choose a window that minimizes false negatives and positives and apply it to all compounds. As noted above, other approaches may also be employed, but must be documented by the analyst. In general, you should not use a window greater than 0.2 to 0.3 minutes. If windows larger than this have been determined a cause should be looked for and the windows should be re-determined. The surrogates are added to each sample, blank, and QC sample and are also contained in each calibration standard. Although the surrogates may be diluted out of certain sample extracts, their retention times in the calibration standards may be useful in tracking retention time shifts. Whenever the observed retention time of a surrogate is outside of the established retention time window, the analyst is advised to determine the cause and correct the problem before continuing analyses.
9.3.6 Calibration Verification
The calibration relationship established during the initial calibration must be verified at periodic intervals as specified in Table 9-2. The process of calibration verification applies to both external standard and internal standard calibration techniques, as well as to linear and non-linear calibration models. NOTE: The process of calibration verification referred to here is fundamentally different from the approach called "calibration" in some methods. As described in those methods, the calibration factors or response factors calculated during calibration are used to update the calibration factors or response factors used for sample quantitation. This approach amounts to a daily single-point calibration, and is neither appropriate nor permitted in SW-846 chromatographic procedures for trace environmental analyses. As a general rule, the initial calibration must be verified at the beginning of each 12-hour analytical shift during which samples are analyzed. Some methods may specify more or less frequent verifications in which case the stricter frequency will be used. The 12-hour analytical shift begins with the injection of the calibration verification standard (or the MS tuning standard in MS methods). The shift ends after the completion of the analysis of the last sample or standard that can be injected within 12 hours of the beginning of the shift. Continuing instrument calibration verification must be repeated at the beginning and end of each analytical batch for non-GC/MS methods. The concentration of the calibration verification shall be varied within the established calibration range. If an internal standard is used, i.e., GC/MS, only one continuing calibration verification must be analyzed per analytical batch. If the response (or calculated concentration) for an analyte is within the acceptance limits of the response obtained during the initial calibration, then the initial calibration is considered still valid and the analyst may continue to use the CF or RF values from the initial calibration to quantitate sample results. If the response (or calculated concentration) for any analyte varies from the mean response obtained during the initial calibration by more than the acceptance criteria, then the initial calibration relationship may no longer be valid. If routine corrective action procedures fail to produce a second consecutive (immediate) calibration verification within acceptance criteria, then either the laboratory has to demonstrate performance after corrective action with two consecutive successful calibration verifications, or a new initial instrument calibration must be performed. However, sample data associated with an unacceptable calibration verification may be reported under the following special conditions:
1. When the acceptance criteria for the calibration verification are exceeded high, i.e., high bias, and there are associated samples that are detects, then those detects may be reported with qualification. Associated samples that are non-detects do not need qualifying. The detect samples affected by the unacceptable calibration verification may be reanalyzed after a new calibration curve has been established, evaluated and accepted.
2. When the acceptance criteria for the calibration verification are exceeded low, i.e., low bias, those sample results may be reported with qualification if the sample results exceed a maximum regulatory limit/decision level. Otherwise, the samples affected by the unacceptable verification shall be reanalyzed after a new calibration curve has been established, evaluated and accepted. Those multi component analyses with calibration verification exceeded low, i.e., low bias, may result in qualification of non-detect samples as well as detect samples with the appropriate data qualifier spelled out in analytical SOP or validation document.
Date: June 30, 2015 Revision No: 1
Author: D. Satterwhite Revision: N. Good
Page 134 of 221
In keeping with the approach described for initial calibration, if the average of the responses for all analytes are within that required in Table 9-2, then the calibration has been verified. However, the conditions in Section 9.3.6 also apply. The average must include all analytes in the calibration, regardless of whether they are target analytes for a specific project. The effect of using the average of the response for all analytes for calibration verification will be similar to that for the initial calibration - namely, that the quantitative results for those analytes where the difference is greater than the limit will include a greater uncertainty. If the calibration does not meet the limit (either on the basis of each compound or the average across all compounds), check the instrument operating conditions, and if necessary, restore them to the original settings, and inject another aliquot of the calibration verification standard. If the response for the analyte is still not within the acceptance criteria, then a new initial calibration must be prepared unless there is an exception allowed in the analytical method or SOP.
9.3.7 Verification of Linear Calibrations
Calibration verification for linear calibrations involves the calculation of the percent drift or the percent difference of the instrument response between the initial calibration and each subsequent analysis of the verification standard. Use the equations below to calculate % Drift or % Difference, depending on the procedure specified in the method SOP.
% Drift = Calculated concentration - Theoretical concentration x 100 Theoretical concentration Where the calculated concentration is determined using the mean calibration factor or response factor from the initial calibration and the theoretical concentration is the concentration at which the standard was prepared, use % 𝑆𝑆𝑖𝑖𝐷𝐷𝐷𝐷𝑀𝑀𝐷𝐷𝑀𝑀𝑀𝑀𝐷𝐷𝑀𝑀 = 𝐶𝐶𝐶𝐶(𝑉𝑉)−𝑀𝑀𝑀𝑀𝑀𝑀𝑛𝑛𝐶𝐶𝐶𝐶
𝐶𝐶𝐶𝐶 ∗ 100 or % 𝑆𝑆𝑖𝑖𝐷𝐷𝐷𝐷𝑀𝑀𝐷𝐷𝑀𝑀𝑀𝑀𝐷𝐷𝑀𝑀 = 𝑅𝑅𝐶𝐶(𝑉𝑉)−𝑀𝑀𝑀𝑀𝑀𝑀𝑛𝑛𝑅𝑅𝐶𝐶
𝑅𝑅𝐶𝐶 ∗ 100
Where CF(v) and RF(v) are the calibration factor and the response factor (whichever applies) from the analysis of the verification standard, and CF and RF are the mean calibration factor and mean response factor from the initial calibration. Except where superseded in certain determinative methods, the %Difference or %Drift calculated for the calibration verification standard must be within +/- 15% for each analyte, or averaged across all analytes, before any sample analyses may take place.
9.3.8 Verification of Non-Linear Calibrations
Calibration verification of a non-linear calibration is performed using the percent drift calculation described in Section 9.3.7. Calibration verification must be acceptable before any sample analyses may take place. It may also be appropriate to employ two standards at different concentrations to verify the calibration. This is outlined in the method SOP when used. Regardless of whether a linear or non-linear calibration model is used, and the percent drift difference criterion is not met, then no sample analyses may take place until the calibration has been verified or a new initial calibration is performed that meets the specifications in the method SOP. If the calibration cannot be verified after the analysis of a single verification standard, adjust the instrument operating conditions or perform instrument maintenance, and then analyze another aliquot of the verification standard. If the calibration cannot be verified with the second standard, and a new initial calibration is performed. All target analytes and surrogates, including those reported as non-detects, must be included in a periodic calibration to confirm retention time and demonstrate that calibration verification criteria are being met. The frequency of this calibration is noted in Table 9-2.
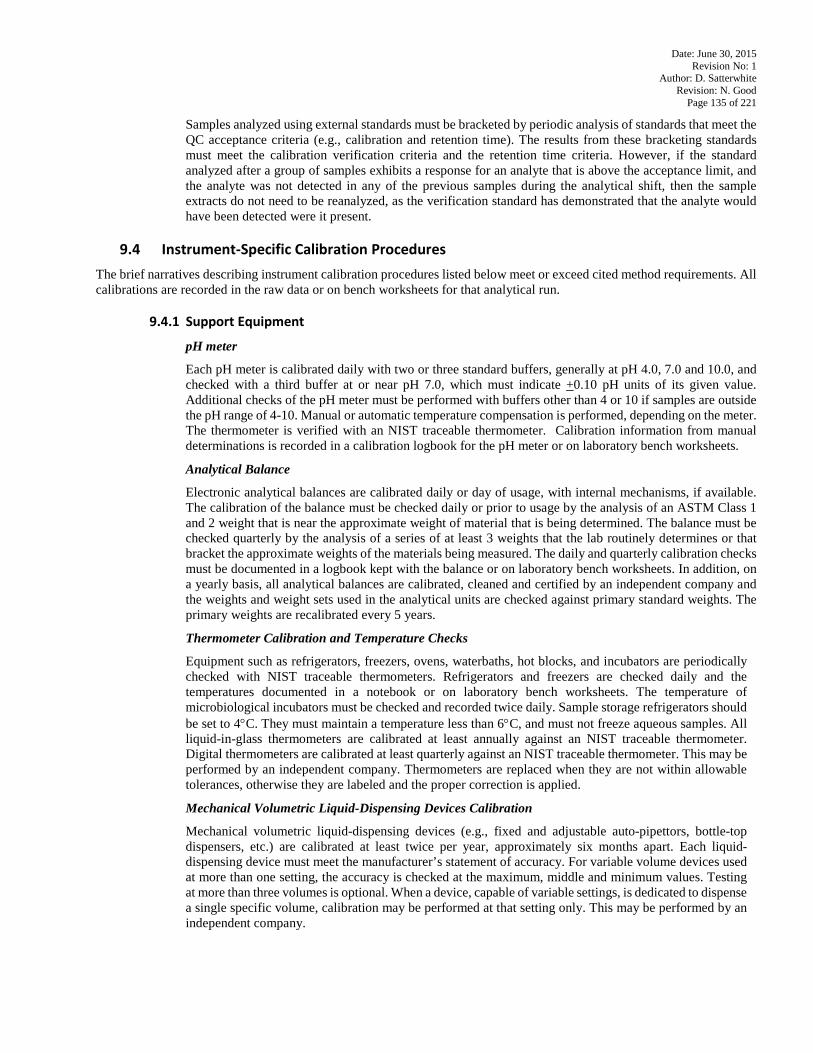
Date: June 30, 2015 Revision No: 1
Author: D. Satterwhite Revision: N. Good
Page 135 of 221
Samples analyzed using external standards must be bracketed by periodic analysis of standards that meet the QC acceptance criteria (e.g., calibration and retention time). The results from these bracketing standards must meet the calibration verification criteria and the retention time criteria. However, if the standard analyzed after a group of samples exhibits a response for an analyte that is above the acceptance limit, and the analyte was not detected in any of the previous samples during the analytical shift, then the sample extracts do not need to be reanalyzed, as the verification standard has demonstrated that the analyte would have been detected were it present.
9.4 Instrument-Specific Calibration Procedures
The brief narratives describing instrument calibration procedures listed below meet or exceed cited method requirements. All calibrations are recorded in the raw data or on bench worksheets for that analytical run.
9.4.1 Support Equipment
pH meter
Each pH meter is calibrated daily with two or three standard buffers, generally at pH 4.0, 7.0 and 10.0, and checked with a third buffer at or near pH 7.0, which must indicate +0.10 pH units of its given value. Additional checks of the pH meter must be performed with buffers other than 4 or 10 if samples are outside the pH range of 4-10. Manual or automatic temperature compensation is performed, depending on the meter. The thermometer is verified with an NIST traceable thermometer. Calibration information from manual determinations is recorded in a calibration logbook for the pH meter or on laboratory bench worksheets.
Analytical Balance
Electronic analytical balances are calibrated daily or day of usage, with internal mechanisms, if available. The calibration of the balance must be checked daily or prior to usage by the analysis of an ASTM Class 1 and 2 weight that is near the approximate weight of material that is being determined. The balance must be checked quarterly by the analysis of a series of at least 3 weights that the lab routinely determines or that bracket the approximate weights of the materials being measured. The daily and quarterly calibration checks must be documented in a logbook kept with the balance or on laboratory bench worksheets. In addition, on a yearly basis, all analytical balances are calibrated, cleaned and certified by an independent company and the weights and weight sets used in the analytical units are checked against primary standard weights. The primary weights are recalibrated every 5 years.
Thermometer Calibration and Temperature Checks
Equipment such as refrigerators, freezers, ovens, waterbaths, hot blocks, and incubators are periodically checked with NIST traceable thermometers. Refrigerators and freezers are checked daily and the temperatures documented in a notebook or on laboratory bench worksheets. The temperature of microbiological incubators must be checked and recorded twice daily. Sample storage refrigerators should be set to 4°C. They must maintain a temperature less than 6°C, and must not freeze aqueous samples. All liquid-in-glass thermometers are calibrated at least annually against an NIST traceable thermometer. Digital thermometers are calibrated at least quarterly against an NIST traceable thermometer. This may be performed by an independent company. Thermometers are replaced when they are not within allowable tolerances, otherwise they are labeled and the proper correction is applied.
Mechanical Volumetric Liquid-Dispensing Devices Calibration
Mechanical volumetric liquid-dispensing devices (e.g., fixed and adjustable auto-pipettors, bottle-top dispensers, etc.) are calibrated at least twice per year, approximately six months apart. Each liquid-dispensing device must meet the manufacturer’s statement of accuracy. For variable volume devices used at more than one setting, the accuracy is checked at the maximum, middle and minimum values. Testing at more than three volumes is optional. When a device, capable of variable settings, is dedicated to dispense a single specific volume, calibration may be performed at that setting only. This may be performed by an independent company.
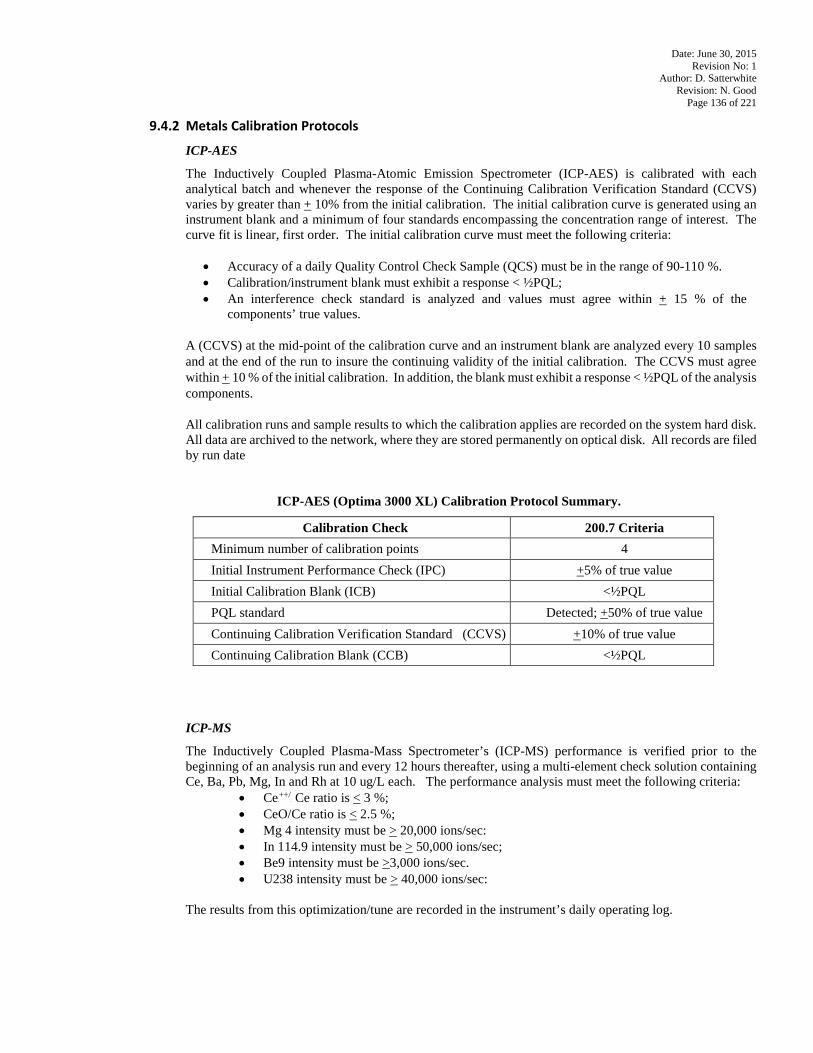
Date: June 30, 2015 Revision No: 1
Author: D. Satterwhite Revision: N. Good
Page 136 of 221
9.4.2 Metals Calibration Protocols
ICP-AES
The Inductively Coupled Plasma-Atomic Emission Spectrometer (ICP-AES) is calibrated with each analytical batch and whenever the response of the Continuing Calibration Verification Standard (CCVS) varies by greater than + 10% from the initial calibration. The initial calibration curve is generated using an instrument blank and a minimum of four standards encompassing the concentration range of interest. The curve fit is linear, first order. The initial calibration curve must meet the following criteria:
• Accuracy of a daily Quality Control Check Sample (QCS) must be in the range of 90-110 %. • Calibration/instrument blank must exhibit a response < ½PQL; • An interference check standard is analyzed and values must agree within + 15 % of the
components’ true values.
A (CCVS) at the mid-point of the calibration curve and an instrument blank are analyzed every 10 samples and at the end of the run to insure the continuing validity of the initial calibration. The CCVS must agree within + 10 % of the initial calibration. In addition, the blank must exhibit a response < ½PQL of the analysis components.
All calibration runs and sample results to which the calibration applies are recorded on the system hard disk. All data are archived to the network, where they are stored permanently on optical disk. All records are filed by run date
ICP-AES (Optima 3000 XL) Calibration Protocol Summary.
Calibration Check 200.7 Criteria Minimum number of calibration points 4 Initial Instrument Performance Check (IPC) +5% of true value Initial Calibration Blank (ICB) <½PQL PQL standard Detected; +50% of true value Continuing Calibration Verification Standard (CCVS) +10% of true value Continuing Calibration Blank (CCB) <½PQL
ICP-MS
The Inductively Coupled Plasma-Mass Spectrometer’s (ICP-MS) performance is verified prior to the beginning of an analysis run and every 12 hours thereafter, using a multi-element check solution containing Ce, Ba, Pb, Mg, In and Rh at 10 ug/L each. The performance analysis must meet the following criteria:
• CeP
++/P Ce ratio is < 3 %;
• CeO/Ce ratio is < 2.5 %; • Mg 4 intensity must be > 20,000 ions/sec: • In 114.9 intensity must be > 50,000 ions/sec; • Be9 intensity must be >3,000 ions/sec. • U238 intensity must be > 40,000 ions/sec:
The results from this optimization/tune are recorded in the instrument’s daily operating log.
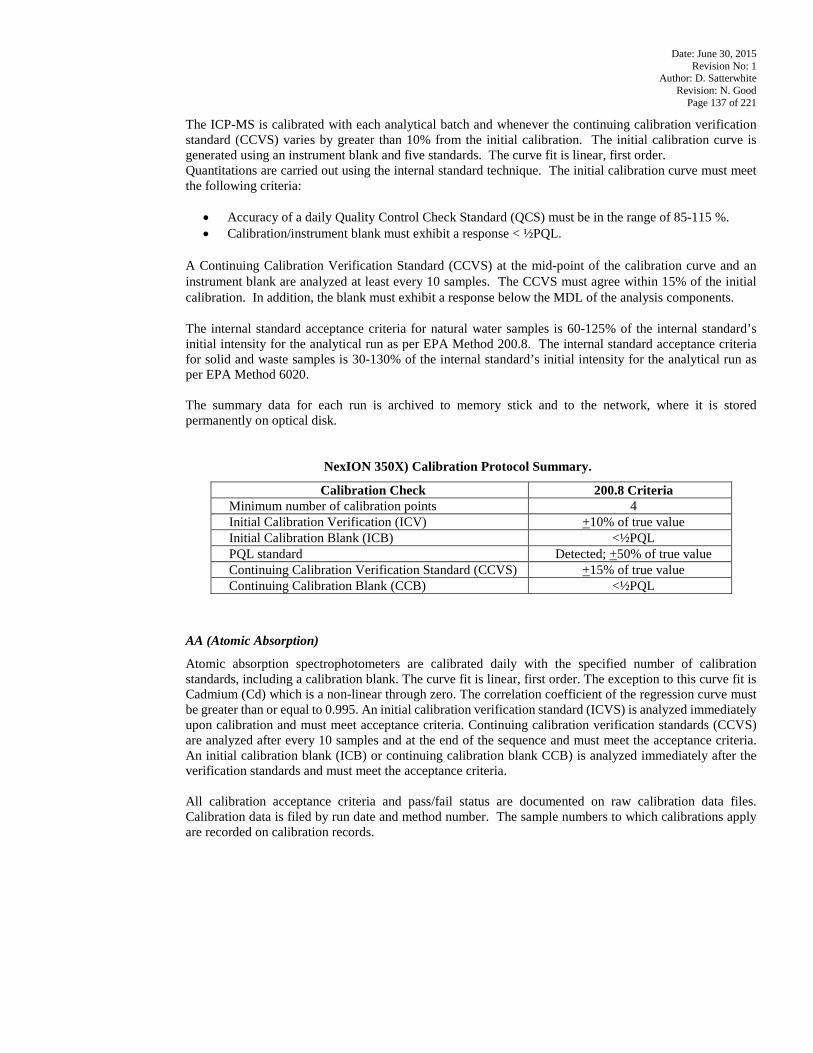
Date: June 30, 2015 Revision No: 1
Author: D. Satterwhite Revision: N. Good
Page 137 of 221
The ICP-MS is calibrated with each analytical batch and whenever the continuing calibration verification standard (CCVS) varies by greater than 10% from the initial calibration. The initial calibration curve is generated using an instrument blank and five standards. The curve fit is linear, first order. Quantitations are carried out using the internal standard technique. The initial calibration curve must meet the following criteria:
• Accuracy of a daily Quality Control Check Standard (QCS) must be in the range of 85-115 %. • Calibration/instrument blank must exhibit a response < ½PQL.
A Continuing Calibration Verification Standard (CCVS) at the mid-point of the calibration curve and an instrument blank are analyzed at least every 10 samples. The CCVS must agree within 15% of the initial calibration. In addition, the blank must exhibit a response below the MDL of the analysis components. The internal standard acceptance criteria for natural water samples is 60-125% of the internal standard’s initial intensity for the analytical run as per EPA Method 200.8. The internal standard acceptance criteria for solid and waste samples is 30-130% of the internal standard’s initial intensity for the analytical run as per EPA Method 6020. The summary data for each run is archived to memory stick and to the network, where it is stored permanently on optical disk.
NexION 350X) Calibration Protocol Summary.
Calibration Check 200.8 Criteria Minimum number of calibration points 4 Initial Calibration Verification (ICV) +10% of true value Initial Calibration Blank (ICB) <½PQL PQL standard Detected; +50% of true value Continuing Calibration Verification Standard (CCVS) +15% of true value Continuing Calibration Blank (CCB) <½PQL
AA (Atomic Absorption)
Atomic absorption spectrophotometers are calibrated daily with the specified number of calibration standards, including a calibration blank. The curve fit is linear, first order. The exception to this curve fit is Cadmium (Cd) which is a non-linear through zero. The correlation coefficient of the regression curve must be greater than or equal to 0.995. An initial calibration verification standard (ICVS) is analyzed immediately upon calibration and must meet acceptance criteria. Continuing calibration verification standards (CCVS) are analyzed after every 10 samples and at the end of the sequence and must meet the acceptance criteria. An initial calibration blank (ICB) or continuing calibration blank CCB) is analyzed immediately after the verification standards and must meet the acceptance criteria. All calibration acceptance criteria and pass/fail status are documented on raw calibration data files. Calibration data is filed by run date and method number. The sample numbers to which calibrations apply are recorded on calibration records.
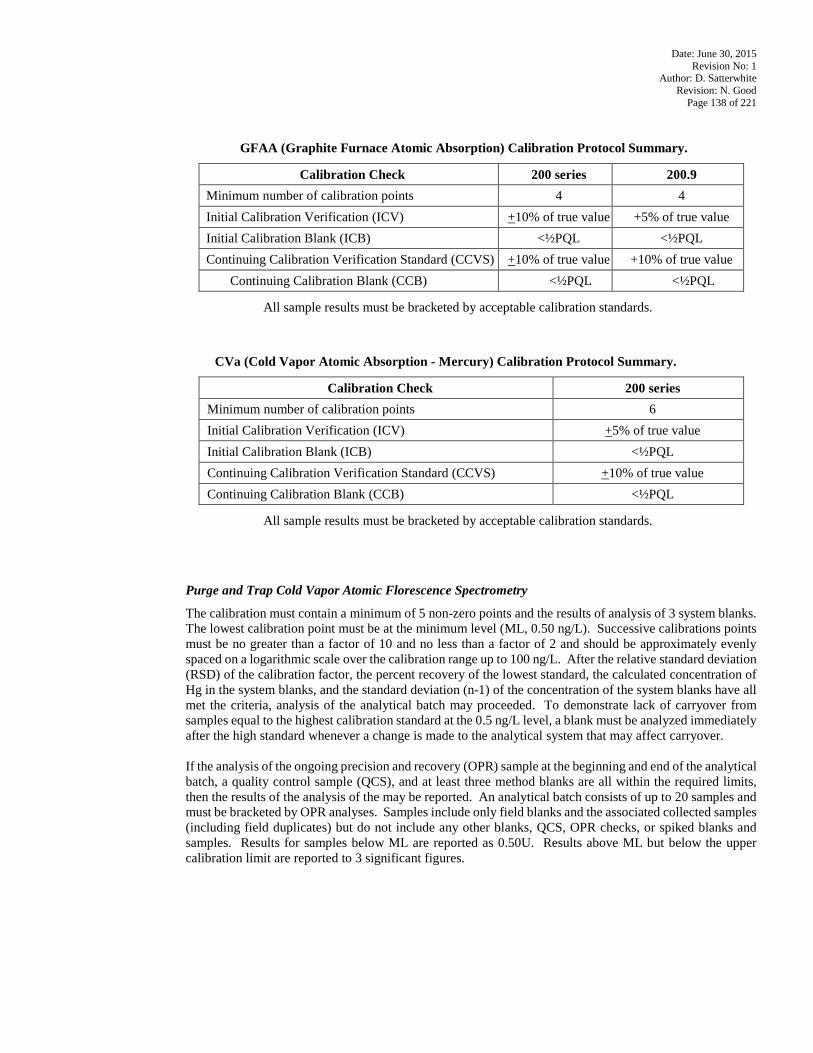
Date: June 30, 2015 Revision No: 1
Author: D. Satterwhite Revision: N. Good
Page 138 of 221
GFAA (Graphite Furnace Atomic Absorption) Calibration Protocol Summary.
Calibration Check 200 series 200.9 Minimum number of calibration points 4 4 Initial Calibration Verification (ICV) +10% of true value +5% of true value Initial Calibration Blank (ICB) <½PQL <½PQL Continuing Calibration Verification Standard (CCVS) +10% of true value +10% of true value
Continuing Calibration Blank (CCB) <½PQL <½PQL
All sample results must be bracketed by acceptable calibration standards.
CVa (Cold Vapor Atomic Absorption - Mercury) Calibration Protocol Summary.
Calibration Check 200 series Minimum number of calibration points 6 Initial Calibration Verification (ICV) +5% of true value Initial Calibration Blank (ICB) <½PQL Continuing Calibration Verification Standard (CCVS) +10% of true value Continuing Calibration Blank (CCB) <½PQL
All sample results must be bracketed by acceptable calibration standards.
Purge and Trap Cold Vapor Atomic Florescence Spectrometry
The calibration must contain a minimum of 5 non-zero points and the results of analysis of 3 system blanks. The lowest calibration point must be at the minimum level (ML, 0.50 ng/L). Successive calibrations points must be no greater than a factor of 10 and no less than a factor of 2 and should be approximately evenly spaced on a logarithmic scale over the calibration range up to 100 ng/L. After the relative standard deviation (RSD) of the calibration factor, the percent recovery of the lowest standard, the calculated concentration of Hg in the system blanks, and the standard deviation (n-1) of the concentration of the system blanks have all met the criteria, analysis of the analytical batch may proceeded. To demonstrate lack of carryover from samples equal to the highest calibration standard at the 0.5 ng/L level, a blank must be analyzed immediately after the high standard whenever a change is made to the analytical system that may affect carryover. If the analysis of the ongoing precision and recovery (OPR) sample at the beginning and end of the analytical batch, a quality control sample (QCS), and at least three method blanks are all within the required limits, then the results of the analysis of the may be reported. An analytical batch consists of up to 20 samples and must be bracketed by OPR analyses. Samples include only field blanks and the associated collected samples (including field duplicates) but do not include any other blanks, QCS, OPR checks, or spiked blanks and samples. Results for samples below ML are reported as 0.50U. Results above ML but below the upper calibration limit are reported to 3 significant figures.
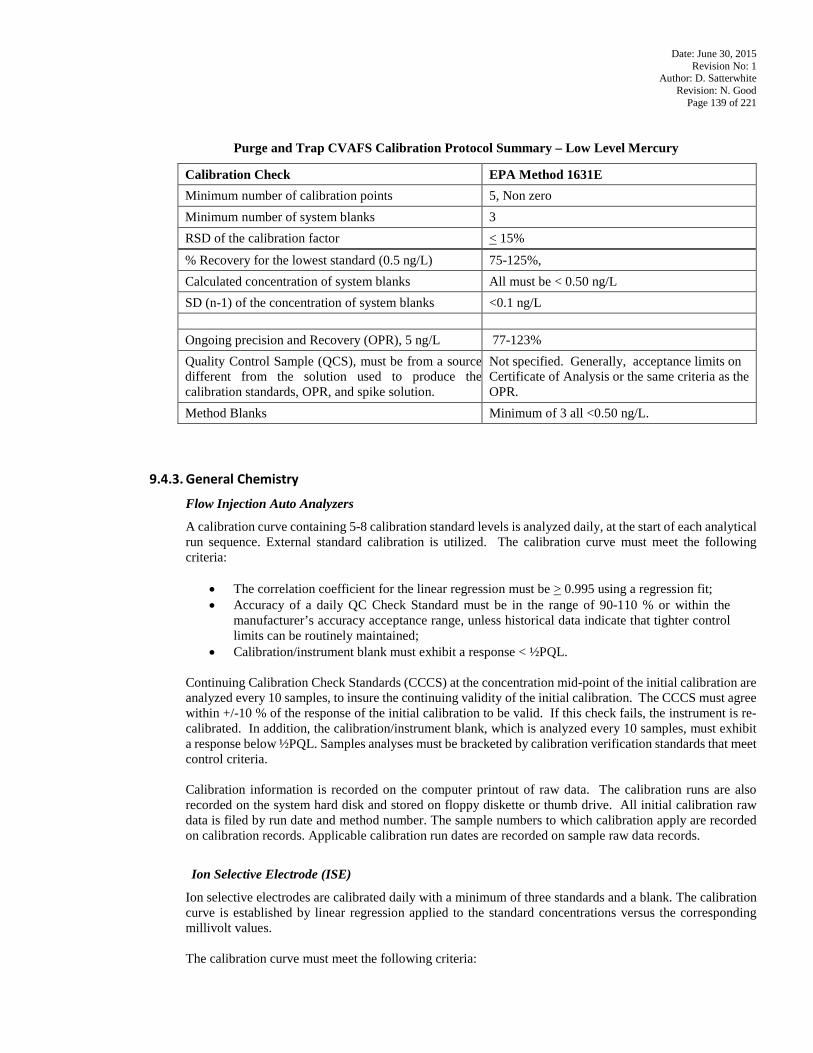
Date: June 30, 2015 Revision No: 1
Author: D. Satterwhite Revision: N. Good
Page 139 of 221
Purge and Trap CVAFS Calibration Protocol Summary – Low Level Mercury
Calibration Check EPA Method 1631E Minimum number of calibration points 5, Non zero Minimum number of system blanks 3 RSD of the calibration factor < 15% % Recovery for the lowest standard (0.5 ng/L) 75-125%, Calculated concentration of system blanks All must be < 0.50 ng/L SD (n-1) of the concentration of system blanks <0.1 ng/L
Ongoing precision and Recovery (OPR), 5 ng/L 77-123% Quality Control Sample (QCS), must be from a source different from the solution used to produce the calibration standards, OPR, and spike solution.
Not specified. Generally, acceptance limits on Certificate of Analysis or the same criteria as the OPR.
Method Blanks Minimum of 3 all <0.50 ng/L.
9.4.3. General Chemistry
Flow Injection Auto Analyzers
A calibration curve containing 5-8 calibration standard levels is analyzed daily, at the start of each analytical run sequence. External standard calibration is utilized. The calibration curve must meet the following criteria:
• The correlation coefficient for the linear regression must be > 0.995 using a regression fit; • Accuracy of a daily QC Check Standard must be in the range of 90-110 % or within the
manufacturer’s accuracy acceptance range, unless historical data indicate that tighter control limits can be routinely maintained;
• Calibration/instrument blank must exhibit a response < ½PQL.
Continuing Calibration Check Standards (CCCS) at the concentration mid-point of the initial calibration are analyzed every 10 samples, to insure the continuing validity of the initial calibration. The CCCS must agree within +/-10 % of the response of the initial calibration to be valid. If this check fails, the instrument is re-calibrated. In addition, the calibration/instrument blank, which is analyzed every 10 samples, must exhibit a response below ½PQL. Samples analyses must be bracketed by calibration verification standards that meet control criteria. Calibration information is recorded on the computer printout of raw data. The calibration runs are also recorded on the system hard disk and stored on floppy diskette or thumb drive. All initial calibration raw data is filed by run date and method number. The sample numbers to which calibration apply are recorded on calibration records. Applicable calibration run dates are recorded on sample raw data records.
Ion Selective Electrode (ISE)
Ion selective electrodes are calibrated daily with a minimum of three standards and a blank. The calibration curve is established by linear regression applied to the standard concentrations versus the corresponding millivolt values. The calibration curve must meet the following criteria:
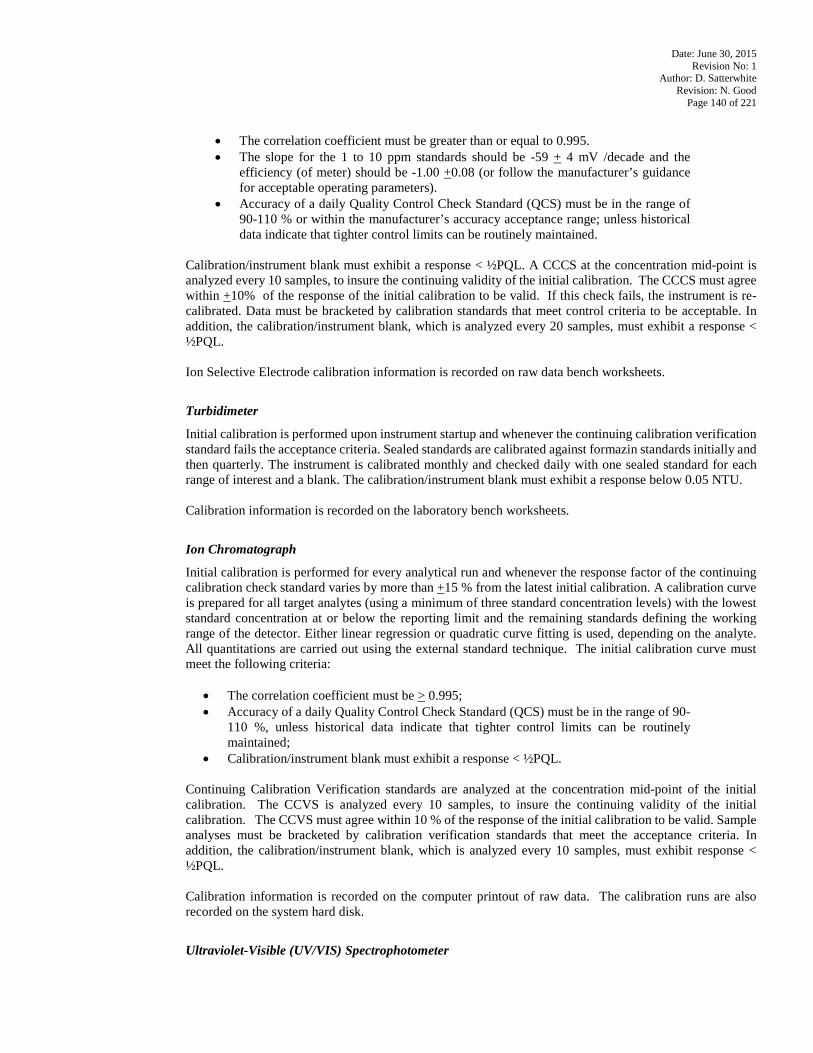
Date: June 30, 2015 Revision No: 1
Author: D. Satterwhite Revision: N. Good
Page 140 of 221
• The correlation coefficient must be greater than or equal to 0.995. • The slope for the 1 to 10 ppm standards should be -59 + 4 mV /decade and the
efficiency (of meter) should be -1.00 +0.08 (or follow the manufacturer’s guidance for acceptable operating parameters).
• Accuracy of a daily Quality Control Check Standard (QCS) must be in the range of 90-110 % or within the manufacturer’s accuracy acceptance range; unless historical data indicate that tighter control limits can be routinely maintained.
Calibration/instrument blank must exhibit a response < ½PQL. A CCCS at the concentration mid-point is analyzed every 10 samples, to insure the continuing validity of the initial calibration. The CCCS must agree within +10% of the response of the initial calibration to be valid. If this check fails, the instrument is re-calibrated. Data must be bracketed by calibration standards that meet control criteria to be acceptable. In addition, the calibration/instrument blank, which is analyzed every 20 samples, must exhibit a response < ½PQL. Ion Selective Electrode calibration information is recorded on raw data bench worksheets.
Turbidimeter
Initial calibration is performed upon instrument startup and whenever the continuing calibration verification standard fails the acceptance criteria. Sealed standards are calibrated against formazin standards initially and then quarterly. The instrument is calibrated monthly and checked daily with one sealed standard for each range of interest and a blank. The calibration/instrument blank must exhibit a response below 0.05 NTU. Calibration information is recorded on the laboratory bench worksheets.
Ion Chromatograph
Initial calibration is performed for every analytical run and whenever the response factor of the continuing calibration check standard varies by more than +15 % from the latest initial calibration. A calibration curve is prepared for all target analytes (using a minimum of three standard concentration levels) with the lowest standard concentration at or below the reporting limit and the remaining standards defining the working range of the detector. Either linear regression or quadratic curve fitting is used, depending on the analyte. All quantitations are carried out using the external standard technique. The initial calibration curve must meet the following criteria:
• The correlation coefficient must be > 0.995; • Accuracy of a daily Quality Control Check Standard (QCS) must be in the range of 90-
110 %, unless historical data indicate that tighter control limits can be routinely maintained;
• Calibration/instrument blank must exhibit a response < ½PQL. Continuing Calibration Verification standards are analyzed at the concentration mid-point of the initial calibration. The CCVS is analyzed every 10 samples, to insure the continuing validity of the initial calibration. The CCVS must agree within 10 % of the response of the initial calibration to be valid. Sample analyses must be bracketed by calibration verification standards that meet the acceptance criteria. In addition, the calibration/instrument blank, which is analyzed every 10 samples, must exhibit response < ½PQL. Calibration information is recorded on the computer printout of raw data. The calibration runs are also recorded on the system hard disk.
Ultraviolet-Visible (UV/VIS) Spectrophotometer
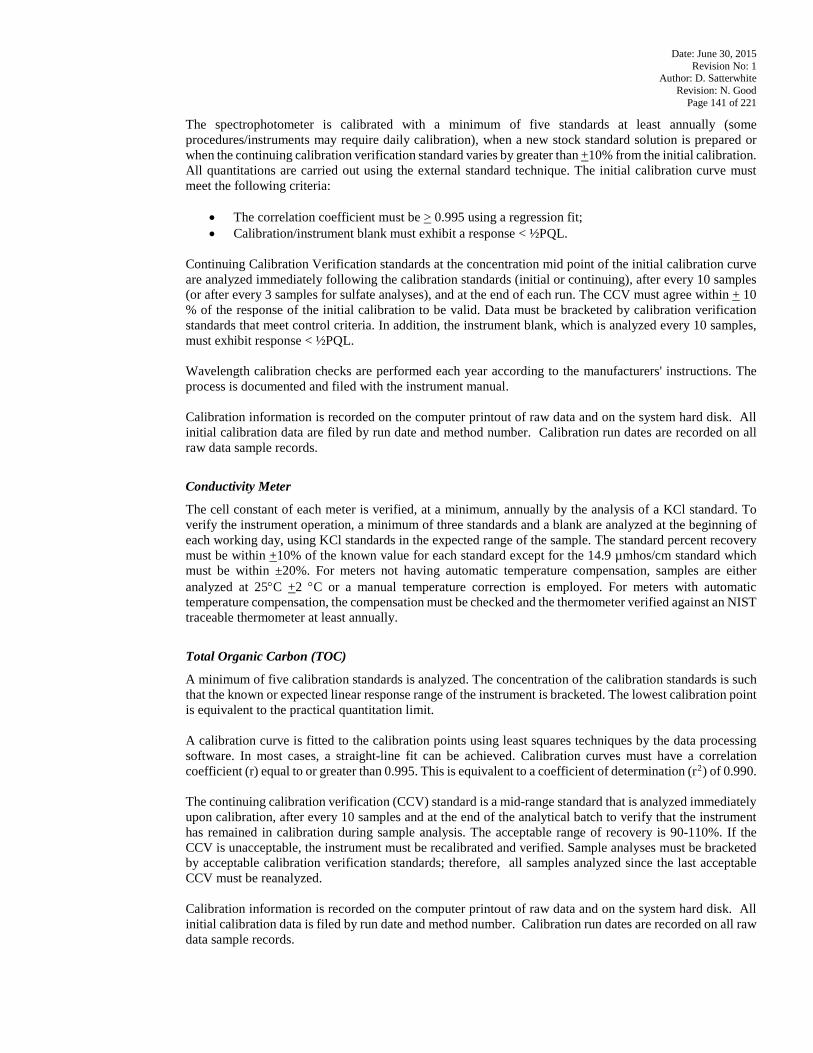
Date: June 30, 2015 Revision No: 1
Author: D. Satterwhite Revision: N. Good
Page 141 of 221
The spectrophotometer is calibrated with a minimum of five standards at least annually (some procedures/instruments may require daily calibration), when a new stock standard solution is prepared or when the continuing calibration verification standard varies by greater than +10% from the initial calibration. All quantitations are carried out using the external standard technique. The initial calibration curve must meet the following criteria:
• The correlation coefficient must be > 0.995 using a regression fit; • Calibration/instrument blank must exhibit a response < ½PQL.
Continuing Calibration Verification standards at the concentration mid point of the initial calibration curve are analyzed immediately following the calibration standards (initial or continuing), after every 10 samples (or after every 3 samples for sulfate analyses), and at the end of each run. The CCV must agree within + 10 % of the response of the initial calibration to be valid. Data must be bracketed by calibration verification standards that meet control criteria. In addition, the instrument blank, which is analyzed every 10 samples, must exhibit response < ½PQL. Wavelength calibration checks are performed each year according to the manufacturers' instructions. The process is documented and filed with the instrument manual. Calibration information is recorded on the computer printout of raw data and on the system hard disk. All initial calibration data are filed by run date and method number. Calibration run dates are recorded on all raw data sample records.
Conductivity Meter
The cell constant of each meter is verified, at a minimum, annually by the analysis of a KCl standard. To verify the instrument operation, a minimum of three standards and a blank are analyzed at the beginning of each working day, using KCl standards in the expected range of the sample. The standard percent recovery must be within +10% of the known value for each standard except for the 14.9 µmhos/cm standard which must be within ±20%. For meters not having automatic temperature compensation, samples are either analyzed at 25°C +2 °C or a manual temperature correction is employed. For meters with automatic temperature compensation, the compensation must be checked and the thermometer verified against an NIST traceable thermometer at least annually.
Total Organic Carbon (TOC)
A minimum of five calibration standards is analyzed. The concentration of the calibration standards is such that the known or expected linear response range of the instrument is bracketed. The lowest calibration point is equivalent to the practical quantitation limit. A calibration curve is fitted to the calibration points using least squares techniques by the data processing software. In most cases, a straight-line fit can be achieved. Calibration curves must have a correlation coefficient (r) equal to or greater than 0.995. This is equivalent to a coefficient of determination (rP
2P) of 0.990.
The continuing calibration verification (CCV) standard is a mid-range standard that is analyzed immediately upon calibration, after every 10 samples and at the end of the analytical batch to verify that the instrument has remained in calibration during sample analysis. The acceptable range of recovery is 90-110%. If the CCV is unacceptable, the instrument must be recalibrated and verified. Sample analyses must be bracketed by acceptable calibration verification standards; therefore, all samples analyzed since the last acceptable CCV must be reanalyzed. Calibration information is recorded on the computer printout of raw data and on the system hard disk. All initial calibration data is filed by run date and method number. Calibration run dates are recorded on all raw data sample records.
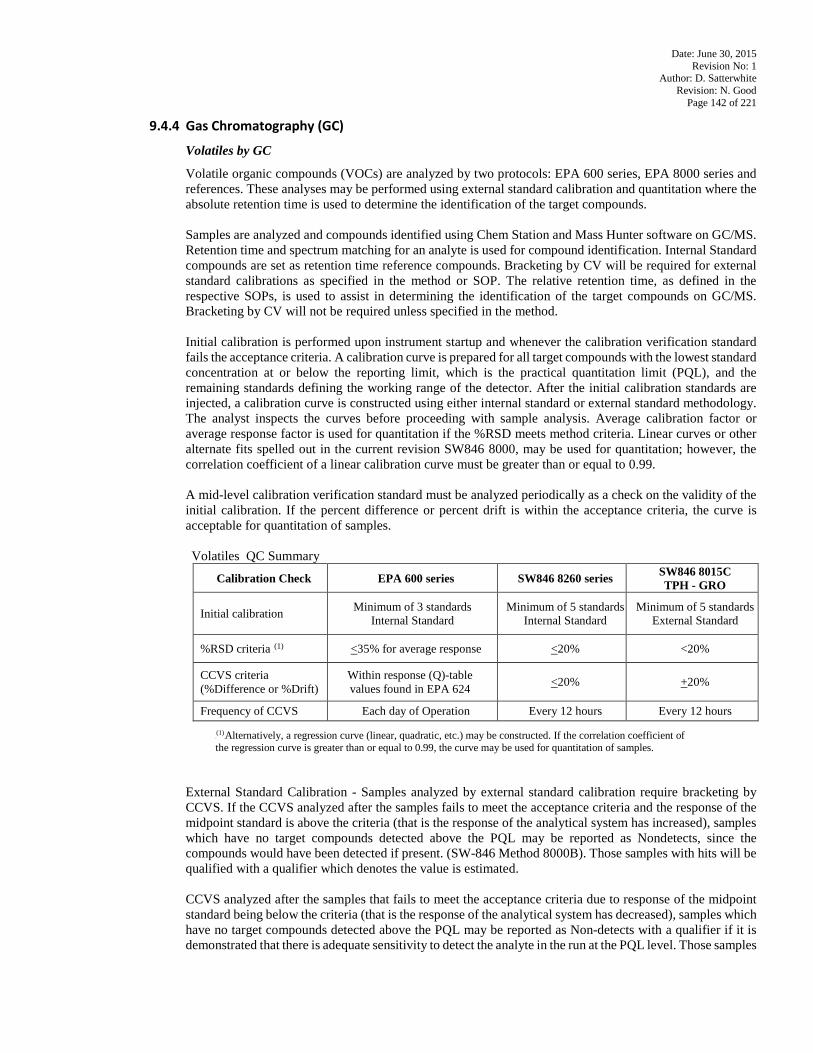
Date: June 30, 2015 Revision No: 1
Author: D. Satterwhite Revision: N. Good
Page 142 of 221
9.4.4 Gas Chromatography (GC)
Volatiles by GC
Volatile organic compounds (VOCs) are analyzed by two protocols: EPA 600 series, EPA 8000 series and references. These analyses may be performed using external standard calibration and quantitation where the absolute retention time is used to determine the identification of the target compounds. Samples are analyzed and compounds identified using Chem Station and Mass Hunter software on GC/MS. Retention time and spectrum matching for an analyte is used for compound identification. Internal Standard compounds are set as retention time reference compounds. Bracketing by CV will be required for external standard calibrations as specified in the method or SOP. The relative retention time, as defined in the respective SOPs, is used to assist in determining the identification of the target compounds on GC/MS. Bracketing by CV will not be required unless specified in the method.
Initial calibration is performed upon instrument startup and whenever the calibration verification standard fails the acceptance criteria. A calibration curve is prepared for all target compounds with the lowest standard concentration at or below the reporting limit, which is the practical quantitation limit (PQL), and the remaining standards defining the working range of the detector. After the initial calibration standards are injected, a calibration curve is constructed using either internal standard or external standard methodology. The analyst inspects the curves before proceeding with sample analysis. Average calibration factor or average response factor is used for quantitation if the %RSD meets method criteria. Linear curves or other alternate fits spelled out in the current revision SW846 8000, may be used for quantitation; however, the correlation coefficient of a linear calibration curve must be greater than or equal to 0.99.
A mid-level calibration verification standard must be analyzed periodically as a check on the validity of the initial calibration. If the percent difference or percent drift is within the acceptance criteria, the curve is acceptable for quantitation of samples.
Volatiles QC Summary
Calibration Check EPA 600 series SW846 8260 series SW846 8015C TPH - GRO
Initial calibration Minimum of 3 standards Internal Standard
Minimum of 5 standards Internal Standard
Minimum of 5 standards External Standard
%RSD criteria P
(1) <35% for average response <20% <20%
CCVS criteria (%Difference or %Drift)
Within response (Q)-table values found in EPA 624 <20% +20%
Frequency of CCVS Each day of Operation Every 12 hours Every 12 hours
P
(1)PAlternatively, a regression curve (linear, quadratic, etc.) may be constructed. If the correlation coefficient of
the regression curve is greater than or equal to 0.99, the curve may be used for quantitation of samples.
External Standard Calibration - Samples analyzed by external standard calibration require bracketing by CCVS. If the CCVS analyzed after the samples fails to meet the acceptance criteria and the response of the midpoint standard is above the criteria (that is the response of the analytical system has increased), samples which have no target compounds detected above the PQL may be reported as Nondetects, since the compounds would have been detected if present. (SW-846 Method 8000B). Those samples with hits will be qualified with a qualifier which denotes the value is estimated. CCVS analyzed after the samples that fails to meet the acceptance criteria due to response of the midpoint standard being below the criteria (that is the response of the analytical system has decreased), samples which have no target compounds detected above the PQL may be reported as Non-detects with a qualifier if it is demonstrated that there is adequate sensitivity to detect the analyte in the run at the PQL level. Those samples
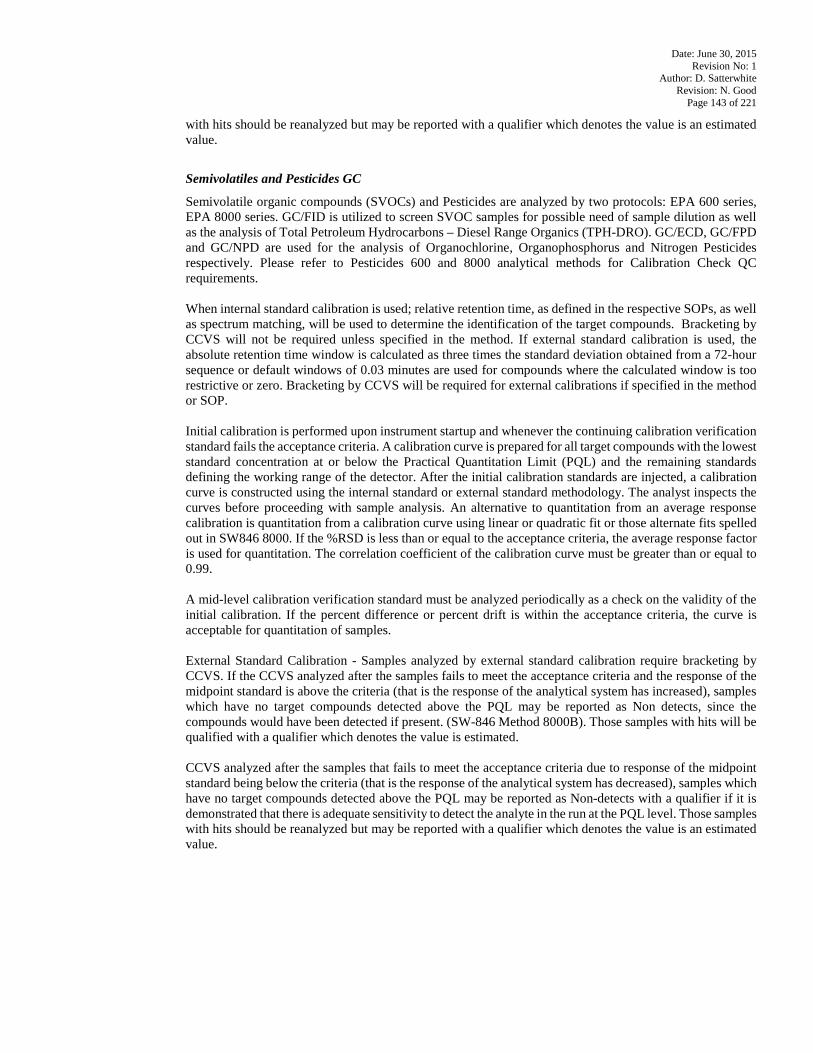
Date: June 30, 2015 Revision No: 1
Author: D. Satterwhite Revision: N. Good
Page 143 of 221
with hits should be reanalyzed but may be reported with a qualifier which denotes the value is an estimated value.
Semivolatiles and Pesticides GC
Semivolatile organic compounds (SVOCs) and Pesticides are analyzed by two protocols: EPA 600 series, EPA 8000 series. GC/FID is utilized to screen SVOC samples for possible need of sample dilution as well as the analysis of Total Petroleum Hydrocarbons – Diesel Range Organics (TPH-DRO). GC/ECD, GC/FPD and GC/NPD are used for the analysis of Organochlorine, Organophosphorus and Nitrogen Pesticides respectively. Please refer to Pesticides 600 and 8000 analytical methods for Calibration Check QC requirements.
When internal standard calibration is used; relative retention time, as defined in the respective SOPs, as well as spectrum matching, will be used to determine the identification of the target compounds. Bracketing by CCVS will not be required unless specified in the method. If external standard calibration is used, the absolute retention time window is calculated as three times the standard deviation obtained from a 72-hour sequence or default windows of 0.03 minutes are used for compounds where the calculated window is too restrictive or zero. Bracketing by CCVS will be required for external calibrations if specified in the method or SOP. Initial calibration is performed upon instrument startup and whenever the continuing calibration verification standard fails the acceptance criteria. A calibration curve is prepared for all target compounds with the lowest standard concentration at or below the Practical Quantitation Limit (PQL) and the remaining standards defining the working range of the detector. After the initial calibration standards are injected, a calibration curve is constructed using the internal standard or external standard methodology. The analyst inspects the curves before proceeding with sample analysis. An alternative to quantitation from an average response calibration is quantitation from a calibration curve using linear or quadratic fit or those alternate fits spelled out in SW846 8000. If the %RSD is less than or equal to the acceptance criteria, the average response factor is used for quantitation. The correlation coefficient of the calibration curve must be greater than or equal to 0.99.
A mid-level calibration verification standard must be analyzed periodically as a check on the validity of the initial calibration. If the percent difference or percent drift is within the acceptance criteria, the curve is acceptable for quantitation of samples.
External Standard Calibration - Samples analyzed by external standard calibration require bracketing by CCVS. If the CCVS analyzed after the samples fails to meet the acceptance criteria and the response of the midpoint standard is above the criteria (that is the response of the analytical system has increased), samples which have no target compounds detected above the PQL may be reported as Non detects, since the compounds would have been detected if present. (SW-846 Method 8000B). Those samples with hits will be qualified with a qualifier which denotes the value is estimated.
CCVS analyzed after the samples that fails to meet the acceptance criteria due to response of the midpoint standard being below the criteria (that is the response of the analytical system has decreased), samples which have no target compounds detected above the PQL may be reported as Non-detects with a qualifier if it is demonstrated that there is adequate sensitivity to detect the analyte in the run at the PQL level. Those samples with hits should be reanalyzed but may be reported with a qualifier which denotes the value is an estimated value.
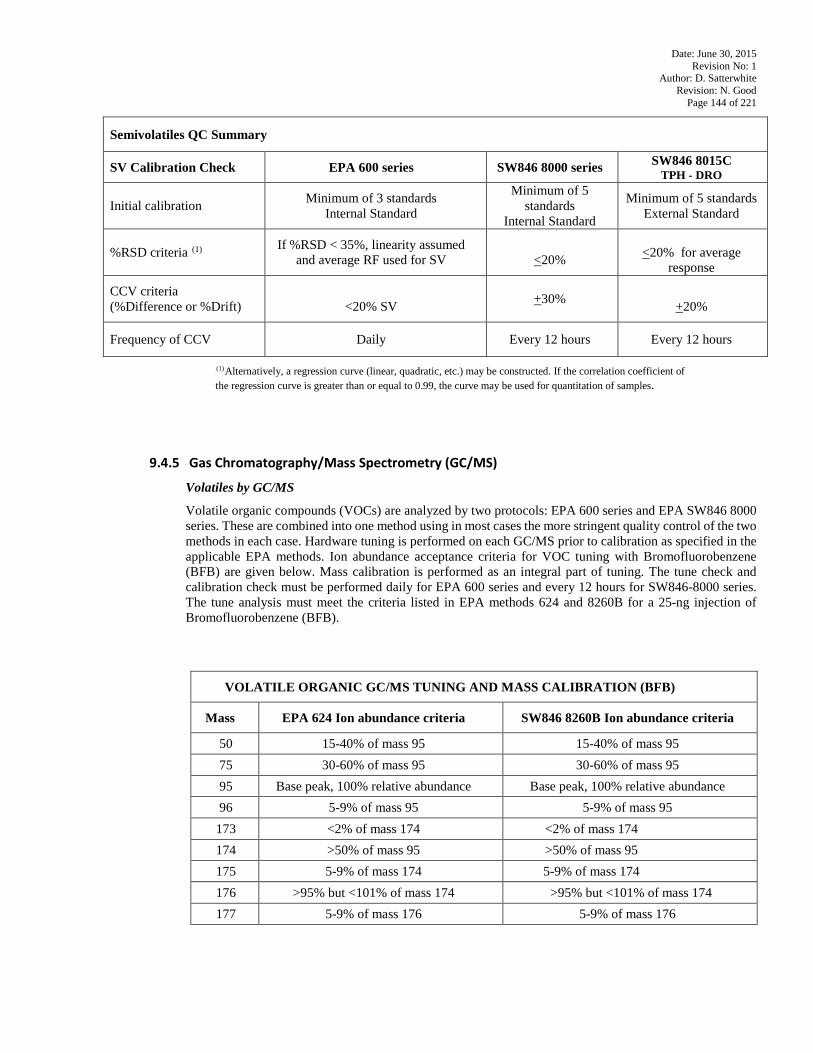
Date: June 30, 2015 Revision No: 1
Author: D. Satterwhite Revision: N. Good
Page 144 of 221
Semivolatiles QC Summary
SV Calibration Check EPA 600 series SW846 8000 series SW846 8015C TPH - DRO
Initial calibration Minimum of 3 standards Internal Standard
Minimum of 5 standards
Internal Standard
Minimum of 5 standards External Standard
%RSD criteria P
(1) If %RSD < 35%, linearity assumed and average RF used for SV
<20%
<20% for average
response
CCV criteria (%Difference or %Drift)
<20% SV
+30%
+20%
Frequency of CCV Daily Every 12 hours Every 12 hours
P
(1)PAlternatively, a regression curve (linear, quadratic, etc.) may be constructed. If the correlation coefficient of
the regression curve is greater than or equal to 0.99, the curve may be used for quantitation of samples.
9.4.5 Gas Chromatography/Mass Spectrometry (GC/MS)
Volatiles by GC/MS
Volatile organic compounds (VOCs) are analyzed by two protocols: EPA 600 series and EPA SW846 8000 series. These are combined into one method using in most cases the more stringent quality control of the two methods in each case. Hardware tuning is performed on each GC/MS prior to calibration as specified in the applicable EPA methods. Ion abundance acceptance criteria for VOC tuning with Bromofluorobenzene (BFB) are given below. Mass calibration is performed as an integral part of tuning. The tune check and calibration check must be performed daily for EPA 600 series and every 12 hours for SW846-8000 series. The tune analysis must meet the criteria listed in EPA methods 624 and 8260B for a 25-ng injection of Bromofluorobenzene (BFB).
VOLATILE ORGANIC GC/MS TUNING AND MASS CALIBRATION (BFB)
Mass EPA 624 Ion abundance criteria SW846 8260B Ion abundance criteria
50 15-40% of mass 95 15-40% of mass 95 75 30-60% of mass 95 30-60% of mass 95 95 Base peak, 100% relative abundance Base peak, 100% relative abundance 96 5-9% of mass 95 5-9% of mass 95
173 <2% of mass 174 <2% of mass 174 174 >50% of mass 95 >50% of mass 95 175 5-9% of mass 174 5-9% of mass 174 176 >95% but <101% of mass 174 >95% but <101% of mass 174 177 5-9% of mass 176 5-9% of mass 176
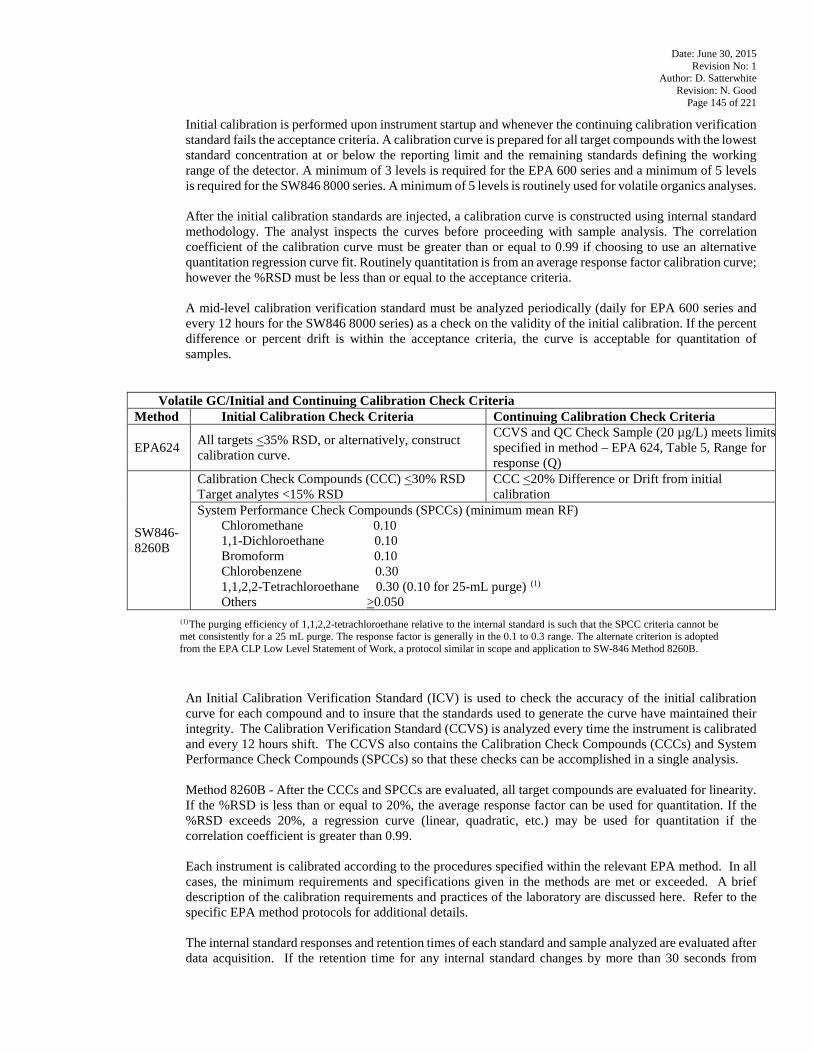
Date: June 30, 2015 Revision No: 1
Author: D. Satterwhite Revision: N. Good
Page 145 of 221
Initial calibration is performed upon instrument startup and whenever the continuing calibration verification standard fails the acceptance criteria. A calibration curve is prepared for all target compounds with the lowest standard concentration at or below the reporting limit and the remaining standards defining the working range of the detector. A minimum of 3 levels is required for the EPA 600 series and a minimum of 5 levels is required for the SW846 8000 series. A minimum of 5 levels is routinely used for volatile organics analyses. After the initial calibration standards are injected, a calibration curve is constructed using internal standard methodology. The analyst inspects the curves before proceeding with sample analysis. The correlation coefficient of the calibration curve must be greater than or equal to 0.99 if choosing to use an alternative quantitation regression curve fit. Routinely quantitation is from an average response factor calibration curve; however the %RSD must be less than or equal to the acceptance criteria.
A mid-level calibration verification standard must be analyzed periodically (daily for EPA 600 series and every 12 hours for the SW846 8000 series) as a check on the validity of the initial calibration. If the percent difference or percent drift is within the acceptance criteria, the curve is acceptable for quantitation of samples.
Volatile GC/Initial and Continuing Calibration Check Criteria Method Initial Calibration Check Criteria Continuing Calibration Check Criteria
EPA624 All targets <35% RSD, or alternatively, construct calibration curve.
CCVS and QC Check Sample (20 µg/L) meets limits specified in method – EPA 624, Table 5, Range for response (Q)
SW846-8260B
Calibration Check Compounds (CCC) <30% RSD Target analytes <15% RSD
CCC <20% Difference or Drift from initial calibration
System Performance Check Compounds (SPCCs) (minimum mean RF) Chloromethane 0.10 1,1-Dichloroethane 0.10 Bromoform 0.10 Chlorobenzene 0.30 1,1,2,2-Tetrachloroethane 0.30 (0.10 for 25-mL purge) P
(1)
Others >0.050 P
(1)PThe purging efficiency of 1,1,2,2-tetrachloroethane relative to the internal standard is such that the SPCC criteria cannot be
met consistently for a 25 mL purge. The response factor is generally in the 0.1 to 0.3 range. The alternate criterion is adopted from the EPA CLP Low Level Statement of Work, a protocol similar in scope and application to SW-846 Method 8260B.
An Initial Calibration Verification Standard (ICV) is used to check the accuracy of the initial calibration curve for each compound and to insure that the standards used to generate the curve have maintained their integrity. The Calibration Verification Standard (CCVS) is analyzed every time the instrument is calibrated and every 12 hours shift. The CCVS also contains the Calibration Check Compounds (CCCs) and System Performance Check Compounds (SPCCs) so that these checks can be accomplished in a single analysis. Method 8260B - After the CCCs and SPCCs are evaluated, all target compounds are evaluated for linearity. If the %RSD is less than or equal to 20%, the average response factor can be used for quantitation. If the %RSD exceeds 20%, a regression curve (linear, quadratic, etc.) may be used for quantitation if the correlation coefficient is greater than 0.99. Each instrument is calibrated according to the procedures specified within the relevant EPA method. In all cases, the minimum requirements and specifications given in the methods are met or exceeded. A brief description of the calibration requirements and practices of the laboratory are discussed here. Refer to the specific EPA method protocols for additional details. The internal standard responses and retention times of each standard and sample analyzed are evaluated after data acquisition. If the retention time for any internal standard changes by more than 30 seconds from
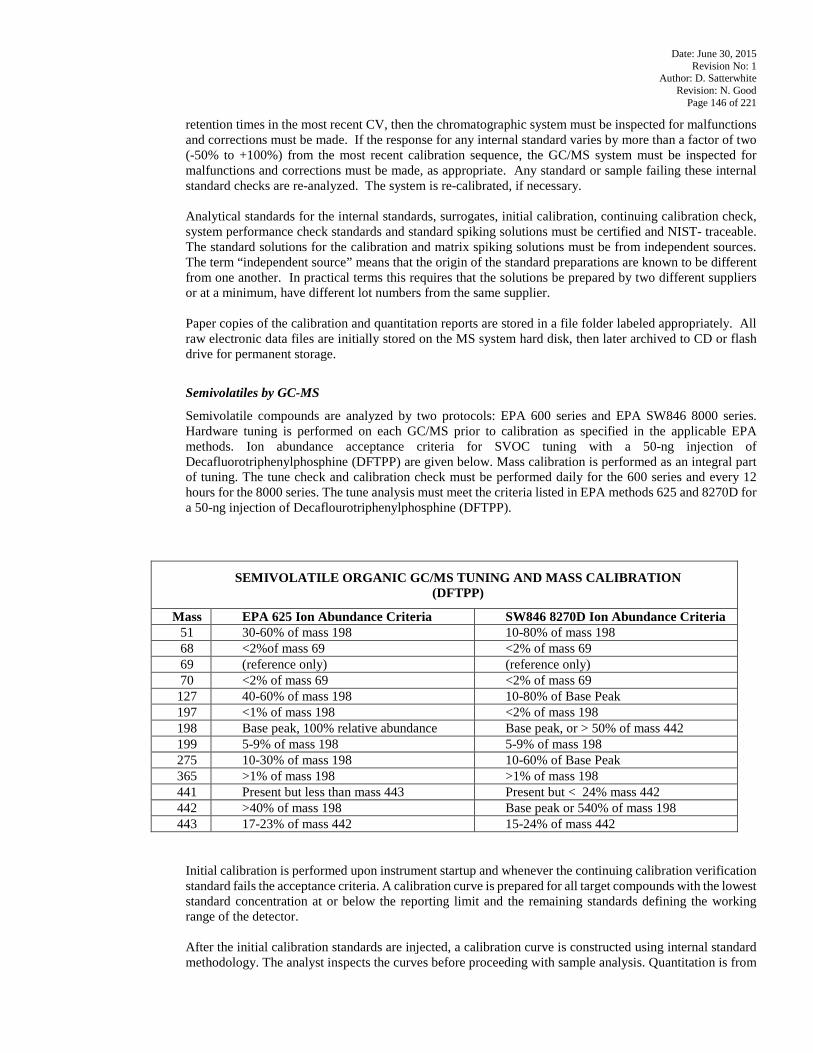
Date: June 30, 2015 Revision No: 1
Author: D. Satterwhite Revision: N. Good
Page 146 of 221
retention times in the most recent CV, then the chromatographic system must be inspected for malfunctions and corrections must be made. If the response for any internal standard varies by more than a factor of two (-50% to +100%) from the most recent calibration sequence, the GC/MS system must be inspected for malfunctions and corrections must be made, as appropriate. Any standard or sample failing these internal standard checks are re-analyzed. The system is re-calibrated, if necessary.
Analytical standards for the internal standards, surrogates, initial calibration, continuing calibration check, system performance check standards and standard spiking solutions must be certified and NIST- traceable. The standard solutions for the calibration and matrix spiking solutions must be from independent sources. The term “independent source” means that the origin of the standard preparations are known to be different from one another. In practical terms this requires that the solutions be prepared by two different suppliers or at a minimum, have different lot numbers from the same supplier. Paper copies of the calibration and quantitation reports are stored in a file folder labeled appropriately. All raw electronic data files are initially stored on the MS system hard disk, then later archived to CD or flash drive for permanent storage.
Semivolatiles by GC-MS
Semivolatile compounds are analyzed by two protocols: EPA 600 series and EPA SW846 8000 series. Hardware tuning is performed on each GC/MS prior to calibration as specified in the applicable EPA methods. Ion abundance acceptance criteria for SVOC tuning with a 50-ng injection of Decafluorotriphenylphosphine (DFTPP) are given below. Mass calibration is performed as an integral part of tuning. The tune check and calibration check must be performed daily for the 600 series and every 12 hours for the 8000 series. The tune analysis must meet the criteria listed in EPA methods 625 and 8270D for a 50-ng injection of Decaflourotriphenylphosphine (DFTPP).
SEMIVOLATILE ORGANIC GC/MS TUNING AND MASS CALIBRATION (DFTPP)
Mass EPA 625 Ion Abundance Criteria SW846 8270D Ion Abundance Criteria 51 30-60% of mass 198 10-80% of mass 198 68 <2%of mass 69 <2% of mass 69 69 (reference only) (reference only) 70 <2% of mass 69 <2% of mass 69
127 40-60% of mass 198 10-80% of Base Peak 197 <1% of mass 198 <2% of mass 198 198 Base peak, 100% relative abundance Base peak, or > 50% of mass 442 199 5-9% of mass 198 5-9% of mass 198 275 10-30% of mass 198 10-60% of Base Peak 365 >1% of mass 198 >1% of mass 198 441 Present but less than mass 443 Present but < 24% mass 442 442 >40% of mass 198 Base peak or 540% of mass 198 443 17-23% of mass 442 15-24% of mass 442
Initial calibration is performed upon instrument startup and whenever the continuing calibration verification standard fails the acceptance criteria. A calibration curve is prepared for all target compounds with the lowest standard concentration at or below the reporting limit and the remaining standards defining the working range of the detector. After the initial calibration standards are injected, a calibration curve is constructed using internal standard methodology. The analyst inspects the curves before proceeding with sample analysis. Quantitation is from
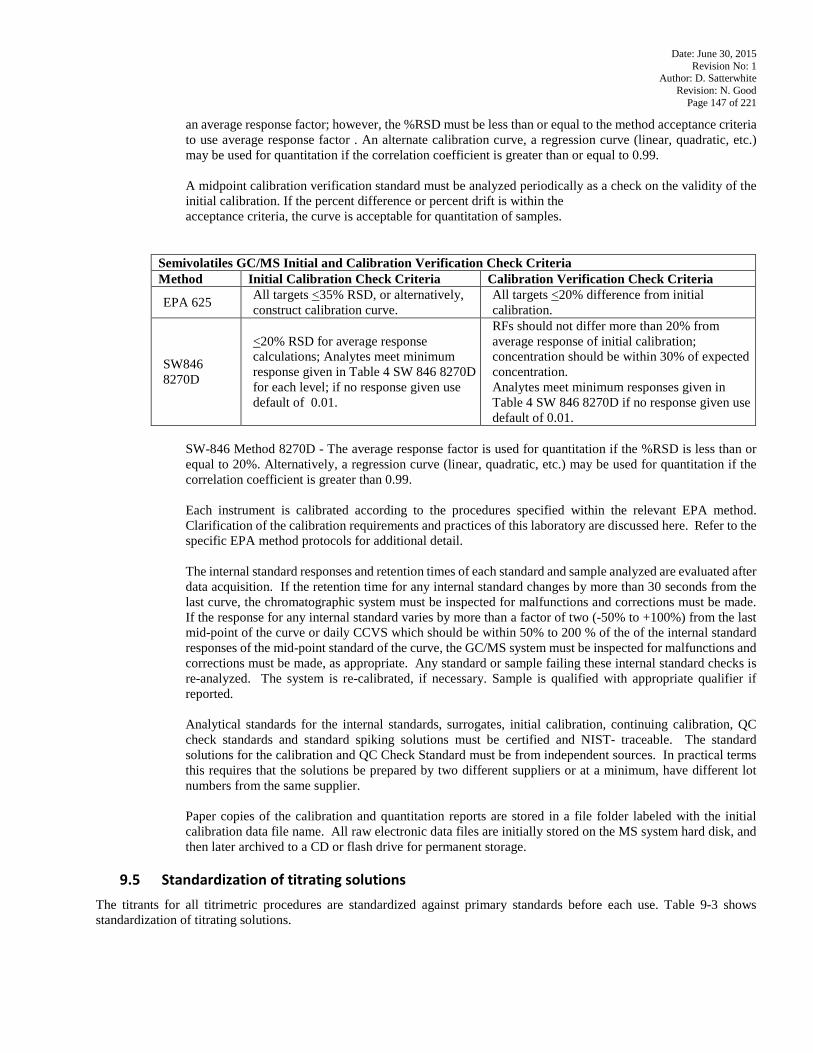
Date: June 30, 2015 Revision No: 1
Author: D. Satterwhite Revision: N. Good
Page 147 of 221
an average response factor; however, the %RSD must be less than or equal to the method acceptance criteria to use average response factor . An alternate calibration curve, a regression curve (linear, quadratic, etc.) may be used for quantitation if the correlation coefficient is greater than or equal to 0.99.
A midpoint calibration verification standard must be analyzed periodically as a check on the validity of the initial calibration. If the percent difference or percent drift is within the acceptance criteria, the curve is acceptable for quantitation of samples.
Semivolatiles GC/MS Initial and Calibration Verification Check Criteria Method Initial Calibration Check Criteria Calibration Verification Check Criteria
EPA 625 All targets <35% RSD, or alternatively, construct calibration curve.
All targets <20% difference from initial calibration.
SW846 8270D
<20% RSD for average response calculations; Analytes meet minimum response given in Table 4 SW 846 8270D for each level; if no response given use default of 0.01.
RFs should not differ more than 20% from average response of initial calibration; concentration should be within 30% of expected concentration. Analytes meet minimum responses given in Table 4 SW 846 8270D if no response given use default of 0.01.
SW-846 Method 8270D - The average response factor is used for quantitation if the %RSD is less than or equal to 20%. Alternatively, a regression curve (linear, quadratic, etc.) may be used for quantitation if the correlation coefficient is greater than 0.99.
Each instrument is calibrated according to the procedures specified within the relevant EPA method. Clarification of the calibration requirements and practices of this laboratory are discussed here. Refer to the specific EPA method protocols for additional detail.
The internal standard responses and retention times of each standard and sample analyzed are evaluated after data acquisition. If the retention time for any internal standard changes by more than 30 seconds from the last curve, the chromatographic system must be inspected for malfunctions and corrections must be made. If the response for any internal standard varies by more than a factor of two (-50% to +100%) from the last mid-point of the curve or daily CCVS which should be within 50% to 200 % of the of the internal standard responses of the mid-point standard of the curve, the GC/MS system must be inspected for malfunctions and corrections must be made, as appropriate. Any standard or sample failing these internal standard checks is re-analyzed. The system is re-calibrated, if necessary. Sample is qualified with appropriate qualifier if reported.
Analytical standards for the internal standards, surrogates, initial calibration, continuing calibration, QC check standards and standard spiking solutions must be certified and NIST- traceable. The standard solutions for the calibration and QC Check Standard must be from independent sources. In practical terms this requires that the solutions be prepared by two different suppliers or at a minimum, have different lot numbers from the same supplier.
Paper copies of the calibration and quantitation reports are stored in a file folder labeled with the initial calibration data file name. All raw electronic data files are initially stored on the MS system hard disk, and then later archived to a CD or flash drive for permanent storage.
9.5 Standardization of titrating solutions
The titrants for all titrimetric procedures are standardized against primary standards before each use. Table 9-3 shows standardization of titrating solutions.
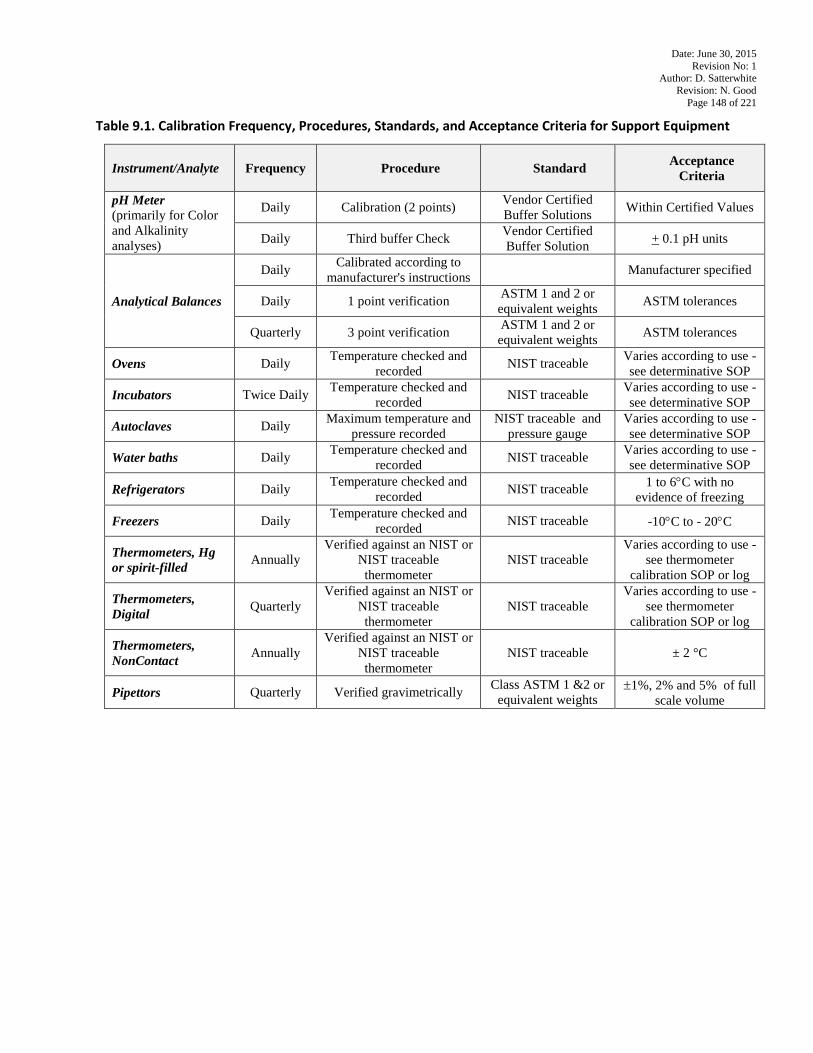
Date: June 30, 2015 Revision No: 1
Author: D. Satterwhite Revision: N. Good
Page 148 of 221
Table 9.1. Calibration Frequency, Procedures, Standards, and Acceptance Criteria for Support Equipment
Instrument/Analyte Frequency Procedure Standard Acceptance Criteria
pH Meter (primarily for Color and Alkalinity analyses)
Daily Calibration (2 points) Vendor Certified Buffer Solutions Within Certified Values
Daily Third buffer Check Vendor Certified Buffer Solution + 0.1 pH units
Analytical Balances
Daily Calibrated according to manufacturer's instructions Manufacturer specified
Daily 1 point verification ASTM 1 and 2 or equivalent weights ASTM tolerances
Quarterly 3 point verification ASTM 1 and 2 or equivalent weights ASTM tolerances
Ovens Daily Temperature checked and recorded NIST traceable Varies according to use -
see determinative SOP
Incubators Twice Daily Temperature checked and recorded NIST traceable Varies according to use -
see determinative SOP
Autoclaves Daily Maximum temperature and pressure recorded
NIST traceable and pressure gauge
Varies according to use - see determinative SOP
Water baths Daily Temperature checked and recorded NIST traceable Varies according to use -
see determinative SOP
Refrigerators Daily Temperature checked and recorded NIST traceable 1 to 6°C with no
evidence of freezing
Freezers Daily Temperature checked and recorded NIST traceable -10°C to - 20°C
Thermometers, Hg or spirit-filled Annually
Verified against an NIST or NIST traceable thermometer
NIST traceable Varies according to use -
see thermometer calibration SOP or log
Thermometers, Digital Quarterly
Verified against an NIST or NIST traceable thermometer
NIST traceable Varies according to use -
see thermometer calibration SOP or log
Thermometers, NonContact Annually
Verified against an NIST or NIST traceable thermometer
NIST traceable ± 2 °C
Pipettors Quarterly Verified gravimetrically Class ASTM 1 &2 or equivalent weights
±1%, 2% and 5% of full scale volume
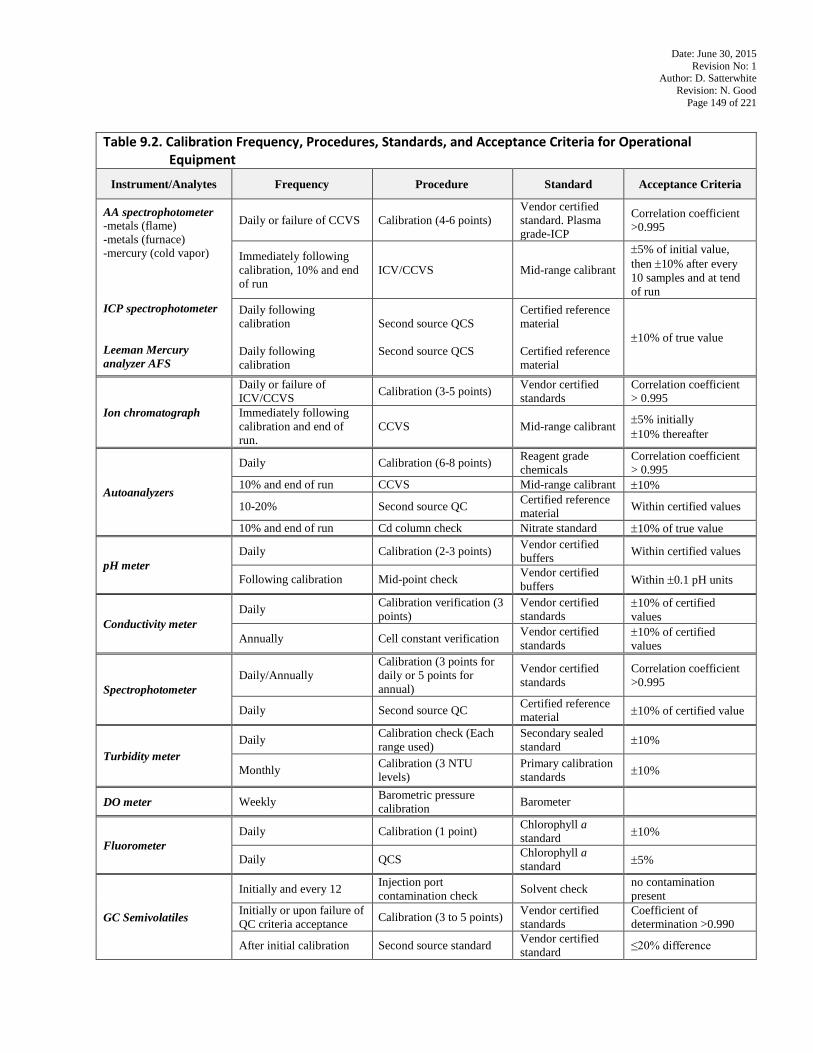
Date: June 30, 2015 Revision No: 1
Author: D. Satterwhite Revision: N. Good
Page 149 of 221
Table 9.2. Calibration Frequency, Procedures, Standards, and Acceptance Criteria for Operational
Equipment
Instrument/Analytes Frequency Procedure Standard Acceptance Criteria
AA spectrophotometer -metals (flame) -metals (furnace) -mercury (cold vapor) ICP spectrophotometer Leeman Mercury analyzer AFS
Daily or failure of CCVS Calibration (4-6 points) Vendor certified standard. Plasma grade-ICP
Correlation coefficient >0.995
Immediately following calibration, 10% and end of run
ICV/CCVS Mid-range calibrant
±5% of initial value, then ±10% after every 10 samples and at tend of run
Daily following calibration Daily following calibration
Second source QCS Second source QCS
Certified reference material Certified reference material
±10% of true value
Ion chromatograph
Daily or failure of ICV/CCVS Calibration (3-5 points) Vendor certified
standards Correlation coefficient > 0.995
Immediately following calibration and end of run.
CCVS Mid-range calibrant ±5% initially ±10% thereafter
Autoanalyzers
Daily Calibration (6-8 points) Reagent grade chemicals
Correlation coefficient > 0.995
10% and end of run CCVS Mid-range calibrant ±10%
10-20% Second source QC Certified reference material Within certified values
10% and end of run Cd column check Nitrate standard ±10% of true value
pH meter Daily Calibration (2-3 points) Vendor certified
buffers Within certified values
Following calibration Mid-point check Vendor certified buffers Within ±0.1 pH units
Conductivity meter Daily Calibration verification (3
points) Vendor certified standards
±10% of certified values
Annually Cell constant verification Vendor certified standards
±10% of certified values
Spectrophotometer Daily/Annually
Calibration (3 points for daily or 5 points for annual)
Vendor certified standards
Correlation coefficient >0.995
Daily Second source QC Certified reference material ±10% of certified value
Turbidity meter Daily Calibration check (Each
range used) Secondary sealed standard ±10%
Monthly Calibration (3 NTU levels)
Primary calibration standards ±10%
DO meter Weekly Barometric pressure calibration Barometer
Fluorometer Daily Calibration (1 point) Chlorophyll a
standard ±10%
Daily QCS Chlorophyll a standard ±5%
GC Semivolatiles
Initially and every 12 Injection port contamination check Solvent check no contamination
present Initially or upon failure of QC criteria acceptance Calibration (3 to 5 points) Vendor certified
standards Coefficient of determination >0.990
After initial calibration Second source standard Vendor certified standard ≤20% difference
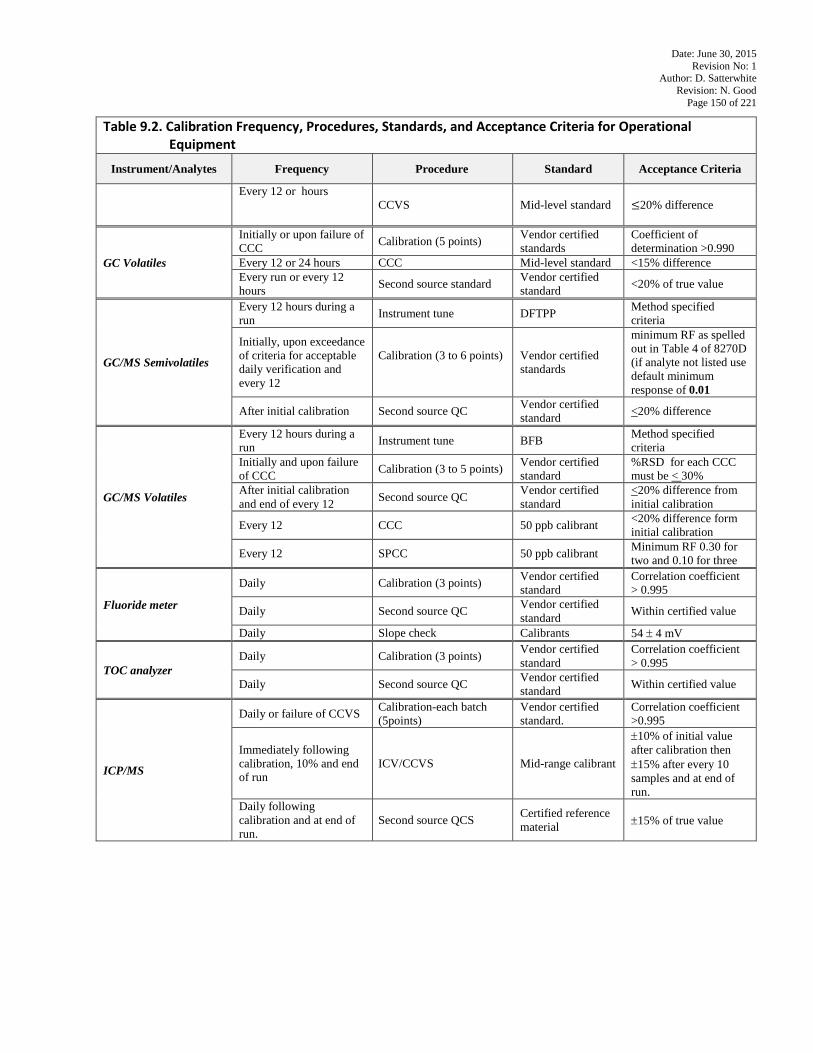
Date: June 30, 2015 Revision No: 1
Author: D. Satterwhite Revision: N. Good
Page 150 of 221
Table 9.2. Calibration Frequency, Procedures, Standards, and Acceptance Criteria for Operational Equipment
Instrument/Analytes Frequency Procedure Standard Acceptance Criteria
Every 12 or hours
CCVS Mid-level standard ≤20% difference
GC Volatiles
Initially or upon failure of CCC Calibration (5 points) Vendor certified
standards Coefficient of determination >0.990
Every 12 or 24 hours CCC Mid-level standard <15% difference Every run or every 12 hours Second source standard Vendor certified
standard <20% of true value
GC/MS Semivolatiles
Every 12 hours during a run Instrument tune DFTPP Method specified
criteria
Initially, upon exceedance of criteria for acceptable daily verification and every 12
Calibration (3 to 6 points)
Vendor certified standards
minimum RF as spelled out in Table 4 of 8270D (if analyte not listed use default minimum response of 0.01
After initial calibration Second source QC Vendor certified standard <20% difference
GC/MS Volatiles
Every 12 hours during a run Instrument tune BFB Method specified
criteria Initially and upon failure of CCC Calibration (3 to 5 points) Vendor certified
standard %RSD for each CCC must be < 30%
After initial calibration and end of every 12 Second source QC Vendor certified
standard <20% difference from initial calibration
Every 12 CCC 50 ppb calibrant <20% difference form initial calibration
Every 12 SPCC 50 ppb calibrant Minimum RF 0.30 for two and 0.10 for three
Fluoride meter
Daily Calibration (3 points) Vendor certified standard
Correlation coefficient > 0.995
Daily Second source QC Vendor certified standard Within certified value
Daily Slope check Calibrants 54 ± 4 mV
TOC analyzer Daily Calibration (3 points) Vendor certified
standard Correlation coefficient > 0.995
Daily Second source QC Vendor certified standard Within certified value
ICP/MS
Daily or failure of CCVS Calibration-each batch (5points)
Vendor certified standard.
Correlation coefficient >0.995
Immediately following calibration, 10% and end of run
ICV/CCVS Mid-range calibrant
±10% of initial value after calibration then ±15% after every 10 samples and at end of run.
Daily following calibration and at end of run.
Second source QCS Certified reference material ±15% of true value
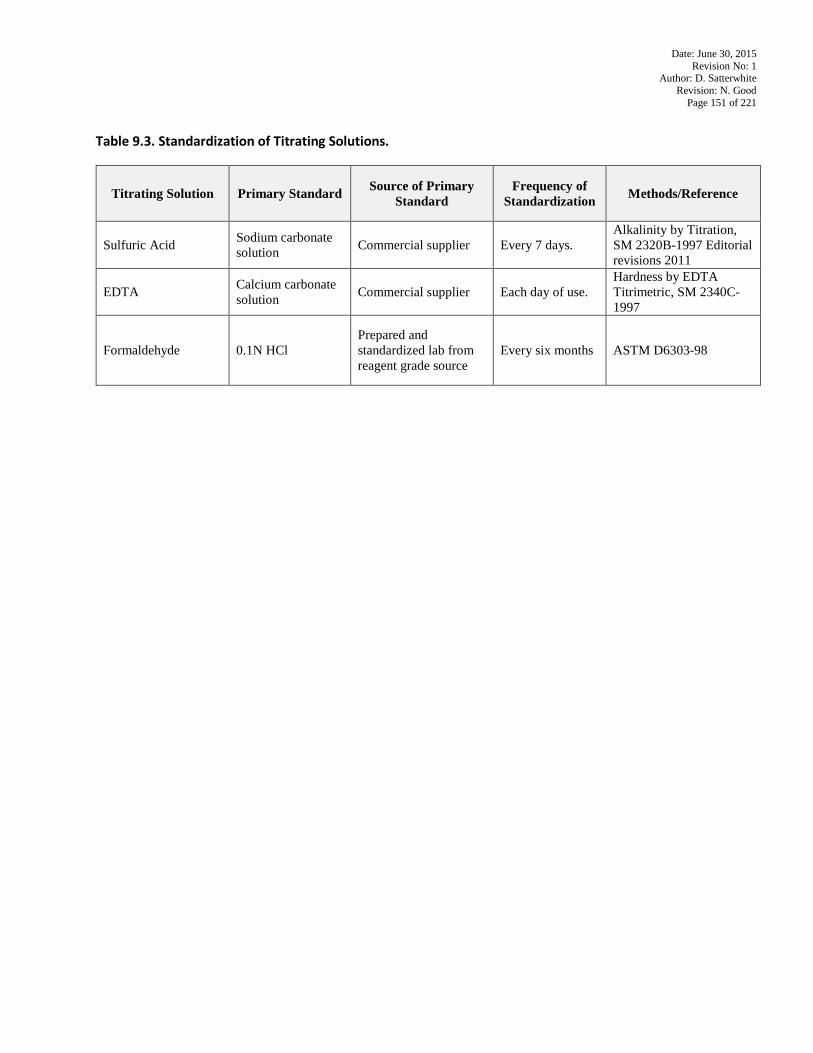
Date: June 30, 2015 Revision No: 1
Author: D. Satterwhite Revision: N. Good
Page 151 of 221
Table 9.3. Standardization of Titrating Solutions.
Titrating Solution Primary Standard Source of Primary Standard
Frequency of Standardization Methods/Reference
Sulfuric Acid Sodium carbonate solution Commercial supplier Every 7 days.
Alkalinity by Titration, SM 2320B-1997 Editorial revisions 2011
EDTA Calcium carbonate solution Commercial supplier Each day of use.
Hardness by EDTA Titrimetric, SM 2340C-1997
Formaldehyde 0.1N HCl Prepared and standardized lab from reagent grade source
Every six months ASTM D6303-98
Date: June 30, 2015 Revision No: 1
Author: D. Satterwhite Revision: N. Good
Page 152 of 221
10.0 Preventive Maintenance The Central Laboratory is equipped with mechanical and computerized instrumentation. A preventive maintenance schedule has been developed to minimize instrument downtime and to obtain reliable data over the life of the instrument. Analysts and supervisors are primarily responsible for routine maintenance and repair of the instruments. Service agreements are kept for some major instruments in the laboratory. Major repairs that go beyond the expertise of the analysts, Supervisors and Managers are contracted to external specialists.
Table 10.1 lists the types of analytical equipment utilized to perform analyses and the frequency of routine preventive maintenance tasks performed to ensure data quality. The service intervals are designated as follows: D = daily; W = weekly; M = monthly; Q = quarterly; SA = semi-annually; A = annually; AN = as needed. The preventive maintenance schedules are based primarily on manufacturer guidance, recommendation in the literature, and the experience of the analysts, Supervisors and Managers. Some of the items will be performed as an integral part of each procedure. Others will be followed as closely as possible, balancing to the extent possible the workload and the urgency of the need for preventive maintenance. Common sense and familiarity with the performance of each instrument will dictate whether the preventive maintenance schedule needs to be accelerated or delayed for that instrument. Trends and excursions from accepted quality assurance requirements such as QC sample results, degradation of peak resolution, a shift in the calibration curve, and loss of sensitivity are monitored to determine if there is instrument malfunction, and in such cases preventive maintenance is provided on an as-needed basis.
10.1 Documentation
An instrument maintenance logbook documenting instrument problems, instrument repair and maintenance activities are kept for all major pieces of equipment. It is the responsibility of each Unit Supervisor to ensure that instrument maintenance logs are up to date for all equipment in his/her Unit. Documentation must include all major maintenance activities such as contracted preventive maintenance and service, and in-house activities such as the replacement of electrical components. An extensive spare parts inventory is maintained for routine repairs at the laboratory facilities, consisting of GC columns, AA lamps, fuses, printer heads, tubing, and other instrument components. Logbook entries must include the date, the problem, the corrective actions taken, the name of the person performing the service and, when appropriate, a statement that the instrument has returned to control and is available for use (also state what was used to determine a return to control - e.g., CCVS acceptable). When maintenance or repair is performed by an outside agency, service receipts detailing the service performed can be stapled into the logbooks adjacent to pages describing the maintenance performed.
10.2 Contingency Plan The laboratory has several pieces of analytical equipment in duplicate. This redundancy allows the laboratory to keep performing critical analyses on one instrument while the other is out of service. In the event of instrument failure or if critical holding times are approaching, the following options exist:
1. Portions of the sample load may be diverted to duplicate instruments within a facility. 2. The analytical technique may be switched to an alternate approved technique (e.g., Total Hardness by ICP to
titration). 3. Samples may be shipped to another State lab. When shipping samples to another facility, COC procedures are
followed as required. In the event of equipment malfunction that cannot be resolved, service shall be obtained from the instrument vendor manufacturer, or qualified service technician, if such a service can be tendered. If on-site service is unavailable, arrangements shall be made to have the instrument shipped back to the manufacture for repair. Back up instruments, which have been approved for the analysis, shall perform the analysis normally carried out by the malfunctioning instrument. If the backup is not available and the analysis cannot be carried out within the needed timeframe, sample collection personnel may be asked to postpone sampling events or to send the samples to a certified commercial laboratory.
Any item of equipment which has been subjected to overloading or mishandling, which gives suspect results, or has been shown to be defective shall be taken out of service. The instrument will be clearly identified and, wherever possible, stored
Date: June 30, 2015 Revision No: 1
Author: D. Satterwhite Revision: N. Good
Page 153 of 221
in a different location until it has been repaired and shown by calibration, verification or test to perform satisfactorily. The supervisor shall examine the effect of this defect on previous calibrations or tests.
10.3 Uninterruptible Power Supply As a further precaution, the Central Laboratory keeps some major instrumentation connected to individual Uninterruptible Power Supply (UPS) units which provide line conditioning and backup power.
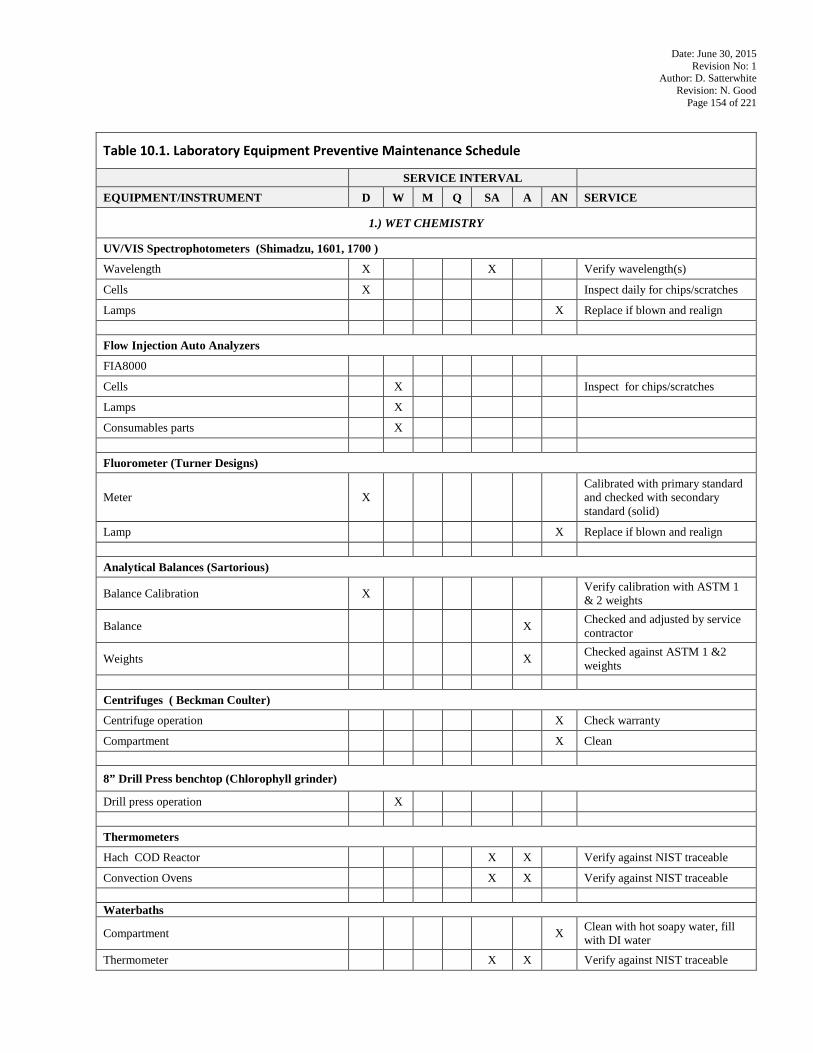
Date: June 30, 2015 Revision No: 1
Author: D. Satterwhite Revision: N. Good
Page 154 of 221
Table 10.1. Laboratory Equipment Preventive Maintenance Schedule SERVICE INTERVAL
EQUIPMENT/INSTRUMENT D W M Q SA A AN SERVICE
1.) WET CHEMISTRY
UV/VIS Spectrophotometers (Shimadzu, 1601, 1700 )
Wavelength X X Verify wavelength(s)
Cells X Inspect daily for chips/scratches
Lamps X Replace if blown and realign Flow Injection Auto Analyzers
FIA8000
Cells X Inspect for chips/scratches
Lamps X
Consumables parts X
Fluorometer (Turner Designs)
Meter X Calibrated with primary standard and checked with secondary standard (solid)
Lamp X Replace if blown and realign Analytical Balances (Sartorious)
Balance Calibration X Verify calibration with ASTM 1 & 2 weights
Balance X Checked and adjusted by service contractor
Weights X Checked against ASTM 1 &2 weights
Centrifuges ( Beckman Coulter)
Centrifuge operation X Check warranty
Compartment X Clean
8” Drill Press benchtop (Chlorophyll grinder)
Drill press operation X
Thermometers
Hach COD Reactor X X Verify against NIST traceable
Convection Ovens X X Verify against NIST traceable Waterbaths
Compartment X Clean with hot soapy water, fill with DI water
Thermometer X X Verify against NIST traceable
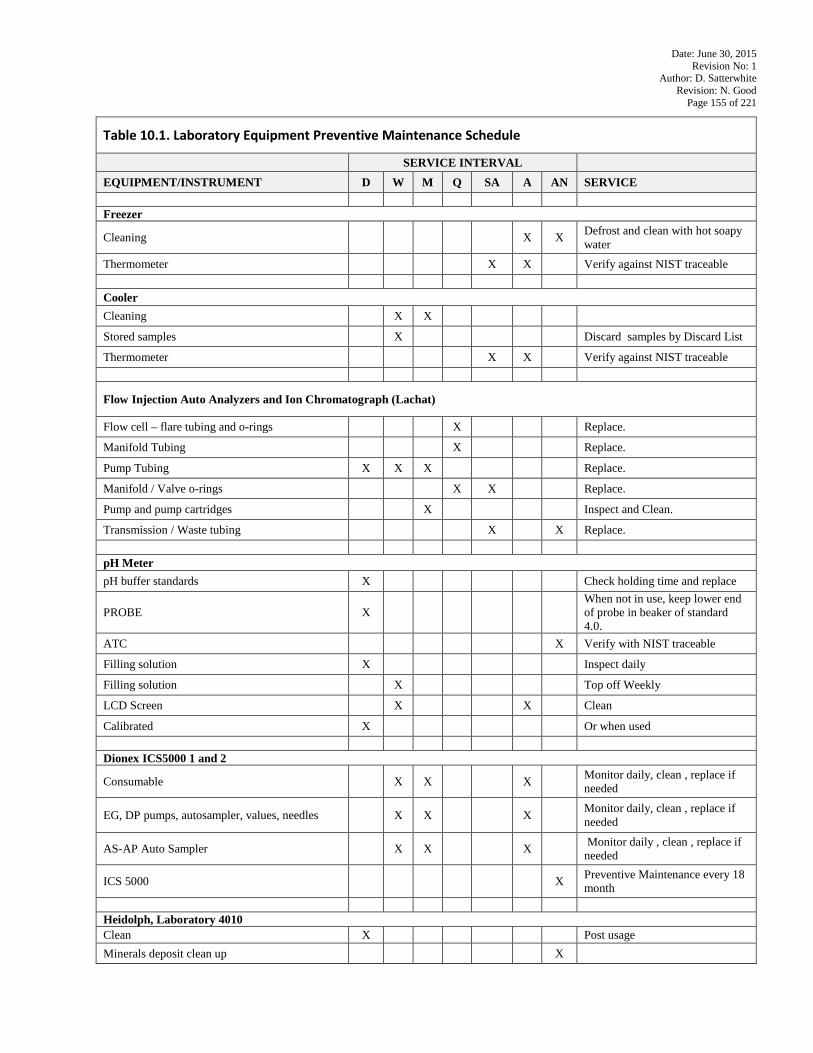
Date: June 30, 2015 Revision No: 1
Author: D. Satterwhite Revision: N. Good
Page 155 of 221
Table 10.1. Laboratory Equipment Preventive Maintenance Schedule SERVICE INTERVAL
EQUIPMENT/INSTRUMENT D W M Q SA A AN SERVICE Freezer
Cleaning X X Defrost and clean with hot soapy water
Thermometer X X Verify against NIST traceable Cooler Cleaning X X
Stored samples X Discard samples by Discard List
Thermometer X X Verify against NIST traceable
Flow Injection Auto Analyzers and Ion Chromatograph (Lachat)
Flow cell – flare tubing and o-rings X Replace.
Manifold Tubing X Replace.
Pump Tubing X X X Replace.
Manifold / Valve o-rings X X Replace.
Pump and pump cartridges X Inspect and Clean.
Transmission / Waste tubing X X Replace. pH Meter pH buffer standards X Check holding time and replace
PROBE X When not in use, keep lower end of probe in beaker of standard 4.0.
ATC X Verify with NIST traceable
Filling solution X Inspect daily
Filling solution X Top off Weekly
LCD Screen X X Clean
Calibrated X Or when used Dionex ICS5000 1 and 2
Consumable X X X Monitor daily, clean , replace if needed
EG, DP pumps, autosampler, values, needles X X X Monitor daily, clean , replace if needed
AS-AP Auto Sampler X X X Monitor daily , clean , replace if needed
ICS 5000 X Preventive Maintenance every 18 month
Heidolph, Laboratory 4010 Clean X Post usage Minerals deposit clean up X
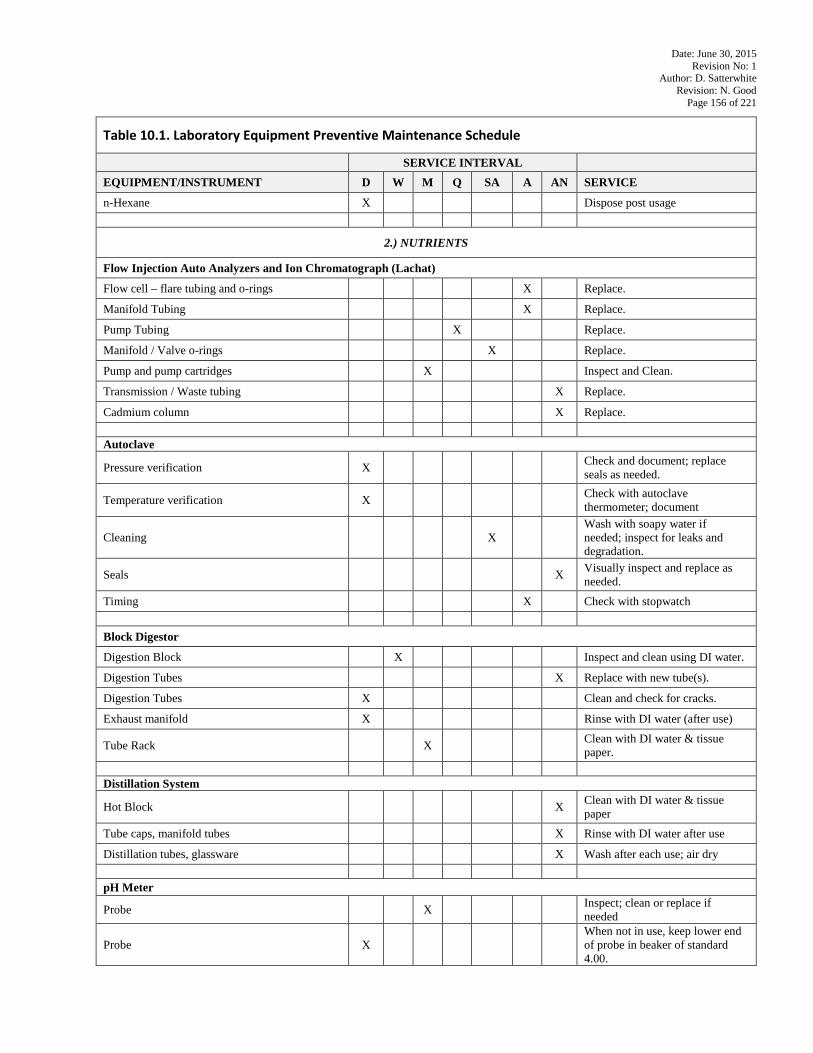
Date: June 30, 2015 Revision No: 1
Author: D. Satterwhite Revision: N. Good
Page 156 of 221
Table 10.1. Laboratory Equipment Preventive Maintenance Schedule SERVICE INTERVAL
EQUIPMENT/INSTRUMENT D W M Q SA A AN SERVICE
n-Hexane X Dispose post usage
2.) NUTRIENTS
Flow Injection Auto Analyzers and Ion Chromatograph (Lachat)
Flow cell – flare tubing and o-rings X Replace.
Manifold Tubing X Replace.
Pump Tubing X Replace.
Manifold / Valve o-rings X Replace.
Pump and pump cartridges X Inspect and Clean.
Transmission / Waste tubing X Replace.
Cadmium column X Replace. Autoclave
Pressure verification X Check and document; replace seals as needed.
Temperature verification X Check with autoclave thermometer; document
Cleaning X Wash with soapy water if needed; inspect for leaks and degradation.
Seals X Visually inspect and replace as needed.
Timing X Check with stopwatch Block Digestor
Digestion Block X Inspect and clean using DI water.
Digestion Tubes X Replace with new tube(s).
Digestion Tubes X Clean and check for cracks.
Exhaust manifold X Rinse with DI water (after use)
Tube Rack X Clean with DI water & tissue paper.
Distillation System
Hot Block X Clean with DI water & tissue paper
Tube caps, manifold tubes X Rinse with DI water after use
Distillation tubes, glassware X Wash after each use; air dry pH Meter
Probe X Inspect; clean or replace if needed
Probe X When not in use, keep lower end of probe in beaker of standard 4.00.
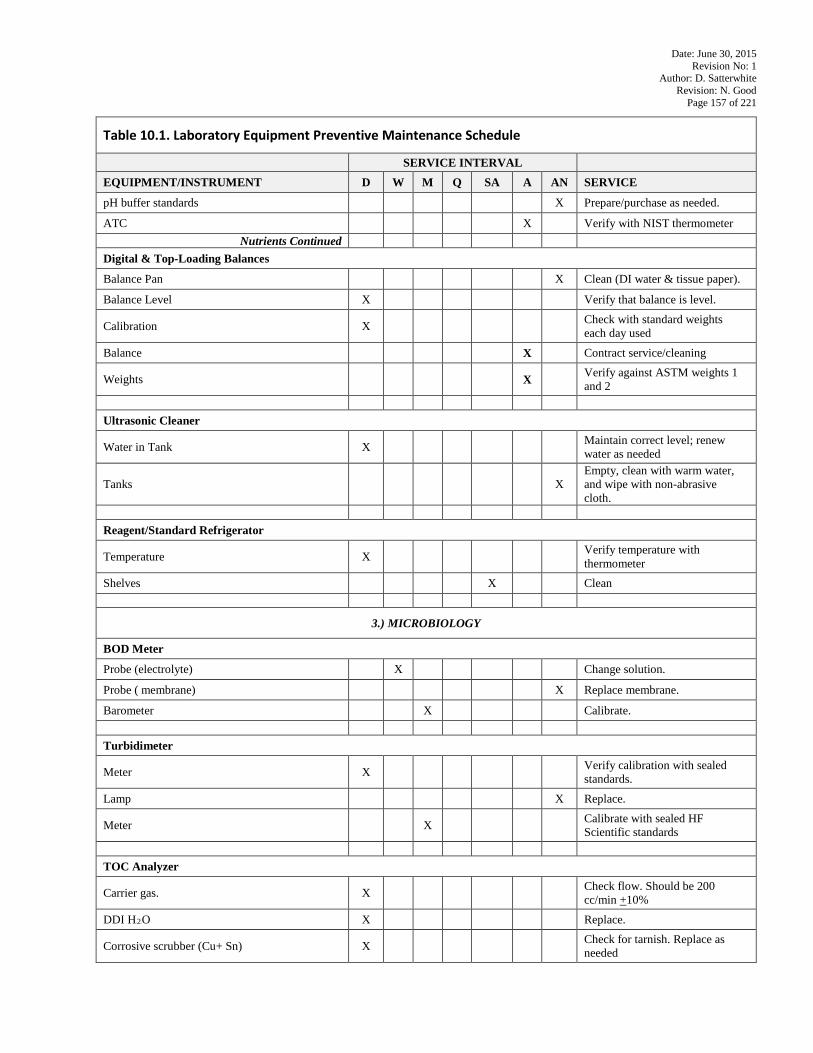
Date: June 30, 2015 Revision No: 1
Author: D. Satterwhite Revision: N. Good
Page 157 of 221
Table 10.1. Laboratory Equipment Preventive Maintenance Schedule SERVICE INTERVAL
EQUIPMENT/INSTRUMENT D W M Q SA A AN SERVICE
pH buffer standards X Prepare/purchase as needed.
ATC X Verify with NIST thermometer Nutrients Continued
Digital & Top-Loading Balances
Balance Pan X Clean (DI water & tissue paper).
Balance Level X Verify that balance is level.
Calibration X Check with standard weights each day used
Balance X Contract service/cleaning
Weights X Verify against ASTM weights 1 and 2
Ultrasonic Cleaner
Water in Tank X Maintain correct level; renew water as needed
Tanks X Empty, clean with warm water, and wipe with non-abrasive cloth.
Reagent/Standard Refrigerator
Temperature X Verify temperature with thermometer
Shelves X Clean
3.) MICROBIOLOGY
BOD Meter
Probe (electrolyte) X Change solution.
Probe ( membrane) X Replace membrane.
Barometer X Calibrate. Turbidimeter
Meter X Verify calibration with sealed standards.
Lamp X Replace.
Meter X Calibrate with sealed HF Scientific standards
TOC Analyzer
Carrier gas. X Check flow. Should be 200 cc/min +10%
DDI HR2RO X Replace.
Corrosive scrubber (Cu+ Sn) X Check for tarnish. Replace as needed
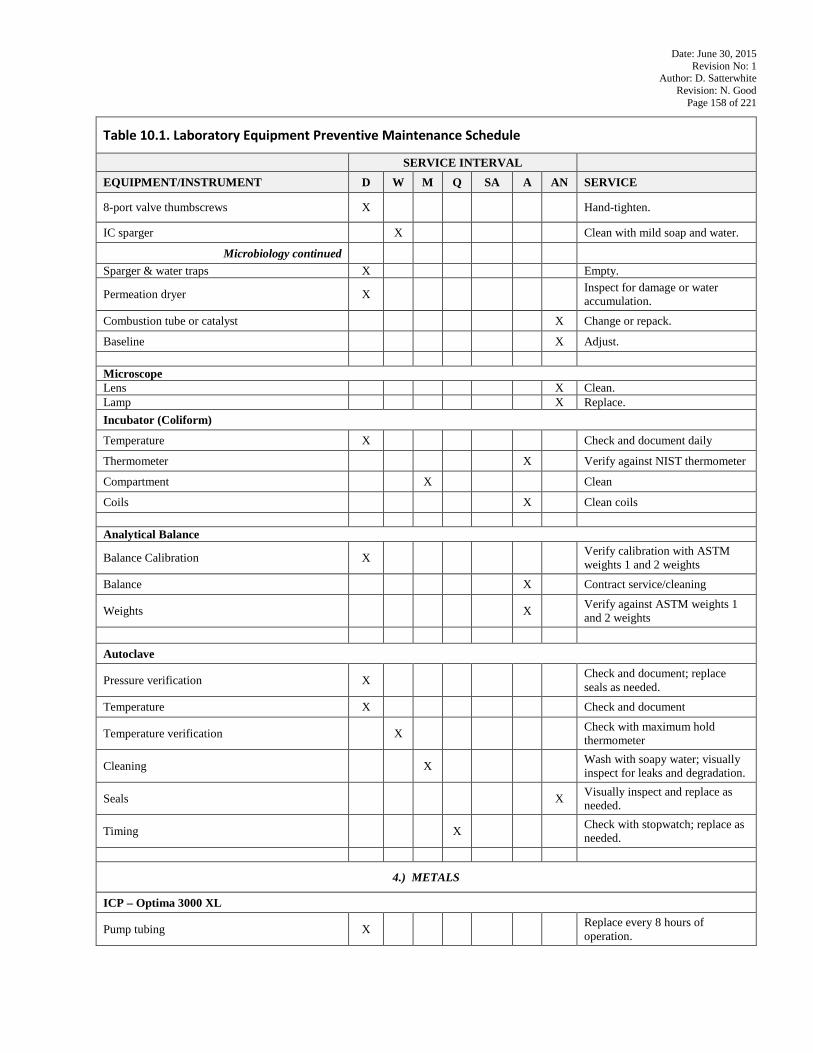
Date: June 30, 2015 Revision No: 1
Author: D. Satterwhite Revision: N. Good
Page 158 of 221
Table 10.1. Laboratory Equipment Preventive Maintenance Schedule SERVICE INTERVAL
EQUIPMENT/INSTRUMENT D W M Q SA A AN SERVICE
8-port valve thumbscrews X Hand-tighten.
IC sparger X Clean with mild soap and water.
Microbiology continued Sparger & water traps X Empty.
Permeation dryer X Inspect for damage or water accumulation.
Combustion tube or catalyst X Change or repack.
Baseline X Adjust. Microscope Lens X Clean. Lamp X Replace. Incubator (Coliform)
Temperature X Check and document daily
Thermometer X Verify against NIST thermometer
Compartment X Clean
Coils X Clean coils Analytical Balance
Balance Calibration X Verify calibration with ASTM weights 1 and 2 weights
Balance X Contract service/cleaning
Weights X Verify against ASTM weights 1 and 2 weights
Autoclave
Pressure verification X Check and document; replace seals as needed.
Temperature X Check and document
Temperature verification X Check with maximum hold thermometer
Cleaning X Wash with soapy water; visually inspect for leaks and degradation.
Seals X Visually inspect and replace as needed.
Timing X Check with stopwatch; replace as needed.
4.) METALS
ICP – Optima 3000 XL
Pump tubing X Replace every 8 hours of operation.
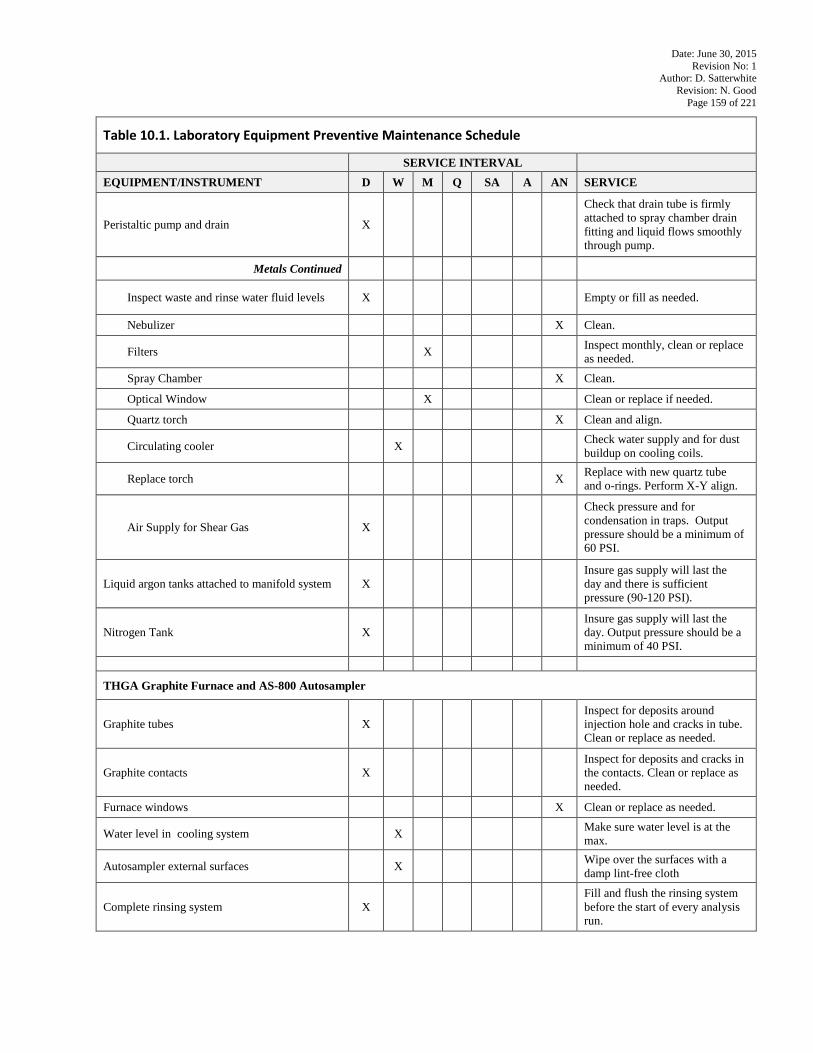
Date: June 30, 2015 Revision No: 1
Author: D. Satterwhite Revision: N. Good
Page 159 of 221
Table 10.1. Laboratory Equipment Preventive Maintenance Schedule SERVICE INTERVAL
EQUIPMENT/INSTRUMENT D W M Q SA A AN SERVICE
Peristaltic pump and drain X Check that drain tube is firmly attached to spray chamber drain fitting and liquid flows smoothly through pump.
Metals Continued
Inspect waste and rinse water fluid levels X Empty or fill as needed.
Nebulizer X Clean.
Filters X Inspect monthly, clean or replace as needed.
Spray Chamber X Clean.
Optical Window X Clean or replace if needed.
Quartz torch X Clean and align.
Circulating cooler X Check water supply and for dust buildup on cooling coils.
Replace torch X Replace with new quartz tube and o-rings. Perform X-Y align.
Air Supply for Shear Gas X Check pressure and for condensation in traps. Output pressure should be a minimum of 60 PSI.
Liquid argon tanks attached to manifold system X Insure gas supply will last the day and there is sufficient pressure (90-120 PSI).
Nitrogen Tank X Insure gas supply will last the day. Output pressure should be a minimum of 40 PSI.
THGA Graphite Furnace and AS-800 Autosampler
Graphite tubes X Inspect for deposits around injection hole and cracks in tube. Clean or replace as needed.
Graphite contacts X Inspect for deposits and cracks in the contacts. Clean or replace as needed.
Furnace windows X Clean or replace as needed.
Water level in cooling system X Make sure water level is at the max.
Autosampler external surfaces X Wipe over the surfaces with a damp lint-free cloth
Complete rinsing system X Fill and flush the rinsing system before the start of every analysis run.
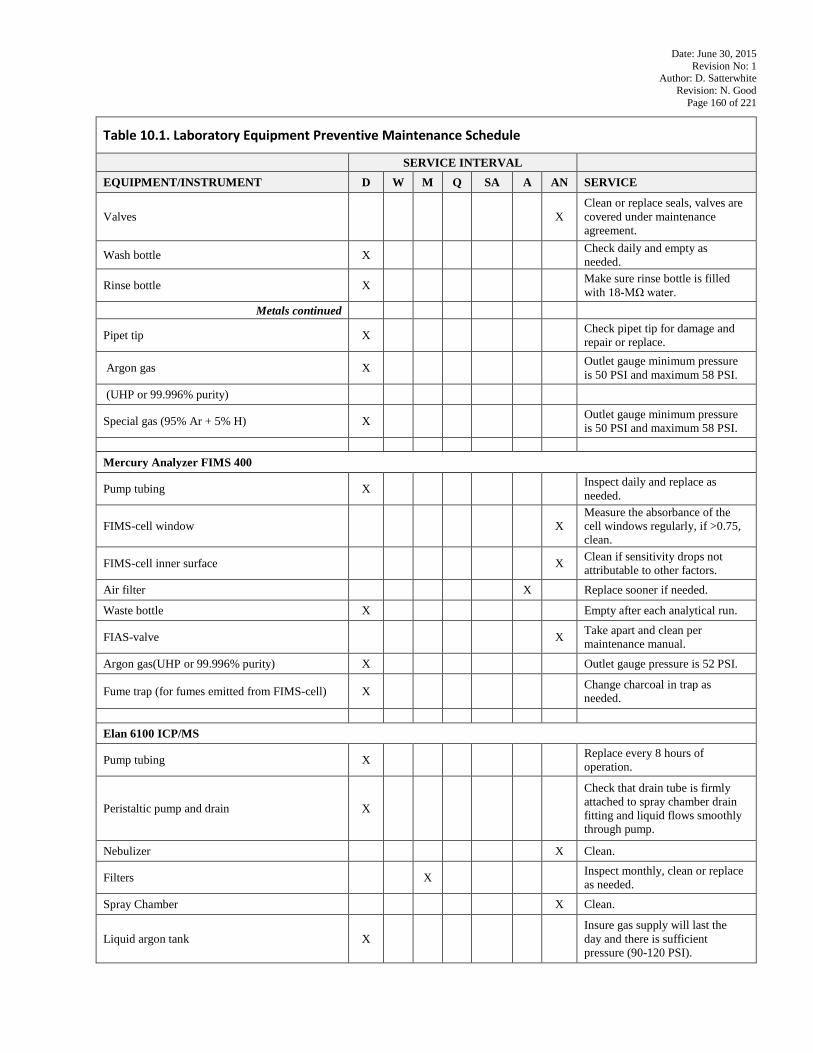
Date: June 30, 2015 Revision No: 1
Author: D. Satterwhite Revision: N. Good
Page 160 of 221
Table 10.1. Laboratory Equipment Preventive Maintenance Schedule SERVICE INTERVAL
EQUIPMENT/INSTRUMENT D W M Q SA A AN SERVICE
Valves X Clean or replace seals, valves are covered under maintenance agreement.
Wash bottle X Check daily and empty as needed.
Rinse bottle X Make sure rinse bottle is filled with 18-ΜΩ water.
Metals continued
Pipet tip X Check pipet tip for damage and repair or replace.
Argon gas X Outlet gauge minimum pressure is 50 PSI and maximum 58 PSI.
(UHP or 99.996% purity)
Special gas (95% Ar + 5% H) X Outlet gauge minimum pressure is 50 PSI and maximum 58 PSI.
Mercury Analyzer FIMS 400
Pump tubing X Inspect daily and replace as needed.
FIMS-cell window X Measure the absorbance of the cell windows regularly, if >0.75, clean.
FIMS-cell inner surface X Clean if sensitivity drops not attributable to other factors.
Air filter X Replace sooner if needed.
Waste bottle X Empty after each analytical run.
FIAS-valve X Take apart and clean per maintenance manual.
Argon gas(UHP or 99.996% purity) X Outlet gauge pressure is 52 PSI.
Fume trap (for fumes emitted from FIMS-cell) X Change charcoal in trap as needed.
Elan 6100 ICP/MS
Pump tubing X Replace every 8 hours of operation.
Peristaltic pump and drain X Check that drain tube is firmly attached to spray chamber drain fitting and liquid flows smoothly through pump.
Nebulizer X Clean.
Filters X Inspect monthly, clean or replace as needed.
Spray Chamber X Clean.
Liquid argon tank X Insure gas supply will last the day and there is sufficient pressure (90-120 PSI).
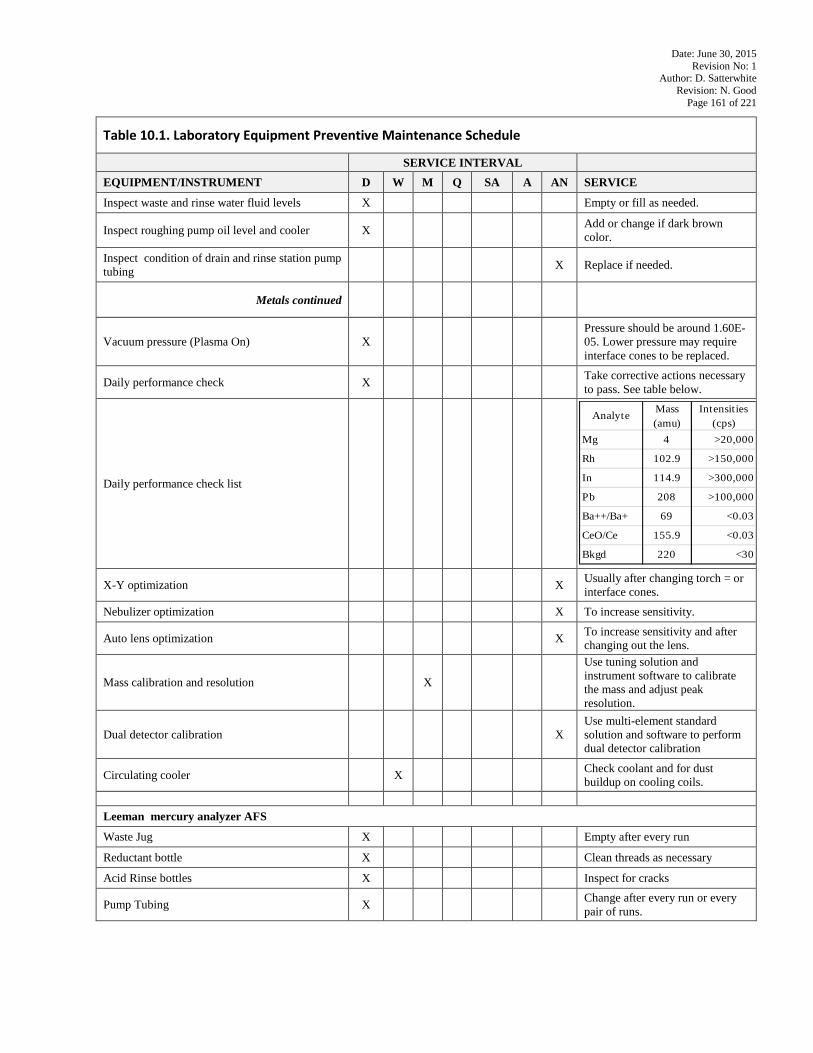
Date: June 30, 2015 Revision No: 1
Author: D. Satterwhite Revision: N. Good
Page 161 of 221
Table 10.1. Laboratory Equipment Preventive Maintenance Schedule SERVICE INTERVAL
EQUIPMENT/INSTRUMENT D W M Q SA A AN SERVICE
Inspect waste and rinse water fluid levels X Empty or fill as needed.
Inspect roughing pump oil level and cooler X Add or change if dark brown color.
Inspect condition of drain and rinse station pump tubing
X Replace if needed.
Metals continued
Vacuum pressure (Plasma On) X Pressure should be around 1.60E-05. Lower pressure may require interface cones to be replaced.
Daily performance check X Take corrective actions necessary to pass. See table below.
Daily performance check list
X-Y optimization X Usually after changing torch = or interface cones.
Nebulizer optimization X To increase sensitivity.
Auto lens optimization X To increase sensitivity and after changing out the lens.
Mass calibration and resolution X Use tuning solution and instrument software to calibrate the mass and adjust peak resolution.
Dual detector calibration X Use multi-element standard solution and software to perform dual detector calibration
Circulating cooler X Check coolant and for dust buildup on cooling coils.
Leeman mercury analyzer AFS
Waste Jug X Empty after every run
Reductant bottle X Clean threads as necessary
Acid Rinse bottles X Inspect for cracks
Pump Tubing X Change after every run or every pair of runs.
Analyte Mass (amu)
Intensities (cps)
Mg 4 >20,000
Rh 102.9 >150,000
In 114.9 >300,000
Pb 208 >100,000
Ba++/Ba+ 69 <0.03
CeO/Ce 155.9 <0.03
Bkgd 220 <30
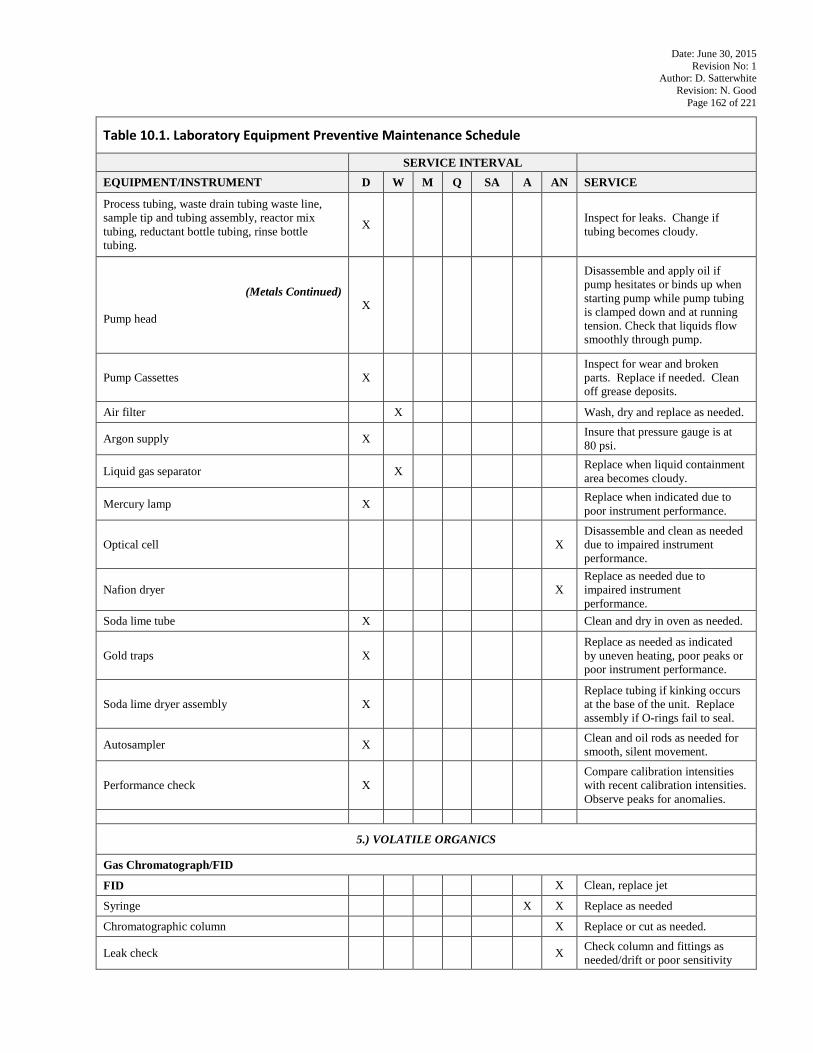
Date: June 30, 2015 Revision No: 1
Author: D. Satterwhite Revision: N. Good
Page 162 of 221
Table 10.1. Laboratory Equipment Preventive Maintenance Schedule SERVICE INTERVAL
EQUIPMENT/INSTRUMENT D W M Q SA A AN SERVICE
Process tubing, waste drain tubing waste line, sample tip and tubing assembly, reactor mix tubing, reductant bottle tubing, rinse bottle tubing.
X Inspect for leaks. Change if tubing becomes cloudy.
(Metals Continued)
Pump head X
Disassemble and apply oil if pump hesitates or binds up when starting pump while pump tubing is clamped down and at running tension. Check that liquids flow smoothly through pump.
Pump Cassettes X Inspect for wear and broken parts. Replace if needed. Clean off grease deposits.
Air filter X Wash, dry and replace as needed.
Argon supply X Insure that pressure gauge is at 80 psi.
Liquid gas separator X Replace when liquid containment area becomes cloudy.
Mercury lamp X Replace when indicated due to poor instrument performance.
Optical cell X Disassemble and clean as needed due to impaired instrument performance.
Nafion dryer X Replace as needed due to impaired instrument performance.
Soda lime tube X Clean and dry in oven as needed.
Gold traps X Replace as needed as indicated by uneven heating, poor peaks or poor instrument performance.
Soda lime dryer assembly X Replace tubing if kinking occurs at the base of the unit. Replace assembly if O-rings fail to seal.
Autosampler X Clean and oil rods as needed for smooth, silent movement.
Performance check X Compare calibration intensities with recent calibration intensities. Observe peaks for anomalies.
5.) VOLATILE ORGANICS
Gas Chromatograph/FID
FID X Clean, replace jet
Syringe X X Replace as needed
Chromatographic column X Replace or cut as needed.
Leak check X Check column and fittings as needed/drift or poor sensitivity
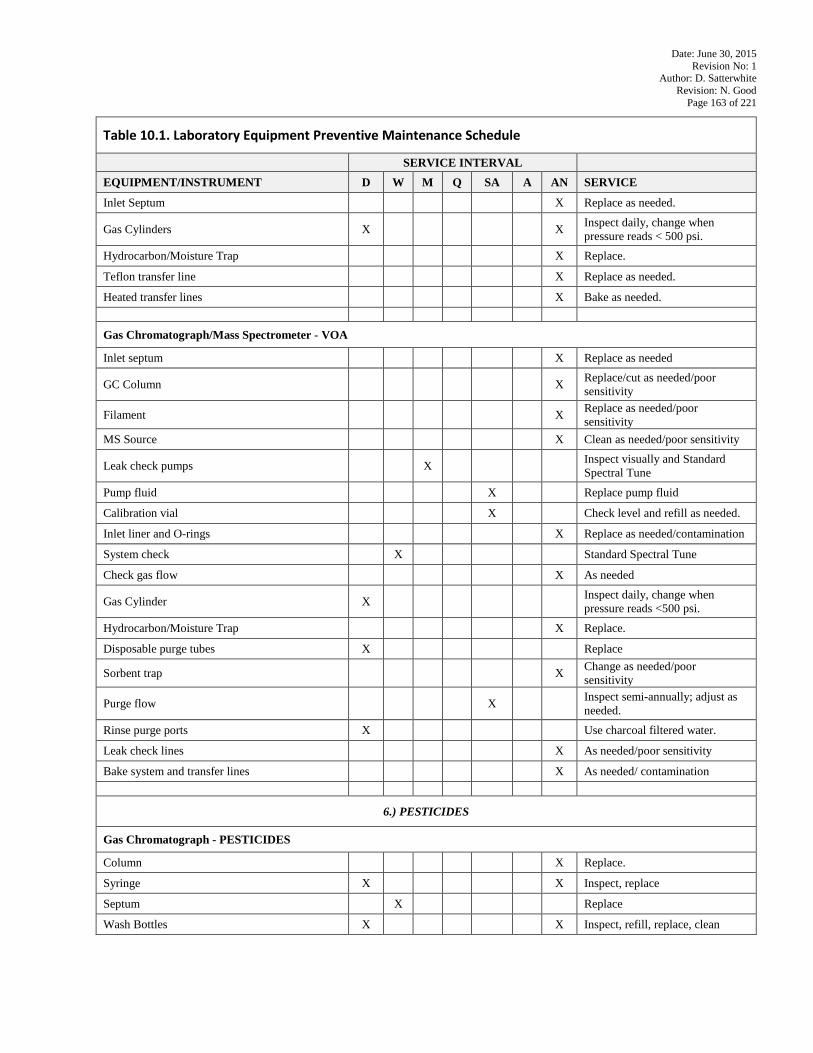
Date: June 30, 2015 Revision No: 1
Author: D. Satterwhite Revision: N. Good
Page 163 of 221
Table 10.1. Laboratory Equipment Preventive Maintenance Schedule SERVICE INTERVAL
EQUIPMENT/INSTRUMENT D W M Q SA A AN SERVICE
Inlet Septum X Replace as needed.
Gas Cylinders X X Inspect daily, change when pressure reads < 500 psi.
Hydrocarbon/Moisture Trap X Replace.
Teflon transfer line X Replace as needed.
Heated transfer lines X Bake as needed.
Gas Chromatograph/Mass Spectrometer - VOA
Inlet septum X Replace as needed
GC Column X Replace/cut as needed/poor sensitivity
Filament X Replace as needed/poor sensitivity
MS Source X Clean as needed/poor sensitivity
Leak check pumps X Inspect visually and Standard Spectral Tune
Pump fluid X Replace pump fluid
Calibration vial X Check level and refill as needed.
Inlet liner and O-rings X Replace as needed/contamination
System check X Standard Spectral Tune
Check gas flow X As needed
Gas Cylinder X Inspect daily, change when pressure reads <500 psi.
Hydrocarbon/Moisture Trap X Replace.
Disposable purge tubes X Replace
Sorbent trap X Change as needed/poor sensitivity
Purge flow X Inspect semi-annually; adjust as needed.
Rinse purge ports X Use charcoal filtered water.
Leak check lines X As needed/poor sensitivity
Bake system and transfer lines X As needed/ contamination
6.) PESTICIDES
Gas Chromatograph - PESTICIDES
Column X Replace.
Syringe X X Inspect, replace
Septum X Replace
Wash Bottles X X Inspect, refill, replace, clean

Date: June 30, 2015 Revision No: 1
Author: D. Satterwhite Revision: N. Good
Page 164 of 221
Table 10.1. Laboratory Equipment Preventive Maintenance Schedule SERVICE INTERVAL
EQUIPMENT/INSTRUMENT D W M Q SA A AN SERVICE
ECD X Replace or have serviced as needed due to impaired instrument performance
FPD X Replace photomultiplier tubes as needed due to impaired instrument performance.
NPD X Replace beads as needed due to impaired instrument performance.
Gas Cylinder X Inspect daily, change when pressure reads < 300 psi.
Check gas leaks X After column change or signs of leak
Hydrocarbon/Moisture Trap X Replace.
Inlet liner X Replace
Automated Sample Processing System (GPC)
Column X Re-solvate.
Gas Cylinder X Inspect daily, change when pressure reads <300psi.
Methylene Chloride reservoir X Add solvent.
6.)SEMIVOLATILE ORGANICS
Gas Chromatographs - SVOA
Column X X Cut off 1 foot or Replace.
Septum X X Replace
Gas Cylinder X X Inspect gauge change when pressure reads < 200 psi.
Hydrocarbon/Moisture Trap X Replace.
Inlet, inlet liner X X Clean, replace and clean
FID X X Clean, replace jet
Wash Bottles X X Inspect, refill, replace, clean
Syringe X X Inspect, replace
Check gas leaks X After column change
Mass Spectrometer - SVOA
Check DFTPP.u tune setting with cal gas snap shot X Check base line operation, air
leaks, tighten vacuum system
Vacuum Pump X X X Check oil level, change oil
Ion source X X Check, Clean when performance not in controls
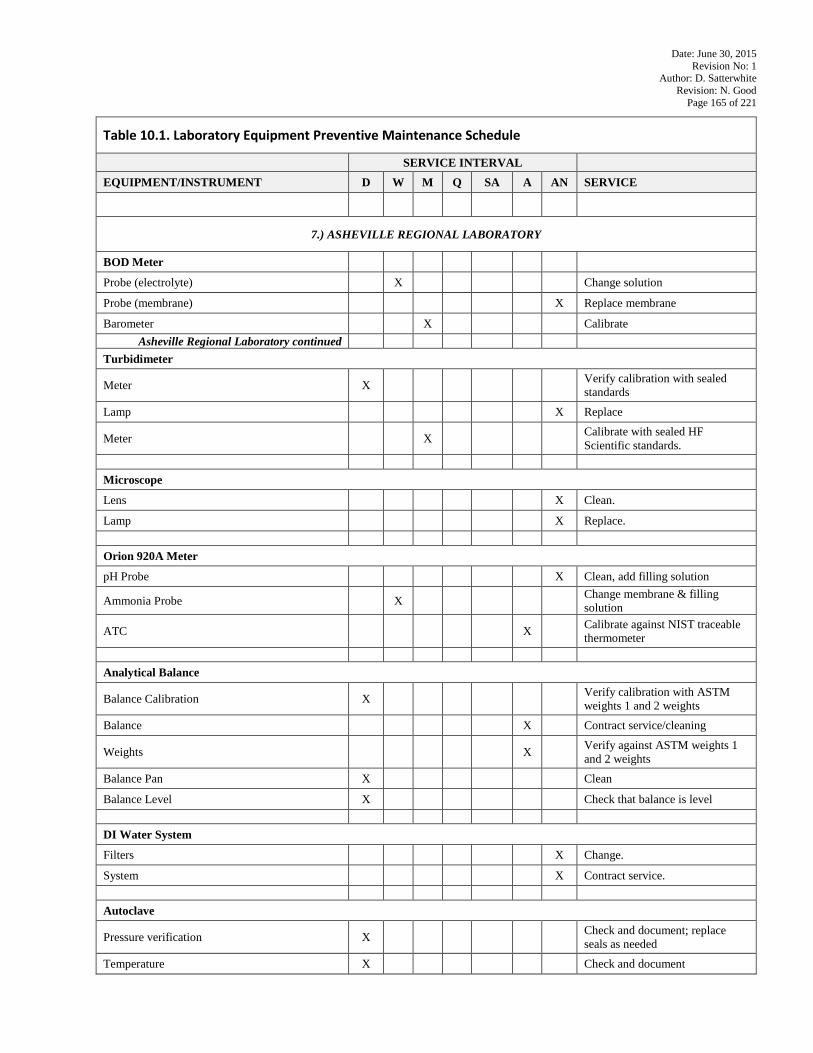
Date: June 30, 2015 Revision No: 1
Author: D. Satterwhite Revision: N. Good
Page 165 of 221
Table 10.1. Laboratory Equipment Preventive Maintenance Schedule SERVICE INTERVAL
EQUIPMENT/INSTRUMENT D W M Q SA A AN SERVICE
7.) ASHEVILLE REGIONAL LABORATORY
BOD Meter
Probe (electrolyte) X Change solution
Probe (membrane) X Replace membrane
Barometer X Calibrate Asheville Regional Laboratory continued
Turbidimeter
Meter X Verify calibration with sealed standards
Lamp X Replace
Meter X Calibrate with sealed HF Scientific standards.
Microscope
Lens X Clean.
Lamp X Replace. Orion 920A Meter
pH Probe X Clean, add filling solution
Ammonia Probe X Change membrane & filling solution
ATC X Calibrate against NIST traceable thermometer
Analytical Balance
Balance Calibration X Verify calibration with ASTM weights 1 and 2 weights
Balance X Contract service/cleaning
Weights X Verify against ASTM weights 1 and 2 weights
Balance Pan X Clean
Balance Level X Check that balance is level DI Water System
Filters X Change.
System X Contract service. Autoclave
Pressure verification X Check and document; replace seals as needed
Temperature X Check and document
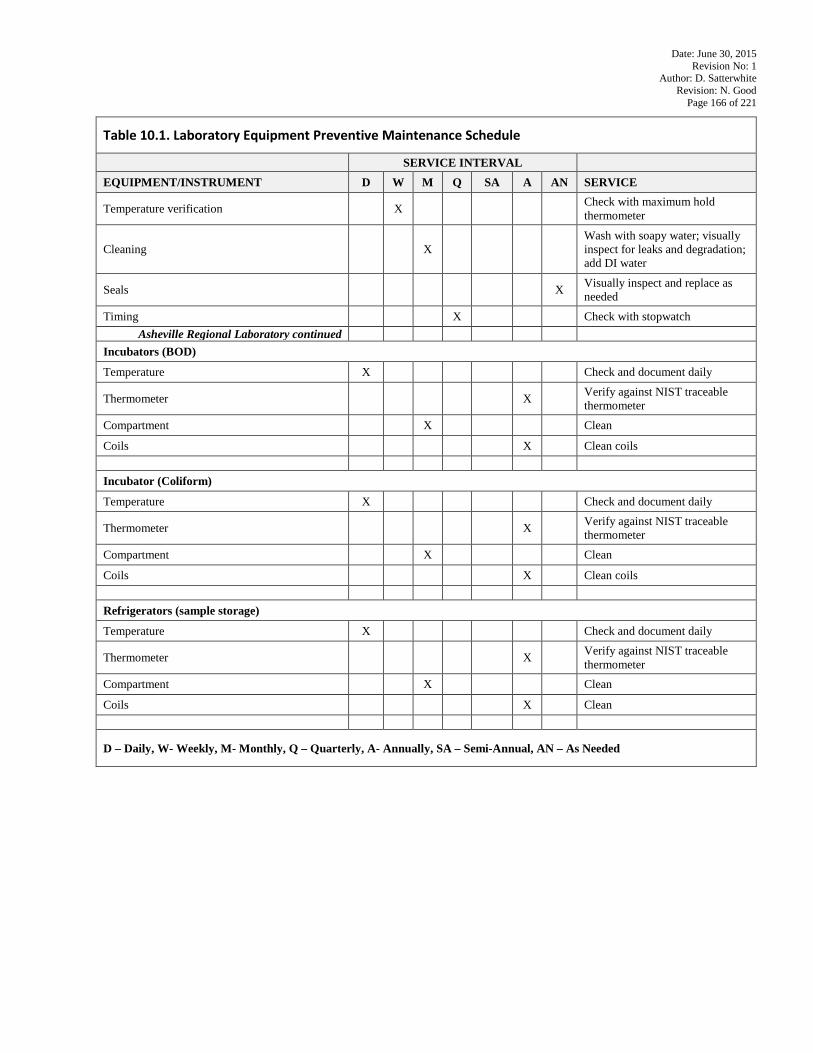
Date: June 30, 2015 Revision No: 1
Author: D. Satterwhite Revision: N. Good
Page 166 of 221
Table 10.1. Laboratory Equipment Preventive Maintenance Schedule SERVICE INTERVAL
EQUIPMENT/INSTRUMENT D W M Q SA A AN SERVICE
Temperature verification X Check with maximum hold thermometer
Cleaning X Wash with soapy water; visually inspect for leaks and degradation; add DI water
Seals X Visually inspect and replace as needed
Timing X Check with stopwatch Asheville Regional Laboratory continued
Incubators (BOD)
Temperature X Check and document daily
Thermometer X Verify against NIST traceable thermometer
Compartment X Clean
Coils X Clean coils Incubator (Coliform)
Temperature X Check and document daily
Thermometer X Verify against NIST traceable thermometer
Compartment X Clean
Coils X Clean coils Refrigerators (sample storage)
Temperature X Check and document daily
Thermometer X Verify against NIST traceable thermometer
Compartment X Clean
Coils X Clean
D – Daily, W- Weekly, M- Monthly, Q – Quarterly, A- Annually, SA – Semi-Annual, AN – As Needed
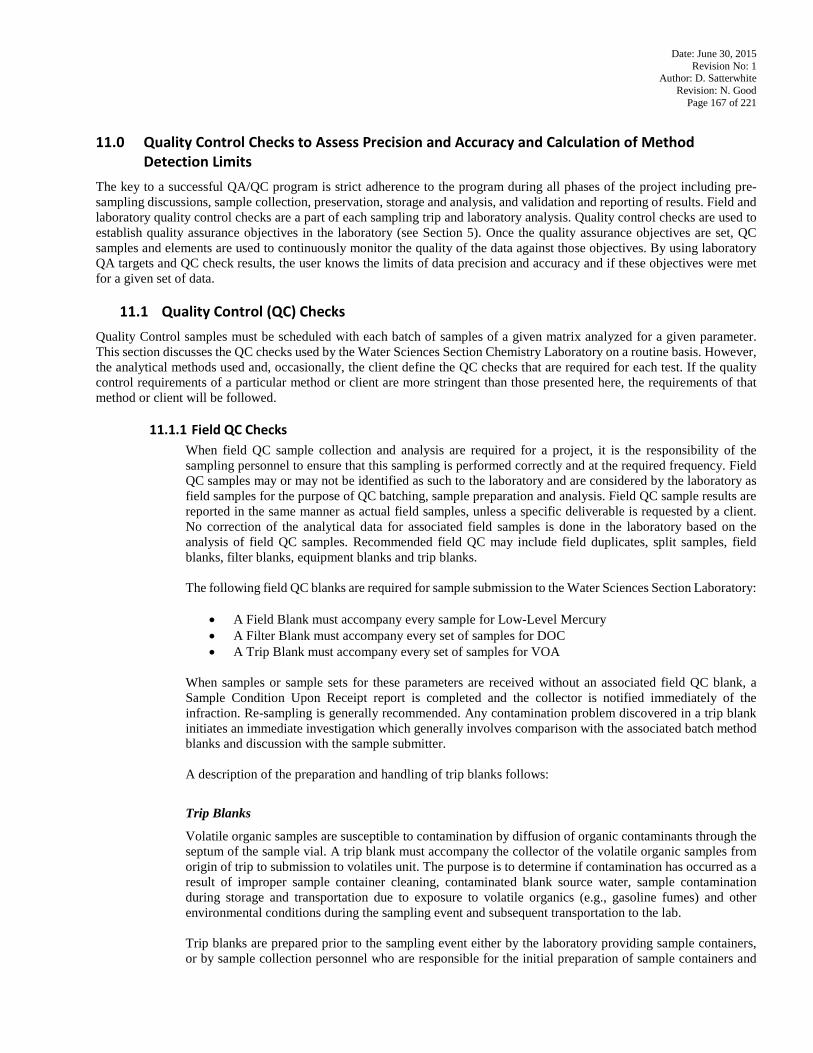
Date: June 30, 2015 Revision No: 1
Author: D. Satterwhite Revision: N. Good
Page 167 of 221
11.0 Quality Control Checks to Assess Precision and Accuracy and Calculation of Method
Detection Limits The key to a successful QA/QC program is strict adherence to the program during all phases of the project including pre-sampling discussions, sample collection, preservation, storage and analysis, and validation and reporting of results. Field and laboratory quality control checks are a part of each sampling trip and laboratory analysis. Quality control checks are used to establish quality assurance objectives in the laboratory (see Section 5). Once the quality assurance objectives are set, QC samples and elements are used to continuously monitor the quality of the data against those objectives. By using laboratory QA targets and QC check results, the user knows the limits of data precision and accuracy and if these objectives were met for a given set of data.
11.1 Quality Control (QC) Checks Quality Control samples must be scheduled with each batch of samples of a given matrix analyzed for a given parameter. This section discusses the QC checks used by the Water Sciences Section Chemistry Laboratory on a routine basis. However, the analytical methods used and, occasionally, the client define the QC checks that are required for each test. If the quality control requirements of a particular method or client are more stringent than those presented here, the requirements of that method or client will be followed.
11.1.1 Field QC Checks When field QC sample collection and analysis are required for a project, it is the responsibility of the sampling personnel to ensure that this sampling is performed correctly and at the required frequency. Field QC samples may or may not be identified as such to the laboratory and are considered by the laboratory as field samples for the purpose of QC batching, sample preparation and analysis. Field QC sample results are reported in the same manner as actual field samples, unless a specific deliverable is requested by a client. No correction of the analytical data for associated field samples is done in the laboratory based on the analysis of field QC samples. Recommended field QC may include field duplicates, split samples, field blanks, filter blanks, equipment blanks and trip blanks. The following field QC blanks are required for sample submission to the Water Sciences Section Laboratory:
• A Field Blank must accompany every sample for Low-Level Mercury • A Filter Blank must accompany every set of samples for DOC • A Trip Blank must accompany every set of samples for VOA
When samples or sample sets for these parameters are received without an associated field QC blank, a Sample Condition Upon Receipt report is completed and the collector is notified immediately of the infraction. Re-sampling is generally recommended. Any contamination problem discovered in a trip blank initiates an immediate investigation which generally involves comparison with the associated batch method blanks and discussion with the sample submitter. A description of the preparation and handling of trip blanks follows:
Trip Blanks
Volatile organic samples are susceptible to contamination by diffusion of organic contaminants through the septum of the sample vial. A trip blank must accompany the collector of the volatile organic samples from origin of trip to submission to volatiles unit. The purpose is to determine if contamination has occurred as a result of improper sample container cleaning, contaminated blank source water, sample contamination during storage and transportation due to exposure to volatile organics (e.g., gasoline fumes) and other environmental conditions during the sampling event and subsequent transportation to the lab. Trip blanks are prepared prior to the sampling event either by the laboratory providing sample containers, or by sample collection personnel who are responsible for the initial preparation of sample containers and
Date: June 30, 2015 Revision No: 1
Author: D. Satterwhite Revision: N. Good
Page 168 of 221
field equipment. Trip blanks are prepared by filling three (3) 40-mL VOA vials (with no headspace) with organic-free water. Any appropriate preservatives must be added at the time that the blanks are prepared. The sample containers are sealed, labeled appropriately, and transported to the field in the same manner as the sample vials. These blanks are NOT to be opened in the field. They are to be transferred to the sample cooler and transported with the samples to the laboratory. Trip blanks are prepared for each cooler expected to be used to store and transport VOA samples.
11.1.2 Laboratory QC Checks
Laboratory performance QC is required to ensure the laboratory systems (instrumentation, samples preparation, analysis, data reduction, etc.) are operating within acceptable QC guidelines during data generation as required to meet method requirements or the client's objectives. Determination of the validity of sample results is based on the acceptance criteria being met by the control samples. The acceptance criteria for each type of control samples are defined in the appropriate SOP. These acceptance criteria are per method requirements or calculated annually from historical data. Laboratory QC samples consist of method blanks, instrument blanks, laboratory control samples and calibration verification samples. In addition to laboratory performance QC, matrix-specific QC is utilized to determine the effect of the sample matrix on the data being generated. Typically, this includes matrix spikes, matrix spike duplicates, sample duplicates and the use of surrogate compounds. A brief description of these QC checks is presented below.
Batch
Environmental samples which are prepared or analyzed together with the same process and personnel, using the same lot(s) of reagents. A preparation batch is composed of one to 20 environmental samples (may be more for Nutrients) of the same matrix, meeting the above-mentioned criteria and with a maximum time between the start of processing of the first and last sample in the batch to be 24 hours. An analytical batch is composed of prepared environmental samples (extracts, digestates or concentrates) or those samples not requiring preparation, which are analyzed together as a group using the same calibration curve or factor. An analytical batch can include samples originating from various environmental matrices and can exceed 20 samples.
Blind sample
A blind sample is a sample submitted for analysis with a composition known to the submitter. The analyst/laboratory may know the identity of the sample but not its composition. It is used to test the analyst's or laboratory's proficiency in the execution of the measurement process.
Calibration
To determine, by measurement or comparison with a standard, the correct value of each scale reading on a meter or other device, or the correct value for each setting of a control knob. The levels of the applied calibration standard should bracket the range of planned or expected sample measurements.
Initial Calibration Verification Standard
An Initial Calibration Verification Standard (ICV) is a second source standard analyzed immediately following calibration and indicates whether sample analysis can proceed. Generally, there should be less than a five to ten percent difference between the calculated and the true value, depending on the method.
Continuing Calibration Verification Standard (equivalent to Calibration Check Standard or CCC )
A Continuing Calibration Verification Standard (CCV) also referred to as CV, is an analytical standard that is reanalyzed with test samples to verify calibration of the analytical system. CCVs are usually mid-range standards that are analyzed at the beginning and end of an analytical run and after every 10 or 20 samples for large analytical runs. The acceptance criterion for the CCV varies per method and is defined in the analytical SOP. If the calculated value is greater than the criteria specified in the method or SOP, the measurement system is no longer in calibration and samples need to be reanalyzed.
Confirmation
Date: June 30, 2015 Revision No: 1
Author: D. Satterwhite Revision: N. Good
Page 169 of 221
A confirmation shall be performed to verify the compound identification when positive results are detected in a sample from a location that has not been previously tested by the laboratory. Such confirmations shall be performed on organic tests such as pesticides, acid herbicides or when recommended by the analytical test method except when the analysis involves the use of a mass spectrometer. When samples results are confirmed using two dissimilar columns or with two dissimilar detectors, the agreement between the quantitative results should be evaluated after the identification has been confirmed. Calculate the relative percent difference (RPD) between the results using the formula described in Section 12 where R1 and R2 are the results for the two columns and the vertical bars in the equation indicate the absolute value of the difference. Therefore, RPD is always a positive value. If one result is significantly higher (e.g., >40%), check the chromatograms of both sample and standards to see if an obviously overlapping peak is causing an erroneously high result. If no overlapping peaks are noted, examine the baseline parameters established by the instrument data system (or analyst) during peak integration. If no anomalies are noted, review the chromatographic conditions. If there is no evidence of chromatographic problems, report the lower result(s) and qualify the result(s) as estimated. This approach is taken (based on a recommendation made by EPA Region IV) because the higher concentration always has a higher likelihood of having been influenced by interferences. The data user should be advised of the disparity between the results of the two columns. The analyst will use his/her best professional judgment as to when to report the compound(s) as non-detect.
Method Blank (equivalent to a laboratory reagent blank or LRB)
The method blank is a QC sample that consists of all reagents specific to the method and is carried through every aspect of the procedure, including preparation, cleanup and analysis. The method blank is used to identify any interferences or contamination of the analytical system that may lead to the reporting of elevated analyte concentrations or false positive data. Potential sources of contamination include solvent, reagents, glassware, other sample processing hardware, or the laboratory environment. In general, the method blank is a volume of deionized laboratory water for inorganic water samples, well water for organic water samples, or Ottawa sand for soil/sediment samples, that is processed as a sample. The volume or weight of the method blank must be approximately equal to the sample volume or sample weight processed. A method blank shall be prepared with each group of samples processed. Method blanks are also referred to as laboratory reagent blanks. The source of contamination must be investigated and measures taken to correct, minimize or eliminate the problem if the blank contamination exceeds a concentration greater than 1/10 of the measured concentration of any sample in the associated sample batch. Any sample associated with the contaminated blank shall be reprocessed for analysis or the results reported with the appropriate data qualifier code.
Instrument Blank
The instrument blank is an unprocessed aliquot of reagent water used to monitor the contamination of the analytical system at the instrument. System contamination may lead to the reporting of elevated analyte concentrations or false positive data. The instrument blank does not undergo the entire analytical process and generally consist of an aliquot of the same reagent(s) used for a sample dilution. Instrument blanks are also referred to as continuing calibration blanks.
Laboratory control sample (equivalent to a laboratory fortified blank or LFB)
A laboratory control sample (LCS) is a sample matrix, free from the analytes of interest, spiked with verified known amounts of analytes from a source independent of the calibration standards or a material containing known and verified amounts of analytes. It is generally used to establish intra-laboratory or analyst specific precision and bias or to assess the performance of all or a portion of the measurement system. The fortified blank is analyzed exactly like a sample. Fortified blanks are used to obtain a recovery from the solution used to spike a matrix spike sample. Results are used to validate or reject matrix spike recovery results. A low or high sample matrix spike recovery can be justified if the fortified blank also shows a similar
Date: June 30, 2015 Revision No: 1
Author: D. Satterwhite Revision: N. Good
Page 170 of 221
bias and all other QC data is acceptable. This may indicate analyst error in the preparation of the spiking solution. If sample recovery results are outside control limits and the fortified blank recovery results are acceptable it is reasonable to assume a sample matrix effect is biasing results. Analysts may attempt to eliminate the interference or else flag the sample results with a sample qualifier code.
Matrix Spike (equivalent to Laboratory Fortified Matrix or LFM)
A matrix spike (MS) is an environmental sample to which known concentrations of target analytes have been added. MS samples are analyzed to evaluate the effect of the sample matrix on the analytical methodology. MS samples are generated by taking a separate aliquot of an actual client sample and spiking it with the selected target analyte(s) prior to sample extraction. The MS sample then undergoes the same extraction and analytical procedures as the unfortified client sample. Due to the potential variability of the matrix of each sample these results may have immediate bearing only on the specific sample spiked and not on all samples in the QC batch. If the mandated or requested test method does not specify the spiking components, the laboratory shall spike all reportable components to be reported in the LCS and MS. However, in cases where the components interfere with accurate assessment (such as simultaneously spiking chlordane, toxaphene and PCBs in Method 608), the test method has an extremely long list of components or components are incompatible, a representative number (at a minimum 10%) of the listed components may be used to control the test method. The selected components of each spiking mix shall represent all chemistries, elution patterns and masses, permit specified analytes and other client requested components. However, the laboratory will make every attempt to ensure that all reported components are used in the spike mixture within a two-year time period.
Matrix Spike Duplicate (equivalent to Laboratory Fortified Matrix Duplicate or LFMD)
A matrix spike duplicate (MSD) is a second aliquot of a sample that is spiked with the selected target analyte(s) and analyzed with the associated sample and MS sample. The results of the MS and MSD are used together to determine the effect of a matrix on the accuracy and precision of the analytical process. Due to the potential variability of the matrix of each sample, the MS/MSD results may have immediate bearing only on the specific sample spiked and not all samples in the QC batch.
Sample Duplicate
A sample duplicate is a second aliquot of an environmental sample taken from the same sample container that is processed identically with the first aliquot of that sample. That is, sample duplicates are processed as independent samples within the same QC batch. The results are compared to determine the sample homogeneity and the precision of the analytical process.
Surrogates
Surrogates are organic compounds that are similar in chemical composition and behavior to the target analytes but that are not normally found in environmental samples. Surrogate compounds must be added to all samples, standards, and blanks for all organic chromatography methods except when the matrix precludes its use or when a surrogate is not available. Poor surrogate recovery may indicate a problem with sample composition and shall be reported to the client whose sample produced poor recovery.
Tuning Solution
Tuning solutions are used to determine acceptable instrument performance prior to calibration and sample analysis for GC/MS analysis.
Post-Digestion Spike
A recommended quality control sample whenever a new or unusual sample matrix is encountered. The spike is added to the sample after digestion. It is a test for matrix interference (positive or negative bias). The spike addition should produce a minimum level of 10 times and a maximum of 100 times the instrument detection limit. If the spike is not recovered within the specified limits, a matrix effect should be suspected.
Interference Check Sample
Date: June 30, 2015 Revision No: 1
Author: D. Satterwhite Revision: N. Good
Page 171 of 221
An interference check sample (ICS) is a solution containing known concentrations of both interfering and analyte elements. Analysis of this sample can be used to verify background and inter-element correction factors.
Internal Standards
An internal standard (IS) is a compound or element with similar chemical characteristics and behavior in the analysis process of the target analytes, but is not normally found in environmental samples. The internal standard is usually added after sample preparation. The primary function of the internal standard is quantitation; however, it also provides a short-term indication of instrument performance. For isotope dilution methods, internal standards are added during sample preparation and are used for quantitation.
Quality Control Check Samples
In general, these samples are prepared similarly to the LCS, except that the reagent water is spiked with all compounds of interest. It must be from an independent source from the calibration standards. The standard is generally required in 40 CFR Part 136 methods (e.g., 624) due to the long list of analytes and the risk that the spiked sample may have some analytes outside of control limits. Note the required concentration of the standard as described within the published method or laboratory SOP.
Range
The range is the difference between the minimum and the maximum of a set of values.
11.2 Methods of Calculations for QC
11.2.1 Generating control limits for Precision and Accuracy Precision is estimated from the relative percent difference (RPD) of the concentrations (not the recoveries) measured for matrix spike/matrix spike duplicate pairs, or for duplicate analyses of unspiked samples. For each matrix spike/matrix spike duplicate or sample and sample duplicate analyzed, calculate the relative percent difference, as described in Section 12.1.4.4 (Data Reduction, Verification and Reporting). If calculated from three or more replicates, relative standard deviation (RSD) is calculated as described in Section 9.3.3.3, rather than RPD.
Note: Range is a better measurement of precision than RPD as analytical results approach the MDL (20 x the MDL is a reasonable figure). This is especially important for those analyses that do not lend themselves to spiking (e.g., BOD and solids). For each sample and sample duplicate using range for precision, calculate range as follows:
𝑅𝑅𝑀𝑀𝑀𝑀𝑅𝑅𝑀𝑀 = �𝐶𝐶(1) − 𝐶𝐶(2)� Where:
CR(1)R = Measured concentration of the first sample aliquot CR(2)R = Measured concentration of the second sample aliquot
Calculate the average (p) and the standard deviation (s) for each of the duplicated compounds after analysis of 20-30 duplicate samples of the same matrix. Calculate control and warning limits for each compound (since RPD or range are expressed as a positive number, there can be no lower control limit, as that value would be a negative number), as follows:
Control limit = p + 3s Warning limit = p + 2s
Control limits approximate a 99% confidence interval around the mean, while warning limits approximate a 95% confidence interval. Statistically, 68% of all results should fall within one standard deviation of the mean. Statistically, seven consecutive results on either side of the mean indicate an anomaly that should be
Date: June 30, 2015 Revision No: 1
Author: D. Satterwhite Revision: N. Good
Page 172 of 221
corrected, while three consecutive results exceeding warning limits also indicate an event that should be investigated. Any matrix spike, surrogate, or laboratory control sample (LCS) result outside of the control limits requires evaluation by the supervisor. Such actions should begin with a comparison of the results from the sample or matrix spike sample with the LCS results. If the recoveries of the analytes in the LCS are outside of the control limits, then the problem may lie with the application of the extraction or cleanup procedures applied to the sample matrix or with the chromatographic procedures. Once the problem has been identified and addressed, corrective action may include the re-analysis of sample, or the extraction and analysis of new sample aliquots, including new matrix spike sample and LCS. When the LCS results are within the control limits, the problem may either be related to the specific sample matrix or to an inappropriate choice of extraction, cleanup, and determinative methods. For a further discussion of corrective action, see Section 13. Control (acceptance) limits and warning limits are printed and updated at the least, annually. Once limits are updated, the new limits are posted in the laboratory (dated and approved by the QA Officer) and entered into a master log. The QA Officer maintains an archive of all limits used within the laboratory with the start and ending effective dates. The control and warning limits used to evaluate sample results are those that are in place at the time of sample analysis. For methods and matrices with very limited data (e.g., unusual matrices not analyzed often), interim limits are established using available data or by analogy to similar methods or matrices. Results used to develop acceptance criteria must meet all other QC criteria associated with the determinative method. For instance, matrix spike recoveries from a GC/MS procedure are generated from samples analyzed only after a valid GC/MS tune and a valid initial calibration that includes the matrix spike compounds. Another example is that analytes in GC methods must fall within the established retention time windows in order to be used to develop acceptance criteria.
It is advisable to consider the effects of the spiking concentration on matrix spike control limits, and to avoid censoring of data. The acceptance criteria for matrix spike recovery and precision are often a function of the spike concentration used. Therefore, caution must be used when pooling matrix spike/matrix spike duplicate data to generate control limits. Not only should the results all be from a similar matrix, but the spiking levels should also be approximately the same (within a factor of 2). Similarly, the matrix spike and surrogate results should all be generated using the same set of extraction, cleanup and analysis techniques. For example, results from solid samples extracted by ultrasonic extraction are not mixed with those extracted by Soxhlet.
Another common misstep in developing acceptance criteria is to discard data that do not meet a preconceived notion of acceptable performance. This results in a censored data set, which, when used to develop acceptance criteria will lead to unrealistically narrow criteria. Remember that for a 95% confidence interval, 1 out of every 20 observations likely will still fall outside the limits. While professional judgement is important in evaluating data to be used to develop acceptance criteria, specific results are not discarded simply because they do not meet one's expectations. Rather, a statistical test for outlier values is employed (see Section 11.3). In-house QC limits must be examined for reasonableness. Poor recoveries should not be legitimized due to the incorrect choice of methods or spiking levels. In-house limits are important when considering the objectives of specific analyses. For example, recovery limits that include allowance for a relatively high positive bias (e.g., 70-170%) may be appropriate for determining that an analyte is not present in a sample. However, they would be less appropriate for the analysis of samples near but below a regulatory limit, because of the potential high bias. It may be useful to compare QC limits generated in the laboratory to the performance data that may be listed in specific determinative methods. However, be aware that performance data generated from multiple laboratory data tend to be significantly wider than those generated from single laboratory data. In addition, comparisons between in-house limits and those from other sources should generally focus more on the
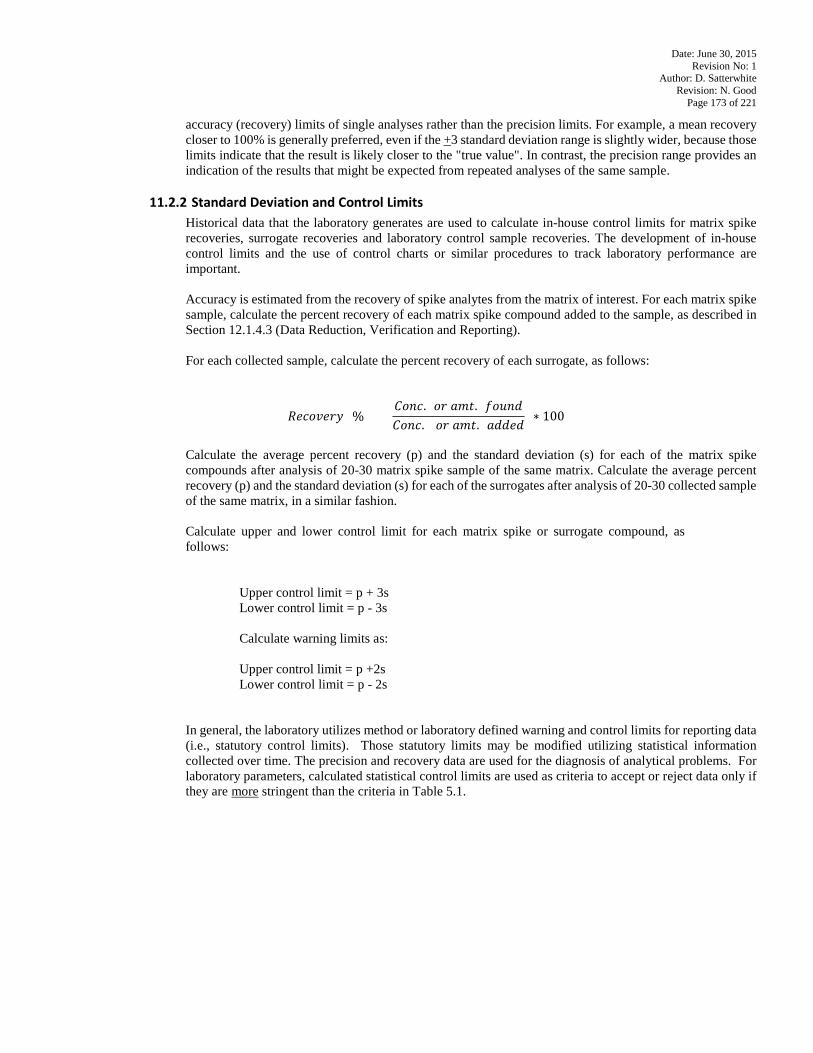
Date: June 30, 2015 Revision No: 1
Author: D. Satterwhite Revision: N. Good
Page 173 of 221
accuracy (recovery) limits of single analyses rather than the precision limits. For example, a mean recovery closer to 100% is generally preferred, even if the +3 standard deviation range is slightly wider, because those limits indicate that the result is likely closer to the "true value". In contrast, the precision range provides an indication of the results that might be expected from repeated analyses of the same sample.
11.2.2 Standard Deviation and Control Limits
Historical data that the laboratory generates are used to calculate in-house control limits for matrix spike recoveries, surrogate recoveries and laboratory control sample recoveries. The development of in-house control limits and the use of control charts or similar procedures to track laboratory performance are important. Accuracy is estimated from the recovery of spike analytes from the matrix of interest. For each matrix spike sample, calculate the percent recovery of each matrix spike compound added to the sample, as described in Section 12.1.4.3 (Data Reduction, Verification and Reporting). For each collected sample, calculate the percent recovery of each surrogate, as follows:
𝑅𝑅𝑀𝑀𝐷𝐷𝑅𝑅𝑅𝑅𝑀𝑀𝐷𝐷𝑅𝑅 (%) = (𝐶𝐶𝑅𝑅𝑀𝑀𝐷𝐷. (𝑅𝑅𝐷𝐷 𝑀𝑀𝑚𝑚𝑎𝑎. )𝐷𝐷𝑅𝑅𝑓𝑓𝑀𝑀𝑓𝑓𝐶𝐶𝑅𝑅𝑀𝑀𝐷𝐷. (𝑅𝑅𝐷𝐷 𝑀𝑀𝑚𝑚𝑎𝑎. )𝑀𝑀𝑓𝑓𝑓𝑓𝑀𝑀𝑓𝑓
) ∗ 100
Calculate the average percent recovery (p) and the standard deviation (s) for each of the matrix spike compounds after analysis of 20-30 matrix spike sample of the same matrix. Calculate the average percent recovery (p) and the standard deviation (s) for each of the surrogates after analysis of 20-30 collected sample of the same matrix, in a similar fashion.
Calculate upper and lower control limit for each matrix spike or surrogate compound, as follows:
Upper control limit = p + 3s Lower control limit = p - 3s Calculate warning limits as: Upper control limit = p +2s Lower control limit = p - 2s
In general, the laboratory utilizes method or laboratory defined warning and control limits for reporting data (i.e., statutory control limits). Those statutory limits may be modified utilizing statistical information collected over time. The precision and recovery data are used for the diagnosis of analytical problems. For laboratory parameters, calculated statistical control limits are used as criteria to accept or reject data only if they are more stringent than the criteria in Table 5.1.
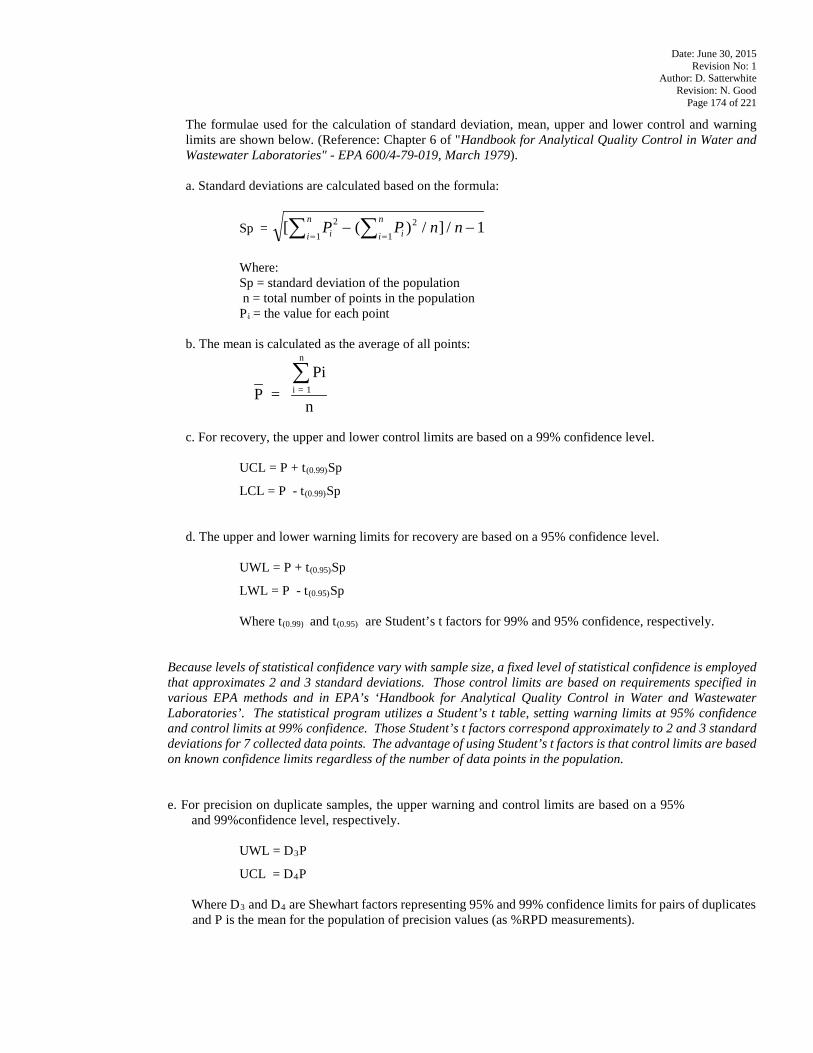
Date: June 30, 2015 Revision No: 1
Author: D. Satterwhite Revision: N. Good
Page 174 of 221
The formulae used for the calculation of standard deviation, mean, upper and lower control and warning limits are shown below. (Reference: Chapter 6 of "Handbook for Analytical Quality Control in Water and Wastewater Laboratories" - EPA 600/4-79-019, March 1979).
a. Standard deviations are calculated based on the formula:
Sp =
Where:
Sp = standard deviation of the population n = total number of points in the population PRi R= the value for each point
b. The mean is calculated as the average of all points:
c. For recovery, the upper and lower control limits are based on a 99% confidence level.
UCL = P + tR(0.99)RSp
LCL = P - tR(0.99)RSp
d. The upper and lower warning limits for recovery are based on a 95% confidence level.
UWL = P + tR(0.95)RSp
LWL = P - tR(0.95)RSp Where tR(0.99) R and tR(0.95)R are Student’s t factors for 99% and 95% confidence, respectively.
Because levels of statistical confidence vary with sample size, a fixed level of statistical confidence is employed that approximates 2 and 3 standard deviations. Those control limits are based on requirements specified in various EPA methods and in EPA’s ‘Handbook for Analytical Quality Control in Water and Wastewater Laboratories’. The statistical program utilizes a Student’s t table, setting warning limits at 95% confidence and control limits at 99% confidence. Those Student’s t factors correspond approximately to 2 and 3 standard deviations for 7 collected data points. The advantage of using Student’s t factors is that control limits are based on known confidence limits regardless of the number of data points in the population.
e. For precision on duplicate samples, the upper warning and control limits are based on a 95% and 99%confidence level, respectively.
UWL = DR3RP
UCL = DR4RP
Where DR3R and DR4R are Shewhart factors representing 95% and 99% confidence limits for pairs of duplicatesP
Pand P is the mean for the population of precision values (as %RPD measurements).
[ ( ) / ] /P P n ni ii
n
i
n 2 211
1− −== ∑∑
P = Pi
ni = 1
n
∑
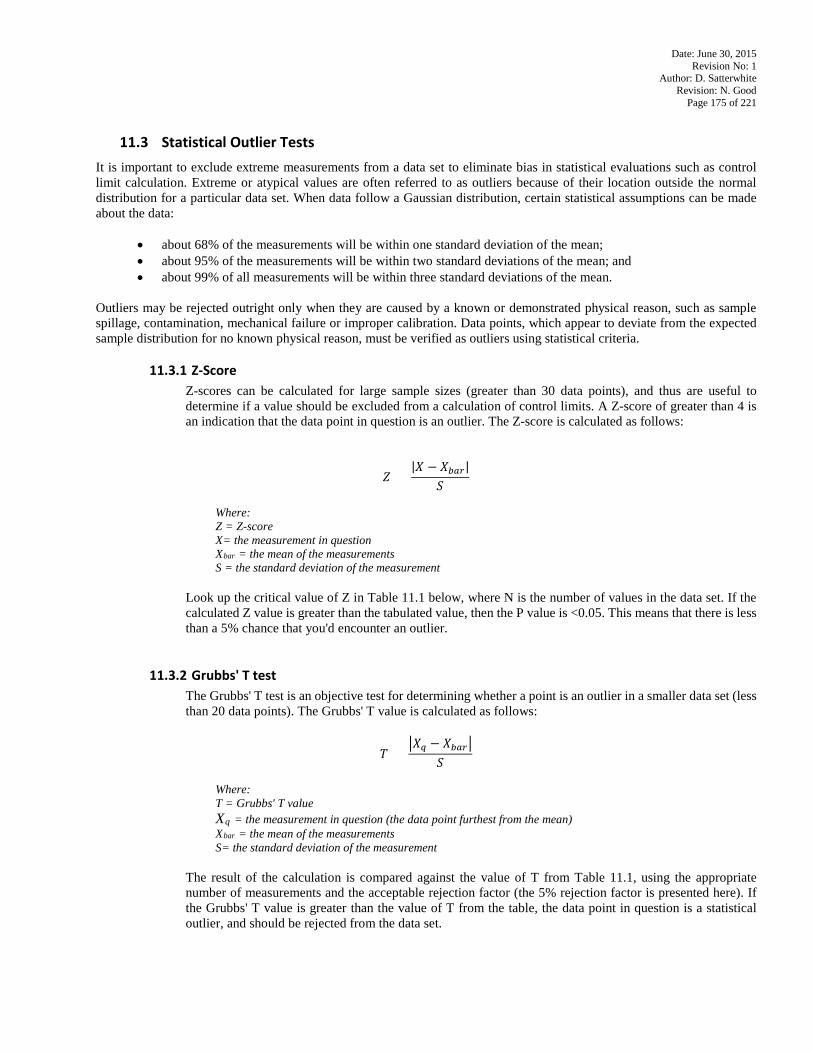
Date: June 30, 2015 Revision No: 1
Author: D. Satterwhite Revision: N. Good
Page 175 of 221
11.3 Statistical Outlier Tests
It is important to exclude extreme measurements from a data set to eliminate bias in statistical evaluations such as control limit calculation. Extreme or atypical values are often referred to as outliers because of their location outside the normal distribution for a particular data set. When data follow a Gaussian distribution, certain statistical assumptions can be made about the data:
• about 68% of the measurements will be within one standard deviation of the mean; • about 95% of the measurements will be within two standard deviations of the mean; and • about 99% of all measurements will be within three standard deviations of the mean.
Outliers may be rejected outright only when they are caused by a known or demonstrated physical reason, such as sample spillage, contamination, mechanical failure or improper calibration. Data points, which appear to deviate from the expected sample distribution for no known physical reason, must be verified as outliers using statistical criteria.
11.3.1 Z-Score
Z-scores can be calculated for large sample sizes (greater than 30 data points), and thus are useful to determine if a value should be excluded from a calculation of control limits. A Z-score of greater than 4 is an indication that the data point in question is an outlier. The Z-score is calculated as follows:
𝑍𝑍 = |𝑋𝑋 − 𝑋𝑋𝑏𝑏𝑀𝑀𝑏𝑏|
𝑆𝑆
Where: Z = Z-score X= the measurement in question XRbarR = the mean of the measurements S = the standard deviation of the measurement
Look up the critical value of Z in Table 11.1 below, where N is the number of values in the data set. If the calculated Z value is greater than the tabulated value, then the P value is <0.05. This means that there is less than a 5% chance that you'd encounter an outlier.
11.3.2 Grubbs' T test
The Grubbs' T test is an objective test for determining whether a point is an outlier in a smaller data set (less than 20 data points). The Grubbs' T value is calculated as follows:
𝑇𝑇 = �𝑋𝑋𝑞𝑞 − 𝑋𝑋𝑏𝑏𝑀𝑀𝑏𝑏�
𝑆𝑆
Where: T = Grubbs' T value XRqR = the measurement in question (the data point furthest from the mean) XRbarR = the mean of the measurements S= the standard deviation of the measurement
The result of the calculation is compared against the value of T from Table 11.1, using the appropriate number of measurements and the acceptable rejection factor (the 5% rejection factor is presented here). If the Grubbs' T value is greater than the value of T from the table, the data point in question is a statistical outlier, and should be rejected from the data set.
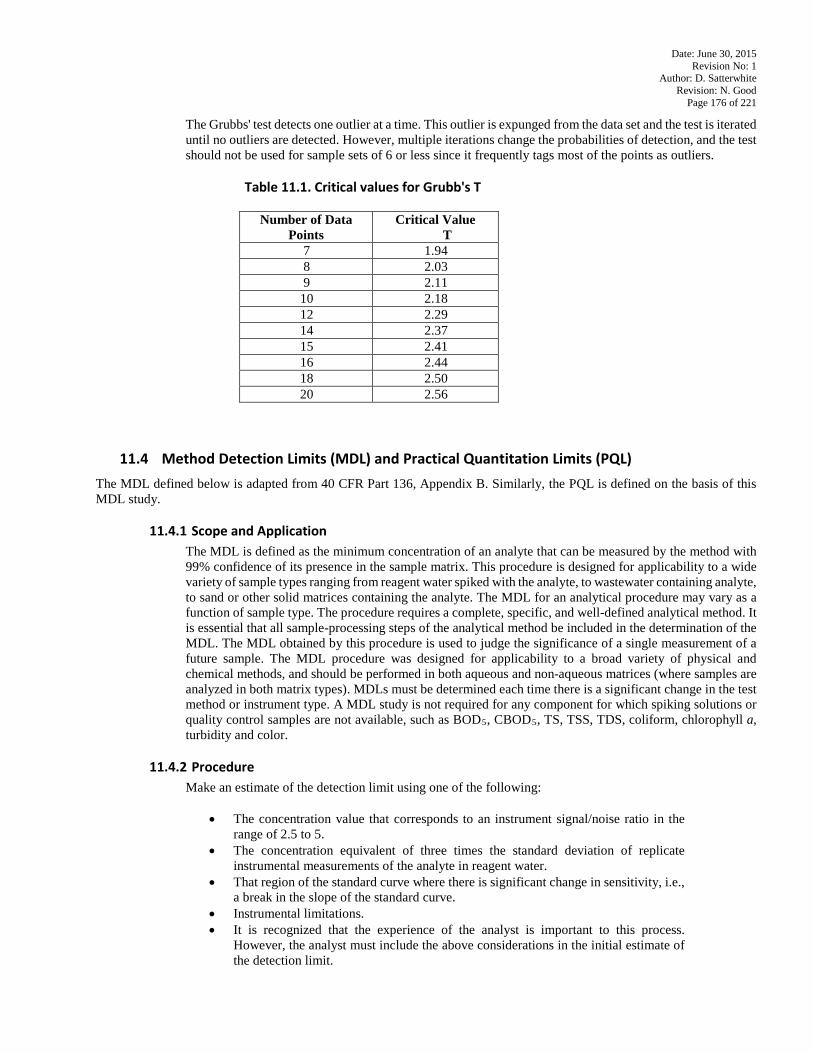
Date: June 30, 2015 Revision No: 1
Author: D. Satterwhite Revision: N. Good
Page 176 of 221
The Grubbs' test detects one outlier at a time. This outlier is expunged from the data set and the test is iterated until no outliers are detected. However, multiple iterations change the probabilities of detection, and the test should not be used for sample sets of 6 or less since it frequently tags most of the points as outliers.
Table 11.1. Critical values for Grubb's T
Number of Data Points
Critical Value T
7 1.94 8 2.03 9 2.11
10 2.18 12 2.29 14 2.37 15 2.41 16 2.44 18 2.50 20 2.56
11.4 Method Detection Limits (MDL) and Practical Quantitation Limits (PQL)
The MDL defined below is adapted from 40 CFR Part 136, Appendix B. Similarly, the PQL is defined on the basis of this MDL study.
11.4.1 Scope and Application The MDL is defined as the minimum concentration of an analyte that can be measured by the method with 99% confidence of its presence in the sample matrix. This procedure is designed for applicability to a wide variety of sample types ranging from reagent water spiked with the analyte, to wastewater containing analyte, to sand or other solid matrices containing the analyte. The MDL for an analytical procedure may vary as a function of sample type. The procedure requires a complete, specific, and well-defined analytical method. It is essential that all sample-processing steps of the analytical method be included in the determination of the MDL. The MDL obtained by this procedure is used to judge the significance of a single measurement of a future sample. The MDL procedure was designed for applicability to a broad variety of physical and chemical methods, and should be performed in both aqueous and non-aqueous matrices (where samples are analyzed in both matrix types). MDLs must be determined each time there is a significant change in the test method or instrument type. A MDL study is not required for any component for which spiking solutions or quality control samples are not available, such as BODR5R, CBODR5R, TS, TSS, TDS, coliform, chlorophyll a, turbidity and color.
11.4.2 Procedure
Make an estimate of the detection limit using one of the following:
• The concentration value that corresponds to an instrument signal/noise ratio in the range of 2.5 to 5.
• The concentration equivalent of three times the standard deviation of replicate instrumental measurements of the analyte in reagent water.
• That region of the standard curve where there is significant change in sensitivity, i.e., a break in the slope of the standard curve.
• Instrumental limitations. • It is recognized that the experience of the analyst is important to this process.
However, the analyst must include the above considerations in the initial estimate of the detection limit.
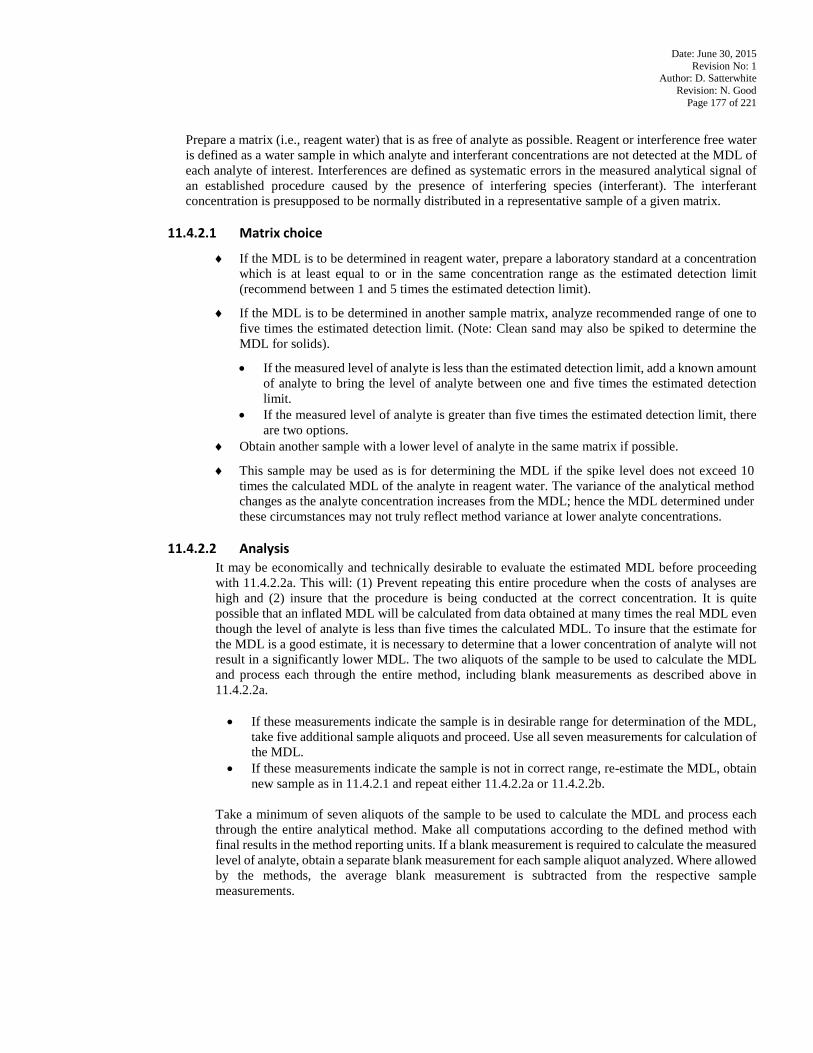
Date: June 30, 2015 Revision No: 1
Author: D. Satterwhite Revision: N. Good
Page 177 of 221
Prepare a matrix (i.e., reagent water) that is as free of analyte as possible. Reagent or interference free water is defined as a water sample in which analyte and interferant concentrations are not detected at the MDL of each analyte of interest. Interferences are defined as systematic errors in the measured analytical signal of an established procedure caused by the presence of interfering species (interferant). The interferant concentration is presupposed to be normally distributed in a representative sample of a given matrix.
11.4.2.1 Matrix choice
♦ If the MDL is to be determined in reagent water, prepare a laboratory standard at a concentration which is at least equal to or in the same concentration range as the estimated detection limit (recommend between 1 and 5 times the estimated detection limit).
♦ If the MDL is to be determined in another sample matrix, analyze recommended range of one to five times the estimated detection limit. (Note: Clean sand may also be spiked to determine the MDL for solids).
• If the measured level of analyte is less than the estimated detection limit, add a known amount of analyte to bring the level of analyte between one and five times the estimated detection limit.
• If the measured level of analyte is greater than five times the estimated detection limit, there are two options.
♦ Obtain another sample with a lower level of analyte in the same matrix if possible.
♦ This sample may be used as is for determining the MDL if the spike level does not exceed 10 times the calculated MDL of the analyte in reagent water. The variance of the analytical method changes as the analyte concentration increases from the MDL; hence the MDL determined under these circumstances may not truly reflect method variance at lower analyte concentrations.
11.4.2.2 Analysis
It may be economically and technically desirable to evaluate the estimated MDL before proceeding with 11.4.2.2a. This will: (1) Prevent repeating this entire procedure when the costs of analyses are high and (2) insure that the procedure is being conducted at the correct concentration. It is quite possible that an inflated MDL will be calculated from data obtained at many times the real MDL even though the level of analyte is less than five times the calculated MDL. To insure that the estimate for the MDL is a good estimate, it is necessary to determine that a lower concentration of analyte will not result in a significantly lower MDL. The two aliquots of the sample to be used to calculate the MDL and process each through the entire method, including blank measurements as described above in 11.4.2.2a. • If these measurements indicate the sample is in desirable range for determination of the MDL,
take five additional sample aliquots and proceed. Use all seven measurements for calculation of the MDL.
• If these measurements indicate the sample is not in correct range, re-estimate the MDL, obtain new sample as in 11.4.2.1 and repeat either 11.4.2.2a or 11.4.2.2b.
Take a minimum of seven aliquots of the sample to be used to calculate the MDL and process each through the entire analytical method. Make all computations according to the defined method with final results in the method reporting units. If a blank measurement is required to calculate the measured level of analyte, obtain a separate blank measurement for each sample aliquot analyzed. Where allowed by the methods, the average blank measurement is subtracted from the respective sample measurements.
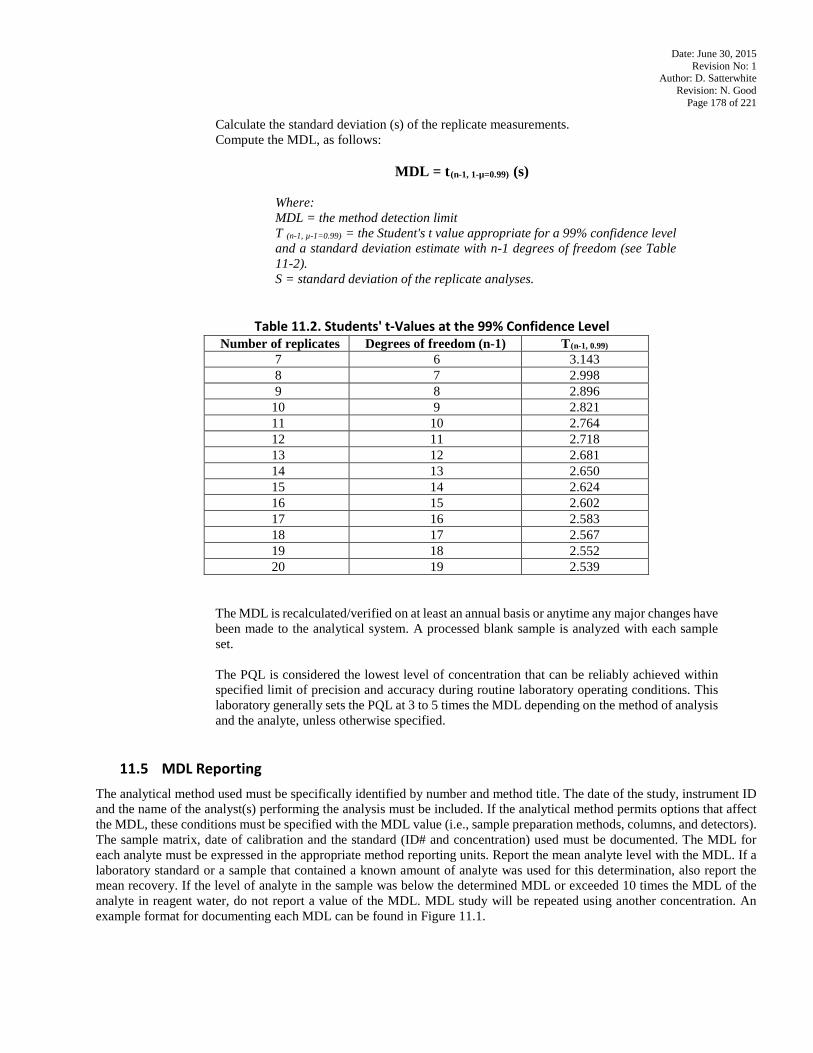
Date: June 30, 2015 Revision No: 1
Author: D. Satterwhite Revision: N. Good
Page 178 of 221
Calculate the standard deviation (s) of the replicate measurements. Compute the MDL, as follows:
MDL = tR(n-1, 1-µ=0.99)R (s)
Where: MDL = the method detection limit T R(n-1, µ-1=0.99)R = the Student's t value appropriate for a 99% confidence level and a standard deviation estimate with n-1 degrees of freedom (see Table 11-2). S = standard deviation of the replicate analyses.
Table 11.2. Students' t-Values at the 99% Confidence Level Number of replicates Degrees of freedom (n-1) TR(n-1, 0.99)
7 6 3.143 8 7 2.998 9 8 2.896
10 9 2.821 11 10 2.764 12 11 2.718 13 12 2.681 14 13 2.650 15 14 2.624 16 15 2.602 17 16 2.583 18 17 2.567 19 18 2.552 20 19 2.539
The MDL is recalculated/verified on at least an annual basis or anytime any major changes have been made to the analytical system. A processed blank sample is analyzed with each sample set.
The PQL is considered the lowest level of concentration that can be reliably achieved within specified limit of precision and accuracy during routine laboratory operating conditions. This laboratory generally sets the PQL at 3 to 5 times the MDL depending on the method of analysis and the analyte, unless otherwise specified.
11.5 MDL Reporting
The analytical method used must be specifically identified by number and method title. The date of the study, instrument ID and the name of the analyst(s) performing the analysis must be included. If the analytical method permits options that affect the MDL, these conditions must be specified with the MDL value (i.e., sample preparation methods, columns, and detectors). The sample matrix, date of calibration and the standard (ID# and concentration) used must be documented. The MDL for each analyte must be expressed in the appropriate method reporting units. Report the mean analyte level with the MDL. If a laboratory standard or a sample that contained a known amount of analyte was used for this determination, also report the mean recovery. If the level of analyte in the sample was below the determined MDL or exceeded 10 times the MDL of the analyte in reagent water, do not report a value of the MDL. MDL study will be repeated using another concentration. An example format for documenting each MDL can be found in Figure 11.1.

Date: June 30, 2015 Revision No: 1
Author: D. Satterwhite Revision: N. Good
Page 179 of 221
11.6 Blind QC Check Sample Analysis The laboratory participates in EPA's Performance Evaluation Studies. Results of these tests are summarized and included in the laboratory's QA report.
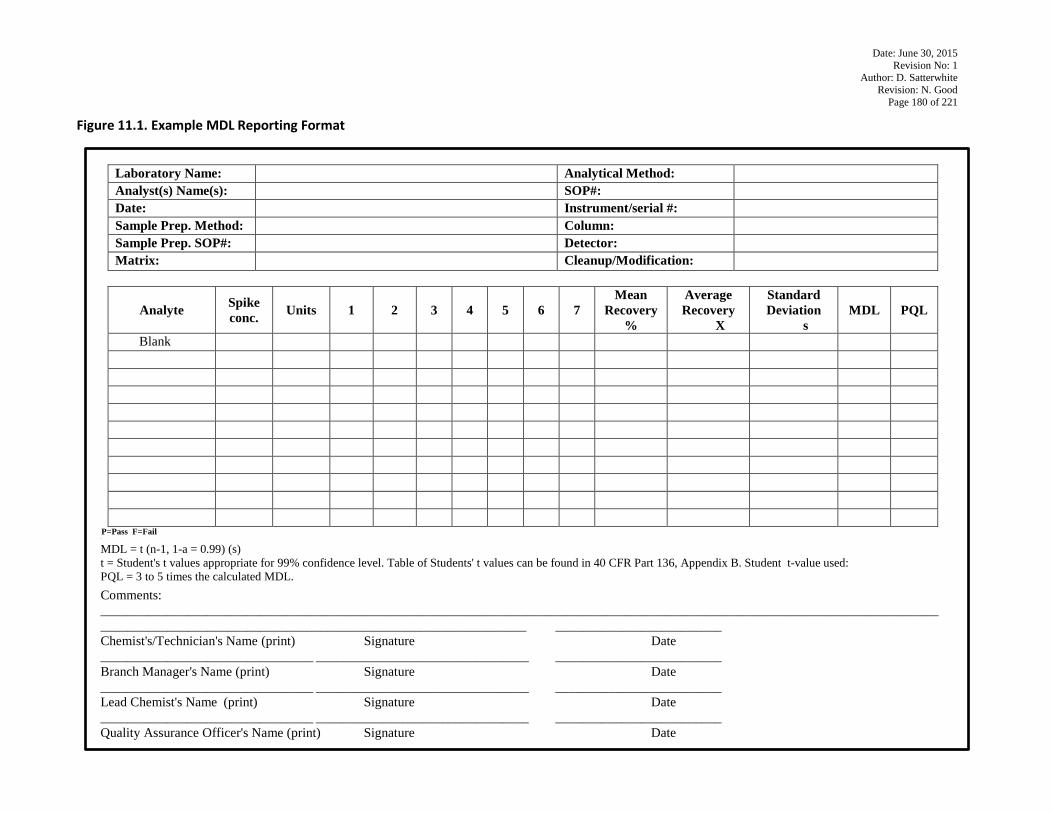
Date: June 30, 2015 Revision No: 1
Author: D. Satterwhite Revision: N. Good
Page 180 of 221
Figure 11.1. Example MDL Reporting Format
Laboratory Name: Analytical Method: Analyst(s) Name(s): SOP#: Date: Instrument/serial #: Sample Prep. Method: Column: Sample Prep. SOP#: Detector: Matrix: Cleanup/Modification:
Analyte Spike conc. Units 1 2 3 4 5 6 7
Mean Recovery
%
Average Recovery
X
Standard Deviation
s MDL PQL
Blank
P
P=Pass F=Fail
MDL = t (n-1, 1-a = 0.99) (s) t = Student's t values appropriate for 99% confidence level. Table of Students' t values can be found in 40 CFR Part 136, Appendix B. Student t-value used: PQL = 3 to 5 times the calculated MDL. Comments: ______________________________________________________________________________________________________________________________________________________________________________________________ _________________________ Chemist's/Technician's Name (print) Signature Date ________________________________ ________________________________ _________________________ Branch Manager's Name (print) Signature Date ________________________________ ________________________________ _________________________ Lead Chemist's Name (print) Signature Date ________________________________ ________________________________ _________________________ Quality Assurance Officer's Name (print) Signature Date
Date: June 30, 2015 Revision No: 1
Author: D. Satterwhite Revision: N. Good
Page 181 of 221
12.0 Data Reduction, Verification and Reporting In order to provide complete, accurate and verifiable results, all analytical data generated by the DWR Water Sciences Section Chemistry Laboratory is recorded, reviewed, reported and archived according to Laboratory policy. Analytical areas have slightly different data reduction, validation and reporting protocols depending on the means by which the data are generated and specific method requirements. The general procedures involved in the process of data reduction, validation and reporting are explained in this section. Detailed procedures are outlined in laboratory operational or analytical SOPs.
12.1 Data Reduction Data reduction includes all activities that convert analytical values into reportable sample concentrations of the target analyte(s). These activities may involve mathematical calculations, compound identification and summary statistics. The final results may be obtained in two ways:
1. Direct readings from the instrument; or 2. Calculations based on instrument output, readings or responses.
The Water Sciences Section Chemistry Laboratory's goal is to minimize the steps needed to transform raw data into reportable results and maximize on the number of analytical results generated by automated systems. The more automated the data reduction process, the less likely data transcription and calculations errors are to occur.
12.1.1 Manual data reduction
Manual data reduction refers to those activities in which analytical output is converted to sample concentrations by calculations performed manually or by validated computer applications.
• During the manual data reduction process, analysts will: • Assure that all data are correctly transcribed into worksheets, forms or computer application; • Keep raw data as part of the analysis records (e.g., tabulated reports, chromatograms, etc.) • Select the appropriate, method-specified formulae for calculating results. The formulae used are
written in the standard operating procedures for each method • Proofread computer-generated reports to ensure that the raw data manually entered into the
computer application was entered correctly. • Record appropriate and accurate information concerning sample identification, operating
conditions, etc.
The Water Sciences Section Chemistry Laboratory retains documentation of all computer applications used for this purpose, including the mathematical formulae used to calculate sample concentrations. If such information is not available, or can not be obtained from the code, the application is validated by comparing the results of the application with the results of manual calculations. A record of this verification is maintained in the analytical unit. Data is to be retained at laboratory for five years and then archived downtown for an additional five years. Please note DENR data retention policy in appendix IV. All raw data output (i.e., strip charts, tabular printouts, etc.) must be identified with the following information (where applicable):
• Date of analysis • Sample ID numbers • Analyst or operator • Type of analysis • Instrument operating conditions • Detector • Column • Instrument configuration
Date: June 30, 2015 Revision No: 1
Author: D. Satterwhite Revision: N. Good
Page 182 of 221
12.1.2 Computer data reduction Computer data reduction refers to those activities in which analytical acquisition and initial calculations are performed automatically by validated computer applications. When computer data reduction is performed, the analysts will (as is appropriate to the method used):
• Ensure that all variables required for final calculations (sample amount, dilution factor, extract
volume, percent solids, surrogate amount, etc.) are entered accurately; • Properly interpret the computer output in terms of correctly identified components, positive or
negative identifications and appropriate confirmatory measures; • Record appropriate and accurate information concerning sample identification, operating
conditions, etc.; • Calculate surrogate recoveries and verify that internal standard responses are acceptable; • Verify that target compounds analyzed by chromatographic methods are within the appropriate
retention time or relative retention time windows and that additional confirmation is initiated as needed.
Raw data files are assigned a unique filename by the analyst performing the analyses. In some instances, the computer performs the filename assignment using rules that ensure that filenames will not be repeated (i.e., a queue number). In such cases, a cross-reference index or log is maintained to identify the computer data files with sample ID numbers. Additional information that should be entered into the data file records are date of analysis, analysis type and analyst initials. Cross-referenced auxiliary records may be required to identify instrument operating conditions. Many analytical instruments are interfaced with computers or integrators that automatically evaluate, identify and calculate final values. The results are printed in combinations of graphic (e.g., chromatograms) and tabular forms. As with manual data reduction, the Section must be aware and should have on file a record of the mathematical formulae or algorithms that are being used by the computer. If the information is not available, the organization shall maintain records, which demonstrate that the software is providing the expected results.
12.1.3 General data reduction responsibilities
Additional data reduction responsibilities include: • Ensuring that samples are analyzed only when the instrument is calibrated according to the
method; • Ensuring that QC results are calculated correctly, within criteria, and if not, initiating corrective
actions; • Identifying QC results for review by the responsible person(s); • Documenting sample preparation and analysis, and the conditions under which they were
performed, inappropriate logbooks or on appropriate benchsheets; • Ensuring that the laboratory sample ID is directly traceable to the field sample and is correctly
transcribed into all associated analytical records; • For computer-controlled data acquisition and data reduction, the analysts are responsible for
entering all the parameters needed for final result calculation correctly; • For manual data reduction, the analysts are responsible for performing the calculations according
to the method requirements; • If the result is transcribed, the analysts are responsible for ensuring that the entry is entered
correctly; • The analysts are responsible for alerting a Supervisor about any problems that the analyst believes
may affect the quality of the data.
Every instrument or method within the six analytical areas and one regional laboratory has a slightly different data reduction process depending on the way in which data are generated and the required data transformations. Most sample concentration results are read directly from instrumentation without further reduction or calculations.
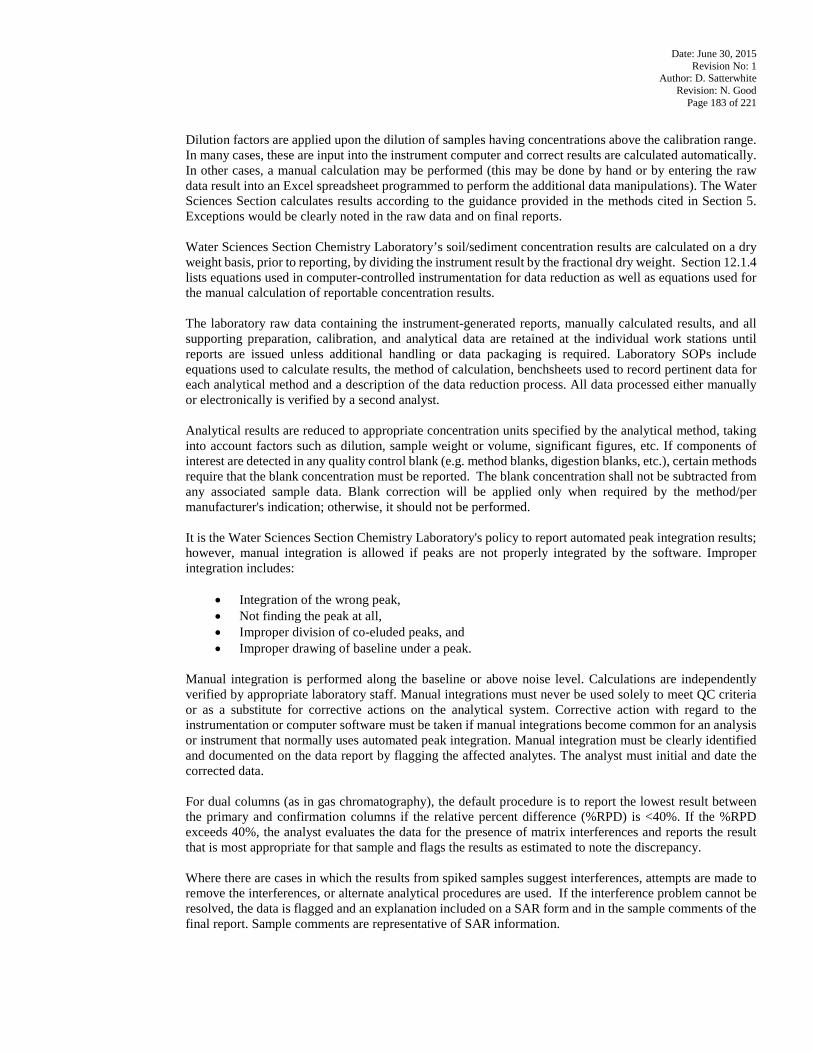
Date: June 30, 2015 Revision No: 1
Author: D. Satterwhite Revision: N. Good
Page 183 of 221
Dilution factors are applied upon the dilution of samples having concentrations above the calibration range. In many cases, these are input into the instrument computer and correct results are calculated automatically. In other cases, a manual calculation may be performed (this may be done by hand or by entering the raw data result into an Excel spreadsheet programmed to perform the additional data manipulations). The Water Sciences Section calculates results according to the guidance provided in the methods cited in Section 5. Exceptions would be clearly noted in the raw data and on final reports. Water Sciences Section Chemistry Laboratory’s soil/sediment concentration results are calculated on a dry weight basis, prior to reporting, by dividing the instrument result by the fractional dry weight. Section 12.1.4 lists equations used in computer-controlled instrumentation for data reduction as well as equations used for the manual calculation of reportable concentration results. The laboratory raw data containing the instrument-generated reports, manually calculated results, and all supporting preparation, calibration, and analytical data are retained at the individual work stations until reports are issued unless additional handling or data packaging is required. Laboratory SOPs include equations used to calculate results, the method of calculation, benchsheets used to record pertinent data for each analytical method and a description of the data reduction process. All data processed either manually or electronically is verified by a second analyst. Analytical results are reduced to appropriate concentration units specified by the analytical method, taking into account factors such as dilution, sample weight or volume, significant figures, etc. If components of interest are detected in any quality control blank (e.g. method blanks, digestion blanks, etc.), certain methods require that the blank concentration must be reported. The blank concentration shall not be subtracted from any associated sample data. Blank correction will be applied only when required by the method/per manufacturer's indication; otherwise, it should not be performed.
It is the Water Sciences Section Chemistry Laboratory's policy to report automated peak integration results; however, manual integration is allowed if peaks are not properly integrated by the software. Improper integration includes:
• Integration of the wrong peak, • Not finding the peak at all, • Improper division of co-eluded peaks, and • Improper drawing of baseline under a peak.
Manual integration is performed along the baseline or above noise level. Calculations are independently verified by appropriate laboratory staff. Manual integrations must never be used solely to meet QC criteria or as a substitute for corrective actions on the analytical system. Corrective action with regard to the instrumentation or computer software must be taken if manual integrations become common for an analysis or instrument that normally uses automated peak integration. Manual integration must be clearly identified and documented on the data report by flagging the affected analytes. The analyst must initial and date the corrected data. For dual columns (as in gas chromatography), the default procedure is to report the lowest result between the primary and confirmation columns if the relative percent difference (%RPD) is <40%. If the %RPD exceeds 40%, the analyst evaluates the data for the presence of matrix interferences and reports the result that is most appropriate for that sample and flags the results as estimated to note the discrepancy.
Where there are cases in which the results from spiked samples suggest interferences, attempts are made to remove the interferences, or alternate analytical procedures are used. If the interference problem cannot be resolved, the data is flagged and an explanation included on a SAR form and in the sample comments of the final report. Sample comments are representative of SAR information.
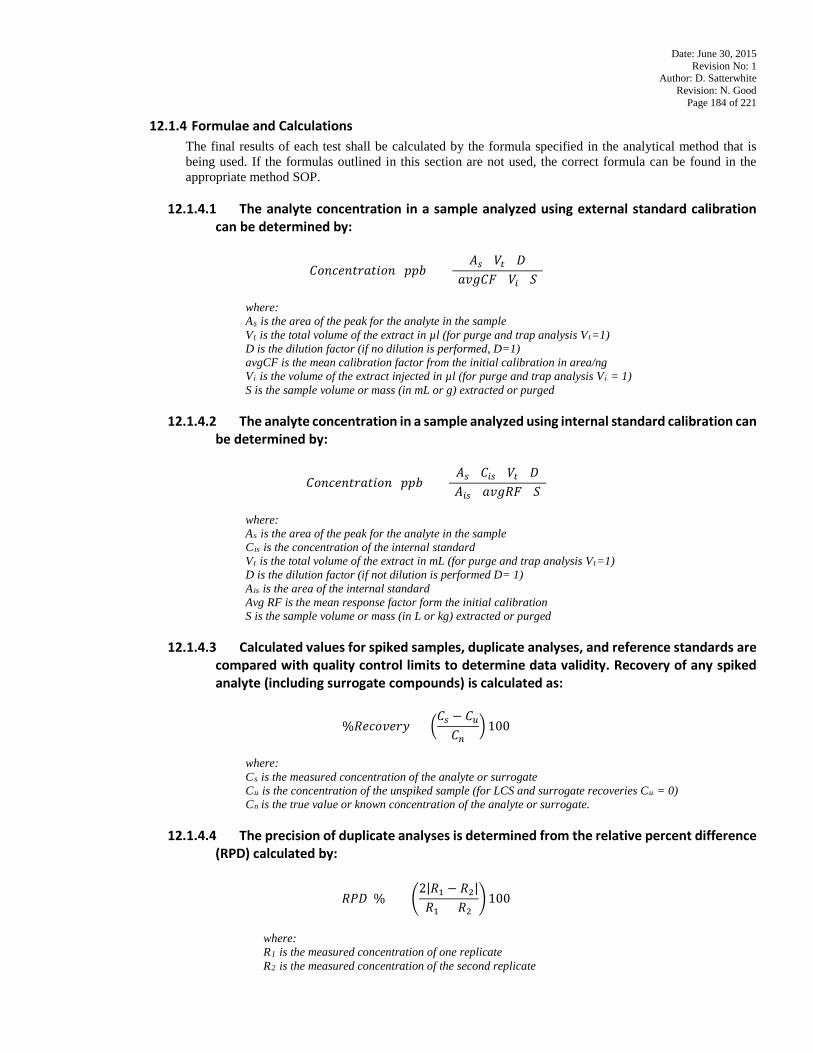
Date: June 30, 2015 Revision No: 1
Author: D. Satterwhite Revision: N. Good
Page 184 of 221
12.1.4 Formulae and Calculations The final results of each test shall be calculated by the formula specified in the analytical method that is being used. If the formulas outlined in this section are not used, the correct formula can be found in the appropriate method SOP.
12.1.4.1 The analyte concentration in a sample analyzed using external standard calibration
can be determined by:
𝐶𝐶𝑅𝑅𝑀𝑀𝐷𝐷𝑀𝑀𝑀𝑀𝑎𝑎𝐷𝐷𝑀𝑀𝑎𝑎𝑖𝑖𝑅𝑅𝑀𝑀 (𝑝𝑝𝑝𝑝𝑝𝑝) = (𝐴𝐴𝑠𝑠)(𝑉𝑉𝑡𝑡)(𝑆𝑆)
(𝑀𝑀𝑅𝑅𝑅𝑅𝐶𝐶𝑅𝑅)(𝑉𝑉𝑖𝑖)(𝑆𝑆)
where: ARsR is the area of the peak for the analyte in the sample VRtR is the total volume of the extract in µl (for purge and trap analysis VRtR=1) D is the dilution factor (if no dilution is performed, D=1) avgCF is the mean calibration factor from the initial calibration in area/ng VRiR is the volume of the extract injected in µl (for purge and trap analysis VRiR = 1) S is the sample volume or mass (in mL or g) extracted or purged
12.1.4.2 The analyte concentration in a sample analyzed using internal standard calibration can
be determined by:
𝐶𝐶𝑅𝑅𝑀𝑀𝐷𝐷𝑀𝑀𝑀𝑀𝑎𝑎𝐷𝐷𝑀𝑀𝑎𝑎𝑖𝑖𝑅𝑅𝑀𝑀 (𝑝𝑝𝑝𝑝𝑝𝑝) = (𝐴𝐴𝑠𝑠)(𝐶𝐶𝑖𝑖𝑠𝑠)(𝑉𝑉𝑡𝑡)(𝑆𝑆)(𝐴𝐴𝑖𝑖𝑠𝑠)(𝑀𝑀𝑅𝑅𝑅𝑅𝑅𝑅𝑅𝑅)(𝑆𝑆)
where: ARsR is the area of the peak for the analyte in the sample CRisR is the concentration of the internal standard VRtR is the total volume of the extract in mL (for purge and trap analysis VRtR=1) D is the dilution factor (if not dilution is performed D= 1) ARisR is the area of the internal standard Avg RF is the mean response factor form the initial calibration S is the sample volume or mass (in L or kg) extracted or purged
12.1.4.3 Calculated values for spiked samples, duplicate analyses, and reference standards are
compared with quality control limits to determine data validity. Recovery of any spiked analyte (including surrogate compounds) is calculated as:
%𝑅𝑅𝑀𝑀𝐷𝐷𝑅𝑅𝑅𝑅𝑀𝑀𝐷𝐷𝑅𝑅 = �𝐶𝐶𝑠𝑠 − 𝐶𝐶𝑢𝑢𝐶𝐶𝑛𝑛
� 100
where: CRsR is the measured concentration of the analyte or surrogate CRuR is the concentration of the unspiked sample (for LCS and surrogate recoveries CRuR = 0) CRn Ris the true value or known concentration of the analyte or surrogate.
12.1.4.4 The precision of duplicate analyses is determined from the relative percent difference
(RPD) calculated by:
𝑅𝑅𝑅𝑅𝑆𝑆(%) = �2|𝑅𝑅1 − 𝑅𝑅2|𝑅𝑅1 + 𝑅𝑅2
�100
where: RR1R is the measured concentration of one replicate RR2R is the measured concentration of the second replicate
Date: June 30, 2015 Revision No: 1
Author: D. Satterwhite Revision: N. Good
Page 185 of 221
12.1.4.5 Relative Standard Deviation (RSD) is computed from the standard deviation and mean
recovery when the standard deviation is derived from multiple recovery results:
𝑅𝑅𝑆𝑆𝑆𝑆(%) = �𝑆𝑆𝑎𝑎𝑀𝑀𝑀𝑀𝑓𝑓𝑀𝑀𝐷𝐷𝑓𝑓 𝑆𝑆𝑀𝑀𝑅𝑅𝑖𝑖𝑀𝑀𝑎𝑎𝑖𝑖𝑅𝑅𝑀𝑀𝑀𝑀𝑀𝑀𝑀𝑀𝑀𝑀 𝑅𝑅𝑀𝑀𝐷𝐷𝑅𝑅𝑅𝑅𝑀𝑀𝐷𝐷𝑅𝑅
� 100
12.1.4.6 Sample and QC result calculations are reduced as follows:
A. Results from analyzed sample extracts or digestates are processed manually by the analytical instruments’ PC-based data systems or by laboratory chromatography software, based on the method protocols discussed in Sections 5 and 9. These raw sample results are manually calculated or manually/electronically downloaded from the analytical instrument to the appropriate computer application.
B. Sample results and QC results are linked together by date of analysis and assigned lab numbers,
so sample prep and analysis batches are always identified with their associated QC. Using pertinent sample prep/analysis data (e.g., amount of sample digested or extracted, final digestate or extract volume, dilution factors, spiking level/solution used, etc.), calculations are either performed manually or by an appropriate computer application. Examples of typical water and sediment calculations performed follow:
Concentration in µg/L (for water samples) =
Final extract or digestate conc. (µg/mL) x Final extract or digestate volume (mL)
Initial Sample Volume Extracted or Digested (L)
Concentration in µg/kg (for sediment samples) =
Final extract or digestate conc. (µg/mL) x Final extract or digestate volume (mL) Initial Sample Weight Extracted or Digested (kg) x Dry Weight Correction Factor
C. The resulting sample and associated QC results are reviewed by the chemist, results deemed acceptable, are entered into DWR LABWORKS™ database. Current acceptance criteria (warning and control limits) for each QC element are stored within an Excel spreadsheet or posted in the analytical unit. If QC results are outside of the current control limits, data is flagged with the appropriate qualifier code. The analysis data is fully reviewed to determine if sample contamination or matrix problems exist. The associated sample batch may then be re-submitted for re-digestion/re-extraction or re-analysis. If there is still a problem with the quality of the data, in-depth investigation into the method in question is conducted until the problem is resolved. The data may be rejected or reported with qualification if the problem cannot be resolved immediately.
12.1.5 Corrections
Entries in records shall not be obliterated by methods such as erasures, liquid paper, overwritten files or markings. All corrections to record-keeping shall be made by one line marked through the error leaving the original record visible. The individual making the correction shall sign (or initial) and date the correction. These criteria shall also apply to electronically maintained records.
Date: June 30, 2015 Revision No: 1
Author: D. Satterwhite Revision: N. Good
Page 186 of 221
12.1.6 Significant Figures Every measurement has a degree of uncertainty associated with it. The uncertainty derives from the limitations of the measuring device and from the skill with which it is used. The accuracy of a measurement is expressed by the number of significant digits (or significant figures) written when the measurement is reported. All digits in a reported result are expected to be known definitely, except for the last digit, which may be in doubt (i.e., has an uncertainty of ± 1 unit). Such a number is said to contain only significant figures.
12.1.6.1 Significant Figure Rules There are several rules for determining the number of significant digits (or significant figures) in a measurement. In general significant figures are determined starting with the leftmost digit.
1. Non-zero digits are always significant. 2. All zeros between other significant digits are significant. 3. The number of significant figures is determined starting with the leftmost non-zero digit.
The leftmost non-zero digit is sometimes called the most significant digit or the most significant figure. For example, in the number 0.004205 the '4' is the most significant figure. The left-hand '0's are not significant. The zero between the '2' and the '5' is significant.
4. The rightmost digit of a decimal number is the least significant digit or least significant figure. Another way to look at the least significant figure is to consider it to be the rightmost digit when the number is written in scientific notation. Least significant figures are still significant. In the number 0.004205 (which may be written as 4.205 x 10P
-3P), the
'5' is the least significant figure. In the number 43.120 (which may be written as 4.3210 x 10P
1P), the '0' is the least significant figure.
5. If no decimal point is present, the rightmost non-zero digit is the least significant figure. In the number 5800, the least significant figure is '8'.
12.1.6.2 Precision and Uncertainty in Calculations
Measured quantities are often used in calculations. The precision of the calculation is limited by the precision of the measurements on which it is based.
Addition and Subtraction
When measured quantities are used in addition or subtraction, the uncertainty is determined by the absolute uncertainty in the least precise measurement (not by the number of significant figures). Sometimes this is considered to be the number of digits after the decimal point. Example: 32.01 grams 5.325 grams 12 grams
Added together, you will get 49.335 grams, but the sum should be reported as '49 grams'.
Multiplication and Division
When experimental quantities are multiplied or divided, the number of significant figures in the result is the same as that in the quantity with the smallest number of significant figures. If, for example, a density calculation is made in which 25.624 grams is divided by 25 mL, the density should be reported as 1.0 g/mL, not as 1.0000 g/mL or 1.000 g/mL. When doing several calculations, carry out all of the calculations to at least one more significant figure than you need, then round the final result.
Date: June 30, 2015 Revision No: 1
Author: D. Satterwhite Revision: N. Good
Page 187 of 221
12.1.6.3 Losing Significant Figures
Sometimes significant figures are 'lost' while performing calculations. For example, if the mass of a filter is found to be 53.110 g, add residue to the filter and find the mass of the filter plus residue to be 53.987 g, the mass of the residue is 53.987-53.110 g = 0.877 g The final value only has three significant figures, even though each mass measurement contained 5 significant figures.
12.1.6.4 Exact Numbers
Sometimes numbers used in a calculation are exact rather than approximate. This is true when using defined quantities, including many conversion factors, and when using pure numbers. Pure or defined numbers do not affect the accuracy of a calculation. These may be thought of as having an infinite number of significant figures. Pure numbers are easy to spot, because they have no units. Defined values or conversion factors, like measured values, may have units.
Example: To calculate the average of three measured titration volumes: 30.1 ml, 25.2 ml, 31.3 ml; calculate as follows: (30.1 + 25.2 + 31.3)/3 = 86.6/3 = 28.87 = 28.9 ml. There are three significant figures in the volumes; even though you are dividing the sum by a single digit, the three significant figures should be retained in the calculation.
12.1.7 Rounding
Whenever data is reduced using computer applications, the rounding rules used are those provided with the operating software. The final result should be rounded off to an appropriate number of significant figures (typically 2 significant figures). When manual calculations are performed, the following rounding rules are followed:
• If the digit to be dropped is less than 5, do not change the last digit to be retained (e.g., 2.23 rounds off to 2.2).
• If the digit to be dropped is greater than 5, increase the last digit to be retained by one (e.g., 2.26 rounds to 2.3).
• If the digit to be dropped is equal to 5, increase the last digit to be retained by one if it is odd (e.g., 2.35 rounds to 2.4, or do not change the last digit to be retained if it is even (e.g., 2.45 rounds to 2.4).
As a general rule, the results should be converted to the reporting units presented in Section 12.1.8. Other reporting conventions (i.e., wet weight instead of dry weight) should be clearly identified on the final reports with appropriate justification.
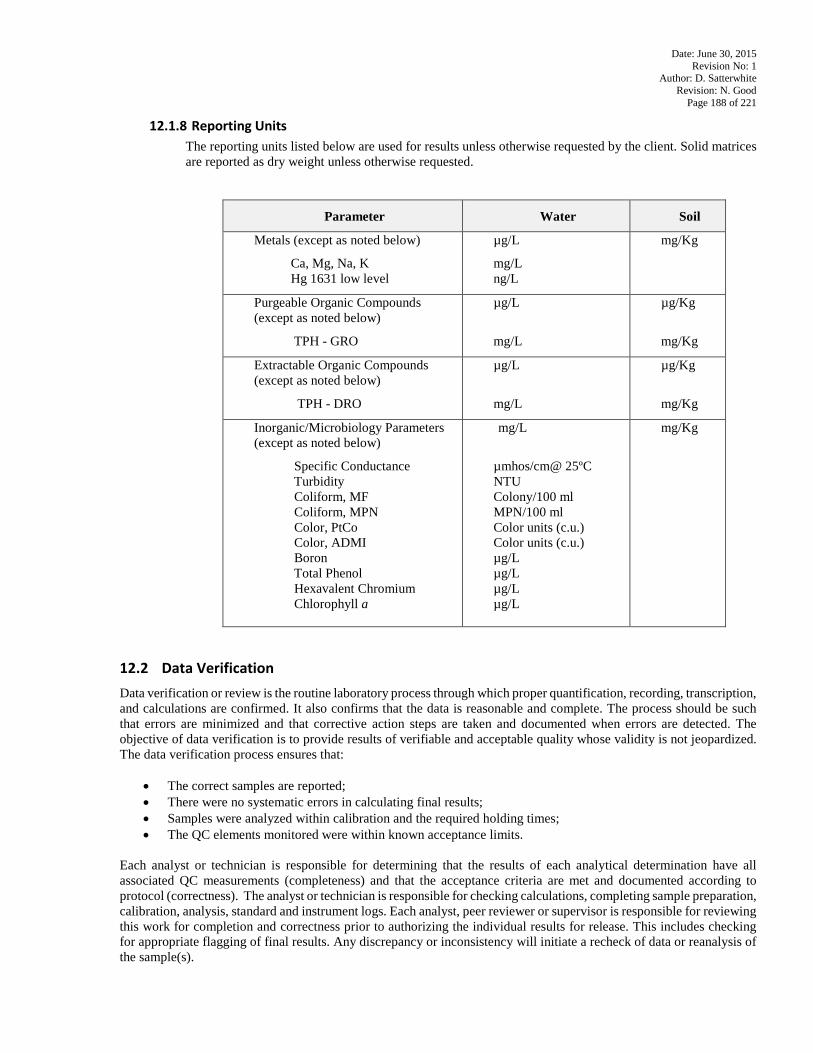
Date: June 30, 2015 Revision No: 1
Author: D. Satterwhite Revision: N. Good
Page 188 of 221
12.1.8 Reporting Units The reporting units listed below are used for results unless otherwise requested by the client. Solid matrices are reported as dry weight unless otherwise requested.
Parameter Water Soil
Metals (except as noted below)
Ca, Mg, Na, K Hg 1631 low level
µg/L
mg/L ng/L
mg/Kg
Purgeable Organic Compounds (except as noted below)
TPH - GRO
µg/L
mg/L
µg/Kg
mg/Kg
Extractable Organic Compounds (except as noted below)
TPH - DRO
µg/L
mg/L
µg/Kg
mg/Kg
Inorganic/Microbiology Parameters (except as noted below)
Specific Conductance Turbidity Coliform, MF Coliform, MPN Color, PtCo Color, ADMI Boron Total Phenol Hexavalent Chromium Chlorophyll a
mg/L
µmhos/cm@ 25ºC NTU Colony/100 ml MPN/100 ml Color units (c.u.) Color units (c.u.) µg/L µg/L µg/L µg/L
mg/Kg
12.2 Data Verification Data verification or review is the routine laboratory process through which proper quantification, recording, transcription, and calculations are confirmed. It also confirms that the data is reasonable and complete. The process should be such that errors are minimized and that corrective action steps are taken and documented when errors are detected. The objective of data verification is to provide results of verifiable and acceptable quality whose validity is not jeopardized. The data verification process ensures that:
• The correct samples are reported; • There were no systematic errors in calculating final results; • Samples were analyzed within calibration and the required holding times; • The QC elements monitored were within known acceptance limits.
Each analyst or technician is responsible for determining that the results of each analytical determination have all associated QC measurements (completeness) and that the acceptance criteria are met and documented according to protocol (correctness). The analyst or technician is responsible for checking calculations, completing sample preparation, calibration, analysis, standard and instrument logs. Each analyst, peer reviewer or supervisor is responsible for reviewing this work for completion and correctness prior to authorizing the individual results for release. This includes checking for appropriate flagging of final results. Any discrepancy or inconsistency will initiate a recheck of data or reanalysis of the sample(s).
Date: June 30, 2015 Revision No: 1
Author: D. Satterwhite Revision: N. Good
Page 189 of 221
The data verification process includes four steps: initial, secondary, and final review and release authorization.
12.2.1 Initial Review
Raw data is converted to reportable data and transcribed from benchsheets or instrument printouts onto standardized laboratory parameter spreadsheets by the analyst performing the test. The analyst performs the initial review of the data and data result entry. The analyst is responsible for verifying the correctness of the data entered into the DWR LABWORKS™ system. In some cases; such as organics, the data is not entered until all confirmations are complete. This initial review includes, but is not limited to, verifying that quality control indicators meet criteria, calibration criteria are met, appropriate detection limits were used, data was reduced correctly and that any corrective action was documented properly. The primary reviewer is responsible for verifying any documentation associated with the data, completing all records associated with the process, and completing sample anomaly reports as required. The analyst is responsible for assembling a data package containing all relevant raw data needed for data interpretation. This may include: benchsheets, instrument printouts such as quantitation reports, integrator peak area/height and retention time reports, chromatograms, and diagnostic reports. The analyst must perform primary review on 100% of the data generated.
12.2.2 Secondary Review A party other than the analyst generating the data (e.g., a peer within the same analytical area) is responsible for a secondary review of the data. This step is intended as a verification of the primary review. Secondary review focuses on laboratory data entries and calculations for errors and mistakes, calibration criteria, quality control indicators, compound identification, results expression, reporting limits, holding times, sample and standard preparation logs, data transcription and documentation. All data are verified. If problems exist during this review, the data is returned to the primary analyst and a 100% review is done and corrective action is performed as appropriate. Once the data is checked and deemed acceptable for reporting, the secondary reviewer dates and initials the quality control section on bench worksheets or on the cover page of computer-generated reports and submits the data to the supervisor or supervisor designee for final review. Specific checks required of the secondary reviewer are summarized in Figures 12.1 and 12.2.
12.2.3 Final Review
Final review must be performed prior to committing the data results to the DWR LABWORKS™ LIMS database by an individual familiar with it, but not involved in the original data reduction process (e.g., peer, supervisor or branch manager). The process includes, but is not limited to, verifying that chemical relationships are evaluated, sample ID numbers are correct, tests have been performed within the appropriate holding times, all precision and accuracy requirements are addressed, data transcription and data entry were performed correctly, narratives are present, flags are appropriate, SARs or sample comments on final report are attached, and project specific requirements are met. Data found to be of doubtful quality by the analyst, through internal audits or arising from customer concerns must be reviewed by a supervisor or the QA/QC Coordinator using the procedures outlined in Section 13. When all results for a sample have been entered into the database, the results are printed from the DWR LABWORKS™ system into a final report. The hard copy report is then checked for data entry errors by a second analyst. The report is then sent to the supervisors for release authorization. The laboratory QA/QC coordinator reviews random final printed reports quarterly for correctness of protocol of signatures, data and sample log in entries.
12.2.4 Release Authorization
This review ensures that client requirements have been met and that the final report has been properly completed. The process includes, but is not limited to, verifying that chemical relationships are evaluated, sample ID numbers are correct, tests have been performed within the appropriate holding times, the results
Date: June 30, 2015 Revision No: 1
Author: D. Satterwhite Revision: N. Good
Page 190 of 221
are relevant to historical values, project-specific requirements have been met, and the chain of custody was maintained. This action authorizes transmittal of the final report to the client. Figure 12.2 is a flow chart of the analytical data review and reporting process.
12.3 Reporting Each supervisor is responsible for authorizing the individual analysis results for release. After all the sample results are authorized, the Processing Assistant uses the DWR LABWORKS™ LIMS to generate final reports in electronic and hard copy format with the appended organics report (when applicable), and any associated anomaly reports which detail the reason data was qualified. The completed report package is sent to the Environmental Program Supervisors, Unit Supervisor, and Supervisor designee for release authorization. The Environmental Program Supervisor, Unit supervisors or program supervisor designee certify the hard copy reports by reviewing, dating and initialing. One report is retained with the original fieldsheets at the Water Sciences Section Chemistry Laboratory. The other report is mailed with copies of the fieldsheets to some clients. The report is accessible to end data uses once the report is released to the client. Some client access the final report in LABWORKS™ instead of receiving a hardcopy. All final sample results are archived in DWR LABWORKS™ LIMS databases and can be retrieved in the future if necessary.
12.3.1 Data Qualifier Codes
Data qualifier codes are used on reports as needed to inform the client of any additional information that might aid in the interpretation of the data. The data flagging system incorporates data qualifiers which are similar to flags specified in the Contract Laboratory Program protocols, and STORET, as well as additional flags used to help explain batch specific events. See Appendix II for qualifier codes and their definitions along with supporting information.
The decision to qualify a result on these factors is at the discretion of the authorizing supervisor and must comply with Water Sciences Section Chemistry Laboratory Standard Operating Procedures.
12.3.2 Report Format and Contents
Data is transmitted to laboratory data users in two ways: paper reports for each sample and by electronic read-only access. Final reports for test data are issued after all internal review has been completed. Electronic transfer of data is an option available to laboratory data users that have access to the laboratory network. Analytical results are issued in a format that mimics the sample submission fieldsheets in the case of inorganics. Since organic parameters are multi-analyte, a separate report is attached to this report. The final reports are printed, reviewed and signed by a supervisor or their designee. Persons designated to sign reports include the Section Chief, Branch Supervisors, Unit Supervisors, and the QA/QC Officer.
An example report can be found in Figure 12.1. At a minimum, the following information must be included on all reports:
• Name of laboratory; • Unique identification of the report (sample ID#) and of each page and the total number of
pages; • Name of the person or entity to report the results to; • Date received; • Date reported; • Sample priority; • Sample results with units of measurement; • Relevant SCUR/SAR forms; • Authorization signature/initials and date.
Date: June 30, 2015 Revision No: 1
Author: D. Satterwhite Revision: N. Good
Page 191 of 221
12.3.3 Corrected Reports Occasionally a report must be re-issued due to the addition of a test, or the correction of an error. When the report is re-issued, a notation of "REVISED REPORT" is to be placed on the page of the report along with a brief explanation of the correction and authorization initials and date. If it is not practical to include this information directly on the corrected page, a "text" flag can be placed in the result column of the report and a case narrative containing the explanation can be included with the report. Additionally, a SAR report is required whenever data is changed after authorization. This allows assessment of why the data review process failed to detect an error prior to authorization and release of data and assures that corrective actions are implemented, when possible to prevent future occurrence.
12.4 Data Storage
All data is maintained in such a manner that the records are easily retrievable by authorized personnel. These records may be in electronic or hard copy form. Records may be retained either as original records or as true copies such as photocopies, microfilm, microfiche, or other accurate reproductions of the original records. Adequate information should be available to allow reconstruction of the final results.
12.4.1 Hard copy records storage After the samples are completed, the hard copy raw and supporting data are stored and filed numerically, alphabetically, or chronologically by date or batch as appropriate for the type of record. The data are maintained in a secured area in the analytical unit in which the data were generated for approximately 1 year. Hard copies of the final reports with associated fieldsheets, COC forms and anomaly reports are filed chronologically in the front office of the Central Laboratory where they are maintained for approximately 3 years. Hard copy records are then transferred to storage boxes that are labeled with the month(s) and year(s) in which the records were generated and a brief content description. Each box is given a unique number and assigned an archive code. This code is entered into an archive log that includes a full description of the contents of each box. The archived boxes are stored on-site for approximately 5 years. Data which is expected to become part of a legal action will probably need to be maintained for a longer period of time. Legal counsel should be consulted in these cases. Data storage areas are protected against fire, theft, environmental deterioration and vermin. Data storage areas are regularly inspected as part of the Internal Audit program. Sample data relating to known litigation samples and subsamples will be stored in a locked file cabinet or other designated secure area maintained by the Section Chief. An archive access log is maintained to document entry into this cabinet. After the in-house storage period is up, records are processed and transferred to the State Records Center (SRC), 109 East Jones Street, Raleigh, NC. In accordance with the North Carolina Administrative Code, entry and access to the SRC building is limited to persons on official business. Access to stored records is restricted to the creating agency's staff. Persons other than an agency's staff must contact the appropriate agency and receive written permission prior to using records in the SRC. Procedures and forms required by the Center are identified in the State Records Center Handbook.
Currently, paper records are stored in their original form for a total of 10 years. After 10 years, the records are destroyed. Alternatively, some records may be processed for microfilming. These records include: • Correspondence between laboratory and client; • All fieldsheets and documentation on the sampling event; • All field and laboratory analytical records including supporting calibration, raw data, data reduction
calculations, quality control information and all data output records (chromatograms, strip charts and other instrument response readout records); Original raw analytical data. This also includes, but it not limited to logbooks, QC samples and analytical samples, MDLs, control limits, standard preparation, method reference and data review records.
Date: June 30, 2015 Revision No: 1
Author: D. Satterwhite Revision: N. Good
Page 192 of 221
• All field and laboratory custody records including shipping receipts, sample transmittal forms, and sample disposal records;
• All notebooks, data forms, and logs pertaining to laboratory operations including sample receipt and log in;
• All records and reports of maintenance, calibration and inspection of equipment and instrumentation; • All records concerning receipt, preparation and use of calibration standards; • All statistical calculations used in data reduction and in determination of quality control limits; • Quality Assurance records including, but not limited to, archived responses, PT sample results and raw
data, internal and external audit findings and employee training records. • Copies of final reports.
Retrieval of archived records (electronic or on paper) is done by referring to the archived records which contain the requester's name, agency, phone number, address, the archive code numbers, date, and the contents. Access to archived information is documented and requesters must complete a Records Retrieval form. Earlier revisions of SOPs and the Quality Assurance Manual are also archived. The document's "date" indicates the time the policy or procedure was first adopted. Subsequent revision dates indicate when the next revision was adopted.
12.4.2 Electronic records storage
All in-lab data generated by computer systems are printed and archived as hard copies. When the capability exists, data is stored to tape, CD or on hard disc. The tapes, CDs or discs are labeled and stored at the individual workstations and serve as backup copies of the lab's raw data files. Currently, only GC/MS data for organics is backed up and electronically stored on a regular basis (weekly) to CDs. Chromatograms and data files are given a unique alphanumeric identification by the chemists initiating the analyses in each unit. These file identification numbers reflect either the date the sequence was initiated, the order in which the samples were analyzed or the sample identification and log numbers given by the client and listed in the DWR-WSS Laboratory LABWORKS™ LIMS. Computer programs are verified initially and periodically by manual calculations and the calculations shall be kept on file. All records must be protected from environmental degradation; stored under secure conditions to discourage tampering or vandalism; and must be cross-indexed by laboratory ID number or some other common identifier for easy retrieval. DWR-Water Sciences Section LABWORKS™ LIMS data resides on a server maintained at the Western Data Center in Forest City NC. The server is programmed to backup daily. These daily tapes are retained for two weeks. Full back ups are done weekly and retained for one month.
Records, which are stored only on electronic media, must be maintained and supported in the laboratory by all hardware and software necessary for immediate data retrieval and review. If the laboratory changes its computer hardware or software, it will make provisions for transferring old data to the new system so that it remains retrievable.
12.4.3 Analytical notebooks/logbooks
Laboratory notebooks used to document pertinent information are stored within each analytical unit. Information contained in notebooks may include sample processing steps such as extractions and digestion records, instrument maintenance and routine checks, and standard and reagent preparations. Each notebook will have: • Notebook Number/Identifier - Each notebook is issued a unique number that is determined sequentially
or Identifier. • Used for - Purpose and department of notebook.
Date: June 30, 2015 Revision No: 1
Author: D. Satterwhite Revision: N. Good
Page 193 of 221
• Date placed into use - This is the date that the notebook begins with entries.
Guidelines for Logbook use are as follows: • Use permanent dark ink. No pencil entries are to be made. • Corrections - Use a single line to cross out documentation errors leaving the original record
visible. Date and initial the correction. • Blank pages or space between the last entry and the bottom of the page must be "Z'd" through,
initialed and dated. • Data must be entered directly and consecutively into the notebook. It is not to be placed onto
scratch paper and entered later. • Entries added to previously signed pages must be dated, initialed and witnessed (if appropriate)
below the new material. • Sign and date each page upon completion. • When pages are added to the notebook, they must be signed and dated across both the added
page and the notebook page. All notebooks are archived when they are complete and no longer in use.
In the organic areas, the following information is verified when applicable to the method being reviewed. • Dates (e.g., extraction, calibration, analysis) and verify that holding times are met. • Criteria for calibration, instrument tuning, internal standard areas, retention times, surrogate
recoveries and analytical quality control results are checked. • Method quality control data (e.g., blanks, spikes, duplicates, etc.) to assure the correct type and
amount of checks are performed and results are within control limits. • Compounds identified on the quantitation report were confirmed and agree with results reported
on data sheets. • Calculations such as total volatile hydrocarbons, soil concentrations, percent recoveries and
dilutions are checked. • Documentation of irregularities and if necessary data flagged when pre-established control
limits are not met.
In the inorganic and microbiological analytical areas, the second analysts check the following items prior to results being entered into the data management system. • Dates (extraction, digestion, calibration, incubation, analysis) and verify that holding times are
met. • Calibration criteria are met. • Method quality control data (e.g., blanks, QCS, spikes, etc.) to assure the correct type
and amount of checks are performed and results are within control limits. • Data entry into calculation programs designed to calculate final results. Calculated results • are checked against data bench worksheets for transcription errors. • Documentation of any irregularity is documented and; if necessary, data flagged when
pre-established control limits are not met. • Reasonableness of data relationships (e.g., ammonia nitrogen results should not exceed total
Kjeldahl nitrogen results).
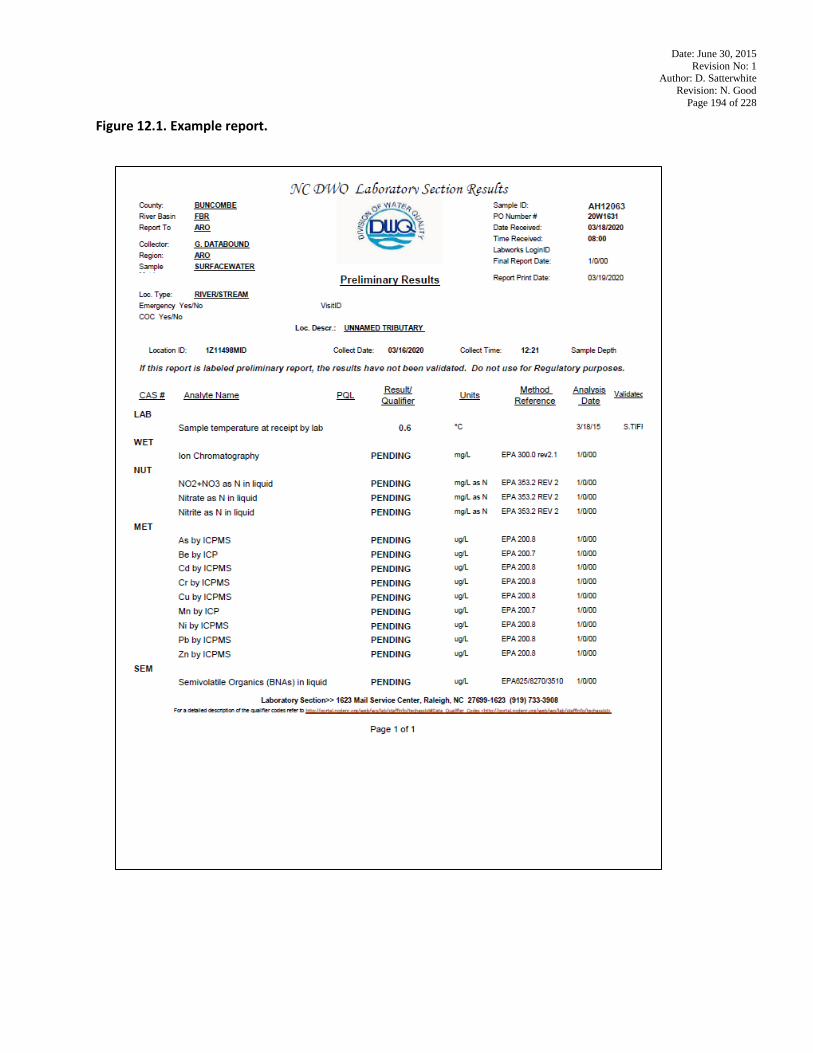
Date: June 30, 2015 Revision No: 1
Author: D. Satterwhite Revision: N. Good
Page 194 of 228
Figure 12.1. Example report.
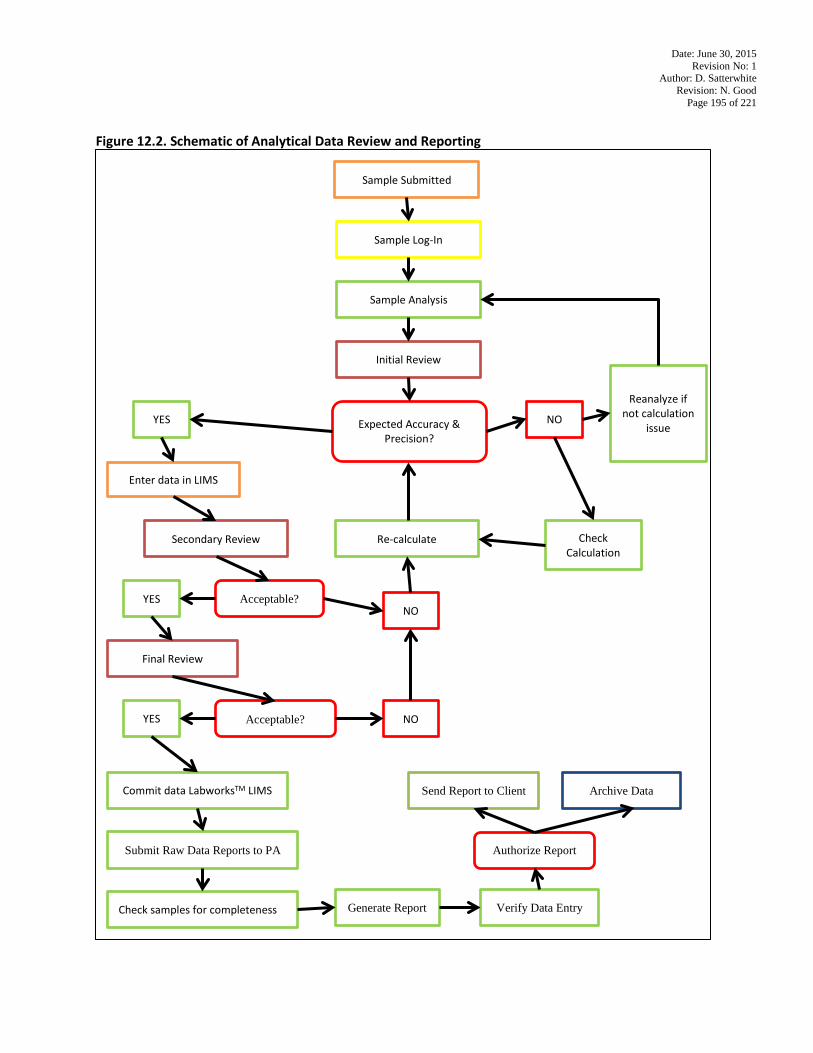
Date: June 30, 2015 Revision No: 1
Author: D. Satterwhite Revision: N. Good
Page 195 of 221
Figure 12.2. Schematic of Analytical Data Review and Reporting
Sample Submitted
Sample Log-In
Sample Analysis
Initial Review
Submit Raw Data Reports to PA
Reanalyze if not calculation
issue
Enter data in LIMS
Secondary Review Re-calculate
NO
Check Calculation
Expected Accuracy & Precision?
YES
YES NO
Final Review
Check samples for completeness
YES NO
Commit data LabworksTM LIMS
Acceptable?
Acceptable?
Generate Report Verify Data Entry
Send Report to Client
Authorize Report
Archive Data
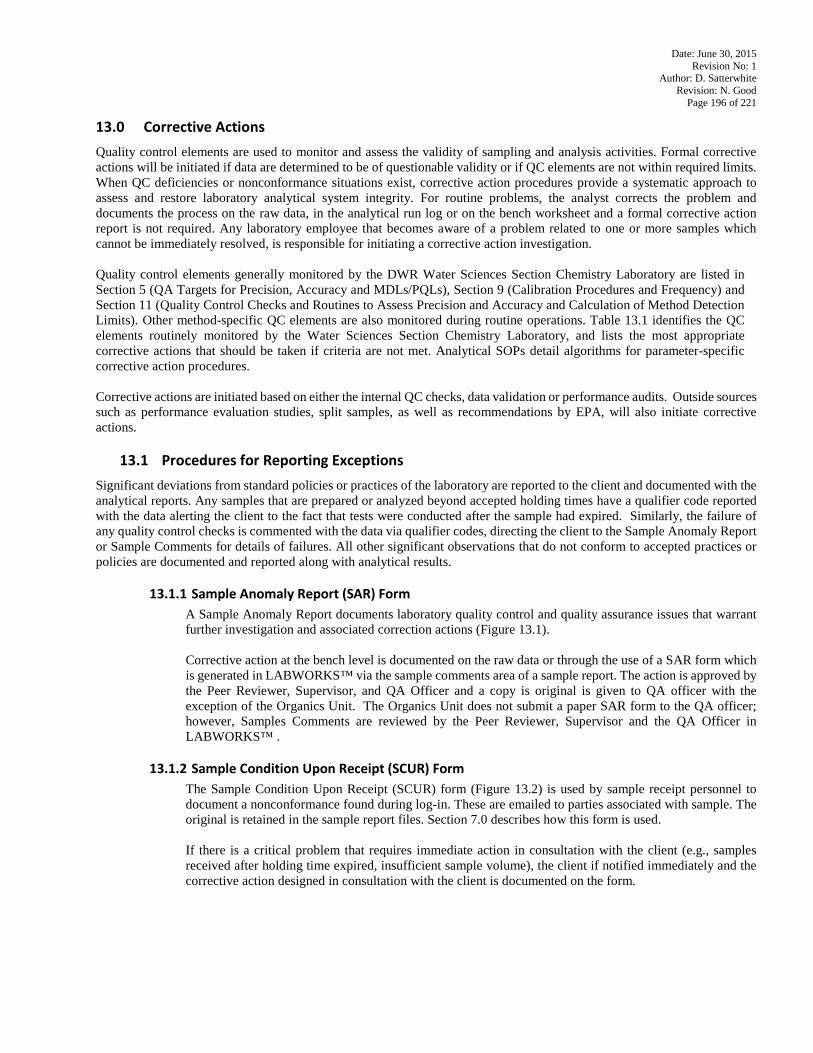
Date: June 30, 2015 Revision No: 1
Author: D. Satterwhite Revision: N. Good
Page 196 of 221
13.0 Corrective Actions Quality control elements are used to monitor and assess the validity of sampling and analysis activities. Formal corrective actions will be initiated if data are determined to be of questionable validity or if QC elements are not within required limits. When QC deficiencies or nonconformance situations exist, corrective action procedures provide a systematic approach to assess and restore laboratory analytical system integrity. For routine problems, the analyst corrects the problem and documents the process on the raw data, in the analytical run log or on the bench worksheet and a formal corrective action report is not required. Any laboratory employee that becomes aware of a problem related to one or more samples which cannot be immediately resolved, is responsible for initiating a corrective action investigation. Quality control elements generally monitored by the DWR Water Sciences Section Chemistry Laboratory are listed in Section 5 (QA Targets for Precision, Accuracy and MDLs/PQLs), Section 9 (Calibration Procedures and Frequency) and Section 11 (Quality Control Checks and Routines to Assess Precision and Accuracy and Calculation of Method Detection Limits). Other method-specific QC elements are also monitored during routine operations. Table 13.1 identifies the QC elements routinely monitored by the Water Sciences Section Chemistry Laboratory, and lists the most appropriate corrective actions that should be taken if criteria are not met. Analytical SOPs detail algorithms for parameter-specific corrective action procedures. Corrective actions are initiated based on either the internal QC checks, data validation or performance audits. Outside sources such as performance evaluation studies, split samples, as well as recommendations by EPA, will also initiate corrective actions.
13.1 Procedures for Reporting Exceptions Significant deviations from standard policies or practices of the laboratory are reported to the client and documented with the analytical reports. Any samples that are prepared or analyzed beyond accepted holding times have a qualifier code reported with the data alerting the client to the fact that tests were conducted after the sample had expired. Similarly, the failure of any quality control checks is commented with the data via qualifier codes, directing the client to the Sample Anomaly Report or Sample Comments for details of failures. All other significant observations that do not conform to accepted practices or policies are documented and reported along with analytical results.
13.1.1 Sample Anomaly Report (SAR) Form A Sample Anomaly Report documents laboratory quality control and quality assurance issues that warrant further investigation and associated correction actions (Figure 13.1).
Corrective action at the bench level is documented on the raw data or through the use of a SAR form which is generated in LABWORKS™ via the sample comments area of a sample report. The action is approved by the Peer Reviewer, Supervisor, and QA Officer and a copy is original is given to QA officer with the exception of the Organics Unit. The Organics Unit does not submit a paper SAR form to the QA officer; however, Samples Comments are reviewed by the Peer Reviewer, Supervisor and the QA Officer in LABWORKS™ .
13.1.2 Sample Condition Upon Receipt (SCUR) Form The Sample Condition Upon Receipt (SCUR) form (Figure 13.2) is used by sample receipt personnel to document a nonconformance found during log-in. These are emailed to parties associated with sample. The original is retained in the sample report files. Section 7.0 describes how this form is used. If there is a critical problem that requires immediate action in consultation with the client (e.g., samples received after holding time expired, insufficient sample volume), the client if notified immediately and the corrective action designed in consultation with the client is documented on the form.
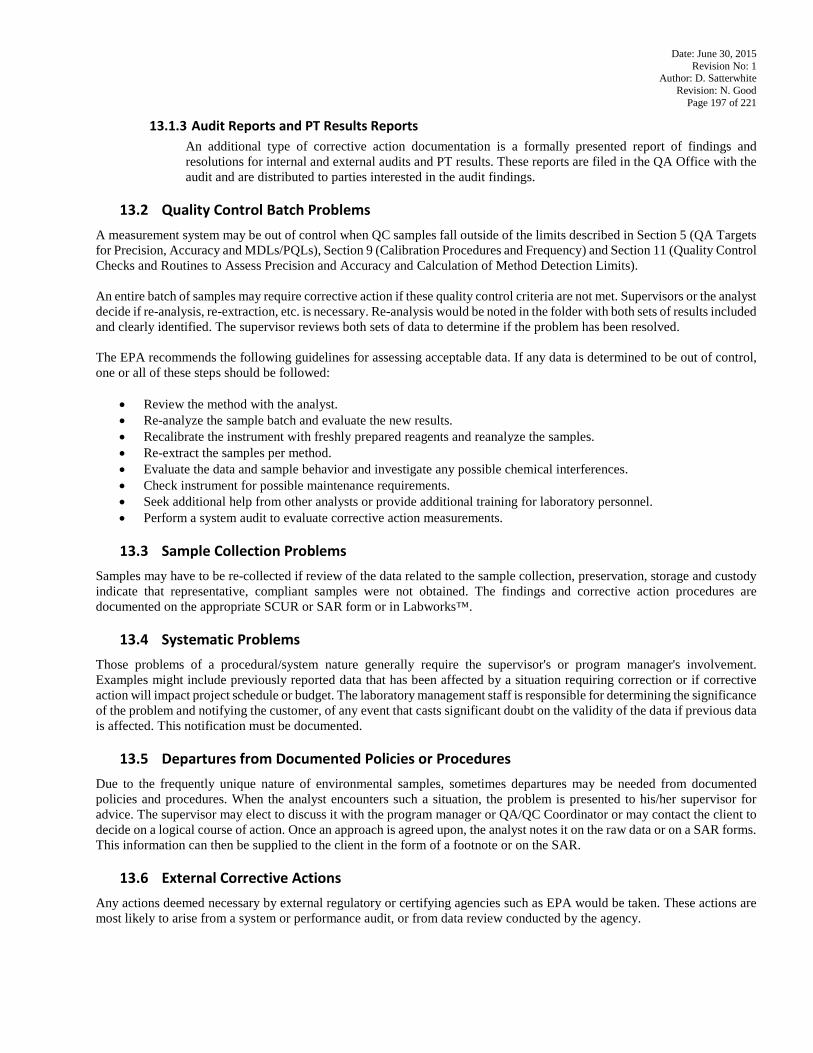
Date: June 30, 2015 Revision No: 1
Author: D. Satterwhite Revision: N. Good
Page 197 of 221
13.1.3 Audit Reports and PT Results Reports An additional type of corrective action documentation is a formally presented report of findings and resolutions for internal and external audits and PT results. These reports are filed in the QA Office with the audit and are distributed to parties interested in the audit findings.
13.2 Quality Control Batch Problems
A measurement system may be out of control when QC samples fall outside of the limits described in Section 5 (QA Targets for Precision, Accuracy and MDLs/PQLs), Section 9 (Calibration Procedures and Frequency) and Section 11 (Quality Control Checks and Routines to Assess Precision and Accuracy and Calculation of Method Detection Limits). An entire batch of samples may require corrective action if these quality control criteria are not met. Supervisors or the analyst decide if re-analysis, re-extraction, etc. is necessary. Re-analysis would be noted in the folder with both sets of results included and clearly identified. The supervisor reviews both sets of data to determine if the problem has been resolved. The EPA recommends the following guidelines for assessing acceptable data. If any data is determined to be out of control, one or all of these steps should be followed:
• Review the method with the analyst. • Re-analyze the sample batch and evaluate the new results. • Recalibrate the instrument with freshly prepared reagents and reanalyze the samples. • Re-extract the samples per method. • Evaluate the data and sample behavior and investigate any possible chemical interferences. • Check instrument for possible maintenance requirements. • Seek additional help from other analysts or provide additional training for laboratory personnel. • Perform a system audit to evaluate corrective action measurements.
13.3 Sample Collection Problems
Samples may have to be re-collected if review of the data related to the sample collection, preservation, storage and custody indicate that representative, compliant samples were not obtained. The findings and corrective action procedures are documented on the appropriate SCUR or SAR form or in Labworks™.
13.4 Systematic Problems Those problems of a procedural/system nature generally require the supervisor's or program manager's involvement. Examples might include previously reported data that has been affected by a situation requiring correction or if corrective action will impact project schedule or budget. The laboratory management staff is responsible for determining the significance of the problem and notifying the customer, of any event that casts significant doubt on the validity of the data if previous data is affected. This notification must be documented.
13.5 Departures from Documented Policies or Procedures
Due to the frequently unique nature of environmental samples, sometimes departures may be needed from documented policies and procedures. When the analyst encounters such a situation, the problem is presented to his/her supervisor for advice. The supervisor may elect to discuss it with the program manager or QA/QC Coordinator or may contact the client to decide on a logical course of action. Once an approach is agreed upon, the analyst notes it on the raw data or on a SAR forms. This information can then be supplied to the client in the form of a footnote or on the SAR.
13.6 External Corrective Actions Any actions deemed necessary by external regulatory or certifying agencies such as EPA would be taken. These actions are most likely to arise from a system or performance audit, or from data review conducted by the agency.
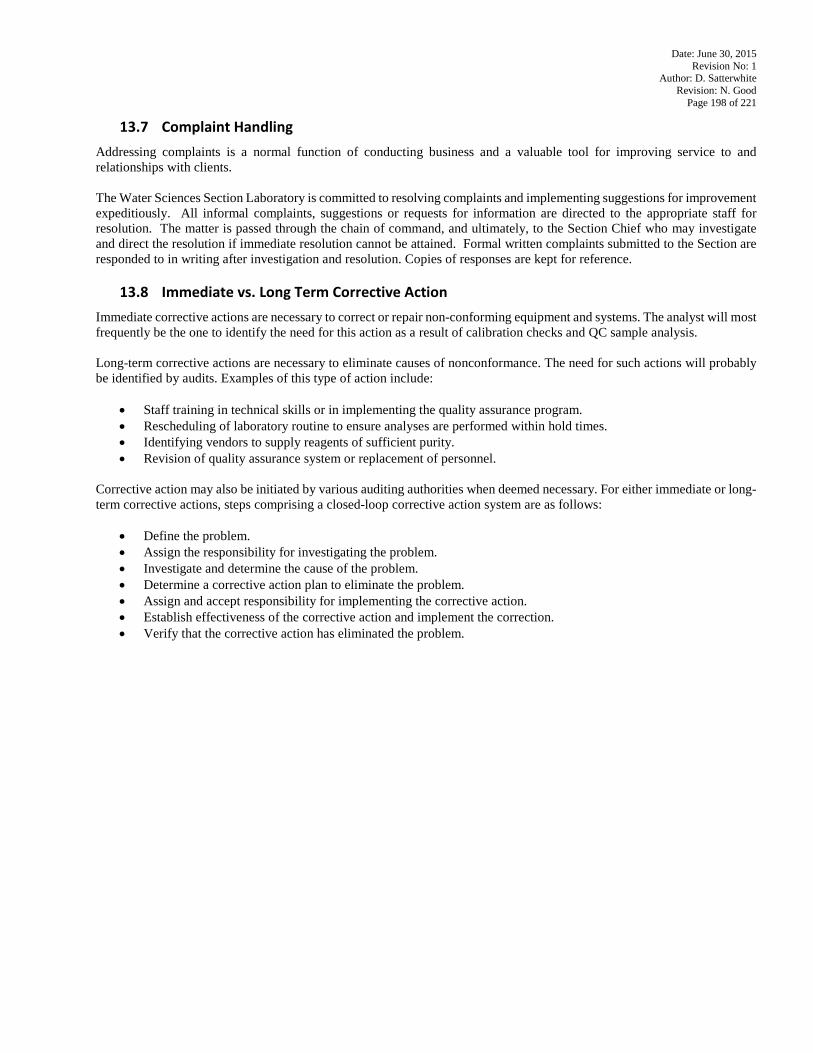
Date: June 30, 2015 Revision No: 1
Author: D. Satterwhite Revision: N. Good
Page 198 of 221
13.7 Complaint Handling Addressing complaints is a normal function of conducting business and a valuable tool for improving service to and relationships with clients. The Water Sciences Section Laboratory is committed to resolving complaints and implementing suggestions for improvement expeditiously. All informal complaints, suggestions or requests for information are directed to the appropriate staff for resolution. The matter is passed through the chain of command, and ultimately, to the Section Chief who may investigate and direct the resolution if immediate resolution cannot be attained. Formal written complaints submitted to the Section are responded to in writing after investigation and resolution. Copies of responses are kept for reference.
13.8 Immediate vs. Long Term Corrective Action Immediate corrective actions are necessary to correct or repair non-conforming equipment and systems. The analyst will most frequently be the one to identify the need for this action as a result of calibration checks and QC sample analysis. Long-term corrective actions are necessary to eliminate causes of nonconformance. The need for such actions will probably be identified by audits. Examples of this type of action include:
• Staff training in technical skills or in implementing the quality assurance program. • Rescheduling of laboratory routine to ensure analyses are performed within hold times. • Identifying vendors to supply reagents of sufficient purity. • Revision of quality assurance system or replacement of personnel.
Corrective action may also be initiated by various auditing authorities when deemed necessary. For either immediate or long-term corrective actions, steps comprising a closed-loop corrective action system are as follows:
• Define the problem. • Assign the responsibility for investigating the problem. • Investigate and determine the cause of the problem. • Determine a corrective action plan to eliminate the problem. • Assign and accept responsibility for implementing the corrective action. • Establish effectiveness of the corrective action and implement the correction. • Verify that the corrective action has eliminated the problem.
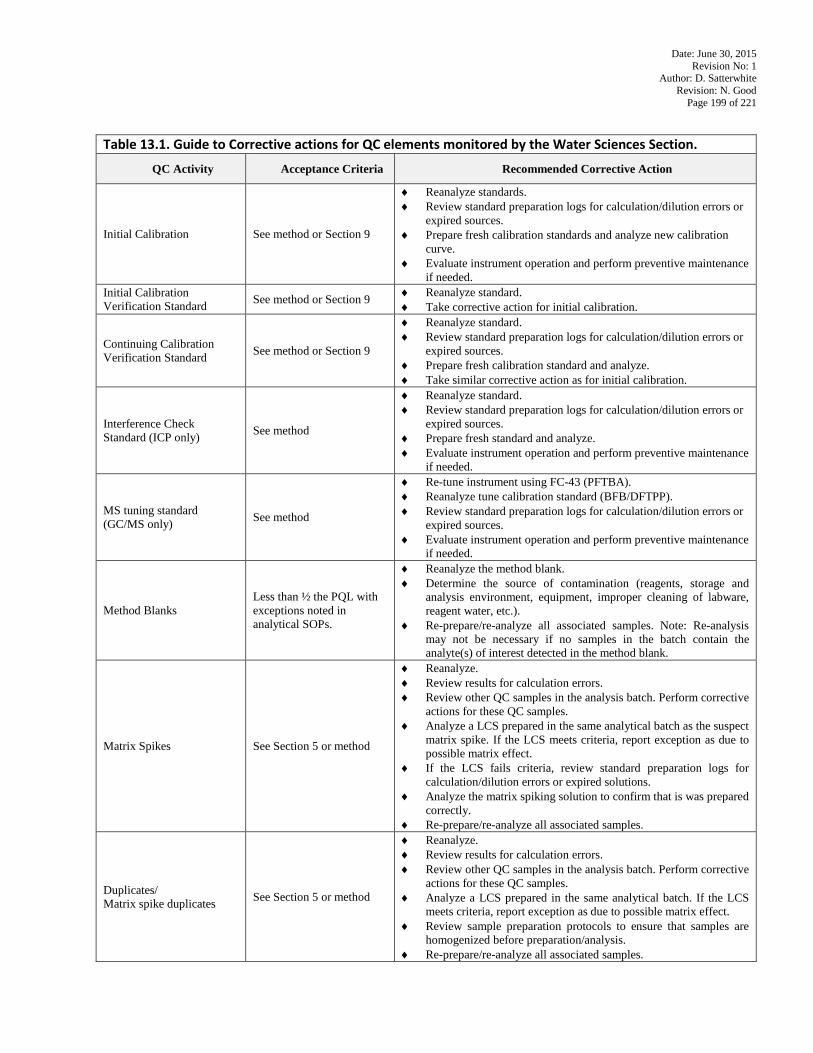
Date: June 30, 2015 Revision No: 1
Author: D. Satterwhite Revision: N. Good
Page 199 of 221
Table 13.1. Guide to Corrective actions for QC elements monitored by the Water Sciences Section.
QC Activity Acceptance Criteria Recommended Corrective Action
Initial Calibration See method or Section 9
♦ Reanalyze standards. ♦ Review standard preparation logs for calculation/dilution errors or
expired sources. ♦ Prepare fresh calibration standards and analyze new calibration
curve. ♦ Evaluate instrument operation and perform preventive maintenance
if needed. Initial Calibration Verification Standard See method or Section 9 ♦ Reanalyze standard.
♦ Take corrective action for initial calibration.
Continuing Calibration Verification Standard See method or Section 9
♦ Reanalyze standard. ♦ Review standard preparation logs for calculation/dilution errors or
expired sources. ♦ Prepare fresh calibration standard and analyze. ♦ Take similar corrective action as for initial calibration.
Interference Check Standard (ICP only) See method
♦ Reanalyze standard. ♦ Review standard preparation logs for calculation/dilution errors or
expired sources. ♦ Prepare fresh standard and analyze. ♦ Evaluate instrument operation and perform preventive maintenance
if needed.
MS tuning standard (GC/MS only) See method
♦ Re-tune instrument using FC-43 (PFTBA). ♦ Reanalyze tune calibration standard (BFB/DFTPP). ♦ Review standard preparation logs for calculation/dilution errors or
expired sources. ♦ Evaluate instrument operation and perform preventive maintenance
if needed.
Method Blanks Less than ½ the PQL with exceptions noted in analytical SOPs.
♦ Reanalyze the method blank. ♦ Determine the source of contamination (reagents, storage and
analysis environment, equipment, improper cleaning of labware, reagent water, etc.).
♦ Re-prepare/re-analyze all associated samples. Note: Re-analysis may not be necessary if no samples in the batch contain the analyte(s) of interest detected in the method blank.
Matrix Spikes See Section 5 or method
♦ Reanalyze. ♦ Review results for calculation errors. ♦ Review other QC samples in the analysis batch. Perform corrective
actions for these QC samples. ♦ Analyze a LCS prepared in the same analytical batch as the suspect
matrix spike. If the LCS meets criteria, report exception as due to possible matrix effect.
♦ If the LCS fails criteria, review standard preparation logs for calculation/dilution errors or expired solutions.
♦ Analyze the matrix spiking solution to confirm that is was prepared correctly.
♦ Re-prepare/re-analyze all associated samples.
Duplicates/ Matrix spike duplicates See Section 5 or method
♦ Reanalyze. ♦ Review results for calculation errors. ♦ Review other QC samples in the analysis batch. Perform corrective
actions for these QC samples. ♦ Analyze a LCS prepared in the same analytical batch. If the LCS
meets criteria, report exception as due to possible matrix effect. ♦ Review sample preparation protocols to ensure that samples are
homogenized before preparation/analysis. ♦ Re-prepare/re-analyze all associated samples.
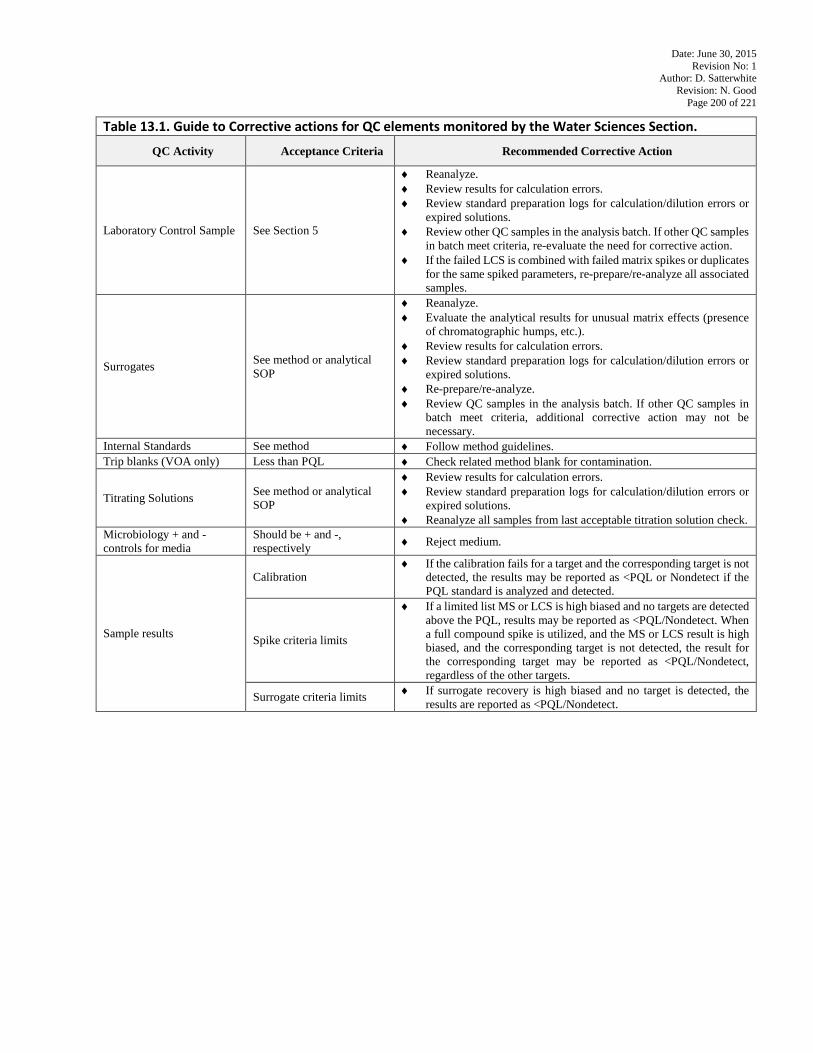
Date: June 30, 2015 Revision No: 1
Author: D. Satterwhite Revision: N. Good
Page 200 of 221
Table 13.1. Guide to Corrective actions for QC elements monitored by the Water Sciences Section.
QC Activity Acceptance Criteria Recommended Corrective Action
Laboratory Control Sample See Section 5
♦ Reanalyze. ♦ Review results for calculation errors. ♦ Review standard preparation logs for calculation/dilution errors or
expired solutions. ♦ Review other QC samples in the analysis batch. If other QC samples
in batch meet criteria, re-evaluate the need for corrective action. ♦ If the failed LCS is combined with failed matrix spikes or duplicates
for the same spiked parameters, re-prepare/re-analyze all associated samples.
Surrogates See method or analytical SOP
♦ Reanalyze. ♦ Evaluate the analytical results for unusual matrix effects (presence
of chromatographic humps, etc.). ♦ Review results for calculation errors. ♦ Review standard preparation logs for calculation/dilution errors or
expired solutions. ♦ Re-prepare/re-analyze. ♦ Review QC samples in the analysis batch. If other QC samples in
batch meet criteria, additional corrective action may not be necessary.
Internal Standards See method ♦ Follow method guidelines. Trip blanks (VOA only) Less than PQL ♦ Check related method blank for contamination.
Titrating Solutions See method or analytical SOP
♦ Review results for calculation errors. ♦ Review standard preparation logs for calculation/dilution errors or
expired solutions. ♦ Reanalyze all samples from last acceptable titration solution check.
Microbiology + and - controls for media
Should be + and -, respectively ♦ Reject medium.
Sample results
Calibration ♦ If the calibration fails for a target and the corresponding target is not
detected, the results may be reported as <PQL or Nondetect if the PQL standard is analyzed and detected.
Spike criteria limits
♦ If a limited list MS or LCS is high biased and no targets are detected above the PQL, results may be reported as <PQL/Nondetect. When a full compound spike is utilized, and the MS or LCS result is high biased, and the corresponding target is not detected, the result for the corresponding target may be reported as <PQL/Nondetect, regardless of the other targets.
Surrogate criteria limits ♦ If surrogate recovery is high biased and no target is detected, the results are reported as <PQL/Nondetect.
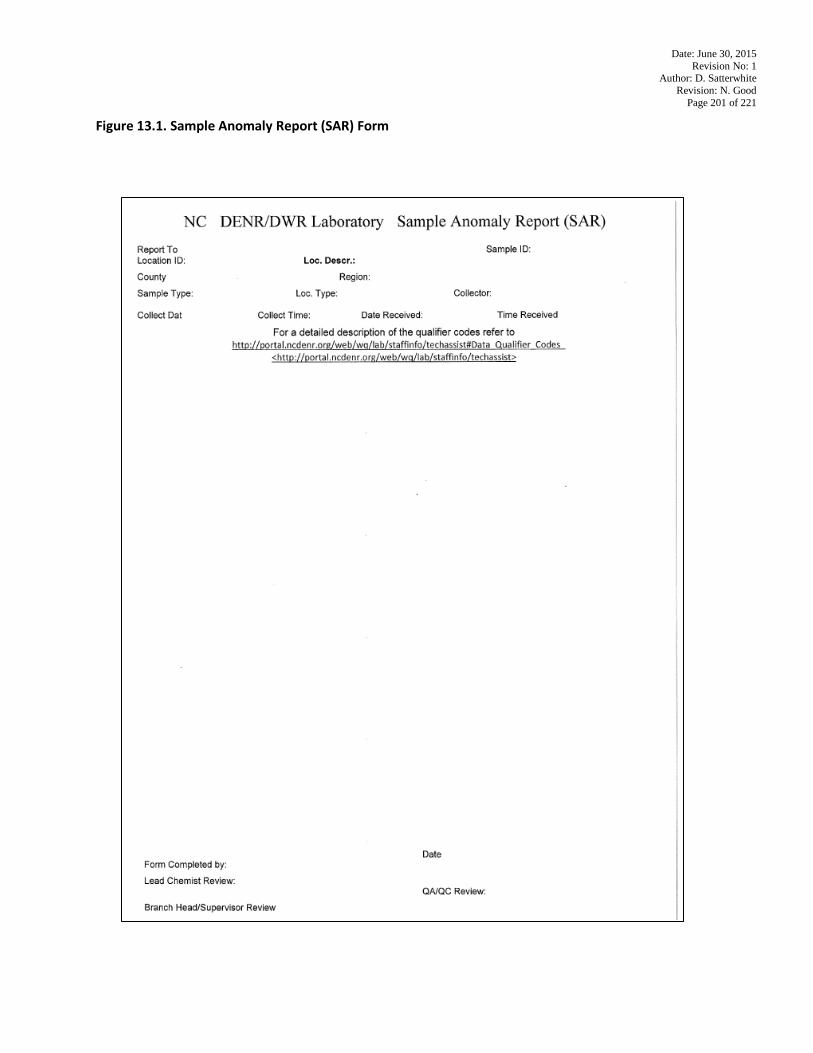
Date: June 30, 2015 Revision No: 1
Author: D. Satterwhite Revision: N. Good
Page 201 of 221
Figure 13.1. Sample Anomaly Report (SAR) Form
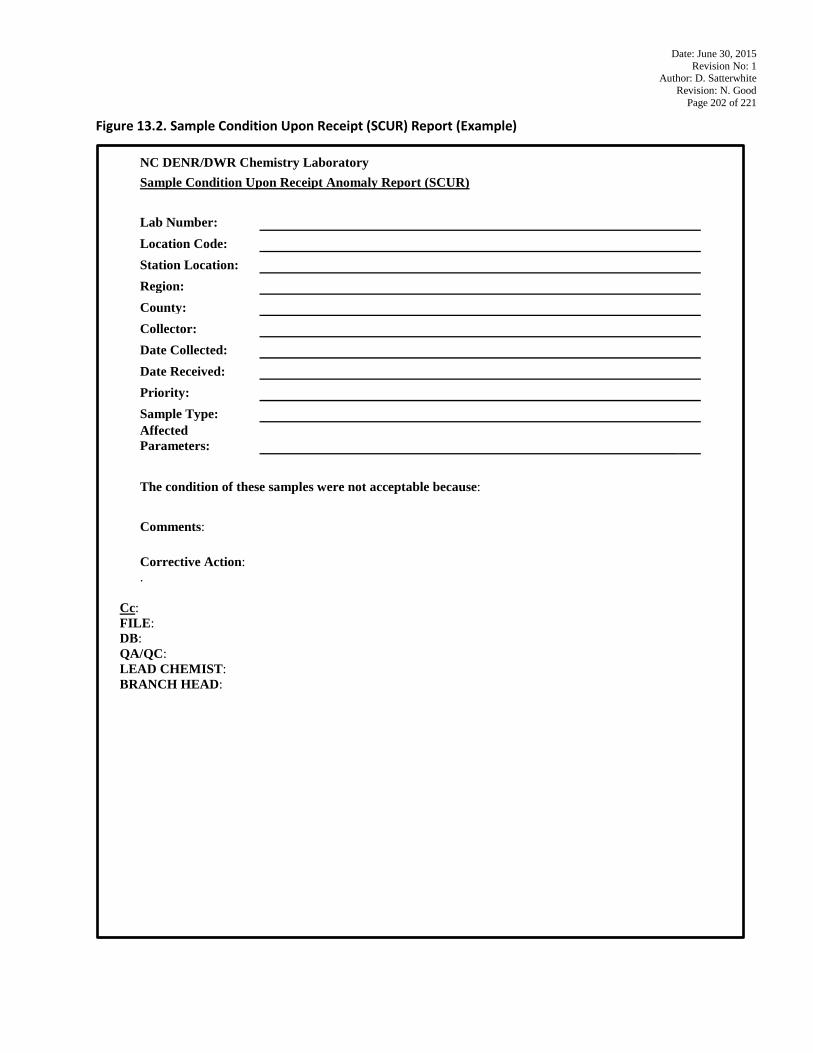
Date: June 30, 2015 Revision No: 1
Author: D. Satterwhite Revision: N. Good
Page 202 of 221
Figure 13.2. Sample Condition Upon Receipt (SCUR) Report (Example)
NC DENR/DWR Chemistry Laboratory Sample Condition Upon Receipt Anomaly Report (SCUR)
Lab Number: Location Code: Station Location: Region: County: Collector: Date Collected: Date Received: Priority: Sample Type: Affected Parameters: The condition of these samples were not acceptable because:
Comments: Corrective Action: .
Cc: FILE: DB: QA/QC: LEAD CHEMIST: BRANCH HEAD:
Date: June 30, 2015 Revision No: 1
Author: D. Satterwhite Revision: N. Good
Page 203 of 221
14.0 Performance and Systems Audits Internal and external audits are conducted regularly at the DWR WSS Laboratory to ensure that the guidance provided in this document and in other related documents is followed. Internal audits are performed by the QA/QC coordinator, which is responsible for all QA/QC function in the laboratory, and members of the professional laboratory staff that do not normally work in the section or analytical unit being audited. External audits are conducted by persons who are not direct employees of the DWR WSS Laboratory (generally EPA Region 4) to provide an independent and unbiased review of laboratory operations. NC DWR WSS Laboratory Certification Staff at least once every three years, performs a full scale audit/review of the DWR WSS Central and Asheville Regional Office Laboratories. There are two types of audits: systems audits and performance audits
1) Systems audits include management system review, quality systems review and technical systems reviews.
System audits involve an in-depth review and evaluation of some or all components of the analytical laboratory to determine the proper application of guidelines listed in the Quality Management Plan (QMP) and Quality Assurance Manual (QAM).
2) Performance audits are part of Quality Systems review and require the analysis of blind samples or other samples whose values are not known o the analytical areas. The DWR WSS Laboratory participates in Round Robin Studies for those parameters that do not have availability of purchasing blind samples. These results are used to evaluate the accuracy of the laboratory analytical system. Quality control elements are used to monitor and assess the validity of sampling and analysis activities. Formal corrective actions will be initiated if data are determined to be of questionable validity or if QC elements are not within required limits. When QC deficiencies or nonconformance situations exist, corrective action procedures provide a systematic approach to assess and restore laboratory analytical system integrity. For routine problems, the analyst corrects the problem and documents the process on the raw data, in the analytical run log or on the bench worksheet and a formal corrective action report is not required. Any laboratory employee that becomes aware of a problem related to one or more samples which cannot be immediately resolved, is responsible for initiating a corrective action investigation.
14.1 System Audits Systems audits may be initiated either internally or externally.
14.1.1 Internal audits It is the responsibility of the QA/QC Coordinator to plan and organize audits as required by a predetermined schedule and as requested by management. Such audits shall be carried out by the QA/QC Coordinator or trained and qualified personnel who are wherever resources permit, independent of the activity being audited. Personnel shall not audit their own activities except when it can be demonstrated that an effective audit will be carried out. System audits evaluate procedures and documentation in the laboratory. Additional audits may be necessary throughout the year to address specific project requirement, problem troubleshooting or issues that arise from other audits. The QA/QC Coordinator conducts several systems audit during each calendar year which may be in combination with in house training. During these audits, one or more components of the laboratory will be reviewed to determine if that part is functioning in compliance with the Water Sciences Section Chemistry Laboratory Quality Management Plan, the Water Sciences Section Chemistry Laboratory Quality Assurance Manual, the approved standard operating procedures and approved methodology.
Date: June 30, 2015 Revision No: 1
Author: D. Satterwhite Revision: N. Good
Page 204 of 221
An audit report will include a list of deficiencies that must be addressed in order to correct or improve the laboratory operations.
(1) Selected systems will be audited every three months with a goal of auditing all systems
once per year.
(2) The QA/QC Coordinator or WSS Laboratory Certification Staff will conduct the audits.
(3) The audit will consist of the submittal of blind samples or the random selection of previously reported samples, tracking of these samples through the system, evaluation of sample results, and a follow-up laboratory audit.
(4) System components to be audited will include, but are not limited to:
(j) All documentation associated with sample and data handling, to include linkage
mechanism employed between all records for tracking documentation for any sample data result.
(ii) Use of established, approved procedures as outlined in this Quality Assurance
Manual. (iii) Personnel training records. (iv) Proper execution of established procedures. (v) Anomaly reports and follow-up to corrective actions from previous audits,
external audits, performance testing samples or blind samples. (vi) Review of Initial Demonstration Of Capabilities and Method Detection Limit
Studies (vii) Sample and data handling activities include:
[a] All sample log-in, routing and disposal.
[b] Sample preparations
[c] Method calibrations
[d] Sample analyses
[e] Data reduction, validation and reporting
[f] Preventive maintenance and repair procedures
[g] Standard and reagent preparation, documentation and storage
[h] Sample and waste disposal
[i] Container and labware decontamination
[j] QC management practices and assessment of analytical precision, accuracy and sensitivity
(5) Deficiency lists and associated corrective action orders will be formally communicated
to responsible staff.
Date: June 30, 2015 Revision No: 1
Author: D. Satterwhite Revision: N. Good
Page 205 of 221
14.1.2 External Audits External audits are performed when certifying agencies or clients submit a sample for analysis or conduct on-site inspections. It is the Water Sciences Section Chemistry Laboratory's policy to cooperate fully with certifying agencies. It is also our policy to comply fully with system audits conducted by regulatory agencies and clients. Currently, these regulatory agencies and clients include: (1) EPA, Region IV; for selected systems, on an 18-60 month basis, depending on budget
constraints; and
(2) USGS; selected systems; per-project basis
14.2 Proficiency Testing and Round Robin Samples
The lab participates in an annual Proficiency Testing (PT) program and Round Robin studies. Double blind PTs are obtained from a proficiency testing sample provider recognized by The NELAC Institute (TNI) and approved by the North Carolina Wastewater/Groundwater Laboratory Certification (NC WW/GW LC) program. Currently, PT providers must be accredited by the American Association for Laboratory Accreditation (A2LA) and Assured Calibration and Laboratory Accreditation (ACLASS). Round Robin studies are initiated by North Carolina Wastewater/Groundwater Laboratory Certification (NC WW/GWLC) program for Chlorophyll-a. Full volume PTs and Round Robin samples follow normal hold time procedures and storage requirements unless the vendor-supplied directions instruct otherwise. Login will obtain the documentation provided with the PTs and fieldsheets will be reviewed by the QA/QC Coordinator or other designated staff prior to delivery to the analytical work areas. However, for PTs, holding time begins when the vial is opened. All PT and Round Robin samples are analyzed and the results reported in a manner consistent with the routine analysis and reporting requirements of compliance samples and any other samples routinely analyzed by the laboratories. PT samples are entered into the laboratory samples receipt log as samples and tracked through the laboratory as routine environmental samples. Their preparation is also documented. The lab retains all records necessary to facilitate historical reconstruction of the analysis and reporting of analytical results for PT samples for a minimum of five years. These records include a copy of the reporting form used by the laboratory to report the analytical results to the PT provider. If the analytical results are entered or uploaded electronically to a provider website, the laboratory retains a copy of the on-line data entry summary or similar documentation from the PT provider website. Vials will be prepared as required in the instruction set provided with the samples. After preparation to full volume, the sample may be spiked, digested, concentrated, etc., as would be done for any normal sample requiring similar analysis. PT samples will not undergo multiple preparations, multiple runs, multiple methods (unless being used to evaluate multiple methods), or multiple dilutions, unless this is what would be done to a normal client sample. No special reviews shall be performed by operation and QA, unless this is what would be done to a normal client sample. To the degree that special report forms or login procedures are required by the PT supplier, it is reasonable that the laboratory would apply special review procedures, as would be done for any client requesting unusual reporting or login processes. Special QC samples can be included in the analytical run if this is what would be done with normal client samples under similar circumstances. North Carolina Wastewater/Groundwater Laboratory Certification (NC WW/GW LC) program arranges sample collection and submission and provides Round Robin Study instructions.
It is however recognized that PT samples are often not representative of "real world" samples either in their form (e.g., vials) or content (e.g., multiple target analyte hits) and as such, present the laboratory with special challenges. It is the policy of DWR that PT samples be treated as typical samples in the normal production process whenever this is possible. Further, where PT samples present special or unique problems in the normal production process they need to be treated differently, as would any special or unique request submitted by any client.
Date: June 30, 2015 Revision No: 1
Author: D. Satterwhite Revision: N. Good
Page 206 of 221
Whenever a DWR-WSS Laboratory fails a PT or Round Robin sample the WSS Laboratory must take the steps below. When greater than or equal to 80% of analytes are acceptable, for multi-analyte parameters (e.g., organic analyses), but one or more individual analytes are graded unacceptable, acceptable performance has been demonstrated for the parameter method technology. The laboratory, must, however, analyze a remedial PT for the individual analytes that were graded unacceptable. NC DWR WSS Laboratory Certification Staff at least once every three years, performs a full scale audit/review of the DWR WSS Central and Asheville Regional Office Laboratories.
• Take steps to identify the root cause of the failure • Take corrective action • Report the corrective action taken to the Unit Supervisor and Environmental Program Supervisor • Complete a DWR WSS Laboratory Corrective Action Report (CAR) (Note: Appendix I Corrective Action Report) • Submit the Corrective Action Report to the QA Officer after management approval. • Participate in a second blind PT or Round Robin Study.
No further action is necessary if the remedial PT results and corrective action report are acceptable. Failure of a second remedial PT or Round Robin results in all data analysis for failed parameters being qualified OR halting analysis for failed parameter. When a remedial PT or follow up Round Robin is graded unacceptable for an individual analyte (constituting a second unacceptable result) for multi-analyte parameters, the laboratory must quality data for those individual analytes as “estimated” (whether detected or not) until acceptable results are obtained on two consecutive remedial PTs. Internal and external audits are conducted regularly at the DWR WSS Laboratory to ensure that the guidance provided in this document and in other related documents is followed. Internal audits are performed by the QA/QC coordinator, which is responsible for all QA/QC function in the laboratory, and members of the professional laboratory staff that do not normally work in the section or analytical unit being audited. External audits are conducted by persons who are not direct employees of the DWR WSS Laboratory (generally EPA Region 4) to provide an independent and unbiased review of laboratory operations.
14.3 Quality Systems Management Review The QA/QC Coordinator conducts an annual review of its quality systems to ensure its continuing suitability and effectiveness in meeting client and regulatory requirements and to introduce any necessary changes or improvements. Program Supervisors may be included in this process. This review uses information generated during the preceding year to assess the "big picture" by ensuring that routine quality actions taken and reviewed on a semiannual basis are not components of systematic concerns. The semiannual review (Section 15) should keep the quality systems current and effective; therefore, the annual review is a formal senior management process to review specific existing documentation. Significant issues from the following documentation are summarized by the QA/QC Coordinator prior to the review meeting.
• Matters arising from the previous annual review. • Prior Quality Assurance Reports. • Review of report reissue request. • Minutes form prior meetings. • Internal and External audits.
Consider:
• Adequacy of staff, equipment and facility resources. • Future plans for resources and testing capability and capacity.
Date: June 30, 2015 Revision No: 1
Author: D. Satterwhite Revision: N. Good
Page 207 of 221
14.4 Corrective Actions All deficiencies found during audits are reported to the Section Chief. Audit information is also provided through a semi-annual report. The Section Chief and QA/QC Coordinator agree upon a time frame for correction. The lab’s response and corrective action procedures are evaluated by the QA/QC Coordinator and when acceptable are attached to each audit and filed. If issues arise that may require method suspension or restriction, the procedures in Section 13 are followed. External audits often require written reports that include proof of correction. The QA coordinates this written response. Written responses to PT’s are required. The response must address the reason for any “unacceptable or “check for error” result. In some cases is may be necessary for blind QC samples to be submitted to the laboratory to show a return to control.
14.5 Report Audits Routine report audits are the responsibility of the laboratory Quality Assurance Officer. The QA Officer performs an independent systems review of reports generated by the laboratory. The QA Officer will quarterly review random final reports for completeness (proper signature, login entry etc.). The QA Officer may review one or more parameters data of final report. Areas for review may include COC, correspondence with the analytical request, batch QC status, completeness of any corrective action statements, 5% of calculations, format, holding time, sensibility and completeness of the contents. A list of reports reviewed is maintained in an audit file.
Date: June 30, 2015 Revision No: 1
Author: D. Satterwhite Revision: N. Good
Page 208 of 221
15.0 Quality Assurance Reports Quality assurance reports to laboratory management are required to keep them informed about how the laboratory QA program is progressing. Items in which performance is not satisfactory are addressed and a plan for corrective action prepared and implemented.
15.1 Internal Reports A semi-annual QA report is prepared by the QA/QC Coordinator. This information is circulated to the Section Chief and branch managers. An example format with the minimum required topics for reporting is illustrated in Figure 15.1. Reports of internal laboratory audits and all performance audits are addressed to the Section Chief, who in turn distributes them to the management staff for corrective action, as needed. Results of external laboratory audits are routed to the management staff through the Section Chief for corrective action, if required. The QA/QC Coordinator ensures that corrective actions are implemented.
15.2 External Reports The QA/QC Coordinator will prepare external QA reports for specific projects, agencies or clients that may require it. These will be addressed to the client or data user at the frequency and in the format mandated by the specific project requirements.
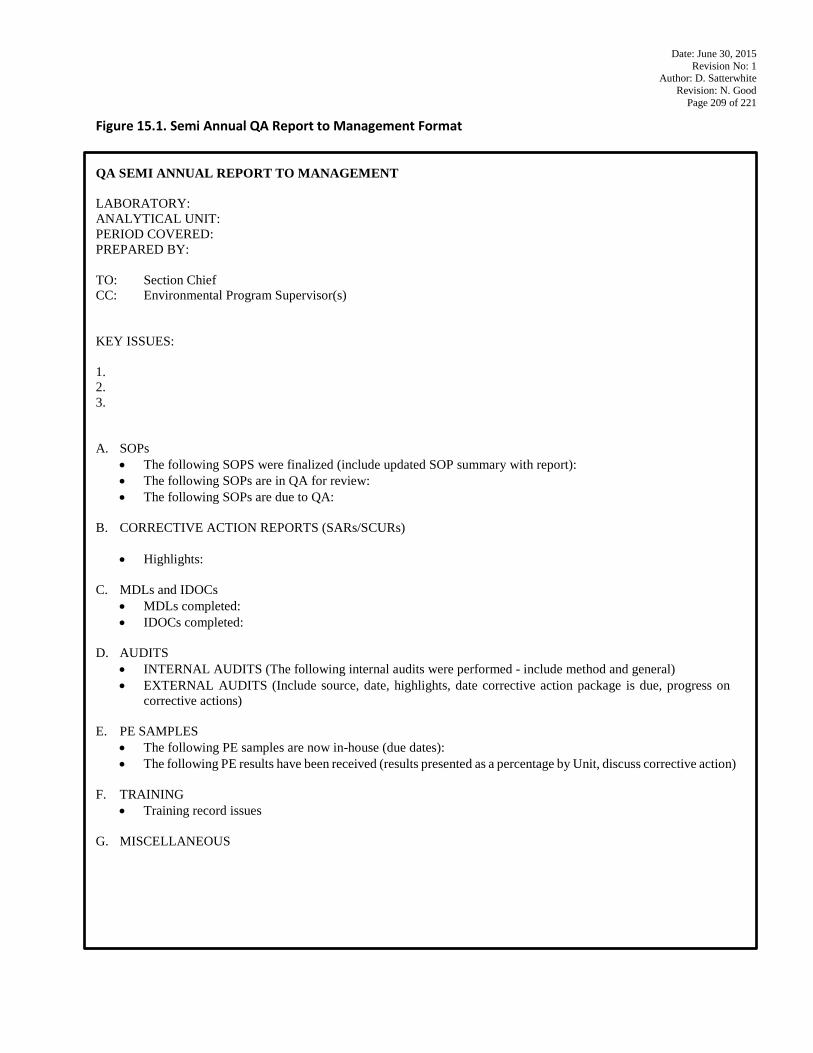
Date: June 30, 2015 Revision No: 1
Author: D. Satterwhite Revision: N. Good
Page 209 of 221
Figure 15.1. Semi Annual QA Report to Management Format QA SEMI ANNUAL REPORT TO MANAGEMENT LABORATORY: ANALYTICAL UNIT: PERIOD COVERED: PREPARED BY: TO: Section Chief CC: Environmental Program Supervisor(s) KEY ISSUES: 1. 2. 3. A. SOPs
• The following SOPS were finalized (include updated SOP summary with report): • The following SOPs are in QA for review: • The following SOPs are due to QA:
B. CORRECTIVE ACTION REPORTS (SARs/SCURs)
• Highlights:
C. MDLs and IDOCs
• MDLs completed: • IDOCs completed:
D. AUDITS
• INTERNAL AUDITS (The following internal audits were performed - include method and general) • EXTERNAL AUDITS (Include source, date, highlights, date corrective action package is due, progress on
corrective actions) E. PE SAMPLES
• The following PE samples are now in-house (due dates): • The following PE results have been received (results presented as a percentage by Unit, discuss corrective action)
F. TRAINING
• Training record issues G. MISCELLANEOUS
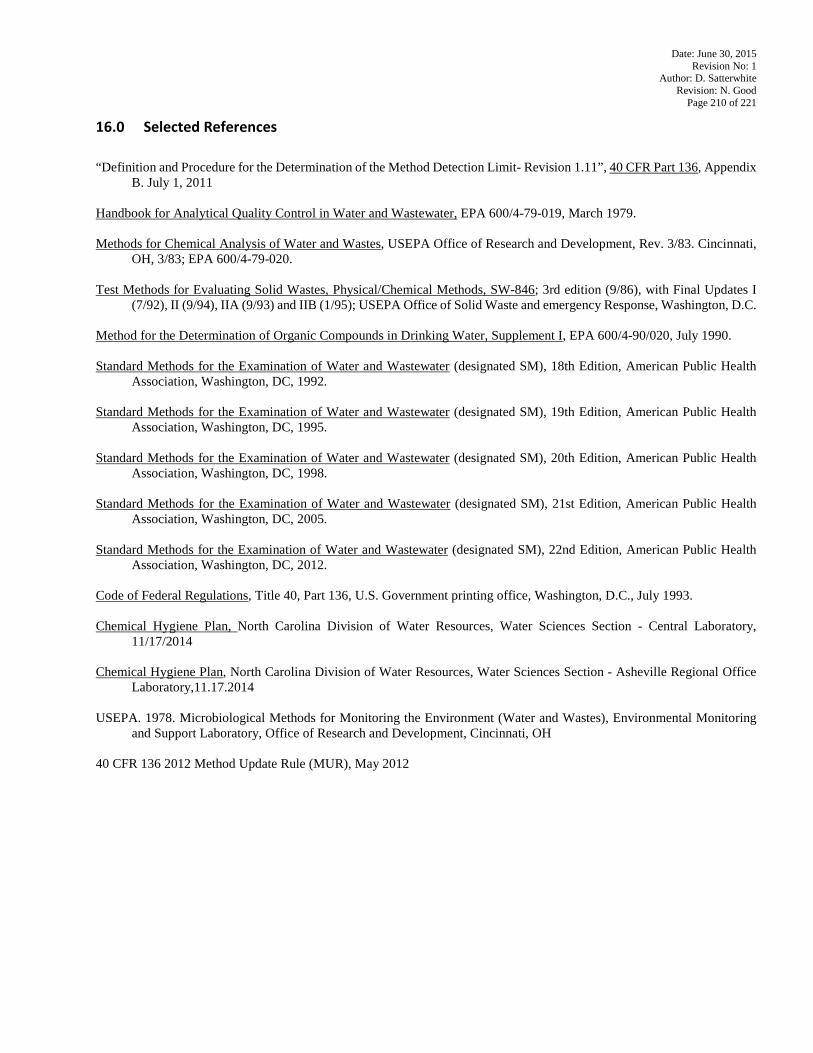
Date: June 30, 2015 Revision No: 1
Author: D. Satterwhite Revision: N. Good
Page 210 of 221
16.0 Selected References “Definition and Procedure for the Determination of the Method Detection Limit- Revision 1.11”, 40 CFR Part 136, Appendix
B. July 1, 2011 Handbook for Analytical Quality Control in Water and Wastewater, EPA 600/4-79-019, March 1979. Methods for Chemical Analysis of Water and Wastes, USEPA Office of Research and Development, Rev. 3/83. Cincinnati,
OH, 3/83; EPA 600/4-79-020. Test Methods for Evaluating Solid Wastes, Physical/Chemical Methods, SW-846; 3rd edition (9/86), with Final Updates I
(7/92), II (9/94), IIA (9/93) and IIB (1/95); USEPA Office of Solid Waste and emergency Response, Washington, D.C. Method for the Determination of Organic Compounds in Drinking Water, Supplement I, EPA 600/4-90/020, July 1990. Standard Methods for the Examination of Water and Wastewater (designated SM), 18th Edition, American Public Health
Association, Washington, DC, 1992. Standard Methods for the Examination of Water and Wastewater (designated SM), 19th Edition, American Public Health
Association, Washington, DC, 1995. Standard Methods for the Examination of Water and Wastewater (designated SM), 20th Edition, American Public Health
Association, Washington, DC, 1998. Standard Methods for the Examination of Water and Wastewater (designated SM), 21st Edition, American Public Health
Association, Washington, DC, 2005. Standard Methods for the Examination of Water and Wastewater (designated SM), 22nd Edition, American Public Health
Association, Washington, DC, 2012. Code of Federal Regulations, Title 40, Part 136, U.S. Government printing office, Washington, D.C., July 1993. Chemical Hygiene Plan, North Carolina Division of Water Resources, Water Sciences Section - Central Laboratory,
11/17/2014 Chemical Hygiene Plan, North Carolina Division of Water Resources, Water Sciences Section - Asheville Regional Office
Laboratory,11.17.2014 USEPA. 1978. Microbiological Methods for Monitoring the Environment (Water and Wastes), Environmental Monitoring
and Support Laboratory, Office of Research and Development, Cincinnati, OH 40 CFR 136 2012 Method Update Rule (MUR), May 2012
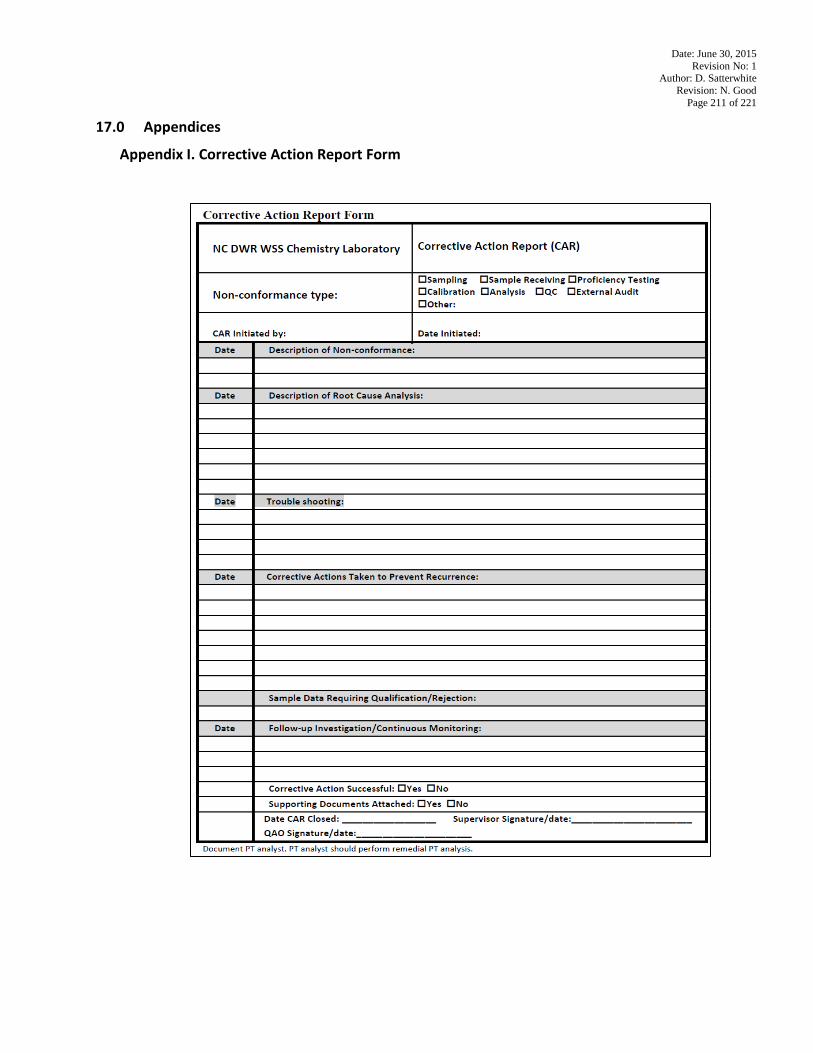
Date: June 30, 2015 Revision No: 1
Author: D. Satterwhite Revision: N. Good
Page 211 of 221
17.0 Appendices
Appendix I. Corrective Action Report Form
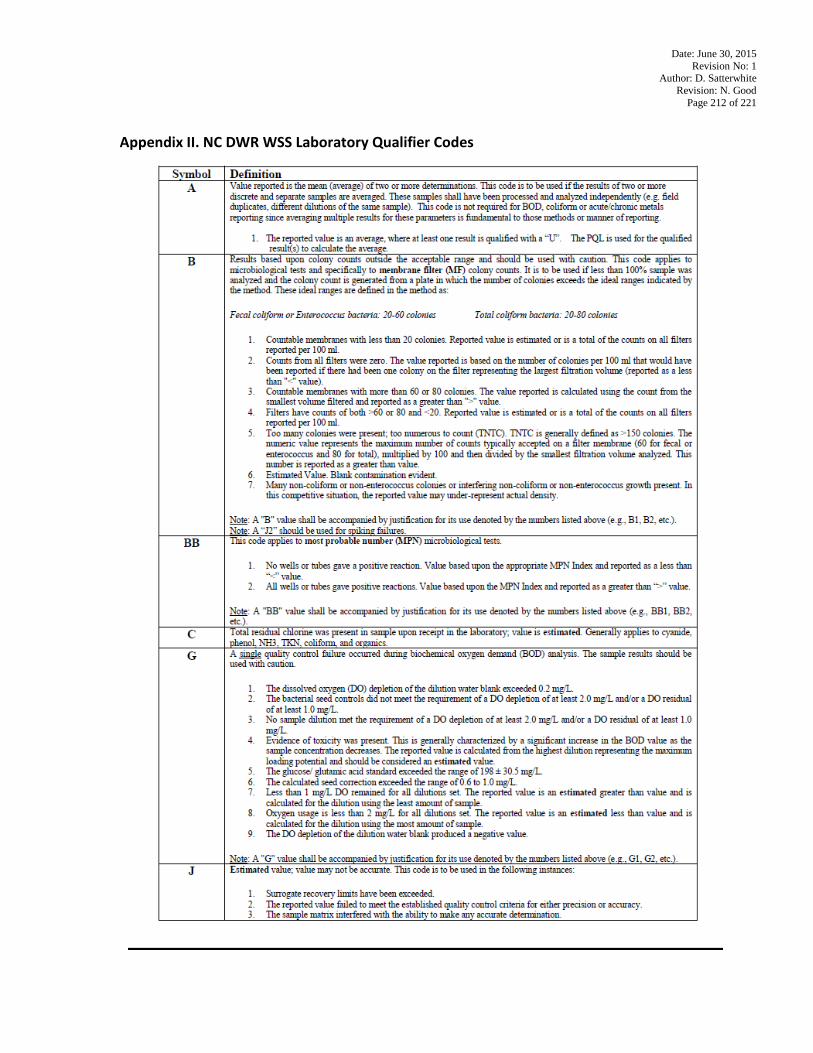
Date: June 30, 2015 Revision No: 1
Author: D. Satterwhite Revision: N. Good
Page 212 of 221
Appendix II. NC DWR WSS Laboratory Qualifier Codes
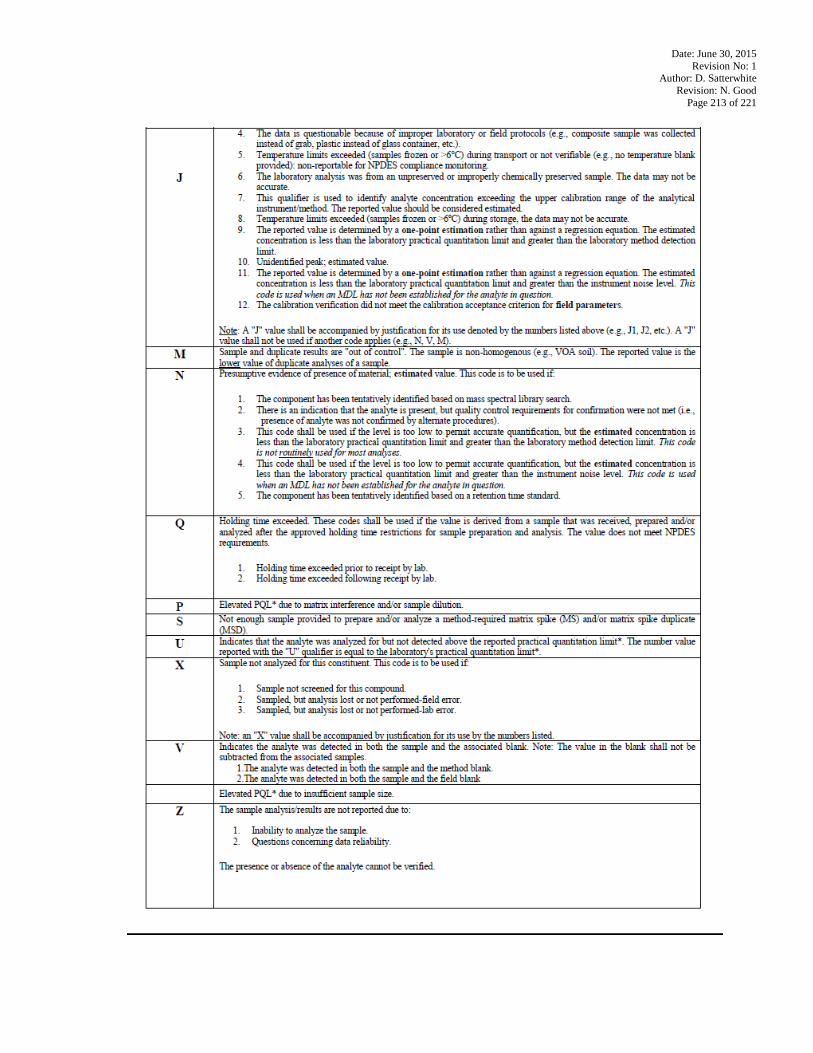
Date: June 30, 2015 Revision No: 1
Author: D. Satterwhite Revision: N. Good
Page 213 of 221
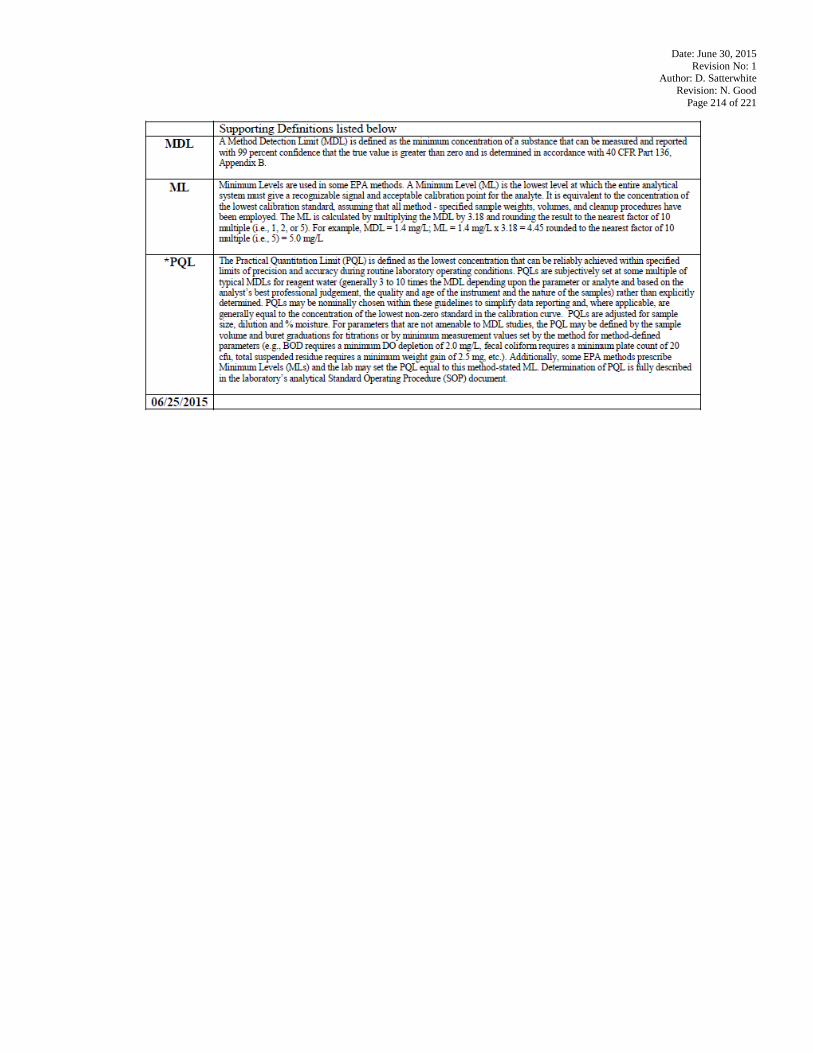
Date: June 30, 2015 Revision No: 1
Author: D. Satterwhite Revision: N. Good
Page 214 of 221
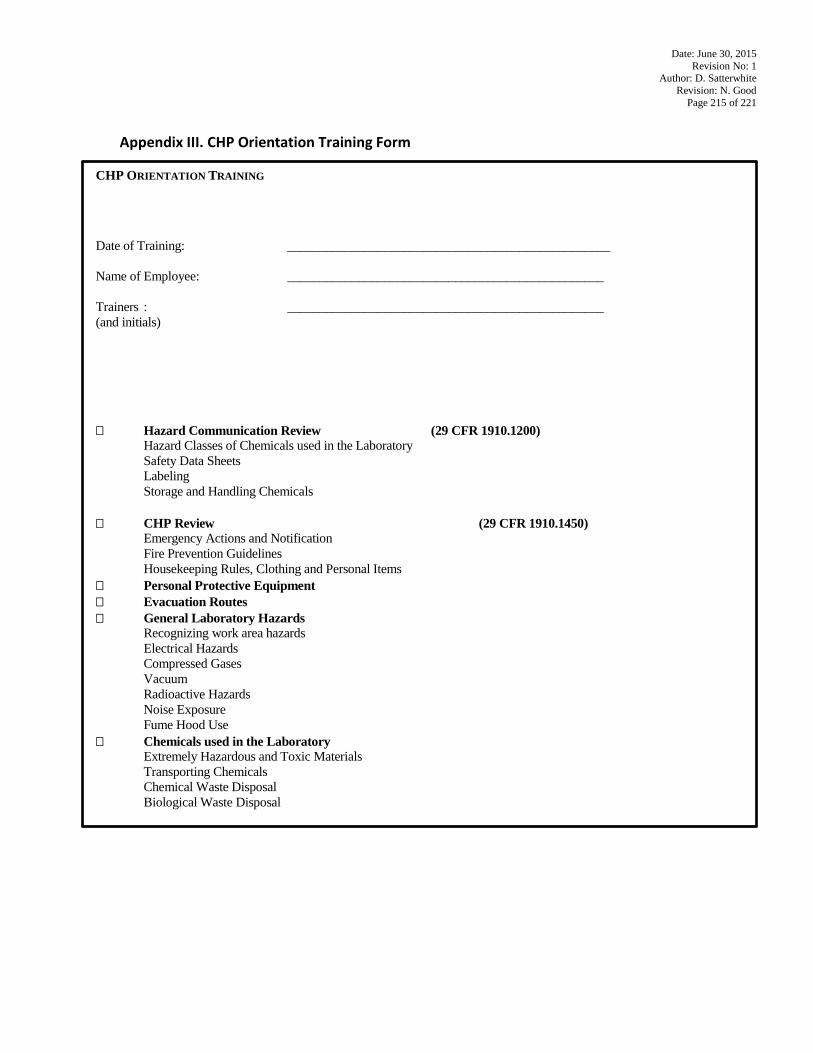
Date: June 30, 2015 Revision No: 1
Author: D. Satterwhite Revision: N. Good
Page 215 of 221
Appendix III. CHP Orientation Training Form
CHP ORIENTATION TRAINING
Date of Training: __________________________________________________ Name of Employee: _________________________________________________ Trainers : _________________________________________________ (and initials) � Hazard Communication Review (29 CFR 1910.1200) Hazard Classes of Chemicals used in the Laboratory Safety Data Sheets Labeling Storage and Handling Chemicals � CHP Review (29 CFR 1910.1450) Emergency Actions and Notification Fire Prevention Guidelines Housekeeping Rules, Clothing and Personal Items � Personal Protective Equipment � Evacuation Routes � General Laboratory Hazards Recognizing work area hazards Electrical Hazards Compressed Gases Vacuum Radioactive Hazards Noise Exposure Fume Hood Use � Chemicals used in the Laboratory Extremely Hazardous and Toxic Materials Transporting Chemicals Chemical Waste Disposal Biological Waste Disposal
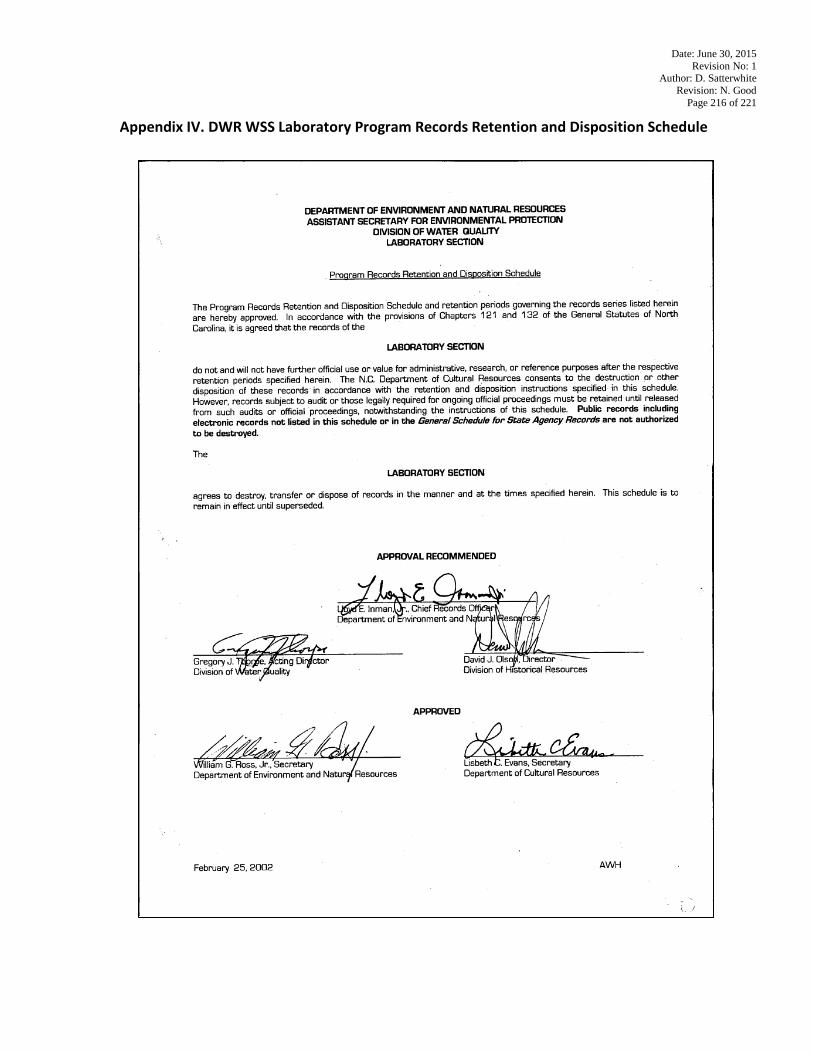
Date: June 30, 2015 Revision No: 1
Author: D. Satterwhite Revision: N. Good
Page 216 of 221
Appendix IV. DWR WSS Laboratory Program Records Retention and Disposition Schedule
Date: June 30, 2015 Revision No: 1
Author: D. Satterwhite Revision: N. Good
Page 217 of 221
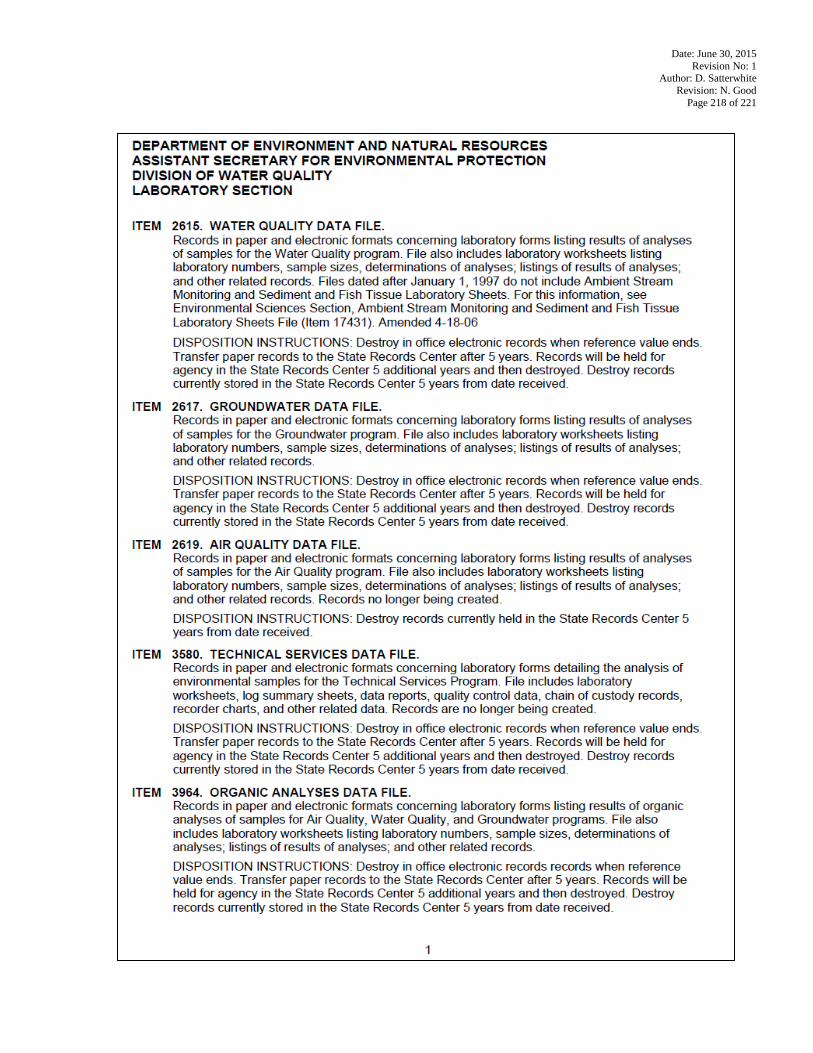
Date: June 30, 2015 Revision No: 1
Author: D. Satterwhite Revision: N. Good
Page 218 of 221
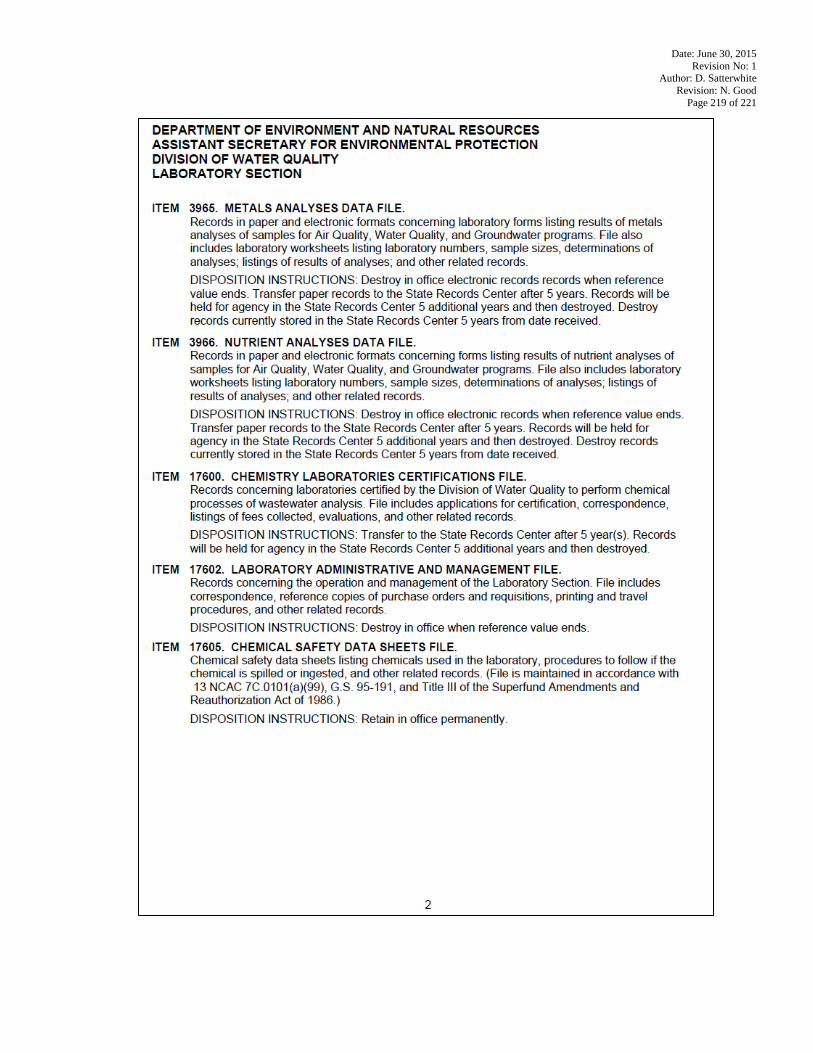
Date: June 30, 2015 Revision No: 1
Author: D. Satterwhite Revision: N. Good
Page 219 of 221
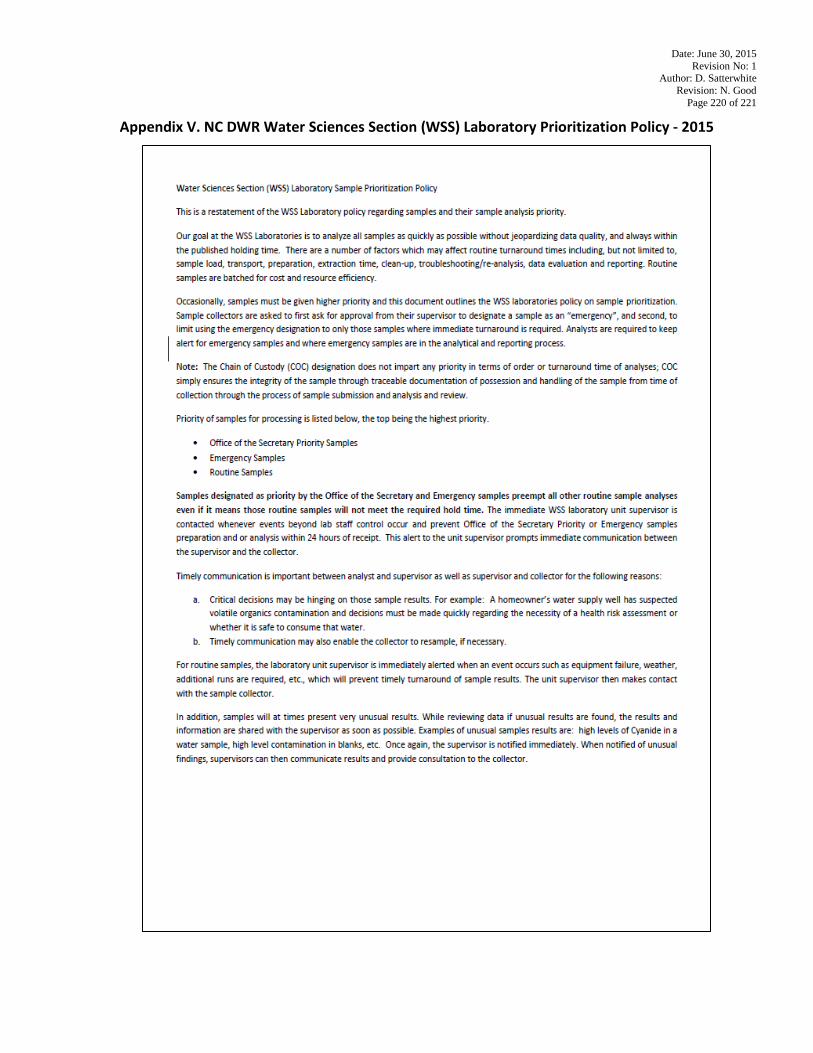
Date: June 30, 2015 Revision No: 1
Author: D. Satterwhite Revision: N. Good
Page 220 of 221
Appendix V. NC DWR Water Sciences Section (WSS) Laboratory Prioritization Policy - 2015
Date: June 30, 2015 Revision No: 1
Author: D. Satterwhite Revision: N. Good
Page 221 of 221
Appendix VI. North Carolina (NC) Division of Water Resources (DWR) Water Sciences Section (WSS) Chemistry Laboratories Initial Demonstration of Capability (IDOC) Policy - May 09, 2016 North Carolina (NC) Division of Water Resources (DWR) Water Sciences Section (WSS) Chemistry Laboratories Initial Demonstration of Capability (IDOC) Policy - May 09, 2016 Initial Demonstration of Capability -The analysis of a set of known concentration samples or standards used to document an analyst's ability to perform an analytical procedure correctly. The results of the analyses must meet the precision and accuracy criteria of the method and in the absence of method criteria, meet the precision and accuracy of the laboratory criteria. Analyst initial demonstration of capability shall be performed initially prior to the independent analysis of any samples. Instrumentation demonstration of capability shall be performed prior to independent sample analysis for reporting by a given method. Initial demonstration of capability is to be performed on any sample matrix for which analyses are performed and for any cleanup procedure employed. Anytime there is a change in staff for sample analysis or major change in instrumentation such as a column type change and for change in any cleanup procedure employed, an IDOC must be performed. (For units that have analyst rotations, once an analyst has performed an IDOC for a parameter method, the IDOC is valid for each rotation thereafter unless there is a change in the method or the instrumentation. A method change or instrumentation change requires a new IDOC.) Method requirements for accuracy and precision for an IDOC take precedence and must be followed when an analyst performs an IDOC. North Carolina DWR WSS Laboratories SOP requirements are followed only if IDOC requirements are not specified in the method. In the case where method-specific IDOC acceptance criteria are not specified in-house acceptance limits criteria must be developed as stated below:
1) In-house limits must be derived from a minimum of 20 results 2) Acceptance limits for recovery are set at ± three standard deviations from the mean recovery. 3) Once derived, in-house limits are to be approved and signed off on by branch supervisor and Quality Assurance
coordinator. 4) If there are no existing guidelines for limits, default limits will be used until such time that twenty spike values
are derived and limits can be calculated. In most instances, per cent recovery default limits for inorganic analyses will be set at 85-115% and per cent recovery limits for organic analyses at 70-130%.
In the case where method-specific acceptance criteria are not specified for IDOC evaluation, precision will be no tighter than 10% and no greater than 20% for Relative Standard Deviation (%RSD). (%RSD may be set at a higher percentage at 30% for historically difficult analyses at the discretion of the QA Coordinator or Branch Manager.) When two methods are referenced and method-specific IDOC acceptance criteria are specified, the IDOC evaluation will adhere to the more strict method of the two. Note: Whether using in-house limits or method-specified limits, if the IDOC study does not pass, the entire study is to be repeated. Example: Four replicates were evaluated. One of the four replicates obviously has resulted in the study failing. Four new replicate samples will need to be analyzed. Demonstration of capability may be performed using quality control samples or other predetermined regiment for demonstration of proficiency in a given test method for those analytes that do not lend themselves to spiking. Each SOP should spell out the regiment for performing and evaluating an IDOC for method parameter(s). Please reference the Quality Assurance Manual for the Division of Water Resources Water Science Section Chemistry Laboratories, Section 8.5.1 Initial Demonstration of Capability (IDOC) for procedural guidance.
NC AMS QAPP Appendix 7 EPA Approved: July 2017 Version 2.0
Appendix 7: Random Ambient Monitoring System Information

NC AMS QAPP Appendix 7 EPA Approved: July 2017 Version 2.0
NC AMS QAPP Appendix 7 EPA Approved: July 2017 Version 2.0
Random Ambient Monitoring System
The Random Ambient Monitoring System (RAMS), started in January 2007, is a component of DWR's Ambient Monitoring System (AMS). RAMS is a probabilistic monitoring initiative where sampling locations are randomly located on freshwater streams (non-tidal, non-lake/reservoir, non-saltwater) throughout the state. RAMS has its origins in EPA’s Probabilistic Monitoring Initiative. The EPA has recommended to the states that probabilistic monitoring be incorporated into the 305(b) water quality reporting process. For this reason and several others DWR has chosen to implement RAMS.
This appendix is to highlight where the AMS and RAMS have differences. Most of the differences are due to AMS being a long-term, judgmentally based program and RAMS being a probabilistic approach on a much smaller scale. However, much of the day-to-day operation of the two programs is the same since the staff involved for management, field sampling, laboratory analysis, and reporting are the same for AMS and RAMS. There are differences in the reasons for sample collection, how stations are selected, which indicators are measured and frequency, quality control processes, and data reporting.
DWR’s ambient monitoring network has historically focused on large rivers and areas with known water quality problems. As a result, the ambient program does not have much data on smaller streams. Because most streams in North Carolina are small, the majority of RAMS sites are also on small streams. In addition, RAMS allows DWR to answer broad questions about the water quality of North Carolina streams without the bias inherent in fixed station sampling. RAMS also allows DWR to cost-effectively collect data on water quality parameters that are rarely examined by existing monitoring programs. Finally, it will also aid in the development of alternative methods of measuring metals, such as dissolved concentrations and toxicity via biotic ligand models.
Objectives
The Primary objectives of RAMS are:
• To obtain unbiased evaluation of all freshwater surface waters in North Carolina without bias introduced through fixed station monitoring.
• To determine, at a state-wide perspective, whether water quality standards are being met for all the pollutants listed in “Standards for Toxic Substances and Temperature” (15A NCAC 02B .0208) and “Fresh Surface Water Quality Standards for Class C Waters” (15A NCAC 02B .0211).
• To identify the presence and magnitude of analytes not collected in the ambient and coalition monitoring programs – i.e. volatile organics, semi-volatiles, pesticides, dissolved metals, and low-level mercury.
NC AMS QAPP Appendix 7 EPA Approved: July 2017 Version 2.0
Bias
RAMS has a probabilistic monitoring design which helps to reduce bias in the sampling locations. However, some bias may be introduced during the station location process due to accessibility concerns. Sites that are not reasonably accessible on a monthly basis are not used for sampling.
The use of consistent sampling methods, SOPs and analytical methods minimizes bias from other sources.
Completeness
It is expected that monthly sampling will occur at each RAMS site for physical and chemical measurements, provided there is water present at the time of sampling. Since RAMS sites are commonly located on smaller headwater streams (Strahler order 1 & 2), seasonal variations or drought conditions may result in low flow conditions or dry streams. These conditions should be noted and sampling resumed once water returns to the stream. Other problems such as inclement weather, road construction, or equipment problems may result in a site not being sampled one month, but sampling should be conducted twice in the following month, if possible.
Biological assessments are completed are all sites unless: 1) the sampling protocols for the benthic macroinvertebrate and/or fish assessments are not met (e.g. streams are not wadable, an Index of Biological Integrity (IBI) for fish has not been developed for some watersheds) or 2) flowing water is not present.
Station Selection
RAMS station selection began with USEPA’s National Health and Environmental Effects Research Laboratory Freshwater Ecology Branch in Corvallis, Oregon providing a list of 330 randomly selected sites to DWR. These sites are based upon the 100K hydrography digital map dataset. Each potential monitoring site is reviewed: 1) to determine if each site is located on freshwater streams (sites that were tidal, saltwater or lake/reservoirs are excluded from the list), and 2) determine if the site could be accessed easily over a two year monthly monitoring period.
Each freshwater site is examined using MapTech’s Terrain Navigator software and Google Maps to determine if a bridge is within ¼ mile or road access is within a 1/8 mile and located with the same stream segment. The proximity of the site to a bridge crossing or road criteria are necessary to minimize site access difficulties, since monitoring locations are accessed 24 times. If both of these criteria are not met then the site is excluded from the list. Once a site meets these criteria, a site visit is completed to verify the stream location, evaluate physically accessibility, and identify if private property permission would be needed for access. The first thirty potential sites that met all the criteria become sampling locations for the two year sampling cycle. This station selection occurs every two years during the spring/summer before sampling is to begin the following January.
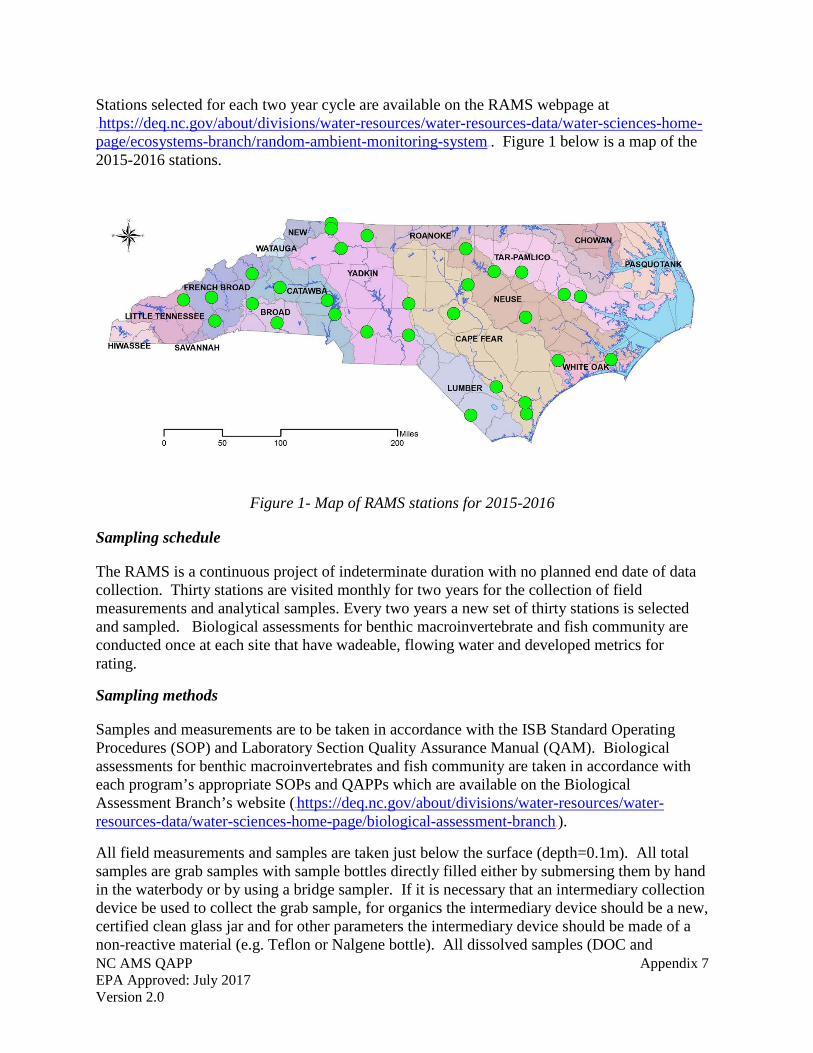
NC AMS QAPP Appendix 7 EPA Approved: July 2017 Version 2.0
Stations selected for each two year cycle are available on the RAMS webpage at 32T Uhttps://deq.nc.gov/about/divisions/water-resources/water-resources-data/water-sciences-home-page/ecosystems-branch/random-ambient-monitoring-systemU32T. Figure 1 below is a map of the 2015-2016 stations.
Figure 1- Map of RAMS stations for 2015-2016
Sampling schedule
The RAMS is a continuous project of indeterminate duration with no planned end date of data collection. Thirty stations are visited monthly for two years for the collection of field measurements and analytical samples. Every two years a new set of thirty stations is selected and sampled. Biological assessments for benthic macroinvertebrate and fish community are conducted once at each site that have wadeable, flowing water and developed metrics for rating.
Sampling methods
Samples and measurements are to be taken in accordance with the ISB Standard Operating Procedures (SOP) and Laboratory Section Quality Assurance Manual (QAM). Biological assessments for benthic macroinvertebrates and fish community are taken in accordance with each program’s appropriate SOPs and QAPPs which are available on the Biological Assessment Branch’s website (32Thttps://deq.nc.gov/about/divisions/water-resources/water-resources-data/water-sciences-home-page/biological-assessment-branch32T).
All field measurements and samples are taken just below the surface (depth=0.1m). All total samples are grab samples with sample bottles directly filled either by submersing them by hand in the waterbody or by using a bridge sampler. If it is necessary that an intermediary collection device be used to collect the grab sample, for organics the intermediary device should be a new, certified clean glass jar and for other parameters the intermediary device should be made of a non-reactive material (e.g. Teflon or Nalgene bottle). All dissolved samples (DOC and
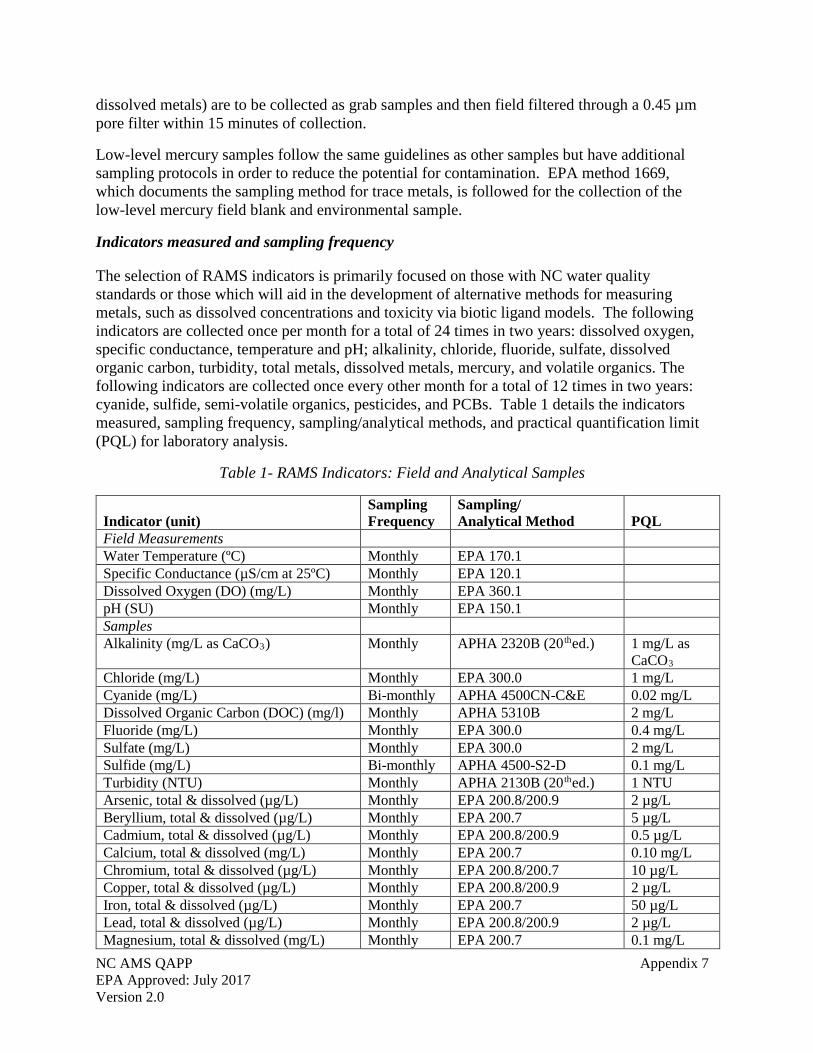
NC AMS QAPP Appendix 7 EPA Approved: July 2017 Version 2.0
dissolved metals) are to be collected as grab samples and then field filtered through a 0.45 µm pore filter within 15 minutes of collection.
Low-level mercury samples follow the same guidelines as other samples but have additional sampling protocols in order to reduce the potential for contamination. EPA method 1669, which documents the sampling method for trace metals, is followed for the collection of the low-level mercury field blank and environmental sample.
Indicators measured and sampling frequency
The selection of RAMS indicators is primarily focused on those with NC water quality standards or those which will aid in the development of alternative methods for measuring metals, such as dissolved concentrations and toxicity via biotic ligand models. The following indicators are collected once per month for a total of 24 times in two years: dissolved oxygen, specific conductance, temperature and pH; alkalinity, chloride, fluoride, sulfate, dissolved organic carbon, turbidity, total metals, dissolved metals, mercury, and volatile organics. The following indicators are collected once every other month for a total of 12 times in two years: cyanide, sulfide, semi-volatile organics, pesticides, and PCBs. Table 1 details the indicators measured, sampling frequency, sampling/analytical methods, and practical quantification limit (PQL) for laboratory analysis.
Table 1- RAMS Indicators: Field and Analytical Samples
Indicator (unit) Sampling Frequency
Sampling/ Analytical Method PQL
Field Measurements Water Temperature (ºC) Monthly EPA 170.1 Specific Conductance (µS/cm at 25ºC) Monthly EPA 120.1 Dissolved Oxygen (DO) (mg/L) Monthly EPA 360.1 pH (SU) Monthly EPA 150.1 Samples Alkalinity (mg/L as CaCOR3R) Monthly APHA 2320B (20P
thPed.) 1 mg/L as
CaCOR3 Chloride (mg/L) Monthly EPA 300.0 1 mg/L Cyanide (mg/L) Bi-monthly APHA 4500CN-C&E 0.02 mg/L Dissolved Organic Carbon (DOC) (mg/l) Monthly APHA 5310B 2 mg/L Fluoride (mg/L) Monthly EPA 300.0 0.4 mg/L Sulfate (mg/L) Monthly EPA 300.0 2 mg/L Sulfide (mg/L) Bi-monthly APHA 4500-S2-D 0.1 mg/L Turbidity (NTU) Monthly APHA 2130B (20P
thPed.) 1 NTU
Arsenic, total & dissolved (µg/L) Monthly EPA 200.8/200.9 2 µg/L Beryllium, total & dissolved (µg/L) Monthly EPA 200.7 5 µg/L Cadmium, total & dissolved (µg/L) Monthly EPA 200.8/200.9 0.5 µg/L Calcium, total & dissolved (mg/L) Monthly EPA 200.7 0.10 mg/L Chromium, total & dissolved (µg/L) Monthly EPA 200.8/200.7 10 µg/L Copper, total & dissolved (µg/L) Monthly EPA 200.8/200.9 2 µg/L Iron, total & dissolved (µg/L) Monthly EPA 200.7 50 µg/L Lead, total & dissolved (µg/L) Monthly EPA 200.8/200.9 2 µg/L Magnesium, total & dissolved (mg/L) Monthly EPA 200.7 0.1 mg/L
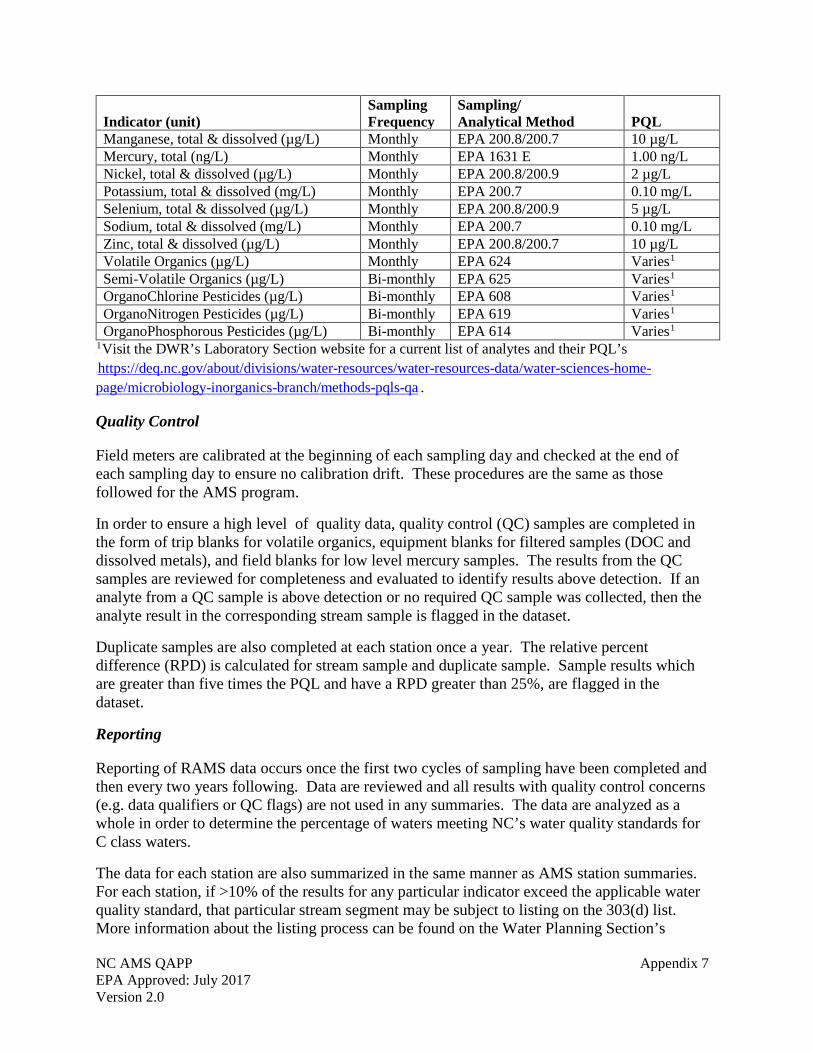
NC AMS QAPP Appendix 7 EPA Approved: July 2017 Version 2.0
Indicator (unit) Sampling Frequency
Sampling/ Analytical Method PQL
Manganese, total & dissolved (µg/L) Monthly EPA 200.8/200.7 10 µg/L Mercury, total (ng/L) Monthly EPA 1631 E 1.00 ng/L Nickel, total & dissolved (µg/L) Monthly EPA 200.8/200.9 2 µg/L Potassium, total & dissolved (mg/L) Monthly EPA 200.7 0.10 mg/L Selenium, total & dissolved (µg/L) Monthly EPA 200.8/200.9 5 µg/L Sodium, total & dissolved (mg/L) Monthly EPA 200.7 0.10 mg/L Zinc, total & dissolved (µg/L) Monthly EPA 200.8/200.7 10 µg/L Volatile Organics (µg/L) Monthly EPA 624 VariesP
1 Semi-Volatile Organics (µg/L) Bi-monthly EPA 625 VariesP
1 OrganoChlorine Pesticides (µg/L) Bi-monthly EPA 608 VariesP
1 OrganoNitrogen Pesticides (µg/L) Bi-monthly EPA 619 VariesP
1 OrganoPhosphorous Pesticides (µg/L) Bi-monthly EPA 614 VariesP
1 P
1PVisit the DWR’s Laboratory Section website for a current list of analytes and their PQL’s
32Thttps://deq.nc.gov/about/divisions/water-resources/water-resources-data/water-sciences-home-page/microbiology-inorganics-branch/methods-pqls-qa32T.
Quality Control
Field meters are calibrated at the beginning of each sampling day and checked at the end of each sampling day to ensure no calibration drift. These procedures are the same as those followed for the AMS program.
In order to ensure a high level of quality data, quality control (QC) samples are completed in the form of trip blanks for volatile organics, equipment blanks for filtered samples (DOC and dissolved metals), and field blanks for low level mercury samples. The results from the QC samples are reviewed for completeness and evaluated to identify results above detection. If an analyte from a QC sample is above detection or no required QC sample was collected, then the analyte result in the corresponding stream sample is flagged in the dataset.
Duplicate samples are also completed at each station once a year. The relative percent difference (RPD) is calculated for stream sample and duplicate sample. Sample results which are greater than five times the PQL and have a RPD greater than 25%, are flagged in the dataset.
Reporting
Reporting of RAMS data occurs once the first two cycles of sampling have been completed and then every two years following. Data are reviewed and all results with quality control concerns (e.g. data qualifiers or QC flags) are not used in any summaries. The data are analyzed as a whole in order to determine the percentage of waters meeting NC’s water quality standards for C class waters.
The data for each station are also summarized in the same manner as AMS station summaries. For each station, if >10% of the results for any particular indicator exceed the applicable water quality standard, that particular stream segment may be subject to listing on the 303(d) list. More information about the listing process can be found on the Water Planning Section’s
NC AMS QAPP Appendix 7 EPA Approved: July 2017 Version 2.0
website at 32Thttps://deq.nc.gov/about/divisions/water-resources/planning/modeling-assessment/water-quality-data-assessment32T.


