Embed Size (px)
Citation preview
An acoustic-speech study of patients who received orthognathic surgery
Dr. Bowers
Joe Bowers,* Emily A. Tobey,** and Robert Shaye* New Orleans, La.
Several reports have suggested that orthognathic surgery may influence speech patterns. The purpose of this _ study was to examine the formant frequency changes of speech following orthognathic surgery in patients whose
speech was considered perceptually normal preoperatively and postoperatively. Speech samples were obtained from five patients (three patients with Class II, Division 1 malocclusions and two patients with Class Ill malocclusions). Significant second-formant frequency shifts were found for the vbwel ‘e’ (as in ‘seat’); however, only minor second-formant frequency variations were found for the vowels ‘a’ (as in ‘sat’) and ‘u (as in ‘suit’). The pattern of formant frequencies before and after surgical treatment suggested that the speakers adjusted their articulation to accommodate the orthognathic surgery. Overall, the data from this study indicate that speech patterns may be reorganized after orthognathic surgery even though speech remains perceptually “normal.” (AM J ORTHOD 88: 373-379, 1985.)
Key words: Orthognathic surgery, speech, malocclusions, articulation, surgical adjustments
T hree types of malocclusion-prognathia, retrognathia, and apertognathia-are often treated by surgical procedures. ‘,* The primary surgical goal is the restoration of normal mandibular and maxillary rela- tionships through adjusttnent of the relative lengths and alignments of the jaws. Patients who receive orthog- nathic surgery also appear to experience secondary ef- fects, such as changes in the degree of jaw opening.3 Surgical correction of a prognathic mandible seems to produce a wider jaw opening, whereas a decreased de- gree of jaw opening is observed after micrognathia cor- rection.3 Changes in the degree of jaw opening appear to be the natural consequence of changing the size of the oral cavity while maintaining a constant tongue size. Wider opening of the mandible thus occurs in post- surgical prognathic jaws to accommodate a relatively “larger” tongue in the relatively smaller, postsurgical vocal tract.3 Ewan3 also suggests that the decreased jaw opening observed after micrognathia correction may represent a similar type of compensation.
It is possible that alterations in jaw length, in con- junction with changes in the degree of jaw opening and relative tongue position within the surgically changed vocal tract, may also influence a patient’s speech.4-8
*Department of Orthodontics, Louisiana State University School of Dentistry. **Departments of Communication Disorders and Otorhinolaryngology, Kresge Hearing Research Laboratory of the South, Louisiana State University Medical Center.
The majority of consonants and vowels are produced by active variations in tongue position and constriction relative to the mandible and maxilla.‘-” Vowels, for example, are often described with three dimensions- jaw opening (“open” versus “closed”), tongue posi- tion (anterior, central, or posterior in the oral cavity), and tongue height (high, mid, and low relative to the maxilla). The frequency patterns of these speech sounds are thus dependent upon the size and configuration of the oral cavity relative to the rest of the vocal tract9-” For example, it is possible that the speech of patients with severe malocclusions may be judged perceptually abnormal preoperatively, but judged to be normal after surgical intervention for the malocclusion. Perceptually deviant speech may be corrected surgically by read- justment of the physical configuration of the oral cavity to provide more nearly normal frequency patterns which, in turn, influence the listener’s perception. Such a situation may represent a simple, passive physical event because the surgical procedure alone may induce sufficient oral cavity changes to alter the resonating characteristics of the vocal tract.
Alternatively, it is possible that patients with mal- occlusions may produce speech that is judged percep- tually normal (that is, without distortions or substitu- tions of one sound for another) both preoperatively and postoperatively. This second example does not preclude the possibility that speech has changed after orthog- nathic surgery. It suggests, instead, that the acoustic
373
374 Bowers, Tobey, and Shuye
Table I. Background information on subjects
Subject Age Class$culion - ~.-
Treatment change.!
I 19 years 3 months
2 17 years 3 months 3 17 years I1 months
4 I8 years 4 months
5 22 years 6 months
Class II, Division I
Class II, Division 1 Class II, Division 1
Class III
Class III
7.0 mm-Mandibular advancement 5.0 mm-Vertical change 4.0 mm--Maxillary incisor retraction 6.5 mm-Mandibular advancement 5.0 mm-Anterior; 2 mm-Posterior maxillary impaction
14.0 mm--Mandibular advancement 4.5 mm--Maxillary advancement 5.0 mm-Maxillary posterior impaction 5.0 mn--Mandibular setback
10.0 mm---Mandibular setback
consequences of the surgically altered vocal tract may not be substantial enough to alter a listener’s perception. Perceptually normal speech before and after surgical intervention may occur for a number of reasons. For instance, it is possible that patients with normal speech also have less severe malocclusions and are therefore subject to less extreme surgical procedures. Although this may account for perceptually normal speech in some patients, clinical experience indicates that per- ceptually normal speech may also be found in many patients with severe malocclusions who receive more extreme surgical treatment. A second possibility is that perceptually normal speech may arise from active read- justments to tongue and mandibular relationships to accommodate sounds specifically affected by the sur- gical procedures. The patient takes into account changes in the degree of jaw opening and relative tongue po- sition in the altered oral cavity to continue producing perceptually normal speech. Minor adjustments along either of these articulatory dimensions may produce formant frequency changes that still fall within a range considered normal by a listener.
This latter hypothesis is particularly interesting be- cause it suggests that the study of perceptually normal speech presurgically and postsurgically may provide insight into the strategies successfully used by patients to accommodate surgical changes to the oral cavity. Perceptual judgments are the most common technique used by orthodontists, oral surgeons, and speech pa- thologists to evaluate speech; however, perceptual judg- ments do not provide information on the type of read- justment strategy used by patients to maintain percep- tually normal speech. The purpose of this study was to explore objectively the speech strategies used by pa- tients after orthognathic surgery.
METHODS AND MATERIALS Subjects
Speech recordings were made of five subjects se- lected for orthognathic surgical treatment in the De-
partment of Orthodontics at Louisiana State University Medical Center. All subjects were reported to have per- ceptually normal speech preoperatively and postoper- atively by their respective orthodontists. Table I indi- cates the ages of the subjects at the time of their treat- ment, their presenting orthodontic classifications, and the treatment changes determined from lateral cepha- lometric radiographic measurements. Three subjects re- ceived vertical oblique ramus osteotomies. The re- maining two subjects received mandibular setbacks by means of sagittal split ramus osteotomies.
Procedures
Recordings were made on four occasions: (1) before placement of orthodontic appliances, (2) before or- thognathic surgery, (3) after surgical fixation, and (4) after removal of orthodontic appliances. Each subject’s speech was recorded in a quiet conference room and the subjects were asked to repeat sentences of the form, “Here is a ____ again.” The blanks were filled with target words whose initial consonants varied be- tween ‘s’ and ‘sh.’ There were three vowel choices- ‘a’ as in ‘sat, ’ +u’ as in ‘shoot,’ and ‘e’ as in *sheet.’ The final consonant was always ‘t.’ Consonant sounds were selected because consonants are traditionally con- sidered to be sounds affected by dental treatment. The three vowels were selected because they require ex- treme tongue positions of the oral cavity (low-front, high-back, and high-front). The sentences were re- peated 30 times in random order at each test session.
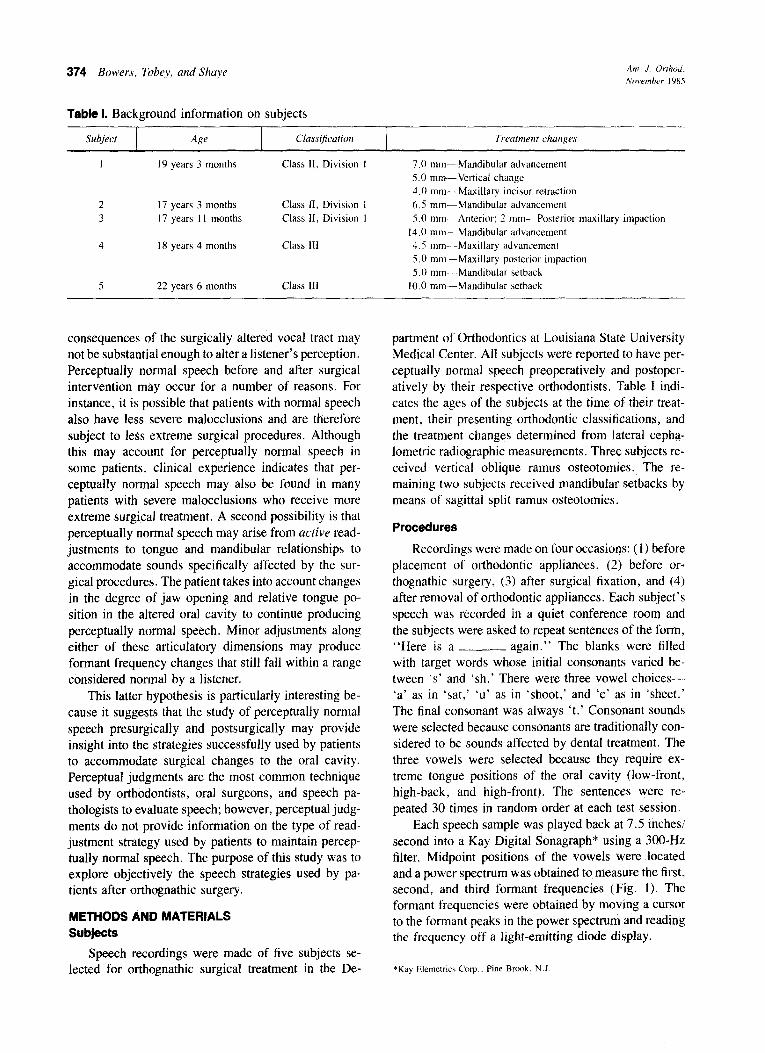
Each speech sample was played back at 7.5 inches/ second into a Kay Digital Sonagraph* using a 300-Hz filter. Midpoint positions of the vowels were located and a power spectrum was obtained to measure the first, second, and third formant frequencies (Fig. 1). The formant frequencies were obtained by moving a cursor to the formant peaks in the power spectrum and reading the frequency off a light-emitting diode display.
*Kay Elemetrics Carp ~ Pine Brook. N.J
Volume 88 Number 5
Acoustic-speech study 375
Fig. 1. Spectrogram of the target word, ‘sat.’ Arrows indicated the position of the second formant frequency.
To determine the reliability of the measures, du- plicate spectrograms of half the data were made and formant frequencies were located and measured by the second author. The average measurement error was 32 Hz for the first formant frequency and 45 Hz for the second formant frequency.
Within-subject, across-test session comparisons were made by means of analysis of variance techniques. We selected only three test sessions of data (before orthodontic or surgical treatment, after surgical fixa- tion, and after orthodontic treatment) from each subject. Our six-way analysis of variance examined subjects (N = 5) by test session (N = 3), by vowel (N = 3), by repetition (N = 5), by consonant (N = 2), and by fre- quency (N = 3). The anova summary table for the pro- gram used unpooled error terms because of our repeated measures design. Application of range tests for signif- icance of the means were applied following the analysis of variance.
RESULTS
Formant frequencies were found to vary signifi- cantly as a function of vowel (F[2,8] = 43.855, P < 0.001) and initial consonant (F[1,4] = 23.825, P < 0.001). Frequencies of the three vowels differed (that is, formant frequency 2 was higher for ‘e’ than ‘a’ or ‘u’) in a manner that agreed with previous reports in the speech literature. ‘O-I’ These observations reflected the differences in tongue-to-palate relationships for ‘e’ versus ‘a’ versus ‘u.’ Collapsing across the frequencies for the three vowels revealed that higher formant fre- quencies are produced in initial contexts containing ‘s’ (1,570 Hz) than ‘sh’ (1,559 Hz). The analysis also
revealed a significant vowel by formant frequency in- teraction (F[4,16] = 45.724, P < 0.001) and indi- cated that the values of the first, second, and third formant frequencies depended upon the particular vowel measured.
Significant shifts in formant frequency were also noted in the interaction of test session, the particular vowel spoken, and the formant frequency measured (F[32,128] = 1.867, P < 0.001). In addition, we found a significant interaction between test session and formant frequency (F[4,16] = 4.73, P < 0.05). Ex- amination of the mean formant frequencies as a function of test session revealed that these differences were pri- marily explained by the second formant frequency mea- sures. Formant frequency 1 was significantly different for each of the vowel and initial consonant contexts, but did not significantly change as a function of test session. Formant frequency 3 paralleled formant fre- quency 2 in all respects. To demonstrate the effects of test session upon speech, we focused on formant fre- quency 2 (which directly reflected the changes in the relative oral cavity volumes) for each of the subjects tested.
In Figs. 2-6, the bottom half illustrates the pretreat- ment and posttreatment lateral cephalograms of the sub- jects. Pretreatment cephalograms are found on the left; posttreatment cephalograms are located on the bottom right. The top half of the figure illustrates the second formant frequencies of the three vowels as a function of test session. Session 1 represents recordings made before tooth movement; session 2 represents recordings made directly before orthognathic surgery; session 3 represents recordings made after surgical fixation; ses-
376 Bowers, Tobey, and Shaye
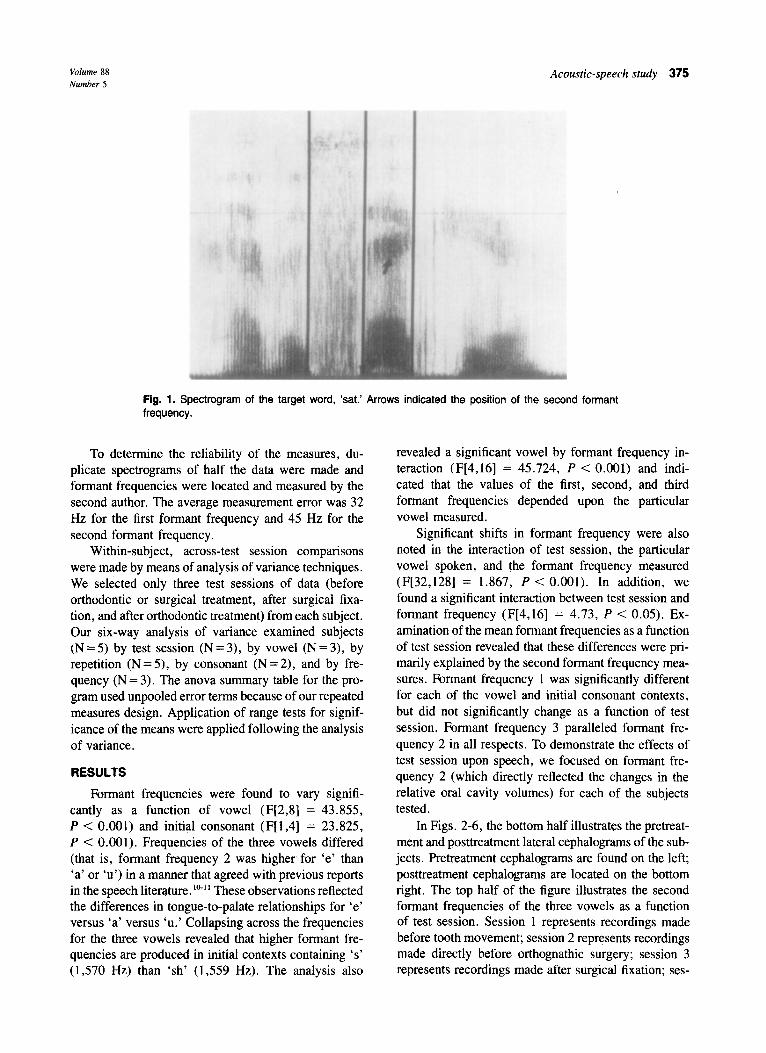
Fig. 2. The upper half of the figure depicts the second formant frequency data for the three vowels as a function of test session for subject 1. The left lower portion of the figure shows the preorthodontic treatment lateral cephalogram; the right lower portion illustrates the lateral cephalogram taken after orthodon- tic treatment.
sion 4 represents recordings made after the completion of orthodontic treatment.
Fig. 2 depicts the speech and lateral cephalogram data from subject 1 who had a Class II, Division 1 malocclusion. Four recordings were made of this sub- ject. Notice that very little change was found for the vowels ‘a’ and ‘u’ between any of the recording ses- sions. Significant decreases in formant frequency 2 are found for the high, front vowel ‘e’ between session 1 (preorthodontic treatment), session 2 (before surgery), and session 3 (after surgical fixation) (significant dif- ferences in the means were confirmed by post hoc ap- plication of Duncan’s new multiple range rest, confi- dence level = 0.0.512). If articulatory accommodation is operationally defined, from an acoustic perspective, to be similar frequencies before and after surgery, it is clear that articulatory accommodation occurred and was indicated by the increase in formant frequency 2 during session 4 (postorthodontic treatment) to a level that approached session 1. A similar formant frequency pat- tern was found for subject 2 with a Class II, Division 1 malocclusion (Fig. 3). Three recordings were made of this subject-session 1, session 3, and session 4.
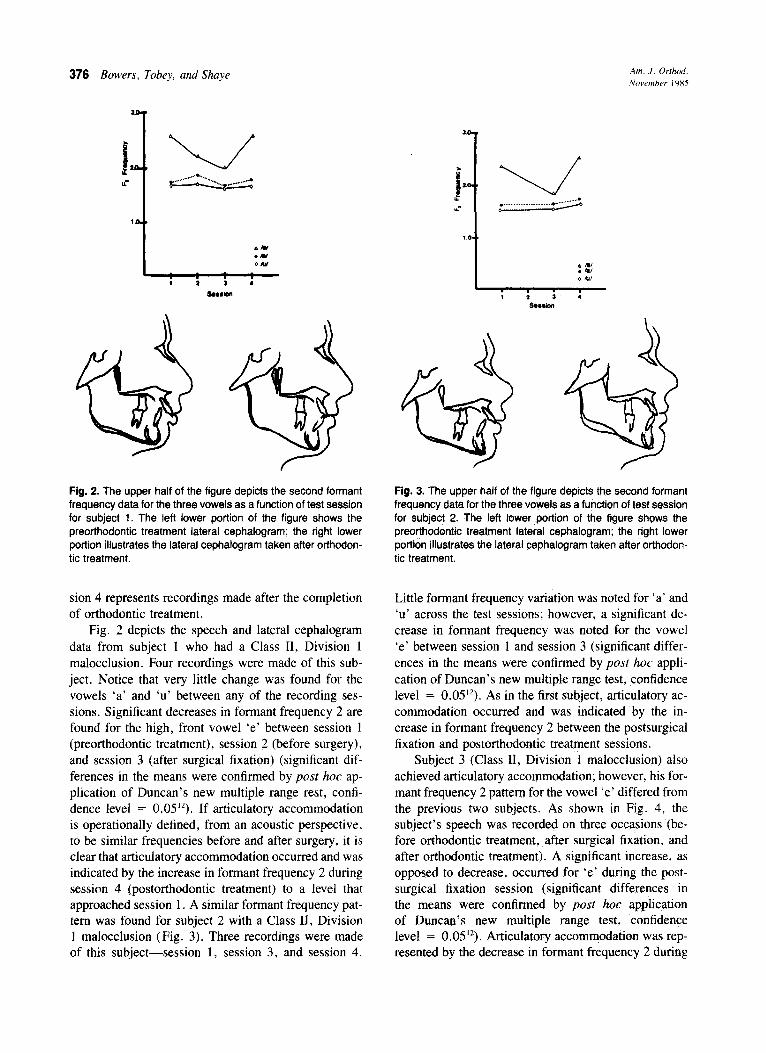
Fig. 3. The upper half of the figure depicts the second formant frequency data for the three vowels as a function of test session for subject 2. The left lower portion of the figure shows the preorthodontic treatment lateral cephalogram; the right lower portion illustrates the lateral cephalogram taken after orthodon- tic treatment.
Little formant frequency variation was noted for ‘a’ and ‘u’ across the test sessions; however, a significant de- crease in formant frequency was noted for the vowel ‘e’ between session 1 and session 3 (significant differ- ences in the means were confirmed by post hoc appli- cation of Duncan’s new multiple range test, confidence level = 0.05”). As in the first subject, articulatory ac- commodation occurred and was indicated by the in- crease in formant frequency 2 between the postsurgical fixation and postorthodontic treatment sessions.
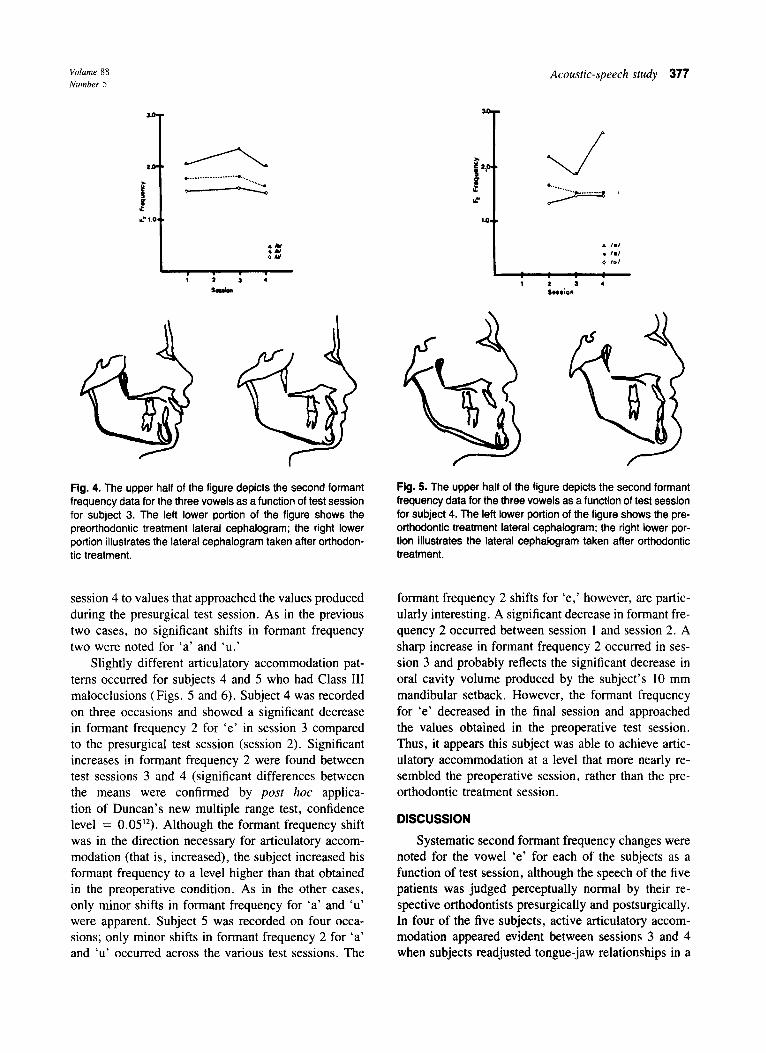
Subject 3 (Class II, Division 1 malocclusion) also achieved articulatory accommodation; however, his for- mant frequency 2 pattern for the vowel ‘e’ differed from the previous two subjects. As shown in Fig. 4, the subject’s speech was recorded on three occasions (be- fore orthodontic treatment, after surgical fixation, and after orthodontic treatment). A significant increase, as opposed to decrease, occurred for ‘e’ during the post- surgical fixation session (significant differences in the means were confirmed by post hoc application of Duncan’s new multiple range test, confidence level = 0.05”). Articulatory accommodation was rep- resented by the decrease in formant frequency 2 during
Volume 88 Number 5
Acoustic-speech study 377
Fig. 4. The upper half of the figure depicts the second formant Fig. 5. The upper half of the figure depicts the second formant frequency data for the three vowels as a function of test session frequency data for the three vowels as a function of test session for subject 3. The left lower portion of the figure shows the for subject 4. The lefi lower portion of the figure shows the pre- preorthodontic treatment lateral cephalogram; the right lower orthodontic treatment lateral cephalogram; the right lower por- portion illustrates the lateral cephalogram taken after orthodon- tion illustrates the lateral cephalogram taken after orthodontic tic treatment. treatment.
session 4 to values that approached the values produced during the presurgical test session. As in the previous two cases, no significant shifts in formant frequency two were noted for ‘a’ and ‘u.’
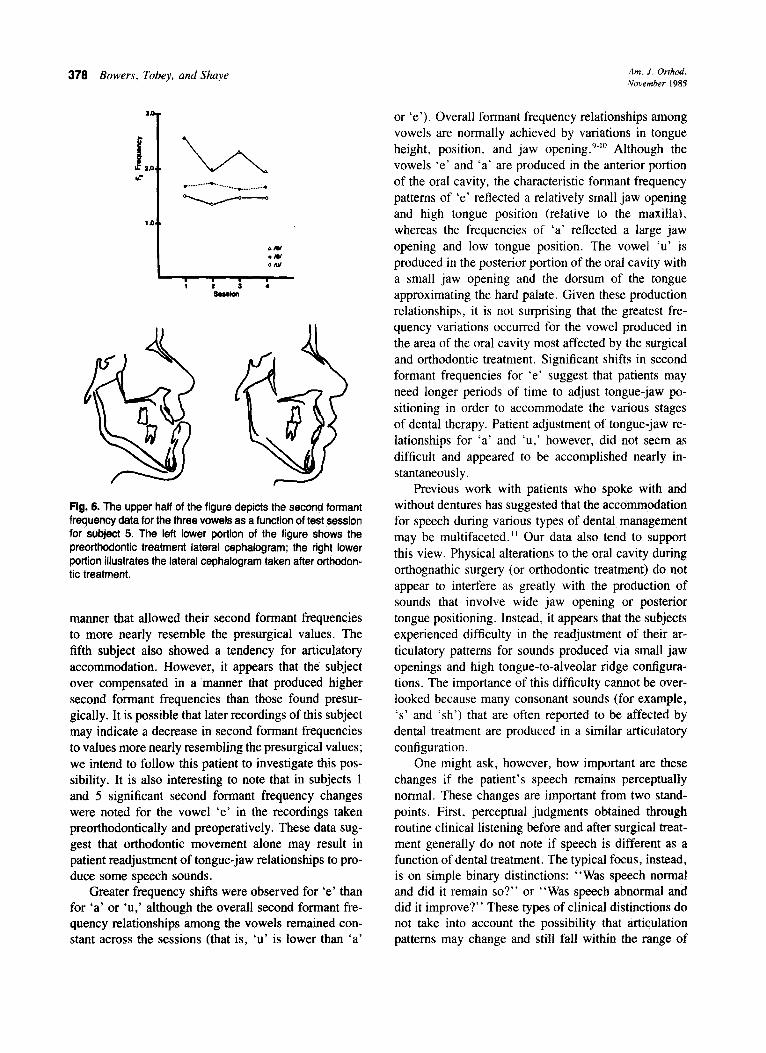
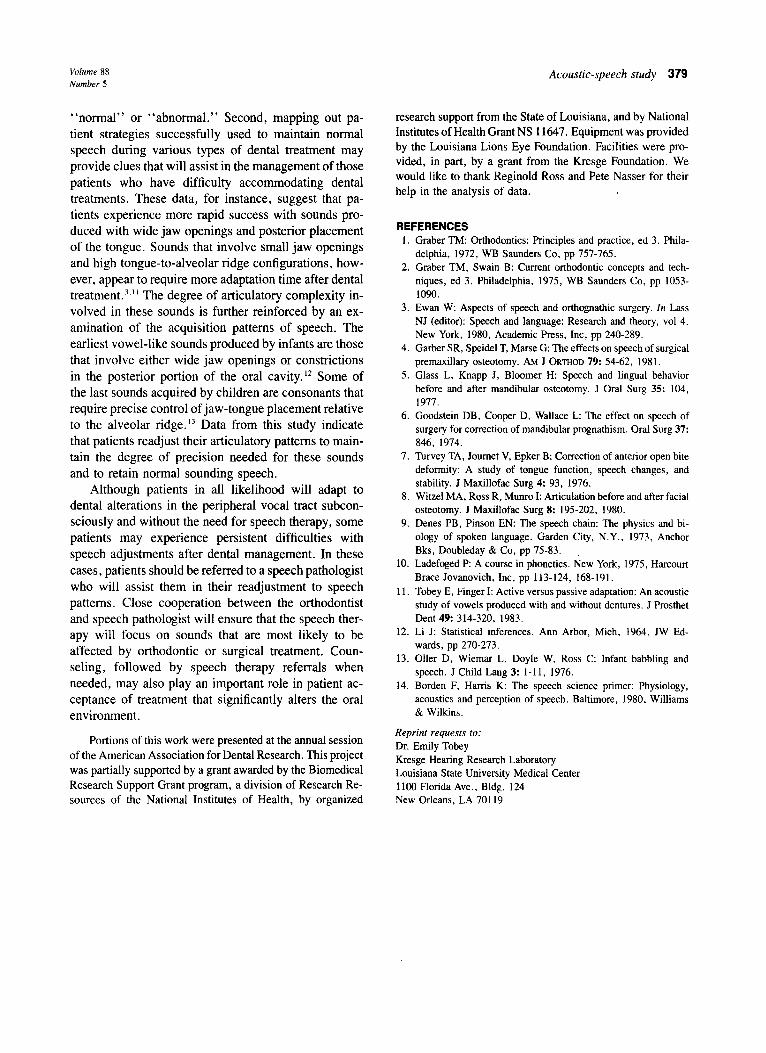
Slightly different articulatory accommodation pat- terns occurred for subjects 4 and 5 who had Class III malocclusions (Figs. 5 and 6). Subject 4 was recorded on three occasions and showed a significant decrease in formant frequency 2 for ‘e’ in session 3 compared to the presurgical test session (session 2). Significant increases in formant frequency 2 were found between test sessions 3 and 4 (significant differences between the means were confirmed by post hoc applica- tion of Duncan’s new multiple range test, confidence level = 0.0512). Although the formant frequency shift was in the direction necessary for articulatory accom- modation (that is, increased), the subject increased his formant frequency to a level higher than that obtained in the preoperative condition. As in the other cases, only minor shifts in formant frequency for ‘a’ and ‘u’ were apparent. Subject 5 was recorded on four occa- sions; only minor shifts in formant frequency 2 for ‘a’ and ‘u’ occurred across the various test sessions. The
formant frequency 2 shifts for ‘e,’ however, are partic- ularly interesting. A significant decrease in formant fre- quency 2 occurred between session 1 and session 2. A sharp increase in formant frequency 2 occurred in ses- sion 3 and probably reflects the significant decrease in oral cavity volume produced by the subject’s 10 mm mandibular setback. However, the formant frequency for ‘e’ decreased in the final session and approached the values obtained in the preoperative test session. Thus, it appears this subject was able to achieve artic- ulatory accommodation at a level that more nearly re- sembled the preoperative session, rather than the pre- orthodontic treatment session.
DISCUSSION
Systematic second formant frequency changes were noted for the vowel ‘e’ for each of the subjects as a function of test session, although the speech of the five patients was judged perceptually normal by their re- spective orthodontists presurgically and postsurgically. In four of the five subjects, active articulatory accom- modation appeared evident between sessions 3 and 4 when subjects readjusted tongue-jaw relationships in a
378 Bowers, Tobey, and Shye Am. J. Orthod. November 1985
P e t3 la -? Fig. 6. The upper half of the figure depicts the second formant frequency data for the three vowels as a function of test session for subject 5. The left lower portion of the figure shows the preorthodontic treatment lateral cephalogram; the right lower portion illustrates the lateral cephalogram taken after orthodon- tic treatment.
manner that allowed their second formant frequencies to more nearly resemble the presurgical values. The fifth subject also showed a tendency for articulatory accommodation. However, it appears that the subkct over compensated in a manner that produced higher second formant frequencies than those found presur- gically. It is possible that later recordings of this subject may indicate a decrease in second formant frequencies to values more nearly resembling the presurgical values; we intend to follow this patient to investigate this pos- sibility. It is also interesting to note that in subjects 1 and 5 significant second formant frequency changes were noted for the vowel ‘e’ in the recordings taken preorthodontically and preoperatively. These data sug- gest that orthodontic movement alone may result in patient readjustment of tongue-jaw relationships to pro- duce some speech sounds.
Greater frequency shifts were observed for ‘e’ than for ‘a’ or ‘u,’ although the overall second formant fre- quency relationships among the vowels remained con- stant across the sessions (that is, ‘u’ is lower than ‘a’
or ‘e’). Overall formant frequency relationships among vowels are normally achieved by variations in tongue height, position, and jaw opening.‘-” Although the vowels ‘e’ and ‘a’ are produced in the anterior portion of the oral cavity, the characteristic formant frequency patterns of ‘e’ reflected a relatively small jaw opening and high tongue position (relative to the maxilla), whereas the frequencies of ‘a’ reflected a large jaw opening and low tongue position. The vowel ‘u’ is produced in the posterior portion of the oral cavity with a small jaw opening and the dorsum of the tongue approximating the hard palate. Given these production relationships, it is not surprising that the greatest fre- quency variations occurred for the vowel produced in the area of the oral cavity most affected by the surgical and orthodontic treatment. Significant shifts in second formant frequencies for ‘e’ suggest that patients may need longer periods of time to adjust tongue-jaw po- sitioning in order to accommodate the various stages of dental therapy. Patient adjustment of tongue-jaw re- lationships for ‘a’ and ‘ul’ however, did not seem as difficult and appeared to be accomplished nearly in- stantaneously.
Previous work with patients who spoke with and without dentures has suggested that the accommodation for speech during various types of dental management may be multifaceted.” Our data also tend to support this view. Physical alterations to the oral cavity during orthognathic surgery (or orthodontic treatment) do not appear to interfere as greatly with the production of sounds that involve wide jaw opening or posterior tongue positioning. Instead, it appears that the subjects experienced difficulty in the readjustment of their ar- ticulatory patterns for sounds produced via small jaw openings and high tongue-to-alveolar ridge configura- tions. The importance of this difficulty cannot be over- looked because many consonant sounds (for example, ‘s’ and ‘sh’) that are often reported to be affected by dental treatment are produced in a similar articulatory configuration.
One might ask, however, how important are these changes if the patient’s speech remains perceptually normal. These changes are important from two stand- points. First, perceptual judgments obtained through routine clinical listening before and after surgical treat- ment generally do not note if speech is different as a function of dental treatment. The typical focus, instead, is on simple binary distinctions: “Was speech normal and did it remain so?” or “Was speech abnormal and did it improve?” These types of clinical distinctions do not take into account the possibility that articulation patterns may change and still fall within the range of
Volume 88 Number 5
“normal” or “abnormal.” Second, mapping out pa- tient strategies successfully used to maintain normal speech during various types of dental treatment may provide clues that will assist in the management of those patients who have difficulty accommodating dental treatments. These data, for instance, suggest that pa- tients experience more rapid success with sounds pro- duced with wide jaw openings and posterior placement of the tongue. Sounds that involve small jaw openings and high tongue-to-alveolar ridge configurations, how- ever, appear to require more adaptation time after dental treatment.3,‘1 The degree of articulatory complexity in- volved in these sounds is further reinforced by an ex- amination of the acquisition patterns of speech. The earliest vowel-like sounds produced by infants are those that involve either wide jaw openings or constrictions in the posterior portion of the oral cavity. I2 Some of the last sounds acquired by children are consonants that require precise control of jaw-tongue placement relative to the alveolar ridge.13 Data from this study indicate that patients readjust their articulatory patterns to main- tain the degree of precision needed for these sounds and to retain normal sounding speech.
Although patients in all likelihood will adapt to dental alterations in the peripheral vocal tract subcon- sciously and without the need for speech therapy, some patients may experience persistent difficulties with speech adjustments after dental management. In these cases, patients should be referred to a speech pathologist who will assist them in their readjustment to speech patterns. Close cooperation between the orthodontist and speech pathologist will ensure that the speech ther- apy will focus on sounds that are most likely to be affected by orthodontic or surgical treatment. Coun- seling, followed by speech therapy referrals when needed, may also play an important role in patient ac- ceptance of treatment that significantly alters the oral environment.
Portions of this work were presented at the annual session of the American Association for Dental Research. This project was partially supported by a grant awarded by the Biomedical Research Support Grant program, a division of Research Re- sources of the National Institutes of Health, by organized
Acoustic-speech study 379
research support from the State of Louisiana, and by National Institutes of Health Grant NS 11647. Equipment was provided by the Louisiana Lions Eye Foundation. Facilities were pro- vided, in part, by a grant from the Kresge Foundation. We would like to thank Reginold Ross and Pete Nasser for their help in the analysis of data.
REFERENCES 1.
2.
3.
4.
5.
6.
7.
8.
9.
10.
11.
12.
13.
14.
Graber TM: Orthodontics: Principles and practice, ed 3. Phila- delphia, 1972, WB Saunders Co, pp 757-765. Graber TM, Swain B: Current orthodontic concepts and tech- niques, ed 3. Philadelphia, 1975, WB Saunders Co, pp 1053- 1090. Ewan W: Aspects of speech and orthognathic surgery. In Lass NJ (editor): Speech and language: Research and theory, vol 4. New York, 1980, Academic Press, Inc, pp 240-289. Garber SR, Speidel T, Marse G: The effects on speech of surgical premaxillary osteotomy. AM J ORTHOD 79: 54-62, 1981. Glass L, Knapp J, Bloomer H: Speech and lingual behavior before and after mandibular osteotomy. J Oral Surg 35: 104, 1977. Goodstein DB, Cooper D, Wallace L: The effect on speech of surgery for correction of mandibular prognathism. Oral Surg 37: 846, 1974. Turvey TA, Joumet V, Epker B: Correction of anterior open bite deformity: A study of tongue function, speech changes, and stability. J Maxillofac Surg 4: 93, 1976. Witzel MA, Ross R, Munro I: Articulation before and after facial osteotomy. J Maxillofac Surg 8: 195-202, 1980. Denes PB, Pinson EN: The speech chain: The physics and bi- ology of spoken language. Garden City, N.Y., 1973, Anchor Bks, Doubleday & Co, pp 75-83. Ladefoged P: A course in phonetics. New York, 1975, Harcourt Brace Jovanovich, Inc. pp 113-124, 168-191. Tobey E, Finger I: Active versus passive adaptation: An acoustic study of vowels produced with and without dentures. J Prosthet Dent 49: 314-320, 1983. Li J: Statistical inferences. Ann Arbor, Mich, 1964, JW Ed- wards, pp 270-273. Oller D, Wiemar L, Doyle W, Ross C: Infant babbling and speech. J Child Lang 3: l-l 1, 1976. Borden F, Harris K: The speech science primer: Physiology, acoustics and perception of speech. Baltimore, 1980, Williams & Wilkins.
Reprint requests to:
Dr. Emily Tobey Kresge Hearing Research Laboratory Louisiana State University Medical Center 1100 Florida Ave., Bldg. 124 New Orleans, LA 70119


