Embed Size (px)
Citation preview

1
Color Detection in RGB Space Using Hierarchical
Neural Network Structure
Dept. of Electrical-Electronics Engineering, Niğde University, Turkey
Abstract
Color detection has a wide application area on
computer based systems. In example, road sign
detection, skin color detection, location detection
etc. This paper describes a new method for color
detection in RGB space. In order to improve any
color detection system, neural networks, specialized
for each color, are used. These expert neural
networks are the keystone of the hierarchical
structure. Conventional N.N. structure and
hierarchical N.N. structure are tested with many
different data sets to compare the results of these
systems.
1. Introduction
The purpose of the color detection is to differentiate
the objects based on their colors in an image. This
detection gives you the chance of doing any kind of
process related to that object. For example tracking,
labeling in industry, skin color detection as a pre-
process of face detection etc.
While image analysis in RGB space, an actual color
is decomposed to its basic color percentages. In this
color space, Red (R), Green (G) and Blue (B)
colors are basics and all other colors can be
obtained from their combinations. In color monitors
for TV and computers, RGB color space is used as
a standard. For our system, one of the advantages
about RGB space is, it is convenient for the training
part of N.N. This advantage contributes system at
deciding level.
Many color detection methods have been developed
until now. For example, color detection for road
and traffic signs with taking images in a car and
converting them into HSV color space [1]. Vehicle
detection using normalized color and edge map, this
detection is different from traditional methods
which introduces a new color transform model to
find vehicle color [2]. Tagging and tracking in
video using neural network color detection and
spatial filters, using a developed algorithm with
neural network which is generated from the first
frame of a video sequence to detect the object of a
chosen color [3] . Detection of ice and mixed ice
water pixels for MODIS ocean color data
Processing [4] .
This paper describes a new developed method using
neural network in a hierarchical structure by using
RGB color space for color detection in any image.
2. RGB Color Space
A RGB color space is defined by the three different
colors, red, green and blue. It can be produced any
secondary color by those primary colors. One of the
most widely used application of the RGB color
model is the display of colors on CRT, LCD, or
plasma display, such as a television or a computer’s
monitor. Each pixel on the display can be
represented in the interface hardware as values of
red, green and blue. Their rates can be changed in a
range of 256 possible values. When written, RGB
values are commonly specified using three integers
between 0 and 255, representing red, green, and
blue intensities, in that order. The basic scheme of
RGB color space is shown as figure 1.
Figure 1: The basic scheme of RGB color
space.
3. Multilayer Perceptron
A multilayer perceptron (MLP) is a feed forward
artificial neural network model.

2
Figure 2: The basic structure of MLP
An MPL consist of one input layer, one or more
hidden layers and one output layer. These layers
have many nodes connected to each other. The
input layer neurons collect the data, multiply them
by the connection weights and send the processed
data to the next layer and so on.
A neural network has to be trained before usage
with a learning technique called back propagation.
Learning happens in the MLP by changing the
connection weights with respect to the expected
outputs.
MLP is a model which can distinguish the non-
linearly separable data. That’s why MLP has a non-
linear activation function. Output of the activation
function is the output of the network.
MLP can be used for any kind of classification
problem, especially for complex ones. Speech
processing, image processing and applications that
need artificial intelligence are some of them.
4. Color Detection Using MLP
Color detection is a common problem which can be
solved by using neural networks.
First thing has to be done is to create a database
which consist of RGB percentages of colors that is
going to be detected in an image. And also the
target for each data has to be determined to train the
network.
Color R G B Target
Blue 10 14 230 10000
Green 14 220 12 01000
Green 20 210 25 01000
White 255 250 253 00010
Yellow 220 215 45 00001
Red 215 25 18 00100
Blue 24 42 226 10000
White 245 250 249 00010
Yellow 230 190 17 00001
Table 1: Data set sample
- Normalized RGB
R = 𝑅
𝑅+𝐺+𝐵 G =
𝐺
𝑅+𝐺+𝐵 B =
𝐵
𝑅+𝐺+𝐵
Normalized RGB values are the inputs and the
targets are the expected outputs for a neural
network.
A network trained with a larger data set gives better
results.
After the training, the network is ready to use.
While testing the input are the RGB values of a
pixel in an image. The network will produce a
result which is based on the results of the training.
For instance, the network may produce a result like
0.998 0.0001 0 .001 0.002 -0.001 for an input like
13 15 213. By looking at the results it is easy to say
that pixel is blue. After this process is done for the
all pixels in an image, colors in the image are
detected by the N.N.
As an example, colorful images were used as inputs
for the conventional N.N. structure [figure3-4-5-6].
In order to show a result, the images were re-
generated by the outputs of N.N. [figure 7-8-9-10].
Figure: 3 – Parrots [5]

3
Figure: 4 – Peppers [6]
Figure: 5 – Milk Drop [7]
Figure: 6 – Lena [8]
Image
Name
Parrots
Peppers
Milk-Drop
Lena
Number
of sample
colors
9
5
8
10
Sample Colors (RGB)
98-124-25
220-220-220
220-3-12
235-47-61
3-33-3
99-144-186
6-47-79
12-12-12
72-41-13
193-45-43
108-176-85
182-203-80
209-219-208
38-0-0
210-223-216
187-190-183
188-138-49
183-151-92
41-0-0
86-24-3
56-65-62
78-82-81
221-159-100
186-102-66
216-184-169
220-232-232
116-126-195
14-21-76
247-255-255
240-212-201
24-14-15
70-53-69
Image
Size
600x400
512x512
450x305
512x512
Some colors were generated with respect to the
picked sample colors. Neural network was trained
with a learning technique called back propagation
and data sets consist of these colors were used for
the training. The neural network has 4 inputs, 1
hidden layer including 10 neurons and the output is
equal to the number of sample colors.
Input 1: 𝑅
𝑅+𝐺+𝐵 Input 2:
𝐺
𝑅+𝐺+𝐵 Input 3:
𝐵
𝑅+𝐺+𝐵
Input 4: 𝑅+𝐺+𝐵
255
Figure: 7 – Result of conventional N.N. structure
Figure: 8 - Result of conventional N.N. structure
Figure: 9 - Result of conventional N.N. structure

4
Figure: 10 - Result of conventional N.N. structure
5. Proposed Structure for MLP
In our method more than one neural network were
used. We have neural networks at the first layer of
the hierarchy as the number of color classes. These
neural networks are specialized for each color and
they are very important at deciding level. If one
N.N. is expert about red, it produces only two
outputs related to its input. It says the input is red or
not. These all outputs, we get from all these neural
networks, are the input of the other N.N. at the
second layer of the hierarchy. The whole structure
is depicted in figure 7.
Figure: 7
The simulation results of the expert neural networks
are used for the training of the main N.N.
If we have n color we will also have n output and
these outputs are the final results of the whole
system.
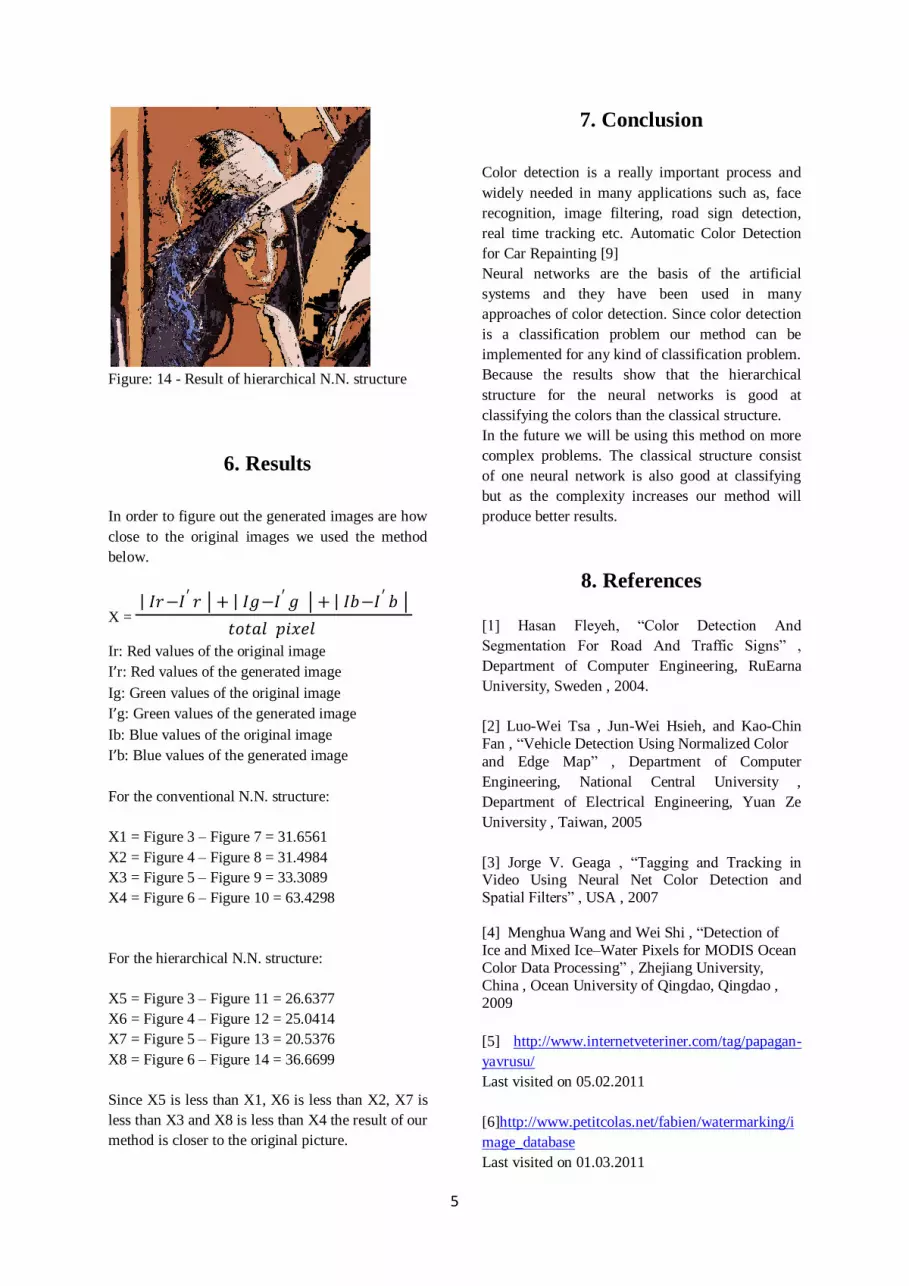
The images shown in figure 3-4-5-6 are also
applied as input for this structure and the images
were re-generated to show the results. Figure [11-
12-13-14]
Same data sets were used for this structure. All of
the neural networks were trained with a learning
technique called back propagation. Expert neural
networks were trained first and simulated. Main
network was trained with the simulation results.
Figure: 11 - Result of hierarchical N.N. structure
Figure: 12 - Result of hierarchical N.N. structure
Figure: 13 - Result of hierarchical N.N. structure
5
Figure: 14 - Result of hierarchical N.N. structure
6. Results
In order to figure out the generated images are how
close to the original images we used the method
below.
X = 𝐼𝑟 − 𝐼′ 𝑟 + 𝐼𝑔 − 𝐼′ 𝑔 + 𝐼𝑏 − 𝐼′ 𝑏
𝑡𝑜𝑡𝑎𝑙 𝑝𝑖𝑥𝑒𝑙
Ir: Red values of the original image
I’r: Red values of the generated image
Ig: Green values of the original image
I’g: Green values of the generated image
Ib: Blue values of the original image
I’b: Blue values of the generated image
For the conventional N.N. structure:
X1 = Figure 3 – Figure 7 = 31.6561
X2 = Figure 4 – Figure 8 = 31.4984
X3 = Figure 5 – Figure 9 = 33.3089
X4 = Figure 6 – Figure 10 = 63.4298
For the hierarchical N.N. structure:
X5 = Figure 3 – Figure 11 = 26.6377
X6 = Figure 4 – Figure 12 = 25.0414
X7 = Figure 5 – Figure 13 = 20.5376
X8 = Figure 6 – Figure 14 = 36.6699
Since X5 is less than X1, X6 is less than X2, X7 is
less than X3 and X8 is less than X4 the result of our
method is closer to the original picture.
7. Conclusion
Color detection is a really important process and
widely needed in many applications such as, face
recognition, image filtering, road sign detection,
real time tracking etc. Automatic Color Detection
for Car Repainting [9]
Neural networks are the basis of the artificial
systems and they have been used in many
approaches of color detection. Since color detection
is a classification problem our method can be
implemented for any kind of classification problem.
Because the results show that the hierarchical
structure for the neural networks is good at
classifying the colors than the classical structure.
In the future we will be using this method on more
complex problems. The classical structure consist
of one neural network is also good at classifying
but as the complexity increases our method will
produce better results.
8. References
[1] Hasan Fleyeh, “Color Detection And
Segmentation For Road And Traffic Signs” ,
Department of Computer Engineering, RuEarna
University, Sweden , 2004.
[2] Luo-Wei Tsa , Jun-Wei Hsieh, and Kao-Chin
Fan , “Vehicle Detection Using Normalized Color
and Edge Map” , Department of Computer
Engineering, National Central University ,
Department of Electrical Engineering, Yuan Ze
University , Taiwan, 2005
[3] Jorge V. Geaga , “Tagging and Tracking in Video Using Neural Net Color Detection and
Spatial Filters” , USA , 2007
[4] Menghua Wang and Wei Shi , “Detection of
Ice and Mixed Ice–Water Pixels for MODIS Ocean
Color Data Processing” , Zhejiang University,
China , Ocean University of Qingdao, Qingdao ,
2009
[5] http://www.internetveteriner.com/tag/papagan-
yavrusu/
Last visited on 05.02.2011
[6]http://www.petitcolas.net/fabien/watermarking/i
mage_database
Last visited on 01.03.2011

6
[7] http://www.designer-daily.com/milk-meets-
coffee-283
Last visited on 01.03.2011
[8] http://www.dfstudios.co.uk/articles/image-
processing-algorithms-part-2
Last visited on 01.03.2011
[9] Ibrahim Al-Bahadly, Hassane Darhmaoui,
“Automatic Colour Detection for Car Repainting”,
Institute of Information Sciences and Technology
Massey University, New Zealand, School of
Science and Engineering AlAkhawayn University,
Morocco, 2005


