Embed Size (px)
Citation preview
An Evaluation of the Impact of Nigeria’s Trade and Investment Policy Reforms♥
by
E. Olawale OGUNKOLA Abiodun S. BANKOLE Adeolu O. ADEWUYI
Trade Policy Research and Training Programme (TPRTP) Department of Economics
University of Ibadan
March 2006
♥An abridged version of the Final Report of a study supported by the African Economic Research Consortium (AERC), Nairobi, Kenya. The authors are research Fellows in the Trade Policy Research and Training Programme (TPRTP) in the Department of Economics, University of Ibadan, Nigeria.
I. Introduction
Nigeria, like many other countries, is currently engaged in an array of economic reforms
negotiations aimed at promoting development and reducing poverty. At the regional level, investment and
trade reforms are significant components of the Economic Community of West African States (ECOWAS)
negotiations. As a founding member of ECOWAS in 1975, the country has consistently pursued the quest
for improved market access conditions simultaneously with policies that will strengthen the weak supply
response capacity. While trade and investment components of the negotiations are not new to the regional
arrangement, the current momentum is understandable in the context of the relationship between the
European Union and the African-Caribbean-Pacific (ACP) countries that is currently being redefined.
Indeed, the on going negotiations of the Economic Partnership Agreement (EPA) which is the economic
component of the Cotonou Partnership Agreement (CPA) focus on trade and investment reforms. The
negotiations of an EPA between West Africa and the European Union (EU) which is scheduled to be on till
December 2007 constitute the second major negotiations which Nigeria is expected to be actively engaged.
Beyond the negotiations of intra- and extra-regional agreements, the country, a founding member of the
World Trade Organisation (WTO) is currently participating in the multilateral negotiations of trade and
investment under the Doha development agenda. This constitutes the third major negotiations that the
country is currently engaged in.
The current frenzy about negotiations should benefit from the experience with previous reforms that
characterised the mid 1980s of which trade and investment are the major components. Starting with the
structural adjustment programme (SAP) in the mid 1980s, and moving to the current home-grown National
Economic Empowerment Development Strategies (NEEDS), different reforms in trade and investment
components points to the liberalisation stance of the government. The reforms encompass changes in policy
directions as well as policy instruments. Investment policy, for instance, witnessed a radical reform as the
indigenisation policy of the government was abandoned in favour of a liberalised (foreign and domestic)
investment regime. In most cases institutional reforms constituted a major component of the package. Again
in the area of investment policy, the Nigerian Investment Promotion Commission (NIPC) was not only re-
invigorated but also strengthened to discharge its redefined statutory functions.
Indeed, SAP was a watershed in the history of trade and investment policy reforms in the country.
The Programme was able to achieve substantial reduction in average tariffs and also saw to the minimal
application of quantitative import restrictions. As a comprehensive approach to restructure the Nigerian
economy, the Programme contains policies that are complementary to trade and investment especially
foreign exchange reform.
This study examines and evaluates the impact of trade and investment policy reforms on some
macroeconomic performance variables. It simulates the impact of entrenched policy scenarios on growth
variables. The lessons from the simulation experiments provide useful inputs into on-going negotiations. The
rest of this paper is structured as follows; Section II reviews the structure and performance of the Nigerian
economy. Section III presents theoretical and analytical framework of the study, while Section IV contains
2
methodology. Section V is on the empirical analysis and Simulation. Section VI provides the summary,
policy implications and conclusion.
II. Structure and Performance of the Nigerian Economy 2.1 Growth Performance and Structure of Output in Nigeria
Aggregate and sectoral output growth performance of the Nigerian economy over the study period is
presented in table 2.1. It can be seen from the table that aggregate output which declined by 3.0 per cent in
the 1980-85 period rose by 5.0 per cent in the following 1985-90 period. It can also be observed from the
table that growth of output of the main sectors of the economy (agriculture, industry and services) during the
two periods followed the same pattern. The largest decrease in sectoral output during the 1980-85 period
was witnessed in the industrial sector, while the lowest was recorded in the services sector. Further, the
highest increase in output during the 1985-90 period was recorded by the services sector, while the lowest
was experienced in the industrial sector. The poor output growth performance of the economy during 1980-
85 period was not unconnected with various macroeconomic crises which adversely affected productivity in
all sectors of the economy. It should be stated that the after effects of the collapse of the world price of crude
oil in the late 1970s was fiscal and balance of payments deficits which led to rising and accumulated
domestic and external debts with negative consequences on investment and output growth.
Against the backdrop of the persistence of the macroeconomic crises even after the introduction of
stabilization measures in 1982, the Structural Adjustment Programme (SAP) was adopted in Nigeria in
1986. Among the policies and programmes packaged in SAP were trade and financial liberalisation, export
and investment promotion and privatisation and commercialization. All these policy reforms might have
promoted sectoral and aggregate output growth performance recorded during 1985-1990 period. The
subsequent periods 1990-1995 and 1995-2000 witnessed declining rate of growth of aggregate output and
differences in sectoral output growth. Thus, the rate of growth of aggregate output which was 5.0 percent in
1985-1990 period fell to 3.4 percent in 1990-1995 period and to 2.9 percent in 1995-2000 period. It should
be noted that the rate of growth of output of the services sector which was the highest in the previous periods
fell to 2.5 percent n the 1995-2000 period. The unimpressive growth performance recorded by the industrial
sector during 1990-1995 gradually improved in the subsequent 1995-2000 period, while agricultural sector
recorded the highest increase in output during the period. However, SAP was scrapped towards the end of
1993.
The period 2000-2004 witnessed improved aggregate and sectoral growth performance because, the
growth performance of the economy improved from 2.9 percent in 1995-2000 period to 6.0 percent in 2000-
2004 period. Similarly, the rate of sectoral output growth improved significantly particularly in the industrial
and services sectors. During this period, sectoral rates of growth ranged between 5.0 and 7.0 percent. This
impressive output growth performance recorded by the Nigerian economy can be attributed largely to
favourable development in the foreign crude oil market in form of substantial improvement in terms of trade
and relatively high volume of oil export. The reform programmes introduced by the current democratic
government in Nigeria might have also contributed to the improvement recorded in the non-oil sector of the
3
economy. Thus, with the current average output growth rate of about 6.0, Nigeria can reach a sustainable
rate of growth of 7.0 percent required for poverty alleviation as recommended in most poverty reduction
strategies (PRS) such as the Millennium Development Goals (MDGs) and the New Partnership for African
Development.
An assessment of the level of industrialization and economic development achieved in a country can
be conducted by examining the structure of output in that country. Table 2.1 indicates that, as at 1980,
industrial sector contributed almost half of the total output in Nigeria. This is followed by the services
sector which accounted for over 30.0 percent of total output. By 1990, the structure of output had changed
just slightly with the industrial sector continuing to play the leading role while the agricultural sector had
displaced the services sector as the second growth driver. By 1995, there was a further shift in the structure
of output in Nigeria, as the agricultural sector had also displaced the industrial sector in terms of its share of
total output of the economy which was about 43.0 per cent. Next to the agricultural sector was the services
sector which accounted for 31.0 percent of total output. In the early 2000s, the industrial sector resumed its
leading role by accounting for 45.0, 49.0 and 39.0 per cent of total output in 2001, 2003 and 2004
respectively. This is followed by the agricultural sector which contributed between 26.0 and 31.0 per cent of
the total output during this period. Thus, Nigeria’s development experience has not followed the path of
industrialisation, particularly because, instead of declining to a relatively low level, the contribution of the
agricultural sector over time has increased and remained relatively high. This therefore informs the need for
renewed economic reform efforts and policy programmes to transform the Nigerian economy from agrarian
to an industrialised entity. The role of investment and trade policy reforms is germane towards this course.
Table 2.1: Nigeria: Average Annual Growth Rate of the economy (Aggregate and Sectoral) and Structure of output
Aggregate and sectoral growth 1980-85 1985-90 1990-95 1995-2000 2000-04* (A) Aggregate output growth -3.0 5.0 3.4 2.9 5.96 (B) Sectoral output growth
• Agriculture -1.5 6.4 2.7 4.5 5.27 • Industry -6.1 2.1 -0.5 1.8 6.78 • Services -0.3 7.6 6.8 2.5 6.74
Sectoral share of GDP 1980 1990 1995 2001 2004* • Agriculture 27.0 33.0 43.0 30.0 31.0 • Industry 40.0 41.0 26.0 45.0 39.0 • Services 33.0 26.0 31.0 25.0 30.0 • Total 100.0 100.0 100.0 100.0 100.0
Source: The World Bank, African Development Indicators, Washington, DC. Note * Figure obtained from the Central Bank of Nigeria, Annual Report and Statement of Accounts (2004), Abuja
2.2 Rate and Structure of Investment and Savings
Average annual rates of investment and savings are presented in Table 2.2. Domestic aggregate
investment rate has increased over time. It rose from about 14.0 per cent in the period 1980-1985 to 15.0 per
cent in 1985-1990 period and further to about 20.0 and 21.0 per cent in 1990-1995 and 1995-2000 periods
and reached over 23.0 per cent in 2002. Continuous rise in the average rate of aggregate domestic
investment over time is explained by the fact that private domestic investment rate rose faster than public
domestic investment rate until 2001 when the latter began to rise again. Private investment rate rose from 6.1
4
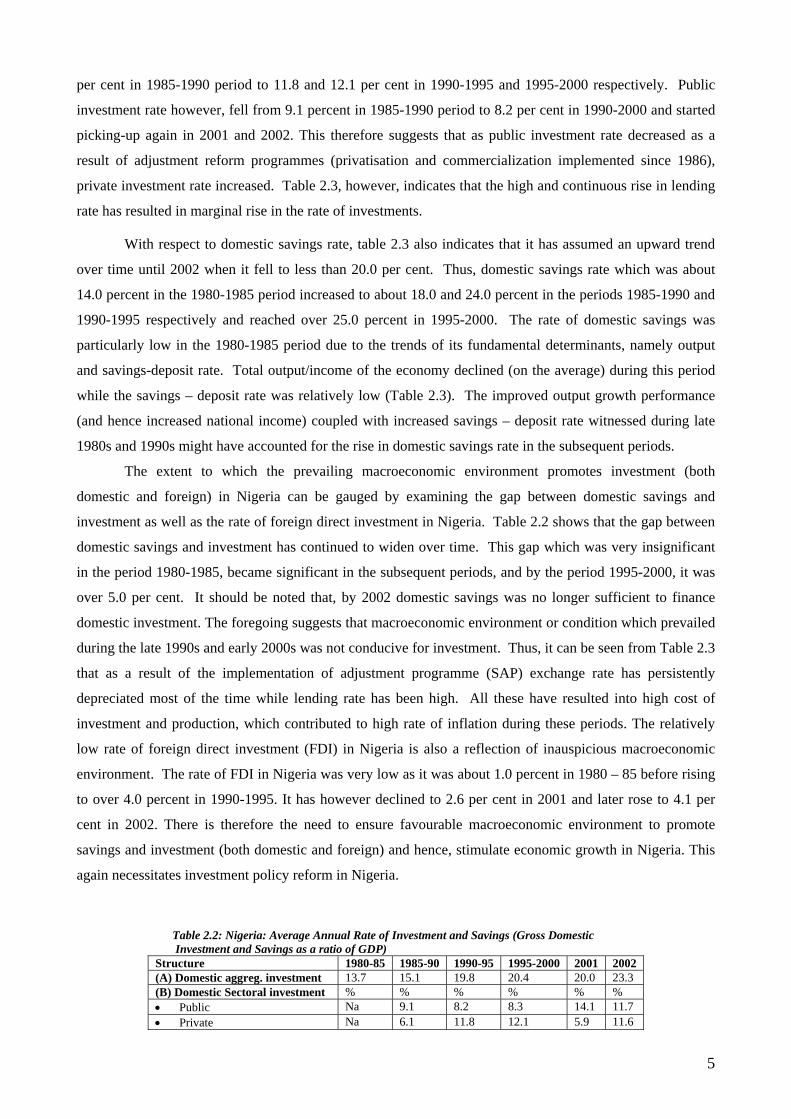
per cent in 1985-1990 period to 11.8 and 12.1 per cent in 1990-1995 and 1995-2000 respectively. Public
investment rate however, fell from 9.1 percent in 1985-1990 period to 8.2 per cent in 1990-2000 and started
picking-up again in 2001 and 2002. This therefore suggests that as public investment rate decreased as a
result of adjustment reform programmes (privatisation and commercialization implemented since 1986),
private investment rate increased. Table 2.3, however, indicates that the high and continuous rise in lending
rate has resulted in marginal rise in the rate of investments.
With respect to domestic savings rate, table 2.3 also indicates that it has assumed an upward trend
over time until 2002 when it fell to less than 20.0 per cent. Thus, domestic savings rate which was about
14.0 percent in the 1980-1985 period increased to about 18.0 and 24.0 percent in the periods 1985-1990 and
1990-1995 respectively and reached over 25.0 percent in 1995-2000. The rate of domestic savings was
particularly low in the 1980-1985 period due to the trends of its fundamental determinants, namely output
and savings-deposit rate. Total output/income of the economy declined (on the average) during this period
while the savings – deposit rate was relatively low (Table 2.3). The improved output growth performance
(and hence increased national income) coupled with increased savings – deposit rate witnessed during late
1980s and 1990s might have accounted for the rise in domestic savings rate in the subsequent periods.
The extent to which the prevailing macroeconomic environment promotes investment (both
domestic and foreign) in Nigeria can be gauged by examining the gap between domestic savings and
investment as well as the rate of foreign direct investment in Nigeria. Table 2.2 shows that the gap between
domestic savings and investment has continued to widen over time. This gap which was very insignificant
in the period 1980-1985, became significant in the subsequent periods, and by the period 1995-2000, it was
over 5.0 per cent. It should be noted that, by 2002 domestic savings was no longer sufficient to finance
domestic investment. The foregoing suggests that macroeconomic environment or condition which prevailed
during the late 1990s and early 2000s was not conducive for investment. Thus, it can be seen from Table 2.3
that as a result of the implementation of adjustment programme (SAP) exchange rate has persistently
depreciated most of the time while lending rate has been high. All these have resulted into high cost of
investment and production, which contributed to high rate of inflation during these periods. The relatively
low rate of foreign direct investment (FDI) in Nigeria is also a reflection of inauspicious macroeconomic
environment. The rate of FDI in Nigeria was very low as it was about 1.0 percent in 1980 – 85 before rising
to over 4.0 percent in 1990-1995. It has however declined to 2.6 per cent in 2001 and later rose to 4.1 per
cent in 2002. There is therefore the need to ensure favourable macroeconomic environment to promote
savings and investment (both domestic and foreign) and hence, stimulate economic growth in Nigeria. This
again necessitates investment policy reform in Nigeria.
Table 2.2: Nigeria: Average Annual Rate of Investment and Savings (Gross Domestic Investment and Savings as a ratio of GDP)
Structure 1980-85 1985-90 1990-95 1995-2000 2001 2002 (A) Domestic aggreg. investment 13.7 15.1 19.8 20.4 20.0 23.3 (B) Domestic Sectoral investment % % % % % % • Public Na 9.1 8.2 8.3 14.1 11.7 • Private Na 6.1 11.8 12.1 5.9 11.6
5
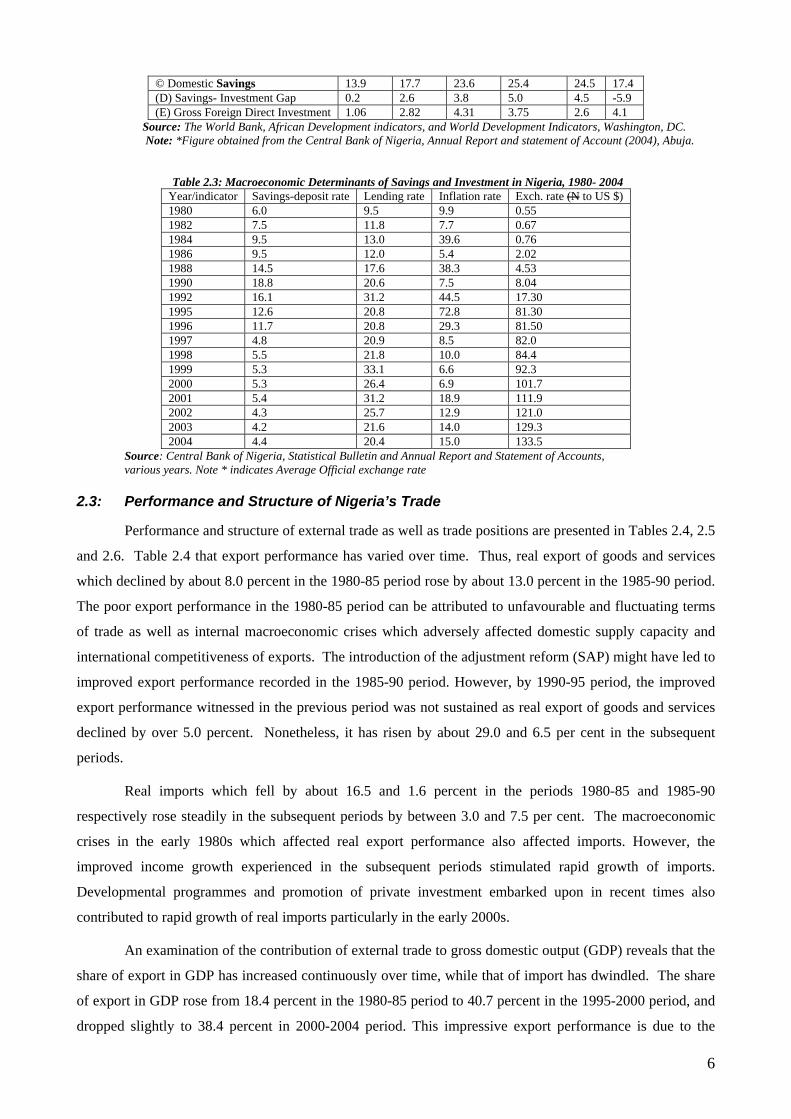
© Domestic Savings 13.9 17.7 23.6 25.4 24.5 17.4 (D) Savings- Investment Gap 0.2 2.6 3.8 5.0 4.5 -5.9 (E) Gross Foreign Direct Investment 1.06 2.82 4.31 3.75 2.6 4.1
Source: The World Bank, African Development indicators, and World Development Indicators, Washington, DC. Note: *Figure obtained from the Central Bank of Nigeria, Annual Report and statement of Account (2004), Abuja.
Table 2.3: Macroeconomic Determinants of Savings and Investment in Nigeria, 1980- 2004 Year/indicator Savings-deposit rate Lending rate Inflation rate Exch. rate (N to US $) 1980 6.0 9.5 9.9 0.55 1982 7.5 11.8 7.7 0.67 1984 9.5 13.0 39.6 0.76 1986 9.5 12.0 5.4 2.02 1988 14.5 17.6 38.3 4.53 1990 18.8 20.6 7.5 8.04 1992 16.1 31.2 44.5 17.30 1995 12.6 20.8 72.8 81.30 1996 11.7 20.8 29.3 81.50 1997 4.8 20.9 8.5 82.0 1998 5.5 21.8 10.0 84.4 1999 5.3 33.1 6.6 92.3 2000 5.3 26.4 6.9 101.7 2001 5.4 31.2 18.9 111.9 2002 4.3 25.7 12.9 121.0 2003 4.2 21.6 14.0 129.3 2004 4.4 20.4 15.0 133.5
Source: Central Bank of Nigeria, Statistical Bulletin and Annual Report and Statement of Accounts, various years. Note * indicates Average Official exchange rate
2.3: Performance and Structure of Nigeria’s Trade
Performance and structure of external trade as well as trade positions are presented in Tables 2.4, 2.5
and 2.6. Table 2.4 that export performance has varied over time. Thus, real export of goods and services
which declined by about 8.0 percent in the 1980-85 period rose by about 13.0 percent in the 1985-90 period.
The poor export performance in the 1980-85 period can be attributed to unfavourable and fluctuating terms
of trade as well as internal macroeconomic crises which adversely affected domestic supply capacity and
international competitiveness of exports. The introduction of the adjustment reform (SAP) might have led to
improved export performance recorded in the 1985-90 period. However, by 1990-95 period, the improved
export performance witnessed in the previous period was not sustained as real export of goods and services
declined by over 5.0 percent. Nonetheless, it has risen by about 29.0 and 6.5 per cent in the subsequent
periods.
Real imports which fell by about 16.5 and 1.6 percent in the periods 1980-85 and 1985-90
respectively rose steadily in the subsequent periods by between 3.0 and 7.5 per cent. The macroeconomic
crises in the early 1980s which affected real export performance also affected imports. However, the
improved income growth experienced in the subsequent periods stimulated rapid growth of imports.
Developmental programmes and promotion of private investment embarked upon in recent times also
contributed to rapid growth of real imports particularly in the early 2000s.
An examination of the contribution of external trade to gross domestic output (GDP) reveals that the
share of export in GDP has increased continuously over time, while that of import has dwindled. The share
of export in GDP rose from 18.4 percent in the 1980-85 period to 40.7 percent in the 1995-2000 period, and
dropped slightly to 38.4 percent in 2000-2004 period. This impressive export performance is due to the
6
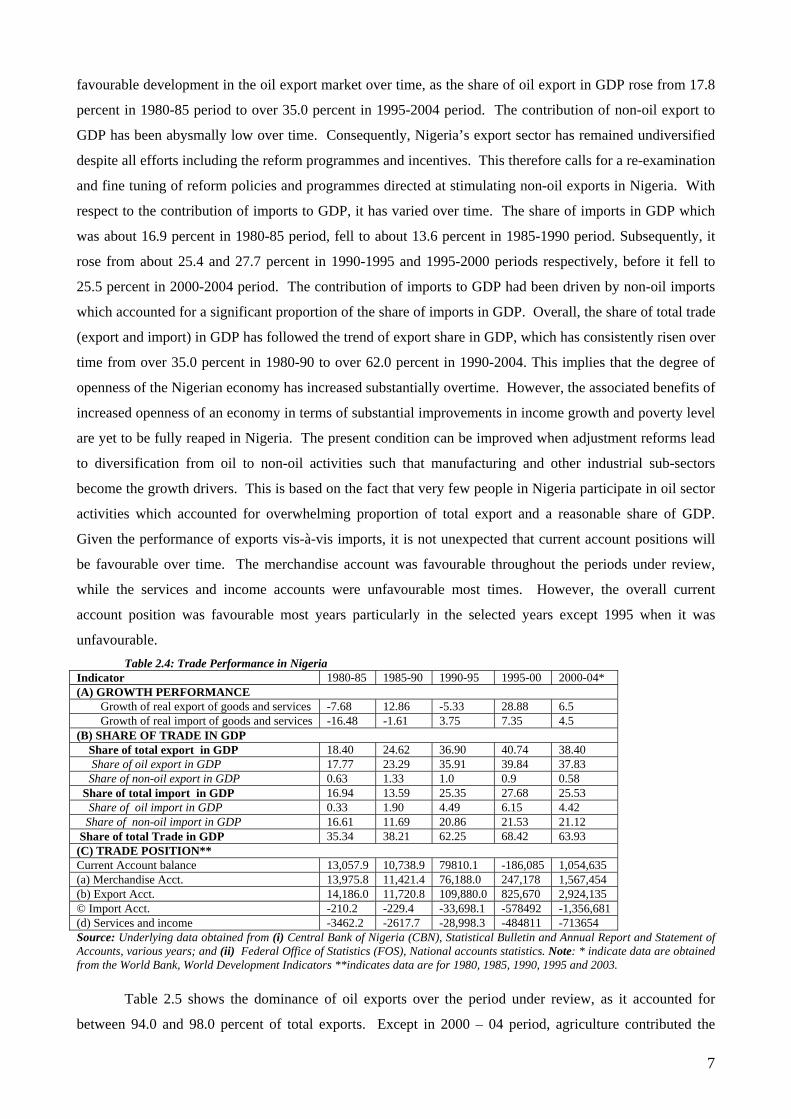
favourable development in the oil export market over time, as the share of oil export in GDP rose from 17.8
percent in 1980-85 period to over 35.0 percent in 1995-2004 period. The contribution of non-oil export to
GDP has been abysmally low over time. Consequently, Nigeria’s export sector has remained undiversified
despite all efforts including the reform programmes and incentives. This therefore calls for a re-examination
and fine tuning of reform policies and programmes directed at stimulating non-oil exports in Nigeria. With
respect to the contribution of imports to GDP, it has varied over time. The share of imports in GDP which
was about 16.9 percent in 1980-85 period, fell to about 13.6 percent in 1985-1990 period. Subsequently, it
rose from about 25.4 and 27.7 percent in 1990-1995 and 1995-2000 periods respectively, before it fell to
25.5 percent in 2000-2004 period. The contribution of imports to GDP had been driven by non-oil imports
which accounted for a significant proportion of the share of imports in GDP. Overall, the share of total trade
(export and import) in GDP has followed the trend of export share in GDP, which has consistently risen over
time from over 35.0 percent in 1980-90 to over 62.0 percent in 1990-2004. This implies that the degree of
openness of the Nigerian economy has increased substantially overtime. However, the associated benefits of
increased openness of an economy in terms of substantial improvements in income growth and poverty level
are yet to be fully reaped in Nigeria. The present condition can be improved when adjustment reforms lead
to diversification from oil to non-oil activities such that manufacturing and other industrial sub-sectors
become the growth drivers. This is based on the fact that very few people in Nigeria participate in oil sector
activities which accounted for overwhelming proportion of total export and a reasonable share of GDP.
Given the performance of exports vis-à-vis imports, it is not unexpected that current account positions will
be favourable over time. The merchandise account was favourable throughout the periods under review,
while the services and income accounts were unfavourable most times. However, the overall current
account position was favourable most years particularly in the selected years except 1995 when it was
unfavourable. Table 2.4: Trade Performance in Nigeria
Indicator 1980-85 1985-90 1990-95 1995-00 2000-04* (A) GROWTH PERFORMANCE
Growth of real export of goods and services -7.68 12.86 -5.33 28.88 6.5 Growth of real import of goods and services -16.48 -1.61 3.75 7.35 4.5
(B) SHARE OF TRADE IN GDP Share of total export in GDP 18.40 24.62 36.90 40.74 38.40 Share of oil export in GDP 17.77 23.29 35.91 39.84 37.83 Share of non-oil export in GDP 0.63 1.33 1.0 0.9 0.58 Share of total import in GDP 16.94 13.59 25.35 27.68 25.53 Share of oil import in GDP 0.33 1.90 4.49 6.15 4.42 Share of non-oil import in GDP 16.61 11.69 20.86 21.53 21.12 Share of total Trade in GDP 35.34 38.21 62.25 68.42 63.93 (C) TRADE POSITION** Current Account balance 13,057.9 10,738.9 79810.1 -186,085 1,054,635 (a) Merchandise Acct. 13,975.8 11,421.4 76,188.0 247,178 1,567,454 (b) Export Acct. 14,186.0 11,720.8 109,880.0 825,670 2,924,135 © Import Acct. -210.2 -229.4 -33,698.1 -578492 -1,356,681 (d) Services and income -3462.2 -2617.7 -28,998.3 -484811 -713654 Source: Underlying data obtained from (i) Central Bank of Nigeria (CBN), Statistical Bulletin and Annual Report and Statement of Accounts, various years; and (ii) Federal Office of Statistics (FOS), National accounts statistics. Note: * indicate data are obtained from the World Bank, World Development Indicators **indicates data are for 1980, 1985, 1990, 1995 and 2003.
Table 2.5 shows the dominance of oil exports over the period under review, as it accounted for
between 94.0 and 98.0 percent of total exports. Except in 2000 – 04 period, agriculture contributed the
7
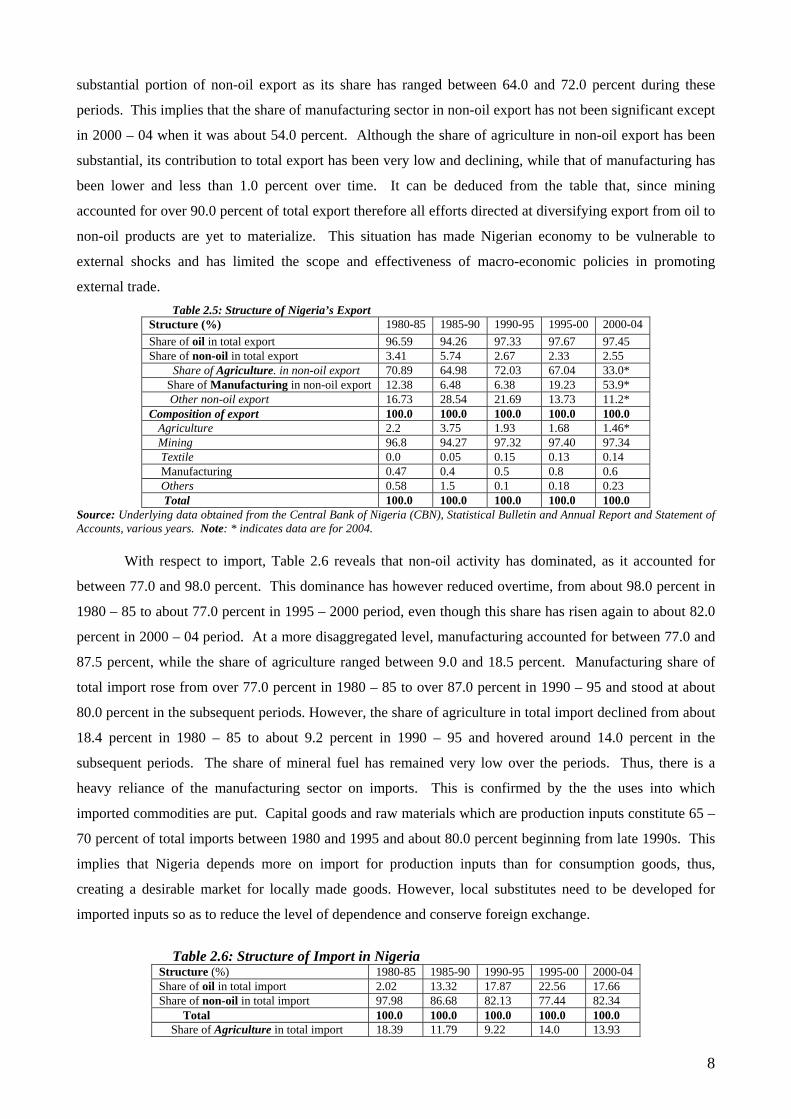
substantial portion of non-oil export as its share has ranged between 64.0 and 72.0 percent during these
periods. This implies that the share of manufacturing sector in non-oil export has not been significant except
in 2000 – 04 when it was about 54.0 percent. Although the share of agriculture in non-oil export has been
substantial, its contribution to total export has been very low and declining, while that of manufacturing has
been lower and less than 1.0 percent over time. It can be deduced from the table that, since mining
accounted for over 90.0 percent of total export therefore all efforts directed at diversifying export from oil to
non-oil products are yet to materialize. This situation has made Nigerian economy to be vulnerable to
external shocks and has limited the scope and effectiveness of macro-economic policies in promoting
external trade. Table 2.5: Structure of Nigeria’s Export
Structure (%) 1980-85 1985-90 1990-95 1995-00 2000-04 Share of oil in total export 96.59 94.26 97.33 97.67 97.45 Share of non-oil in total export 3.41 5.74 2.67 2.33 2.55
Share of Agriculture. in non-oil export 70.89 64.98 72.03 67.04 33.0* Share of Manufacturing in non-oil export 12.38 6.48 6.38 19.23 53.9* Other non-oil export 16.73 28.54 21.69 13.73 11.2* Composition of export 100.0 100.0 100.0 100.0 100.0 Agriculture 2.2 3.75 1.93 1.68 1.46* Mining 96.8 94.27 97.32 97.40 97.34 Textile 0.0 0.05 0.15 0.13 0.14 Manufacturing 0.47 0.4 0.5 0.8 0.6 Others 0.58 1.5 0.1 0.18 0.23 Total 100.0 100.0 100.0 100.0 100.0
Source: Underlying data obtained from the Central Bank of Nigeria (CBN), Statistical Bulletin and Annual Report and Statement of Accounts, various years. Note: * indicates data are for 2004.
With respect to import, Table 2.6 reveals that non-oil activity has dominated, as it accounted for
between 77.0 and 98.0 percent. This dominance has however reduced overtime, from about 98.0 percent in
1980 – 85 to about 77.0 percent in 1995 – 2000 period, even though this share has risen again to about 82.0
percent in 2000 – 04 period. At a more disaggregated level, manufacturing accounted for between 77.0 and
87.5 percent, while the share of agriculture ranged between 9.0 and 18.5 percent. Manufacturing share of
total import rose from over 77.0 percent in 1980 – 85 to over 87.0 percent in 1990 – 95 and stood at about
80.0 percent in the subsequent periods. However, the share of agriculture in total import declined from about
18.4 percent in 1980 – 85 to about 9.2 percent in 1990 – 95 and hovered around 14.0 percent in the
subsequent periods. The share of mineral fuel has remained very low over the periods. Thus, there is a
heavy reliance of the manufacturing sector on imports. This is confirmed by the the uses into which
imported commodities are put. Capital goods and raw materials which are production inputs constitute 65 –
70 percent of total imports between 1980 and 1995 and about 80.0 percent beginning from late 1990s. This
implies that Nigeria depends more on import for production inputs than for consumption goods, thus,
creating a desirable market for locally made goods. However, local substitutes need to be developed for
imported inputs so as to reduce the level of dependence and conserve foreign exchange.
Table 2.6: Structure of Import in Nigeria
Structure (%) 1980-85 1985-90 1990-95 1995-00 2000-04 Share of oil in total import 2.02 13.32 17.87 22.56 17.66 Share of non-oil in total import 97.98 86.68 82.13 77.44 82.34
Total 100.0 100.0 100.0 100.0 100.0 Share of Agriculture in total import 18.39 11.79 9.22 14.0 13.93
8
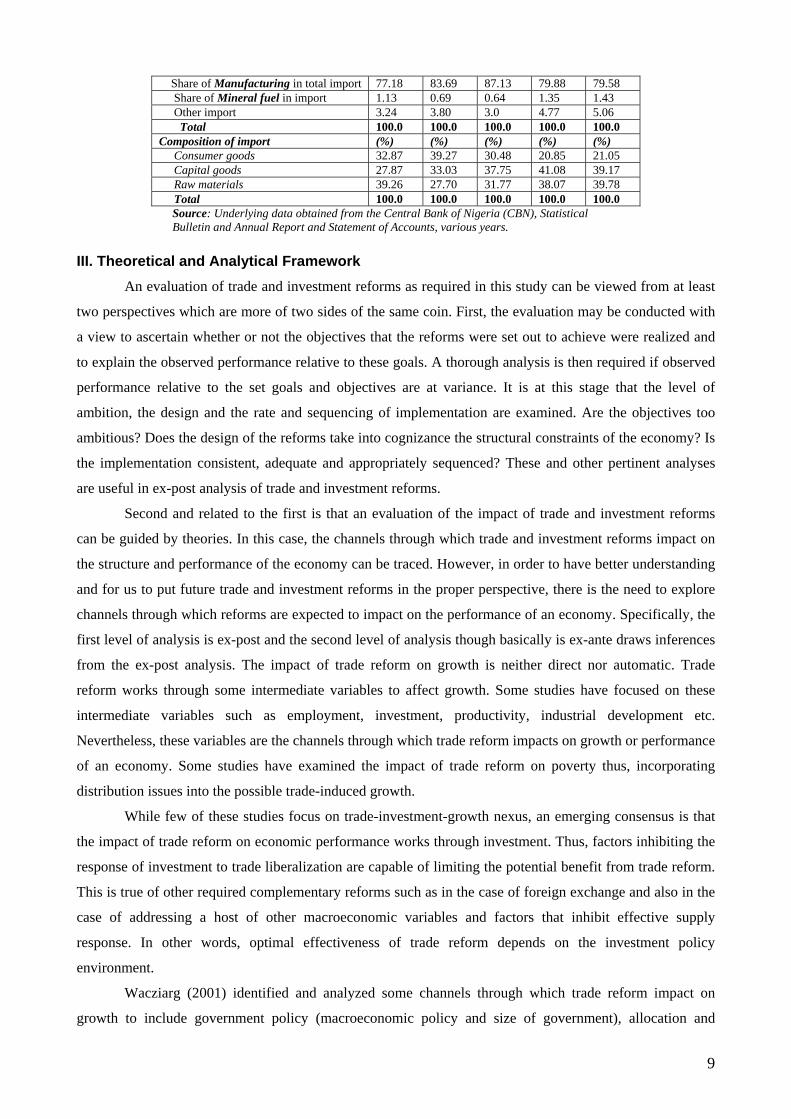
Share of Manufacturing in total import 77.18 83.69 87.13 79.88 79.58 Share of Mineral fuel in import 1.13 0.69 0.64 1.35 1.43 Other import 3.24 3.80 3.0 4.77 5.06 Total 100.0 100.0 100.0 100.0 100.0 Composition of import (%) (%) (%) (%) (%) Consumer goods 32.87 39.27 30.48 20.85 21.05 Capital goods 27.87 33.03 37.75 41.08 39.17 Raw materials 39.26 27.70 31.77 38.07 39.78 Total 100.0 100.0 100.0 100.0 100.0
Source: Underlying data obtained from the Central Bank of Nigeria (CBN), Statistical Bulletin and Annual Report and Statement of Accounts, various years.
III. Theoretical and Analytical Framework
An evaluation of trade and investment reforms as required in this study can be viewed from at least
two perspectives which are more of two sides of the same coin. First, the evaluation may be conducted with
a view to ascertain whether or not the objectives that the reforms were set out to achieve were realized and
to explain the observed performance relative to these goals. A thorough analysis is then required if observed
performance relative to the set goals and objectives are at variance. It is at this stage that the level of
ambition, the design and the rate and sequencing of implementation are examined. Are the objectives too
ambitious? Does the design of the reforms take into cognizance the structural constraints of the economy? Is
the implementation consistent, adequate and appropriately sequenced? These and other pertinent analyses
are useful in ex-post analysis of trade and investment reforms.
Second and related to the first is that an evaluation of the impact of trade and investment reforms
can be guided by theories. In this case, the channels through which trade and investment reforms impact on
the structure and performance of the economy can be traced. However, in order to have better understanding
and for us to put future trade and investment reforms in the proper perspective, there is the need to explore
channels through which reforms are expected to impact on the performance of an economy. Specifically, the
first level of analysis is ex-post and the second level of analysis though basically is ex-ante draws inferences
from the ex-post analysis. The impact of trade reform on growth is neither direct nor automatic. Trade
reform works through some intermediate variables to affect growth. Some studies have focused on these
intermediate variables such as employment, investment, productivity, industrial development etc.
Nevertheless, these variables are the channels through which trade reform impacts on growth or performance
of an economy. Some studies have examined the impact of trade reform on poverty thus, incorporating
distribution issues into the possible trade-induced growth.
While few of these studies focus on trade-investment-growth nexus, an emerging consensus is that
the impact of trade reform on economic performance works through investment. Thus, factors inhibiting the
response of investment to trade liberalization are capable of limiting the potential benefit from trade reform.
This is true of other required complementary reforms such as in the case of foreign exchange and also in the
case of addressing a host of other macroeconomic variables and factors that inhibit effective supply
response. In other words, optimal effectiveness of trade reform depends on the investment policy
environment.
Wacziarg (2001) identified and analyzed some channels through which trade reform impact on
growth to include government policy (macroeconomic policy and size of government), allocation and
9
distribution (price distortion and factor accumulation) and technological transmission (technology
transmission and foreign direct investment). Trade policy reforms through binding commitments provide
required external anchor for government policies. The consequences of not been virtuous in other policy
handles are usually devastating such as in the case of capital flight and migration of skilled manpower. It is
generally agreed that effective trade policy reform potentially tied the hands of government especially when
the commitments are binding at regional and/or multilateral levels. The effects of trade policy reforms on
government activity and its size is subject to empirical verification as large government size may insulate
consumers from various shocks. However, the need to ensure that the economic activities are competitive
may limit the size of government and in this sense large size of government is inconsistent with liberal trade
reform. An open economy is expected to be characterised by a lower degree of price distortion. The
argument is simply that free trade facilitates international price convergence through the law of one price.
The link between price distortions and factor accumulation and growth has been shown to be negative. Price
stability and convergence facilitates investment (Easterly 1989 and 1993).
Factor accumulation (investment) is a channel through which trade liberalization impact on the
performance of the economy. Levine and Renelt (1992) Baldwin and Seghezza (1996) and Wacziarg (2001)
among others have shown that an increase in wage-rental ratio, as a result of an adoption of liberal trade
regime will lead to an increase in the rate of investment. The impact of trade liberalization on investment has
also been explained through the big push hypothesis. That is, liberal trade regime removes constraints of
market size and thus generates impetus for new investment. Put differently, ‘the entry of new firms on
export markets, after an episode of liberalization, may well entail large fixed investment’ Wacziarg (2001).
Liberal trade regime may as well remove or relax structural constraint to capital goods imports.
Endogenous growth model emphasizes the role of technical capabilities in facilitating technological
transmission. Thus the model distinguishes between skilled and unskilled labour as the quality of available
labour impacts on the process of technology transmission. Trade reform enhances technology transmission
by making embodied technology available through traded goods and services. The higher the frequency and
volume of international trade transactions, the higher the possibility of imitations of foreign technologies.
Apart from transmission of technologies through efforts geared at meeting specific requirements of different
markets, embodied technological transmission has greatest potential in capital goods imports.
Foreign direct investment (FDI) is another channel through which foreign technology permeates
domestic economy. Irrespective of the type of FDI, various stakeholders tend to acquire one form of
technological capabilities or the other. It has been argued that capital goods imports tend to promote
technological capabilities more than FDI. Once capital goods are imported indigenous technologists are
responsible for their operations, maintenance and repair. In some cases, they modify and extend the
imported machinery and equipment. In the case of FDI, even if indigenous hands carried out all these
activities, they are subject to control by the parent companies (Ogunkola, 2002). In any case, the effect of
trade reform on FDI is not a priori clear. Changes in the level of FDI depend on the type and structure of
FDI in the pre-reform period and the content and level of implementation of reform and other
10
complementary policy reform. In a situation where trade reform increases the level of FDI, its effectiveness
interfering technology has the greatest potential of impacting positively on growth.
Different authors have emphasized different channels, with a few of them concentrating on trade-
investment-growth linkages (Levine and Renelt, (1992), Oyejide and Ogunkola (forthcoming). The starting
point is that trade reform and economic growth is related and that the relationship is mediated through
investment (Oyejide and Ogunkola (forthcoming). Explanation as to how trade and growth are related
through investment is usually cast in the framework of the new growth model. By classifying goods and
services according to their factor intensities: physical capital; human capital and labour and assuming traded
goods sectors are more physical capital-intensive than non-traded sector, trade reform is expected to drive up
the demand for physical capital in the first instance and consequently raise the return on capital and thus
boost investment. Two levels of linkages have been identified: First, the link between liberal trade reform
and traded sector. This postulates that trade liberalization boosts traded sector. The extent to which trade
liberalization induces expansion of traded sector depends on some other factors. At the second level of the
linkage, traded input goods are assumed to be an input into investment. Put differently, liberal trade regime
works through reduction in inputs costs, to lowering marginal cost of investment goods and services and
thereby reduces the cost of capital and, all things being equal, increases the level of investment.
In sum, new growth theory emphasizes the role of human capital through research and development
activities. A major part of this theory focuses on the relationship between trade and growth. The implication
of this relationship for trade policy reform can be traced through changes in relative prices. However, the
effect of trade reform on growth is not definite. Trade reform may increase or decrease growth rate
depending on the pattern of imports and exports (Baldwin 2003). Thus, empirical analysis is required to
determine the ultimate effect of liberal trade regime.
Empirical evaluation of different channels through which trade and investment reforms impact on
economic performance must, among other things, address the issue of measurement such as finding
appropriate proxies for some variables (macroeconomic policy, and even trade policy index). The empirical
analysis is complicated in the sense that trade reform even without investment reform impacts on the
performance of an economy through investment. When trade and investment reforms are combined,
empirical problem of identification cannot be ruled out. It may be difficult separating the changes in the
growth of an economy, as a result of trade and investment reforms into different components. Perhaps a
plausible method is to explicitly model the effect of trade reform on growth and/or performance index. Call
this model restricted model. An unrestricted model is then formulated to incorporate an investment dummy
variable into the restricted model to capture change in investment regime. A test is then performed to
determine whether or not the dummy is statistically significant. If the dummy is statistically significant, then
a model to capture the effect of investment reform on the economy in a simultaneous system with the trade
reform will be attempted.
The trade literature has concerned itself with the nature and extent of short-term adjustment costs
and long term benefits of trade and investment liberalizations. In the case of trade liberalization, which is
construed to imply export promotion and import policy reform, its full benefits have basically been
11
envisaged to be derived on a long term basis granting the absence of liberalization policy reversal which
works to truncate the process generating expected benefits. Received wisdom about the costs of import
liberalization revolves around three issues namely, generation of a more binding fiscal constraint,
deindustrialization and creation of unemployment through unfair import competition to domestic producers,
and bringing about balance of payment deficits. On the other hand, export policy reform is expected to only
provide benefits in terms of lessening a country’s foreign exchange constraints and balance of payments
problems, though issues have also been raised regarding the possibility of immiserising growth, principally
in cases of a large exporting country or export boom of a particular type of product involving several
exporting countries. Further benefits are expected if subsidies hitherto placed on goods to stimulate their
exports are reduced or removed as this reduction or removal then lowers or eliminates the distortion losses
from production and consumption.
For a typical developing country like Nigeria, the concerns have gravitated around the costs and
benefits associated with import liberalization in the form of reducing the number of prohibited goods and
subjecting them to tariffs and reduction of existing high tariffs. Hence, import liberalization benefits include
the expansion of supply base, including access to intermediate materials, lower prices, efficiency-inducing
competition to local industries, and the development of export firms which seeks trading opportunity in a
more open economy. Thus, export diversification constitutes a dynamic gain from import liberalisation,
along with capital accumulation through domestic and foreign investment, stimulus to competition,
transmission and acquisition of new technical and business knowledge and changes in attitudes and
institutions (Thirlwall, 2003, p.630). Increased income and consumption are the final long-term gains of
import liberalisation, resulting from dynamic gains of trade and manifested as an improvement of the
economy’s long-run growth. Where the liberalization takes the form of tariffication of import prohibitions or
quotas, reduction of government revenue normally postulated may not occur and liberalization of this sort
will turn out to be beneficial to the extent that it contributes to government revenue.
In the case of the reform of the investment environment, this constitutes a policy design following
the expectation of reaping such benefits as job creation, technology transfer, improved corporate governance
in terms of better management practices, capital formation, expanded market access, increased product
diversity and total productivity growth (see Coe, Helpman and Hoffmaister, 1997; Borensztein, De Gregorio
and Lee, 1995; de Mello, 1997). These claims have not been without some measure of pessimism, especially
as they relate to the impact of foreign direct investment on growth, which most investment reforms target.
Devarajan, Easterly and Pack (2003) are of the view that in the absence of several underlying fundamentals,
such as high capacity utilisation, good policies and high absorptive capacity of induced-skill acquisition
opportunities created by the foreign direct investment, a higher level of investment will not in itself lead to a
higher GDP growth rate. Where the foreign direct investment lacks appropriate backward linkages in the
host economy, especially the case of inadequate sourcing of inputs and intermediate materials from local
suppliers, the positive impact on growth occurs with a lag, and in effect, is slow (Akinlo 2004). The
inconclusive evidence of the relationship between foreign direct investment and growth may have
additionally been due to a number of factors namely, the proneness of foreign direct investment to widen
12
rural-urban income inequality, its encouragement of wasteful consumption, and introduction of inappropriate
technology which tends to crowd out or slow down the development of indigenous capital goods industry
and stifle indigenous entrepreneurship (Thirlwall 2003).
IV Methodology of the Study IV.1 Model Specification
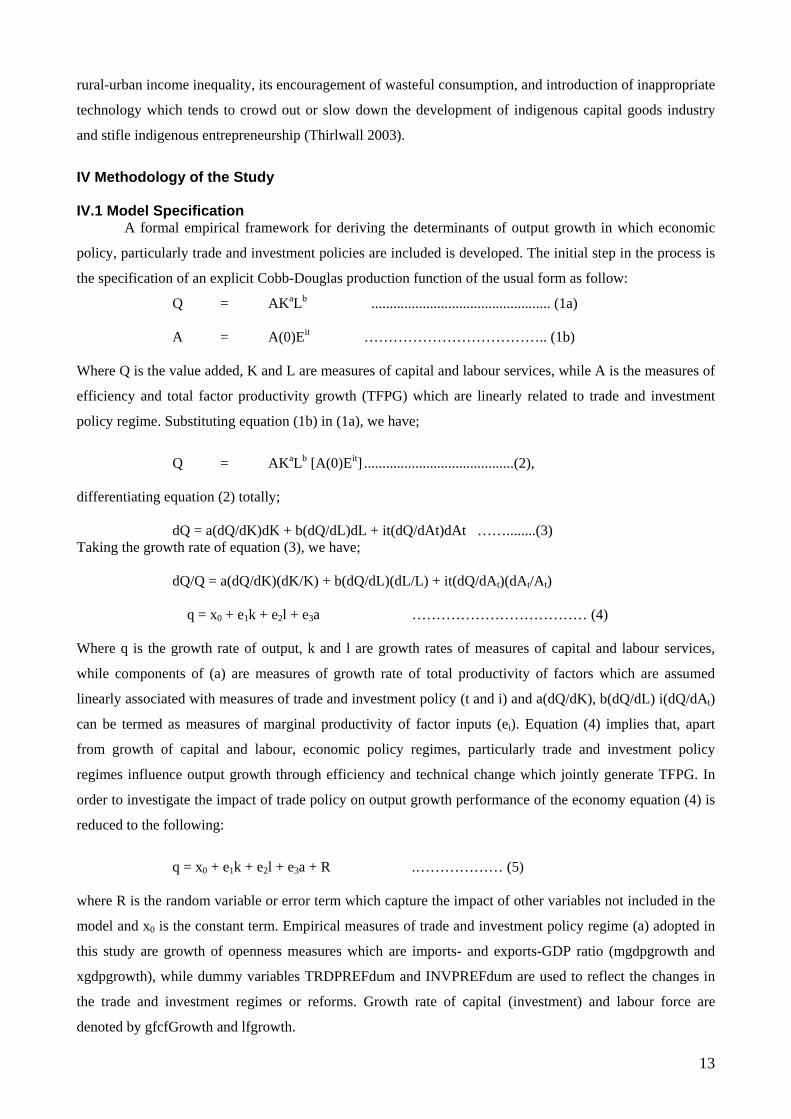
A formal empirical framework for deriving the determinants of output growth in which economic
policy, particularly trade and investment policies are included is developed. The initial step in the process is
the specification of an explicit Cobb-Douglas production function of the usual form as follow:
Q = AKaLb ................................................. (1a) A = A(0)Eit ……………………………….. (1b) Where Q is the value added, K and L are measures of capital and labour services, while A is the measures of
efficiency and total factor productivity growth (TFPG) which are linearly related to trade and investment
policy regime. Substituting equation (1b) in (1a), we have;
Q = AKaLb [A(0)Eit] .........................................(2), differentiating equation (2) totally; dQ = a(dQ/dK)dK + b(dQ/dL)dL + it(dQ/dAt)dAt ……........(3) Taking the growth rate of equation (3), we have; dQ/Q = a(dQ/dK)(dK/K) + b(dQ/dL)(dL/L) + it(dQ/dAt)(dAt/At) q = x0 + e1k + e2l + e3a ……………………………… (4) Where q is the growth rate of output, k and l are growth rates of measures of capital and labour services,
while components of (a) are measures of growth rate of total productivity of factors which are assumed
linearly associated with measures of trade and investment policy (t and i) and a(dQ/dK), b(dQ/dL) i(dQ/dAt)
can be termed as measures of marginal productivity of factor inputs (ei). Equation (4) implies that, apart
from growth of capital and labour, economic policy regimes, particularly trade and investment policy
regimes influence output growth through efficiency and technical change which jointly generate TFPG. In
order to investigate the impact of trade policy on output growth performance of the economy equation (4) is
reduced to the following:
q = x0 + e1k + e2l + e3a + R .……………… (5) where R is the random variable or error term which capture the impact of other variables not included in the
model and x0 is the constant term. Empirical measures of trade and investment policy regime (a) adopted in
this study are growth of openness measures which are imports- and exports-GDP ratio (mgdpgrowth and
xgdpgrowth), while dummy variables TRDPREFdum and INVPREFdum are used to reflect the changes in
the trade and investment regimes or reforms. Growth rate of capital (investment) and labour force are
denoted by gfcfGrowth and lfgrowth.
13
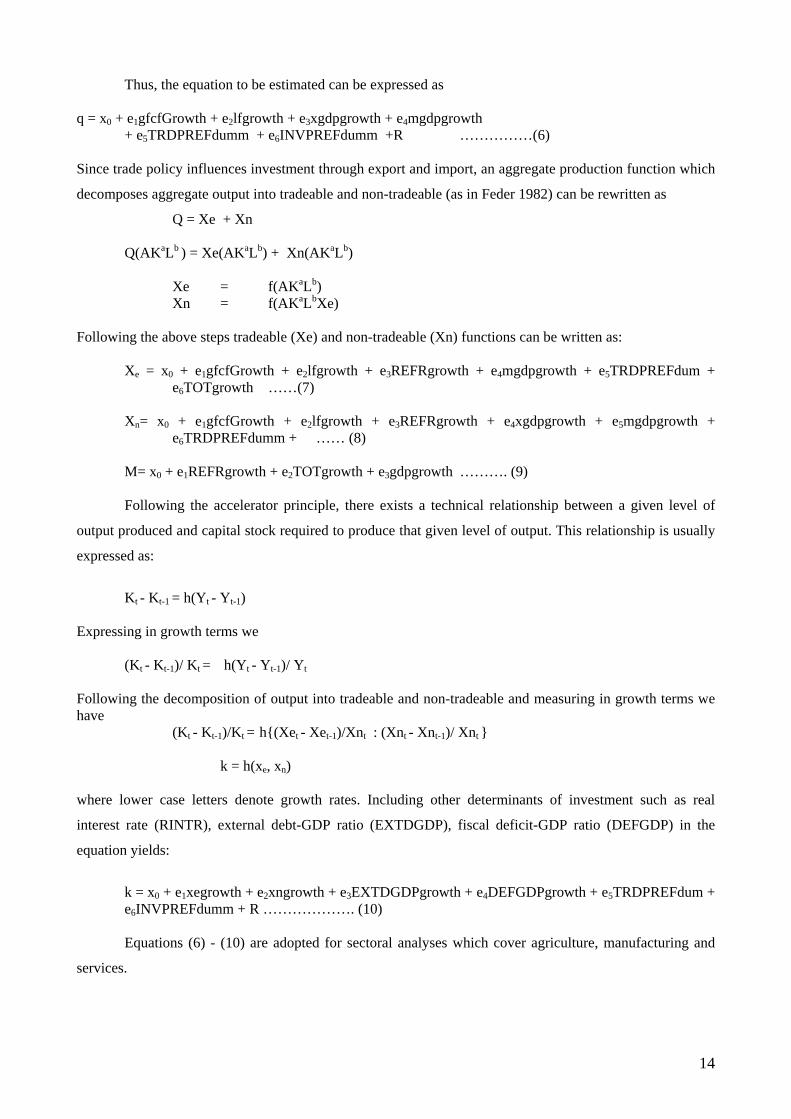
Thus, the equation to be estimated can be expressed as q = x0 + e1gfcfGrowth + e2lfgrowth + e3xgdpgrowth + e4mgdpgrowth
+ e5TRDPREFdumm + e6INVPREFdumm +R ……………(6) Since trade policy influences investment through export and import, an aggregate production function which
decomposes aggregate output into tradeable and non-tradeable (as in Feder 1982) can be rewritten as
Q = Xe + Xn
Q(AKaLb ) = Xe(AKaLb) + Xn(AKaLb) Xe = f(AKaLb)
Xn = f(AKaLbXe) Following the above steps tradeable (Xe) and non-tradeable (Xn) functions can be written as:
Xe = x0 + e1gfcfGrowth + e2lfgrowth + e3REFRgrowth + e4mgdpgrowth + e5TRDPREFdum +
e6TOTgrowth ……(7) Xn= x0 + e1gfcfGrowth + e2lfgrowth + e3REFRgrowth + e4xgdpgrowth + e5mgdpgrowth +
e6TRDPREFdumm + …… (8)
M= x0 + e1REFRgrowth + e2TOTgrowth + e3gdpgrowth ………. (9)
Following the accelerator principle, there exists a technical relationship between a given level of
output produced and capital stock required to produce that given level of output. This relationship is usually
expressed as:
Kt - Kt-1 = h(Yt - Yt-1) Expressing in growth terms we (Kt - Kt-1)/ Kt = h(Yt - Yt-1)/ Yt Following the decomposition of output into tradeable and non-tradeable and measuring in growth terms we have (Kt - Kt-1)/Kt = h{(Xet - Xet-1)/Xnt : (Xnt - Xnt-1)/ Xnt }
k = h(xe, xn)
where lower case letters denote growth rates. Including other determinants of investment such as real
interest rate (RINTR), external debt-GDP ratio (EXTDGDP), fiscal deficit-GDP ratio (DEFGDP) in the
equation yields:
k = x0 + e1xegrowth + e2xngrowth + e3EXTDGDPgrowth + e4DEFGDPgrowth + e5TRDPREFdum +
e6INVPREFdumm + R ………………. (10)
Equations (6) - (10) are adopted for sectoral analyses which cover agriculture, manufacturing and
services.
14
IV.2 Estimation techniques and Data Sources
Apart from generating the magnitude of association between output growth and export and import
growth, either of agriculture, manufacturing and services, dummies capturing trade and investment policy
regimes included in the equations should help disentangle reform effects on economic growth. The
estimation method used is the ordinary least squares (OLS), having been constrained by inadequate data
series to apply the full information maximum likelihood (FIML) estimator which is deemed ideal for the
system of equations specified. Since a recent effort in this direction did not also yield significant differences
between OLS and FIML estimates (Oyejide, Ogunkola and N’juguna, 2002), it is believed that the OLS
estimates in this study can be relied upon.
Data were gathered from the publications of the World Bank. This includes the World Development
Indicators and African Development Indicators. The data used were measured in real terms.
V Empirical Analysis
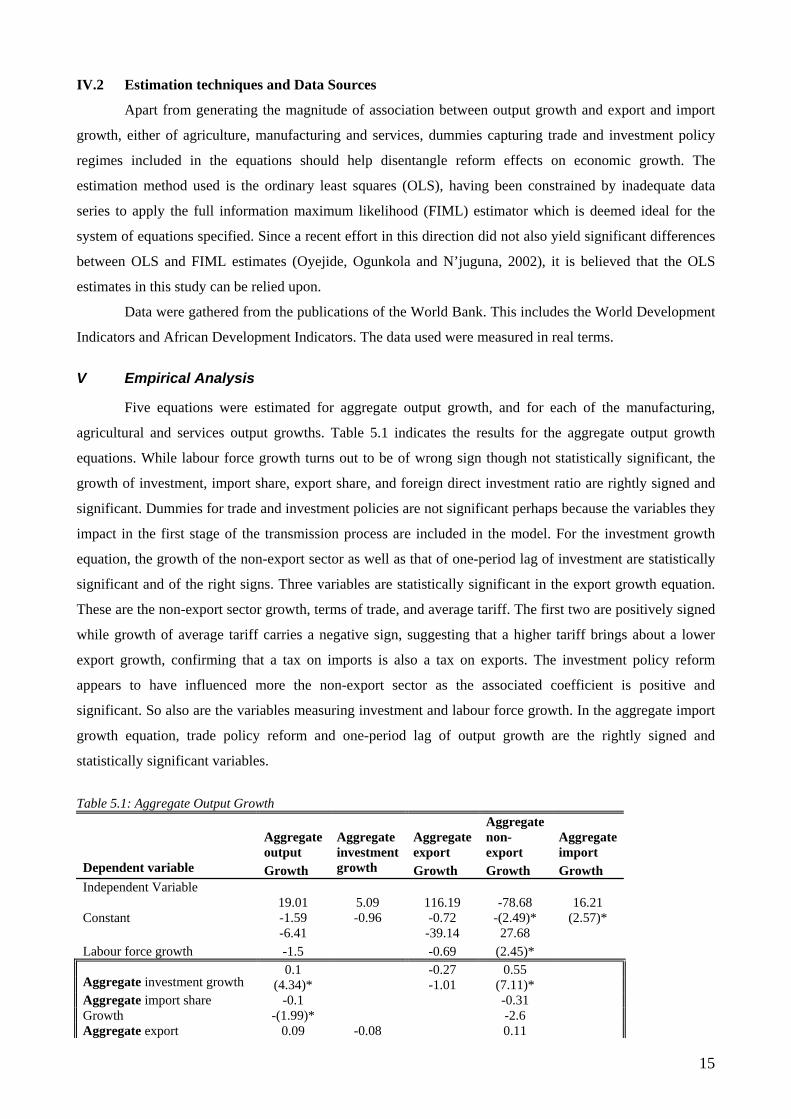
Five equations were estimated for aggregate output growth, and for each of the manufacturing,
agricultural and services output growths. Table 5.1 indicates the results for the aggregate output growth
equations. While labour force growth turns out to be of wrong sign though not statistically significant, the
growth of investment, import share, export share, and foreign direct investment ratio are rightly signed and
significant. Dummies for trade and investment policies are not significant perhaps because the variables they
impact in the first stage of the transmission process are included in the model. For the investment growth
equation, the growth of the non-export sector as well as that of one-period lag of investment are statistically
significant and of the right signs. Three variables are statistically significant in the export growth equation.
These are the non-export sector growth, terms of trade, and average tariff. The first two are positively signed
while growth of average tariff carries a negative sign, suggesting that a higher tariff brings about a lower
export growth, confirming that a tax on imports is also a tax on exports. The investment policy reform
appears to have influenced more the non-export sector as the associated coefficient is positive and
significant. So also are the variables measuring investment and labour force growth. In the aggregate import
growth equation, trade policy reform and one-period lag of output growth are the rightly signed and
statistically significant variables.
Table 5.1: Aggregate Output Growth
Aggregate output
Aggregate export
Aggregate non-export
Aggregate import
Dependent variable Growth
Aggregate investment growth Growth Growth Growth
Independent Variable 19.01 5.09 116.19 -78.68 16.21
Constant -1.59 -0.96 -0.72 -(2.49)* (2.57)* -6.41 -39.14 27.68
Labour force growth -1.5 -0.69 (2.45)* 0.1 -0.27 0.55
Aggregate investment growth (4.34)* -1.01 (7.11)* -0.1 -0.31 Aggregate import share
Growth -(1.99)* -2.6 Aggregate export 0.09 -0.08 0.11
15
Growth (2.32)* -0.8 -2.11 0.02
Foreign Investment ratio (2.00)*
0.59 -3.16 -4.92 19.7
Trade policy reform dummy (0.6)* -0.19 -1.31 (2.32)* -0.87 -6.35 8.89 Investment policy reform
dummy -0.65 (-0.69) (3.15)* 0.15
Inflation Rate -1.7 0
Real interest rate growth -0.68
0.92 0.89
Aggregate non-export growth (4.32)* (2.50)*
0.002
Deficit- gdp ratio growth -0.037
-0.02 External debt – gdp ratio
growth -0.45
1.12 -0.05
Terms of trade growth (6.63)*
-0.28 -0.21
Reer growth (-1) (-1.29)
-0.55 0.57
Average tariff growth -(2.82)*
-0.35 -1.19
Reer growth
-0.74 Aggregate import-gdp growth
2.22 Aggregate gdp growth (-1)
(2.29)*
0.31 Investment growth (-1) (2.21)*
R-squared 0.74 0.55 0.78 0.9 0.56 Adjusted R-squared 0.65 0.42 0.69 0.87 0.42 Prob(F-statistic) 0 0 0 0 0.005 Durbin-Watson stat 1.93 1.87 1.83 1.94 2.03
Note: * significant at 5% confidence level; ** significant at 10% confidence level
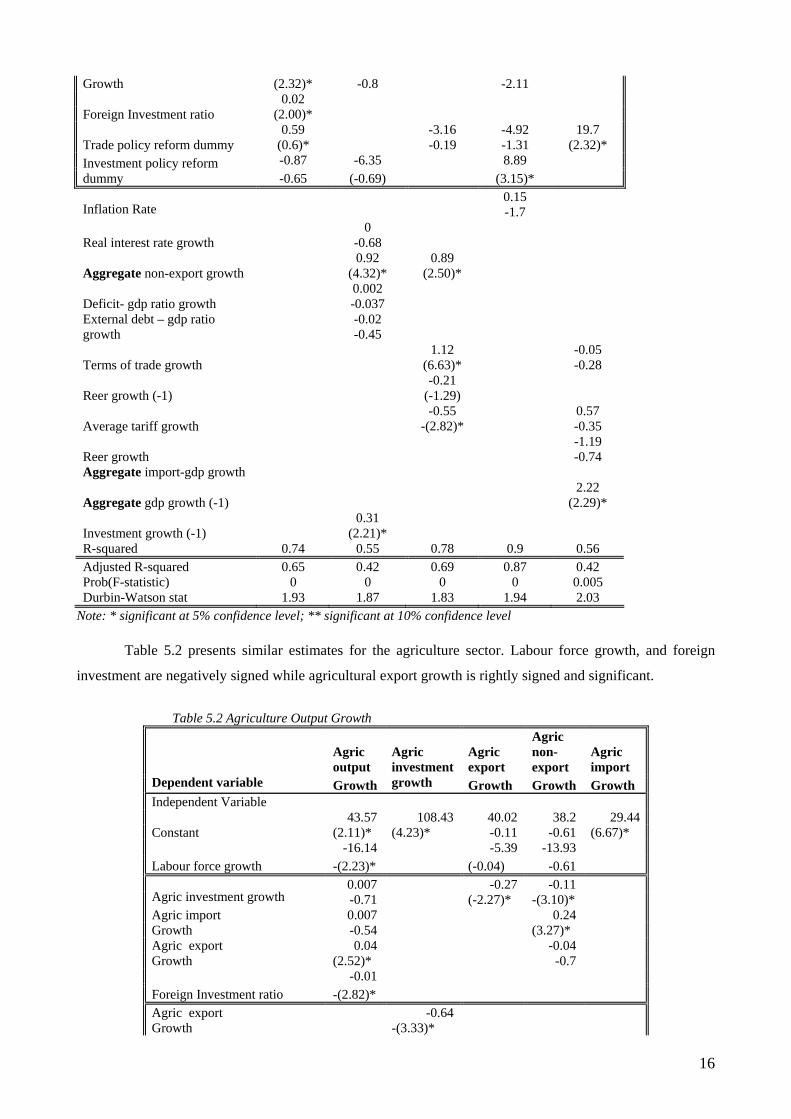
Table 5.2 presents similar estimates for the agriculture sector. Labour force growth, and foreign
investment are negatively signed while agricultural export growth is rightly signed and significant.
Table 5.2 Agriculture Output Growth
Agric output
Agric export
Agric non-export
Agric import
Dependent variable Growth
Agric investment growth Growth Growth Growth
Independent Variable 43.57 108.43 40.02 38.2 29.44
Constant (2.11)* (4.23)* -0.11 -0.61 (6.67)* -16.14 -5.39 -13.93
Labour force growth -(2.23)* (-0.04) -0.61 0.007 -0.27 -0.11
Agric investment growth -0.71 (-2.27)* -(3.10)* Agric import 0.007 0.24 Growth -0.54 (3.27)* Agric export 0.04 -0.04 Growth (2.52)* -0.7
-0.01 Foreign Investment ratio -(2.82)*
Agric export -0.64 Growth -(3.33)*
16
0.52 Inflation Rate (2.54)*
0.001 Real interest rate growth -0.49
0.043 -0.01 Agric non-export growth -0.05 -0.01
0.015 Deficit- gdp ratio growth -0.85
-0.17 External debt – gdp ratio growth -0.84
0.63 1.35 Terms of trade growth -1.27
(4.58)*
-0.43 Reergrowth (-1) -0.85
0.39 6.02 Average tariff growth -0.76
-0.82
1.25 18.28 -17.64 -27.34 Trade policy reform dummy -0.75 -0.54 -(2.17)* -(1.96)*
1.96 -6.8 Reergrowth -1.26
-0.94 3.48
Agric gdpg rowth(-1)
-1.4 -92.6 18.27 Investment policy reform
dummy -(1.95)* (3.49)* -0.59
Investment growth (-1) -(4.02)*
R-squared 0.68 0.51 0.59 0.41 0.69 Adjusted R-squared 0.59 0.28 0.49 0.21 0.59 Prob(F-statistic) 0 0.059 0.0005 0.07 0.0001 Durbin-Watson stat 2.04 1.9 1.8 1.85 2.04
Note: * significant at 5% confidence level; ** significant at 10% confidence level; t-statistics are in parenthesis
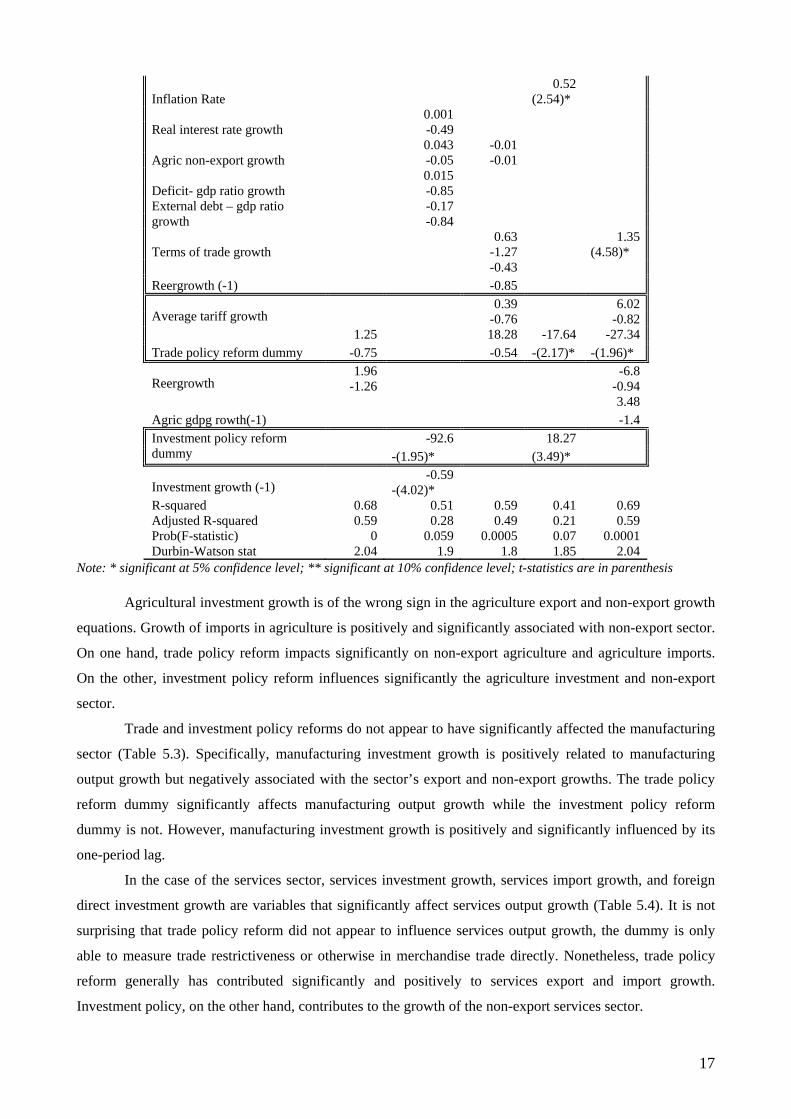
Agricultural investment growth is of the wrong sign in the agriculture export and non-export growth
equations. Growth of imports in agriculture is positively and significantly associated with non-export sector.
On one hand, trade policy reform impacts significantly on non-export agriculture and agriculture imports.
On the other, investment policy reform influences significantly the agriculture investment and non-export
sector.
Trade and investment policy reforms do not appear to have significantly affected the manufacturing
sector (Table 5.3). Specifically, manufacturing investment growth is positively related to manufacturing
output growth but negatively associated with the sector’s export and non-export growths. The trade policy
reform dummy significantly affects manufacturing output growth while the investment policy reform
dummy is not. However, manufacturing investment growth is positively and significantly influenced by its
one-period lag.
In the case of the services sector, services investment growth, services import growth, and foreign
direct investment growth are variables that significantly affect services output growth (Table 5.4). It is not
surprising that trade policy reform did not appear to influence services output growth, the dummy is only
able to measure trade restrictiveness or otherwise in merchandise trade directly. Nonetheless, trade policy
reform generally has contributed significantly and positively to services export and import growth.
Investment policy, on the other hand, contributes to the growth of the non-export services sector.
17
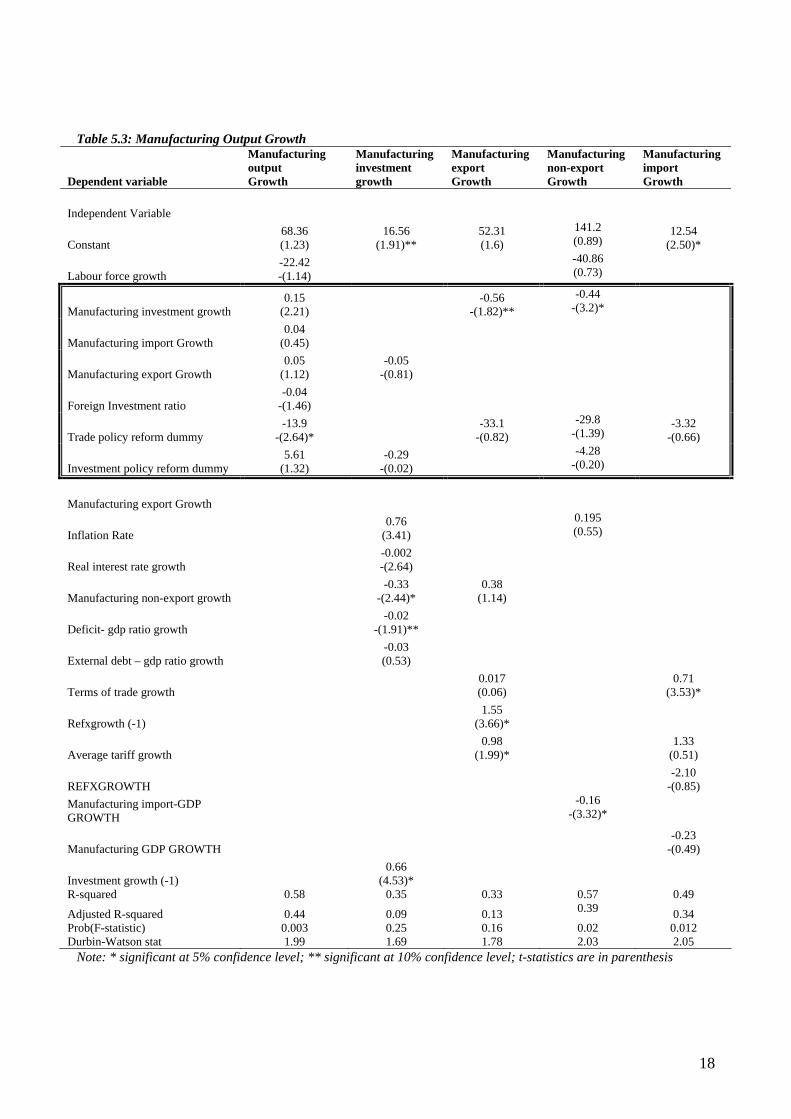
Table 5.3: Manufacturing Output Growth
Dependent variable
Manufacturing output Growth
Manufacturing investment growth
Manufacturing export Growth
Manufacturing non-export Growth
Manufacturing import Growth
Independent Variable
Constant 68.36 (1.23)
16.56 (1.91)**
52.31 (1.6)
141.2 (0.89)
12.54 (2.50)*
Labour force growth -22.42 -(1.14)
-40.86 (0.73)
Manufacturing investment growth 0.15
(2.21) -0.56
-(1.82)** -0.44
-(3.2)*
Manufacturing import Growth 0.04
(0.45)
Manufacturing export Growth 0.05
(1.12) -0.05
-(0.81)
Foreign Investment ratio -0.04
-(1.46)
Trade policy reform dummy -13.9
-(2.64)* -33.1
-(0.82) -29.8
-(1.39) -3.32
-(0.66)
Investment policy reform dummy 5.61
(1.32) -0.29
-(0.02) -4.28
-(0.20)
Manufacturing export Growth
Inflation Rate 0.76
(3.41) 0.195 (0.55)
Real interest rate growth -0.002 -(2.64)
Manufacturing non-export growth -0.33
-(2.44)* 0.38
(1.14)
Deficit- gdp ratio growth -0.02
-(1.91)**
External debt – gdp ratio growth -0.03 (0.53)
Terms of trade growth 0.017 (0.06)
0.71 (3.53)*
Refxgrowth (-1) 1.55
(3.66)*
Average tariff growth 0.98
(1.99)* 1.33
(0.51)
REFXGROWTH -2.10
-(0.85) Manufacturing import-GDP GROWTH
-0.16 -(3.32)*
Manufacturing GDP GROWTH -0.23
-(0.49)
Investment growth (-1) 0.66
(4.53)*
R-squared 0.58 0.35 0.33 0.57 0.49
Adjusted R-squared 0.44 0.09 0.13 0.39 0.34 Prob(F-statistic) 0.003 0.25 0.16 0.02 0.012 Durbin-Watson stat 1.99 1.69 1.78 2.03 2.05
Note: * significant at 5% confidence level; ** significant at 10% confidence level; t-statistics are in parenthesis
18
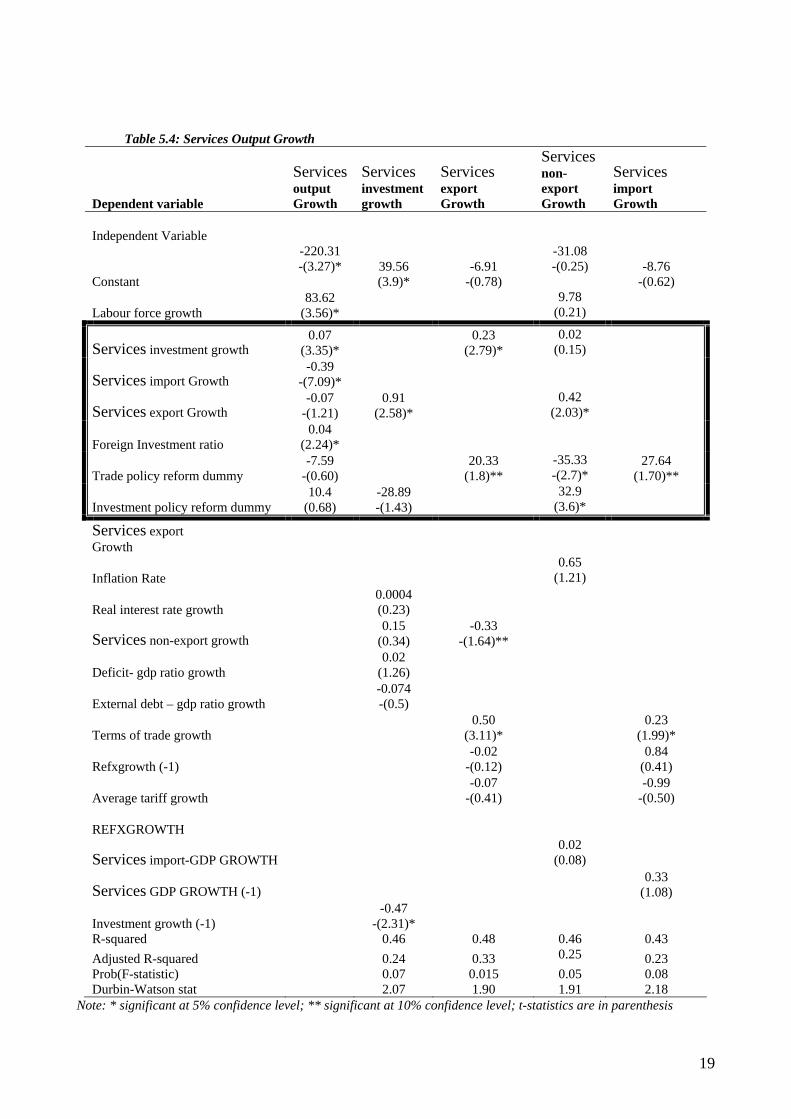
Table 5.4: Services Output Growth
Dependent variable
Services output Growth
Services investment growth
Services export Growth
Services non-export Growth
Services import Growth
Independent Variable
Constant
-220.31 -(3.27)*
39.56 (3.9)*
-6.91 -(0.78)
-31.08 -(0.25) -8.76
-(0.62)
Labour force growth 83.62
(3.56)* 9.78
(0.21)
Services investment growth 0.07
(3.35)* 0.23
(2.79)* 0.02
(0.15)
Services import Growth -0.39
-(7.09)*
Services export Growth -0.07
-(1.21) 0.91
(2.58)* 0.42
(2.03)*
Foreign Investment ratio 0.04
(2.24)*
Trade policy reform dummy -7.59
-(0.60) 20.33
(1.8)** -35.33 -(2.7)*
27.64 (1.70)**
Investment policy reform dummy 10.4
(0.68) -28.89 -(1.43)
32.9 (3.6)*
Services export Growth
Inflation Rate 0.65
(1.21)
Real interest rate growth 0.0004 (0.23)
Services non-export growth 0.15
(0.34) -0.33
-(1.64)**
Deficit- gdp ratio growth 0.02
(1.26)
External debt – gdp ratio growth -0.074 -(0.5)
Terms of trade growth 0.50
(3.11)* 0.23
(1.99)*
Refxgrowth (-1) -0.02
-(0.12) 0.84
(0.41)
Average tariff growth -0.07
-(0.41) -0.99
-(0.50)
REFXGROWTH
Services import-GDP GROWTH 0.02
(0.08)
Services GDP GROWTH (-1) 0.33
(1.08)
Investment growth (-1) -0.47
-(2.31)*
R-squared 0.46 0.48 0.46 0.43 Adjusted R-squared 0.24 0.33 0.25 0.23 Prob(F-statistic) 0.07 0.015 0.05 0.08 Durbin-Watson stat 2.07 1.90 1.91 2.18
Note: * significant at 5% confidence level; ** significant at 10% confidence level; t-statistics are in parenthesis
19
The totality of sectoral activities determines the level of aggregate activities. Based on this, the
impact of trade and investment policy reforms on sectoral growth performance would eventually show up in
the aggregate growth performance. While different sectors may respond to trade and investment policy
reforms differently, trade and investment policy reform measures implemented in each sector is likely to be
different. It is therefore considered necessary to examine the impact of trade and investment policy reform
measures undertaken in each sector on aggregate growth performance. This will enable us to see how
different sectoral policy reforms impact on the performance of the entire economy. Thus, it is possible to
discern which sectoral policy reform measures have the greatest or least potential to generate positive impact
on aggregate growth. The result of this kind of exercise can inform policy decisions on resource allocation
for growth of the economy. This implies that, the sector(s) that has (or have) higher potential to generate
more positive impact on aggregate growth may be accorded more priority in the allocation of resources.
Sectoral analysis is attempted by incorporating sectoral policy reform variables into the aggregate
growth model (Aq) as follows;
Aq = f (Mgrowth, Agrowth, Sgrowth)
Where, Mgrowth, Agrowth and Sgrowth denote sectoral growth performance in the Manufacturing,
Agricultural and Services services, each of which has been earlier said to be influenced by factors such as
sectoral inputs growth and trade and investment policy variables at sectoral level. Thus, instead of using the
aggregate policy variables in the aggregate growth model, sectoral variables are substituted. This additional
model was estimated for each sector.
In order to assess the possible impact of trade and investment policy reforms on the economy,
additional equations which were subsequently used for forecasting and simulations were estimated. Table
5.5 shows the results of these estimations for agriculture, manufacturing and services sectors. Agricultural
investment growth affects the economy positively though not statistically significantly, unlike services
investment growth whose contribution to the economy is significant and positive.
The growth of manufacturing investment appears to impact negatively on economy. While services
import growth affects the economy positively and in a significant way, agricultural and manufacturing
import growths affect it in the opposite direction. Before analysing the future impacts of trade and
investment policy reforms on output, presented on Table 5.7, Table 5.6 provides the Theil Inequality index
for the equations used for simulations. The underlying assumption is that these reforms will generate growth
in import and export of agriculture, manufactures and services between 2005 and 2008 by between 10%-
50%. The forecast statistics in Table 5.6 appear acceptable. In particular, the bias proportions are very small.
Following increase in export shares and import shares as a result of trade and investment policy
reforms, the GDP is expected to grow on the average by 4.8% in 2005, and by about 5% in 2006 and 2007
and 5.4% in 2008. These growth rates result from the average of the sectoral stimuli on growth. In particular,
the effect of investment and trade policy reforms on the manufacturing sector provides the largest stimulus
for economic growth while that of the agricultural sector dampens the economy’s growth potentials. For the
20
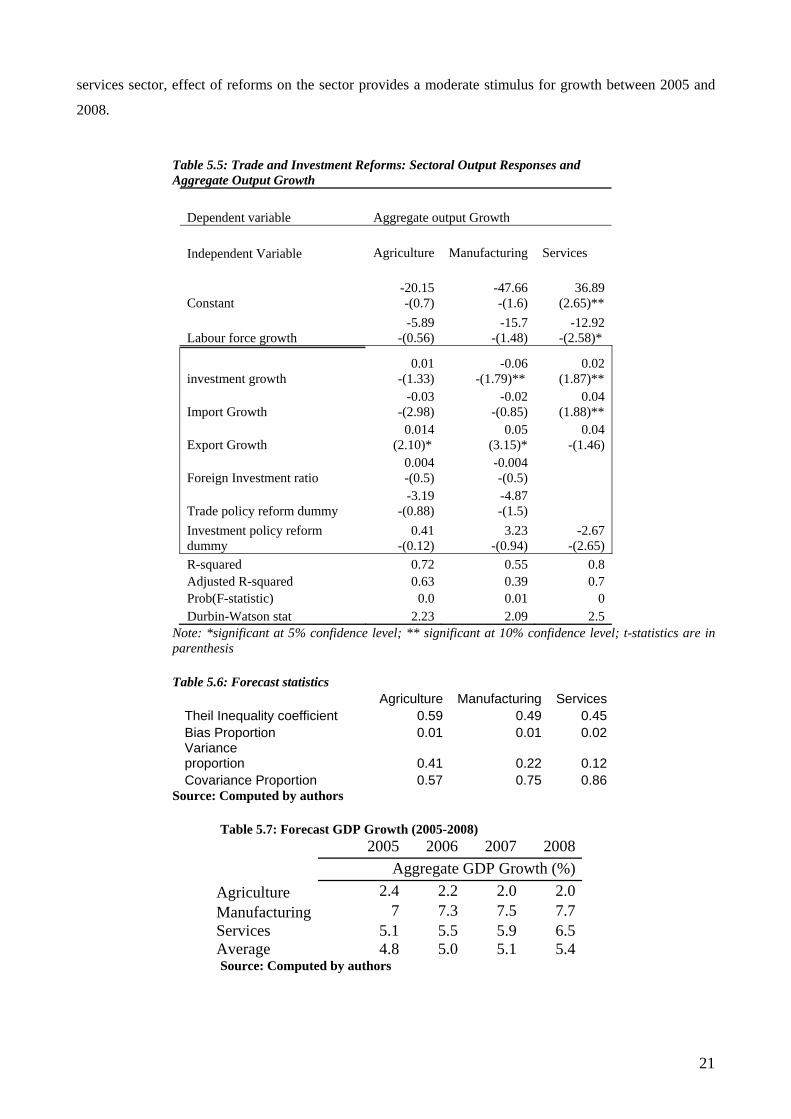
services sector, effect of reforms on the sector provides a moderate stimulus for growth between 2005 and
2008.
Table 5.5: Trade and Investment Reforms: Sectoral Output Responses and Aggregate Output Growth
Dependent variable Aggregate output Growth Independent Variable Agriculture Manufacturing Services
Constant -20.15 -(0.7)
-47.66 -(1.6)
36.89 (2.65)**
Labour force growth -5.89
-(0.56) -15.7
-(1.48) -12.92
-(2.58)*
investment growth 0.01
-(1.33) -0.06
-(1.79)** 0.02
(1.87)**
Import Growth -0.03
-(2.98) -0.02
-(0.85) 0.04
(1.88)**
Export Growth 0.014
(2.10)* 0.05
(3.15)* 0.04
-(1.46)
Foreign Investment ratio 0.004 -(0.5)
-0.004 -(0.5)
Trade policy reform dummy -3.19
-(0.88) -4.87 -(1.5)
Investment policy reform dummy
0.41 -(0.12)
3.23 -(0.94)
-2.67 -(2.65)
R-squared 0.72 0.55 0.8 Adjusted R-squared 0.63 0.39 0.7 Prob(F-statistic) 0.0 0.01 0 Durbin-Watson stat 2.23 2.09 2.5
Note: *significant at 5% confidence level; ** significant at 10% confidence level; t-statistics are in parenthesis
Table 5.6: Forecast statistics
Agriculture Manufacturing Services Theil Inequality coefficient 0.59 0.49 0.45 Bias Proportion 0.01 0.01 0.02 Variance proportion 0.41 0.22 0.12 Covariance Proportion 0.57 0.75 0.86
Source: Computed by authors
Table 5.7: Forecast GDP Growth (2005-2008) 2005 2006 2007 2008 Aggregate GDP Growth (%) Agriculture 2.4 2.2 2.0 2.0 Manufacturing 7 7.3 7.5 7.7 Services 5.1 5.5 5.9 6.5 Average 4.8 5.0 5.1 5.4 Source: Computed by authors
21
VI Summary of findings, Policy implications and Conclusion
The results show that labour force growth is not a significant determinant of aggregate output
growth, while the growth of investment, import share, export share, and foreign direct investment ratio are
major factors influencing aggregate output growth. It was shown that trade and investment policy reforms do
not have significant impact on aggregate output growth. Result further reveals that growth of non-export as
well as previous level of investment is significant determinants of aggregate investment in Nigeria.
Moreover, among the significant determinants of export growth are non-export growth, terms of trade, and
average tariff. The growth of average tariff carries a negative sign, suggesting that a higher tariff brings
about a lower export growth, confirming that a tax on imports is also a tax on exports.
Empirical result shows that investment policy reform appears to have influenced the non-export
growth. So also are the variables measuring investment and labour force growth. It was seen that, trade
policy reform and one-period lag of output growth produced positive impact on aggregate import growth.
Sectoral results reveal that, in the case of agriculture sector, labour force growth, and foreign
investment have negative impact on agricultural output growth while agricultural export growth has positive
impact on same. Further, agricultural investment growth hindered export and non-export growth in the
sector. Growth of imports has positive and significant impact on non-export growth. On one hand, trade
policy reform impacts significantly on non-export and imports in the sector. On the other, investment policy
reform influences significantly the agriculture investment and non-export sector.
Manufacturing investment growth is positively related to manufacturing output growth but
negatively associated with the sector’s export and non-export growths. Trade policy reform significantly
affects manufacturing output growth while the investment policy reform is not. However, manufacturing
investment growth is positively and significantly influenced by its previous level.
In the case of the services sector, investment growth, import growth, and foreign direct investment
growth in the sector significantly affect services output growth. It is not surprising that trade policy reform
did not appear to influence services output growth because it is not directed at the sector. Nonetheless, trade
policy reform generally has contributed significantly and positively to services export and import growth.
Investment policy, on the other hand, contributes to the growth of the non-export services sector.
The impact of trade and investment policy reforms on sectoral growth performance would
eventually show up in the aggregate growth performance. It should be noted that different sectors may
respond to trade and investment policy reforms differently. It should also be noted that trade and investment
policy reform measures implemented in each sector is likely to be different. It is therefore considered
necessary to examine the impact of trade and investment policy reform measures undertaken in each sector
on aggregate growth performance. This will enable us to see how different sectoral policy reforms impact on
the performance of the entire economy. Thus, we would be able to see which sectoral policy reform
measures have the greatest or least potential to generate positive impact on aggregate growth. The result of
this kind of exercise can inform policy decisions on resource allocation for growth of the economy. This
implies that, the sector(s) that has (or have) higher potential to generate more positive impact on aggregate
growth may be accorded more priority in the allocation of resources.
22
Results reveal that agricultural investment growth affects the economy positively but insignificantly,
while services investment growth contributes positively and significantly to the economy. The growth of
manufacturing investment appears to impact negatively on economy. While services import growth affects
the economy positively and significantly, agricultural and manufacturing import growths affect it in the
opposite direction.
The simulation experiments show that, following increase in export shares and import shares as a
result of trade and investment policy reforms, the GDP is expected to grow on the average by 4.8% in 2005,
and by about 5% in 2006 and 2007 and 5.4% in 2008. These growth rates result from the average of the
sectoral stimuli on growth. In particular, the effect of investment and trade policy reforms on the
manufacturing sector provides the largest stimulus for economic growth while that of the agricultural sector
dampens the economy’s growth potentials. For the services sector, effect of reforms on the sector provides a
moderate stimulus for growth between 2005 and 2008.
23
Bibliography Adenikinju A., (2005), ‘African Imperatives in the New World Trade Order: The Case of Manufacturing’ In E.O
Ogunkola and A. S. Bankole (eds.), Nigeria’s Imperatives in a New World Trade Order, Trade Policy Research and Training Programme Department of Economics, University of Ibadan and AERC, Nairobi.
Adewuyi, A.O. (2001), "The Implications of Crude Oil Exploitation and Export on the Environment and Level of Economic Growth and Development in Nigeria”. Proceedings of the annual Conference of the Nigerian Economic Society.
Agbaje A. and A. Jerome (2005). ‘Institutional Framework for Trade Policy in Nigeria’ In E.O Ogunkola and A. S. Bankole (eds.), Nigeria’s Imperatives in a New World Trade Order, Trade Policy Research and Training Programme Department of Economics, University of Ibadan and AERC, Nairobi.
Akinlo, A 2004. “Foreign direct investment and growth in Nigeria An empirical investigation” Journal of Policy Modeling 26: 627-39
Amjadi, A., U. Reinke and A. Yeast (1996), Did External Barriers Cause the Marginalisation of Sub-Saharan African in World Trade? World Bank, Washington, DC.
Baldwin, R. E. (2003), “Openness and Growth: What’s the Empirical Relationship?” NBER Working Paper Number 9576. National Bureau of Economic Research, Cambridge, Massachusetts. March. http://www.nber.org/papers/w9578
Baldwin, R. E. and E. Seghezza (1996), "Trade-Induced Investment-Led Growth", CEPR Discussion Paper Series, No 1430, June, CEPR, London.
Bankole, A. S (2004b), “An Econometric Analysis of Firms Compliance Costs of Sanitary and PhytoSanitary Standards (SPS) in Nigeria’s Export Markets: The case of Processed Agricultural and Food Products”. African Journal of Economic Policy, 10 (2), December, pp. 103-136.
Bankole, A.S (2004a), “Sanitary and PhytoSanitary Standards and Processed Agricultural and Food Products Exports. Evidence from Nigerian Firms”. African Journal of Economic Policy, 10 (1), June, pp.33-54.
Bankole, A.S and K. Olayiwola (2001), Policy and Institutional Arrangements for Promoting Industrial Development, DPC Research Report No 31, Ibadan, Development Policy Centre.
Boeninger, E. (1991), “Governance and Development: Issues and Constraints. Proceedings of the World Bank Annual Conference on Development Economics, World Bank, Washington, DC.
Borensztein, E., J. De Gregorio and J.-W. Lee (1995) ‘How Does Foreign Investment Affect Growth?’, NBER Working Paper, 5057 (Cambridge: mass: NBER).
Busse, M., A. Borrmann, and H. Grobmann (2004), “The Impact of ACP-EU Economic Partnership Agreements on ECOWAS Countries: An Empirical Analysis of the Trade and Budget Effects”, mimeo, Hamburg Institute of International Economics.
Coe, D.E., E. Helpman and A. Hoffmaister (1997) ‘North-South R&D Spillovers’, Economic Journal, January. Collier, P., Greenaway, D., and Gunning J. W. (1997), ‘Evaluating Trade Liberalization: A Methodological
Framework’. In Oyejide, A., Elbadawi, I., and Collier, P. (eds.), Regional Integration and Trade Liberalization in Sub-Saharan Africa. Volume 1: Framework, Issues and Methodological Perspectives. London: Macmillan Press Ltd, pp. 306-52.
de Mello, L. (1997), ‘Foreign Investment in Developing Countries and Growth: A Selective Survey’, Journal of Development Studies, October.
Devarajan, S., W. Easterly and H. Pack (2001), ‘Is Investment in Africa Too High or Too Low? Macro- and Micro Evidence’, Journal of African Economies, Volume 10, AERC Supplement 2, pp. 81-108.
Easterly, W. (1989). “Policy Distortions, Size of Government, and Growth,” NBER Working Paper 3214. National Bureau of Economic Research, Cambridge, Massachusetts
Easterly, W. (1993) “How Much Do Distortions Affect Growth?” Journal of Monetary Economics. 32(3). Pages 187-212.
Feder, G. (1982), “On Exports and Economic Growth”. Journal of Development Economics, 12. ILO (2000), “Supply Side Constraints that Hamper African Enterprises from Taking Advantages of Emerging Export
Market Opportunities. Working Paper PMD, 5. Iwayemi, A., A. Aminu, and A. Adenikinju (2005), Economic Impact on Nigeria of the Proposed Economic
Partnership Agreement with the European: A General Equilibrium Evaluation. A paper presented at the Departmental Seminar, Department of Economics, University of Ibadan, Ibadan.
Karingi, S. R. Lamg, N Oulmane, R. Perez, M. Sadni and H . B. Hammouda (2005), Economic and Welfare Impacts of the EU-Africa Economic Partnership Agreement, United Nations Economic Commission for Africa, Addis Ababa
Levine, R. and D. Renelt (1992), "A Sensitivity Analysis of Cross-Country Growth Regressions", American Economic Review, 82(4), pp. 942-963.
NISER (2003 & 2004), NISER Survey of Business Conditions, Experience and Expectations in the Manufacturing Sector. NISER Annual Monitoring Research Programme (NARMP), Ibadan: Nigerian Institute of social and Economic Research.
Ogunkola E.O. and A. S. Bankole, 2005. ‘Effective Integration of Nigeria in the Multilateral Trading System through Export Promotion’ In E.O Ogunkola and A. S. Bankole (eds.), Nigeria’s Imperatives in a New World Trade
24
Order, Trade Policy Research and Training Programme Department of Economics, University of Ibadan and AERC, Nairobi.
Ogunkola E.O., 2005. ‘Agriculture in the Doha Development Round’ In E.O Ogunkola and A. S. Bankole (eds.), Nigeria’s Imperatives in a New World Trade Order, Trade Policy Research and Training Programme Department of Economics, University of Ibadan and AERC, Nairobi.
Ogunkola, E. O. (2002), “Training, Technology and Productivity of Nigerian Manufacturing Firms”, AERC Special Paper 32, African Economic Research Consortium, Nairobi.
Ogunkola, E. O. (2005), “Integrating West African Agriculture into the Global Trading System: Issues in Regional and Multilateral Trade Negotiations”, Paper Presented at the Workshop on “The Trade Negotiations and Development for West Africa: EPA and the WTO” Organised the Economic Community of West African States ECOWAS) and the International Lawyers and Economists Against Poverty (ILEAP). 17-18 October. Cotonou, Benin.
Ogunkola, E. O. and T. A. Jerome (2005) “Foreign Direct Investment in Nigeria: Magnitude, Direction and Prospects”. Final Report Submitted to the African Research Economic Research Consortium, Nairobi, Kenya. March 2005.
Ogunkola, E. O. and T.A Oyejide (2001), “Market Access For Nigeria’s Exports in the European Union: An Assessment of the Impact of the Lome Convention and the Uruguay Round. Nigerian Journal of Economic and Social Studies, 43 (1).
Ogunkola, E.O (2003), Agriculture and the WTO: Economic Interests and Options for Nigeria, in Merlinda, D.I., J. Nash and D. Njinkeu (ed.), Liberalising Agricultural Trade: Issues and Options for Sub-Saharan Africa in the WTO, Published for The World Bank, Macmillan Nigeria Ltd.
Ogunkola, E.O, and A.S. Bankole (2005), “Effective Integration of Nigeria into Multilateral Trading System through Export Promotion “, in Ogunkola, E.O and A.S. Bankole (ed.), Nigeria’s Imperative in the New World Trade Order, Trade Policy Research and Training Programme Department of Economics, University of Ibadan and AERC, Nairobi.
Oyejide, T. A. and E. O. Ogunkola (forthcoming) Trade, Investment and Growth in Africa: Patterns, Trends and Puzzles, The Nigerian Journal of Economics and Social Studies
Oyejide, T. A., E. O. Ogunkola and A.S. Bankole (2004), Building Coherence of Objectives, Strategies and. Modalities in the Negotiation of Bilateral, Regional and Multilateral Trade Agreements Involving Sub-Saharan Africa. A Draft Report Submitted to the United Nations Development Programmes (UNDP),.
Oyejide, T.A (2003). Trade Reform for Economic Growth and Poverty Reduction”, Development Outreach, 5(2), July. Rodriguez, F., and Rodrik, D. (1999), “Trade Policy and Economic Growth: A Skeptic’s Guide to the Cross-National
Evidence”. NBER Working Paper No. 7081. Soludo, C. C., O.G. Oji and C. Agu (2003), Potential Impacts of Extension of UEMOA Tariffs to all ECOWAS-
Member States: A Case Study of Impacts of Revenue and Trade balance in Nigeria, Africa Institute of Applied Economics, Enugu, Nigeria.
Srinivasan, T.N., and Bhagwati, J. N. (1999), “Outward-Orientation and Development: Are Revisionists Right?” Mimeo, Yale University.
Thirlwall, A.P. (2003), Growth and Development with Special Reference to Developing Economies, Palgrave Macmillan,Seventh Edition.
Wacziarg, R., 2001, “Measuring the Dynamic Gains from Trade”, The World Bank Economic Review v15, n3, pp. 393-429.
WTO (2005), Trade Policy Review, Nigeria, Geneva
25


