Embed Size (px)
Citation preview

1
Psychology and Human Development
Institute of Education,
University of London
An Examination of Writing Assessments in 9-11 year olds
Kirsty Walter1, Julie Dockrell1, Vince Connelly2,
1Institute of Education University of London, UK
2Oxford Brookes University, UK
Research Funded by ESRC as part of my PhD Thesis
Plan of Presentation
1. Writing Theory Background
2. Discussion of the different writing measures
a) Standardised Measures
b) Curriculum-Based Measures in Writing
3. Examine the relationship between the writing measures
4. Discuss relevance to the school classroom
5. Summary & Conclusions

2
Writing Background Acquiring competency in writing is crucial if children are to access the school
curriculum.
UK: 19% children aged 9-11 years are struggling to achieve this (DfE, 2012).
Writing is a complex, and demanding, task.
It requires the author to simultaneously manage multiple processes.
Simple View of Writing

3
Writing Assessments Regular monitoring aids children’s writing development (Fuchs et al, 1993)
Subjectivity in marking writing.
- Opinion
- Scoring rubrics or criteria
Teacher views
- In a series of interviews with UK teachers many referred to using scoring rubrics to aid them in the assessment of writing
- Writing is also assessed on whether it fulfilled the brief/learning objective
However, research has found the quality of teacher assessment to be questionable as they do not consider the many factors that influence their marking.
WIAT-II UK
•Choice of scoring criteria: Holistic or Mechanic
•10 minute task
•1-2-1 administration
•Holistic: Subjective
CBM
•Choice of scoring criteria in two groups: fluency & accuracy
•5 minute task
•Whole class administration
•Objective
Standardised vs Curriculum Based Measures

4
Current Study
Research Questions
1. Compare & contrast children’s essays: 1) Standardised Writing Task & 2) CBM-W (Narrative)
2. Examine children’s writing in different contexts in response to the standardised writing task.
METHOD

5
Participants 2 classes from one UK primary school.
58 children, aged 9-10 years old (Mean=122 months, SD=3.2 months). Even gender split (29M:29F)
2 children identified with Statements relating to writing.
Measures Standardised Writing Task – WIAT-II UK Written Expression Subtest
10 minute writing task asking the children to write in response to a sentence starter prompt – “My favourite game is…” or “On a rainy day I like”
Assessed for: Text Quality – holistic score ranging from 0-6, adapted from WIAT II UK
Writing Task – Curriculum-Based Measure
5 minute narrative writing task in response to a sentence starter prompt - “One time I had the best/worst weekend ever”
Assessed for: Fluency & Accuracy Measures including spelling, sentences and correct word sequences.
6
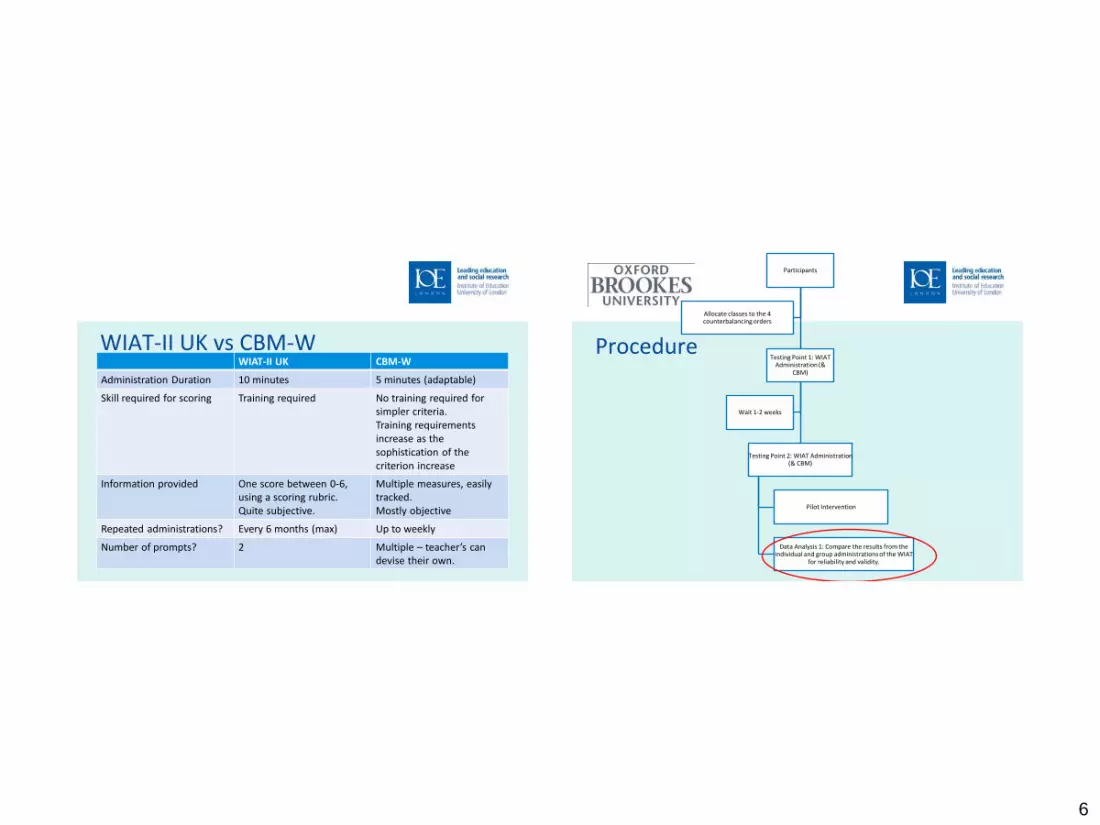
WIAT-II UK vs CBM-W WIAT-II UK CBM-W
Administration Duration 10 minutes 5 minutes (adaptable)
Skill required for scoring Training required No training required for simpler criteria. Training requirements increase as the sophistication of the criterion increase
Information provided One score between 0-6, using a scoring rubric. Quite subjective.
Multiple measures, easily tracked. Mostly objective
Repeated administrations? Every 6 months (max) Up to weekly
Number of prompts? 2 Multiple – teacher’s can devise their own.
Procedure
Participants
Testing Point 1: WIAT Administration (&
CBM)
Testing Point 2: WIAT Administration (& CBM)
Pilot Intervention
Data Analysis 1: Compare the results from the individual and group administrations of the WIAT
for reliability and validity.
Wait 1-2 weeks
Allocate classes to the 4 counterbalancing orders

7
Procedure
1 2 3 4
Task
Ord
er
Group – Form A Individual – Form B Group – Form B Individual – Form A
1-2 week break
Individual – Form
B Group – Form A
Individual – Form
A Group – Form B
RESULTS

8
Descriptives WIAT Holistic Score N Mean SD
Time 1 57 3.14 1.10
Time 2 44 2.93 0.91
CBM – Narrative: Fluency N Mean SD Total Words Written 48 65.42 20.9 Words Spelled Correctly 48 60.65 20.43 Correct Word Sequences 48 63.44 20.68 Total Sentences 48 3.77 2.35 Complete Sentences 48 3.4 2.43
Quality Scoring (using WIAT Holistic) 48 2.92 1.09
CBM – Narrative: Accuracy N Mean SD
Percentage Words Spelled Correctly 48 92.34 7.13
Percentage Correct Word Sequences 48 94.42 5.90
Correlations – WIAT & CBM Correlations - WIAT T1 with Narrative CBM
WIAT T1
CBM
Quality
CBM -
TW
CBM –
WSC
CBM –
CWS CBM TS
CBM –
CS
CBM -
Percentage
WSC
CBM -
Percentage
CWS WIAT T1 Pearson
Correlation 1 .476** .423** .419** .509** .426** .390** .141 .419**
Sig. (2-
tailed) .001 .003 .003 .000 .003 .006 .340 .003
N 57 48 48 48 48 48 48 48 48
CBM
Quality
Pearson
Correlation 1 .549** .558** .644** .540** .528** .250 .561**
Sig. (2-
tailed) .000 .000 .000 .000 .000 .086 .000
N 48 48 48 48 48 48 48 48
**. Correlation is significant at the 0.01 level (2-tailed).
*. Correlation is significant at the 0.05 level (2-tailed).

9
WIAT: Class vs Individual Administration
WIAT N Mean SD Time 1 57 3.14 1.10
Time 2 44 2.93 0.91
WIAT: Class vs Individual Administration
WIAT N Mean SD
Time 1 57 3.14 1.10 Time 2 44 2.93 0.91

10
WIAT: Class vs Individual Administration • Clear correlation between the individual and class administrations:
r(39)=.437, p=.003
• No significant main effect of class or testing point and no interaction between the two.
• Lack of difference between the two testing environments suggests that the WIAT can be administered on a whole class basis.
• The WIAT was also tested to see if it could identify children the teachers felt were struggling writers. Of the list of 18/57 children identified as such, the teachers commented that 2 were, in their opinion, not struggling writers.
Discussion • WIAT correlates strongly with most CBM measures, which is in-line with the
literature stating that these measures are useful proxy measures for determining writing quality.
• BUT how can we increase teacher’s trust in using such ‘simple’ measures to assess children’s writing.
• There is no difference between the two administration contexts for the WIAT – therefore teachers may be able to use this method of assessing writing in their classrooms.
• By increasing teacher’s access to writing assessments, we can aid the early identification of struggling writers and direct interventions and resources appropriately.

11
Conclusion • CBM measures remain a useful tool for closely monitoring student writing progress as
they can be administered more frequently than the alternative standardised measures
• Indications that the WIAT can be administered to a whole class, making it more useful for teachers who may trust this method of assessment more than the CBM method.
• Standardised measures are quick to score, but are more subjective.
• CBM measures can take longer to score as there are more criteria to consider; however, they can be administered more frequently and are more objective than their standardised counterparts.
Thanks to...
... our funders the ESRC.
... The school, children and teachers involved in this study.
12
Any questions?
Kirsty Walter
Email: [email protected]
References Connelly, V., Dockrell, J. E., & Barnett, A. L. (2012). Children Challenged by Writing Due to Language and Motor Difficulties. In V.
Berninger (Ed.), Cognitive Psychology of Writing Handbook: Past, Present, and Future Contributions of Cognitive Writing Research to Cognitive Psychology. Hove, UK: Psychology Press
DfE. (2012). Statistical First Release: National Curriculum Assessments at Key Stage 2 in England, 2012 (Provisional). London: Department for Education.
Flower, L., & Hayes, J. R. (1980). The dynamics of composing: Making plans and juggling constraints. In L. W. Gregg & E. R. Steinberg (Eds.), Cognitive Proceses in Writing (pp. 31-50). Hillsdale, Nj: Erlbaum.
Fuchs, L. S., Fuchs, D., Hamlett, C. L., Walz, L., & Germann, G. (1993) Formtaive Evaluation of academic Progress – How mucu growth can we expect. School Psychology Review, 22(1), 27-48.
Gansle, K. A., VanDerHeyden, A. M., Noell, G. H., Resetar, J. L., & Williams, K. L. (2006) The technical adequacy of curriculum-based and rating-based measures of written expression for elementary school students. School Psychology Review, 35(3), 435-450.
13
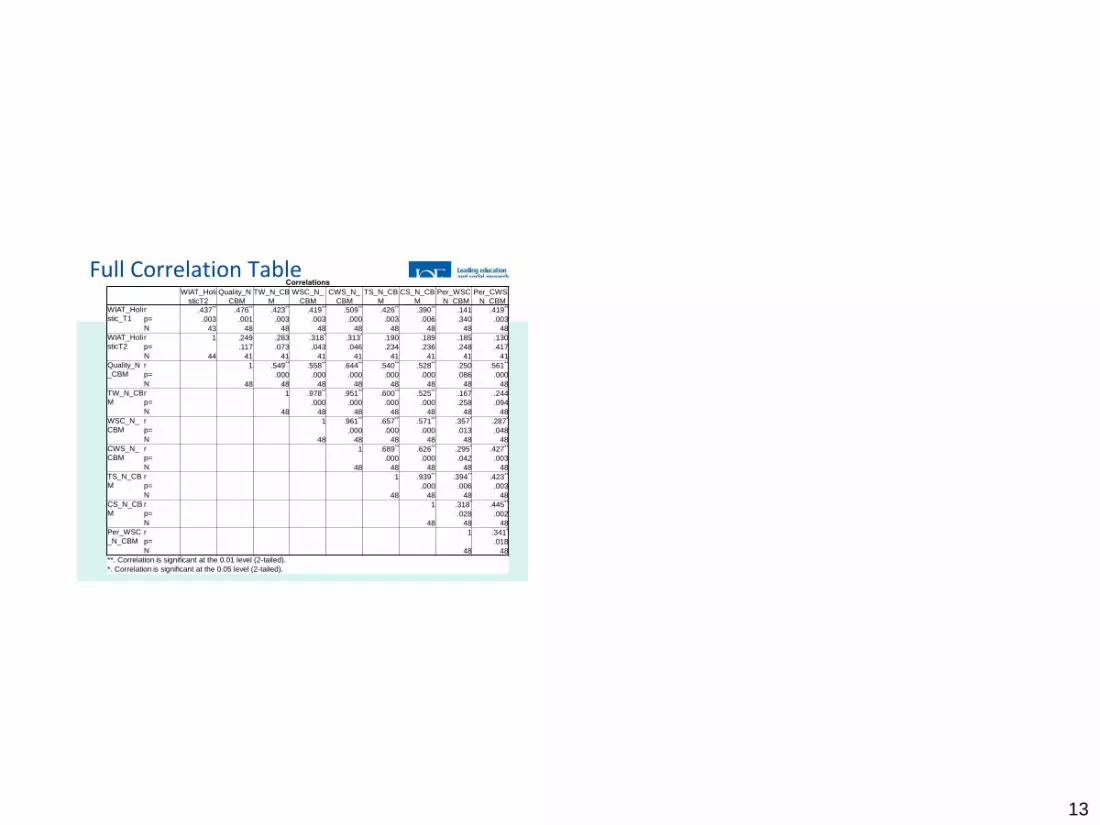
Full Correlation Table Correlations
WIAT_Holi
sticT2
Quality_N
_CBM
TW_N_CB
M
WSC_N_
CBM
CWS_N_
CBM
TS_N_CB
M
CS_N_CB
M
Per_WSC
_N_CBM
Per_CWS
_N_CBM WIAT_Holi
stic_T1
r .437** .476** .423** .419** .509** .426** .390** .141 .419**
p= .003 .001 .003 .003 .000 .003 .006 .340 .003
N 43 48 48 48 48 48 48 48 48
WIAT_Holi
sticT2
r 1 .249 .283 .318* .313* .190 .189 .185 .130
p= .117 .073 .043 .046 .234 .236 .248 .417
N 44 41 41 41 41 41 41 41 41
Quality_N
_CBM
r 1 .549** .558** .644** .540** .528** .250 .561**
p= .000 .000 .000 .000 .000 .086 .000
N 48 48 48 48 48 48 48 48
TW_N_CB
M
r 1 .978** .951** .600** .525** .167 .244
p= .000 .000 .000 .000 .258 .094
N 48 48 48 48 48 48 48
WSC_N_
CBM
r 1 .961** .657** .571** .357* .287*
p= .000 .000 .000 .013 .048
N 48 48 48 48 48 48
CWS_N_
CBM
r 1 .689** .626** .295* .427**
p= .000 .000 .042 .003
N 48 48 48 48 48
TS_N_CB
M
r 1 .939** .394** .423**
p= .000 .006 .003
N 48 48 48 48
CS_N_CB
M
r 1 .318* .445**
p= .028 .002
N 48 48 48
Per_WSC
_N_CBM
r 1 .341*
p= .018
N 48 48
**. Correlation is significant at the 0.01 level (2-tailed).
*. Correlation is significant at the 0.05 level (2-tailed).


