Embed Size (px)
Citation preview

Outline
An Improved Spectrum Sensing for CognitivePLC Systems
Alam Silva MenezesYan Coutinho
Moises Vidal Ribeiro
Electrical EngineeringFederal University of Juiz de Fora
September 26th – 29th, 2021
1/18
Outline
Outline
1 Introduction
2 PLC Spectrum Sensing Modeling
3 Improved PLC Spectrum Sensing
4 Numerical Results
5 Conclusions and Perspectives
2/18

IntroductionPLC Spectrum Sensing ModelingImproved PLC Spectrum Sensing
Numerical ResultsConclusions and Perspectives
Introduction
PLC is being pointed out as one of the technologies to meetthe data communication demands related to Smart Grids(SG), Internet of Things (IoT), and Industry 4:0;
The hostile characteristics of electric power system fortransmitting carrying-signals information and the existingregulatory constraints motivate flexible spectrum access;
Several researches have been investigating the CR techniquesin PLC systems;
The power line has been used as a sensor to detect spectrumholes and to avoid possible interference in the radiocommunication systems.
3/18
IntroductionPLC Spectrum Sensing ModelingImproved PLC Spectrum Sensing
Numerical ResultsConclusions and Perspectives
MotivationSystem Modeling
System Modeling
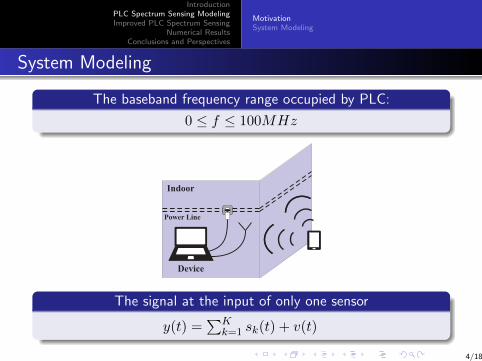
The baseband frequency range occupied by PLC:
0 ≤ f ≤ 100MHz
The signal at the input of only one sensor
y(t) =∑K
k=1 sk(t) + v(t)
4/18
IntroductionPLC Spectrum Sensing ModelingImproved PLC Spectrum Sensing
Numerical ResultsConclusions and Perspectives
MotivationSystem Modeling
Acquisition Formulation
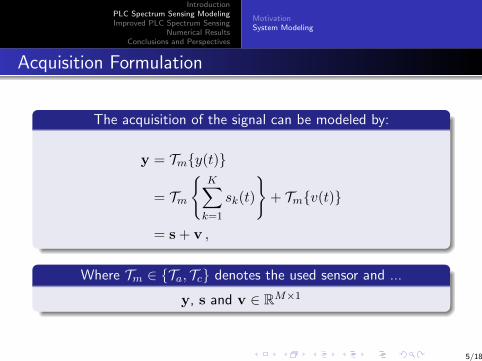
The acquisition of the signal can be modeled by:
y = Tm{y(t)}
= Tm
{K∑k=1
sk(t)
}+ Tm{v(t)}
= s + v ,
Where Tm ∈ {Ta, Tc} denotes the used sensor and ...
y, s and v ∈ RM×1
5/18
IntroductionPLC Spectrum Sensing ModelingImproved PLC Spectrum Sensing
Numerical ResultsConclusions and Perspectives
MotivationSystem Modeling
Matrix Formulation
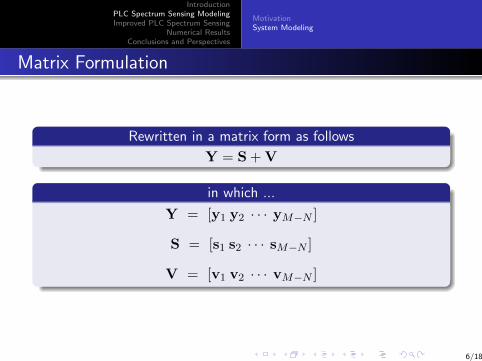
Rewritten in a matrix form as follows
Y = S + V
in which ...
Y = [y1 y2 · · · yM−N ]
S = [s1 s2 · · · sM−N ]
V = [v1 v2 · · · vM−N ]
6/18
IntroductionPLC Spectrum Sensing ModelingImproved PLC Spectrum Sensing
Numerical ResultsConclusions and Perspectives
MotivationSystem Modeling
Matrix Formulation
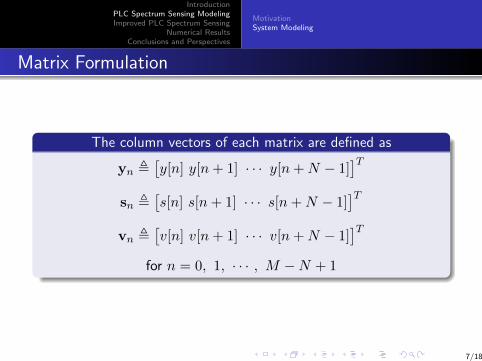
The column vectors of each matrix are defined as
yn ,[y[n] y[n+ 1] · · · y[n+N − 1]
]Tsn ,
[s[n] s[n+ 1] · · · s[n+N − 1]
]Tvn ,
[v[n] v[n+ 1] · · · v[n+N − 1]
]Tfor n = 0, 1, · · · , M −N + 1
7/18
IntroductionPLC Spectrum Sensing ModelingImproved PLC Spectrum Sensing
Numerical ResultsConclusions and Perspectives
Proposed Technique
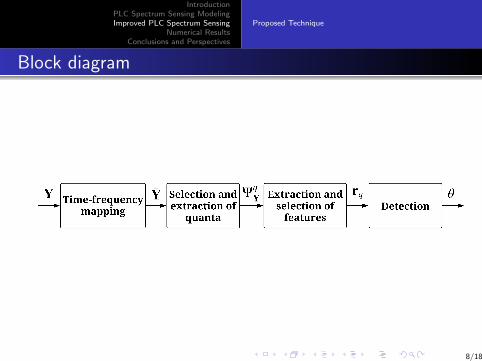
Block diagram
8/18
IntroductionPLC Spectrum Sensing ModelingImproved PLC Spectrum Sensing
Numerical ResultsConclusions and Perspectives
Proposed Technique
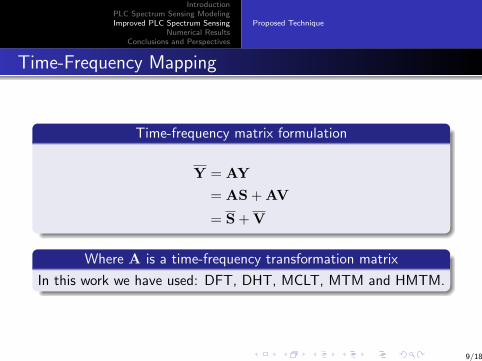
Time-Frequency Mapping
Time-frequency matrix formulation
Y = AY
= AS + AV
= S + V
Where A is a time-frequency transformation matrix
In this work we have used: DFT, DHT, MCLT, MTM and HMTM.
9/18
IntroductionPLC Spectrum Sensing ModelingImproved PLC Spectrum Sensing
Numerical ResultsConclusions and Perspectives
Proposed Technique
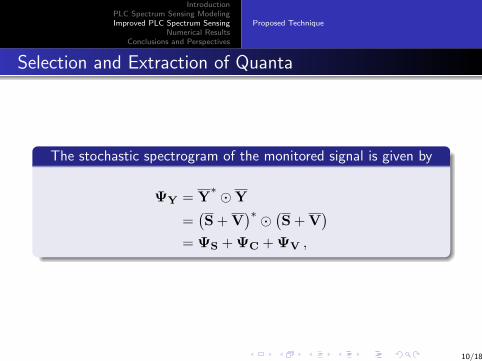
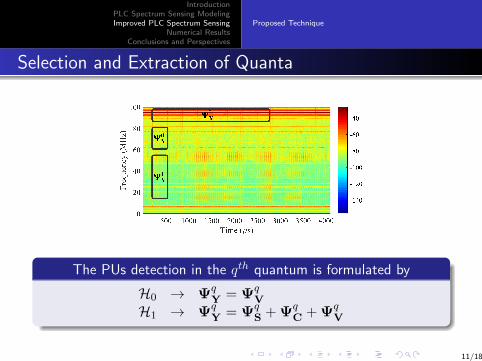
Selection and Extraction of Quanta
The stochastic spectrogram of the monitored signal is given by
ΨY = Y∗ �Y
=(S + V
)∗ � (S + V)
= ΨS + ΨC + ΨV ,
10/18
IntroductionPLC Spectrum Sensing ModelingImproved PLC Spectrum Sensing
Numerical ResultsConclusions and Perspectives
Proposed Technique
Selection and Extraction of Quanta
The PUs detection in the qth quantum is formulated by
H0 → ΨqY = Ψq
V
H1 → ΨqY = Ψq
S + ΨqC + Ψq
V
11/18
IntroductionPLC Spectrum Sensing ModelingImproved PLC Spectrum Sensing
Numerical ResultsConclusions and Perspectives
Proposed Technique
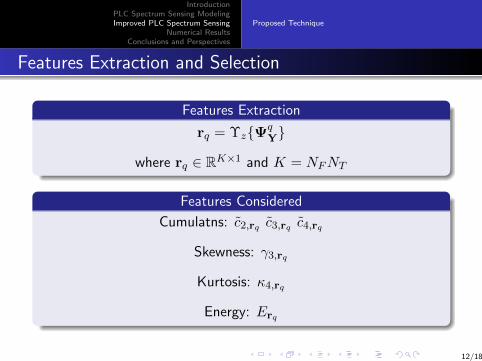
Features Extraction and Selection
Features Extraction
rq = Υz{ΨqY}
where rq ∈ RK×1 and K = NFNT
Features Considered
Cumulatns: c2,rq c3,rq c4,rq
Skewness: γ3,rq
Kurtosis: κ4,rq
Energy: Erq
12/18
IntroductionPLC Spectrum Sensing ModelingImproved PLC Spectrum Sensing
Numerical ResultsConclusions and Perspectives
Proposed Technique
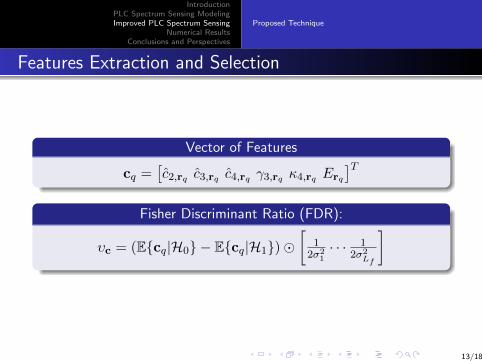
Features Extraction and Selection
Vector of Features
cq =[c2,rq c3,rq c4,rq γ3,rq κ4,rq Erq
]TFisher Discriminant Ratio (FDR):
υc = (E{cq|H0} − E{cq|H1})�[
12σ2
1· · · 1
2σ2Lf
]
13/18
IntroductionPLC Spectrum Sensing ModelingImproved PLC Spectrum Sensing
Numerical ResultsConclusions and Perspectives
Proposed Technique
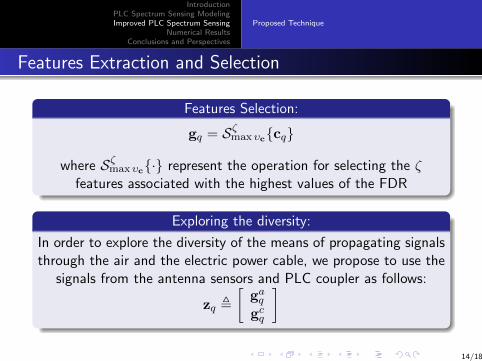
Features Extraction and Selection
Features Selection:
gq = Sζmax υc{cq}
where Sζmax υc{·} represent the operation for selecting the ζfeatures associated with the highest values of the FDR
Exploring the diversity:
In order to explore the diversity of the means of propagating signalsthrough the air and the electric power cable, we propose to use the
signals from the antenna sensors and PLC coupler as follows:
zq ,
[gaqgcq
]
14/18
IntroductionPLC Spectrum Sensing ModelingImproved PLC Spectrum Sensing
Numerical ResultsConclusions and Perspectives
Proposed Technique
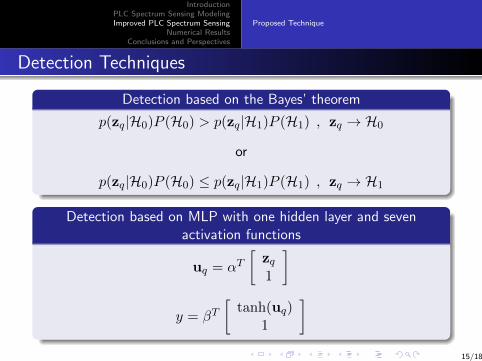
Detection Techniques
Detection based on the Bayes’ theorem
p(zq|H0)P (H0) > p(zq|H1)P (H1) , zq → H0
or
p(zq|H0)P (H0) ≤ p(zq|H1)P (H1) , zq → H1
Detection based on MLP with one hidden layer and sevenactivation functions
uq = αT[
zq1
]
y = βT[
tanh(uq)1
]15/18
IntroductionPLC Spectrum Sensing ModelingImproved PLC Spectrum Sensing
Numerical ResultsConclusions and Perspectives
Setup
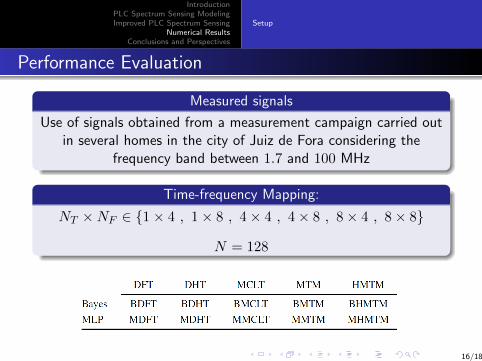
Performance Evaluation
Measured signals
Use of signals obtained from a measurement campaign carried outin several homes in the city of Juiz de Fora considering the
frequency band between 1.7 and 100 MHz
Time-frequency Mapping:
NT ×NF ∈ {1× 4 , 1× 8 , 4× 4 , 4× 8 , 8× 4 , 8× 8}
N = 128
16/18
IntroductionPLC Spectrum Sensing ModelingImproved PLC Spectrum Sensing
Numerical ResultsConclusions and Perspectives
Setup
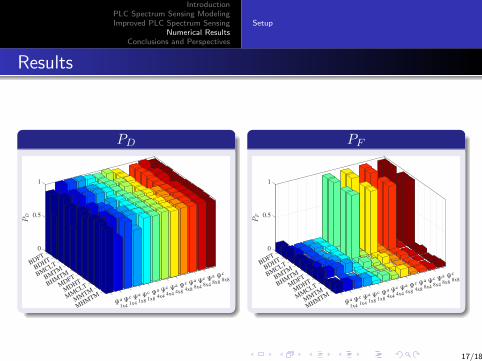
Results
PD
0
BDFT
0.5
BDH
T
1
BMCLT
BMTM
8x8
c
BHM
TM
8x8
a
8x4
c
MD
FT
8x4
a
4x8
c
MD
HT
4x8
a
4x4
c
MM
CLT
4x4
a
MM
TM
1x8
c
1x8
a
MH
MTM
1x4
c
1x4
a
PF
0
BDFT
0.5
BDH
T
1
BMCLT
BMTM
8x8
c
BHM
TM
8x8
a
8x4
c
MD
FT
8x4
a
4x8
c
MD
HT
4x8
a
4x4
c
MM
CLT
4x4
a
MM
TM
1x8
c
1x8
a
MH
MTM
1x4
c
1x4
a
17/18
IntroductionPLC Spectrum Sensing ModelingImproved PLC Spectrum Sensing
Numerical ResultsConclusions and Perspectives
Conclusions
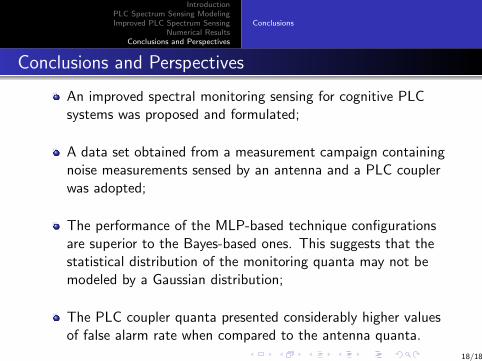
Conclusions and Perspectives
An improved spectral monitoring sensing for cognitive PLCsystems was proposed and formulated;
A data set obtained from a measurement campaign containingnoise measurements sensed by an antenna and a PLC couplerwas adopted;
The performance of the MLP-based technique configurationsare superior to the Bayes-based ones. This suggests that thestatistical distribution of the monitoring quanta may not bemodeled by a Gaussian distribution;
The PLC coupler quanta presented considerably higher valuesof false alarm rate when compared to the antenna quanta.
18/18


