Embed Size (px)
Citation preview
ARTICLE IN PRESS
Journal of Magnetism and Magnetic Materials 266 (2003) 68–78
*Tel.: +
(S.N. Klau1 Present
Center, Bl
2800 Kgs.2 Present
Jyllinge, D
0304-8853/
doi:10.1016
An inelastic neutron scattering study of hematite nanoparticles
S.N. Klausena,*, K. Lefmanna, P.-A. Lindg(arda, K.N. Clausena, M.F. Hansenb,1,F. B^dkerb,2, S. M^rupb, M. Tellingc
a Materials Research Department, Risø National Laboratory, DK-4000 Roskilde, Denmarkb Department of Physics, Bldg. 307, Technical University of Denmark, DK-2800 Kgs. Lyngby, Denmark
c Rutherford Appleton Laboratory, Chilton, Didcot OX11 0QX, UK
Received 30 September 2002
Abstract
We have studied the magnetic dynamics in nanocrystalline hematite by inelastic neutron scattering at the high-
resolution time-of-flight spectrometer IRIS at ISIS. Compared to previous inelastic neutron scattering experiments an
improvement of the resolution function is achieved and more detailed information is obtained. We have performed
measurements at several temperatures ranging from 5 to 325 K. The particles are canted antiferromagnetic (weakly
ferromagnetic) at temperatures at least down to 5 K. We study both superparamagnetic relaxation and collective
magnetic excitations of the whole particle moment at the antiferromagnetic Bragg reflection. We have studied different
weightings of the particle size distribution. The data and their temperature dependence can with good agreement be
interpreted on the basis of the N!eel-Brown theory for superparamagnetic relaxation and a model for the collective
magnetic excitations.
r 2003 Elsevier B.V. All rights reserved.
PACS: 75.50.Tt; 76.60.Es; 76.50.+g; 78.70.Nx
Keywords: Magnetic fluctuations; Neutron scattering; Superparamagnetic relaxation; Hematite
1. Introduction
The magnetic properties of nanoparticles haveattracted much attention because of the applica-tions of such particles in magnetic data storagemedia, in ferrofluids, in biotechnology, etc.
45-46774862; fax: +45-46775758.
address: [email protected]
sen).
address: Micro- and Nanotechnology Research
dg. 345E, Technical University of Denmark, DK-
Lyngby, Denmark.
address: Danfysik A/S, M^llehaven 31, DK-4040
enmark.
03/$ - see front matter r 2003 Elsevier B.V. All rights rese
/S0304-8853(03)00457-8
Furthermore, magnetic nanoparticles are alsocommonly found in nature. Also from a theore-tical point of view magnetic nanoparticles areinteresting because their properties may differconsiderably from the properties of bulk magneticmaterials. In particular it is notable that themagnetisation directions of magnetic nanoparti-cles may fluctuate due to superparamagneticrelaxation and collective magnetic excitations.For a review of studies of the magnetic propertiesof nanoparticles, see for example Ref. [1].
Most experimental studies of magnetic nano-particles have been performed using AC and DCmagnetisation measurements and M .ossbauer
rved.
ARTICLE IN PRESS
S.N. Klausen et al. / Journal of Magnetism and Magnetic Materials 266 (2003) 68–78 69
spectroscopy. With these techniques, one canstudy relaxation phenomena on time scales from10�10 s to about 100 s or longer. Neutron scatter-ing is sensitive to magnetic relaxation processeswith time scales of the order of 10�7–10�16 s andmay therefore be a valuable complement to themore commonly used techniques. Several studieshave in fact shown that neutron scattering can giveuseful information on relaxation phenomena inmagnetic nanoparticles [2–7].
In this paper, we present the results of experi-mental studies of nanoparticles of hematite(a-Fe2O3) using inelastic neutron scattering. Thesample has previously been studied using a tripleaxis spectrometer with an energy resolution of35 meV (HWHM) [3]. Many of the observed effectsin that study were close to the resolution limit ofthe spectrometer. Here we have used a time-of-flight spectrometer with a better energy resolution(12 meV HWHM) that also provides informationon the scattering properties in a whole ðk;oÞregion. This provides an advantage over the point-wise triple-axis measurements and gives moreaccurate information on both collective magneticexcitations and superparamagnetic relaxation ofthe particles.
2. Hematite nanoparticles
Bulk hematite has the corundum structure and isantiferromagnetic below the Morin temperature(TME263 K) with the magnetic moment of theFe3þ ions along the [1 1 1] direction. Above TM andbelow the N!eel temperature, TNE955 K; the spinslie in the (1 1 1) plane with a slight canting awayfrom the perfect antiferromagnetic alignment,resulting in a weakly ferromagnetic structure [8].
Hematite particles smaller than 20 nm haveshown a suppression of the Morin transition andstay in the weakly ferromagnetic state at leastdown to 5 K [8,9]. This has been confirmed for thepresent particles [3,10], and in the following wewill therefore discuss exclusively the weaklyferromagnetic phase. For further general detailson hematite and the hematite nanoparticles con-sult Refs. [8] and [10], respectively. These refer-
ences also explain the rhombohedral indexing usedin this paper.
The sublattice magnetisation directions of thesingle-domain hematite nanoparticles are confinedto the basal plane in which the bulk hexagonalmagnetocrystalline anisotropy is dominated by auniaxial anisotropy [10]. Hence the magneticanisotropy energy can be approximated by
EA ¼ �K1V cos2 yþ KBuV sin2f: ð1Þ
Here y and f are the angles between SAF �S1 � S2 and the [1 1 1] direction and the in-planeeasy direction, #e ¼ ð1; 0; 0Þ; respectively. Si is thesublattice spin, i ¼ 1; 2: K1 is the anisotropyconstant of the [1 1 1] direction (which is negativeabove the Morin transition), KBu is the (positive)uniaxial anisotropy constant in the basal plane,and V is the volume of the particle. �K1V is largecompared to all other energies implying yEp=2[5,9,10].
3. Superparamagnetic relaxation and collective
magnetic excitations
We use the common assumption for singledomain nanoparticles that all spins move coher-ently [5,11].
Due to the large K1 value of the presentparticles, the superparamagnetic relaxation (spon-taneous spin reversal caused by thermal fluctua-tions) of SAF takes place in the basal plane [10].Hence the energy barrier to be surmounted in therelaxation is given by KBuV : Although the super-paramagnetic relaxation is of two-dimensionalnature it can as a first approximation be describedby the N!eel-Brown expression [3,9,10]
t ¼ t0eKBuV=kBT ; ð2Þ
where t is the relaxation time, and t0 is the averagetime between attempts to jump the energy barrier.Here kB is the Boltzmann constant and T is thetemperature [11].
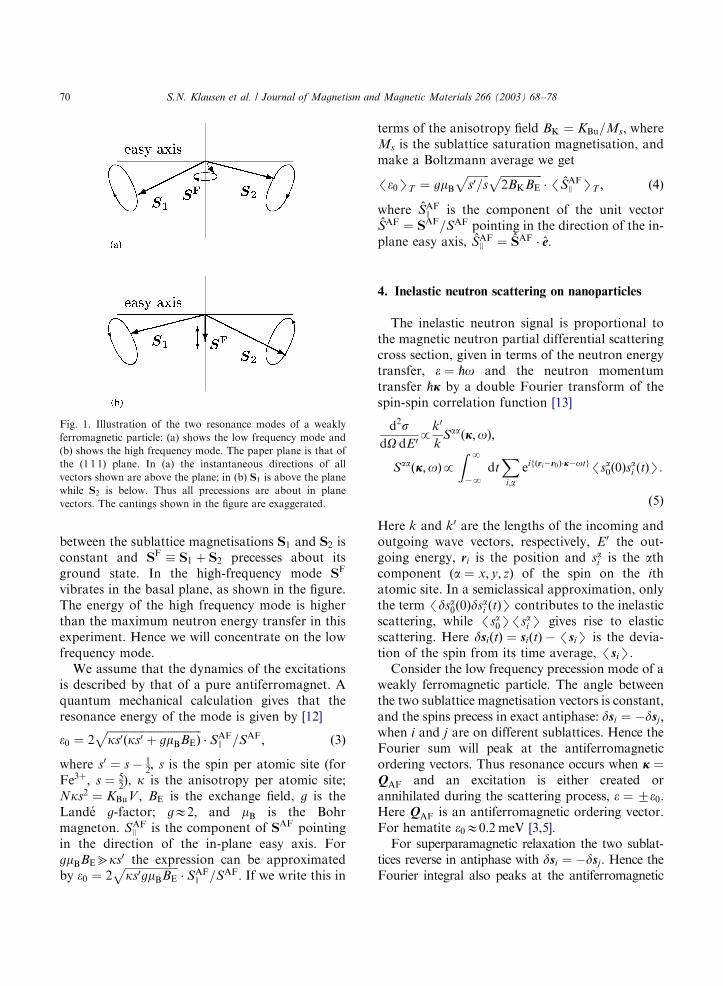
In the weakly ferromagnetic phase of a hematiteparticle there are two types of collective magneticexcitations related to fluctuation modes of theweakly ferromagnetic moment [8], as shown inFig. 1. In the low-frequency mode, the angle
ARTICLE IN PRESS
Fig. 1. Illustration of the two resonance modes of a weakly
ferromagnetic particle: (a) shows the low frequency mode and
(b) shows the high frequency mode. The paper plane is that of
the (1 1 1) plane. In (a) the instantaneous directions of all
vectors shown are above the plane; in (b) S1 is above the plane
while S2 is below. Thus all precessions are about in plane
vectors. The cantings shown in the figure are exaggerated.
S.N. Klausen et al. / Journal of Magnetism and Magnetic Materials 266 (2003) 68–7870
between the sublattice magnetisations S1 and S2 isconstant and SF � S1 þ S2 precesses about itsground state. In the high-frequency mode SF
vibrates in the basal plane, as shown in the figure.The energy of the high frequency mode is higherthan the maximum neutron energy transfer in thisexperiment. Hence we will concentrate on the lowfrequency mode.
We assume that the dynamics of the excitationsis described by that of a pure antiferromagnet. Aquantum mechanical calculation gives that theresonance energy of the mode is given by [12]
e0 ¼ 2ffiffiffiffiffiffiffiffiffiffiffiffiffiffiffiffiffiffiffiffiffiffiffiffiffiffiffiffiffiffiffiffiffiffiks0ðks0 þ gmBBEÞ
p� SAF
J =SAF; ð3Þ
where s0 ¼ s � 12; s is the spin per atomic site (for
Fe3þ; s ¼ 52), k is the anisotropy per atomic site;
Nks2 ¼ KBuV ; BE is the exchange field, g is theLand!e g-factor; gE2; and mB is the Bohrmagneton. SAF
J is the component of SAF pointingin the direction of the in-plane easy axis. ForgmBBEbks0 the expression can be approximatedby e0 ¼ 2
ffiffiffiffiffiffiffiffiffiffiffiffiffiffiffiffiffiffiffiks0gmBBE
p� SAF
J =SAF: If we write this in
terms of the anisotropy field BK ¼ KBu=Ms; whereMs is the sublattice saturation magnetisation, andmake a Boltzmann average we get
/e0ST ¼ gmB
ffiffiffiffiffiffiffiffis0=s
p ffiffiffiffiffiffiffiffiffiffiffiffiffiffiffi2BKBE
p�/ #SAF
J ST ; ð4Þ
where #SAFJ is the component of the unit vector
#SAF ¼ SAF=SAF pointing in the direction of the in-plane easy axis, #SAF
J ¼ #SAF � #e:
4. Inelastic neutron scattering on nanoparticles
The inelastic neutron signal is proportional tothe magnetic neutron partial differential scatteringcross section, given in terms of the neutron energytransfer, e ¼ _o and the neutron momentumtransfer _j by a double Fourier transform of thespin-spin correlation function [13]
d2sdO dE0p
k0
kSaaðj;oÞ;
Saaðj;oÞpZ
N
�N
dtX
i;a
eifðri�r0Þ�j�otg/sa0ð0Þsai ðtÞS:
ð5Þ
Here k and k0 are the lengths of the incoming andoutgoing wave vectors, respectively, E0 the out-going energy, ri is the position and sai is the athcomponent (a ¼ x; y; z) of the spin on the ithatomic site. In a semiclassical approximation, onlythe term /dsa0ð0Þdsai ðtÞS contributes to the inelasticscattering, while /sa0S/sai S gives rise to elasticscattering. Here dsiðtÞ ¼ siðtÞ �/siS is the devia-tion of the spin from its time average, /siS:
Consider the low frequency precession mode of aweakly ferromagnetic particle. The angle betweenthe two sublattice magnetisation vectors is constant,and the spins precess in exact antiphase: dsi ¼ �dsj ;when i and j are on different sublattices. Hence theFourier sum will peak at the antiferromagneticordering vectors. Thus resonance occurs when j ¼QAF and an excitation is either created orannihilated during the scattering process, e ¼ 7e0:Here QAF is an antiferromagnetic ordering vector.For hematite e0E0:2 meV [3,5].
For superparamagnetic relaxation the two sublat-tices reverse in antiphase with dsi ¼ �dsj : Hence theFourier integral also peaks at the antiferromagnetic
ARTICLE IN PRESS
S.N. Klausen et al. / Journal of Magnetism and Magnetic Materials 266 (2003) 68–78 71
ordering vectors only. Superparamagnetic relaxationoccurs randomly with /sJ0ð0Þs
Ji ðtÞSpexpð�t=tÞ;
where J denotes the easy axis. This gives a Lorentzianenergy line shape of width (HWHM) _=t andcentered at e ¼ 0 when j ¼ QAF:
Now SAF is the antisum of of the individual spinsin the sublattices SAF ¼
Piðsi;1 � si;2Þ: The correla-
tion function relevant for inelastic scattering at j ¼QAF is then /Sað0ÞSaðtÞS: For superparamagneticrelaxation corresponding to longitudinal relaxationthe spin–spin correlation function, and hence thecorresponding part of the integrated intensity in aninelastic neutron scattering experiment, A1 is pro-
portional to ðSAFÞ2/ð #SAFJ Þ2ST : Here /yST is a
Boltzmann average. For the low frequency mode thecollective magnetic excitations correspond to trans-verse fluctuations, and we get a contribution to theintegrated neutron scattering intensity
A2pðSAFÞ2/ð #SAF> Þ2ST ; where ð #SAF
J Þ2 þ ð #SAF> Þ2 ¼
1: Thus, for these two types of dynamics, we obtain
A1
A1 þ A2¼ /ðSAF
J Þ2ST : ð6Þ
Excitations to the high frequency mode areneglected.
With #SAF ¼ ðsin y cos f; sin y sin f; cos yÞ andthe anisotropy energy given by Eq. (1), theBoltzmann averages / #SAF
J ST and /ð #SAFJ Þ2ST of
Eqs. (4) and (6) in one hemisphere can becalculated [14]
/ #SAFJ ST ¼
I0ð12a1Þ þ I1ð12a1Þ
2 I0ð12aBuÞ
� e12ðaBu�a1Þ
ffiffiffiffiffiffiffia1
aBu
rerfð
ffiffiffiffiffiffiffiaBu
pÞ
erfðffiffiffiffiffia1
pÞ
E 1 � kBT1
4jK1jVþ
1
4KBuV
� �ð7Þ
and
/ð #SAFJ Þ2ST ¼
I0ð12aBuÞ þ I1ð12aBuÞ
2 I0ð12aBuÞ
�a�1
21 e�a1 þ 1
2
ffiffiffip
pð2 � a�1
1 Þerfðffiffiffiffiffia1
pÞffiffiffi
pp
erfðffiffiffiffiffia1
pÞ
E 1 � kBT1
2jK1jVþ
1
2KBuV
� �: ð8Þ
The approximations are valid for low tempera-tures, kBT5KBuV : Here ai ¼ KiV=kBT ; i ¼ 1; Bu;InðxÞ is the modified Bessel function of order n anderfðxÞ ¼ 2=
ffiffiffip
p R x
0du e�u2
is the error function.
5. Preparation and material verification
The hematite nanoparticle sample was preparedas described in Refs. [3] and [10] by thermaldecomposition of FeðNO3Þ3 � 9H2O: Powder X-raydiffraction patterns of the freeze dried sampleconfirmed that the sample consisted of nanocrys-talline hematite with an average size of 1673 nm[10]. Using electron microscopy the particles werefound to be almost spherical, with a diameter ofabout 16 nm. The sample contains a small amountof impurities in the form of ferrihydrite. Thesample also contains water adsorbed onto theparticles.
The influence of inter-particle interactions wasinvestigated by M .ossbauer spectroscopy, which isvery sensitive to such interactions [15]. Spectra ofthe sample used in the neutron scattering experi-ments and another sample of particles from thesame batch, but coated with oleic acid andsuspended in hexadecane, were obtained at varioustemperatures. The superparamagnetic behavior ofthe two samples was almost identical. Because theinter-particle interaction is negligible in the sampleof coated and suspended particles it can beconcluded that the interparticle interaction also isnegligible in the sample used for the neutronstudies.
6. Experiments
The inelastic neutron scattering experimentswere performed at the high resolution inversegeometry time-of-flight spectrometer IRIS [16] atISIS, Rutherford Appleton Laboratory, UK. Thechopper system was run at 25 Hz giving incidentneutron energies ranging from 0.9 to 2.9 meV,approximately. The scattered intensities wereenergy analysed by a large pyrolytic graphitecrystal array oriented close to back-scatteringgeometry using the (0 0 2) reflection with energy
ARTICLE IN PRESS
S.N. Klausen et al. / Journal of Magnetism and Magnetic Materials 266 (2003) 68–7872
of approximately 1.8 meV. The hematite powdersample was placed inside an Oxford Orangecryostat.
The data were treated in the following way: theefficiency and solid angle of each of the 51 ZnSdetectors was calibrated by using the incoherentelastic scattering of vanadium measured at a
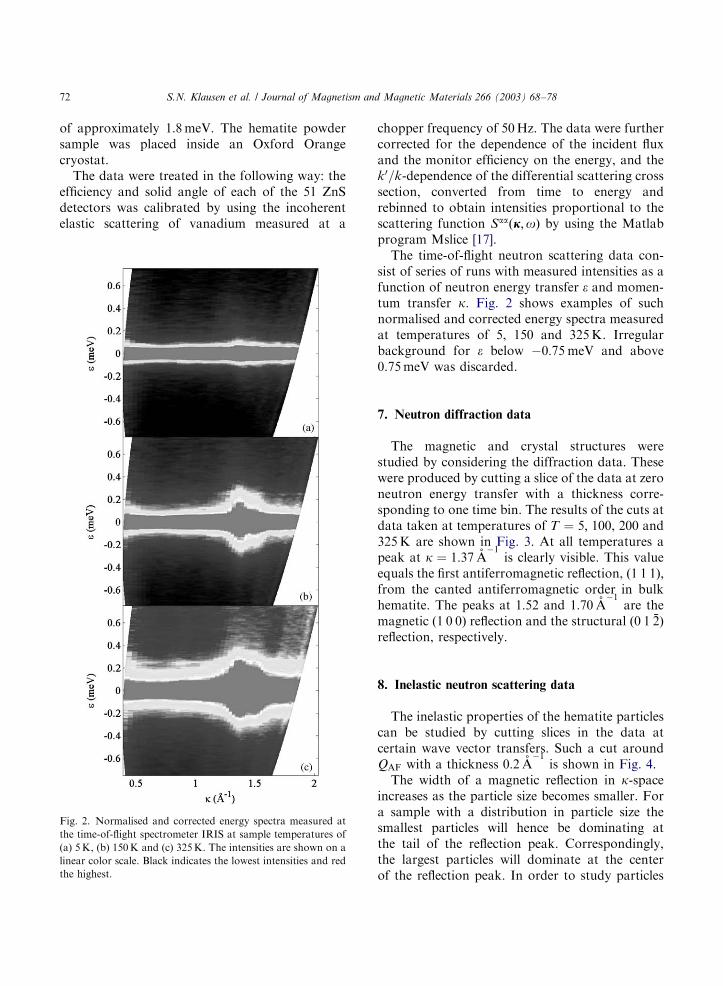
Fig. 2. Normalised and corrected energy spectra measured at
the time-of-flight spectrometer IRIS at sample temperatures of
(a) 5 K, (b) 150 K and (c) 325 K. The intensities are shown on a
linear color scale. Black indicates the lowest intensities and red
the highest.
chopper frequency of 50 Hz. The data were furthercorrected for the dependence of the incident fluxand the monitor efficiency on the energy, and thek0=k-dependence of the differential scattering crosssection, converted from time to energy andrebinned to obtain intensities proportional to thescattering function Saaðj;oÞ by using the Matlabprogram Mslice [17].
The time-of-flight neutron scattering data con-sist of series of runs with measured intensities as afunction of neutron energy transfer e and momen-tum transfer k: Fig. 2 shows examples of suchnormalised and corrected energy spectra measuredat temperatures of 5, 150 and 325 K. Irregularbackground for e below �0:75 meV and above0.75 meV was discarded.
7. Neutron diffraction data
The magnetic and crystal structures werestudied by considering the diffraction data. Thesewere produced by cutting a slice of the data at zeroneutron energy transfer with a thickness corre-sponding to one time bin. The results of the cuts atdata taken at temperatures of T ¼ 5; 100, 200 and325 K are shown in Fig. 3. At all temperatures apeak at k ¼ 1:37 (A
�1is clearly visible. This value
equals the first antiferromagnetic reflection, ð1 1 1Þ;from the canted antiferromagnetic order in bulkhematite. The peaks at 1:52 and 1:70 (A
�1are the
magnetic ð1 0 0Þ reflection and the structural ð0 1 %2Þreflection, respectively.
8. Inelastic neutron scattering data
The inelastic properties of the hematite particlescan be studied by cutting slices in the data atcertain wave vector transfers. Such a cut aroundQAF with a thickness 0:2 (A
�1is shown in Fig. 4.
The width of a magnetic reflection in k-spaceincreases as the particle size becomes smaller. Fora sample with a distribution in particle size thesmallest particles will hence be dominating atthe tail of the reflection peak. Correspondingly,the largest particles will dominate at the centerof the reflection peak. In order to study particles
ARTICLE IN PRESS
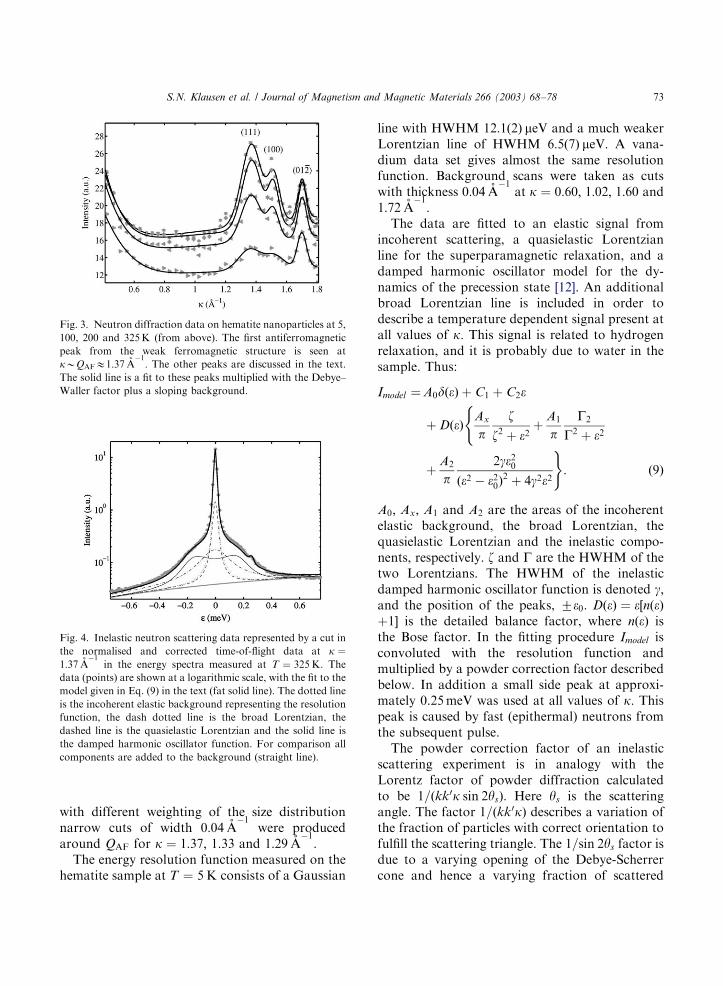
Fig. 3. Neutron diffraction data on hematite nanoparticles at 5,
100, 200 and 325 K (from above). The first antiferromagnetic
peak from the weak ferromagnetic structure is seen at
kBQAFE1:37 (A�1: The other peaks are discussed in the text.
The solid line is a fit to these peaks multiplied with the Debye–
Waller factor plus a sloping background.
Fig. 4. Inelastic neutron scattering data represented by a cut in
the normalised and corrected time-of-flight data at k ¼1:37 (A
�1in the energy spectra measured at T ¼ 325 K: The
data (points) are shown at a logarithmic scale, with the fit to the
model given in Eq. (9) in the text (fat solid line). The dotted line
is the incoherent elastic background representing the resolution
function, the dash dotted line is the broad Lorentzian, the
dashed line is the quasielastic Lorentzian and the solid line is
the damped harmonic oscillator function. For comparison all
components are added to the background (straight line).
S.N. Klausen et al. / Journal of Magnetism and Magnetic Materials 266 (2003) 68–78 73
with different weighting of the size distributionnarrow cuts of width 0:04 (A
�1were produced
around QAF for k ¼ 1:37; 1.33 and 1:29 (A�1:
The energy resolution function measured on thehematite sample at T ¼ 5 K consists of a Gaussian
line with HWHM 12:1ð2Þ meV and a much weakerLorentzian line of HWHM 6:5ð7Þ meV: A vana-dium data set gives almost the same resolutionfunction. Background scans were taken as cutswith thickness 0:04 (A
�1at k ¼ 0:60; 1:02; 1:60 and
1:72 (A�1:
The data are fitted to an elastic signal fromincoherent scattering, a quasielastic Lorentzianline for the superparamagnetic relaxation, and adamped harmonic oscillator model for the dy-namics of the precession state [12]. An additionalbroad Lorentzian line is included in order todescribe a temperature dependent signal present atall values of k: This signal is related to hydrogenrelaxation, and it is probably due to water in thesample. Thus:
Imodel ¼A0dðeÞ þ C1 þ C2e
þ DðeÞAx
pz
z2 þ e2þ
A1
pG2
G2 þ e2
(
þA2
p2ge2
0
ðe2 � e20Þ
2 þ 4g2e2
): ð9Þ
A0; Ax; A1 and A2 are the areas of the incoherentelastic background, the broad Lorentzian, thequasielastic Lorentzian and the inelastic compo-nents, respectively. z and G are the HWHM of thetwo Lorentzians. The HWHM of the inelasticdamped harmonic oscillator function is denoted g;and the position of the peaks, 7e0: DðeÞ ¼ e½nðeÞþ1� is the detailed balance factor, where nðeÞ isthe Bose factor. In the fitting procedure Imodel isconvoluted with the resolution function andmultiplied by a powder correction factor describedbelow. In addition a small side peak at approxi-mately 0.25 meV was used at all values of k: Thispeak is caused by fast (epithermal) neutrons fromthe subsequent pulse.
The powder correction factor of an inelasticscattering experiment is in analogy with theLorentz factor of powder diffraction calculatedto be 1=ðkk0k sin 2ysÞ: Here ys is the scatteringangle. The factor 1=ðkk0kÞ describes a variation ofthe fraction of particles with correct orientation tofulfill the scattering triangle. The 1=sin 2ys factor isdue to a varying opening of the Debye-Scherrercone and hence a varying fraction of scattered
ARTICLE IN PRESS
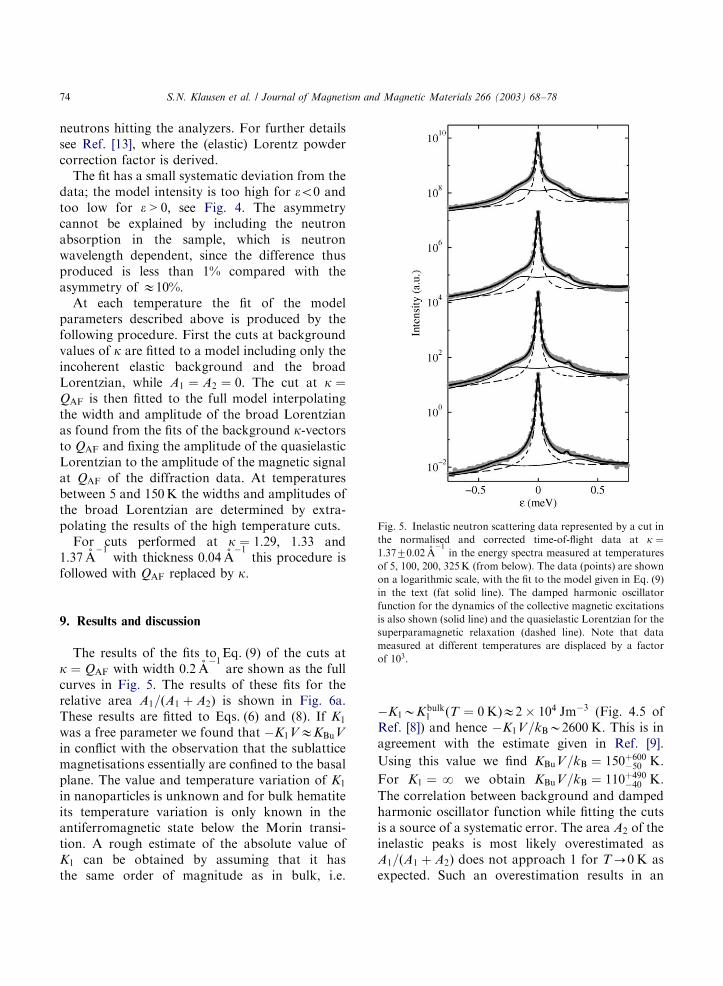
Fig. 5. Inelastic neutron scattering data represented by a cut in
the normalised and corrected time-of-flight data at k ¼1:3770:02 (A
�1in the energy spectra measured at temperatures
of 5, 100, 200, 325 K (from below). The data (points) are shown
on a logarithmic scale, with the fit to the model given in Eq. (9)
S.N. Klausen et al. / Journal of Magnetism and Magnetic Materials 266 (2003) 68–7874
neutrons hitting the analyzers. For further detailssee Ref. [13], where the (elastic) Lorentz powdercorrection factor is derived.
The fit has a small systematic deviation from thedata; the model intensity is too high for eo0 andtoo low for e > 0; see Fig. 4. The asymmetrycannot be explained by including the neutronabsorption in the sample, which is neutronwavelength dependent, since the difference thusproduced is less than 1% compared with theasymmetry of E10%:
At each temperature the fit of the modelparameters described above is produced by thefollowing procedure. First the cuts at backgroundvalues of k are fitted to a model including only theincoherent elastic background and the broadLorentzian, while A1 ¼ A2 ¼ 0: The cut at k ¼QAF is then fitted to the full model interpolatingthe width and amplitude of the broad Lorentzianas found from the fits of the background k-vectorsto QAF and fixing the amplitude of the quasielasticLorentzian to the amplitude of the magnetic signalat QAF of the diffraction data. At temperaturesbetween 5 and 150 K the widths and amplitudes ofthe broad Lorentzian are determined by extra-polating the results of the high temperature cuts.
For cuts performed at k ¼ 1:29; 1:33 and1:37 (A
�1with thickness 0:04 (A
�1this procedure is
followed with QAF replaced by k:
in the text (fat solid line). The damped harmonic oscillatorfunction for the dynamics of the collective magnetic excitations
is also shown (solid line) and the quasielastic Lorentzian for the
superparamagnetic relaxation (dashed line). Note that data
measured at different temperatures are displaced by a factor
of 103:
9. Results and discussion
The results of the fits to Eq. (9) of the cuts atk ¼ QAF with width 0:2 (A
�1are shown as the full
curves in Fig. 5. The results of these fits for therelative area A1=ðA1 þ A2Þ is shown in Fig. 6a.These results are fitted to Eqs. (6) and (8). If K1
was a free parameter we found that �K1VEKBuV
in conflict with the observation that the sublatticemagnetisations essentially are confined to the basalplane. The value and temperature variation of K1
in nanoparticles is unknown and for bulk hematiteits temperature variation is only known in theantiferromagnetic state below the Morin transi-tion. A rough estimate of the absolute value ofK1 can be obtained by assuming that it hasthe same order of magnitude as in bulk, i.e.
�K1BKbulk1 ðT ¼ 0 KÞE2 � 104 Jm�3 (Fig. 4.5 of
Ref. [8]) and hence �K1V=kBB2600 K: This is inagreement with the estimate given in Ref. [9].
Using this value we find KBuV=kB ¼ 150þ600�50 K:
For K1 ¼ N we obtain KBuV=kB ¼ 110þ490�40 K:
The correlation between background and dampedharmonic oscillator function while fitting the cutsis a source of a systematic error. The area A2 of theinelastic peaks is most likely overestimated asA1=ðA1 þ A2Þ does not approach 1 for T-0 K asexpected. Such an overestimation results in an
ARTICLE IN PRESS
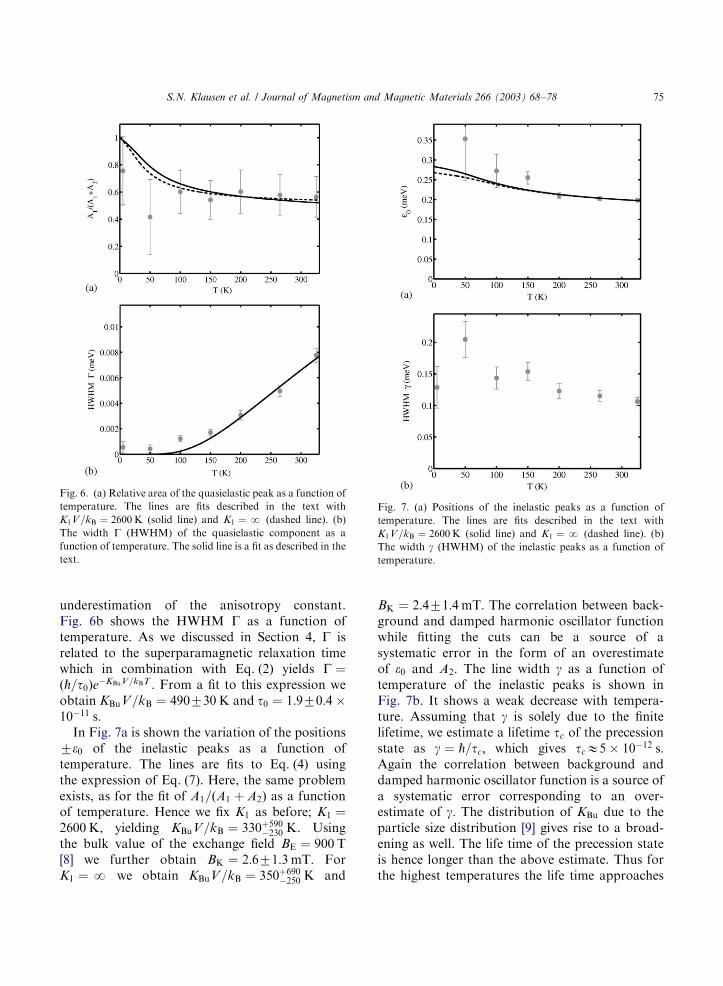
Fig. 6. (a) Relative area of the quasielastic peak as a function of
temperature. The lines are fits described in the text with
K1V=kB ¼ 2600 K (solid line) and K1 ¼ N (dashed line). (b)
The width G (HWHM) of the quasielastic component as a
function of temperature. The solid line is a fit as described in the
text.
Fig. 7. (a) Positions of the inelastic peaks as a function of
temperature. The lines are fits described in the text with
K1V=kB ¼ 2600 K (solid line) and K1 ¼ N (dashed line). (b)
The width g (HWHM) of the inelastic peaks as a function of
temperature.
S.N. Klausen et al. / Journal of Magnetism and Magnetic Materials 266 (2003) 68–78 75
underestimation of the anisotropy constant.Fig. 6b shows the HWHM G as a function oftemperature. As we discussed in Section 4, G isrelated to the superparamagnetic relaxation timewhich in combination with Eq. (2) yields G ¼ð_=t0Þe�KBuV=kBT : From a fit to this expression weobtain KBuV=kB ¼ 490730 K and t0 ¼ 1:970:4 �10�11 s:
In Fig. 7a is shown the variation of the positions7e0 of the inelastic peaks as a function oftemperature. The lines are fits to Eq. (4) usingthe expression of Eq. (7). Here, the same problemexists, as for the fit of A1=ðA1 þ A2Þ as a functionof temperature. Hence we fix K1 as before; K1 ¼2600 K; yielding KBuV=kB ¼ 330þ590
�230 K: Usingthe bulk value of the exchange field BE ¼ 900 T[8] we further obtain BK ¼ 2:671:3 mT: ForK1 ¼ N we obtain KBuV=kB ¼ 350þ690
�250 K and
BK ¼ 2:471:4 mT: The correlation between back-ground and damped harmonic oscillator functionwhile fitting the cuts can be a source of asystematic error in the form of an overestimateof e0 and A2: The line width g as a function oftemperature of the inelastic peaks is shown inFig. 7b. It shows a weak decrease with tempera-ture. Assuming that g is solely due to the finitelifetime, we estimate a lifetime tc of the precessionstate as g ¼ _=tc; which gives tcE5 � 10�12 s:Again the correlation between background anddamped harmonic oscillator function is a source ofa systematic error corresponding to an over-estimate of g: The distribution of KBu due to theparticle size distribution [9] gives rise to a broad-ening as well. The life time of the precession stateis hence longer than the above estimate. Thus forthe highest temperatures the life time approaches
ARTICLE IN PRESS
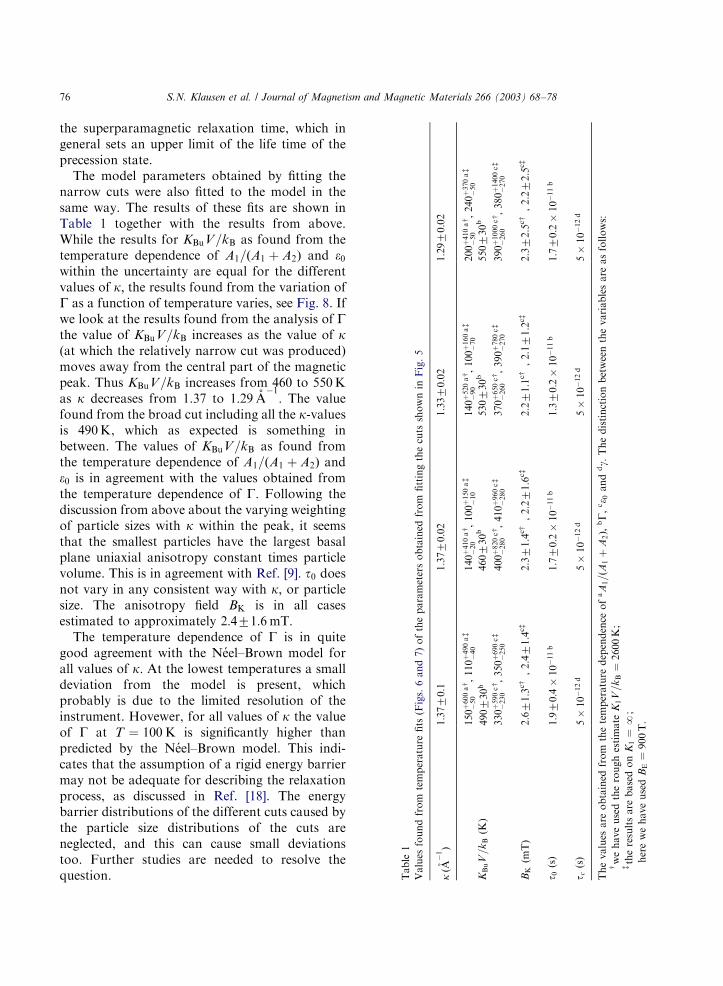
Tab
le1
Valu
esfo
un
dfr
om
tem
per
atu
refi
ts(F
igs.
6an
d7)
of
the
para
met
ers
ob
tain
edfr
om
fitt
ing
the
cuts
sho
wn
inF
ig.
5
kð( A
�1Þ
1:3
77
0:1
1:3
77
0:0
21:3
37
0:0
21:2
97
0:0
2
150þ
600
a�
50
w ,110þ
490
a�
40
z140þ
410
a�
20
w ,100þ
150
a�
10
z140þ
520
a�
90
w ,100þ
160
a�
70
z200þ
410
a�
50
w ,240þ
370
a�
50
z
KB
uV=k
B(K
)4907
30
b4607
30
b5307
30
b5507
30
b
330þ
590
c�
230
w ,350þ
690
c�
250
z400þ
820
c�
280
w ,410þ
960
c�
280
z370þ
650
c�
260
w ,390þ
780
c�
270
z390þ
1000
c�
260
w ,380þ
1400
c�
270
z
BK
(mT
)2.67
1.3
cw�
,2.47
1.4
cz�
2.37
1.4
cw�
,2.27
1.6
cz�
2.27
1.1
cw�
,2.17
1.2
cz�
2.37
2.5
cw�
,2.27
2.5
cz�
t 0(s
)1:97
0:4�
10�
11
b1:77
0:2�
10�
11
b1:37
0:2�
10�
11
b1:77
0:2�
10�
11
b
t c(s
)5�
10�
12
d5�
10�
12
d5�
10�
12
d5�
10�
12
d
Th
evalu
esare
ob
tain
edfr
om
the
tem
per
atu
red
epen
den
ceo
faA
1=ð
A1þ
A2Þ;
bG;
ce 0
an
ddg:
Th
ed
isti
nct
ion
bet
wee
nth
evari
ab
les
are
as
follo
ws:
ww
eh
ave
use
dth
ero
ugh
esti
mate
K1V=k
B¼
2600
K;
zth
ere
sult
sare
base
do
nK
1¼
N;
�h
ere
we
have
use
dB
E¼
900
T:
S.N. Klausen et al. / Journal of Magnetism and Magnetic Materials 266 (2003) 68–7876
the superparamagnetic relaxation time, which ingeneral sets an upper limit of the life time of theprecession state.
The model parameters obtained by fitting thenarrow cuts were also fitted to the model in thesame way. The results of these fits are shown inTable 1 together with the results from above.While the results for KBuV=kB as found from thetemperature dependence of A1=ðA1 þ A2Þ and e0
within the uncertainty are equal for the differentvalues of k; the results found from the variation ofG as a function of temperature varies, see Fig. 8. Ifwe look at the results found from the analysis of Gthe value of KBuV=kB increases as the value of k(at which the relatively narrow cut was produced)moves away from the central part of the magneticpeak. Thus KBuV=kB increases from 460 to 550 Kas k decreases from 1.37 to 1:29 (A
�1: The value
found from the broad cut including all the k-valuesis 490 K, which as expected is something inbetween. The values of KBuV=kB as found fromthe temperature dependence of A1=ðA1 þ A2Þ ande0 is in agreement with the values obtained fromthe temperature dependence of G: Following thediscussion from above about the varying weightingof particle sizes with k within the peak, it seemsthat the smallest particles have the largest basalplane uniaxial anisotropy constant times particlevolume. This is in agreement with Ref. [9]. t0 doesnot vary in any consistent way with k; or particlesize. The anisotropy field BK is in all casesestimated to approximately 2:471:6 mT:
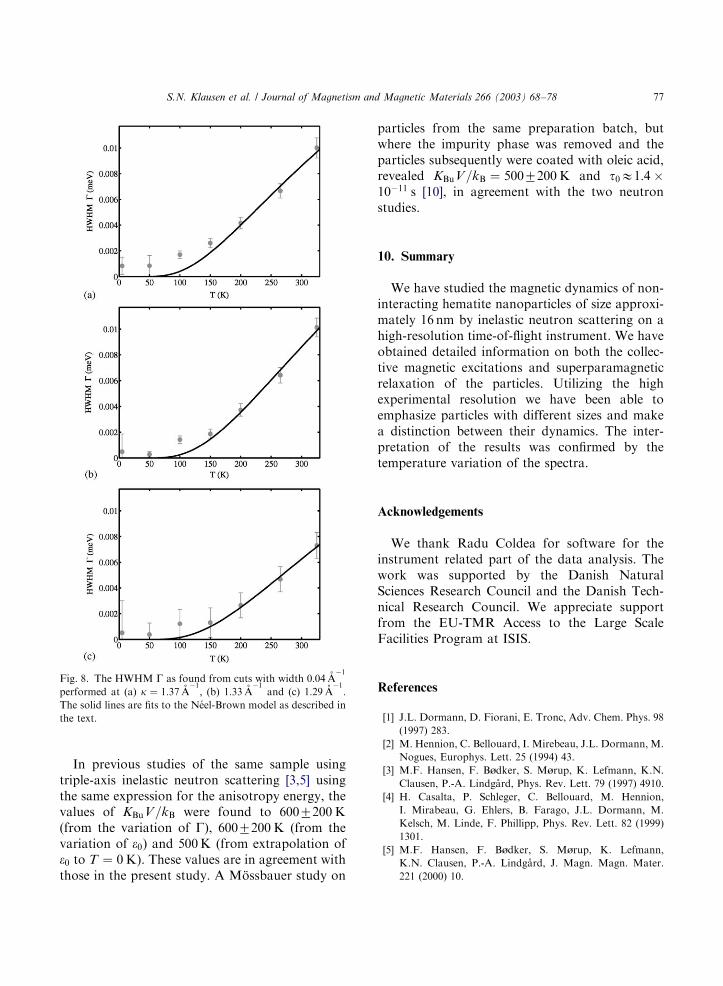
The temperature dependence of G is in quitegood agreement with the N!eel–Brown model forall values of k: At the lowest temperatures a smalldeviation from the model is present, whichprobably is due to the limited resolution of theinstrument. Hovewer, for all values of k the valueof G at T ¼ 100 K is significantly higher thanpredicted by the N!eel–Brown model. This indi-cates that the assumption of a rigid energy barriermay not be adequate for describing the relaxationprocess, as discussed in Ref. [18]. The energybarrier distributions of the different cuts caused bythe particle size distributions of the cuts areneglected, and this can cause small deviationstoo. Further studies are needed to resolve thequestion.
ARTICLE IN PRESS
Fig. 8. The HWHM G as found from cuts with width 0:04 (A�1
performed at (a) k ¼ 1:37 (A�1; (b) 1:33 (A
�1and (c) 1:29 (A
�1:
The solid lines are fits to the N!eel-Brown model as described in
the text.
S.N. Klausen et al. / Journal of Magnetism and Magnetic Materials 266 (2003) 68–78 77
In previous studies of the same sample usingtriple-axis inelastic neutron scattering [3,5] usingthe same expression for the anisotropy energy, thevalues of KBuV=kB were found to 6007200 K(from the variation of G), 6007200 K (from thevariation of e0) and 500 K (from extrapolation ofe0 to T ¼ 0 K). These values are in agreement withthose in the present study. A M .ossbauer study on
particles from the same preparation batch, butwhere the impurity phase was removed and theparticles subsequently were coated with oleic acid,revealed KBuV=kB ¼ 5007200 K and t0E1:4 �10�11 s [10], in agreement with the two neutronstudies.
10. Summary
We have studied the magnetic dynamics of non-interacting hematite nanoparticles of size approxi-mately 16 nm by inelastic neutron scattering on ahigh-resolution time-of-flight instrument. We haveobtained detailed information on both the collec-tive magnetic excitations and superparamagneticrelaxation of the particles. Utilizing the highexperimental resolution we have been able toemphasize particles with different sizes and makea distinction between their dynamics. The inter-pretation of the results was confirmed by thetemperature variation of the spectra.
Acknowledgements
We thank Radu Coldea for software for theinstrument related part of the data analysis. Thework was supported by the Danish NaturalSciences Research Council and the Danish Tech-nical Research Council. We appreciate supportfrom the EU-TMR Access to the Large ScaleFacilities Program at ISIS.
References
[1] J.L. Dormann, D. Fiorani, E. Tronc, Adv. Chem. Phys. 98
(1997) 283.
[2] M. Hennion, C. Bellouard, I. Mirebeau, J.L. Dormann, M.
Nogues, Europhys. Lett. 25 (1994) 43.
[3] M.F. Hansen, F. B^dker, S. M^rup, K. Lefmann, K.N.
Clausen, P.-A. Lindg(ard, Phys. Rev. Lett. 79 (1997) 4910.
[4] H. Casalta, P. Schleger, C. Bellouard, M. Hennion,
I. Mirabeau, G. Ehlers, B. Farago, J.L. Dormann, M.
Kelsch, M. Linde, F. Phillipp, Phys. Rev. Lett. 82 (1999)
1301.
[5] M.F. Hansen, F. B^dker, S. M^rup, K. Lefmann,
K.N. Clausen, P.-A. Lindg(ard, J. Magn. Magn. Mater.
221 (2000) 10.
ARTICLE IN PRESS
S.N. Klausen et al. / Journal of Magnetism and Magnetic Materials 266 (2003) 68–7878
[6] K. Lefmann, F. B^dker, S.N. Klausen, M.F. Hansen,
K.N. Clausen, P.-A. Lindg(ard, S. M^rup, Europhys. Lett.
54 (2001) 526.
[7] S.N. Klausen, P.-A. Lindg(ard, K. Lefmann, F. B^dker,
S. M^rup, Phys. Stat. Sol. A 189 (2002) 1039.
[8] A.H. Morrish, Canted antiferromagnetism, Hematite,
World Scientific, Singapore, 1994.
[9] F. B^dker, S. M^rup, Europhys. Lett. 52 (2000) 217.
[10] F. B^dker, M.F. Hansen, C.B. Koch, K. Lefmann,
S. M^rup, Phys. Rev. B 61 (2000) 6826.
[11] L. N!eel, Ann. G!eophys 5 (1949) 99;
W.F. Brown Jr., Phys. Rev. 130 (163) 1677.
[12] P.A. Lindg(ard, R.J. Birgeneau, J. Als-Nielsen, H.J.
Guggenheim, J. Phys. C: Solid State Phys. 8 (1975) 1059.
[13] G.L. Squires, Introduction to the theory of thermal
Neutron scattering, Dover Publications, New York, 1996.
[14] M.F. Hansen, Magnetic properties of systems of magnetic
particles, Ph.D. Thesis, Technical University of Denmark,
Kgs. Lyngby, 1998.
[15] M.F. Hansen, C. Bender Koch, S. M^rup, Phys. Rev. B 62
(2000) 1124.
[16] C.J. Carlile, M.A. Adams, Physica B 182 (1992) 431.
[17] R. Coldea, private communications.
[18] P.-A. Lindg(ard, Acta Phys. Polonica A 91 (1997) 121.


