Embed Size (px)
Citation preview

arX
iv:n
ucl-
th/0
1050
52v2
18
Jun
2002
Preprint RM3-TH/01-2
Neutron structure function and inclusive DIS
from 3H and 3He at large Bjorken-xa
M.M. Sargsian(1), S. Simula(2) and M.I. Strikman(3)
(1)Department of Physics, Florida International University, Miami, FL 33199, USA(2)INFN, Sezione Roma III, Via della Vasca Navale 84, I-00146 Roma, Italy
(3)Department of Physics, Pennsylvania State University, University Park, PA 16802, USA
Abstract
A detailed study of inclusive deep inelastic scattering (DIS) from mirror A = 3 nucleiat large values of the Bjorken variable x is presented. The main purpose is to estimatethe theoretical uncertainties on the extraction of the neutron DIS structure functionfrom such nuclear measurements. On one hand, within models in which no modificationof the bound nucleon structure functions is taken into account, we have investigatedthe possible uncertainties arising from: i) charge symmetry breaking terms in thenucleon-nucleon interaction, ii) finite Q2 effects neglected in the Bjorken limit, iii) therole of different prescriptions for the nucleon Spectral Function normalization providingbaryon number conservation, and iv) the differences between the virtual nucleon andlight cone formalisms. Although these effects have been not yet considered in existinganalyses, our conclusion is that all these effects cancel at the level of ≈ 1% for x ∼< 0.75in overall agreement with previous findings. On the other hand we have consideredseveral models in which the modification of the bound nucleon structure functions isaccounted for to describe the EMC effect in DIS scattering from nuclei. It turns outthat within these models the cancellation of nuclear effects is expected to occur onlyat a level of ≈ 3%, leading to an accuracy of ≈ 12% in the extraction of the neutron toproton structure function ratio at x ≈ 0.7 ÷ 0.8. Another consequence of consideringa broad range of models of the EMC effect is that the previously suggested iterationprocedure does not improve the accuracy of the extraction of the neutron to protonstructure function ratio.
PACS numbers: 25.30.Mr; 21.45.+v; 24.83.+p; 24.80.+y
Keywords: Few-nucleon systems; EMC effect; neutron structure function.
aTo appear in Physical Review C.

1 Introduction
The investigation of deep inelastic scattering (DIS) of leptons off the nucleon is an importanttool to get fundamental information on the structure of quark distributions in the nucleon.In the past years several experiments have been performed in order to study the region ofsmall values of the Bjorken variable x ≡ Q2/2Mν, which is dominated by sea quarks andgluons. Recently, experiments at HERA have pushed the measurements at large x to a newhigh-Q2 domain, while dijet measurements at Tevatron have reached the kinematics wherethe knowledge of the quark distributions in the nucleon at x ∼> 0.6 becomes important (fora recent discussion and references see [1]).
One of the major uncertainty in large-x studies comes from a poor knowledge of thed-quark distribution in the nucleon. The reason is that it is very difficult to extract d(x, Q2)from measurements off hydrogen targets: it enters as a correction in case of inclusive electronscattering off the proton at Q2 ≪ M2
W (where MW is the mass of the W -boson), while themeasurements using semi-inclusive e + p → e + π± + X and large-Q2 e± + p → ν(ν) + Xscatterings do not have reached a sufficient degree of statistical accuracy yet. As a result,one has to rely on the extraction of d(x, Q2) from the data involving DIS off the deuteron.
On the theoretical side the predictions for the behavior of the ratio d(x, Q2)/u(x, Q2) atx → 1 vary very significantly. The deviations from the SU(6) value d(x, Q2)/u(x, Q2) = 0.5could come either from non-perturbative effects, which could lead, as suggested firstly byFeynman [2], to d(x, Q2)/u(x, Q2) → 0 (corresponding to F n
2 (x, Q2)/F p2 (x, Q2) → 1/4) at
x → 1 [3] or from the hard scattering (perturbative QCD) mechanism, yielding d(x, Q2)/u(x, Q2) →1/5 (corresponding to F n
2 (x, Q2)/F p2 (x, Q2) → 3/7 ≃ 0.43) at x → 1 [5]. Thus experimental
data on F n2 (x, Q2)/F p
2 (x, Q2) at large x have a high degree of theoretical significance.The first extraction of the ratio F n
2 (x, Q2)/F p2 (x, Q2) from the SLAC DIS p(e, e′)X
and D(e, e′)X data (see [6](a) and references therein) used the West procedure [7], which isbased on a covariant electron-deuteron scattering formalism with the interacting nucleon off-mass-shell and the spectator nucleon on-mass-shell. Such a procedure leads to the so-calledWest correction σtot(γ
∗ + d)/(σtot(γ∗ + p) + σtot(γ
∗ + n)) < 1 in the impulse approximation(the numerical value of this ratio is around 0.980 ÷ 0.985). The application of the Westprocedure has provided a limiting value (F n
2 /F p2 )|x→1 ≈ 1/4, which has been adopted in
most of the global fits of parton distribution functions (PDF ’s) (see, e.g., [8, 9, 10, 11]).Later [12, 13] it was pointed out that the West correction leads to a violation of the Gross-Llewellyn Smith (baryon charge) sum rule, because of the neglect of relativistic correctionsin the normalization of the deuteron wave function in Ref. [7]. Furthermore it was pointedout in [12] that modeling the deuteron wave function with one on-mass-shell- and one off-mass-shell nucleon without taking into account other degrees of freedom unavoidably leadsto the violation of the energy-momentum sum rule, which expresses the requirement thatthe sum of the light cone fractions carried by all partons adds up to 1. Then an alternativelight-cone (LC) formalism was suggested [14] which satisfies both the baryon charge andthe momentum sum rules. Both the Virtual Nucleon Convolution (V NC) model [12] andthe LC formalism [14] lead to an enhancement of F D
2 (x, Q2) at large x as compared to the
2

SLAC procedure and hence to a further decrease of the extracted value of the n/p ratio,F n
2 /F p2 , at large x.
The discovery of the EMC effect [15] has clearly indicated gross deviations of the F A2 /FD
2
ratio from the predictions based on the Fermi motion approximation in the kinematicalregions at large x relevant for the extraction of F n
2 /F p2 from the deuteron inclusive data.
This led immediately to the conclusion [16] that the value of F n2 /F p
2 extracted by SLACwas underestimated. Therefore an approximate procedure, which was argued to depend onlymarginally on the details of the EMC effect [16, 17, 18], was suggested for x ∼< 0.7. Theuse of this procedure by the SLAC experimental group [19] has confirmed the conclusionof Ref. [16], finding that the value of F n
2 /F p2 at x ≈ 0.7 may be much closer to the pQCD
asymptotic value of 3/7 ≃ 0.43.Over the years a number of further studies of deuteron structure functions have been
performed using the V NC model [20] and most of them have adopted the normalizationof the deuteron wave function of Ref. [12]. Some of these studies have included also piondegrees of freedom to fix the momentum sum rule problem. Other studies have consideredoff-mass-shell effects in the structure function of the interacting virtual nucleon. Within thelatter the issue of the extraction of the ratio F n
2 /F p2 was analyzed in Ref. [21], where the
extracted values for the n/p ratio at x ∼< 0.7 turned out to be very similar to the findings ofRefs. [19, 18].
It should be also mentioned that quite recent analyses [1, 22] of leading and highertwists in proton and deuteron DIS data have found that the latter are consistent with asignificant enhancement of the d-quark distribution at large x with respect to the standardPDF behavior of d/u → 0.
The realization that the extraction of the large-x n/p ratio from deuteron DIS data isinherently model dependent has led to the suggestion of two new strategies. One is the useof the tagged semi-inclusive processes off the deuteron [23, 24], which require the detectionof a low momentum proton (p ∼< 150MeV/c). The other one is the determination of theDIS structure functions of mirror A = 3 nuclei [25, 26]. In the former one can tag themomentum of the struck neutron by detecting the slow recoiling proton; in this way it ispossible to select initial deuteron configurations in which the two nucleons are far apart, sothat the struck nucleon can be considered as free. In principle, one can use here an analog ofthe Chew-Low procedure for the study of scattering off a pion [27] and extrapolate the crosssection to the neutron pole. The neutron structure function can then be extracted directlyfrom the semi-inclusive deuteron cross section without significant nuclear model dependence[23, 24]. In the latter one tries to exploit the mirror symmetry of A = 3 nuclei; in otherwords, thanks to charge symmetry, one expects that the magnitude of the EMC effect in3He and 3H
RAEMC(x, Q2) ≡ F A
2 (x, Q2)
F D2 (x, Q2)
F p2 (x, Q2) + F n
2 (x, Q2)
ZF p2 (x, Q2) + NF n
2 (x, Q2)(1)
3

is very similar and hence the so called super-ratio [25]
SREMC(x, Q2) ≡ R3HeEMC(x, Q2)
R3HEMC(x, Q2)
=F
3He2 (x, Q2)
F3H2 (x, Q2)
2F n2 (x, Q2) + F p
2 (x, Q2)
2F p2 (x, Q2) + F n
2 (x, Q2), (2)
should be very close to unity regardless of the size of the EMC ratios itself [25, 26]. Ifthis is true, the n/p ratio could be extracted directly from the ratio of the measurements ofthe 3He to 3H DIS structure functions without significant nuclear modifications. However,it should be pointed out that, even if charge symmetry were exact, the motion of protonsand neutrons in a non isosinglet nucleus (let’s say 3He) is somewhat different due to thespin-flavor dependence of the nuclear force.
The aim of this paper is to perform explicit calculations of the EMC effect for both3He and 3H targets, taking properly into account the motion of protons and neutrons inmirror A = 3 nuclei. We explore in greater details the V NC model used in [25, 26] inorder to analyze the effects of: i) charge symmetry breaking terms in the nucleon-nucleon(NN) interaction; ii) finite Q2 effects in the impulse approximation; iii) the role ofdifferent prescriptions for the nucleon Spectral Function normalization providing baryonnumber conservation; and iv) the role of different PDF sets. Additionally we comparethe predictions of the V NC model and the LC formalism in the approximation where nobound nucleon modification is taken into account. It will be shown that the inclusion ofthese additional effects leaves the super-ratio (2) close to unity within 1% only for x ∼< 0.75,confirming therefore the findings of Refs. [25] and [26], where deviations of the order of 2%and 1% were found, respectively.
However, it is well known that the V NC model underestimates significantly the EMCeffect at large x. Also, if the VNC model is adjusted to satisfy the momentum sum rule byadding pionic degrees of freedom, it leads to a significant enhancement of the qA/qN ratio atx ∼> 0.1, where a suppression is observed experimentally [28]. Moreover, the V NC model isjust one of the many models of the EMC effect. Similarly the LC formalism without boundnucleon modifications strongly disagrees with data at large x. Hence, to provide a moreconservative estimate of the possible range of deviations of the super-ratio from unity wewill also investigate carefully various models of the EMC effect which interpret this effectas due to modification of the wave function of either individual nucleons or two nucleoncorrelations. We will show that the cancellation of the nuclear effects in the super-ratio (2)within the broad range of the models considered occurs only at the level of ≈ 3%, restrictingsignificantly (up to ≈ 12%) the accuracy of the extraction of the free n/p ratio from theratio of the measurements of the 3He to 3H DIS structure functions.
In this work we will not address all the EMC models predicting possible deviations fromthe convolution formula at large x. We feel however that it’s worthwhile to mention at leastfew of them. An important issue in modeling the EMC effect is the possible role of finalstate interaction effects even in the Bjorken limit. Though these effects are absent if thescattering process is formulated directly in terms of parton degrees of freedom, the finalstate interactions may be present in the case of a two stage descriptions, where the nucleusis described as a system of hadrons and next the scattering off the parton constituents of the
4

hadrons is considered. However, it is very difficult to obtain safe estimates of such an effect,and therefore we have not included it in the present work. Another issue is the polarizabilityof the nucleon into ∆(1232) components, which contributes to three-nucleon forces addinga ≃ 10% correction to the binding energy of the three-nucleon system. Consequently, itmay be possible that at large x one is not measuring only the nucleon structure function.Note here that the interference among the scattering off ∆-isobar and nucleon is known tobe relevant for the description of the polarized A = 3 structure functions [29]. The role ofthe ∆(1232) component effects in the problem of extraction of the F n
2 /F p2 ratio deserves a
special study, which is beyond the scope of this paper.The plan of this paper is as follows. In Section 2 the formalism needed to evaluate the
nuclear structure functions F A2 (x, Q2) within the V NC model and the LC approximation is
presented. All the necessary inputs for a realistic estimate of the basic nuclear ingredient,namely the invariant nucleon Spectral Function and its proper normalization, are discussed.In Section 3 both the nuclear EMC effect and the super-ratio in mirror A = 3 nuclei areevaluated adopting the V NC model and the LC approximation, assuming also no modifica-tion of the bound nucleon structure functions. Section 4 is devoted to estimate the deviationsof the super-ratio SREMC(x, Q2) from unity in several models of the EMC effect, in whichmodifications of the bound nucleon structure functions are considered. The issue of theextraction of the n/p ratio from the measurement of the ratio of the mirror A = 3 struc-ture functions is fully analyzed in Section 5. Our main conclusions are then summarized inSection 6.
2 Basic Formalism for Inclusive DIS from Nuclei
There exist a number of treatments in the literature. However some of them do large Q2
approximations right away, do not specify completely a prescription for treating off-mass-shell effects in the amplitude of virtual photon-nucleon interaction, etc. Hence we find itnecessary in this Section to rederive the basic formulae needed for the evaluation of thenuclear structure function F A
2 (x, Q2) within the V NC model and the LC approach at finiteQ2.In both cases no modification of the bound nucleon structure functions will be considered.We will refer to these approximations as convolution approximations.
2.1 Virtual Nucleon Convolution Model
The cross section for the inclusive A(e, e′)X reaction can be written in the following generalform
dσ
dE ′edΩ′
e
=E ′
e
Ee
α2
q4ηµν W µν
A , (3)
where ηµν ≡ 12Tr(k2γµk1γν) is the leptonic tensor, k1 ≡ (Ee, ~k1) and k2 ≡ (E ′
e,~k2) are the four-
momenta of the incident and scattered electrons, respectively, and W µνA is the electromagnetic
5

tensor of the target, viz.
W µνA =
∑
spin,X
〈A | JµA(q) | X〉〈X | Jµ†
A (0) | A〉. (4)
Within the covariant impulse approximation one assumes that the virtual photon inter-acts with a virtual nucleon and the final hadronic state X consists of the product of inelasticγ∗N interaction and the recoil (A − 1)-nucleon system. Based on the Feynman diagramanalysis of this scattering for the electromagnetic nuclear tensor [30] one obtains:
W µνA =
∑
N
∫d4p SN(p) W µν
N . (5)
Here the invariant nucleon Spectral Function in the nucleus is defined as:
SN (p) =∫
d[pA−1] Γ2(p, [pA−1]), (6)
where p is the momentum of the virtual nucleon, [pA−1] denotes internal variables of the resid-ual on-mass-shell (A − 1)-nucleon system and Γ(p, pA−1) is the covariant A → N, (A − 1)vertex function combined with the propagator of the virtual nucleon. Based on the require-ment of baryonic number conservation [30] the nucleon Spectral Function is normalized asfollows:
∫d4p A
p0 − pz
MASN (p) =
∫d4p
Ap0
MASN(p) = 1. (7)
To proceed further, we express the electromagnetic tensor through the two invariant structurefunctions W1 and W2:
W µνj = −W j
1 (pj · q, Q2)
(gµν − qµqν
q2
)
+W j
2 (pj · q, Q2)
M2j
(pµ
j − qµpj · qq2
)(pν
j − qν pj · qq2
), (8)
where j = A, N . Multiplying the left and right sides of Eq. (5) by kµ1 ≡ kµ
1 − qµ k1−/q−(see e.g. [17, 31])b), where k1− = ǫ1 − k1z and q− = q0 − qz, and considering the limit ofǫ1, k1 → ∞ with both Q2 and q0 fixed, one obtains
W A2 (Q2, ν) =
∑
N
∫d4p S(p) W N
2 (Q2, w)
[1
M2(1 + cosδ)2(p− + q−
Mν ′
Q2)2 +
p2⊥
2M2sin2δ
], (9)
where sinδ =√
Q2/|~q|, p− = p0 − pz, ν ′ = p · q/M and w2 = (p + q)2. Because of theoff-shellness of the interacting nucleon one has p2 6= M2. Contracting Eq. (5) with the unitvector nµ = (0, 0, 0, ny) one has
W A1 (Q2, ν) =
∑
N
∫d4p SN(p)
W N
1 (Q2, w) +p2⊥
2M2W N
2 (Q2, w)
. (10)
bNote that kµ1
automatically fulfills the current conservation q · Jj = 0 and k−
1= 0.
6

The inclusive cross section (3) can be expressed through the structure function W A2 and
W A1 in a standard way:
dσ
dEe′dΩe′= σMott
W A
2 (Q2, ν) + 2tan2(θe
2) W A
1 (Q2, ν)
. (11)
In case of DIS one introduces the usual scaling functions:
F j1 = MW j
1 ,
F j2 = νW j
2 , (12)
where j = A, N . Using Eq. (12) in Eqs. (9,10,11) one gets:
dσ
dEe′dΩe′= σMott
1
ν
F A
2 (x, Q2) +2ν
Mtan2(
θe
2)F A
1 (x, Q2)
, (13)
where x = Q2
2Mνand
F A1 (x, Q2) =
∑
N
∫d4p SN (p)
F N
1 (x, Q2) +p2⊥
2Mν ′F N
2 (x, Q2)
, (14)
F A2 (x, Q2) =
∑
N
∫d4p SN (p) F N
2 (x, Q2)ν
ν
[1
M2(1 + cosδ)2(p− + q−
Mν ′
Q2)2
+p2⊥
2M2sin2δ
], (15)
where ν = (w2 + Q2 − M2)/2M = ν ′ + (p2 − M2)/2M and x = Q2/2Mν. Note that withsuch a definition of the argument of Fj(x, Q2) it is ensured that the cross section is vanishingbelow the threshold for the eD → e′pn reaction.
2.1.1 The Nuclear Structure Function F A2 (x, Q2)
In this subsection we will discuss the DIS structure function F A2 (x, Q2) in more detail. Let’s
introduce the scaling variables
z =Ap−MA
,
αq =Aq−MA
, (16)
and make use of the identity d4p = 12dp+dp−d2p⊥; then, Eq. (15) can be written as
F A2 (x, Q2) =
1
2
∑
N
∫dp+dp−d2p⊥dz SN(p) F N
2 (x, Q2)ν
νδ(z − Ap−
MA)
·[(MA
AM)2(1 + cosδ)2(z + αq
Mν ′
Q2)2 +
p2⊥
2M2sin2δ
]. (17)
7

The integration over dp− can be taken automatically, while the integration over p+, whichdescribes the virtuality of the interacting nucleon, requires the knowledge of the invariantnucleon Spectral Function. One can proceed however by observing that the virtuality of theinteracting nucleon depends on the structure of the recoil (A − 1)-nucleon system. Namelyfor the case of two-body break-up the invariant Spectral Function contains the δ(p+ − p+0)function with
p+0 = MA − (MfA−1)
2 + p2⊥
(A − z)MA/A, (18)
where MfA−1 is the mass of the recoiling A− 1 nucleus. In case of the excitation of the recoil
nuclear system into its continuum, one can use the observation, based on the multinucleoncorrelation model [33], that for different ranges of z the dominant value of p+ in SN(p)depends on whether the interacting nucleon is in the nuclear mean field or in 2N , 3N , etc.correlations. Based on this model we can estimate the integrand in Eq. (17) as
< p+ >= MA − M2A−1 + p2
⊥
(A − z)MA/Aat z ≤ 1.2 ÷ 1.3
< p+ >= MA − MA−2 −M2 + p2
⊥
(2 − z)MA/Aat z > 1.2 ÷ 1.3 (2N correlations)
< p+ >= MA − MA−3 −(2M)2 + p2
⊥
(3 − z)MA/Aat z > 1.7 ÷ 1.8 (3N correlations)
... (19)
Using these approximations we can now integrate Eq. (17) over p+ arriving at:
F A2 (x, Q2) =
∑
N
∫dzd2p⊥ ρN(z, p⊥) F N
2 (< x >, Q2)ν
< ν >
·[(MA
AM)2(1 + cosδ)2(z + αq
M < ν ′ >
Q2)2 +
p2⊥
2M2sin2δ
], (20)
where
< x > =Q2
2M < ν >,
< ν > =w2 + Q2 − M2
2M,
w2 = Q2 +1
2
MA
A(p+αq + zq+) +
MA
Ap+z − p2
⊥,
< ν′ > =1
2M(p+q− + p−q+) =
MA
AM[p+αq + q+z] , (21)
and p+ here defined according to Eqs. (18, 19). In Eq. (20) ρN(z, p⊥) is the one-bodydensity function in the nucleus, defined as:
ρN(z, p⊥) =1
2
∫dp−dp+ SN (p0, pz, p⊥)δ(z − p0 − pz
MA/A)
8

=MA
A
∫dp0 SN(p0, p0 − z
MA
A, p⊥). (22)
2.1.2 The Bjorken Limit
Equation (20) allows to calculate the inelastic A(e, e′)x reaction in a wide range of values ofQ2, i.e. large enough that the condition for the closure over final hadronic states is achievedand the impulse approximation is valid. Additionally, in DIS the range of the Bjorken xshould correspond to the valence region (x > 0.2÷0.3) where shadowing effects are negligible.In the Bjorken limit, where Q2, q → ∞ and x is kept fixed, Eq. (17) transforms to the usualconvolution formula used by many authors [25, 30, 32, 34, 35]:
F A2 (x, Q2) =
A∑
N=1
∫ A
xdz z fN(z) F N
2 (x
z, Q2), (23)
where fN(z) is the nucleon light-cone momentum distribution in the nucleus
fN(z) =∫
d2p⊥ ρN (z, p⊥), (24)
with the baryon charge normalization condition given by Eq. (27).Introducing the compact notation fN⊗F N
2 to indicate the convolution (23) and assumingexact nuclear charge symmetry, the 3He and 3H DIS structure functions can be written as
F3He2 = S ⊗ (2F p
2 + F n2 ) + D ⊗ (2F p
2 − F n2 ),
F3H2 = S ⊗ (2F n
2 + F p2 ) + D ⊗ (2F n
2 − F p2 ), (25)
where
S(z) ≡ f p(z) + fn(z)
2,
D(z) ≡ f p(z) − fn(z)
2, (26)
with f p(n)(z) being the light-cone momentum distribution of proton (neutron) in 3He. IfD(z) ≃ 0 [i.e. f p(z) ≃ fn(z)], then it is reasonable to expect that the EMC ratios (1)in 3He and 3H are quite close each other, so that the super-ratio (2) is close to unity, asobserved in Ref. [25]. However, as it will be illustrated in detail in the next subsection, thespin-flavor dependence of the nuclear force (even without any charge-symmetry and charge-independence breaking terms) yield f p(z) 6= fn(z). Therefore, when D(z) 6= 0, the differencein the proton and neutron structure function [leading to 2F p
2 − F n2 6= 2F n
2 − F p2 in Eq. (25)]
can give rise to R3HeEMC 6= R
3HEMC and correspondingly to deviations of the super-ratio (2) from
unity depending on the size of the EMC effect itself. It is important to note that the nuclear
charge symmetry will not limit such deviations.
9

2.2 Nuclear Density Function and LC Momentum Distribution in
the V NC Model
Now we further analyze the one-body density function ρN (z, p⊥) and the light-cone momen-tum distribution fN(z). From Eqs. (7) and (22) one obtains the following normalization forthe one-body density function [30]:
∫d2p⊥
∫ A
0dz z ρN (z, p⊥) =
∫ A
0dz z fN(z) = 1. (27)
To construct the one-body density function and subsequently the light-cone momentumdistribution we have to relate the invariant Spectral Function SN (p) to the non-relativisticSpectral Function P N(p, E), which represents the joint probability to find in the nucleus anucleon with three-momentum p = |~p| and removal energy E. Since the latter is defined asE ≡ EA−EA−1+E∗
A−1 [E∗A−1 being the (positive) excitation energy of the system with (A−1)
nucleons measured with respect to its ground-state, and EA (EA−1) the binding energy ofthe nucleus A (A − 1)], the nucleon Spectral Function also represents the probability that,after a nucleon with momentum p is removed from the target, the residual (A − 1)-nucleonsystem is left with excitation energy E∗
A−1.Since the (non-relativistic) nucleon Spectral Function P N(p, E) is normalized as
4π∫ ∞
Emin
dE∫ ∞
0dp p2 P N(p, E) = 1, (28)
where Emin ≡ EA−EA−1 is the minimum value of the removal energy, one has some ambiguityin the relation between SN(p) and P N(p, E). Two ansatz were suggested to relate SN(p)and P N(p, E) which can be considered to represent two extremes. In one [17, 30, 31] it isassumed that
SN(p) =MA
Ap0
· P N(p, E). (29)
In this case the non-relativistic transition from SN (p) to P N(p, E) is straightforward, sincein this limit one has (MA/Ap0) →≈ 1, and hence the renormalization is the smallest forsmall nucleon momenta. Another ansatz assumes [35] that renormalization is momentumindependent so that
SN(p) ≈ CN · PN(p, E), (30)
where CN can be found from the requirement given by Eq. (7). In this prescription fN(z)reads explicitly as
fN(z) = 2πMCN
∫ ∞
Emin
dE∫ ∞
pmin(z,E)dp p P N(p, E)
M√M2 + p2
, (31)
where pmin(z, E) is given by
pmin(z, E) =1
2
(MA − Mz)2 − (MfA−1)
2
MA − Mz, (32)
10

with MA = A ·M + EA and MfA−1 = MA−1 + E −Emin. Note that the normalization factor
CN can be different for protons and neutrons, in line with the normalization factor appearingin Eq. (29).
For a generic nucleus with A > 2 the nucleon Spectral Function can be written as (cf.,e.g., [33, 35])
P N(p, E) = P N0 (p, E) + P N
1 (p, E), (33)
where P N0 (p, E) includes the contributions of all the final states belonging to the discrete
spectrum of the (A − 1)-nucleon system (basically its ground and one-hole states), whileP N
1 (p, E) corresponds to more complex final configurations (i.e. the final states of the con-tinuum spectrum of the (A−1)-nucleon system), which are mainly 1p-2h states arising fromthe 2p-2h excitations generated in the target ground state by short-range and tensor NNcorrelations. In what follows we will refer to P N
0 and P N1 as the ground and correlated parts
of the nucleon Spectral Function, respectively.The nucleon momentum distribution nN(p) can be simply obtained from the nucleon
Spectral Function by integrating over the removal energy; thus, Eq. (33) implies that nN(p)can be written as the sum of two components related to the ground and correlated parts ofP N(p, E), respectively, viz.
nN (p) ≡∫ ∞
Emin
dE P N(p, E) = nN0 (p) + nN
1 (p). (34)
Useful parameterizations of the results of many-body calculations of nN (p), available forfew-nucleon systems, complex nuclei and nuclear matter, as well as its decomposition (34)into nN
0 (p) and nN1 (p) can be read off from Ref. [33](b).
As it is well known, the calculation of P N(p, E) for A > 2 requires the knowledge ofa complete set of wave functions for (A − 1) interacting nucleons. Thus, since the latterones should be obtained from many-body calculations using realistic models of the NNinteraction, the evaluation of P N(p, E) represents a formidable task. In case of 3He thenucleon Spectral Function has been obtained using three-body Faddeev [36] or variational[37] wave functions, whereas for A = ∞ the evaluation of P N(p, E) has been performed usingthe orthogonal correlated basis approach [38] and perturbation expansions of the one-nucleonpropagator [39]. Since in this work we are interested in the evaluation of Eqs. (20,23) formirror A = 3 nuclei as well as for A > 3 nuclei, in what follows we will adopt the SpectralFunction model of Ref. [33], which was developed for any value of A and shown to reproducein a very satisfactory way the nucleon Spectral Function in 3He and nuclear matter calculatedwithin many-body approaches using realistic models of the NN interaction.
Let us now briefly describe the (non-relativistic) nucleon Spectral Function adopted incase of 3He and 3H . For the former nucleus the ground component P N
0 (p, E) is given by
P p0 (p, E) = np
0(p) δ[E − E(3He)min ] ,
P n0 (p, E) = 0, (35)
11

where np0(p) is the proton momentum distribution corresponding to the 3He to deuteron
transition and E(3He)min ≃ 5.49 MeV . Note that the ground component P n
0 (p, E) is identicallyvanishing because the residual pp system does not possess any bound states. In case of 3H ,since charge symmetry largely holds for the nuclear wave functions of 3He and 3H , one canwrite:
P n0 (p, E) = R(p) · np
0(p) δ[E − E(3H)min ] ,
P p0 (p, E) = 0, (36)
where np0(p) is the same momentum distribution appearing in Eq. (35). The correction
function R(p), which includes the effects due to charge symmetry and charge independencebreaking terms in the NN (as well as NNN) interaction, turns out to be quite close tounity, namely within 2 ÷ 3% level of accuracy, as it can be estimated from the explicitcalculations of 3He and 3H wave functions carried out in Ref. [41]. For np
0(p) we use thesimple parameterization obtained in Ref. [33](b) in case of the RSC model [40] of the NN
interaction. Note that E(3H)min ≃ 6.26 MeV 6= E
(3He)min because of the different values of the
experimental binding energies of 3He and 3H .As for the correlated part P N
1 (p, E) for 3He we adopt the model of Ref. [33] and theparameterizations of nN=n,p
1 (p) corresponding to the RSC interaction. For 3H we followthe same logic of Eq. (36) and estimate the correction function R(p) from the calculationsof Ref. [41]. An additional difference in the correlated parts may arise from the differentvalues of the threshold for the three-body break-up Ethr (cf. [33]), namely: Ethr = 7.72 and8.48 MeV in 3He and 3H , respectively.
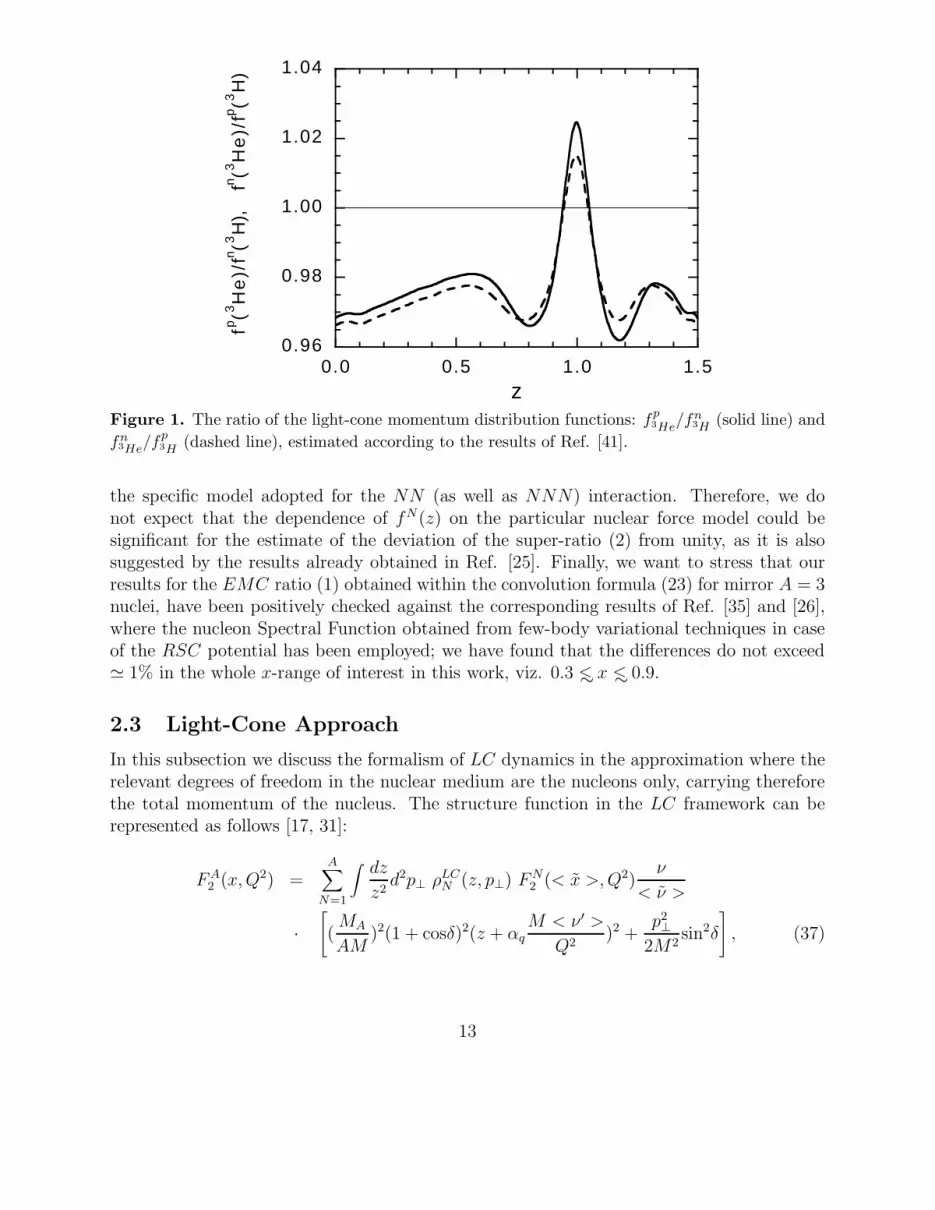
In Fig. 1 we have reported the results for two ratios of light-cone momentum distributionfunctions, namely f p
3He/fn3H (solid line) and fn
3He/fp3H (dashed line), estimated according to
the results of Ref. [41]. It can clearly be seen that the corrections to the charge independencein case of 3He and 3H nuclear wave functions are typically at the level of 2 ÷ 3%.
Next we want to estimate the uncertainty introduced by the above-mentioned normaliza-tion procedures, given by Eqs. (29) and (30). In Fig. 2 we have reported the results of ourcalculation of the proton and neutron light-cone momentum distributions in 3He accordingto Eqs. (30) and (31) (solid and dashed curves for proton and neutron, respectively) andaccording to Eqs. (24) and (29) (solid and dashed curves with circles for proton and neutron,respectively). It turns out that the two different normalization prescriptions can substan-tially differ at small values of the light-cone fraction z and this may represent a potentialsource of uncertainty.
From Fig. 2 it can be seen also that within each normalization prescription f p(z) 6= fn(z).Such a difference is driven by the presence in the three-nucleon wave function of a mixed-symmetry S ′-wave component as well as of P - and D-waves arising from the spin-spin,spin-orbit and tensor terms of the NN interaction, respectively. According to the resultsof sophisticated solutions of the three-nucleon ground states both with and without chargesymmetry (and charge independence) breaking terms [41], the probabilities of the S ′, Pand D partial waves are: PS′ ≃ 1.2 ÷ 1.5%, PP ∼< 0.2% and PD ≃ 7 ÷ 9%, depending on
12
0.96
0.98
1.00
1.02
1.04
0.0 0.5 1.0 1.5
fp (3H
e)/
fn (3H
),
fn (3
He
)/fp (3
H)
zFigure 1. The ratio of the light-cone momentum distribution functions: fp
3He/fn3H (solid line) and
fn3He/f
p3H (dashed line), estimated according to the results of Ref. [41].
the specific model adopted for the NN (as well as NNN) interaction. Therefore, we donot expect that the dependence of fN(z) on the particular nuclear force model could besignificant for the estimate of the deviation of the super-ratio (2) from unity, as it is alsosuggested by the results already obtained in Ref. [25]. Finally, we want to stress that ourresults for the EMC ratio (1) obtained within the convolution formula (23) for mirror A = 3nuclei, have been positively checked against the corresponding results of Ref. [35] and [26],where the nucleon Spectral Function obtained from few-body variational techniques in caseof the RSC potential has been employed; we have found that the differences do not exceed≃ 1% in the whole x-range of interest in this work, viz. 0.3 ∼< x ∼< 0.9.
2.3 Light-Cone Approach
In this subsection we discuss the formalism of LC dynamics in the approximation where therelevant degrees of freedom in the nuclear medium are the nucleons only, carrying thereforethe total momentum of the nucleus. The structure function in the LC framework can berepresented as follows [17, 31]:
F A2 (x, Q2) =
A∑
N=1
∫dz
z2d2p⊥ ρLC
N (z, p⊥) F N2 (< x >, Q2)
ν
< ν >
·[(MA
AM)2(1 + cosδ)2(z + αq
M < ν ′ >
Q2)2 +
p2⊥
2M2sin2δ
], (37)
13

1 0-3
1 0-2
1 0-1
1 00
1 01
0.0 0.5 1.0 1.5
fN(z
)
z
3He
Figure 2. The nucleon light-cone momentum distribution in 3He, corresponding to the RSC
model [40] of the NN interaction, adopted in this work. The dashed and solid lines correspond to
the neutron and proton momentum distribution, respectively. Lines with open circles correspond
to the calculation with the normalization scheme of Eq. (29), and those without open circles to the
normalization scheme of Eq. (30).
where all the quantities in the r.h.s, except ρLCN (z, p⊥), are defined in subsection 2.1.1. In
the Bjorken limit one obtains:
F A2 (x, Q2) =
A∑
N=1
∫ A
x
dz
zfLC
N (z) F N2 (
x
z, Q2), (38)
where fLCN (z) is related to ρLC
N (z, p⊥) according to Eq. (24). The quantity ρLCN (z, p⊥) rep-
resents the nucleon LC density matrix in the nuclear medium. This function satisfies twosum rules; namely, from baryon charge conservation one has
∫dz
zd2p⊥ ρLC
N (z, p⊥) = 1 , (39)
while the momentum sum rule requires
∫dz
zd2p⊥ zρLC
N (z, p⊥) = 1. (40)
Note that the last sum rule is not directly satisfied in the V NC model, but it can be restoredif mesonic degrees of freedom are explicitly introduced.
In general ρLCN (z, p⊥) is not known for nuclei with A ≥ 3. However, for numerical calcu-
lations one can proceed using the two following observations. First, in the non-relativistic
14
limit (applicable for 0.7 ÷ 0.8 ∼< z ∼< 1.2 ÷ 1.3 and p⊥ ∼< kF ≈ 200 ÷ 300MeV/c) the densityρLC
N (z, p⊥) can be related to the non-relativistic nucleon momentum distribution nN(p) as
ρLCN (z, p⊥) |z≈1− pz
M≈ M nN(p). (41)
Second, within the two-nucleon correlation model [33] one can relate the high momentumtail of the nuclear LC density matrix to the two-nucleon density matrix on the light cone[32]:
ρLCN (z, p⊥) ≈ a2(A) ρLC
NN (z, p⊥) =Ek a2(A) nNN (k)
2 − z(42)
where Ek =√
M2 + k2 and [32]
k =
√√√√M2 + p2⊥
z(2 − z)− M2. (43)
The observation [33] that the two-nucleon correlations define the high momentum tail of thenuclear momentum distribution at momenta (> kF ) allows to replace nN(k) in Eq. (42) bya2(A) nNN(k) at k > kF , where a2(A) characterizes the probability to find a two-nucleoncorrelation in the high momentum tail of the nucleon momentum distribution in the nucleusAc. Finally in the kinematical range where two-nucleon correlations dominate the proton-neutron pair, one can replace nNN (k) by the squared LC wave function |ΨD(k)|2 of thedeuteron [32].
The LC many-nucleon approximation for the nuclear wave function leads to a predictionfor the F A
2 /FN2 ratio which qualitatively contradicts the EMC effect for x ∼> 0.5. This
reflects the need to include explicitly non-nucleonic degrees of freedom in nuclei in order toexplain the EMC effect. In the LC approximation a natural explanation is offered by thedeformation of the quark wave function in the bound nucleon which will be considered in thesubsection 4.4. In the following Section we will use the LC model to illustrate the magnitudeof the Fermi motion effects on the super-ratio (2).
3 Numerical Estimates of Inelastic Cross Section
To check the reliability of our assumptions in the derivation of Eq. (20) as well as of themodels used for the three-nucleon Spectral Function, we first compare our calculations withthe experimental data at moderate values of Q2 ∼ 2÷3 (GeV/c)2. At these values of Q2 thenuclear modification of the valence quark distributions (the EMC effect) is expected to besmall and thus the comparison with the data will allow to check the validity of Eqs. (20-22).Figure 3 presents the comparison of our calculations with the experimental data of Ref. [43],where for the nucleon structure function F N
2 (x, Q2) we have used the parameterization of
cAn estimate of a2(A) for a variety of nuclei can be found in Ref. [33].
15

Ref. [6] containing also the contribution of nucleon resonances. For the evaluation of F A1 [see
Eq. (14)] we have used the relation F N1 = F N
2 [1 + (2Mx/ν)]/2x(1 + R) with R = 0.18. Thecomparison clearly demonstrates that Eq. (20) is a good starting point for the discussion ofhigher Q2 regime.
1 0-4
1 0-2
1 00
0.5 1.0 1.5 2.0 2.5
d σ /
dE
e'dΩ
e'
(µb
/ G
eV s
r)
ν (GeV)
Ee = 10.954 GeV, θ
e' = 8o
Q2 = 2.10 (GeV/c)2 @ x = 1
3He(e, e')X
1 0-5
1 0-3
1 0-1
1.2 1.6 2.0 2.4 2.8 3.2d σ
/ d
Ee
'dΩe
' (
µb /
GeV
sr)
ν (GeV)
Ee = 14.696 GeV, θ
e' = 8o
Q2 = 3.65 (GeV/c)2 @ x = 1
3He(e, e')X
Figure 3. The cross section of inclusive 3He(e, e′)X scattering as a function of energy transfer ν.
Dashed line - inelastic contribution calculated according to Eq. (20) and adopting for the nucleon
structure function the parameterization of Ref. [6], which includes nucleon resonances. Dotted line
- quasi-elastic contribution calculated according to Ref. [44]. Solid line - total cross section. The
experimental data (full triangles) are from Ref. [43] and the kinematical conditions are shown in
the insets.
At larger Q2 the first question we want to address is how fast the Bjorken limit isestablished and how much the nuclear recoil effects accounted for in Eq. (20) are important.The finite Q2 effects are governed by the scale of the target-mass corrections (∼ M2/Q2 aswell as the factors proportional to Q2/ν2 and p2
⊥/Q2). In Fig. 4 we compare the resultsobtained for both the EMC ratio and the super-ratio for 3He and 3H targets at Q2 =10 (GeV/c)2, calculated within Eq. (20) and the convolution formula (23). It can clearly beseen that, while for the EMC ratio (1) the convolution formula works within a 2÷ 3% levelof accuracy at large x, in case of the super-ratio (2) the differences between the non-Bjorkenand the Bjorken limits cancel out almost completely.
The next question is the expected uncertainty on the EMC ratio due to the differentnormalization procedures of the nucleon Spectral Function discussed in the previous Section.In Fig. 5 we compare the calculation of RA=3
EMC and SREMC performed within the convolutionapproximation using the two different schemes of normalization given by Eqs. (29) and (30).It can be seen that RA=3
EMC exhibits some sensitivity to the choice of the normalization scheme,while the differences in the calculated SREMC are well below ∼ 1%.
16

0.96
0.98
1.00
1.02
1.04
0.3 0.5 0.7 0.9
REM
C(x
, Q
2)
x
3He,
3H
(a)
0.90
0.92
0.94
0.96
0.98
1.00
1.02
0.3 0.5 0.7 0.9
SREM
C(x
, Q
2)
x
(b)
Bodek
CTEQ
Figure 4. The x dependence of RAEMC (a) and SREMC (b) for 3He and 3H targets at Q2 =
10 (GeV/c)2. Dashed and solid lines are the results obtained using Eq. (20) calculated without
invoking the Bjorken limit, and Eq. (23) using the Bjorken limit, respectively. Lines marked by
crosses correspond to 3H target, unmarked lines to 3He target. In (a) and (b) the CTEQ set
of PDF ’s from Ref. [10] is adopted, while in (b) the results obtained using the parameterization
of Ref. [6] for the nucleon structure function FN2 (x,Q2) are also reported. The charge-symmetry
breaking effects shown in Fig. 1 are included in the calculations.
Next we address the sensitivity of the super-ratio (2) to the particular choice of thePDF parameterization in the nucleon. To this end we have calculated the super-ratio (2)via the convolution formula (23) using the proton and neutron LC momentum distributions(31) with the normalization procedure given by Eq. (30). The RSC model [40] of the NNinteraction adopted in the calculation yields Cn = 1.048 and Cp = 1.033 for the normalizationconstants in Eq. (30). We have neglected the charge-symmetry breaking effects shown in Fig.1 and we have used different parameterizations of the nucleon structure function F N
2 (x, Q2)taken at Q2 = 10 (GeV/c)2, namely the GRV set [11] of PDF ’s and the SLAC fit of Ref.[9]. Both the GRV and SLAC parameterizations are constructed in a such a way that theneutron to proton structure function ratio reaches the ”non-perturbative prediction” 1/4 asx → 1 (see Fig. 6(a)). We have therefore applied to the GRV and SLAC structure functionsan ad hoc modification in the form of a distortion of the d-quark distribution limited only atlarge x (i.e., x ∼> 0.7), viz.: d(x) → d(x) + 0.1x4(1 + x)u(x). Such a modification has beendirectly implemented in the GRV set of PDF ’s, while in case of the SLAC parameterizationwe have considered the following replacements: F p
2 (x, Q2) → F p2 (x, Q2)1 + 0.1x4(1 + x)/4
and F n2 (x, Q2) → F n
2 (x, Q2)1+4 ·0.1x4(1+x). In both cases the n/p ratio of the modifiedstructure functions goes to the ”pQCD prediction” 3/7 ≃ 0.43 as x → 1 (see Fig. 6(a)).Since the proton structure function is dominated at large x by the u-quark distribution, the
17

0.96
0.98
1.00
1.02
1.04
0.3 0.5 0.7 0.9
REM
C(x
, Q
2)
x
3He,
3H
(a)
0.90
0.92
0.94
0.96
0.98
1.00
1.02
0.3 0.5 0.7 0.9
SREM
C(x
, Q
2)
x
(b)
Figure 5. (a) The EMC ratio [Eq. (1)] in 3He (thin lines) and in 3H (thick lines) vs. x at
Q2 = 10 (GeV/c)2. (b) The super-ratio [Eq. (2)] vs. x. Dashed and solid lines correspond to the
results obtained using the normalization schemes of Eqs. (29) and (30), respectively. The CTEQ
set of PDF ’s from Ref. [10] has been adopted as input for the nucleon structure function FN2 (x,Q2).
The charge-symmetry breaking effects shown in Fig. 1 are not included in the calculations.
above-mentioned modification does not change significantly the shape of the proton structurefunction; the effects are larger on the neutron structure function, but by construction theyare limited in the region x ∼> 0.7 (see Fig. 6(a)).
The results obtained for the super-ratio (2) are shown in Fig. 6(b). It can be clearly seenthat the deviation of the super-ratio from unity is small (less than 1%) up to x ≃ 0.75, whileit increases rapidly as x ∼> 0.75 and depends strongly on the large-x behavior of the n/pratio. Our conclusion is that the V NC model predicts a deviation of the super-ratio fromunity within 1% only for x ∼< 0.75 in overall agreement with the results of Refs. [25, 26].Note however that the x-shape and the average value of our results for the super-ratio arecloser to the findings of Ref. [26] (where a Spectral Function similar to the one of the presentwork is adopted) and differs from the results of Ref. [25], where larger deviations (up to2%) from unity were found. It is likely that the difference is related to the different SpectralFunctions used in the present work and in Ref. [25], since the latter uses the V NC modelwith the same normalization scheme [Eq. (29))] for the nucleon LC momentum distribution.
The x-shape of the super-ratio SREMC(x, Q2) shown in Fig. 6(b), can be better under-stood by looking at Fig. 7, where the EMC ratio REMC(x, Q2) in the two mirror A = 3nuclei is separately reported. It can be seen that the convolution approach predicts a largerdeviation from unity in 3H than in 3He for x ∼< 0.75. This is a direct consequence of thehigher kinetic energy of the neutron (proton) with respect to the proton (neutron) in 3He(3H) due to the spin-flavor dependence of the nuclear force [see the discussion after Eq. (25)].
18

0.0
0.2
0.4
0.6
0.8
0.3 0.5 0.7 0.9
F 2
n (x,
Q2)
/ F
2
p (x,
Q2)
x
(a)
0.90
0.92
0.94
0.96
0.98
1.00
1.02
0.3 0.5 0.7 0.9
SREM
C(x
, Q
2)
x
(b)
Figure 6. (a) Neutron to proton structure function ratio, Fn2 (x,Q2)/F p
2 (x,Q2), vs. the Bjorken
variable x at Q2 = 10 (GeV/c)2. The full dots are the NMC data points as given in Ref. [45]. Thick
dashed and solid lines correspond to the GRV set [11] of PDF ’s and to the SLAC parameterization
of Ref. [9]. Thin lines are the modified GRV and SLAC fits, as described in the text. (b) Super-
ratio [Eq. (2)] of the EMC effects in A = 3 mirror nuclei. The meaning of the lines is the same as
in (a). Using the CTEQ parameterization [10] one obtains results very similar to those reported
for the GRV set [11] of PDF ’s.
The super-ratio SREMC(x, Q2) is therefore larger than one up to x ≃ 0.75 (see Fig. 6(b)),but such a deviation from unity is small because the EMC ratio itself is predicted to bequite small in the two mirror nuclei (less than a 1% effect) within the VNCM. For x ∼> 0.75the EMC ratio increases above unity very sharply; generally speaking, this is related tothe fact that the nucleon structure function goes to zero as x → 1, while the nuclear oneis non-vanishing because of the Fermi motion of the nucleons in the nucleus. Moreover, theslope of the rise of REMC(x, Q2) is larger in 3H than in 3He due to the decrease of F n
2 /F p2
at x → 1. Note also that the EMC ratio in 3H is sensitive to the modification of the d/uratio at large x, whereas the EMC ratio in 3He is not (see Fig. 7). Thus, for x ∼> 0.75the super-ratio SREMC(x, Q2) drops below one and becomes a rapidly varying function ofx with a remarkable sensitivity to the large-x shape of the nucleon structure function.
Finally the last source of uncertainty we want to consider within the convolution approx-imations is the difference between the predictions of the V NC model and the LC formalism.In Fig. 8 the predictions for EMC ratio calculated within the V NC model according to Eq.(20) and the normalization scheme of Eq. (29) are compared with the corresponding onesof the LC approach [see Eq. (37)]. In both cases we have adopted the F N
2 parameterizationof Ref. [6] , which contains the contribution of nucleon resonances. As it follows from Fig.8(a) the LC approximation predicts larger value of the EMC ratio as compared with the
19

0.96
0.98
1.00
1.02
1.04
0.3 0.4 0.5 0.6 0.7 0.8 0.9
REM
C(x
, Q
2)
x
3He, 3H
Figure 7. The EMC ratio [Eq. (1)] in 3He (thin lines) and in 3H (thick lines) as predicted by
the convolution formula (23) at Q2 = 10 (GeV/c)2. The solid lines correspond to the SLAC [9]
parameterization of the nucleon structure function, while the dashed lines are the results obtained
using the modified SLAC fit at large x as described in the text. The thin dashed and solid lines
are almost indistinguishable.
V NC model. As a result the super-ratio within the LC approximation is smaller (closerto one) as compared with the prediction of the V NC model. Note also that the effects ofnucleon resonances are still visible in Fig. 8(a) for x ∼> 0.8, corresponding to W < 2 GeV atQ2 = 10 (GeV/c)2. Therefore, if one wants to investigate only the leading twist of the nu-cleon structure function, one can either limit the range of values of x or increase sufficientlythe value of Q2.
To sum up this Section, we conclude that all the considered uncertainties within theconvolution approximation, in which no nuclear modification of bound nucleons is considered,do not yield deviations of the super-ratio (2) from unity larger than 1% at x ∼< 0.75 (2% atx ∼< 0.8).
4 Models of the EMC Effect with Modifications of the
Bound Nucleon Structure Function
Although within the V NC model and the LC approach the nuclear corrections to the super-ratio (2) are ≈ 1% at x ∼< 0.75, it is hardly safe to treat this as an ultimate estimate of thenuclear effects. The V NC model is just one of the many models of the EMC effect. Also,literally, the V NC model predicts the parton densities to violate the momentum sum rule(for instance by ∼ 5% for an iron target). When this feature is fixed by adding mesonic
20

0.96
0.98
1.00
1.02
1.04
0.3 0.5 0.7 0.9
REM
C(x
, Q
2)
x
3He,
3H
(a)
0.90
0.92
0.94
0.96
0.98
1.00
1.02
0.3 0.5 0.7 0.9
SREM
C(x
, Q
2)
x
(b)
Figure 8. (a) The EMC ratio [Eq. (1)] in 3He (thin lines) and in 3H (thick lines) vs. x at
Q2 = 10 (GeV/c)2. (b) The super-ratio [Eq. (2)] vs. x. Dashed and solid lines correspond to the
results obtained using the V NC model and the LC formalism, respectively. The parameterization
of Ref. [6], which includes nucleon resonances, has been adopted as input for the nucleon structure
function FN2 (x,Q2). The charge-symmetry breaking effects shown in Fig. 1 are not included in the
calculations.
(pionic) degrees of freedom, one predicts an enhancement of the antiquark distributions innuclei at x ≥ 0.05 which grossly contradicts the Drell-Yan data [28]. It is also well knownthat the convolution approximations underestimate significantly the EMC effect at large x(cf., e.g., Refs. [17, 35] and [46]). Experimental data are available for a variety of nuclei andin Fig. 9 we have limited ourselves to the cases of 4He and 56Fe. The convolution formulawithin the V NC model (23) has been evaluated adopting for the nucleon Spectral FunctionP N(k, E) the model of Ref. [33] and our results turn out to be in agreement with the findingsof Ref. [35]. From Fig. 9 it can clearly be seen that the convolution approach is not able toreproduce the minimum of the EMC ratio around x ≈ 0.7 as well as the subsequent sharprise at larger x. Note that the disagreement is even larger within the LC approximation (seedashed curves in Fig. 16).
Therefore, it is reasonable to expect that the results of the convolution approximationfor mirror A = 3 nuclei can suffer the same drawback. Moreover it is very important toasses any isospin dependence of EMC effect in order to extract in a reliable way the neutronstructure function from 3He and 3H data. An isospin dependence for EMC effect is naturallyexpected from the differences in the relative motion of pn and nn (pp) pairs in 3H (3He).The results obtained for 3H in Ref. [42] in case of the Argonne V 18 + Urbana IX modelsof the NN and NNN interactions, are reported in Fig. 10. It can clearly be seen that,since the interaction of a pn pair is more attractive than the one of a nn pair, the proton
21

0.85
0.90
0.95
1.00
1.05
1.10
1.15
0.3 0.4 0.5 0.6 0.7 0.8 0.9
R EMC(x
, Q
2)
x
(a) 4He
0.8
0.9
1.0
1.1
1.2
1.3
0.3 0.4 0.5 0.6 0.7 0.8 0.9
R EMC(x
, Q
2)
x
(b) 5 6Fe
Figure 9. The EMC ratio [Eq. (1)] in 4He (a) and 56Fe (b) at Q2 = 10 (GeV/c)2. Open dots
are data from Ref. [46], while in (b) the full squares are from Ref. [47]. The solid lines are the
results of the convolution formula (23), calculated adopting the SLAC [9] parameterization of the
nucleon structure function FN2 (x,Q2) and the model of Ref. [33] for the nucleon Spectral Function
PN (k,E).
is closer to the 3H center-of-mass than the neutron. The corresponding root mean square
radius turns out to be:√
< r2pn > ≃ 2.5 fm and
√< r2
nn > ≃ 2.8 fm. As a consequence,
the overlapping probability is larger for a pn pair than for a nn pair. As a matter of fact,from Fig. 10 it follows that the partially integrated probability to find a NN pair withrNN ≤ 1 fm, is ∼ 40% larger for a pn pair than for a nn pair. We stress that this is a veryimportant isospin effect in mirror A = 3 nuclei.
Thus in order to draw final conclusion about the size of the deviation of the super-ratio
SREMC(x, Q2) from unity we should investigate effects beyond those predicted by the convo-
lution approach.
The discovery of the EMC effect at large x has triggered a huge theoretical effort whichhas led to the development of a large number of models (see, e.g., Refs. [49, 48, 16, 46]and references therein). In this work we will limit ourselves to consider some of thesemodels, which are of interest for an estimate of the possible deviation of the super-ratioSREMC(x, Q2) from unity. We will use the experimental points presented in Fig. 9 in orderto constrain as much as possible the parameters of these models. Note that the experimentaluncertainties on the EMC ratio in 4He are significantly larger than the corresponding onesin 56Fe; therefore, new measurements on 4He targets with reduced errors will certainly helpin improving our knowledge of the EMC effect in light nuclei.
22

0.0
0.1
0.2
0.3
0.4
0.5
0 1 2 3 4 5
gN
N(r
NN)
(f
m-1
)
rNN
(fm)
3H
Figure 10. The distributions gNN (rNN ) of the relative motion of a nn pair (full dots) and of a
pn pair (open squares) in 3H, as a function of the relative distance rNN between the NN pair.
The results reported correspond to the the Argonne V 18 and Urbana IX models of the NN and
NNN interactions, respectively, obtained using the Green Function Monte Carlo method of Ref.
[42]. The distributions are normalized as:∫∞0 drNNgNN (rNN ) = 1.
4.1 Nuclear Density Model
It was argued in [16, 17] that due to a diluteness of the nuclear systems the nuclear effectsfor the deviation of the nuclear structure function from the sum of the nucleon structurefunctions can be treated as a series in the powers of k2/M2 and ǫA/M . This approximationholds in a number of dynamical models, like the rescaling model [48, 49, 50], the six quark(6q) cluster model [51, 52], the color screening model (suppression of small size configurationsin bound nucleons) [16, 17, 53] and pion models [54]. Hence in the region of small enough x(i.e, x ∼< 0.7), where terms ∝ k4/M4 can be neglected, an approximate factorization shouldtake place
RAEMC(x, Q2) − 1 = β(x, Q2) f(A), (44)
where RAEMC(x, Q2) ≡ F A
2 (x, Q2)/[ZF p2 (x, Q2) + NF n
2 (x, Q2)], and
f(A) ∝< k2 > /M2 (45)
or to the average virtuality of the nucleon. Eq. (44) is in a very good agreement withthe SLAC data on the A-dependence of the EMC effect. Numerical estimates using Eqs.(44,45) and realistic deuteron and iron wave functions lead to [16]
F D2 (x, Q2)
F p2 (x, Q2) + F n
2 (x, Q2)− 1 ≈ 1
4
F Fe2 (x, Q2)
F D2 (x, Q2)
− 1. (46)
23

For A ∼> 12 one has approximately < k2 > /M2 ∝< ρA(r) >≡ ρ(A), where ρ(A) is theaverage nuclear matter density, leading to
RAEMC(x, Q2) ≡ RA
EMC(x, Q2)
RDEMC(x, Q2)
= α(x, Q2) [1 + ρ(A)β(x, Q2)] . (47)
Note in passing that such an approximation is definitely not applicable at very large x, sinceshort-range correlations dominate for x ∼> 1 and therefore the relation RA
EMC(x) ∝ ρA isexpected not to hold any more. Also one hardly can directly use this approximation for thedeuteron since the notion of average nuclear density is not well defined in this case.
Analysis of the data on the EMC effect using Eq. (47) (including deuteron and 4Hedata) has been carried out in terms of the average nuclear density ρ(A) in Ref. [46]. Thequantities α(x, Q2) and β(x, Q2) were fitted to the data; their values for various x-bins canbe easily read off from Table IX of [46]. The nuclear density ρ(A) was assumed to be given
by : ρ(A) = 3A/4πR3e where Re =
√5/3 · rc,A, with rc,A representing the r.m.s. electron
scattering (charge) radius of the nucleus. In particular, the values ρ(4He) = 0.089 fm−3
and ρ(56Fe) = 0.117 fm−3 were adopted in [46]. We will refer hereafter to Eq. (47) as thedensity model.
Note that the fit in Eq. (47) has been done in Ref. [46] using charge rather than matterradii of nuclei, which is a good approximation for large A and Z = N nuclei since in thiscase
< r2c,A > = < r2
matter,A > + < r2c,proton > + < r2
c,neutron > (48)
and
< r2matter,A > ≫ < r2
c,proton > , < r2c,neutron > . (49)
For light isosinglet nuclei Eq. (48) is expected to hold. However the predictions of thedensity model for light isosinglet nuclei should have a rather qualitative character since Eq.(49) does not hold for deuteron and barely holds for 4He nucleus. Moreover, the step leadingfrom Eqs. (44,45) to Eq. (47) is not justified.
We have mentioned above that the density model was proposed in Ref. [16] only incase of sufficiently heavy nuclei. If we want to apply Eq. (47) to mirror A = 3 nuclei, thefirst question is which density we have to use. As already observed in Fig. 10, the neutron(proton) is closer to the 3He (3H) center-of-mass than the proton (neutron). This meansthat the neutron (proton) has more kinetic energy of the proton (neutron) in 3He (3H)d.According to the RSC interaction, the neutron in 3He possesses on average about 25%kinetic energy more than the proton. Since the deviation of the EMC ratio from unity maybe related to the mean kinetic energy of the nucleon and to the derivatives of the nucleonstructure function (cf. [17]), we expect a different EMC effect in mirror A = 3 nuclei, driven
dIn what follows we neglect the small isospin violation driven by charge symmetry breaking effects in therelative motion of the pp pair in 3He and of the nn pair in 3H .
24

by the spin-flavor dependence of the NN interaction and by the different quark content ofthe proton and neutron (cf. Fig. 6). In case of A = 3 systems it should be emphasized thatwhat matters ultimately is the matter size and not the charge radius. The relation betweencharge and matter radii for 3He and 3H targets differs from Eq. (48), namely:
< r2c,3He > = < r2
matter,proton > + < r2c,proton > + < r2
c,neutron > /2
< r2c,3H > = < r2
matter,neutron > + < r2c,proton > + 2 < r2
c,neutron >, (50)
where < r2matter,proton > and < r2
matter,neutron > are matter density of proton and neutron in3He. Thus a relation similar to Eq. (48) can be obtained only for the isosinglet combinationof the 3He and 3H targets since in this case < r2
c,(3He+3H)/2 >=< r2matter,(proton+neutron)/2 >
+ < r2c,proton > + 5 < r2
c,neutron > /4, which coincides with Eq. (48) up to the small term< r2
c,neutron > /4.In case of 3He and 3H nuclei we need to account for the fact that it is the difference
between matter radii of proton and neutron in 3He (or in 3H) that should be considered inestimating the different EMC effects for these nuclei within the density model. To be able touse the results of the fit of Ref. [46] one should use for proton (neutron) density ρp(n)(A) =
3A/4πR3p(n), where Rp(n) =
√5/3 · rp(n) and r2
p(n) =< r2matter,proton(neutron) > + r2
0, where the
parameter r0 accounts for the fact that the fit of Ref. [46] is based on the use of the nu-
clear charge radius. For estimation purposes we take r0 ≃√
< r2c,proton > + < r2
c,neutron > ≃0.7 fm.
Using these densities one can now estimate the EMC effects within the density model,modifying the Eq. (47) as follows:
R3HeEMC ≈ α
(1 + β
2ρpFp2 (x, Q2) + ρnF n
2 (x, Q2)
2F p2 (x, Q2) + F n
2 (x, Q2)
)
R3HEMC ≈ α
(1 + β
2ρpFn2 (x, Q2) + ρnF p
2 (x, Q2)
2F n2 (x, Q2) + F p
2 (x, Q2)
)(51)
In Fig. 11 the predictions of the density model (47) for both the EMC ratio and thesuper-ratio are reported and compared with the results of the V NC model. For proton
and neutron matter radii we adopt the values√
< r2matter,proton > = 1.75 ± 0.03 fm and
√< r2
matter,neutron > = 1.55 ± 0.04 fm, obtained from the results of Refs. [55, 56, 57].Since in this simple model we neglect small effects of the isospin violation which couldlead to < r2
matter,proton 6= (3He) 6=< r2matter,neutron > (3H), the above results correspond to:
ρp(3He) = ρn(3H) ≃ 0.050 fm−3 and ρn(3He) = ρp(
3H) ≃ 0.068 fm−3.It can be seen from Fig. 11 that the deviation of the EMC ratios from unity is different
for 3He and 3H targets by approximately the same amount in percentage, but the densitymodel predicts a deeper EMC effect. Therefore, at variance with the V NC model, thedeviation of the super-ratio SREMC(x, Q2) from unity can reach a ≃ 2% level already aroundx ≃ 0.7 ÷ 0.8 in the density model, because the latter predicts a larger EMC effect withrespect to the V NC formula.
25

0.90
0.95
1.00
1.05
1.10
0.3 0.5 0.7 0.9
REM
C(x
, Q
2)
x
3He,
3H
(a)
0.90
0.92
0.94
0.96
0.98
1.00
1.02
1.04
0.3 0.5 0.7 0.9
SREM
C(x
, Q
2)
x
(b)
Figure 11. (a) The EMC ratio [Eq. (1)] in 3He (thin lines) and in 3H (thick lines) vs. x at
Q2 = 10 (GeV/c)2. (b) The super-ratio [Eq. (2)] vs. x. The meaning of the lines is the same as in
Fig. 7. In (a) the open and full dots correspond to the predictions of the density model (51) for3He and 3H, respectively, adopting ρp(
3He) = ρn(3H) = 0.050 fm−3 and ρn(3He) = ρp(3H) =
0.068 fm−3. In (b) the prediction of the density model is represented by the open squares.
However we stress again that one should be very careful in applying the density model forlight nuclei, as 3He and 3H , since for the lightest nuclei the Fermi momentum distributionis very steep and the A-dependence of the EMC effect may not have the same form as theone for heavy nuclei. Therefore the predictions of the EMC effect for 3He and 3H targetsbased on the density model should be considered for illustrative purposes only.
4.2 Quark Confinement Size
In Refs. [49, 50] it was proposed to explain the EMC effect at large x via the softening ofthe (valence) quark distributions in nuclei (i.e., a more efficient gluon radiation in boundnucleons than in free nucleons) caused by an increase of the confinement volume of the quarkin a bound nucleon. One can combine the model of [49] with the V NC model by includingin the latter modifications of the structure functions of the virtual nucleons. For simplicityone can neglect the dependence of the modification on the nucleon momentum treating thiseffect on average. In this case one can write
F A2 (x, Q2) =
A∑
N=1
∫ A
xdz z fN(z) F N
2 (x
z, ξA(Q2) · Q2), (52)
26
where ξA(Q2) is the (dynamical) rescaling factor, whose Q2-dependence, dictated by pQCD,is given by
ξA(Q2) =
[λ2
A
λ2N
]αs(µ2)/αs(Q2)
, (53)
with λA and λN representing the quark confinement sizes in the bound and free nucleon,respectively. A change of λA with respect to λN may be viewed as a change in the nucleonsize in the nuclear medium (this interpretation is usually refereed to as the nucleon swelling).In this respect, it should be pointed out that: i) in Ref. [58] an increase not larger than≃ 6% of the proton charge radius is found to be compatible with y-scaling in 3He and 56Fe;ii) the analysis of the Coulomb Sum Rule (CSR) made in Ref. [59] suggests an upper limit of≃ 10% for the change of the proton charge radius in 56Fe; iii) recently [60] the experimentalvalues of the CSR in 12C and 56Fe have been re-analyzed at Q2 ≃ 0.3 (GeV/c)2, implyingan upper limit of ≃ 8% for the increase of the proton charge radius (cf. [61]).
0.85
0.90
0.95
1.00
1.05
1.10
1.15
0.3 0.4 0.5 0.6 0.7 0.8 0.9
R EMC(x
, Q
2)
x
(a) 4He
0.8
0.9
1.0
1.1
1.2
1.3
0.3 0.4 0.5 0.6 0.7 0.8 0.9
R EMC(x
, Q
2)
x
(b) 5 6Fe
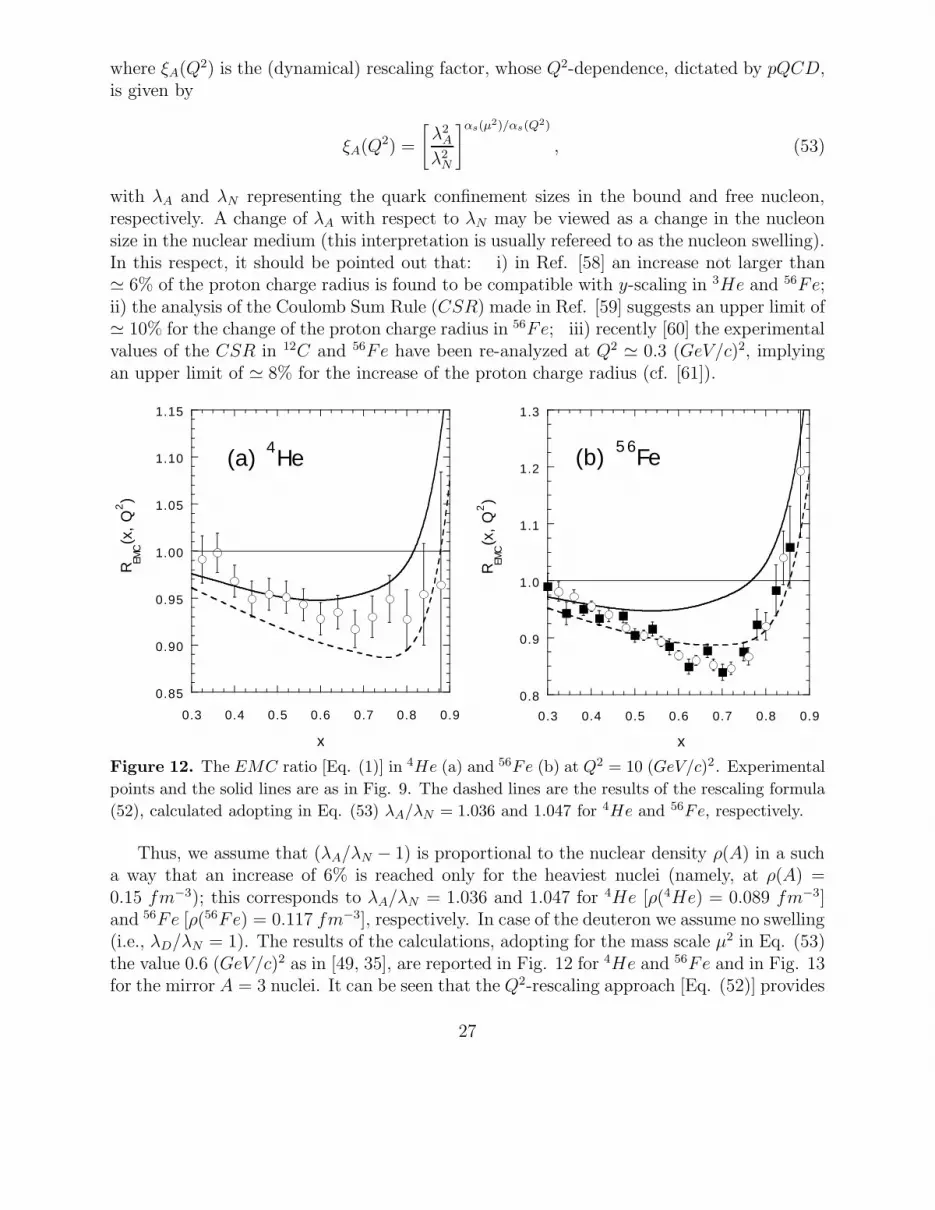
Figure 12. The EMC ratio [Eq. (1)] in 4He (a) and 56Fe (b) at Q2 = 10 (GeV/c)2. Experimental
points and the solid lines are as in Fig. 9. The dashed lines are the results of the rescaling formula
(52), calculated adopting in Eq. (53) λA/λN = 1.036 and 1.047 for 4He and 56Fe, respectively.
Thus, we assume that (λA/λN − 1) is proportional to the nuclear density ρ(A) in a sucha way that an increase of 6% is reached only for the heaviest nuclei (namely, at ρ(A) =0.15 fm−3); this corresponds to λA/λN = 1.036 and 1.047 for 4He [ρ(4He) = 0.089 fm−3]and 56Fe [ρ(56Fe) = 0.117 fm−3], respectively. In case of the deuteron we assume no swelling(i.e., λD/λN = 1). The results of the calculations, adopting for the mass scale µ2 in Eq. (53)the value 0.6 (GeV/c)2 as in [49, 35], are reported in Fig. 12 for 4He and 56Fe and in Fig. 13for the mirror A = 3 nuclei. It can be seen that the Q2-rescaling approach [Eq. (52)] provides
27

a better description of the EMC data at large x for both 4He and 56Fe than the convolutionformula (23). For 3He and 3H the predictions of the rescaling approach (corresponding toλ3He/λp = λ3H/λn = 1.020 and λ3He/λn = λ3H/λp = 1.027, respectively) provide a possiblemechanism to achieve a ≃ 1.5% deviation of the super-ratio SREMC(x, Q2) from 1 alreadyaround x ≃ 0.7 ÷ 0.8.
0.90
0.95
1.00
1.05
1.10
0.3 0.5 0.7 0.9
REM
C(x
, Q
2)
x
3He,
3H
(a)
0.90
0.92
0.94
0.96
0.98
1.00
1.02
1.04
0.3 0.5 0.7 0.9SR
EMC(x
, Q
2)
x
(b)
Figure 13. (a) The EMC ratio [Eq. (1)] in 3He (thin lines) and in 3H (thick lines) vs. x at
Q2 = 10 (GeV/c)2. (b) The super-ratio [Eq. (2)] vs. x. The solid and dashed lines correspond
to the convolution (23) and rescaling (52) formula, respectively. In the latter case the values
λ3He/λp = λ3H/λn = 1.020 and λ3He/λn = λ3H/λp = 1.027 are adopted in Eq. (53).
4.3 Six-Quark Clusters
Another mechanism proposed for the explanation of the EMC effect is the formation ofclusters of six (or more) quarks when two (or more) nucleons are overlapping in the nucleus[51, 52]. This mechanism also provides a softening of the quark distribution in nuclei, sincethe phase space available in a cluster of six (or more) quarks is clearly larger than in a nucleon.In what follows we limit ourselves to the case of 6q clusters and we adopt the procedure ofRef. [62] in order to evaluate the 6q cluster contribution to the nuclear response.
The main point is to take into account the decomposition (33) of the nucleon SpectralFunction into a ground (P N
0 ) and a correlated (P N1 ) parts. Indeed, since two nucleons can
overlap only in the correlated part P N1 , the modification of the convolution formula (23) due
to the possible presence of 6q clusters can be written as
F A2 (x, Q2) =
A∑
N=1
∫ A
xdzzfN
0 (z)F N2 (
x
z, Q2) +
A∑
N=1
(1 − P6q
SN1
)∫ A
xdzzfN
1 (z)F N2 (
x
z, Q2) +
28

P6qFA(6q)2 (x, Q2), (54)
where, following Eqs. (31) and (33), one has
fNi (z) = 2πMCN
∫ ∞
Emin
dE∫ ∞
pmin(z,E)dp p P N
i (p, E)M√
M2 + p2, (55)
with i = 0, 1. In Eq. (54) P6q is the probability to have a six-quark cluster in the nucleus,SN
1 is the normalization of the correlated part of the nucleon Spectral Function, viz.
SN1 ≡ 4π
∫ ∞
Emin
dE∫ ∞
0dp p2 P N
1 (p, E) , (56)
while FA(6q)2 (x, Q2) is given by
F A,6q2 (x, Q2) =
A
2
∑
β
∫ MA2M
x2
dzcm zcm fβ(zcm) F β2 (
x
2zcm, Q2), (57)
where β = (u2d4, u3d3, u4d2) = ([nn], [np], [pp]) identifies the type of 6q cluster, fβ(zcm) isthe light-cone momentum distribution describing the center-of-mass motion of the 6q clusterin the nuclear medium and F β
2 (ξ, Q2) is the structure function of the 6q cluster. FollowingRef. [62], we adopt for fβ(zcm) the momentum distribution of the center-of-mass motion ofa correlated NN pair (with the same quark content of the 6q cluster) as resulting from theSpectral Function model of Ref. [33]. In this way we take into account that the 6q bag maybe not at rest in the nucleus.
As for F β2 (ξ, Q2) we follow a simple Q2-independent parameterization proposed in Ref.
[52](a) and inspired by quark counting rules, viz.
F β2 (ξ) =
a (1 − ξ)14 +
∑
j
e2j
b
√ξ (1 − ξ)10
, (58)
where the coefficients a and b can be found in Ref. [52](a). Note that the charge factor (∑
j e2j )
is different for the various types of 6q clusters, namely:∑
j e2j = 4/3, 5/3, 2 for [nn], [np], [pp]
clusters. Therefore, the 6q cluster contribution is different in 3He and in 3H , because [nn]and [pp] bags have at least different quark content. Note that an additional difference maycome from different x-distributions in [pn] and [nn], [pp] bags.
The only remaining parameter is the 6q bag probability P6q in the nucleus. Since theprobability for two nucleon overlapping is proportional to the nuclear density, we assume P6q
to be proportional to the density ρ(A). We fix the constant of proportionality by requiringthe best reproduction of the EMC data of 56Fe, obtaining in this way P6q ≃ 15% in ironand P6q ≃ 11% in 4He. We assume no 6q bag in the deuteron, while for mirror A = 3 nucleiwe get P[pp]([nn]) = 6.4% and P[np] = 8.6%. The results of our calculations are reported inFigs. 14 and 15. It can be seen that the presence of 6q bags can have an important impacton the possible difference of the EMC effect in 3He and 3H , leading to a deviation of thesuper-ratio (2) of ≃ 3% already around x ≃ 0.7 ÷ 0.8.
29

0.85
0.90
0.95
1.00
1.05
1.10
1.15
0.3 0.4 0.5 0.6 0.7 0.8 0.9
R EMC(x
, Q
2)
x
(a) 4He
0.8
0.9
1.0
1.1
1.2
1.3
0.3 0.4 0.5 0.6 0.7 0.8 0.9
R EMC(x
, Q
2)
x
(b) 5 6Fe
Figure 14. The EMC ratio [Eq. (1)] in 4He (a) and 56Fe (b) at Q2 = 10 (GeV/c)2. Experimental
points and the solid lines are as in Fig. 9. The dotted lines are the results of the 6q bag formula
(54), calculated adopting P6q = 11% and 15% for 4He and 56Fe, respectively.
4.4 Color Screening Model
In inclusive A(e, e′)X reactions the most significant EMC effect is observed at x ∼ 0.5÷0.6.This range of x corresponds to high momentum components of the quark distribution inthe nucleon and therefore the EMC effect is expected to be mostly sensitive to nucleonwave function configurations where three quarks are likely to be close together [16, 17]. Werefer to such small size configurations of quarks as point-like configurations (PLC). It isthen assumed that for large x the dominant contribution to F N
2 (x, Q2) is given by PLC ofpartons which, due to color screening, weakly interact with the other nucleons. Note thatdue to pQCD evolution F N
2 (x, Q2) at x ∼> 0.6, Q2 ∼> 10 (GeV/c)2, is determined by thenon-perturbative nucleon wave function at x ∼> 0.7. Thus it is actually assumed that in thenon-perturbative nucleon wave function point-like configurations dominate at x ∼> 0.7.
The suppression of PLC in a bound nucleon is assumed to be the main source of theEMC effect in inclusive DIS [16, 17]. Note that this suppression does not lead to a noticeablechange in the average characteristics of the nucleon in nuclei [16]. To calculate the change ofthe probability of a PLC in a bound nucleon, one can use a perturbation series over a smallparameter, κ, which controls the corrections to the description of the nucleus as a system ofundeformed nucleons. This parameter is taken to be the ratio of the characteristic energiesfor nucleons and nuclei:
κ =
∣∣∣∣∣〈UA〉∆EA
∣∣∣∣∣ ∼1
10, (59)
where 〈UA〉 is the average potential energy per nucleon, 〈UA〉 |A≫1≈ −40 MeV , and ∆EA ≈
30

0.90
0.95
1.00
1.05
1.10
0.3 0.5 0.7 0.9
REM
C(x
, Q
2)
x
3He,
3H
(a)
0.90
0.92
0.94
0.96
0.98
1.00
1.02
1.04
0.3 0.5 0.7 0.9
SREM
C(x
, Q
2)
x
(b)
Figure 15. (a) The EMC ratio [Eq. (1)] in 3He (thin lines) and in 3H (thick lines) vs. x at
Q2 = 10 (GeV/c)2. (b) The super-ratio [Eq. (2)] vs. x. The solid and dotted lines correspond to the
convolution (23) and 6q bag (54) formula, respectively. In the latter case the values P[pp]([nn]) = 6.4%
and P[np] = 8.6% are adopted.
M∗ − M ∼ 0.6 ÷ 1 GeV is the typical energy for nucleon excitations within the nucleus.The task now is to calculate the deformation of the quark wave function in the bound
nucleon due to suppression of the probability of PLC in a bound nucleon and then to accountfor it in the calculation of F A
2 (x, Q2). To this end we consider a model, in which the interac-tion between nucleons is described by a Schrodinger equation with a potential V (Rij , yi, yj)which depends both on the internucleon distances (besides nucleon spin and isospin) and theinner variables yi and yj, where yi characterizes the quark-gluon configuration in the i-thnucleon [16, 17, 53].
In the non-relativistic theory of the nucleus the internucleon interaction V (Rij, yi, yj) isaveraged over all yi and yj, and the Schrodinger equation is solved for the non-relativisticpotential U(Rij), which is related to V (Rij , yi, yj) as follows:
U(Rij) =∑
yi,yj ,yi,yj
〈φN(yi)φN(yj) | V (Rij , yi, yj, yi, yj) | φN(yi)φN(yj)〉, (60)
where φN(yi) is the free nucleon wave function. Using for the unperturbed nuclear wavefunction the solution of the Schrodinger equation with U(Rij), one can treat (U − V )/(Ei −EN), as a small parameter to calculate the dependence of the probability to find a nucleonin a PLC on the momentum of the nucleon inside the nucleus. The quantity Ei introducedabove is the energy of an intermediate excited nucleon state. Such a calculation allows toestimate the suppression of the probability to find a PLC in a bound nucleon as compared tothe similar probability for a free nucleon. In the DIS cross section the PLC suppression can
31

be represented as a suppression factor γA(p2) which is multiplicative to the nucleon structurefunction F N
2 (< x >, Q2) in the LC convolution formula (37), viz. [16]
γA(p2) =1
(1 + κ)2=
1
[1 + (p2/M + 2ǫA)/∆EA]2,
(61)
where ∆EA = 〈Ei − EN〉 ≈ M∗ − M and p is the momentum of the bound nucleon in thelight cone.
The x dependence of the suppression effect is based on the assumption that the PLCcontribution in the nucleon wave function is negligible at x ∼< 0.3, and gives the dominantcontribution at x ∼> 0.5 [16, 31]. We use a simple linear fit to describe the x dependencebetween these two values of x [31]. Using Eq. (61) for large A at x ≃ 0.5 when Fermi motioneffects are small one can obtains an estimate for RA in Eq. (1) for large A as follows:
RA(x) |x≃0.5∼ γA(p2) ≈ 1 +4〈UA〉∆EA
∼ 0.7 ÷ 0.8, (62)
where 〈UA〉 ≈ −40 MeV . Since 〈UA〉 ∼ 〈ρA(r)〉 for A ≥ 12, the model predicts also theA dependence of the EMC effect, which is consistent with the data [17]. However for thelightest nuclei where the Fermi momentum distribution is very steep, the A dependencedue to the nuclear density is rather oversimplified. The correct estimation requires theconvolution of Eq. (61) with the structure function of a bound nucleon in Eqs. (37) and(38).
To estimate the suppression factor for large Fermi momenta when the interacting nucleonbelongs to nucleonic correlations, we use the same formula (61), in which now γ is definedthrough the virtuality of the interacting nucleon in many-nucleon correlations as follows:
κ =M2
v − M2
M · ∆EA,
M2v = z
(M2
j
j− M2
R + p2⊥
j − z
), (63)
where Mj ≈ j ·M and MR ≈ (j−1)M are the masses of the j-nucleon correlation and recoil(j − 1)-nucleon system.
In Fig. 16 we present the comparison of the predictions of the color screening modelwith the EMC data for 4He and 56Fe targets. The shaded area is defined by the values∆E = 0.6 GeV (lower solid curve) and ∆E = 1 GeV (upper solid curve).
In Fig. 17 our results obtained for 3He and 3H nuclei assuming the same range of valuesof ∆E are presented. If one assumes that ∆E is the same for all nuclei, then even though wehave large uncertainties for the EMC ratio [see Figs. 17(a) and 17(b)], the nuclear effectslargely cancel out in the super-ratio (2) [see Fig. 17(c)]. However the assumption that ∆Eis independent on the specific nucleus is a clear oversimplification, since the bound nucleonexcitation in NN correlations does depend on the isospin of the NN pair. Indeed, as it is
32

0.85
0.90
0.95
1.00
1.05
1.10
1.15
0.3 0.4 0.5 0.6 0.7 0.8 0.9
R EMC(x
, Q
2)
x
(a) 4He
0.8
0.9
1.0
1.1
1.2
1.3
0.3 0.4 0.5 0.6 0.7 0.8 0.9
R EMC(x
, Q
2)
x
(b) 5 6Fe
Figure 16. The EMC ratio in 4He (a) and 56Fe (b) at Q2 = 10 (GeV/c)2. Open dots are data
from Ref. [46], while in (b) the full squares are from Ref. [47]. The dashed lines are the results
of Eq. (37) calculated adopting the parameterization of the nucleon structure function FN2 (x,Q2)
of Ref. [6], including nucleon resonances, and the model of Ref. [33] for the nucleon Spectral
Function PN (k,E). The shaded area corresponds to the prediction of the color screening model
with ∆E = 0.6 GeV - lower solid curve and ∆E = 1 GeV - upper solid curve.
shown in Fig. 10, one has more attraction in isosinglet than in the isovector pairs and thespatial distributions for different isospin states may substantially differ. Therefore, one canexpect that ∆E is smaller in isotriplet states as compared to the isosinglet cases. To estimatethe upper limit of uncertainties due to the expected isospin dependence of bound nucleonexcitation, we decompose the NN correlation into an isosinglet and an isotriplet contribu-tions. Then we assume for isotriplet states the minimal value of ∆E = 0.6 GeV , whereasfor isosinglet states we assume no suppression at all. The prediction of this approximationis shown as the dotted curve in Fig. 17(c).
The isospin dependence of the EMC effect emerges naturally also in the quark-diquarkmodel of the nucleon. Within this model one expects a different degree of suppression forvalence quark and quarks in the diquark. In Fig. 17(d) we have presented the predictions ofthe color screening model within the quark-diquark picture, in which we have considered twoextreme cases: the first one when the suppression occurs only for the valence quarks (thinsolid curve) and the second one when only the quarks in the diquark are suppressed (thicksolid curve). To estimate the extent of the suppression we assume ∆E ≈ M∆−M ≃ 0.3 GeVwhich roughly corresponds to the quark helicity-flip excitation in the nucleon.
As follows from Figs. 17(c) and 17(d) all these approximations produce at most a 2÷3%deviation in the super-ratio (2) around x ≃ 0.7÷ 0.8, which may be considered as an upperlimit of the uncertainties due to the EMC effect in mirror A = 3 nuclei within the color
33

screening model.
5 Extraction of the n/p Ratio
We now use the the results of the previous Sections to address the issue of the extraction ofthe neutron to proton structure function ratio F n
2 (x, Q2)/F p2 (x, Q2) from the measurements
of the ratio of the mirror A = 3 structure functions, defined as
RF (x, Q2) ≡ F3He2 (x, Q2)
F3H2 (x, Q2)
. (64)
From Eq. (2) one gets
F n2 (x, Q2)
F p2 (x, Q2)
=2SREMC(x, Q2) −RF (x, Q2)
2RF (x, Q2) − SREMC(x, Q2), (65)
and correspondingly the uncertainty on the extracted n/p ratio is given by
∆ (F n2 /F p
2 )
F n2 /F p
2
=3 SREMC(x, Q2) RF (x, Q2)
[2RF (x, Q2) − SREMC(x, Q2)][2SREMC(x, Q2) −RF (x, Q2)]
·
√√√√[∆(SREMC)
SREMC
]2
+
[∆(RF )
RF
]2
(66)
One can easily see that in the r.h.s. of Eq. (66) the quantity in front of the squareroot provides a factor of ≃ 4 at x ∼> 0.7; thus, even a small uncertainty on the super-ratio islargely amplified in Eq. (66), yielding a non-negligible uncertainty on the extracted n/p ratioat large x. Following Ref. [25], the total experimental error in the DIS cross section ratio of3H and 3He is likely to be ∼< 1%. Therefore in Eq. (66) we assume that ∆(RF )/RF = 1%and from the results of the previous Sections we consider that ∆(SREMC)/SREMC = 3%for x ≥ 0.6, leading to a total uncertainty of ≃ 12% in the extracted n/p ratio already atx ≃ 0.7. In Fig. 18 we have reported the x-dependence of the expected accuracy for theextraction of the ratio F n
2 (x, Q2)/F p2 (x, Q2), and the shaded areas include the combination of
all the effects discussed above. Moreover we have used the CTEQ [10] set of PDF ’s (lowershaded area) and the modified CTEQ parameterization (upper shaded area), obtained fromthe CTEQ one as described in Sec. 3, in order to reproduce a n/p ratio approaching 3/7 atx → 1. Figure 18 demonstrates that although mirror A = 3 measurements will significantlyimprove the existing accuracy of the neutron structure functions at large x, they may notprovide 3σ separation for the two predictions of the n/p ratio having limiting values of 1/4and 3/7 at x → 1.
In Ref. [25, 26] it was suggested that, once the ratio RF (x, Q2) is measured, one canemploy an iterative procedure to extract the n/p ratio which can almost eliminate the effectsof the dependence of the super-ratio SREMC(x, Q2) on the large-x behavior of the specific
34

structure function input (see Fig. 6). Namely, after extracting the n/p ratio assuming aparticular calculation of SREMC , one can use the extracted neutron structure function toget a new estimate of SREMC, which can then be employed for a further extraction of then/p ratio. Such a procedure can be iterated until convergence is achieved and self-consistentsolutions for the extracted F n
2 /F p2 and the super-ratio SREMC are obtained. In Ref. [26]
the numerical estimate of the iteration procedure was performed within the V NC modeland a good convergence was achieved for x up to ≃ 0.8. However this result depends on theassumed validity of the V NC model in the considered range of values of x. To check howwell the iteration procedure will work in case of other models of the EMC effect, we haveconsidered the following two examples.
First, let us consider in Eq. (65) the nuclear structure function ratio RF (x, Q2) whichresults from the use of the modified SLAC parameterization of F N
2 (x, Q2) and the inclusion ofthe effects of possible 6q bags within the V NC model. Then we apply the iteration procedureassuming for the super-ratio SREMC(x, Q2) the convolution calculation corresponding to theDonnachie-Landshoff (DL) fit [63] of F N
2 (x, Q2), which provides a n/p ratio equal to 1/3 asx → 1. Figure 19 demonstrates that a consistency is achieved between the n/p ratio used asthe input and the extracted one. However, for the calculation of RF (x, Q2) we started fromthe modified SLAC parameterization which goes to 3/7 as x → 1.
In the second example we calculate the nuclear structure function ratio RF (x, Q2) us-ing the modified CTEQ parameterization within the LC approximation adopting the colorscreening model for the EMC effect (only with valence quark suppression in the quark-diquark picture). To do the iteration we start with the super-ratio SREMC(x, Q2) calculatedwithin the LC approximation without EMC effects using the CTEQ parameterization forthe nucleon structure function. Figure 20 demonstrates that the iteration diverges alreadyat values of x (≃ 0.7) smaller than the ones obtained in [26], where only the V NC modelwas used. Below x ≃ 0.7 the iteration procedure converges to a value of the n/p ratio whichdiffers from the “exact” one (used in RF (x, Q2)) exactly by the amount of the EMC effectwhich is implemented in the calculation of RF (x, Q2).
Both examples illustrate that the iterative procedure cannot improve the accuracy of theextraction of the n/p ratio as estimated in Fig. 18.
6 Conclusions
In conclusion, we have performed a detailed theoretical investigation of the EMC effect in3He and 3H targets. First, we have considered first the convolution approximation within theV NC model and the LC approach. The differences in the motion of protons and neutrons inmirror A = 3 nuclei, resulting from the spin-flavor dependence of the nuclear force, have beentaken into account. We have investigated various sources of uncertainties in the estimateof the super-ratio of the EMC effects in mirror A = 3 nuclei, like: i) charge symmetrybreaking terms in the nucleon-nucleon interaction; ii) finite Q2 corrections to the Bjorkenlimit; iii) the role of different prescriptions to relate the invariant nucleon Spectral Functionto the non-relativistic one, required to ensure baryon number conservation; iv) the role
35

of the x-shape of parton distribution functions; and v) the differences between the V NCmodel and the light cone formalism.
Within convolution approach, in which no modification of the bound nucleon is consid-ered, the deviation of the super-ratio (2) from unity is predicted to stay within 1% only forx ∼< 0.75 in close agreement with Ref. [26] and in overall agreement with Ref. [25] (which bythe way neglect the effects (i)-(iv)), where 1% deviations were found from an average valueof the super-ratio equal to ≈ 1.01.
We have further argued that the previous estimate cannot be considered as definitivefor the purpose of extraction of the F n
2 /F p2 ratio, since it is derived using just one of the
many models of the EMC effect, which has in particular a number of problems in describingthe nuclear data, namely the underestimation the EMC effect at x ∼> 0.6. Hence we haveprovided a detailed analysis of the super-ratio within a broad range of models of the EMCeffect, which take into account possible modifications of the bound nucleons in nuclei, like:i) a change in the quark confinement size (including swelling); ii) the possible presenceof clusters of six quarks; and iii) the suppression of point-like configurations due to colorscreening. Our main result is that one cannot exclude the possibility that the cancellationof the nuclear effects in the super-ratio may occur only at a level of ≈ 3%, resulting in asignificant uncertainty (up to ≈ 12% for x ≈ 0.7 ÷ 0.8) in the extraction of the free n/pratio from the ratio of the measurements of the 3He and 3H DIS structure functions. Suchan uncertainty is comparable to the ≃ 18% difference between the n/p predictions havinglimiting values of 3/7 and 1/4 at x → 1, which characterize the pQCD and Feynman models.Another consequence of the use of a broad range of models for the EMC effect is that theiteration procedure cannot in general improve the accuracy of the extracted n/p ratio.
It is however important to note that despite of such restrictions the mirror A = 3 measure-ments will provide an unprecedented accuracy in the extraction of the neutron DIS structurefunction. Thus such measurements are very much welcomed. It is however very importantto complement them with the measurements of semi-inclusive processes off the deuteron, inwhich the momentum of the struck nucleon is tagged by detecting the recoiling one. Impos-ing the kinematical conditions that the detected momentum is low (p ∼< 150 MeV/c), whichmeans that the nucleons in the deuteron are initially far apart [17, 23, 24], it is possible tominimize significantly the nuclear effects. Furthermore, all the unwanted nuclear effects canbe isolated by using the same reaction for the extraction of the proton structure functionby detecting slow recoiling neutrons and comparing the results with existing hydrogen data,as well as by performing tighter cuts on the momentum of the spectator proton and thenextrapolating to the neutron pole.
Acknowledgements
The authors gratefully acknowledge Steven Pieper for supplying them with the results ofthe Green Function Monte Carlo method of Ref. [42]. M.M.S. gratefully acknowledges acontract from Jefferson Lab under which this work was done. The Thomas Jefferson NationalAccelerator Facility (Jefferson Lab) is operated by the Southeastern Universities Research
36

Association (SURA) under DOE contract DE-AC05-84ER40150. This work is supportedalso by DOE grants under contract DE-FG02-93ER-40771 and DE-FG02-01ER41172. Weare grateful to the Institute for Nuclear Theory (Seattle) for the hospitality during the courseof this study.
References
[1] U.K. Yang and A. Bodek: Phys. Rev. Lett. 82, 2467 (1999).
[2] R.P. Feynman: Photon Hadron Interactions, Benjamin Inc. 1972
[3] For a recent review see N. Isgur: Phys. Rev. D59, 034013 (1999) and references thereinquoted
[4] S.J. Brodsky and G. Farrar: Phys. Rev. D11, 229 (1975).
[5] G.R. Farrar and D.R. Jackson: Phys. Rev. Lett. 35, 1416 (1975).
[6] (a) A. Bodek et al.: Phys. Rev. D20, 1471 (1979). (b) A. Bodek and J.L. Ritchie: Phys.Rev. D23, 1070 (1981).
[7] G.B. West: Phys.Lett. 37B, 509 (1971); Ann. Phys. (N.Y.) 74, 464 (1972). W.B. At-wood and G.B. West: Phys. Rev. D7, 773 (1973).
[8] J.J. Aubert et al.: Nucl. Phys. B293, 740 (1987). A.C. Benvenuti et al.: Phys. Lett.B237, 599 (1990). P. Amaudruz et al.: Nucl. Phys. B371, 3 (1992).
[9] L.W. Whitlow et al.: Phys. Lett. 282B, 475 (1992).
[10] H.L. Lai et al.: Phys. Rev. D51, 4763 (1995).
[11] M. Gluck, E. Reya and A. Vogt: Z. Phys. C67, 433 (1995).
[12] L.L. Frankfurt and M.I. Strikman: Phys. Lett. B64, 433 (1976); Phys. Lett. B76, 333(1978).
[13] P.V. Landshoff and J.C. Polkinghorne: Phys. Rev. D18, 153 (1978).
[14] L.L. Frankfurt and M.I. Strikman: Phys. Lett. B65, 51 (1976).
[15] J.J. Aubert et al. (EMC collaboration): Phys. Lett. B 123, 275 (1983).
[16] L.L. Frankfurt and M.I. Strikman: Nucl. Phys. B250 (1985) 143.
[17] L.L. Frankfurt and M.I. Strikman: Phys. Rep. 160, 235 (1988).
37

[18] M.I. Strikman, Nuclear Parton Distributions and Extraction of Neutron Structure Func-
tions, in Proc. of XXVI International Conference on High Energy Physics, Dallas (USA),World Scientific, Singapore, Vol. 1, 8060809 (1992).
[19] A. Bodek, S. Dasu and S.E. Rock, in Tucson Part. Nucl. Phys. 768-770 (1991).
[20] L.P. Kaptari and A.Yu. Umnikov: Phys. Lett. B259,155 (1991). M.A. Braun and M.V.Tokarev: Phys. Lett. B320, 381 (1994). A.Yu. Umnikov and F.C. Khanna: Phys. Rev.C49, 2311 (1994). W. Melnitchouk, A.W. Schreiber and A.W. Thomas: Phys. Rev.D49, 1183 (1994); Phys. Lett. 335B, 11 (1994). S.A. Kulagin, G. Piller and W. Weise:Phys. Rev. C50, 1154 (1994).
[21] W. Melnitchouk and A.W. Thomas: Phys. Lett. B377, 11 (1996).
[22] G. Ricco, S. Simula and M. Battaglieri: Nucl. Phys. B555, 306 (1999); Nucl. Phys.A663, 1015 (2000); ibidem A666, 165 (2000).
[23] W. Melnitchouk, M. Sargsian and M.I. Strikman: in Proc. of the Workshop on ”Fu-ture Physics at HERA” (DESY, September ’95 - May ’96), ed. by G. Ingelman, A. deRoeck and R.K. Klanner, DESY (Hamburg, 1996), p. 1064, also e-print archive nucl-th/9609048; Z. Phys. A359, 99 (1997)
[24] S. Simula: Phys. Lett. B387, 245 (1996); Nucl. Phys. A631, 602c (1997); in Proc. ofthe Workshop on ”Future Physics at HERA” (DESY, September ’95 - May ’96), ed.by G. Ingelman, A. de Roeck and R.K. Klanner, DESY (Hamburg, 1996), p. 1058, alsoe-print archive nucl-th 9608053.
[25] I.R. Afnan et al.: Phys. Lett. B493, 36 (2000).
[26] E. Pace, G. Salme and S. Scopetta: Phys. Rev. C64, 05503 (2001).
[27] G.F. Chew and F.E. Low: Phys. Rev. 113, 1640 (1959).
[28] D.M. Alde et al.: Phys. Rev. Lett. 64, 2479 (1990).
[29] L. Frankfurt, V. Guzey and M. Strikman: Phys. Lett. B381, 379 (1996). F. Bissey, V.Guzey, M. Strikman and A.W. Thomas: e-print archive hep-ph/0109069.
[30] L.L. Frankfurt and M.I. Strikman: Phys. Lett. B183, 254 (1987).
[31] M.M. Sargsian, L.L. Frankfurt and M.I. Strikman: Z. Phys. A335, 431 (1990).
[32] L.L. Frankfurt and M.I. Strikman: Phys. Rep. 76, 215 (1981).
[33] (a) C. Ciofi degli Atti, L.L. Frankfurt, S. Simula and M.I. Strikman: Phys. Rev. C44,R7 (1991). (b) C. Ciofi degli Atti and S. Simula: Phys. Rev. C53, 1689 (1996).
38

[34] E.L. Berger and F. Coester: Ann. Rev. Part. Sci. 37, 463 (1987). T. Uchiyama and K.Saito: Phys. Rev. C38, 2245 (1988). R.P. Bickerstaff and A.W. Thomas: J. Phys. G15,1523 (1989).
[35] C. Ciofi degli Atti and S. Liuti: Phys. Lett. B225, 215 (1989); Phys. Rev. C41, 1100(1990); Phys. Rev. C44, 1269 (1991).
[36] H. Meier-Hajduk, P.U. Sauer and W. Theis: Nucl. Phys. A395, 332 (1983).
[37] C. Ciofi degli Atti, E. Pace and G. Salme: Phys. Rev. C21, 805 (1980).
[38] O. Benhar, A. Fabrocini and S. Fantoni: Nucl. Phys. A505, 267 (1989); A550, 201(1992).
[39] A. Ramos, A. Polls and W.H. Dickhoff: Nucl. Phys. A503, 1 (1989). W.H. Dickhoffand H. Muther: Rep. Prog. Phys. 55, 1947 (1992). H.S. Kohler: Nucl. Phys. A537, 64(1992); Phys. Rev. C46, 1687 (1992). M. Baldo et al.: Nucl. Phys. A545, 741 (1992).F. de Jong and R. Malfliet: Phys. Rev. C44, 998 (1991). P. Fernandez de Cordoba andE. Oset: Phys. Rev. C46, 1697 (1992).
[40] R.V. Reid: Ann. Phys. (N.Y.) 50, 411 (1968).
[41] A. Nogga, H. Kamada and W. Glockle: Phys. Rev. Lett. 85, 944 (2000) and referencestherein quoted.
[42] S.C. Pieper and R.B. Wiringa: Annu. Rev. Nucl. Part. Sci. 51, 53 (2001).
[43] D. Day et al.: Phys. Rev. Lett. 43 (1979) 1143.
[44] L.L Frankfurt, M.M. Sargsian and M.I. Strikman: in preparation.
[45] M. Arneodo et al.: Phys. Rev. D50), R1 (1994).
[46] J. Gomez et al.: Phys. Rev. D49, 4348 (1994).
[47] R.G. Arnold et al.: Phys. Rev. Lett. 52, 727 (1984).
[48] R.L. Jaffe, F.E. Close, R.G. Roberts and G.G. Ross: Phys. Lett. B134, 449 (1984).
[49] F.E. Close, R.G. Roberts and G.G. Ross: Phys. Lett. B129, 346 (1983). F.E. Close etal.: Phys. Rev. D31, 1004 (1985).
[50] O. Nachtmann and H.J. Pirner: Z. Phys. C21, 277 (1984). G. Guttner and H.J. Pirner:Nucl. Phys. 457, 555 (1986).
[51] J. Vary et al.: Phys. Rev. Lett. 46, 1376 (1981).
39

[52] (a) C.E. Carlson and T.J. Havens: Phys. Rev. Lett. 51, 261 (1983). (b) K.E. Lassilaand U.P. Sukhatme: Phys. Lett. B209, 343 (1988).
[53] M.R. Frank, B.K. Jennings and G.A. Miller: Phys. Rev. C54, 920 (1996).
[54] E.L. Berger, F. Coester and R.B. Wiringa: Phys. Rev. D29, 398 (1984). E.L. Bergerand F. Coester: Phys. Rev. D32, 1071 (1985).
[55] F.-P. Juster et al.: Phys. Rev. Lett. 55, 2261 (1985). J. Martino: Lecture Notes inPhysics 260, Springer Verlag (1986), p. 129.
[56] C.R. Chen et al.: Phys. Rev. C31, 2266 (1985); ibidem C33, 1740 (1986). J.L. Friar etal.: Phys. Rev. C35 , 1502 (1987).
[57] R. Schiavilla, V.R. Pandharipande and R.B. Wiringa: Nucl. Phys. A449, 219 (1986).
[58] I. Sick: Phys. Lett. B157, 13 (1985).
[59] J.P. Chen et al.: Phys. Rev. Lett. 66, 1283 (1991).
[60] J. Jourdan: Nucl. Phys. A603, 117 (1996).
[61] G. Ricco et al.: Phys. Rev. C57, 356 (1998); Few Body Syst. Suppl. 10, 423 (1999).
[62] (a) C. Ciofi degli Atti and S. Simula: Few Body Systems 18, 55 (1995). (b) S. Simula:Few Body Systems Suppl. 8, 423 (1995); ibidem 9, 466 (1995).
[63] A. Donnachie and P.V. Landshoff: Zeit Phys. C61, 139 (1994).
40

0.94
0.96
0.98
1.00
1.02
1.04
0.3 0.5 0.7 0.9
SREM
C(x
, Q
2)
x
(c)0.94
0.96
0.98
1.00
1.02
1.04
0.3 0.5 0.7 0.9
SREM
C(x
, Q
2)
x
(d)
0.90
0.95
1.00
1.05
1.10
0.3 0.5 0.7 0.9
REM
C(x
, Q
2)
x
3He
(a)0.90
0.95
1.00
1.05
1.10
0.3 0.5 0.7 0.9
REM
C(x
, Q
2)
x
3H
(b)
Figure 17. The EMC ratio in 3He (a) and in 3H (b) vs. x at Q2 = 10 (GeV/c)2. The super-
ratio [Eq. (2)]) vs. x (c, d). In (a)-(c) the dashed curves correspond to the LC formalism (37)
using for the nucleon structure function the parameterization of Ref. [6], which includes nucleon
resonances. In (a)-(c) the shaded areas correspond to the predictions of the color screening model
for isospin independent values of ∆E, namely for ∆E = 0.6 GeV - lower (upper for (c)) solid curves
and ∆E = 1 GeV - upper (lower for (c)) solid curves. In (c) the dotted line corresponds to the
prediction of the isospin dependent screening model described in the text. In (d) the thin and thick
solid curves correspond to the predictions of the screening model within the quark-diquark picture,
when only the valence quarks and the quarks in the diquark are suppressed, respectively.
41

0.2
0.3
0.4
0.5
0.6
0.7
0.3 0.5 0.7 0.9
F 2
n (x,
Q2)
/ F
2
p(x
, Q
2)
xFigure 18. The expected accuracy for the extraction of the neutron to proton ratioFn
2 (x,Q2)/F p2 (x,Q2) vs. x at Q2 = 10 (GeV/c)2. The lower and upper shaded areas correspond
to the CTEQ and modified CTEQ parameterization described in the text. The full dots are theNMC data points as given in Ref. [45].
0.2
0.3
0.4
0.5
0.6
0.7
0.3 0.5 0.7 0.9
F 2
n (x,
Q2)
/ F
2
p(x
, Q
2)
xFigure 19. The neutron to proton ratio Fn
2 (x,Q2)/F p2 (x,Q2) vs. x at Q2 = 10 (GeV/c)2. The
full dots are the NMC data points as given in Ref. [45]. The solid line represents the DL
parameterization [63] of the n/p ratio. The open squares are the results of the extraction of the
n/p ratio adopting the the convolution formula (23) as described in the text. The error bars are
calculated via Eq. (66).
42

0.2
0.3
0.4
0.5
0.6
0.7
0.3 0.5 0.7 0.9
F 2
n (x,
Q2)
/ F
2
p(x
, Q
2)
x
4
3
2
1
Figure 20. The x dependence of neutron to proton structure function ratios-F2n/F2p. The thick
solid curve corresponds to the n/p ratio used to calculate RF . The thin solid curve is the ratio used
as input for the iteration procedure. The dashed curves correspond to the extracted ratio obtained
after subsequent iterations.
43


![The inhibitory action of ketamine HCl on [3H]5-hydroxytryptamine accumulation by rat brain synaptosomal-rich fractions: Comparison with [3H]catecholamine and [3H]γ-aminobutyric acid](https://img.pdfslide.net/doc/110x75/634e6320940e97c6be03a049/the-inhibitory-action-of-ketamine-hcl-on-3h5-hydroxytryptamine-accumulation-by.jpg)


![Glutamate receptor agonists release [3H]GABA preferentially from horizontal cells](https://img.pdfslide.net/doc/110x75/631d0b22665120b3330c268c/glutamate-receptor-agonists-release-3hgaba-preferentially-from-horizontal-cells.jpg)


![of [3H]PGF1x. - NCBI](https://img.pdfslide.net/doc/110x75/634d8ccba3f58bc38f088adc/of-3hpgf1x-ncbi.jpg)


