Embed Size (px)
Citation preview
AN INFERENCE ALGORITHM FOR PROBABILISTIC FAULT MANAGEMENT IN DISTRIBUTED SYSTEMS
Jianguo Ding1,2, Bernd Kramer1, Yingcai Bai2 and Hansheng Chen3
1 FernUniversitdt Hagen, D-58084, Germany; 2Shanghai Jiao Tong University, Shanghai 200030, P. R. China, [email protected]. en; 2East-china Institute of Computer Technology, Shanghai 200233, P. R. China
Abstract: With the proliferation of novel paradigms in distributed systems, including service-oriented computing, ubiquitous computing or self-organizing systems, an efficient distributed management system needs to work effectively even in face of incomplete management information, uncertain situations and dynamic changes. In this paper, Bayesian networks are proposed to model dependencies between managed objects in distributed systems management. Based on probabilistic backward inference mechanisms the so-called Strongest Dependency Route (SDR) algorithm is used to compute the set of most probable faults that may have caused an error or failure.
Keywords: fault management; uncertainty; Bayesian network; backward inference.
1. INTRODUCTION
As distributed systems grow in size, heterogeneity, pervasiveness, and complexity of applications and network services, their effective management becomes more important and more difficult. Individual hardware defects or software errors or combinations of such defects and errors in different system components may cause the degradation of services of other (remote) components in the network or even their complete failure due to functional dependencies between managed objects. Hence an effective distributed fault detection mechanism is needed to support rapid decision making in distributed systems management and allow for partial automation of fault correction. In the past decade, a great deal of research effort has been focused on improving a management system in fault detection and diagnosis.
194 Jianguo Ding, Bernd Kramer, Yingcai Bai and Hansheng Chen
Rule-based methods were proposed for fault detection11'6. Finite State Machines (FSMs) were used to model fault propagation behaviour and duration4,27. Coding-based methods18,26 and Case-based methods17 were used for fault identification and isolation. However most of these solutions are unable to deal with the incomplete and imprecise management information effectively. Probabilistic reasoning is another effective approach for fault detection in distributed systems management5,9'24.
On the practical side, most of the current commercial management software, such as IBM Tivoli, HP OpenView, or Cisco serial network management software still lack facilities for exact fault localization, or the automatic execution of appropriate fault recovery actions. A typical metric for on-line fault identification is 95% fault location accuracy and 5% faults can not be located and recovered in due time22. Hence for large distributed systems including thousands of managed components it may be rather time-consuming and difficult to resolve the problems in a short time by exhaustive search in locating the root causes of a failure.
In this paper we apply Bayesian networks (BNs) to model dependencies among managed objects and provide efficient methods to locate the root causes of failure situations in the presence of imprecise management information. Our ultimate goal is to automate part of the daily management business. A Strongest Dependence Route (SDR) algorithm for backward-inference in BNs is presented. The SDR algorithm will allow users to trace the strongest dependency route from some malicious effect to its causes, so that the most probable causes are investigated first. The algorithm also provides a dependency ranking of a particular effect's causes.
2. BAYESIAN NETWORKS FOR DISTRIBUTED SYSTEMS MANAGEMENT
2.1 BNs model for distributed systems management
Bayesian networks, also known as Bayesian belief networks, belief networks, causal networks or probabilistic networks, are effective means to model probabilistic knowledge by representing cause-and-effect relationships among key entities of a managed system. BNs can be used to generate useful predictions about future faults and decisions even in the presence of uncertain or incomplete information. BNs have been applied to problems in medical diagnosis20,26, map learning1 and language understanding2. BNs use DAGs (Directed Acyclic Graphs) with probability labels to represent probabilistic knowledge. BNs can be defined as a triplet (V, L, P), where V is a set of variables (nodes of the DAG), L is the set of
An Inference Algorithm for Probabilistic Fault Management 195
causal links among the variables (the directed arcs between nodes of the DAG), P is a set of probability distributions defined by: P={p(v\n(v))\vU V}\ n(v) denotes the parents of node v. The DAG is commonly referred to as the dependence structure of a BN.
In BNs, the information included in one node depends on the information of its predecessor nodes. The former denotes an effect node; the latter represents its causes. This dependency relationship is denoted by a probability distribution in the interval [0, 1]. An important advantage of BNs is the avoidance of building huge joint probability distribution tables that include permutations of all the nodes in the network. Rather, for an effect node, only the states of its immediate predecessor need to be considered.
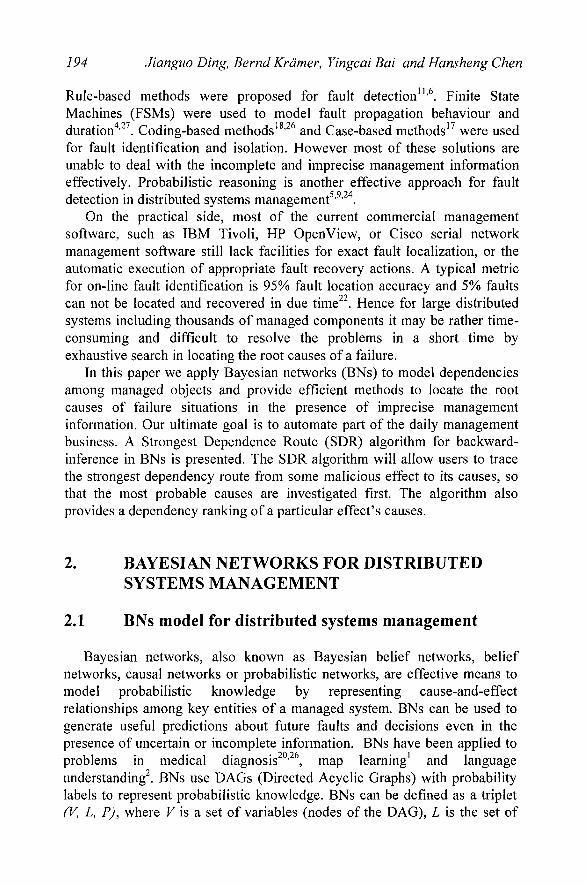
Figure 1 shows a particular detail of the campus network of the FernUniversitat in Hagen.
Remote dialin
S Internet
FemUrd
Router J
Switch
^ B j ^ H Cisco jftccess-
™ ^ ^ ^ Careemntor 3745
h" | EAUUESenrer
j j j LDAPSenrer
Figure L Example of distributed system
Component A: Access-server
Component B: RADIUS-Server
Component C: LDAP-SERV ER
Component D: Connection to mtemet-Ptovider
Component E Switch for LAN Access
Component F: GVfiN and Internet Access
f(K) - 0 . 0 0 9 2 % ? < F ) - 0 . 0 0 9 7 % r(C) - 0 . 0 0 9 7 % / ( £ " ) - 0 .37 (5% p{S-) - 0 .0 6 3 % / ( f ) - 0 . 0 3 5 % > ( J C | B E ) - 0% J M J H F - E ) - 1 0 0 % j r ( * - | B E - ) - 1 0 0 % piXWE). 10 0% > ( r r | E F ) * 0 % j(E"|E"F)« 1 0 0 % * ( I T | E F > 2 0 % J<ET|EX)» 10 0% / ( F I T ) - 1 0 0 % / ( F I E ) - 0 %
; i n r ) . 100% / ( H E ) - 0%
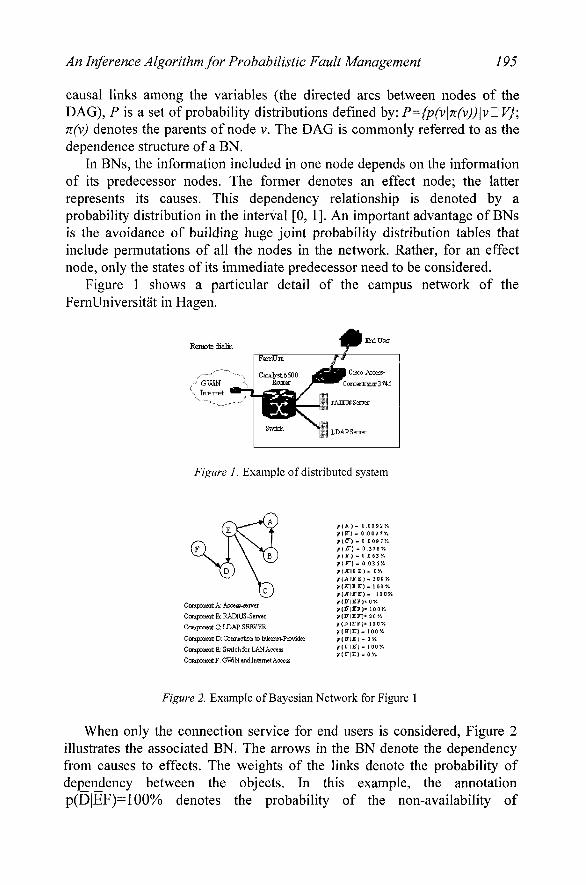
Figure 2. Example of Bayesian Network for Figure 1
When only the connection service for end users is considered, Figure 2 illustrates the associated BN. The arrows in the BN denote the dependency from causes to effects. The weights of the links denote the probability of dependency between the objects. In this example, the annotation p(D|EF)=100% denotes the probability of the non-availability of
196 Jianguo Ding, Bernd Kramer, Yingcai Bai and Hansheng Chen
component D is 100% when component F is in order but component E is not. Other annotations can be read similarly.
Due to the dense knowledge representation and precise calculations of BNs, BNs can represent large amount of interconnected and causally linked data as they occur in distributed systems. Generally speaking:
(1) BNs can represent knowledge in depth by modeling the relationship between the causes and effects among network components and network services.
(2) They can provide guidance in diagnosis. Calculations over a BN can determine both the precedence of detected effects and the network part that needs further investigation in order to provide a finer grained diagnosis.
(3) They have the capability of handling uncertain and incomplete information due to their grounding in probability theory.
2.2 Mapping distributed systems to BNs
We represent uncertainty in the dependencies among distributed system entities by assigning probabilities to the links in the dependency or causality graph1315. This dependency graph can be transformed into a BN10.
When a distributed system is modelled as a BN, two important processes need to be resolved:
(l)Ascertain the dependency relationship between managed entities. When one entity requires a service performed by another entity in order
to execute its function, this relationship between the two entities is called a dependency. The notion of dependencies can be applied at various levels of granularity. The inter-system dependencies are always confined to the components of the same service. Two models are useful to get the dependency between cooperating entities in distributed systems12.
The functional model defines generic service dependencies and establishes the principle constrains to which the other models are bound. A functional dependency is an association between two entities, typically captured first at design time, which says that one component requires some services from another.
The structural model contains the detailed descriptions of software and hardware components that realize the service. A structural dependency contains detailed information and is typically captured first at deployment or installation time.
(2)Obtain the measurement of the dependency. When BNs are used to model distributed systems, BNs represent causes
and effects between observable symptoms and the unobserved problems, so that when a set of evidences is observed the most likely causes can be determined by inference technologies.
An Inference Algorithm for Probabilistic Fault Management 197
Single-cause and multi-cause are two kinds of general assumptions to consider the dependencies between managed entities in distributed systems management. A non-root node may have one or several parents (causal nodes). Single-cause means any of the causes must lead to the effect. While multi-cause means that one effect is generated only when more than one cause happens simultaneity. Management information statistics are the main source to get the dependencies between the managed objects in distributed systems. The empirical knowledge of experts and experiments are useful to determine the dependency.
Some researchers have performed useful work to discover dependencies from the application view in distributed systems812,7.
3. BACKWARD INFERENCE IN BAYESIAN NETWORKS
3.1 Inference in Bayesian networks
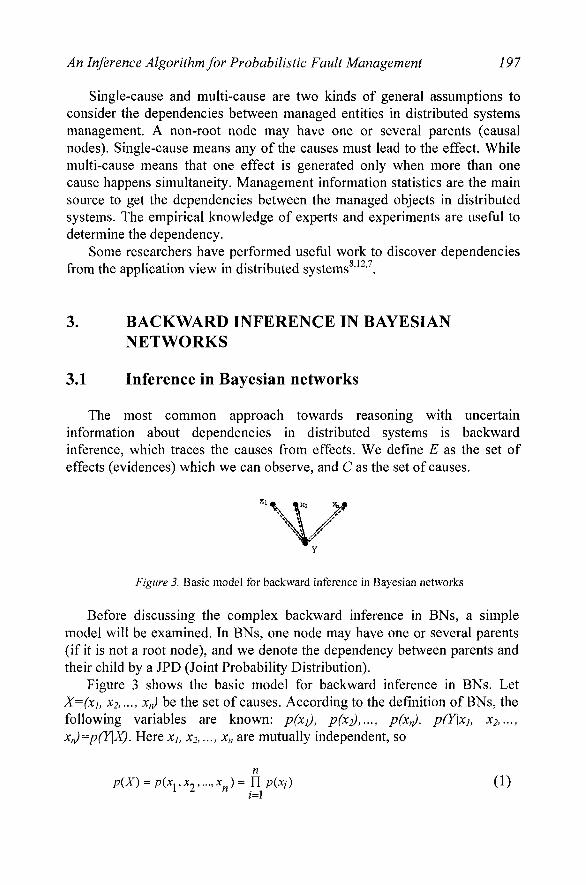
The most common approach towards reasoning with uncertain information about dependencies in distributed systems is backward inference, which traces the causes from effects. We define E as the set of effects (evidences) which we can observe, and C as the set of causes.
Figure 3. Basic model for backward inference in Bayesian networks
Before discussing the complex backward inference in BNs, a simple model will be examined. In BNs, one node may have one or several parents (if it is not a root node), and we denote the dependency between parents and their child by a JPD (Joint Probability Distribution).
Figure 3 shows the basic model for backward inference in BNs. Let X=(x], x2,...,xn) be the set of causes. According to the definition of BNs, the following variables are known: p(xj), p(x2),..., pM, p(Y\x1} X2,..., xn)=p(Y\X). Here xh x2,..., xn are mutually independent, so
n p(X) = p(xl,x2,...,xn) = n p(xt) (1)
198 Jianguo Ding, Bernd Kramer, Yingcai Bai and Hansheng Chen
p(Y) = E [p(Y\X)p(X)] = Z X X
p(Y\X)np(Xj) (2)
by Bayes' theorem, P(x \ Y) = ^(71Z)p(X) /•=1
p{Y\X)\\ p{xt) /=i
(3)
which computes to p(*,|r)= i p(X|r) X\xt
(4)
In Eq. (4), X\XJ=X-{XJ}.According to the Eqs. (l)-(4), the individual conditional probability p(xt\ Y) can be achieved from the JPD p(Y\X), X=(xj, x2,..., xj. The backward dependency can be obtained from Eq. (4). The dashed arrowed lines in figure 3 denote the backward inference from effect Y to individual causex,/ ^[1,2, ..., n].
In Figure 2, when a fault is detected in component D, then based on Eqs. (l)-(4), we obtain P(F \ D) = 61.6%, P(E\D) = 32 A% • This can be interpreted as follows: when component D is not available, the probability of a fault in component F is 67.6% and the probability of a fault in component E is 32.4%. Here only the fault related to connection service is considered.
3.2 SDR algorithm for backward inference
In distributed system management, the key factors that are related to the defect in the system should be identified. The Strongest Dependency Route (SDR) algorithm is proposed to resolve these tasks based on probabilistic inference.
Before we describe the SDR, the definition of strongest cause and strongest dependency route are given as follows:
Definition 3.2.1 In a BN let C be the set of causes, E be the set of effects. For et £E, Cj be the set of causes based on effect eh iffp(Ck\ei)=Max[p(Cj\ei), Cj &C], then Ck is the strongest cause for effect et.
Definition 3.2.2 In a BN, let C be the set of causes, E be the set of effects, let R be the set of routes from effect et £E to its cause Cj £C, R=(Ri, R2, ..., Rm). Let Mk be the set of transition nodes between et and Cj in route Rk ^R. IJfp(Cj\Mk,ei)=Max[p(Cj\Mt,ei),t=(l, 2, ..., m)](herep(Cj\Mt,ej) can be derived from p(Mt\ej)*pfcjlMf)), then Rk is the strongest route between et and Cj.
The detailed description of the SDR algorithm is described as follows:
An Inference Algorithm for Probabilistic Fault Management 199
3.2.1 Pruning of the BNs
Generally speaking, multiple effects (symptoms) may be observed at a moment, so Ek= {ej ,e2 ,...,ek} is defined as initial effects. In the operation of pruning, every step just integrates current nodes' parents into BN5 and omits their brother nodes, because their brother nodes are independent with each other. To achieve this, a prune operation is defined as follows:
Algorithm 3.2.1 Prune (BN=(V, L, P), Ek c E, Ek ={ej ,e2, ...,ek})
newBN' = (V',L',P'); V'=Ek; //addEktoV, L '=0; //& denotes empty set. for et£Ek (i=l,..,k)
Vj = eh
while Vj fNIL do V'= V U{n(Vj)}, // add vertex n(vt) to V Vi*-n(Vj),
L '=L '+<7t(Vj), Vj >; // add edge <n(Vj), v,- > to L' return BN';
The pruned graph is composed of the effect node Ek and its entire ancestor.
3.2.2 Strongest Dependency Route (SDR) trace algorithm
After the pruning algorithm has been applied to a BN, a simplified sub-BN is obtained. Between every cause and effect, there may be more than one dependency routes. The questions now are: which route is the strongest dependency route and among all causes, which is the strongest cause? The SDR algorithm use product calculation to measure the serial strongest dependencies between effect nodes and causal nodes. Suppose Ek c E> Ek
={ei ,e2, ..-,ek}. If k=l, the graph will degenerate to a single-effect model.
Algorithm 3.2.2 (SDR): Input: V: the set of nodes (variables) in BNs; L: the set of links in the
BN; P: the dependency probability distribution for every node in BN; Ek
={ej ,e2 ,...,ekJ: the set of initial effect nodes in BN. Output: T: a spanning tree of the BN, rooted on vertex Ek, and a vertex-
labelling gives the probability of the strongest dependency from e, to each vertex.
200 Jianguo Ding, Bernd Kramer, Yingcai Bai and Hansheng Chen
Variables: dependfvj: the probability of the strongest dependency between v and all its descendants; p(v\u): the probability can be calculated from JPD of p(u\n(u)) based on Eqs. (l)-(4)? v is the parent of u; <p(l)\ the temporal variable which records the strongest dependency between nodes.
Initialize the SDR tree T as E^; // Ek is added as root nodes ofT Write label 1 on e, // et &Ek While SDR tree T does not yet span the BN
For each frontier edge I in BN Let u be the labelled endpoint of edge I, Let v be the unlabeled endpoint of edge I (v is one parent ofu), Set cp (I) =depend[uj * p(v \ u);
Let I be a frontier edge for T that has the maximum cp-value; Add edge I (and vertex v) to tree T; dependfvj = cp(l); Write label dependfvj on vertex v;
Return SDR tree T and its vertex labels;
The result of the SDR algorithm is a spanning tree T. Every cause code Cj £C is labeled with dependfcjJ=p(Cj\Mk,ei), ef ^Ek, Mk is the transition nodes
between et and c7 in route Rk ER.
3.2.3 Proof of the SDR algorithm
Now we prove the correctness of SDR algorithm. Algorithm 3.2.2 gives a way to identify the strongest route from effect et (et EE0 to Cj (cj EC). If the route <ehuj, u2i'", um Cj> is the strongest dependency route, <ei,§i>d2i..., Sm
Cj>is any route from et to Cj. Then
p(ui\ei)*p(u2\ui)*... *p(cJ\uri) >p(SI\ei)*p(d2\SI):i:... *p(cj\Sm) (5)
Define weight(u,n(u)) = -lg(p(n(u)\u)), Eq. (5) is transferred to:
weight (et,ui) + weight (ui,U2) +...+ weight(un,Cj)
< weight(eudi) + weight(d],S2) +... + weight(Sm,Cj) (6)
Lemma: when a vertex u is added to spanning tree T, dfuj = weight(ehu) = -lg(dependfuj).
0<depend[8j] < 1, so d [SJ > 0. (Note dependfdj ^0, or else exists empty link between Sjand its children.)
Proof: suppose to the contrary that at some point the SDR algorithm first attempts to add a vertex u to T for which dfuj ^ weight(ei} u).
Consider the situation just prior to the insertion of u. See Figure 4. Consider the true strongest dependency route from et to u. Because et £T,
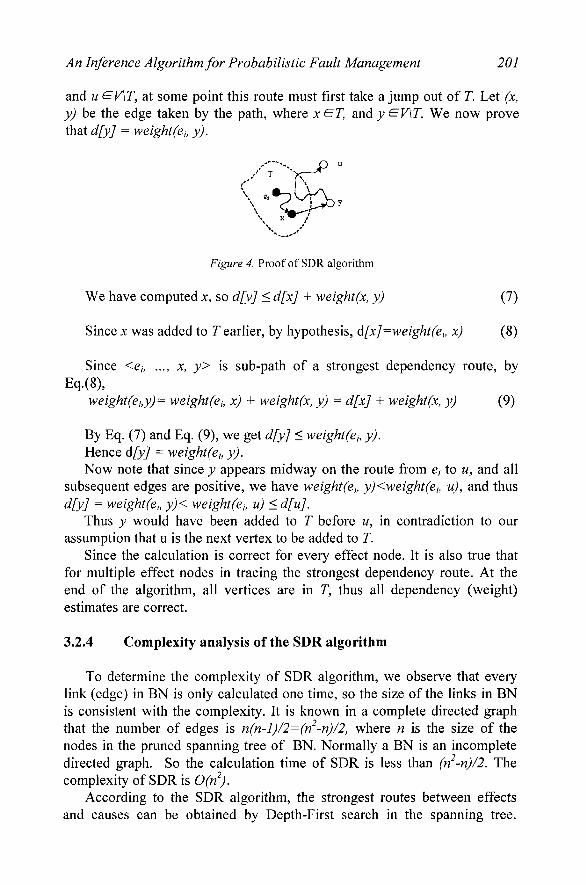
An Inference Algorithm for Probabilistic Fault Management 201
and u^V\T, at some point this route must first take a jump out of T. Let (x, y) be the edge taken by the path, where x £T, and y EV\T. We now prove that d[y] = weight(eh y).
Figure 4. Proof of SDR algorithm
We have computed x, so d[yj < dfx] + weight(x, y) (7)
Since x was added to T earlier, by hypothesis, A[x]=w eight (eh x) (8)
Since <eh ..., x, y> is sub-path of a strongest dependency route, by Eq.(8),
weight (et,y) = weight(eh x) + weight(x, y) = dfx] + weight(x, y) (9)
By Eq. (7) and Eq. (9), we get dfy] < weight(eh y). Hence dfy] = weight(eh y). Now note that since y appears midway on the route from et to u, and all
subsequent edges are positive, we have weight(eh y)<weight(eh u), and thus dfy] = weight(eu y)< weight(eu u) < dfu].
Thus y would have been added to T before u, in contradiction to our assumption that u is the next vertex to be added to T.
Since the calculation is correct for every effect node. It is also true that for multiple effect nodes in tracing the strongest dependency route. At the end of the algorithm, all vertices are in T, thus all dependency (weight) estimates are correct.
3.2.4 Complexity analysis of the SDR algorithm
To determine the complexity of SDR algorithm, we observe that every link (edge) in BN is only calculated one time, so the size of the links in BN is consistent with the complexity. It is known in a complete directed graph that the number of edges is n(n-l)/2=(n2-n)/2, where n is the size of the nodes in the pruned spanning tree of BN. Normally a BN is an incomplete directed graph. So the calculation time of SDR is less than (n2-n)/2. The complexity of SDR is 0(n2).
According to the SDR algorithm, the strongest routes between effects and causes can be obtained by Depth-First search in the spanning tree.
202 Jianguo Ding, Bernd Kramer, Yingcai Bai and Hansheng Chen
Meanwhile the values of the labels in the cause nodes generate a dependency ranking of causes based on the effects. This dependency sequence is useful reference for fault diagnosis and related maintenance operations.
3.3 Related algorithms for probabilistic inference
There exist various types of inference algorithms For BNs. They can be classified into two types of inferences: exact inference18,21 and approximate inference19. Each class offers different properties and works better on different classes of problems. This situation is true for almost all computational problems and probabilistic inference using general BNs has been shown to be NP-hard by Cooper3.
Pearl's algorithm, the most popular inference algorithm in BNs, can not be extended easily to apply to acyclic multiply connected digraphs in general23,14. Another popular exact BN inference algorithm is the clique-tree algorithm18. It transforms a multiply connected network into a clique tree by clustering the triangulated moral graph of the underlying undirected graph first, and then performs message propagation over the clique tree. But it is difficult to record the internal nodes and the dependency routes between particular effect nodes and causes. In distributed systems management, the states of internal nodes and the key route, which connect the effects and causes, are important for management decisions. Moreover, the sequence of localization for potential faults is very useful for reference to systems managers. For system performance management, the identification of related key factors is also important. Few algorithms give satisfactory resolution for this case.
Compared to other algorithms, the SDR algorithm belongs into the class of exact inferences and it provides an efficient method to trace the strongest dependency routes from effects to causes and to track the dependency sequences of the causes. Moreover it can treat multiple connected networks modelled as DAGs.
4. CONCLUSIONS AND FUTURE WORK
In distributed systems of realistic size and complexity, managers have to live with unstable, uncertain and incomplete information. It is reasonable to use BNs to represent the knowledge about managed objects and their dependencies and apply probabilistic reasoning to determine the causes of failures or errors. Bayesian inference is a popular mechanism underlying probabilistic reasoning systems. The SDR algorithm introduced in this paper presents an efficient method to trace the causes of effects. This is useful for
An Inference Algorithm for Probabilistic Fault Management 203
systems diagnosis and fault location and further can be used to improve performance management.
Most distributed systems, however, dynamically update their structures, topologies and their dependency relationships between management objects. Due to the special requirements in distributed systems and network management, the following topics need to be considered for future work:
First, we need to accommodate sustainable changes and maintain a healthy management system based on learning strategies that allows us to modify the cause-effect structure and also the dependencies between the nodes of a BNs correspondingly
Secondly, if the status of concerned managed objects is predictable, it is also possible to get a prospective view of the whole system. So an effective prediction strategy, which takes into account the dynamic changes in distributed systems, is important. This is related to discrete nonlinear time series analysis. Nonlinear regression theory25 is useful to capture the trend of changes and give reasonable predictions of individual components and the whole system. Further the state of particular causal managed component can be predicted from future possible states of the effect components based on the inference rules in BNs. The future performance of the system can also be evaluated.
REFERENCES
1. K. Basye, T. Dean, J. S. Vitter. Coping with Uncertainty in Map Learning. Machine Learning 29(1): 65-88, 1997.
2. E. Charniak, R. P. Goldman. A Semantics for Probabilistic Quantifier-Free First-Order Languages, with Particular Application to Story Understanding. Proceedings ofIJCAI-89, pp 1074-1079, Morgan-Kaufmann, 1989.
3. G. Cooper. Computational complexity of probabilistic inference using Bayesian belief networks. Artificial Intelligence, 42:393-405, 1990.
4. C. Chao, D. Yang, A. Liu. A LAN fault diagnosis system. Computer Communications. Vol24,ppl439-1451,2001.
5. R. H. Deng, A. A. Lazar, and W. Wang. A probabilistic Approach to Fault Diagnosis in Linear Lightwave Networks. IEEE Journal on Selected Areas in Communications, Vol. 11, no. 9, pp. 1438-1448, December 1993.
6. M. Frontini, J. Griffin, and S. Towers. A knowledge-based system for fault localization in wide area networks. In Integrated Network Management, II. Amsterdam: North-Holland, 519-530, 1990.
7. J. Gao, G. Kar, P. Kermani. Approaches to Building Self Healing Systems using Dependency Analysis. IEEE/IFIP NOMS'04, April, 2004.
8. M. Gupta, A. Neogi, M. K. Agarwal and G. Kar. Discovering Dynamic Dependencies in Enterprise Environments for Problem Determination. DSOM 2003, LNCS 2867, ISBN 3-540-20314-1, pp221-233, 2003,
9. C. S. Hood and C. Ji. Proactive network-fault detection. IEEE Transactions on Reliability, 46(3):333-341, September 1997.
204 Jianguo Ding, Bernd Kramer, Yingcai Bai and Hansheng Chen
10.D. Heckerman and M. P. Wellman. Bayesian networks. Communications of the ACM, 38(3):27-30, Mar. 1995.
1 l.C. A. Joseph, A. Sherzer, K. Muralidhar. Knowledge based fault management for OSI networks. Proceedings of 3th International conference on Industrial and engineering applications of artificial intelligence and expert systems, pp.61-69, June 1990.
12. A. Keller, U. Blumenthal, G. Kar. Classification and Computation of Dependencies for Distributed Management. Proceedings of 5th IEEE Symposium on Computers and Communications. Antibes-Juan-les-Pins, France, July 2000.
13.1. Katzela and M. Schwarz. Schemes for fault identification in communication networks. IEEE Transactions on Networking, 3(6): 733-764, 1995.
14.F. L. Koch, and C. B. Westphall. Decentralized network management using distributed artificial intelligence. Journal of Network and Systems Management, Vol. 9, No. 4, Dec. 2001.
15.S. Klinger , S. Yemini , Y. Yemini , D. Ohsie , S. Stolfo. A coding approach to event correlation. Proceedings of the fourth international symposium on Integrated network management IV, p.266-277, January 1995.
16.C. Lo, S. H. Chen, B. Lin. Coding-based schemes for fault identification in communication networks. Int. Journal of Network Management 10(3): 157-164, 2000.
17.L. Lewis. A case-based reasoning approach to the resolution of faults in communication networks. In Integrated Network Management, III, 671-682. Elsevier Science Publishers B.V., Amsterdam, 1993.
18.S. L. Lauritzen and D. J. Spiegelhalter. Local computations with probabilities on graphical structures and their application to expert systems. Journal of the Royal Statistical Society, Series B 50:157-224, 1988.
19.R. M. Neal, Probabilistic inference using Markov chain Monte Carlo methods. Tech. Rep. CRG-TR93-I, University of Toronto, Department of Computer Science, 1993.
20.D. Nikovski. Constructing Bayesian networks for medical diagnosis from incomplete and partially correct statistics. IEEE Transactions on Knowledge and Data Engineering, Vol. 12, No. 4, pp. 509 - 516, July 2000.
21. J. Pearl. A constraint-propagation approach to probabilistic reasoning. Uncertainty in Artificial Intelligence. North-Holland, Amsterdam, pp357-369, 1986.
22.The International Engineering Consortium. Highly available embedded computer platforms become reality, http://www.iec.org/online/tutorials/acrobat/ha_embed.pdf.
23.H. J. Suermondt and G. F. Cooper. Probabilistic inference in multiply connected belief network using loop cutsets. International Journal of Approximate Reasoning, vol. 4, 1990, pp. 283-306.
24.M. Steinder and A. S. Sethi. Non-deterministic diagnosis of end-to-end service failures in a multi-layer communication system. In Proc. oflCCCN, Scottsdale, AR, 2001. pp. 374-379.
25. A. S. Weigend, and N. A. Gershenfeld. Time Series Prediction. Addison-Wesley, 1994. 26. W. Wiegerinck, H.J. Kappen, E.W.M.T ter Braak, W.J.P.P ter Burg, M.J. Nijman.
Approximate inference for medical diagnosis. Pattern Recognition Letters, 20:1231-1239, 1999.
27.C. Wang, M. Schwartz. Fault detection with multiple observers. IEEE/ACM transactions on Networking. 1993; Vol 1: pp48-55
28.S. A. Yemini, S. Kliger, E. Mozes, Y. Yemini, and D. Ohsie. High speed and robust event correlation. IEEE Communications Magazine, 34(5):82-90, 1996.


