Embed Size (px)
Citation preview
ORIGINAL ARTICLE
An optimization method of the machining parametersin high-speed machining of stainless steel using coatedcarbide tool for best surface finish
Ahmad Hamdan & Ahmed A. D. Sarhan & Mohd Hamdi
Received: 30 November 2010 /Accepted: 16 May 2011 /Published online: 1 June 2011# Springer-Verlag London Limited 2011
Abstract High-speed machining (HSM) has emerged as akey technology in rapid tooling and manufacturing appli-cations. Compared with traditional machining, the cuttingspeed, feed rate has been great progress, and the cuttingmechanism is not the same. HSM with coated carbidecutting tools used in high-speed, high temperature situa-tions and cutting more efficient and provided a lowersurface roughness. However, the demand for high qualityfocuses extensive attention to the analysis and prediction ofsurface roughness and cutting force as the level of surfaceroughness and the cutting force partially determine thequality of the cutting process. This paper presents anoptimization method of the machining parameters in high-speed machining of stainless steel using coated carbide toolto achieve minimum cutting forces and better surfaceroughness. Taguchi optimization method is the mosteffective method to optimize the machining parameters, inwhich a response variable can be identified. The standardorthogonal array of L9 (34) was employed in this researchwork and the results were analyzed for the optimizationprocess using signal to noise (S/N) ratio response analysisand Pareto analysis of variance (ANOVA) to identify the
most significant parameters affecting the cutting forces andsurface roughness. For such application, several machiningparameters are considered to be significantly affectingcutting forces and surface roughness. These parametersinclude the lubrication modes, feed rate, cutting speed, anddepth of cut. Finally, conformation tests were carried out toinvestigate the improvement of the optimization. The resultshowed a reduction of 25.5% in the cutting forces and41.3% improvement on the surface roughness performance.
Keywords Taguchi . Optimization . High speed .
Machining . Lubricant . Cutting . Force . Roughness
1 Introduction
High-speed machining (HSM) is gaining popularity inindustry in recent years due to the capability in improvingmachining performance, reducing cost while achievingreduced lead times, and higher productivity [1]. However,the demand for high quality focuses attention on the surfacecondition and the quality of the product, especially theroughness of the machined surface because of its effect onproduct appearance, function, and reliability. In addition, agood quality machined surface significantly improvesfatigue strength, corrosion resistance, and creep life.Besides that, the quality of the machined surface is usefulin diagnosing the stability of the machining process, wherea deteriorating surface finish may indicate workpiecematerial non-homogeneity, progressive tool wear, cuttingtool chatter, etc. For these reasons, it is important tomaintain consistent tolerances and surface roughness.Surface roughness is defined as a group of irregular wavesin the surface, measured in micrometers (μm). Theroughness data obtained by measurement can be manipu-
A. Hamdan :A. A. D. Sarhan (*) :M. HamdiDepartment of Engineering Design and Manufacture,University of Malaya,Faculty of Engineering Building,50603 Kuala Lumpur, Malaysiae-mail: [email protected]
A. A. D. Sarhane-mail: [email protected]
A. Hamdane-mail: [email protected]
M. Hamdie-mail: [email protected]
Int J Adv Manuf Technol (2012) 58:81–91DOI 10.1007/s00170-011-3392-5
lated to determine the roughness parameter. There are manydifferent roughness parameters in use, but Ra is by far themost common. Other common parameters include Rz, Rq,and Rsk.
Surface roughness is mainly affected by differentmachining parameters that can be setup in advance, suchas rotation speed, feed rate, and cut depth. However, it isalso affected by other uncontrol variables such as themechanical properties of the material, the type of the cutter,and the vibration produced during the process. The cuttingspeed and feed rate are significant machining parametersaffecting surface roughness; however, the effect of depth ofcut is small [2–8]. The use of higher cutting speed andlower feed rate produced a better surface finish and this ismainly attributed to the high temperature [8, 9]. However,with higher cutting speed and temperature, special rapidtooling is needed to increase abrasion resistance and henceproduced good surface roughness. For rapid toolingapplications in the die and mold industry, it will lead togreat improvements if tool can be used for machining withshorter lead times and better surface finish. The achieve-ment of these objectives by HSM puts it at the priority ofrapid tooling and manufacturing technologies. Whereas,tool life is important for cost purposes, the surface finish isconsider a direct measure of the quality of productproduced. Coating tools are traditionally expected to playmultiple roles such as reducing cutting temperatures andcutting forces and increasing abrasion resistance [10, 11]. Itis clear that the coated cutting tool provided a lower surfaceroughness; however, the benefits will depend on manyfactors, including substrate material, tool coating combina-tions, and the thermophysical conditions of both tool andworkpiece. The application of coated carbide tools has beenfound to bring about an expansion of the region ofmachining conditions within which reduced wear ratesmay be experienced [7]. The effect of tool coatings is thusexpected to be the broadening of the lowest wear zone onthe feed-cutting speed wear map. In addition, coatings areexpected to result in lower wear regions occurring at higherspindle speeds, promoting the use of HSM.
Although, coating tools are playing a key role to reduce thecutting temperatures, it is however still high as the frictionbetween cutting tool and workpiece is also high due toextensive contact during machining. The cutting temperatureis a key factor, which directly affects cutting tool wear,workpiece surface integrity, and machining precision accord-ing to the relative motion between the tool and work piece[12]. The amount of heat generated varies with the type ofmaterial being machined and machining parameters espe-cially cutting speed, which had the most influence on thetemperature [13]. Several attempts have been made to predictthe temperatures involved in the process as a function ofmany parameters. Da Silva and Wallbank [14] presented a
review for cutting temperature prediction and measurementmethods. Additionally, many experimental methods tomeasure temperature directly, only a few systems have asyet been used this temperature as an indicator for machineperformance monitoring and for industrial application.Therefore, design and develop control system to control thetemperature lead to better surface finish, as machineperformance parameter is required [14]. Thus, the imple-mentation of cutting fluid, which acts as a lubricant and acoolant, are very crucial. However, the usage of conventionalflooding application in machining processes is becomingdebatable because machine operators could be exposed topossible health problems [9, 15]. In addition, the bulk ofwaste from the conventional flooding technique might bedisposed off irresponsibly thus causing serious damage to theenvironment. Economically, the cost related to the cuttingfluid is 7–17% of total production cost which is normallyhigher than that of cutting tool equipments which incurs only2–4% of total cost [11].
An alternative has been suggested in which a highpressure jet of soluble oil was applied directly to the chip-tool interface. This has been reported to reduce cuttingtemperature and improve tool life due to its ability topenetrate into the chip–tool interface [9]. Klocke andEisennblatter [16] state that minimal quantity lubrication(MQL) refers to the use of cutting fluids of only a minuteamount—typically of a flow rate of 50–500 ml/h which isabout three to four orders of magnitude lower than theamount commonly used in flood cooling condition. Inaddition, it is also reported that MQL increases themachining processes efficiency by improving its overallperformance compared to dry and conventional floodmachining [3, 9, 17, 18]. Besides that, study on machiningaustenitic stainless steels indicated that high-pressure MQLgive better performance in drilling and turning [19].However, the investigations of milling process with MQLespecially in high-speed milling of austenitic stainless steelsare still at an early stage and many areas of research is yetto be explored. This is because of the high ductility ofstainless steel that categorizes it to be amongst the difficultto cut materials [2, 20, 21].
Following the review above, this study included lubri-cation mode, feed rate, spindle speed, and dept of cut asmachining parameters (called control factor hear after)affecting the surface roughness. The main objective is tofind the best combination of theses parameters in high-speed machining of stainless steel using coated carbide toolto achieve low cutting force and surface roughness. Theconventional method to achieve that is to use the “trial anderror” approach. However, due to the large number ofexperiments, the “trial and error” approach is very timeconsuming. Hence, a reliable systematic approach foroptimizing the machining parameters is thus required.
82 Int J Adv Manuf Technol (2012) 58:81–91
2 The optimization method
The optimization method presented in this study is anexperimental process called the Taguchi optimization method.Taguchi optimization, developed by Dr. Genichi Taguchi, is aset of methodologies in which the inherent variability ofmaterials and manufacturing processes has been taken intoaccount at the design stage. In Taguchi optimization, themultiple factors can be considered at once. Moreover, it seeksnominal design points that are insensitive to variations inproduction and user environments to improve the yield inmanufacturing and the reliability in performance of a product[22]. Therefore, not only can control factors be considered,but also uncontrol factors (noise factors) that cause thefunctional characteristics of a product to deviate from theirtarget values. By using the Taguchi optimization techniques,industries are able to greatly reduce product developmentcycle time for both design and production, therefore reducingcosts and increasing profit.
The complete procedure in Taguchi optimization methodis consisting of three stages: system design, parameterdesign, and tolerance design. However, the parameterdesign is the most important stage [22, 23]. It has beenwidely applied in the USA and Japan with great success foroptimizing industrial/production processes. The most im-portant step in the parameter design is the selection ofcontrol factors. As many factors as possible should beincluded, so that it would be possible to identify non-significant variables at the earliest opportunity. The stepsincluded in the parameter design of an experiment are:selecting the orthogonal array (OA) according to thenumbers of controllable factors, running experiments basedon the OA, analyzing data, identifying the optimumcondition, and conducting confirmation runs with theoptimal levels of all the parameters. The details regardingthese steps will be described in the following sections.
In this research, the Taguchi optimization method is appliedto identify the optimal control factors combination that yieldthe lowest cutting force and surface roughness value (Ra). Toachieve this goal, the following items will be investigated:
& The relationship between the controllable factors (lubri-cation mode, feed rate, spindle speed, and dept of cut) andthe response factor (surface roughness and cutting force)
& What are the optimal conditions of the controllablefactors for best surface roughness?
3 Design of experiment
The most important stage in the design of experiment lies inthe selection of control factors and identifying the OA thenrunning the experiment based on that particular OA.
3.1 Identifying the OA
The standardized orthogonal array L9 (34) was used in this
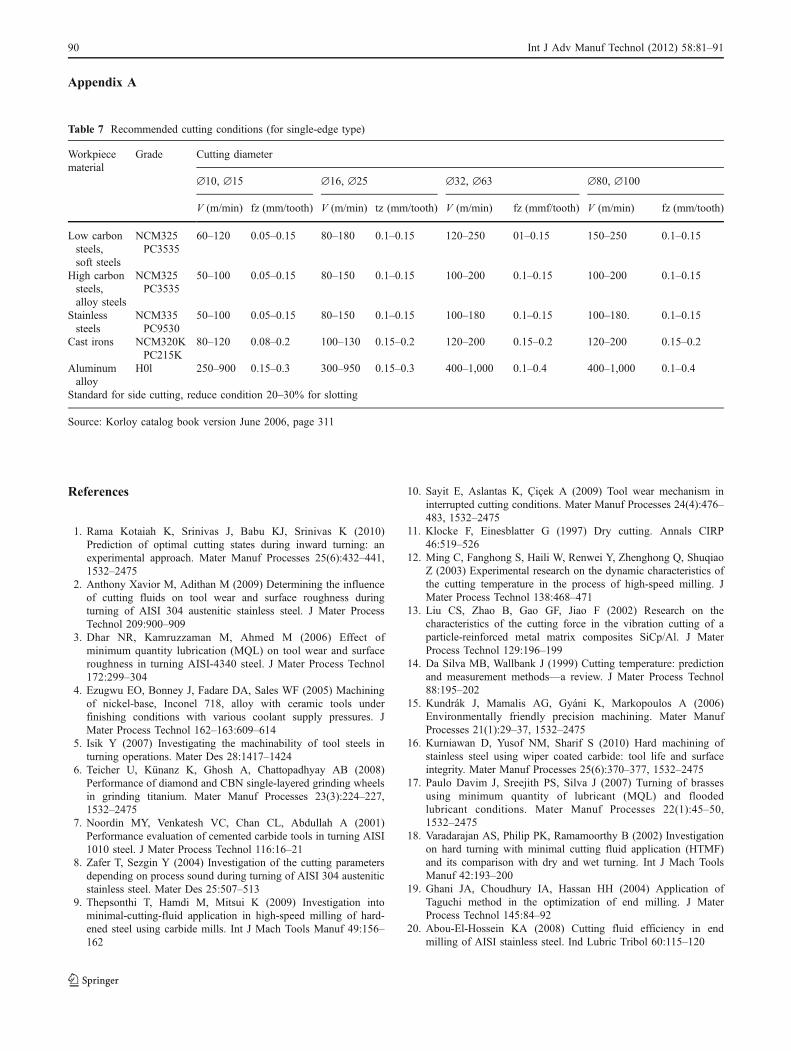
experiment. It consists of nine experiments with fourdifferent factors and three different experimental conditionlevels. The factors and levels are specified in Table 1. Thefeeds and depths of cut were selected based on recom-mendations given by the insert manufacturer’s recommen-dation shown in Appendix A. Cutting speeds were chosenthree times above the recommended speeds in order tomove the experiment into the “high cutting speed” category[1, 21]. The highest value of cutting speed was selectedafter preliminary test. Total damage is occurred to the toolinsert beyond the 400 m/min. The nine experiments withthe details of the combination of the experimental conditionlevels for each control factor (A–D) are shown in Table 2.
3.2 Experimental details
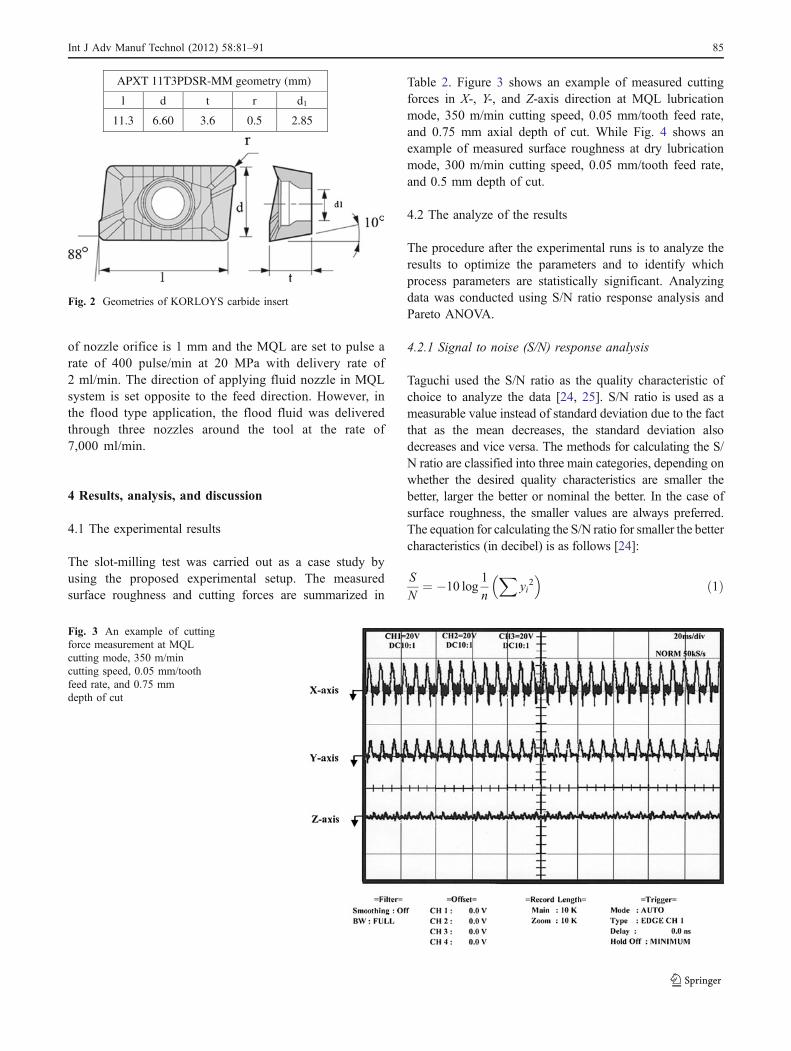
After the orthogonal array has been selected, the secondstep in Taguchi optimization method is running theexperiment based on that OA. The experimental setup usedin this research is shown in Fig. 1. The machine used was avertical type-machining center (Mitsui Seiki VT3A). Thespindle has constant position preload bearings with oil-airlubrication and maximum rotational speed of 20,000 min−1.The spindle motor power is 15 kW and maximum cuttingfeed used is 10 m/min. The KORLOY carbide insert withan ISO designation of APXT 11T3PDSR-MM (coated withtitanium aluminum nitride) is shown in Fig. 2. The tool wasmounted on a 12 mm diameter KORLOYAlpha mill insertholder with a code of AMS2012S. The insert holder wasfirmly mounted on the BT 40 tool holder with a code CTR32–150 KURODA, which is suitable for high-speed millingprocess. The cutter is a single-flute type that has chipbreaker grooves and is suitable for slot milling of ductilematerial.
To investigate the machining performances of the cuttingprocess, the slot-milling test was carried out as a case studyby using the proposed experimental setup. A cuttingprocess of a rectangular workpiece of stainless steel AISI304 (85.1 HRB) prepared in 50×50×220 mm is selected as
Table 1 Factors and levels used in experiment
Factor Experimental condition levels
1 2 3
A. Cutting speed (m/min) 300 350 400
B. Feed rate (mm/tooth) 0.05 0.1 0.15
C. Axial depth of cut (mm) 0.5 0.75 1
D. Lubrication mode Dry Flood MQL
Int J Adv Manuf Technol (2012) 58:81–91 83
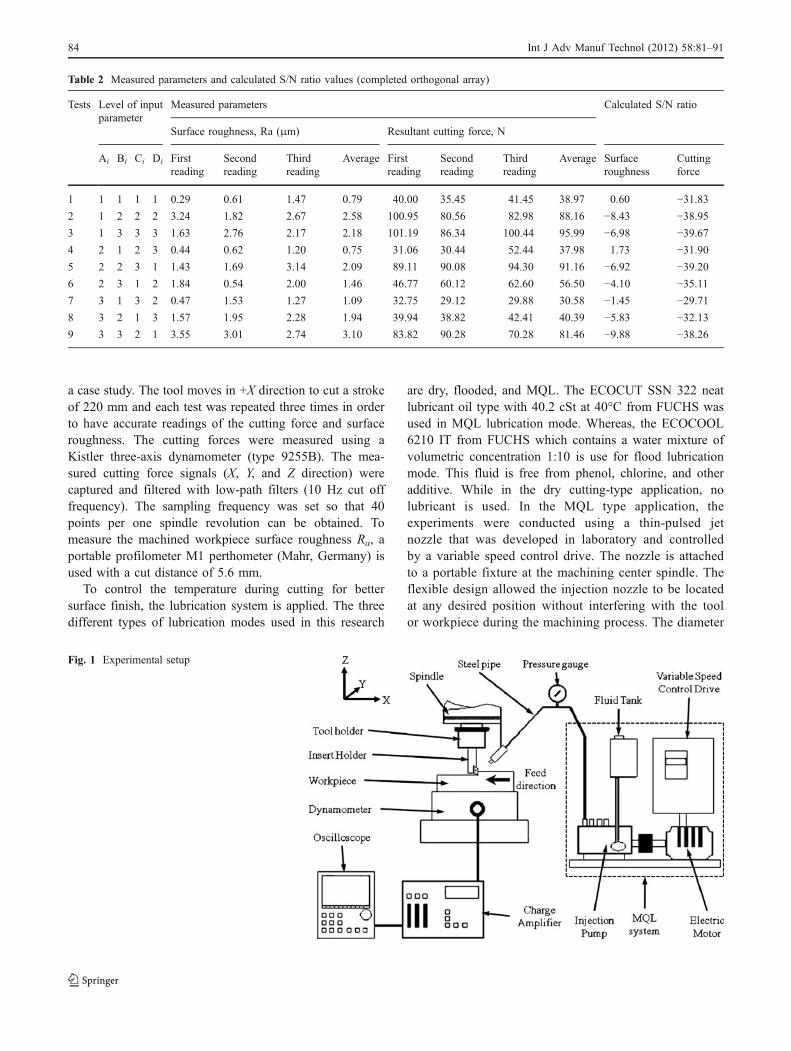
a case study. The tool moves in +X direction to cut a strokeof 220 mm and each test was repeated three times in orderto have accurate readings of the cutting force and surfaceroughness. The cutting forces were measured using aKistler three-axis dynamometer (type 9255B). The mea-sured cutting force signals (X, Y, and Z direction) werecaptured and filtered with low-path filters (10 Hz cut offfrequency). The sampling frequency was set so that 40points per one spindle revolution can be obtained. Tomeasure the machined workpiece surface roughness Ra, aportable profilometer M1 perthometer (Mahr, Germany) isused with a cut distance of 5.6 mm.
To control the temperature during cutting for bettersurface finish, the lubrication system is applied. The threedifferent types of lubrication modes used in this research
are dry, flooded, and MQL. The ECOCUT SSN 322 neatlubricant oil type with 40.2 cSt at 40°C from FUCHS wasused in MQL lubrication mode. Whereas, the ECOCOOL6210 IT from FUCHS which contains a water mixture ofvolumetric concentration 1:10 is use for flood lubricationmode. This fluid is free from phenol, chlorine, and otheradditive. While in the dry cutting-type application, nolubricant is used. In the MQL type application, theexperiments were conducted using a thin-pulsed jetnozzle that was developed in laboratory and controlledby a variable speed control drive. The nozzle is attachedto a portable fixture at the machining center spindle. Theflexible design allowed the injection nozzle to be locatedat any desired position without interfering with the toolor workpiece during the machining process. The diameter
Table 2 Measured parameters and calculated S/N ratio values (completed orthogonal array)
Tests Level of inputparameter
Measured parameters Calculated S/N ratio
Surface roughness, Ra (μm) Resultant cutting force, N
Ai Bi Ci Di Firstreading
Secondreading
Thirdreading
Average Firstreading
Secondreading
Thirdreading
Average Surfaceroughness
Cuttingforce
1 1 1 1 1 0.29 0.61 1.47 0.79 40.00 35.45 41.45 38.97 0.60 −31.832 1 2 2 2 3.24 1.82 2.67 2.58 100.95 80.56 82.98 88.16 −8.43 −38.953 1 3 3 3 1.63 2.76 2.17 2.18 101.19 86.34 100.44 95.99 −6.98 −39.674 2 1 2 3 0.44 0.62 1.20 0.75 31.06 30.44 52.44 37.98 1.73 −31.905 2 2 3 1 1.43 1.69 3.14 2.09 89.11 90.08 94.30 91.16 −6.92 −39.206 2 3 1 2 1.84 0.54 2.00 1.46 46.77 60.12 62.60 56.50 −4.10 −35.117 3 1 3 2 0.47 1.53 1.27 1.09 32.75 29.12 29.88 30.58 −1.45 −29.718 3 2 1 3 1.57 1.95 2.28 1.94 39.94 38.82 42.41 40.39 −5.83 −32.139 3 3 2 1 3.55 3.01 2.74 3.10 83.82 90.28 70.28 81.46 −9.88 −38.26
Fig. 1 Experimental setup
84 Int J Adv Manuf Technol (2012) 58:81–91
of nozzle orifice is 1 mm and the MQL are set to pulse arate of 400 pulse/min at 20 MPa with delivery rate of2 ml/min. The direction of applying fluid nozzle in MQLsystem is set opposite to the feed direction. However, inthe flood type application, the flood fluid was deliveredthrough three nozzles around the tool at the rate of7,000 ml/min.
4 Results, analysis, and discussion
4.1 The experimental results
The slot-milling test was carried out as a case study byusing the proposed experimental setup. The measuredsurface roughness and cutting forces are summarized in
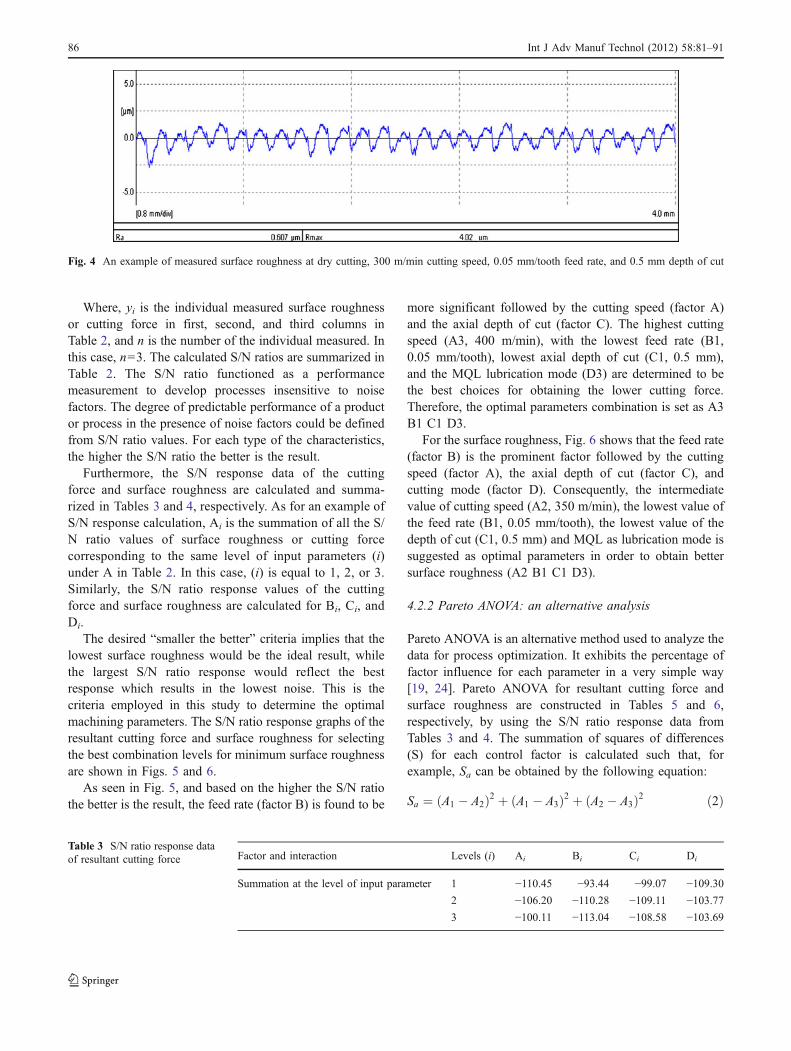
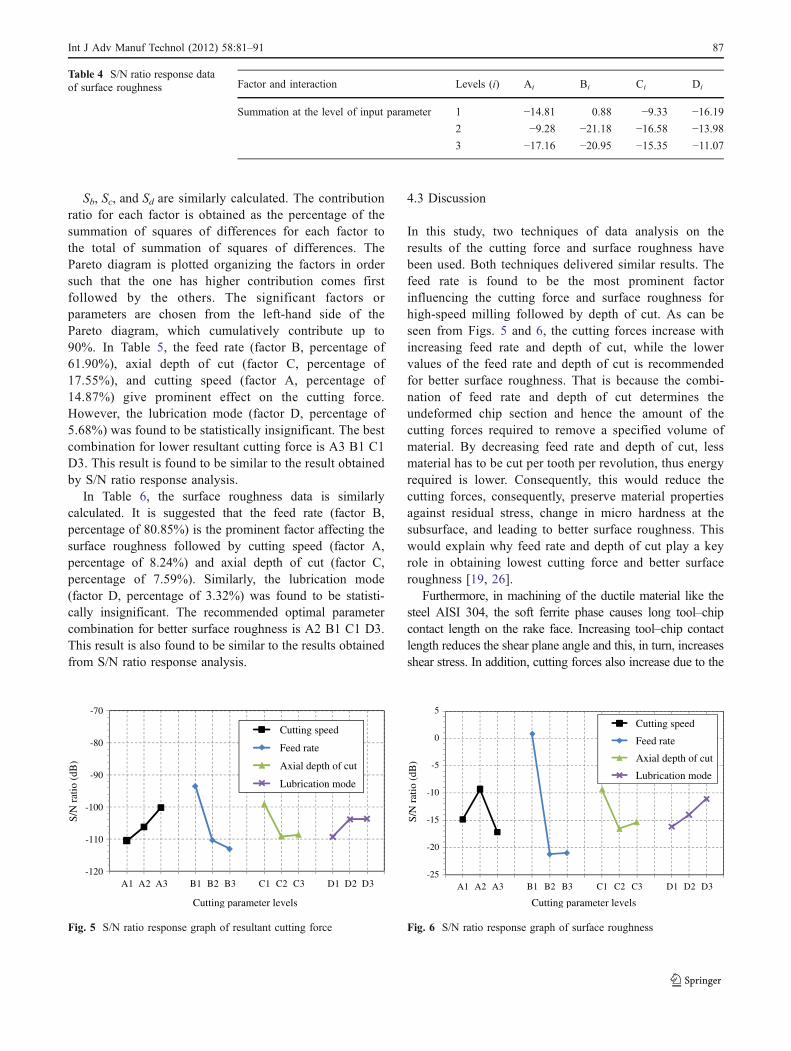
Table 2. Figure 3 shows an example of measured cuttingforces in X-, Y-, and Z-axis direction at MQL lubricationmode, 350 m/min cutting speed, 0.05 mm/tooth feed rate,and 0.75 mm axial depth of cut. While Fig. 4 shows anexample of measured surface roughness at dry lubricationmode, 300 m/min cutting speed, 0.05 mm/tooth feed rate,and 0.5 mm depth of cut.
4.2 The analyze of the results
The procedure after the experimental runs is to analyze theresults to optimize the parameters and to identify whichprocess parameters are statistically significant. Analyzingdata was conducted using S/N ratio response analysis andPareto ANOVA.
4.2.1 Signal to noise (S/N) response analysis
Taguchi used the S/N ratio as the quality characteristic ofchoice to analyze the data [24, 25]. S/N ratio is used as ameasurable value instead of standard deviation due to the factthat as the mean decreases, the standard deviation alsodecreases and vice versa. The methods for calculating the S/N ratio are classified into three main categories, depending onwhether the desired quality characteristics are smaller thebetter, larger the better or nominal the better. In the case ofsurface roughness, the smaller values are always preferred.The equation for calculating the S/N ratio for smaller the bettercharacteristics (in decibel) is as follows [24]:
S
N¼ �10 log
1
n
Xyi2
� �ð1Þ
APXT 11T3PDSR-MM geometry (mm)
1l d t r d
11.3 6.60 3.6 0.5 2.85
Fig. 2 Geometries of KORLOYS carbide insert
Fig. 3 An example of cuttingforce measurement at MQLcutting mode, 350 m/mincutting speed, 0.05 mm/toothfeed rate, and 0.75 mmdepth of cut
Int J Adv Manuf Technol (2012) 58:81–91 85
Where, yi is the individual measured surface roughnessor cutting force in first, second, and third columns inTable 2, and n is the number of the individual measured. Inthis case, n=3. The calculated S/N ratios are summarized inTable 2. The S/N ratio functioned as a performancemeasurement to develop processes insensitive to noisefactors. The degree of predictable performance of a productor process in the presence of noise factors could be definedfrom S/N ratio values. For each type of the characteristics,the higher the S/N ratio the better is the result.
Furthermore, the S/N response data of the cuttingforce and surface roughness are calculated and summa-rized in Tables 3 and 4, respectively. As for an example ofS/N response calculation, Ai is the summation of all the S/N ratio values of surface roughness or cutting forcecorresponding to the same level of input parameters (i)under A in Table 2. In this case, (i) is equal to 1, 2, or 3.Similarly, the S/N ratio response values of the cuttingforce and surface roughness are calculated for Bi, Ci, andDi.
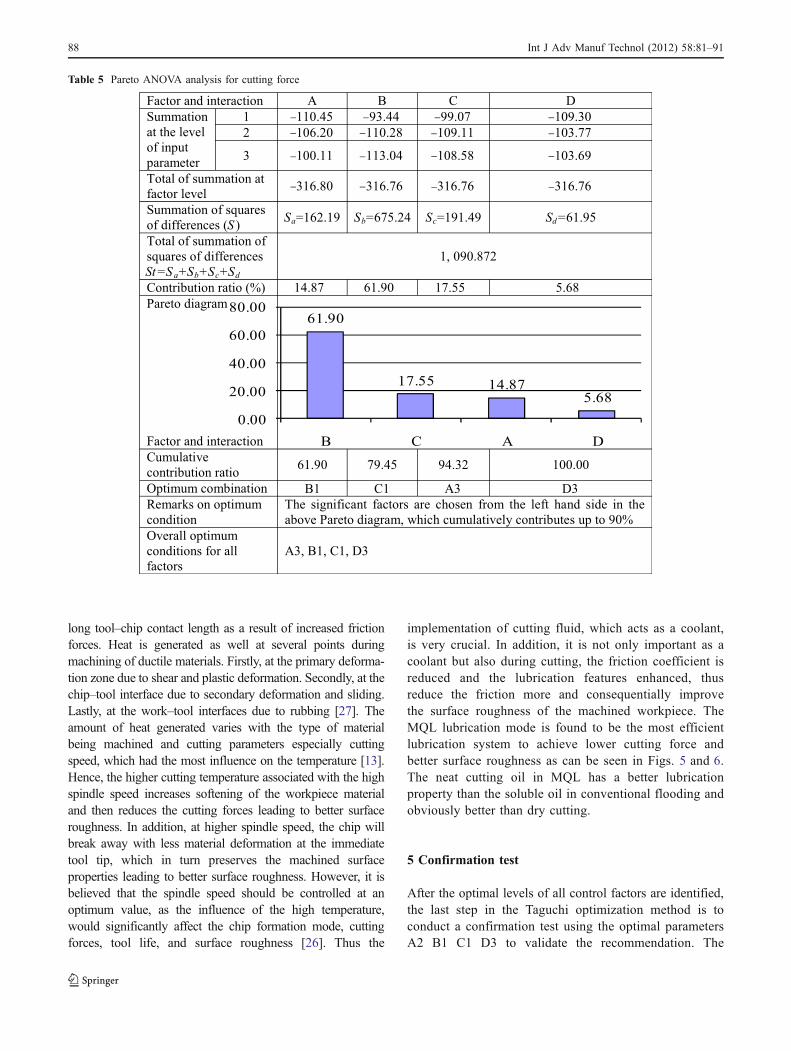
The desired “smaller the better” criteria implies that thelowest surface roughness would be the ideal result, whilethe largest S/N ratio response would reflect the bestresponse which results in the lowest noise. This is thecriteria employed in this study to determine the optimalmachining parameters. The S/N ratio response graphs of theresultant cutting force and surface roughness for selectingthe best combination levels for minimum surface roughnessare shown in Figs. 5 and 6.
As seen in Fig. 5, and based on the higher the S/N ratiothe better is the result, the feed rate (factor B) is found to be
more significant followed by the cutting speed (factor A)and the axial depth of cut (factor C). The highest cuttingspeed (A3, 400 m/min), with the lowest feed rate (B1,0.05 mm/tooth), lowest axial depth of cut (C1, 0.5 mm),and the MQL lubrication mode (D3) are determined to bethe best choices for obtaining the lower cutting force.Therefore, the optimal parameters combination is set as A3B1 C1 D3.
For the surface roughness, Fig. 6 shows that the feed rate(factor B) is the prominent factor followed by the cuttingspeed (factor A), the axial depth of cut (factor C), andcutting mode (factor D). Consequently, the intermediatevalue of cutting speed (A2, 350 m/min), the lowest value ofthe feed rate (B1, 0.05 mm/tooth), the lowest value of thedepth of cut (C1, 0.5 mm) and MQL as lubrication mode issuggested as optimal parameters in order to obtain bettersurface roughness (A2 B1 C1 D3).
4.2.2 Pareto ANOVA: an alternative analysis
Pareto ANOVA is an alternative method used to analyze thedata for process optimization. It exhibits the percentage offactor influence for each parameter in a very simple way[19, 24]. Pareto ANOVA for resultant cutting force andsurface roughness are constructed in Tables 5 and 6,respectively, by using the S/N ratio response data fromTables 3 and 4. The summation of squares of differences(S) for each control factor is calculated such that, forexample, Sa can be obtained by the following equation:
Sa ¼ A1 � A2ð Þ2 þ A1 � A3ð Þ2 þ A2 � A3ð Þ2 ð2Þ
Factor and interaction Levels (i) Ai Bi Ci Di
Summation at the level of input parameter 1 −110.45 −93.44 −99.07 −109.302 −106.20 −110.28 −109.11 −103.773 −100.11 −113.04 −108.58 −103.69
Table 3 S/N ratio response dataof resultant cutting force
86 Int J Adv Manuf Technol (2012) 58:81–91
Fig. 4 An example of measured surface roughness at dry cutting, 300 m/min cutting speed, 0.05 mm/tooth feed rate, and 0.5 mm depth of cut
Sb, Sc, and Sd are similarly calculated. The contributionratio for each factor is obtained as the percentage of thesummation of squares of differences for each factor tothe total of summation of squares of differences. ThePareto diagram is plotted organizing the factors in ordersuch that the one has higher contribution comes firstfollowed by the others. The significant factors orparameters are chosen from the left-hand side of thePareto diagram, which cumulatively contribute up to90%. In Table 5, the feed rate (factor B, percentage of61.90%), axial depth of cut (factor C, percentage of17.55%), and cutting speed (factor A, percentage of14.87%) give prominent effect on the cutting force.However, the lubrication mode (factor D, percentage of5.68%) was found to be statistically insignificant. The bestcombination for lower resultant cutting force is A3 B1 C1D3. This result is found to be similar to the result obtainedby S/N ratio response analysis.
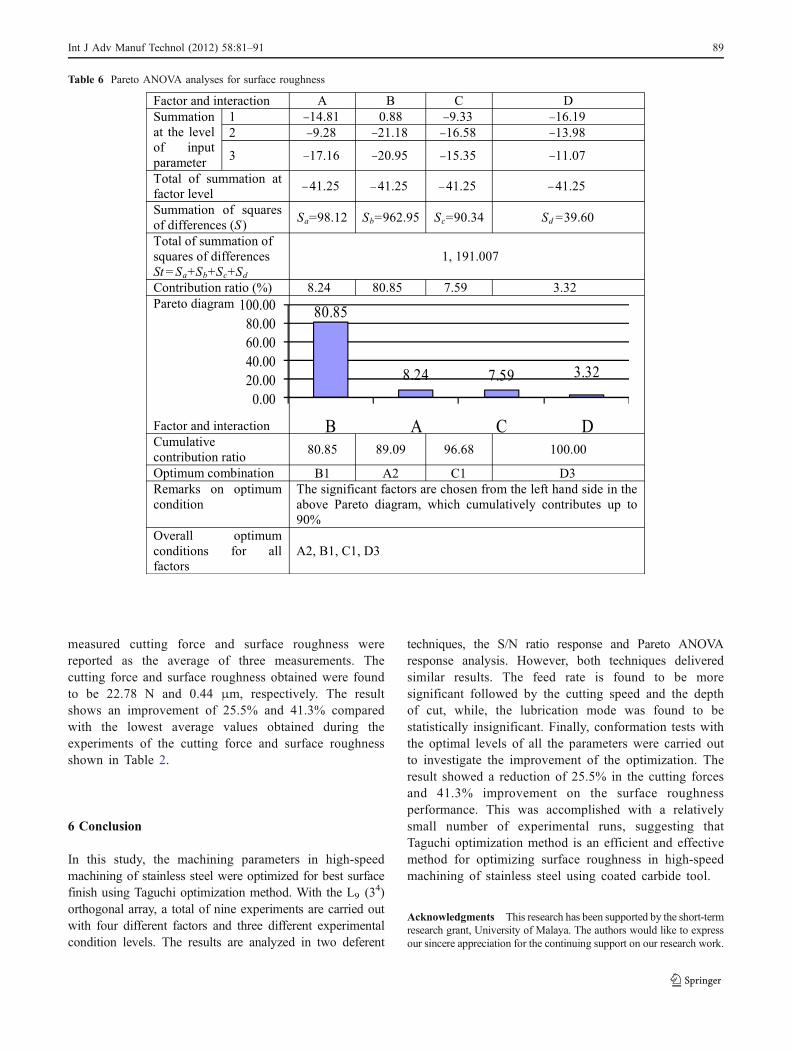
In Table 6, the surface roughness data is similarlycalculated. It is suggested that the feed rate (factor B,percentage of 80.85%) is the prominent factor affecting thesurface roughness followed by cutting speed (factor A,percentage of 8.24%) and axial depth of cut (factor C,percentage of 7.59%). Similarly, the lubrication mode(factor D, percentage of 3.32%) was found to be statisti-cally insignificant. The recommended optimal parametercombination for better surface roughness is A2 B1 C1 D3.This result is also found to be similar to the results obtainedfrom S/N ratio response analysis.
4.3 Discussion
In this study, two techniques of data analysis on theresults of the cutting force and surface roughness havebeen used. Both techniques delivered similar results. Thefeed rate is found to be the most prominent factorinfluencing the cutting force and surface roughness forhigh-speed milling followed by depth of cut. As can beseen from Figs. 5 and 6, the cutting forces increase withincreasing feed rate and depth of cut, while the lowervalues of the feed rate and depth of cut is recommendedfor better surface roughness. That is because the combi-nation of feed rate and depth of cut determines theundeformed chip section and hence the amount of thecutting forces required to remove a specified volume ofmaterial. By decreasing feed rate and depth of cut, lessmaterial has to be cut per tooth per revolution, thus energyrequired is lower. Consequently, this would reduce thecutting forces, consequently, preserve material propertiesagainst residual stress, change in micro hardness at thesubsurface, and leading to better surface roughness. Thiswould explain why feed rate and depth of cut play a keyrole in obtaining lowest cutting force and better surfaceroughness [19, 26].
Furthermore, in machining of the ductile material like thesteel AISI 304, the soft ferrite phase causes long tool–chipcontact length on the rake face. Increasing tool–chip contactlength reduces the shear plane angle and this, in turn, increasesshear stress. In addition, cutting forces also increase due to the
-25
-20
-15
-10
-5
0
5
A1 A2 A3 B1 B2 B3 C1 C2 C3 D1 D2 D3
S/N
rat
io (
dB)
Cutting parameter levels
Cutting speed
Feed rate
Axial depth of cut
Lubrication mode
Fig. 6 S/N ratio response graph of surface roughness
-120
-110
-100
-90
-80
-70
A1 A2 A3 B1 B2 B3 C1 C2 C3 D1 D2 D3
S/N
rat
io (
dB)
Cutting parameter levels
Cutting speed
Feed rate
Axial depth of cut
Lubrication mode
Fig. 5 S/N ratio response graph of resultant cutting force
Factor and interaction Levels (i) Ai Bi Ci Di
Summation at the level of input parameter 1 −14.81 0.88 −9.33 −16.192 −9.28 −21.18 −16.58 −13.983 −17.16 −20.95 −15.35 −11.07
Table 4 S/N ratio response dataof surface roughness
Int J Adv Manuf Technol (2012) 58:81–91 87
long tool–chip contact length as a result of increased frictionforces. Heat is generated as well at several points duringmachining of ductile materials. Firstly, at the primary deforma-tion zone due to shear and plastic deformation. Secondly, at thechip–tool interface due to secondary deformation and sliding.Lastly, at the work–tool interfaces due to rubbing [27]. Theamount of heat generated varies with the type of materialbeing machined and cutting parameters especially cuttingspeed, which had the most influence on the temperature [13].Hence, the higher cutting temperature associated with the highspindle speed increases softening of the workpiece materialand then reduces the cutting forces leading to better surfaceroughness. In addition, at higher spindle speed, the chip willbreak away with less material deformation at the immediatetool tip, which in turn preserves the machined surfaceproperties leading to better surface roughness. However, it isbelieved that the spindle speed should be controlled at anoptimum value, as the influence of the high temperature,would significantly affect the chip formation mode, cuttingforces, tool life, and surface roughness [26]. Thus the
implementation of cutting fluid, which acts as a coolant,is very crucial. In addition, it is not only important as acoolant but also during cutting, the friction coefficient isreduced and the lubrication features enhanced, thusreduce the friction more and consequentially improvethe surface roughness of the machined workpiece. TheMQL lubrication mode is found to be the most efficientlubrication system to achieve lower cutting force andbetter surface roughness as can be seen in Figs. 5 and 6.The neat cutting oil in MQL has a better lubricationproperty than the soluble oil in conventional flooding andobviously better than dry cutting.
5 Confirmation test
After the optimal levels of all control factors are identified,the last step in the Taguchi optimization method is toconduct a confirmation test using the optimal parametersA2 B1 C1 D3 to validate the recommendation. The
Table 5 Pareto ANOVA analysis for cutting force
88 Int J Adv Manuf Technol (2012) 58:81–91
measured cutting force and surface roughness werereported as the average of three measurements. Thecutting force and surface roughness obtained were foundto be 22.78 N and 0.44 μm, respectively. The resultshows an improvement of 25.5% and 41.3% comparedwith the lowest average values obtained during theexperiments of the cutting force and surface roughnessshown in Table 2.
6 Conclusion
In this study, the machining parameters in high-speedmachining of stainless steel were optimized for best surfacefinish using Taguchi optimization method. With the L9 (34)orthogonal array, a total of nine experiments are carried outwith four different factors and three different experimentalcondition levels. The results are analyzed in two deferent
techniques, the S/N ratio response and Pareto ANOVAresponse analysis. However, both techniques deliveredsimilar results. The feed rate is found to be moresignificant followed by the cutting speed and the depthof cut, while, the lubrication mode was found to bestatistically insignificant. Finally, conformation tests withthe optimal levels of all the parameters were carried outto investigate the improvement of the optimization. Theresult showed a reduction of 25.5% in the cutting forcesand 41.3% improvement on the surface roughnessperformance. This was accomplished with a relativelysmall number of experimental runs, suggesting thatTaguchi optimization method is an efficient and effectivemethod for optimizing surface roughness in high-speedmachining of stainless steel using coated carbide tool.
Acknowledgments This research has been supported by the short-termresearch grant, University of Malaya. The authors would like to expressour sincere appreciation for the continuing support on our research work.
Table 6 Pareto ANOVA analyses for surface roughness
Int J Adv Manuf Technol (2012) 58:81–91 89
Appendix A
References
1. Rama Kotaiah K, Srinivas J, Babu KJ, Srinivas K (2010)Prediction of optimal cutting states during inward turning: anexperimental approach. Mater Manuf Processes 25(6):432–441,1532–2475
2. Anthony Xavior M, Adithan M (2009) Determining the influenceof cutting fluids on tool wear and surface roughness duringturning of AISI 304 austenitic stainless steel. J Mater ProcessTechnol 209:900–909
3. Dhar NR, Kamruzzaman M, Ahmed M (2006) Effect ofminimum quantity lubrication (MQL) on tool wear and surfaceroughness in turning AISI-4340 steel. J Mater Process Technol172:299–304
4. Ezugwu EO, Bonney J, Fadare DA, Sales WF (2005) Machiningof nickel-base, Inconel 718, alloy with ceramic tools underfinishing conditions with various coolant supply pressures. JMater Process Technol 162–163:609–614
5. Isik Y (2007) Investigating the machinability of tool steels inturning operations. Mater Des 28:1417–1424
6. Teicher U, Künanz K, Ghosh A, Chattopadhyay AB (2008)Performance of diamond and CBN single-layered grinding wheelsin grinding titanium. Mater Manuf Processes 23(3):224–227,1532–2475
7. Noordin MY, Venkatesh VC, Chan CL, Abdullah A (2001)Performance evaluation of cemented carbide tools in turning AISI1010 steel. J Mater Process Technol 116:16–21
8. Zafer T, Sezgin Y (2004) Investigation of the cutting parametersdepending on process sound during turning of AISI 304 austeniticstainless steel. Mater Des 25:507–513
9. Thepsonthi T, Hamdi M, Mitsui K (2009) Investigation intominimal-cutting-fluid application in high-speed milling of hard-ened steel using carbide mills. Int J Mach Tools Manuf 49:156–162
10. Sayit E, Aslantas K, Çiçek A (2009) Tool wear mechanism ininterrupted cutting conditions. Mater Manuf Processes 24(4):476–483, 1532–2475
11. Klocke F, Einesblatter G (1997) Dry cutting. Annals CIRP46:519–526
12. Ming C, Fanghong S, Haili W, Renwei Y, Zhenghong Q, ShuqiaoZ (2003) Experimental research on the dynamic characteristics ofthe cutting temperature in the process of high-speed milling. JMater Process Technol 138:468–471
13. Liu CS, Zhao B, Gao GF, Jiao F (2002) Research on thecharacteristics of the cutting force in the vibration cutting of aparticle-reinforced metal matrix composites SiCp/Al. J MaterProcess Technol 129:196–199
14. Da Silva MB, Wallbank J (1999) Cutting temperature: predictionand measurement methods—a review. J Mater Process Technol88:195–202
15. Kundrák J, Mamalis AG, Gyáni K, Markopoulos A (2006)Environmentally friendly precision machining. Mater ManufProcesses 21(1):29–37, 1532–2475
16. Kurniawan D, Yusof NM, Sharif S (2010) Hard machining ofstainless steel using wiper coated carbide: tool life and surfaceintegrity. Mater Manuf Processes 25(6):370–377, 1532–2475
17. Paulo Davim J, Sreejith PS, Silva J (2007) Turning of brassesusing minimum quantity of lubricant (MQL) and floodedlubricant conditions. Mater Manuf Processes 22(1):45–50,1532–2475
18. Varadarajan AS, Philip PK, Ramamoorthy B (2002) Investigationon hard turning with minimal cutting fluid application (HTMF)and its comparison with dry and wet turning. Int J Mach ToolsManuf 42:193–200
19. Ghani JA, Choudhury IA, Hassan HH (2004) Application ofTaguchi method in the optimization of end milling. J MaterProcess Technol 145:84–92
20. Abou-El-Hossein KA (2008) Cutting fluid efficiency in endmilling of AISI stainless steel. Ind Lubric Tribol 60:115–120
Table 7 Recommended cutting conditions (for single-edge type)
Workpiecematerial
Grade Cutting diameter
∅10, ∅15 ∅16, ∅25 ∅32, ∅63 ∅80, ∅100
V (m/min) fz (mm/tooth) V (m/min) tz (mm/tooth) V (m/min) fz (mmf/tooth) V (m/min) fz (mm/tooth)
Low carbonsteels,soft steels
NCM325PC3535
60–120 0.05–0.15 80–180 0.1–0.15 120–250 01–0.15 150–250 0.1–0.15
High carbonsteels,alloy steels
NCM325PC3535
50–100 0.05–0.15 80–150 0.1–0.15 100–200 0.1–0.15 100–200 0.1–0.15
Stainlesssteels
NCM335PC9530
50–100 0.05–0.15 80–150 0.1–0.15 100–180 0.1–0.15 100–180. 0.1–0.15
Cast irons NCM320KPC215K
80–120 0.08–0.2 100–130 0.15–0.2 120–200 0.15–0.2 120–200 0.15–0.2
Aluminumalloy
H0l 250–900 0.15–0.3 300–950 0.15–0.3 400–1,000 0.1–0.4 400–1,000 0.1–0.4
Standard for side cutting, reduce condition 20–30% for slotting
Source: Korloy catalog book version June 2006, page 311
90 Int J Adv Manuf Technol (2012) 58:81–91

21. Gandarias A, de Luis Norberto Lopez L, Aizpitarte X, Lamikiz A (2008)Study of the performance of the turning and drilling of austenitic stainlesssteels using two coolant techniques. Int J Mach Mach Mater 3:1–17
22. Taguchi G (1990) Introduction to quality engineering. AsianProductivity Organization, Tokyo
23. Zhang JZ, Chen JC, Kirby ED (2007) Surface roughnessoptimization in an end-milling operation using the Taguchi designmethod. J Mater Process Technol 184:233–239
24. Park SH (1996) Robust design and analysis for quality engineering.Chapman & Hall, London
25. Phadke MS (1989) Quality engineering using robust design.Prentice Hall, Englewood Cliffs, NJ
26. Suresh Kumar Reddy N, Venkateswara Rao P (2005) Performanceimprovement of end milling using graphite as a solid lubricant.Mater Manuf Processes 20(4):673–686, 1532–2475
27. Khan MMA, Dhar NR (2006) Performance evaluation ofminimum quantity lubrication by vegetable oil in terms of cuttingforce, cutting zone temperature, tool wear, job dimension andsurface finish in turning AISI-1060 steel. J Zhejiang University7:1790–1799
Int J Adv Manuf Technol (2012) 58:81–91 91


