Embed Size (px)
Citation preview
RESEARCH ARTICLE Open Access
An untargeted multi-technique metabolomicsapproach to studying intracellular metabolites ofHepG2 cells exposed to 2,3,7,8-tetrachlorodibenzo-p-dioxinAinhoa Ruiz-Aracama1,3*, Ad Peijnenburg1,3, Jos Kleinjans2,3, Danyel Jennen2,3, Joost van Delft2,3,Caroline Hellfrisch1 and Arjen Lommen1,3
Abstract
Background: In vitro cell systems together with omics methods represent promising alternatives to conventionalanimal models for toxicity testing. Transcriptomic and proteomic approaches have been widely applied in vitro butrelatively few studies have used metabolomics. Therefore, the goal of the present study was to develop anuntargeted methodology for performing reproducible metabolomics on in vitro systems. The human liver cell lineHepG2, and the well-known hepatotoxic and non-genotoxic carcinogen 2,3,7,8-tetrachlorodibenzo-p-dioxin (TCDD),were used as the in vitro model system and model toxicant, respectively.
Results: The study focused on the analysis of intracellular metabolites using NMR, LC-MS and GC-MS, withemphasis on the reproducibility and repeatability of the data. State of the art pre-processing and alignment toolsand multivariate statistics were used to detect significantly altered levels of metabolites after exposing HepG2 cellsto TCDD. Several metabolites identified using databases, literature and LC-nanomate-Orbitrap analysis were affectedby the treatment. The observed changes in metabolite levels are discussed in relation to the reported effects ofTCDD.
Conclusions: Untargeted profiling of the polar and apolar metabolites of in vitro cultured HepG2 cells is a validapproach to studying the effects of TCDD on the cell metabolome. The approach described in this researchdemonstrates that highly reproducible experiments and correct normalization of the datasets are essential forobtaining reliable results. The effects of TCDD on HepG2 cells reported herein are in agreement with previousstudies and serve to validate the procedures used in the present work.
BackgroundMetabolomics has been defined as the quantitative mea-surement of the multi-parametric metabolic response ofliving systems to patho-physiological stimuli or geneticmodification [1]. It encompasses the qualitative andquantitative measurement of metabolites interacting in abiological system; targeted and untargeted strategies foranalysis of metabolites can be used. Targeted studiesfocus on the analysis of a predefined list of metabolites,whereas the initial objective of untargeted metabolomics
is to analyze as many non-predefined metabolites aspossible at the raw signal level. With the latterapproach, identification is only carried out on relevantsignals [2,3].Recently, there has been an exponential growth in the
number of published papers concerning metabolomicsof a wide variety of systems [4-7]. Metabolomicapproaches have been used for toxicological studies [8].However, in most cases, biofluids or tissues from in vivoexperiments have been analyzed [8,9]. Few toxicologicalstudies have been published that concern the profilingof intracellular metabolites using in vitro cell culturesystems [10,11]
* Correspondence: [email protected] of Food Safety, Wageningen University and Research Centre,P.O. Box 230, 6700 AE, Wageningen, The NetherlandsFull list of author information is available at the end of the article
Ruiz-Aracama et al. BMC Genomics 2011, 12:251http://www.biomedcentral.com/1471-2164/12/251
© 2011 Ruiz-Aracama et al; licensee BioMed Central Ltd. This is an Open Access article distributed under the terms of the CreativeCommons Attribution License (http://creativecommons.org/licenses/by/2.0), which permits unrestricted use, distribution, andreproduction in any medium, provided the original work is properly cited.
Owing to ethical concerns (animal welfare) and costefficiency, there is a need to develop alternatives to con-ventional toxicity testing incorporating animals [12].Among these alternatives, in vitro systems are consid-ered particularly promising [13,14]. Much research hasfocused on the analysis of the effects of toxic com-pounds using in vitro systems and omics techniques[15-18]. However, transcriptomics and proteomics havepredominantly been used to elucidate the toxic mechan-isms of the studied compounds.The goals of the present work were two-fold. First, to
develop an untargeted in vitro cell system methodologywith reproducible metabolomics; second, to evaluatetoxicant-induced cell responses on metabolic levels withregards to published data concerning the toxicant,thereby substantiating the methodology. TCDD (2,3,7,8-tetrabenzodi-p-dioxin) was chosen as the model toxiccompound as it has been widely studied in vivo and invitro [15,19,20], particularly in terms of its hepatotoxic,carcinogenic and immunotoxic effects. Toxic effects ofdioxins mediated by the aryl hydrocarbon receptor(AhR) include the wasting syndrome [21], the inductionof oxidative damage [22,23], hepatic injury and carcino-genesis [24,25]. TCDD has also been reported to havean anti-proliferative effect [26].TCDD is an agonist of AhR, a cytosolic ligand-acti-
vated transcription factor. Upon activation, AhRdimerizes with ARNT to form a heterodimer that bindsto DNA sequences called xenobiotic response elements(XREs). Through such binding, AhR up-regulates theexpression of several downstream genes including thoseencoding xenobiotic metabolizing enzymes such asPhase I (e.g. cytochrome P450 monooxygenases) andPhase II (e.g. glutathione S-transferases, sulfotrans-ferases) biotransformation enzymes [27].In this study, the human hepatoma cell line HepG2
was chosen for experiments concerning in vitro expo-sure to TCDD as this compound is a well known livertoxicant. HepG2 cells have preserved the activities ofseveral phase I and phase II enzymes [28]. Conse-quently, HepG2 cells have been widely used as a modelfor various omics studies concerning carcinogenicity andhepatotoxicity [28-30]. Furthermore, this cell line hasbeen exploited for studying the effects of TCDD ongene expression using transcriptomics [15-17,26].For the untargeted metabolomics approach used in
this study, multiple complementary analytical techniqueswere applied to polar and apolar cell lysate fractions, i.e.NMR and GCMS to the apolar fraction, and NMR andLCMS to the polar fraction. Data analysis was per-formed using state-of-the-art software [31-33] for pre-processing and alignment of data sets in combinationwith multivariate statistical analysis and advanced identi-fication technology.
Particular emphasis was placed on the repeatability ofexperiments, reproducibility of metabolic changes, nor-malization and validation of the results by literaturecomparison.
ResultsThe advantages and limitations of omics techniquesapplied to in vitro systems must be elucidated before invitro omics-based alternatives to conventional toxicitystudies are considered valid. The goal of the presentstudy was to develop a reproducible untargeted metabo-lomics methodology for in vitro studies using theHepG2 human hepatocarcinoma cell line exposed toTCDD for 48 h.Cell extracts containing intracellular metabolites were
separated into polar and apolar fractions and subjectedto 1D 1H-NMR and LC-MS or 1D 1H-NMR and GC-MS,respectively. The majority of NMR and MS data obtainedwere complementary in terms of their information con-tent. Raw data were pre-processed and aligned using spe-cific software enabling statistical analysis. Subsequently,metabolites with significantly altered levels were identi-fied using databases, literature and LC-nanomate-Orbi-trap analysis. In this study, a particular focus concernedthe repeatability of experiments with HepG2 cellsobtained from different passages, and reproducibility ofbiological replicates from the same passage, and normali-zation of experimental data prior to comparison. Resultswere compared with data from previous studies concern-ing the effects of TCDD in non-metabolomics studies.The first major problem addressed was the normaliza-
tion of chemical profiles. In this study, typical changesin metabolite concentrations were between 20 and100%. Compounds such as TCDD can influence overallcell metabolism and cause a decrease in the rate of cellproliferation. Therefore, the net effect of exposure canbe an overall decrease of metabolites because there isless cell material. If this is not taken into account it willdominate the metabolomics results and metabolic effectsmay go undetected. Furthermore, in order to identifystatistically significant changes in metabolite concentra-tions in the order of 20 to 100%, it was essential to havemultiple replicates.Preliminary studies in our laboratory have shown that
the age of cell cultures (expressed as passage number)could influence the magnitude of the effect of the expo-sure on the cell metabolome. To address this issue,HepG2 cells obtained from different passage numberswere exposed to medium containing 10 nM TCDD orthe vehicle, DMSO, for a period of 48 h.
The apolar fractionNMR analyses of the apolar fraction were performedusing the same deuterated chloroform. Therefore, the
Ruiz-Aracama et al. BMC Genomics 2011, 12:251http://www.biomedcentral.com/1471-2164/12/251
Page 2 of 19
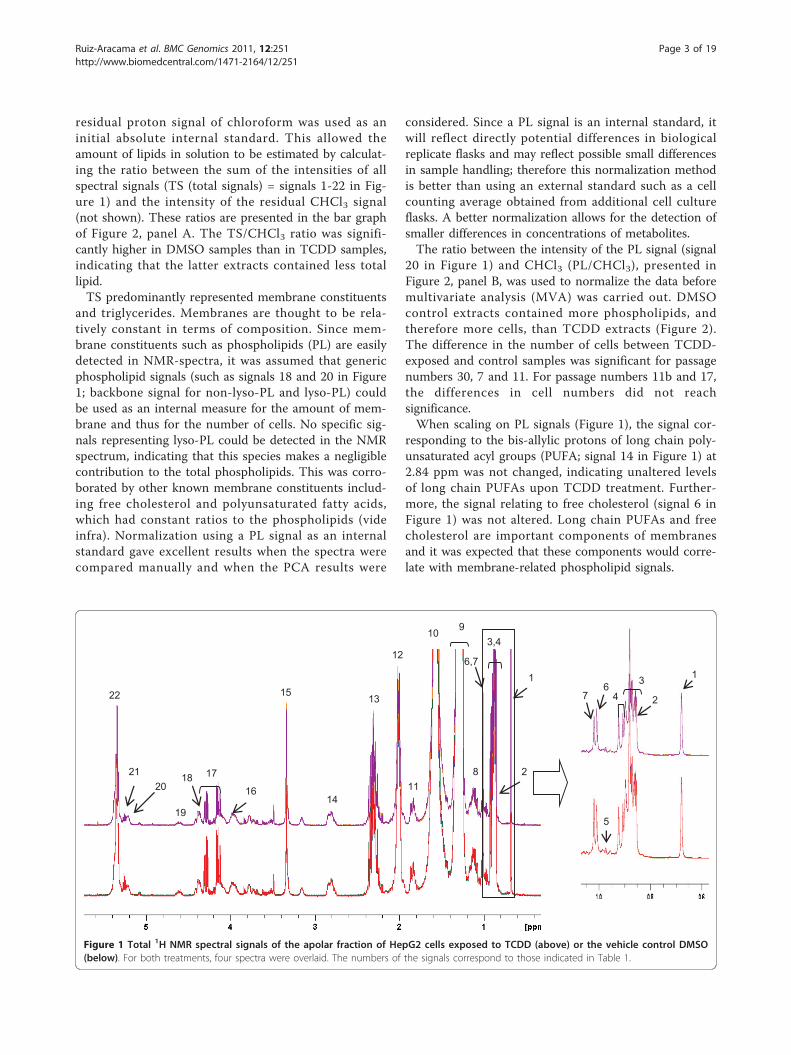
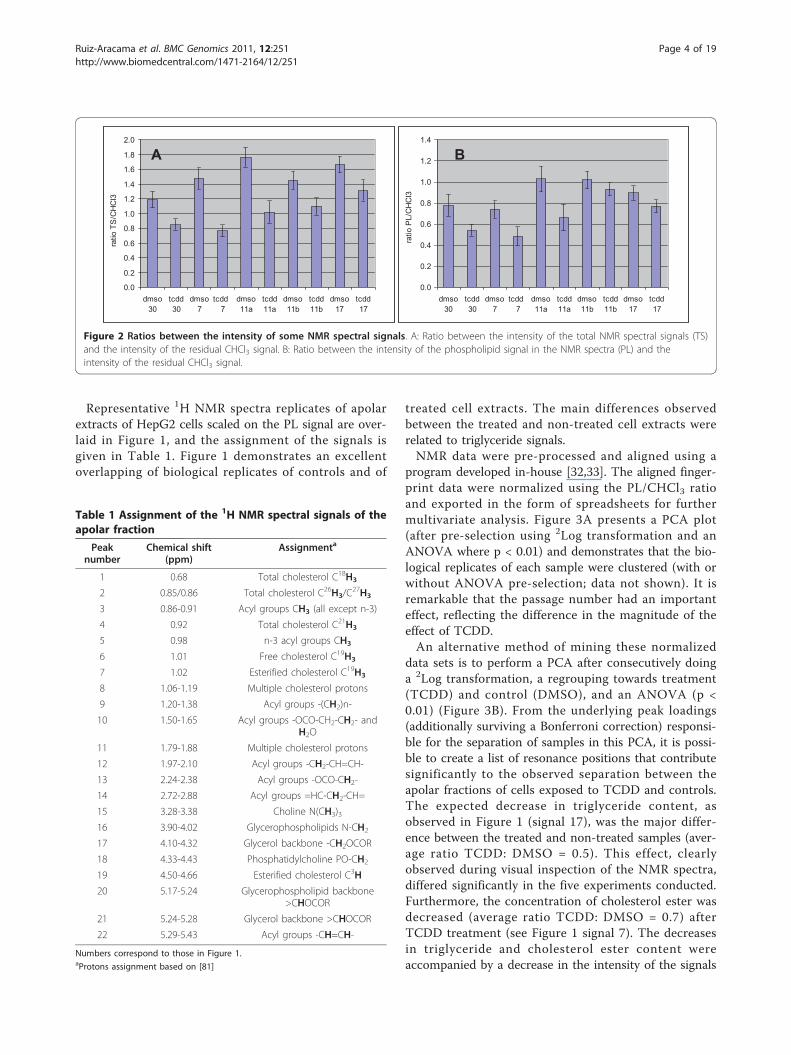
residual proton signal of chloroform was used as aninitial absolute internal standard. This allowed theamount of lipids in solution to be estimated by calculat-ing the ratio between the sum of the intensities of allspectral signals (TS (total signals) = signals 1-22 in Fig-ure 1) and the intensity of the residual CHCl3 signal(not shown). These ratios are presented in the bar graphof Figure 2, panel A. The TS/CHCl3 ratio was signifi-cantly higher in DMSO samples than in TCDD samples,indicating that the latter extracts contained less totallipid.TS predominantly represented membrane constituents
and triglycerides. Membranes are thought to be rela-tively constant in terms of composition. Since mem-brane constituents such as phospholipids (PL) are easilydetected in NMR-spectra, it was assumed that genericphospholipid signals (such as signals 18 and 20 in Figure1; backbone signal for non-lyso-PL and lyso-PL) couldbe used as an internal measure for the amount of mem-brane and thus for the number of cells. No specific sig-nals representing lyso-PL could be detected in the NMRspectrum, indicating that this species makes a negligiblecontribution to the total phospholipids. This was corro-borated by other known membrane constituents includ-ing free cholesterol and polyunsaturated fatty acids,which had constant ratios to the phospholipids (videinfra). Normalization using a PL signal as an internalstandard gave excellent results when the spectra werecompared manually and when the PCA results were
considered. Since a PL signal is an internal standard, itwill reflect directly potential differences in biologicalreplicate flasks and may reflect possible small differencesin sample handling; therefore this normalization methodis better than using an external standard such as a cellcounting average obtained from additional cell cultureflasks. A better normalization allows for the detection ofsmaller differences in concentrations of metabolites.The ratio between the intensity of the PL signal (signal
20 in Figure 1) and CHCl3 (PL/CHCl3), presented inFigure 2, panel B, was used to normalize the data beforemultivariate analysis (MVA) was carried out. DMSOcontrol extracts contained more phospholipids, andtherefore more cells, than TCDD extracts (Figure 2).The difference in the number of cells between TCDD-exposed and control samples was significant for passagenumbers 30, 7 and 11. For passage numbers 11b and 17,the differences in cell numbers did not reachsignificance.When scaling on PL signals (Figure 1), the signal cor-
responding to the bis-allylic protons of long chain poly-unsaturated acyl groups (PUFA; signal 14 in Figure 1) at2.84 ppm was not changed, indicating unaltered levelsof long chain PUFAs upon TCDD treatment. Further-more, the signal relating to free cholesterol (signal 6 inFigure 1) was not altered. Long chain PUFAs and freecholesterol are important components of membranesand it was expected that these components would corre-late with membrane-related phospholipid signals.
1
2
3,4
8
9
11
12
13
1416
1718
19
2021
22
6,7
10
15
1
2
37
64
5
Figure 1 Total 1H NMR spectral signals of the apolar fraction of HepG2 cells exposed to TCDD (above) or the vehicle control DMSO(below). For both treatments, four spectra were overlaid. The numbers of the signals correspond to those indicated in Table 1.
Ruiz-Aracama et al. BMC Genomics 2011, 12:251http://www.biomedcentral.com/1471-2164/12/251
Page 3 of 19
Representative 1H NMR spectra replicates of apolarextracts of HepG2 cells scaled on the PL signal are over-laid in Figure 1, and the assignment of the signals isgiven in Table 1. Figure 1 demonstrates an excellentoverlapping of biological replicates of controls and of
treated cell extracts. The main differences observedbetween the treated and non-treated cell extracts wererelated to triglyceride signals.NMR data were pre-processed and aligned using a
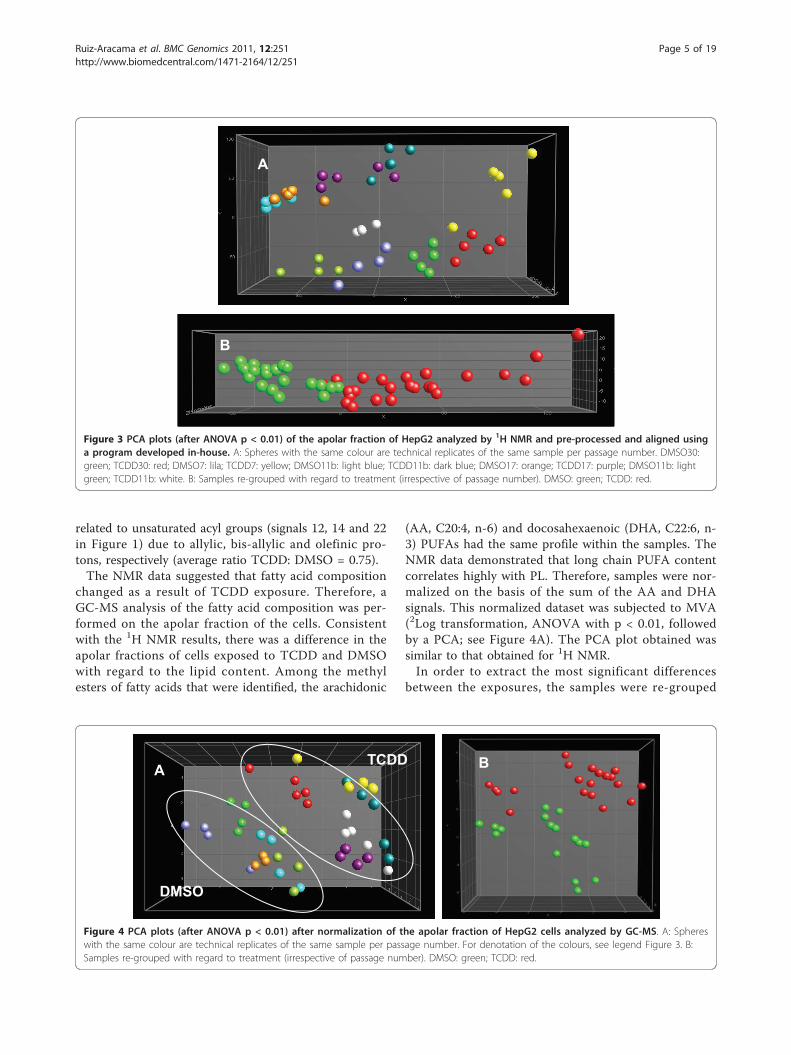
program developed in-house [32,33]. The aligned finger-print data were normalized using the PL/CHCl3 ratioand exported in the form of spreadsheets for furthermultivariate analysis. Figure 3A presents a PCA plot(after pre-selection using 2Log transformation and anANOVA where p < 0.01) and demonstrates that the bio-logical replicates of each sample were clustered (with orwithout ANOVA pre-selection; data not shown). It isremarkable that the passage number had an importanteffect, reflecting the difference in the magnitude of theeffect of TCDD.An alternative method of mining these normalized
data sets is to perform a PCA after consecutively doinga 2Log transformation, a regrouping towards treatment(TCDD) and control (DMSO), and an ANOVA (p <0.01) (Figure 3B). From the underlying peak loadings(additionally surviving a Bonferroni correction) responsi-ble for the separation of samples in this PCA, it is possi-ble to create a list of resonance positions that contributesignificantly to the observed separation between theapolar fractions of cells exposed to TCDD and controls.The expected decrease in triglyceride content, asobserved in Figure 1 (signal 17), was the major differ-ence between the treated and non-treated samples (aver-age ratio TCDD: DMSO = 0.5). This effect, clearlyobserved during visual inspection of the NMR spectra,differed significantly in the five experiments conducted.Furthermore, the concentration of cholesterol ester wasdecreased (average ratio TCDD: DMSO = 0.7) afterTCDD treatment (see Figure 1 signal 7). The decreasesin triglyceride and cholesterol ester content wereaccompanied by a decrease in the intensity of the signals
0.0
0.2
0.4
0.6
0.8
1.0
1.2
1.4
1.6
1.8
2.0
dmso30
tcdd30
dmso7
tcdd 7
dmso11a
tcdd11a
dmso11b
tcdd11b
dmso17
tcdd17
ratio
TS
/CH
Cl3
0.0
0.2
0.4
0.6
0.8
1.0
1.2
1.4
dmso30
tcdd30
dmso7
tcdd 7
dmso11a
tcdd11a
dmso11b
tcdd11b
dmso17
tcdd17
ratio
PL/
CH
Cl3
A B
Figure 2 Ratios between the intensity of some NMR spectral signals. A: Ratio between the intensity of the total NMR spectral signals (TS)and the intensity of the residual CHCl3 signal. B: Ratio between the intensity of the phospholipid signal in the NMR spectra (PL) and theintensity of the residual CHCl3 signal.
Table 1 Assignment of the 1H NMR spectral signals of theapolar fraction
Peaknumber
Chemical shift(ppm)
Assignmenta
1 0.68 Total cholesterol C18H3
2 0.85/0.86 Total cholesterol C26H3/C27H3
3 0.86-0.91 Acyl groups CH3 (all except n-3)
4 0.92 Total cholesterol C21H3
5 0.98 n-3 acyl groups CH3
6 1.01 Free cholesterol C19H3
7 1.02 Esterified cholesterol C19H3
8 1.06-1.19 Multiple cholesterol protons
9 1.20-1.38 Acyl groups -(CH2)n-
10 1.50-1.65 Acyl groups -OCO-CH2-CH2- andH2O
11 1.79-1.88 Multiple cholesterol protons
12 1.97-2.10 Acyl groups -CH2-CH=CH-
13 2.24-2.38 Acyl groups -OCO-CH2-
14 2.72-2.88 Acyl groups =HC-CH2-CH=
15 3.28-3.38 Choline N(CH3)316 3.90-4.02 Glycerophospholipids N-CH2
17 4.10-4.32 Glycerol backbone -CH2OCOR
18 4.33-4.43 Phosphatidylcholine PO-CH2
19 4.50-4.66 Esterified cholesterol C3H
20 5.17-5.24 Glycerophospholipid backbone>CHOCOR
21 5.24-5.28 Glycerol backbone >CHOCOR
22 5.29-5.43 Acyl groups -CH=CH-
Numbers correspond to those in Figure 1.aProtons assignment based on [81]
Ruiz-Aracama et al. BMC Genomics 2011, 12:251http://www.biomedcentral.com/1471-2164/12/251
Page 4 of 19
related to unsaturated acyl groups (signals 12, 14 and 22in Figure 1) due to allylic, bis-allylic and olefinic pro-tons, respectively (average ratio TCDD: DMSO = 0.75).The NMR data suggested that fatty acid composition
changed as a result of TCDD exposure. Therefore, aGC-MS analysis of the fatty acid composition was per-formed on the apolar fraction of the cells. Consistentwith the 1H NMR results, there was a difference in theapolar fractions of cells exposed to TCDD and DMSOwith regard to the lipid content. Among the methylesters of fatty acids that were identified, the arachidonic
(AA, C20:4, n-6) and docosahexaenoic (DHA, C22:6, n-3) PUFAs had the same profile within the samples. TheNMR data demonstrated that long chain PUFA contentcorrelates highly with PL. Therefore, samples were nor-malized on the basis of the sum of the AA and DHAsignals. This normalized dataset was subjected to MVA(2Log transformation, ANOVA with p < 0.01, followedby a PCA; see Figure 4A). The PCA plot obtained wassimilar to that obtained for 1H NMR.In order to extract the most significant differences
between the exposures, the samples were re-grouped
B
A
Figure 3 PCA plots (after ANOVA p < 0.01) of the apolar fraction of HepG2 analyzed by 1H NMR and pre-processed and aligned usinga program developed in-house. A: Spheres with the same colour are technical replicates of the same sample per passage number. DMSO30:green; TCDD30: red; DMSO7: lila; TCDD7: yellow; DMSO11b: light blue; TCDD11b: dark blue; DMSO17: orange; TCDD17: purple; DMSO11b: lightgreen; TCDD11b: white. B: Samples re-grouped with regard to treatment (irrespective of passage number). DMSO: green; TCDD: red.
A B
DMSO
TCDD
Figure 4 PCA plots (after ANOVA p < 0.01) after normalization of the apolar fraction of HepG2 cells analyzed by GC-MS. A: Sphereswith the same colour are technical replicates of the same sample per passage number. For denotation of the colours, see legend Figure 3. B:Samples re-grouped with regard to treatment (irrespective of passage number). DMSO: green; TCDD: red.
Ruiz-Aracama et al. BMC Genomics 2011, 12:251http://www.biomedcentral.com/1471-2164/12/251
Page 5 of 19
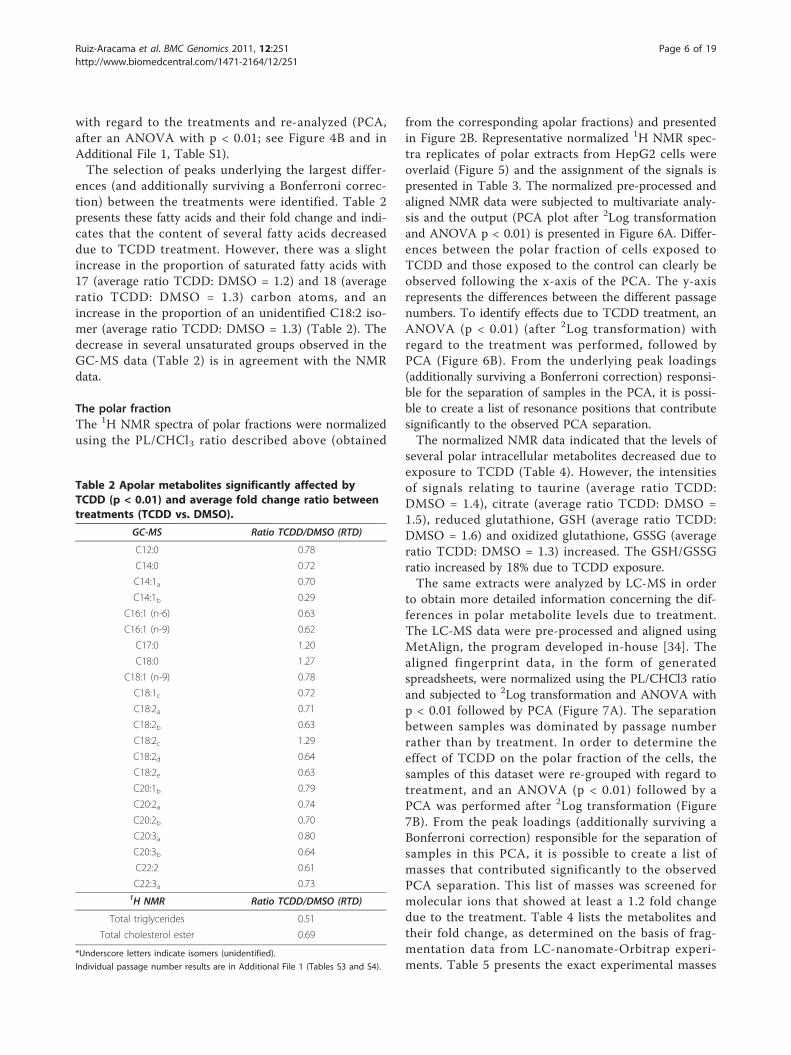
with regard to the treatments and re-analyzed (PCA,after an ANOVA with p < 0.01; see Figure 4B and inAdditional File 1, Table S1).The selection of peaks underlying the largest differ-
ences (and additionally surviving a Bonferroni correc-tion) between the treatments were identified. Table 2presents these fatty acids and their fold change and indi-cates that the content of several fatty acids decreaseddue to TCDD treatment. However, there was a slightincrease in the proportion of saturated fatty acids with17 (average ratio TCDD: DMSO = 1.2) and 18 (averageratio TCDD: DMSO = 1.3) carbon atoms, and anincrease in the proportion of an unidentified C18:2 iso-mer (average ratio TCDD: DMSO = 1.3) (Table 2). Thedecrease in several unsaturated groups observed in theGC-MS data (Table 2) is in agreement with the NMRdata.
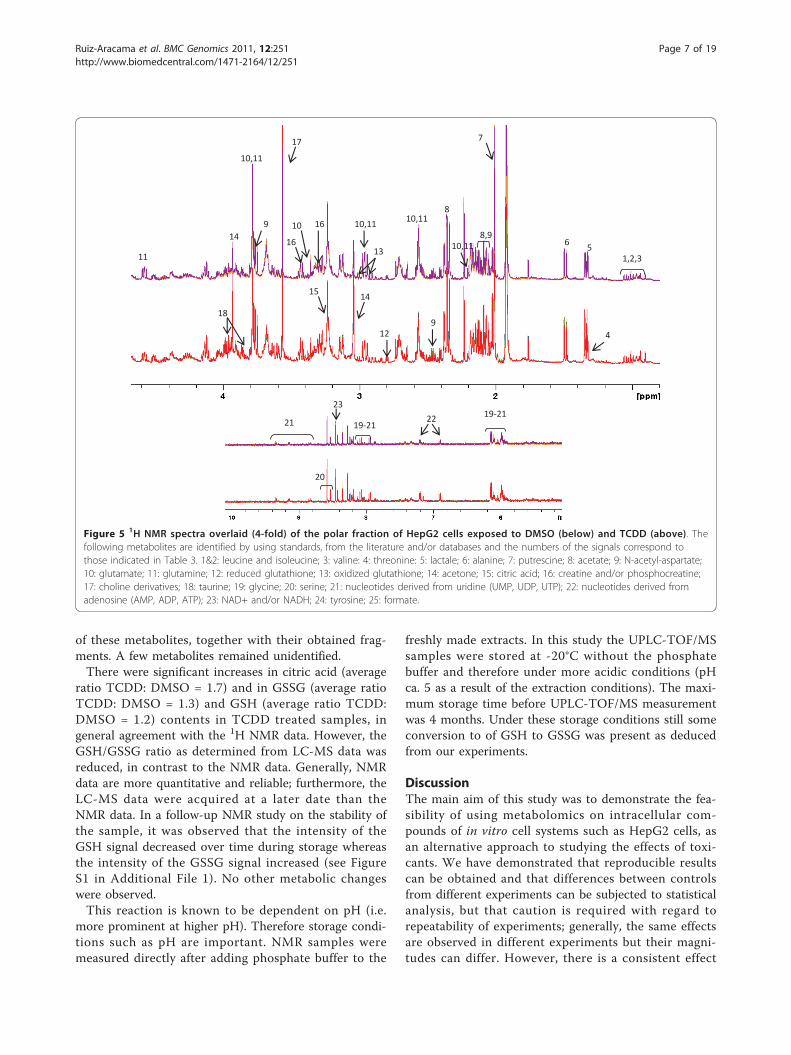
The polar fractionThe 1H NMR spectra of polar fractions were normalizedusing the PL/CHCl3 ratio described above (obtained
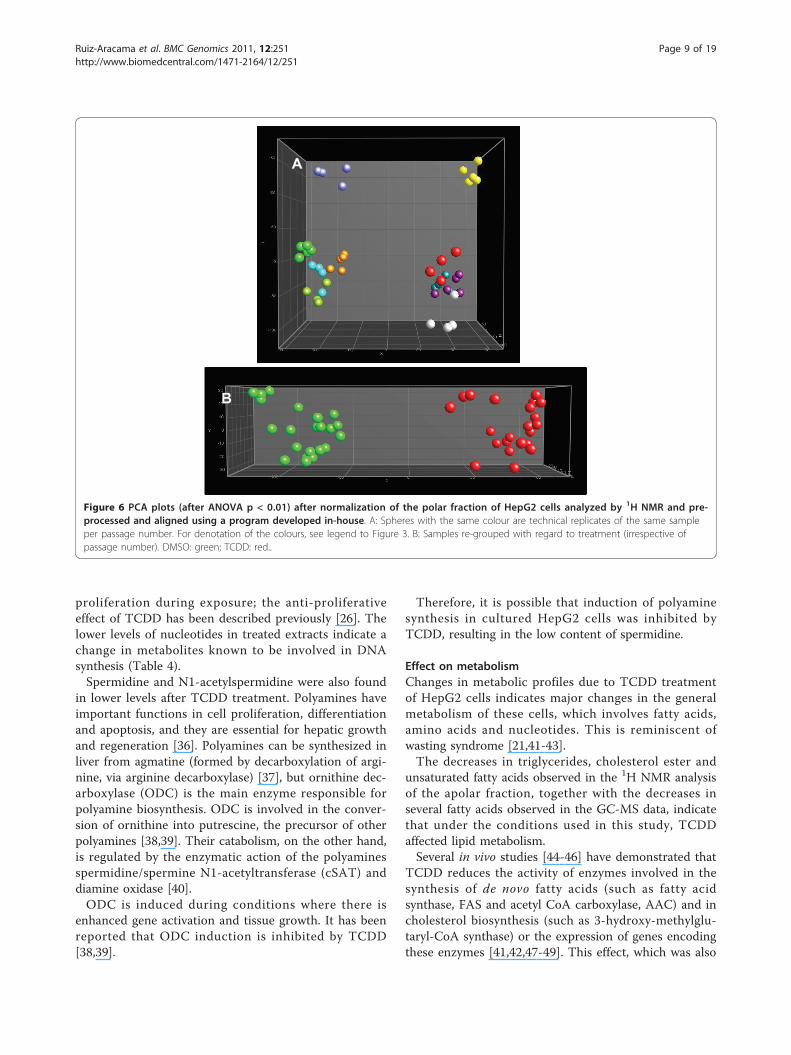
from the corresponding apolar fractions) and presentedin Figure 2B. Representative normalized 1H NMR spec-tra replicates of polar extracts from HepG2 cells wereoverlaid (Figure 5) and the assignment of the signals ispresented in Table 3. The normalized pre-processed andaligned NMR data were subjected to multivariate analy-sis and the output (PCA plot after 2Log transformationand ANOVA p < 0.01) is presented in Figure 6A. Differ-ences between the polar fraction of cells exposed toTCDD and those exposed to the control can clearly beobserved following the x-axis of the PCA. The y-axisrepresents the differences between the different passagenumbers. To identify effects due to TCDD treatment, anANOVA (p < 0.01) (after 2Log transformation) withregard to the treatment was performed, followed byPCA (Figure 6B). From the underlying peak loadings(additionally surviving a Bonferroni correction) responsi-ble for the separation of samples in the PCA, it is possi-ble to create a list of resonance positions that contributesignificantly to the observed PCA separation.The normalized NMR data indicated that the levels of
several polar intracellular metabolites decreased due toexposure to TCDD (Table 4). However, the intensitiesof signals relating to taurine (average ratio TCDD:DMSO = 1.4), citrate (average ratio TCDD: DMSO =1.5), reduced glutathione, GSH (average ratio TCDD:DMSO = 1.6) and oxidized glutathione, GSSG (averageratio TCDD: DMSO = 1.3) increased. The GSH/GSSGratio increased by 18% due to TCDD exposure.The same extracts were analyzed by LC-MS in order
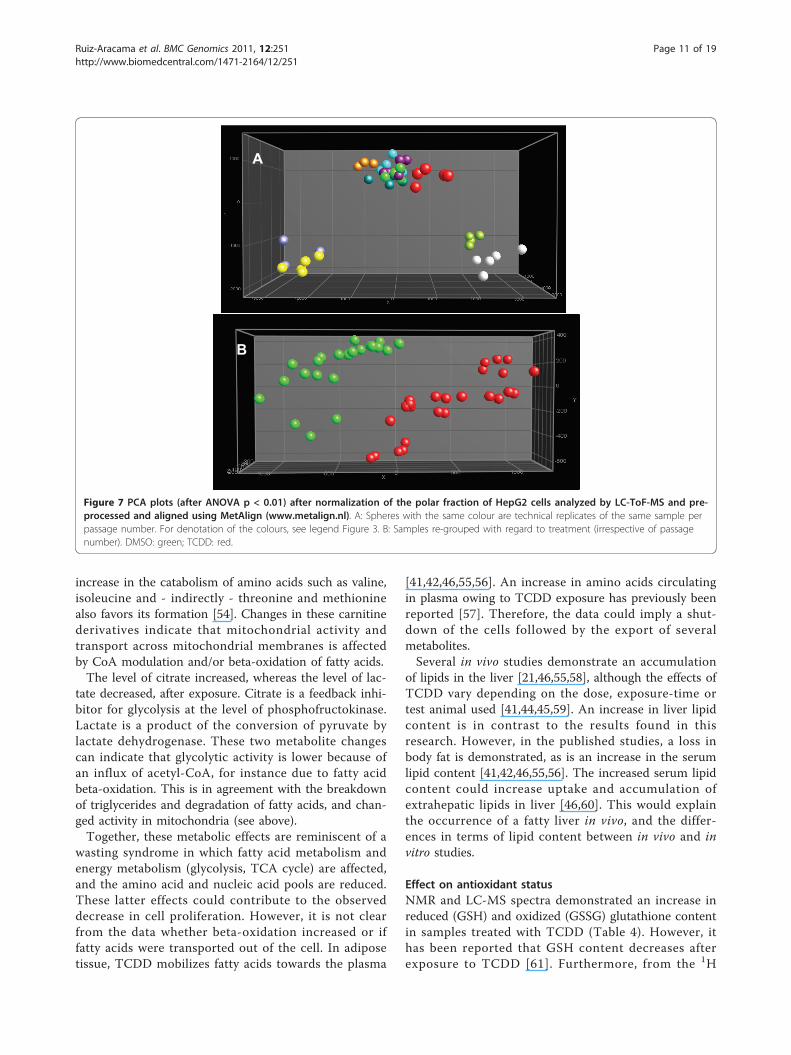
to obtain more detailed information concerning the dif-ferences in polar metabolite levels due to treatment.The LC-MS data were pre-processed and aligned usingMetAlign, the program developed in-house [34]. Thealigned fingerprint data, in the form of generatedspreadsheets, were normalized using the PL/CHCl3 ratioand subjected to 2Log transformation and ANOVA withp < 0.01 followed by PCA (Figure 7A). The separationbetween samples was dominated by passage numberrather than by treatment. In order to determine theeffect of TCDD on the polar fraction of the cells, thesamples of this dataset were re-grouped with regard totreatment, and an ANOVA (p < 0.01) followed by aPCA was performed after 2Log transformation (Figure7B). From the peak loadings (additionally surviving aBonferroni correction) responsible for the separation ofsamples in this PCA, it is possible to create a list ofmasses that contributed significantly to the observedPCA separation. This list of masses was screened formolecular ions that showed at least a 1.2 fold changedue to the treatment. Table 4 lists the metabolites andtheir fold change, as determined on the basis of frag-mentation data from LC-nanomate-Orbitrap experi-ments. Table 5 presents the exact experimental masses
Table 2 Apolar metabolites significantly affected byTCDD (p < 0.01) and average fold change ratio betweentreatments (TCDD vs. DMSO).
GC-MS Ratio TCDD/DMSO (RTD)
C12:0 0.78
C14:0 0.72
C14:1a 0.70
C14:1b 0.29
C16:1 (n-6) 0.63
C16:1 (n-9) 0.62
C17:0 1.20
C18:0 1.27
C18:1 (n-9) 0.78
C18:1c 0.72
C18:2a 0.71
C18:2b 0.63
C18:2c 1.29
C18:2d 0.64
C18:2e 0.63
C20:1b 0.79
C20:2a 0.74
C20:2b 0.70
C20:3a 0.80
C20:3b 0.64
C22:2 0.61
C22:3a 0.731H NMR Ratio TCDD/DMSO (RTD)
Total triglycerides 0.51
Total cholesterol ester 0.69
*Underscore letters indicate isomers (unidentified).
Individual passage number results are in Additional File 1 (Tables S3 and S4).
Ruiz-Aracama et al. BMC Genomics 2011, 12:251http://www.biomedcentral.com/1471-2164/12/251
Page 6 of 19
of these metabolites, together with their obtained frag-ments. A few metabolites remained unidentified.There were significant increases in citric acid (average
ratio TCDD: DMSO = 1.7) and in GSSG (average ratioTCDD: DMSO = 1.3) and GSH (average ratio TCDD:DMSO = 1.2) contents in TCDD treated samples, ingeneral agreement with the 1H NMR data. However, theGSH/GSSG ratio as determined from LC-MS data wasreduced, in contrast to the NMR data. Generally, NMRdata are more quantitative and reliable; furthermore, theLC-MS data were acquired at a later date than theNMR data. In a follow-up NMR study on the stability ofthe sample, it was observed that the intensity of theGSH signal decreased over time during storage whereasthe intensity of the GSSG signal increased (see FigureS1 in Additional File 1). No other metabolic changeswere observed.This reaction is known to be dependent on pH (i.e.
more prominent at higher pH). Therefore storage condi-tions such as pH are important. NMR samples weremeasured directly after adding phosphate buffer to the
freshly made extracts. In this study the UPLC-TOF/MSsamples were stored at -20°C without the phosphatebuffer and therefore under more acidic conditions (pHca. 5 as a result of the extraction conditions). The maxi-mum storage time before UPLC-TOF/MS measurementwas 4 months. Under these storage conditions still someconversion to of GSH to GSSG was present as deducedfrom our experiments.
DiscussionThe main aim of this study was to demonstrate the fea-sibility of using metabolomics on intracellular com-pounds of in vitro cell systems such as HepG2 cells, asan alternative approach to studying the effects of toxi-cants. We have demonstrated that reproducible resultscan be obtained and that differences between controlsfrom different experiments can be subjected to statisticalanalysis, but that caution is required with regard torepeatability of experiments; generally, the same effectsare observed in different experiments but their magni-tudes can differ. However, there is a consistent effect
1,2,3
4
56
7
8,910,11
8
9
10,1110,11
1415
16
10 169
10,11
14
18
11
17
13
12
20
21
23
22 19-2119-21
Figure 5 1H NMR spectra overlaid (4-fold) of the polar fraction of HepG2 cells exposed to DMSO (below) and TCDD (above). Thefollowing metabolites are identified by using standards, from the literature and/or databases and the numbers of the signals correspond tothose indicated in Table 3. 1&2: leucine and isoleucine; 3: valine: 4: threonine: 5: lactale; 6: alanine; 7: putrescine; 8: acetate; 9: N-acetyl-aspartate;10: glutamate; 11: glutamine; 12: reduced glutathione; 13: oxidized glutathione; 14: acetone; 15: citric acid; 16: creatine and/or phosphocreatine;17: choline derivatives; 18: taurine; 19: glycine; 20: serine; 21: nucleotides derived from uridine (UMP, UDP, UTP); 22: nucleotides derived fromadenosine (AMP, ADP, ATP); 23: NAD+ and/or NADH; 24: tyrosine; 25: formate.
Ruiz-Aracama et al. BMC Genomics 2011, 12:251http://www.biomedcentral.com/1471-2164/12/251
Page 7 of 19
(due to TCDD in this study) on metabolic profiles usingan untargeted approach. The changes in metabolite con-centrations are minimal and can vary because of theeffect of the treatment on cell numbers. Therefore, nor-malization (using PL and PUFA), as described above, iscrucial; so is having enough biological replicates toensure the accuracy of the data. Without normalizationor sufficient biological replicates, several of the meta-bolic changes may not have been detected. In apparentcontradiction to the normalization using PL, it has beenreported that TCDD induces the expression of the phos-pholipase A2a (PLA2a) gene in mouse hepatoma Hepa-1c1c7 [35]. However, in this HepG2 study, degradationof PL was not evident with regard to total PL. Further-more, a parallel study using transcriptomics did not pro-vide evidence of an effect of TCDD on PLA2a geneexpression in HepG2 cells; this supports the presentfindings for HepG2 cells and supports the validity of thechosen normalization method.To substantiate the usefulness of the untargeted meta-
bolomics methodology, the observed changes in metabo-lite levels were interpreted in the light of published dataconcerning the effect of TCDD. Ultimately, this was thevalidation of the procedures and protocols developed in
this study. In general, a decrease or increase of an intra-cellular metabolite concentration is not necessarily anindicator of flux. Actual metabolite levels depend onhow biochemical pathways/processes are regulated, howmetabolites in pathways interact and how fast and inwhich directions reactions occur (kinetics). Cells tend tobalance their metabolism after perturbation in order tomaintain homeostasis. Therefore, it is likely that onlychanges in the main pools of substrates in the cell aremeasured when it is exposed to a toxicant. Inhibition/activation of a pathway may lead to increased ordecreased levels of relevant pools of compounds. How-ever, it is often difficult to determine whether inhibitionor activation is relevant by observing metabolite concen-trations at one time point. As discussed in more detailbelow, TCDD is known to have an effect on the prolif-erative capacity, metabolism and antioxidant status ofthe cell.
Effect on cell proliferationMembrane constituents such as PL (Figure 2B) and freecholesterol are present at lower levels in extractsobtained after treatment with TCDD because there arefewer cells in the culture, and are indicative of decreased
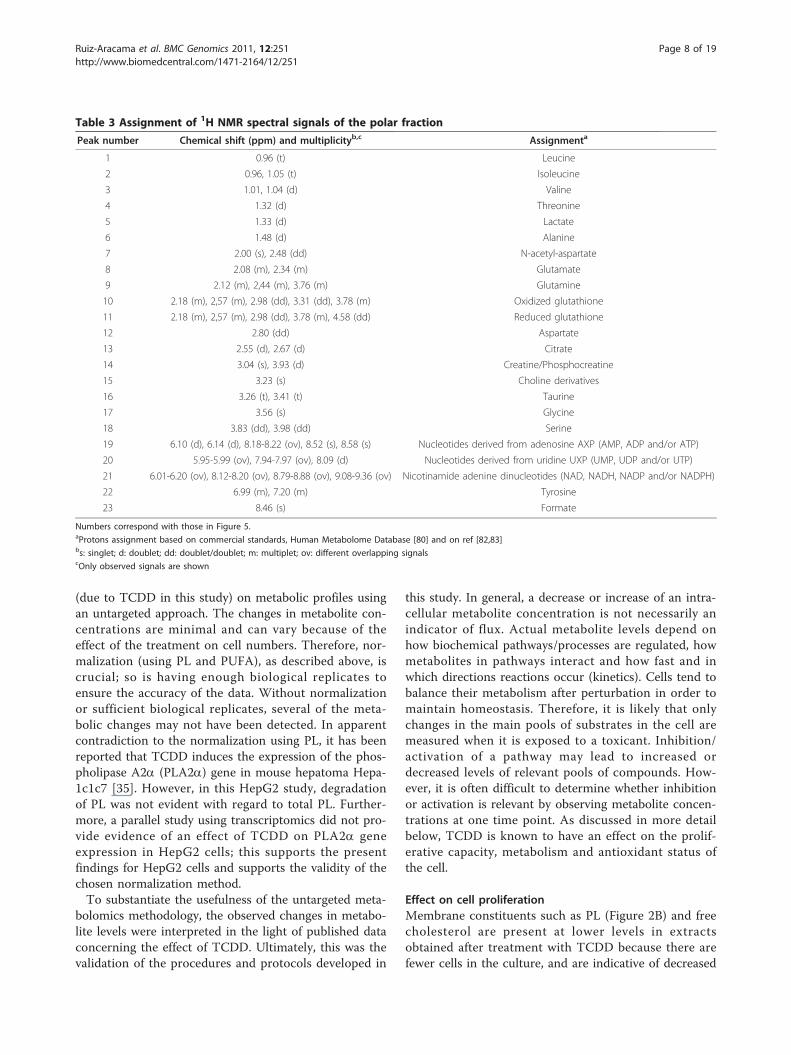
Table 3 Assignment of 1H NMR spectral signals of the polar fraction
Peak number Chemical shift (ppm) and multiplicityb,c Assignmenta
1 0.96 (t) Leucine
2 0.96, 1.05 (t) Isoleucine
3 1.01, 1.04 (d) Valine
4 1.32 (d) Threonine
5 1.33 (d) Lactate
6 1.48 (d) Alanine
7 2.00 (s), 2.48 (dd) N-acetyl-aspartate
8 2.08 (m), 2.34 (m) Glutamate
9 2.12 (m), 2,44 (m), 3.76 (m) Glutamine
10 2.18 (m), 2,57 (m), 2.98 (dd), 3.31 (dd), 3.78 (m) Oxidized glutathione
11 2.18 (m), 2,57 (m), 2.98 (dd), 3.78 (m), 4.58 (dd) Reduced glutathione
12 2.80 (dd) Aspartate
13 2.55 (d), 2.67 (d) Citrate
14 3.04 (s), 3.93 (d) Creatine/Phosphocreatine
15 3.23 (s) Choline derivatives
16 3.26 (t), 3.41 (t) Taurine
17 3.56 (s) Glycine
18 3.83 (dd), 3.98 (dd) Serine
19 6.10 (d), 6.14 (d), 8.18-8.22 (ov), 8.52 (s), 8.58 (s) Nucleotides derived from adenosine AXP (AMP, ADP and/or ATP)
20 5.95-5.99 (ov), 7.94-7.97 (ov), 8.09 (d) Nucleotides derived from uridine UXP (UMP, UDP and/or UTP)
21 6.01-6.20 (ov), 8.12-8.20 (ov), 8.79-8.88 (ov), 9.08-9.36 (ov) Nicotinamide adenine dinucleotides (NAD, NADH, NADP and/or NADPH)
22 6.99 (m), 7.20 (m) Tyrosine
23 8.46 (s) Formate
Numbers correspond with those in Figure 5.aProtons assignment based on commercial standards, Human Metabolome Database [80] and on ref [82,83]bs: singlet; d: doublet; dd: doublet/doublet; m: multiplet; ov: different overlapping signalscOnly observed signals are shown
Ruiz-Aracama et al. BMC Genomics 2011, 12:251http://www.biomedcentral.com/1471-2164/12/251
Page 8 of 19
proliferation during exposure; the anti-proliferativeeffect of TCDD has been described previously [26]. Thelower levels of nucleotides in treated extracts indicate achange in metabolites known to be involved in DNAsynthesis (Table 4).Spermidine and N1-acetylspermidine were also found
in lower levels after TCDD treatment. Polyamines haveimportant functions in cell proliferation, differentiationand apoptosis, and they are essential for hepatic growthand regeneration [36]. Polyamines can be synthesized inliver from agmatine (formed by decarboxylation of argi-nine, via arginine decarboxylase) [37], but ornithine dec-arboxylase (ODC) is the main enzyme responsible forpolyamine biosynthesis. ODC is involved in the conver-sion of ornithine into putrescine, the precursor of otherpolyamines [38,39]. Their catabolism, on the other hand,is regulated by the enzymatic action of the polyaminesspermidine/spermine N1-acetyltransferase (cSAT) anddiamine oxidase [40].ODC is induced during conditions where there is
enhanced gene activation and tissue growth. It has beenreported that ODC induction is inhibited by TCDD[38,39].
Therefore, it is possible that induction of polyaminesynthesis in cultured HepG2 cells was inhibited byTCDD, resulting in the low content of spermidine.
Effect on metabolismChanges in metabolic profiles due to TCDD treatmentof HepG2 cells indicates major changes in the generalmetabolism of these cells, which involves fatty acids,amino acids and nucleotides. This is reminiscent ofwasting syndrome [21,41-43].The decreases in triglycerides, cholesterol ester and
unsaturated fatty acids observed in the 1H NMR analysisof the apolar fraction, together with the decreases inseveral fatty acids observed in the GC-MS data, indicatethat under the conditions used in this study, TCDDaffected lipid metabolism.Several in vivo studies [44-46] have demonstrated that
TCDD reduces the activity of enzymes involved in thesynthesis of de novo fatty acids (such as fatty acidsynthase, FAS and acetyl CoA carboxylase, AAC) and incholesterol biosynthesis (such as 3-hydroxy-methylglu-taryl-CoA synthase) or the expression of genes encodingthese enzymes [41,42,47-49]. This effect, which was also
A
B
Figure 6 PCA plots (after ANOVA p < 0.01) after normalization of the polar fraction of HepG2 cells analyzed by 1H NMR and pre-processed and aligned using a program developed in-house. A: Spheres with the same colour are technical replicates of the same sampleper passage number. For denotation of the colours, see legend to Figure 3. B: Samples re-grouped with regard to treatment (irrespective ofpassage number). DMSO: green; TCDD: red..
Ruiz-Aracama et al. BMC Genomics 2011, 12:251http://www.biomedcentral.com/1471-2164/12/251
Page 9 of 19
observed in experiments using mouse embryo fibroblasts[50], supports the results presented here. In studies car-ried out in vivo [49] and in vitro [50], it has beenreported that the effect of TCDD on the gene expres-sion of enzymes involved in the de novo synthesis offatty acids is mediated by AhR.Using GC-MS analysis it is possible to determine the
nature of the fatty acids that are most affected by expo-sure to TCDD (Table 2). The levels of the majority offatty acids decreased upon treatment. However, the con-tents of heptadecanoic (C17:0) and octadecanoic, i.e.stearic (C18:0), acids were increased after exposure. Theincreased percentage of saturated and the decreased per-centage of mono-unsaturated fatty acids could be due tothe decreased expression of stearoyl-CoA-desaturase(SCD1), as demonstrated in mouse embryo fibroblastsafter TCDD exposure [51]. SCD1 is the rate limitingenzyme in the biosynthesis of mono-unsaturated fattyacids and catalyzes the introduction of the cis doublebond in the Δ9 position of acyl CoA substrates [52].
Therefore, inhibiting the expression of SCD1 usingTCDD would partially explain the increased ratiobetween saturated/monounsaturated fatty acids observedin this study.Pantothenic acid and AMP are metabolites found in
lower concentrations after exposure to TCDD (Table 4).Pantothenic acid and AMP are two of the three precur-sors for coenzyme A (CoA) synthesis. In general, duringfatty acid degradation and synthesis, CoA transportsfatty acids as acyl groups through repetitive degradativeor synthetic cycles.Furthermore, decreases in the content of propionyl-
and butyryl-carnitines were observed when cells wereexposed to TCDD. These short chain acyl-carnitines aremetabolic products of the reaction of acyl CoA and car-nitine, which is mediated by transferases in the mito-chondria [53]. Formation of butyryl- and propionyl-carnitines is favored when butyryl and propionyl-CoAaccumulate in the mitochondria owing to an increasedacyl-CoA/CoA ratio. In the case of propionyl-CoA, an
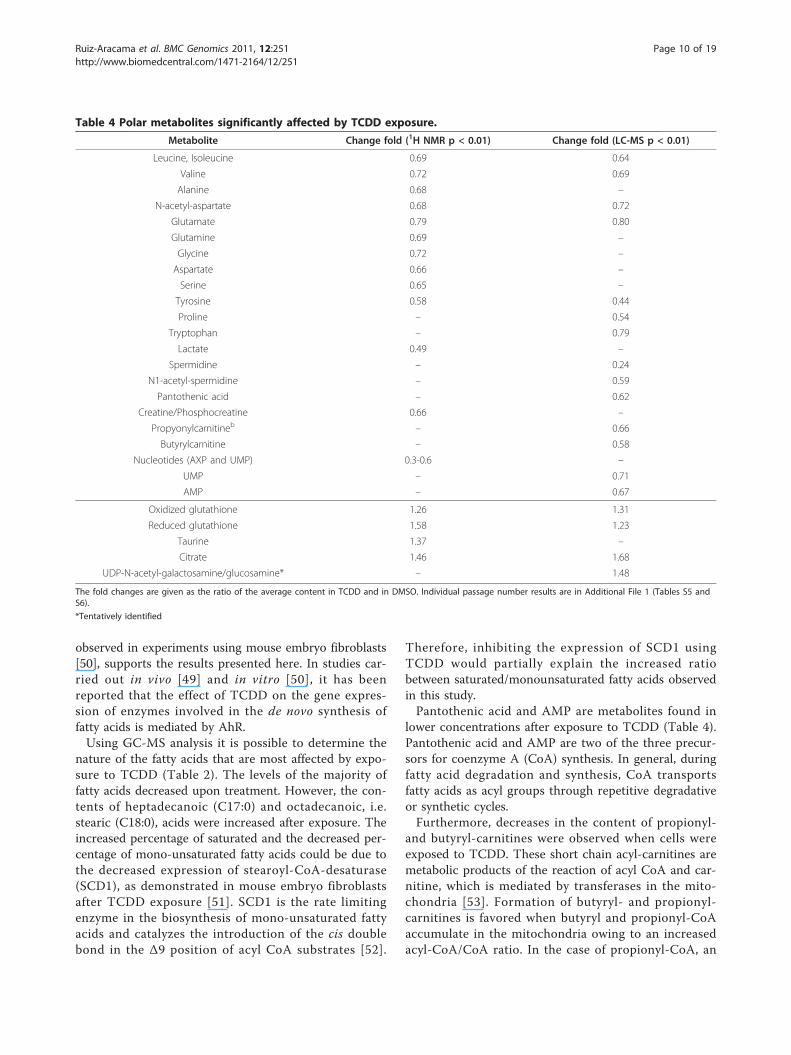
Table 4 Polar metabolites significantly affected by TCDD exposure.
Metabolite Change fold (1H NMR p < 0.01) Change fold (LC-MS p < 0.01)
Leucine, Isoleucine 0.69 0.64
Valine 0.72 0.69
Alanine 0.68 –
N-acetyl-aspartate 0.68 0.72
Glutamate 0.79 0.80
Glutamine 0.69 –
Glycine 0.72 –
Aspartate 0.66 –
Serine 0.65 –
Tyrosine 0.58 0.44
Proline – 0.54
Tryptophan – 0.79
Lactate 0.49 –
Spermidine – 0.24
N1-acetyl-spermidine – 0.59
Pantothenic acid – 0.62
Creatine/Phosphocreatine 0.66 –
Propyonylcarnitineb – 0.66
Butyrylcarnitine – 0.58
Nucleotides (AXP and UMP) 0.3-0.6 –
UMP – 0.71
AMP – 0.67
Oxidized glutathione 1.26 1.31
Reduced glutathione 1.58 1.23
Taurine 1.37 –
Citrate 1.46 1.68
UDP-N-acetyl-galactosamine/glucosamine* – 1.48
The fold changes are given as the ratio of the average content in TCDD and in DMSO. Individual passage number results are in Additional File 1 (Tables S5 andS6).
*Tentatively identified
Ruiz-Aracama et al. BMC Genomics 2011, 12:251http://www.biomedcentral.com/1471-2164/12/251
Page 10 of 19
increase in the catabolism of amino acids such as valine,isoleucine and - indirectly - threonine and methioninealso favors its formation [54]. Changes in these carnitinederivatives indicate that mitochondrial activity andtransport across mitochondrial membranes is affectedby CoA modulation and/or beta-oxidation of fatty acids.The level of citrate increased, whereas the level of lac-
tate decreased, after exposure. Citrate is a feedback inhi-bitor for glycolysis at the level of phosphofructokinase.Lactate is a product of the conversion of pyruvate bylactate dehydrogenase. These two metabolite changescan indicate that glycolytic activity is lower because ofan influx of acetyl-CoA, for instance due to fatty acidbeta-oxidation. This is in agreement with the breakdownof triglycerides and degradation of fatty acids, and chan-ged activity in mitochondria (see above).Together, these metabolic effects are reminiscent of a
wasting syndrome in which fatty acid metabolism andenergy metabolism (glycolysis, TCA cycle) are affected,and the amino acid and nucleic acid pools are reduced.These latter effects could contribute to the observeddecrease in cell proliferation. However, it is not clearfrom the data whether beta-oxidation increased or iffatty acids were transported out of the cell. In adiposetissue, TCDD mobilizes fatty acids towards the plasma
[41,42,46,55,56]. An increase in amino acids circulatingin plasma owing to TCDD exposure has previously beenreported [57]. Therefore, the data could imply a shut-down of the cells followed by the export of severalmetabolites.Several in vivo studies demonstrate an accumulation
of lipids in the liver [21,46,55,58], although the effects ofTCDD vary depending on the dose, exposure-time ortest animal used [41,44,45,59]. An increase in liver lipidcontent is in contrast to the results found in thisresearch. However, in the published studies, a loss inbody fat is demonstrated, as is an increase in the serumlipid content [41,42,46,55,56]. The increased serum lipidcontent could increase uptake and accumulation ofextrahepatic lipids in liver [46,60]. This would explainthe occurrence of a fatty liver in vivo, and the differ-ences in terms of lipid content between in vivo and invitro studies.
Effect on antioxidant statusNMR and LC-MS spectra demonstrated an increase inreduced (GSH) and oxidized (GSSG) glutathione contentin samples treated with TCDD (Table 4). However, ithas been reported that GSH content decreases afterexposure to TCDD [61]. Furthermore, from the 1H
A
B
Figure 7 PCA plots (after ANOVA p < 0.01) after normalization of the polar fraction of HepG2 cells analyzed by LC-ToF-MS and pre-processed and aligned using MetAlign (www.metalign.nl). A: Spheres with the same colour are technical replicates of the same sample perpassage number. For denotation of the colours, see legend Figure 3. B: Samples re-grouped with regard to treatment (irrespective of passagenumber). DMSO: green; TCDD: red.
Ruiz-Aracama et al. BMC Genomics 2011, 12:251http://www.biomedcentral.com/1471-2164/12/251
Page 11 of 19
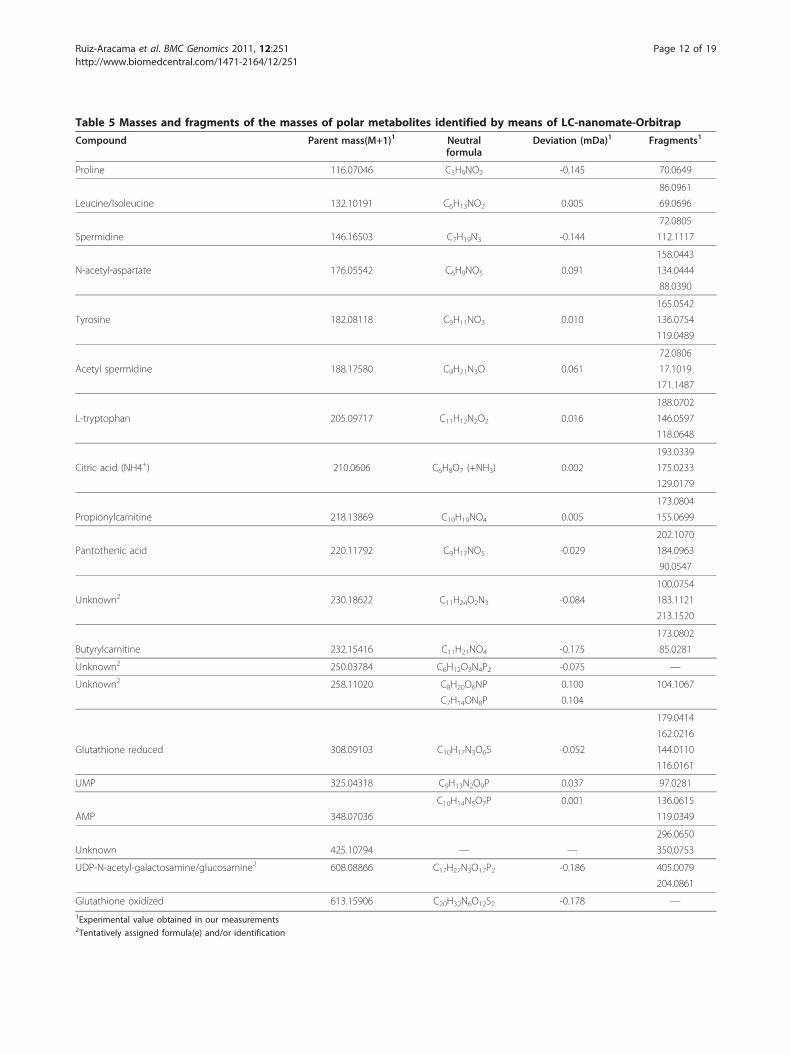
Table 5 Masses and fragments of the masses of polar metabolites identified by means of LC-nanomate-Orbitrap
Compound Parent mass(M+1)1 Neutralformula
Deviation (mDa)1 Fragments1
Proline 116.07046 C5H9NO2 -0.145 70.0649
86.0961
Leucine/Isoleucine 132.10191 C6H13NO2 0.005 69.0696
72.0805
Spermidine 146.16503 C7H19N3 -0.144 112.1117
158.0443
N-acetyl-aspartate 176.05542 C6H9NO5 0.091 134.0444
88.0390
165.0542
Tyrosine 182.08118 C9H11NO3 0.010 136.0754
119.0489
72.0806
Acetyl spermidine 188.17580 C9H21N3O 0.061 17.1019
171.1487
188.0702
L-tryptophan 205.09717 C11H12N2O2 0.016 146.0597
118.0648
193.0339
Citric acid (NH4+) 210.0606 C6H8O7 (+NH3) 0.002 175.0233
129.0179
173.0804
Propionylcarnitine 218.13869 C10H19NO4 0.005 155.0699
202.1070
Pantothenic acid 220.11792 C9H17NO5 -0.029 184.0963
90.0547
100,0754
Unknown2 230.18622 C11H24O2N3 -0.084 183.1121
213.1520
173.0802
Butyrylcarnitine 232.15416 C11H21NO4 -0.175 85.0281
Unknown2 250.03784 C6H12O3N4P2 -0.075 —
Unknown2 258.11020 C8H20O6NP 0.100 104.1067
C7H14ON8P 0.104
179.0414
162.0216
Glutathione reduced 308.09103 C10H17N3O6S -0.052 144.0110
116.0161
UMP 325.04318 C9H13N2O9P 0.037 97.0281
C10H14N5O7P 0.001 136.0615
AMP 348.07036 119.0349
296.0650
Unknown 425.10794 — — 350,0753
UDP-N-acetyl-galactosamine/glucosamine2 608.08866 C17H27N3O17P2 -0.186 405.0079
204.0861
Glutathione oxidized 613.15906 C20H32N6O12S2 -0.178 —1Experimental value obtained in our measurements2Tentatively assigned formula(e) and/or identification
Ruiz-Aracama et al. BMC Genomics 2011, 12:251http://www.biomedcentral.com/1471-2164/12/251
Page 12 of 19
NMR data, it was observed that the GSH/GSSG ratioincreased ca. 20% with TCDD exposure. This ratio, con-sidered a parameter for measuring the oxidative statusof a cell, has been reported to decrease in several in vivostudies as a consequence of exposure to TCDD [23,61].However, data are variable and some authors havereported an increase in the GSH/GSSG ratio after micewere treated with TCDD [22].GSH acts as a nucleophilic “scavenger” of numerous
compounds and their metabolites via enzymatic and chemi-cal mechanisms (converting electrophilic centers tothioether bonds) and as a substrate in the glutathione per-oxidase (GPx)-mediated reduction of lipid hydroperoxidesand of H2O2 to water [62,63]. As a consequence of thisreaction, GSH is oxidized to GSSG, which is in turnrecycled back to GSH via glutathione reductase (GR).Therefore, any effect on the activity of GPx, GR or bothcould affect the ratio between GSH and GSSG. Several invivo [61] and in vitro [64,65] studies have described theinhibition of GPx activity in liver due to TCDD treatment.Inhibition of the activity of this enzyme could theoreticallylead to an increase in the content of GSH and in the GSH/GSSG ratio, as observed herein. However, it has beenreported that the activity of GPx in liver mitochondria ofmice exposed to TCDD is increased [22], but increasedactivity of GR in liver mitochondria was also evident, possi-bly explaining the increased GSH/GSSG ratio followingdioxin treatment. Some studies have demonstrated thatTCDD increases the activity of GR in liver cells [66],whereas other authors describe the opposite effect [64].In relation to the synthesis of GSH, Boverhof and co-
authors [41] demonstrated up-regulated expression ofthe genes for enzymes involved in the synthesis of GSH(such as glutamate-cysteine ligase, Gclc, and glutathionesynthase, Gss) after rats and mice were exposed toTCDD. Increased synthesis of GSH could explain theresults. Boverhof and co-authors [41] described a down-regulation of the genes associated with the metabolismof glutamate and glycine, which are building blocks ofGSH. They suggested that this down-regulation couldbe an adaptation of the cell to conserve these aminoacids for increased glutathione synthesis.
Other effects associated with TCDD treatmentCreatine is decreased in cells as a result of TCDD treat-ment (Table 4). In relation to this, Boverhof and co-authors [41] found that genes expressing guanidinoace-tate N-methyltransferase (GAMT), one of the keyenzymes in the biosynthesis of creatine, are down-regu-lated in liver after TCDD administration to rats. It hasbeen reported that GAMT deficiency is associated witha reduction in body weight owing to reduced body fatmass [67], which could be related to the aforementionedin vivo effects of TCDD exposure.
The content of taurine, a non-protein sulfur-contain-ing b-amino acid, is increased after the exposure of cellsto TCDD. Taurine plays an important role in severalbiological processes including anti-oxidation, detoxifica-tion, membrane stabilization and maintenance of osmo-larity [68]. Moreover, it has been demonstrated thatthere is a relationship between taurine and lipid metabo-lism [69,70]. Taurine lowers hepatic triglyceride concen-tration, reduces the synthesis of cellular cholesterol esterand elevates hepatic free fatty acids. These effects are inagreement with the results of the present study forHepG2 cells exposed to TCDD. TCDD down-regulatescysteine dioxygenase (CDO) [41,42,71,72], the firstenzyme in the conversion of cysteine to taurine. Thisseems to conflict with the observation of higher taurinelevels after exposure to TCDD, but since the regulationof taurine concentration is unknown, perhaps theincreased concentration of taurine after exposing cellsto TCDD is related to other mechanisms.An increased signal (average ratio TCDD: DMSO =
1.5) tentatively assigned to uridine diphosphate-N-acet-ylgalactosamine (UDP-NAcGal) and/or uridine dipho-sphate-N-acetylglucosamine (UDP-NacGlu) wasobserved after TCDD exposure (Table 4).UDP-NAcGal and UDP-NacGlu are N-acetylhexosa-
mines involved in several biosynthetic reactions includ-ing O-glycosylation of proteins on serine and threonineresidues. O-linked glycosylation involves the transfer ofthe N-acetylhexosamine group from the UDP-acetylhex-osamine, which is catalyzed by glycosyltransferases[73,74].Lower activity of these enzymes could theoretically
produce an increase in the levels of UDP-N-acetylhexo-samines. In agreement with this, decreased expression ofGALNT1, the gene encoding the UDP-N-acetylgalacto-samine transferase, was observed by Kim and co-authors[75] after HepG2 cells were exposed to TCDD.Changes in the intracellular levels of UDP-N-acetyl-
hexosamines, as observed in this study after exposure toTCDD, may indicate that protein O-glycosylation isaffected. Altered expression levels of glycosylated pro-tein have been described after TCDD exposure in vitro[76].We have no explanation for the decrease in concen-
tration of N-acetyl aspartate. This metabolite is normallyexpressed at high concentrations in the brain and hasbeen implicated as an osmolyte [77] with the potentialto bind to calcium ions or metal ions [78].
ConclusionsThe present study demonstrates that untargeted profil-ing of the polar and apolar extracts of in vitro culturedHepG2 cells using various analytical techniques is a fea-sible approach to studying the effect of a toxicant,
Ruiz-Aracama et al. BMC Genomics 2011, 12:251http://www.biomedcentral.com/1471-2164/12/251
Page 13 of 19
TCDD, on the cell metabolome. In the metabolomicsmethodology used, sample protocols and handling wereminimized to enhance reproducibility. The results arecompatible with previously well-documented effects ofTCDD, in vitro and in vivo. This serves to validate themetabolomics results produced in this study. This com-bination of cell culture and metabolomics technology(together with other -omics techniques) can contributeto reducing the number of animals required for toxicitystudies.This study is an example of how complementary ana-
lytical techniques (NMR, GCMS, LCMS) can be used onthe same samples and provide complementary data. Theuntargeted nature of the experiments aids in finding dif-ferences in profiles, which are then subjected to identifi-cation approaches. As discussed, normalization andsufficient biological replicates (and repeated experi-ments) are essential for reliability (in terms of statisticalanalysis) in detecting relatively small differences in ana-lyte concentrations.Maintaining homeostasis could be the driving force in
cells responsible for keeping concentration differencessmall. The effects are predominantly centered on storagepools of metabolites.
MethodsChemicalsMinimal essential medium (MEM glutamax), non-essen-tial amino acids, sodium pyruvate, penicillin/streptomy-cin and fetal bovine serum were purchased from GibcoBRL (Breda, The Netherlands). Ammonium acetate(NH4Ac), sodium hydroxide (NaOH), sodium chloride(NaCl), dipotassium hydrogenphosphate (K2HPO4),monopotassium hydrogenphosphate (KH2PO4), borontrifluoride (BF3), EDTA and deuterated chloroform(CDCl3), deuterium oxide (D2O) and deuterated metha-nol (CD3OD) were obtained from Merck (Darmstadt,Germany); methanol (MeOH) and iso-octane from Bio-solve (Valkenswaard, The Netherlands); DMSO andTMSP from Sigma-Aldrich (St. Louis, MO, USA) andTCDD (CAS no. 1746-01-6) from Cerilliant (RoundRock, TX, USA). All chemicals and solvents were pur-chased in the highest purity available. Ultra-pure waterwas obtained using the PureLab equipment from Ross-mark (Ede, The Netherlands).
Cell culture treatment and disruptionHepG2 cells were obtained from the ATCC (Rockville,MD) and cultured in MEM glutamax supplementedwith 1% non-essential amino acids, 1% sodium-pyruvate,1% penicillin/streptomycin and 10% fetal bovine serum(FBS). The cells were incubated at 37°C with 5% CO2.When the cell monolayer reached 80% confluency, themedium was replaced with fresh medium with or
without TCDD. TCDD was administered to a final con-centration of 10 nM by adding 60 μl of a solution of 2μM of TCDD in DMSO to 12 ml of medium. In thecontrol treatments, cells were exposed to 12 ml of med-ium to which 60 μl of DMSO had been added. The finalconcentration of 10 nM TCDD was sub-cytotoxic andhas been used in previous omics studies [1,15] Thetreatment of HepG2 cells with 10 nM TCDD and thevehicle control (DMSO) was terminated after 48 h (as inprevious studies) by washing the cells several times withice-cold 0.9% NaCl in ultra-pure water and disruptingthem by osmotic shock with ice-cold ultra-pure water.The cells were harvested using a cell scraper and subse-quently treated ultrasonically to ensure total disruption.The TCDD effect on the cell metabolome was studiedin five independent experiments, using five different pas-sage numbers (p+7, p+11a, p+11b, p+17 and p+30). Allcells, except those in p+11b, originally came from thesame cryogenic vial; those in p+11b were obtained froma second vial of frozen cells in order to check whetherthere were differences between the same passage num-bers from different vials (p+11a vs. p+11b). Four inde-pendent biological replicates (i.e. tissue culture flasks)were examined in each experiment.A separate study - prior to this one - with additional
replicates was done to establish the suitability of thenormalization approach based on PL signals. This studyinvolved cell counting. In short, the cells were detachedfrom the flasks by trypsinization and counted using ahemocytometer (Neubauer chamber). The results aregiven in Table S2, Additional File 1.
Extraction of the apolar and polar fractionsThe metabolomics study was performed on two differ-ent fractions of the cells, one apolar fraction containingthe apolar metabolites (membranes and intracellularlipids), and one polar fraction, containing the polar andsemi-polar intracellular metabolites. To extract these,the disrupted cells were centrifuged (4°C) and the pellet(apolar fraction) and supernatant (polar fraction) wereseparated and processed.Apolar fractionThe pellet was re-suspended in 1 M NH4Ac and freeze-dried. Once dried, the residue was extracted three timeswith 1 ml of CDCl3, after which the organic solvent wasevaporated under N2 flow. The dried extract was dis-solved in 1 ml of CDCl3; an aliquot (0.6 ml) was usedfor NMR analysis and the remaining sample was storedat -20°C for GC-MS analysis.Polar fractionThe supernatant containing the polar intracellular meta-bolites was freeze-dried. The pellet was re-suspended in1 ml of 100% CD3OD, dried with N2 and re-suspendedin 50% CD3OD/50% D2O. The solution was centrifuged
Ruiz-Aracama et al. BMC Genomics 2011, 12:251http://www.biomedcentral.com/1471-2164/12/251
Page 14 of 19
to remove the proteins (in the pellet) and the superna-tant was dried under N2 flow. The dry residue was dis-solved in 1 ml of D2O. Some of the sample (350 μl) wasstored at -20°C for UPLC-TOF/MS analysis. To theremainder, 1 M phosphate buffer (90:10; v: v; pH = 7)in 99.95% D2O was added and used for NMR analysis.
Analysis of the polar and apolar fractionsNMR analysisThe samples were analyzed by NMR just after extrac-tion. Some of these samples were also used for a follow-up study with the aim of determining the stability of thedifferent metabolites over time. These samples werestored at -20°C in phosphate buffer (pH = 7) for 9months.The 1H NMR spectra were recorded at 400.13 MHz at
300.0 (± 0.05) K on a Bruker Avance 400 narrow boreusing a 5.0-mm probe. The spectrometer settings were2s relaxation delay; 1024 scans for the polar fractionand 128 scans for the apolar fraction, with four dummyscans in all cases; a spectral width of 5000 Hz; a 60degree pulse; acquisition in 16 K data points. Prior todata analysis, the raw NMR data were subjected to asquared sine bell filter (shifted 1/2 pi), zero-filling to128 K data points, Fourier transformation and phasecorrection.NMR raw data and the corresponding metadata are
provided as an additional file (see Additional file 2).GC-MS analysisDerivatisation A miniature scale BF3-mediated metha-nolysis method for derivatizing fatty acids (for GC-MS)was used. In brief: 132 μl of the apolar fraction wasdried under nitrogen. To this dry extract, 40 μl of 0.5 NNaOH in MeOH was added. The capped vial was placedin a pre-heated oven at 65°C for 30 minutes after which50 μl of BF3 (20% in methanol) was added. After closingit again, the vial was put in the oven for three minutesat 65°C; 0.2 ml of iso-octane was added. The vial wasagain closed and put in the oven for two minutes at 65°C. After cooling, the volume was adjusted to 1 ml witha saturated NaCl solution. This was shaken firmly andthe content was left to separate into two phases. Thevial was centrifuged at 2800 rpm and the upper phasewas carefully collected. For GC-MS analysis, 75 μl of theiso-octane phase was transferred into a new vial andkept at -20°C pending analysis.GC-MS A Trace GC 2000 series gas chromatographinterfaced with a Trace MS Plus mass spectrometer(Thermo Finnigan, San Jose, CA) was used for GC/MSanalysis. Two μl of sample was injected using a PTV-Splitless injection. For the separations, a RTX-5 column(length 10 m, internal diameter 0.18 mm, stationaryphase film 0.20_m; Alltech, Breda, The Netherlands)was used with helium as the carrier at a constant flow
of 1.3 ml/min. The GC temperature program was: 2min at 80°C; increase temperature at 5.5°C min-1 to 185°C followed by 3.5°C min-1 to 290°C. This latter tempera-ture was kept for 12 min and afterwards it decreased by120°C min-1 to 150°C. The GC-MS interface tempera-ture was 280°C; the source temperature was 200°C.Mass scanning in EI (electron impact) mode was carriedout for the range of 50-500 m/z at a scan time of 0.4seconds. The detector voltage was set to 500 V and thesetting of the EI ionization source was 70 eV. All datawere collected consecutively in one analysis series tominimize chromatography differences and the injectionsequence was randomized according to Vos and co-authors [2].Metadata for GS-MS files are provided as an addi-
tional file (see Additional file 2). Raw GS-MS data willbe provided by a download link on requestUPLC-TOF/MS analysisThe fraction containing the polar metabolites was storedfor a maximum of 4 months at -20°C (pH = 5) beforeanalysis by UPLC-TOF/MS. UPLC-TOF/MS sampleswere diluted twice with D2O prior to analysis; formicacid was added to a final concentration of 0.1%. Theinjection sequence was randomized according to Vosand co-authors [2]. The analyses were performed on aLCT Premier LC-TOF-MS system (Waters, Milford,MA, USA) equipped with a dual spray electrospraysource. The lock mass calibrant (leucine/enkephaline)was measured every 10 scans. The gradient was pro-vided by an UPLC system (model Acquity, Waters) witha 150 mm × 2.1 mm UPLC BEH-C8 column with 1.7μm particles (Waters).The mobile phase consisted of water, acetonitrile and
formic acid (A:100/0/0.2 and B: 0/100/0.2). Gradientelution was performed at 0.4 ml min-1. The initial elu-ent composition, 100% A, was held for one min afterwhich the composition was changed to 85% A and15% B in 14 min. Afterwards, the composition of Bwas increased to 30% in 10 min and subsequentlyincreased again to 90% in three min; this compositionwas maintained for five min. The injection volume was10 μl. The effluent of the LC system was interfaceddirectly with the TOF-MS, which was operated in posi-tive mode polarity. A stable spray was obtained with acapillary voltage of 2.5 kV, a source temperature of120°C and desolvatation temperature of 350°C. Thedesolvatation and cone gas flows were 600 and 50 L h-1, respectively. The cone voltage was 50 V. Spectrawere collected in centroid mode from m/z 80 to 1500,with a scan duration of 0.2 s. Accurate masses wereobtained after lock mass correction. The mass spectro-meter was operated in W mode with the DynamicRange Enhancement turned on and the resolution was8500 (FWHM).
Ruiz-Aracama et al. BMC Genomics 2011, 12:251http://www.biomedcentral.com/1471-2164/12/251
Page 15 of 19
Metadata for LC-MS files are provided as an addi-tional file (see Additional file 2). Raw LC-MS data willbe provided by a download link on request.”LC-nanomate-Orbitrap analysisLiquid Chromatography-Mass Spectrometry (LC-PDA-MS) The system consisted of an Accela U HPLCsystem (pump and auto sampler) equipped with anAccela PDA with a one cm light Pipe flow cell (Ther-moFisher Scientific) and coupled to a LTQ/Orbitraphybrid mass spectrometer (Thermo Fisher Scientific)that was equipped with a chip-based nano-electrosprayionization source (Triversa NanoMate (Advion BioS-ciences). The sample (10 μl) was separated on a 150mm × 2.1 mm UPLC BEH-C8 column with 1.7 μm par-ticles (Waters). The flow rate was set at 0.4 ml min-1.Isopropanol (60 μl min-1 of 100%) was added betweenPDA and NanoMate via a T-junction to the LC flow toensure a stable nanospray. The sample was loaded with100% eluent A (H2O/0.1% formic acid). The gradientwas the same as that used for the UPLC-TOF/MS analy-sis. The PDA detector, placed between the analyticalcolumn and the NanoMate, was programmed to acquiredata every second from 210 to 600 nm with a resolutionof 1 nm and 2 Hz sampling rate. The NanoMate sourcewas operated in the positive ionization mode with aHD_A_384 chip with a spray voltage of 1.4 kV and 0.4psi N2 gas. The NanoMate was used in the LC couplingmode with fraction collection. The total flow (460 μl/min) was split using capillary tubing for MS spray (480nl/min) and for fractionation (459.5 μl/min). Fractionswere collected by the NanoMate from retention time 0.5to 19.5 min in 3 s fractions (23 μl) in a 384 well plate(twin tec, Eppendorf). The plate temperature was set at10°C. After collection, extra isopropanol (5 μl) wasadded. The plate was sealed to prevent evaporation ofthe fractions. These fractions were used in the MSn
experiments. Parallel to the fractionation, the MS sprayfrom the NanoMate was used to record a full FTMSscan (m/z 80-1000) with resolution of 15.000 (at m/z400). Automatic tuning was carried out on m/z 566.89.The full AGC target was set to 30000. The Orbitrap wasexternally calibrated in positive mode using sodium for-mate clusters in the range m/z 158.69-1110.79.MSn by direct infusion The system consisted of a LTQ/Orbitrap hybrid mass spectrometer (Thermo FisherScientific) equipped with a chip-based nano-electrosprayionization source (Triversa NanoMate, Advion BioS-ciences). After manually selecting the masses of interest,recorded in the full scan MS, the fractions containingthese masses were subjected to MSn fragmentation inpositive mode. Delivery of the sample to MS: The Nano-Mate used a pipette tip to take the sample from aselected well and infused this sample to the MS via thespray nozzle on the chip. NanoMate parameters were:
spray voltage 1.7 kV and 0.6 psi N2 gas. The mass spec-trometer was tuned on m/z 566.89. The full AGC targetwas set to 30000. The Orbitrap was externally calibratedin positive mode using sodium formate clusters in therange m/z 158.69-1110.79. For performing the MSn
experiments in MS1 a window of 1 m/z was used to iso-late the mass of interest. The resolution used in theMS1 scan event was 60.000. For all dependent scanevents (MSn) a resolution of 15000 and normalized col-lision energy 35% was used.
MSn description:MS 1 Full scan with limited m/z range, m/z of inter-est ± 0.5 m/zMS 2 fragmentation of most intense m/z of MS1MS 3 fragmentation of five most intense fragmentsin MS2MS 4 fragmentation of five most intense fragmentsin MS3MS 5 fragmentation of three most intense fragmentsin MS4Following the sample infusion and MS analysis, thepipette tip was ejected and a new tip and nozzlewere used for each sample, thereby preventing anycross-contamination or carry-over.
Data analysisNMR data analysisPre-processing of the data and alignment A visualinspection of the technical replicates (4-fold) of eachsample was carried out to ensure a high degree ofreproducibility. The NMR data were pre-processed andaligned using a program developed in-house. This pro-gram was described in the Materials and Methods sec-tion of the paper by Lommen et al. [32], but has beenadapted to run under Windows.Normalization The aligned fingerprint data in the formof generated spreadsheets were normalized using factorsobtained from the scaling on the phospholipid signals ofthe 1H NMR spectra of the apolar fraction (seeRESULTS section).Statistical analysis The normalized spreadsheets ofboth datasets were subjected to statistical analysis usingGenemaths XT [79]. Standard initial analysis entailedperforming a 2Log transformation and a PCA (averageof rows and columns subtracted). This was followed bya 2Log transformation, a pre-selection of variables usingan ANOVA (p < 0.01) followed by a PCA (average ofrows and columns subtracted). An example of the effectof the ANOVA is given in Figure S2 in the AdditionalFile 1. The grouping in the ANOVA was on the repli-cates per treatment for each passage number of cellswhen the effect of passage number as well as treatment
Ruiz-Aracama et al. BMC Genomics 2011, 12:251http://www.biomedcentral.com/1471-2164/12/251
Page 16 of 19
was studied (10 groups with 5 replicates). The groupingin the ANOVA was on all replicates per treatment irre-spective of passage number when only the effect oftreatment was studied (2 groups of each 25 samples).From the latter figure a selection of peak loadings -underlying the separation by treatment in the PCA -could be exported as described in [31] (an example isgiven in Additional File 1, Figure S3); to check that thenumbers of variables selected exceeded that expectedpurely by chance, table S1 was added in the AdditionalFile 1. Only differences with a fold change higher than1.2 and surviving a Bonferroni false positive correctionwere taken into account.Identification of metabolites The identification of rele-vant signals from the NMR data was carried out byusing commercially available standards and/or from lit-erature and databases, such as HMDB [80].MS data analysisPre-processing of the data and alignment A visualinspection of the technical replicates (4-fold) of eachsample was carried out to ensure that high degree ofreproducibility. The GC-MS and LC-MS data were pre-processed and aligned using MetAlign [31,34]. In short,this software performs a baseline correction, accuratemass calculation, data smoothing and noise reduction,followed by alignment between chromatograms, generat-ing data files that are reduced in size 100-1000 times.The pre-processing and alignment parameters used havebeen included as Figures S4 and S5 in Additional File 1.NormalizationLC-MS dataThe aligned fingerprint data of the polar fraction data-set, in the form of generated spreadsheets, were normal-ized using the phospholipid scaling factors obtainedfrom the 1H NMR spectra of the apolar fraction (seeRESULTS section).GC-MS dataThe identified peaks of GC-MS chromatograms weremanually integrated. This fraction was normalized byscaling to the raw values of the integrals of docosahex-aenoic and arachidonic methyl esters (see RESULTSsection).Statistical analysis The same procedure as described inthe NMR section was used.Identification of metabolites A method of facilitatingfurther analysis and identification was accomplishedusing GM2MS, an application of MetAlign that re-cre-ates “new chromatograms” that contain only the peaksexported from the PCA selection [31]. Polar metaboliteswere identified with commercially available standards,with FT-MS/MS analysis and using databases, such asthe HMDB [80]. Fatty acids were identified using theeluting order of the peaks and the NIST mass spectrallibrary.
Additional material
Additional file 1: PDF file containing Figures S1, S2, S3, S4 and S5and Tables S1, S2, S3, S4, S5 and S6, mentioned in the text.
Additional file 2: Metadata and NMR raw data: ZIP file containing:-All NMR raw data (in JCAMP-DX format “.dx”) -The metadata on NMR(polars & apolars), LC-MS and GC-MS data sets (as Tab delimited files “.txt”).
AcknowledgementsThe Netherlands Toxicogenomics Centre, NTC (http://www.toxicogenomics.nl) is acknowledged for funding this project through a postdoctoral grant.The Basque Government is thanked for funding a postdoctoral grantthrough the “Programa de Formación de Investigadores del Departamentode Educación, Universidades e Investigación”. Jenneke Poortman (RIKILT),Bert Schipper (PRI), Arjen Gerssen (RIKILT) and Gerrit Bor (RIKILT) are thankedfor their assistance in respect of the cell exposure, LC-nanomate-MS, LC-MSand GC-MS experiments.
Author details1RIKILT-Institute of Food Safety, Wageningen University and Research Centre,P.O. Box 230, 6700 AE, Wageningen, The Netherlands. 2Department of HealthRisk Analysis and Toxicology, P.O. Box 616, 6200 MD Maastricht University,Maastricht, The Netherlands. 3Netherlands Toxicogenomics Centre, TheNetherlands.
Authors’ contributionsAP, JK, J van D and DJ participated in the design of the study and overalldiscussion; CH helped to set up the methodology for in vitro metabolomicsexperiments; ARA optimized protocols, performed cell culture, exposuresand collection of data; ARA and AL analysed data and interpreted theresults. All authors read and approved the final manuscript. None of theauthors had any personal or financial conflict of interest.
Received: 25 June 2010 Accepted: 20 May 2011 Published: 20 May 2011
References1. Nicholson JK, Lindon JC, Holmes E: Metabonomics: understanding the
metabolic responses of living systems to pathophysiological stimuli viamultivariate statistical analysis of biological NMR spectroscopic data.Xenobiotica 1999, 29:1181-1189.
2. De Vos RCH, Moco S, Lommen A, Keurentjes JJB, Bino RJ, Hall RD:Untargeted large-scale plant metabolomics using liquid chromatographycoupled to mass spectrometry. Nat Protoc 2007, 2:778-791.
3. Lommen A, van der Weg G, van Engelen MC, Bor G, Hoogenboom LAP,Nielen MWF: An untargeted metabolomics approach to contaminantanalysis: Pinpointing potential unknown compounds. Anal Chim Acta2007, 584:43-49.
4. Fernie AR, Schauer N: Metabolomics-assisted breeding: a viable optionfor crop improvement? Trends Genet 2008, 25:39-48.
5. Griffin JL: Understanding mouse models of disease throughmetabolomics. Curr Opin Chem Biol 2006, 10:309-315.
6. Kaddurah-Daouk R, Kristal BS, Weinshilboum RM: Metabolomics: A GlobalBiochemical Approach to Drug Response and Disease. Annu RevPharmacol Toxicol 2008, 48:653-683.
7. Powers R: NMR metabolomics and drug discovery. Magn Reson Chem2009, 47:S2-S11.
8. Coen M, Holmes E, Lindon JC, Nicholson JK: NMR-Based MetabolicProfiling and Metabonomic Approaches to Problems in MolecularToxicology. Chem Res Toxicol 2008, 21:9-27.
9. Beger RD, Sun J, Schnackenberg LK: Metabolomics approaches fordiscovering biomarkers of drug-induced hepatotoxicity andnephrotoxicity. Toxicol Appl Pharmacol 243:154-166.
10. Ellis JK, Chan PH, Doktorova T, Athersuch TJ, Cavill R, Vanhaecke T,Rogiers V, Vinken M, Nicholson JK, Ebbels T MD, Keun HC: Effect of theHistone Deacetylase Inhibitor Trichostatin A on the Metabolome ofCultured Primary Hepatocytes. J Proteome Res 2009, 9:413-419.
Ruiz-Aracama et al. BMC Genomics 2011, 12:251http://www.biomedcentral.com/1471-2164/12/251
Page 17 of 19
11. van Vliet E, Morath S, Eskes C, Linge J, Rappsilber J, Honegger P, Hartung T,Coecke S: A novel in vitro metabolomics approach for neurotoxicitytesting, proof of principle for methyl mercury chloride and caffeine.Neurotoxicology 2008, 29:1-12.
12. Vanhaecke T, Snykers S, Rogiers V, Garthoff B, Castell J, Hengstler J: EUresearch activities in alternative testing strategies: current status andfuture perspectives. Arch Toxicol 2009, 83:1037-1042.
13. Corvi R: Genomics: an in vitro toxicology point of view. Altern Lab Anim2002, 30:129-131.
14. Snodin DJ: An EU perspective on the use of in vitro methods inregulatory pharmaceutical toxicology. Toxicol Lett 2002, 127:161-168.
15. Jennen DGJ, Magkoufopoulou C, Ketelslegers HB, van Herwijnen MHM,Kleinjans JCS, van Delft JHM: Comparison of HepG2 and HepaRG byWhole-Genome Gene Expression Analysis for the Purpose of ChemicalHazard Identification. Toxicol Sci 2010, 115:66-79.
16. van Delft JHM, van Agen E, van Breda SGJ, Herwijnen MH, Staal YCM,Kleinjans JCS: Discrimination of genotoxic from non-genotoxiccarcinogens by gene expression profiling. Carcinogenesis 2004,25:1265-1276.
17. van Delft JHM, van Agen E, van Breda SGJ, Herwijnen MH, Staal YCM,Kleinjans JCS: Comparison of supervised clustering methods todiscriminate genotoxic from non-genotoxic carcinogens by geneexpression profiling. Mutat Res, Fundam Mol Mech Mutagen 2005,575:17-33.
18. Winkler J, Sotiriadou I, Chen S, Hescheler J, Sachinidis A: The Potential ofEmbryonic Stem Cells Combined with -omics Technologies as ModelSystems for Toxicology. Curr Med Chem 2009, 16:4814-4827.
19. Landers JP, Bunce NJ: The Ah receptor and the mechanism of dioxintoxicity. Biochem J 1991, 276:273-287.
20. Mandal PK: Dioxin: a review of its environmental effects and its arylhydrocarbon receptor biology. J Comp Physiol, B 2005, 175:221-230.
21. Uno S, Dalton TP, Sinclair PR, Gorman N, Wang B, Smith AG, Miller ML,Shertzer HG, Nebert DW: Cyp1a1(-/-) male mice: protection against high-dose TCDD-induced lethality and wasting syndrome, and resistance tointrahepatocyte lipid accumulation and uroporphyria. Toxicol ApplPharmacol 2004, 196:410-421.
22. Senft AP, Dalton TP, Nebert DW, Genter MB, Hutchinson RJ, Shertzer HG:Dioxin Increases Reactive Oxygen Production in Mouse LiverMitochondria. Toxicol Appl Pharmacol 2002, 178:15-21.
23. Shertzer HG, Nebert DW, Puga A, Ary M, Sonntag D, Dixon K, Robinson LJ,Cianciolo E, Dalton TP: Dioxin Causes a Sustained Oxidative StressResponse in the Mouse. Biochem Biophys Res Commun 1998, 253:44-48.
24. Poland A, Knutson JC: 2,3,7,8-Tetrachlorodibenzo-p-Dioxin and RelatedHalogenated Aromatic Hydrocarbons: Examination of the Mechanism ofToxicity. Annu Rev Pharmacol Toxicol 1982, 22:517-554.
25. Safe S: Molecular biology of the Ah receptor and its role incarcinogenesis. Toxicol Lett 2001, 120:1-7.
26. Puga A, Maier A, Medvedovic M: The transcriptional signature of dioxin inhuman hepatoma HepG2 cells. Biochem Pharmacol 2000, 60:1129-1142.
27. Hankinson O: The Aryl Hydrocarbon Receptor Complex. Annu RevPharmacol Toxicol 1995, 35:307-340.
28. Knasmüller S, Parzefall W, Sanyal R, Ecker S, Schwab C, Uhl M, Mersch-Sundermann V, Williamson G, Hietsch G, Langer T, Darroudi F, Natajaran AT:Use of metabolically competent human hepatoma cells for thedetection of mutagens and antimutagens. Mutat Res, Fundam Mol MechMutagen 1998, 402:185-202.
29. Hockley SL, Mathijs K, Staal YCM, Brewer D, Giddings I, van Delft JHM,Phillips DH: Interlaboratory and Interplatform Comparison of MicroarrayGene Expression Analysis of HepG2 Cells Exposed to Benzo(a)pyrene.OMICS 2009, 13:115-125.
30. Wilkening S, Stahl F, Bader A: Comparison of primary human hepatocytesand hepatoma cell line HepG2 with regard with their biotransformationproperties. Drug Metab Dispos 2003, 31:1035-1042.
31. Lommen A: MetAlign: Interface-Driven, Versatile Metabolomics Tool forHyphenated Full-Scan Mass Spectrometry Data Preprocessing. Anal Chem2009, 81:3079-3086.
32. Lommen A, Weseman JM, Smith GO, Noteborn HPJM: On the detection ofenvironmental effects on complex matrices combining off-line liquidchromatography and 1H-NMR. Biodegradation 1998, 9:513-525.
33. Noteborn HPJM, Lommen A, van der Jagt RC, Weseman JM: Chemicalfingerprinting for the evaluation of unintended secondary metabolicchanges in transgenic food crops. J Biotechnol 2000, 77:103-114.
34. MetAlign. [http://www.metalign.nl].35. Kinehara M, Fukuda I, Yoshida Ki, Ashida H: Aryl hydrocarbon receptor-
mediated induction of the cytosolic phospholipase A(2)alpha gene by2,3,7,8-tetrachlorodibenzo-p-dioxin in mouse hepatoma Hepa-1c1c7cells. J Biosci Bioeng 2009, 108:277-281.
36. Dayoub R, Thasler WE, Bosserhoff AK, Singer T, Jauch KW, Schlitt HJ,Weiss TS: Regulation of polyamine synthesis in human hepatocytes byhepatotrophic factor augmenter of liver regeneration. Biochem BiophysRes Commun 2006, 345:181-187.
37. Raasch W, Regunathan S, Li G, Reis DJ: Agmatine, the bacterial amine, iswidely distributed in mammalian tissues. Life Sci 1995, 56:2319-2330.
38. Potter CL, Sipes IG, Russell DH: Inhibition of ornithine decarboxylaseactivity by 2,3,7,8-tetrachlorodibenzo-p-dioxin. Biochem Pharmacol 1982,3:3367-3371.
39. Thomas T, MacKenzie SA, Gallo MA: Regulation of polyamine biosynthesisby 2,3,7,8-tetrachlorodibenzo-p-dioxin (TCDD). Toxicol Lett 1990,53:315-325.
40. Pegg AE, McCann PP: Polyamine metabolism and function. Am J Physiol.Cell Physiol 1982, 243:C212-221.
41. Boverhof DR, Burgoon LD, Tashiro C, Sharratt B, Chittim B, Harkema JR,Mendrick DL, Zacharewski TR: Comparative Toxicogenomic Analysis of theHepatotoxic Effects of TCDD in Sprague Dawley Rats and C57BL/6 Mice.Toxicol Sci 2006, 94:398-416.
42. Fletcher N, Wahlström D, Lundberg R, Nilsson CB, Nilsson KC, Stockling K,Hellmold H, Håkansson H: 2,3,7,8-Tetrachlorodibenzo-p-dioxin (TCDD)alters the mRNA expression of critical genes associated with cholesterolmetabolism, bile acid biosynthesis, and bile transport in rat liver: Amicroarray study. Toxicol Appl Pharmacol 2005, 207:1-24.
43. Seefeld MD, Corbett SW, Keesey RE, Peterson RE: Characterization of thewasting syndrome in rats treated with 2,3,7,8-tetrachlorodibenzo-p-dioxin. Toxicol Appl Pharmacol 1984, 73:311-322.
44. Lakshman MR, Campbell BS, Chirtel SJ, Ekarohita N: Effects of 2,3,7,8-tetrachlorodibenzo-p-dioxin (TCDD) on de novo fatty acid andcholesterol synthesis in the rat. Lipids 1988, 23:904-906.
45. Lakshman MR, Chirtel SJ, Chambers LL, Coutlakis PJ: Effects of 2,3,7,8-tetrachlorodibenzo-p-dioxin on lipid synthesis and lipogenic enzymes inthe rat. J Pharmacol Exp Ther 1989, 248:62-66.
46. McKim J, Marien K, Schaup H, Selivonchick D: Alterations of hepatic acetyl-CoA carboxylase by 2,3,7,8-tetrachlorodibenzo- p -dioxin. Lipids 1991,26:521-525.
47. Boverhof DR, Burgoon LD, Tashiro C, Chittim B, Harkema JR, Jump DB,Zacharewski TR: Temporal and Dose-Dependent Hepatic Gene ExpressionPatterns in Mice Provide New Insights into TCDD-MediatedHepatotoxicity. Toxicol Sci 2005, 85:1048-1063.
48. Nishiumi S, Yabushita Y, Furuyashiki T, Fukuda I, Ashida H: Involvement ofSREBPs in 2,3,7,8-tetrachlorodibenzo-p-dioxin-induced disruption of lipidmetabolism in male guinea pig. Toxicol Appl Pharmacol 2008, 229:281-289.
49. Sato S, Shirakawa H, Tomita S, Ohsaki Y, Haketa K, Tooi O, Santo N,Tohkin M, Furukawa Y, Gonzalez FJ, Komai M: Low-dose dioxins alter geneexpression related to cholesterol biosynthesis, lipogenesis, and glucosemetabolism through the aryl hydrocarbon receptor-mediated pathwayin mouse liver. Toxicol Appl Pharmacol 2008, 229:10-19.
50. Alexander DL, Ganem LG, Fernandez-Salguero P, Gonzalez F, Jefcoate CR:Aryl-hydrocarbon receptor is an inhibitory regulator of lipid synthesisand of commitment to adipogenesis. J Cell Sci 1998, 111:3311-3322.
51. Vogel CFA, Matsumura F: Interaction of 2,3,7,8-tetrachlorodibenzo-p-dioxin (TCDD) with induced adipocyte differentiation in mouseembryonic fibroblasts (MEFs) involves tyrosine kinase c-Src. BiochemPharmacol 2003, 66:1231-1244.
52. Ntambi JM, Miyazaki M, Stoehr JP, Lan H, Kendziorski CM, Yandell BS,Song Y, Cohen P, Friedman JM, Attie AD: Loss of stearoyl-CoA desaturase-1 function protects mice against adiposity. Proc Natl Acad Sci USA 2002,99:11482-11486.
53. Sewell AC, Böhles HJ: Acylcarnitines in intermediary metabolism. Eur JPediatr 1995, 154:871-877.
54. Siliprandi N, Lisa F, Menabò R: Propionyl-L-carnitine: Biochemicalsignificance and possible role in cardiac metabolism. Cardiovasc DrugsTher 1991, 5:11-15.
Ruiz-Aracama et al. BMC Genomics 2011, 12:251http://www.biomedcentral.com/1471-2164/12/251
Page 18 of 19
55. Schiller CM, Adcock CM, Moore RA, Walden R: Effect of 2,3,7,8-tetrachlorodibenzo-p-dioxin (TCDD) and fasting on body weight andlipid parameters in rats. Toxicol Appl Pharmacol 1985, 81:356-361.
56. Swift LL, Gasiewicz TA, Dunn GD, Soulé PD, Neal RA: Characterization ofthe hyperlipidemia in guinea pigs induced by 2,3,7,8-tetrachlorodibenzo-p-dioxin. Toxicol Appl Pharmacol 1981, 59:489-499.
57. Viluksela M, Unkila M, Pohjanvirta R, Tuomisto JT, Stahl BU, Rozman KK,Tuomisto J: Effects of 2,3,7,8-tetrachlorodibenzo-p-dioxin (TCDD) on liverphosphoenolpyruvate carboxykinase (PEPCK) activity, glucosehomeostasis and plasma amino acid concentrations in the most TCDD-susceptible and the most TCDD-resistant rat strains. Arch Toxicol 1999,73:323-336.
58. Albro PW, Corbett JT, Harris M, Lawson LD: Effects of 2,3,7,8-tetrachlorodibenzo-p-dioxin on lipid profiles in tissue of the Fischer rat.Chem Biol Interact 1978, 23:315-330.
59. Hassan MQ, Stohs SJ, Murray WJ: Comparative ability of TCDD to inducelipid peroxidation in rats, guinea pigs, and Syrian golden hamsters. BullEnviron Contam Toxicol 1983, 31:649-657.
60. Pohjanvirta R, Sankari S, Kulju T, Naukkarinen A, Ylinen M, Tuomisto J:Studies on the Role of Lipid Peroxidation in the Acute Toxicity of TCDDin Rats. Pharmacol Toxicol 1990, 66:399-408.
61. Hilscherova K, Blankenship AL, Nie M, Coady KK, Upham BL, Trosko JE,Giesy JP: Oxidative stress in liver and brain of the hatchling chicken(Gallus domesticus) following in ovo injection with TCDD. Comp BiochemPhysiol C Toxicol Pharmacol 2003, 136:29-45.
62. Deneke SM, Fanburg BL: Regulation of cellular glutathione. Am J PhysiolLung Cell Mol Physiol 1989, 257:L163-173.
63. Reed DJ: Glutathione: Toxicological Implications. Annu Rev PharmacolToxicol 1990, 30:603-631.
64. Aly HAA, Domènech Ò: Cytotoxicity and mitochondrial dysfunction of2,3,7,8-tetrachlorodibenzo-p-dioxin (TCDD) in isolated rat hepatocytes.Toxicol Lett 2009, 191:79-87.
65. Kern PA, Fishman RB, Song W, Brown AD, Fonseca V: The effect of 2,3,7,8-tetrachlorodibenzo-p-dioxin (TCDD) on oxidative enzymes in adipocytesand liver. Toxicology 2002, 171:117-125.
66. Hassan MQ, Stohs SJ, Murray WJ: Inhibition of TCDD-induced lipidperoxidation, glutathione peroxidase activity and toxicity by BHA andglutathione. Bull Environ Contam Toxicol 1985, 34:787-796.
67. Schmidt A, Marescau B, Boehm EA, Renema WKJ, Peco R, Das A, Steinfeld R,Chan S, Wallis J, Davidoff M, Ullrich K, Waldschütz R, Heerschap A, DeDeyn PP, Neubauer S, Isbrandt D: Severely altered guanidino compoundlevels, disturbed body weight homeostasis and impaired fertility in amouse model of guanidinoacetate N-methyltransferase (GAMT)deficiency. Hum Mol Gen 2004, 13:905-921.
68. Huxtable RJ: Physiological actions of taurine. Physiol Rev 1992, 72:101-163.69. Park T, Oh J, Lee K: Dietary taurine or glycine supplementation reduces
plasma and liver cholesterol and triglyceride concentrations in rats fed acholesterol-free diet. Nutr Res 1999, 19:1777-1789.
70. Yanagita T, Han SY, Hu Y, Nagao K, Kitajima H, Murakami S: Taurinereduces the secretion of apolipoprotein B100 and lipids in HepG2 cells.Lipids Health Dis 2008, 7:38.
71. Cimafranca MA, Hanlon PR, Jefcoate CR: TCDD administration after thepro-adipogenic differentiation stimulus inhibits PPARγ through a MEK-dependent process but less effectively suppresses adipogenesis. ToxicolAppl Pharmacol 2004, 196:156-168.
72. Hanlon PR, Zheng W, Ko AY, Jefcoate CR: Identification of novel TCDD-regulated genes by microarray analysis. Toxicol Appl Pharmacol 2005,202:215-228.
73. Konrad RJ, Kudlow JE: The role of O-linked protein glycosylation in beta-cell dysfunction. Int J Mol Med 2002, 10:535-539.
74. Wagner KW, Punnoose EA, Januario T, Lawrence DA, Pitti RM, Lancaster K,Lee D, von Goetz M, Yee SF, Totpal K, Huw L, Katta V, Cavet G,Hymowitz SG, Amler L, Ashkenazi A: Death-receptor O-glycosylationcontrols tumor-cell sensitivity to the proapoptotic ligand Apo2L/TRAIL.Nat Med 2007, 13:1070-1077.
75. Kim S, Dere E, Burgoon LD, Chang CC, Zacharewski TR: ComparativeAnalysis of AhR-Mediated TCDD-Elicited Gene Expression in HumanLiver Adult Stem Cells. Toxicol Sci 2009, 112:229-244.
76. Kim JH, In YJ, Kim WK, Bae KH, Kang S, Lee SC: Differential signatures ofprotein glycosylation and phosphorylation in human Chang liver cellsinduced by TCDD treatment. Toxicol Lett 2008, 178:20-28.
77. Baslow MH: N-Acetylaspartate in the Vertebrate Brain: Metabolism andFunction. Neurochem Res 2003, 28:1573-6903.
78. Rubin Y, Connelly GP, Lenkinski RE: N-acetylaspartate complexes withcalcium and lanthanide ions. J Inorg Biochem 1995, 60:31-43.
79. GeneMaths. [http://www.applied-maths.com/genemaths/genemaths.htm].80. The Human Metabolome Database. [http://www.hmdb.ca/].81. Oostendorp M, Engelke UFH, Willemsen MAAP, Wevers RA: Diagnosing
Inborn Errors of Lipid Metabolism with Proton Nuclear MagneticResonance Spectroscopy. Clin Chem 2006, 52:1395-1405.
82. Fan TWM, Lane AN: Structure-based profiling of metabolites andisotopomers by NMR. Prog Nucl Magn Reson Spectrosc 2008, 52:69-117.
83. Govindaraju V, Young K, Maudsley AA: Proton NMR chemical shifts andcoupling constants for brain metabolites. NMR Biomed 2000, 13:129-153.
doi:10.1186/1471-2164-12-251Cite this article as: Ruiz-Aracama et al.: An untargeted multi-techniquemetabolomics approach to studying intracellular metabolites of HepG2cells exposed to 2,3,7,8-tetrachlorodibenzo-p-dioxin. BMC Genomics 201112:251.
Submit your next manuscript to BioMed Centraland take full advantage of:
• Convenient online submission
• Thorough peer review
• No space constraints or color figure charges
• Immediate publication on acceptance
• Inclusion in PubMed, CAS, Scopus and Google Scholar
• Research which is freely available for redistribution
Submit your manuscript at www.biomedcentral.com/submit
Ruiz-Aracama et al. BMC Genomics 2011, 12:251http://www.biomedcentral.com/1471-2164/12/251
Page 19 of 19


