Embed Size (px)
Citation preview

Du et al. BMC Genomics 2014, 15:625http://www.biomedcentral.com/1471-2164/15/625
RESEARCH ARTICLE Open Access
An update of the goat genome assembly usingdense radiation hybrid maps allows detailedanalysis of evolutionary rearrangements inBovidaeXiaoyong Du1,6†, Bertrand Servin2†, James E Womack3, Jianhua Cao1, Mei Yu1, Yang Dong4,5, Wen Wang4*
and Shuhong Zhao1*
Abstract
Background: The domestic goat (Capra hircus), an important livestock species, belongs to a clade of Ruminantia,Bovidae, together with cattle, buffalo and sheep. The history of genome evolution and chromosomal rearrangementson a small scale in ruminants remain speculative. Recently completed goat genome sequence was released but is stillin a draft stage. The draft sequence used a variety of assembly packages, as well as a radiation hybrid (RH) map ofchromosome 1 as part of its validation.
Results: Using an improved RH mapping pipeline, whole-genome dense maps of 45,953 SNP markers wereconstructed with statistical confidence measures and the saturated maps provided a fine map resolution ofapproximate 65 kb. Linking RH maps to the goat sequences showed that the assemblies of scaffolds/super-scaffoldswere globally accurate. However, we observed certain flaws linked to the process of anchoring chromosome usingconserved synteny with cattle. Chromosome assignments, long-range order, and orientation of the scaffolds werereassessed in an updated genome sequence version. We also present new results exploiting the updated goat genomesequence to understand genomic rearrangements and chromosome evolution between mammals during speciesradiations. The sequence architecture of rearrangement sites between the goat and cattle genomes presentedabundant segmental duplication on regions of goat chromosome 9 and 14, as well as new insertions in homologouscattle genome regions. This complex interplay between duplicated sequences and Robertsonian translocationshighlights the rearrangement mechanism of centromeric nonallelic homologous recombination (NAHR) in mammals.We observed that species-specific shifts in ANKRD26 gene duplication are coincident with breakpoint reuse indivergent lineages and this gene family may play a role in chromosome stabilization in chromosome evolution.
Conclusions: We generated dense maps of the complete whole goat genome. The chromosomal maps allowed us toanchor and orientate assembled genome scaffolds along the chromosomes, annotate chromosome rearrangementsand thereby get a better understanding of the genome evolution of ruminants and other mammals.
Keywords: Goat, Radiation hybrid map, Genomic rearrangements, Gene duplication
* Correspondence: [email protected]; [email protected]†Equal contributors4State Key Laboratory of Genetic Resources and Evolution, Kunming Instituteof Zoology, Chinese Academy of Sciences, Kunming, China1Key lab of animal genetics, breeding and reproduction of ministryeducation, College of Animal Science and Technology, HuazhongAgricultural University, Wuhan 430070, People's Republic of ChinaFull list of author information is available at the end of the article
© 2014 Du et al.; licensee BioMed Central Ltd. This is an Open Access article distributed under the terms of the CreativeCommons Attribution License (http://creativecommons.org/licenses/by/2.0), which permits unrestricted use, distribution, andreproduction in any medium, provided the original work is properly credited. The Creative Commons Public DomainDedication waiver (http://creativecommons.org/publicdomain/zero/1.0/) applies to the data made available in this article,unless otherwise stated.

Du et al. BMC Genomics 2014, 15:625 Page 2 of 16http://www.biomedcentral.com/1471-2164/15/625
BackgroundThe domestic goat (Capra hircus) is an important sourceof food and wool (cashmere) especially important in lowinput production systems. The ability of goat to consumea wide range of vegetation explains its significance for theagricultural economy. In 2007, the FAO estimated theworld population of goats to be around 800 million ani-mals. Despite this economic importance, goat genomicresources are not extensive compared to other livestockspecies, such as cattle, pig, chicken, or sheep. Goat is aruminant and a member of the Caprinae order, a cladedistinct from Bovinae in the Bovidae family. Its lastcommon ancestor with cattle is dated between 19 and40 million year (Myr) ago, and with sheep between 6.2and 8.5 Myr ago [1]. Comparative mapping betweencattle and goat using fluorescent in situ hybridization(FISH) showed a strong synteny conservation betweenthe two genomes with a few large-scale rearrangements,including the well-known 9–14 translocation differen-tiating Bovinae and Caprinae [2] and differences inintra-chromosomal organization of the X chromosome[3,4]. However, the history of genome evolution andchromosomal rearrangements on a small scale in rumi-nants remain speculative, mostly due to limited number ofmapped loci.High-resolution gene maps provide basic but crucial
linear information on the physical organization of thegenome and typically serve as the backbone for furthergenomic research. For example, robust informationabout marker organization on chromosomes is crucial forlinkage analysis and marker assisted animal breeding.Although assembling next-generation sequencing datainto a draft genome comprising scaffolds is relativelystraightforward, constructing a physical map of the struc-ture of chromosomes is still difficult and costly. Recentyears have witnessed a slow increase in gene mapping datain the goat since the first genetic and cytogenetic maps[2,5]. To date, approximately only 550 loci have beenmapped to the goat genome using linkage maps of lowresolution [6]. The initial release of the goat genome se-quence is based entirely on short-read de novo sequencingof a Yunnan Black goat that yielded a ~2.66 Gb assemblyof 284,683 scaffolds (N50 = 3.06 Mb). Anew improvedoptical mapping technology was used to joined 2,090scaffolds into 315 larger super-scaffolds (N50 = 16.3 Mb).Finally, super-scaffolds were assembled into chromosomesbased on conserved synteny with cattle [7]. The goat gen-ome sequence could yield a wealth of information aboutgene content and putative regulatory elements sequences;however, it is still lacking long-range continuity and itsreleased form only gives a fragmented view of the genome.Another genomic resource, radiation hybrid (RH) maps,
played a pivotal role in the process of mapping animal ge-nomes and validation of draft assemblies of the genome
sequence, especially in mammals [8-11]. For obtainingdense and accurate next-generation RH maps, newmethods were developed recently exploiting the increasedavailability of comparative genomic resources [12] andhave proved successful for the production of RH mapsbased on SNP array genotyping data [13,14].As a part of the goat genome project, we built RH
maps of chromosome 1 that helped to validate the draftgenome assembly. In this study, using a goat RH panelthat we generated recently [15], we constructed robustphysical maps of 45,953 loci for all of goat chromosomesexcept chromosome Y. The whole-genome goat RH map,as an independent chromosomal map, allowed us to anchorand orientate assembled genome scaffolds along the chro-mosomes thus permitting the annotation of chromosomerearrangements and the study of their evolutionary historyusing ruminants and other mammalian genomes.
Results and discussionGenotype calling of SNPs in the RH clonesIn building the RH maps, we sought to provide accurate,detailed and reliable physical maps at the whole-genomescale to aid in the validation and improvement of thegoat genome assembly. Genotyping SNP arrays fromother species on the goat RH panel turned out to be asuccessful strategy for the genotype calling of RH clones.A similar strategy of marker selection from close relatedspecies had been applied for constructing buffalo RHmaps [16]. Because sequence conservation between thethree species considered here is high, a number of bovineand sheep SNPs presented a positive signal in the goat.Moreover, the SNPs that did not provide positive signalswere particularly useful for the genotype calling procedureas they gave an internal control, within each clone, of thesignal exhibited by non-retained SNPs. We believe ithighly increased the robustness of the genotype callingprocedure, which is ultimately proven by the quality of theRH maps produced and for future studies we wouldrecommend this approach. The feasibility depends onthe availability of a SNP array in a closely related species.To test that whether the approach can be carried out in aspecies, a simple experiment would consist in genotypingof whole genome sample of the species of interest withthe related species array and check that (1) a number ofSNPs can provide signal and (2) a number of SNPs do notprovide signal. Optimally both the categories should be insimilar proportion on the array. Recall that the fact thatSNPs are actually polymorphic in the species of interest isnot relevant for RH mapping.The goat radiation hybrid panel [12] including 94 hybrid
clones was genotyped using IlluminaBovineSNP50KBeadChip and OvineSNP50K BeadChip. RH vectors wereconstructed for more than 110,000 SNPs out of which54,318 could be assigned a position on the chromosomes

Du et al. BMC Genomics 2014, 15:625 Page 3 of 16http://www.biomedcentral.com/1471-2164/15/625
of the goat genome assembly CHIR_1.0. We performedgenotype calls (Figure 1) independently for the sheep andthe bovine SNP arrays (see Methods). Table 1 summarizesthe results of our genotype calling procedure for eachSNP array. The two analyzes provided consistent esti-mates of the panel retention fraction: 37% based on thesheep array data and 35% based on the bovine arraydata. False negative rates and proportion of missing datawere also similar. The call rate was slightly higher forthe bovine arrays (80%) than for the ovine array (73%),however, the number of SNPs that could be called wasslightly lower (35,521 vs. 43,628). This is explained bythe fact that there are much more SNPs (12,577) on thebovine array which do not exhibit a positive signal inthe whole genome goat sample than that on the sheeparray (3,969), consistent with the phylogeny of thesethree species.Even low levels of error result in large losses of informa-
tion about breakage probabilities, markedly increase theuncertainty in the marker ordering, and inflate estimatesof inter-marker distances and total map length [17]. Thehigh error rate of genotypes for constructing certain mapsprevents from recovering sufficient signal for ordering themarkers. The ability to produce useful robust maps incomparative RH mapping is impaired when the error ratein the data increases above 10% [14]. Before constructingthe integrated robust map, we also checked the vectordata from bovine SNPs and Ovine SNPs, respectively, andconstructed two robust maps for each chromosome.These maps (data not shown) presented a very low errorrate in the RH data, in consistent with the low false nega-tive rate estimated by the Q-value R package [18]. How-ever, we note that the slight differences in experimental
Figure 1 Imax for SNP marker genotyping. We called genotypes of clongenotyping system. A number (Nneg) of SNPs showed very low intensitiesgenotype calling of a given SNP in a given clone was the maximum obserdistribution of Imax in a given clone can be seen as a mixture of two undeand one for the retained SNPs (e.g. panel B).
conditions between genotyping RH clones on theBovineSNP50K array and on the OvineSNP50K array.It could bring certain systematic errors when mergingthe two datasets, which we cannot assess, since our RHvectors have not been validated by replicated genotyping.However, the availability of negative control SNPs withineach clone offers a replication across clones. For increasedrobustness, we applied three approaches to remove pos-sible genotyping errors before constructing the integratedrobust maps.
Genome map construction and characterizationBriefly, for each chromosome, the analysis of RH mappingwas done in three steps:
1) We portioned 53,075 mapped SNPs (mSNPs)according to their assigned chromosome onCHIR_1.0. For each of the 30 chromosomes, alinkage group was established using RH data alone,which removed 13 unlinked markers.
2) We then built comparative RH maps with allremaining markers, using prior information on theirordering from assembly CHIR_1.0. We furtherexcluded 1,918 markers, which possibly have errorsor have poor information in RH vector using threecriteria (see Methods for details). This resulted in51,144 SNPs being positioned on 30 chromosomalLKH maps.
3) We extracted a subset of markers from the LKHmaps for which the ordering was strongly supportedby RH data. This procedure removed about 5,191SNPs, which could not be confidently ordered, andled to RH robust maps comprising 45,953 SNPs.
es at SNPs based on the raw signal intensities obtained from Illuminafor both alleles in the goat (panel A). Specifically, the statistic used forved intensity over the two possible alleles (herein called Imax). Therlying distributions, where one for the non-retained SNPs in the clone

Table 1 Summary of the genotype calling results
SNP array Ns Nneg Ndis Ret. rate estimate Call rate Missing proportion FNR
Ovine 54,231 3,969 6,634 37% 73% 7% 7%
Bovine 54,001 12,577 5,903 35% 80% 5% 5%
Ns: number of SNPs with raw data, Nneg: number of SNPs not callable in the goat, Ndis: number of SNPs discarded based on their retention rate (see details inthe text). Call Rate = Proportion of SNP called retained/retention rate estimate. Missing proportion: proportion of missing data, FNR: estimate of the false negativerate in the SNP called “un-retained”.
Du et al. BMC Genomics 2014, 15:625 Page 4 of 16http://www.biomedcentral.com/1471-2164/15/625
The final robust RH map contained 45,953 SNP Markersspanning totally 76,800 cR5000. Marker information ofthe RH maps is shown in Additional file 1. These markersare mapped at 17,628 distinct positions (38.4% of the totalnumber of markers) hence the maps are highly saturated.A summary of the maps including chromosome size, RHmap length, and the number of SNPs kept at each step foreach chromosome is shown in Figure 2. The number ofSNPs removed during construction of robust maps wasrelatively constant across chromosomes, with the notableexception of CHI23 (27.6%), CHI24 (25.6%), and CHI29(22.1%), for which a large portion in the middle of thechromosome could not be considered in the robust maps.Marker density was also fairly uniform between chromo-somes (results not shown).Detailed characteristics of the final RH maps are
provided in Additional file 2. In general, the retentionfrequency was stable across the genome, with the ex-pected minor increases at the distal chromosomes. TheRH maps uniformly cover >99% of CHIR_1.0 and have anaverage resolution of 32.6 kb/cR5000 based on a goat gen-ome size of 2.66 GB. The map of chromosome 19 has theshortest length of 1,228 cR and does not cover the regionfrom 40.9 Mb to 62.1 Mb in CHIR_1.0. On CHI19 we re-trieved 2,377 RH vectors from raw genotyping data beforeany quality control. In the raw data, the retention from
Figure 2 Number of Single Nucleotide Polymorphisms mapped on thand the length of robust maps.
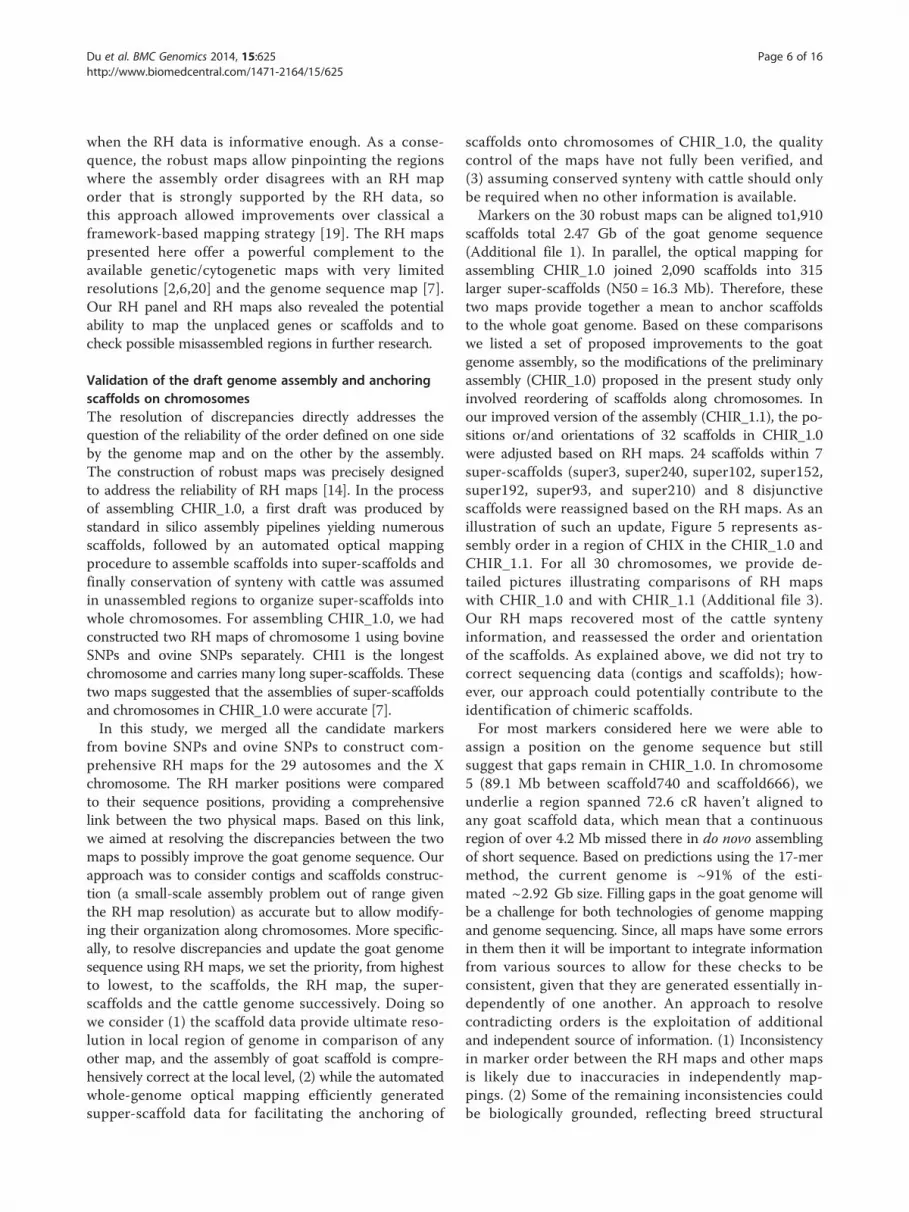
40.9 Mb to 62.1 Mb is extremely high because it sur-rounds the selection locus TK1 (thymidine kinase 1 gene).We further observed that the regions carry TK1 gene atposition of 52.7 Mb, where the anticipated highest reten-tion near 100%. Consequently, the markers in this regioncould not be mapped (Figure 3). The log of the ratio ofthe posterior probability of the best map to the secondbest map (similar to a LOD score) ranged from 0.17 to3.54 for robust RH maps. The two chromosomes with thelowest LOD value are CHI21 and CHI4 possibly indicat-ing a higher genotyping error rate in their RH vectors.Genotyping errors are also a vital factor to increase thedistance of inter-markers unexpectedly. The total maplength of CHI2, CHI7 and CHI18 are higher than ex-pected given the sequence length of these chromosomes(Figure 2). To further characterize the resolution of ourRH maps, we studied the distribution of the length ofretained fragments using a methodology suggested in aprevious study [19]. We found a generally good agree-ment with the expected distribution of segment lengths(Figure 4), except for the class of very small segments(<2 cR) which is completely lacking in our maps. This ismost likely because we are not able to order such closemarkers with confidence and therefore these small seg-ments are not saw in the robust RH maps. We estimatethat the RH panel can order confidently markers separated
e goat chromosomes at different steps of the mapping process
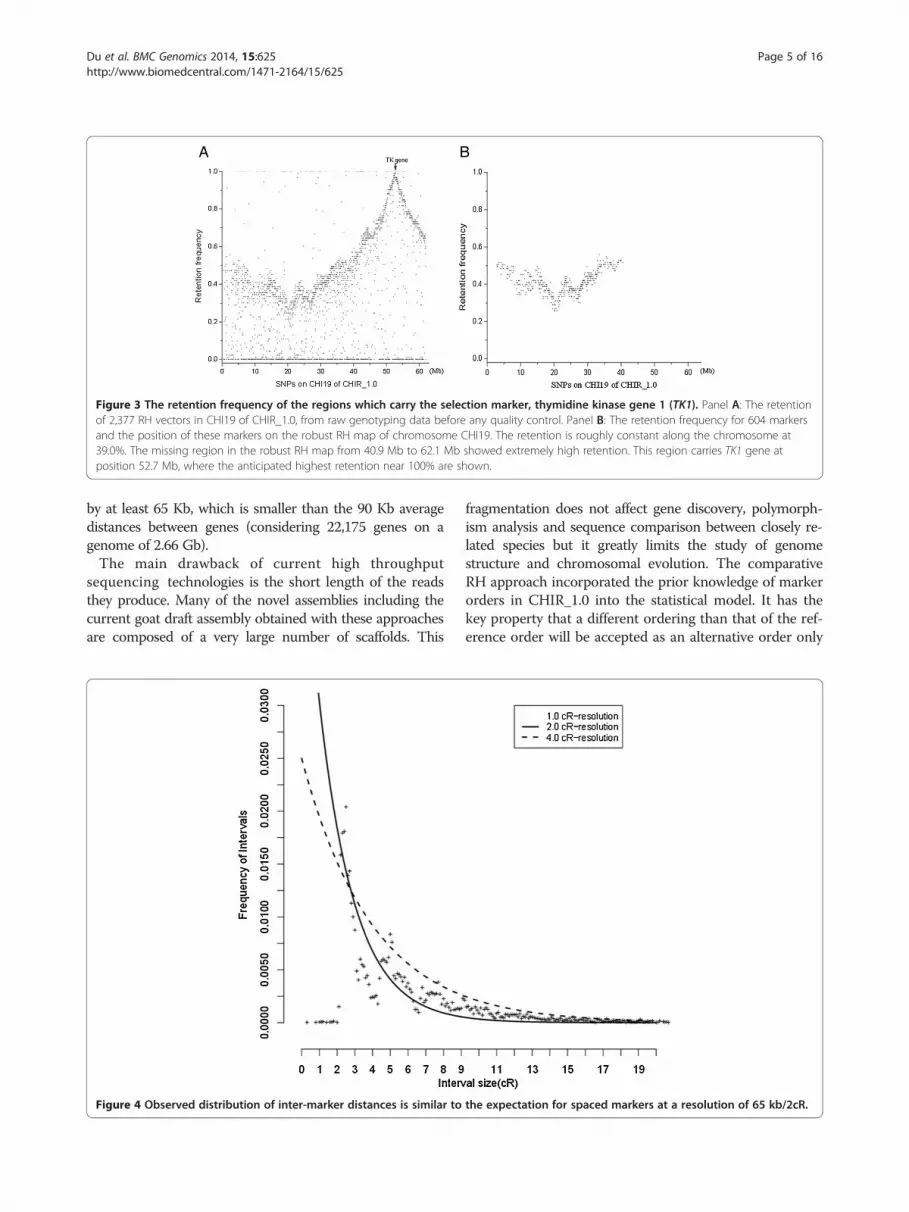
Figure 3 The retention frequency of the regions which carry the selection marker, thymidine kinase gene 1 (TK1). Panel A: The retentionof 2,377 RH vectors in CHI19 of CHIR_1.0, from raw genotyping data before any quality control. Panel B: The retention frequency for 604 markersand the position of these markers on the robust RH map of chromosome CHI19. The retention is roughly constant along the chromosome at39.0%. The missing region in the robust RH map from 40.9 Mb to 62.1 Mb showed extremely high retention. This region carries TK1 gene atposition 52.7 Mb, where the anticipated highest retention near 100% are shown.
Du et al. BMC Genomics 2014, 15:625 Page 5 of 16http://www.biomedcentral.com/1471-2164/15/625
by at least 65 Kb, which is smaller than the 90 Kb averagedistances between genes (considering 22,175 genes on agenome of 2.66 Gb).The main drawback of current high throughput
sequencing technologies is the short length of the readsthey produce. Many of the novel assemblies including thecurrent goat draft assembly obtained with these approachesare composed of a very large number of scaffolds. This
Figure 4 Observed distribution of inter-marker distances is similar to
fragmentation does not affect gene discovery, polymorph-ism analysis and sequence comparison between closely re-lated species but it greatly limits the study of genomestructure and chromosomal evolution. The comparativeRH approach incorporated the prior knowledge of markerorders in CHIR_1.0 into the statistical model. It has thekey property that a different ordering than that of the ref-erence order will be accepted as an alternative order only
the expectation for spaced markers at a resolution of 65 kb/2cR.
Du et al. BMC Genomics 2014, 15:625 Page 6 of 16http://www.biomedcentral.com/1471-2164/15/625
when the RH data is informative enough. As a conse-quence, the robust maps allow pinpointing the regionswhere the assembly order disagrees with an RH maporder that is strongly supported by the RH data, sothis approach allowed improvements over classical aframework-based mapping strategy [19]. The RH mapspresented here offer a powerful complement to theavailable genetic/cytogenetic maps with very limitedresolutions [2,6,20] and the genome sequence map [7].Our RH panel and RH maps also revealed the potentialability to map the unplaced genes or scaffolds and tocheck possible misassembled regions in further research.
Validation of the draft genome assembly and anchoringscaffolds on chromosomesThe resolution of discrepancies directly addresses thequestion of the reliability of the order defined on one sideby the genome map and on the other by the assembly.The construction of robust maps was precisely designedto address the reliability of RH maps [14]. In the processof assembling CHIR_1.0, a first draft was produced bystandard in silico assembly pipelines yielding numerousscaffolds, followed by an automated optical mappingprocedure to assemble scaffolds into super-scaffolds andfinally conservation of synteny with cattle was assumedin unassembled regions to organize super-scaffolds intowhole chromosomes. For assembling CHIR_1.0, we hadconstructed two RH maps of chromosome 1 using bovineSNPs and ovine SNPs separately. CHI1 is the longestchromosome and carries many long super-scaffolds. Thesetwo maps suggested that the assemblies of super-scaffoldsand chromosomes in CHIR_1.0 were accurate [7].In this study, we merged all the candidate markers
from bovine SNPs and ovine SNPs to construct com-prehensive RH maps for the 29 autosomes and the Xchromosome. The RH marker positions were comparedto their sequence positions, providing a comprehensivelink between the two physical maps. Based on this link,we aimed at resolving the discrepancies between the twomaps to possibly improve the goat genome sequence. Ourapproach was to consider contigs and scaffolds construc-tion (a small-scale assembly problem out of range giventhe RH map resolution) as accurate but to allow modify-ing their organization along chromosomes. More specific-ally, to resolve discrepancies and update the goat genomesequence using RH maps, we set the priority, from highestto lowest, to the scaffolds, the RH map, the super-scaffolds and the cattle genome successively. Doing sowe consider (1) the scaffold data provide ultimate reso-lution in local region of genome in comparison of anyother map, and the assembly of goat scaffold is compre-hensively correct at the local level, (2) while the automatedwhole-genome optical mapping efficiently generatedsupper-scaffold data for facilitating the anchoring of
scaffolds onto chromosomes of CHIR_1.0, the qualitycontrol of the maps have not fully been verified, and(3) assuming conserved synteny with cattle should onlybe required when no other information is available.Markers on the 30 robust maps can be aligned to1,910
scaffolds total 2.47 Gb of the goat genome sequence(Additional file 1). In parallel, the optical mapping forassembling CHIR_1.0 joined 2,090 scaffolds into 315larger super-scaffolds (N50 = 16.3 Mb). Therefore, thesetwo maps provide together a mean to anchor scaffoldsto the whole goat genome. Based on these comparisonswe listed a set of proposed improvements to the goatgenome assembly, so the modifications of the preliminaryassembly (CHIR_1.0) proposed in the present study onlyinvolved reordering of scaffolds along chromosomes. Inour improved version of the assembly (CHIR_1.1), the po-sitions or/and orientations of 32 scaffolds in CHIR_1.0were adjusted based on RH maps. 24 scaffolds within 7super-scaffolds (super3, super240, super102, super152,super192, super93, and super210) and 8 disjunctivescaffolds were reassigned based on the RH maps. As anillustration of such an update, Figure 5 represents as-sembly order in a region of CHIX in the CHIR_1.0 andCHIR_1.1. For all 30 chromosomes, we provide de-tailed pictures illustrating comparisons of RH mapswith CHIR_1.0 and with CHIR_1.1 (Additional file 3).Our RH maps recovered most of the cattle syntenyinformation, and reassessed the order and orientationof the scaffolds. As explained above, we did not try tocorrect sequencing data (contigs and scaffolds); how-ever, our approach could potentially contribute to theidentification of chimeric scaffolds.For most markers considered here we were able to
assign a position on the genome sequence but stillsuggest that gaps remain in CHIR_1.0. In chromosome5 (89.1 Mb between scaffold740 and scaffold666), weunderlie a region spanned 72.6 cR haven’t aligned toany goat scaffold data, which mean that a continuousregion of over 4.2 Mb missed there in do novo assemblingof short sequence. Based on predictions using the 17-mermethod, the current genome is ~91% of the esti-mated ~2.92 Gb size. Filling gaps in the goat genome willbe a challenge for both technologies of genome mappingand genome sequencing. Since, all maps have some errorsin them then it will be important to integrate informationfrom various sources to allow for these checks to beconsistent, given that they are generated essentially in-dependently of one another. An approach to resolvecontradicting orders is the exploitation of additionaland independent source of information. (1) Inconsistencyin marker order between the RH maps and other mapsis likely due to inaccuracies in independently map-pings. (2) Some of the remaining inconsistencies couldbe biologically grounded, reflecting breed structural

Figure 5 Comparison between robust RH maps with CHIR_1.0 (left) and CHIR_1.1 (right) for goat chromosome X.
Du et al. BMC Genomics 2014, 15:625 Page 7 of 16http://www.biomedcentral.com/1471-2164/15/625
variations. Indeed, the reference sequence and the RHpanel were generated using the DNA from different in-dividuals and from different breeds (a Yunnan black forthe reference sequence and Boer samples for the RHpanels), as has already been evidenced in the goat [20].
Mapping of unplaced scaffolds on the goat genomeAs an application of the RH maps, we predicted the posi-tions of SNPs with no localization on the assemblyCHIR_1.0. Herein we call these unmapped SNPs “uSNPs”.On the assembly CHIR_1.0, 391 uSNPs assigned to un-placed scaffolds longer than 10Kbhad RH vectors. Firstly,the most likely chromosome was determined based on thelinkage with mSNPs and then the best possible positionwas determined in the LKH map. We excluded uSNPson tiny scaffolds from map construction because of thelimited resolution of our RH maps (we noticed thatessentially all SNPs assigned to a given scaffold hadconsistent predicted localization on the same RH map).We identified 32 uSNPs (2.2%) on the X chromosome,more than expected compared to autosome maps. Thiscould imply that for CHIX more genome sequence ismissing in the current assembly than for other chromo-somes. We set the same principle for mapping unplacedscaffolds as we used to validate the draft genome: unplacedscaffolds could only be inserted between two contiguousplaced scaffolds and we aligned the candidate scaffolds andtheir neighbors based on the cattle genome order.Localizing unplaced scaffold280 (1,268 Kb with 9 uSNPs)
and scaffold767 (185 Kb with 3 uSNPs) is illustrated onFigure 6. The predicted localization for this scaffold, basedon SNPs predicted positions, was at the beginning ofCHI4. We verified that scaffold280 and scaffold767aligned on the putative syntenic region of the cattlegenome and constructed a local RH map of the regionincluding uSNPs of both scaffolds. We found that bothscaffolds were indeed strongly linked to scaffold641 onCHI4 so that both can be placed on the goat genome
confidently. Another example, illustrated in Additionalfile 4, revealed that RH maps can be used to improvethe goat sequence map accurately in a local region byboth correcting the ordering of scaffolds and addingunplaced scaffolds.Among the uSNPs for which we could assign a position
on the goat genome, we were able to align 95 scaffoldspresent in the goat genome sequence but currently un-assigned. Of these scaffolds 52 only could be assigned aposition but not orientated, either because they carried asingle uSNP or because they contained multiple tightlylinked SNPs whose map order was questionable due to in-sufficient radiation-induced breakpoints. The orientationsof the 53 scaffolds were obtained using comparative infor-mation with the cattle genome (UMD3.1) assuming con-served synteny. In total, 19.45 Mb of previously unplacedgenome sequences were incorporated into the new versionof the genome assembly. The comparison between the RHmap with super-scaffolds and the CHIR_1.1 assembly arepresented in Additional file 5. Of 1,910 scaffolds that canbe aligned to the 30 robust RH maps, 1,884 were used toreassembling chromosome sequences. Only a few rear-rangements exist between RH map and the new version ofgenome assembly. The updated assembly is available as anagp file (the CHIR_1.1 assembly, at http://goat.kiz.ac.cn)
Genome rearrangements between caprine andbovine genomeWe used our RH updated genome assembly to identifyconserved segments between species that led to noveldiscoveries of ancient chromosome rearrangements andstudy the sequence features of evolutionary breakpoints.Mapping a large number of markers on the goat genomeand cross-referencing 96.4% of these with the maplocations for the markers in the bovine achieved thisalignment (Additional file 1). Overall, there is a verygood colinearity between the goat RH maps order andthe bovine assembly order, consistent with a relatively

Figure 6 The validation of the predicted position for the unplaced scaffold280 and scaffold767. Panel A: We constructed a local RH mapof CHI4 including SNPs from the scaffold the unplaced scaffold280 and scaffold767. Panel B: The genomic region from 0 to 1.35 Mb on cattlechromosome 4 do not have any alignment with CHI4 on CHIR_1.0, which pointed out that a long sequence probably missed on the distal ofCHI4 on CHIR_1.0. Panel C: We verified that scaffold280 and scaffold767 were aligned with the putative syntenic region of the cattle genome andwere closed to the placed scaffold641.
Table 2 The major rearrangement sites between goat and cattle
Goat/chrom. SNP marker RH(cR) Goat_V1.1(Mb) UMD3.1(Mb)
Chr14 OAR9_334753.1 0 chr14:0.41 chr9:12.20
OAR9_12923703.1 269.51 chr14:11.67 chr9:0.90
Chr13 s60476.1 259.30 chr13:10.31 chr13:16.44
s10077.1 433.42 chr13:15.86 chr13:10.59
ChrX OARX_91845722.1 0 chrX: 1.46 chrX:27.32
ARS-BFGL-NGS-41828 119.73 chrX: 21.42 chrX:40.41
ChrX OARX_111907035.1 152.9 chrX: 25.88 chrX:6.74
OARX_126406510.1 254.23 chrX: 35.07 chrX:0.34
ChrX OARX_120191387.1 268.01 chrX:36.52 chrX:7.10
ARS-BFGL-NGS-8011 625.00 chrX: 56.40 chrX:23.69
Du et al. BMC Genomics 2014, 15:625 Page 8 of 16http://www.biomedcentral.com/1471-2164/15/625

Du et al. BMC Genomics 2014, 15:625 Page 9 of 16http://www.biomedcentral.com/1471-2164/15/625
short divergence time between the two species. Howeverthere are few discrepancies (Table 2), in agreement withchromosome banding features [21]. X chromosomesappear to have been subjected to large number of rear-rangements, compared to the autosomes, suggesting thatrearrangements might better tolerated on sex chromo-somes. The X-chromosome linkage group is usually con-served in placental mammals and does not interplay withautosomes in chromosome evolution. Comparison of thecytogenetic maps of caprine and bovine X chromosomesalso shows some changes in loci order, defining 6 commonchromosome segments [3,22]. Both the RH map and thesequence map confirmed the well-known chromosome9–14 translocation, with CHI14 containing a smallBTA9q11-q13 segment including genes COL9A1 andETH225 [23]. Our comparative mapping did not detectinversions between CHI2 and BTA2, or CHI19 andBTA19, which were suggested by these previous
Figure 7 Sequence architecture at synteny breaks of chromosome 9–A: A breakpoint region on CHI14 (10.40 Mb-11.08 Mb) mapping to two catmapping to two goat centromeres. In each panel, [α] Goat-cattle DNA pairof goat regions or cattle regions are grey. Each two neighboring synteny brespectively. Colors have not any biological meanings. [β] Segmental duplicatsegmental duplications are highly enriched in breakpoints comparing to syntLTRs (yellow). [δ] Genes with colors denotes transcriptional orientation (the whomologsare marked in red. Breakpoint intervals were highlighted using mbetween cattle and goat, which revealed mosaic new insertions at rearranshare larger homologous region in cattle (panel A), different from in goatevolution process than two goat centromeres. The breakpoint in goat gengenome (panel B). Segmental duplications are enriched in breakpoints copromoted nonallelic homologous recombination (NAHR), and thus a chro
cytogenetic maps. We believe the relative inaccuracy inthese cytogenetic maps may account for these differences.We characterized the sequence architecture of the
evolutionary breakpoints for two ruminant rearrange-ments, one between CHI9 and CHI14 (Figure 7) and onein CHI13 (Additional file 6). While the CHI9-CHI14translation is a known rearrangement between ruminantgenomes [6], the CHI13 one was not described previously.Cattle shares a large region of conserved synteny with thehuman and dog genomes at position 13.0 Mb on cattleBTA14, whereas goat presents species-specific breakpointsand loaded to two centromeres of CHI9 and CHI14(Figure 8), so we considered that the rearrangementoccurred in the goat lineage. Breakpoint intervals fromtwo neighboring synteny blocks between cattle andgoat reveal a mosaic of new insertions at rearrangementsites, rather than a simple model of nonhomologousend-joining (NHEJ). In Figure 7, Representative repeat
14 translation between cattle (UMD3.1) and goat (CHIR_1.0). Paneltle centromeres. Panel B: A breakpoint on BTA9 (13.03 Mb-13.16 Mb)wise alignments are highlighted using colored curve; Self-comparisonslocks are distinguished between in red curves with in green curves,ions longer than 3 kb are highlighted in grey (>5 kb are in red). Longeny blocks. [γ] LINEs (green), SINEs (purple), Simple repeats (blue), andhite represents “+” and the black represent “-“). [ε] Names of ANKRD26ixture colored regions from two neighboring synteny blocksgement sites. Self-comparisons showed that these two centromeres(panel B) suggest two cattle centromeres underwent a much longerome (panel A) presents more complex architecture than one in cattlemparing to synteny blocks suggested that in these cases duplicationsmosome rearrangement.

Figure 8 Cattle share HSB with human and dog genome in at position 13.0 Mb on cattle chromosome 14 (panel A and panel B), butsynteny block break on goat genome (panel C and panel D).
Du et al. BMC Genomics 2014, 15:625 Page 10 of 16http://www.biomedcentral.com/1471-2164/15/625
elements including LINEs, LTRs, SINEs, simple repeatsand segmental duplications (SDs), as well as genes areenriched in breakpoints compared to synteny blocks.Each breakpoint region aligns with the two homologouscentromeres radiantly and is sprayed with SDs. More inter-estingly, the breakpoint of the goat genome (Figure 7A)presents a more complex architecture than cattle genomeone (Figure 7B). We inferred that these two cattle centro-meres underwent a much longer evolution of SD than thatof the two goat centromeres (Figure 7A and B). It suggeststhat these two goat centromeres of CHI9 and CHI14 areformed by a Robertsonian fusion and is evolutionarilymore recent. Though neocentromere formation may beindependent of sequence characteristic and comply withthe rules of epigenetic, DNA rearrangement is one of theprimary driving forces for neocentromere formation inchromosome evolution. Abundant SDs could hypothetic-ally provide homologous sequences that are not in allelicpositions, where nonallelic homologous recombination(NAHR) or crossing-over in meiosis result in region-specific genomic rearrangement [24]. These duplicationscan promote NAHR, and thus a chromosome
rearrangement. Among distinctive sequence features, wenoted that a gene cluster containing ANKRD26 (ankyrinrepeat domain 26) was highly duplicated in ruminantbreakpoints (Figure 7 and Additional file 6).The ancestral Bovidae diploid number of 30 pairs of
chromosomes has been retained in all but one (gaur) ofthe previous studied species of Bovina. Robertsonianfusions or centric translocations (ROBs) involving thefusions of two nonhomologous acrocentric or telocen-tric chromosomes at their centromeres (producing asingle biarmed product with distinguishable internalcentromere) is frequent in ruminant chromosome evo-lution and particularly in Bovidae [25-27]. Severalhypotheses have been advanced to explain the formationof ROBs in mammals usually invoking the organizationof pericentromeric satellite DNA and nonallelic hom-ologous recombination at meiosis [28]. Breakpointsare considered to occur in regions of SDs [29] and highconcentrations of repetitive elements [30]. The sequencearchitectures of genomic breakpoints what we identifiedfor ROBs are found to be complex with enriched genesand other active elements, which refine the evidences of

Figure 9 An example of the map of mammalian breakpointsand ANKRD26 homologs. Cattle chromosomes are used asreference chromosomes and are respectively compared to goat RHmaps, pig (S. scrofa), horse (E. caballus), dog (C. familiaris), human(H. sapiens), macaque (M. mulatta), mouse (M. musculus), and rat(R. norvegicus) in the Evolution Highyway program. Large blocks ofhomologous synteny and a high frequency of breakpoint reuse arepresented on mammalian chromosomes. We combined of this mapof mammalian breakpoints and the genomic distribution ofANKRD26family (Additional file 8) and take examples of cattle chromosome13 in this figure. Most members of ANKRD26 family locate onspecies-specific or lineage- specific rearrangement regions orcentromeres (red cross), whereas a very few (blue cross) were locatedon HSBs. The homologous copies of ANKRD26 are spotted intensivelyin two neighboring breakpoint regions, where ANKRD26 locate. Onelikely reason for of this excessive gene duplication is that the HSBbetween the two neighboring breakpoints have undergonerepeatedly inversion, thus ANKR26 copies accumulated.
Du et al. BMC Genomics 2014, 15:625 Page 11 of 16http://www.biomedcentral.com/1471-2164/15/625
these previous studies. The fact that SDs are enriched inbreakpoints compared to synteny blocks and that break-point specific SD have a different evolutionary history ingoat and cattle suggests that in these cases duplicationspromoted nonallelic homologous recombination (NAHR),and thus a chromosome rearrangement.
ANKRD26 gene cluster associated with genomerearrangementsLarge-scale genome rearrangements caused by chromo-some breaks underlie numerous inherited diseases and areassociated with species evolution. Evolutionary breakpointsare nonrandomly distributed (reused) throughout mamma-lian genomes [31] and many breakpoints are coincidentwith ancient centromere activity as well as new centromereformation [32-36]. It has been hypothesized that centro-meric illegitimate recombination between nonhomologouschromosomes led to chromosome fusions and syntenybreakpoints during rapid speciation. This hypothesis initi-ated from the analysis of karyotypic evolution in mammals[37] and was supported by similar studies in marsupials[32] and in plants [38].From goat-cattle the comparison, we found that
ANKRD26 has expanded in ruminant breakpoints. Wethen explored the genomic distribution of members ofANKRD26 homologs to other mammalian genomes. Theortholog of ANKRD26 is a highly conserved protein genein reptiles, birds and mammals. We found that ANKRD26have a single copy in each reptile genome or each birdgenome as far as we can find in their available genomesequences, whereas it was expanded in mammals. Phylo-genetic analysis of ANKRD26 homologs revealed fourgroups of homologous genes including ancient ANKRD26-like (1), POTE (2), ANKRD18/ANKRD20 (3), andANKRD36/ANKRD62 (4) and an over-expansion espe-cially in primate and artiodactyla (Additional file 7). Theanalysis of evolutionary breakpoints using the Evolutionhighway program [33,39,40] was used to determinatewhether a breakpoint is species-specific or lineage-specific (i.e. reused). We combined of the map ofmammalian breakpoints and the genomic distributionofANKRD26 homologs (Figure 9 and Additional file 8).The result showed that most of ANKRD26 homologs lo-cate on species-specific or lineage- specific rearrangementregions or centromeres, whereas a very few (6/115) werelocated on homologous synteny blocks (HSBs). For in-stance, the POTE family, made of primate-specific para-logs of ANKRD26, was extensively reshaped involvingsegmental loss and internal duplication in human [41].Genes in the POTE family are located near the centro-meres of numerous chromosomes including the site ofhuman-chimpanzee chromosome 2 fusion [42]. Of the22 human autosomes, 11 centromeres including all fiveacrocentric ones (that always resulted from Robinson
translocation) have ANKR26 paralogs. The ANKRD26,as the ancestor of this big family, is located on cattle(or goat) chromosome 13 and human chromosome10p, and its homologous copies are spotted intensivelyin two neighboring breakpoint regions. One likely reason

Du et al. BMC Genomics 2014, 15:625 Page 12 of 16http://www.biomedcentral.com/1471-2164/15/625
for of this excessive duplication is that the HSB betweenthe two neighboring breakpoint have undergone repeat-edly inversions, thereby provoking an accumulation ofANKR26 (Figure 9 and Additional file 6). This means thatspecies-specific shifts in ANKRD26 duplication are coinci-dent with breakpoint reuse in divergent lineages.Evolutionary breakpoints are supposed to contribute
importantly to new genetic variation and novel genes atthese fragile sites [39]. However, the dynamics betweenevolutionary breakpoints and genomic elements locallyhave not been completely understood yet [43]. A currenthypothesis is that genetic innovation and change at thesesites may, as a driving force of local adaptation [44],have influences in subsequent chromosome stabilization.Indeed, most of the proteins belonging to this gene clusterconserved the Ankyrin domains near to N-terminal and thestructural maintenance of chromosomes protein (SMC)domains near the C-terminal (Additional file 9). SMC pro-teins interact with DNA in chromosome condensation,sister-chromatic cohesion, recombination, DNA double-strand break repair and epigenetic silencing of gene ex-pression. It may indicate that ANKRD26 is responsive toDNA damage [45], pericentromeric cohesin and condens-ing [46], and even centromere formation. The members ofANKRD26 usually linked with LINEs near the C-terminal[47] may indicate their duplication by retrotransposition.Although little is known about the regulation of
ANKRD26, previous studies demonstrated that ANKRD26–involved in chromosome rearrangements are responsiblefor several inherited disease: a gene conversion ofANKRD26 is associated with type-2 diabetes [48], whichwere supported by the studies of ANKRD26-inactivation[49] and familial thrombocytopenia, associated with achromosome breakage [50] on human chromosome 10p[51] appears to be due to an ANKRD26 mutation [52,53].
ConclusionsIn the present study, we constructed dense goat RH mapsof SNP markers from closely related species via a novelmethod of genotype calling and recent methodologies.Overall, there is good agreement between the currentgenome assembly and the robust RH maps. We were ableto propose correction to the goat genome assembly andadd previously unplaced scaffolds. We combined this in-formation in the form of a new goat genome sequenceCHI_1.1.We think this updated sequence, with a more ac-curate ordering of scaffolds will can be useful for manygenetic studies on goat, for instance, linkage disequilib-rium analysis and QTL mapping. We used our newdense chromosomal maps to annotate genomic rear-rangements and chromosome evolution of ruminants.We compared sequence architecture of the evolution-ary breakpoints including representative repeat elementsand genes in ruminant rearrangements. Breakpoint
intervals from two neighboring synteny blocks in goatgnome reveal a mosaic of new insertions at rearrangementsites. The Breakpoints in the goat genome presents morecomplex architectures than breakpoints of the cattle gen-ome suggesting that goat centromeres of CHI9 andCHI14 underwent much shorter evolutionary time thanthose two cattle centromeres. Our findings highlight thecomplex interplay between duplicated sequences andchromosomal rearrangements, which favored a rearrange-ment mechanism of centromeric non-allelic homologousrecombination in mammals. We detected a gene cluster,ANKRD26, which was expanded specifically in species aswell as lineage specific evolutionary breakpoints and incentromeres. Their genomic distribution associated withthe biological function of their conserved protein domainssuggested it might play a role in chromosome stabilizationduring chromosome evolution.
MethodsRH panel and marker genotypingWe generated a 5000 rads goat-hamster RH panel [15].In total, 108,242 Bovidae-derived SNP markers fromBovineSNP50K BeadChip (54,001) and OvineSNP50KBeadChip (54,241) were genotyped against 94 RH clonesand 2 controls (one positive Boer goat sample and onenegative hamster A23 sample) using the IlluminaBead-Station 500G genotyping system.We performed the genotype calling procedure described
below independently for each SNP array. We called ge-notypes of clones at SNPs based on the raw signalintensities obtained from the Illumina genotyping system.Specifically, the statistic used for genotype calling of agiven SNP in a given clone was the maximum observedintensity over the two possible alleles (herein called Imax).The distribution of Imax in a given clone can be seen as amixture of two underlying distributions, where one for thenon-retained SNPs in the clone and one for the retainedSNPs (e.g. Figure 1B). The difficulty of the genotype callingprocedure is to evaluate from which of these two dis-tributions a given data point (Imax) comes from. Moreprecisely, we aimed at evaluating the p-value of the ob-served Imax under the hypothesis H0 that the SNP isnot retained in the clone (i.e. P (T > =Imax |H0)).To calculate this p-value an estimate of the distribution
of Imax for a non-retained SNP is needed. For this, weexploited the fact that the SNP array was designed for adifferent species than the goat (either cattle or sheep).Looking at the intensity distribution in the positive wholegenome goat sample, we observed that a number (Nneg)of SNPs showed very low intensities for both alleles inthe goat (Figure 1A). We speculate that the sequencescorresponding to these negative SNPs are not conservedenough in the goat genome to provide a signal with theSNP array. Finally, the p-value that a (non-negative)

Du et al. BMC Genomics 2014, 15:625 Page 13 of 16http://www.biomedcentral.com/1471-2164/15/625
SNP is not retained was calculated as the proportion ofImax in the negative SNPs that exceeds the observedImax. If none was found, we set the p-value at 1/Nneg.After calculating p-values for all observations, we esti-
mated their corresponding q-values using the Q-value Rpackage [18]. This approach allows controlling the falsepositive and false negative rates and provides an estimateof the proportion of true null hypotheses in the data,which is in our case an estimate of one minus the panelretention fraction. We called "retained" data points at anFDR threshold of 1% and removed SNPs which retentionfraction was either greater than 50% or lower than 10%.Furthermore, one RH clone (#73) showed a very highrate of retention (>90%) and was therefore removedfrom the analysis. Among the remaining data points, wecalled “missing” data points with q-values lower than10% for the sheep array, and 5% for the bovine array.Finally, data points with q-values greater than 10% werecalled “un-retained”. The overall approach with thesethresholds allowed us to control both the missing datarate and the false negative rate (see Results).
Map constructionOur pipeline of RH mapping is very similar to that recentlyused for recently building porcine RH maps [13]. TheCarthagene software [12,14,54] was used to computeefficiently marker ordering for candidate maps withreference maps. This approach is based on a probabilisticBayesian model integrating the usual RH probabilisticmodel with a probabilistic model of breakpoint occurrenceswith the reference order. In this probabilistic model, break-points induced by chromosomal rearrangements are con-sidered as rare events, following a Poisson law. Meaning,the model considers that genome assembly errors createrare spurious breakpoints between the RH map order andthe current goat genome assembly order [12].The map construction process was conducted in parallel
to the goat genome assembly. As our first goal to buildRH maps was to help ordering scaffolds of the goatgenome, only SNPs that could be mapped unambiguouslyto a working draft of the goat genome were used to buildRH maps. These summed up to 54,318 SNPs, with 35,203SNPs from the Ovine array and 19,115 SNPs from thebovine array. We portioned 53,075 mapped SNPs(mSNPs) according to their assigned chromosome and1243 unassigned SNPs (uSNPs) remained on assemblyCHIR_1.0. For each autosome, we determined linkagegroups among mSNPs, based on RH data alone. Of the53,075 SNPs that generated RH vectors, 53,062wereassigned to 30 single linkage groups based on two-pointanalysis at a LOD threshold of 10. In these linkage groups13 markers did not show enough evidence for linkage.Each RH linkage group was assigned to a chromosome
based on homologous comparison between RH markers
and the goat genome. (1) We manually increased the LODthreshold in a two-point analysis to remove minor markergroups (<5 markers) to remove possible error vector. (2) Aprimary map was first generated with Carthagene by con-verting the RH data into a TSP and solved using a LKHheuristic method (lkh1 1). The initial RH maps were com-pared to the assembly to observe the general discrepancies,and were used to inspect inter-markers intervals withextremely long distances (>25 cR). In this step, we manuallyremoved possible questionable markers, most of whichwere located on map ends. (3) The command of find_errorsin RHMAPPER [19] was used to flags marker/hybrid assayresults that are likely to be the result of laboratory error,where the order for these results set to the primary map. Athreshold of 3 was specified in the command i.e. reportingthat this result is 1000:1 more likely to represent a labora-tory error than a true result. Once again, we converted theRH data into a TSP and solved using the LKH heuristicmethod, and constructed the LKH map.A novel approach [14] was applied next to build maps
with a highly reliable ordering, called robust maps.Briefly, the principle of the method is to estimate aposterior distribution of marker ordering using an MCMCapproach and then to extract from this distribution a subsetof markers that show the same ordering across maps ofhigh probability. We performed 5000 MCMC iterationsand discarded the first 1000 as burning iterations in thecommand of Carthagene software, mcmc, using the LKHmaps obtained above as starting orderings. We extractedrobust maps from the posterior distribution using themetamap software [14]. An inclusion tree called metamapthat summarizes the uncertainty lying in the map distribu-tion was calculated. In the metamap tree, groups in whichthe best order have posterior probability higher than 95%in the robust map were include the final robust map. Thedistances of the robust maps were evaluated using thediploid equal retention model with an EM convergenceset to 10−9 (command cgtolerance). This approach isclosely related to the idea of constructing frameworkmaps. In the case of framework maps, an order isaccepted based on a maximum likelihood ratio, alsocalled LOD (the logarithm of odds between the bestorder and the second best order must exceed a presetratio, such as 1,000:1 for example (LOD 3)). In contrast,the construction of robust maps falls into the Bayesianparadigm [14].For mapping the unplaced scaffolds on the goat genome,
we constructed primary LKH maps with mSNP and uSNPtogether. We removed 852 uSNPs, which assigned toscaffolds shorter than 10 Kb in RH mapping from 1,243unassigned SNPs (uSNPs) on assembly CHIR_1.0. Then391 uSNPs were assigned to chromosomes based ontheir linkage with each of 30 linkage groups. The LKHmaps were constructed as above. We aligned both of

Du et al. BMC Genomics 2014, 15:625 Page 14 of 16http://www.biomedcentral.com/1471-2164/15/625
the robust maps of only mSNP and the LKH map of allSNPs to the goat scaffold data, then computed theorientation of scaffolds positions on the chromosomesand the orientation of the scaffold. A comparison of thetwo results showed that the assignments of placed scaf-folds are very similar, so we proposed that the assignmentsof placed scaffolds using the LKH maps are accurate.
Genome map comparisons and gene comparisonsMap discrepancies were determined by comparing theRH map with target genome data including goat scaffoldsequence, goat assemblies (CHIR_1.0 and CHIR_1.1)and cattle genomes (BTA4.2 and UMD3.1). The probesequences of markers in RH maps aligned with thesetarget genome maps using BLASTN (version 2.2.21) withE-values < 1 × 10⁻¹⁰. We also conducted synteny-basedcomparisons between the goat genome sequence andother mammalian sequences. The comparisons wereperformed using NUCmer [55] with parameter “-c 500”(with cattle) or “-c 150” (with other mammals). The assign-ment of assembled sequences to chromosomes was donebased on a best alignment and majority rule. The Inter-quartile Range method was used to filter out suspiciousmarkers and compute the scaffold positions on chromo-somes. The Least Square method was used to compute theorientation of the scaffold that had multiple markers alignedto them. Orientation was considered forward if the slopevalue was positive, reverse if the slope value was nega-tive and unknown if the slope was close to be 0.For the reconstruction of the evolutionary breakpoints,
the Evolution Highway program [33,39,40] was used tocompare more mammalian genomes including human,mouse, dog, horse, cattle, rat and goat RH maps. Thedata of orthologous gene pairs between cattle genome andother mammalian genome for generating homologoussynteny block was downloaded from the Biomart database.We used lastz program and lastz-based Cassis program[56] to precisely detect sequence homology and genomicrearrangement breakpoints. RepeatMasker was run againstboth libraries separately to identify homologous repeats,which were classified into known classes of repeats [57].SDs was identified using the identical whole-genomesequence comparison method [58]. The characterizedelements of sequence were graphed by circus [59].For phylogenetic analysis of gene family, the sequence
of goat ANKRD26 was blasted (BlastP) against theNCBI-nr database. In the results, genes with less than40% homology or 40% coverage were filtered out. Theannotated genes of ANKRD26 in public protein databasesalso were retrieved. Multiple sequence alignment was per-formed and the Neighbor-joining tree were constructedbased on Dayhoff PAM matrix method with a bootstrapvalue of 1000 [60].
Additional files
Additional file 1: Radiation hybrid maps of the Illumina SNPmarkers. This text file contains the position (in centiRays) on final robustRH maps of 45,953 SNPs from Illumina BovineSNP50K BeadChip andOvineSNP50K BeadChip on radiation hybrid maps. The RH markers weremapped to goat assemblyCHIR_V1.0, cattle genome assembly BTA4.2, goatassembly CHIR_V1.1, goat scaffolds and goat super-scaffolds, respectively.
Additional file 2: Characteristics of the RH maps. The table containsdetailed characteristics of the RH maps obtained for each chromosome:number of SNPs mapped; number of distinct position for each panel,resolution, average marker distance and the retention fraction.
Additional file 3: Detailed comparison of RH maps with theCHIR_1.0 and with the CHIR_1.1. This file contains comprehensivepictures comparing (i) CHIR_1.0 and the RH maps, as well as (ii) the goatgenome sequence CHIR_1.1 and the RH maps.
Additional file 4: Our RH maps can be applied to improve goatsequence map accurately in local region, by both of rectifying thearrangements of scaffolds and adding the unplaced scaffolds.Forward alignments are plotted as red lines/dots while inverse (reversecompliment) alignments are plotted as blue lines/dots. Panel A: The regionfrom 8.3 Mb to 8.9 Mb of CHI14 [where the order of scaffolds is scaffold406(−), scaffold940 (+), scaffold1516 (−)], showed an inversion and twodeletions with cattle genome, that presents either true chromosomeevolution or artificial errors. Panel B: The RH map suggested an order ofscaffolds in the region [scaffold1942(+), scaffold1305(−), scaffold940(−),scaffold406(+), scaffold1542(+), scaffold1424(−), scaffold1896(+), scaffold2162(+), scaffold1331(+), scaffold1733(−), scaffold1187(+), scaffold2528(−),scaffold1516(−)]. The new sequence, ordered using our RH map showedgood colinearity with the cattle genome, demonstrating that the inversionand the two deletions were artificial errors. Thus, the goat sequence can beimproved. Panel C: The cattle genome suggested an order of scaffolds inthe region. The information of conserved syntenies is used to the neworder of scaffold by RH map. Panel D: The new ordering of scaffoldsexcluded three dubious scaffolds (scaffold1424, scaffold1896, andscaffold2162) and is used to the assembly CHIR_1.0.
Additional file 5: The connections between the robust RH mapswith sequence-based scaffolds and super-scaffolds. Markers in the 30robust RH maps were linked to 1884 scaffolds and then to 297 super-scaffolds,that were used to reassembling chromosome sequences. Only a fewrearrangements (the red link lines between RH markers with chromosomesequences) exist between the RH map and the new assembly CHIR_1.1.Forward alignments between scaffolds and chromosome sequences(CHIR_1.1) are plotted as red lines/dots while inverse (reverse compliment)alignments are plotted as blue lines/dots. Forward alignments betweensuper-scaffolds and CHIR_1.1 are also plotted. To better display theconnection, each of neighboring scaffolds (or super-scaffolds) arecompulsively divided to two paralleled lines.
Additional file 6: Sequence architecture at synteny breaks inchromosome 13 between cattle and goat. [α] Goat-cattle pair-wisealignments are highlighted by red and green colors; Self-comparisons arein grey. [β] Segmental duplications. [γ] LINEs (green), LTRs (yellow), SINEs(purple), and Simple repeats (blue). [δ] Genes with colors denotestranscriptional orientation (the white represents “+” and the blackrepresent “-“). [ε] Names of ANKRD26 homologs are marked in red.
Additional file 7: A phylogenetic tree including 142 proteins ofANKRD26 homologs in mammals (132 proteins), in birds (6 proteins)and in reptilians (4 proteins). Proteins of GI number were clustered infour groups of ancient ANKRD26-like (red), ANKRD18/ANKRD20 (green),ANKRD36/ANKRD62 (orange), and POTE (blue). The proteins of birds andthose of reptilians are marked as triangles and circles, respectively.
Additional file 8: Cattle chromosomes are used as referencechromosomes and are respectively compared to goat RH maps, pig(S. scrofa), horse (E. caballus), dog (C. familiaris), human (H. sapiens),macaque (M. mulatta), mouse (M. musculus), and rat (R. norvegicus)in the Evolution Highyway program. We detected the genomic locationof 115 members of ANKRD26 family in nine mammalian genome(excluding unmapped scaffolds), of which 109 locate in breakpoints (red cross)

Du et al. BMC Genomics 2014, 15:625 Page 15 of 16http://www.biomedcentral.com/1471-2164/15/625
and 6 locate in homologous synteny (blue cross). Most of the membersexpanded specifically in species and lineage specific evolutionary breakpointsor in centromeres. The duplication of ANKRD26 gene follows the patterns ofconvergent breakpoint reuse through chromosome evolution.
Additional file 9: Fast identification of conserved domains inprotein sequences of human ANKRD26 homologs was performedusing NCBI Conserved Domain Database. Ankyrin domains are near toN-terminal and structural maintenance of chromosomes protein (SMC)domains are near to C-terminal.
AbbreviationsBTA: Bos taurus; CHI: Capra hircus; HSB: Homologous synteny block; LKH:Lin-Kernighan heuristic; LOD scores: Log odds score method; MCMC: MarkovChain Monte Carlo; NAHR: Nonallelic homologous recombination;RH: Radiation hybrid; SD: Segmental duplication; SNP: Single nucleotidepolymorphism; TSP: Traveling Salesman problem.
Competing interestsThe authors declare that they have no competing interests.
Authors’ contributionsXD and JEW generated the RH panel and performed marker genotyping.BS and XD participated in map construction and performed the statisticalanalysis. DY and WW participated in sequence assembly, annotation, analysis.XD, MY and JC participated in the sequence alignment and performed theanalysis of chromosome arrangement. SZ, JEW and BS conceived of thestudy, and participated in its design and coordination and helped to draftthe manuscript. All authors read and approved the final manuscript.
AcknowledgementsWe thank DNA LandMarks, Inc. for its contributions of experimentalsupplement for genotyping the RH panel and its technical assistance formDr. Tunping Yu. We thank Ruheena Javed for reviewing the manuscript. Thiswork has been supported by National High-Tech Research and DevelopmentProgram of China (No. 2013AA102506), the International collaborating grantsfrom National ministry of science and technology projects of China (NO. 1111),the 973 program (2013CB835200) of China, the IAEA’s Coordinated ResearchProject (Contract No. 16087/R0), the FP7-3SR (FP7-KBBE-2009-3: No. 245140),and the Fundamental Research Funds for the Central Universities.
Author details1Key lab of animal genetics, breeding and reproduction of ministryeducation, College of Animal Science and Technology, HuazhongAgricultural University, Wuhan 430070, People's Republic of China. 2INRA,Laboratoire de Génétique Cellulaire, Castanet-Tolosan, Auzeville-Tolosane31320, France. 3Department of Veterinary Pathobiology, College of VeterinaryMedicine, Texas A&M University, College Station, TX 77843, USA. 4State KeyLaboratory of Genetic Resources and Evolution, Kunming Institute ofZoology, Chinese Academy of Sciences, Kunming, China. 5Faculty of LifeScience and Technology, Kunming University of Science and Technology,Kunming 650500, People's Republic of China. 6State Key Laboratory ofAgricultural Microbiology, Huazhong Agricultural University, Wuhan 430070,People's Republic of China.
Received: 24 October 2013 Accepted: 10 July 2014Published: 23 July 2014
References1. Hedges SB, Dudley J, Kumar S: TimeTree: a public knowledge-base of
divergence times among organisms. Bioinformatics 2006, 22(23):2971–2972.2. Vaiman D, Schibler L, Bourgeois F, Oustry A, Amigues Y, Cribiu EP: A genetic
linkage map of the male goat genome. Genetics 1996, 144(1):279–305.3. de Leon Ponce FA, Ambady S, Hawkins GA, Kappes SM, Bishop MD, Robl
JM, Beattie CW: Development of a bovine X chromosome linkage groupand painting probes to assess cattle, sheep, and goat X chromosomesegment homologies. Proc Natl Acad Sci U S A 1996, 93(8):3450–3454.
4. Piumi F, Schibler L, Vaiman D, Oustry A, Cribiu EP: Comparative cytogeneticmapping reveals chromosome rearrangements between the Xchromosomes of two closely related mammalian species (cattle andgoats). Cytogenet Cell Genet 1998, 81(1):36–41.
5. Schibler L, Vaiman D, Oustry A, Giraud-Delville C, Cribiu EP: Comparativegene mapping: a fine-scale survey of chromosome rearrangementsbetween ruminants and humans. Genome Res 1998, 8:901–915.
6. Schibler L, Di Meo GP, Cribiu EP, Iannuzzi L: Molecular cytogenetics andcomparative mapping in goats (Capra hircus, 2n = 60). Cytogenet GenomeRes 2009, 126(1–2):77–85.
7. Dong Y, Xie M, Jiang Y, Xiao N, Du X, Zhang W, Tosser-Klopp G, Wang J,Yang S, Liang J, Chen W, Chen J, Zeng P, Hou Y, Bian C, Pan S, Li Y, Liu X,Wang W, Servin B, Sayre B, Zhu B, Sweeney D, Moore R, Nie W, Shen Y, Zhao R,Zhang G, Li J, Faraut T, et al: Sequencing and automated whole-genomeoptical mapping of the genome of a domestic goat (Capra hircus).Nat Biotechnol 2013, 31(2):135–141.
8. Lewin HA, Larkin DM, Pontius J, O'Brien SJ: Every genome sequence needsa good map. Genome Res 2009, 19(11):1925–1928.
9. Jiang Y, Xie M, Chen W, Talbot R, Maddox JF, Faraut T, Wu C, Muzny DM,Li Y, Zhang W, Stanton JA, Brauning R, Barris WC, Hourlier T, Aken BL, Searle SM,Adelson DL, Bian C, Cam GR, Chen Y, Cheng S, DeSilva U, Dixen K, Dong Y,Fan G, Franklin IR, Fu S, Fuentes-Utrilla P, Guan R, Highland MA,et al: The sheep genome illuminates biology of the rumen and lipidmetabolism. Science 2014, 344(6188):1168–1173.
10. Groenen MA, Archibald AL, Uenishi H, Tuggle CK, Takeuchi Y, Rothschild MF,Rogel-Gaillard C, Park C, Milan D, Megens HJ, Li S, Larkin DM, Kim H, FrantzLA, Caccamo M, Ahn H, Aken BL, Anselmo A, Anthon C, Auvil L, Badaoui B,Beattie CW, Bendixen C, Berman D, Blecha F, Blomberg J, Bolund L, BosseM, Botti S, Bujie Z, et al: Analyses of pig genomes provide insight intoporcine demography and evolution. Nature 2012, 491(7424):393–398.
11. Hitte C, Madeoy J, Kirkness EF, Priat C, Lorentzen TD, Senger F, Thomas D,Derrien T, Ramirez C, Scott C, Evanno G, Pullar B, Cadieu E, Oza V, LourgantK, Jaffe DB, Tacher S, Dréano S, Berkova N, André C, Deloukas P, Fraser C,Lindblad-Toh K, Ostrander EA, Galibert F: Facilitating genome navigation:survey sequencing and dense radiation-hybrid gene mapping. Nat RevGenet 2005, 6:643–648.
12. Faraut T, de Givry S, Chabrier P, Derrien T, Galibert F, Hitte C, Schiex T:A comparative genome approach to marker ordering. Bioinformatics2007, 23(2):e50–e56.
13. Servin B, Faraut T, Iannuccelli N, Zelenika D, Milan D: High-resolutionautosomal radiation hybrid maps of the pig genome and theircontribution to the genome sequence assembly. BMC Genomics2012, 13:585.
14. Servin B, de Givry S, Faraut T: Statistical confidence measures for genomemaps: application to the validation of genome assemblies. Bioinformatics2010, 26(24):3035–3042.
15. Du X, Womack JE, Owens KE, Elliott JS, Sayre B, Bottcher PJ, Milan D,Podesta MG, Zhao S, Malek M: A whole-genome radiation hybrid panelfor goat. Small ruminat research 2012, 105:114–116.
16. Amaral ME, Grant JR, Riggs PK, Stafuzza NB, Filho EA, Goldammer T, WeikardR, Brunner RM, Kochan KJ, Greco AJ, Jeong J, Cai Z, Lin G, Prasad A, KumarS, Saradhi GP, Mathew B, Kumar MA, Miziara MN, Mariani P, Caetano AR,Galvão SR, Tantia MS, Vijh RK, Mishra B, Kumar ST, Pelai VA, Santana AM,Fornitano LC, Jones BC, et al: A first generation whole genome RH mapof the river buffalo with comparison to domestic cattle. BMC Genomics2008, 9:631.
17. Lunetta KL, Boehnke M, Lange K, Cox DR: Experimental design and errordetection for polyploid radiation hybrid mapping. Genome Res 1995,5(2):151–163.
18. Storey JD, Tibshirani R: Statistical significance for genomewide studies.Proc Natl Acad Sci U S A 2003, 100(16):9440–9445.
19. Stewart EA, McKusick KB, Aggarwal A, Bajorek E, Brady S, Chu A, Fang N,Hadley D, Harris M, Hussain S, Lee R, Maratukulam A, O'Connor K, Perkins S,Piercy M, Qin F, Reif T, Sanders C, She X, Sun WL, Tabar P, Voyticky S,Cowles S, Fan JB, Mader C, Quackenbush J, Myers RM, Cox DR: AnSTS-based radiation hybrid map of the human genome. Genome Res1997, 7(5):422–433.
20. Fontanesi L, Martelli PL, Beretti F, Riggio V, Dall'Olio S, Colombo M, CasadioR, Russo V, Portolano B: An initial comparative map of copy numbervariations in the goat (Capra hircus) genome. BMC Genomics 2010, 11:639.
21. Cribiu EP, Di Berardino D, Di Meo GP, Eggen A, Gallagher DS, Gustavsson I,Hayes H, Iannuzzi L, Popescu CP, Rubes J, Schmutz S, Stranzinger G, VaimanA, Womack J: International System for Chromosome Nomenclature ofDomestic Bovids (ISCNDB 2000). Cytogenet Cell Genet 2001,92(3–4):283–299.

Du et al. BMC Genomics 2014, 15:625 Page 16 of 16http://www.biomedcentral.com/1471-2164/15/625
22. Maddox JF: A presentation of the differences between the sheep andgoat genetic maps. Genet Sel Evol 2005, 37(Suppl 1):S1–S10.
23. Buckland RA, Evans HJ: Cytogenetic aspects of phylogeny in the Bovidae.I. G-banding. Cytogenet Cell Genet 1978, 21(1–2):42–63.
24. Samonte RV, Eichler EE: Segmental duplications and the evolution of theprimate genome. Nat Rev Genet 2002, 3(1):65–72.
25. Gallagher DS Jr, Womack JE: Chromosome conservation in the Bovidae.J Hered 1992, 83(4):287–298.
26. Iannuzzi L, King WA, Di Berardino D: Chromosome evolution in domesticbovids as revealed by chromosome banding and FISH-mappingtechniques. Cytogenet Genome Res 2009, 126(1–2):49–62.
27. Robinson TJ, Ropiquet A: Examination of hemiplasy, homoplasy andphylogenetic discordance in chromosomal evolution of the Bovidae.Syst Biol 2011, 60(4):439–450.
28. Hernandez Fernandez M, Vrba ES: A complete estimate of thephylogenetic relationships in Ruminantia: a dated species-level supertreeof the extant ruminants. Biol Rev Camb Philos Soc 2005, 80(2):269–302.
29. Kehrer-Sawatzki H, Cooper DN: Molecular mechanisms of chromosomalrearrangement during primate evolution. Chromosome Res 2008,16(1):41–56.
30. Ruiz-Herrera A, Castresana J, Robinson TJ: Is mammalian chromosomalevolution driven by regions of genome fragility? Genome Biol 2006,7(12):R115.
31. Pevzner P, Tesler G: Human and mouse genomic sequences revealextensive breakpoint reuse in mammalian evolution. Proc Natl Acad SciU S A 2003, 100(13):7672–7677.
32. Bulazel KV, Ferreri GC, Eldridge MD, O'Neill RJ: Species-specific shifts incentromere sequence composition are coincident with breakpoint reusein karyotypically divergent lineages. Genome Biol 2007, 8(8):R170.
33. Murphy WJ, Larkin DM, Everts-van der Wind A, Bourque G, Tesler G, Auvil L,Beever JE, Chowdhary BP, Galibert F, Gatzke L, Hitte C, Meyers SN, Milan D,Ostrander EA, Pape G, Parker HG, Raudsepp T, Rogatcheva MB, Schook LB,Skow LC, Welge M, Womack JE, O'brien SJ, Pevzner PA, Lewin HA: Dynamicsof mammalian chromosome evolution inferred from multispeciescomparative maps. Science 2005, 309(5734):613–617.
34. Han Y, Zhang Z, Liu C, Liu J, Huang S, Jiang J, Jin W: Centromererepositioning in cucurbit species: implication of the genomic impactfrom centromere activation and inactivation. Proc Natl Acad Sci U S A2009, 106(35):14937–14941.
35. Ventura M, Antonacci F, Cardone MF, Stanyon R, D'Addabbo P, Cellamare A,Sprague LJ, Eichler EE, Archidiacono N, Rocchi M: Evolutionary formationof new centromeres in macaque. Science 2007, 316(5822):243–246.
36. Wade CM, Giulotto E, Sigurdsson S, Zoli M, Gnerre S, Imsland F, Lear TL,Adelson DL, Bailey E, Bellone RR, Blöcker H, Distl O, Edgar RC, Garber M,Leeb T, Mauceli E, MacLeod JN, Penedo MC, Raison JM, Sharpe T, Vogel J,Andersson L, Antczak DF, Biagi T, Binns MM, Chowdhary BP, Coleman SJ,Della Valle G, Fryc S, Guérin G: Genome sequence, comparative analysis,and population genetics of the domestic horse. Science 2009,326(5954):865–867.
37. Ferreri GC, Brown JD, Obergfell C, Jue N, Finn CE, O'Neill MJ, O'Neill RJ:Recent amplification of the kangaroo endogenous retrovirus, KERV,limited to the centromere. J Virol 2011, 85(10):4761–4771.
38. Murat F, Xu JH, Tannier E, Abrouk M, Guilhot N, Pont C, Messing J, Salse J:Ancestral grass karyotype reconstruction unravels new mechanisms ofgenome shuffling as a source of plant evolution. Genome Res 2010,20(11):1545–1557.
39. Larkin DM, Pape G, Donthu R, Auvil L, Welge M, Lewin HA: Breakpointregions and homologous synteny blocks in chromosomes have differentevolutionary histories. Genome Res 2009, 19(5):770–777.
40. Donthu R, Lewin HA, Larkin DM: SyntenyTracker: a tool for defininghomologous synteny blocks using radiation hybrid maps andwhole-genome sequence. BMC research notes 2009, 2:148.
41. Hahn Y, Bera TK, Pastan IH, Lee B: Duplication and extensive remodelingshaped POTE family genes encoding proteins containing ankyrin repeatand coiled coil domains. Gene 2006, 366(2):238–245.
42. Bera TK, Zimonjic DB, Popescu NC, Sathyanarayana BK, Kumar V, Lee B,Pastan I: POTE, a highly homologous gene family located on numerouschromosomes and expressed in prostate, ovary, testis, placenta, andprostate cancer. Proc Natl Acad Sci U S A 2002, 99(26):16975–16980.
43. Fungtammasan A, Walsh E, Chiaromonte F, Eckert KA, Makova KD:A genome-wide analysis of common fragile sites: what features determinechromosomal instability in the human genome? Genome Res 2012,22(6):993–1005.
44. Yeaman S: Genomic rearrangements and the evolution of clusters oflocally adaptive loci. Proc Natl Acad Sci U S A 2013, 110(19):E1743–E1751.
45. Matsuoka S, Ballif BA, Smogorzewska A, McDonald ER 3rd, Hurov KE, Luo J,Bakalarski CE, Zhao Z, Solimini N, Lerenthal Y, Shiloh Y, Gygi SP, Elledge SJ:ATM and ATR substrate analysis reveals extensive protein networksresponsive to DNA damage. Science 2007, 316(5828):1160–1166.
46. Stephens AD, Haase J, Vicci L, Taylor RM 2nd, Bloom K: Cohesin, condensin,and the intramolecular centromere loop together generate the mitoticchromatin spring. J Cell Biol 2011, 193(7):1167–1180.
47. Wang Y, Leung FC: Discovery of a long inverted repeat in human POTEgenes. Genomics 2009, 94(4):278–283.
48. Ross KA: Evidence for somatic gene conversion and deletion in bipolardisorder, Crohn's disease, coronary artery disease, hypertension,rheumatoid arthritis, type-1 diabetes, and type-2 diabetes. BMC Med2011, 9:12.
49. Bera TK, Liu XF, Yamada M, Gavrilova O, Mezey E, Tessarollo L, Anver M,Hahn Y, Lee B, Pastan I: A model for obesity and gigantism due todisruption of the Ankrd26 gene. Proc Natl Acad Sci U S A 2008,105(1):270–275.
50. Helmerhorst FM, Heaton DC, Crossen PE, von dem Borne AE, Engelfriet CP,Natarajan AT: Familial thrombocytopenia associated with plateletautoantibodies and chromosome breakage. Hum Genet 1984, 65(3):252–256.
51. Savoia A, Del Vecchio M, Totaro A, Perrotta S, Amendola G, Moretti A, ZelanteL, Iolascon A: An autosomal dominant thrombocytopenia gene maps tochromosomal region 10p. Am J Hum Genet 1999, 65(5):1401–1405.
52. Pippucci T, Savoia A, Perrotta S, Pujol-Moix N, Noris P, Castegnaro G, Pecci A,Gnan C, Punzo F, Marconi C, Gherardi S, Loffredo G, De Rocco D, Scianguetta S,Barozzi S, Magini P, Bozzi V, Dezzani L, Di Stazio M, Ferraro M, Perini G, Seri M,Balduini CL: Mutations in the 5' UTR of ANKRD26, the ankirin repeat domain26 gene, cause an autosomal-dominant form of inheritedthrombocytopenia, THC2. Am J Hum Genet 2011, 88(1):115–120.
53. Noris P, Perrotta S, Seri M, Pecci A, Gnan C, Loffredo G, Pujol-Moix N, ZeccaM, Scognamiglio F, De Rocco D, Punzo F, Melazzini F, Scianguetta S, CasaleM, Marconi C, Pippucci T, Amendola G, Notarangelo LD, Klersy C, Civaschi E,Balduini CL, Savoia A: Mutations in ANKRD26 are responsible for afrequent form of inherited thrombocytopenia: analysis of 78 patientsfrom 21 families. Blood 2011, 117(24):6673–6680.
54. de Givry S, Bouchez M, Chabrier P, Milan D, Schiex T: CARHTA GENE:multipopulation integrated genetic and radiation hybrid mapping.Bioinformatics 2005, 21(8):1703–1704.
55. Delcher AL, Phillippy A, Carlton J, Salzberg SL: Fast algorithms for large-scalegenome alignment and comparison. Nucleic Acids Res 2002,30(11):2478–2483.
56. Baudet C, Lemaitre C, Dias Z, Gautier C, Tannier E, Sagot MF: Cassis:detection of genomic rearrangement breakpoints. Bioinformatics 2010,26(15):1897–1898.
57. Wicker T, Sabot F, Hua-Van A, Bennetzen JL, Capy P, Chalhoub B, Flavell A,Leroy P, Morgante M, Panaud O, Paux E, SanMiguel P, Schulman AH:A unified classification system for eukaryotic transposable elements.Nat Rev Genet 2007, 8(12):973–982.
58. Bailey JA, Yavor AM, Massa HF, Trask BJ, Eichler EE: Segmental duplications:organization and impact within the current human genome projectassembly. Genome Res 2001, 11(6):1005–1017.
59. Krzywinski M, Schein J, Birol I, Connors J, Gascoyne R, Horsman D, Jones SJ,Marra MA: Circos: an information aesthetic for comparative genomics.Genome Res 2009, 19(9):1639–1645.
60. Lin CY, Lin FK, Lin CH, Lai LW, Hsu HJ, Chen SH, Hsiung CA: POWER:PhylOgenetic WEb Repeater–an integrated and user-optimizedframework for biomolecular phylogenetic analysis. Nucleic Acids Res2005, 33(Web Server issue):W553–W556.
doi:10.1186/1471-2164-15-625Cite this article as: Du et al.: An update of the goat genome assemblyusing dense radiation hybrid maps allows detailed analysis ofevolutionary rearrangements in Bovidae. BMC Genomics 2014 15:625.


