Embed Size (px)
Citation preview
Anaerobic Acidogenesis of a Complex Wastewater: 1. The Influence of Operational Parameters on Reactor Performance
Georgia Dinopoulou, Thomasine Rudd and John N. Lester' Public Health Engineering Laboratory., Imperial College, London SW7 2BU, England
Accepted for publication June 29, 1987
The influence of operational parameters, such a s hy- draulic retention time, organic loading rate, influent substrate concentration, pH, and temperature, on the performance of the first phase of anaerobic digestion has been investigated. A complex substrate based on beef extract was used, and six series of experimental r u n s were conducted, each one showing the effect of one operational variable. The predominant fermentation products were always acetic and propionic acid, inde- pendent of the values of the operational parameters. For initial COD concentrations and hydraulic retention times above the critical values identified as 3 g/L and 6 h, re- spectively, the degree of acidification achieved was be- tween 30 and 60%. The degree of acidification was found to increase with the hydraulic retention time and decrease with the influent substrate concentration and organic loading rate, while the opposite held true for the rate of product formation. Furthermore, it has been demonstrated that acidification is primarily determined by the hydraulic retention time and the rate of product formation by the influent substrate concentration. The concentration of the acetic acid produced was found to depend on the operational parameters. However, the concentration of propionic acid produced depended only on the substrate availability with a consistent pro- portion of 8% initial COD converted to it. The optimum pH and temperature were 7 and 40°C, respectively. The percentage of acetic acid a s a proportion of the total volatile fatty acids produced was found to increase with increasing pH and temperature, while the percentage of propionic acid seemed to decrease accordingly. Finally the effect of the temperature on the rate of acidification followed an Arrhenius type equation with an activation energy equal to 4739 cal/mol.
INTRODUCTION
The numerous advantages of anaerobic digestion over conventional aerobic methods make it an ideal alternative for treating industrial wastes. There are, however, certain drawbacks to its application, such as the prolonged periods required for start-up and the process instability, which re- sults in the failure of operating digesters.'
* To whom dl correspondence should be addressed.
Biotechnology and Bioengineering, Vol. 31, Pp. 958-968 (1988) Q 1988 John Wiley 81 Sons, Inc.
In order to increase the stability of anaerobic digestion, two-phase anaerobic systems have been introduced and in- vestigated. 2-4 The physical separation of the acidogenic and methanogenic phases can increase stability because overloading of the methane reactor can be prevented by proper control of the acidification step.' Furthermore, phase separation allows the maintenance of appropriate densities of the acid and methane formers in separate reac- tors and enables maximization of the rates of acidification and methanogenesis by applying optimal operational con- ditions, determined by the metabolic and biokinetic prop- erties of both group^.^ Other advantages of the two-phase configuration are that it significantly increases the specific activity of methanoged and enables the disposal of the faster growing acid formers without loss of the former (the yield of acid formers is 8.15% while that of methanogens is only 1.2%).' The acidification reactor can serve as a buffer system when the composition of the wastewater is variable, and can help in the removal of compounds that are toxic to methane bacteria (e.g., sulphide).' When a flu- idized bed reactor is used for methanogenesis, smaller sand size and consequently lower pumping costs are re- quired, because of the low biomass yield and the biofilm characteristics of methanogem.* Finally, the acidification reactor provides a constant substrate for the methanogens, which are known to adapt slowly to varying substrate con- tent and cornpo~ition.~
The effluent of an acidogenic reactor contains mainly acetic, propionic and butyric acids, although higher fatty acids are found at lower concentrations. Products such as lactate and ethanol, which are produced through energeti- cally less favorable pathways, are generally avoided during steady-state operations. lo According to recent findings, lo
there are two important fermentation types occumng com- plementary to each other, namely butyric acid and propionic acid types. Butyric acid type fermentation is characterized by the production of butyrate, acetate, hydrogen and carbon dioxide as the main fermentation products, while propionic acid type fermentation results mainly in the formation of
CCC 0006-35921881090958-11$04.00
propionate, acetate and some valerate, with no significant gas production."
In order to optimize the two phases of anaerobic diges- tion, it is necessary to engineer the operation of the first reactor towards those acids which are preferable substrates for methanogenesis. It is now recognized that methanogens can use directly only acetic acid, formic acid, and hydro- gen, while butyric and propionic acids need to be converted to the latter compounds by a special group of microorgan- isms, the obligatory hydrogen producing acetogenic bacte- ria." The rate of butyric acid removal has been found to be higher than that of the rest of the volatile fatty acid^.^."-'^ It has also been reported that the rate-limiting step of butyrate degradation in methanogenic digesters is the con- version of the acetate produced to methane,I4 while the rate-limiting step of propionate degradation is the splitting of propionate to acetate, which is slower than the conver- sion of acetate to methane." A potential problem, how- ever, for large scale operations producing. butyrate might be odor control. 'I
The anaerobic degradation of propionate can only pro- ceed when the hydrogen concentration is low .I5 It has been reported that propionate degradation is largely inhibited during periods of high activity of the butyrate converting bacteria, because of the elevated hydrogen concentrations they produce.I6 Acetate exerts a less strong influence on the thermodynamics of the conversion of propionate, although it is also known to be inhibit~ry. '~, '~ The above observa- tions agree with the finding that the degradation of propi- onate proceeds more rapidly when individual acids rather than a mixture of volatile acids are used'' and it was there- fore suggested that controlled acidification leading to one or few major intermediates would be desirable.
Separate acidogenesis as part of a two-phase process has been studied in reactors treating glucose, sucrose, starch, pectin and gelatin as substrate^.^'^"^"^ These studies have shown that the products of the first stage, the conversion of substrate to volatile fatty acids, as well as the optimum conditions of the first stage, depend greatly on the sub- strate used. The operational parameters, such as hydraulic
retention time, organic loading rate, temperature, and pH also affect the content and composition of the acidification reactor effluent. It is important to know the effect of these parameters, firstly because it can help in the engineering of the first phase towards more desirable products, and sec- ondly because it can show to which parameters the system is most sensitive. According to some researchers, there is little dependence of the product distribution on the hydraulic retention while others have found that it has a con- siderable effect on the composition of the effluent. ''*I9 Simi- larly contradictory results have been reported for the effect of pH on the effluent composition, which was shown to be negligible in the range 5-7,'s319 while other researchers found a more pronounced i n f l u e n ~ e . ~ ~ " ~ ' ~ Elevated tempera- tures were found to result in higher product concentrations and biomass growth rates, because of less pronounced product inhibition.*' Finally, increasing organic loading rate has been variously reported to result in the production of more propionic and conversely more butyric acid and other products. l 3
The aim of this study was to investigate the influence of various operational parameters, such as hydraulic retention time, influent substrate concentration, organic loading rate, pH, and temperature on the conversion of the substrate to volatile acids, on the rate of acid production per unit of re- actor, and on the composition of the reactor effluent. A complex medium was used as substrate, which was based on beef extract. In this way the optimum parameters for this particular substrate could be identified in order to produce an appropriate and constant influent for a second phase methanogenic reactor.
MATERIALS AND METHODS
Reactors and Wastewater
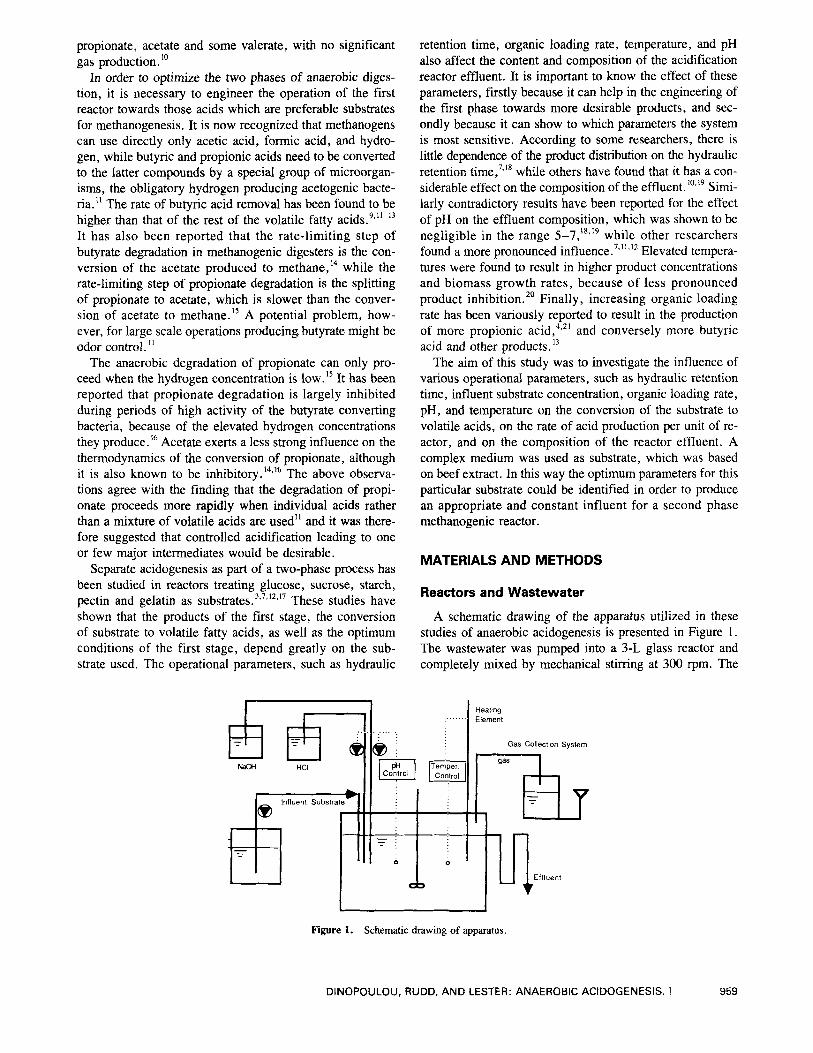
A schematic drawing of the apparatus utilized in these studies of anaerobic acidogenesis is presented in Figure 1. The wastewater was pumped into a 3-L glass reactor and completely mixed by mechanical stimng at 300 rpm. The
1
Figure 1. Schematic drawing of apparatus.
DINOPOULOU, RUDD, AND LESTER: ANAEROBIC ACIDOGENESIS. I 959
temperature was controlled to 35 1°C and the pH as re- quired by a feedback control unit. Solutions of 2M NaOH and 2M HCl were used for pH adjustment.
The wastewater was based on a meat extract powder. For a COD of 2.5 g/L, the influent composition (g/L dis- tilled water) was meat extract (Oxoid Lab lemco L29), 1.95; glycerol, 0.2; sodium chloride, 0.05; potassium di- hydrogen orthophosphate, 0.03; calcium chloride, 0.024; and magnesium sulphate, 0.0075. For influent of a differ- ent concentration, the amounts of all organic and inorganic constituents were adjusted pro rutu . The synthetic waste- water was prepared in 20-L quantities and sterilized by autoclaving at 121°C for 1 h to prevent bacterial growth.
Experimental Design
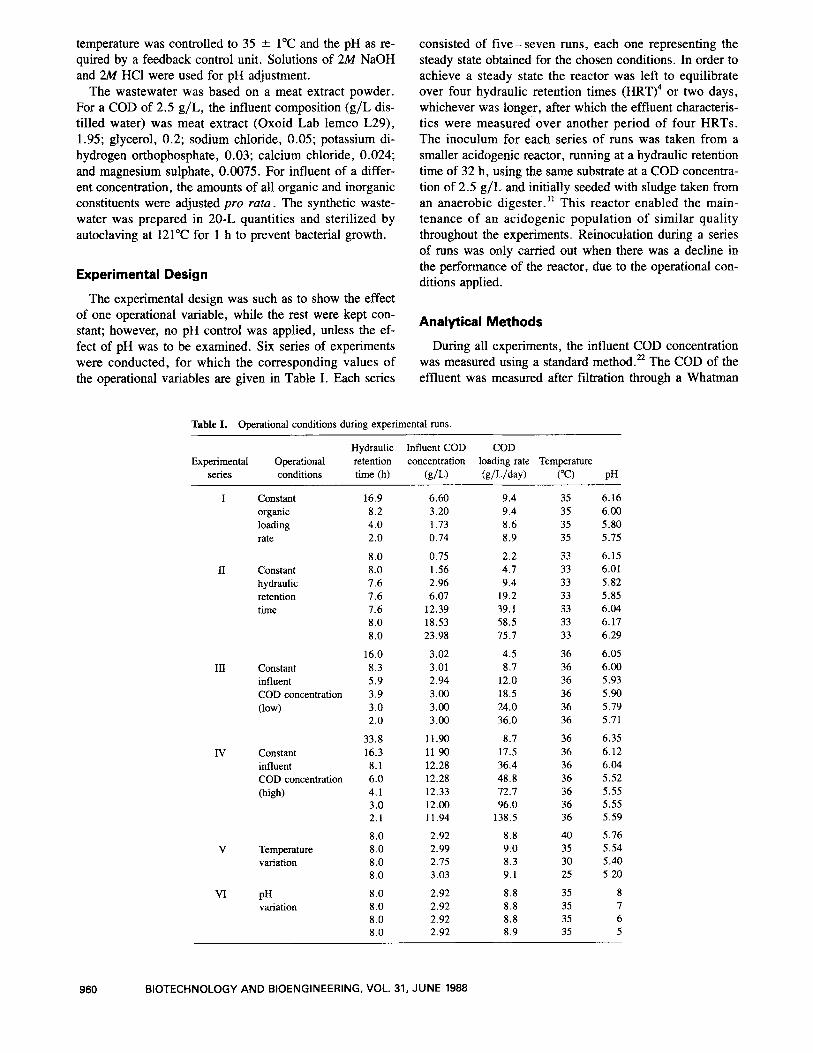
The experimental design was such as to show the effect of one operational variable, while the rest were kept con- stant; however, no pH control was applied, unless the ef- fect of pH was to be examined. Six series of experiments were conducted, for which the corresponding values of the operational variables are given in Table I. Each series
consisted of five-seven runs, each one representing the steady state obtained for the chosen conditions. In order to achieve a steady state the reactor was left to equilibrate over four hydraulic retention times (HRT)4 or two days, whichever was longer, after which the effluent characteris- tics were measured over another period of four HRTs. The inoculum for each series of runs was taken from a smaller acidogenic reactor, running at a hydraulic retention time of 32 h, using the same substrate at a COD concentra- tion of 2.5 g/L and initially seeded with sludge taken from an anaerobic digester. ” This reactor enabled the main- tenance of an acidogenic population of similar quality throughout the experiments. Reinoculation during a series of runs was only carried out when there was a decline in the performance of the reactor, due to the operational con- ditions applied.
Analytical Methods
During all experiments, the influent COD concentration was measured using a standard method.” The COD of the effluent was measured after filtration through a Whatman
Table I. Operational conditions during experimental runs.
Hydraulic Influent COD COD Experimental Operational retention concentration loading rate Temperature
series conditions time (h) (g/U (g/L/day) (“C) PH
I Constant organic loading rate
11 Constant hydraulic retention time
I11 Constant influent COD concentration (low)
IV Constant influent COD concentration (high)
V Temperature variation
VI pH variation
16.9 8.2 4.0 2.0
8.0 8.0 7.6 7.6 7.6 8.0 8.0
16.0 8.3 5.9 3.9 3.0 2.0
33.8 16.3 8.1 6.0 4.1 3.0 2.1
8.0 8.0 8.0 8.0
8.0 8.0 8.0 8.0
6.60 3.20 1.73 0.74
0.75 1.56 2.96 6.07
12.39 18.53 23.98
3.02 3.01 2.94 3.00 3.00 3.00
11.90 11.90 12.28 12.28 12.33 12.00 11.94
2.92 2.99 2.75 3.03
2.92 2.92 2.92 2.92
9.4 9.4 8.6 8.9
2.2 4.7 9.4
19.2 39.1 58.5 75.7
4.5 8.7
12.0 18.5 24.0 36.0
8.7 17.5 36.4 48.8 12.7 96.0
138.5
8.8 9.0 8.3 9.1
8.8 8.8 8.8 8.9
35 35 35 35
33 33 33 33 33 33 33
36 36 36 36 36 36
36 36 36 36 36 36 36
40 35 30 25
35 35 35 35
6.16 6.00 5.80 5.75
6.15 6.01 5.82 5.85 6.04 6.17 6.29
6.05 6.00 5.93 5.90 5.79 5.71
6.35 6.12 6.04 5.52 5.55 5.55 5.59
5.76 5.54 5.40 5.20
8 7 6 5
960 BIOTECHNOLOGY AND BIOENGINEERING, VOL. 31, JUNE 1988
GF/C glass fiber filter, acidification to pH 5 by adding HN03 and purging with N2 gas for 0.5 min. This pretreat- ment method was intended to removed dissolved H,S from the solution.23
The biomass concentration (as total suspended solids) was measured using a turbidimeter (Hach, model 2100A), which was calibrated over a range of biomass concentra- tions. The response (optical density) was found to be linear for biomass concentrations to 160 mg/L. Appropriate dilu- tion were made when the biomass concentration of the sample was higher. For calibration of the instrument, the standard method for determination of total suspended solids was used.24
The volatile fatty acid concentrations of the influent and the effluent were determined by gas chromatography. A Hewlett-Packard model 5700A gas chromatograph with a Flame Ionization Detector (FID) and one 1 m X 2 mm i.d. glass column packed with 0.3% Carbowax with 0.1% phosphoric acid on 60/80 Carbopack (Supelco, Inc.) were used in the analysis. The oven temperature was maintained at 120°C. The nitrogen carrier gas was supplied at a flow rate of 40 mL/min. Prior to the analysis the samples were filtered through a Whatman GF/C glass fiber filter and acidified to pH 2 with phosphoric acid or formic acid. When formic acid was used the individual volatile acid con- centrations were determined in the blank.23325 Lactic acid and ethanol concentrations were measured using a High Performance Liquid Chromatograph (HPLC) coupled to a refractometer detector. An Aminex HPX-87H column, 300 mm X 7.8 mm i.d. was used in conjunction with 0.01N H,SO, as eluant at a flow rate of 0.8 mL/min.
Reproducibility of the Experiments
Experimental reproducibility was tested by comparing the effluent characteristics of experimental runs conducted under similar operational conditions. Four such runs were selected, for which the operational parameters and the ef- fluent characteristics are given in Table 11. The biomass concentrations and the filtered effluent COD concentrations were very similar in all runs, with a relative strandard de- viation of less than 6%. This variation was less than those
Table 11. Operational parameters of runs compared for repeatability.
associated with the analytical methods used to determine these parameters, which were 8 and 7%, respectively. The standard deviation of the measured volatile fatty acid concentrations was 0.16 g/L (relative standard deviation 16%), which was higher than the variation of the analytical method (ca. 10%). This may be partly explained by the fact that the operational parameters applied to the reactor dur- ing the experimental runs, although similar, were not iden- tical. Nevertheless, the deviation observed was small compared to the differences in volatile acid concentrations obtained within an experimental series (e.g. 1.14-3.85 g/L) and it was thus considered that the performance of the acidogenic reactor could be regarded as consistent under constant operating conditions.
RESULTS
Influence of Hydraulic Retention Time, Organic Loading Rate, and the Initial Substrate Concentration on Acidification
In order to examine the influence of hydraulic retention time (HRT), organic loading rate and initial substrate con- centration (So) on the performance of the first stage of the anaerobic digestion, the results of experimental series I, 11, 111, IV were used. The influence of the above variables on the degree of acidification, on the rate of product formation and finally on the composition of the effluent was assessed.
The degree of acidification was quantified using the per- centage of the initial substrate concentration converted to volatile fatty acids and other fermentation products (e.g., ethanol and lactate). The initial substrate concentration (So) was measured in g COD/L and the quantity of fermenta- tion products was converted to the theoretical equivalent in g COD/L (S,) i.e., the nominal COD exerted by the mix- ture of the products [eq. (l)]:
(1) % acidification = - SP X 100 SO
In Figures 2 and 3 the degree of acidification is plotted versus the hydraulic retention time and the organic loading
Hydraulic Influent COD Effluent COD Total volatile Percent Experimental Experimental retention concentration Temperature TSS concentration fatty acids acidification
series runs time (h) k /L) ("C) (mg/L) (g/L) (g/L) (%)
I 1.3 8.2 3.20 35 149 2.51 0.995 44.3 I1 11.3 7.6 2.96 33 144 2.58 0.857 41.3
111 111.2 8.3 3.01 36 164 2.37 1.176 53.6 IV IV.2 8.0 2.99 35 152 2.46 0.829 41.0
Mean 8.0 3.04 35 152 2.48 0.964 45.0
Standard Deviation ?0.3 20.109 21.3 28.5 20.088 20.159 25.9
Relative Standard Deviation +4% 24% 24% 26% * 4% ? 16% 2 13%
DINOPOULOU, RUDD, AND LESTER: ANAEROBIC ACIDOGENESIS. I 96 1
50 -
40- .- c m 0 .- c 30- E
s 20-
10 -
+ Series I I -A- Series 111
0 1 I I I I 0 1 0 2 0 30 4 0
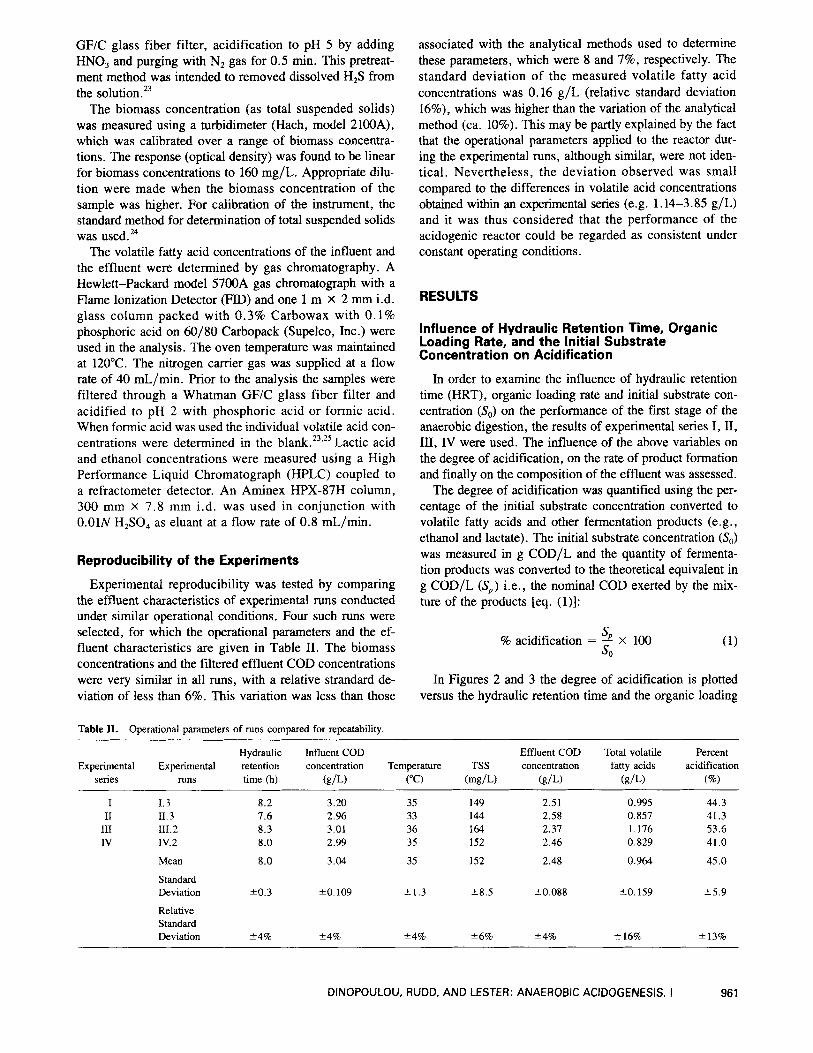
Hydraulic Retention time, h Figure 2. tion of substrate, during experimental series I, 11, 111, and IV.
Effect of hydraulic retention time on the degree of acidifica-
50 11 + Series II * Series 111
0 5 0 100 1 5 0 2 0 0
COD Loading Rate, giUday Figure 3. substrate, during experimental series I, 11, 111, and IV.
Effect of COD loading rate on the degree of acidification of
rate, respectively. The influent substrate concentration can be indirectly evaluated from Figures 2 and 3.
The degree of acidification showed a general tendency to vary proportionally with hydraulic retention time and in- versely with organic loading rate and initial substrate con- centration. From the degree of acidification obtained during the individual experimental series, it can be seen that the degree of acidification during experimental series 11, pro- duced under the regime of constant hydraulic retention time, did not change drastically with the organic loading rate (Fig. 3) or the influent substrate concentration. The maximum degree of acidification was achieved for a COD loading rate equal to 9.4 g/L/day and an influent COD equal to 3 g/L. Further increase in the organic loading rate and influent concentration did not significantly affect the degree of acidification, which remained almost constant
even for COD loadings as high as 72 g/L/day and influent COD concentrations of 24 g/L. This implies that the hy- draulic retention time is the operational parameter with the greatest impact on the degree of acidification.
A comparison of the data from experimental series I11 and IV, generated using constant influent COD concentra- tions equal to 3.15 and 12 g/L, respectively, showed that the degree of acidification achieved during the former was invariably higher than that obtained during the latter, at similar hydraulic retention times (Fig. 2). The negative ef- fect of the higher initial substrate concentration is thus in- dicated. Another observation derived from the same series was the existence of a critical hydraulic retention time, below which the degree of acidification dropped abruptly. This changed slightly with the influent substrate concentra- tion and was found to be equal to 6 and 8 h for experimen- tal series I11 and IV, respectively (Fig. 2).
The degree of acidification obtained during experimental series I, produced under constant organic loading rate, in- creased significantly with hydraulic retention time (Fig. 2), although this coincided with increasing substrate concen- tration, which has been shown to repress the degree of acidification. This suggested that the effect of hydraulic re- tention time on acidification was much more pronounced than that of the substrate concentration. The same conclu- sion can be reached by comparing series I1 and series I (Fig. 2): the degree of acidification obtained during Series 11, using constant hydraulic retention time, did not change drastically when the influent COD changed from 7.5 to 24 g/L. On the contrary, the degree of acidification ob- tained during series I, using constant loading, and varying hydraulic retention time, changed significantly for influent COD, between 0.74 and 13 g/L. The existence of a step increase in the percentage of acidification was also ob- served during Series I for hydraulic retention times greater than 8 h or initial COD concentrations higher than 3 g/L.
In order to verify the above observations and quantify the effect of the operational parameters on the degree of acidification, the stepwise multiple regression technique was used.26 This technique selects those variables that are most significant for the regression and discards the least useful ones. In this way the best model is obtained, which maximizes the correlation coefficient (R) while minimizing the number of input terms.
The regression line obtained was the following:
% acidification = 34.2 + 0.681(HRT) - 0.18l(load),
R = 0.762 (2)
where (HRT) is the hydraulic retention time (h) and (load) is the COD loading rate (g/L/day). The above two vari- ables were found to be the most important for the pre- diction of the degree of acidification. Furthermore, the calculation of the t-statistics of the multiple regression co- efficients indicated that the hydraulic retention time was the most important variable. Thus, to increase the degree of acidification, long hydraulic retention times are required, even for the less concentrated substrates.
962 BIOTECHNOLOGY AND BIOENGINEERING, VOL. 31, JUNE 1988
Another parameter that can be used in order to evaluate the performance of the first stage of the anaerobic diges- tion process, is the rate of product formation per unit of re- actor volume, (g/L/day):
(P - Po) 24 rp = (HRT) (3)
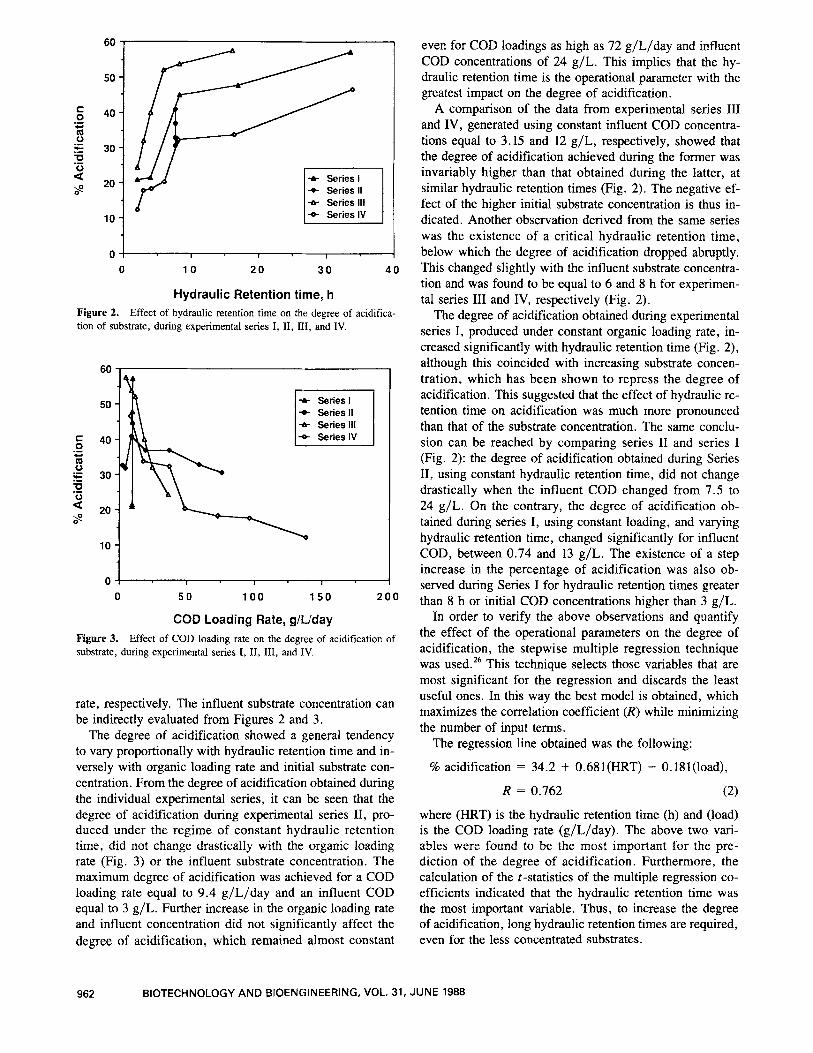
where Po and P are the influent and effluent product con- centrations, respectively (g/L), and (HRT) is the hydraulic retention time (h). For the wastewater utilized during this study, Po was very low and constituted ca. 0.8% of the in- fluent COD concentration. The rate of product formation was found to increase with the influent substrate concen- tration (Fig. 4) and the COD loading rate, and to decrease when the hydraulic retention time was increased. In order to determine the variables which had the largest effect on the rate of product formation, the stepwise multiple regres-
0
0 0
0 0
A A A .
0
0 .
0 A
A Series I 0 Series I1 A Series 111 o Series IV
? I I
0 1 0 2 0 30
Influent Substrate Concentration, g/L
Figure 4. duction, during experimental series I, 11, 111, and IV.
Effect of COD influent concentration on the rate of acid pro-
sion technique was used. The regression line obtained was the following:
rp = 2.87 - 0.244(HRT) + 0.652(S0); R = 0.956 (4)
where (So) is the influent COD concentration (g/L). The application of the t-test to the multiple regression coeffi- cients showed that the influent substrate concentration was the operational variable that most affected the rate of product formation. Thus, the more concentrated the influ- ent substrate, the higher the rate of product formation, even when the hydraulic retention time was relatively large.
The Effect of Temperature on Acidification
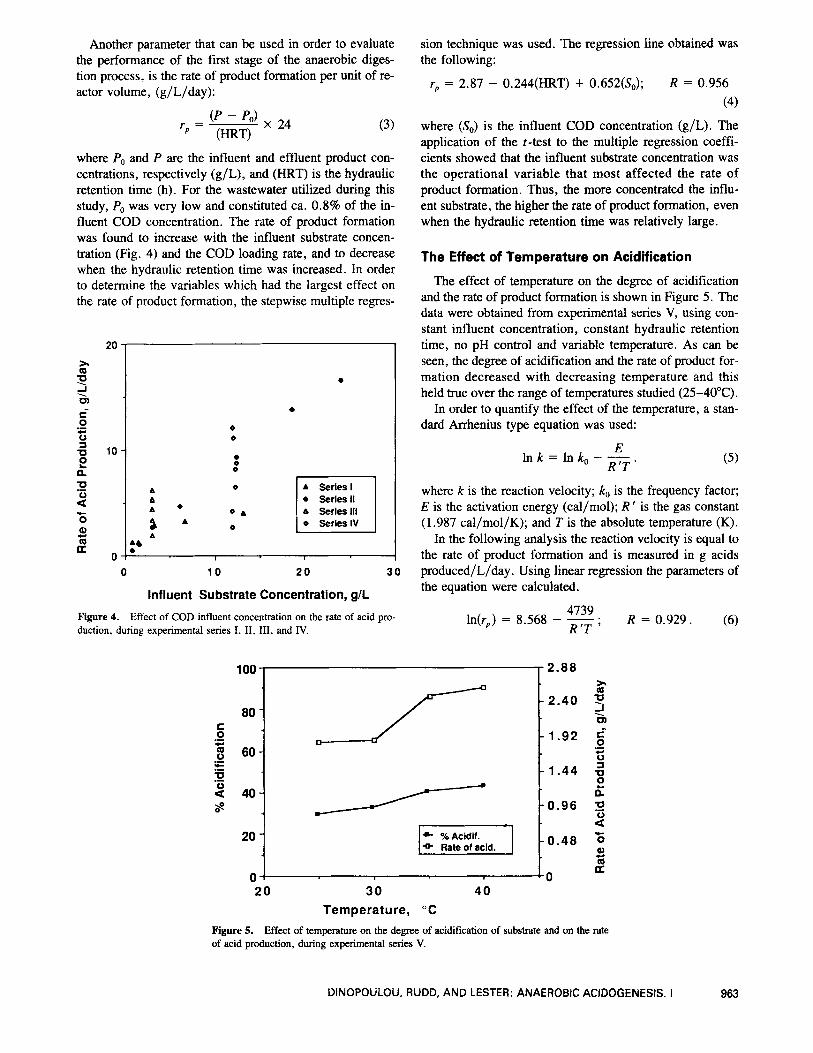
The effect of temperature on the degree of acidification and the rate of product formation is shown in Figure 5. The data were obtained from experimental series V, using con- stant influent concentration, constant hydraulic retention time, no pH control and variable temperature. As can be seen, the degree of acidification and the rate of product for- mation decreased with decreasing temperature and this held true over the range of temperatures studied (25-40°C).
In order to quantify the effect of the temperature, a stan- dard Arrhenius type equation was used:
E R'T
In k = In ko - -.
where k is the reaction velocity; k, is the frequency factor; E is the activation energy (cal/mol); R ' is the gas constant (1.987 cal/mol/K); and T is the absolute temperature (K).
In the following analysis the reaction velocity is equal to the rate of product formation and is measured in g acids produced/L/day . Using linear regression the parameters of the equation were calculated.
In(.,) = 8.568 - -. 4739 R = 0.929. (6) R'T '
100 I I 2.88
1.44 lo.% 2o i t
a- %Acidif. * Rate of acid. t 0.48
O ! ! O 20 30 40
Temperature, "C Figure 5. Effect of temperature on the degree of acidification of substrate and on the rate of acid production, during experimental series V.
DINOPOULOU, RUDD, AND LESTER: ANAEROBIC ACIDOGENESIS. I 963
Hence, the activation energy of the reaction was found to be 4739 cal/mol.
The temperature correction factor Q lo can be further cal- culated. This indicates how many times the overall reaction rate will increase if the temperature increases by 10°C:
rate at (T"C + 10°C) Q ~ o = rate at TOC (7)
For this system, the Q,, value at 30°C was found to be 1.29.
The Effect of pH on Acidification
The effect of pH on the degree of acidification and the rate of product formation is shown in Figure 6, using the data from experimental series VI. It can easily be seen that the optimum pH for both degree of acidification and rate of product formation was 7 or close to it. The effect of the pH on the product distribution in the effluent is dis- cussed below.
The Effect of Operational Parameters on Product Distribution
The effluent of the acidogenic reactor was analyzed and the concentration of individual volatile fatty acids, lactic acid and ethanol was measured for all the experimental se- ries. It was found that acetic and propionic acids were al- ways the main products. As a proportion of the total products, the percentage of acetic acid in the effluent ranged from 13 to 65%, with a mean value of 45%, while that of propionic acid ranged from 13 to 74%, with a mean value of 40%. The next most important products were bu- tyric and valeric acids both in the range of 4 to 17%. Other volatile fatty acids, such as isobutyric, 2-methyl buytric and isovaleric acids, were found at even lower concentrations.
Lactic acid was found in certain runs, at concentrations less than 30 mg/L, while ethanol was not detected in any run.
In order to investigate the influence of the various opera- tional parameters on the distribution of the volatile acids produced, the concentrations of the individual acids were correlated to the hydraulic retention time, loading rate and inital substrate concentration by means of multiple regression.
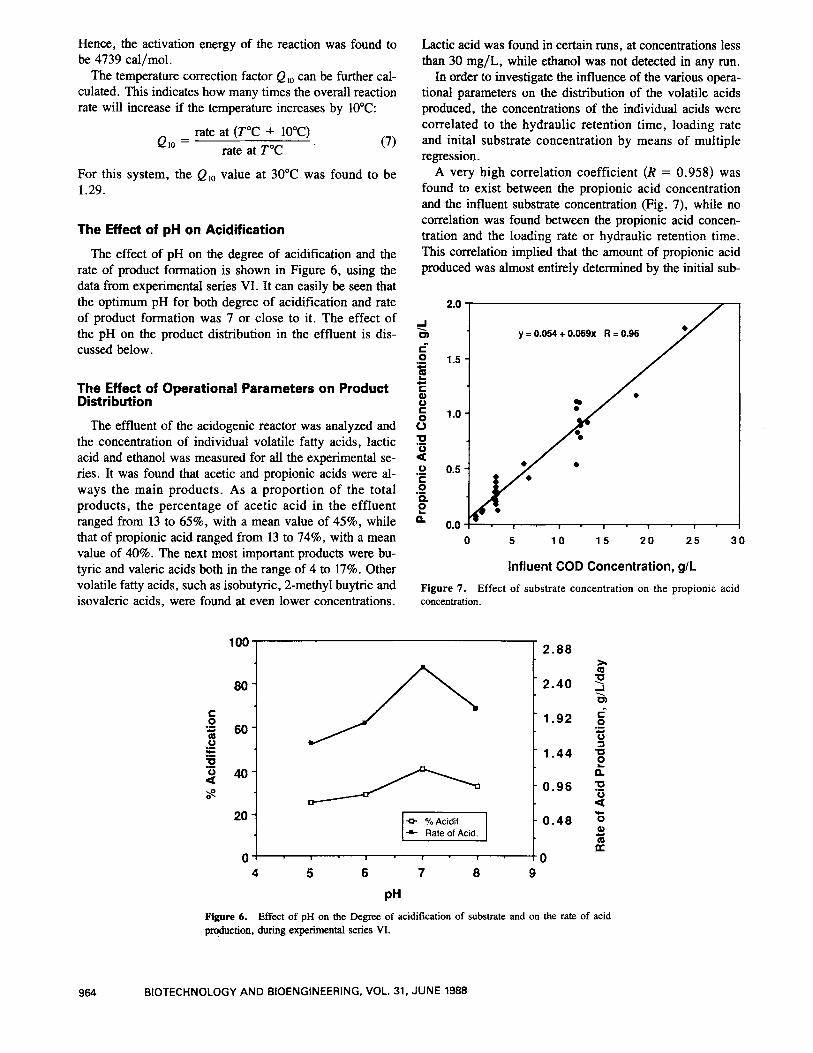
A very high correlation coefficient (R = 0.958) was found to exist between the propionic acid concentration and the influent substrate concentration (Fig. 7), while no correlation was found between the propionic acid concen- tration and the loading rate or hydraulic retention time. This correlation implied that the amount of propionic acid produced was almost entirely determined by the initial sub-
0 5 10 15 2 0 2 5 3 0
Influent COD Concentration, g/L
Figure 7. Effect of substrate concentration on the propionic acid
I 2.88 100 1
*O 1 11 .44
4 5 6 7 8 9
P" Figure 6. production, during experimental series VI.
Effect of pH on the Degree of acidification of substrate and on the rate of acid
964 BIOTECHNOLOGY AND BIOENGINEERING, VOL. 31, JUNE 1988
strate concentration, with the other parameters such as hy- draulic retention time and organic loading rate affecting this very little. The regression line does not change when the propionic acid concentrations produced during experi- mental series V and VI are used. This indicated that nei- ther the temperature nor the pH affect the propionic acid concentration significantly. The proportion of substrate transformed to propionic acid was consistently ca. 8%.
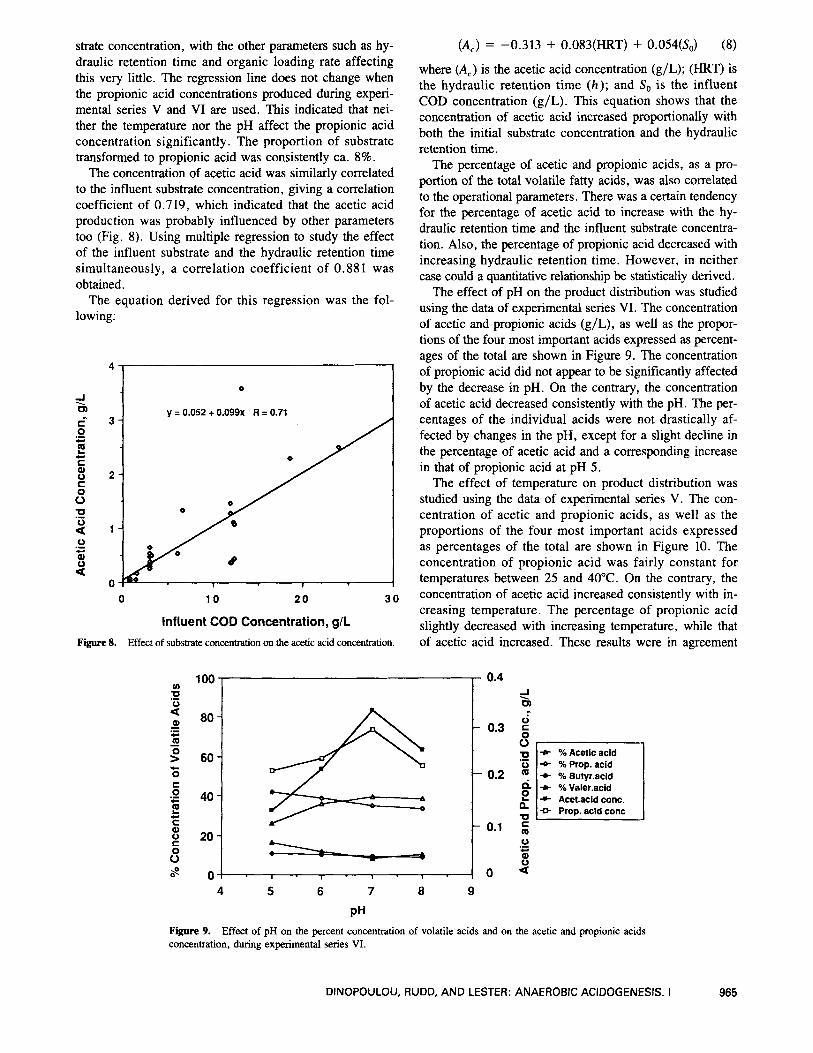
The concentration of acetic acid was similarly correlated to the influent substrate concentration, giving a correlation coefficient of 0.719, which indicated that the acetic acid production was probably influenced by other parameters too (Fig. 8). Using multiple regression to study the effect of the influent substrate and the hydraulic retention time simultaneously, a correlation coefficient of 0.88 1 was obtained.
The equation derived for this regression was the fol- lowing:
80 -
60 -
40 -
i cn C 0
- .- c E c S Q) 0 C 0 0 x 2
2 0
Q)
.- c
0
Y = 0.052 + 0.099X R = 0.71 3 J
2 -
1 -
0
C
1XQ 8 I ,Po I I I
0 10 2 0 3 0
Influent COD Concentration, glL Figure 8. Effect of substrate concentration on the acetic acid concentration.
(A,) = -0.313 + 0.083(HRT) + 0.054(&) (8)
where (A,) is the acetic acid concentration (g/L); (HRT) is the hydraulic retention time ( h ) ; and So is the influent COD concentration (g/L). This equation shows that the concentration of acetic acid increased proportionally with both the initial substrate concentration and the hydraulic retention time.
The percentage of acetic and propionic acids, as a pro- portion of the total volatile fatty acids, was also correlated to the operational parameters. There was a certain tendency for the percentage of acetic acid to increase with the hy- draulic retention time and the influent substrate concentra- tion. Also, the percentage of propionic acid decreased with increasing hydraulic retention time. However, in neither case could a quantitative relationship be statistically derived.
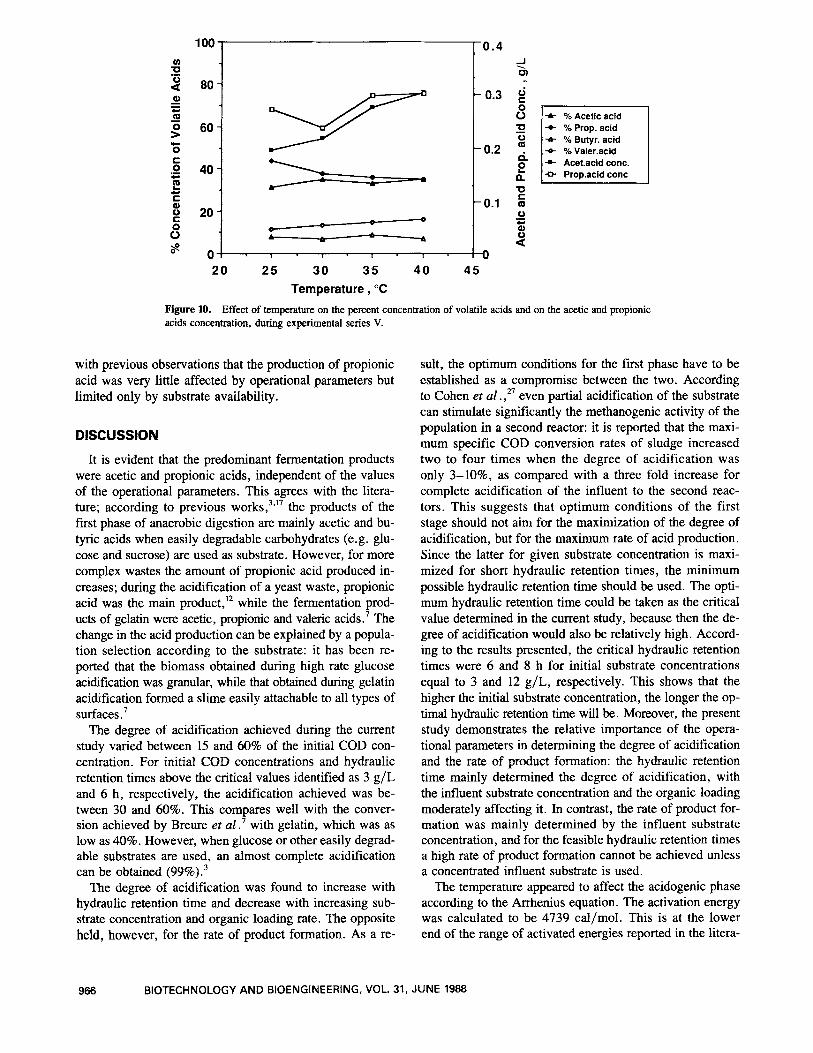
The effect of pH on the product distribution was studied using the data of experimental series VI. The concentration of acetic and propionic acids (g/L), as well as the propor- tions of the four most important acids expressed as percent- ages of the total are shown in Figure 9. The concentration of propionic acid did not appear to be significantly affected by the decrease in pH. On the contrary, the concentration of acetic acid decreased consistently with the pH. The per- centages of the individual acids were not drastically af- fected by changes in the pH, except for a slight decline in the percentage of acetic acid and a corresponding increase in that of propionic acid at pH 5.
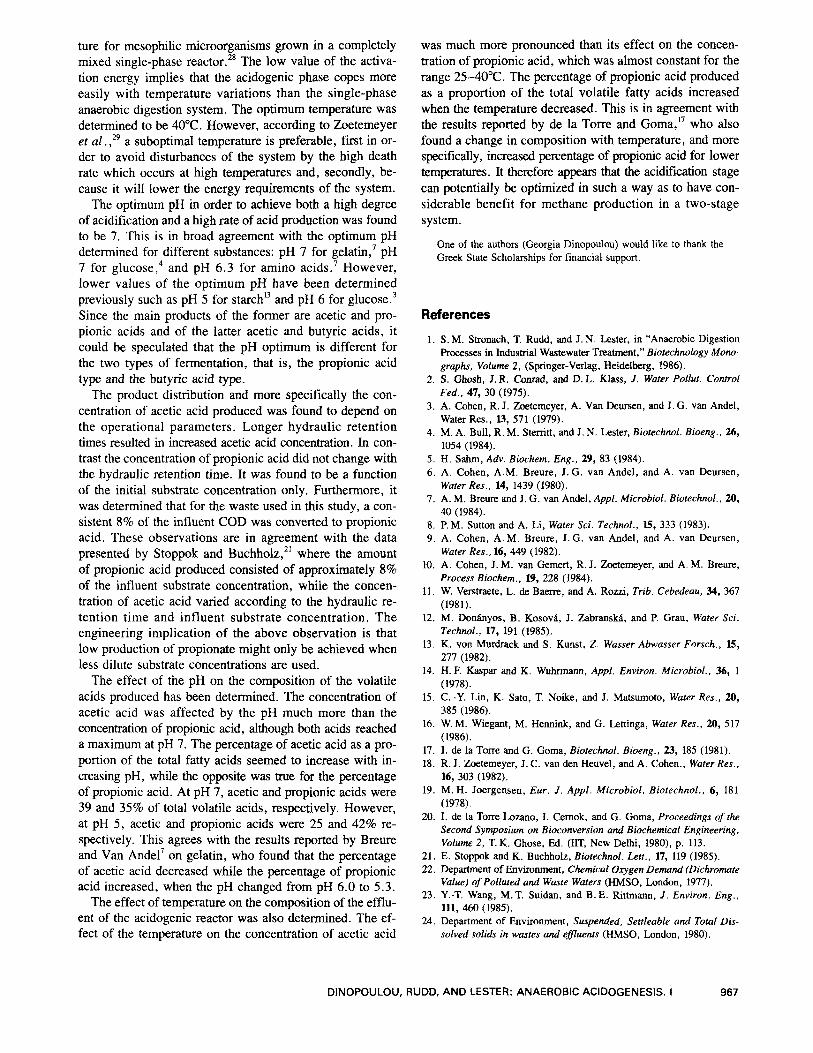
The effect of temperature on product distribution was studied using the data of experimental series V. The con- centration of acetic and propionic acids, as well as the proportions of the four most important acids expressed as percentages of the total are shown in Figure 10. The concentration of propionic acid was fairly constant for temperatures between 25 and 40°C. On the contrary, the concentration of acetic acid increased consistently with in- creasing temperature. The percentage of propionic acid slightly decreased with increasing temperature, while that of acetic acid increased. These results were in agreement
l o o m
"1 - I 0.4
0.3
0.2
0.1
0
i
3 0)
C
C m 0
Q)
.- U
2
Figure 9. concentration, during experimental series VI.
Effect of pH on the percent concentration of volatile acids and on the acetic and propionic acids
DINOPOULOU, RUDD, AND LESTER: ANAEROBIC ACIDOGENESIS. I 965
100!0*4
40j h I 2o t - t O-’
4
ri w
C
8 rr d 2 a
0 m
D c Q 0
a2 .- c.
Y
-A- % Acetic acid + % Prop. acid * % Butyr. acid 9 % Valer.acid + Acet.acid conc. * Prop.acid conc
20 25 30 3.5 4 0 45 Temperature, “C
Figure 10. acids concentration, during experimental series V.
Effect of temperature on the percent concentration of volatile acids and on the acetic and propionic
with previous observations that the production of propionic acid was very little affected by operational parameters but limited only by substrate availability.
DISCUSSION It is evident that the predominant fermentation products
were acetic and propionic acids, independent of the values of the operational parameters. This agrees with the litera- ture; according to previous the products of the first phase of anaerobic digestion are mainly acetic and bu- tyric acids when easily degradable carbohydrates (e.g. glu- cose and sucrose) are used as substrate. However, for more complex wastes the amount of propionic acid produced in- creases; during the acidification of a yeast waste, propionic acid was the main product,” while the fermentation prod- ucts of gelatin were acetic, propionic and valeric acids. The change in the acid production can be explained by a popula- tion selection according to the substrate: it has been re- ported that the biomass obtained during high rate glucose acidification was granular, while that obtained during gelatin acidification formed a slime easily attachable to all types of surfaces.
The degree of acidification achieved during the current study varied between 15 and 60% of the initial COD con- centration. For initial COD concentrations and hydraulic retention times above the critical values identified as 3 g/L and 6 h, respectively, the acidification achieved was be- tween 30 and 60%. This compares well with the conver- sion achieved by Breure et a1 .7 with gelatin, which was as low as 40%. However, when glucose or other easily degrad- able substrates are used, an almost complete acidification can be obtained (99%).’
The degree of acidification was found to increase with hydraulic retention time and decrease with increasing sub- strate concentration and organic loading rate. The opposite held, however, for the rate of product formation. As a re-
sult, the optimum conditions for the first phase have to be established as a compromise between the two. According to Cohen et a1 . ,27 even partial acidification of the substrate can stimulate significantly the methanogenic activity of the population in a second reactor: it is reported that the maxi- mum specific COD conversion rates of sludge increased two to four times when the degree of acidification was only 3-lo%, as compared with a three fold increase for complete acidification of the influent to the second reac- tors. This suggests that optimum conditions of the first stage should not aim for the maximization of the degree of acidification, but for the maximum rate of acid production. Since the latter for given substrate concentration is maxi- mized for short hydraulic retention times, the minimum possible hydraulic retention time should be used. The opti- mum hydraulic retention time could be taken as the critical value determined in the current study, because then the de- gree of acidification would also be relatively high. Accord- ing to the results presented, the critical hydraulic retention times were 6 and 8 h for initial substrate concentrations equal to 3 and 12 g/L, respectively. This shows that the higher the initial substrate concentration, the longer the op- timal hydraulic retention time will be. Moreover, the present study demonstrates the relative importance of the opera- tional parameters in determining the degree of acidification and the rate of product formation: the hydraulic retention time mainly determined the degree of acidification, with the influent substrate concentration and the organic loading moderately affecting it. In contrast, the rate of product for- mation was mainly determined by the influent substrate concentration, and for the feasible hydraulic retention times a high rate of product formation cannot be achieved unless a concentrated influent substrate is used.
The temperature appeared to affect the acidogenic phase according to the Arrhenius equation. The activation energy was calculated to be 4739 cal/mol. This is at the lower end of the range of activated energies reported in the litera-
966 BIOTECHNOLOGY AND BIOENGINEERING, VOL. 31, JUNE 1988
ture for mesophilic microorganisms grown in a completely mixed single-phase reactor.28 The low value of the activa- tion energy implies that the acidogenic phase copes more easily with temperature variations than the single-phase anaerobic digestion system. The optimum temperature was determined to be 40°C. However, according to Zoetemeyer et a1 . ,29 a suboptimal temperature is preferable, first in or- der to avoid disturbances of the system by the high death rate which occurs at high temperatures and, secondly, be- cause it will lower the energy requirements of the system.
The optimum pH in order to achieve both a high degree of acidification and a high rate of acid production was found to be 7. This is in broad agreement with the optimum pH determined for different substances: pH 7 for gelatin,7 pH 7 for g l u ~ o s e , ~ and pH 6.3 for amino acids.7 However, lower values of the optimum pH have been determined previously such as pH 5 for starch13 and pH 6 for g luco~e .~ Since the main products of the former are acetic and pro- pionic acids and of the latter acetic and butyric acids, it could be speculated that the pH optimum is different for the two types of fermentation, that is, the propionic acid type and the butyric acid type.
The product distribution and more specifically the con- centration of acetic acid produced was found to depend on the operational parameters. Longer hydraulic retention times resulted in increased acetic acid concentration. In con- trast the concentration of propionic acid did not change with the hydraulic retention time. It was found to be a function of the initial substrate concentration only. Furthermore, it was determined that for the waste used in this study, a con- sistent 8% of the influent COD was converted to propionic acid. These observations are in agreement with the data presented by Stoppok and Buchholz,21 where the amount of propionic acid produced consisted of approximately 8% of the influent substrate concentration, while the concen- tration of acetic acid varied according to the hydraulic re- tention time and influent substrate concentration. The engineering implication of the above observation is that low production of propionate might only be achieved when less dilute substrate concentrations are used.
The effect of the pH on the composition of the volatile acids produced has been determined. The concentration of acetic acid was affected by the pH much more than the concentration of propionic acid, although both acids reached a maximum at pH 7. The percentage of acetic acid as a pro- portion of the total fatty acids seemed to increase with in- creasing pH, while the opposite was true for the percentage of propionic acid. At pH 7, acetic and propionic acids were 39 and 35% of total volatile acids, respectively. However, at pH 5, acetic and propionic acids were 25 and 42% re- spectively. This agrees with the results reported by Breure and Van Andel’ on gelatin, who found that the percentage of acetic acid decreased while the percentage of propionic acid increased, when the pH changed from pH 6.0 to 5.3.
The effect of temperature on the composition of the efflu- ent of the acidogenic reactor was also determined. The ef- fect of the temperature on the concentration of acetic acid
was much more pronounced than its effect on the concen- tration of propionic acid, which was almost constant for the range 2540°C. The percentage of propionic acid produced as a proportion of the total voIatile fatty acids increased when the temperature decreased. This is in agreement with the results reported by de la Torre and Goma,17 who also found a change in composition with temperature, and more specifically, increased percentage of propionic acid for lower temperatures. It therefore appears that the acidification stage can potentially be optimized in such a way as to have con- siderable benefit for methane production in a two-stage system.
One of the authors (Georgia Dinopoulou) would like to thank the Greek State Scholarships for financial support.
References
I . S. M. Stronach, T. Rudd, and J. N. Lester, in “Anaerobic Digestion Processes in Industrial Wastewater Treatment,” Biotechnology Mono- graphs, Volume 2 , (Springer-Verlag, Heidelberg, 1986).
2. S. Ghosh, J. R. Conrad, and D. L. Klass, J. Water Pollut. Control Fed., 47, 30 (1975).
3. A. Cohen, R. J. Zoetemeyer, A. Van Deursen, and J. G. van Andel, Water Res., W, 571 (1979).
4. M. A. Bull, R. M. Stemtt, and J. N. Lester, Biotechnol. Bioeng., 26, 1054 (1984).
5 . H. Sahm, Adv. Biochem. Eng., 29, 83 (1984). 6. A. Cohen, A.M. Breure, J. G. van Andel, and A. van Deursen,
7. A. M. Breure and J. G. van Andel, Appl. Microbiol. Biotechnol., 20,
8. P. M. Sutton and A. Li, Water Sci. Technol., 15, 333 (1983). 9. A. Cohen, A.M. Breure, J .G. van Andel, and A. van Deursen,
10. A. Cohen, J. M. van Gemert, R. J. Zoetemeyer, and A.M. Breure,
11. W. Verstraete, L. de Baerre, and A. Rozzi, Trib. Cebedeau, 34, 367
12. M. DonBnyos, B. KosovB, J. ZabranskB, and P. Grau, Water Sci.
13. K. von Murdrack and S. Kunst, 2. Wasser Abwasser Forsch., 15,
14. H. F. Kaspar and K. Wuhrmann, Appl. Environ. Microbiol., 36, 1
15. C. -Y. Lin, K. Sato, T. Noike, and J. Matsumoto, Water Res., 20,
16. W. M. Wiegant, M. Hennink, and G. Lettinga, Water Res., 20, 517
17. I. de la Torre and G. Goma, Biotechnol. Bioeng., 23, 185 (1981). 18. R. J. Zoetemeyer, J. C. van den Heuvel, and A. Cohen., Water Res.,
16, 303 (1982). 19. M. H. Joergensen, Eur. J. Appl. Microbiol. Biotechnol., 6 , 181
( 1978). 20. I. de la Torre Lozano, I. Cemok, and G. Goma, Proceedings of the
Second Symposium on Bioconversion and Biochemical Engineering, Volume 2, T. IC. Ghose, Ed. (IIT, New Delhi, 1980), p. 113.
21. E. Stoppok and K. Buchholz, Biotechnol. Lett., 17, 119 (1985). 22. Department of Environment, Chemical Oxygen Demand (Dichromute
Value) of Polluted and Waste Waters (HMSO, London, 1977). 23. Y.-T. Wang, M. T. Suidan, and B. E. Rittmann, J . Environ. Eng..
111, 460 (1985). 24. Department of Environment, Suspended, Settleable and Total Dis-
solved solids in wastes and effluents (HMSO, London, 1980).
Water Res., 14, 1439 (1980).
40 (1984).
Water Res., 16, 449 (1982).
Process Biochem., 19, 228 (1984).
(1981).
Technol., 17, 191 (1985).
277 (1982).
(1978).
385 (1986).
(1986).
DINOPOULOU, RUDD, AND LESTER: ANAEROBIC ACIDOGENESIS. I 967
25. Water Research Centre, “Manual and Automated gas chromato- graphic procedures for the determination of volatile fatty acids,” Technical Report TR76, (1978).
26. N. R. Draper and H. Smith, Applied Regression Analysis, (Wiley, New Yo&, 1981).
27. A. Cohen, A.M. Breure, D. J. M. Schmedding, R. J. Zoetemeyer, and J.G. van Andel, Appl. Microbial. Biorechnol., 21, 404 (1985).
28. R. E. Muck and C. P. L. Grady, Jr., Proc. Am. Soc. Civ. Eng., 100,
29. R. J. Zoetemeyer, P. Amoldy, A. Cohen, and C. Boelhouwer, Water
30. J. C. Young and P. L. McCarty, Proceedings of the 22nd Industrial
1147 (1974).
Res., 16, 313 (1982).
Waste Conference, Purdue University, Lafayette, IN, 1967, p. 559.
968 BIOTECHNOLOGY AND BIOENGINEERING, VOL. 31, JUNE 1988