Embed Size (px)
Citation preview
Analysing land and vegetation cover dynamics during lastthree decades in Katerniaghat wildlife sanctuary, India
V S Chitale1,2,∗ and M D Behera1
1Spatial Analysis and Modeling Laboratory, Centre for Oceans, Rivers, Atmosphere and Land Sciences(CORAL), Indian Institute of Technology, Kharagpur 721 302, India.
2International Centre for Integrated Mountain Development (ICIMOD), GPO Box 3226, Khumaltar,Lalitpur, Kathmandu, Nepal.
∗Corresponding author. e-mail: [email protected]
The change in the tropical forests could be clearly linked to the expansion of the human populationand economies. An understanding of the anthropogenic forcing plays an important role in analyzingthe impacts of climate change and the fate of tropical forests in the present and future scenario. Inthe present study, we analyze the impact of natural and anthropogenic factors in forest dynamics inKaterniaghat wildlife sanctuary situated along the Indo-Nepal border in Uttar Pradesh state, India.The study site is under tremendous pressure due to anthropogenic factors from surrounding areas sincelast three decades. The vegetation cover of the sanctuary primarily comprised of Shorea robusta forests,Tectona grandis plantation, and mixed deciduous forest; while the land cover comprised of agriculture,barren land, and water bodies. The classification accuracy was 83.5%, 91.5%, and 95.2% with MSS,IKONOS, and Quickbird datasets, respectively. Shorea robusta forests showed an increase of 16 km2; whileTectona grandis increased by 63.01 km2 during 1975–2010. The spatial heterogeneity in these tropicalvegetation classes surrounded by the human dominated agricultural lands could not be addressed usingLandsat MSS data due to coarse spatial resolution; whereas the IKONOS and Quickbird satellite datasetsproved to advantageous, thus being able to precisely address the variations within the vegetation classesas well as in the land cover classes and along the edge areas. Massive deforestation during 1970s alongthe adjoining international boundary with Nepal has led to destruction of the wildlife corridor and hasexposed the wildlife sanctuary to interference like grazing and poaching. Higher rates of forest dynamicsduring the 25-year period indicate the vulnerability of the ecosystem to the natural and anthropogenicdisturbances in the proximity of the sanctuary.
1. Introduction
Tropical forests play a crucial role in the globalcarbon and energy cycles. They support more than50% of the described species and an even largernumber of undescribed species (Dirzo and Raven2003). With accelerated decline in biodiversityacross the world, there is an urgent need to map
and monitor the vegetation cover across differenthabitats and landscapes. An understanding of theanthropogenic forcing is crucial to analyze theeffects of climate change and the fate of tropicalforests (Wright 2005). Natural disturbances deter-mine at the forest dynamics and affect the treediversity on local and regional scales (Pickett andWhite 1985; Clark 1992; Attiwill 1994; Sheil 1999),
Keywords. Tropical ecosystem; deforestation; forest dynamics; Quickbird; IKONOS.
J. Earth Syst. Sci. 123, No. 7, October 2014, pp. 1467–1479c© Indian Academy of Sciences 1467
1468 V S Chitale and M D Behera
while anthropogenic disturbances contribute inregulating the regeneration dynamics, structure,and floristic composition of tropical ecosystems(Ewel et al. 1981; Horn and Hickey 1991). In mostcases, changes in the structural attributes of theforests are related to disturbance regimes involv-ing a single factor over a regional scale (Cannonet al. 1994; Scherer et al. 2000; Wright 2005). How-ever, low-intensity disturbances such as firewoodextraction and grazing, could involve the com-bined effect of multiple factors and result in ecosys-tem alteration, consequently leading to habitatdegradation (Veblen 1978; Smiet 1992; Kappelleet al. 1996).
A priority area of research for the ecologistsis the assessment and monitoring of biodiversity,which is essential in tropical habitats, where muchof the world’s species diversity is concentrated(Nagendra and Gadgil 1999; Sanchez-Azofeifaet al. 2003; Loarie et al. 2007). Wildlife pro-tected areas (PAs) could provide the refuge tothe endangered ecosystems and result in enhancedgrowth of the same. PAs in India have a relativelylong history of forest management and exploita-tion as a majority of the PAs were originallyreserved forests or other categories of governmentowned forests where focus of management wastimber production, to meet the biomass demandsof local communities, or soil and water conserva-tion (Rodgers and Sawarkar 1988). During 1970’sand 1980’s, several reserved forests having highabundance of wildlife were noted/listed as nationalparks where exploitation of forest resources isentirely legally prohibited or as wildlife sanctu-aries where a certain amount of exploitation anddevelopment may be permissible (Tripathi andSingh 2009).
Remote sensing datasets and techniques havelong been utilized to predict species richness, basedon environmental heterogeneity and derived byspectral heterogeneity (Palmer et al. 2002; Foodyand Cutler 2003; Rocchini et al. 2004; Hernandez-Stefanoni and Dupny 2007). While some successhas been achieved, obviously, no single factor suchas landscape heterogeneity or primary productivitydrives biodiversity patterns (Turner et al. 2003).Instead, species are clustered based on some exoge-nous factors, such as climate and soil type. Suchclustering or autocorrelation of species distribu-tion is often on broad scales, facilitating the useof medium-coarse resolution imagery for speciesdiversity estimations (Dormann 2007). Other bioticand abiotic processes may however cause furtherstructuring within smaller areas of relative environ-mental homogeneity, giving rise to small scale nichepatterning, and fine scale variations in biodiver-sity (Legendre 1993; Wagner 2003). In such cases,there is an apparent need for ‘hyper-spatial’ data.
When medium pixel resolution satellite datasets, afew tens of meters in size are used for ecologicalstudies, a single pixel often encompasses a num-ber of individual trees or plants, sometimes evencrossing habitat boundaries (Small 2004). Thuseach pixel corresponds to a mixed field signatureaveraged across multiple objects, leading to diffi-culties in identification of the species, or the map-ping of fine scale variations in biodiversity. Hyper-spatial satellite imagery is potentially much bettersuited for biodiversity mapping with pixel sizes ofthe size of 5 m or less, corresponding well to thesize of individual tree crowns (Read et al. 2003;Wulder et al. 2004).
The region along the Himalayan foothills formsone of the distinct eco-climatic zones in northernIndia. The landscape is listed among the impor-tant eco-regions of the world, and is well knownfor its unique biodiversity and high productivity(Johnsingh et al. 2004). The region has undergonesevere alterations due to the expansion of agri-cultural land, replacement of natural forests withcommercial plantations, industrialization, andurbanization. It has caused fragmentation anddegradation of natural habitats causing localextinction of several species. Due to its ecologicalimportance as home to a large number of threat-ened and endangered flora and fauna species, theecosystem has been studied by various researchersin terms of ecological studies and biodiversityassessments. Champion and Seth (1968) comparedvarious communities associated with Shorearobusta forests along moisture gradients. Panigrahiet al. (1969) compared the flora of Terai forests andgrasslands of Uttar Pradesh, India. The biotic pres-sures and their impact on regeneration and growthof wild plants in tropical moist deciduous forestof this region have been documented by Pandey(2000). Regeneration pattern and plant diversityin degraded Shorea robusta forest of northeast-ern Uttar Pradesh were assessed by Pandey andShukla (1999, 2001). The structure of a rehabili-tated forest established on barren land was stud-ied in response to natural succession and degree ofsoil amelioration/land renewal over period of time(Tripathi 2001; Tripathi and Singh 2005). Sev-eral studies have analyzed community structurein Shorea robusta forests (Gupta and Shukla1991; Singh et al. 1995, Pandey and Shukla1999; Shankar 2001; Maliya and Singh 2003;Kumari and Tripathi 2007; Maliya 2007). Someof the patches in the region are drought proneand hence affect the regeneration rate of Shorearobusta. The plantations of Tectona grandis, Ter-minalia alata and Syzygium cumini were startedmainly for gap filling and to replace poorlyregenerating Shorea robusta species in someregions.
Land and vegetation cover dynamics in Katerniaghat wildlife sanctuary 1469
2. Materials and methods
2.1 Study area
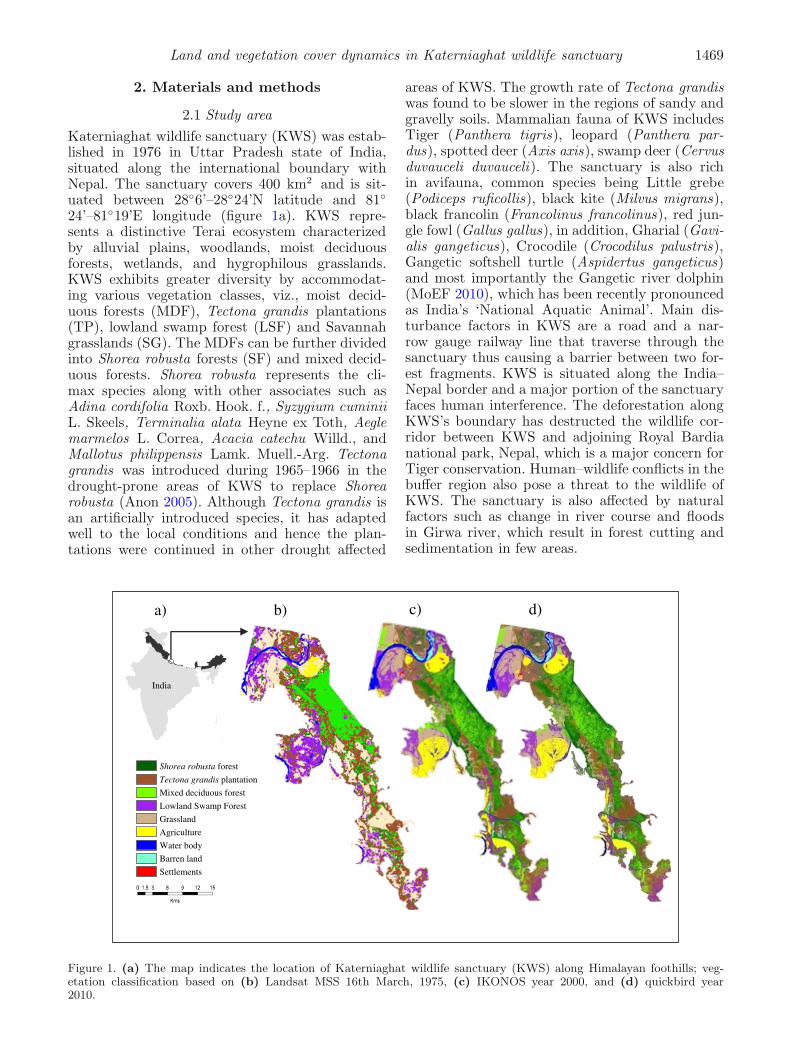
Katerniaghat wildlife sanctuary (KWS) was estab-lished in 1976 in Uttar Pradesh state of India,situated along the international boundary withNepal. The sanctuary covers 400 km2 and is sit-uated between 28◦6’–28◦24’N latitude and 81◦
24’–81◦19’E longitude (figure 1a). KWS repre-sents a distinctive Terai ecosystem characterizedby alluvial plains, woodlands, moist deciduousforests, wetlands, and hygrophilous grasslands.KWS exhibits greater diversity by accommodat-ing various vegetation classes, viz., moist decid-uous forests (MDF), Tectona grandis plantations(TP), lowland swamp forest (LSF) and Savannahgrasslands (SG). The MDFs can be further dividedinto Shorea robusta forests (SF) and mixed decid-uous forests. Shorea robusta represents the cli-max species along with other associates such asAdina cordifolia Roxb. Hook. f., Syzygium cuminiiL. Skeels, Terminalia alata Heyne ex Toth, Aeglemarmelos L. Correa, Acacia catechu Willd., andMallotus philippensis Lamk. Muell.-Arg. Tectonagrandis was introduced during 1965–1966 in thedrought-prone areas of KWS to replace Shorearobusta (Anon 2005). Although Tectona grandis isan artificially introduced species, it has adaptedwell to the local conditions and hence the plan-tations were continued in other drought affected
areas of KWS. The growth rate of Tectona grandiswas found to be slower in the regions of sandy andgravelly soils. Mammalian fauna of KWS includesTiger (Panthera tigris), leopard (Panthera par-dus), spotted deer (Axis axis), swamp deer (Cervusduvauceli duvauceli). The sanctuary is also richin avifauna, common species being Little grebe(Podiceps ruficollis), black kite (Milvus migrans),black francolin (Francolinus francolinus), red jun-gle fowl (Gallus gallus), in addition, Gharial (Gavi-alis gangeticus), Crocodile (Crocodilus palustris),Gangetic softshell turtle (Aspidertus gangeticus)and most importantly the Gangetic river dolphin(MoEF 2010), which has been recently pronouncedas India’s ‘National Aquatic Animal’. Main dis-turbance factors in KWS are a road and a nar-row gauge railway line that traverse through thesanctuary thus causing a barrier between two for-est fragments. KWS is situated along the India–Nepal border and a major portion of the sanctuaryfaces human interference. The deforestation alongKWS’s boundary has destructed the wildlife cor-ridor between KWS and adjoining Royal Bardianational park, Nepal, which is a major concern forTiger conservation. Human–wildlife conflicts in thebuffer region also pose a threat to the wildlife ofKWS. The sanctuary is also affected by naturalfactors such as change in river course and floodsin Girwa river, which result in forest cutting andsedimentation in few areas.
Shorea robusta forest
Tectona grandis plantation
Mixed deciduous forest
Lowland Swamp Forest
Grassland
Agriculture
Water body
Barren land
Settlements
India
a) c) d)b)
Figure 1. (a) The map indicates the location of Katerniaghat wildlife sanctuary (KWS) along Himalayan foothills; veg-etation classification based on (b) Landsat MSS 16th March, 1975, (c) IKONOS year 2000, and (d) quickbird year2010.
1470 V S Chitale and M D Behera
2.2 Land/vegetation cover classificationand dynamics
In the present study, we analyzed the past andpresent status of KWS with the alterations inthe forest vegetation and land cover classes inthe Katerniaghat wildlife sanctuary (KWS) dueto human interference and natural factors. Theoptical satellite datasets with variable spatial andtemporal resolution were used in vegetation andland cover mapping of KWS. Due to unavailabil-ity of high resolution datasets, Landsat MSS satel-lite data with coarse resolution was used for thevegetation mapping of 1975. The land cover ofKWS was mapped under six vegetation and threenon-vegetation classes using the satellite datasetsfor the 1975 Landsat MSS data (spatial resolu-tion: 60m) of 16 March. Four tiles of multispectralIKONOS satellite data (spatial resolution: 4m) ofyear 2000 dating from 18 February to 21 Marchand four tiles of multispectral Quickbird satellitedata (spatial resolution: 2.4m) of 2010 rangingfrom 28 February to 19 March were utilized inthe study. The ‘Equal area’– Lambert ConformalConic LCC projection was maintained for all satel-lite datasets in order to keep the same area extent.The vegetation classification of Landsat MSS satel-lite data was carried out in Erdas Imagine 9.2 soft-ware and that of IKONOS and Quickbird satellitedata was carried out in eCognition software v8.0.The land/vegetation cover classification process forthe three time periods was based on the deci-sion tree classifiers (Simard et al. 2000; Pavuluriet al. 2002) due to their capability to break downa complex decision-making process into a collec-tion of simpler decisions, thus providing a simplersolution. Classification accuracy of all vegetationand land cover classes for all time periods wasassessed by utilizing field sampling points acquiredusing global positioning system (GPS) during2009–2011. Field reconnaissance tours were con-ducted during summer, post-rainfall, and winterseason to account for the seasonal variations in thevegetation and to use the field details as interpre-tation keys for better vegetation identification anddemarcation using all three datasets. The classi-fied outputs for the years 1975, 2000, and 2010were analyzed to study the land cover dynamicsand its drivers in KWS. The change dynamicsmatrix was critically studied to see the changesin vegetation of KWS during 10 years from 2000to 2010, 25 years from 1975 to 2000, and 35years from 1975 to 2010. The river dynamics ofGirwa river was studied to analyze the role ofnutrient load in the forest growth and net pri-mary productivity. Human and nonhuman driversinducing the land/vegetation cover change in KWSwere analyzed based on the satellite datasets of
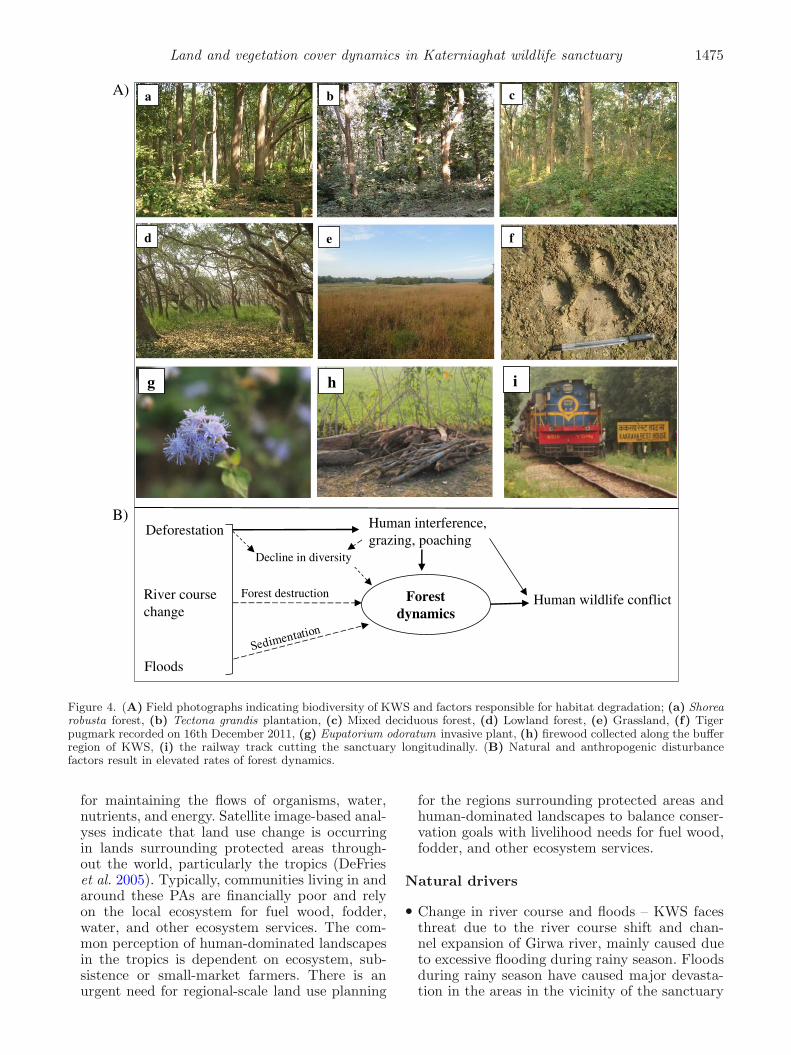
Landsat MSS, IKONOS, and Quickbird, meteoro-logical datasets (Chitale et al. 2012). Ground truthinputs in the form of field photographs and GPSpoints acquired during the field reconnaissancesurveys were utilized to analyze the impacts ofhuman interference in KWS in the form of cattlegrazing, fire wood collection and timber wood log-ging (figure 4). Published literature from previousstudies (Johnsingh et al. 2004; Anonymous 2005;Tripathi and Singh 2009) was used to analysethe influence of human and non-human drivers onland/vegetation cover change. Based on the multi-temporal satellite data, the effect of sedimenta-tion on the growth and productivity of lowlandswamp forest was studied. Rate of land and vege-tation cover dynamics per year for all three timeperiods was assessed based on the area changed insquare kilometers and number of years in each timeinterval.
3. Results
3.1 Vegetation/land cover of KWS
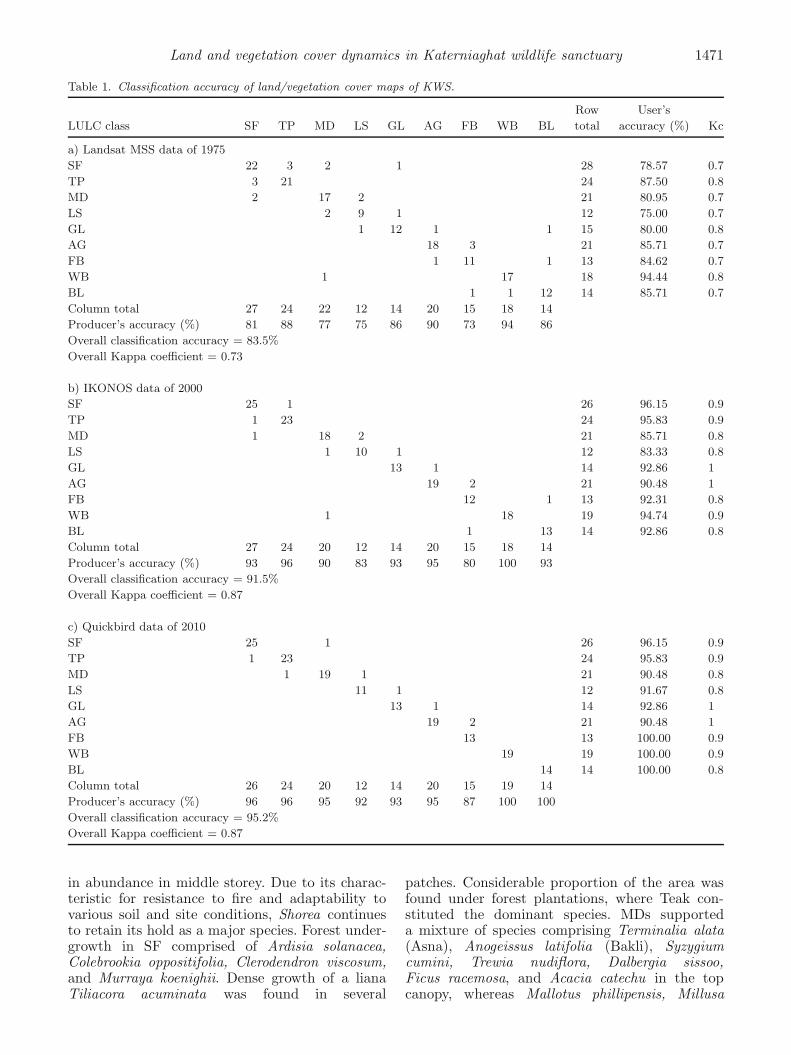
Katerniaghat wildlife sanctuary (KWS) accom-modated five dominant vegetation classes andfour non-vegetation classes across the landscapeof approximately 400 km2. Very high resolutionIKONOS and Quickbird satellite data-based vege-tation map for the year 2000 and 2010 respectively,resulted in nine land/vegetation classes, compris-ing of Shorea robusta (Sal) forest, Tectona grandis(Teak) plantation, mixed deciduous forest (MD),lowland swamp forest (LS), Savanna grassland(GL), and nonvegetation classes, viz., barren land,water body, agriculture, and settlements (figure 1cand d). Due to coarse resolution Landsat MSSdata for year 1975, it was not possible to accountfor the spatial heterogeneity of vegetation classes,hence broad scale map showed six vegetationand two nonvegetation classes (figure 1b). Thedisturbance drivers such as roads, railways, andhuman settlements were easy to demarcate in caseof VHR satellite data, but were difficult to iden-tify on the coarse resolution satellite data. Thearea was classified under five vegetation classescomprising of Shorea robusta forest (SF), Tectonagrandis plantation (TP), mixed deciduous for-est (MD), lowland swamp forest (LS), grassland(GL), and three land cover classes; forest blanks,water body, agriculture. The classification accu-racy was 83.5%, 91.5%, and 95.2% with MSS,IKONOS, and Quickbird datasets respectively(table 1a–c). SFs are dominated mainly by Sal(Shorea robusta), a major constituent in the topcanopy along with other species, viz., Terminaliaalata, Syzygium cumini, Anogeissus latifolia, andHaldina cordifolia. Mallotus phillipensis is found
Land and vegetation cover dynamics in Katerniaghat wildlife sanctuary 1471
Table 1. Classification accuracy of land/vegetation cover maps of KWS.
Row User’s
LULC class SF TP MD LS GL AG FB WB BL total accuracy (%) Kc
a) Landsat MSS data of 1975
SF 22 3 2 1 28 78.57 0.7
TP 3 21 24 87.50 0.8
MD 2 17 2 21 80.95 0.7
LS 2 9 1 12 75.00 0.7
GL 1 12 1 1 15 80.00 0.8
AG 18 3 21 85.71 0.7
FB 1 11 1 13 84.62 0.7
WB 1 17 18 94.44 0.8
BL 1 1 12 14 85.71 0.7
Column total 27 24 22 12 14 20 15 18 14
Producer’s accuracy (%) 81 88 77 75 86 90 73 94 86
Overall classification accuracy = 83.5%
Overall Kappa coefficient = 0.73
b) IKONOS data of 2000
SF 25 1 26 96.15 0.9
TP 1 23 24 95.83 0.9
MD 1 18 2 21 85.71 0.8
LS 1 10 1 12 83.33 0.8
GL 13 1 14 92.86 1
AG 19 2 21 90.48 1
FB 12 1 13 92.31 0.8
WB 1 18 19 94.74 0.9
BL 1 13 14 92.86 0.8
Column total 27 24 20 12 14 20 15 18 14
Producer’s accuracy (%) 93 96 90 83 93 95 80 100 93
Overall classification accuracy = 91.5%
Overall Kappa coefficient = 0.87
c) Quickbird data of 2010
SF 25 1 26 96.15 0.9
TP 1 23 24 95.83 0.9
MD 1 19 1 21 90.48 0.8
LS 11 1 12 91.67 0.8
GL 13 1 14 92.86 1
AG 19 2 21 90.48 1
FB 13 13 100.00 0.9
WB 19 19 100.00 0.9
BL 14 14 100.00 0.8
Column total 26 24 20 12 14 20 15 19 14
Producer’s accuracy (%) 96 96 95 92 93 95 87 100 100
Overall classification accuracy = 95.2%
Overall Kappa coefficient = 0.87
in abundance in middle storey. Due to its charac-teristic for resistance to fire and adaptability tovarious soil and site conditions, Shorea continuesto retain its hold as a major species. Forest under-growth in SF comprised of Ardisia solanacea,Colebrookia oppositifolia, Clerodendron viscosum,and Murraya koenighii. Dense growth of a lianaTiliacora acuminata was found in several
patches. Considerable proportion of the area wasfound under forest plantations, where Teak con-stituted the dominant species. MDs supporteda mixture of species comprising Terminalia alata(Asna), Anogeissus latifolia (Bakli), Syzygiumcumini, Trewia nudiflora, Dalbergia sissoo,Ficus racemosa, and Acacia catechu in the topcanopy, whereas Mallotus phillipensis, Millusa
1472 V S Chitale and M D Behera
velutina, and Streblus asper occurred in themiddle canopy. Shrub species like Clerodendrumviscosum and Glycosmis pentaphylla were alsoencountered. Lowland swamp forests (LS) occurredin swampy depressions which remain floodedduring the rains or heavy waterlogged areas con-taining deep black soils with rich humus content.Poor soil aeration results in waterlogging thatsupports the dominant growth of tree specieslike Syzygium cumini. Other species, viz., Trewianudiflora, Terminalia alata, and Lagerstromeaparviflora were found along with shrubs likeClerodendrum viscosum, Glycosmis pentaphylla,and Murraya koenigii. Savannah/grasslands (GL)occupied large areas and accommodated scat-tered trees of Bombax ceiba, Syzygium cerasoides,Dalbergia sissoo, Haldina cordifolia, and Acaciacatechu. The dominant grasses vary from place toplace, depending mainly upon the soil type anddrainage. Sclerostachya fusca and Arundo donaxwere in swampy locations, whereas Imperatacylindrica, Desmostachya bipinnata, Cymbopogonjwarancusa, and Saccharum spontaneum werefound over clayey soil.
3.2 Land/vegetation cover dynamics
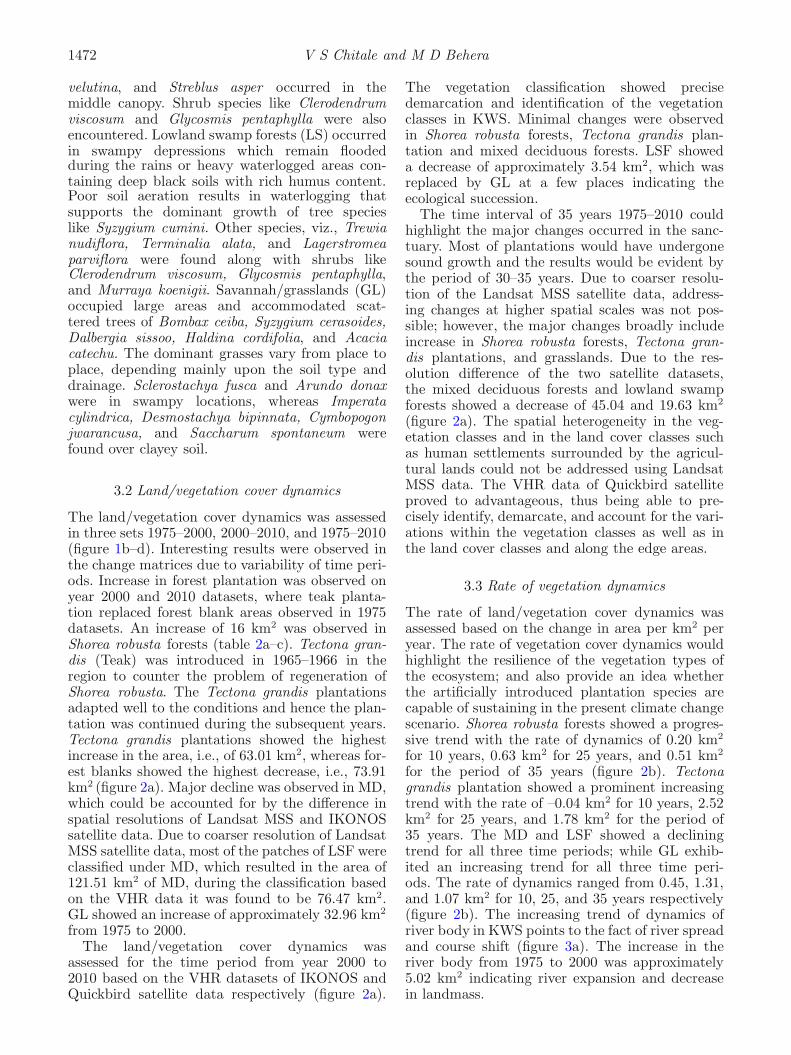
The land/vegetation cover dynamics was assessedin three sets 1975–2000, 2000–2010, and 1975–2010(figure 1b–d). Interesting results were observed inthe change matrices due to variability of time peri-ods. Increase in forest plantation was observed onyear 2000 and 2010 datasets, where teak planta-tion replaced forest blank areas observed in 1975datasets. An increase of 16 km2 was observed inShorea robusta forests (table 2a–c). Tectona gran-dis (Teak) was introduced in 1965–1966 in theregion to counter the problem of regeneration ofShorea robusta. The Tectona grandis plantationsadapted well to the conditions and hence the plan-tation was continued during the subsequent years.Tectona grandis plantations showed the highestincrease in the area, i.e., of 63.01 km2, whereas for-est blanks showed the highest decrease, i.e., 73.91km2 (figure 2a). Major decline was observed in MD,which could be accounted for by the difference inspatial resolutions of Landsat MSS and IKONOSsatellite data. Due to coarser resolution of LandsatMSS satellite data, most of the patches of LSF wereclassified under MD, which resulted in the area of121.51 km2 of MD, during the classification basedon the VHR data it was found to be 76.47 km2.GL showed an increase of approximately 32.96 km2
from 1975 to 2000.The land/vegetation cover dynamics was
assessed for the time period from year 2000 to2010 based on the VHR datasets of IKONOS andQuickbird satellite data respectively (figure 2a).
The vegetation classification showed precisedemarcation and identification of the vegetationclasses in KWS. Minimal changes were observedin Shorea robusta forests, Tectona grandis plan-tation and mixed deciduous forests. LSF showeda decrease of approximately 3.54 km2, which wasreplaced by GL at a few places indicating theecological succession.
The time interval of 35 years 1975–2010 couldhighlight the major changes occurred in the sanc-tuary. Most of plantations would have undergonesound growth and the results would be evident bythe period of 30–35 years. Due to coarser resolu-tion of the Landsat MSS satellite data, address-ing changes at higher spatial scales was not pos-sible; however, the major changes broadly includeincrease in Shorea robusta forests, Tectona gran-dis plantations, and grasslands. Due to the res-olution difference of the two satellite datasets,the mixed deciduous forests and lowland swampforests showed a decrease of 45.04 and 19.63 km2
(figure 2a). The spatial heterogeneity in the veg-etation classes and in the land cover classes suchas human settlements surrounded by the agricul-tural lands could not be addressed using LandsatMSS data. The VHR data of Quickbird satelliteproved to advantageous, thus being able to pre-cisely identify, demarcate, and account for the vari-ations within the vegetation classes as well as inthe land cover classes and along the edge areas.
3.3 Rate of vegetation dynamics
The rate of land/vegetation cover dynamics wasassessed based on the change in area per km2 peryear. The rate of vegetation cover dynamics wouldhighlight the resilience of the vegetation types ofthe ecosystem; and also provide an idea whetherthe artificially introduced plantation species arecapable of sustaining in the present climate changescenario. Shorea robusta forests showed a progres-sive trend with the rate of dynamics of 0.20 km2
for 10 years, 0.63 km2 for 25 years, and 0.51 km2
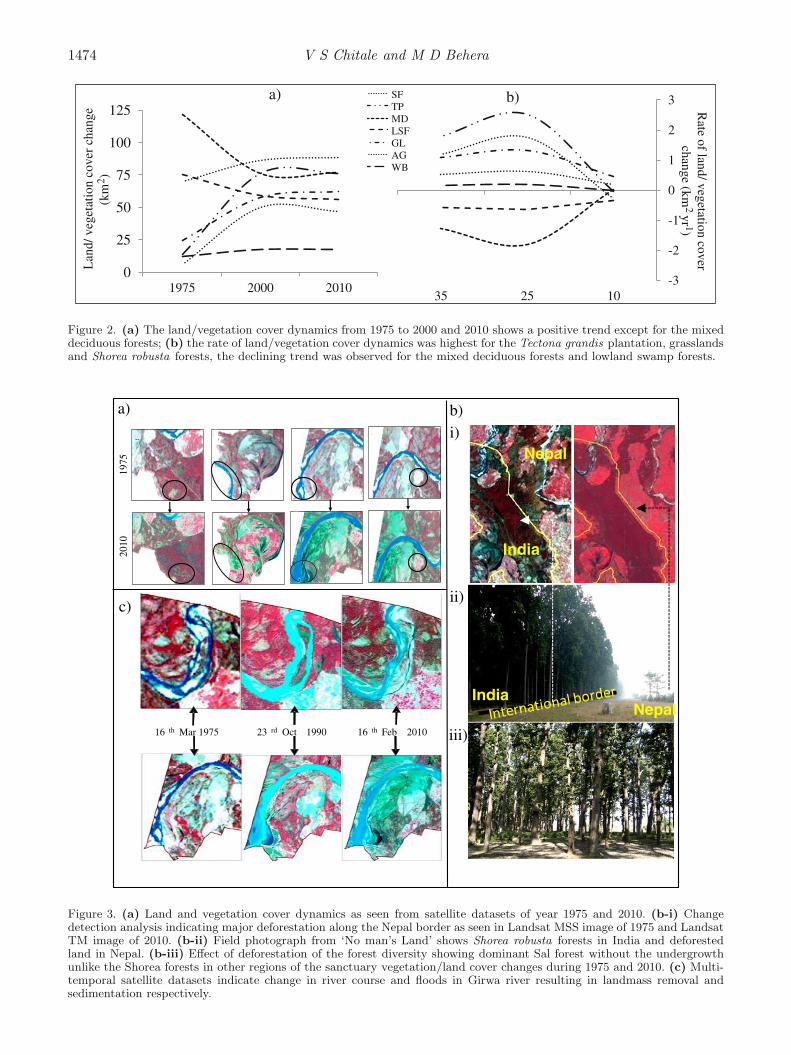
for the period of 35 years (figure 2b). Tectonagrandis plantation showed a prominent increasingtrend with the rate of –0.04 km2 for 10 years, 2.52km2 for 25 years, and 1.78 km2 for the period of35 years. The MD and LSF showed a decliningtrend for all three time periods; while GL exhib-ited an increasing trend for all three time peri-ods. The rate of dynamics ranged from 0.45, 1.31,and 1.07 km2 for 10, 25, and 35 years respectively(figure 2b). The increasing trend of dynamics ofriver body in KWS points to the fact of river spreadand course shift (figure 3a). The increase in theriver body from 1975 to 2000 was approximately5.02 km2 indicating river expansion and decreasein landmass.
Land and vegetation cover dynamics in Katerniaghat wildlife sanctuary 1473
Table 2. Land/vegetation cover dynamics from year (a) 1975 to 2000, (b) 2000 to 2010 and (c) 1975 to 2010.
a) SF TP MD LS GL AG FB WB BL 1975
SF 41.57 4.77 19.76 2.79 0.19 0.40 0.56 0.03 0.28 70.36
TP 0.32 6.31 4.63 1.65 0.48 0.07 0.00 0.01 0.00 13.47
MD 19.58 12.63 60.15 13.33 10.23 2.82 4.11 1.08 0.22 121.51
LS 2.50 3.21 14.14 5.71 27.65 11.29 4.89 7.15 0.26 75.60
GL 1.46 1.29 6.94 1.97 6.64 0.90 6.16 0.33 0.11 24.78
AG 0.00 0.00 0.05 0.00 0.05 5.40 0.15 0.00 0.05 5.72
FB 2.98 24.82 23.91 6.57 19.68 10.79 13.24 7.19 0.00 107.61
WB 0.19 0.15 0.62 0.49 3.05 0.15 1.47 6.15 0.16 12.45
BL 0.16 0.12 0.52 0.17 0.69 0.54 0.15 0.23 0.00 2.57
2000 68.76 53.30 130.72 32.68 68.66 32.36 30.73 22.17 1.08 434.07
b) SF TP MD LS GL AG WB BL ST 2000
SF 85.57 0.14 0.26 0.12 0.11 0.02 0.04 0.00 0.00 86.26
TP 0.00 75.59 0.67 0.00 0.22 0.00 0.00 0.00 0.00 76.48
MD 2.50 0.00 71.44 1.27 1.26 0.00 0.00 0.00 0.00 76.47
LS 0.05 0.25 4.21 52.79 1.59 0.49 0.04 0.09 0.00 59.51
GL 0.01 0.00 0.00 0.12 56.82 0.41 0.00 0.34 0.04 57.74
AG 0.00 0.00 0.00 1.61 2.29 45.94 0.01 0.02 0.05 49.92
WB 0.16 0.00 0.00 0.01 0.00 0.00 17.29 0.01 0.00 17.47
BL 0.05 0.00 0.00 0.04 0.00 0.00 0.00 7.88 0.00 7.97
ST 0.00 0.02 0.00 0.00 0.00 0.00 0.00 0.00 0.80 0.82
2010 88.34 76.00 76.58 55.96 62.29 46.86 17.38 8.34 0.89 432.64
c) SF TP MD LS GL AG WB BL ST 1975
SF 85.57 0.14 0.26 0.12 0.11 0.02 0.04 0.00 0.00 70.36
TP 0.00 75.59 0.67 0.00 0.22 0.00 0.00 0.00 0.00 13.47
MD 2.50 0.00 71.44 1.27 1.26 0.00 0.00 0.00 0.00 121.51
LS 0.05 0.25 4.21 52.79 1.59 0.49 0.04 0.09 0.00 75.60
GL 0.01 0.00 0.00 0.12 56.82 0.41 0.00 0.34 0.04 24.78
AG 0.00 0.00 0.00 1.61 2.29 45.94 0.01 0.02 0.05 5.72
WB 0.16 0.00 0.00 0.01 0.00 0.00 17.29 0.01 0.00 107.61
BL 0.05 0.00 0.00 0.04 0.00 0.00 0.00 7.88 0.00 12.45
ST 0.00 0.02 0.00 0.00 0.00 0.00 0.00 0.00 0.80 2.57
2010 88.34 76.00 76.58 55.96 62.29 46.86 17.38 8.34 0.89 434.07
SF: Shorea robusta forest, TP: Tectona grandis plantation, MD: moist deciduous forest, LS: lowland swamp forest, GL:grassland, AG: agriculture, FB: forest blanks, WB: water body, BL: barren land.
3.3.1 Land/vegetation dynamics drivers
Human-induced drivers
• Forest plantations – Human induced drivers putforth positive and negative consequences, whichalter the composition of the ecosystem. In KWS,the forest plantations of Tectona grandis andEucalyptus citriodora undertaken regularly bythe State Forest Department (SFD) proved tobe supportive to the ecosystem by maintainingthe forest density. The results of the SFD effortscan be seen by the increase in the forest cover(figure 3a), which would result in higher carbonsequestration.
• Deforestation and human intervention – DiverseShorea robusta forests situated along the
Indo-Nepal border are facing tremendous anthro-pogenic pressure due to the ever-increasinghuman interference by the Nepal residents. Theforest corridor between Katerniaghat wildlifesanctuary, India and Bardia national park, Nepalwas destructed due to major deforestation under-taken by Nepal government during the post-independence period (figure 3b). This has led toincrease in human interference in the sanctuary,which may result in deforestation, poaching, andhuman–wildlife conflicts.
• Human–wildlife conflict – Katerniaghat WLS,Dudhwa national park, and Kishanpur WLSare the important protected areas (PAs) in theTerai landscape of Uttar Pradesh, India. Thereis always an active interaction between pro-tected areas and landscapes surrounding them
1474 V S Chitale and M D Behera
a) b)SFTPMDLSFGLAGWB
0
25
50
75
100
125
1975 2000 2010
Lan
d/ v
eget
atio
n co
ver
chan
ge
(km
2 )
-3
-2
-1
0
1
2
3
102535
Rate of land/ vegetation cover
change (km2 yr 1)
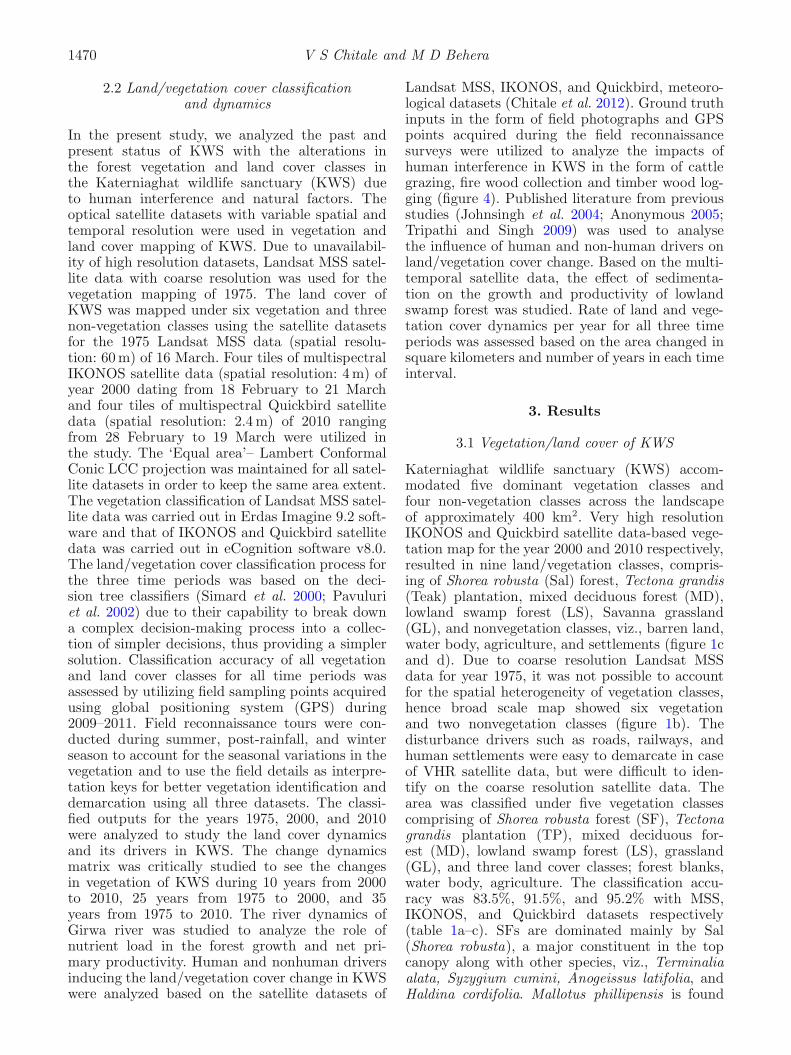
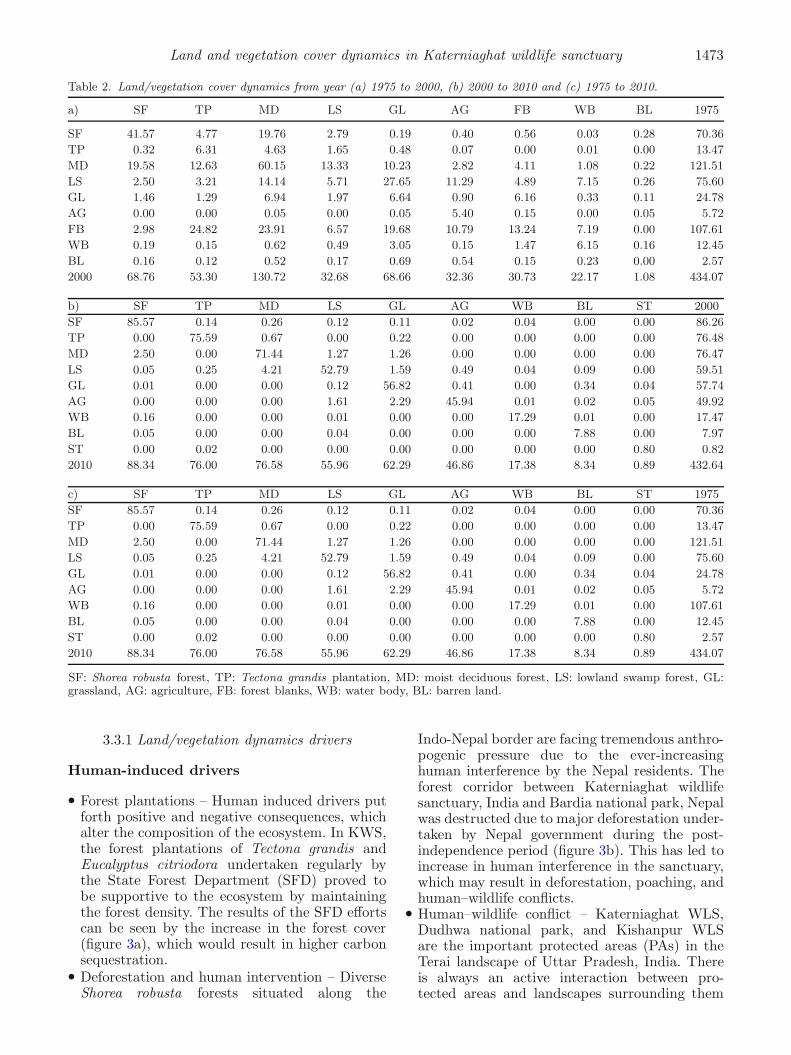
Figure 2. (a) The land/vegetation cover dynamics from 1975 to 2000 and 2010 shows a positive trend except for the mixeddeciduous forests; (b) the rate of land/vegetation cover dynamics was highest for the Tectona grandis plantation, grasslandsand Shorea robusta forests, the declining trend was observed for the mixed deciduous forests and lowland swamp forests.
16 th Mar 1975 23 rd Oct 1990 16 th Feb 2010
a)
1975
2010
a b c
a b c
d
d
c)
b)i)
ii)
iii)
IndiaNepal
India
Nepal
Figure 3. (a) Land and vegetation cover dynamics as seen from satellite datasets of year 1975 and 2010. (b-i) Changedetection analysis indicating major deforestation along the Nepal border as seen in Landsat MSS image of 1975 and LandsatTM image of 2010. (b-ii) Field photograph from ‘No man’s Land’ shows Shorea robusta forests in India and deforestedland in Nepal. (b-iii) Effect of deforestation of the forest diversity showing dominant Sal forest without the undergrowthunlike the Shorea forests in other regions of the sanctuary vegetation/land cover changes during 1975 and 2010. (c) Multi-temporal satellite datasets indicate change in river course and floods in Girwa river resulting in landmass removal andsedimentation respectively.
Land and vegetation cover dynamics in Katerniaghat wildlife sanctuary 1475
a b c
fed
ihg
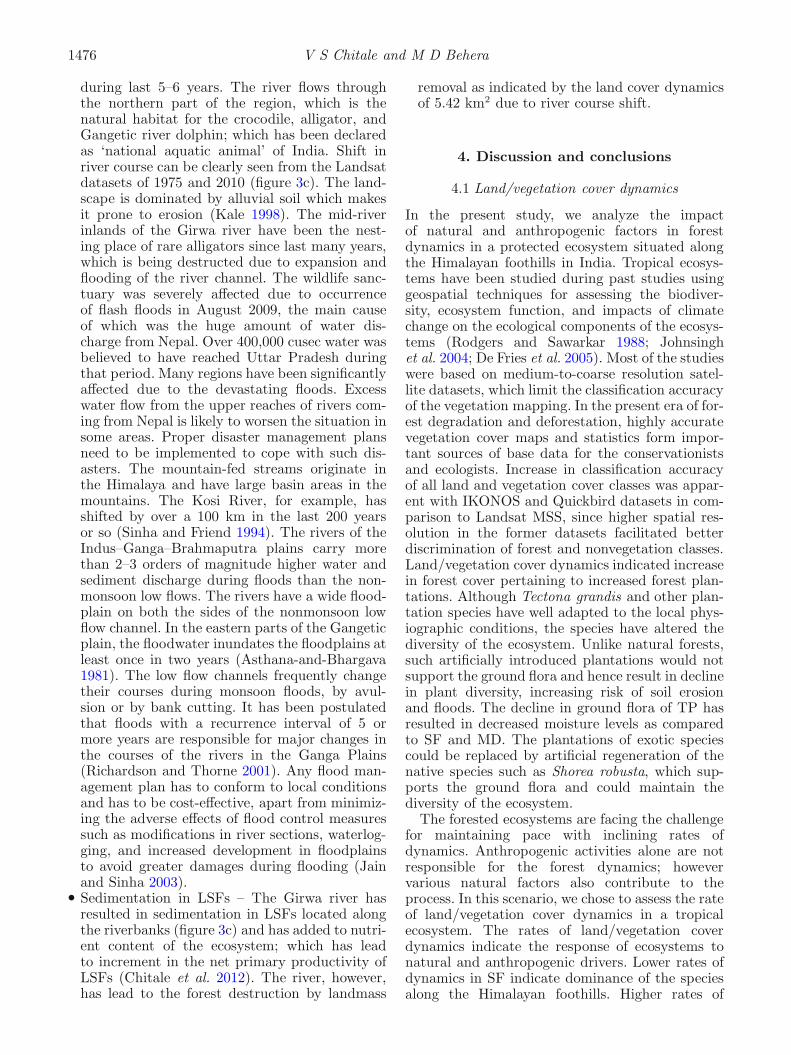
Deforestation
Forest destructionRiver course change
Forest dynamics
Human wildlife conflict
Human interference, grazing, poaching
Floods
Decline in diversity
A)
B)
Figure 4. (A) Field photographs indicating biodiversity of KWS and factors responsible for habitat degradation; (a) Shorearobusta forest, (b) Tectona grandis plantation, (c) Mixed deciduous forest, (d) Lowland forest, (e) Grassland, (f) Tigerpugmark recorded on 16th December 2011, (g) Eupatorium odoratum invasive plant, (h) firewood collected along the bufferregion of KWS, (i) the railway track cutting the sanctuary longitudinally. (B) Natural and anthropogenic disturbancefactors result in elevated rates of forest dynamics.
for maintaining the flows of organisms, water,nutrients, and energy. Satellite image-based anal-yses indicate that land use change is occurringin lands surrounding protected areas through-out the world, particularly the tropics (DeFrieset al. 2005). Typically, communities living in andaround these PAs are financially poor and relyon the local ecosystem for fuel wood, fodder,water, and other ecosystem services. The com-mon perception of human-dominated landscapesin the tropics is dependent on ecosystem, sub-sistence or small-market farmers. There is anurgent need for regional-scale land use planning
for the regions surrounding protected areas andhuman-dominated landscapes to balance conser-vation goals with livelihood needs for fuel wood,fodder, and other ecosystem services.
Natural drivers
• Change in river course and floods – KWS facesthreat due to the river course shift and chan-nel expansion of Girwa river, mainly caused dueto excessive flooding during rainy season. Floodsduring rainy season have caused major devasta-tion in the areas in the vicinity of the sanctuary
1476 V S Chitale and M D Behera
during last 5–6 years. The river flows throughthe northern part of the region, which is thenatural habitat for the crocodile, alligator, andGangetic river dolphin; which has been declaredas ‘national aquatic animal’ of India. Shift inriver course can be clearly seen from the Landsatdatasets of 1975 and 2010 (figure 3c). The land-scape is dominated by alluvial soil which makesit prone to erosion (Kale 1998). The mid-riverinlands of the Girwa river have been the nest-ing place of rare alligators since last many years,which is being destructed due to expansion andflooding of the river channel. The wildlife sanc-tuary was severely affected due to occurrenceof flash floods in August 2009, the main causeof which was the huge amount of water dis-charge from Nepal. Over 400,000 cusec water wasbelieved to have reached Uttar Pradesh duringthat period. Many regions have been significantlyaffected due to the devastating floods. Excesswater flow from the upper reaches of rivers com-ing from Nepal is likely to worsen the situation insome areas. Proper disaster management plansneed to be implemented to cope with such dis-asters. The mountain-fed streams originate inthe Himalaya and have large basin areas in themountains. The Kosi River, for example, hasshifted by over a 100 km in the last 200 yearsor so (Sinha and Friend 1994). The rivers of theIndus–Ganga–Brahmaputra plains carry morethan 2–3 orders of magnitude higher water andsediment discharge during floods than the non-monsoon low flows. The rivers have a wide flood-plain on both the sides of the nonmonsoon lowflow channel. In the eastern parts of the Gangeticplain, the floodwater inundates the floodplains atleast once in two years (Asthana-and-Bhargava1981). The low flow channels frequently changetheir courses during monsoon floods, by avul-sion or by bank cutting. It has been postulatedthat floods with a recurrence interval of 5 ormore years are responsible for major changes inthe courses of the rivers in the Ganga Plains(Richardson and Thorne 2001). Any flood man-agement plan has to conform to local conditionsand has to be cost-effective, apart from minimiz-ing the adverse effects of flood control measuressuch as modifications in river sections, waterlog-ging, and increased development in floodplainsto avoid greater damages during flooding (Jainand Sinha 2003).
• Sedimentation in LSFs – The Girwa river hasresulted in sedimentation in LSFs located alongthe riverbanks (figure 3c) and has added to nutri-ent content of the ecosystem; which has leadto increment in the net primary productivity ofLSFs (Chitale et al. 2012). The river, however,has lead to the forest destruction by landmass
removal as indicated by the land cover dynamicsof 5.42 km2 due to river course shift.
4. Discussion and conclusions
4.1 Land/vegetation cover dynamics
In the present study, we analyze the impactof natural and anthropogenic factors in forestdynamics in a protected ecosystem situated alongthe Himalayan foothills in India. Tropical ecosys-tems have been studied during past studies usinggeospatial techniques for assessing the biodiver-sity, ecosystem function, and impacts of climatechange on the ecological components of the ecosys-tems (Rodgers and Sawarkar 1988; Johnsinghet al. 2004; De Fries et al. 2005). Most of the studieswere based on medium-to-coarse resolution satel-lite datasets, which limit the classification accuracyof the vegetation mapping. In the present era of for-est degradation and deforestation, highly accuratevegetation cover maps and statistics form impor-tant sources of base data for the conservationistsand ecologists. Increase in classification accuracyof all land and vegetation cover classes was appar-ent with IKONOS and Quickbird datasets in com-parison to Landsat MSS, since higher spatial res-olution in the former datasets facilitated betterdiscrimination of forest and nonvegetation classes.Land/vegetation cover dynamics indicated increasein forest cover pertaining to increased forest plan-tations. Although Tectona grandis and other plan-tation species have well adapted to the local phys-iographic conditions, the species have altered thediversity of the ecosystem. Unlike natural forests,such artificially introduced plantations would notsupport the ground flora and hence result in declinein plant diversity, increasing risk of soil erosionand floods. The decline in ground flora of TP hasresulted in decreased moisture levels as comparedto SF and MD. The plantations of exotic speciescould be replaced by artificial regeneration of thenative species such as Shorea robusta, which sup-ports the ground flora and could maintain thediversity of the ecosystem.
The forested ecosystems are facing the challengefor maintaining pace with inclining rates ofdynamics. Anthropogenic activities alone are notresponsible for the forest dynamics; howevervarious natural factors also contribute to theprocess. In this scenario, we chose to assess the rateof land/vegetation cover dynamics in a tropicalecosystem. The rates of land/vegetation coverdynamics indicate the response of ecosystems tonatural and anthropogenic drivers. Lower rates ofdynamics in SF indicate dominance of the speciesalong the Himalayan foothills. Higher rates of
Land and vegetation cover dynamics in Katerniaghat wildlife sanctuary 1477
change were observed during longer time periods,because the plantations of Tectona grandis werecarried out on a major scale in the region duringthe period. GL exhibited an increasing trend dur-ing all three time periods. The inclining trend ofGL indicates two facts: (i) fastening of the ecolog-ical succession in the ecosystem, (ii) degradationof the ecosystem/ decline in the ecosystem health.The increase in GL could be linked to the degra-dation of the ecosystem health; however GLs arethe most suitable places for large mammals suchas Tigris tigris. The increase in GL could improvethe survival rates of the big cats by providing themabundant prey.
4.1.1 Land/vegetation dynamics drivers
We analyzed the role of natural and anthropogenicdrivers in land/vegetation cover dynamics. TheState Forest Department is putting maximumeffort in ecosystem conservation by undertakingforest plantations, maintaining the forest nurseriesto maintain the seed bank, and keeping the ecosys-tem under persistent surveillance to protect it fromthe human interference. The other side of human-induced drivers, however, does not prove to beadvantageous to KWS. Road and railway networkstraversing through KWS pose a threat to the sanc-tuary by destructing the wildlife corridor and for-est destruction makes previously inaccessible areasaccessible. Shorea robusta forests, which are sit-uated along the Indo-Nepal border, are exposedto higher levels of anthropogenic pressure due tothe ever-increasing human interference by resi-dents of Nepal. Forest corridor between Katerni-aghat wildlife sanctuary, India and adjoining Bar-dia national park, Nepal was destructed due tomajor deforestation undertaken by Nepal govern-ment during 1970s (figure 3b). For the purposeof revenue generation and to provide land areafor human settlements; Nepal government under-took massive forest felling. This has proved to bedestructive for the forested ecosystems situated inthe Indian region along the Nepal border. Checkposts set up by SFD on the traversing roads main-tain the records of vehicles passing through KWSand prevent smuggling and illegal transport oftimber wood and wildlife.
Katerniaghat WLS, Dudhwa national park, andKishanpur WLS are some of the important pro-tected areas (PAs) in the Terai landscape of UttarPradesh along the Indo-Nepal border. These areasface tremendous anthropogenic pressure from allsides of the boundary, which makes them vulner-able to human–wildlife conflicts (figure 4a and b).There is always an active interaction between pro-tected areas and landscapes surrounding them for
maintaining the flows of organisms, water, nutri-ents, and energy. There have been frequent attacksby wild animals on the livestock from the villagesin the proximity of PAs. Crops in the agriculturalfields situated in the surroundings of the PAs areoften destroyed by the herds of deer (Axis axis) andantelope (Boselaphus tragocamelus). Scientifically-based regional land use planning is needed tobalance human needs and conservation goals inthe larger landscape. Natural drivers of dynamicsinclude change of river course and floods, whichcause major devastation of the human settlements,agricultural lands, and forests. During the lastfew years, the floods have caused massive destruc-tion of the forests (Reuters India, September 23,2008, Asian News International, August 25, 2009,Times of India, September 22, 2010). Mid-riverinlands of the Girwa river have been the nest-ing place of alligators for long, which is affecteddue to expansion and flooding of the river chan-nel. Stone/tyre pitching, hard armoring, and bio-engineering could be implemented to cope withthe river bank erosion, which cuts the forest landevery year. Girwa river has affected KWS resultingin sedimentation in LSFs located along the riverbanks and has added to nutrient content of theecosystem, leading to increment in the net primaryproductivity of LSFs (Chitale et al. 2012). Ourstudy highlights present status of a diverse tropicalecosystem located along Himalayan foothills, whichindicates habitat loss due to natural and anthro-pogenic factors. Higher rates of forest dynamicsobserved during the long-term vegetation dynam-ics indicate the vulnerability of the ecosystemto the natural and anthropogenic disturbancesin the proximity of the sanctuary. High resolu-tion satellite datasets proved to be advantageousin precise vegetation classification, which couldbe utilized for mapping and monitoring of forestecosystems.
Acknowledgements
The present study is carried out under theCSIR network project in collaboration with NBRI,Lucknow. The authors are thankful to the financialsupport provided by CSIR, Dr C S Nautiyal,Director, NBRI and S K Behera, Scientist, NBRIfor their kind support and encouragement. TheLandsat MSS satellite datasets downloaded fromUSGS are thankfully acknowledged. They arethankful to ICIMOD, Nepal for the facilities pro-vided during the final phase of the manuscript.The authors are also thankful to two anonymousreviewers for their valuable comments on the earlierversion of the manuscript.
1478 V S Chitale and M D Behera
References
Anonymous 2005 Management Plan of the KaterniaghatWildlife Sanctuary 2005–2015; Uttar Pradesh ForestDepartment, Lucknow.
Asian News International, August 25, 2009.Asthana B N and Bhargava A N 1981 Dominant discharge
for alluvial rivers; Irr. Power J. 38 65–68.Attiwill P M 1994 The disturbance of forest ecosystems:
The ecological basis for conservative management; ForestEcol. Manag. 63(2–3) 247–500.
Cannon C H, Peart D R, Leighton M and KartawinataK 1994 The structure of lowland rainforest after selec-tive logging in West Kalimantan, Indonesia; Forest Ecol.Manag. 67 49–68.
Champion H G and Seth S K 1968 Revised survey of foresttypes of India; Manager of Publications; Government ofIndia, Delhi.
Chitale V S, Tripathi P, Behera M D, Behera S K and TuliR 2012 On the relationships among diversity, produc-tivity and climate from an Indian tropical ecosystem: Apreliminary investigation; Biodivers. Conserv. 21 1177–1197.
Clark D B 1992 The role of disturbance in the regenerationof neotropical moist forests; In: Reproductive Ecology ofTropical Forest Plants (eds) Bawa K S and Hadley M,UNESCO-Parthenon, New York, Man and the BiosphereSeries 7 291–315.
DeFries R, Hansen A J, Newton A C and Hansen M C 2005Increasing isolation of protected areas in tropical forestsover the past twenty years; Ecol. Appl. 15 19–26.
Dirzo R and Raven P H 2003 Global state of biodiversityand loss; Ann. Rev. Environ. Resour. 28 137–167.
Dormann C F 2007 Effects of incorporating spatial auto-correlation into the analysis of species distribution data;Global Eco. Biogeogr. 16 129–138.
Ewel J, Berish C, Brown B, Price N and Raich J 1981Slash-and-burn impacts on a Costa Rican wet forest site;Ecology 62 816–829.
Foody G M and Cutler M E J 2003 Tree biodiversity inprotected and logged Bornean tropical rain forests and itsmeasurement by satellite remote sensing; J. Biogeogr. 301053–1066.
Gupta O P and Shukla R P 1991 The composition anddynamics of associated plant communities of sal planta-tions; Tropical Ecol. 32 296–309.
Hernandez-Stefanoni J L and Dupny J M 2007 Mappingspecies density of trees, shrubs and vines in a tropicalforest, using field measurements, satellite multispectralimagery and spatial interpolation; Biodivers. Conserv. 163817–3833.
Horn R and Hickey J 1991 Ecological sensitivity of Aus-tralian rainforests to selective logging; Aust. J. Ecol. 16119–129.
Jain V and Sinha R 2003 Geomorphic manifestation of theflood hazard: A remote sensing based approach; GeocartoInt. 184 51–60.
Johnsingh A J T, Ramesh K, Qureshi Q, David A, Goyal SP, Rawat G S, Rajapandian K and Prasad S 2004 Conser-vation status of tiger and associated species in the TeraiArc Landscape, India, RR-04/001, Wildlife Institute ofIndia, Dehradun, pp. viii + 110.
Kale V S 1998 Monsoon floods in India: A hydro-geomorphicperspective; In: Flood Studies in India (ed.) Kale V S,Geol. Soc. India Memoir 41 229–256.
Kappelle M, Geuze T, Leal M E and Cleef A M 1996Successional age and forest structure in a Costa Ricanupper montane Quercus forest; J. Trop. Ecol. 12 681–698.
Kumari A and Tripathi K P 2007 Phytosociological studiesof the pteridophytes in Terai forest of North India; Ind.J. Forestry 30 445–450.
Legendre P 1993 Spatial autocorrelation: Trouble or newparadigm? Ecology 74 1659–1673.
Loarie S R, Joppa L N and Pimm S L 2007 Satellites missenvironmental priorities; Trends Ecol. Evol. 22 630–632.
Maliya S D 2007 Rare species of Katerniaghat Wild LifeSanctuary, District Bahraich, Uttar Pradesh, India; TheIndian Forester 133 1052–1056.
Maliya S D and Singh K K 2003 Some new or lessknown folk medicines of Bahraich district, Uttar Pradesh;Ethnobotany 15 132–135.
Notification 18th May, 2010, Ministry of Environmentand Forests, Government of India; http://moef.nic.in/downloads/public-information/Dolphins press n.pdf.
Nagendra H and Gadgil M 1999 Biodiversity assessment atmultiple scales: Linking remotely sensed data with fieldinformation; Proc. Natl. Acad. Sci. USA 96 9154–9158.
News paper The Hindu, Thursday, August 31, 2006, UttarPradesh.
Palmer M W, Earls P, Hoagland B W, White P S andWohlgemuth T 2002 Quantitative tools for perfectingspecies lists; Environmetrics 13 121–137.
Pandey S K 2000 Population status and regeneration strat-egy of some perennial legumes in plantation forestsof north-eastern Uttar Pradesh; Ph.D. Thesis, DDUGorakhpur University, Gorakhpur, India.
Pandey S K and Shukla R P 1999 Plant diversity and com-munity patterns along the disturbance gradient in plan-tation forests of sal Shorea robusta Gaertn. f; Curr. Sci.77 814–818.
Pandey S K and Shukla R P 2001 Regeneration strategy andplant diversity status in degraded sal forests; Curr. Sci.81 95–102.
Panigrahi G, Singh A N and Misra O P 1969 Contributionto the Botany of the Terai Forest of the Bahraich Districtof Uttar Pradesh; Bull. Bot. Surv. India 11 89–114.
Pavuluri M K, Ramanathan S and Daniel Z 2002 A rule-based classifier using classification and regression treeCART approach for urban landscape dynamics; Int.Geosci. Remote Sens. Symp. 2 24–28.
Pickett S T A and White P S 1985 The Ecology of NaturalDisturbance and Patch Dynamics; Academic Press, NewYork.
Read J M, Clark D B, Venticinque E M and Moreira M P2003 Application of 1-m and 4-m resolution satellite datato research and management in tropical forests; J. Appl.Ecol. 40 592–600.
Reuters India, September 23, 2008.Richardson W R and Thorne C R 2001 Multiple thread flow
and channel bifurcation in a braided river: Brahmaputra–Jamuna River, Bangladesh; Geomorphology 38 185–196.
Rocchini D, Chiarucci A and Loiselle S A 2004 Test-ing the spectral variation hypothesis by using satellitemultispectral images; Acta Oecologica. 26 117–120.
Rodgers W A and Sawarkar V B 1988 Vegetation manage-ment in wildlife protected areas in India; Aspects Appl.Biol. 16 407–422.
Sanchez-Azofeifa G A, Castro K L, Rivard B, Kalascka M Rand Harriss R C 2003 Remote sensing research prioritiesin tropical dry forest environments; Biotropica 35 134–142.
Scherer G, Zabowski D, Java B and Everett R 2000Timber harvesting residue treatment. Part II. Under-story vegetation response; Forest Ecol. Manag. 12635–50.
Shankar U 2001 A case of high tree diversity in a sal Shorearobusta-dominated lowland forest of Eastern Himalaya:
Land and vegetation cover dynamics in Katerniaghat wildlife sanctuary 1479
Floristic composition, regeneration and conservation;Curr. Sci. 81 776–786.
Sheil D 1999 Tropical forest diversity, environmental changeand species augmentation: After the intermediate distur-bance hypothesis; J. Vegetation Sci. 10 851–860.
Simard M, Saatchi S and De Grandi F 2000 The use ofdecision tree and multiscale texture for classification ofJERS-1 SAR data over tropical forest; IEEE Trans.Geosci. Remote Sens. 38 2310–2321.
Singh A, Reddy V S and Singh J S 1995 Analysis of woodyvegetation of Corbett National Park, India; Vegetatio 12069–79.
Sinha R and Friend P F 1994 River systems and their sed-iment flux, Indo-Gangetic plains, northern Bihar, India;Sedimentology 41 825–845.
Small C 2004 The Landsat ETM+ spectral mixing space;Remote Sens. Environ. 93 1–17.
Smiet A C 1992 Forest ecology on Java: Human impact andvegetation on montane forest; J. Trop. Ecol. 8 129–152.
Times of India, September 22, 2010.Tripathi K P 2001 Ecology of a Rehabilitated Forest on Sodic
Wasteland ; Ph.D. Thesis, Lucknow University, Lucknow.
Tripathi K P and Singh B 2005 The role of revegetation forrehabilitation of sodic soils in semiarid subtropical forest,India; Restoration Ecol. 13 29–38.
Tripathi K P and Singh B 2009 Species diversity and vegeta-tion structure across various strata in natural and planta-tion forests in Katerniaghat Wildlife Sanctuary; TropicalEcol. 501 191–200.
Turner W, Spector S, Gardiner N, Fladeland M, SterlingE and Steininger M 2003 Remote sensing for biodi-versity science and conservation; Trends Ecol. Evol. 18306–314.
Veblen T 1978 Forest preservation in the highlands ofGuatemala; Geogr. Rev. 68 417–434.
Wagner H H 2003 Spatial covariance in plant communities:Integrating ordination, geostatistics, and variance testing;Ecology 84 1045–1057.
Wright S J 2005 Tropical forests in a changing environment;Trends Ecol. Evol. 20 553–560.
Wulder M A, Franklin S E, White J, Cranny M and DechkaJ 2004 Inclusion of topographic attributes in an unsu-pervised classification of satellite imagery; Canadian J.Remote Sens. 30 137–149.
MS received 13 December 2013; revised 15 May 2014; accepted 17 June 2014


