Embed Size (px)
Citation preview
Citation: Letha, S.S.; Bollen, M.H.J.;
Rönnberg, S.K. Analysis and
Recommendations for LED
Catastrophic Failure Due to Voltage
Stress. Energies 2022, 15, 540.
https://doi.org/10.3390/
en15020540
Academic Editors: Antonio
Peña-García and Li Qin
Received: 20 November 2021
Accepted: 8 January 2022
Published: 12 January 2022
Publisher’s Note: MDPI stays neutral
with regard to jurisdictional claims in
published maps and institutional affil-
iations.
Copyright: © 2022 by the authors.
Licensee MDPI, Basel, Switzerland.
This article is an open access article
distributed under the terms and
conditions of the Creative Commons
Attribution (CC BY) license (https://
creativecommons.org/licenses/by/
4.0/).
energies
Article
Analysis and Recommendations for LED Catastrophic FailureDue to Voltage StressShimi Sudha Letha 1,2,* , Math H. J. Bollen 1 and Sarah K. Rönnberg 1
1 Department of Engineering Sciences and Mathematics, Luleå University of Technology,93177 Skellefteå, Sweden; [email protected] (M.H.J.B.); [email protected] (S.K.R.)
2 Electrical Engineering Department, National Institute of Technical Teachers Training and Research,Chandigarh 160019, India
* Correspondence: [email protected]
Abstract: Light-emitting diode (LED) lighting has, compared to other types of lighting, a significantlylower energy consumption. However, the perceived service life is also important for customersatisfaction and here there is a discrepancy between customers’ experience and manufacturers’statements. Many customers experience a significantly shorter service life than claimed by themanufacturers. An experiment was carried out in the Pehr Högström Laboratory at Luleå Universityof Technology in Skellefteå, Sweden to investigate whether voltage disturbances could explain thisdiscrepancy. Over 1000 LED lamps were exposed to high levels of voltage disturbances for morethan 6000 h; the failure rate from this experiment was similar to the one from previous experimentsin which lamps were exposed to normal voltage. The discrepancy thus remains, even though somepossible explanations have emerged from the project’s results. The lamps were exposed to fivedifferent types of voltage disturbances: short interruptions; transients; overvoltage; undervoltage;and harmonics. Only overvoltage resulted in failure of the lamps, and only for a single topologyof lamp. A detailed analysis has been made of the topology of lamps that failed. This lamp typecontains a different internal electronics circuit than the other lamp types. Failures of the lamps whenexposed to overvoltage are due to the heat development in the control circuit increasing sharplywhen the lamps are exposed to a higher voltage. Hence, it is concluded that there are lamps that aresignificantly more sensitive to voltage disturbances than other lamp types. Manufactures need toconsider the voltage quality that can be expected at the terminal of the lamp to prevent failure oflamps due to voltage disturbances. This paper therefore contains recommendations for manufacturersof lighting; the recommendations describe which voltage disturbances lamps should cope with.
Keywords: catastrophic failure; LED lamps; power quality; voltage disturbances; filament lamp; heatsink type lamp
1. Introduction
Reliability and lifetime of energy-efficient lighting are important features to meet thegoals set to save electricity. If both the reliability and the lifetime are too low, the energyrequired for the production of the lamps may exceed the energy gain that the use itselfentails. Another important factor to consider is that the reputation of energy-efficientlighting has to be maintained for it to reach a wide spread among the consumers. A lowenergy consumption is not enough for customers to be satisfied. It is important that thelifetime specified by the manufacturer can be achieved for customer satisfaction. Otherwise,the type of lighting can easily get a bad reputation and it can be more difficult to achievethe energy-saving goals. During the tests of lighting performance performed today, awell-defined and constant voltage with small distortion (small deviations from an idealvoltage) is used, which is not what the lighting is exposed to in reality.
In [1,2], the authors have estimated the thermal stress of key components of LEDlamps using a new thermal coupling model. In a degradation data-driven method the
Energies 2022, 15, 540. https://doi.org/10.3390/en15020540 https://www.mdpi.com/journal/energies
Energies 2022, 15, 540 2 of 18
degradation pattern was analyzed by the lumen maintenance data to determine the lifetimeof an LED [3]. A non-accelerated 20,000-h aging test based on lumen degradation andcolor shift was performed to explore the error in a 6000-h test [4]. An advanced lifetimeprediction method was proposed in [5] which considered the field operation missionprofile and statistical properties of the life data from accelerated degradation testing. In [6],a hybrid numerical approach based junction temperature analysis for LED luminousflux lifetime prediction was performed. In [7], the Bayesian method was proposed toestimate the lifetime gathering lumen degradation data. This technique showed betterprediction accuracy compared to the nonlinear squares (NLS) method. A latest research onlifetime prediction has used single accelerated degradation test (ADT) and electrothermalinteraction (ETI) multiplication factor to predict lifetime. This method involves junctiontemperature estimation and determination of lumen output reduction [8]. In [9], the authorsdiscussed the colour shift of N-based luminaires and the reason is dominated by the Agmirror tarnish of the LED package, blue chip and phosphor-based degradation. The resultsidentify that LED physics and device packaging also play a significant role in reliabilitystudy. In [10], an accelerated degradation test was performed, such as lumen maintenance,deep ultraviolet (Duv), capacitance, and equivalent series resistance (ESR) were estimated,and reliability was analyzed. The article [11] focuses on the spatial distribution uniformityof luminous intensity. In [12], the effectiveness of the Eyring model as a lumen maintenancelife prediction model for thermal-electrical operating conditions was investigated. Thestep-stress temperature accelerated aging test was performed in [13]. The estimation errorsof the accelerated lifetimes by the traditional method were in a range from 12.8% to 18.6%under the aging temperature of 80 C and from 12.5% to 20.3% under the aging temperatureof 70 C for the seven samples. The estimation accuracy of the decay rates and acceleratedlifetimes of LED lamps were improved using the step-stress accelerated aging test. Manyarticles have discussed different factors such as thermal stress and mechanical stress forLED failure, but very few articles have discussed the electrical stress.
The nominal lifetime specified by the manufacturer is a statistical estimate of how longa lamp will work as intended. The actual lifetime is affected by design, material selection,component selection, the manufacturing process, and the environment (including electricalenvironment) in which it is placed. In particular, the electrical environment is somethingthat the manufacturer cannot control. The single value specified by the manufacturer forthe service life must therefore only be seen as a general performance index where manyother parameters may affect the actual outcome.
Failures of lighting can manifest themselves in several different ways and some are:
â Reduction in luminous flux. Here a certain limit is often set, e.g., “median useful life”has been introduced in international electrotechnical commission (IEC) 62,717 where50% of the population has decreased to example L80, 80% luminous flux [14];
â Reduced light due to partial catastrophic failure. This is measured in the same way asabove, but the error is due to one or more components in the electronics failing;
â Completely absent light (catastrophic failure). This can be due to either the LEDmodule or the driver circuit completely ceasing to function.
It has been found that more than half of all faults that occur on LED lighting are relatedto the drivers, 10% to the LED unit [15]. The design and component selection of the driverscan differ considerably between different types of lighting equipment, but both the driversand the LED unit have the same properties during their lifetime.
The voltage used to perform standard aging tests has a constant amplitude andlow distortion, total harmonic distortion (THD) should be less than 3%. Such detaileddefinitions of tests are common in testing standards. The harmonics limit for lamps testsare given in [16]. The reason for this is that the tests must be reproducible and independentof deviations between different test facilities. The disadvantage, however, is that certainphenomena are not included in the assessment.
The voltage in a standard test does not have to be the same as in reality, but two im-portant conditions must be met:
Energies 2022, 15, 540 3 of 18
• A lamp that has a short lifetime according to the standard test should have, with highprobability, a short lifetime under real conditions;
• A lamp that has a long lifetime according to the standard test should have, with highprobability, a long lifetime under real conditions.
It is the second condition that may not be met because the amplitude and waveformof the voltage is idealized in the standard test. The first condition will still be met.
The supply voltage deviations from the ideal voltage in a number of ways, so-calledvoltage disturbances. Some of these are defined in standards and are studied in detail in theliterature, where a lot of information about them can be found [17,18]. Examples of thesedisturbances are voltage variations (including undervoltage and overvoltage); voltage dips(short-duration, up to a few seconds, reduction in voltage magnitude), and waveformdistortion. Immunity tests exists for short-term high distortion levels (such as IEC 61000-4-13 [19] for waveform distortion) or for individual events (such as IEC 61000-4-11 [20]for voltage dips). However, there are no standard tests to assess the device’s immunity toprolonged high levels of voltage disturbances or to repeated events. An attempt by theinstitute of electrical and electronic engineers (IEEE) to create an informal list of levels ofvoltage disturbances against which a customer-friendly equipment manufacturer wouldtest its products unfortunately did not go beyond the idea stage. A checklist for voltagedips has been proposed by an international working group in 2010 [21], but even here itis unclear whether it is used by equipment manufacturers. Getting the message across tothose who design and build appliances (whether those are large drive systems or smallLED lights) remains a major challenge.
An overview of voltage disturbances to which low-voltage equipment is exposedis given in [22]. The overview is intended as a recommendation for manufacturers ofsmall appliances connected to the low-voltage network. Recommendations in [22] can beapplied directly to lighting equipment. The overview deals with some well-known typesof disturbances (e.g., those mentioned above), but some new types of disturbances are alsointroduced, such as supraharmonics and medium-fast voltage variations [23,24].
The impact and potential problems on LED lamps caused by voltage variations suchas rapid voltage changes, voltage steps, undervoltage and overvoltage due to photovoltaics(PV) or electric vehicle (EV) operation in a low-voltage network are studied in [25].
Several studies performed through the years have shown that the distortion of voltagecan differ considerably between different locations. The voltage distortion at a specificlocation depends on what electrical equipment is connected and on the impedances in thenetwork. This is expected to affect the reliability and lifetime of the lamps as well, butto what extent is unknown. If there were a strong impact, it would mean that the samelighting would age at different speeds in different places, but no information on that isavailable either. When it comes to waveform distortion in particular, it can be assumedthat primarily it is the drivers and their components that are affected to the greatest extentbecause these are electrically closest to the network.
The same reasoning also applies to the amplitude of the voltage: It also varies a lotbetween different connection points, and it can affect the service life of the lighting. Theeffect of the amplitude of the voltage on the life of incandescent lamps is well known, butfor electronics-based lighting, such a relationship has not (yet) emerged.
Repeated events could also reduce the lifetime of lighting equipment. Possible exam-ples are voltage dips, short-term voltage increases or switching transients that often occurat a certain point in the network. Overvoltage transients due to lighting strokes typicallylead to damaged appliances, including lighting.
2. Description of the Experiment
A group of 1080 LED lamps was exposed to different voltages for 6618 h. The LEDlamps were divided into six equally sized groups, each consisting of four different types ofLED lamps. Each group was subjected to a different voltage profile during the duration of
Energies 2022, 15, 540 4 of 18
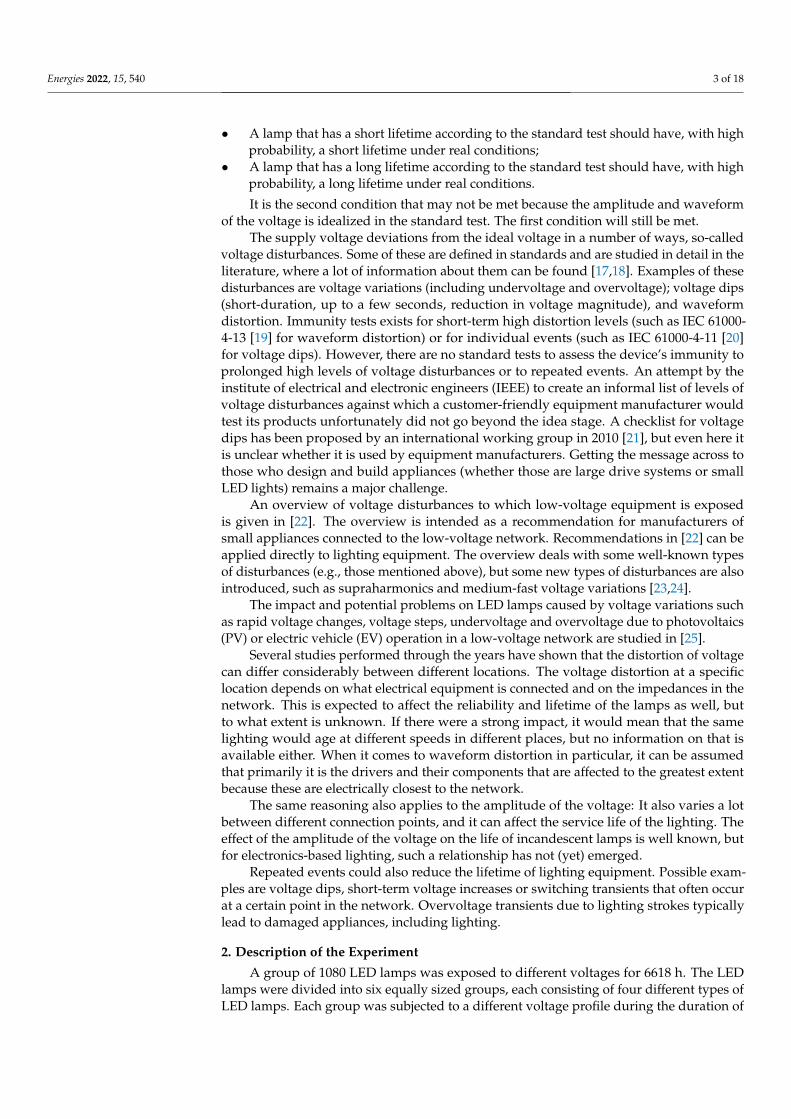
the experiment as shown in Figure 1b. The lamps are shown in Figure 1. The four lamptypes are described in Section 2.1; the six groups are described in Section 2.2.
Energies 2022, 15, x FOR PEER REVIEW 4 of 20
2. Description of the Experiment A group of 1080 LED lamps was exposed to different voltages for 6618 h. The LED
lamps were divided into six equally sized groups, each consisting of four different types of LED lamps. Each group was subjected to a different voltage profile during the duration of the experiment as shown in Figure 1b. The lamps are shown in Figure 1. The four lamp types are described in Section 2.1; the six groups are described in Section 2.2.
(a) (b)
Figure 1. (a) One thousand and eighty lamps mounted on wooden boards hanging from the ceiling in the Pehr Högström laboratory at Luleå University of Technology in Skellefteå, Sweden. (b) Single line diagram.
Since the luminaires/fixtures are of different shapes and sizes, standardizing the re-sult was not possible. The results for naked unshielded lamps can be used further for standardizing any lamp, taking into account the heat dissipation factor. Hence, lamp fix-tures were not included in this study.
2.1. Types of Lamps All lamps were LED-based and had a power between 4, 5, and 6 W, mounted on an
E27 socket. All were of well-known brands, designed for the European market with 230 V, 50 Hz supply voltage, and were intended to be a direct replacement for an incandescent light bulb.
The price ranged from lamps that were primarily intended for domestic applications, sold to customers at very competitive prices, up to lamps intended for use in offices, shops, etc.
Three of the four lamps tested were of the topology with heatsink. These are built with one or more LED chips soldered to the surface of a circuit board, often of the insu-lated metal substrate (IMS) type. The IMS circuit boards are designed for thermal handling of electronic components; those components are built on an aluminum holder for good thermal conductivity. This circuit board is then mounted on a heat-conducting base that acts as a heat sink.
The second type of lamp that was tested was designed with LED filament strips, where small LEDs are connected in series on a transparent surface in the form of a filament to mimic a light bulb.
The following four types of lamps detailed in Table 1 were selected; information on manufacturer is not disclosed.
Figure 1. (a) One thousand and eighty lamps mounted on wooden boards hanging from the ceilingin the Pehr Högström laboratory at Luleå University of Technology in Skellefteå, Sweden. (b) Singleline diagram.
Since the luminaires/fixtures are of different shapes and sizes, standardizing theresult was not possible. The results for naked unshielded lamps can be used further forstandardizing any lamp, taking into account the heat dissipation factor. Hence, lampfixtures were not included in this study.
2.1. Types of Lamps
All lamps were LED-based and had a power between 4, 5, and 6 W, mounted on anE27 socket. All were of well-known brands, designed for the European market with 230 V,50 Hz supply voltage, and were intended to be a direct replacement for an incandescentlight bulb.
The price ranged from lamps that were primarily intended for domestic applications,sold to customers at very competitive prices, up to lamps intended for use in offices,shops, etc.
Three of the four lamps tested were of the topology with heatsink. These are builtwith one or more LED chips soldered to the surface of a circuit board, often of the insulatedmetal substrate (IMS) type. The IMS circuit boards are designed for thermal handlingof electronic components; those components are built on an aluminum holder for goodthermal conductivity. This circuit board is then mounted on a heat-conducting base thatacts as a heat sink.
The second type of lamp that was tested was designed with LED filament strips, wheresmall LEDs are connected in series on a transparent surface in the form of a filament tomimic a light bulb.
The following four types of lamps detailed in Table 1 were selected; information onmanufacturer is not disclosed.
Energies 2022, 15, 540 5 of 18
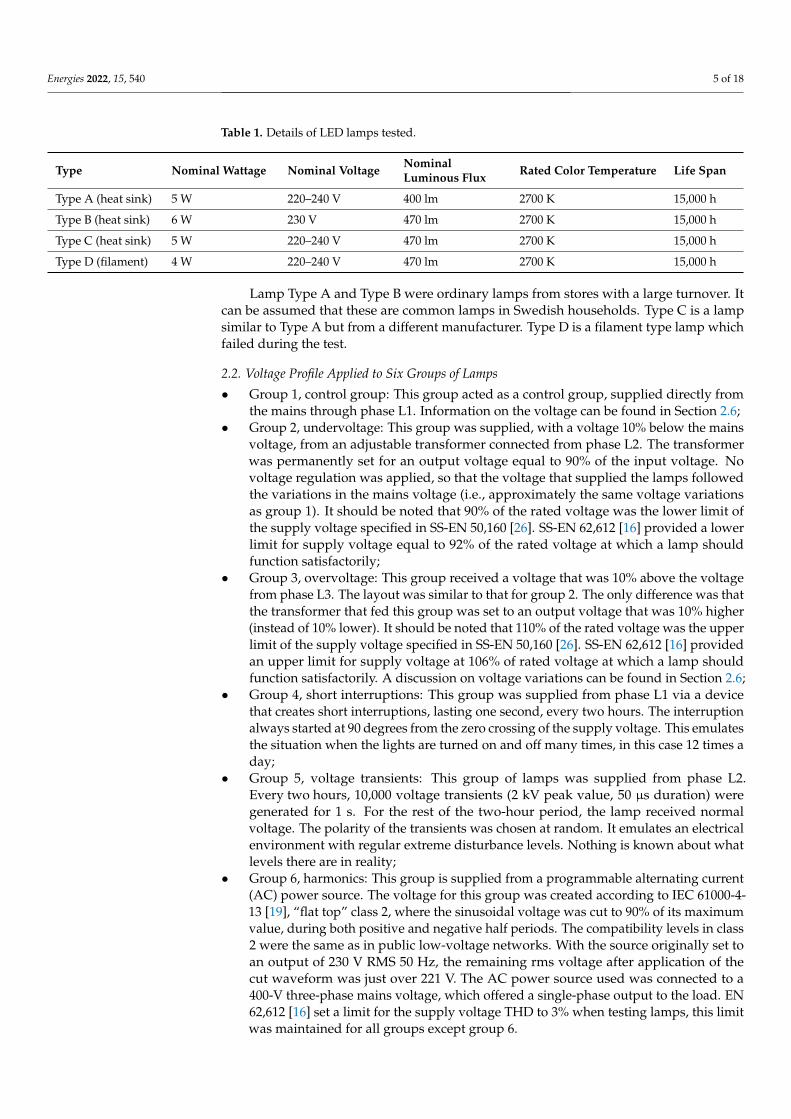
Table 1. Details of LED lamps tested.
Type Nominal Wattage Nominal Voltage NominalLuminous Flux Rated Color Temperature Life Span
Type A (heat sink) 5 W 220–240 V 400 lm 2700 K 15,000 h
Type B (heat sink) 6 W 230 V 470 lm 2700 K 15,000 h
Type C (heat sink) 5 W 220–240 V 470 lm 2700 K 15,000 h
Type D (filament) 4 W 220–240 V 470 lm 2700 K 15,000 h
Lamp Type A and Type B were ordinary lamps from stores with a large turnover. Itcan be assumed that these are common lamps in Swedish households. Type C is a lampsimilar to Type A but from a different manufacturer. Type D is a filament type lamp whichfailed during the test.
2.2. Voltage Profile Applied to Six Groups of Lamps
• Group 1, control group: This group acted as a control group, supplied directly fromthe mains through phase L1. Information on the voltage can be found in Section 2.6;
• Group 2, undervoltage: This group was supplied, with a voltage 10% below the mainsvoltage, from an adjustable transformer connected from phase L2. The transformerwas permanently set for an output voltage equal to 90% of the input voltage. Novoltage regulation was applied, so that the voltage that supplied the lamps followedthe variations in the mains voltage (i.e., approximately the same voltage variationsas group 1). It should be noted that 90% of the rated voltage was the lower limit ofthe supply voltage specified in SS-EN 50,160 [26]. SS-EN 62,612 [16] provided a lowerlimit for supply voltage equal to 92% of the rated voltage at which a lamp shouldfunction satisfactorily;
• Group 3, overvoltage: This group received a voltage that was 10% above the voltagefrom phase L3. The layout was similar to that for group 2. The only difference was thatthe transformer that fed this group was set to an output voltage that was 10% higher(instead of 10% lower). It should be noted that 110% of the rated voltage was the upperlimit of the supply voltage specified in SS-EN 50,160 [26]. SS-EN 62,612 [16] providedan upper limit for supply voltage at 106% of rated voltage at which a lamp shouldfunction satisfactorily. A discussion on voltage variations can be found in Section 2.6;
• Group 4, short interruptions: This group was supplied from phase L1 via a devicethat creates short interruptions, lasting one second, every two hours. The interruptionalways started at 90 degrees from the zero crossing of the supply voltage. This emulatesthe situation when the lights are turned on and off many times, in this case 12 times aday;
• Group 5, voltage transients: This group of lamps was supplied from phase L2.Every two hours, 10,000 voltage transients (2 kV peak value, 50 µs duration) weregenerated for 1 s. For the rest of the two-hour period, the lamp received normalvoltage. The polarity of the transients was chosen at random. It emulates an electricalenvironment with regular extreme disturbance levels. Nothing is known about whatlevels there are in reality;
• Group 6, harmonics: This group is supplied from a programmable alternating current(AC) power source. The voltage for this group was created according to IEC 61000-4-13 [19], “flat top” class 2, where the sinusoidal voltage was cut to 90% of its maximumvalue, during both positive and negative half periods. The compatibility levels in class2 were the same as in public low-voltage networks. With the source originally set toan output of 230 V RMS 50 Hz, the remaining rms voltage after application of thecut waveform was just over 221 V. The AC power source used was connected to a400-V three-phase mains voltage, which offered a single-phase output to the load. EN62,612 [16] set a limit for the supply voltage THD to 3% when testing lamps, this limitwas maintained for all groups except group 6.
Energies 2022, 15, 540 6 of 18
2.3. Test Period
The experiment started on 14 January 2020 and ended on 18 March 2021. The experi-ment was temporarily stopped for about two months during the summer of 2020. All thelamps were exposed to the same temperature of around 20 degrees, so that this would notimpact the difference in behavior between the different groups. The total time that thelamps were on was 6618 h.
2.4. Electricity Supply to the Experiment
The experiment was fed from a mains connection with a single-phase source impedanceof 230 mΩ. Each group of 90 lamps was fed with a 20- to 25-m cable with 1.5-mm2 conductor.This cable had a resistance of approximately 325 mΩ.
The total current (three-phase) of 1080 lamps (5 W each) was 7.8 A per phase. Thevoltage drop across the source impedance then became around 1.8 V.
The current (three-phase) to 90 lamps was 0.65 A per phase, which provided a voltagedrop over the conductor to the lamps of approximately 0.2 V.
2.5. Description of the Experiment
For control and handling, a programmable logic control unit (PLC) measured thecurrent supplied to each wooden board and the ambient temperature, in order to be able toturn off groups in the event of a fault. The PLC unit also drove the groups up and downsequentially when there was a need to pause the experiment. With a connection to themonitoring system and the fire alarm in the building, the control unit was also able toswitch off the entire experiment directly if any of the smoke detectors in the room woulddetect smoke. The controller could also send text messages if an event occurred; via its webserver the state of the experiment could be monitored remotely.
In order to perform an experiment of this size, 12 wooden boards were mounted justbelow the ceiling with lamps hanging from the boards at different heights to minimizethe heat transfer between them, as shown in Figure 1. Although precautions were takento minimize ambient temperature, the lamps were occasionally exposed to higher tem-peratures (1 to 2 degree) than those defined as test conditions for lighting equipment inIEC 61000-3-2 [27]. Two boards formed a group of lamps and there were 180 lamps ineach group. All six groups had lamps of four different types, 45 lamps of the same type ineach group. All groups had the same set of lamps, resulting in 1080 lamps. The lamps thatunderwent catastrophic failure during the experiment were not replaced by new ones.
2.6. Voltage Variations
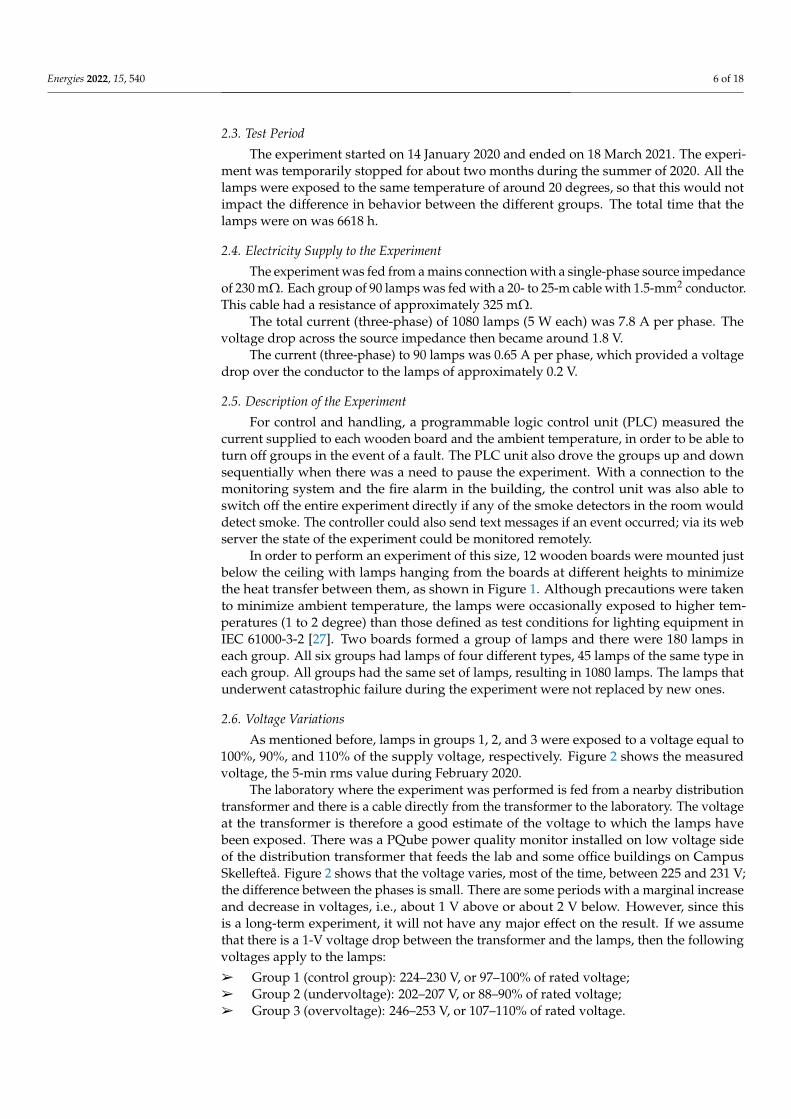
As mentioned before, lamps in groups 1, 2, and 3 were exposed to a voltage equal to100%, 90%, and 110% of the supply voltage, respectively. Figure 2 shows the measuredvoltage, the 5-min rms value during February 2020.
The laboratory where the experiment was performed is fed from a nearby distributiontransformer and there is a cable directly from the transformer to the laboratory. The voltageat the transformer is therefore a good estimate of the voltage to which the lamps havebeen exposed. There was a PQube power quality monitor installed on low voltage sideof the distribution transformer that feeds the lab and some office buildings on CampusSkellefteå. Figure 2 shows that the voltage varies, most of the time, between 225 and 231 V;the difference between the phases is small. There are some periods with a marginal increaseand decrease in voltages, i.e., about 1 V above or about 2 V below. However, since thisis a long-term experiment, it will not have any major effect on the result. If we assumethat there is a 1-V voltage drop between the transformer and the lamps, then the followingvoltages apply to the lamps:
â Group 1 (control group): 224–230 V, or 97–100% of rated voltage;â Group 2 (undervoltage): 202–207 V, or 88–90% of rated voltage;â Group 3 (overvoltage): 246–253 V, or 107–110% of rated voltage.
Energies 2022, 15, 540 7 of 18
Energies 2022, 15, x FOR PEER REVIEW 7 of 20
Figure 2. Voltage with the distribution transformer that supplies the laboratory, February 2020.
The laboratory where the experiment was performed is fed from a nearby distribu-tion transformer and there is a cable directly from the transformer to the laboratory. The voltage at the transformer is therefore a good estimate of the voltage to which the lamps have been exposed. There was a PQube power quality monitor installed on low voltage side of the distribution transformer that feeds the lab and some office buildings on Cam-pus Skellefteå. Figure 2 shows that the voltage varies, most of the time, between 225 and 231 V; the difference between the phases is small. There are some periods with a marginal increase and decrease in voltages, i.e., about 1 V above or about 2 V below. However, since this is a long-term experiment, it will not have any major effect on the result. If we assume that there is a 1-V voltage drop between the transformer and the lamps, then the following voltages apply to the lamps: Group 1 (control group): 224–230 V, or 97–100% of rated voltage; Group 2 (undervoltage): 202–207 V, or 88–90% of rated voltage; Group 3 (overvoltage): 246–253 V, or 107–110% of rated voltage.
Voltage measurements over a longer period, near the lamps, are shown in Figure 3. In this case, the rms value over a three-hour period is shown, for groups 1, 2, and 3. The results of the voltage to which the lamps were exposed were the same as the results of measurements with the distribution transformer. The measurements in Figure 3 also show that the voltages in the three phases (groups) followed each other.
Figure 2. Voltage with the distribution transformer that supplies the laboratory, February 2020.
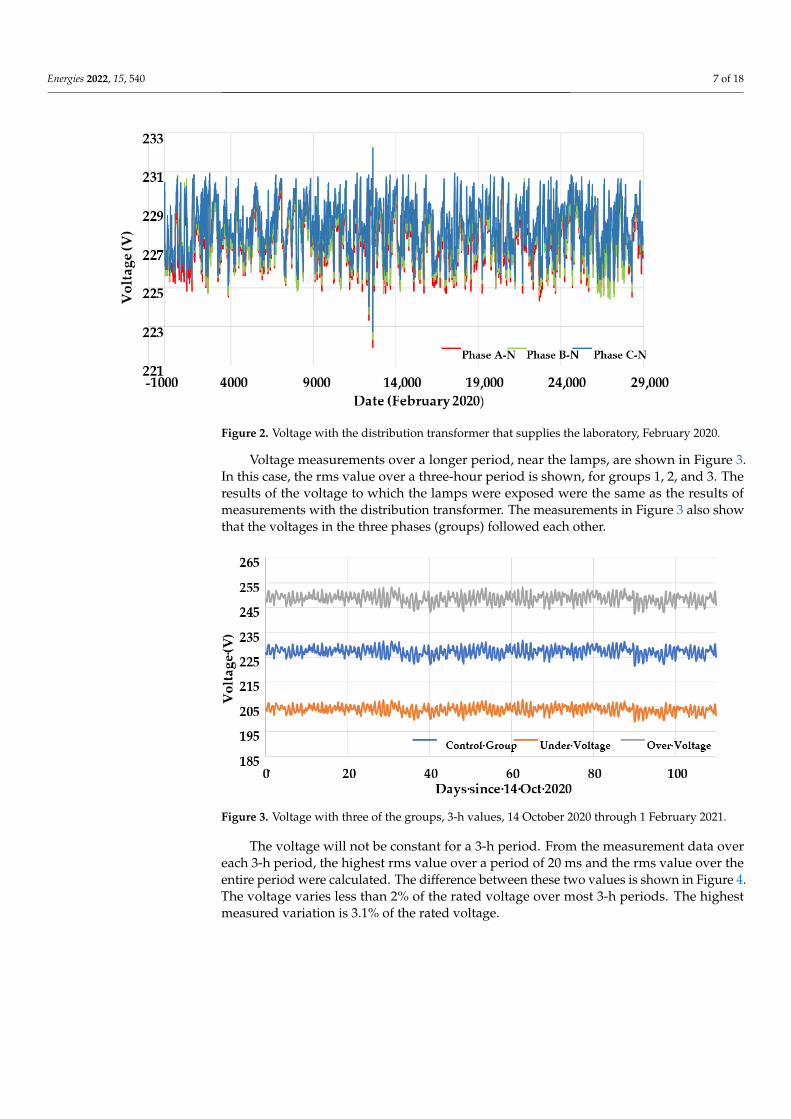
Voltage measurements over a longer period, near the lamps, are shown in Figure 3.In this case, the rms value over a three-hour period is shown, for groups 1, 2, and 3. Theresults of the voltage to which the lamps were exposed were the same as the results ofmeasurements with the distribution transformer. The measurements in Figure 3 also showthat the voltages in the three phases (groups) followed each other.
Energies 2022, 15, x FOR PEER REVIEW 8 of 20
Figure 3. Voltage with three of the groups, 3-h values, 14 October 2020 through 1 February 2021.
The voltage will not be constant for a 3-h period. From the measurement data over each 3-h period, the highest rms value over a period of 20 ms and the rms value over the entire period were calculated. The difference between these two values is shown in Figure 4. The voltage varies less than 2% of the rated voltage over most 3-h periods. The highest measured variation is 3.1% of the rated voltage.
Figure 4. Difference between the highest 1-cycle rms voltage and the 3-h rms voltage, for the group “overvoltage”.
2.7. Impact of Background Voltage on Current The current profile of the six groups of identical lamp were measured and is shown
in Figure 5. The group interruptions and transients current profile were similar to group 1, and hence not shown here.
Figure 3. Voltage with three of the groups, 3-h values, 14 October 2020 through 1 February 2021.
The voltage will not be constant for a 3-h period. From the measurement data overeach 3-h period, the highest rms value over a period of 20 ms and the rms value over theentire period were calculated. The difference between these two values is shown in Figure 4.The voltage varies less than 2% of the rated voltage over most 3-h periods. The highestmeasured variation is 3.1% of the rated voltage.
Energies 2022, 15, 540 8 of 18
Energies 2022, 15, x FOR PEER REVIEW 8 of 20
Figure 3. Voltage with three of the groups, 3-h values, 14 October 2020 through 1 February 2021.
The voltage will not be constant for a 3-h period. From the measurement data over each 3-h period, the highest rms value over a period of 20 ms and the rms value over the entire period were calculated. The difference between these two values is shown in Figure 4. The voltage varies less than 2% of the rated voltage over most 3-h periods. The highest measured variation is 3.1% of the rated voltage.
Figure 4. Difference between the highest 1-cycle rms voltage and the 3-h rms voltage, for the group “overvoltage”.
2.7. Impact of Background Voltage on Current The current profile of the six groups of identical lamp were measured and is shown
in Figure 5. The group interruptions and transients current profile were similar to group 1, and hence not shown here.
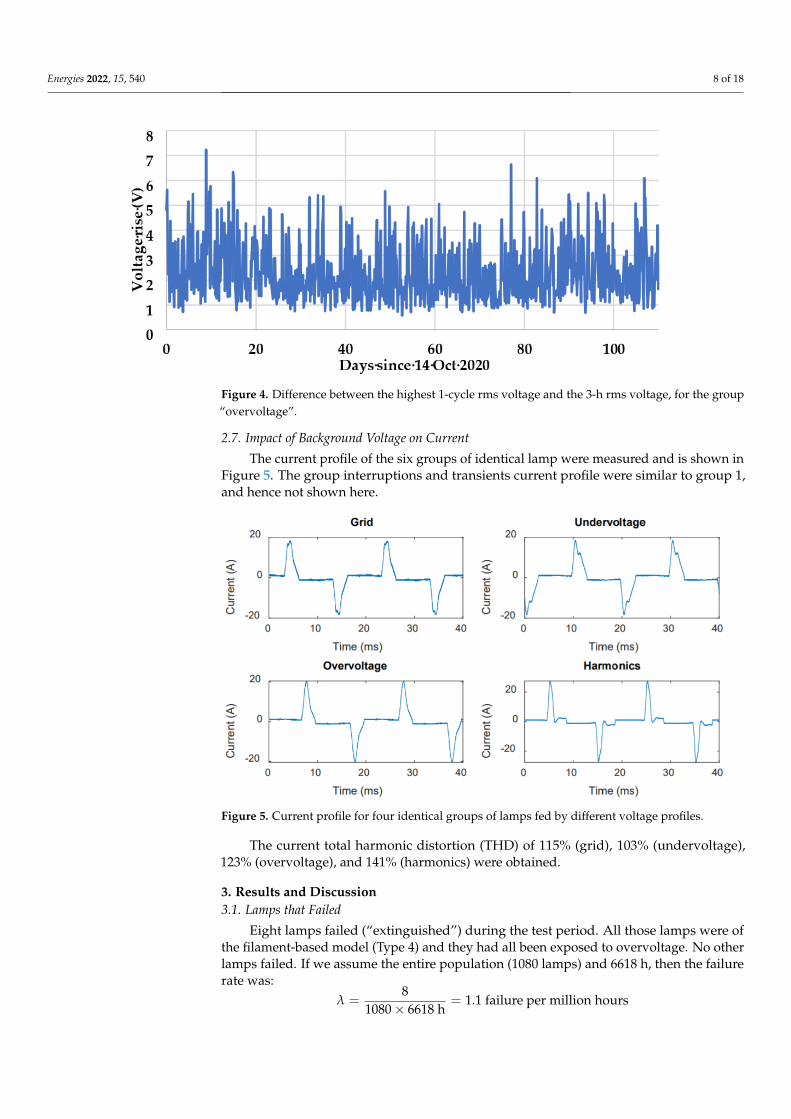
Figure 4. Difference between the highest 1-cycle rms voltage and the 3-h rms voltage, for the group“overvoltage”.
2.7. Impact of Background Voltage on Current
The current profile of the six groups of identical lamp were measured and is shown inFigure 5. The group interruptions and transients current profile were similar to group 1,and hence not shown here.
Energies 2022, 15, x FOR PEER REVIEW 9 of 20
Figure 5. Current profile for four identical groups of lamps fed by different voltage profiles.
The current total harmonic distortion (THD) of 115% (grid), 103% (undervoltage), 123% (overvoltage), and 141% (harmonics) were obtained.
3. Results and Discussion 3.1. Lamps that Failed
Eight lamps failed (“extinguished”) during the test period. All those lamps were of the filament-based model (Type 4) and they had all been exposed to overvoltage. No other lamps failed. If we assume the entire population (1080 lamps) and 6618 h, then the failure rate was: 𝜆 = 81080 × 6618 h = 1.1 failure per million hours
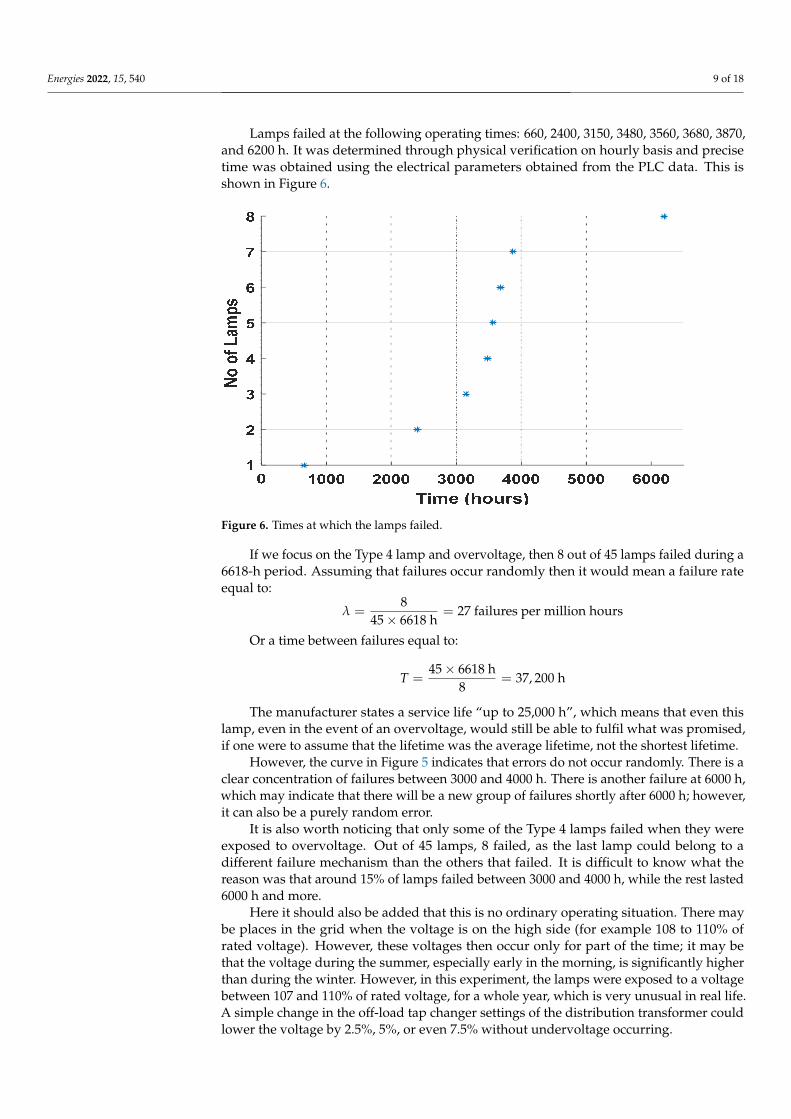
Lamps failed at the following operating times: 660, 2400, 3150, 3480, 3560, 3680, 3870, and 6200 h. It was determined through physical verification on hourly basis and precise time was obtained using the electrical parameters obtained from the PLC data. This is shown in Figure 6.
Figure 5. Current profile for four identical groups of lamps fed by different voltage profiles.
The current total harmonic distortion (THD) of 115% (grid), 103% (undervoltage),123% (overvoltage), and 141% (harmonics) were obtained.
3. Results and Discussion3.1. Lamps that Failed
Eight lamps failed (“extinguished”) during the test period. All those lamps were ofthe filament-based model (Type 4) and they had all been exposed to overvoltage. No otherlamps failed. If we assume the entire population (1080 lamps) and 6618 h, then the failurerate was:
λ =8
1080 × 6618 h= 1.1 failure per million hours
Energies 2022, 15, 540 9 of 18
Lamps failed at the following operating times: 660, 2400, 3150, 3480, 3560, 3680, 3870,and 6200 h. It was determined through physical verification on hourly basis and precisetime was obtained using the electrical parameters obtained from the PLC data. This isshown in Figure 6.
Energies 2022, 15, x FOR PEER REVIEW 9 of 20
Figure 5. Current profile for four identical groups of lamps fed by different voltage profiles.
The current total harmonic distortion (THD) of 115% (grid), 103% (undervoltage), 123% (overvoltage), and 141% (harmonics) were obtained.
3. Results and Discussion 3.1. Lamps that Failed
Eight lamps failed (“extinguished”) during the test period. All those lamps were of the filament-based model (Type 4) and they had all been exposed to overvoltage. No other lamps failed. If we assume the entire population (1080 lamps) and 6618 h, then the failure rate was: 𝜆 = 81080 × 6618 h = 1.1 failure per million hours
Lamps failed at the following operating times: 660, 2400, 3150, 3480, 3560, 3680, 3870, and 6200 h. It was determined through physical verification on hourly basis and precise time was obtained using the electrical parameters obtained from the PLC data. This is shown in Figure 6.
Figure 6. Times at which the lamps failed.
If we focus on the Type 4 lamp and overvoltage, then 8 out of 45 lamps failed during a6618-h period. Assuming that failures occur randomly then it would mean a failure rateequal to:
λ =8
45 × 6618 h= 27 failures per million hours
Or a time between failures equal to:
T =45 × 6618 h
8= 37, 200 h
The manufacturer states a service life “up to 25,000 h”, which means that even thislamp, even in the event of an overvoltage, would still be able to fulfil what was promised,if one were to assume that the lifetime was the average lifetime, not the shortest lifetime.
However, the curve in Figure 5 indicates that errors do not occur randomly. There is aclear concentration of failures between 3000 and 4000 h. There is another failure at 6000 h,which may indicate that there will be a new group of failures shortly after 6000 h; however,it can also be a purely random error.
It is also worth noticing that only some of the Type 4 lamps failed when they wereexposed to overvoltage. Out of 45 lamps, 8 failed, as the last lamp could belong to adifferent failure mechanism than the others that failed. It is difficult to know what thereason was that around 15% of lamps failed between 3000 and 4000 h, while the rest lasted6000 h and more.
Here it should also be added that this is no ordinary operating situation. There maybe places in the grid when the voltage is on the high side (for example 108 to 110% ofrated voltage). However, these voltages then occur only for part of the time; it may bethat the voltage during the summer, especially early in the morning, is significantly higherthan during the winter. However, in this experiment, the lamps were exposed to a voltagebetween 107 and 110% of rated voltage, for a whole year, which is very unusual in real life.A simple change in the off-load tap changer settings of the distribution transformer couldlower the voltage by 2.5%, 5%, or even 7.5% without undervoltage occurring.
Energies 2022, 15, 540 10 of 18
The lifetime distribution shown in Figure 5 should also be compared with the lifetimeof incandescent light bulbs, which was between 750 and 2000 h [28] for normal voltage;long-term exposure to voltage above the rated voltage led to a large reduction in lifetime.All but one of the LED lamps had a lifetime longer than 2000 h.
According to [29], the lifetime of incandescent lamps is inversely proportional with thevoltage to the power of 13. A voltage equal to 107% (the lowest value to which they wereexposed during the experiment), would then have reduced the lifetime to 1.07−13 = 42%of the life time at rated voltage; it would have a lifetime between 350 and 850 h, less thaneven the worst of the 1080 LED lights.
3.2. Detailed Analysis of the Failure Mechanism
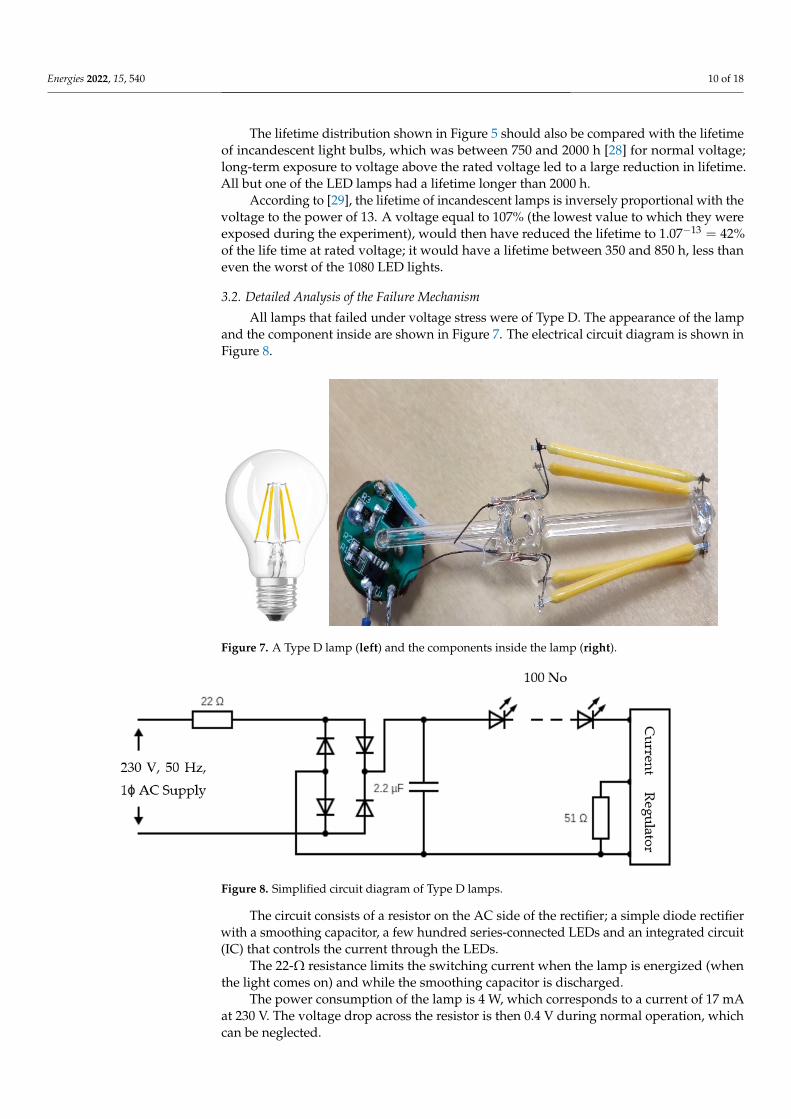
All lamps that failed under voltage stress were of Type D. The appearance of the lampand the component inside are shown in Figure 7. The electrical circuit diagram is shown inFigure 8.
Energies 2022, 15, x FOR PEER REVIEW 11 of 20
Figure 7. A Type D lamp (left) and the components inside the lamp (right).
Figure 8. Simplified circuit diagram of Type D lamps.
The circuit consists of a resistor on the AC side of the rectifier; a simple diode rectifier with a smoothing capacitor, a few hundred series-connected LEDs and an integrated cir-cuit (IC) that controls the current through the LEDs.
The 22-Ω resistance limits the switching current when the lamp is energized (when the light comes on) and while the smoothing capacitor is discharged.
The power consumption of the lamp is 4 W, which corresponds to a current of 17 mA at 230 V. The voltage drop across the resistor is then 0.4 V during normal operation, which can be neglected.
The goal of the smoothing capacitor is to limit variations in voltage on the direct cur-rent (DC) voltage side. Assuming a direct voltage equal to 300 V, and a discharge time equal to 8 ms, then the voltage variation becomes approximately: Δ𝑈𝑈 = 1300 V × 13.3 mA2.2 μF × 8 ms = 16%
which is something on the high side, but the current regulator integrated circuit (IC) keeps the current through the LEDs (and thus the luminous flux) constant.
Some detailed measurements were performed on a Type D lamp, in order to under-stand why this particular type of lamp was so affected by overvoltages. Some results are shown in Figure 9. The power was measured over a number of periods for two different voltages on the AC side: 230 (rated voltage) and 250 V (108.7% of rated voltage). The diode current and voltage ripple were calculated using Equations (1) and (2), respectively.
Figure 7. A Type D lamp (left) and the components inside the lamp (right).
Energies 2022, 15, x FOR PEER REVIEW 11 of 20
Figure 7. A Type D lamp (left) and the components inside the lamp (right).
Figure 8. Simplified circuit diagram of Type D lamps.
The circuit consists of a resistor on the AC side of the rectifier; a simple diode rectifier with a smoothing capacitor, a few hundred series-connected LEDs and an integrated cir-cuit (IC) that controls the current through the LEDs.
The 22-Ω resistance limits the switching current when the lamp is energized (when the light comes on) and while the smoothing capacitor is discharged.
The power consumption of the lamp is 4 W, which corresponds to a current of 17 mA at 230 V. The voltage drop across the resistor is then 0.4 V during normal operation, which can be neglected.
The goal of the smoothing capacitor is to limit variations in voltage on the direct cur-rent (DC) voltage side. Assuming a direct voltage equal to 300 V, and a discharge time equal to 8 ms, then the voltage variation becomes approximately: Δ𝑈𝑈 = 1300 V × 13.3 mA2.2 μF × 8 ms = 16%
which is something on the high side, but the current regulator integrated circuit (IC) keeps the current through the LEDs (and thus the luminous flux) constant.
Some detailed measurements were performed on a Type D lamp, in order to under-stand why this particular type of lamp was so affected by overvoltages. Some results are shown in Figure 9. The power was measured over a number of periods for two different voltages on the AC side: 230 (rated voltage) and 250 V (108.7% of rated voltage). The diode current and voltage ripple were calculated using Equations (1) and (2), respectively.
Figure 8. Simplified circuit diagram of Type D lamps.
The circuit consists of a resistor on the AC side of the rectifier; a simple diode rectifierwith a smoothing capacitor, a few hundred series-connected LEDs and an integrated circuit(IC) that controls the current through the LEDs.
The 22-Ω resistance limits the switching current when the lamp is energized (whenthe light comes on) and while the smoothing capacitor is discharged.
The power consumption of the lamp is 4 W, which corresponds to a current of 17 mAat 230 V. The voltage drop across the resistor is then 0.4 V during normal operation, whichcan be neglected.
Energies 2022, 15, 540 11 of 18
The goal of the smoothing capacitor is to limit variations in voltage on the directcurrent (DC) voltage side. Assuming a direct voltage equal to 300 V, and a discharge timeequal to 8 ms, then the voltage variation becomes approximately:
∆UU
=1
300 V× 13.3 mA
2.2 µF× 8 ms = 16%
which is something on the high side, but the current regulator integrated circuit (IC) keepsthe current through the LEDs (and thus the luminous flux) constant.
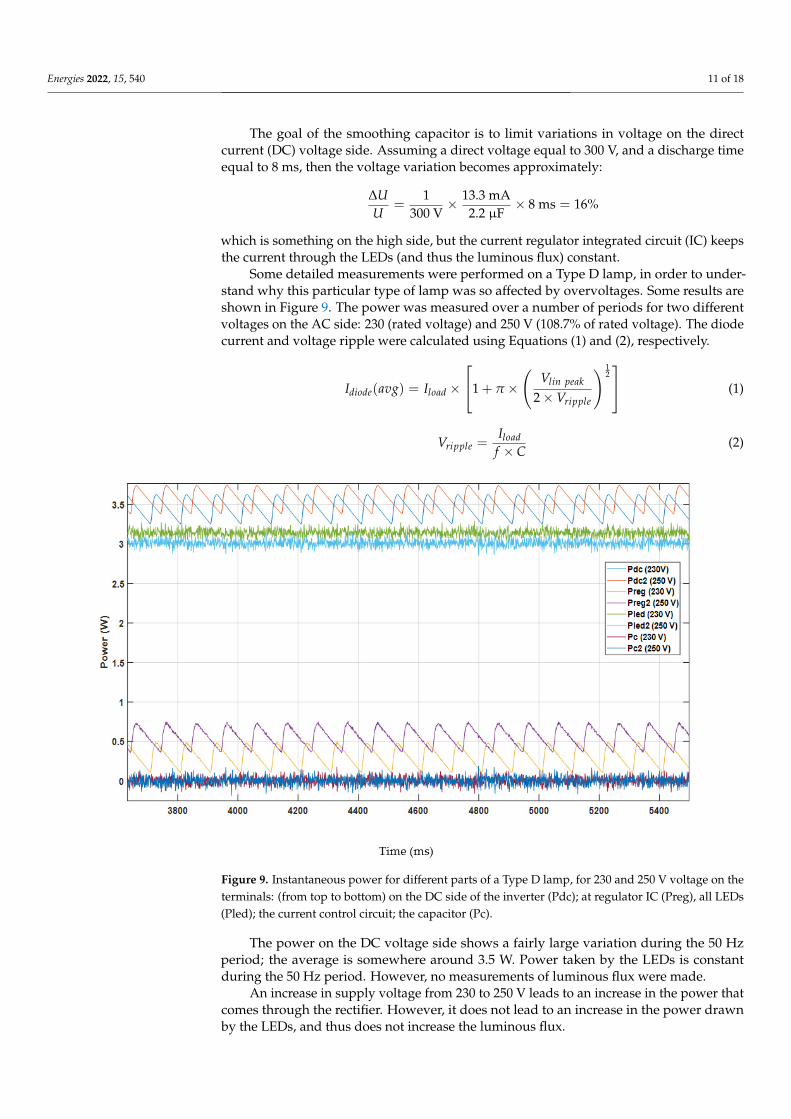
Some detailed measurements were performed on a Type D lamp, in order to under-stand why this particular type of lamp was so affected by overvoltages. Some results areshown in Figure 9. The power was measured over a number of periods for two differentvoltages on the AC side: 230 (rated voltage) and 250 V (108.7% of rated voltage). The diodecurrent and voltage ripple were calculated using Equations (1) and (2), respectively.
Idiode(avg) = Iload ×
1 + π ×(
Vlin peak
2 × Vripple
) 12 (1)
Vripple =Iload
f × C(2)
Energies 2022, 15, x FOR PEER REVIEW 12 of 20
Figure 9. Instantaneous power for different parts of a Type D lamp, for 230 and 250 V voltage on the terminals: (from top to bottom) on the DC side of the inverter (Pdc); at regulator IC (Preg), all LEDs (Pled); the current control circuit; the capacitor (Pc).
𝐼 (𝑎𝑣𝑔) = 𝐼 × [ 1 + 𝜋 × 𝑉 2 × 𝑉 ] (1)
𝑉 = 𝐼𝑓 × 𝐶 (2)
The power on the DC voltage side shows a fairly large variation during the 50 Hz period; the average is somewhere around 3.5 W. Power taken by the LEDs is constant during the 50 Hz period. However, no measurements of luminous flux were made.
An increase in supply voltage from 230 to 250 V leads to an increase in the power that comes through the rectifier. However, it does not lead to an increase in the power drawn by the LEDs, and thus does not increase the luminous flux.
Instead of increasing the luminous flux, the voltage increase provided an increase in the power absorbed by the current regulator circuit. The average power absorbed by the circuit was doubled from about 300 to about 600 mW when the mains voltage increased from 230 to 250 V. One possible explanation is that a large part of this power was absorbed by the 51-Ω resistor connected to the circuit. However, measurements showed that the voltage drop across the resistor was only 0.597 V, which corresponded to an output equal to 7 mW. It is a negligible part of the power that comes to the residual current.
The conclusion from this analysis is that the failure is due to overheating of the cur-rent regulator IC when it absorbs more energy with increased supply voltage in the ab-sence of a heat sink.
Figure 9. Instantaneous power for different parts of a Type D lamp, for 230 and 250 V voltage on theterminals: (from top to bottom) on the DC side of the inverter (Pdc); at regulator IC (Preg), all LEDs(Pled); the current control circuit; the capacitor (Pc).
The power on the DC voltage side shows a fairly large variation during the 50 Hzperiod; the average is somewhere around 3.5 W. Power taken by the LEDs is constantduring the 50 Hz period. However, no measurements of luminous flux were made.
An increase in supply voltage from 230 to 250 V leads to an increase in the power thatcomes through the rectifier. However, it does not lead to an increase in the power drawnby the LEDs, and thus does not increase the luminous flux.
Energies 2022, 15, 540 12 of 18
Instead of increasing the luminous flux, the voltage increase provided an increase inthe power absorbed by the current regulator circuit. The average power absorbed by thecircuit was doubled from about 300 to about 600 mW when the mains voltage increasedfrom 230 to 250 V. One possible explanation is that a large part of this power was absorbedby the 51-Ω resistor connected to the circuit. However, measurements showed that thevoltage drop across the resistor was only 0.597 V, which corresponded to an output equalto 7 mW. It is a negligible part of the power that comes to the residual current.
The conclusion from this analysis is that the failure is due to overheating of the currentregulator IC when it absorbs more energy with increased supply voltage in the absence ofa heat sink.
3.3. Construction of Heat Sink Type Lamps
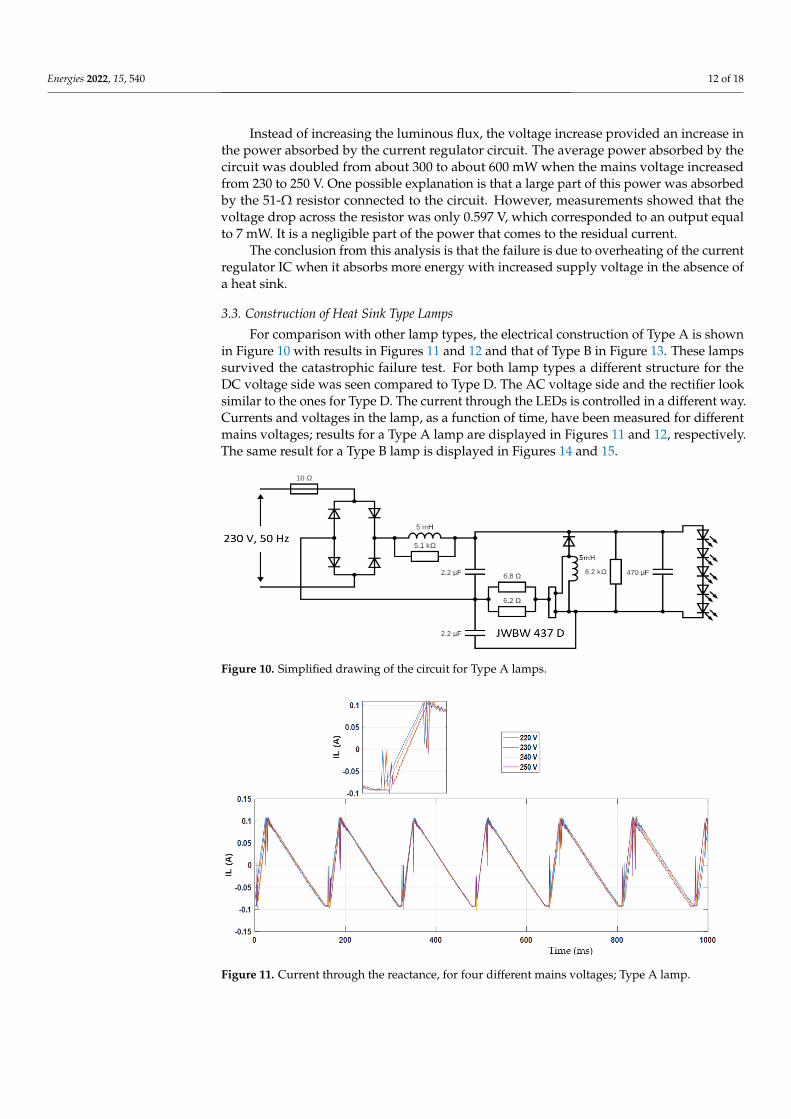
For comparison with other lamp types, the electrical construction of Type A is shownin Figure 10 with results in Figures 11 and 12 and that of Type B in Figure 13. These lampssurvived the catastrophic failure test. For both lamp types a different structure for theDC voltage side was seen compared to Type D. The AC voltage side and the rectifier looksimilar to the ones for Type D. The current through the LEDs is controlled in a different way.Currents and voltages in the lamp, as a function of time, have been measured for differentmains voltages; results for a Type A lamp are displayed in Figures 11 and 12, respectively.The same result for a Type B lamp is displayed in Figures 14 and 15.
Energies 2022, 15, x FOR PEER REVIEW 13 of 20
3.3. Construction of Heat Sink Type Lamps For comparison with other lamp types, the electrical construction of Type A is shown
in Figure 10 with results in Figures 11 and 12 and that of Type B in Figure 13. These lamps survived the catastrophic failure test. For both lamp types a different structure for the DC voltage side was seen compared to Type D. The AC voltage side and the rectifier look similar to the ones for Type D. The current through the LEDs is controlled in a different way. Currents and voltages in the lamp, as a function of time, have been measured for different mains voltages; results for a Type A lamp are displayed in Figures 11 and 12, respectively . The same result for a Type B lamp is displayed in Figures 14 and 15.
Figure 10. Simplified drawing of the circuit for Type A lamps.
Figure 11. Current through the reactance, for four different mains voltages; Type A lamp.
Figure 10. Simplified drawing of the circuit for Type A lamps.
Energies 2022, 15, x FOR PEER REVIEW 13 of 20
3.3. Construction of Heat Sink Type Lamps For comparison with other lamp types, the electrical construction of Type A is shown
in Figure 10 with results in Figures 11 and 12 and that of Type B in Figure 13. These lamps survived the catastrophic failure test. For both lamp types a different structure for the DC voltage side was seen compared to Type D. The AC voltage side and the rectifier look similar to the ones for Type D. The current through the LEDs is controlled in a different way. Currents and voltages in the lamp, as a function of time, have been measured for different mains voltages; results for a Type A lamp are displayed in Figures 11 and 12, respectively . The same result for a Type B lamp is displayed in Figures 14 and 15.
Figure 10. Simplified drawing of the circuit for Type A lamps.
Figure 11. Current through the reactance, for four different mains voltages; Type A lamp. Figure 11. Current through the reactance, for four different mains voltages; Type A lamp.
Energies 2022, 15, 540 13 of 18Energies 2022, 15, x FOR PEER REVIEW 14 of 20
Figure 12. The voltage across the reactance (VL) and the voltage across the LEDs (VLED) for four different mains voltages, Type A lamp.
Figure 13. Simplified drawing of the circuit for Type B lamps.
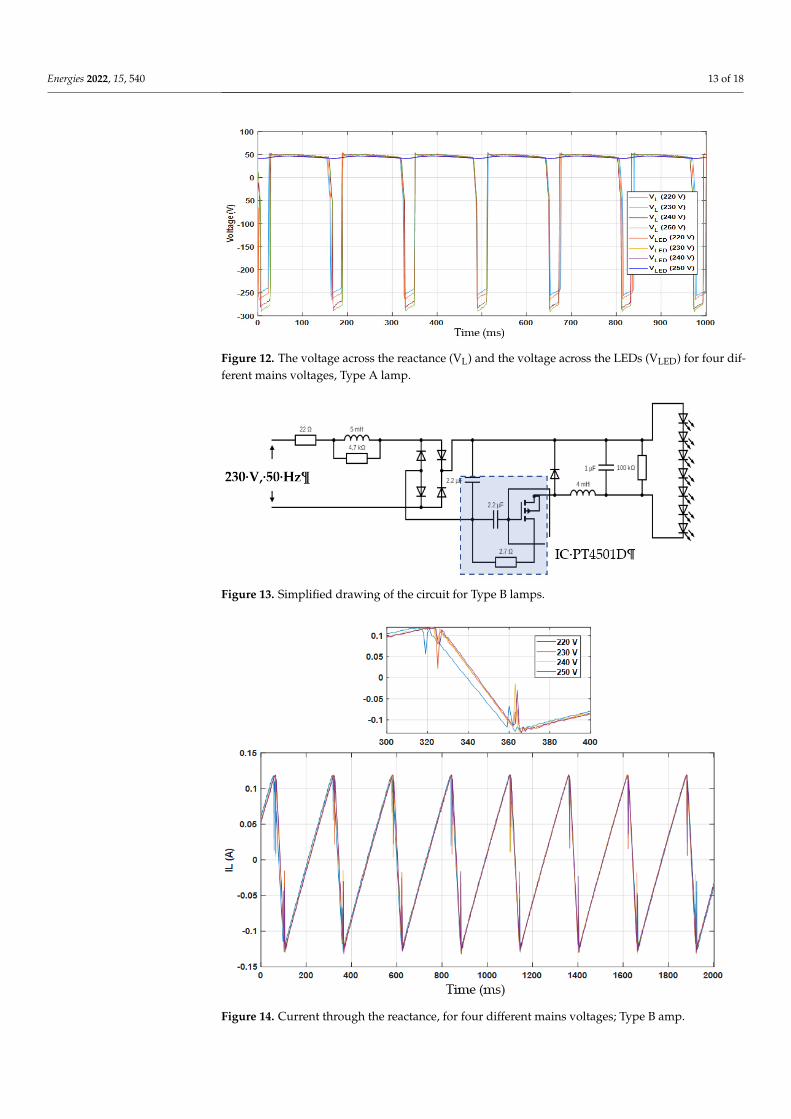
Figure 12. The voltage across the reactance (VL) and the voltage across the LEDs (VLED) for four dif-ferent mains voltages, Type A lamp.
Energies 2022, 15, x FOR PEER REVIEW 14 of 20
Figure 12. The voltage across the reactance (VL) and the voltage across the LEDs (VLED) for four different mains voltages, Type A lamp.
Figure 13. Simplified drawing of the circuit for Type B lamps.
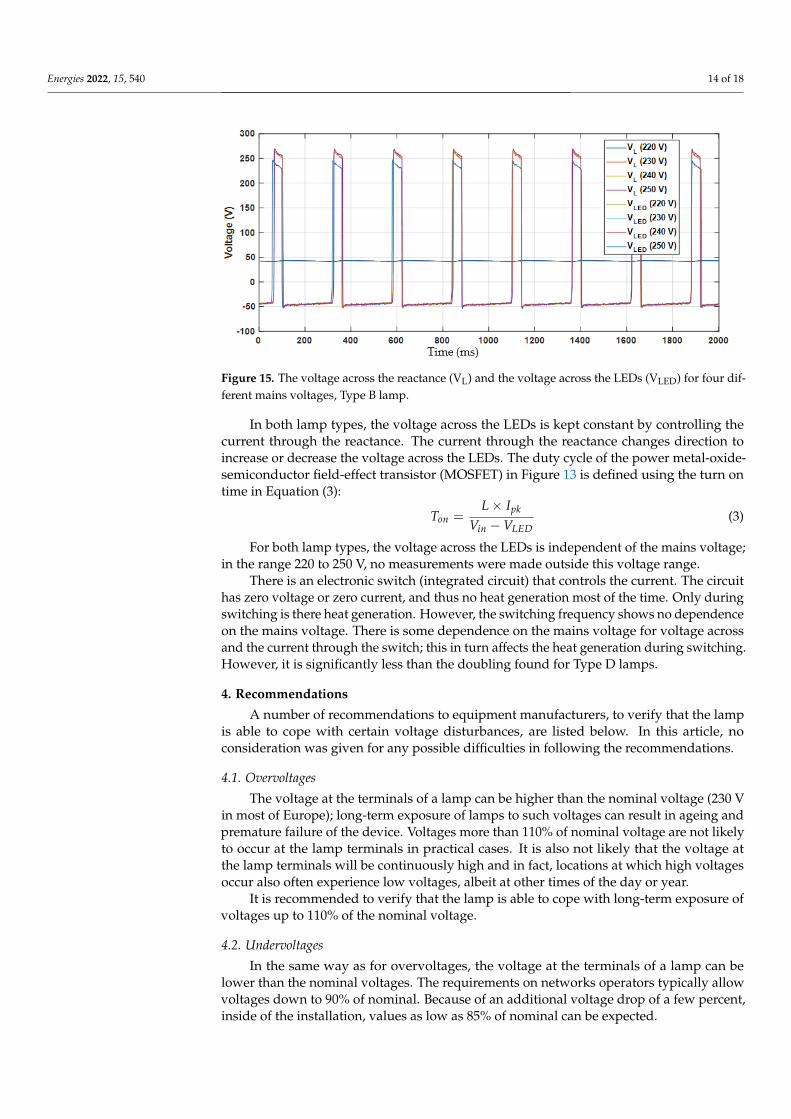
Figure 13. Simplified drawing of the circuit for Type B lamps.
Energies 2022, 15, x FOR PEER REVIEW 14 of 20
Figure 12. The voltage across the reactance (VL) and the voltage across the LEDs (VLED) for four different mains voltages, Type A lamp.
Figure 13. Simplified drawing of the circuit for Type B lamps.
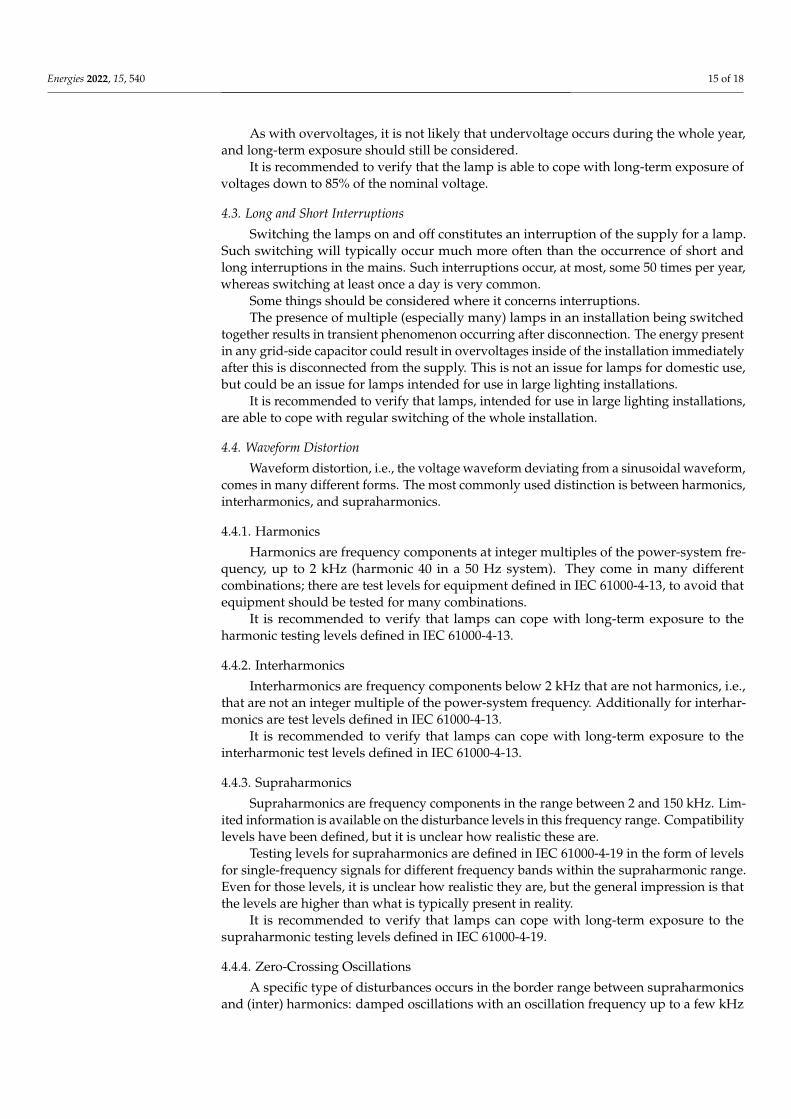
Figure 14. Current through the reactance, for four different mains voltages; Type B amp.
Energies 2022, 15, 540 14 of 18
Energies 2022, 15, x FOR PEER REVIEW 15 of 20
Figure 14. Current through the reactance, for four different mains voltages; Type B amp.
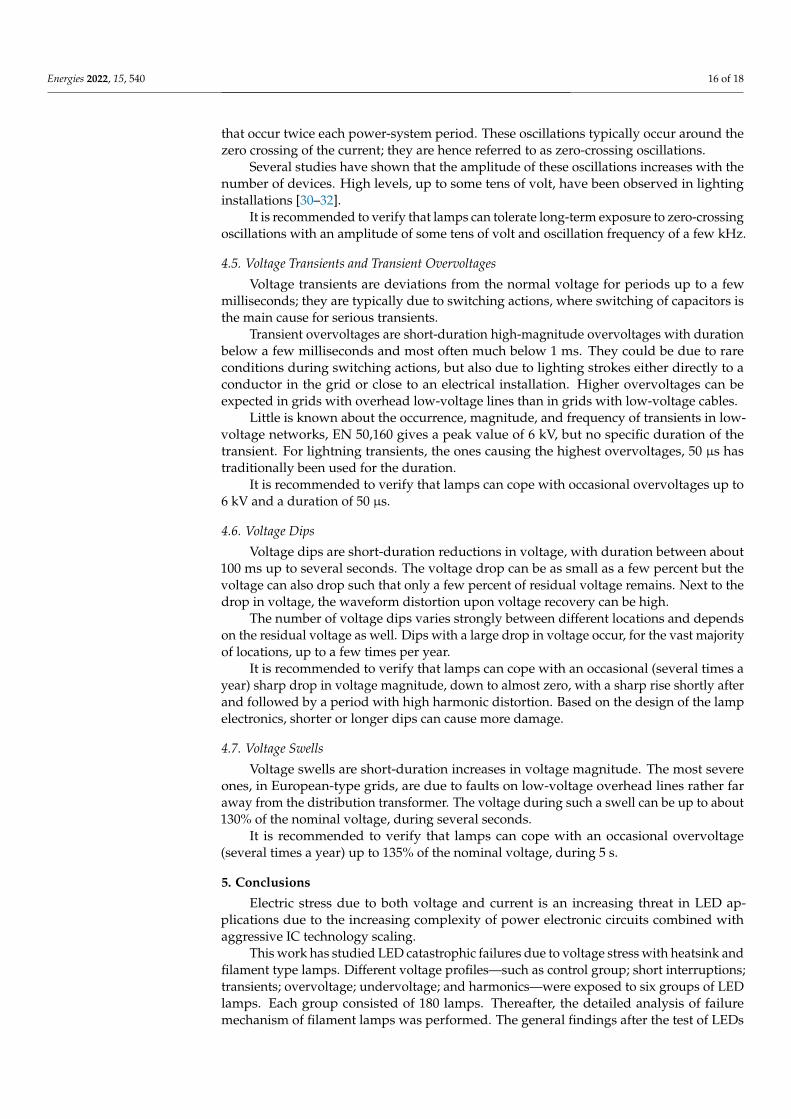
Figure 15. The voltage across the reactance (VL) and the voltage across the LEDs (VLED) for four different mains voltages, Type B lamp.
In both lamp types, the voltage across the LEDs is kept constant by controlling the current through the reactance. The current through the reactance changes direction to increase or decrease the voltage across the LEDs. The duty cycle of the power metal-oxide-semiconductor field-effect transistor (MOSFET) in Figure 13 is defined using the turn on time in Equation (3): 𝑇 = 𝐿 × 𝐼𝑉 − 𝑉 (3)
For both lamp types, the voltage across the LEDs is independent of the mains voltage; in the range 220 to 250 V, no measurements were made outside this voltage range.
There is an electronic switch (integrated circuit) that controls the current. The circuit has zero voltage or zero current, and thus no heat generation most of the time. Only dur-ing switching is there heat generation. However, the switching frequency shows no de-pendence on the mains voltage. There is some dependence on the mains voltage for volt-age across and the current through the switch; this in turn affects the heat generation dur-ing switching. However, it is significantly less than the doubling found for Type D lamps.
4. Recommendations A number of recommendations to equipment manufacturers, to verify that the lamp
is able to cope with certain voltage disturbances, are listed below. In this article, no con-sideration was given for any possible difficulties in following the recommendations.
4.1. Overvoltages The voltage at the terminals of a lamp can be higher than the nominal voltage (230 V
in most of Europe); long-term exposure of lamps to such voltages can result in ageing and premature failure of the device. Voltages more than 110% of nominal voltage are not likely to occur at the lamp terminals in practical cases. It is also not likely that the voltage at the lamp terminals will be continuously high and in fact, locations at which high voltages occur also often experience low voltages, albeit at other times of the day or year.
It is recommended to verify that the lamp is able to cope with long-term exposure of voltages up to 110% of the nominal voltage.
4.2. Undervoltages
Figure 15. The voltage across the reactance (VL) and the voltage across the LEDs (VLED) for four dif-ferent mains voltages, Type B lamp.
In both lamp types, the voltage across the LEDs is kept constant by controlling thecurrent through the reactance. The current through the reactance changes direction toincrease or decrease the voltage across the LEDs. The duty cycle of the power metal-oxide-semiconductor field-effect transistor (MOSFET) in Figure 13 is defined using the turn ontime in Equation (3):
Ton =L × Ipk
Vin − VLED(3)
For both lamp types, the voltage across the LEDs is independent of the mains voltage;in the range 220 to 250 V, no measurements were made outside this voltage range.
There is an electronic switch (integrated circuit) that controls the current. The circuithas zero voltage or zero current, and thus no heat generation most of the time. Only duringswitching is there heat generation. However, the switching frequency shows no dependenceon the mains voltage. There is some dependence on the mains voltage for voltage acrossand the current through the switch; this in turn affects the heat generation during switching.However, it is significantly less than the doubling found for Type D lamps.
4. Recommendations
A number of recommendations to equipment manufacturers, to verify that the lampis able to cope with certain voltage disturbances, are listed below. In this article, noconsideration was given for any possible difficulties in following the recommendations.
4.1. Overvoltages
The voltage at the terminals of a lamp can be higher than the nominal voltage (230 Vin most of Europe); long-term exposure of lamps to such voltages can result in ageing andpremature failure of the device. Voltages more than 110% of nominal voltage are not likelyto occur at the lamp terminals in practical cases. It is also not likely that the voltage atthe lamp terminals will be continuously high and in fact, locations at which high voltagesoccur also often experience low voltages, albeit at other times of the day or year.
It is recommended to verify that the lamp is able to cope with long-term exposure ofvoltages up to 110% of the nominal voltage.
4.2. Undervoltages
In the same way as for overvoltages, the voltage at the terminals of a lamp can belower than the nominal voltages. The requirements on networks operators typically allowvoltages down to 90% of nominal. Because of an additional voltage drop of a few percent,inside of the installation, values as low as 85% of nominal can be expected.
Energies 2022, 15, 540 15 of 18
As with overvoltages, it is not likely that undervoltage occurs during the whole year,and long-term exposure should still be considered.
It is recommended to verify that the lamp is able to cope with long-term exposure ofvoltages down to 85% of the nominal voltage.
4.3. Long and Short Interruptions
Switching the lamps on and off constitutes an interruption of the supply for a lamp.Such switching will typically occur much more often than the occurrence of short andlong interruptions in the mains. Such interruptions occur, at most, some 50 times per year,whereas switching at least once a day is very common.
Some things should be considered where it concerns interruptions.The presence of multiple (especially many) lamps in an installation being switched
together results in transient phenomenon occurring after disconnection. The energy presentin any grid-side capacitor could result in overvoltages inside of the installation immediatelyafter this is disconnected from the supply. This is not an issue for lamps for domestic use,but could be an issue for lamps intended for use in large lighting installations.
It is recommended to verify that lamps, intended for use in large lighting installations,are able to cope with regular switching of the whole installation.
4.4. Waveform Distortion
Waveform distortion, i.e., the voltage waveform deviating from a sinusoidal waveform,comes in many different forms. The most commonly used distinction is between harmonics,interharmonics, and supraharmonics.
4.4.1. Harmonics
Harmonics are frequency components at integer multiples of the power-system fre-quency, up to 2 kHz (harmonic 40 in a 50 Hz system). They come in many differentcombinations; there are test levels for equipment defined in IEC 61000-4-13, to avoid thatequipment should be tested for many combinations.
It is recommended to verify that lamps can cope with long-term exposure to theharmonic testing levels defined in IEC 61000-4-13.
4.4.2. Interharmonics
Interharmonics are frequency components below 2 kHz that are not harmonics, i.e.,that are not an integer multiple of the power-system frequency. Additionally for interhar-monics are test levels defined in IEC 61000-4-13.
It is recommended to verify that lamps can cope with long-term exposure to theinterharmonic test levels defined in IEC 61000-4-13.
4.4.3. Supraharmonics
Supraharmonics are frequency components in the range between 2 and 150 kHz. Lim-ited information is available on the disturbance levels in this frequency range. Compatibilitylevels have been defined, but it is unclear how realistic these are.
Testing levels for supraharmonics are defined in IEC 61000-4-19 in the form of levelsfor single-frequency signals for different frequency bands within the supraharmonic range.Even for those levels, it is unclear how realistic they are, but the general impression is thatthe levels are higher than what is typically present in reality.
It is recommended to verify that lamps can cope with long-term exposure to thesupraharmonic testing levels defined in IEC 61000-4-19.
4.4.4. Zero-Crossing Oscillations
A specific type of disturbances occurs in the border range between supraharmonicsand (inter) harmonics: damped oscillations with an oscillation frequency up to a few kHz
Energies 2022, 15, 540 16 of 18
that occur twice each power-system period. These oscillations typically occur around thezero crossing of the current; they are hence referred to as zero-crossing oscillations.
Several studies have shown that the amplitude of these oscillations increases with thenumber of devices. High levels, up to some tens of volt, have been observed in lightinginstallations [30–32].
It is recommended to verify that lamps can tolerate long-term exposure to zero-crossingoscillations with an amplitude of some tens of volt and oscillation frequency of a few kHz.
4.5. Voltage Transients and Transient Overvoltages
Voltage transients are deviations from the normal voltage for periods up to a fewmilliseconds; they are typically due to switching actions, where switching of capacitors isthe main cause for serious transients.
Transient overvoltages are short-duration high-magnitude overvoltages with durationbelow a few milliseconds and most often much below 1 ms. They could be due to rareconditions during switching actions, but also due to lighting strokes either directly to aconductor in the grid or close to an electrical installation. Higher overvoltages can beexpected in grids with overhead low-voltage lines than in grids with low-voltage cables.
Little is known about the occurrence, magnitude, and frequency of transients in low-voltage networks, EN 50,160 gives a peak value of 6 kV, but no specific duration of thetransient. For lightning transients, the ones causing the highest overvoltages, 50 µs hastraditionally been used for the duration.
It is recommended to verify that lamps can cope with occasional overvoltages up to6 kV and a duration of 50 µs.
4.6. Voltage Dips
Voltage dips are short-duration reductions in voltage, with duration between about100 ms up to several seconds. The voltage drop can be as small as a few percent but thevoltage can also drop such that only a few percent of residual voltage remains. Next to thedrop in voltage, the waveform distortion upon voltage recovery can be high.
The number of voltage dips varies strongly between different locations and dependson the residual voltage as well. Dips with a large drop in voltage occur, for the vast majorityof locations, up to a few times per year.
It is recommended to verify that lamps can cope with an occasional (several times ayear) sharp drop in voltage magnitude, down to almost zero, with a sharp rise shortly afterand followed by a period with high harmonic distortion. Based on the design of the lampelectronics, shorter or longer dips can cause more damage.
4.7. Voltage Swells
Voltage swells are short-duration increases in voltage magnitude. The most severeones, in European-type grids, are due to faults on low-voltage overhead lines rather faraway from the distribution transformer. The voltage during such a swell can be up to about130% of the nominal voltage, during several seconds.
It is recommended to verify that lamps can cope with an occasional overvoltage(several times a year) up to 135% of the nominal voltage, during 5 s.
5. Conclusions
Electric stress due to both voltage and current is an increasing threat in LED ap-plications due to the increasing complexity of power electronic circuits combined withaggressive IC technology scaling.
This work has studied LED catastrophic failures due to voltage stress with heatsink andfilament type lamps. Different voltage profiles—such as control group; short interruptions;transients; overvoltage; undervoltage; and harmonics—were exposed to six groups of LEDlamps. Each group consisted of 180 lamps. Thereafter, the detailed analysis of failuremechanism of filament lamps was performed. The general findings after the test of LEDs
Energies 2022, 15, 540 17 of 18
with different voltage profiles and a detailed analysis with filament type lamps and heatsinktype lamps can be summarized as follows:
• As none of the lamps failed due to undervoltage, harmonics, transients, or short inter-ruptions, there is no reason to perform accelerated aging tests on these phenomena;
• All lamps that failed were filament type lamps under overvoltage test condition;• Further for an accelerated overvoltage test condition, a number of lamps were exposed
to 120% voltage for 100 h. None of these lamps failed. Exposing the lamps to thehigher voltage would probably lead to other error mechanisms that makes it no longerpossible to compare results.
This study helps to better understand the accelerated test procedures that need tobe considered while testing an LED lamp with different voltage profiles for acceleratedaging. With the conclusions of this work and the analysis with different types of lampsit can be determined that overvoltage stress for filament type lamps is essential. Theother voltage profiles such as undervoltage, harmonics, transients, and short interruptionsdo not influence the aging phenomena of LEDs. Hence, this study would help the LEDmanufacturers and the standardization committee to set LED accelerated aging test profiles.The study can be extended to investigate the weakest link in the LED circuit that failsdue to overvoltage. Further research could investigate the impact of LED aging on thepower quality.
Author Contributions: Conceptualization, M.H.J.B., S.S.L. and S.K.R.; methodology, M.H.J.B., S.S.L.and S.K.R.; formal analysis, M.H.J.B. and S.S.L.; investigation, S.S.L.; resources, M.H.J.B.; datacuration, M.H.J.B.; writing—original draft preparation, M.H.J.B., S.K.R. and S.S.L.; writing—reviewand editing, M.H.J.B.; project administration, M.H.J.B.; funding acquisition, M.H.J.B. All authors haveread and agreed to the published version of the manuscript.
Funding: This work was funded by the Swedish Energy Agency under grant number 46678-1.
Institutional Review Board Statement: Not applicable.
Informed Consent Statement: Not applicable.
Data Availability Statement: Not applicable.
Conflicts of Interest: The authors declare no conflict of interest.
References1. Alfarog, A.O.; Qu, X.; Wang, H.; Blaabjerg, F.; Li, Z. Lifetime prediction of LED lighting systems considering thermal coupling
between LED sources and drivers. In Proceedings of the IECON 2017—43rd Annual Conference of the IEEE Industrial ElectronicsSociety, Beijing, China, 29 October–1 November 2017; pp. 1273–1278. [CrossRef]
2. Qu, X.; Liu, Q.; Wang, H.; Blaabjerg, F. System-Level Lifetime Prediction for LED Lighting Applications Considering ThermalCoupling between LED Sources and Drivers. IEEE J. Emerg. Sel. Top. Power Electron. 2018, 6, 1860–1870. [CrossRef]
3. Fan, J.; Yung, W.K.C.; Pecht, M. Lifetime Estimation of High-Power White LED Using Degradation-Data-Driven Method. IEEETrans. Device Mater. Reliab. 2012, 12, 470–477. [CrossRef]
4. Hao, J.; Ke, H.-L.; Jing, L.; Sun, Q.; Sun, R.-T. Prediction of lifetime by lumen degradation and color shift for LED lamps, in anon-accelerated reliability test over 20,000 h. Appl. Opt. 2019, 58, 1855–1861. [CrossRef] [PubMed]
5. Qu, X.; Wang, H.; Zhan, X.; Blaabjerg, F.; Chung, H.S.-H. A lifetime prediction method for LEDs considering mission profiles. InProceedings of the 2016 IEEE Applied Power Electronics Conference and Exposition (APEC), Long Beach, CA, USA, 20–24 March2016; pp. 2154–2160. [CrossRef]
6. Kijkanjanapaiboon, K.; Kretschmer, T.W.; Chen, L.; Fan, X.; Zhou, J. LED’s luminous flux lifetime prediction using a hybridnumerical approach. In Proceedings of the 2015 16th International Conference on Thermal, Mechanical and Multi-PhysicsSimulation and Experiments in Microe-lectronics and Microsystems, Budapest, Hungary, 19–22 April 2015; pp. 1–8. [CrossRef]
7. Ibrahim, M.S.; Jing, Z.; Yung, W.K.; Fan, J. Bayesian based lifetime prediction for high-power white LEDs. Expert Syst. Appl. 2021,185, 115627. [CrossRef]
8. Padmasali, A.N.; Kini, S.G. A Generalized Methodology for Predicting the Lifetime Performance of LED Luminaire. IEEE Trans.Electron. Devices 2020, 67, 2831–2836. [CrossRef]
9. Padmasali, A.N.; Kini, S.G. Accelerated Testing Based Lifetime Performance Evaluation of LEDs in LED Luminaire Systems. IEEEAccess 2021, 9, 137140–137147. [CrossRef]
Energies 2022, 15, 540 18 of 18
10. Padmasali, A.N.; Kini, S.G. Accelerated Degradation Test Investigation for Life-Time Performance Analysis of LED Luminaires.IEEE Trans. Compon. Packag. Manuf. Technol. 2019, 10, 551–558. [CrossRef]
11. Yan, J.; Liu, H.; Zhao, W.; Su, Y. LED filament standard lamp for total luminous flux with uniform spatial distribution. J. PhysicsConf. Ser. 2019, 1345, 32046. [CrossRef]
12. Tan, K.-Z.; Lee, S.-K.; Low, H.-C. LED Lifetime Prediction Under Thermal-Electrical Stress. IEEE Trans. Device Mater. Reliab. 2021,21, 310–319. [CrossRef]
13. Wang, X.-X.; Jing, L.; Wang, Y.; Gao, Q.; Sun, Q. The Influence of Junction Temperature Variation of LED on the Lifetime Estimationduring Accelerated Aging Test. IEEE Access 2018, 7, 4773–4781. [CrossRef]
14. IEC 62717:2014; LED Modules for General Lighting—Performance Requirements. TC 34/SC 34A—Electric Light Sources. TC34/SC 34A—Electric Light Sources; IEC: Geneva, Switzerland, 2014.
15. Utvärdering av Provuppställningar och Karakteristik på Provsignaler vid Immunitetsprov på Belysning, Energimyndigheten.Available online: https://www.ltu.se/research/subjects/Elkraftteknik/Forskningsprojekt/Pagaende-projekt/Utvardering-av-provuppstallningar-och-karakteristik-pa-provsignaler-vid-immunitetsprov-pa-belysning-1.162569 (accessed on 8 September2021).
16. IEC 62612, 1st ed.; Self-Ballasted LED Lamps for General Lighting Services with Supply Voltages > 50 V–Performance Require-ments; IEC: Geneva, Switzerland, 2013.
17. Bollen, M.H.J.; Gu, I.Y.-H. Signal Processing of Power Quality Disturbances; Wiley, IEEE Press: Hoboken, NJ, USA, 2006.18. Bollen, M.; Olofsson, M. Consumer Electronics and the Power Grid: What are they doing to each other? IEEE Consum. Electron.
Mag. 2014, 4, 50–57. [CrossRef]19. IEC 61000-4-13; Electromagnetic Compatibility (EMC) –Part 4–13: Testing and Measurement Techniques—Harmonics and
Interharmonics Including Mains Signaling at a.c. Power Port, Low Frequency Immunity Tests. 1st ed. IEC: Geneva, Switzerland,2002.
20. SS-EN 61000-4-11:2004; Electromagnetic Compatibility (EMC)—Part 4–11: Testing and Measurement Techniques—Voltage Dips,Short Interruptions and Voltage Variations Immunity Tests; IEC: Geneva, Switzerland, 2017.
21. Bollen, M.H.J. Voltage dip immunity of equipment and installations, final report CIGRE/CIRED/UIE Joint Working GroupC4.110. In CIGRE Technical Brochure 412; e-CIGRE: Paris, France, 2010.
22. Bollen, M.H.J.; de Castro, A.G.; Rönnberg, S.K. Typical Harmonic Levels and Spectra with Low-Voltage Customers; CIRED: Madrid,Spain, 3–6 June 2019.
23. Rönnberg, S.K.; Gil-De-Castro, A.; Medina-Gracia, R. Supraharmonics in European and North American Low-Voltage Networks.In Proceedings of the 2018 IEEE International Conference on Environment and Electrical Engineering and 2018 IEEE Industrialand Commercial Power Systems Europe (EEEIC/I&CPS Europe), Palermo, Italy, 12–15 June 2018.
24. Sakar, S.; Ronnberg, S.; Bollen, M. Interferences in AC–DC LED Drivers Exposed to Voltage Disturbances in the Frequency Range2–150 kHz. IEEE Trans. Power Electron. 2019, 34, 11171–11181. [CrossRef]
25. Ravindran, V.; Sakar, S.; Rönnberg, S.; Bollen, M.H.J. Characterization of the impact of PV and EV induced voltage variations onLED lamps in a low voltage installation. Electr. Power Syst. Res. 2020, 185, 106352. [CrossRef]
26. EN50160; Voltage Characteristics of Electricity Supplied by Public Distribution Networks. Ed.4.3. Ed.4.3; CENELEC: Brussels,Belgium, 2020.
27. IEC 61000-3-2; Electromagnetic Compatibility (EMC)—Part 3-2: Limits—Limits for Harmonic Current Emissions (EquipmentInput Current ≤ 16 A Per Phase). 6th ed. CENELEC: Brussels, Belgium, 2019.
28. The Lightbulb Company, Light Bulb Average Rated Life Time Hours. Available online: https://www.thelightbulb.co.uk/resources/light_bulb_average_rated_life_time_hours/ (accessed on 8 September 2021).
29. Beaty, H.W.; Donald, G.F. Standard Handbook for Electrical Engineers, Chapter 26: Kule Hemmi, Illumination, 16th ed.; McGraw Hill:New York, NY, USA, 2013.
30. Anders, L. On High-Frequency Distortion in Low-Voltage Power Systems. Ph.D. Thesis, Luleå University of Technology, Luleå,Sweden, 2011.
31. Larsson, E.; Bollen, M. Measurement result from 1 to 48 fluorescent lamps in the frequency range 2 to 150 kHz. In Proceedings ofthe 14th International Conference on Harmonics and Quality of Power—ICHQP, Bergamo, Italy, 26–29 September 2010; pp. 1–8.[CrossRef]
32. Busatto, T.; Ronnberg, S.K.; Bollen, M.H. Stability Analysis of PFC Converters under Different Source Impedances and ItsConsequences on Zero-Crossing Distortion. IEEE Trans. Power Deliv. 2021. [CrossRef]


