Embed Size (px)
Citation preview

CRANFIELD UNIVERSITY
RUMORI SAFARI
ANALYSIS AND SIMULATION OF TRANSIENT PERFOMANCE OF
A MEDIUM BYPASS RATIO TURBOFAN ENGINE
SCHOOL OF ENGINEERING
MSc. THERMAL POWER (AEROSPACE PROPULSION)
MSc. THESIS
Academic Year: 2012- 2013
Supervisor: Dr Theoklis Nikolaidis
September 2013


CRANFIELD UNIVERSITY
SCHOOL OF ENGINEERING
MSc. THERMAL POWER (AEROSPACE PROPULSION)
MSc. THESIS
Academic Year 2012- 2013
RUMORI SAFARI
ANALYSIS AND SIMULATION OF TRANSIENT PERFORMANCE OF A MEDIUM BYPASS RATIO TURBOFAN ENGINE
Supervisor: Dr Theoklis Nikolaidis
September 2013
This thesis is submitted in partial fulfilment of the requirements for
the degree of Master of Science
© Cranfield University 2013. All rights reserved. No part of this
publication may be reproduced without the written permission of the
copyright owner.


i
ABSTRACT
With the advent of powered flight, propulsion systems have never ceased to
grow in complexity and performance capabilities which now allow an aero-
engine to operate over a wide range of ambient conditions and power settings
over an ever increasing operational envelope.
This wide range of an aero-engine performance regime requires conducting a
performance analysis of engine performance parameters with aim of obtaining
performance estimates before developing and operating the engine in order to
ascertain that it is capable of operating safely within its prescribed operational
envelope of a given mission specifications.
Although initially an aero-engine is designed and optimised for a particular
design point for which the parameters such as pressure ratio, fuel flow, mass
flow etc., are fixed, however, some other performance points at off-design and
transient are looked at during the early engine development phase.
During a transient phase many components operate close to their performance
limits, such as surge in the compressors, high temperatures in the turbines and
in some cases rotor over speeding. The ability to predict the off-design
performance of a gas turbine engine through simulation is indispensable.
Therefore, the aim of this work is to investigate the transient performance of a
medium bypass ratio turbofan engine. Six simple linear fuel schedules are
defined and are used to simulate acceleration manoeuvres. Effects of engine
degradation on transient performance are also studied using Turbomatch 2.0.
This work has found out that the shorter the acceleration time the faster the fuel
flow and this has resulted in HPC SM decrease by 12% and COT increased
500K above the design value while SFC was found to rise up to 47.5 mg/N.s.
Such fuel schedule was unacceptable to a safe engine operation.
It was recommended in the future works to investigate the effects of bleed and
power off-take on transient performance during both acceleration and
deceleration manoeuvres as well as transient below idle.

ii
Keywords:
Gas turbine, off-design performance, parametric analysis, fuel schedule,
acceleration

iii
ACKNOWLEDGEMENTS
The overall outcomes of this work are born out of a close supervision of Dr
Theoklis Nikolaidis by sharing his thoughts and experience and giving advice
and motivation towards the accomplishment of this project work. I gratefully
acknowledge his immeasurable support through his technical instructions and
encouragement.
I would like to express my gratitude to my thermo-power department colleagues
with whom I spent a year doing this aerospace propulsion course. They have
been encouraging and supportive all the way long to the completion and I owe
them many thanks for their invaluable interactions.
I wish also to address my great gratitude to Bellis Claire our department
administrator, although I cannot mention all our academic staffs, for her timely
provision of information and course materials, she has been so professional.
My other thanks are addressed to other non-academic staffs like our
professional and courteous librarians and the IT personnel for the nice classes
they are have been arranging for us.
My sincere gratitude goes to my sponsor the MoD, Rwanda for the trust they
have bestowed unto me by proving me with such a big opportunity to attend
Cranfield University.
Finally I wish to express my heart felt gratitude to my fiancé Ketsela Gadissa for
the way she managed this distant relationship.


v
TABLE OF CONTENTS
ABSTRACT ......................................................................................................... i
Keywords............................................................................................................. ii
ACKNOWLEDGEMENTS................................................................................... iii
TABLE OF CONTENTS ..................................................................................... v
LIST OF FIGURES ............................................................................................ vii
LIST OF TABLES ............................................................................................... ix
LIST OF EQUATIONS ........................................................................................ x
LIST OF ABBREVIATIONS ............................................................................... xii
LIST OF SYMBOLS ......................................................................................... xiv
LIST OF SUBSCRIPTS ..................................................................................... xv
1 INTRODUCTION ............................................................................................. 1
1.1 General ..................................................................................................... 1
1.2 Base line engine and its development ...................................................... 2
1.3 Aims and objectives this thesis ................................................................. 4
1.4 Thesis Scope ............................................................................................ 5
1.5 Methodology ............................................................................................. 5
1.6 Thesis structure ........................................................................................ 6
2 LITERATURE REVIEW ................................................................................... 7
2.1 Background ............................................................................................... 7
2.2 Aero-engine performance improvement over time .................................. 11
2.3 Principle of gas turbine propulsion .......................................................... 16
2.4 Classification of aerospace engines........................................................ 18
2.5 The Turbofan Engine .............................................................................. 18
2.6 Gas turbine engine performance analysis ............................................... 21
2.6.1 Thermodynamic cycle of a gas turbine engine ................................. 22
2.6.2 Turbofan engine performance parameters ....................................... 23
2.6.3 Engine Thrust ................................................................................... 23
2.6.4 Factors affecting engine performance .............................................. 25
2.6.5 Specific Fuel Consumption ............................................................... 27
2.6.6 Thermal efficiency ............................................................................ 27
2.6.7 Propulsive Efficiency ........................................................................ 28
2.6.8 Overall Efficiency ............................................................................. 30
2.7 Gas turbine engine performance simulation ........................................... 30
2.8 Gas turbine engine transient performance .............................................. 31
2.9 Transient phenomena ............................................................................. 33
2.9.1 Heat soakage ................................................................................... 33
2.9.2 Volume dynamics ............................................................................. 33
2.9.3 Tip clearance changes ..................................................................... 35
2.9.4 Combustion delay ............................................................................ 36
2.9.5 Control system delays and lags ....................................................... 36

vi
2.10 Operability concerns ............................................................................. 36
2.11 Previous research works ....................................................................... 37
2.12 Conclusion ............................................................................................ 37
3 ANALYSIS AND SIMULATION OF OFF-DESIGN PERFORMANCE OF A
TWO SPOOL TURBOFAN ENGINE ................................................................ 39
3.1 Introduction ............................................................................................. 39
3.2 Off-design Performance analysis ............................................................ 42
3.3 OD Simulation and results analysis ........................................................ 44
3.3.1 Effects of rotational speed on engine performance .......................... 44
3.3.2 Effects of Atmospheric Conditions ................................................... 44
3.3.3 Effect of flight speed ......................................................................... 49
3.3.4 Influence of BPR on the engine performance ................................... 51
3.3.5 Influence of the FPR on the engine performance ............................. 52
3.3.6 Effect of design PR........................................................................... 52
3.3.7 Effect of overboard bleed ................................................................. 53
3.3.8 Effect of power off-take .................................................................... 55
3.4 Conclusion .............................................................................................. 57
4 TRANSIENT PERFORMANCE ANALYSIS AND SIMULATION OF A
TWO SPOOL TURBOFAN ENGINE ................................................................ 59
4.1 Introduction ............................................................................................. 59
4.2 Acceleration and deceleration manoeuvres ............................................ 59
4.3 Engine acceleration and deceleration requirements ............................... 61
4.4 Transient performance modelling with Turbomatch ................................ 61
4.5 Simulation results analysis ...................................................................... 66
4.5.1 Clean engine simulation ................................................................... 66
4.5.2 Degraded module simulation ............................................................ 78
4.6 Conclusion .............................................................................................. 85
5 CONCLUSION, RECOMMENDATION AND FUTURE WORK ...................... 87
5.1 Concluding Remarks ............................................................................... 87
5.2 Limitations ............................................................................................... 89
5.3 Recommendations for future works ........................................................ 90
REFERENCES ................................................................................................. 91
APPENDICES .................................................................................................. 95
Appendix A Turbomatch 2.0 models ............................................................. 95
Appendix B Gas Turb models ..................................................................... 102
vii
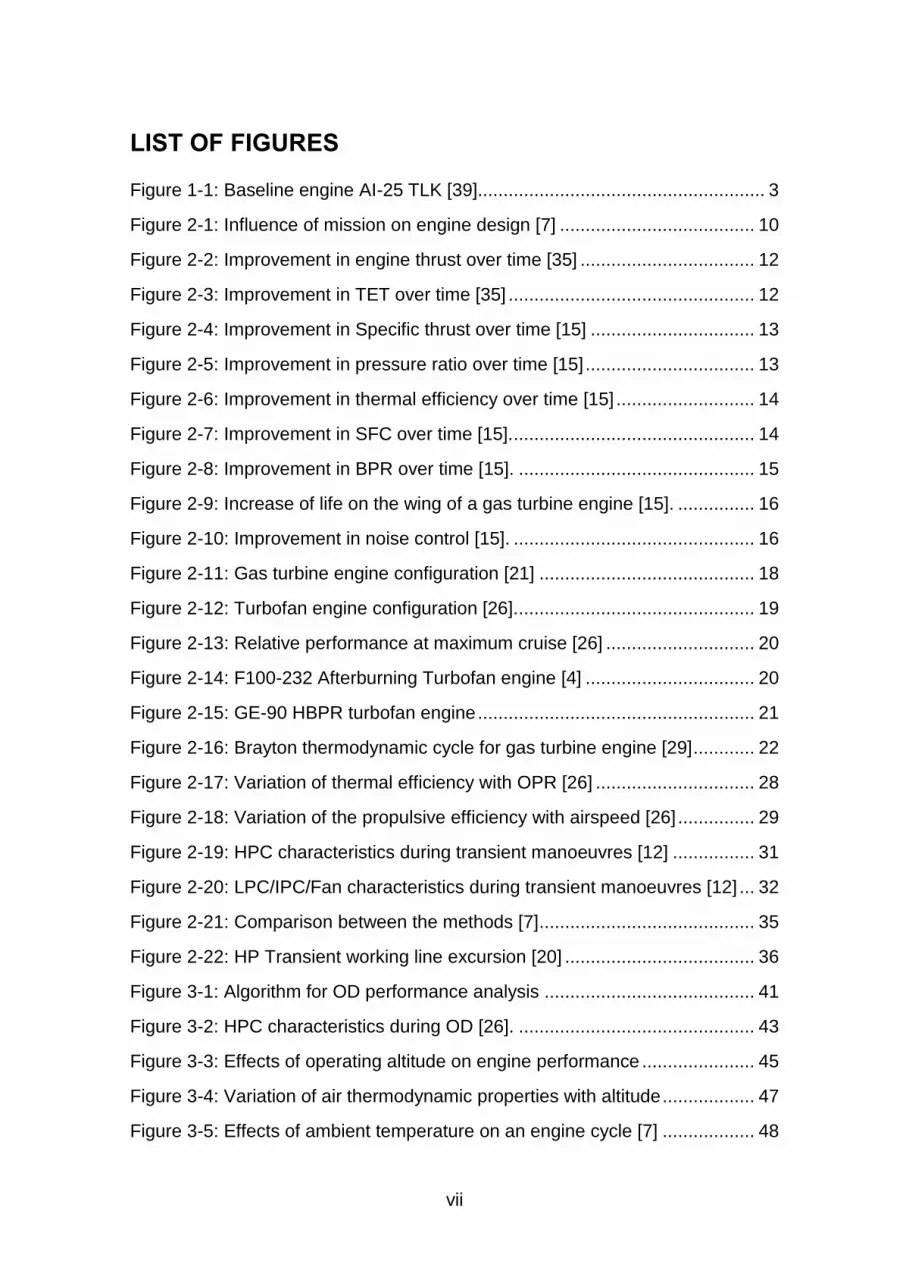
LIST OF FIGURES
Figure 1-1: Baseline engine AI-25 TLK [39]........................................................ 3
Figure 2-1: Influence of mission on engine design [7] ...................................... 10
Figure 2-2: Improvement in engine thrust over time [35] .................................. 12
Figure 2-3: Improvement in TET over time [35] ................................................ 12
Figure 2-4: Improvement in Specific thrust over time [15] ................................ 13
Figure 2-5: Improvement in pressure ratio over time [15] ................................. 13
Figure 2-6: Improvement in thermal efficiency over time [15] ........................... 14
Figure 2-7: Improvement in SFC over time [15]................................................ 14
Figure 2-8: Improvement in BPR over time [15]. .............................................. 15
Figure 2-9: Increase of life on the wing of a gas turbine engine [15]. ............... 16
Figure 2-10: Improvement in noise control [15]. ............................................... 16
Figure 2-11: Gas turbine engine configuration [21] .......................................... 18
Figure 2-12: Turbofan engine configuration [26]. .............................................. 19
Figure 2-13: Relative performance at maximum cruise [26] ............................. 20
Figure 2-14: F100-232 Afterburning Turbofan engine [4] ................................. 20
Figure 2-15: GE-90 HBPR turbofan engine ...................................................... 21
Figure 2-16: Brayton thermodynamic cycle for gas turbine engine [29] ............ 22
Figure 2-17: Variation of thermal efficiency with OPR [26] ............................... 28
Figure 2-18: Variation of the propulsive efficiency with airspeed [26] ............... 29
Figure 2-19: HPC characteristics during transient manoeuvres [12] ................ 31
Figure 2-20: LPC/IPC/Fan characteristics during transient manoeuvres [12] ... 32
Figure 2-21: Comparison between the methods [7] .......................................... 35
Figure 2-22: HP Transient working line excursion [20] ..................................... 36
Figure 3-1: Algorithm for OD performance analysis ......................................... 41
Figure 3-2: HPC characteristics during OD [26]. .............................................. 43
Figure 3-3: Effects of operating altitude on engine performance ...................... 45
Figure 3-4: Variation of air thermodynamic properties with altitude .................. 47
Figure 3-5: Effects of ambient temperature on an engine cycle [7] .................. 48

viii
Figure 3-6: Variation of performance parameters with Mach number ............... 50
Figure 3-7: Effects of BPR on engine performance .......................................... 51
Figure 3-8: Effect of FPR on an engine performance ....................................... 52
Figure 3-9: Effect of PR on engine performance .............................................. 53
Figure 3-10: Effects of bleed extraction on engine performance ...................... 55
Figure 3-11: Effects of power extraction on engine performance ..................... 57
Figure 4-1: Slam acceleration manoeuvre [12] ................................................. 60
Figure 4-2: Fuel scheduling [7] ......................................................................... 62
Figure 4-3: Transient performance [7] .............................................................. 63
Figure 4-4: Transient performance modelling [7] .............................................. 64
Figure 4-5: Effect acceleration time on fuel schedules ..................................... 66
Figure 4-6: Effect of different fuel schedule to SFC .......................................... 67
Figure 4-7: Effect of acceleration time on TET ................................................. 68
Figure 4-8: Effect of acceleration on thrust ....................................................... 69
Figure 4-9: Effect of acceleration on engine rotational speed .......................... 70
Figure 4-10: Effect of engine acceleration on HPC SM .................................... 71
Figure 4-11: Effect of acceleration on fan SM .................................................. 72
Figure 4-12: Effect of acceleration on Fan speed ............................................. 73
Figure 4-13: Fan characteristics during acceleration ........................................ 74
Figure 4-14: Effect of acceleration on Fan characteristics ................................ 75
Figure 4-15: Effect of acceleration on HPC characteristics .............................. 76
Figure 4-16: Effects of HPC rotor inertia and simulation time on the working lines. .......................................................................................................... 77
Figure 4-17: Effects of degradation on transient characteristics of the HPC. ... 79
Figure 4-18: Effect of engine deterioration on transient SM of HPC. ................ 80
Figure 4-19: Effect of degradation engine transient acceleration thrust. .......... 81
Figure 4-20: Effect of degradation during transient acceleration on SFC ......... 82
Figure 4-21: Effect of engine degradation during transient on TET .................. 84

ix
LIST OF TABLES
Table 1-1: Specifications of the base line engine ............................................... 4
Table 4-1: Fuel schedules ................................................................................ 62
Table 4-2: COT variation with acceleration time ............................................... 69
Table 4-3: Recommended SM [12] ................................................................... 72

x
LIST OF EQUATIONS
(2-1) .................................................................................................................. 17
(2-2) .................................................................................................................. 17
(2-3) .................................................................................................................. 17
(2-4) .................................................................................................................. 23
(2-5) .................................................................................................................. 24
(2-6) .................................................................................................................. 24
(2-7) .................................................................................................................. 24
(2-8) .................................................................................................................. 24
(2-9) .................................................................................................................. 24
(2-10) ................................................................................................................ 26
(2-11) ................................................................................................................ 26
(2-12) ................................................................................................................ 26
(2-13) ................................................................................................................ 27
(2-14) ................................................................................................................ 27
(2-15) ................................................................................................................ 27
(2-16) ................................................................................................................ 28
(2-17) ................................................................................................................ 28
(2-18) ................................................................................................................ 29
(2-19) ................................................................................................................ 30
(2-20) ................................................................................................................ 30
(2-21) ................................................................................................................ 30
(2-22) ................................................................................................................ 33
(2-23) ................................................................................................................ 34
(2-24) ................................................................................................................ 34
(3-1) .................................................................................................................. 39
(3-2) .................................................................................................................. 42
(3-3) .................................................................................................................. 46
(3-4) .................................................................................................................. 49
xi
(3-5) .................................................................................................................. 49
(3-6) .................................................................................................................. 49
(3-7) .................................................................................................................. 49
(3-8) .................................................................................................................. 54
(3-9) .................................................................................................................. 54
(3-10) ................................................................................................................ 54
(3-11) ................................................................................................................ 54
(3-12) ................................................................................................................ 56
(3-13) ................................................................................................................ 56
(3-14) ................................................................................................................ 56
(3-15) ................................................................................................................ 56
(3-16) ................................................................................................................ 56
(3-17) ................................................................................................................ 56
(4-1) .................................................................................................................. 59
(4-2) .................................................................................................................. 65
(4-3) .................................................................................................................. 65
(4-4) .................................................................................................................. 65

xii
LIST OF ABBREVIATIONS
AR Aspect Ratio
AW Acceleration Work
BNPR Bypass Nozzle Pressure Ratio
BPR Bypass Ratio
CDP Compressor Delivery Pressure
CDT Compressor Delivery Temperature
CMF Constant mass Flow Method
COT Combustor Exit Temperature
CPR Compressor Pressure Ratio
CW Compressor work
DP Design Point
EEC Engine Electronic Control
EGT Exhaust Gas Temperature
FADEC Full Authority Digital Engine Control
FAFC Full Authority Fuel Control
FAR Fuel to Air Ratio
FCV Fuel Calorific Value
FMU Fuel Metering Unit
FOD Foreign Object Damage
FPR Fan Pressure Ratio
FW Fan Work
HBPTF High Bypass Turbofan
HPC High Pressure Compressor
HPR High Pressure Turbine
ICAO International Civil Aviation Authority
ICV Inter-Component Volume
IPC Intermediate Pressure Compressor
IRP Individual Research Project
ISA International Standard Atmosphere
LBPTF Low Bypass Turbofan
LCC Life Cycle Cost
LPC Low Pressure Compressor

xiii
LPT Low Pressure Turbine
LTO Landing and Take-Off
MRO Maintenance Repair and Overhaul
NDMF Non- Dimensional Mass Flow
NOx Nitrogen Oxide
NPF Net Propulsive Force
NPR Nozzle Pressure Ratio
OD Off Design
OPR Over Pressure Ratio
PLA Power Level Angle
RPM Revolutions Per Minute
RPS Revolutions Per Second
SFC Specific Fuel consumption
SL Surge Line
SLS Sea Level Static
SM Surge Margin
TET Turbine Entry Temperature
TFE Turbofan Engine
TJE Turbojet Engine
TR Transient
TSFC Thrust Specific Fuel Consumption
TW Turbine work
USSR Union of Soviet Socialist Republics
VIGV Variable Inlet Guide Vanes
VSV Variable Stator Vane

xiv
LIST OF SYMBOLS
Specific heat capacity at constant pressure
Specific heat capacity at constant volume
Weight flow rate
Bleed flow
Work Extracted
Change
F Force/Thrust
f Fuel to air ratio
H Total enthalpy
h Specific enthalpy
I Moment of inertia
L Characteristic length
M Mach number
N Rotational speed
P Total pressure
p Static temperature
Q Torque
R Gas constant
Re Reynolds number
s Second
S Entropy
T Total temperature
t Static temperature
W Weight flow
Z Height
η Efficiency
ρ Density
Bleed ratio
Angular acceleration
Bypass Ratio
Ratio of specific heat
Dynamic viscosity

xv
Blade loading
Flow function
LIST OF SUBSCRIPTS
0 Ambient condition
a Air
b burner
D Drag
e Exit
g gas
G Gross
INT Intrinsic
m Mechanical
n net
NAC Nacelle
NB No Bleed
NW No work Extraction
o Overall
pr propulsive
s Stage
STD Standard
th thermal
TO Take Off


1
1 INTRODUCTION
1.1 General
Since an aircraft gas turbine engine operates over a wide range of flight
conditions that change with altitude, flight velocity, and ambient temperature,
the performance estimation considers that the flight conditions must be known
before developing and operating the gas turbine engine in order to ascertain
that a particular gas turbine engine meets a given mission specifications.
The ability to predict the DP, OD and transient performance of a gas turbine
engine under various power setting and operating conditions is of critical
importance in order to ensure that safe limits of operation of an engine are
maintained. This prediction of engine behaviour is achieved by performing
simulations which demonstrate the performance and safety features required of
a propulsion system.
In the early stage of gas turbine development, performance parameters could
be obtained from experimental tests performed in a simulated environmental
test chamber, although recent technological advancement proves that computer
performance models such as Turbomatch of Cranfield University may be used
to simulate engine performance.
It is essential to analyse the performance of the gas turbine for its design and
off-design conditions as well as transient. Design point of an engine being the
operation mode where the engine will be operated for the maximum time of its
life. An engine is designed in such a way that it performs efficiently at this
operating point, since efficiency and the performance of the engine varies with
different operating conditions which are known as off-design points.
This study aims at analysing and simulating the transient performance of a
medium bypass ratio turbofan engine under clean and deteriorated conditions.
Transient performance is that performance regime of short duration over which
the engine adjusts to a new power setting and performance parameters
significantly change with time. During this phase many components operate
close to their performance limits, such as surge in the compressors, high

2
temperatures in the turbines and in some cases rotor over speeding. Six
simplified linear fuel schedules have been defined and will be used to simulate
the effect of acceleration times on the baseline engine transient performance
using Turbomatch 2.0. Effects of engine degradation on transient performance
will also be investigated.
Moreover, OD cases such the effects of change in operating conditions of
altitude, ambient temperature, flight Mach number as well as engine design
parameters on the base line engine performance will be looked at in order to
have a wide picture of the entire performance of the base line engine.
1.2 Base line engine and its development
In this study work a two spool turbofan engine will be considered and AI-25 TL
shown in figure 1-1 which is a modern variant of AI-25 was chosen as a
baseline engine. The AI-25 was designed to power the Yakovlev Yak-40 tri-jet
airliner, often called the first regional jet transport aircraft in the former USSR,
and is the starting point for the Lotarev DV-2 turbofan engine. The project to
develop this engine was launched in 1965, with the AI-25s first test flight in
1966, and finally cleared for production in 1967. In 1972, the AI-25 was selected
for the Polish PZL M-15 Belphegor, the world's only jet-powered biplane.
Development of the AI-25 continued and the uprated AI-25TL was designed for
use by the Czechoslovak Aero L-39 Albatros military trainer with the first flight
occurring in 1968. A smaller version of the AI-25TL, the AI-25TLK has equipped
the People's Republic of Chinas Hongdu L-11 fighter-trainer. The AI-25TLK is
also licensed built in the People's Republic of China as the WS-11 [34], [39].
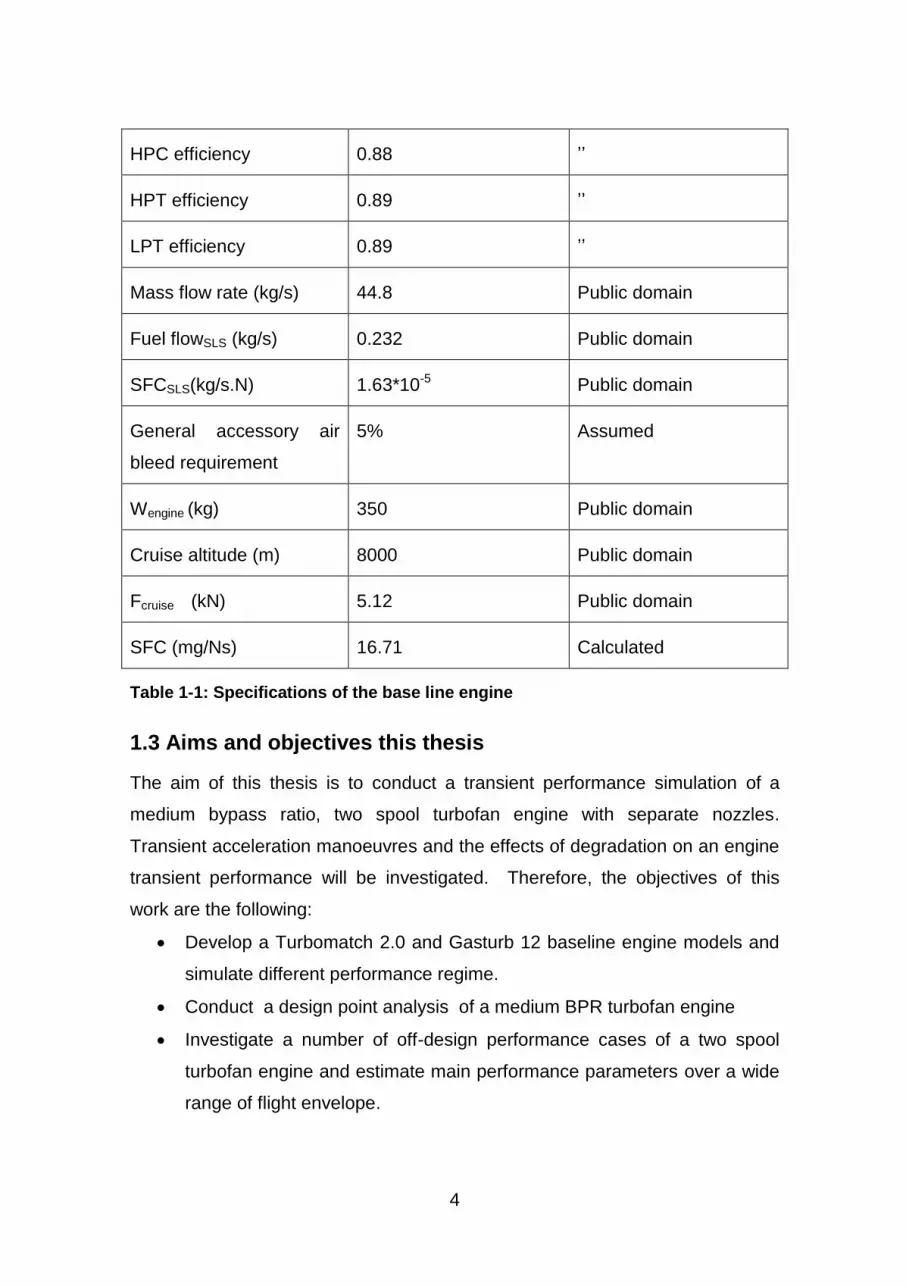
The performance and specifications AI-25TL are shown in table 1-1.

3
Figure 1-1: Baseline engine AI-25 TLK [39].
Parameter Value Source
Rated performance
FSLS (kN) TO
16.9 Public domain
Rated performance
FSLS ( Combat Power)
18.14 Public domain
OPR 9.5 Public domain
FPR 1.7 Public domain
BPR 2.2 Public domain
Fan Tip Diameter (m) 0.99 ’’
RPM 10,560 ’’
TET (K) 1281 ’’
Fan efficiency 0.88 Assumed
4
HPC efficiency 0.88 ’’
HPT efficiency 0.89 ’’
LPT efficiency 0.89 ’’
Mass flow rate (kg/s) 44.8 Public domain
Fuel flowSLS (kg/s) 0.232 Public domain
SFCSLS(kg/s.N) 1.63*10-5 Public domain
General accessory air
bleed requirement
5% Assumed
Wengine (kg) 350 Public domain
Cruise altitude (m) 8000 Public domain
Fcruise (kN) 5.12 Public domain
SFC (mg/Ns) 16.71 Calculated
Table 1-1: Specifications of the base line engine
1.3 Aims and objectives this thesis
The aim of this thesis is to conduct a transient performance simulation of a
medium bypass ratio, two spool turbofan engine with separate nozzles.
Transient acceleration manoeuvres and the effects of degradation on an engine
transient performance will be investigated. Therefore, the objectives of this
work are the following:
Develop a Turbomatch 2.0 and Gasturb 12 baseline engine models and
simulate different performance regime.
Conduct a design point analysis of a medium BPR turbofan engine
Investigate a number of off-design performance cases of a two spool
turbofan engine and estimate main performance parameters over a wide
range of flight envelope.

5
Investigate the performance behaviour of the baseline engine during
various transient manoeuvres above idle.
Investigate the effects of engine deterioration on transient performance.
1.4 Thesis Scope
This thesis is associated with performance analysis and simulation of a medium
bypass ratio, two-spool turbofan engine. The present work aims to extend the
past year’s research works in the area of gas turbine engine by focusing on the
transient performance analysis and simulation for a two spool turbofan engine.
Acceleration manoeuvre and effect of degradation on engine performance will
be investigated.
1.5 Methodology
This work will start with making a model of a base line engine to be simulated.
First of all the engine design point will be investigated using Turbomatch 2.0 in
order to get and optimise the engine performance at a reference point. OD
performance will be modelled using both Turbomatch 2.0 and Gasturb 12 in
order to investigate the base line engine to other points away from DP. This will
help in getting the wider performance picture over the wider operational envelop
and estimation of the effect of engine design variables on the engine
performance. In house Cranfield university performance calculation software,
Turbomatch 2.0 will be used for the purpose of this investigation. This program
has undergone an intensive development and testing over the past several
decades to ensure it will be able to simulate different performances under
various operating conditions of any gas turbine configuration with greater
accuracy. Of recent, a new algorithm has been added to Turbomatch 2.0 to
enable it simulate transient performance. An engine model for a two spool
turbofan engine is made using a Turbomatch input file and then tested for
convergence as shown in appendix A1. If the solution does not converge, then
the input file is revisited until convergence is achieved and then results are
analysed. Gasturb 12 engine model for off-design is made to estimate the
engine performance behaviour for various off-design cases as shown in

6
appendix B1. This performance calculation software has been developed by Dr
Joachim, Kurzke for the past two decades and is capable of simulating design
point, off-design and transient performance of different kinds of gas turbine
engines including variable cycle engines and was initially written in turbo
Pascal. Finally, the transient engine model and an engine input file with different
fuel schedules as shown in Appendix A.2, are made and run to investigate
various transient manoeuvres.
1.6 Thesis structure
This work is organised in five chapters of which an introduction is given in
chapter one. The introductory chapter gives a flavour to what the reader shall
expect to find through this report. It also gives the main objectives intended to
be achieved in this work and methodologies adopted to accomplish them. A
thorough survey of literature summarises the gas turbine performance
improvement in chapter two. Chapter two also highlights performance enabling
technologies and performance limitations. A few cases of Off-design
performance and their respective effects on an engine performance will be
discussed in chapter three. Chapter four will go around investigating transient
performance with various fuel schedules and the effects of engine deterioration
on engine transient performance. At last, chapter five will give concluding
remarks whereby results of the analysis will be presented, deferred works and
limitations to the accomplishment of the present work.

7
2 LITERATURE REVIEW
2.1 Background
It is now more than a century since human kind started experimental flights
which progressed slowly in the early days but picked up a high momentum
during the two world wars. The steady progress of powered flight has closely
followed the development of suitable aircraft power plants. Without a lightweight
and yet adequately powerful engine, controlled flight of sufficient distance would
not be possible.
The advent of the first and second world wars gave rise to increased demand of
air transport because payloads were needed to be dispatched the quickest
possible from one place to another. In various military campaigns airs
superiority was a competitive advantage to win wars and hence aviation assets
were being strategically used to shift the balance of war fighting. Major players
in these two wars invested a lot in the R&D for aircraft and engine industries
which were mainly confined within the defense organisations due to their
classified nature.
In the early age of the aerospace engine development, performance was only
optimised at a particular point which is known as design point. However, as
aerospace engines were required to perform complex mission over a wide
operational envelope, engine performance has to be revisited and optimised not
only at the design point but also at various off-design points over the entire flight
envelop.
Therefore, the post-world wars era was marked by intensive research in
improving the performance of aircraft engines especially the gas turbine. The
reciprocating engine that served propulsion for both world wars was reaching its
ultimate size and horsepower and has long been in use for low and medium
altitudes and airspeeds. The turboprop which combines the advantage, inherent
in propeller driven aircraft, of short take-offs with the higher and faster flying
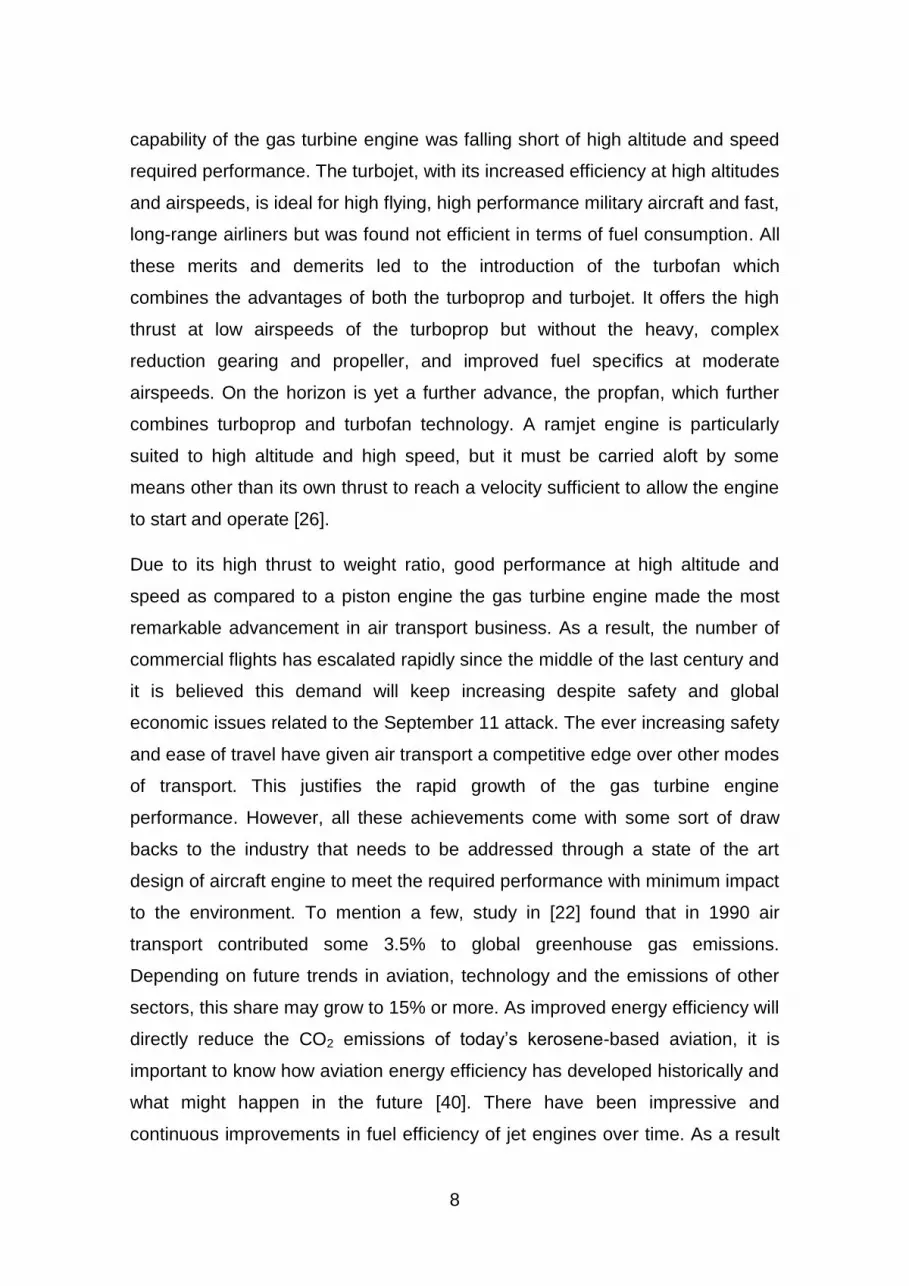
8
capability of the gas turbine engine was falling short of high altitude and speed
required performance. The turbojet, with its increased efficiency at high altitudes
and airspeeds, is ideal for high flying, high performance military aircraft and fast,
long-range airliners but was found not efficient in terms of fuel consumption. All
these merits and demerits led to the introduction of the turbofan which
combines the advantages of both the turboprop and turbojet. It offers the high
thrust at low airspeeds of the turboprop but without the heavy, complex
reduction gearing and propeller, and improved fuel specifics at moderate
airspeeds. On the horizon is yet a further advance, the propfan, which further
combines turboprop and turbofan technology. A ramjet engine is particularly
suited to high altitude and high speed, but it must be carried aloft by some
means other than its own thrust to reach a velocity sufficient to allow the engine
to start and operate [26].
Due to its high thrust to weight ratio, good performance at high altitude and
speed as compared to a piston engine the gas turbine engine made the most
remarkable advancement in air transport business. As a result, the number of
commercial flights has escalated rapidly since the middle of the last century and
it is believed this demand will keep increasing despite safety and global
economic issues related to the September 11 attack. The ever increasing safety
and ease of travel have given air transport a competitive edge over other modes
of transport. This justifies the rapid growth of the gas turbine engine
performance. However, all these achievements come with some sort of draw
backs to the industry that needs to be addressed through a state of the art
design of aircraft engine to meet the required performance with minimum impact
to the environment. To mention a few, study in [22] found that in 1990 air
transport contributed some 3.5% to global greenhouse gas emissions.
Depending on future trends in aviation, technology and the emissions of other
sectors, this share may grow to 15% or more. As improved energy efficiency will
directly reduce the CO2 emissions of today’s kerosene-based aviation, it is
important to know how aviation energy efficiency has developed historically and
what might happen in the future [40]. There have been impressive and
continuous improvements in fuel efficiency of jet engines over time. As a result

9
of this, fuel burned per seat mile in today's aircraft is 70% less than that of early
jet engines, this being attributed to improved design and performance analysis
and advanced simulation capabilities over the past couple of decades.
Of recent, fossil fuels are depleting and their prices going high and higher. With
the current trend in NOx emission regulations, this calls for an imperative
necessity for better optimization of engine fuel consumption and flight trajectory
especially for aircraft engines which is now becoming increasingly a matter of
concern more than at any previous time because of the importance of fuel
economy in air transport business. This can only be achieved by improving
engine performance particularly the transient part and control systems which
are almost inseparable. Engine variable geometry has been used to improve
the performance of an engine. Of recent, engine variable cycle is under study
and could greatly improve the performance of an engine.
In order to determine the right propulsion system for a given aircraft application,
a performance analysis and simulation has to be carried out to check if the
required size and performance capabilities given mission characteristics are
met. Each type of gas turbine engine has merits and demerits which have to be
weighed during a propulsion system selection. On the other hands, engines
designers have to make a trade-off between design constraints and
performance requirements which are most of the time hard to conciliate as
shown in figure 2-1. Figure 2-1 shows how challenging it is to meet both an
engine that has the lowest SFC and best performance.

10
Figure 2-1: Influence of mission on engine design [7]
Recent advancement in computational platforms have enhanced the prediction
of performance of gas turbine engines by use of simulation techniques and this
allowed both designers and operators to better understand the behaviour of gas
turbine engines operating over a wide range of temperatures, altitudes and fuel
schedules on the entire operational envelope.
Importantly computational platforms have incorporated transient performance
analysis capabilities which are able to predict the transient behaviour during
transient manoeuvres. To mention a few of these, Cranfield University has
developed its own in house performance software known as Turbomatch and
the other one commonly used is the Gasturb developed by Dr Joachim, Kurzke.
Transient performance can be defined as that very short period of time normally
about 4 seconds over which gas turbine engine parameters vary significantly
with time. It is of a big concern to gas turbine performance and control
engineers because of its detrimental consequence on engine safety, passenger
comfort and fuel economy when it comes to civil aircraft and a need for quick
thrust response when it comes to military aircrafts.
This part of the thesis will give an overview about the evolution of gas turbine
performance and what has been done in the past on gas turbine performance

11
analysis and simulation. Over the last century of space flight, performance
analysis of gas turbine has been at the heart of major aerospace research
centres, however, simulation of engine performance evolved out of
advancement in increasing computational capabilities of digital computers, the
breakthrough being the birth of engine digital control systems like FAFEC and
recently the FADEC.
2.2 Aero-engine performance improvement over time
Early generations of gas turbines were less useful because the power they
produced was much less than that required to drive the compressors. To
achieve positive efficiencies, attempts were made by engineers to increase TET
beyond the maximum allowable turbine material temperatures of the day which
resulted into destruction of the engine. Despite these challenges, interest in gas
turbine engines continued to increase, and developmental breakthroughs were
made in 1930s. It was only in 19th century that gas turbines evolved into useful
machines, primarily as jet engines. Components efficiencies have improved and
today efficiency as high as 90% can be achieve as a result of improved design
technology. Transition from hydro-mechanical to digital engine fuel control
system technology allowed gas turbines to operate over a wide range of flight
conditions. Of recent, engine variable geometry is a performance enhancement
where more power output and better engine control can be achieved.
Since 1939, aero engine thrust has increased over 100-fold for civil engines and
some 20-fold for military engines as illustrated by figure 2-2; the driving change
being the higher TET achievement due to better material used in gas turbine
blade and the advent of cooling technologies. Today’s engines also recorded
(thrust/weight) approaching 7.

12
Figure 2-2: Improvement in engine thrust over time [35]
TET has also been increased over years due to advancement in material
research and cooling technologies which have permitted an increase in TET
from 900 K to 2000 K today and this has allowed a significant improvement in
thrust, specific thrust and thrust to weight ratio as shown in figure 2-3.
Figure 2-3: Improvement in TET over time [35]
TET improvement and the increase in stage pressure ratio have also allowed
improvement in specific thrust as well as the thrust to weight ratio as illustrated
by figure 2-4.

13
Figure 2-4: Improvement in Specific thrust over time [15]
The rapid innovation pace in the propulsion system design brought about
radical design innovations that introduced the use of axial compressor which
improved the size of the engine diameter at the same time improving the thrust.
The advent of the axial flow compressor brought about an increase in PR from
about 4:1 in the old days and today with the ultra-bypass ratio turbofan engine
an OPR of up to 45:1 can be achieved as can be seen in figure 2-5. For
component improvements, the single-stage compressor pressure ratio has also
increased by 30 percent and at the same time the number of stages and blade
count has decreased which is a contributing factor to achieving higher specific
thrust.
Figure 2-5: Improvement in pressure ratio over time [15]
14
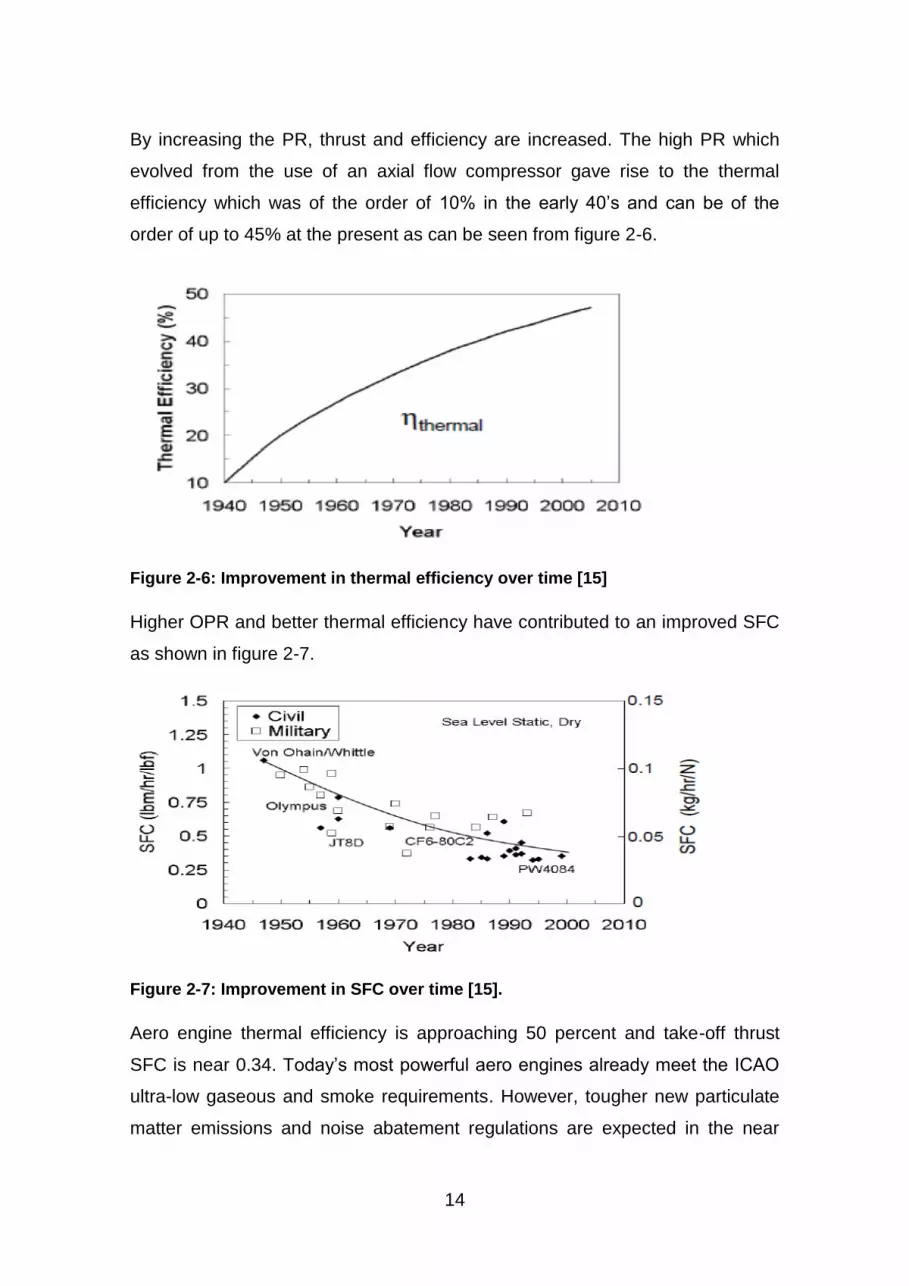
By increasing the PR, thrust and efficiency are increased. The high PR which
evolved from the use of an axial flow compressor gave rise to the thermal
efficiency which was of the order of 10% in the early 40’s and can be of the
order of up to 45% at the present as can be seen from figure 2-6.
Figure 2-6: Improvement in thermal efficiency over time [15]
Higher OPR and better thermal efficiency have contributed to an improved SFC
as shown in figure 2-7.
Figure 2-7: Improvement in SFC over time [15].
Aero engine thermal efficiency is approaching 50 percent and take-off thrust
SFC is near 0.34. Today’s most powerful aero engines already meet the ICAO
ultra-low gaseous and smoke requirements. However, tougher new particulate
matter emissions and noise abatement regulations are expected in the near

15
future. These areas will require further improvement and innovative design and
better simulation platforms. Figure 2-8 shows BPR of up to 12 achievable today
by current commercial turbofan engines such as Trent 1000. The higher the
BPR the more thrust and better SFC.
Figure 2-8: Improvement in BPR over time [15].
With the advancement of performance analysis tool, diagnostic and prognostic
techniques, life of an engine can now be estimated and hence appropriate
maintenance procedures can be implemented to lengthen its life on the wing.
Figure 2-9 shows a tremendous improvement of an engine life on the wing
which was tens of hours in 1940’s and today an engine can stay as long as
10000 hours on the wing which is of a great economic benefit to airline
companies whose main objective is to optimise down-time and hence spend
less on maintenance and hence more engine availability.
16
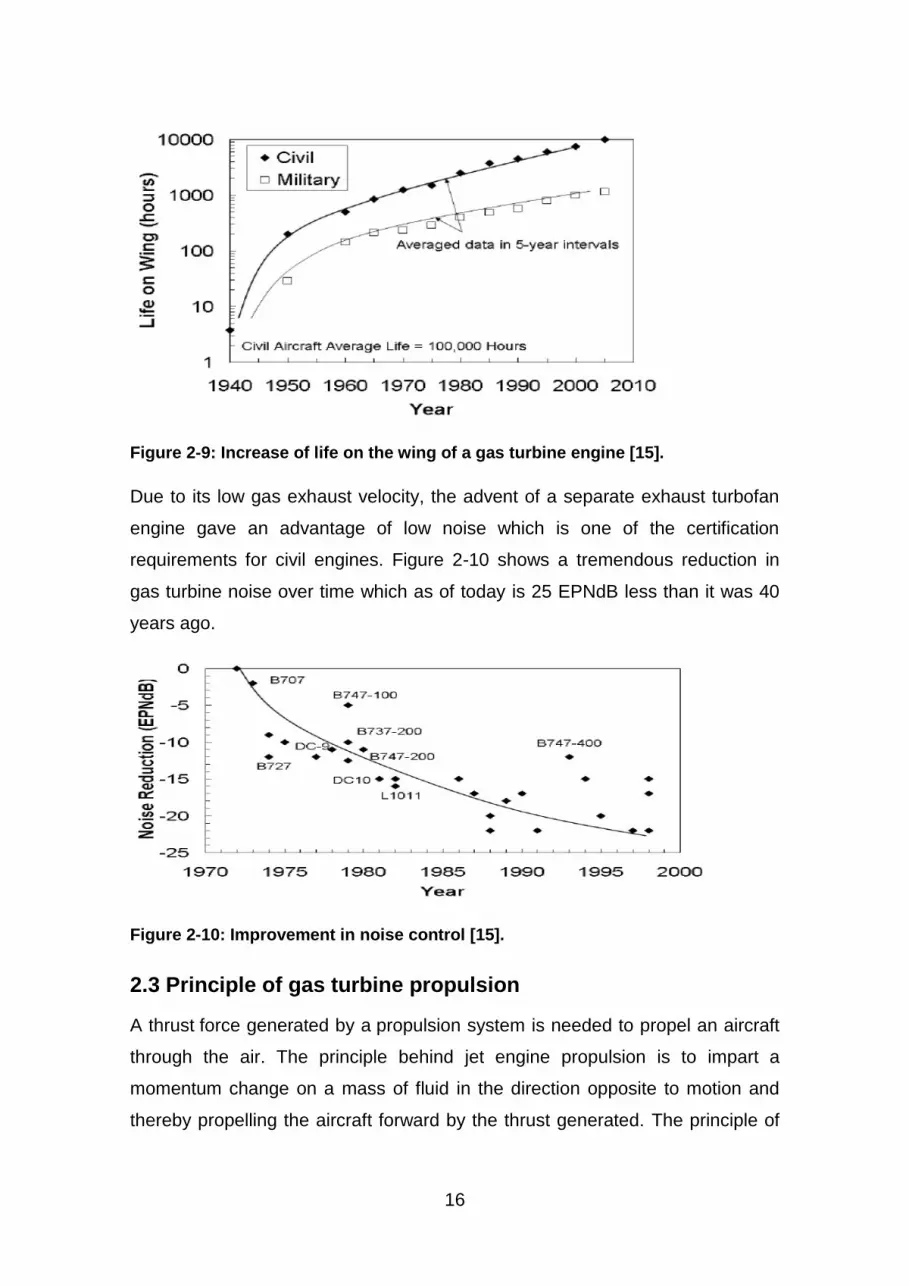
Figure 2-9: Increase of life on the wing of a gas turbine engine [15].
Due to its low gas exhaust velocity, the advent of a separate exhaust turbofan
engine gave an advantage of low noise which is one of the certification
requirements for civil engines. Figure 2-10 shows a tremendous reduction in
gas turbine noise over time which as of today is 25 EPNdB less than it was 40
years ago.
Figure 2-10: Improvement in noise control [15].
2.3 Principle of gas turbine propulsion
A thrust force generated by a propulsion system is needed to propel an aircraft
through the air. The principle behind jet engine propulsion is to impart a
momentum change on a mass of fluid in the direction opposite to motion and
thereby propelling the aircraft forward by the thrust generated. The principle of

17
jet propulsion derives from an application of Newton's laws of motion which is
mathematically represented by equation 2-1. When a fluid is accelerated or
given a momentum change, a force is required to produce this acceleration in
the fluid, and, at the same time, there is an equal and opposite reaction force. In
order to accelerate a mass of air, a gas generator which is basically a simple
turbojet as shown in figure 2-11 is used. First, the air mass is compressed, and
pressure is built up as the air goes through the compressors with little change in
velocity. Secondly, the fuel and part of the air are burned to produce heat. The
heated gases expand in the burner section and accelerate through the turbine
inlet nozzle at the outlet of the burner section. The turbines extract power to
drive the compressors. This process decelerates the gases but leaves some
excess pressure. The jet nozzle allows the gases to attain their final
acceleration and generates the outgoing momentum.
(2-1)
The velocity change is between the low velocity of the incoming air, the zero
velocity of the fuel, and the high velocity of the outgoing gases, all velocities
being relative to that of the engine. Since momentum is defined as mass times
velocity, when velocity changes are substituted in the equation 2-1 in place of
acceleration, the idea of momentum changes within the engine being equal to
force can be understood and this idea transforms equation 2-1 to equation 2-2
which is an expression of a turbojet engine thrust.
( ) (2-2)
When the static pressure at the jet nozzle or the tailpipe exit exceeds the
ambient outside air pressure, an additional amount of thrust is developed at this
point. Force is the net thrust and can be expressed by equation 2-3.
( ) ( ) (2-3)
Fundamentally, a gas turbine engine may be considered as consisting of five
main sections: an inlet, a compressor, a burner, a turbine, and a tailpipe having
a jet nozzle as shown in figure 2-11.

18
Figure 2-11: Gas turbine engine configuration [21]
Studies in [15] have found that the development of a new engine from scratch is
the most complicated, costly and tedious design process. It is therefore, found
to be common practice for engine development companies to derive a series of
engines, high bypass ratio turbofans for civil applications and low bypass ratio
turbofans for military use, basing on an existing core engine to reduce cost and
time for developing a new engine.
2.4 Classification of aerospace engines
According to reference [11] aerospace engines can be classified into two broad
categories, namely, air-breathing and non-air-breathing engines. There are five
basic air-breathing engines used for aircraft propulsion. These are the ramjet
and the four basic gas turbine variants: turbojet, turboprop, turboshaft and
turbofan. The air-breathing engines can also be subdivided into reciprocating
and reaction engines.
2.5 The Turbofan Engine
A turbofan is obtained by adding a fan at the front of a turbojet engine as shown
in figure 2-12. The engine consists of a diffuser, D, a front fan, F, a mechanical
compressor, C, a combustion chamber, H, a turbine, T, a bypass duct, B, and
an exhaust nozzle or nozzles; N. The function of the diffuser is to convert the

19
kinetic energy of the entering air into a static pressure rise. The diffuser delivers
its air to a fan, which further compresses it a small amount (PR 1.5 to 2.0).
Figure 2-12: Turbofan engine configuration [26].
The fan will force more air to enter the bypass duct than the engine core and
exit at higher speeds, resulting in greater thrust, lower SFC and reduced noise
level. A turbofan with this type of arrangement is called a two-spool turbofan
engine. Since the bypass air does not mix with the engine core stream at the
nozzle, the TFE in this study is of the separate-exhaust type. The TFE has
drawn attention to the air transport business as well as defence organisations
for various reasons including their ever increasing OPR and their ever
decreasing SFC as shown in the figure 2-13. Currently high performance
military aircrafts are powered by low BPR TFEs with mixing exhausts for their
increased thrust and low operating costs compared to their equivalent turbojet
engines. Due to their core engine low exhaust velocities, TFEs have got a good
propulsive efficiency and are able to develop enough static thrust at low speed
and low noise level.

20
Figure 2-13: Relative performance at maximum cruise [26]
Due to their low SFC, TFEs are expect to remain the main propulsion systems
of today and the future especially that they meet low NOx emission regulations
and LTO cycle which is to come into force in the near future. Geared turbofan,
ultra bypass, variable cycle and use pulse detonation combustion are other
development under way that promise much better performance for the future
TFE. According to reference [11] the BPR TFEs are categorised into two types.
These are the low BPR mixing flow turbofans and the high BPR or separate
nozzles turbofans as shown in figure 2-14 and figure 2-15 respectively.
Figure 2-14: F100-232 Afterburning Turbofan engine [4]
The turbofan offers superior ecomic benefits over a turbojet for a limited flight
regime as a result of its good SFC as shown in figure 2-13 and this rendered its
application in civil and military as well. Reference [26] shows that the low BPR
turbofan has some definite advantages over the turbojet for similar applications.
Low BPR turbofan offers better subsonic TSFC than a turbojet. Finally, the
presence of the lower energy and velocity bypass stream provides a noise
reduction advantage over the conventional turbojet.
On the other hand HBPTF offers a much better SFC and is quieter than the
earlier low BPR civil engines. The combination of a higher OPR and TET
improves thermal efficiency. They have however low specific thrust but with low
exhaust energy they have a good propulsive efficiency. For reasons of fuel
economy, and also of reduced noise, almost all of today's jet airliners are
powered by high BPR turbofans.

21
Figure 2-15: GE-90 HBPR turbofan engine
As with the turbojet engine, significant thrust augmentation is also possible with
the turbofan engine. Afterburning can be accomplished in either or both of the
exhaust streams. In fact, since the bypass stream has no combustion products,
very large temperature increases and, hence, exhaust velocity or thrust
increases are possible with the TFE. For supersonic flight an afterburner can be
added to augment thrust from the same configuration as shown in figure 2-14.
2.6 Gas turbine engine performance analysis
Engine performance starts with aerothermodynamics analysis where by all the
working fluid properties are estimated using the basic laws of thermodynamics.
Reference [9] suggests that a parametric analysis is the next most important
step in the study of the engine performance parameters in relation with the
engine design constraints. The aim of a parametric cycle analysis is to see if the
engine design constrains are still under control. The final stage in the
performance analysis is to study the overall behaviour of the whole engine over
the mission envelope to see whether or not an engine will be able to accomplish
the prescribed flight mission [27]. Engine performance analysis at conditions
away from reference point, DP; usually know as off-design analysis cannot start
until the reference point and size of the engine have been chosen by some
means. Identifying the combination of the engine design variables that provides
the best performance at each mission flight condition is the other most
22
important reason of performing a performance analysis. These three stages in
engine design are going to serve a guide in the accomplishment of this work.
2.6.1 Thermodynamic cycle of a gas turbine engine
For all types of gas turbine engine (turbojet, turbofan, and turboprop), the gas
generator has basically the same component configuration with a turbine,
compressor and a burner at its heart. The main function of the gas generator is
to convert an air-fuel mixture into a hot gas having a high pressure and
temperature. The thrust produced by the high pressure gas is the main
performance parameter and is influenced by the cycle parameters chosen
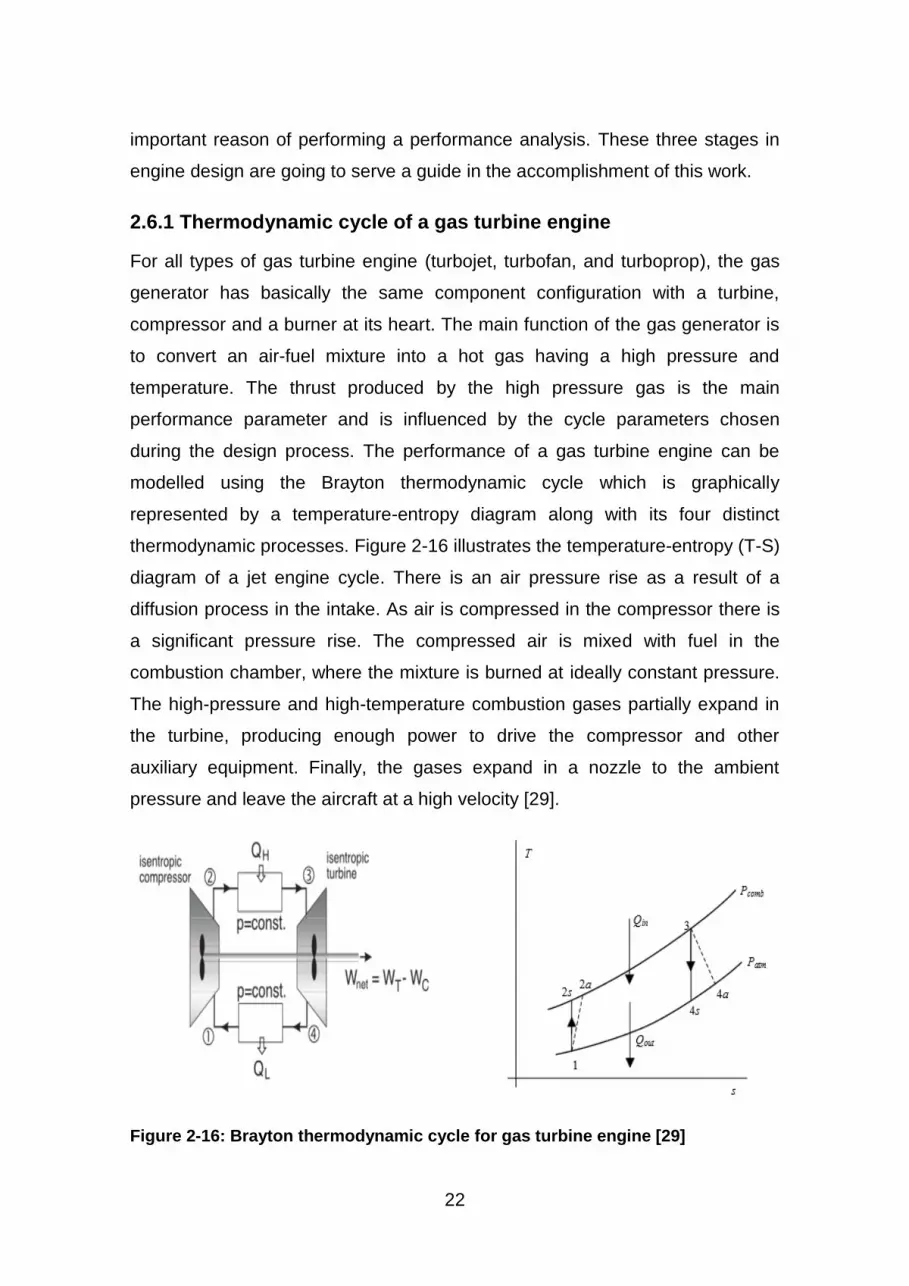
during the design process. The performance of a gas turbine engine can be
modelled using the Brayton thermodynamic cycle which is graphically
represented by a temperature-entropy diagram along with its four distinct
thermodynamic processes. Figure 2-16 illustrates the temperature-entropy (T-S)
diagram of a jet engine cycle. There is an air pressure rise as a result of a
diffusion process in the intake. As air is compressed in the compressor there is
a significant pressure rise. The compressed air is mixed with fuel in the
combustion chamber, where the mixture is burned at ideally constant pressure.
The high-pressure and high-temperature combustion gases partially expand in
the turbine, producing enough power to drive the compressor and other
auxiliary equipment. Finally, the gases expand in a nozzle to the ambient
pressure and leave the aircraft at a high velocity [29].
Figure 2-16: Brayton thermodynamic cycle for gas turbine engine [29]

23
2.6.2 Turbofan engine performance parameters
In this part of the work, the author surveyed the literatures on the performance
parameters for non-mixing turbofan engine with emphasis being put on an
engine thrust and the SFC.
The performance of an engine may be judged by the amount of the thrust force
it generates to propel an aircraft in its different flight regimes. Performance
analysis seeks to check if engine performance parameters meet aircraft thrust
requirement over the entire flight envelope for which a particular engine is
designed for, these including take-off, climb, and cruise and manoeuvring.
These performance requirements vary depending on a given engine application,
the relative importance of these being different for civil and military applications
and for short and long-haul aircraft [11]. For long-range civil aircraft fuel
consumption is the dominant parameter. Superior performance is a prime
criterion for military engine selection. For cargo airplanes the maximum payload
is the key performance requirement.
The primary measures of the engine's overall performance are the engine
uninstalled thrust and the thrust specific fuel consumption (TSFC). The amount
of thrust generated by a TFE will be influenced by the combination of the design
variables such as FPR, BPR, OPR and TET and operating conditions.
2.6.3 Engine Thrust
Reference [19] defines thrust as the propulsive force responsible for propelling
the aircraft in different flight regime. Reference [17] has found that due to
viscous losses in the engine intakes, bleed and power extraction as well as
installation losses, the thrust generated by an engine is less when installed.
Therefore, whenever possible use installed sea level thrust as a performance
reference. From the law conservation of mass and momentum, thrust of a TFE
can be derived.
(2-4)

24
Making use of the relations: and we can express the
engine fuel flow as: which allows us to define the fuel to
air ratio given by equation 2-5.
(2-5)
And therefore, ( )
According to the momentum equation, a two stream turbofan engine gross
thrust is given by equation 2-6.
[( ) ] ( ) ( )
( )
(2-6)
Static thrust is important performance parameter and should be evaluated in the
early performance analysis. For a turbojet with unchoked nozzle under static
conditions, the take-off thrust is given by equation 2-7.
( ) (2-7)
The static thermal efficiency is given by equation 2-8.
( ) ( )
(2-8)
From equation 2-7 and 2-8, the take-off thrust is given by equation 2-9.
(2-9)
For a given rate of flow and thermal efficiency,
. Equation 2-9 shows the
advantages of propeller engines over turbojet and turbofan engines. Due to
their low exhaust velocities they are capable of developing a high thrust and
therefore, are able to take-off from short runways.

25
2.6.4 Factors affecting engine performance
If a turbofan engine were operated only under static conditions in an air-
conditioned room at standard day temperature, there would be no need to
change the quantities used in the foregoing performance equations for net and
gross thrust at any given throttle setting. However, all engines installed on an
aircraft must operate under varying conditions of airspeed and altitude. These
varying conditions will radically affect the temperature and pressure of the air
entering the engine, the amount of airflow through the engine, and the jet
velocity at the engine exhaust nozzle [19]. Although some of these variables are
compensated by the engine fuel control, many of the changes will affect the
thrust output of the engine directly. In actual practice, the equation presented
previously will seldom be used directly to calculate engine thrust. Nevertheless,
an understanding of the effect on the thrust equations of the several variables
that will be encountered during normal engine operation will serve to illustrate
how the changing conditions at the engine air inlet affect engine performance in
flight and on the ground. References [6], [7] and [11] describe the factors
influencing the variation of an engine thrust. These factors are related to engine
power settings and ambient conditions. As seen from equation 2-3, the engine
thrust depends mass flow rates, FAR, flight speed, exhaust jet velocity each of
them depending on several other parameters. Due to the effects of power plant
integration on the airframe on the engine performance, [19] suggests an
accounting method of thrust quantification and hence define the net propulsive
force. The installed performance of the engine can be greatly affected by the
quality of air flow delivered to it by the air intake. Changes in the quantity of air
mass flow through the intake and nozzle and the nozzle pressure ratio affect the
external flow field in the vicinities of the intake and the nozzle, so causing
changes in the local static-pressure distribution on the fore-body and after-body
of the nacelle.
Losses of engine performance are more pronounced for a buried engine than
podded engine. In the case of the buried engine installations the internal
performance of the propulsion system is significantly eroded by the loss of flow
distortion in the long and, perhaps, curved intake duct and may be affected by

26
the effect of flow distortion on the engine. Nozzle performance is affected as a
result of the change in nozzle entry conditions that occur. The effects of losses
due to the intake must therefore be included in the methodology for determining
the net propulsive force and efficiency of the propulsion system. This involves
accounting for the uninstalled thrust of the engine and then the thrust
corrections due to the installation, intake drag and nacelles after-body drag are
applied in an explicit manner. Equation 2-10 gives the amount of thrust we
would expect from an engine when installation losses have been accounted for
by applying the required correction factors.
(2-10)
Where
(2-11)
And
(2-12)
Equation 2-12 is the definition of thrust quoted by the engine manufacturer. It
can be derived from the measurements of the gross thrust and airflow of the
uninstalled engine in the sea-level test cell and in the altitude test cell. The
standard net thrust does not take into consideration installation losses that
appear on the engine internal performance account. Typically, these result from
losses of intake efficiency of total pressure recovery ( ) and from the effect of
air bleed ( ) and power off-take (POT). These also act to cause a decrease in
thrust available from the engine and an increase in SFC.
In certain circumstances was taken to approximately equal to NPF of
simple engine installation and historically, was used uncorrected for so called
installation effects with the airframe drag to determine overall aircraft
performance throughout all regimes of aircraft operation. As the need for
greater precision in the definition of the aircraft performance increased, the
speed range of the aircraft and the power range of the engines increased, the

27
installation terms became more important and their inclusion in modern
propulsion-system force accounting is now indispensable.
2.6.5 Specific Fuel Consumption
The TSFC is a crucial engine performance parameter that reflects engine fuel
consumption and allows an easy comparison of one engine fuel consumption
efficiency among various engines. It also has a direct influence on the cost of
operating an aircraft. For jet engines, SFC is given by equation 2-13.
(2-13)
Values of TSFC strongly depend on the flight speed. As Mach increases, the
optimum TSFC occurs at a progressively lower bypass ratio and degrades with
increasing Mach number as shown in figure 3-6. In designing an engine, the
propulsion engineer optimizes the performance for a specific mission of the
aircraft. For instance, a transport aircraft designed to cruise at Mach 0.8 might
have a BPR 6 and FPR 2. A fighter type aircraft presents a more complex
problem since the overall mission is divided into several phases, each requiring
a different Mach and altitude combination.
2.6.6 Thermal efficiency
Thermal efficiency ( )of an engine is defined as the ratio of the net kinetic
energy gain extracted from the working fluid to the thermal energy obtained by
combustion of fuel [33]. It is the efficiency of energy conversion within the power
plant itself as defined by equation 2-14.
[
]
(2-14)
For a two-stream engine, equation 2-14 can be written as equation 2-15 when
the nozzles are choked.
( )
( )
( )
(2-15)

28
Figure 2-17: Variation of thermal efficiency with OPR [26]
In ideal engine cycle, thermal efficiency increases with an increase in
OPR as illustrated in equation 2-16, however, in a real cycle, thermal
efficiency also depends on engine temperature. By increasing the
engine OPR the compressor temperature and pressure delivery
increases which leads to a reduction in energy input into the cycle and
hence less fuel which favours high thermal efficiency and better SFC as
illustrated by figure 2-17.
(
)
(2-16)
2.6.7 Propulsive Efficiency
The propulsive efficiency ( ) can be defined as the rate at which the total
kinetic energy of the exhaust gases is being converted into propulsive power
( ) of the engine as shown by equation 2-17.
(
)
(2-17)

29
Equation 2-18 gives a more simplified and easy to analyse form of propulsive
efficiency which is known as Froude equation for propulsive efficiency.
(2-18)
Analysis of equation 2-18 implies that if the flight velocity tends to the jet
velocity the kinetic energy of the jet is being used very efficiently and the
propulsive efficiency approaches one and consequently the thrust approaches
zero. High propulsive efficiency is important if an engine design is to be
optimised for SFC.
The propulsive efficiency is a measure of the effectiveness with which the
propulsive duct is being used for propelling the aircraft. To achieve higher
propulsive efficiency, an engine has to be designed for higher OPR and
moderate TET which is a principle upon which turbofans are built.
Figure 2-18: Variation of the propulsive efficiency with airspeed [26]
As shown in figure 2-18, in normal cruising speed ranges, the propulsive
efficiency of a turboprop remains more or less constant, whereas the propulsive

30
efficiency of a turbojet increases rapidly as airspeed increases. This suggests
that turboprops and turbofans offer the best performance at low speeds as
compared to turbojets.
2.6.8 Overall Efficiency
The proportion of fuel power that is usable as propulsive power is known as
overall ( ) of the engine. The propulsive efficiency is the product of the thermal
and propulsive efficiencies as defined by equation 2-19.
(2-19)
The overall efficiency of a turbofan with unchoked nozzles is given by equation
2-20.
[( ) ]
( )
(2-20)
The overall efficiency is related to the SFC by equation 2-21 which tells that a
higher over efficiency is needed if optimum SFC is to be achieved.
(2-21)
2.7 Gas turbine engine performance simulation
The design and control complexity and the wide range of mission to be fulfilled
by current aero-engines require some forms of computational platform capable
of predicting their performance under different operating conditions. These
estimates are done using computer simulations unlike physical experiments as
was used to be done in the old days.
Gas turbine performance simulation is an essential process in predicting OD
performance of a gas turbine engine. It is done to establish a safe operation
region of the propulsion system. Performance simulation can provide important
data not only to confirm performance characteristics in much wider flight

31
envelope, which experimental tests are not able to carry out, but also to design
the engine controller or the integrated flight control system.
2.8 Gas turbine engine transient performance
The process of an engine operating point moving from one off-design point to
another off-design point is called the dynamic response and the kind of
performance during this migration is called a transient performance during
which engine performance parameters significantly change with time. It is of
significant importance to the engine designer and performance engineer due to
its detrimental effect on engine operational safety. It deals with investigation of
engine response to various fuel schedules.
A rapid increase in fuel flow will result in an increase in TET and thrust. As the
turbine is designed to operate chocked, the quantity ( √
) remains nearly
constant. This in turn causes a sharp increase in , the turbine inlet pressure in
order to maintain the turbine flow capacity constant. Whilst the increase in
turbine power provides an accelerating torque, the high rotor inertia will ensure
that the rotational speed remains initially nearly constant. The compressor also
will continue to operate essentially at constant speed. As a result, the CDP will
suddenly increase to match the increased turbine inlet pressure demand.
During this instantaneous transient change, the compressor NDMF ( √
) will
also remain essentially constant because of choking.
Figure 2-19: HPC characteristics during transient manoeuvres [12]

32
However, since the CDP has increased, the operating point on the compressor
map will move to a higher point of PR. Due to this increase in PR, the result is
also an increase in static pressure and hence the air working fluid density.
Under conditions of rapid acceleration at any rotational speed, rear stages of a
multi-stage axial flow compressor move towards stall as the operating point
migrates as shown in figure 2-19. In the case of HPC, the deceleration
manoeuvre takes an opposite trends where by the transient working line moves
below the steady sate working line as shown in figure 2-19.
During the acceleration of the LPC/IPC or Fan the transient working line initially
moves above the steady state working line towards the surge line and then
moves below the steady state working line as the acceleration proceeds until a
new steady state condition is reached as shown in figure 2-20. During the
deceleration, the opposite happens as shown in figure 2-20.
Figure 2-20: LPC/IPC/Fan characteristics during transient manoeuvres [12]
Therefore, the understanding of the transient behaviour of the engine is useful
to map the deflection of the working line and enables the control system to
maintain the fuel flow schedule such that the engine operating line will remain
within region bounded by the surge line and flame out line.

33
2.9 Transient phenomena
Reference [7] and [12] discuss some of the phenomena associated to with
transient manoeuvres.
2.9.1 Heat soakage
There is a significant net heat transfer between the working fluid and engine
metal during transient performance regime as compared to steady state
performance as a result of fast fuel addition or removal. One event to consider
is the heat transfer when an engine is accelerated from idle to full thrust where
the engine carcass must soak to a new high steady state operating temperature
[12]. Finding in [7] shows that nearly 30% of excess fuel energy is absorbed by
engine metal. This net heat transfer from the working fluid to the metal is termed
as heat soakage and has a significant effect on engine performance such as
lowering the engine surge line. The resulting thermal expansion is found to be
responsible for clearance change in components during transient phase. One of
the effects of clearance changes is that of modifying component efficiency.
Study conducted by Lakhaminarayana has found that losses due to clearance
change as a result of heat transfer are of the order given by equation 2-22.
[ (
)
] (2-22)
The changes in performance due to the modified efficiencies of compressors
and turbines resulting in non-design clearances are generally small. However,
the change of efficiency of the HPT can have a significant effect on the
predicted performance.
2.9.2 Volume dynamics
Steady state operation assumes continuity of mass flow across a given
component which is true in virtual of the principle of conservation of mass.
However, due to transient operation, there is a variation of temperature,
pressure and hence density of the fluid with time and therefore mass flow
entering a duct is no longer equal that leaving it especially for components with

34
large volume. Assuming that turbine operates under choked conditions, its inlet
( √
) and outlet (
√
) NDMF are nearly constant. The temperature ratio
and pressure ratio
across the turbine also remain nearly constant. The power
produced by the turbine is a function of the mass flow and inlet and outlet
temperatures to the turbine as shown by equation 2-23.
( ) ( )
(2-23)
Equation 2-23 shows that the turbine power is a function of TET. To maintain
the NDMF of the turbine constant while the TET is increasing, the pressure in
the combustion chamber needs to be increased by a square root of the turbine
inlet and outlet temperature ratio increase. The increase in turbine power will
also result in an increase in compressor power but not at the same rate as that
of the turbine.
( ) ( )
(2-24)
The surplus power, W, obtained from the difference between the turbine and
the compressor powers makes the shaft to accelerate/decelerate and moves
the compressor operating point to a new position on the compressor map.
The consideration given to volume dynamics will determine whether CMF or
ICV method is to be used to simulate the transient performance.
2.9.2.1 The constant mass flow method (CMF)
According to [12] CFM assumes that the mass flow of the working fluid entering
the component must equal the mass flow leaving the component. The
advantage of this approach is that the step change during iterative execution of
the simulation can be longer than that in ICV method and therefore, the analysis
could be performed faster. This method gave advantage in performing transient
simulation in the past when real time simulation of the transient was necessary
but computers were limited in their processing speed. This method also suits for
simulating engines with smaller components’ volume. Findings in [3] have

35
shown that the results of the CMF method were very similar to those obtained
by the ICV method, the main difference occurring in the first part of the transient
running line on the compressor map as shown in figure 2-21.
2.9.2.2 The inter-component volume method (ICV)
This method provides more accuracy when working with component with large
volumes. The accuracy of the ICV rises with more accurate estimation of
component volumes [3].
Since ICV method considers the gas storage change due to thermodynamic
changes, it is believed to produces more accurate results especially when
working with components with large volumes as shown in figure 2-21.
Figure 2-21: Comparison between the methods [7]
2.9.3 Tip clearance changes
During acceleration manoeuvre the thermal growth of compressor or turbine
discs is slower than the pressure and thermal growth of the casings causing the
blade tip clearances to be temporarily increased. The converse is true during
deceleration which can lead to rubs. The major effect of tip clearance change is
the change in engine geometry effect which affects its map, the main issue
being lower surge margin lines and second order effect being that of reduction
in flow capacity and efficiency.

36
2.9.4 Combustion delay
There is a time delay between fuel leaving the injector and actually burning to
release heat within the combustor. For steady state performance this is
irrelevant, however, for transient performance it should be considered [12].
2.9.5 Control system delays and lags
Due to their inertia, hydro-mechanical components of the fuel control systems
such as fuel valves, VIGV actuation rings, etc. take a finite time to move to new
positions demanded by the control system during transient manoeuvres. This
finite time may comprise a delay, where there is no movement for a given time
and/or lag where the device is moving but lagging behind the demanded signal
[12].
2.10 Operability concerns
Transient performance manoeuvres bring about migration of the working line to
and fro the surge line. The extent of this migration brings about undesirable
events which must be mapped and controlled by engine control system. One of
the most important operability concerns is the excursion of the working line
which happen when the compressor is trying to provide PR and mass flow that
it has not been designed for as illustrated by figure 2-22 which may result into
either surge, rotating stall of locked stall.
Figure 2-22: HP Transient working line excursion [20]

37
2.11 Previous research works
A number of academic works have been conducted within the department of
power and propulsion at Cranfield University both at masters and doctorate
levels with an aim to bring more light about the transient phenomena and how
they affect gas turbine performance. Transient operation cannot be avoided
since it is inherent within an engine operation, however, all research works
being done aim at alleviating its negative effects and making this process more
or less smooth. The department of thermo-power has made a big achievement
in improvement the in house Turbomatch performance calculation software from
steady state and off-design performance calculation by adding in a transient
performance capability which students of thermo-power are currently using to
conduct their respective projects. Currently Turbomatch is capable of simulating
transient performance above idle. Efforts are being made so that in the future
performance like shut-down and hot reslam can also be simulated. Research in
[37] has investigated the effect of acceleration on transient performance of a
HBPTF engine and found that COT was detrimental during acceleration to the
usage of different fuel schedules. The author also found that during acceleration
of degraded engine, there was a small effect on the HPC SM while same results
were found for the fan and LP during deceleration. Author in [38] investigated
the influence of air bleed on the transient performance and found that due to
bleed acceleration response will take longer while deceleration will respond a bit
faster. He also found out that power off-take had similar effect on transient
performance. The same author again found that fuel increase that result into
20K increase in TET will result in reduction of about 50% of component life.
2.12 Conclusion
In this part of the thesis, literature about gas turbine performance evolution was
surveyed and enabling technologies that led to the gas turbine engine
performance we know today were discussed. Material research, advances in
aerodynamic design and cooling technologies were cited to have led to modern
gas turbine engines. The two world wars and increase in air transport demand
were the main drivers to performance improvement over years. Also fuel

38
economy and environmental regulations on NOx are the current drivers for
performance improvement. Of today, the most focused area of performance
research is the transient performance due to its effect of the performance
characteristics of engine components. This part has also mentioned on
performance optimisation by matching the desired performance parameters with
engine design variables depending on the mission of the aircraft. Performance
analysis begins with thermodynamic analysis, followed by parametric analysis
and an overall analysis to see if the design variables are still under control.

39
3 ANALYSIS AND SIMULATION OF OFF-DESIGN
PERFORMANCE OF A TWO SPOOL TURBOFAN
ENGINE
3.1 Introduction
Although the main aim of this thesis was to investigate the transient
performance of a two spool turbofan engine, this work also had looked at OD
performance which is an important evaluation to see the effects of the ambient
conditions and power setting on the performance of this engine over the wide
range operational envelope. A gas turbine engine is designed and optimised for
its main mission that is where the engine will be spending much of its time in
operation. Civil aircraft engines are optimised for SFC at cruise performance in
order to achieve the longest range. Military aircraft engines are optimised for
best performance depending on mission requirements such quick thrust
response during attack or evasive actions, enough flight endurance for
surveillance aircrafts. For transport aircrafts, take-off performance is of
paramount considerations. DP optimisation will set the main engine parameters
for the engine and will give the information required for components’ sizing thus
fixing the engine basic geometry. Even though an engine is designed to meet a
given DP performance, in the early engine preliminary design, some OD cases
such as critical points, margins for bleed, power off-takes will have to be looked
at. The performance of a gas turbine engine can be expressed by equation 3-1.
(
√ )
(3-1)
During OD performance, as PLA is varied, so does the fuel flow and hence
rotational speed as shown in equation 3-1. At higher fuel flow and low ambient
temperature, the non-dimension speed increases, and so does the PR and the
mass flow rate and hence the engine thrust. Therefore, equation 3-1 illustrates
how engine power setting and ambient conditions can affect an engine output
and behaviour during OD performance. The performance behaviour of a gas
turbine engine is graphically represented on a characteristic map where the
quasi NDMF over a wide range of quasi non-dimensional speed is plotted

40
against the PR and isentropic efficiency. The performance requirement is
mainly determined by the amount of thrust the engine develops for a given set
of conditions. The majority of aircraft gas turbine engines are rated at standard
day conditions. This provides a baseline to which gas turbine engines of all
types can be compared. Many factors affect both the efficiency and the
performance of the engine. The mass flow rate of air through the engine will
dictate engine performance. The compressor PR, the engine operating ambient
conditions, and the individual component efficiencies will also influence both the
overall engine performance.
In this work the baseline engine OD performance simulation was modelled
using Turbomatch 2.0 and Gasturb 12 at several real time operating conditions.
Both Turbomatch 2.0 and Gasturb input files for OD performance simulation are
made as shown in appendix A and B respectively. Based on the results of these
simulations, OD performance charts highlighting the effects of altitude, flight
Mach number, BPR, OPR, FPR, power and bleed extraction on engine
performance parameters are presented. OD performance analysis is based on
the principle of component matching where by flow continuity and energy
balance are applied throughout the engine component as shown in figure 3-1.
As changes in thermodynamic properties of the working gas take place
rematching the flow and power to attain new steady state condition is needed.
Both performance results from Turbomatch 2.0 and Gasturb 12 are quite
similar.
In this part of the work, OD analysis of a two spool TFE will be carried out as
per the algorithm shown in figure 3-1 and basic performance and design data of
table 1-1 will be used. Assumption is made that the turbine is operating between
choked nozzles so that pressure and temperature ratios of DP will remain
almost the same as those for OD.

41
Begin
User defined Input
GTE LIBRARY
Input ambient conditions and
operating parameters at
intake
Guess PRCompute T3
and P3
Estimate gas properties at intake
P2=P0-ΔPOT2=T0
W2=W0
Input Etha compressor
Compute the compressor work
Input TET for ODDetermine P4 for OD
Determine W4 for OD=W2+Wff
Is (NDMF)OD=(NDMF)DP?
NO⇒GUESS A NEW Wo
W5=W2
Etha*TW=CWYES
Calculate T5 ideal and P5 and
(NDMF)5 for both turbines
Input Etha turbine
Evaluate both nozzle condition for choking and compute exit conditions for gas properties
Is A6=A6 of DP?
NO⇒Guess a new PR
Process OD engine parameters
YES
End
Figure 3-1: Algorithm for OD performance analysis

42
3.2 Off-design Performance analysis
OD simulation uses thermodynamic matching model where performance
estimates can be obtained by guessing initial values of mass flow and PR and
doing a number of iterations. The engine design having been fixed during the
DP, now the user is only allowed to vary operating conditions, blade angles and
a handle (fuel flow, TET or HPC corrected rotational speed). The objective of
thermodynamic matching is to find values of non-dimensional parameters of
one component matched to parameters of other components. Reference [18]
gives a brief description of the behaviour of the HPC at normal steady state
operating conditions of the engine over a reasonable range of power settings as
shown in figure 3-2 and labelled as steady state working line. The normal
steady state operating points on the compressor lie along a line approximately
parallel to and below the surge line. The working line shown is the locus of
steady state operating points. During engine acceleration, the working line rises
above the steady state locus and sufficient margin must be allowed to permit
the engine to accelerate at the required rate without surging. At low rotational
speeds the working line tends to approach the surge line.
The engine is designed such that the compressor surge line and the working
line are separated by a margin known as the surge margin the amount of which
is given by equation 3-2. This margin must be big enough to allow for engine
acceleration, engine deterioration and disturbed inlet flow to happen without
surge. If the air entering the compressor is turbulent or non-uniform, the surge
line will fall. A typical surge margin is measured at constant ( √
)
and is given
by equation 3-2.
(3-2)
As the compressor operation moves from one OD point to another, this sets
operating conditions through a transient phase which gives locus of typical
transient operating points during the acceleration of an engine from low power
to high power. At low power settings, there are some engines which tend to
operate near the region where the compressor cannot operate. In such
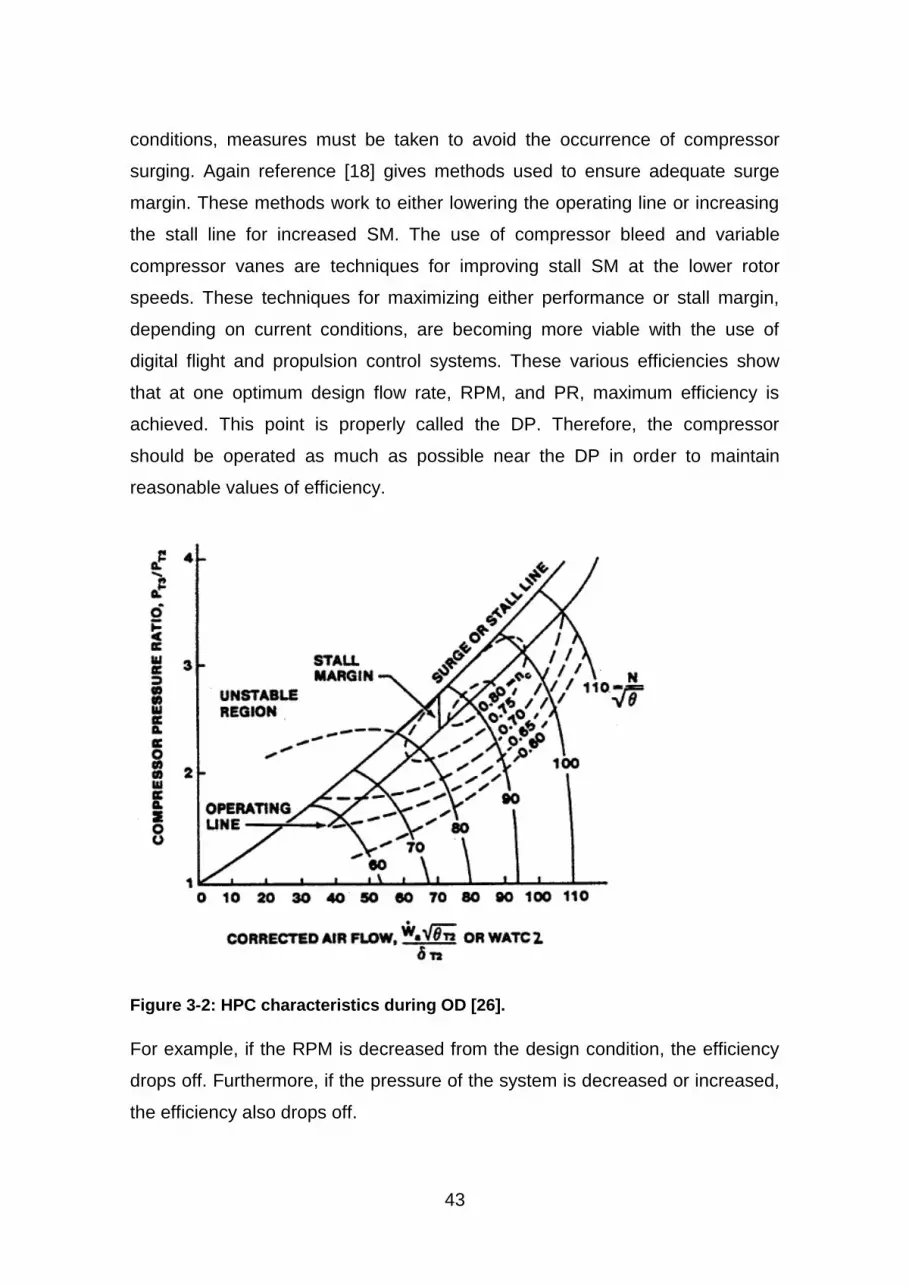
43
conditions, measures must be taken to avoid the occurrence of compressor
surging. Again reference [18] gives methods used to ensure adequate surge
margin. These methods work to either lowering the operating line or increasing
the stall line for increased SM. The use of compressor bleed and variable
compressor vanes are techniques for improving stall SM at the lower rotor
speeds. These techniques for maximizing either performance or stall margin,
depending on current conditions, are becoming more viable with the use of
digital flight and propulsion control systems. These various efficiencies show
that at one optimum design flow rate, RPM, and PR, maximum efficiency is
achieved. This point is properly called the DP. Therefore, the compressor
should be operated as much as possible near the DP in order to maintain
reasonable values of efficiency.
Figure 3-2: HPC characteristics during OD [26].
For example, if the RPM is decreased from the design condition, the efficiency
drops off. Furthermore, if the pressure of the system is decreased or increased,
the efficiency also drops off.

44
3.3 OD Simulation and results analysis
3.3.1 Effects of rotational speed on engine performance
Rotational speed is a function of ambient condition and fuel flow the maximum
value of which is determined by the stressing considerations and is a constant
at all flight conditions. The minimum value, however, is not constant and there is
certain rotational speed (self-sustaining speed) below which the turbine power
falls off more rapidly than the compressor power, so that the engine decelerates
to rest. To allow for contingencies, the fuel control system must be set to give a
static idling speed that is well above the self-sustaining speed, a typical value of
which is 40% of the maximum rotational speed.
On a compressor map as seen from figure 3-2, increasing the rotational speed
results in an increase in mass flow and PR (which usually requires an engine
geometry change); while the mass flow falls slightly and eventually a point is
reached where the compressor blading cannot produce more PR without
stalling. The compressor will now be operating in a region of aerodynamic
instability or surge where it is no longer capable of providing the required
working PR.
At a fixed non-dimension rotational speed, lowering the PR, the mass flow rises
and reaches a maximum caused by choking of the flow usually in the rear
stages of a multi-stage compressor. As N rises, the engine pumps more air and
mass flow rises at the same time the PR and TET rise with N, causing the
specific thrust to increase. These two effects combine to give a rapid increase in
net thrust, although the rate of increase may tail off somewhat as the maximum
rotational speed is approached; where this happens the rate of mass flow
increase is diminishing due to internal choking of the compressor exit.
3.3.2 Effects of Atmospheric Conditions
The performance of the gas turbine engine is dependent on the mass of air
entering the engine which also varies with altitude. At a constant speed, the
compressor pumps a constant volume of air into the engine with no regard for
air mass or density. If the density of the air decreases, the same volume of air
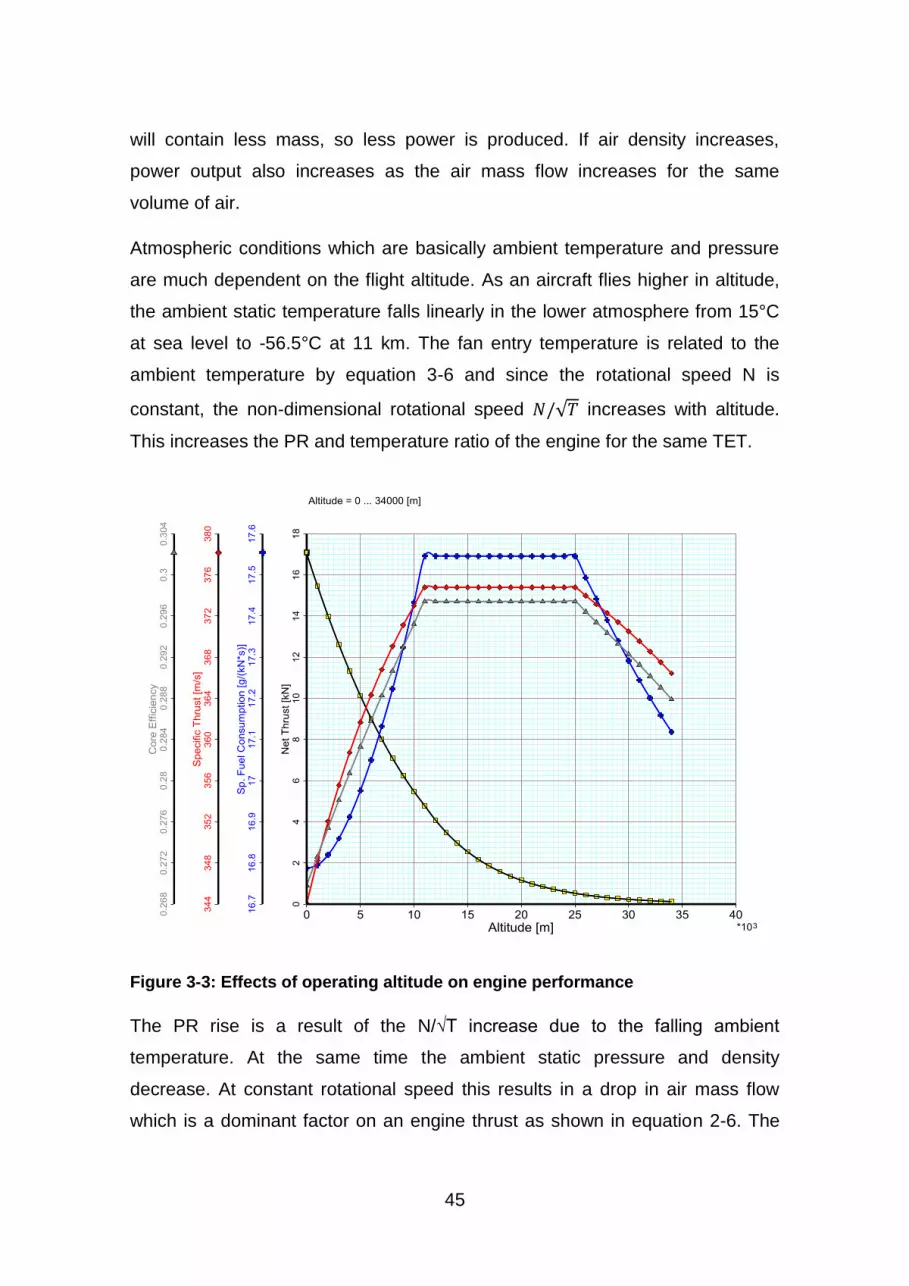
45
will contain less mass, so less power is produced. If air density increases,
power output also increases as the air mass flow increases for the same
volume of air.
Atmospheric conditions which are basically ambient temperature and pressure
are much dependent on the flight altitude. As an aircraft flies higher in altitude,
the ambient static temperature falls linearly in the lower atmosphere from 15°C
at sea level to -56.5°C at 11 km. The fan entry temperature is related to the
ambient temperature by equation 3-6 and since the rotational speed N is
constant, the non-dimensional rotational speed √ increases with altitude.
This increases the PR and temperature ratio of the engine for the same TET.
Figure 3-3: Effects of operating altitude on engine performance
The PR rise is a result of the N/√T increase due to the falling ambient
temperature. At the same time the ambient static pressure and density
decrease. At constant rotational speed this results in a drop in air mass flow
which is a dominant factor on an engine thrust as shown in equation 2-6. The

46
engine behaves as if N was in fact rising, giving increased PR, TET, and
specific thrust, which partly off-sets the effect of falling mass flow. In the
stratosphere, however, the fan entry temperature and rotational speed of the
fan are constant, so that the specific thrust no longer improves with increase in
altitude as shown in figure 3-3 due to constant PR and TET. The resulting
improvement in PR and temperature ratio as TET increases in the troposphere
causes an increase in thermal efficiency.
Figure 3-3 shows the variation of the engine net thrust with altitude. Even
though temperature remains constant at an altitude over 11km, however,
pressure keeps on decreasing, and hence net thrust. As mentioned above the
improvement of PR and temperature ratio in the troposphere results in an
increase in thermal efficiency as SFC falls. Although the propulsive efficiency
simultaneously falls, the former effect predominates due to the fall in SFC,
levelling off to a constant value in Stratosphere
Atmospheric conditions affect the performance of the engine since the density
of the air will be different under different conditions. On a cold day, the air
density is high, so the mass of the air entering the compressor is increased. As
a result, higher thrust is produced. In contrast, on a hot day air density is
decreased, resulting in a decrease in engine output. Also altitude variation has
got an influence on the Reynolds number, air becomes thinner and thinner and
density decreases and hence the Reynolds number as shown in equation 3-3.
As altitude increases, the ratio of density to absolute viscosity ( ⁄ ) falls at a
certain altitude (which is lower for small engine than for a larger one, in virtual of
linear dimension term) the Re will fall below a critical value of about 105, and the
flow about the blades will start to separate and the compressor blades will
eventually stall.
( ⁄ ) (3-3)
Figure 3-3 shows the effect of Re on engine SFC which is seen to increase as
Re decreases up to an altitude of 11km. Beyond an altitude of 11km where
ambient temperature remains constant, the SFC is seem to remain constant as

47
density and hence Re remains constant. At an altitude above 25 km, ambient
temperature starts increasing and hence SFC begins dropping. Thus two main
effects related to the altitude, the dominant one being the pressure effect, which
reduces the air density and hence the mass flow and thrust but does not alter
the non-dimensional performance of the engine. The temperature effect is of
less magnitude of altering the non-dimensional speed.
Figure 3-4: Variation of air thermodynamic properties with altitude
Another pronounced effect related to atmospheric condition that was
investigated in this work is the effect of day temperature which affects the
performance of a gas turbine engine. Study in [7] has found that on a hot day
due to increased , compression work on a hot day is larger than on the cold
day which has an effect of reducing the specific work of the engine in an ideal
case as illustrated in figure 3-5. The ideal cycle PR is not affected and hence
the thermal efficiency because the latter is a function of PR only. On real cycle,
thermal efficiency is dependent on the temperature ratio TET and the
temperature at the entry of the compressor or fan and hence on a hot day,

48
thermal efficiency and specific work are both affected. For an engine running at
constant speed N, the non-dimensional speed √ ⁄ will be lower on hot day
than it should be on a standard cold day and consequently at lower pressure
and temperature ratios. Assuming a constant TET, the thrust and thermal
efficiency will also be reduced.
Figure 3-5: Effects of ambient temperature on an engine cycle [7]
For an ideal cycle of fixed OPR, during a normal day the cycle will be as given
by 1n, 2n, 3, and 4; while on a hot day the cycle will be as shown by 1h, 2h, 3,
and 4. It can be seen from figure 3-5 that the compression work on the hot day
is larger than during the cold day. Thus in the ideal cycle, the specific work is
reduced. The PR of the cycle has not been affected; thus thermal efficiency is
not affected because it is a function of PR only. In the real cycle, thermal
efficiency is dependent on the temperature ratio TET/T1; so the thermal
efficiency will be affected, along with the specific work. As the ambient
temperature increases the net thrust decreases. This because is due to the fact
that for a real engine, the thermal efficiency does not only depend on the PR but
also by the engine temperature ratio. Therefore, for a constant TET, the
temperature ratio on a hot day decreases hence thermal efficiency decreases
and vice versa.

49
3.3.3 Effect of flight speed
Change in flight speed has three effects on engine performance parameters:
momentum drag, ram compression and ram temperature rise. Among the three
effects the momentum drag is the dominant factor reducing the net thrust as
flight Mach number increases as shown in equation 2-6. The flight velocity is
related to Mach number by equation 3-4.
√ (3-4)
The momentum drag as expressed in equation 3-5 reduces the net thrust as
velocity increases. The amount of momentum imparted to the fluid reduces as
flight speed increases. However, this increases the propulsive efficiency
because flight velocity increases faster than jet velocity .
(3-5)
Ram compression has a positive effect which acts to increase thrust because
as flight Mach number increases so does the ram compression and hence the
inlet pressure, flow density, mass flow rate and thrust. The second effect is that
of increasing NPR and hence the gross thrust. Ram pressure rise can be
expressed by equation 3-6.
(
)
(3-6)
At constant TET, the ram temperature increases due to increase in Mach
number, hence the fuel flow reduces which results in a constant shaft speed
and in an increased flow temperature at the inlet to the fan. At a constant shaft
speed this will leads to further reduction in non-dimensional rotational speed
and power setting and hence thermal efficiency as in the case of the engine
operating on hot day. Ram temperature rise can be expressed using equation
3-7.
(3-7)

50
There is noticeable thrust decrease at lower altitudes as compared to higher
altitude because at lower altitudes the air density is high and therefore the
momentum drag is predominant.
Figure 3-6: Variation of performance parameters with Mach number
Ram compression and momentum drag have the most significant effects on the
engine performance. At low speed momentum drag predominates and thrust
falls because up to a Mach number 0.3 the effects of ram compression and ram
temperature rise are very small as can be seen in figure 3-6. In the case of a
turbofan engine, the effects momentum drag is more pronounced due to the
lower jet velocity. However, as Mach number increases say M=0.6, ram
compression starts to be noticed in the form of increased mass flow and NPR,
and thereby becomes a dominant effect as illustrated by figure 3-6. At very high
Mach numbers, the flight velocity which increases faster than the jet velocity is
similar in magnitude to the jet velocity and becomes predominant until
and thrust tends to zero as illustrated in figure 3-6 although the propulsive
efficiency improves tremendously. As a result of ram temperature rise at high
Mach number, it can be shown that due to the increased inlet temperature, both

51
the engine temperature ratio and non-dimensional speed reduces and hence
the PR. These two effects combine to lower the thermal efficiency and
increasing the SFC as shown in figure 3-6.
3.3.4 Influence of BPR on the engine performance
As can be seen from figure 3-7, at fixed TET and OPR, when the BPR
increases, SFC decreases. Here we assume the fan diameter is kept constant,
as the BPR increases, the core engine mass flow decreases. And since the
TET is fixed, the fuel injected is less, which leads to a lower SFC. Also, as the
BPR increases, the specific thrust decreases as a result of increased airflow.
The optimum design will be a compromise between better performance and fuel
economy. High BPR favours good cruise SFC and low noise. Surprisingly as
was expected, the net thrust was expect to increase with the BPR, however,
what we see in figure 3-7 is the opposite. This is because as the design BPR
increases, the core flow reduces and in order to maintain the correct FAR, the
fuel flow has to reduce accordingly and consequently there will be a reduction in
net thrust. However, bypass nozzle thrust increases as BPR increase up to the
up to the optimum value where the momentum drug is the limiting factor.
Figure 3-7: Effects of BPR on engine performance

52
3.3.5 Influence of the FPR on the engine performance
Figure 3-8: Effect of FPR on an engine performance
For every BPR there is a corresponding optimum FPR. In this analysis where
design BPR=2.2, the optimum FPR is seen to be 1.8 as shown in figure 3-8,
however, design practices suggest that a FPR slightly lower than optimum be
chosen in order to avoid high tip speed which may lead to losses due to shock
waves. FPR above optimum will lead to increased SFC and therefore FPR
lower than optimum is used instead.
3.3.6 Effect of design PR
Design PR can be increased by increasing the number of stages; however, this
brings about higher degree of mismatch between various stages as they depart
from their design mass flows and incidences.
In practice a PR in excess of 4.5 is not achievable on a single spool unless
engine variable geometry is deployed. Alternatively the compressor is split into
two or more separate spools, each driven by its own turbine. As N rises, the
engine pumps in more air mass flow. PR and TET rise with N, causing the
specific thrust to increase.

53
Figure 3-9: Effect of PR on engine performance
Reference [7] has found that these two effects combine to give a rapid increase
in net thrust, although the rate of increase may tail off somewhat as the
maximum rotational speed is approached; where this happens, the rate of mass
flow increase is diminishing due to internal chocking of the compressor exit.
Thermal efficiency is seen to increase as it increases with increasing PR and
temperature ratio. TET increases with PR and hence the specific thrust. At
higher PR more air flow is being pumped into the engine. Higher mass flow with
higher TET are favourable for increasing core thrust as can be seen from figure
3-9.
3.3.7 Effect of overboard bleed
Bleed extraction is one of the most important customer requirements depending
on the aircraft application. Bleed extraction will affect the performance of the
engine by altering the mass flow balance between engine components and
hence rematching flow will be required to attain new steady state condition.

54
Since air is bled from the last stages of the HPC, the turbine will have to work
with reduced mass flow to produce the power required to run the compressor.
This will result in a higher TET, but with a reduced mass flow, to ensure the
correct value of the turbine NDMF, the PR will have to decrease. Again
assuming a choked HPC and HPT operating between choked nozzles, the
quantities ( √
) ( √
)
will remain nearly constant. Defining the
bleed ratio as
, the power balance before any bleed is extracted is given
by equation 3-8.
( ) ( ) (3-8)
And when bleed is being extracted, the new power balance is given by equation
3-9.
( ) ( ) ( )
(3-9)
Further simplifications of equations 3-8 and 3-9 show that the result of bleed
extraction is the reduction in PR and increase in TET as show in equations 3-10
and 3-11 respectively.
√ (3-10)
( ) (3-11)
Effects of bleed extraction on engine performance are shown in figure 3-10. As
is in the case in power extraction, bleed extraction has also got a detrimental
impact on SFC as higher TET is required to make up the thrust. Bleed off-take
affects the matching of the component but increases the surge margin while
power off-take reduces the surge margin. Finding in reference [7] tells that the
work required to compress the turbine cooling air of large HBPRTF is
approximately 5 MW. As the bleed is being extracted, PR and mass flow to the
core engine will drop and hence the thermal efficiency will drop and hence the
net thrust as shown in figure 3-10. To make the thrust, more fuel will have to be
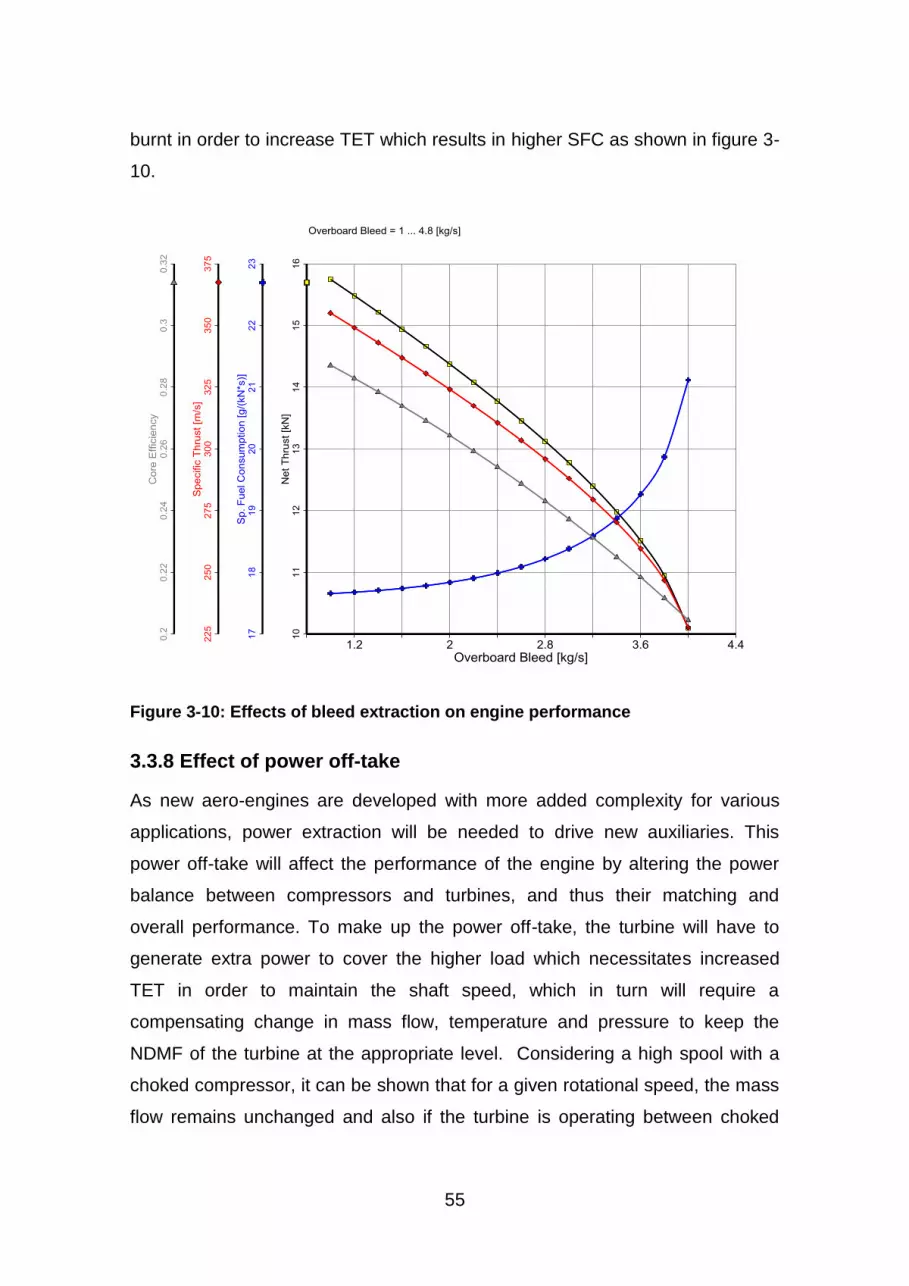
55
burnt in order to increase TET which results in higher SFC as shown in figure 3-
10.
Figure 3-10: Effects of bleed extraction on engine performance
3.3.8 Effect of power off-take
As new aero-engines are developed with more added complexity for various
applications, power extraction will be needed to drive new auxiliaries. This
power off-take will affect the performance of the engine by altering the power
balance between compressors and turbines, and thus their matching and
overall performance. To make up the power off-take, the turbine will have to
generate extra power to cover the higher load which necessitates increased
TET in order to maintain the shaft speed, which in turn will require a
compensating change in mass flow, temperature and pressure to keep the
NDMF of the turbine at the appropriate level. Considering a high spool with a
choked compressor, it can be shown that for a given rotational speed, the mass
flow remains unchanged and also if the turbine is operating between choked

56
nozzles with constant efficiencies, ( √
) ( √
)
remain nearly
constant. Defining
as the work ratio, the work balance on the spool is
given by equation 3-12.
(3-12)
Or the work balance on the spool without work extraction can be expressed
equation 3-13.
( ) ( ) (3-13)
Introducing the work ratio, equation 4-12 becomes equation 3-14.
(3-14)
And the new work balance on the spool when work is extracted is given by
equation 3-15.
( ) ( ) ( ) (3-15)
Further simplification of equations 3-13 and 4-15 will show that power off-take
will have effects of rising the PR and TET as approximated by equations 3-16
and 3-17 respectively.
√ (3-16)
( ) (3-17)
The effect of increased PR and TET is the worsening of the SFC and thermal
efficiency as shown in figure 3-11.

57
Figure 3-11: Effects of power extraction on engine performance
3.4 Conclusion
Although an engine is designed and optimise for DP, however, early design
stages requires a look at some OD cases given mission specifications of that
particular engine. This part of the IRP has shown the importance of carrying out
an OD performance analysis and simulation which gives good estimates of the
performance parameters over a wide range of operating conditions.
Investigation of OD performance has also elaborated the relationship between
engine cycle parameters and the impact they have on the engine performance
parameters and how a choice of engine design variables can be made in order
to optimise engine for fuel economy or high performance. Particularly, it has
been shown that by increasing the BPR, better SFC can be achieved; however,
performance will be impaired due to momentum drug and other installation
losses. Similar analysis was shown for FPR as well. It has been shown that as
FPR is increase beyond 1.8 the thrust and specific thrust begins to drop while
the SFC starts rising slightly due to shockwave losses and momentum drag.

58
Effect of altitude on engine performance was found to be that of reducing mass
flow rate as a result of a decreasing air density and Reynolds number with
altitude in the lower atmosphere. It was found that thrust keeps decreasing with
altitude. However, as altitude increases, temperature decreases and hence the
non-dimensional rotational speed increases up to an altitude of 11 km. This
increase in the non-dimensional speed will result into increased PR and hence
more mass flow will be pumped into the engine to compensate somehow for the
decreasing thrust. Effects of flight speed were found to relate to momentum
drag, ram pressure rise and ram temperature rise. The momentum drug was
found to be of significant effect especially a low Mach numbers say M=0.4 but
at Mach numbers above 4 the effects of ram pressure can be evidenced and
the thrust starts rising. The ram pressure rise has the positive effect as that of
PR and will act to increase thrust. Also bleed and power off-take have been
investigated and were mainly found to alter the flow and power balance and
required component rematching. Both are found to reduce engine thrust,
increasing SFC and TET. However, bleed off-take is found to improve SM while
power off-take is found to worsen it.

59
4 TRANSIENT PERFORMANCE ANALYSIS AND
SIMULATION OF A TWO SPOOL TURBOFAN ENGINE
4.1 Introduction
Transient performance is that performance phase where engine performance
parameters are significantly changing with time. In this phase of performance
engine is responding to a given fuel schedule and variable geometry and engine
control system plays a major role in controlling fuel flow to match the required
thrust requirement. Acceleration and deceleration are the major transient
manoeuvres encountered during this particular performance. This chapter has
been limited to acceleration manoeuvre and the effect of engine degradation on
acceleration performance. Six simple linear fuel schedules will be defined as
function of time and will be used to simulate the effects of acceleration time on
the transient performance. Also effects of rotor inertia on transient performance
will be investigated as well. Finally, different kinds of engine degradation will be
modelled and their effects on engine transient performance will be investigated.
CMF method will be used to model and simulate transient performance.
Turbomatch 2.0 is going to be used in this part of simulation.
4.2 Acceleration and deceleration manoeuvres
If a higher power is suddenly requested via PLA engine steady state and the
engine control system suddenly increase fuel flow, then due to the increased
temperature, the turbine will produce power in excess to that required to drive
the compressor, auxiliaries and overcome mechanical losses. The unbalanced
power, the amount of which is expressed by equation 4-1, resulting from excess
fuel flow will produce acceleration of the rotor.
( ) ( ) (4-1)
As a result of this excess power, air flow, pressure and thrust all increase as the
spool accelerates. This acceleration continues until a new steady state
condition corresponding to the new fuel flow is achieved. Conversely for a
deceleration the unbalanced power is negative and the spool speed reduces
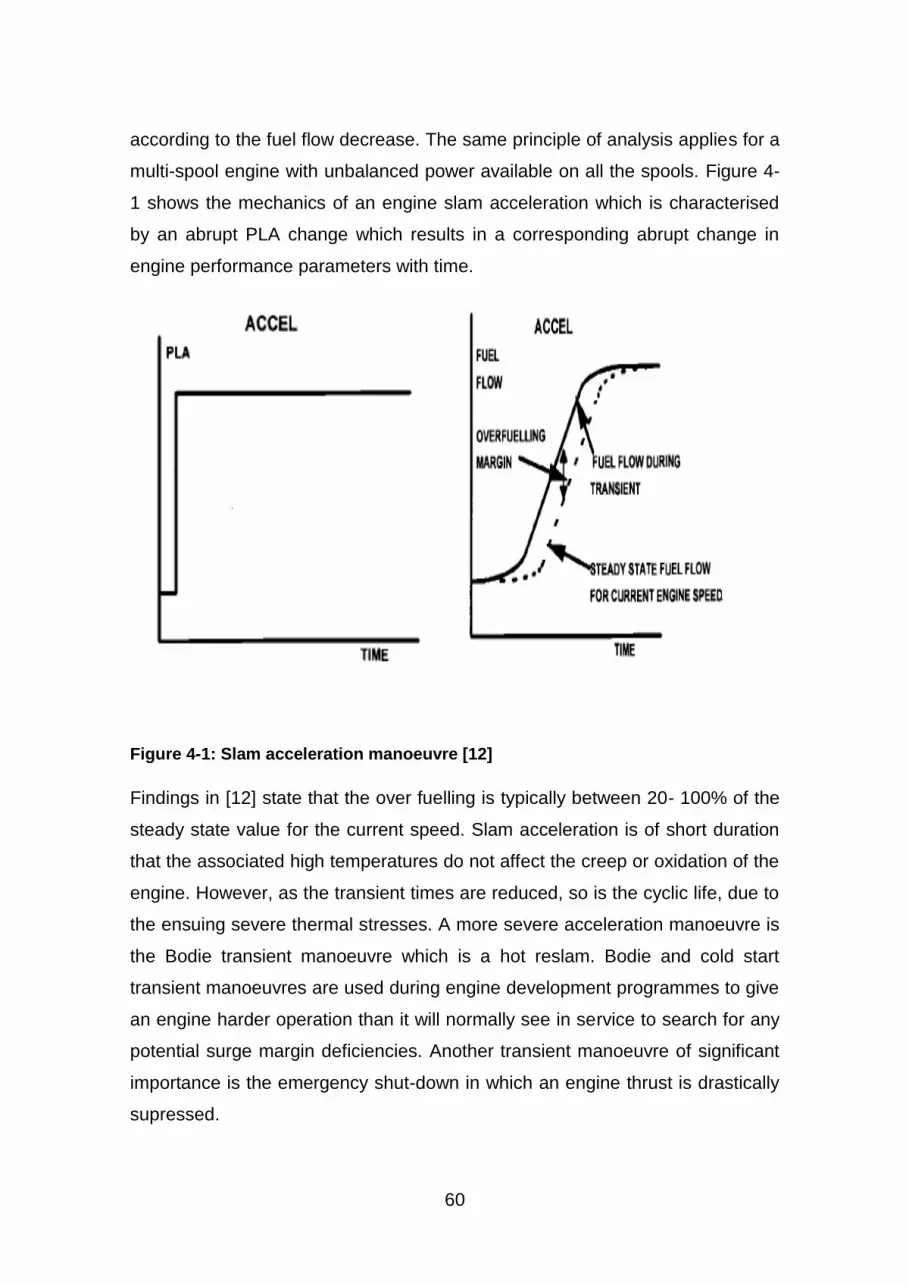
60
according to the fuel flow decrease. The same principle of analysis applies for a
multi-spool engine with unbalanced power available on all the spools. Figure 4-
1 shows the mechanics of an engine slam acceleration which is characterised
by an abrupt PLA change which results in a corresponding abrupt change in
engine performance parameters with time.
Figure 4-1: Slam acceleration manoeuvre [12]
Findings in [12] state that the over fuelling is typically between 20- 100% of the
steady state value for the current speed. Slam acceleration is of short duration
that the associated high temperatures do not affect the creep or oxidation of the
engine. However, as the transient times are reduced, so is the cyclic life, due to
the ensuing severe thermal stresses. A more severe acceleration manoeuvre is
the Bodie transient manoeuvre which is a hot reslam. Bodie and cold start
transient manoeuvres are used during engine development programmes to give
an engine harder operation than it will normally see in service to search for any
potential surge margin deficiencies. Another transient manoeuvre of significant
importance is the emergency shut-down in which an engine thrust is drastically
supressed.

61
4.3 Engine acceleration and deceleration requirements
Depending on a given engine application, there are time requirements for key
transient manoeuvres. Time zero for acceleration and deceleration times
corresponds to the instant the PLA is changed. Typically the gas generator
acceleration is timed to 98% speed corresponding to about 95% thrust. All times
must be achieved free from any of the operability concerns. For civil aircraft in
the event of aborted landing, airworthiness requirements stipulate that the
aircraft must be able to achieve a climb gradient of 3.2%, 8 seconds after
demanding take-off thrust. This requires an engine to accelerate from idle to
95% thrust in less than 8 seconds at an altitude of about 4,500 m. These
maximum acceleration must be achieved with maximum allowable customer
bleed and power extraction. In the event of aborted take-off, a deceleration of
an engine is required to enable the aircraft to stop on the run way within a safe
distance. Reference [12] stipulates that airworthiness requires that this
deceleration time gives 75% of thrust change between take-off and minimum
idle in less than 7 seconds up to an altitude 4,500. This means that at sea level
this acceleration must be achieved in about 4.5 seconds. The acceleration
times for military engines stipulate achievement of 98% speed within less than 4
seconds at sea level. The fastest deceleration time requirement is also around 4
seconds from take-off thrust to 75% of thrust change between take-off and flight
idle.
4.4 Transient performance modelling with Turbomatch
In this analysis an engine model file is made along with its fuel input file which is
made up of six simplified linear fuel schedules varying with acceleration time.
These fuel schedules are labelled as 1 to 6 with their corresponding
acceleration time as shown in table 4-1 where fuel schedule 1 is the fastest and
fuel schedule 6 is the slowest.

62
Fuel schedule Acceleration time (s)
1 1
2 2
3 3
4 4
5 5
6 6
Table 4-1: Fuel schedules
The fuel schedule is made such that the engine operating line will remain within
region bounded by the surge line and flame out line. To simulate the
acceleration, a step fuel increase is made and assumed to be linear with time
as shown in figure 4-2.
Figure 4-2: Fuel scheduling [7]

63
For acceleration to take place, the turbine power must exceed the compressor
power as shown by figure 4-3. It follows that, for given flight conditions; the
engine's performance is now a function of both non-dimensional rotational
speed and non-dimensional fuel flow, which are independent variables. This is
also true during deceleration, although the turbine power is now less than the
compressor power.
Figure 4-3: Transient performance [7]
In figure 4-3, A and B represent points on the steady-state working line at the
initial and final rotational speeds Ninitial, Nfinal respectively. If the fuel flow and
TET are instantaneously increased the compressor and turbine operating points
move up to C and T respectively, so that CT is the accelerating torque.
Thereafter the engine accelerates until the compressor and turbine operating
points again coincide, at point B. Between points A and B, performance will
change, and the engine parameters will deviate from their steady state values
as illustrated in figure 4-1.
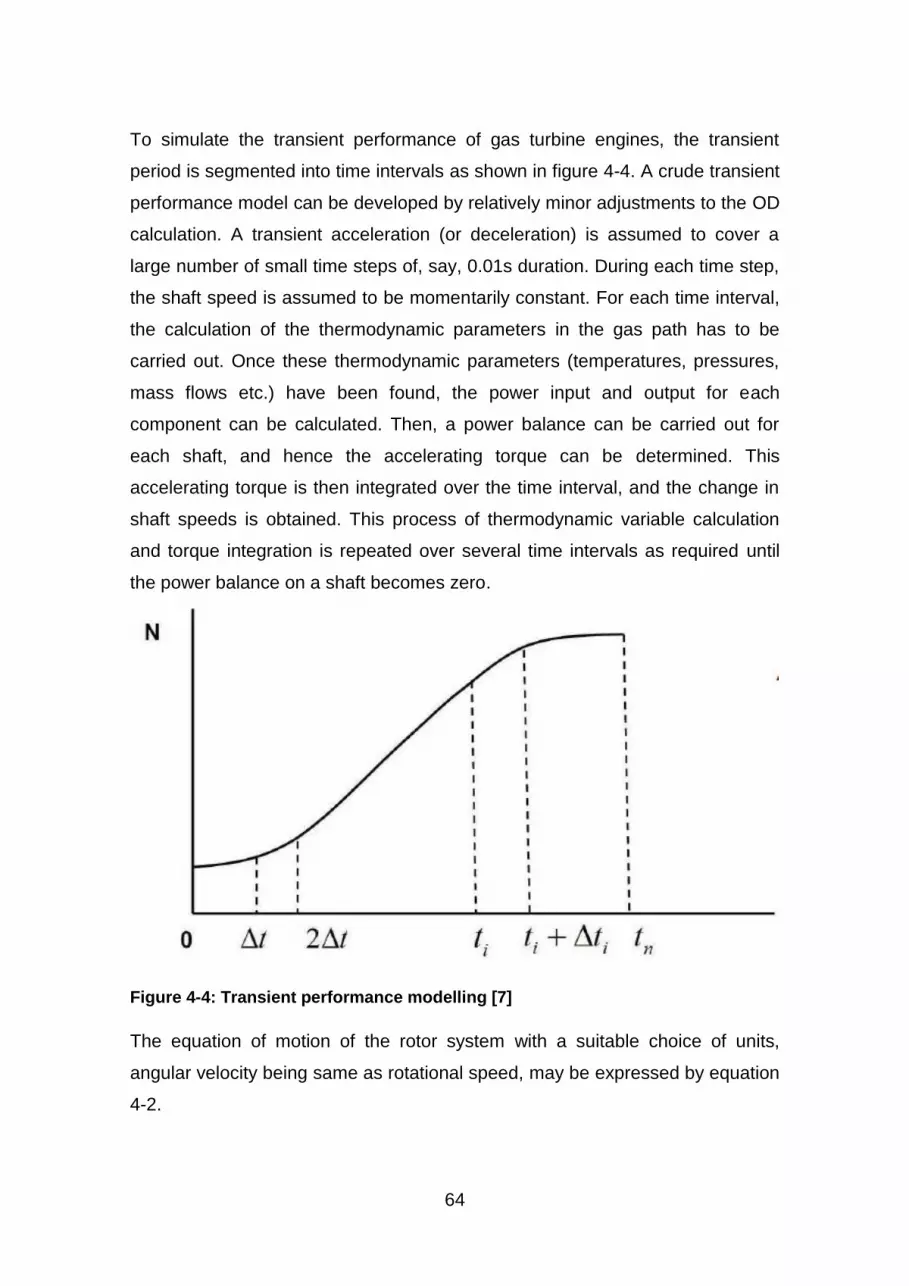
64
To simulate the transient performance of gas turbine engines, the transient
period is segmented into time intervals as shown in figure 4-4. A crude transient
performance model can be developed by relatively minor adjustments to the OD
calculation. A transient acceleration (or deceleration) is assumed to cover a
large number of small time steps of, say, 0.01s duration. During each time step,
the shaft speed is assumed to be momentarily constant. For each time interval,
the calculation of the thermodynamic parameters in the gas path has to be
carried out. Once these thermodynamic parameters (temperatures, pressures,
mass flows etc.) have been found, the power input and output for each
component can be calculated. Then, a power balance can be carried out for
each shaft, and hence the accelerating torque can be determined. This
accelerating torque is then integrated over the time interval, and the change in
shaft speeds is obtained. This process of thermodynamic variable calculation
and torque integration is repeated over several time intervals as required until
the power balance on a shaft becomes zero.
Figure 4-4: Transient performance modelling [7]
The equation of motion of the rotor system with a suitable choice of units,
angular velocity being same as rotational speed, may be expressed by equation
4-2.

65
(
)*
(4-2)
The change in rotational speed due to fuel increment is given by equation 4-3.
(4-3)
The new rotational speed resulting from adding fuel at is given
by equation 4-4.
(4-4)
The iterations are repeated until ΔP=0.
In this analysis civil engine acceleration requirement will be considered. For civil
engine acceleration requirements in the event of aborted take-off, an engine is
required to accelerate from idle to 95% of take-off thrust in 8 seconds. To
simulate acceleration manoeuvre, a fuel is scheduled to run initially from 30% to
95% rated engine thrust. The deceleration manoeuvre is supposed to take a
reverse trend. In this simulation model fuel flow is chosen to be a control
parameter and a number of simple fuel schedules as shown in table 4-1 are
considered to vary linearly with time. To achieve a stable engine operation
without surging of the fan during the deceleration and surging of the HPC during
the acceleration, fuel addition/reduction is done gradually.
First of all, a clean engine transient acceleration manoeuvre is simulated using
the six fuel schedules and its transient performance results are analysed and
plotted. The same engine is subjected to various degradation forms. The HPC
is subjected to degradation by fouling while the HPT is subject to erosion.
Fouling results in degradation of flow capacity and efficiency in compressors
and turbines while degradation by erosion results in reduction in components
efficiency, reduction in flow capacity in compressor and increase in flow
capacity in turbine. The results of deteriorated engine transient performance are
also analysed and plotted on the same graph to enhance a graphical
comparison. Of all degradation forms, HPT erosion and HPC efficiency
deteriorations are the ones that significantly degrade the engine performance

66
during transient while the combustion change efficiency degradation has the
least effect.
4.5 Simulation results analysis
4.5.1 Clean engine simulation
Figure 4-5 shows the effect of acceleration time on various fuel schedules as
defined in table 4-1. Each fuel schedule is made such that it can provide engine
thrust between idle to maximum take-off thrust the only difference is the time
taken to accelerate from ground idle to maximum take-off speed. The lowest
fuel flow corresponding to idle thrust is 0.05 kg/s and the design value
corresponding to take-off thrust is 0.25 kg/s as can be seen from figure 4-5.
Each fuel schedule is set to accelerate the engine from ground idle to 100%
take-off thrust. The shorter the acceleration time, the faster the maximum fuel
flow is reached and hence the maximum thrust. The longer the acceleration
time, the longer it takes to reach the maximum take-off thrust.
Figure 4-5: Effect acceleration time on fuel schedules

67
Figure 4-6 shows that for fuel schedule labelled 1 sec, where acceleration time
is the shortest, fuel flow is released very quickly and hence the highest SCF
overshoot can be observed to reach 47.5 mg/N.s. Therefore, engine
acceleration has the effect of SFC overshoot which leads to higher TET. The
base line design SFC is about 16 mg/N.s but due to a fast acceleration, it can
be seen that SFC spike of about 47.5 mg/N.s can be reached. Again from figure
4-6 it can be seen that as acceleration time increases, SFC peaks smooth out.
This results from the fact that the longer the acceleration time the more gradual
is the fuel increase and the engine metal has enough time to soak the net heat
than in the short acceleration time case. Therefore for fuel schedule 6 where the
acceleration time is 6 second, the slowest fuel schedule, the SFC peak is about
32 mg/N.s as seen from figure 4-6. In the absence of an efficient engine control
system, this will lead to a non-economic, non-environmental friendly engine and
excessive TET may result which ultimately affects the engine creep life. As
acceleration time increases, SFC curve becomes more or less smooth. Engine
fuel control uses an integrator to smoothen out the fuel spikes and other
transient. Transient deceleration will usually give a reverse SFC trend.
Figure 4-6: Effect of different fuel schedule to SFC

68
As a result of fast fuel increase during a quick engine acceleration, TET
increases instantaneously as shown in figure 4-7. Again the shorter the
acceleration time the faster the fuel injection into the combustion chamber and
the higher is the TET over shoot unless if there is a longer combustion delay or
control systems lag. As can be seen from figure 4-7, if acceleration from idle to
full take-off thrust is effected within 1 second, this raises TET about 500K above
the design TET which is unacceptable from the turbine material point of view.
Figure 4-7: Effect of acceleration time on TET
TET is detrimental to engine safe operation and health. Although for all the six
fuel schedule this engine did not surge, however as can be seen from figure 4-7
fuel schedules 1, 2 and 3 overshot COT about 1700K and above which is not
acceptable to the turbine material for this particular base line engine. Therefore,
these three fuel schedules are not recommended for use due to COT
overshoot. Transient deceleration is expected to produce reverse trend.

69
Fuel schedule Acceleration time (s) Max COT (K)
1 1 1900
2 2 1850
3 3 1780
4 4 1700
5 5 1650
6 6 1620
Table 4-2: COT variation with acceleration time
Figure 4-8: Effect of acceleration on thrust
During transient engine thrust is predominantly a function of rotational speed.
The acceleration time has an effect on engine thrust during transient. The
acceleration time is defined as the time required for accelerating from ground
idle to 95% maximum take-off thrust. The shorter the acceleration time, the

70
faster the fuel is injected into the combustion chamber and the faster is the
increase in engine thrust as shown in figure 4-8. Fuel schedule 1 is the fastest
and is seen to reach the thrust peak of 17 KN very quickly. The instantaneous
thrust increase may be undesirable for civil engine where safety and passenger
comfort is of a big importance. However, for military engines quick thrust
response is very important.
Figure 4-9: Effect of acceleration on engine rotational speed
As can be seen from figure 4-9 HP spool acceleration from ground idle to 100%
rpm is reached quicker when a fast fuel schedule 1 is used. This is due to the
fact that the smaller the acceleration time the faster is the fuel addition and this
raises TET instantaneously and hence the rotational speed of the rotor. Engine
over fuelling may result into rotor over speeding which may impair the
mechanical integrity of the rotor and therefore, has to be avoided whenever
possible.

71
Figure 4-10: Effect of engine acceleration on HPC SM
During acceleration HPC is prone of surge. The surge margin will vary
according to the fuel schedule and engine configuration whether it is a
centrifugal of axial type compressor or whether engine variable geometry are
deployed or not. In this analysis bleed and power off-take which can be used to
control the engine SM have not been taken into account for simplicity of the
analysis and therefore the effect of acceleration has given very reduced SM. It
is expected that is engine variable geometry were used, SM would have been
better than it is now. HPC SM is sensitive to fuel flow acceleration due to the
fact that with a fast engine acceleration does not give enough time to the engine
metal to soak the resultant heat and hence the surge line is lowered. From table
4-3 it is recommended that HPC SM for civil engine be maintained in the range
of 20-25% when engine variable geometry and bleed are in use. In this analysis
with a 1 second fuel schedule it can be seen that only a SM of about 12% is
available for HPC. This is practically inacceptable for safe HPC operation;
however, if engine variable geometry were used higher SM would have been

72
obtained. It can also be observed that slowest fuel schedule leaves HPC SM of
about 18%.
Component Surge margin (%)
Engine Application Fan LP/IP Compressor
HP compressor
Power generation
15-20 15-20
Gas and oil
10-15 15-20
Automotive
15-20 20-25
Marine
10-15 15-20
Civil aero-engine 15-20 15-20 20-25
Helicopter
15-20 20-25
Military fighter 15-20 20-25 25-30
Table 4-3: Recommended SM [12]
Figure 4-11: Effect of acceleration on fan SM

73
Unlike the HPC the fan SM during acceleration is not affected by the
acceleration time. The discussion above has shown that fan is not prone of
surge during acceleration, instead surging of the fan happens during
deceleration manoeuvre. Table 4-3 shows that fan SM for civil engine must be
maintained between 15-20%. In this analysis even though engine variable
geometry is not used a SM 15 is still available even with fuel schedule 1.
Figure 4-12: Effect of acceleration on Fan speed

74
Figure 4-13: Fan characteristics during acceleration
During acceleration manoeuvre of the fan, the transient line initially moves
above the working line towards the surge line and moves below it after wards
until a new steady state condition is established as shown in figure 4-13. The
operating line of the fan is affected by the fan outlet capacity and as this
capacity falls, the operating line will tend to move towards the surge line. As can
be seen from figure 4-13 the transient working line does not deviate too much
from the steady sate working line as in the case of LPC or HPC. The transient
line of the HPC deviates significantly from the steady state working line whereas
that of the fan, IP and LP compressors almost coincide with that of the steady
state working line as shown in figure 4-13 and 4-14. Figure 4-14 shows less
sensitivity to acceleration time. It can be observed that for fuel schedules 1, 3
and 5, the transient working lines of the fan almost coincide with those of the
steady state working lines.
1
1.2
1.4
1.6
1.8
2
2.2
0 10 20 30 40 50 60
PR
NDMF
Fan transient characteritics
FAN CLEAN MAP
SL
RL
TR

75
Figure 4-14: Effect of acceleration on Fan characteristics
Usually fan is not prone of surge during acceleration and figure 4-14 shows that
fan SM is not sensitive to fast engine acceleration. As can be seen from figure
4-14 the running lines for the for fuel schedule 1, 3 and 5 almost coincide. The
same is true for the corresponding transient lines. This is due to the reason that
the working line of the fan is affected by the flow capacity. As the outlet capacity
of the fan fall, the working lines will tend to move towards the surge line. Since
the BPR is assumed to be constant during the transient acceleration so the flow
capacity will not be affected and hence the transient working lines. Plots for fuel
schedule 2, 4 and 6 are intentionally omitted to enhance clarity.

76
Figure 4-15: Effect of acceleration on HPC characteristics
The shorter the acceleration time, the closer the working line will move towards
the surge line. From figure 4-15 it can be seen that the fastest fuel schedule 1
gives a transient working line much closer to the surge line at the beginning of
the acceleration manoeuvre. This is justified by the fact that during acceleration
there will be fast fuel increase which will result in higher TET. Given that HPT is
working choked, the quantity ( √
)
will remain nearly constant. However,
to keep this quantity constant while TET is increasing more rapidly and is
reducing rapidly, the HPC is required to supply more pressure and hence the
transient working line can be seen moving towards the surge line above the
steady state working line at the beginning of the transient acceleration.
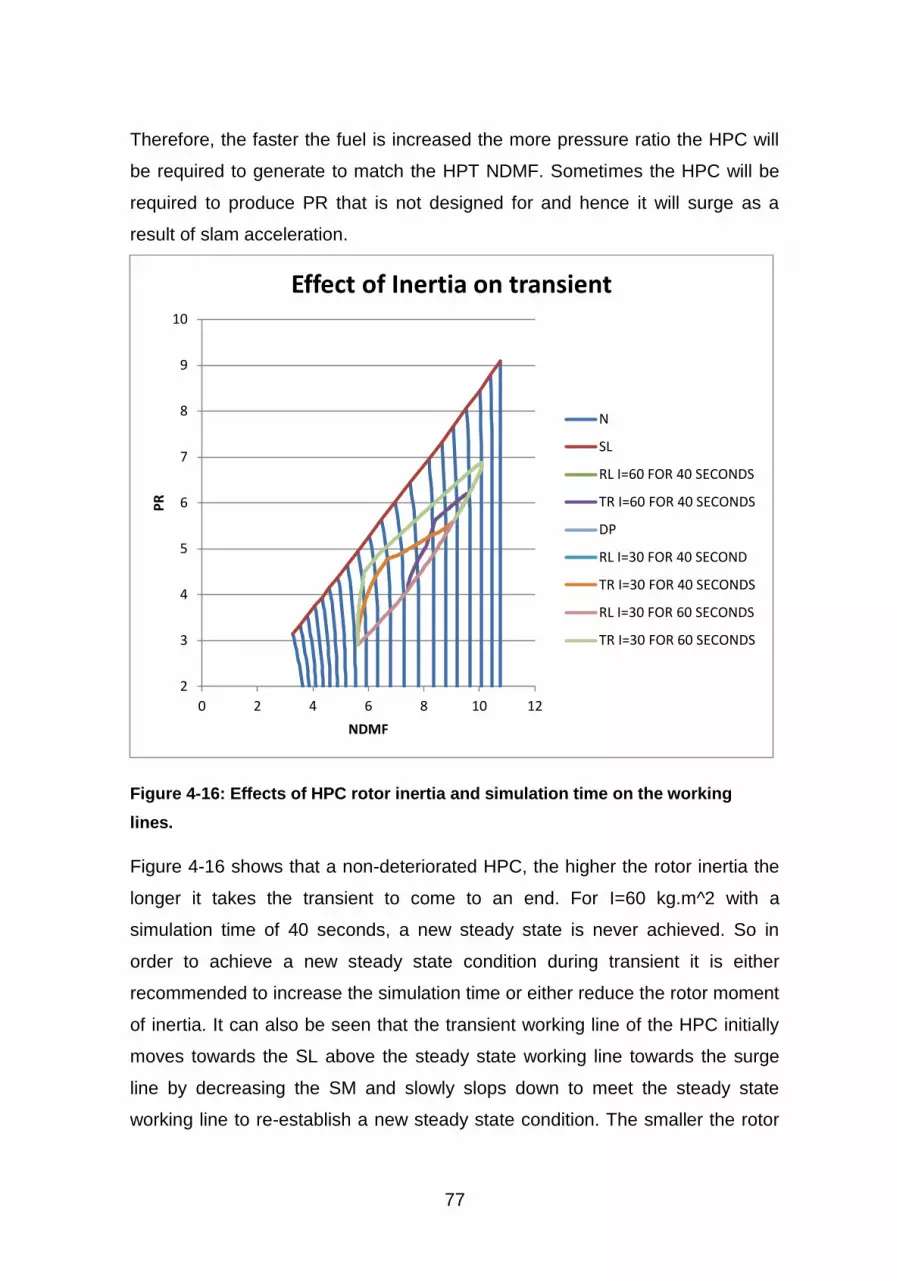
77
Therefore, the faster the fuel is increased the more pressure ratio the HPC will
be required to generate to match the HPT NDMF. Sometimes the HPC will be
required to produce PR that is not designed for and hence it will surge as a
result of slam acceleration.
Figure 4-16: Effects of HPC rotor inertia and simulation time on the working
lines.
Figure 4-16 shows that a non-deteriorated HPC, the higher the rotor inertia the
longer it takes the transient to come to an end. For I=60 kg.m^2 with a
simulation time of 40 seconds, a new steady state is never achieved. So in
order to achieve a new steady state condition during transient it is either
recommended to increase the simulation time or either reduce the rotor moment
of inertia. It can also be seen that the transient working line of the HPC initially
moves towards the SL above the steady state working line towards the surge
line by decreasing the SM and slowly slops down to meet the steady state
working line to re-establish a new steady state condition. The smaller the rotor
2
3
4
5
6
7
8
9
10
0 2 4 6 8 10 12
PR
NDMF
Effect of Inertia on transient
N
SL
RL I=60 FOR 40 SECONDS
TR I=60 FOR 40 SECONDS
DP
RL I=30 FOR 40 SECOND
TR I=30 FOR 40 SECONDS
RL I=30 FOR 60 SECONDS
TR I=30 FOR 60 SECONDS

78
of inertia and the short the simulation time the higher the propensity of the HPC
to surge as can be seen from figure 4-16. The reason behind the HPC transient
working moving towards the surge line is that during the transient manoeuvre
the turbine is working between choked nozzles and the turbine flow capacity
( √
) is nearly constant. As the fuel flow is increased to accelerate the rotor,
TET increases. In the order to maintain the turbine flow capacity constant the
HPC will be required to deliver higher pressure and hence the working line will
be moving towards area of high pressure ratio which is in the surge region. This
suggests that HPC is prone of surge during acceleration manoeuvre and ways
to alleviate this problem includes, lowering the working line, increasing SM and
use of engine variable geometries. The attempt to provide PR for which the
compressor has not been designed for will lead to surge which is an
undesirable phenomenon.
4.5.2 Degraded module simulation
In this part of analysis fuel schedule 6 is used to simulate the engine degraded
module. Engine degradation will be manifested through drop in performance
such as thrust. In order to maintain the required thrust more fuel will have to be
burnt and this will result in higher COT and higher EGT and therefore higher
NOx emission especially during acceleration. Engine degradation will also have
an effect of increasing the acceleration time and reducing the surge margin and
therefore if transient performance requirement is to be met, fuel schedule has to
meet the required acceleration times, the acceptable levels of COT and
acceptable SM.
HPC degradation by fouling has essentially an effect of reducing the flow
capacity of the HPC. During acceleration, fast fuel injection will instantaneously
increase TET. As the HPT is supposed to be working between choked nozzles,
its flow capacity will nearly stay constant. With a decreasing as a result of
degradation, the HPC will need to produce more PR in order to maintain the
HPT NDMF constant. Due to high PR demand during engine acceleration, HPC
is prone of surge and measures must be taken so that acceleration can be

79
gradual to keep the working lines within the SM. This scenario will force the
HPC to move in a region where the PR is increasing and at the same time the
flow capacity decreasing and this is a surge region as shown in figure 4-17. 5%
HPC efficiency degradation during transient gives the most severe transient
working line deviation from the steady state working line. Even though the HPC
has not surged, degradation more than 5% is inacceptable.
Figure 4-17: Effects of degradation on transient characteristics of the HPC.
Figure 4-18 shows that degradation of HPC efficiency and PR has more
pronounced effect of reducing the SM at the beginning of the acceleration. 5%
efficiency HPC degradation has got the greatest effect of narrowing the SM.

80
However, HPC PR degradation greatly narrows the SM as the acceleration
increases by an amount of the order of 15%. Also 5% HPC efficiency
degradation has the next most severe effects on the SM with a reduction of the
order of 12%. SM highly depends on the acceleration/deceleration time
requirements, engine configuration and whether engine variable geometry is
being used or not. In this analysis engine variable geometry has not been
considered and this suggests the extent to which SM was reduced is over
estimated by about 10%.
Figure 4-18: Effect of engine deterioration on transient SM of HPC.
In order for an engine to accelerate, fuel needs to be increase to achieve high
TET so that the turbine can produce more power than required to drive the
compressor as shown by equation 4-1. As an engine is accelerated from idle to
95% of its take-off thrust TET increases and more power is produced by the
turbine. The quicker the fuel addition, the shorter the acceleration time will be
and hence the engine will not have enough time to soak the heat which will
result in lowering of the surge line leading to compressor surge as shown in
figure 4-18.

81
Figure 4-19 shows the effects of acceleration on an engine thrust for both clean
and deteriorated. Engine degradation will result in lower thrust compared to a
clean engine and in order to make up the thrust higher COT will be needed at a
penalty of higher SFC. As can be seen from figure 4-19, 5% HPT efficiency
degradation is the one that results from the lowest thrust during an engine
normal acceleration and this will be of the order of 0.5KN. Also 5% HPC
efficiency degradation results in about 0.3 KN thrust reduction as seen from
figure 4-19.
Figure 4-19: Effect of degradation engine transient acceleration thrust.
10000.0
11000.0
12000.0
13000.0
14000.0
15000.0
16000.0
17000.0
18000.0
0 10 20 30 40 50
Thru
st [
N]
Simulation time [s]
Transient Thrust
Thrust clean
Thrust HPT NDMF Deg
Thrust HPT ETA Deg
Thrust HPC 5% ETA Deg
Thrust HPC 5% NDMFDeg
Thrust HPC PR 5% Deg
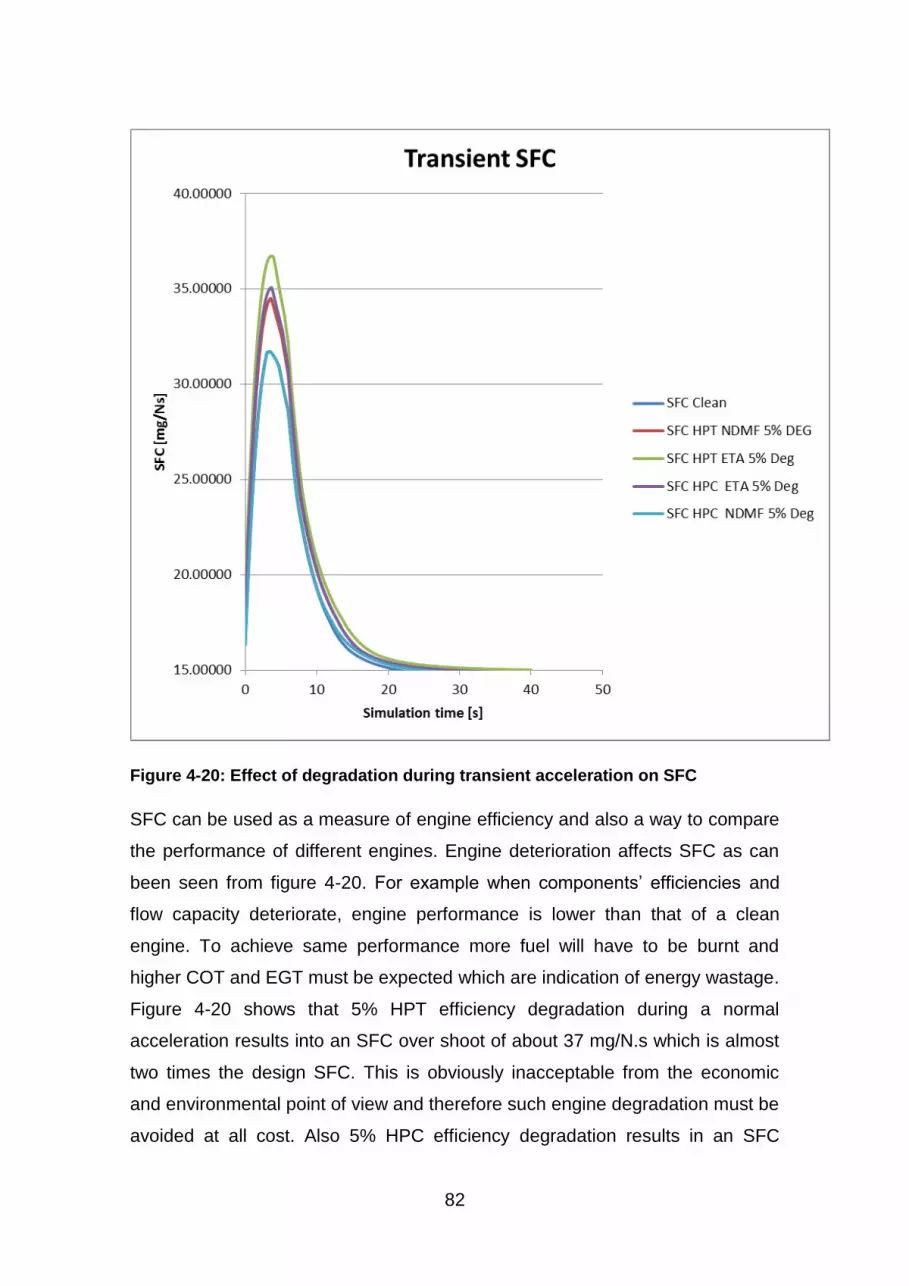
82
Figure 4-20: Effect of degradation during transient acceleration on SFC
SFC can be used as a measure of engine efficiency and also a way to compare
the performance of different engines. Engine deterioration affects SFC as can
been seen from figure 4-20. For example when components’ efficiencies and
flow capacity deteriorate, engine performance is lower than that of a clean
engine. To achieve same performance more fuel will have to be burnt and
higher COT and EGT must be expected which are indication of energy wastage.
Figure 4-20 shows that 5% HPT efficiency degradation during a normal
acceleration results into an SFC over shoot of about 37 mg/N.s which is almost
two times the design SFC. This is obviously inacceptable from the economic
and environmental point of view and therefore such engine degradation must be
avoided at all cost. Also 5% HPC efficiency degradation results in an SFC

83
increase up to 35 mg/N.s as shown in figure 4-20 which is again very high to be
accepted in practical engines. A point to note here is an improvement in SFC as
NDMF of HPC degrades. This is because as the flow capacity reduces the fuel
flow will have to reduce as well in order to meet the correct FAR to avoid a rich
mixture.
Usually COT over shoot at take-off is the highest and the higher the fuel supply,
the higher the COT overshoot. Abrupt change in PLA for high power demand is
detrimental to engine safety. High power demand will be met when large
amount of fuel is release and this will result in COT overshoot which is not
desirable if stable operations are required. COT overshoot will force the HPC to
deliver more PR than it is designed for and hence compressor surge will take
place. In addition to compressor surge, COT overshoot will affect the creep life
of components downstream as a result of the differential thermal gradient. As
shown from figure 4-21, component degradation favours COT overshoot and
the highest peak can be noticed at around 4 seconds of simulation time. It can
be noted that HPT and HPC 5% efficiency degradation are the ones which
favour COT overshoot with a peak temperature of about 300K above the design
TET which is not acceptable. The quicker the acceleration the higher the COT
overshoots and it can be seen that this engine degradation makes this fuel
schedule unacceptable from the turbine blade material creep strength point of
view.

84
Figure 4-21: Effect of engine degradation during transient on TET

85
4.6 Conclusion
The main purpose of this part of the thesis was to study the transient
performance and different factors that affecting it. A medium bypass ratio non-
mixing turbofan was chosen as a study bench mark and Turbomatch 2.0 was
used for this transient modelling and simulation. Transient performance deals
with the variation of engine performance parameters with time and this requires
close control given its operational safety on engine. In this chapter the author
has highlighted the importance of the transient performance, the phenomena
associated with it and the requirement for transient performance for both civil
and military engines. Six simplified linear fuel schedules were defined and used
to investigate the effects various fuel schedules on acceleration manoeuvre.
Findings have shown that the shorter the acceleration time, the faster the fuel
flow and hence the more the instantaneous change of the performance
parameters of the engine. For a clean engine the fastest fuel schedule has
resulted in HPC SM decrease by 12% and TET over shoot of up 1900K while
SFC was found to rise up to 47.5 mg/N.s which is as three times as high as the
design SFC. These performance parameters are unacceptable for a safe
engine operation and therefore fuel schedule 1, 2 and 3 are not recommended
for use on this model engine although they have not surged the compressor.
However, use of engine variable geometry such as bleed off-take may improve
the surge margin problem. Effects of rotor moment of inertia and engine
degradation on transient performance were also investigated. It has been found
that the higher the rotor inertia the longer it takes to regain a new steady state
and the transient working line of the HPC initially moves towards the surge line.
Engine degradation has shown that 5% HPT efficiency degradation has
reduced engine thrust by 0.5 KN while 5% HPC PR degradation has resulted
into 15% HPC SM reduction. Finally, 5% HPC efficiency degradation has
reduced the HPC SM by 12%. On the other hand 5% HPT efficiency
degradation has been found to increase SFC up to 37% mg/N.s which is almost
two times higher than the design point SFC while 5% HPC efficiency
degradation increased SFC up to 30 mg/N.s. Again these values are far high to
be accepted for working engine.

86
Effects of engine variable geometry; bleed and power off-take were not
investigated in this work but in previous works they have been found to affect
the transient performance. To simplify the analysis CMF method which does not
take into account the effects of volume dynamics, heat transfer and tip
clearance changes was used.

87
5 CONCLUSION, RECOMMENDATION AND FUTURE
WORK
5.1 Concluding Remarks
The aim of the work in this thesis was to conduct analysis and simulation of a
transient performance of a medium bypass ratio turbofan engine. A model
engine was idealised and both OD and transient performances were
investigated. Though the main focus was the transient performance
investigation, however, the author did investigate the off-design performance
part as well and results were discussed in detail in chapter 3. The aim of the OD
performance investigation was to evaluate the influence of the engine design
variables, flight conditions and power settings on a turbofan engine
performance in order to get a wider performance picture. In this regard the
effects of FPR, BPR, OPR and TET on the engine performance were
investigated and results have been discussed in chapter 3. It has been found
out that there will be an optimum FPR for every BPR that gives the best highest
thrust and lower SFC and this was found to be 1.7. The study has also found
that as we move for a greener air transport higher BPR are very important for
the best SFC. Effect of altitude on engine performance was found to be that of
reducing mass flow rate as a result of a decreasing air density and Reynolds
number with altitude in the lower atmosphere. It was found that thrust keep
decreasing with altitude. However, as altitude increases, temperature
decreases and hence the non-dimensional rotational speed increases up to an
altitude of 11 km. This increase in the non-dimensional speed will result into
increased PR and hence more mass flow will be pumped into the engine to
somehow compensate for the decreasing thrust to some extent. Effects of flight
speed were found to relate to momentum drag, ram pressure rise and ram
temperature rise. The momentum drug was found to be of significant effect
especially a low Mach numbers say M=0.4 but at Mach numbers above 4 the
effects of ram pressure can be evidenced and the thrust starts rising. The ram
pressure rise has the positive effect as that of PR and will act to increase thrust.
Also bleed and power off-take have been investigated and were mainly found to

88
alter the flow and power balance and required component rematching. Both are
found to reduce engine thrust, increasing SFC and TET. However, bleed off-
take is found to improve SM while power off-take is found to worsen it.
Transient performance study has been limited to the acceleration performance
and the effect of engine degradation on acceleration performance. A medium
bypass ratio non-mixing turbofan was chosen as a study bench mark and
Turbomatch 2.0 was used for this transient modelling and simulation. Transient
performance deals with the variation of engine performance parameters with
time and this requires close control given its operational safety on engine.
Findings of transient performance simulation were discussed in detail in chapter
4. In this chapter the author has highlighted the importance of the transient
performance, the phenomena associated with it and the requirement for
transient performance for both civil and military engines. Six simplified linear
fuel schedules were defined and used to investigate the effects of various fuel
schedules on acceleration manoeuvre. Findings have shown that the shorter
the acceleration time, the faster the fuel flow and hence the more the
instantaneous change of the performance parameters of the engine. For a clean
engine the fastest fuel schedule has resulted in HPC SM decrease by 12% and
TET over shoot of up 1900K (about 500K above the design COT) while SFC
was found to rise up to 47.5 mg/N.s which is as three times as high as the
design SFC. These performance parameters are unacceptable for a safe
engine operation and therefore fuel schedule 1, 2 and 3 are not recommended
for use on this model engine although they have not surged the compressor.
However, use of engine variable geometry such as bleed off-take may improve
the surge margin problem.
Effects of rotor moment of inertia and engine degradation on transient
performance were also investigated. It has been found that the higher the rotor
inertia the longer it takes to regain a new steady state and the transient working
line of the HPC initially moves towards the surge line above the steady state
working line.

89
Engine degradation has shown that 5% HPT efficiency degradation has
reduced engine thrust by 0.5 KN while 5% HPC PR degradation has resulted
into 15% HPC SM reduction. Finally, 5% HPC efficiency degradation has
reduced the HPC SM by 12%. On the other hand 5% HPT efficiency
degradation has been found to increase SFC up to 37% mg/N.s which is almost
two times higher than the design point SFC while 5% HPC efficiency
degradation increased SFC up to 30 mg/N.s. Again these values are far high to
be accepted for a working engine.
Effects of engine variable geometry; bleed and power off-take were not
investigated in this work but in previous works they have been found to affect
the transient performance. To simplify the analysis CMF method which does not
take into account the effects of volume dynamics, heat transfer and tip
clearance changes was used.
The results of investigation of transient acceleration were discussed in chapter
4. Given the effects of engine degradation on transient performance such as
TET overshoot and higher SFC, good engine control system is required to
contain fuel schedule in order to smoothen these transients. Transient
manoeuvres are found to affect the creep life of an engine and the mechanical
integrity of components. It also has got an environment issues due higher NOx
as a result of higher COT overshoot. Results of simulation for OD analysis for
both Turbomatch 2.0 and Gasturb 12 are quite similar except that Gasturb 12 is
more user friendly than Turbomatch 2.0.
5.2 Limitations
The aim of this work was to investigate transient performance of a turbofan
engine by looking at the acceleration and deceleration manoeuvres above idle
and also investigating the effects of different forms of degradation on transient
performance. Given the time limits and difficulties the author faced with
Turbomatch 2.0 simulation, this work only looked at acceleration manoeuvre
using six different simple linear fuel schedules. However, with the underlying
theory of gas turbine, deceleration would produce opposite results of
acceleration. This work also use the CMF which is a more simplified method of

90
investigating transient performance as it ignores volume dynamics. It has been
proved that ICV method gives more accurate results when dealing with large
component volume.
5.3 Recommendations for future works
Based on the short comings of this work, the author recommends that the future
works must attempt to look at deceleration manoeuvre, and also investigate fuel
different fuel schedule such as referred fuel versus referred rotational speed.
Study of acceleration manoeuvers below idle is also recommended. Moreover,
the effect of different bleed off-take and the effect of variable engine geometry
on the SM would be another good point of investigation in the future works.
Analysing the same problem with ICV method would set another bench mark to
compare the accuracy of these results. Therefore, in the future it is
recommendable to analyse this problem using ICV method and see if there is
any deviation between CMF and ICV results.

91
REFERENCES
[1] Elodie, R. (2007). Turbofan and Turbojet Engines, Database Handbook, 3rd
ed. Elodie Roux, France
[2] Palmer, J.R. (1983). The Turbomatch scheme for Gas-Turbine Performance
Calculations: Users’ Guide, SoE, Cranfield University, UK.
[3] Janikovik, J. (2010). Gas Turbine Transient Performance Modelling for
Engine Fight Path Cycle Analysis, PhD Thesis, SoE, Cranfield University, UK
[4] Vassilios, P. (2012). Gas Turbine Performance Simulation Lecture Notes,
MSc, SoE, Cranfield University, UK
[5] Jackson, A. J. B., Ramsden, K. W., McManus, D.G., and Zachos, P. (2012).
Gas Turbine Fundamentals and Turbomachinery Lecture Notes, SoE, Cranfield
University, UK
[6] Saravanamutto, H.I.H., Roger, G.F.C., Cohen, H., and Straznicky, P.V.
(2009). Gas Turbine Theory, 6th ed. Pearson, Essex, UK
[7] Pilidis, P., Palmer, J. P. (2012). Gas Turbine Theory and Performance
lecture Notes, SoE, Cranfield University, UK.
[8], Erian A, Baskharone (2000). Principles of Turbomachinery in Air-Breathing
Engines, 1st ed. Cambridge University Press, UK
[9] Jack D. Mattingly, William H. Heiser, David. (2006). Element of Propulsion:
Gas Turbine and Rockets, 3rd ed. Virginia state University, USA.
[10] Douglas R. Archer, Maido Saarlas. (1996). An Introduction to Aerospace
Propulsion, 4th ed. Prentice Hall, New Jersie, USA
[11] Ahmed F. El-Sayed. (2008). Aircraft Propulsion and Gas turbine Engines,
1st ed. CRF Press, Taylor & Francis Group, USA
[12] Philip .P. Walsh, Paul Fletcher. (2004). Gas Turbine Performance, 2nd ed.
Blackwell Publishing, 9600 Garsington Road, UK

92
[13] Joachim, Kurzke. (2013). Gas Turb 12: Design and Off-Design
Performance of Gas Turbines Manual, 12th ed. Max Feldbauer Weg, Germany.
[14] Benjamin G. Bruni. (2010). Performance Investigations of Turbofan Aero
Engines, MSc. Thesis, Cranfield University, UK
[15] Dilip R. Ballal, Joseph, Zelina. (2003). Progress in Aero-engine
Technology: (1939--2003), 4th ed. University of Dayton, USA.
[16] Joachim, Kurzke, (1999). Gas turbine cycle design methodology: A
comparison of parameter variation with numerical optimization, Transactions of
the ASME, Vol. 121, UK.
[17] Gordon C. Oates. (1997). Aircraft Propulsion Systems Technology and
Design, AIAA Education Series, 3rd ed. Washington, DC, USA
[18] K. W. Ramsden. (2012). Turbomachinery Courses Notes, SoE, Cranfield
University, UK
[19] Williams, Darrell. (2013). Propulsion systems performance and integration,
volume 2, lecture notes, SoE, Cranfield University, UK.
[20] E. A. Lehmann. (1980). Multiple Application Core Engine: Sizing and Usage
Criteria, Journal of Aircraft 1980, 0021-8669 vol.17 no.11 (802-809).
[21] Rolls-Royce. (2007). Introduction to gas turbine technology:
http://www.rolls-royce. com/history/publications/jet_engine.jsp, UK.
[22] Peeters P.M, Middel J. Hoolhorst, A. (2005). Fuel efficiency of commercial
aircraft, an overview of historical and future trends, National Aerospace
Laboratory NLR, Netherlands
[23] Al- Balushi Mohammed, Ali. (2010). Degradation issues in low by-pass
turbofan engines, MSc Thesis, SoE, Cranfield University, UK
[24] Melissa Wilcox, SwRI, Richard Baldwin, SwRI, Augusto Garcia Hernandez,
SwRI, Klaus Brun, Ph.D., SwRI. (2010). Guideline for gas turbine inlet air
filtration systems, Gas Machinery Research Council Southwest Research
Institute, USA

93
[25] KA HENG, LIEW. (2006). Aero thermodynamic cycle analysis of a dual-
spool separate exhaust turbofan engine, PhD Thesis, MSU, USA
[26] USAF.(1991). Performance Flight Testing Phase, Propulsion,
CAAEROPRO, USA
[27] Jack, Mattingly, Heiser H., Daley H. (2002). Aircraft Engine Design, AIAA
Education Series, USA
[28]Oates G. (1997). Aerothermodynamics of Gas Turbine and Rocket
Propulsion, AIAA Education Series, 3rd ed. USA
[29]Çengel Y., Boles M.A. (2006). Thermodynamics: an engineering approach,
5th ed. McGraw-Hill Higher Education, USA.
[30] Richard, Avellán. (2011). On the Design of Energy Efficient Aero Engines
Some Recent Innovations, PhD Thesis, Chalmers University of Technology,
Goteborg, Sweden.
[31] Anis, Faidi. (2012). Effect of accessory power take-off variation on a
turbofan engine performance, MSc Thesis, AFIT, USA
[32] Martin, Kirkman. (2013). Fundamental of gas turbine engine control, MSc
lecture notes’’, SoE, Cranfield University
[33] Thomas A. Ward. (2010), Aerospace propulsion system
[34] http://www.aircraftenginedesign.com/cepics1.html
[35] Philip A. Rubini. (2012). Turbine blade cooling’’, MSc Lecture notes, Hull
University, UK.
[36] Nikolaidis Th. (2013). Turbomatch 2.0 Network Version User Manual, SoE,
Cranfield University
[37] Pengliang, Rui. (2012). A degraded civil aircraft engine transient performance modelling and simulating, MSc, Thesis, SoE, Cranfield University, UK [38] Gangtuan, Li. (2009). Gas turbine technology: Transient performance simulation of a high bypass ratio turbofan engine, MSc, Thesis, SoE, Cranfield University, UK
[39] National aerospace laboratory (1999), WWW. Transport environment.org,
(accessed June 2013)


95
APPENDICES
Appendix A Turbomatch 2.0 models
A.1 Transient Engine model
**************************************************
ANALYSIS AND SIMULATION OF PERFORMANCE OF A MEDIUM
BYPASS RATIO TURBOFAN ENGINE
BY RUMORI SAFARI
***************************************************
MEDIUM BYPASS TURBO-FAN ENGINE (2 SPOOL)
DESIGN POINT: SEA LEVEL STATIC (ISA)
ALT 0.0 m
MACH 0.0
OPR 9.5
THRUST 16.9 kN
BPR 2.2
Mass Flow 44.8 kg/s
////
TR SI KE VA FP
-1
-1
INTAKE S1,2 D1-6 R200
COMPRE S2,3 D7-18 R202 V7 V8
PREMAS S3,20,4 D19-22 V19
NOZCON S20,21,1 D23,24 R204
COMPRE S4,5 D25-36 R206 V25 V26
PREMAS S5,25,6 D49-52

96
BURNER S6,7 D53-60 R210
MIXEES S7,25,8
TURBIN S8,9 D76-90 V77
TURBIN S9,10 D91-105 V92
NOZCON S10,11,1 D106,107 R212
PERFOR S1,0,0 D108-111,212,200,210,204,0,0,0,0,0
CODEND
////
! BRICK DATA ITEMS
! INTAKE
1 0.0 ! Altitude [m]
2 0.0 ! Deviation from ISA temperature [K]
3 0.0 ! Mach number
4 0.99 ! Pressure recovery, according to USAF
5 0.0 ! Deviation from ISA pressure [atm]
6 0.0 ! Relative humidity [%]
! FAN
7 0.85 ! SURGE MARGIN FAN: Z (if =-1. the default value 0.85 is
invoked)
8 1.0 ! Relative rotational speed N1 (PCN=RPM/RPM DP)
9 1.7 ! DP Pressure ratio
10 0.88 ! Isentropic efficiency
11 0.0 ! Error selection
12 2.0 ! Compressor Map Number
13 1.0 ! Shaft number
14 1.0 ! Scaling factor of Pressure Ratio – Degradation factor
15 1.0 ! Scaling factor of Non-D Mass Flow – Degradation factor

97
16 1.0 ! Scaling factor of ETAc
17 -1.0 ! Effective component volume [m^3]
18 0.0 ! Stator angle (VSV) relative to DP
! PREMAS: MAIN BYPASS
19 0.687 ! LAMDA=MASS FLOW RATIO=W4/W3 FOR A BPR=2.2
20 0.0 ! MASS FLOW LOSS (DELTA W=0)
21 1.0 ! PRESSURE FACTOR (LAMBDA P)
22 0.0 ! PRESSURE LOSS (DELTA P)
! NOZCON
23 -1.0 ! CONVERGENT NOZZLE: Switch set (= "1" if exit area "floats"
! = "-1" if exit area is fixed)
24 1.0 ! Scaling factor
! HIGH PRESSURE COMPRESSOR
25 0.7 ! SURGE MARGIN HPC: Z (if =-1. the default value 0.85 is
invoked)
26 1.0 ! Relative rotational speed PCN
27 5.59 ! DP Pressure ratio
28 0.88 ! Isentropic efficiency
29 1.0 ! Error selection
30 5.0 ! Compressor Map Number
31 2.0 ! Shaft number
32 1.0 ! Scaling factor of Pressure Ratio – Degradation factor
33 1.0 ! Scaling factor of Non-D Mass Flow – Degradation factor
34 1.0 ! Scaling factor of ETAc is
35 -1.0 ! Effective component volume [m^3]
36 0.0 ! Stator angle (VSV) relative to DP
! PREMASS COOLING BLEED

98
49 0.09 ! LAMDA W Cooling bypass (Wout/Win)
50 0.0 ! DELTA W
51 1.0 ! LAMBDA P
52 0.0 ! DELTA P
! COMBUSTOR
53 0.05 ! Pressure loss (=Total pressure loss/Inlet total pressure)
54 0.99 ! Combustion efficiency
55 0.2466 ! Fuel flow (If -1. is given the TET must be determined)
56 0.0 ! (>0) Water flow [kg s-1 or lb. s-1] or (<0) Water to air ratio
57 288. 15 ! Temperature of water stream [K]
58 0.0 ! Phase of water (0=liquid, 1=vapour)
59 1.0 ! Scaling factor of ETAb (combustion efficiency) – Degradation
factor
60 -1.0 ! Effective component volume [m^3]
! MIXEES
! HIGH PRESSURE TURBINE
76 0.0 ! Auxiliary or power output [W]
77 -1.0 ! Relative non-dimensional mass flow (if = -1, value 0.8 is
invoked)
78 -1.0 ! Relative non-dimensional speed CN (if = -1, value 0.6 is
invoked)
79 0.9 ! Design isentropic efficiency
80 -1.0 ! Relative non-dimensional speed PCN (= -1 for compressor
turbine)
81 2.0 ! Shaft Number (for power turbine, the value “0.” is used)
82 5.0 ! Turbine map umber
83 -1.0 ! Power law index "n", If = -1, power is assumed to be a
constant

99
84 1.0 ! Scaling factor of TF (non-D inlet mass flow) – Degradation
factor
85 1.0 ! Scaling factor of DH (enthalpy change) – Degradation factor
86 1.0 ! Scaling factor of ETAc– Degradation factor
87 177.0 ! Rotor rotational speed [RPS]
88 30.0 ! Rotor moment of inertia [kg.m^2]
89 -1. 0 ! Effective component volume [m^3]
90 0.0 ! NGV angle, relative to D.P.
! LOW PRESSURE TURBINE
91 0.0 ! Auxiliary or power output [W]
92 -1.0 ! Relative non-dimensional mass flow (if = -1, value 0.8 is
invoked)
93 -1.0 ! Relative non-dimensional speed CN (if = -1, value 0.6 is
invoked)
94 0.9 ! Design isentropic efficiency
95 -1.0 ! Relative non-dimensional speed PCN (= -1 for compressor
turbine)
96 1.0 ! Shaft Number (for power turbine, the value “0.” is used)
97 5.0 ! Turbine map umber
98 -1.0 ! Power law index "n", If = -1, power is assumed to be a
constant
99 1.0 ! Scaling factor of TF (non-D inlet mass flow) – Degradation
factor
100 1.0 ! Scaling factor of DH (enthalpy change) – Degradation factor
101 1.0 ! Scaling factor of ETAc– Degradation factor
102 170.0 ! Rotor rotational speed [RPS]
103 10.0 ! Rotor moment of inertia [kg.m^2]
104 -1.0 ! Effective component volume [m^3]

100
105 0.0 ! NGV angle, relative to D.P.
! NOZCORN
106 -1.0 ! CONVERGENT NOZZLE: Switch set (= "1" if exit area
"floats"
! = "-1" if exit area is fixed)
107 1.0 ! Scaling factor
! PERORMACE
108 -1.0 ! Power output - Power or Power turbine (= -1 for
turbojet/turbofan)
109 -1.0 ! Propeller efficiency (= -1 for turbojet/turbofan)
110 0.0 ! Scaling index ("1" = scaling needed, "0" = no scaling)
111 0.0 ! Required DP net thrust (Turbojet, turbofan) or shaft power
! STATION VECTOR ITEMS
-1
1 2 44.8 ! Item 2 at station 1 = Mass flow (kg/s)
-1
1 0.0 ! New OD Calculation; Altitude = 0.0 m
3 0.0
55 0.24
-1
-1
55 0.23
-1
-1
-3
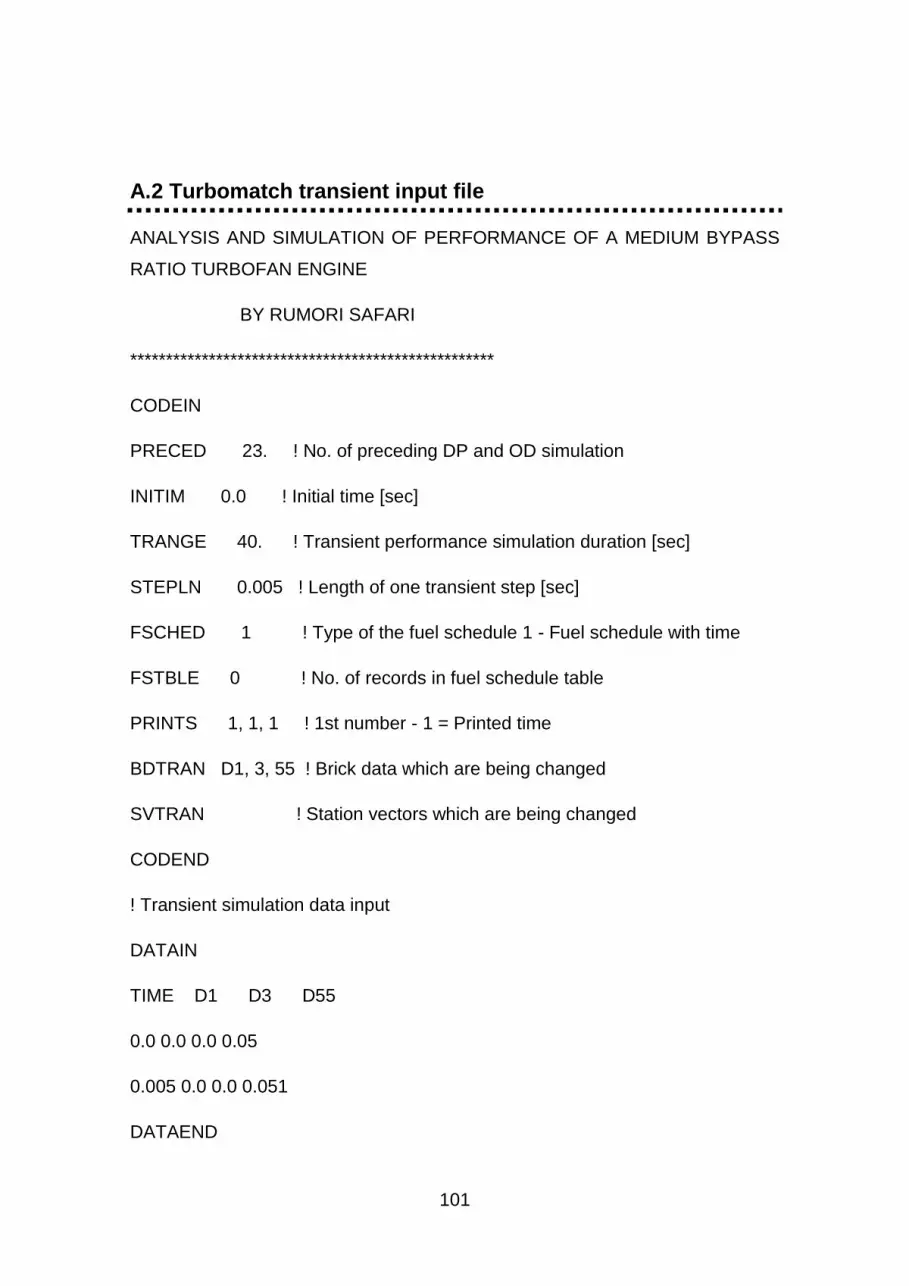
101
A.2 Turbomatch transient input file
ANALYSIS AND SIMULATION OF PERFORMANCE OF A MEDIUM BYPASS
RATIO TURBOFAN ENGINE
BY RUMORI SAFARI
***************************************************
CODEIN
PRECED 23. ! No. of preceding DP and OD simulation
INITIM 0.0 ! Initial time [sec]
TRANGE 40. ! Transient performance simulation duration [sec]
STEPLN 0.005 ! Length of one transient step [sec]
FSCHED 1 ! Type of the fuel schedule 1 - Fuel schedule with time
FSTBLE 0 ! No. of records in fuel schedule table
PRINTS 1, 1, 1 ! 1st number - 1 = Printed time
BDTRAN D1, 3, 55 ! Brick data which are being changed
SVTRAN ! Station vectors which are being changed
CODEND
! Transient simulation data input
DATAIN
TIME D1 D3 D55
0.0 0.0 0.0 0.05
0.005 0.0 0.0 0.051
DATAEND

102
Appendix B Gas Turb models
B.1 Gas Turb Input file for the base line engine

103
B.2 Gas Turb Output file for the base line engine


![[Coronary Bypass Surgery in Acute Myocardial Infarction]. Akut Miyokard İnfarktüsünde Koroner Bypass Cerrahisi](https://img.pdfslide.net/doc/110x75/63444ad1596bdb97a9086499/coronary-bypass-surgery-in-acute-myocardial-infarction-akut-miyokard-infarktuesuende.jpg)