Embed Size (px)
Citation preview
For comments, suggestions or further inquiries please contact:
Philippine Institute for Development StudiesSurian sa mga Pag-aaral Pangkaunlaran ng Pilipinas
The PIDS Discussion Paper Seriesconstitutes studies that are preliminary andsubject to further revisions. They are be-ing circulated in a limited number of cop-ies only for purposes of soliciting com-ments and suggestions for further refine-ments. The studies under the Series areunedited and unreviewed.
The views and opinions expressedare those of the author(s) and do not neces-sarily reflect those of the Institute.
Not for quotation without permissionfrom the author(s) and the Institute.
The Research Information Staff, Philippine Institute for Development Studies5th Floor, NEDA sa Makati Building, 106 Amorsolo Street, Legaspi Village, Makati City, PhilippinesTel Nos: (63-2) 8942584 and 8935705; Fax No: (63-2) 8939589; E-mail: [email protected]
Or visit our website at http://www.pids.gov.ph
December 2010
Chronic and Transient Poverty
Celia M. Reyes, Aubrey D. Tabuga, Christian D. MinaRonina D. Asis, and Maria Blesila G. Datu
DISCUSSION PAPER SERIES NO. 2010-30 (Revised)
DRAFT (FOR DISCUSSION PURPOSES ONLY)
Chronic and transient poverty
Celia M. Reyes, Aubrey D. Tabuga, Christian D. Mina, Ronina D. Asis, and Maria Blesila G. Datu*
Abstract The Philippines has been posting progress in terms of poverty reduction since the early 1990s. However, reversal in the trend was observed in 2006. Further worsening of the poverty situation is expected given the various economic and natural shocks (i.e., food and fuel price hikes; global financial and economic crisis; typhoons Milenyo, Reming, Frank, Ondoy, Pepeng; and, the recent El Niño) that recently hit the country. Many households, especially those that belong to the bottom 40 percent, are deemed vulnerable to these shocks. Using a panel of households from the different rounds of Family Income and Expenditure Survey (FIES) and Annual Poverty Indicators Survey (APIS) from 2003 to 2008, this paper examined the movements in and out of poverty among households. The study provided a description of the extent of chronic and transient poverty as well as the various household characteristics that discriminate among the different groups of households, including the chronic and the transient poor. A panel regression analysis was also explored to identify factors that can predict the income-based poverty status of households. Based on the descriptive and regression analyses, some insights were presented that can guide the government in the formulation of specific types of interventions to different groups of households, especially the transient poor. This is hopefully an attempt to recover the previous gains in poverty reduction and thus attain the MDG target of halving extreme poverty by 2015. Keywords: chronic poor, transient poor, panel data, logistic panel regression
* Celia M. Reyes is Senior Research Fellow, Aubrey D. Tabuga and Christian D. Mina are Supervising Research Specialists, while Ronina D. Asis and Maria Blesila G. Datu are Senior Research Specialists at the Philippine Institute for Development Studies (PIDS). The usual disclaimer applies.
ii
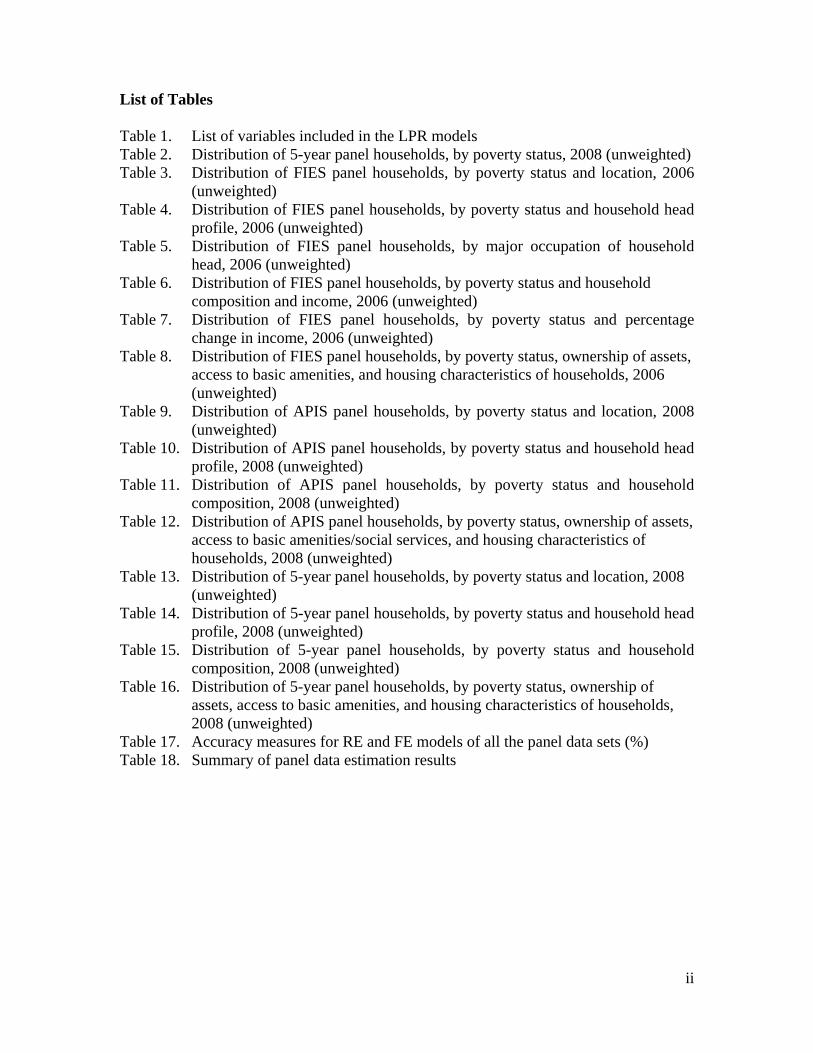
List of Tables Table 1. List of variables included in the LPR models Table 2. Distribution of 5-year panel households, by poverty status, 2008 (unweighted) Table 3. Distribution of FIES panel households, by poverty status and location, 2006
(unweighted) Table 4. Distribution of FIES panel households, by poverty status and household head
profile, 2006 (unweighted) Table 5. Distribution of FIES panel households, by major occupation of household
head, 2006 (unweighted) Table 6. Distribution of FIES panel households, by poverty status and household
composition and income, 2006 (unweighted) Table 7. Distribution of FIES panel households, by poverty status and percentage
change in income, 2006 (unweighted) Table 8. Distribution of FIES panel households, by poverty status, ownership of assets,
access to basic amenities, and housing characteristics of households, 2006 (unweighted)
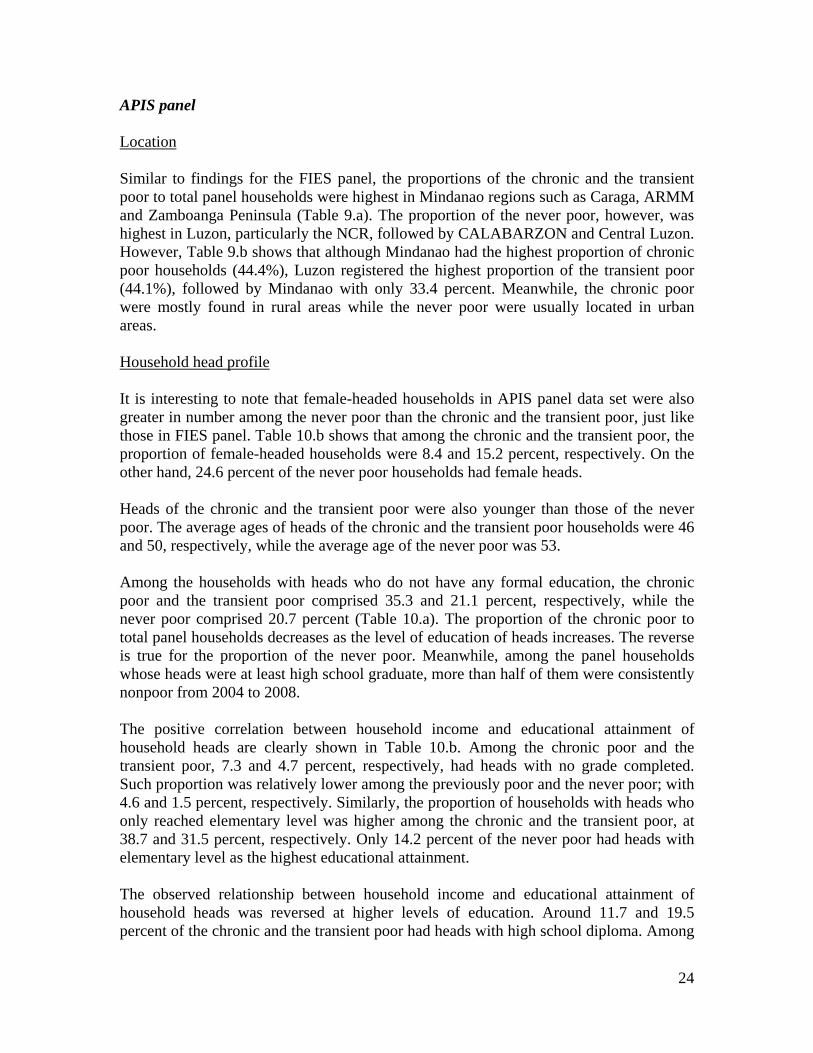
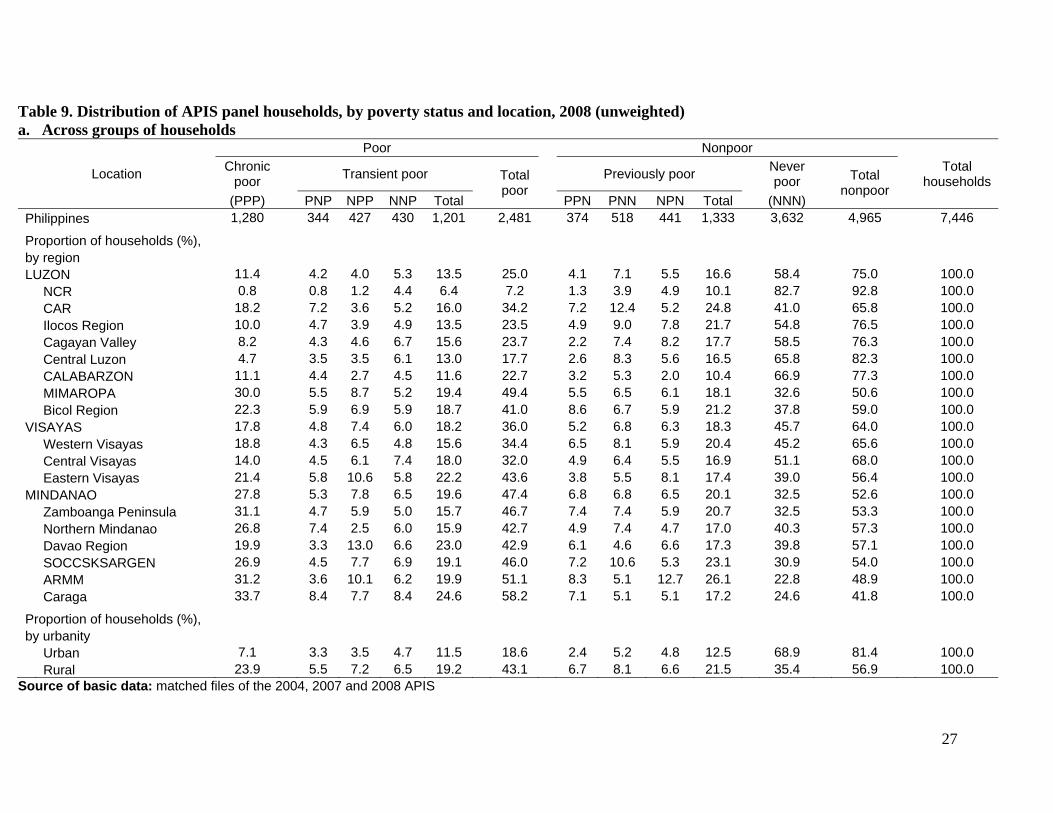
Table 9. Distribution of APIS panel households, by poverty status and location, 2008 (unweighted)
Table 10. Distribution of APIS panel households, by poverty status and household head profile, 2008 (unweighted)
Table 11. Distribution of APIS panel households, by poverty status and household composition, 2008 (unweighted)
Table 12. Distribution of APIS panel households, by poverty status, ownership of assets, access to basic amenities/social services, and housing characteristics of households, 2008 (unweighted)
Table 13. Distribution of 5-year panel households, by poverty status and location, 2008 (unweighted)
Table 14. Distribution of 5-year panel households, by poverty status and household head profile, 2008 (unweighted)
Table 15. Distribution of 5-year panel households, by poverty status and household composition, 2008 (unweighted)
Table 16. Distribution of 5-year panel households, by poverty status, ownership of assets, access to basic amenities, and housing characteristics of households, 2008 (unweighted)
Table 17. Accuracy measures for RE and FE models of all the panel data sets (%) Table 18. Summary of panel data estimation results
iii
List of Figures Figure 1. Movements in and out of poverty of FIES panel households, 2003 and 2006 Figure 2. Movements in and out of food poverty of FIES panel households, 2003 and
2006 Figure 3. Movements in and out of poverty of APIS panel households, 2004, 2007 and
2008 Figure 4. Movements in and out of food poverty of APIS panel households, 2004, 2007
and 2008 List of Appendices Appendix Table 1. Random Effects model for the FIES panel Appendix Table 2. Fixed Effects model for the FIES panel Appendix Table 3. Random Effects model for the APIS panel Appendix Table 4. Fixed Effects model for the APIS panel Appendix Table 5. Random Effects model for the 5-year panel Appendix Table 6. Fixed Effects model for the 5-year panel
1
I. Introduction The Philippines has been posting progress in terms of poverty reduction since the early 1990s until 2003. From 45.3 percent in 1991, poverty incidence among population had consistently declined to 30 percent in 2003. However, reversal in the trend was observed in 2006. Poverty incidence suddenly increased to 32.9 percent despite positive economic growth during the period. Reyes et al. (2010) analyzed the rise in poverty rate from 2003 to 2006. A decomposition analysis reveals that the recent rise in poverty is attributable to the lack of growth in real income as well as the lack of redistributive efforts that can improve the distribution of income in favor of the poor. Further worsening of the poverty situation is expected given the various economic and natural shocks that recently hit the country. These include the food and fuel price hikes in 2008, global financial and economic crisis which reached the country in the latter part of 2008, natural calamities such as the devastating typhoons Ondoy and Pepeng that hit the country during the last quarter of 2009, followed by the occurrence of the recent El Niño phenomenon that emerged during the latter part of 2009. Many households, especially those that belong to the bottom 40 percent, are deemed vulnerable to these shocks. Reyes (2003) found that a high proportion of households in a panel moved in and out of poverty during the period 1997-1999. Many of them were considered as vulnerable to shocks such as the 1997 Asian financial crisis and the worst episodes of El Niño and La Niña which occurred during the latter part of the 1990s. Using three different panels of households from the different rounds of Family Income and Expenditure Survey (FIES) and Annual Poverty Indicators Survey (APIS) from 2003 to 2008, this paper examines the movements in and out of poverty among households. The following section presents the methodology, which include a brief discussion of the data, the specification of the panel regression model as well as the variables used in developing the model. The third section discusses the characteristics of the panel of households, particularly those identified as chronic and transient poor. The section also presents the results of the regression analysis, specifically the various factors that can significantly predict the income-based poverty status of households. Based on the descriptive and regression analyses, the paper presents some insights that can guide the government in the formulation of specific types of interventions to different groups of households, especially the transient poor. This is hopefully an attempt to recover the previous gains in poverty reduction and thus attain the MDG target of halving extreme poverty by 2015.
2
II. Methodology A. Data Using various rounds of Family Income and Expenditure Survey (FIES) and Annual Poverty Indicator Survey (APIS) from 2003 to 2008, three different panel data sets were generated. One is the FIES panel data set, which consists of the 2003 and 2006 FIES data sets. Another is the APIS panel data set, which covers the 2004, 2007 and 2008 rounds of APIS. The third one is the 5-year panel data set, which is a combination of the FIES and APIS panel data sets. All of the panel data sets were generated using exact matching. This particular method utilized the geographical identification (ID) variables such as the province, municipality, barangay, enumeration area, sample housing unit serial number, and household control number in matching the sample of panel households. Exact matching of households was ensured by the National Statistics Office (NSO) through the assignment of 800(n) as household control number to new households in the sampling unit. Based on design, only matched households belonging to Rotation Group 2 under Replicate 4 were retained. The FIES panel data set includes 7,899 households while the APIS panel data set contains 7,446 households. The 5-year panel, meanwhile, consists of 6,574 households. B. Model In order to identify the factors that can predict the income-based poverty status of households, a logistic panel regression (LPR) model† was estimated. The LPR model can be written as follows: where: itY = logit(pit) = log[pit /(1- pit)], pit = probability of being nonpoor of household
i at time t; iα is the individual effect, which is constant over time and specific to individual
cross-section unit i; itΧ is a vector of independent variables, or characteristics of household i at time
t; β is a vector of coefficients, or effects of household characteristics on poverty
status; itu refers to the error term; i denotes the cross-sectional units or subjects, 1, 2, 3, …, n; t denotes time. Estimation of an LPR model depends on the assumptions on the intercepts, coefficients, and error terms. If each of the unit’s intercept is constant over time or ‘time invariant,’
† Theoretical discussions on panel data regression models were drawn from Gujarati (2004) and Wooldridge (2002).
ititiit uY +Χ+= βα
3
)( itiitiitY εμα ++Χ+= β
although it may vary across units, a fixed effects (FE) regression model has to be estimated. This particular model, which can be written as , examines differences in intercepts (among subjects) assuming the same slopes and constant variance across subjects. On the other hand, if the difference among subjects (or time periods) lies in the variance of the error term, a random effects (RE) regression model should be used. This model estimates variance components for subjects and error, assuming the same intercept and slopes. The specification of the RE model is as follows:
.
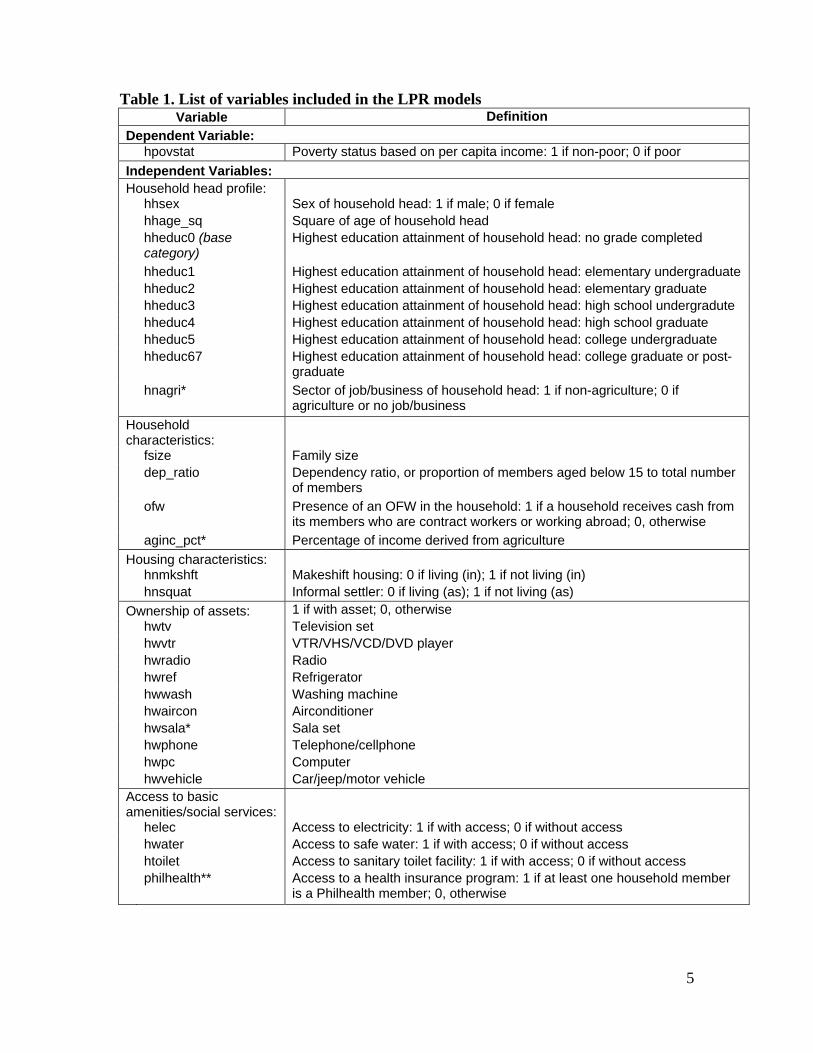
C. Variables Dependent variables The dependent variable is the poverty status of households based on per capita income, which takes the value 1 if nonpoor and 0 if poor. It is derived by comparing the per capita income of a household with the official poverty threshold for the province where the household resides. The poverty threshold is estimated by the National Statistical Coordination Board as the per capita income necessary to meet basic food and non-food needs of each household. Per capita income is computed as the total income reported by a household divided by the total number of members in that household. If per capita income is below the provincial poverty threshold, a household is considered poor. Otherwise, a household is tagged as non-poor.
Independent variables
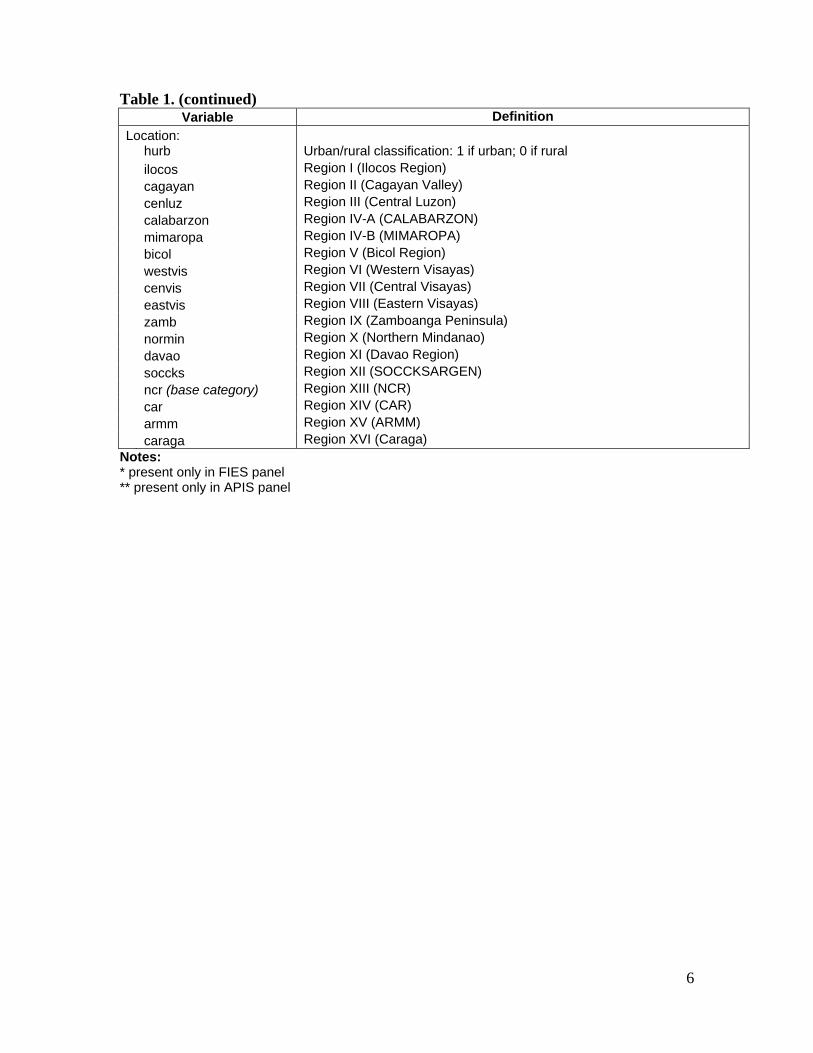
Many studies have already established the significant correlation between income and other household socioeconomic indicators such as household head profile, household composition, access to basic amenities, housing structure and tenure, and location (Balisacan 1997; Reyes 2003; Tabunda 2000). The independent variables, on the other hand, comprised of: (i) household head profile, which includes sex, age, educational attainment, and sector of job/business; (ii) household characteristics such as family size, dependency ratio, OFW indicator, and percentage of income derived from agriculture; (iii) housing characteristics such as kind of housing materials and housing tenure; (iv) ownership of assets such as television set, VTR/VHS/VCD/DVD player, radio, refrigerator, washing machine, airconditioner, sala set, telephone/cellphone, computer, car/jeep/motor vehicle; (v) access to basic amenities/social services like electricity, safe water, sanitary toilet facility, as well as health insurance program; and, (vi) location, e.g., urban/rural, region (see Table 1 for variable definition). D. Definition of terms Adopting the definitions used in Reyes (2003), poverty status of households was further classified into four (4) categories depending on their poverty status in each of the covered years. The “chronic poor” are those that are consistently income poor during the period under study. The “transient poor” refer to those who are classified as poor during a given
ititiiitY εμα +Χ++= β)(
4
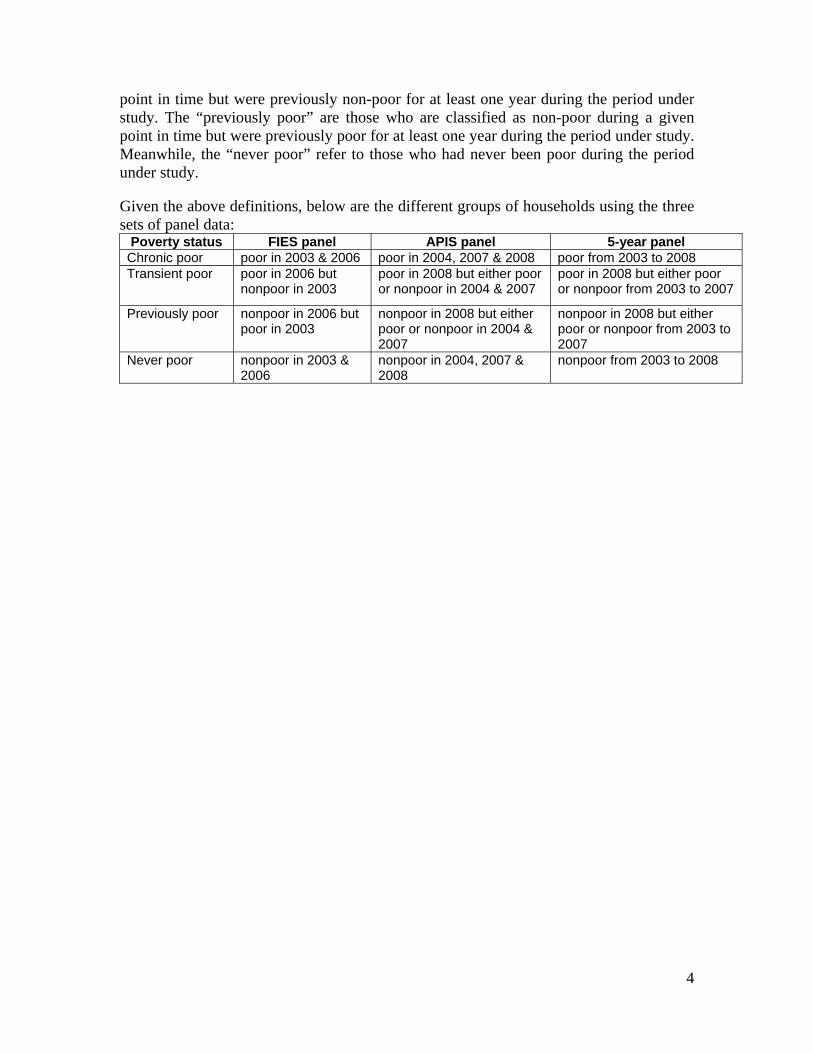
point in time but were previously non-poor for at least one year during the period under study. The “previously poor” are those who are classified as non-poor during a given point in time but were previously poor for at least one year during the period under study. Meanwhile, the “never poor” refer to those who had never been poor during the period under study. Given the above definitions, below are the different groups of households using the three sets of panel data:
Poverty status FIES panel APIS panel 5-year panel Chronic poor poor in 2003 & 2006 poor in 2004, 2007 & 2008 poor from 2003 to 2008 Transient poor poor in 2006 but
nonpoor in 2003 poor in 2008 but either poor or nonpoor in 2004 & 2007
poor in 2008 but either poor or nonpoor from 2003 to 2007
Previously poor nonpoor in 2006 but poor in 2003
nonpoor in 2008 but either poor or nonpoor in 2004 & 2007
nonpoor in 2008 but either poor or nonpoor from 2003 to 2007
Never poor nonpoor in 2003 & 2006
nonpoor in 2004, 2007 & 2008
nonpoor from 2003 to 2008
5
Table 1. List of variables included in the LPR models Variable Definition
Dependent Variable: hpovstat Poverty status based on per capita income: 1 if non-poor; 0 if poor Independent Variables: Household head profile: hhsex Sex of household head: 1 if male; 0 if female hhage_sq Square of age of household head
hheduc0 (base category)
Highest education attainment of household head: no grade completed
hheduc1 Highest education attainment of household head: elementary undergraduate hheduc2 Highest education attainment of household head: elementary graduate hheduc3 Highest education attainment of household head: high school undergradute hheduc4 Highest education attainment of household head: high school graduate hheduc5 Highest education attainment of household head: college undergraduate
hheduc67 Highest education attainment of household head: college graduate or post-
graduate
hnagri* Sector of job/business of household head: 1 if non-agriculture; 0 if
agriculture or no job/business Household characteristics:
fsize Family size
dep_ratio Dependency ratio, or proportion of members aged below 15 to total number
of members
ofw Presence of an OFW in the household: 1 if a household receives cash from
its members who are contract workers or working abroad; 0, otherwise aginc_pct* Percentage of income derived from agriculture Housing characteristics: hnmkshft Makeshift housing: 0 if living (in); 1 if not living (in) hnsquat Informal settler: 0 if living (as); 1 if not living (as) Ownership of assets: 1 if with asset; 0, otherwise hwtv Television set hwvtr VTR/VHS/VCD/DVD player hwradio Radio hwref Refrigerator hwwash Washing machine hwaircon Airconditioner hwsala* Sala set hwphone Telephone/cellphone hwpc Computer hwvehicle Car/jeep/motor vehicle Access to basic amenities/social services:
helec Access to electricity: 1 if with access; 0 if without access hwater Access to safe water: 1 if with access; 0 if without access htoilet Access to sanitary toilet facility: 1 if with access; 0 if without access
philhealth** Access to a health insurance program: 1 if at least one household member
is a Philhealth member; 0, otherwise
6
Table 1. (continued) Variable Definition
Location: hurb Urban/rural classification: 1 if urban; 0 if rural ilocos Region I (Ilocos Region) cagayan Region II (Cagayan Valley) cenluz Region III (Central Luzon) calabarzon Region IV-A (CALABARZON) mimaropa Region IV-B (MIMAROPA) bicol Region V (Bicol Region) westvis Region VI (Western Visayas) cenvis Region VII (Central Visayas) eastvis Region VIII (Eastern Visayas) zamb Region IX (Zamboanga Peninsula) normin Region X (Northern Mindanao) davao Region XI (Davao Region) soccks Region XII (SOCCKSARGEN) ncr (base category) Region XIII (NCR) car Region XIV (CAR) armm Region XV (ARMM) caraga Region XVI (Caraga)
Notes: * present only in FIES panel ** present only in APIS panel
7
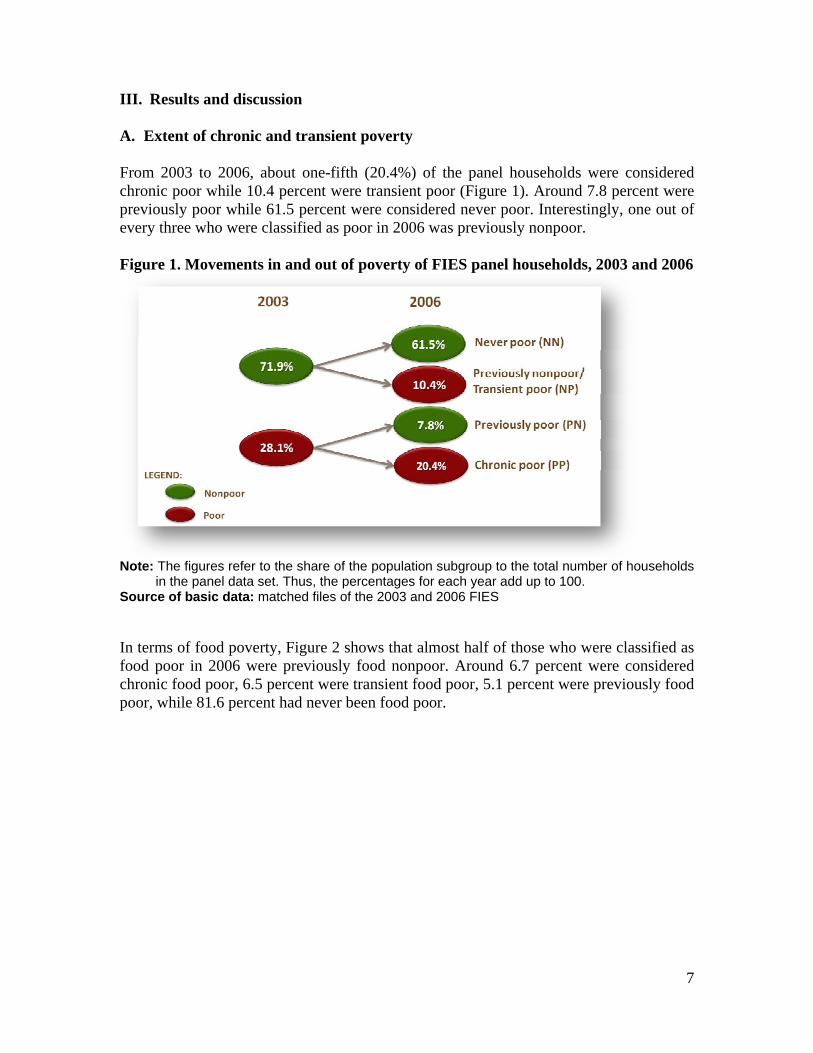
III. Results and discussion A. Extent of chronic and transient poverty From 2003 to 2006, about one-fifth (20.4%) of the panel households were considered chronic poor while 10.4 percent were transient poor (Figure 1). Around 7.8 percent were previously poor while 61.5 percent were considered never poor. Interestingly, one out of every three who were classified as poor in 2006 was previously nonpoor. Figure 1. Movements in and out of poverty of FIES panel households, 2003 and 2006
Note: The figures refer to the share of the population subgroup to the total number of households
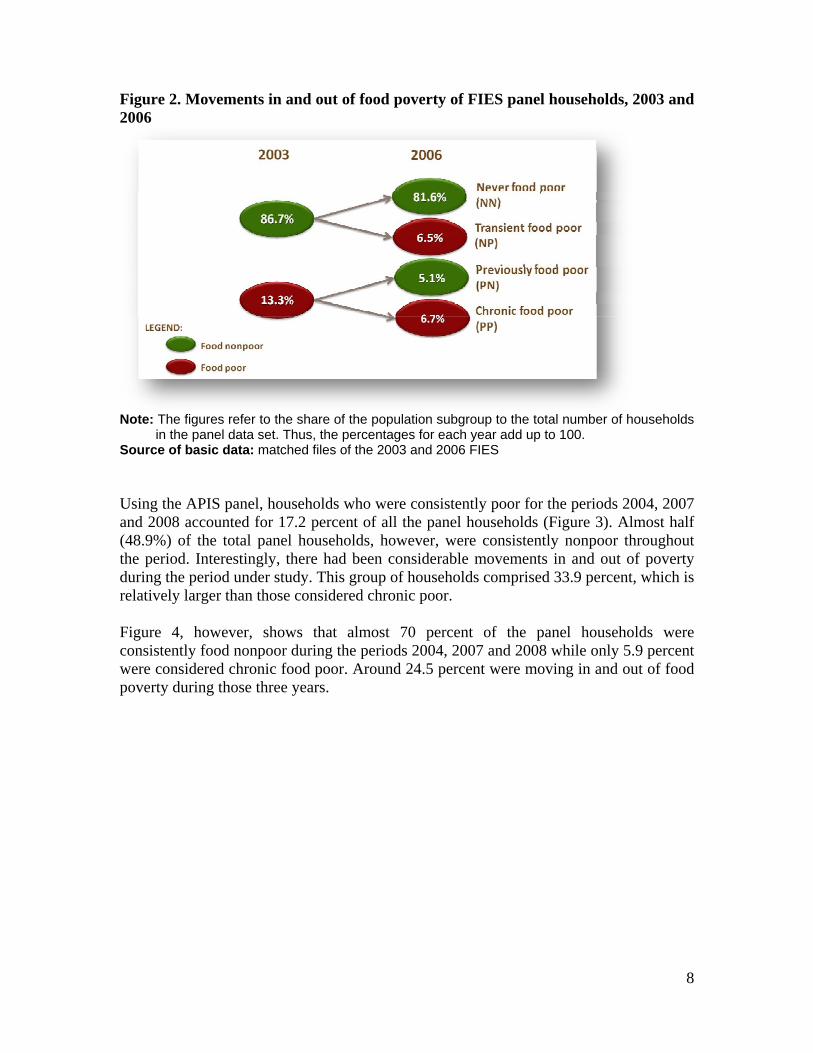
in the panel data set. Thus, the percentages for each year add up to 100. Source of basic data: matched files of the 2003 and 2006 FIES In terms of food poverty, Figure 2 shows that almost half of those who were classified as food poor in 2006 were previously food nonpoor. Around 6.7 percent were considered chronic food poor, 6.5 percent were transient food poor, 5.1 percent were previously food poor, while 81.6 percent had never been food poor.
8
Figure 2. Movements in and out of food poverty of FIES panel households, 2003 and 2006
Note: The figures refer to the share of the population subgroup to the total number of households
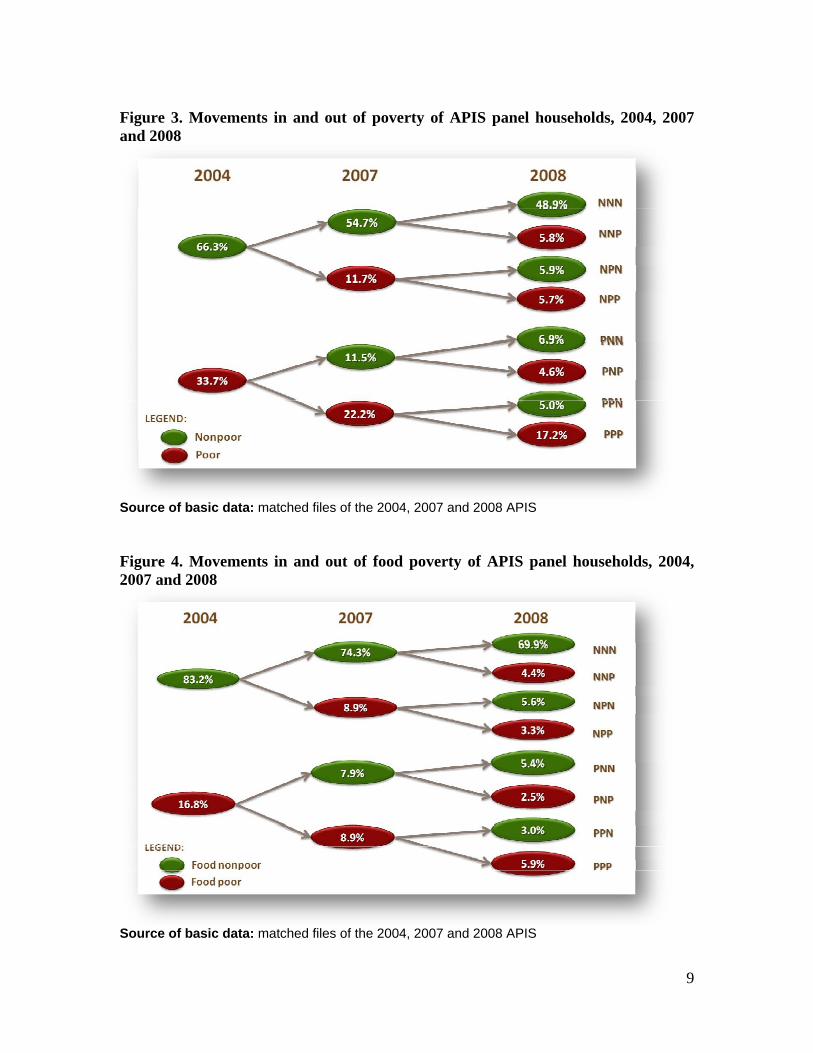
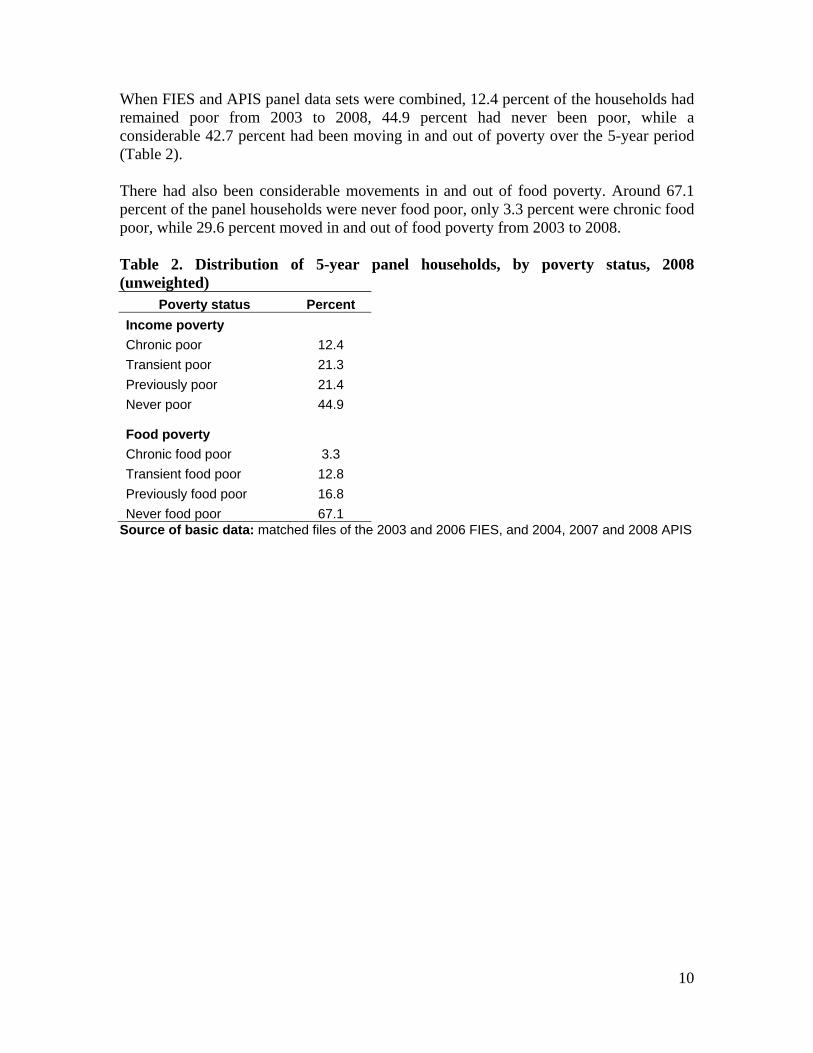
in the panel data set. Thus, the percentages for each year add up to 100. Source of basic data: matched files of the 2003 and 2006 FIES Using the APIS panel, households who were consistently poor for the periods 2004, 2007 and 2008 accounted for 17.2 percent of all the panel households (Figure 3). Almost half (48.9%) of the total panel households, however, were consistently nonpoor throughout the period. Interestingly, there had been considerable movements in and out of poverty during the period under study. This group of households comprised 33.9 percent, which is relatively larger than those considered chronic poor. Figure 4, however, shows that almost 70 percent of the panel households were consistently food nonpoor during the periods 2004, 2007 and 2008 while only 5.9 percent were considered chronic food poor. Around 24.5 percent were moving in and out of food poverty during those three years.
9
Figure 3. Movements in and out of poverty of APIS panel households, 2004, 2007 and 2008
Source of basic data: matched files of the 2004, 2007 and 2008 APIS Figure 4. Movements in and out of food poverty of APIS panel households, 2004, 2007 and 2008
Source of basic data: matched files of the 2004, 2007 and 2008 APIS
10
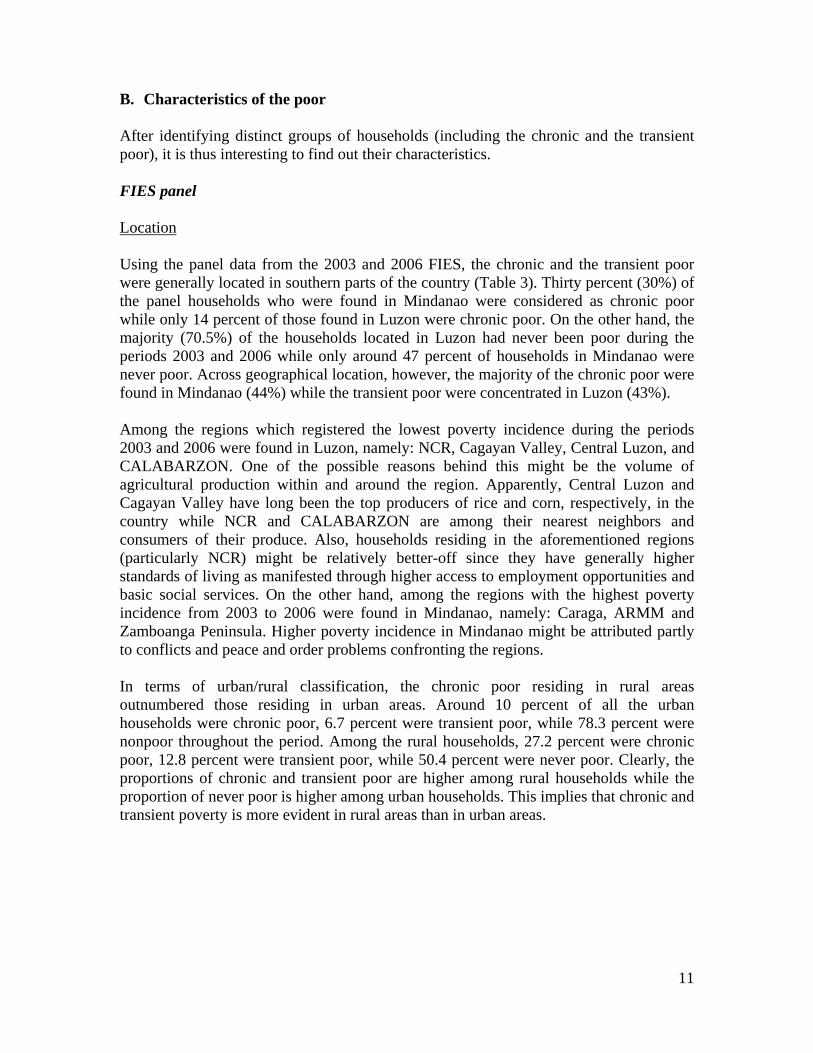
When FIES and APIS panel data sets were combined, 12.4 percent of the households had remained poor from 2003 to 2008, 44.9 percent had never been poor, while a considerable 42.7 percent had been moving in and out of poverty over the 5-year period (Table 2). There had also been considerable movements in and out of food poverty. Around 67.1 percent of the panel households were never food poor, only 3.3 percent were chronic food poor, while 29.6 percent moved in and out of food poverty from 2003 to 2008. Table 2. Distribution of 5-year panel households, by poverty status, 2008 (unweighted)
Poverty status Percent Income poverty Chronic poor 12.4 Transient poor 21.3 Previously poor 21.4 Never poor 44.9
Food poverty Chronic food poor 3.3 Transient food poor 12.8 Previously food poor 16.8 Never food poor 67.1
Source of basic data: matched files of the 2003 and 2006 FIES, and 2004, 2007 and 2008 APIS
11
B. Characteristics of the poor
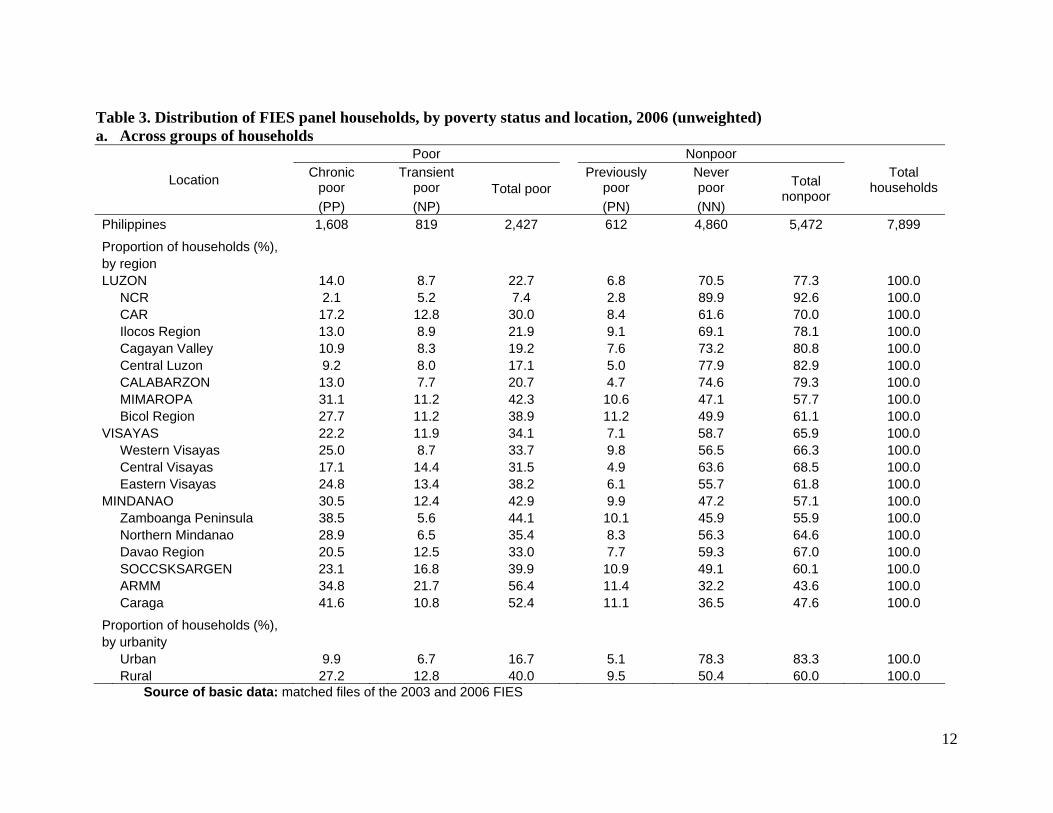
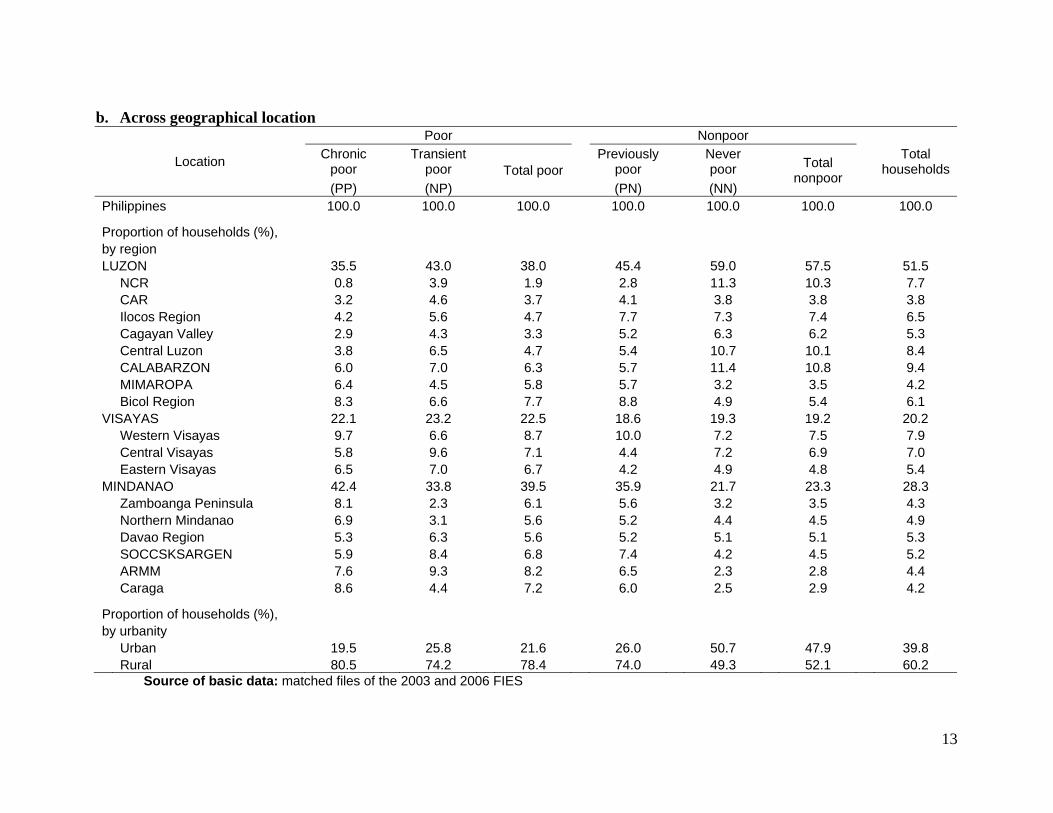
After identifying distinct groups of households (including the chronic and the transient poor), it is thus interesting to find out their characteristics. FIES panel Location Using the panel data from the 2003 and 2006 FIES, the chronic and the transient poor were generally located in southern parts of the country (Table 3). Thirty percent (30%) of the panel households who were found in Mindanao were considered as chronic poor while only 14 percent of those found in Luzon were chronic poor. On the other hand, the majority (70.5%) of the households located in Luzon had never been poor during the periods 2003 and 2006 while only around 47 percent of households in Mindanao were never poor. Across geographical location, however, the majority of the chronic poor were found in Mindanao (44%) while the transient poor were concentrated in Luzon (43%). Among the regions which registered the lowest poverty incidence during the periods 2003 and 2006 were found in Luzon, namely: NCR, Cagayan Valley, Central Luzon, and CALABARZON. One of the possible reasons behind this might be the volume of agricultural production within and around the region. Apparently, Central Luzon and Cagayan Valley have long been the top producers of rice and corn, respectively, in the country while NCR and CALABARZON are among their nearest neighbors and consumers of their produce. Also, households residing in the aforementioned regions (particularly NCR) might be relatively better-off since they have generally higher standards of living as manifested through higher access to employment opportunities and basic social services. On the other hand, among the regions with the highest poverty incidence from 2003 to 2006 were found in Mindanao, namely: Caraga, ARMM and Zamboanga Peninsula. Higher poverty incidence in Mindanao might be attributed partly to conflicts and peace and order problems confronting the regions. In terms of urban/rural classification, the chronic poor residing in rural areas outnumbered those residing in urban areas. Around 10 percent of all the urban households were chronic poor, 6.7 percent were transient poor, while 78.3 percent were nonpoor throughout the period. Among the rural households, 27.2 percent were chronic poor, 12.8 percent were transient poor, while 50.4 percent were never poor. Clearly, the proportions of chronic and transient poor are higher among rural households while the proportion of never poor is higher among urban households. This implies that chronic and transient poverty is more evident in rural areas than in urban areas.
12
Table 3. Distribution of FIES panel households, by poverty status and location, 2006 (unweighted) a. Across groups of households
Location
Poor Nonpoor Total
householdsChronic
poor Transient poor Total poor
Previously poor Never
poor Total nonpoor
(PP) (NP) (PN) (NN) Philippines 1,608 819 2,427 612 4,860 5,472 7,899
Proportion of households (%), by region LUZON 14.0 8.7 22.7 6.8 70.5 77.3 100.0
NCR 2.1 5.2 7.4 2.8 89.9 92.6 100.0 CAR 17.2 12.8 30.0 8.4 61.6 70.0 100.0 Ilocos Region 13.0 8.9 21.9 9.1 69.1 78.1 100.0 Cagayan Valley 10.9 8.3 19.2 7.6 73.2 80.8 100.0 Central Luzon 9.2 8.0 17.1 5.0 77.9 82.9 100.0 CALABARZON 13.0 7.7 20.7 4.7 74.6 79.3 100.0 MIMAROPA 31.1 11.2 42.3 10.6 47.1 57.7 100.0 Bicol Region 27.7 11.2 38.9 11.2 49.9 61.1 100.0
VISAYAS 22.2 11.9 34.1 7.1 58.7 65.9 100.0 Western Visayas 25.0 8.7 33.7 9.8 56.5 66.3 100.0 Central Visayas 17.1 14.4 31.5 4.9 63.6 68.5 100.0 Eastern Visayas 24.8 13.4 38.2 6.1 55.7 61.8 100.0
MINDANAO 30.5 12.4 42.9 9.9 47.2 57.1 100.0 Zamboanga Peninsula 38.5 5.6 44.1 10.1 45.9 55.9 100.0 Northern Mindanao 28.9 6.5 35.4 8.3 56.3 64.6 100.0 Davao Region 20.5 12.5 33.0 7.7 59.3 67.0 100.0 SOCCSKSARGEN 23.1 16.8 39.9 10.9 49.1 60.1 100.0 ARMM 34.8 21.7 56.4 11.4 32.2 43.6 100.0 Caraga 41.6 10.8 52.4 11.1 36.5 47.6 100.0
Proportion of households (%), by urbanity
Urban 9.9 6.7 16.7 5.1 78.3 83.3 100.0 Rural 27.2 12.8 40.0 9.5 50.4 60.0 100.0
Source of basic data: matched files of the 2003 and 2006 FIES
13
b. Across geographical location
Location
Poor Nonpoor Total
householdsChronic
poor Transient poor Total poor
Previously poor Never
poor Total nonpoor
(PP) (NP) (PN) (NN) Philippines 100.0 100.0 100.0 100.0 100.0 100.0 100.0
Proportion of households (%), by region LUZON 35.5 43.0 38.0 45.4 59.0 57.5 51.5
NCR 0.8 3.9 1.9 2.8 11.3 10.3 7.7 CAR 3.2 4.6 3.7 4.1 3.8 3.8 3.8 Ilocos Region 4.2 5.6 4.7 7.7 7.3 7.4 6.5 Cagayan Valley 2.9 4.3 3.3 5.2 6.3 6.2 5.3 Central Luzon 3.8 6.5 4.7 5.4 10.7 10.1 8.4 CALABARZON 6.0 7.0 6.3 5.7 11.4 10.8 9.4 MIMAROPA 6.4 4.5 5.8 5.7 3.2 3.5 4.2 Bicol Region 8.3 6.6 7.7 8.8 4.9 5.4 6.1
VISAYAS 22.1 23.2 22.5 18.6 19.3 19.2 20.2 Western Visayas 9.7 6.6 8.7 10.0 7.2 7.5 7.9 Central Visayas 5.8 9.6 7.1 4.4 7.2 6.9 7.0 Eastern Visayas 6.5 7.0 6.7 4.2 4.9 4.8 5.4
MINDANAO 42.4 33.8 39.5 35.9 21.7 23.3 28.3 Zamboanga Peninsula 8.1 2.3 6.1 5.6 3.2 3.5 4.3 Northern Mindanao 6.9 3.1 5.6 5.2 4.4 4.5 4.9 Davao Region 5.3 6.3 5.6 5.2 5.1 5.1 5.3 SOCCSKSARGEN 5.9 8.4 6.8 7.4 4.2 4.5 5.2 ARMM 7.6 9.3 8.2 6.5 2.3 2.8 4.4 Caraga 8.6 4.4 7.2 6.0 2.5 2.9 4.2
Proportion of households (%), by urbanity
Urban 19.5 25.8 21.6 26.0 50.7 47.9 39.8 Rural 80.5 74.2 78.4 74.0 49.3 52.1 60.2
Source of basic data: matched files of the 2003 and 2006 FIES
14
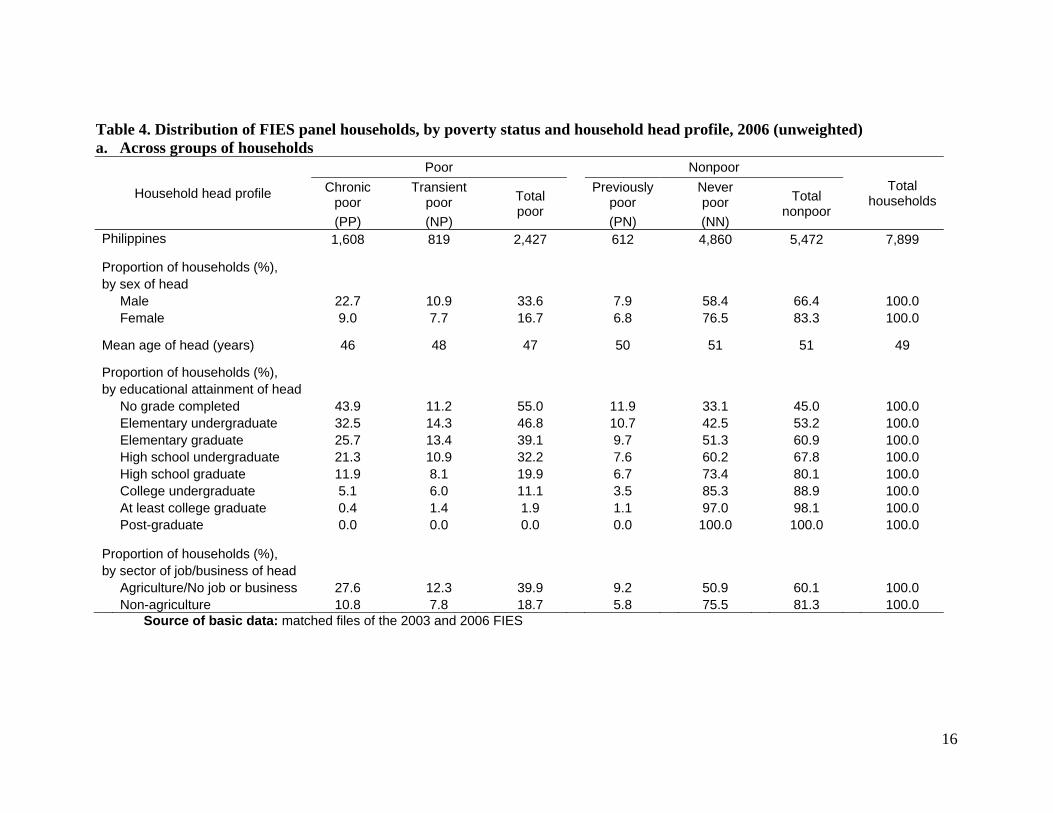
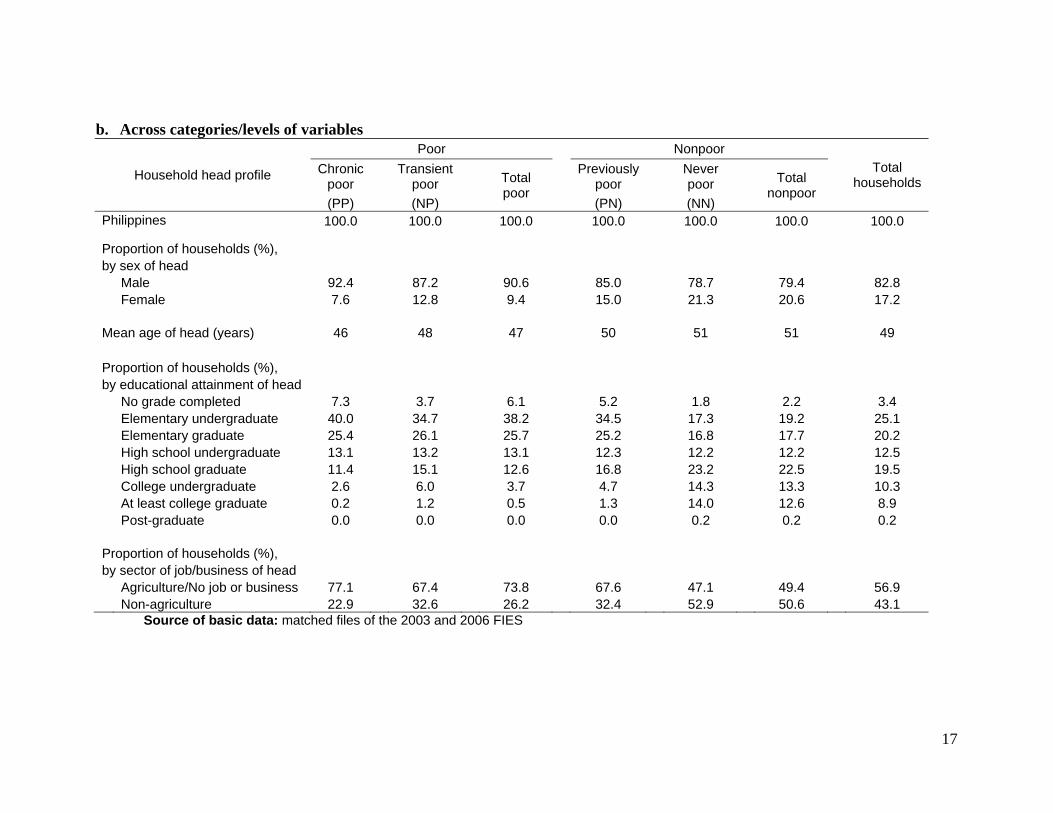
Household head profile Among male-headed households, 22.7 percent were chronic poor, 10.9 percent were transient poor, while 58.4 percent were consistently nonpoor (Table 4). Among female-headed households, 9.0 and 7.7 percent were chronic and transient poor, respectively, while 76.5 percent were never poor. Although all groups of households were predominantly male-headed, the proportions imply that many of the female-headed ones were consistently nonpoor. Meanwhile, it is also interesting to note that 92.4 percent of the chronic poor were headed by males while only 78.7 percent of the never poor were male-headed. This implies that the proportion of female-headed households seems to increase with income. On the average, heads of the chronic and the transient poor were relatively younger than heads of the previously and the never poor. The average ages of heads of the chronic and the transient poor were 46 and 48, respectively, which are relatively lower than the average ages of heads of the previously and the never poor (50 and 51, respectively). Interestingly, educational attainment of household head seems to be positively correlated with income. Table 4.a clearly shows that the proportion of chronic poor households decreases as educational level of head increases. The reverse is true among the never poor households; the proportion decreases as educational level of head increases. Almost half (43.9%) of households having heads with no formal education were chronic poor. On the other hand, 7.4 percent of households having heads who are at least high school graduate were chronic poor, 6.0 percent were transient poor, while 82.0 percent were never poor. Table 4.b, however, shows that almost 50 percent of the chronic poor households have heads who did not even finish elementary while only 2.8 percent of them reached tertiary education. This observation does not hold among the never poor because more than half of them have heads with high school diploma.
Moreover, the proportion of the chronic poor to total panel households whose heads either were engaged in agriculture or had no job/business is higher (at 27.6%) than the proportion of those whose heads were engaged in non-agricultural activities (at 10.8%). This observation is also true among the transient poor, with 12.7 percent for those engaged in agriculture or without job/business and 7.8 percent for those whose works were not related to agriculture. Different patterns, however, were observed among the never poor. The proportion of the never poor to total households whose heads either had agriculture-related job/business or no work at all, at 50.9 percent, is only two thirds of that whose heads were employed in non-agriculture sector, at 75.5 percent. Among the chronic poor, the proportion of households whose heads were either engaged in agriculture or had no job/business both in 2003 and 2006 is significantly higher, at 77.1%, than those whose heads were engaged in non-agricultural works/businesses, at 22.9% (Table 4.b). Among the never poor, however, 52.9 percent have heads whose
15
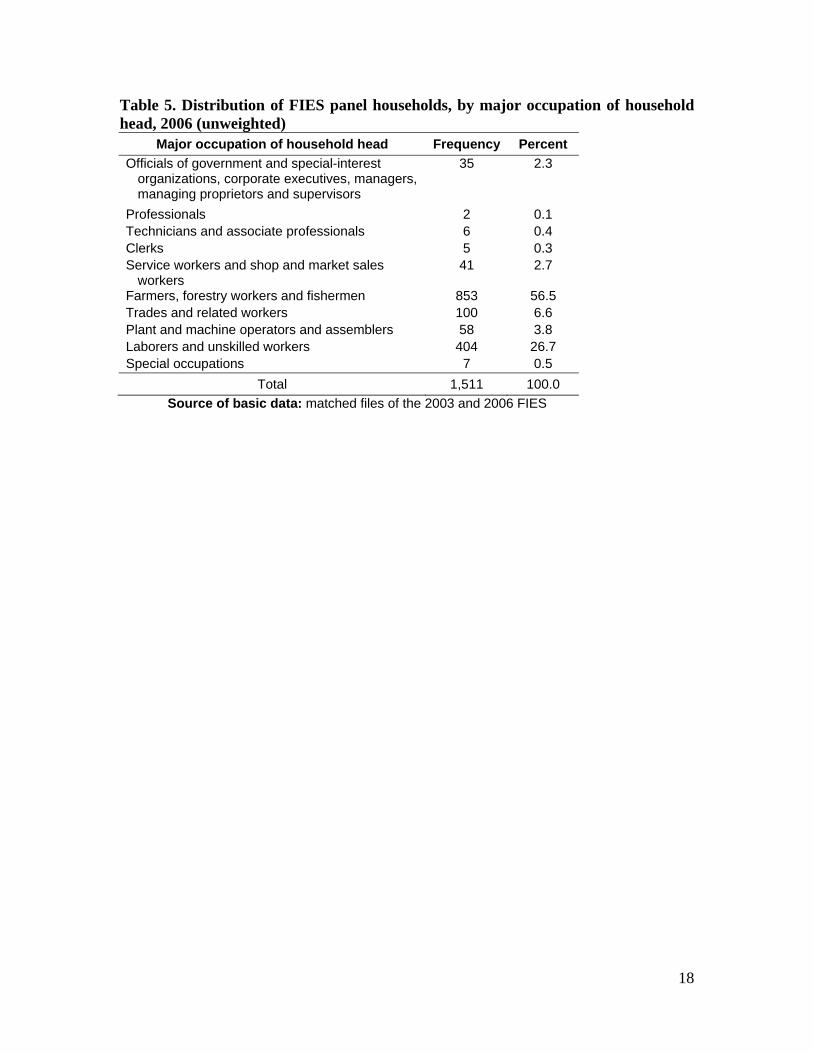
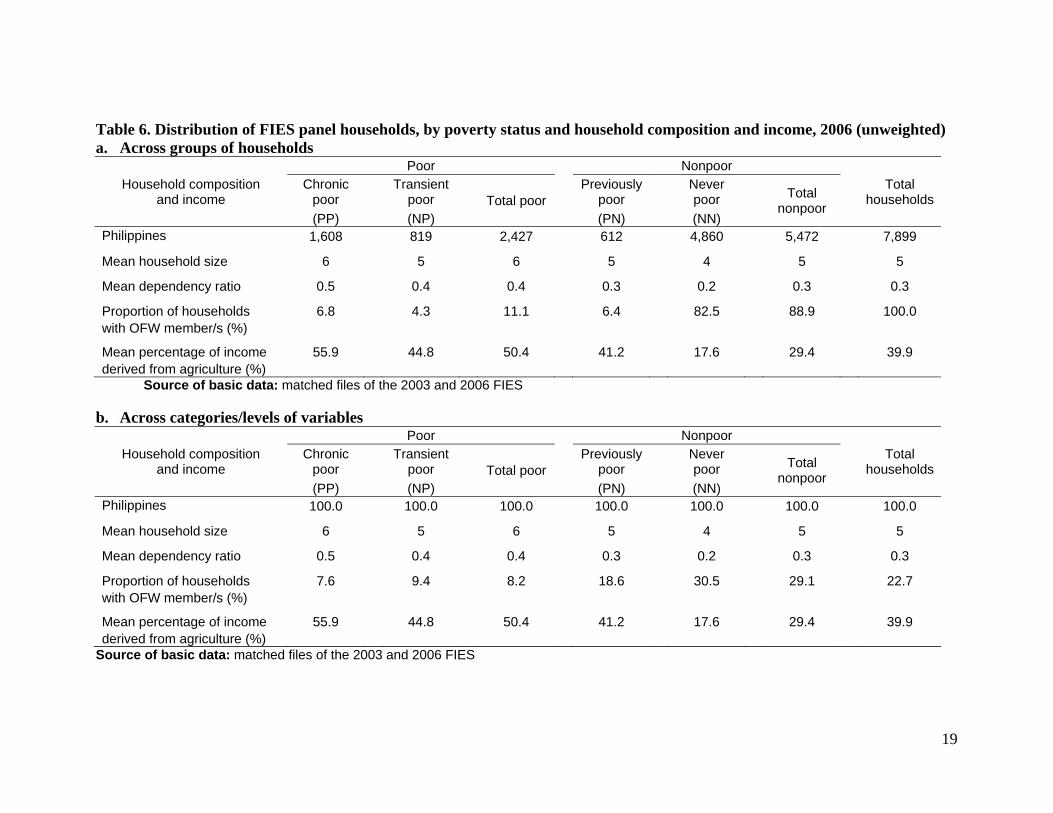
jobs/businesses were non-agriculture-related while 47.1 percent have heads who either had agriculture-related jobs/businesses or no works at all. In terms of occupation of household heads, Table 5 shows that more than half (56.6%) of the panel households have heads who were farmers, fishermen or forestry workers. This was the largest among the major occupational groups of household heads. The second largest group was laborers and unskilled workers, which accounted for 26.7 percent of the total panel households, followed by trades and related workers with 6.6 percent, and then plant and machine operators and assemblers, with 3.8 percent. Household composition and income There are also some notable differences across groups of households in terms of household composition and income (Table 6). The chronic and the transient poor were observed to have relatively larger household size and higher dependency ratio compared to the never poor. The chronic and the transient poor tend to have 5 to 6 members on the average while the never poor households were usually composed of 4 members. Similarly, the chronic and the transient poor had relatively higher number of dependents (members aged below 15), around 4 or 5 dependents out of every 10 members, than the never poor, which only had about 2 dependents for every 10 members. The presence of an OFW member in a household was also observed to discriminate among households from different income groups. Around 82.5 percent of households with at least one OFW member were considered as never poor while only 6.8 and 4.3 percent of such households were chronic and transient poor, respectively. Table 6.b shows that the proportion of households with at least one OFW member increases with income; 7.6 percent among the chronic poor, 9.4 percent among the transient poor, 18.6 percent among the previously poor, and 30.5 percent among the never poor. In terms of income, the chronic poor had the highest mean percentage of income derived from agriculture among the four distinct groups of households. In 2006, more than 50 percent of their total household income was sourced from agricultural activities. The transient and the previously poor also registered significant percentages of income from agricultural sources. Agricultural income of the transient poor accounted for about 44.8 percent of their total household income while a slightly lower percentage, at 41.2 percent, was reported for the previously poor. In contrast, only 17.6 percent of the total household income of the never poor was derived from agricultural activities.
16
Table 4. Distribution of FIES panel households, by poverty status and household head profile, 2006 (unweighted) a. Across groups of households
Household head profile
Poor Nonpoor Total
householdsChronic
poor Transient
poor Total poor
Previously poor
Never poor Total
nonpoor (PP) (NP) (PN) (NN)
Philippines 1,608 819 2,427 612 4,860 5,472 7,899
Proportion of households (%), by sex of head
Male 22.7 10.9 33.6 7.9 58.4 66.4 100.0 Female 9.0 7.7 16.7 6.8 76.5 83.3 100.0
Mean age of head (years) 46 48 47 50 51 51 49
Proportion of households (%), by educational attainment of head
No grade completed 43.9 11.2 55.0 11.9 33.1 45.0 100.0 Elementary undergraduate 32.5 14.3 46.8 10.7 42.5 53.2 100.0 Elementary graduate 25.7 13.4 39.1 9.7 51.3 60.9 100.0 High school undergraduate 21.3 10.9 32.2 7.6 60.2 67.8 100.0 High school graduate 11.9 8.1 19.9 6.7 73.4 80.1 100.0 College undergraduate 5.1 6.0 11.1 3.5 85.3 88.9 100.0 At least college graduate 0.4 1.4 1.9 1.1 97.0 98.1 100.0 Post-graduate 0.0 0.0 0.0 0.0 100.0 100.0 100.0
Proportion of households (%), by sector of job/business of head
Agriculture/No job or business 27.6 12.3 39.9 9.2 50.9 60.1 100.0 Non-agriculture 10.8 7.8 18.7 5.8 75.5 81.3 100.0
Source of basic data: matched files of the 2003 and 2006 FIES
17
b. Across categories/levels of variables
Household head profile
Poor Nonpoor Total
householdsChronic
poor Transient
poor Total poor
Previously poor
Never poor Total
nonpoor (PP) (NP) (PN) (NN)
Philippines 100.0 100.0 100.0 100.0 100.0 100.0 100.0
Proportion of households (%), by sex of head
Male 92.4 87.2 90.6 85.0 78.7 79.4 82.8 Female 7.6 12.8 9.4 15.0 21.3 20.6 17.2
Mean age of head (years) 46 48 47 50 51 51 49
Proportion of households (%), by educational attainment of head
No grade completed 7.3 3.7 6.1 5.2 1.8 2.2 3.4 Elementary undergraduate 40.0 34.7 38.2 34.5 17.3 19.2 25.1 Elementary graduate 25.4 26.1 25.7 25.2 16.8 17.7 20.2 High school undergraduate 13.1 13.2 13.1 12.3 12.2 12.2 12.5 High school graduate 11.4 15.1 12.6 16.8 23.2 22.5 19.5 College undergraduate 2.6 6.0 3.7 4.7 14.3 13.3 10.3 At least college graduate 0.2 1.2 0.5 1.3 14.0 12.6 8.9 Post-graduate 0.0 0.0 0.0 0.0 0.2 0.2 0.2
Proportion of households (%), by sector of job/business of head
Agriculture/No job or business 77.1 67.4 73.8 67.6 47.1 49.4 56.9 Non-agriculture 22.9 32.6 26.2 32.4 52.9 50.6 43.1
Source of basic data: matched files of the 2003 and 2006 FIES
18
Table 5. Distribution of FIES panel households, by major occupation of household head, 2006 (unweighted)
Major occupation of household head Frequency Percent Officials of government and special-interest
organizations, corporate executives, managers, managing proprietors and supervisors
35 2.3
Professionals 2 0.1 Technicians and associate professionals 6 0.4 Clerks 5 0.3 Service workers and shop and market sales
workers 41 2.7
Farmers, forestry workers and fishermen 853 56.5 Trades and related workers 100 6.6 Plant and machine operators and assemblers 58 3.8 Laborers and unskilled workers 404 26.7 Special occupations 7 0.5
Total 1,511 100.0 Source of basic data: matched files of the 2003 and 2006 FIES
19
Table 6. Distribution of FIES panel households, by poverty status and household composition and income, 2006 (unweighted) a. Across groups of households
Household composition and income
Poor Nonpoor Total
householdsChronic
poor Transient
poor Total poor Previously
poor Never poor Total
nonpoor (PP) (NP) (PN) (NN)
Philippines 1,608 819 2,427 612 4,860 5,472 7,899
Mean household size 6 5 6 5 4 5 5
Mean dependency ratio 0.5 0.4 0.4 0.3 0.2 0.3 0.3
Proportion of households 6.8 4.3 11.1 6.4 82.5 88.9 100.0 with OFW member/s (%)
Mean percentage of income 55.9 44.8 50.4 41.2 17.6 29.4 39.9 derived from agriculture (%)
Source of basic data: matched files of the 2003 and 2006 FIES b. Across categories/levels of variables
Household composition and income
Poor Nonpoor Total
householdsChronic
poor Transient
poor Total poor Previously
poor Never poor Total
nonpoor (PP) (NP) (PN) (NN)
Philippines 100.0 100.0 100.0 100.0 100.0 100.0 100.0
Mean household size 6 5 6 5 4 5 5
Mean dependency ratio 0.5 0.4 0.4 0.3 0.2 0.3 0.3
Proportion of households 7.6 9.4 8.2 18.6 30.5 29.1 22.7 with OFW member/s (%)
Mean percentage of income 55.9 44.8 50.4 41.2 17.6 29.4 39.9 derived from agriculture (%)
Source of basic data: matched files of the 2003 and 2006 FIES
20
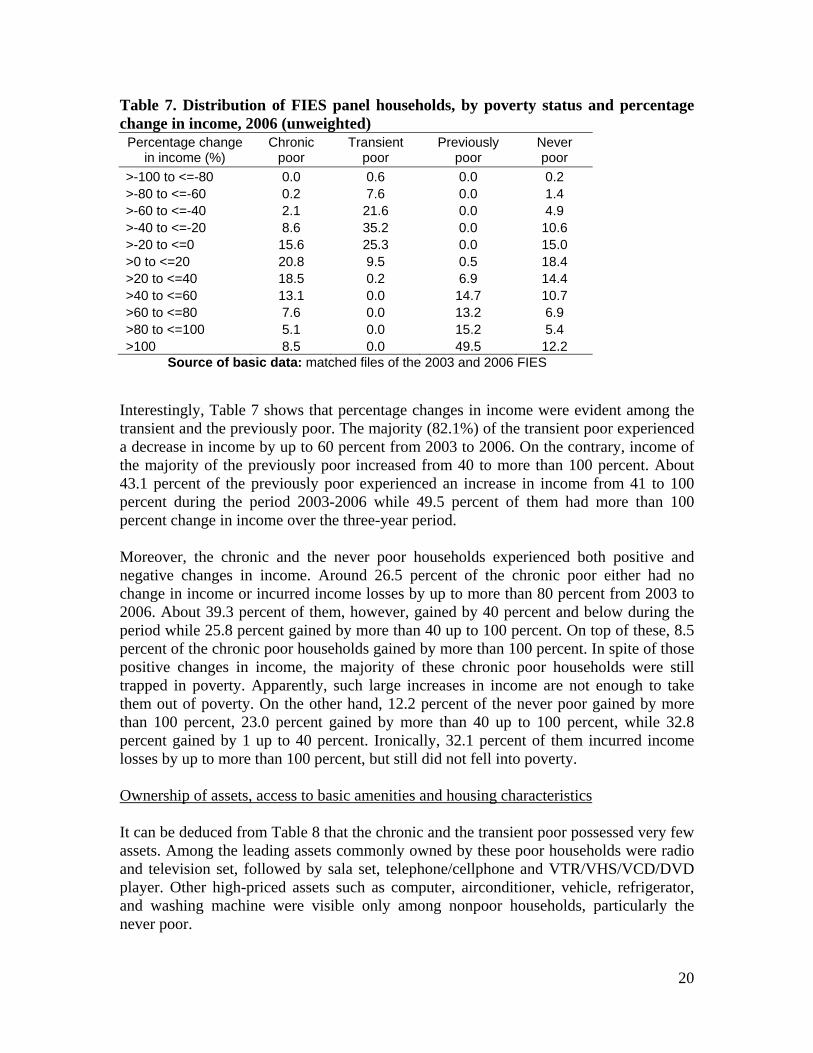
Table 7. Distribution of FIES panel households, by poverty status and percentage change in income, 2006 (unweighted)
Percentage change in income (%)
Chronic poor
Transient poor
Previously poor
Never poor
>-100 to <=-80 0.0 0.6 0.0 0.2 >-80 to <=-60 0.2 7.6 0.0 1.4 >-60 to <=-40 2.1 21.6 0.0 4.9 >-40 to <=-20 8.6 35.2 0.0 10.6 >-20 to <=0 15.6 25.3 0.0 15.0 >0 to <=20 20.8 9.5 0.5 18.4 >20 to <=40 18.5 0.2 6.9 14.4 >40 to <=60 13.1 0.0 14.7 10.7 >60 to <=80 7.6 0.0 13.2 6.9 >80 to <=100 5.1 0.0 15.2 5.4 >100 8.5 0.0 49.5 12.2
Source of basic data: matched files of the 2003 and 2006 FIES Interestingly, Table 7 shows that percentage changes in income were evident among the transient and the previously poor. The majority (82.1%) of the transient poor experienced a decrease in income by up to 60 percent from 2003 to 2006. On the contrary, income of the majority of the previously poor increased from 40 to more than 100 percent. About 43.1 percent of the previously poor experienced an increase in income from 41 to 100 percent during the period 2003-2006 while 49.5 percent of them had more than 100 percent change in income over the three-year period. Moreover, the chronic and the never poor households experienced both positive and negative changes in income. Around 26.5 percent of the chronic poor either had no change in income or incurred income losses by up to more than 80 percent from 2003 to 2006. About 39.3 percent of them, however, gained by 40 percent and below during the period while 25.8 percent gained by more than 40 up to 100 percent. On top of these, 8.5 percent of the chronic poor households gained by more than 100 percent. In spite of those positive changes in income, the majority of these chronic poor households were still trapped in poverty. Apparently, such large increases in income are not enough to take them out of poverty. On the other hand, 12.2 percent of the never poor gained by more than 100 percent, 23.0 percent gained by more than 40 up to 100 percent, while 32.8 percent gained by 1 up to 40 percent. Ironically, 32.1 percent of them incurred income losses by up to more than 100 percent, but still did not fell into poverty. Ownership of assets, access to basic amenities and housing characteristics
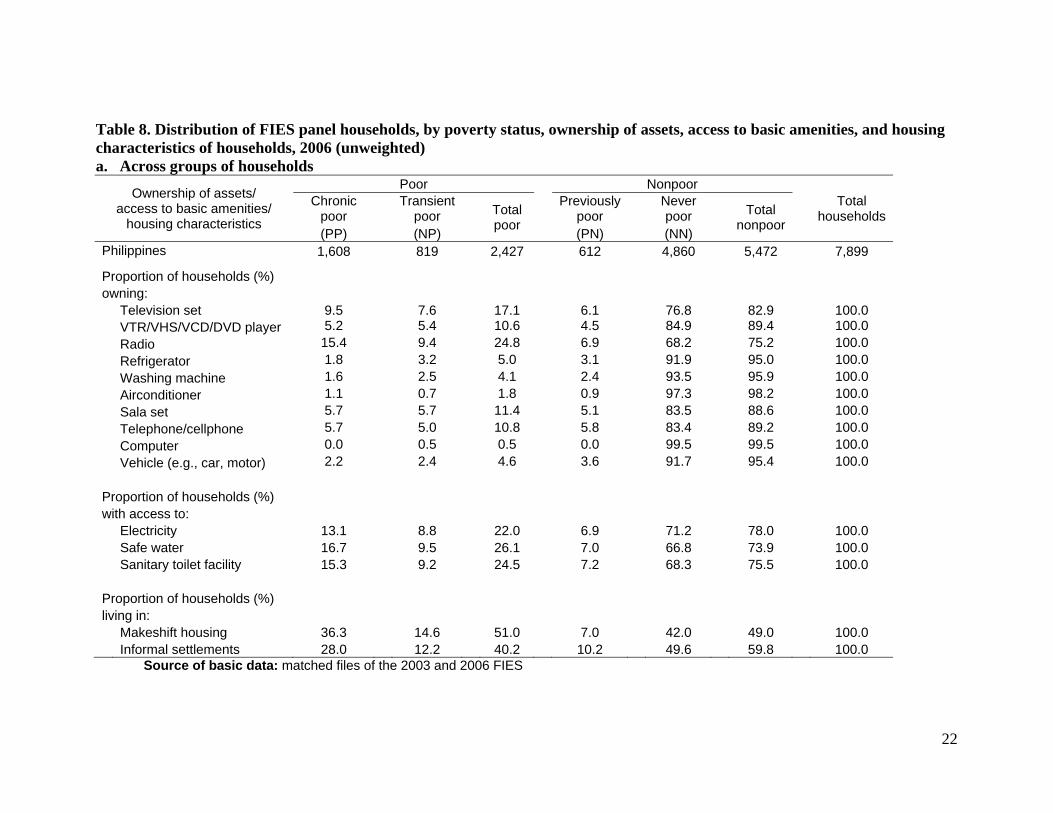
It can be deduced from Table 8 that the chronic and the transient poor possessed very few assets. Among the leading assets commonly owned by these poor households were radio and television set, followed by sala set, telephone/cellphone and VTR/VHS/VCD/DVD player. Other high-priced assets such as computer, airconditioner, vehicle, refrigerator, and washing machine were visible only among nonpoor households, particularly the never poor.
21
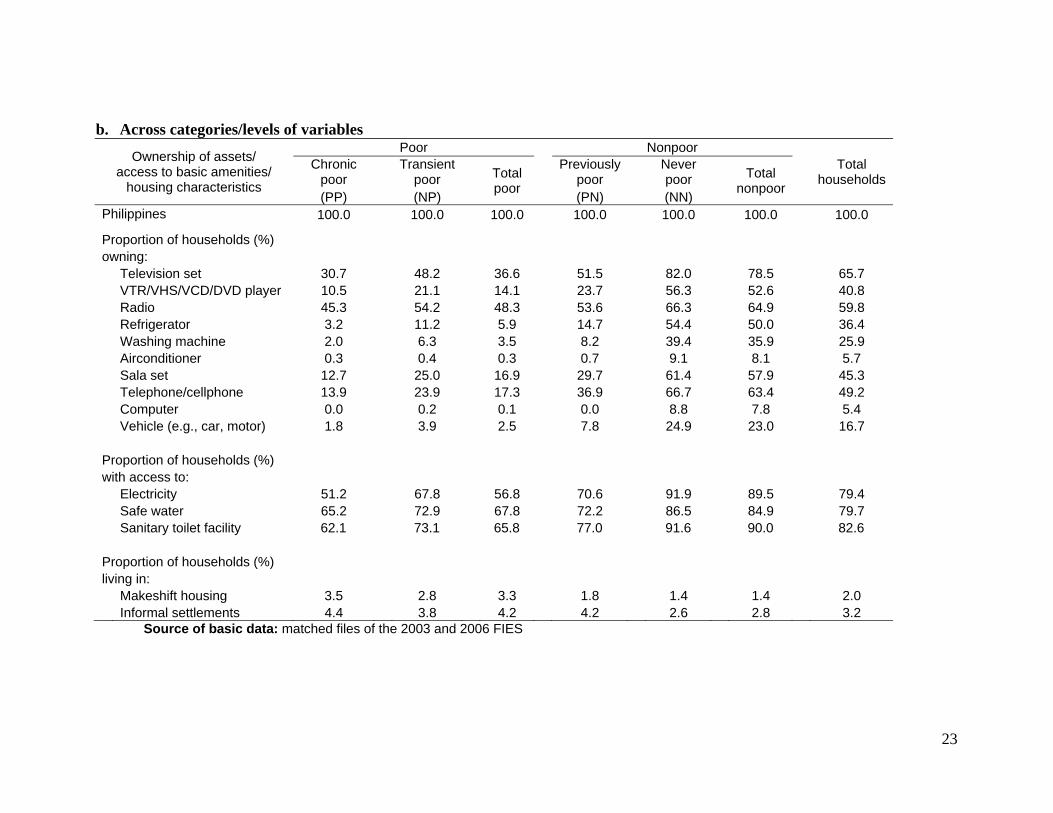
Similar to asset ownership, access to basic amenities were also seldom present among poor households, especially the chronic poor. Among households with access to electricity, safe water or sanitary toilet facility, around 13-16 percent were chronic poor, around 8.8-9.5 percent were transient poor, while around 67-71 percent were never poor. Table 8.b, however, shows that the proportion of households with access to the aforementioned basic amenities seems to increase with income. Around 51.2 percent of the chronic poor, 67.8 percent of the transient poor, 70.6 percent of the previously poor, and 91.9 percent of the never poor had access to electricity. In terms of safe water, 65.2 percent of the chronic poor, 72.9 percent of the transient poor, 72.2 percent of the previously poor, and 86.5 percent of the never poor had access. Meanwhile, around 62.1 percent of the chronic poor, 73.1 percent of the transient poor, 77.0 percent of the previously poor, and 91.6 percent of the never poor had access to sanitary toilet facility. In terms of types of housing materials and housing tenure, Table 8 shows that there was not much difference between the proportion of poor and that of nonpoor. Households living in makeshift housing and informal settlements comprised a small percentage of the total households in the panel. While this is true, Table 8.b revealed that the proportions are slightly higher among the chronic poor and the transient poor than among the previously poor and the never poor. Around 3 to 4 percent of the chronic and transient poor households were living in makeshift housing and as informal settlers. On the other hand, only around 1 to 2 percent of the never poor were living in those conditions.
22
Table 8. Distribution of FIES panel households, by poverty status, ownership of assets, access to basic amenities, and housing characteristics of households, 2006 (unweighted) a. Across groups of households
Ownership of assets/ access to basic amenities/
housing characteristics
Poor Nonpoor Total
householdsChronic
poor Transient
poor Total poor
Previously poor
Never poor Total
nonpoor(PP) (NP) (PN) (NN) Philippines 1,608 819 2,427 612 4,860 5,472 7,899
Proportion of households (%) owning:
Television set 9.5 7.6 17.1 6.1 76.8 82.9 100.0 VTR/VHS/VCD/DVD player 5.2 5.4 10.6 4.5 84.9 89.4 100.0 Radio 15.4 9.4 24.8 6.9 68.2 75.2 100.0 Refrigerator 1.8 3.2 5.0 3.1 91.9 95.0 100.0 Washing machine 1.6 2.5 4.1 2.4 93.5 95.9 100.0 Airconditioner 1.1 0.7 1.8 0.9 97.3 98.2 100.0 Sala set 5.7 5.7 11.4 5.1 83.5 88.6 100.0 Telephone/cellphone 5.7 5.0 10.8 5.8 83.4 89.2 100.0 Computer 0.0 0.5 0.5 0.0 99.5 99.5 100.0 Vehicle (e.g., car, motor) 2.2 2.4 4.6 3.6 91.7 95.4 100.0
Proportion of households (%) with access to:
Electricity 13.1 8.8 22.0 6.9 71.2 78.0 100.0 Safe water 16.7 9.5 26.1 7.0 66.8 73.9 100.0 Sanitary toilet facility 15.3 9.2 24.5 7.2 68.3 75.5 100.0
Proportion of households (%) living in:
Makeshift housing 36.3 14.6 51.0 7.0 42.0 49.0 100.0 Informal settlements 28.0 12.2 40.2 10.2 49.6 59.8 100.0
Source of basic data: matched files of the 2003 and 2006 FIES
23
b. Across categories/levels of variables
Ownership of assets/ access to basic amenities/
housing characteristics
Poor Nonpoor Total
householdsChronic
poor Transient
poor Total poor
Previously poor
Never poor Total
nonpoor(PP) (NP) (PN) (NN) Philippines 100.0 100.0 100.0 100.0 100.0 100.0 100.0
Proportion of households (%) owning:
Television set 30.7 48.2 36.6 51.5 82.0 78.5 65.7 VTR/VHS/VCD/DVD player 10.5 21.1 14.1 23.7 56.3 52.6 40.8 Radio 45.3 54.2 48.3 53.6 66.3 64.9 59.8 Refrigerator 3.2 11.2 5.9 14.7 54.4 50.0 36.4 Washing machine 2.0 6.3 3.5 8.2 39.4 35.9 25.9 Airconditioner 0.3 0.4 0.3 0.7 9.1 8.1 5.7 Sala set 12.7 25.0 16.9 29.7 61.4 57.9 45.3 Telephone/cellphone 13.9 23.9 17.3 36.9 66.7 63.4 49.2 Computer 0.0 0.2 0.1 0.0 8.8 7.8 5.4 Vehicle (e.g., car, motor) 1.8 3.9 2.5 7.8 24.9 23.0 16.7
Proportion of households (%) with access to:
Electricity 51.2 67.8 56.8 70.6 91.9 89.5 79.4 Safe water 65.2 72.9 67.8 72.2 86.5 84.9 79.7 Sanitary toilet facility 62.1 73.1 65.8 77.0 91.6 90.0 82.6
Proportion of households (%) living in:
Makeshift housing 3.5 2.8 3.3 1.8 1.4 1.4 2.0 Informal settlements 4.4 3.8 4.2 4.2 2.6 2.8 3.2
Source of basic data: matched files of the 2003 and 2006 FIES
24
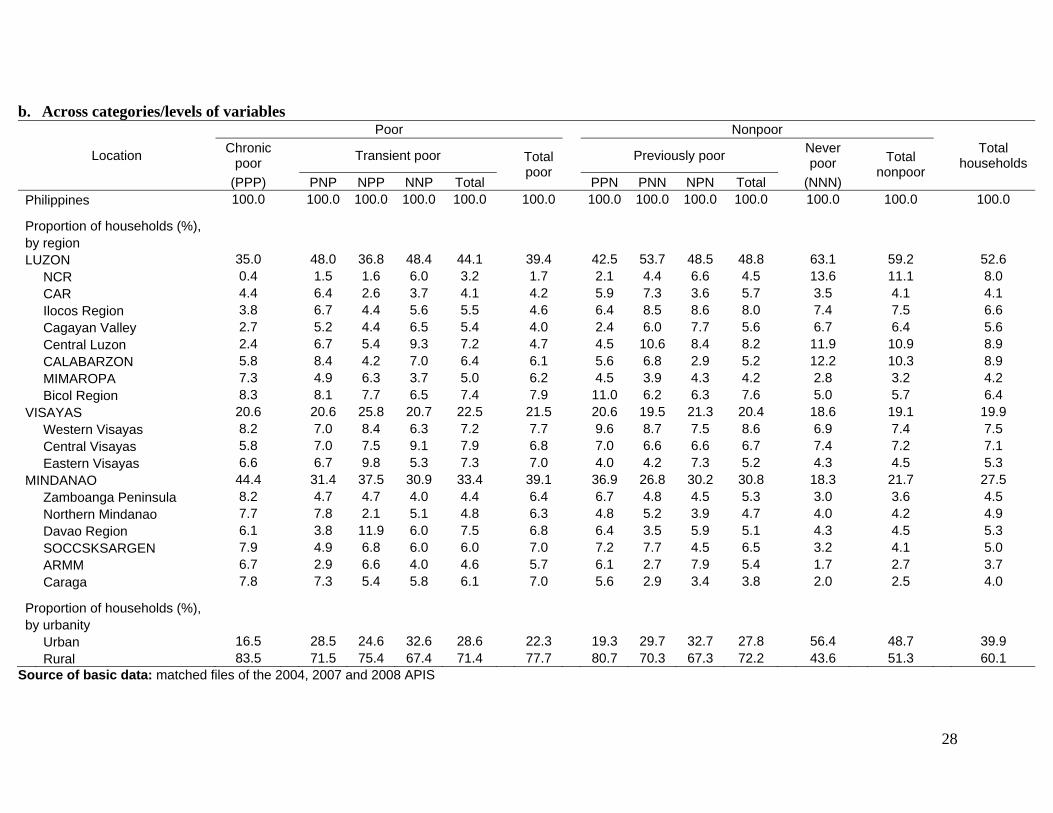
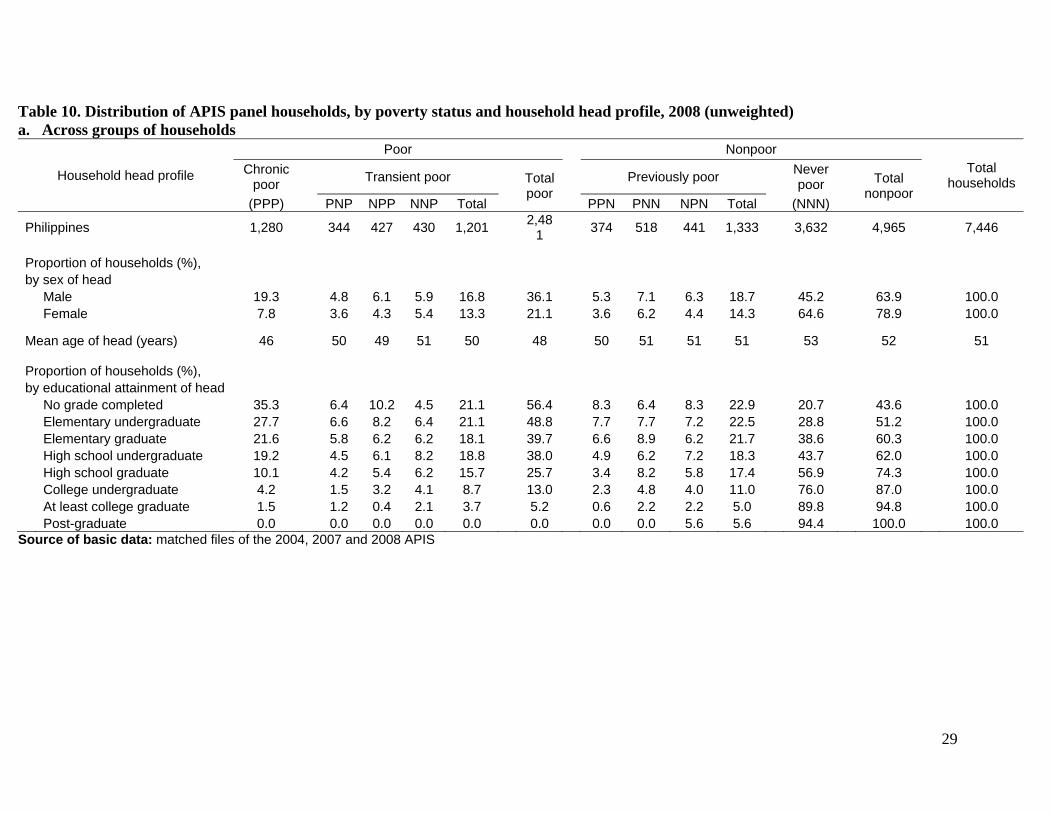
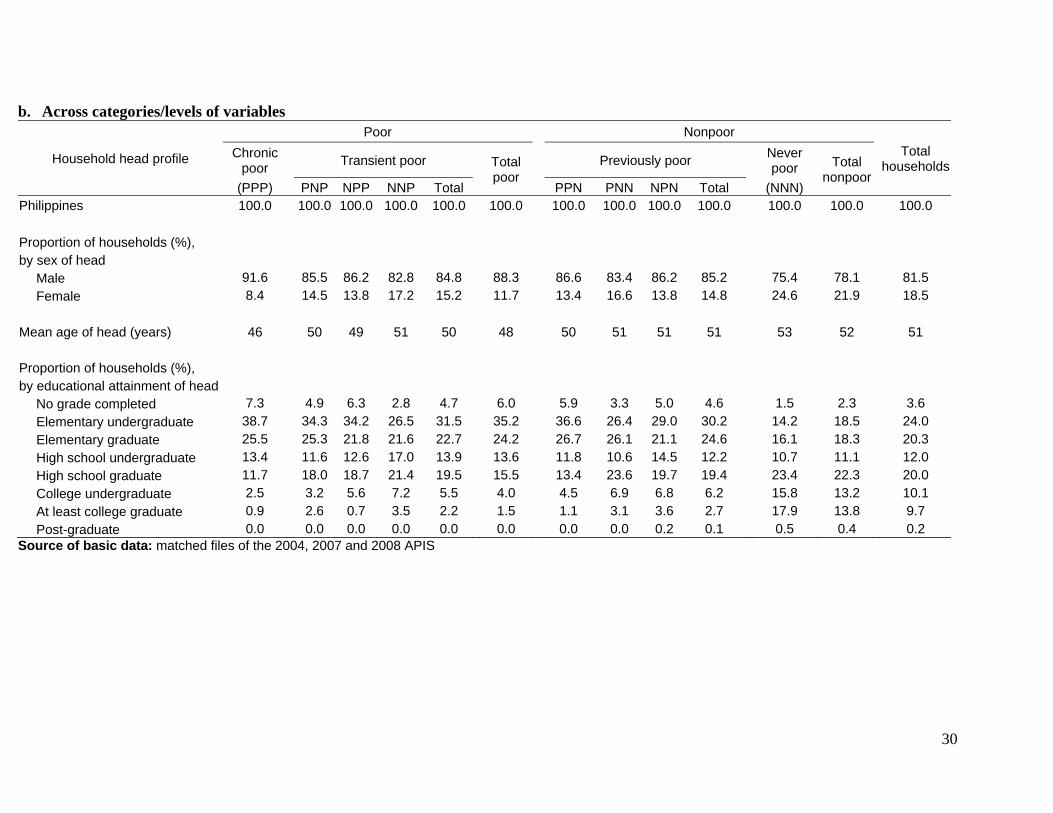
APIS panel Location Similar to findings for the FIES panel, the proportions of the chronic and the transient poor to total panel households were highest in Mindanao regions such as Caraga, ARMM and Zamboanga Peninsula (Table 9.a). The proportion of the never poor, however, was highest in Luzon, particularly the NCR, followed by CALABARZON and Central Luzon. However, Table 9.b shows that although Mindanao had the highest proportion of chronic poor households (44.4%), Luzon registered the highest proportion of the transient poor (44.1%), followed by Mindanao with only 33.4 percent. Meanwhile, the chronic poor were mostly found in rural areas while the never poor were usually located in urban areas. Household head profile It is interesting to note that female-headed households in APIS panel data set were also greater in number among the never poor than the chronic and the transient poor, just like those in FIES panel. Table 10.b shows that among the chronic and the transient poor, the proportion of female-headed households were 8.4 and 15.2 percent, respectively. On the other hand, 24.6 percent of the never poor households had female heads. Heads of the chronic and the transient poor were also younger than those of the never poor. The average ages of heads of the chronic and the transient poor households were 46 and 50, respectively, while the average age of the never poor was 53. Among the households with heads who do not have any formal education, the chronic poor and the transient poor comprised 35.3 and 21.1 percent, respectively, while the never poor comprised 20.7 percent (Table 10.a). The proportion of the chronic poor to total panel households decreases as the level of education of heads increases. The reverse is true for the proportion of the never poor. Meanwhile, among the panel households whose heads were at least high school graduate, more than half of them were consistently nonpoor from 2004 to 2008. The positive correlation between household income and educational attainment of household heads are clearly shown in Table 10.b. Among the chronic poor and the transient poor, 7.3 and 4.7 percent, respectively, had heads with no grade completed. Such proportion was relatively lower among the previously poor and the never poor; with 4.6 and 1.5 percent, respectively. Similarly, the proportion of households with heads who only reached elementary level was higher among the chronic and the transient poor, at 38.7 and 31.5 percent, respectively. Only 14.2 percent of the never poor had heads with elementary level as the highest educational attainment. The observed relationship between household income and educational attainment of household heads was reversed at higher levels of education. Around 11.7 and 19.5 percent of the chronic and the transient poor had heads with high school diploma. Among
25
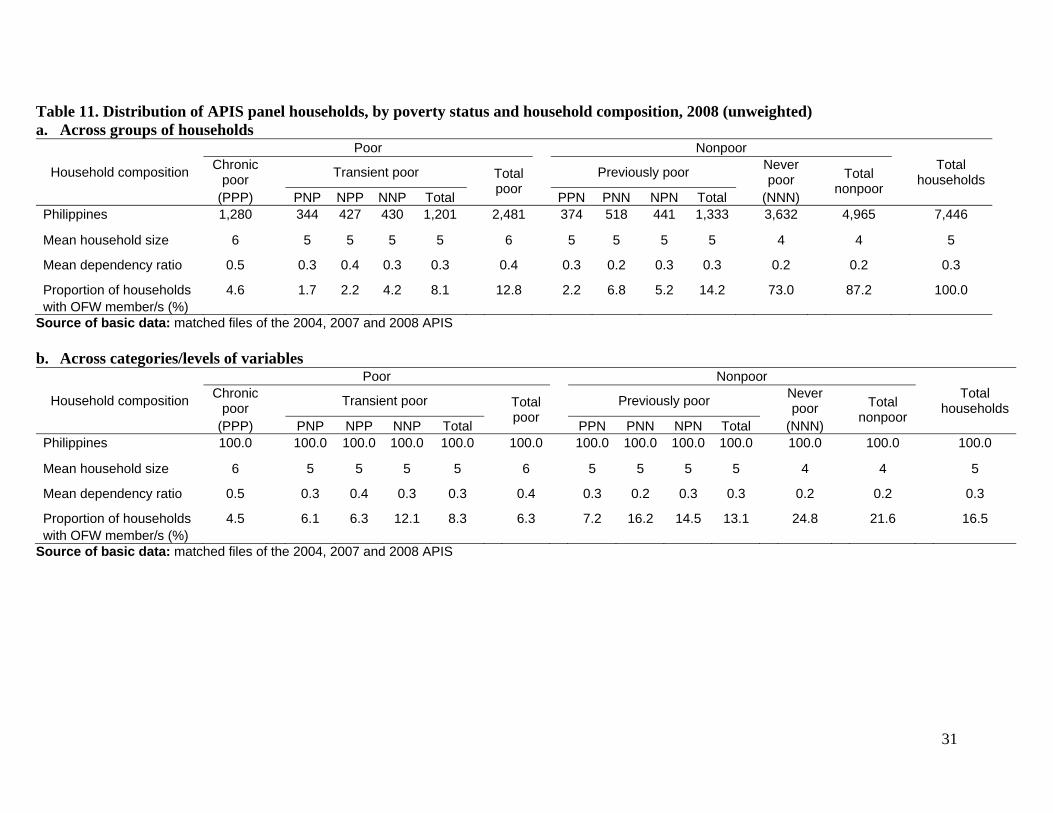
the never poor, however, 23.4 percent had heads who were high school graduates. The differences among the groups of households were more evident at higher levels. Only 0.9 and 2.2 percent of the chronic poor and transient poor had heads who were at least college graduates. On the contrary, around 17.9 percent of the never poor had heads who had college/university degrees. Furthermore, both the chronic poor and the transient poor had no heads who reached post-graduate level. However, 0.5 percent of the never poor had post-graduate units/degrees. Household composition The average household size and number of dependents in a household were higher among the chronic and the transient poor relative to those of the never poor (Table 11). On the average, the chronic and the transient poor were composed of 6 and 5 members, respectively, while the never poor had 4 members. In terms of dependency ratio, the chronic and the transient poor had an average of 5 dependents for every 10 household members, while the never poor only had an average of 2 for every 10 members. Among the panel households with at least one OFW member, 73.0 percent were never poor, 14.2 percent were previously poor, 8.1 percent were transient poor, while only 4.6 percent were chronic poor (Table 11.a). Ownership of assets, access to basic amenities/social services and housing characteristics In general, the proportion of households owning assets was relatively lower among the chronic and the transient poor than the never poor (Table 12). Like in FIES panel, the most common assets owned by the chronic and the transient poor include radio, television, telephone/cellphone, and VTR/VHS/VCD/DVD player. On the other hand, airconditioner and computer were the leading assets which were rarely owned by poor households. It is unfortunate that the proportion of chronic poor households with access to basic amenities such as electricity, safe water and sanitary toilet facility ranged only from 55.4 to 72.5 percent (Table 12.b). Such proportions are slightly higher among the transient poor; ranging from 75.4 to 83.0. These are even higher among the previously poor, which ranged from 76.1 to 86.0, but substantially higher among the never poor, at around 87.7 to 96.8. The proportion of the chronic poor who had access to Philhealth is much lower, at 26.0 percent. Access to Philhealth is even lower among the transient poor, at 24.9 percent. On the contrary, around 33.8 percent of the previously poor had access to this particular social service. Surprisingly, more than half (52.9%) of the never poor had access to Philhealth. In support of this observation, Table 12.a clearly shows that among those with access to Philhealth, 64.0 percent were never poor households, 15.0 percent were previously poor, but only 10.0 and 11.1 percent were transient and chronic poor, respectively.
26
Among those living in makeshift housing, 27.7 and 32.1 percent were chronic and transient poor households, respectively (Table 12.a). These proportions are slightly lower among the previously poor and the never poor, with 18.8 and 21.4 percent, respectively. Table 12.b, however, shows that among the chronic poor, only 3.8 percent were living as informal settlers. Similarly, only 3.8 percent of the never poor were living in informal settlements.
27
Table 9. Distribution of APIS panel households, by poverty status and location, 2008 (unweighted) a. Across groups of households
Location
Poor Nonpoor Total
households Chronic
poor Transient poor Total poor Previously poor Never
poor Total nonpoor
(PPP) PNP NPP NNP Total PPN PNN NPN Total (NNN) Philippines 1,280 344 427 430 1,201 2,481 374 518 441 1,333 3,632 4,965 7,446
Proportion of households (%), by region LUZON 11.4 4.2 4.0 5.3 13.5 25.0 4.1 7.1 5.5 16.6 58.4 75.0 100.0
NCR 0.8 0.8 1.2 4.4 6.4 7.2 1.3 3.9 4.9 10.1 82.7 92.8 100.0 CAR 18.2 7.2 3.6 5.2 16.0 34.2 7.2 12.4 5.2 24.8 41.0 65.8 100.0 Ilocos Region 10.0 4.7 3.9 4.9 13.5 23.5 4.9 9.0 7.8 21.7 54.8 76.5 100.0 Cagayan Valley 8.2 4.3 4.6 6.7 15.6 23.7 2.2 7.4 8.2 17.7 58.5 76.3 100.0 Central Luzon 4.7 3.5 3.5 6.1 13.0 17.7 2.6 8.3 5.6 16.5 65.8 82.3 100.0 CALABARZON 11.1 4.4 2.7 4.5 11.6 22.7 3.2 5.3 2.0 10.4 66.9 77.3 100.0 MIMAROPA 30.0 5.5 8.7 5.2 19.4 49.4 5.5 6.5 6.1 18.1 32.6 50.6 100.0 Bicol Region 22.3 5.9 6.9 5.9 18.7 41.0 8.6 6.7 5.9 21.2 37.8 59.0 100.0
VISAYAS 17.8 4.8 7.4 6.0 18.2 36.0 5.2 6.8 6.3 18.3 45.7 64.0 100.0 Western Visayas 18.8 4.3 6.5 4.8 15.6 34.4 6.5 8.1 5.9 20.4 45.2 65.6 100.0 Central Visayas 14.0 4.5 6.1 7.4 18.0 32.0 4.9 6.4 5.5 16.9 51.1 68.0 100.0 Eastern Visayas 21.4 5.8 10.6 5.8 22.2 43.6 3.8 5.5 8.1 17.4 39.0 56.4 100.0
MINDANAO 27.8 5.3 7.8 6.5 19.6 47.4 6.8 6.8 6.5 20.1 32.5 52.6 100.0 Zamboanga Peninsula 31.1 4.7 5.9 5.0 15.7 46.7 7.4 7.4 5.9 20.7 32.5 53.3 100.0 Northern Mindanao 26.8 7.4 2.5 6.0 15.9 42.7 4.9 7.4 4.7 17.0 40.3 57.3 100.0 Davao Region 19.9 3.3 13.0 6.6 23.0 42.9 6.1 4.6 6.6 17.3 39.8 57.1 100.0 SOCCSKSARGEN 26.9 4.5 7.7 6.9 19.1 46.0 7.2 10.6 5.3 23.1 30.9 54.0 100.0 ARMM 31.2 3.6 10.1 6.2 19.9 51.1 8.3 5.1 12.7 26.1 22.8 48.9 100.0 Caraga 33.7 8.4 7.7 8.4 24.6 58.2 7.1 5.1 5.1 17.2 24.6 41.8 100.0
Proportion of households (%), by urbanity
Urban 7.1 3.3 3.5 4.7 11.5 18.6 2.4 5.2 4.8 12.5 68.9 81.4 100.0 Rural 23.9 5.5 7.2 6.5 19.2 43.1 6.7 8.1 6.6 21.5 35.4 56.9 100.0
Source of basic data: matched files of the 2004, 2007 and 2008 APIS
28
b. Across categories/levels of variables
Location
Poor Nonpoor Total
households Chronic
poor Transient poor Total poor Previously poor Never
poor Total nonpoor
(PPP) PNP NPP NNP Total PPN PNN NPN Total (NNN) Philippines 100.0 100.0 100.0 100.0 100.0 100.0 100.0 100.0 100.0 100.0 100.0 100.0 100.0
Proportion of households (%), by region LUZON 35.0 48.0 36.8 48.4 44.1 39.4 42.5 53.7 48.5 48.8 63.1 59.2 52.6
NCR 0.4 1.5 1.6 6.0 3.2 1.7 2.1 4.4 6.6 4.5 13.6 11.1 8.0 CAR 4.4 6.4 2.6 3.7 4.1 4.2 5.9 7.3 3.6 5.7 3.5 4.1 4.1 Ilocos Region 3.8 6.7 4.4 5.6 5.5 4.6 6.4 8.5 8.6 8.0 7.4 7.5 6.6 Cagayan Valley 2.7 5.2 4.4 6.5 5.4 4.0 2.4 6.0 7.7 5.6 6.7 6.4 5.6 Central Luzon 2.4 6.7 5.4 9.3 7.2 4.7 4.5 10.6 8.4 8.2 11.9 10.9 8.9 CALABARZON 5.8 8.4 4.2 7.0 6.4 6.1 5.6 6.8 2.9 5.2 12.2 10.3 8.9 MIMAROPA 7.3 4.9 6.3 3.7 5.0 6.2 4.5 3.9 4.3 4.2 2.8 3.2 4.2 Bicol Region 8.3 8.1 7.7 6.5 7.4 7.9 11.0 6.2 6.3 7.6 5.0 5.7 6.4
VISAYAS 20.6 20.6 25.8 20.7 22.5 21.5 20.6 19.5 21.3 20.4 18.6 19.1 19.9 Western Visayas 8.2 7.0 8.4 6.3 7.2 7.7 9.6 8.7 7.5 8.6 6.9 7.4 7.5 Central Visayas 5.8 7.0 7.5 9.1 7.9 6.8 7.0 6.6 6.6 6.7 7.4 7.2 7.1 Eastern Visayas 6.6 6.7 9.8 5.3 7.3 7.0 4.0 4.2 7.3 5.2 4.3 4.5 5.3
MINDANAO 44.4 31.4 37.5 30.9 33.4 39.1 36.9 26.8 30.2 30.8 18.3 21.7 27.5 Zamboanga Peninsula 8.2 4.7 4.7 4.0 4.4 6.4 6.7 4.8 4.5 5.3 3.0 3.6 4.5 Northern Mindanao 7.7 7.8 2.1 5.1 4.8 6.3 4.8 5.2 3.9 4.7 4.0 4.2 4.9 Davao Region 6.1 3.8 11.9 6.0 7.5 6.8 6.4 3.5 5.9 5.1 4.3 4.5 5.3 SOCCSKSARGEN 7.9 4.9 6.8 6.0 6.0 7.0 7.2 7.7 4.5 6.5 3.2 4.1 5.0 ARMM 6.7 2.9 6.6 4.0 4.6 5.7 6.1 2.7 7.9 5.4 1.7 2.7 3.7 Caraga 7.8 7.3 5.4 5.8 6.1 7.0 5.6 2.9 3.4 3.8 2.0 2.5 4.0
Proportion of households (%), by urbanity
Urban 16.5 28.5 24.6 32.6 28.6 22.3 19.3 29.7 32.7 27.8 56.4 48.7 39.9 Rural 83.5 71.5 75.4 67.4 71.4 77.7 80.7 70.3 67.3 72.2 43.6 51.3 60.1
Source of basic data: matched files of the 2004, 2007 and 2008 APIS
29
Table 10. Distribution of APIS panel households, by poverty status and household head profile, 2008 (unweighted) a. Across groups of households
Household head profile
Poor Nonpoor Total
households Chronic
poor Transient poor Total poor Previously poor Never
poor Total nonpoor
(PPP) PNP NPP NNP Total PPN PNN NPN Total (NNN)
Philippines 1,280 344 427 430 1,201 2,481 374 518 441 1,333 3,632 4,965 7,446
Proportion of households (%), by sex of head
Male 19.3 4.8 6.1 5.9 16.8 36.1 5.3 7.1 6.3 18.7 45.2 63.9 100.0 Female 7.8 3.6 4.3 5.4 13.3 21.1 3.6 6.2 4.4 14.3 64.6 78.9 100.0
Mean age of head (years) 46 50 49 51 50 48 50 51 51 51 53 52 51
Proportion of households (%), by educational attainment of head
No grade completed 35.3 6.4 10.2 4.5 21.1 56.4 8.3 6.4 8.3 22.9 20.7 43.6 100.0 Elementary undergraduate 27.7 6.6 8.2 6.4 21.1 48.8 7.7 7.7 7.2 22.5 28.8 51.2 100.0 Elementary graduate 21.6 5.8 6.2 6.2 18.1 39.7 6.6 8.9 6.2 21.7 38.6 60.3 100.0 High school undergraduate 19.2 4.5 6.1 8.2 18.8 38.0 4.9 6.2 7.2 18.3 43.7 62.0 100.0 High school graduate 10.1 4.2 5.4 6.2 15.7 25.7 3.4 8.2 5.8 17.4 56.9 74.3 100.0 College undergraduate 4.2 1.5 3.2 4.1 8.7 13.0 2.3 4.8 4.0 11.0 76.0 87.0 100.0 At least college graduate 1.5 1.2 0.4 2.1 3.7 5.2 0.6 2.2 2.2 5.0 89.8 94.8 100.0
Post-graduate 0.0 0.0 0.0 0.0 0.0 0.0 0.0 0.0 5.6 5.6 94.4 100.0 100.0 Source of basic data: matched files of the 2004, 2007 and 2008 APIS
30
b. Across categories/levels of variables
Household head profile
Poor Nonpoor Total
householdsChronic
poor Transient poor Total poor
Previously poor Never poor Total
nonpoor(PPP) PNP NPP NNP Total PPN PNN NPN Total (NNN)
Philippines 100.0 100.0 100.0 100.0 100.0 100.0 100.0 100.0 100.0 100.0 100.0 100.0 100.0
Proportion of households (%), by sex of head
Male 91.6 85.5 86.2 82.8 84.8 88.3 86.6 83.4 86.2 85.2 75.4 78.1 81.5 Female 8.4 14.5 13.8 17.2 15.2 11.7 13.4 16.6 13.8 14.8 24.6 21.9 18.5
Mean age of head (years) 46 50 49 51 50 48 50 51 51 51 53 52 51
Proportion of households (%), by educational attainment of head
No grade completed 7.3 4.9 6.3 2.8 4.7 6.0 5.9 3.3 5.0 4.6 1.5 2.3 3.6 Elementary undergraduate 38.7 34.3 34.2 26.5 31.5 35.2 36.6 26.4 29.0 30.2 14.2 18.5 24.0 Elementary graduate 25.5 25.3 21.8 21.6 22.7 24.2 26.7 26.1 21.1 24.6 16.1 18.3 20.3 High school undergraduate 13.4 11.6 12.6 17.0 13.9 13.6 11.8 10.6 14.5 12.2 10.7 11.1 12.0 High school graduate 11.7 18.0 18.7 21.4 19.5 15.5 13.4 23.6 19.7 19.4 23.4 22.3 20.0 College undergraduate 2.5 3.2 5.6 7.2 5.5 4.0 4.5 6.9 6.8 6.2 15.8 13.2 10.1 At least college graduate 0.9 2.6 0.7 3.5 2.2 1.5 1.1 3.1 3.6 2.7 17.9 13.8 9.7
Post-graduate 0.0 0.0 0.0 0.0 0.0 0.0 0.0 0.0 0.2 0.1 0.5 0.4 0.2 Source of basic data: matched files of the 2004, 2007 and 2008 APIS
31
Table 11. Distribution of APIS panel households, by poverty status and household composition, 2008 (unweighted) a. Across groups of households
Household composition
Poor Nonpoor Total
households Chronic
poor Transient poor Total poor Previously poor Never
poor Total nonpoor (PPP) PNP NPP NNP Total PPN PNN NPN Total (NNN)
Philippines 1,280 344 427 430 1,201 2,481 374 518 441 1,333 3,632 4,965 7,446
Mean household size 6 5 5 5 5 6 5 5 5 5 4 4 5
Mean dependency ratio 0.5 0.3 0.4 0.3 0.3 0.4 0.3 0.2 0.3 0.3 0.2 0.2 0.3
Proportion of households 4.6 1.7 2.2 4.2 8.1 12.8 2.2 6.8 5.2 14.2 73.0 87.2 100.0 with OFW member/s (%)
Source of basic data: matched files of the 2004, 2007 and 2008 APIS
b. Across categories/levels of variables
Household composition
Poor Nonpoor Total
households Chronic
poor Transient poor Total poor Previously poor Never
poor Total nonpoor (PPP) PNP NPP NNP Total PPN PNN NPN Total (NNN)
Philippines 100.0 100.0 100.0 100.0 100.0 100.0 100.0 100.0 100.0 100.0 100.0 100.0 100.0
Mean household size 6 5 5 5 5 6 5 5 5 5 4 4 5
Mean dependency ratio 0.5 0.3 0.4 0.3 0.3 0.4 0.3 0.2 0.3 0.3 0.2 0.2 0.3
Proportion of households 4.5 6.1 6.3 12.1 8.3 6.3 7.2 16.2 14.5 13.1 24.8 21.6 16.5 with OFW member/s (%)
Source of basic data: matched files of the 2004, 2007 and 2008 APIS

32
Table 12. Distribution of APIS panel households, by poverty status, ownership of assets, access to basic amenities/social services, and housing characteristics of households, 2008 (unweighted) a. Across groups of households
Ownership of assets/ access to basic amenities,
social services/ housing characteristics
Poor Nonpoor Total
households Chronic
poor Transient poor Total poor Previously poor Never
poor Total nonpoor (PPP) PNP NPP NNP Total PPN PNN NPN Total (NNN)
No. of households 1,280 344 427 430 1,201 2,481 374 518 441 1,333 3,632 4,965 7,446
Proportion of households (%) owning:
Television set 8.2 3.3 4.0 5.3 12.6 20.8 4.0 7.1 5.7 16.8 62.4 79.2 100.0 VTR/VHS/VCD/DVD player 5.6 2.6 2.7 4.7 10.1 15.7 3.3 6.6 5.2 15.0 69.3 84.3 100.0 Radio 16.4 4.2 5.9 5.1 15.2 31.6 5.7 8.3 6.1 20.0 48.3 68.4 100.0 Refrigerator 2.0 1.5 1.6 3.5 6.6 8.6 1.7 5.1 4.2 11.0 80.4 91.4 100.0 Washing machine 1.7 0.8 1.5 3.1 5.4 7.0 1.3 5.1 3.6 10.0 83.0 93.0 100.0 Airconditioner 0.0 0.5 0.0 1.2 1.6 1.6 0.2 0.7 0.9 1.8 96.5 98.4 100.0 Telephone/cellphone 8.0 3.1 3.6 4.9 11.7 19.7 3.8 7.3 5.4 16.5 63.8 80.3 100.0 Computer 0.2 0.3 0.3 0.5 1.2 1.3 0.2 1.9 1.2 3.2 95.4 98.7 100.0 Vehicle (e.g., car, motor) 4.5 2.3 1.9 3.2 7.4 11.8 2.6 6.4 4.6 13.6 74.5 88.2 100.0
Proportion of households (%) with access to:
Electricity 11.5 4.3 4.8 5.7 14.8 26.3 4.2 7.1 5.9 17.1 56.6 73.7 100.0 Safe water 15.3 4.4 4.9 5.7 15.0 30.3 4.6 6.5 5.7 16.8 52.9 69.7 100.0 Sanitary toilet facility 14.1 4.3 5.0 5.8 15.1 29.2 4.6 7.0 5.8 17.4 53.4 70.8 100.0 Philhealth 11.1 3.2 3.0 3.8 10.0 21.0 4.0 6.5 4.5 15.0 64.0 79.0 100.0
Proportion of households (%) living in:
Makeshift housing 27.7 8.9 10.7 12.5 32.1 59.8 8.9 3.6 6.3 18.8 21.4 40.2 100.0 Informal settlements 17.3 5.4 7.6 6.5 19.4 36.7 3.6 5.0 5.0 13.7 49.6 63.3 100.0
Source of basic data: matched files of the 2004, 2007 and 2008 APIS
33
b. Across categories/levels of variables Ownership of assets/
access to basic amenities, social services/
housing characteristics
Poor Nonpoor Total
households Chronic
poor Transient poor Total poor Previously poor Never
poor Total nonpoor (PPP) PNP NPP NNP Total PPN PNN NPN Total (NNN)
No. of households 100.0 100.0 100.0 100.0 100.0 100.0 100.0 100.0 100.0 100.0 100.0 100.0 100.0
Proportion of households (%) owning:
Television set 32.6 48.5 47.1 62.6 53.0 42.5 53.7 68.9 65.8 63.6 86.9 80.7 68.0 VTR/VHS/VCD/DVD player 15.2 26.5 22.2 38.4 29.2 22.0 30.5 44.2 40.8 39.2 66.5 59.2 46.8
Radio 38.8 37.2 41.9 35.6 38.3 38.5 45.7 48.3 42.0 45.5 40.3 41.7 40.6 Refrigerator 4.2 12.2 10.5 22.6 15.3 9.6 12.6 27.2 26.3 22.8 61.3 51.0 37.2 Washing machine 2.7 4.9 7.3 14.7 9.2 5.8 7.0 20.5 16.8 15.5 47.0 38.5 27.7 Airconditioner 0.0 0.6 0.0 1.2 0.6 0.3 0.3 0.6 0.9 0.6 11.5 8.6 5.8 Telephone/cellphone 28.8 41.9 38.9 52.6 44.6 36.5 46.5 65.1 55.8 56.8 80.7 74.3 61.7 Computer 0.1 0.6 0.5 0.7 0.6 0.3 0.3 2.1 1.6 1.4 15.6 11.8 8.0 Vehicle (e.g., car, motor) 6.0 11.3 7.7 12.8 10.6 8.2 12.0 21.4 17.9 17.6 35.4 30.6 23.2
Proportion of households (%) with access to:
Electricity 55.4 76.7 68.6 81.6 75.6 65.2 69.5 83.8 81.9 79.1 95.8 91.3 82.6 Safe water 72.0 77.3 68.9 80.2 75.4 73.6 74.1 75.5 78.5 76.1 87.7 84.6 80.9 Sanitary toilet facility 72.5 82.8 77.3 88.8 83.0 77.6 80.5 89.6 86.6 86.0 96.8 93.9 88.5 Philhealth 26.0 27.6 20.8 26.7 24.9 25.5 32.1 37.8 30.4 33.8 52.9 47.8 40.3
Proportion of households (%) living in:
Makeshift housing 2.4 2.9 2.8 3.3 3.0 2.7 2.7 0.8 1.6 1.6 0.7 0.9 1.5 Informal settlements 3.8 4.4 4.9 4.2 4.5 4.1 2.7 2.7 3.2 2.9 3.8 3.5 3.7
Source of basic data: matched files of the 2004, 2007 and 2008 APIS
34
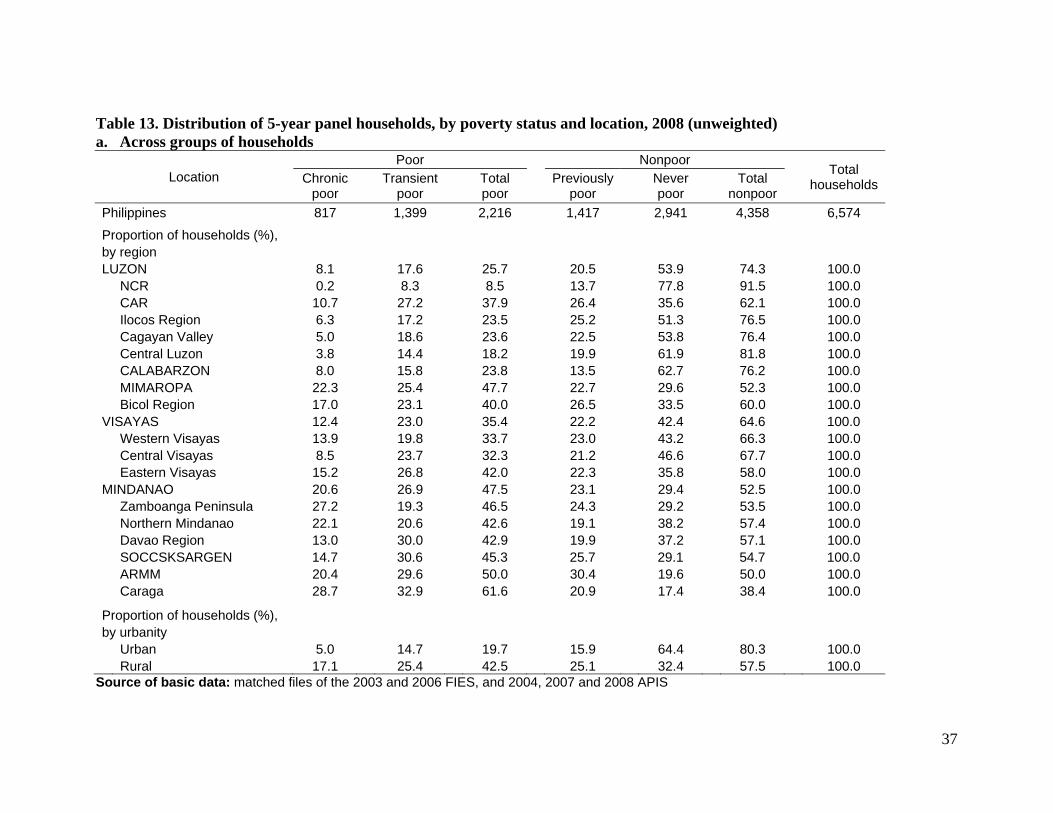
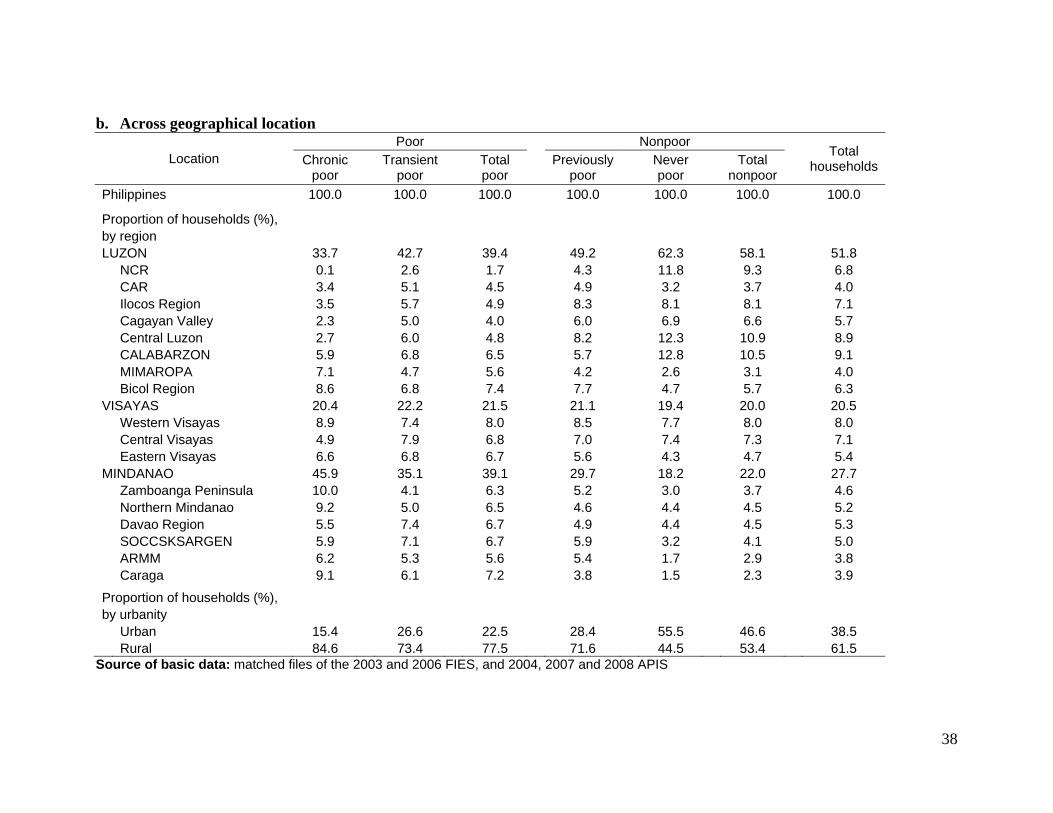
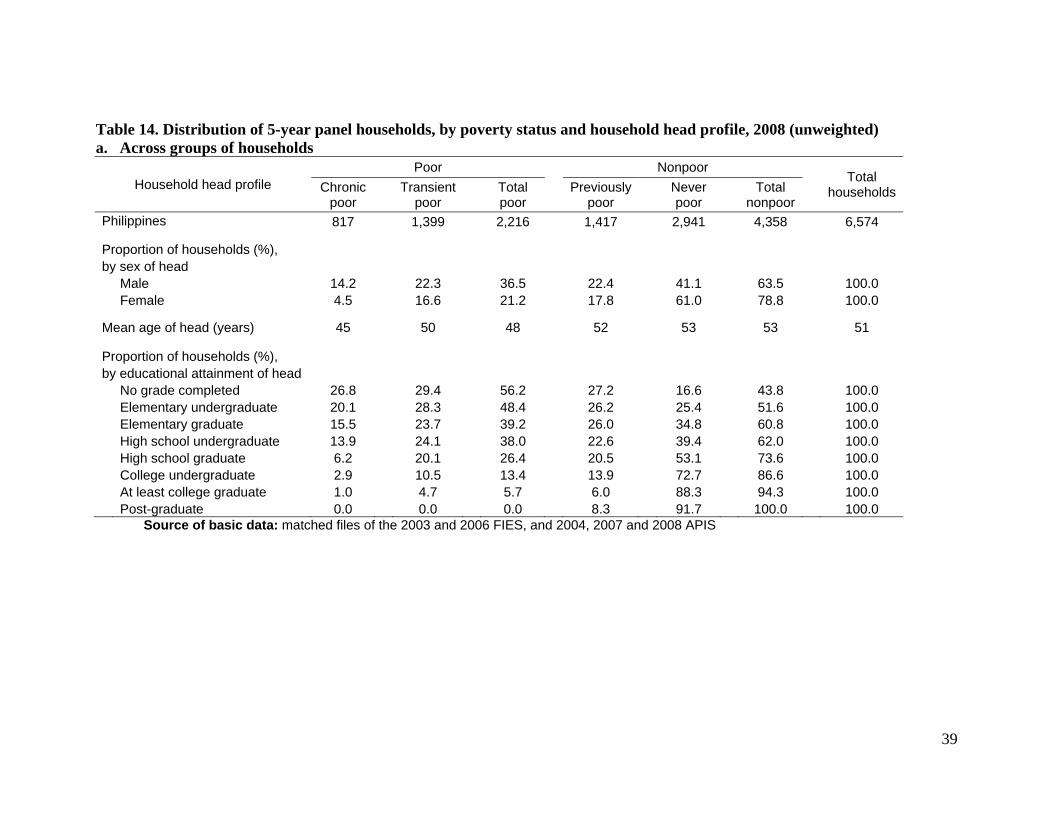
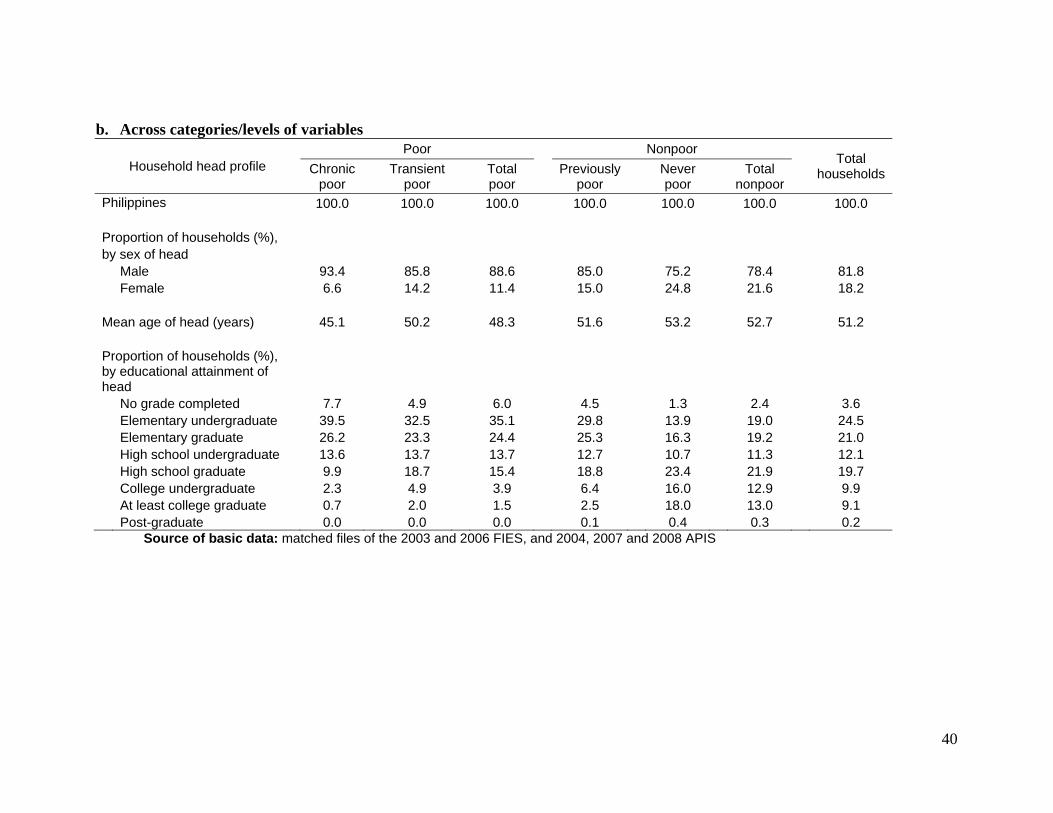
5-year panel Location Table 13 shows that high proportions of chronic and transient poor households were located in Mindanao, particularly in Caraga, ARMM, Zamboanga Peninsula, and SOCCSKSARGEN. These proportions seem to increase from north (Luzon) to south (Mindanao). The opposite is true for the never poor. The proportions of households living in Luzon, Visayas and Mindanao were around 53.9, 42.4 and 29.4 percent, respectively. Among the regions with high proportions of nonpoor households were NCR, CALABARZON and Central Luzon. Although the chronic poor households were mostly found in Mindanao (45.9%), the majority of the transient poor were found in Luzon, with 42.7 percent (Table 13.b). Only 35.1 percent of the transient poor were found in Mindanao. In terms of urban/rural classification, the majority (84.6%) of the chronic poor reside in rural areas. Similarly, 73.4 percent of the transient poor are rural dwellers. On the contrary, only 44.5 percent of the never poor are found in rural areas while 55.5 percent of them are situated in urban areas. Household head profile Among the male-headed households, 14.2 percent were chronic poor, 22.3 percent were transient poor, while 41.1 percent were never poor (Table 14.a). Among the female-headed households, only 4.5 were chronic poor, 16.6 percent were transient poor, while 61.0 percent were never poor. In terms of age, heads of the chronic and the transient poor households were usually younger (with average ages of 45 and 50, respectively) than heads of the never poor, who were 53 years old on the average. Educational attainment of heads can also differentiate the poor from the nonpoor. The majority of the households whose heads do not have any formal education were poor. Around 26.8 percent of these households were chronic poor while 29.4 percent were transient poor. On the contrary, only 16.6 percent of households with uneducated heads were never poor. Among the panel households whose heads were at least high school graduates, only 4.1 percent were chronic poor, 14.0 percent were transient poor, while 81.9 percent were nonpoor (81 percent of which had never been poor). Moreover, Table 14.b shows that there seems to be a positive relationship between household income and educational attainment of household heads. More than half of the chronic poor (73.4%) and the transient poor (60.8%) had heads who did not reach secondary level. Only 31.5 percent of the never poor had heads who either finished elementary, reached only elementary but did not finish it, or did not complete any grade. In contrast, more than half (57.8%) of the never poor had heads who were at least high
35
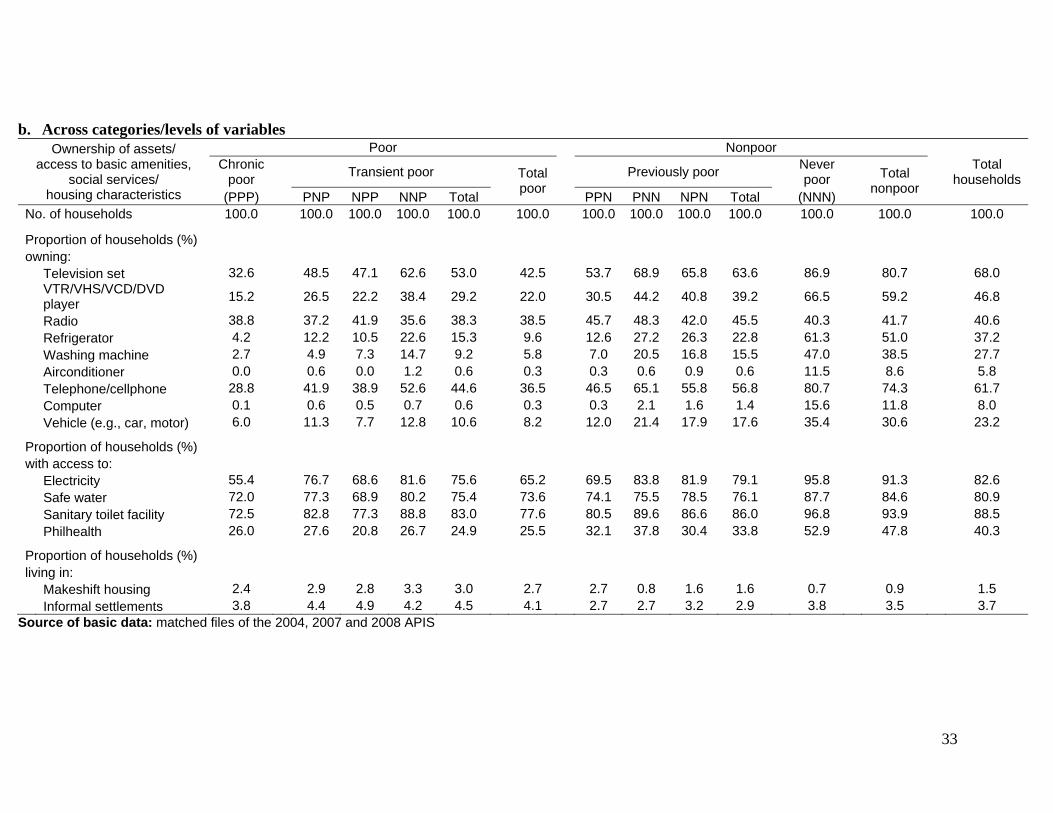
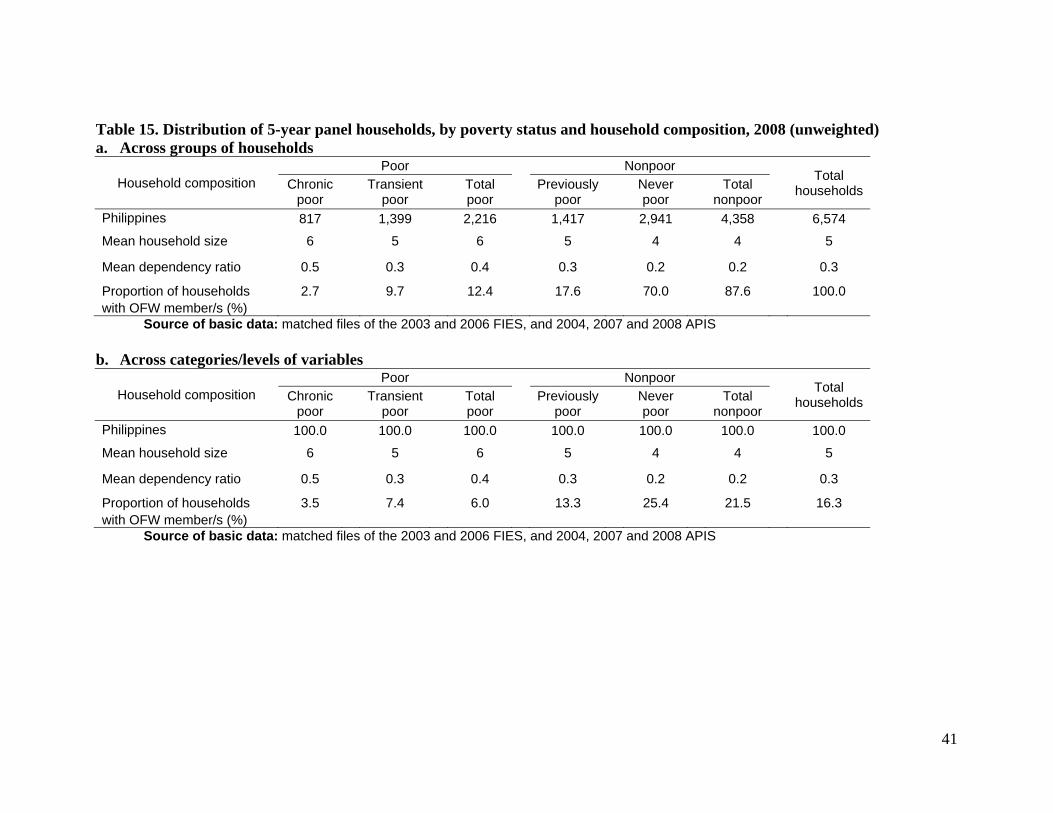
school graduates. Among the chronic and transient poor households, only 13.0 and 25.5 percent, respectively, had high school diploma. Household composition On the average, the chronic poor were composed of 6 members while the transient poor comprised 5 members (Table 15). The never poor households, on the other hand, were usually composed of 4 members. The chronic poor also had higher dependency ratio, which averaged around 0.5 or 5 dependents for every 10 members. The transient poor had relatively lower dependency ratio, at 0.3. The never poor had even lower proportion of dependents, at around 2 dependents for every 10 members. In terms of proportion of households with OFW member/s, the never poor had the highest, at 70 percent (Table 15.a). Around 17.6 percent of these were previously poor, 9.7 percent were transient poor, while only 2.7 percent were chronic poor. Ownership of assets, access to basic amenities and housing characteristics
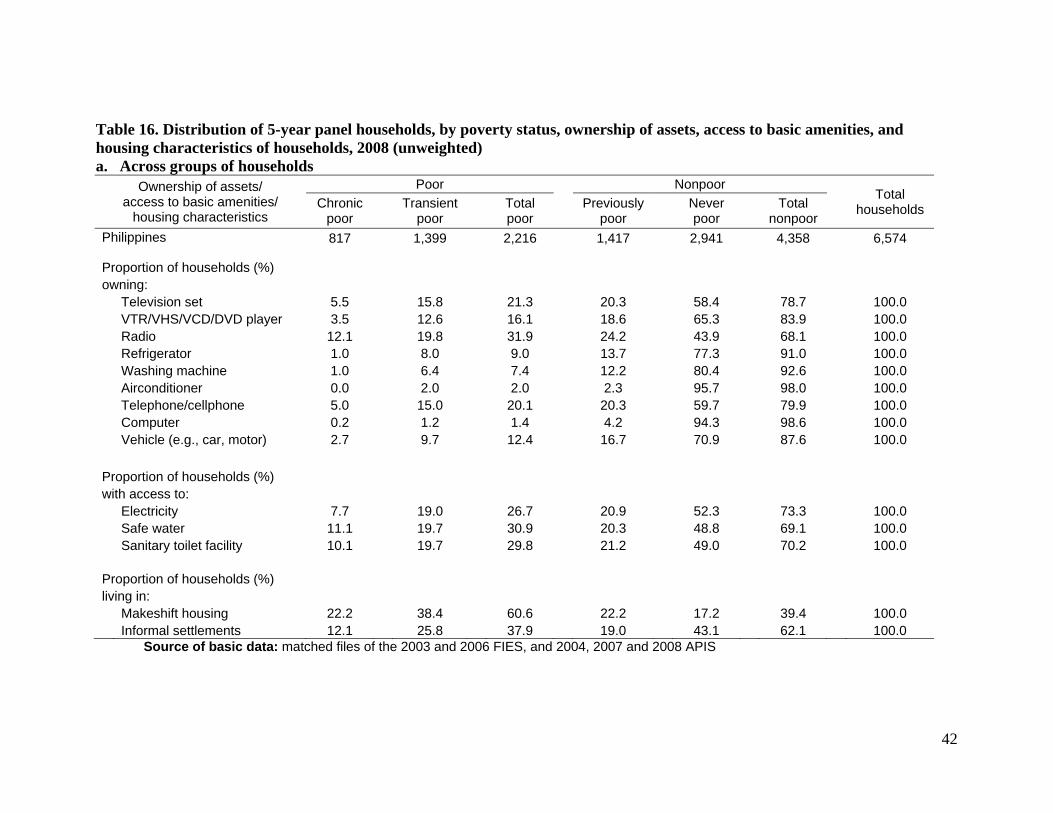
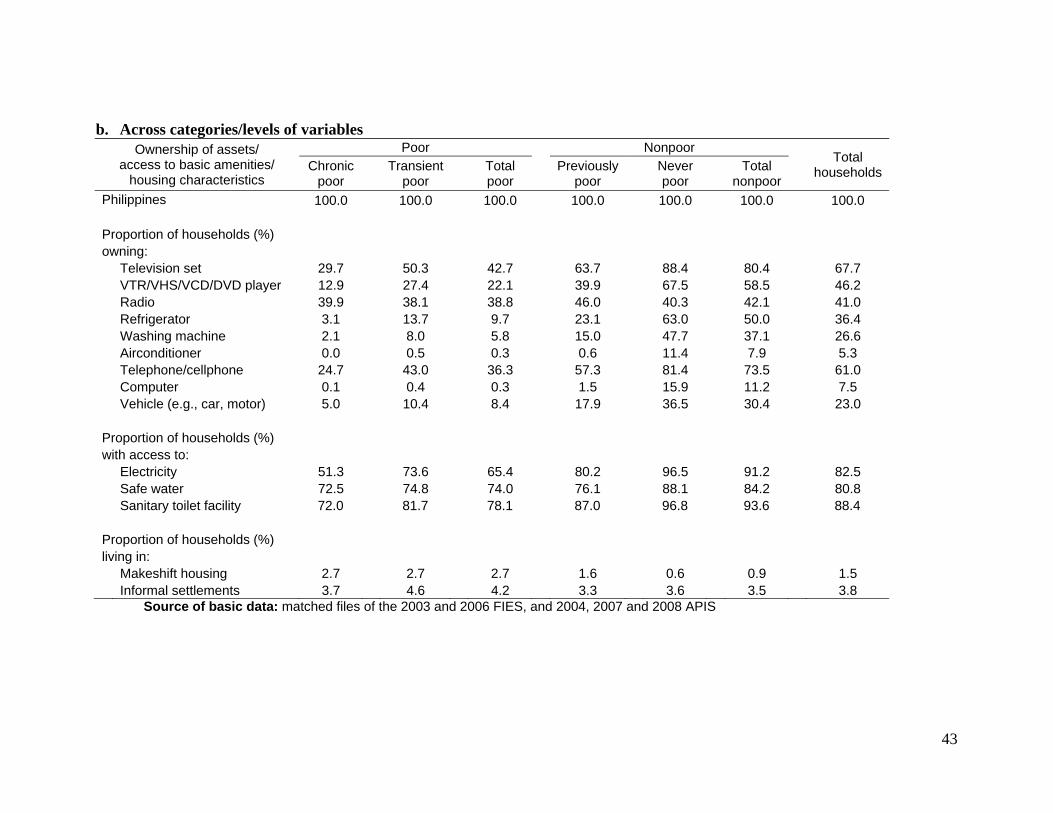
Similar to the earlier findings on asset ownership (using the FIES and APIS panel data sets), the chronic and the transient poor owned only few assets. This is evidenced by the very low proportions of poor households owning each of the assets in the list, particularly airconditioner, computer, refrigerator, and washing machine. Three of the most common assets owned by the poor households, however, were television set, radio and telephone/cellphone. The proportions of poor households owning these three most common assets were 42.7, 38.8 and 36.3 percent, respectively (Table 16.b). In terms of access to basic amenities such as electricity, safe water and sanitary toilet facility, almost half of the panel households with access were never poor, around 20 percent were transient poor, while only around 10 percent were chronic poor (Table 16.a). Similar to findings from the FIES and APIS panel data sets, Table 16.b shows that the proportion of households with access to basic amenities increases with household income. Around 51.3 and 73.6 percent of the chronic poor and the transient poor, respectively, had access to electricity. These proportions are higher among the nonpoor. Around 80.2 and 96.5 percent of the previously poor and the never poor, respectively, had access to electricity. Such pattern can also be observed in terms of water and basic sanitation. Among the chronic and the transient poor, 72.5 and 74.8 percent, respectively, had access to safe water. Among the previously poor and the never poor, however, 76.1 and 88.1 percent, respectively, had access to safe water. In terms of basic sanitation, 72.0 and 81.7 percent of the chronic poor and the transient poor, respectively, had access. Around 87.0 and 96.8 percent of the previously poor and the never poor, respectively, had access to sanitary toilet facility. Among the households living in makeshift housing, only 17.2 percent were never poor, 22.2 percent were previously poor, 38.4 percent were transient poor, while 22.2 percent
36
also were chronic poor (Table 16.a). Among those that were living as informal settlers, only 12.1 percent were chronic poor, 25.8 percent were transient poor, and 19.0 percent were previously poor. Ironically, 43.1 percent of the informal settlers had been consistently nonpoor over the five-year period.
Table 16.b shows that the proportion of poor households living in makeshift housing is higher than that of nonpoor households. Around 2.7 percent of the chronic poor were living in makeshift housing. Among the transient poor, 2.7 percent also had houses made of makeshift materials. On the other hand, only 0.6 and 1.6 of the never poor and the previously poor, respectively, were living in makeshift housing. In terms of housing tenure, there were not much differences among the groups of households. Around 3.7 percent of the chronic poor were living in informal settlements. Among the never poor, 3.6 percent were living in similar condition. Meanwhile, 4.6 percent of the transient poor were living as informal settlers.
37
Table 13. Distribution of 5-year panel households, by poverty status and location, 2008 (unweighted) a. Across groups of households
Location Poor Nonpoor Total
householdsChronic poor
Transient poor
Total poor
Previously poor
Never poor
Total nonpoor
Philippines 817 1,399 2,216 1,417 2,941 4,358 6,574
Proportion of households (%), by region LUZON 8.1 17.6 25.7 20.5 53.9 74.3 100.0
NCR 0.2 8.3 8.5 13.7 77.8 91.5 100.0 CAR 10.7 27.2 37.9 26.4 35.6 62.1 100.0 Ilocos Region 6.3 17.2 23.5 25.2 51.3 76.5 100.0 Cagayan Valley 5.0 18.6 23.6 22.5 53.8 76.4 100.0 Central Luzon 3.8 14.4 18.2 19.9 61.9 81.8 100.0 CALABARZON 8.0 15.8 23.8 13.5 62.7 76.2 100.0 MIMAROPA 22.3 25.4 47.7 22.7 29.6 52.3 100.0 Bicol Region 17.0 23.1 40.0 26.5 33.5 60.0 100.0
VISAYAS 12.4 23.0 35.4 22.2 42.4 64.6 100.0 Western Visayas 13.9 19.8 33.7 23.0 43.2 66.3 100.0 Central Visayas 8.5 23.7 32.3 21.2 46.6 67.7 100.0 Eastern Visayas 15.2 26.8 42.0 22.3 35.8 58.0 100.0
MINDANAO 20.6 26.9 47.5 23.1 29.4 52.5 100.0 Zamboanga Peninsula 27.2 19.3 46.5 24.3 29.2 53.5 100.0 Northern Mindanao 22.1 20.6 42.6 19.1 38.2 57.4 100.0 Davao Region 13.0 30.0 42.9 19.9 37.2 57.1 100.0 SOCCSKSARGEN 14.7 30.6 45.3 25.7 29.1 54.7 100.0 ARMM 20.4 29.6 50.0 30.4 19.6 50.0 100.0 Caraga 28.7 32.9 61.6 20.9 17.4 38.4 100.0
Proportion of households (%), by urbanity
Urban 5.0 14.7 19.7 15.9 64.4 80.3 100.0 Rural 17.1 25.4 42.5 25.1 32.4 57.5 100.0
Source of basic data: matched files of the 2003 and 2006 FIES, and 2004, 2007 and 2008 APIS
38
b. Across geographical location
Location Poor Nonpoor Total
householdsChronic poor
Transient poor
Total poor
Previously poor
Never poor
Total nonpoor
Philippines 100.0 100.0 100.0 100.0 100.0 100.0 100.0
Proportion of households (%), by region LUZON 33.7 42.7 39.4 49.2 62.3 58.1 51.8
NCR 0.1 2.6 1.7 4.3 11.8 9.3 6.8 CAR 3.4 5.1 4.5 4.9 3.2 3.7 4.0 Ilocos Region 3.5 5.7 4.9 8.3 8.1 8.1 7.1 Cagayan Valley 2.3 5.0 4.0 6.0 6.9 6.6 5.7 Central Luzon 2.7 6.0 4.8 8.2 12.3 10.9 8.9 CALABARZON 5.9 6.8 6.5 5.7 12.8 10.5 9.1 MIMAROPA 7.1 4.7 5.6 4.2 2.6 3.1 4.0 Bicol Region 8.6 6.8 7.4 7.7 4.7 5.7 6.3
VISAYAS 20.4 22.2 21.5 21.1 19.4 20.0 20.5 Western Visayas 8.9 7.4 8.0 8.5 7.7 8.0 8.0 Central Visayas 4.9 7.9 6.8 7.0 7.4 7.3 7.1 Eastern Visayas 6.6 6.8 6.7 5.6 4.3 4.7 5.4
MINDANAO 45.9 35.1 39.1 29.7 18.2 22.0 27.7 Zamboanga Peninsula 10.0 4.1 6.3 5.2 3.0 3.7 4.6 Northern Mindanao 9.2 5.0 6.5 4.6 4.4 4.5 5.2 Davao Region 5.5 7.4 6.7 4.9 4.4 4.5 5.3 SOCCSKSARGEN 5.9 7.1 6.7 5.9 3.2 4.1 5.0 ARMM 6.2 5.3 5.6 5.4 1.7 2.9 3.8 Caraga 9.1 6.1 7.2 3.8 1.5 2.3 3.9
Proportion of households (%), by urbanity
Urban 15.4 26.6 22.5 28.4 55.5 46.6 38.5 Rural 84.6 73.4 77.5 71.6 44.5 53.4 61.5
Source of basic data: matched files of the 2003 and 2006 FIES, and 2004, 2007 and 2008 APIS
39
Table 14. Distribution of 5-year panel households, by poverty status and household head profile, 2008 (unweighted) a. Across groups of households
Household head profile Poor Nonpoor Total
householdsChronic poor Transient
poor Total poor Previously
poor Never poor Total
nonpoor Philippines 817 1,399 2,216 1,417 2,941 4,358 6,574
Proportion of households (%), by sex of head
Male 14.2 22.3 36.5 22.4 41.1 63.5 100.0 Female 4.5 16.6 21.2 17.8 61.0 78.8 100.0
Mean age of head (years) 45 50 48 52 53 53 51
Proportion of households (%), by educational attainment of head
No grade completed 26.8 29.4 56.2 27.2 16.6 43.8 100.0 Elementary undergraduate 20.1 28.3 48.4 26.2 25.4 51.6 100.0 Elementary graduate 15.5 23.7 39.2 26.0 34.8 60.8 100.0 High school undergraduate 13.9 24.1 38.0 22.6 39.4 62.0 100.0 High school graduate 6.2 20.1 26.4 20.5 53.1 73.6 100.0 College undergraduate 2.9 10.5 13.4 13.9 72.7 86.6 100.0 At least college graduate 1.0 4.7 5.7 6.0 88.3 94.3 100.0
Post-graduate 0.0 0.0 0.0 8.3 91.7 100.0 100.0 Source of basic data: matched files of the 2003 and 2006 FIES, and 2004, 2007 and 2008 APIS
40
b. Across categories/levels of variables
Household head profile Poor Nonpoor Total
householdsChronic poor
Transient poor
Total poor
Previously poor
Never poor
Total nonpoor
Philippines 100.0 100.0 100.0 100.0 100.0 100.0 100.0
Proportion of households (%), by sex of head
Male 93.4 85.8 88.6 85.0 75.2 78.4 81.8 Female 6.6 14.2 11.4 15.0 24.8 21.6 18.2
Mean age of head (years) 45.1 50.2 48.3 51.6 53.2 52.7 51.2
Proportion of households (%), by educational attainment of head
No grade completed 7.7 4.9 6.0 4.5 1.3 2.4 3.6 Elementary undergraduate 39.5 32.5 35.1 29.8 13.9 19.0 24.5 Elementary graduate 26.2 23.3 24.4 25.3 16.3 19.2 21.0 High school undergraduate 13.6 13.7 13.7 12.7 10.7 11.3 12.1 High school graduate 9.9 18.7 15.4 18.8 23.4 21.9 19.7 College undergraduate 2.3 4.9 3.9 6.4 16.0 12.9 9.9 At least college graduate 0.7 2.0 1.5 2.5 18.0 13.0 9.1
Post-graduate 0.0 0.0 0.0 0.1 0.4 0.3 0.2 Source of basic data: matched files of the 2003 and 2006 FIES, and 2004, 2007 and 2008 APIS
41
Table 15. Distribution of 5-year panel households, by poverty status and household composition, 2008 (unweighted) a. Across groups of households
Household composition Poor Nonpoor Total
householdsChronic poor
Transient poor
Total poor
Previously poor
Never poor
Total nonpoor
Philippines 817 1,399 2,216 1,417 2,941 4,358 6,574
Mean household size 6 5 6 5 4 4 5
Mean dependency ratio 0.5 0.3 0.4 0.3 0.2 0.2 0.3
Proportion of households 2.7 9.7 12.4 17.6 70.0 87.6 100.0 with OFW member/s (%)
Source of basic data: matched files of the 2003 and 2006 FIES, and 2004, 2007 and 2008 APIS
b. Across categories/levels of variables
Household composition Poor Nonpoor Total
householdsChronic poor
Transient poor
Total poor
Previously poor
Never poor
Total nonpoor
Philippines 100.0 100.0 100.0 100.0 100.0 100.0 100.0
Mean household size 6 5 6 5 4 4 5
Mean dependency ratio 0.5 0.3 0.4 0.3 0.2 0.2 0.3
Proportion of households 3.5 7.4 6.0 13.3 25.4 21.5 16.3 with OFW member/s (%)
Source of basic data: matched files of the 2003 and 2006 FIES, and 2004, 2007 and 2008 APIS
42
Table 16. Distribution of 5-year panel households, by poverty status, ownership of assets, access to basic amenities, and housing characteristics of households, 2008 (unweighted) a. Across groups of households
Ownership of assets/ access to basic amenities/
housing characteristics
Poor Nonpoor Total
households Chronic poor Transient
poor Total poor Previously
poor Never poor Total
nonpoor Philippines 817 1,399 2,216 1,417 2,941 4,358 6,574
Proportion of households (%) owning:
Television set 5.5 15.8 21.3 20.3 58.4 78.7 100.0 VTR/VHS/VCD/DVD player 3.5 12.6 16.1 18.6 65.3 83.9 100.0 Radio 12.1 19.8 31.9 24.2 43.9 68.1 100.0 Refrigerator 1.0 8.0 9.0 13.7 77.3 91.0 100.0 Washing machine 1.0 6.4 7.4 12.2 80.4 92.6 100.0 Airconditioner 0.0 2.0 2.0 2.3 95.7 98.0 100.0 Telephone/cellphone 5.0 15.0 20.1 20.3 59.7 79.9 100.0 Computer 0.2 1.2 1.4 4.2 94.3 98.6 100.0 Vehicle (e.g., car, motor) 2.7 9.7 12.4 16.7 70.9 87.6 100.0
Proportion of households (%) with access to:
Electricity 7.7 19.0 26.7 20.9 52.3 73.3 100.0 Safe water 11.1 19.7 30.9 20.3 48.8 69.1 100.0 Sanitary toilet facility 10.1 19.7 29.8 21.2 49.0 70.2 100.0
Proportion of households (%) living in:
Makeshift housing 22.2 38.4 60.6 22.2 17.2 39.4 100.0 Informal settlements 12.1 25.8 37.9 19.0 43.1 62.1 100.0
Source of basic data: matched files of the 2003 and 2006 FIES, and 2004, 2007 and 2008 APIS
43
b. Across categories/levels of variables Ownership of assets/
access to basic amenities/ housing characteristics
Poor Nonpoor Total householdsChronic
poor Transient
poor Total poor
Previously poor
Never poor
Total nonpoor
Philippines 100.0 100.0 100.0 100.0 100.0 100.0 100.0
Proportion of households (%) owning:
Television set 29.7 50.3 42.7 63.7 88.4 80.4 67.7 VTR/VHS/VCD/DVD player 12.9 27.4 22.1 39.9 67.5 58.5 46.2 Radio 39.9 38.1 38.8 46.0 40.3 42.1 41.0 Refrigerator 3.1 13.7 9.7 23.1 63.0 50.0 36.4 Washing machine 2.1 8.0 5.8 15.0 47.7 37.1 26.6 Airconditioner 0.0 0.5 0.3 0.6 11.4 7.9 5.3 Telephone/cellphone 24.7 43.0 36.3 57.3 81.4 73.5 61.0 Computer 0.1 0.4 0.3 1.5 15.9 11.2 7.5 Vehicle (e.g., car, motor) 5.0 10.4 8.4 17.9 36.5 30.4 23.0
Proportion of households (%) with access to:
Electricity 51.3 73.6 65.4 80.2 96.5 91.2 82.5 Safe water 72.5 74.8 74.0 76.1 88.1 84.2 80.8 Sanitary toilet facility 72.0 81.7 78.1 87.0 96.8 93.6 88.4
Proportion of households (%) living in:
Makeshift housing 2.7 2.7 2.7 1.6 0.6 0.9 1.5 Informal settlements 3.7 4.6 4.2 3.3 3.6 3.5 3.8
Source of basic data: matched files of the 2003 and 2006 FIES, and 2004, 2007 and 2008 APIS
44
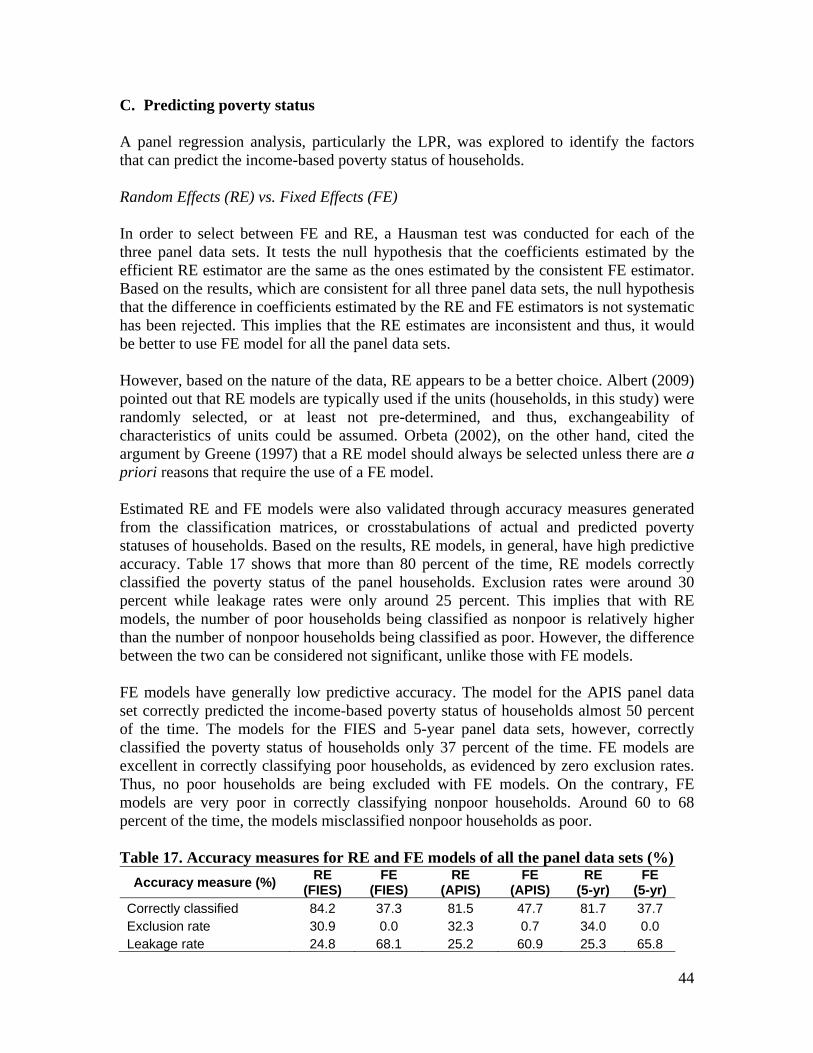
C. Predicting poverty status
A panel regression analysis, particularly the LPR, was explored to identify the factors that can predict the income-based poverty status of households. Random Effects (RE) vs. Fixed Effects (FE) In order to select between FE and RE, a Hausman test was conducted for each of the three panel data sets. It tests the null hypothesis that the coefficients estimated by the efficient RE estimator are the same as the ones estimated by the consistent FE estimator. Based on the results, which are consistent for all three panel data sets, the null hypothesis that the difference in coefficients estimated by the RE and FE estimators is not systematic has been rejected. This implies that the RE estimates are inconsistent and thus, it would be better to use FE model for all the panel data sets. However, based on the nature of the data, RE appears to be a better choice. Albert (2009) pointed out that RE models are typically used if the units (households, in this study) were randomly selected, or at least not pre-determined, and thus, exchangeability of characteristics of units could be assumed. Orbeta (2002), on the other hand, cited the argument by Greene (1997) that a RE model should always be selected unless there are a priori reasons that require the use of a FE model. Estimated RE and FE models were also validated through accuracy measures generated from the classification matrices, or crosstabulations of actual and predicted poverty statuses of households. Based on the results, RE models, in general, have high predictive accuracy. Table 17 shows that more than 80 percent of the time, RE models correctly classified the poverty status of the panel households. Exclusion rates were around 30 percent while leakage rates were only around 25 percent. This implies that with RE models, the number of poor households being classified as nonpoor is relatively higher than the number of nonpoor households being classified as poor. However, the difference between the two can be considered not significant, unlike those with FE models. FE models have generally low predictive accuracy. The model for the APIS panel data set correctly predicted the income-based poverty status of households almost 50 percent of the time. The models for the FIES and 5-year panel data sets, however, correctly classified the poverty status of households only 37 percent of the time. FE models are excellent in correctly classifying poor households, as evidenced by zero exclusion rates. Thus, no poor households are being excluded with FE models. On the contrary, FE models are very poor in correctly classifying nonpoor households. Around 60 to 68 percent of the time, the models misclassified nonpoor households as poor. Table 17. Accuracy measures for RE and FE models of all the panel data sets (%)
Accuracy measure (%) RE (FIES)
FE (FIES)
RE (APIS)
FE (APIS)
RE (5-yr)
FE (5-yr)
Correctly classified 84.2 37.3 81.5 47.7 81.7 37.7 Exclusion rate 30.9 0.0 32.3 0.7 34.0 0.0 Leakage rate 24.8 68.1 25.2 60.9 25.3 65.8
45
Estimation results Several variables included in the LPR models were found statistically significant in predicting the income-based poverty status of households. Interestingly, many of these variables satisfied their hypothesized relationship with poverty status. If time-invariant variables such as regions are not considered, RE models still have higher number of significant variables relative to FE models. This supports the earlier statement on predictive accuracy of the estimated models. More variables appeared significant in predicting the poverty status of households in RE models (or, when time-invariant factors were not controlled), which resulted in higher predictive accuracy of the models. Table 18 summarizes the estimation results (Refer to Appendices for regression models for all three panel data sets). The consistently significant factors in predicting the poverty status of households in all models were: age of head; family size; dependency ratio; and, ownership of some assets such as radio, washing machine and vehicle. Some other variables that were found significant in at least 3 models were: education dummies (from high school undergraduate up to at least college graduate); OFW indicator; ownership of the remaining assets in the list, except computer (i.e., television set, VTR/VHS/VCD/DVD player, refrigerator, airconditioner, telephone/cellphone); access to electricity and sanitary toilet facility; and, some regional dummies such as Ilocos, CALABARZON, MIMAROPA, Bicol, West Visayas, Zamboanga Peninsual, Northern Mindanao, and Caraga. It can also be observed that some factors appeared significant only in a particular type of model or a particular data set. Aside from location factors, sex and education of heads as well as access indicators were found significant only in RE models. Except for percent share of agricultural income and access to Philhealth (which are present only in FIES and APIS models, respectively), type of housing materials was significant only in FIES panel while status of housing tenure was significant only in APIS panel. Below are the insights drawn from the panel regression analysis: • Female-headed households have lower probability of being nonpoor.
• Households with prime-aged heads have higher probability of being nonpoor. In
contrast, those with younger and older heads tend to be poorer.
• The higher the educational attainment of head, the higher the probability of being nonpoor.
• Households with heads who are either engaged in agriculture or have no
job/business tend to be poorer.
• Bigger households and those with higher proportion of dependents (members aged below 15) are more likely to be poor.
46
• Households with at least one OFW member have higher probability of being
nonpoor.
• Households living in makeshift housing and as informal settlers tend to be poorer.
• Households with access to basic amenities/social services such as electricity, safe water, sanitary toilet facility, and Philhealth program have higher probability of being nonpoor.
• Households owning more assets, especially the high-priced ones, are more likely to
be nonpoor.
• Households living in NCR and in urban areas outside NCR have higher probability of being nonpoor.
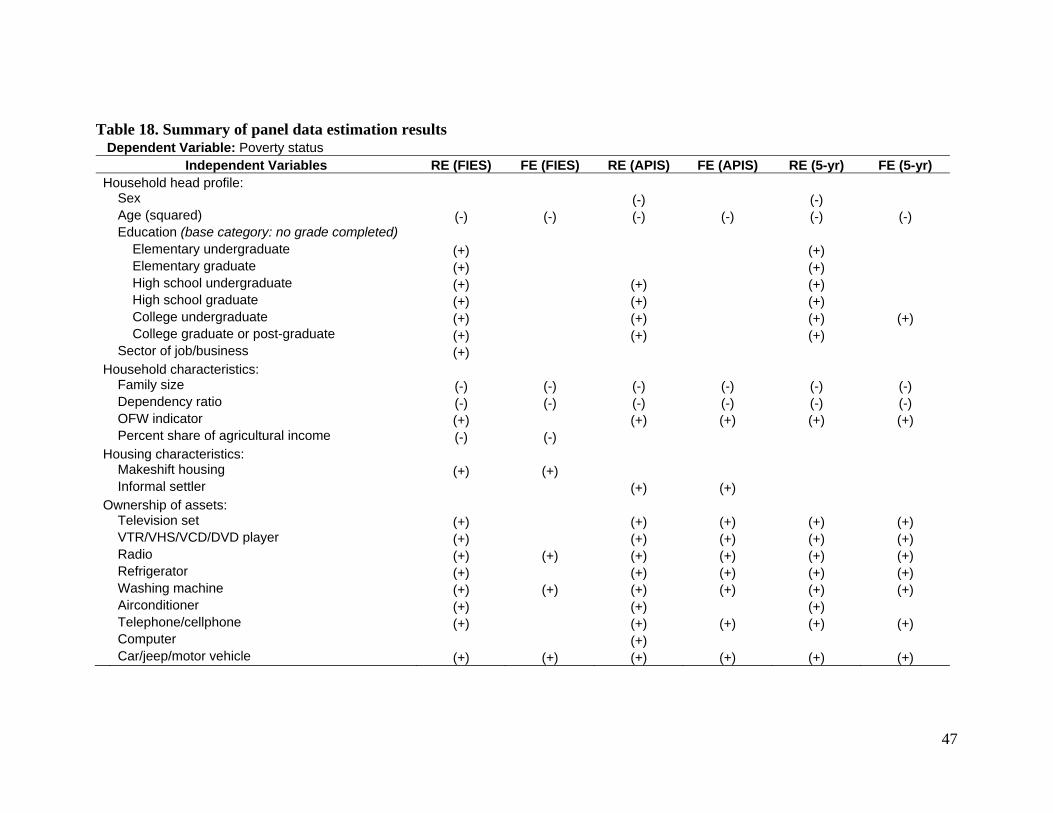
47
Table 18. Summary of panel data estimation results Dependent Variable: Poverty status
Independent Variables RE (FIES) FE (FIES) RE (APIS) FE (APIS) RE (5-yr) FE (5-yr) Household head profile:
Sex (-) (-) Age (squared) (-) (-) (-) (-) (-) (-) Education (base category: no grade completed) Elementary undergraduate (+) (+) Elementary graduate (+) (+) High school undergraduate (+) (+) (+) High school graduate (+) (+) (+) College undergraduate (+) (+) (+) (+) College graduate or post-graduate (+) (+) (+) Sector of job/business (+)
Household characteristics: Family size (-) (-) (-) (-) (-) (-) Dependency ratio (-) (-) (-) (-) (-) (-) OFW indicator (+) (+) (+) (+) (+) Percent share of agricultural income (-) (-)
Housing characteristics: Makeshift housing (+) (+) Informal settler (+) (+)
Ownership of assets: Television set (+) (+) (+) (+) (+) VTR/VHS/VCD/DVD player (+) (+) (+) (+) (+) Radio (+) (+) (+) (+) (+) (+) Refrigerator (+) (+) (+) (+) (+) Washing machine (+) (+) (+) (+) (+) (+) Airconditioner (+) (+) (+) Telephone/cellphone (+) (+) (+) (+) (+) Computer (+) Car/jeep/motor vehicle (+) (+) (+) (+) (+) (+)
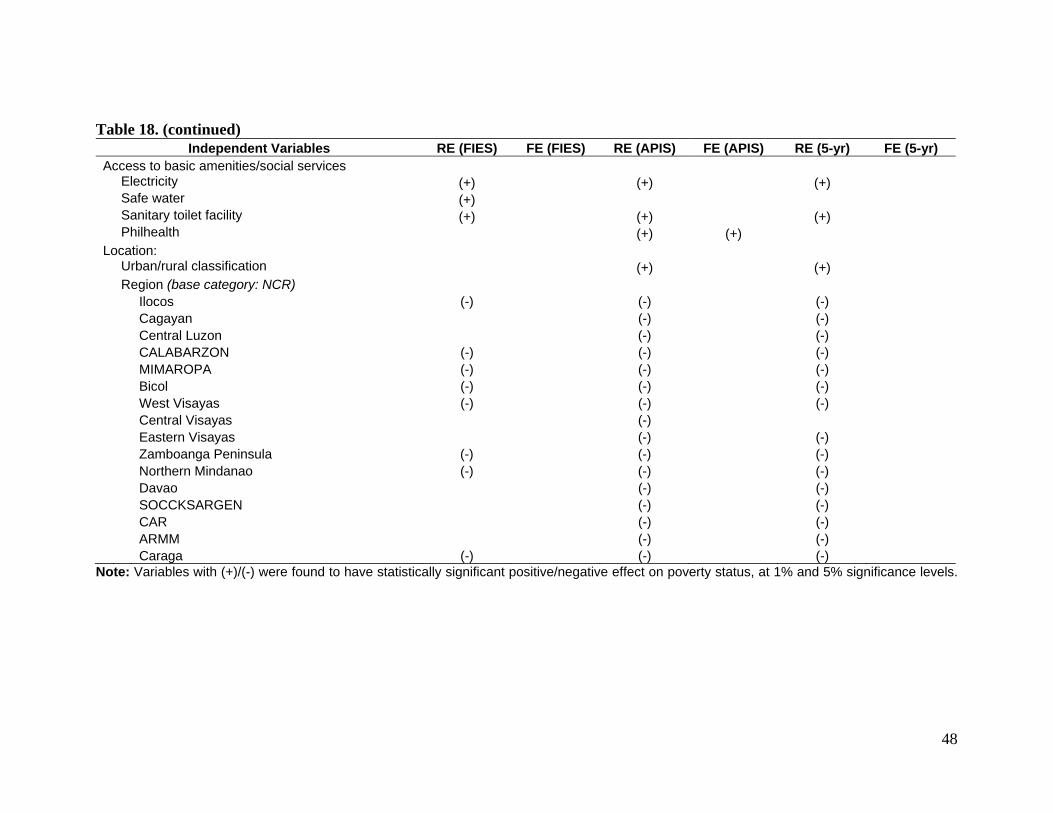
48
Table 18. (continued) Independent Variables RE (FIES) FE (FIES) RE (APIS) FE (APIS) RE (5-yr) FE (5-yr)
Access to basic amenities/social services Electricity (+) (+) (+) Safe water (+) Sanitary toilet facility (+) (+) (+) Philhealth (+) (+)
Location: Urban/rural classification (+) (+) Region (base category: NCR)
Ilocos (-) (-) (-) Cagayan (-) (-) Central Luzon (-) (-) CALABARZON (-) (-) (-) MIMAROPA (-) (-) (-) Bicol (-) (-) (-) West Visayas (-) (-) (-) Central Visayas (-) Eastern Visayas (-) (-) Zamboanga Peninsula (-) (-) (-) Northern Mindanao (-) (-) (-) Davao (-) (-) SOCCKSARGEN (-) (-) CAR (-) (-) ARMM (-) (-)
Caraga (-) (-) (-) Note: Variables with (+)/(-) were found to have statistically significant positive/negative effect on poverty status, at 1% and 5% significance levels.
49
IV. Concluding remarks The major finding of the study is that the poor is not a homogeneous group. Those who were classified as poor at any point in time consist of the chronic poor and the transient poor. In fact, the transient poor comprised a significant portion of the poor. Using the panel data generated from the 2003 and 2006 FIES, about one-third of the poor households were transient poor while half of those considered as food poor were previously nonpoor. Using the APIS panel, almost half of the income poor were considered transient poor while around 63.3 percent of food poor were transient food poor. Meanwhile, the 5-year panel from the combined FIES and APIS rounds during the period 2003-2008 revealed that 63.2 percent of the income poor were transient poor while 79.5 percent of the food poor were considered transient food poor. Different groups of households need different types of interventions. Longer-term investment schemes are more appropriate in addressing chronic poverty. These may include providing assistance to chronic poor households that will help increase their human and physical assets or returns to those assets. On the other hand, transient poverty may be addressed through insurance and income stabilization schemes. The transient poor are considered vulnerable to various economic and natural shocks so they have to be protected against these shocks. The government can also help the transient poor cope with shocks. Programs that reduce risks or help households manage the risks better can be designed and implemented. This type of intervention can help households from falling into poverty. Moreover, identifying the characteristics of the different groups of households, particularly the chronic and the transient poor, can be of great help in designing specific types of interventions. The chronic poor tend to reside in the rural areas and are engaged in agriculture. This suggests the need for the poverty reduction strategy to focus on the rural areas, particularly on agriculture. The chronic poor also tend to have larger family sizes. Better population management is a critical component of an effective poverty reduction strategy. Meanwhile, education is an essential factor affecting the poverty status of households. Providing access to education is an effective way of breaking the cycle of poverty.
50
References Albert, J.R.G. 2009. Econometric and statistical analysis: how to utilize STATA.
Training course conducted at the Asian Development Bank, Mandaluyong City, July 1-14, 2009.
Greene, W.H. 1997. Econometric analysis (3rd ed.). London, UK: Prentice Hall. Gujarati, D.N. 2004. Basic econometrics (4th ed.). London, UK: The McGraw-Hill. Orbeta, A.C. 2002. The impact of globalization on employment in the Philippines.
Philippine Review of Economics, 39 (2): 1-36. Reyes, C.M. 2003. The poverty fight: has it made an impact? Perspective Paper Series
No. 2. Makati City: Philippine Institute for Development Studies. Wooldridge, J.M. 2002. Econometric analysis of cross section and panel data. London,
England: The MIT Press.
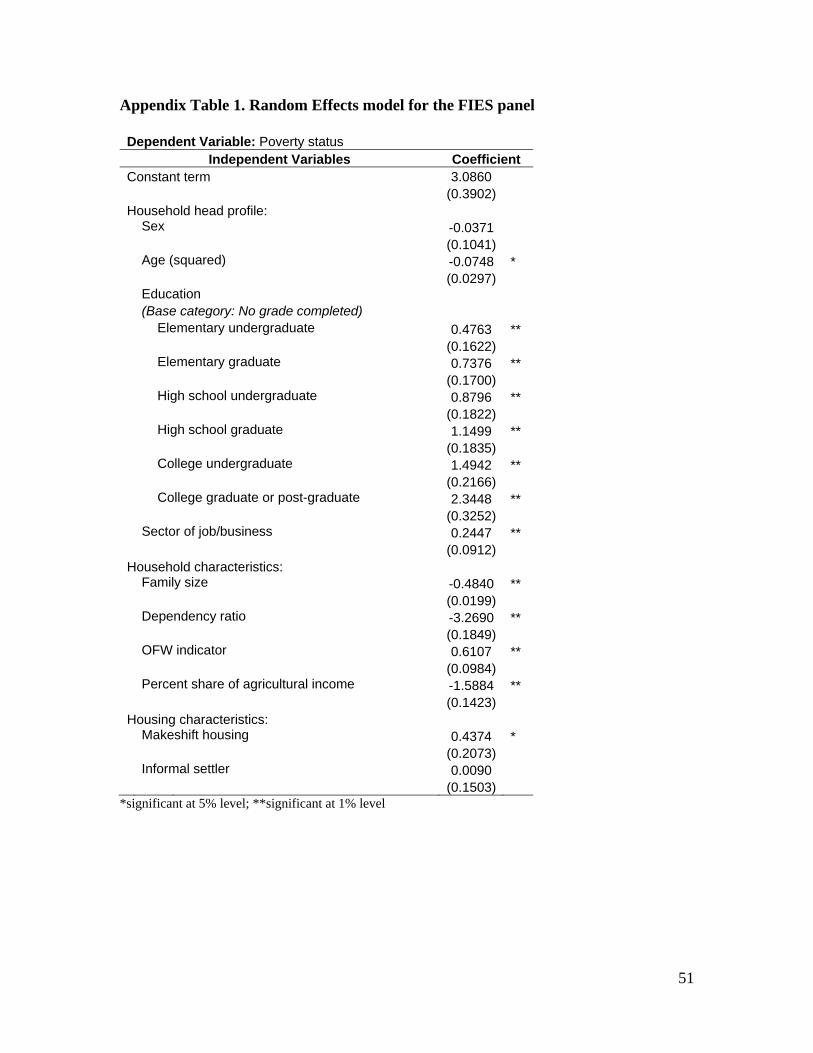
51
Appendix Table 1. Random Effects model for the FIES panel Dependent Variable: Poverty status
Independent Variables Coefficient Constant term 3.0860
(0.3902)Household head profile:
Sex -0.0371 (0.1041)Age (squared) -0.0748 * (0.0297)Education (Base category: No grade completed) Elementary undergraduate 0.4763 ** (0.1622) Elementary graduate 0.7376 ** (0.1700) High school undergraduate 0.8796 ** (0.1822) High school graduate 1.1499 ** (0.1835) College undergraduate 1.4942 ** (0.2166) College graduate or post-graduate 2.3448 ** (0.3252)Sector of job/business 0.2447 ** (0.0912)
Household characteristics: Family size -0.4840 ** (0.0199)Dependency ratio -3.2690 ** (0.1849)OFW indicator 0.6107 ** (0.0984)Percent share of agricultural income -1.5884 ** (0.1423)
Housing characteristics: Makeshift housing 0.4374 * (0.2073)Informal settler 0.0090 (0.1503)
*significant at 5% level; **significant at 1% level
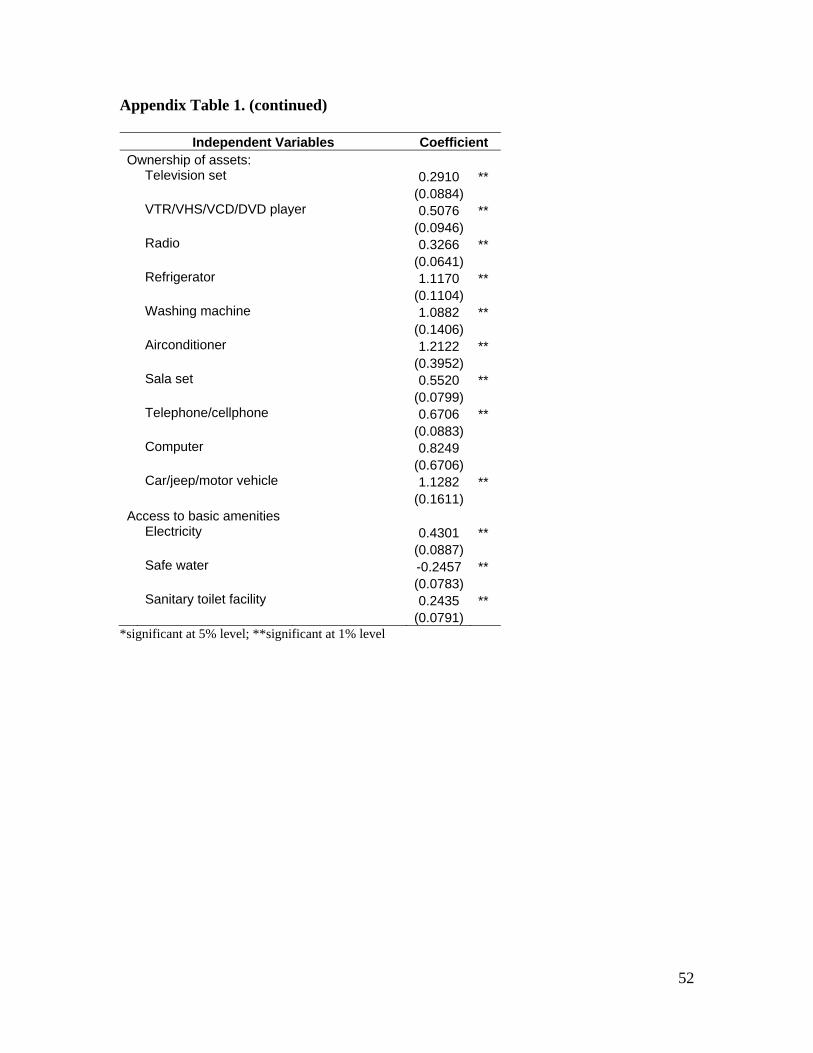
52
Appendix Table 1. (continued)
Independent Variables Coefficient Ownership of assets:
Television set 0.2910 ** (0.0884)VTR/VHS/VCD/DVD player 0.5076 ** (0.0946)Radio 0.3266 ** (0.0641)Refrigerator 1.1170 ** (0.1104)Washing machine 1.0882 ** (0.1406)Airconditioner 1.2122 ** (0.3952)Sala set 0.5520 ** (0.0799)Telephone/cellphone 0.6706 ** (0.0883)Computer 0.8249 (0.6706)Car/jeep/motor vehicle 1.1282 ** (0.1611)
Access to basic amenities Electricity 0.4301 ** (0.0887)Safe water -0.2457 ** (0.0783)Sanitary toilet facility 0.2435 **
(0.0791) *significant at 5% level; **significant at 1% level
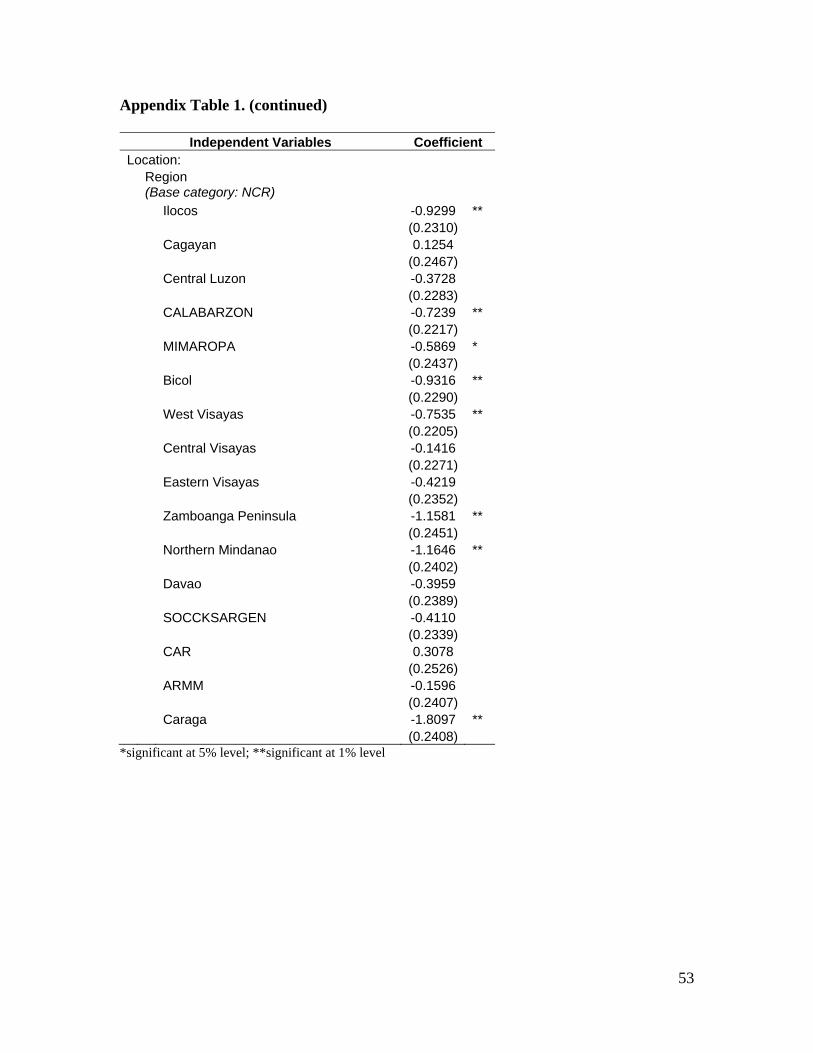
53
Appendix Table 1. (continued)
Independent Variables Coefficient Location:
Region (Base category: NCR)
Ilocos -0.9299 ** (0.2310)
Cagayan 0.1254 (0.2467)
Central Luzon -0.3728 (0.2283)
CALABARZON -0.7239 ** (0.2217)
MIMAROPA -0.5869 * (0.2437)
Bicol -0.9316 ** (0.2290)
West Visayas -0.7535 ** (0.2205)
Central Visayas -0.1416 (0.2271)
Eastern Visayas -0.4219 (0.2352)
Zamboanga Peninsula -1.1581 ** (0.2451)
Northern Mindanao -1.1646 ** (0.2402)
Davao -0.3959 (0.2389)
SOCCKSARGEN -0.4110 (0.2339)
CAR 0.3078 (0.2526)
ARMM -0.1596 (0.2407)
Caraga -1.8097 ** (0.2408)
*significant at 5% level; **significant at 1% level
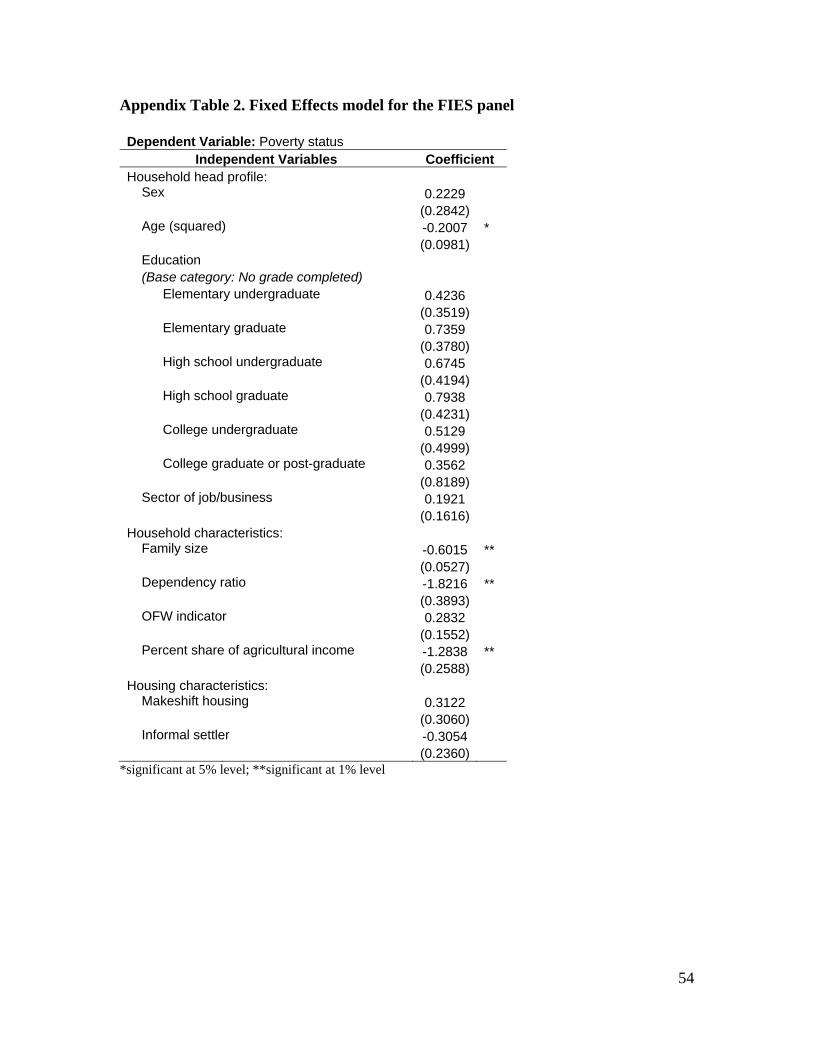
54
Appendix Table 2. Fixed Effects model for the FIES panel Dependent Variable: Poverty status
Independent Variables Coefficient Household head profile:
Sex 0.2229 (0.2842)Age (squared) -0.2007 * (0.0981)Education (Base category: No grade completed) Elementary undergraduate 0.4236 (0.3519) Elementary graduate 0.7359 (0.3780) High school undergraduate 0.6745 (0.4194) High school graduate 0.7938 (0.4231) College undergraduate 0.5129 (0.4999) College graduate or post-graduate 0.3562 (0.8189)Sector of job/business 0.1921 (0.1616)
Household characteristics: Family size -0.6015 ** (0.0527)Dependency ratio -1.8216 ** (0.3893)OFW indicator 0.2832 (0.1552)Percent share of agricultural income -1.2838 ** (0.2588)
Housing characteristics: Makeshift housing 0.3122 (0.3060)Informal settler -0.3054 (0.2360)
*significant at 5% level; **significant at 1% level
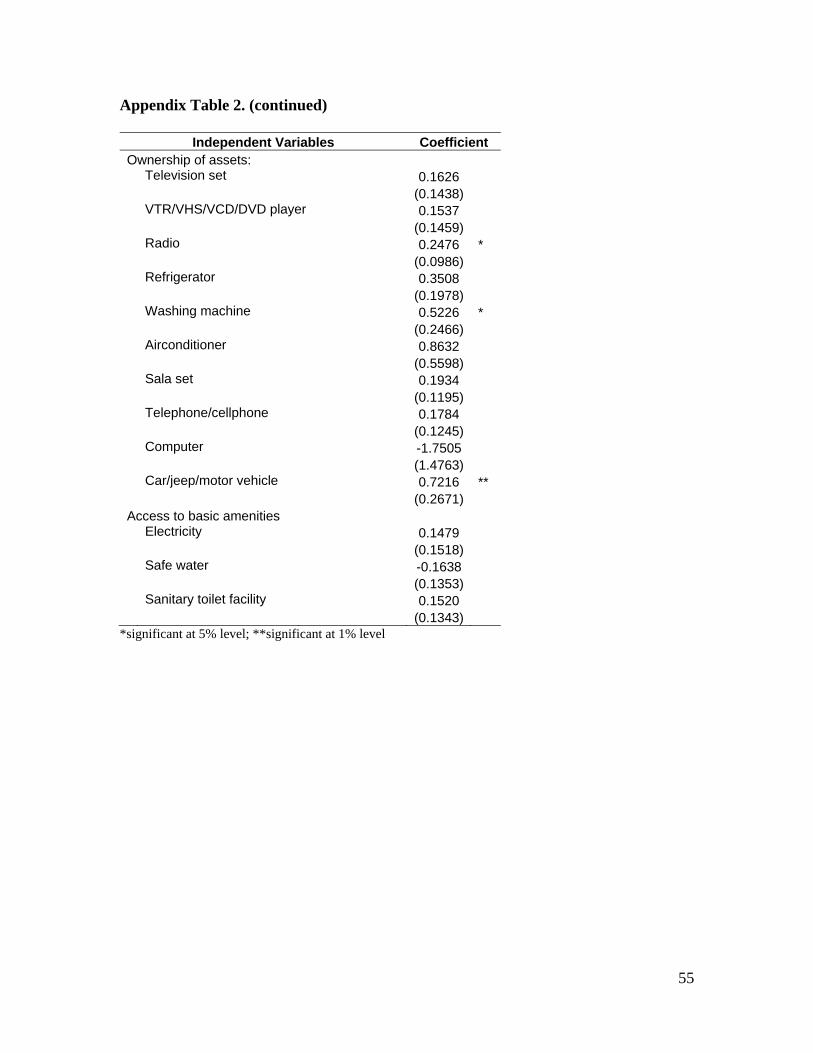
55
Appendix Table 2. (continued)
Independent Variables Coefficient Ownership of assets:
Television set 0.1626 (0.1438)VTR/VHS/VCD/DVD player 0.1537 (0.1459)Radio 0.2476 * (0.0986)Refrigerator 0.3508 (0.1978)Washing machine 0.5226 * (0.2466)Airconditioner 0.8632 (0.5598)Sala set 0.1934 (0.1195)Telephone/cellphone 0.1784 (0.1245)Computer -1.7505 (1.4763)Car/jeep/motor vehicle 0.7216 ** (0.2671)
Access to basic amenities Electricity 0.1479 (0.1518)Safe water -0.1638 (0.1353)Sanitary toilet facility 0.1520
(0.1343) *significant at 5% level; **significant at 1% level
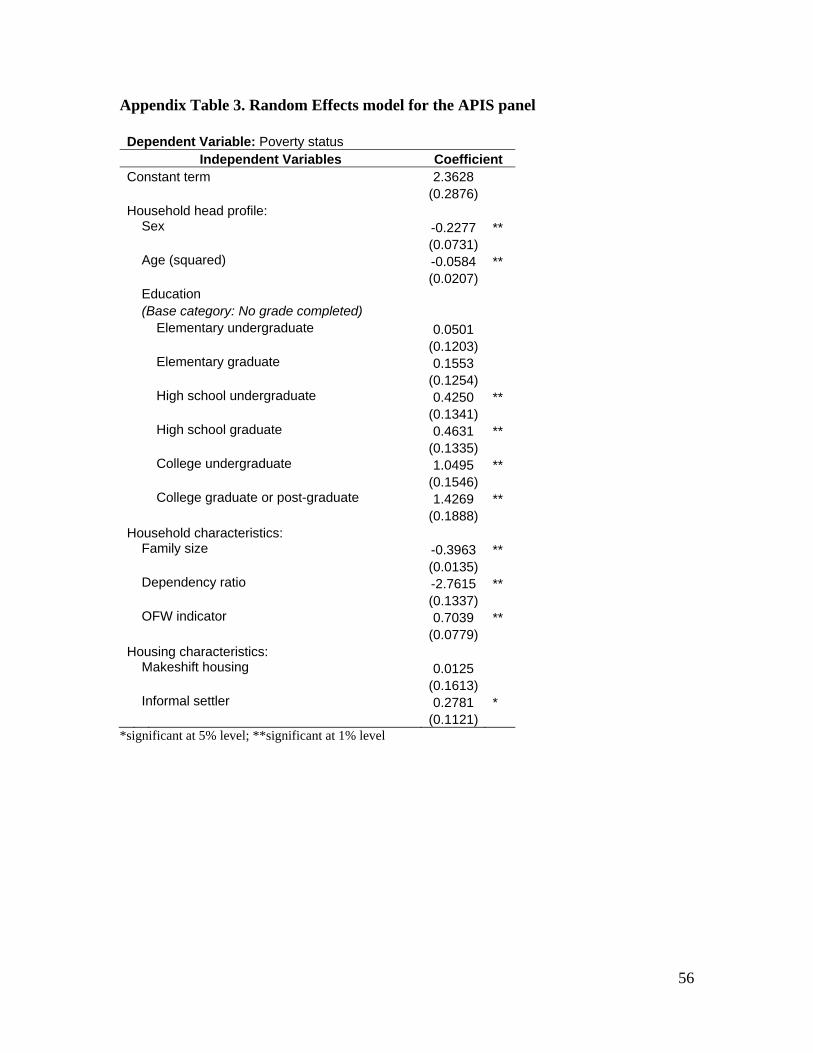
56
Appendix Table 3. Random Effects model for the APIS panel Dependent Variable: Poverty status
Independent Variables Coefficient Constant term 2.3628
(0.2876)Household head profile:
Sex -0.2277 ** (0.0731)Age (squared) -0.0584 ** (0.0207)Education (Base category: No grade completed) Elementary undergraduate 0.0501 (0.1203) Elementary graduate 0.1553 (0.1254) High school undergraduate 0.4250 ** (0.1341) High school graduate 0.4631 ** (0.1335) College undergraduate 1.0495 ** (0.1546) College graduate or post-graduate 1.4269 ** (0.1888)
Household characteristics: Family size -0.3963 ** (0.0135)Dependency ratio -2.7615 ** (0.1337)OFW indicator 0.7039 ** (0.0779)
Housing characteristics: Makeshift housing 0.0125 (0.1613)Informal settler 0.2781 * (0.1121)
*significant at 5% level; **significant at 1% level

57
Appendix Table 3. (continued)
Independent Variables Coefficient Ownership of assets:
Television set 0.4097 ** (0.0626)VTR/VHS/VCD/DVD player 0.3186 ** (0.0596)Radio 0.1428 ** (0.0457)Refrigerator 1.0802 ** (0.0714)Washing machine 0.6899 ** (0.0828)Airconditioner 0.7459 * (0.3156)Telephone/cellphone 0.4951 ** (0.0545)Computer 0.5618 * (0.2654)Car/jeep/motor vehicle 0.9618 ** (0.0778)
Access to basic amenities/social services Electricity 0.3912 ** (0.0705)Safe water -0.0706 (0.0551)Sanitary toilet facility 0.2395 ** (0.0706)Philhealth 0.5802 ** (0.0516)
*significant at 5% level; **significant at 1% level
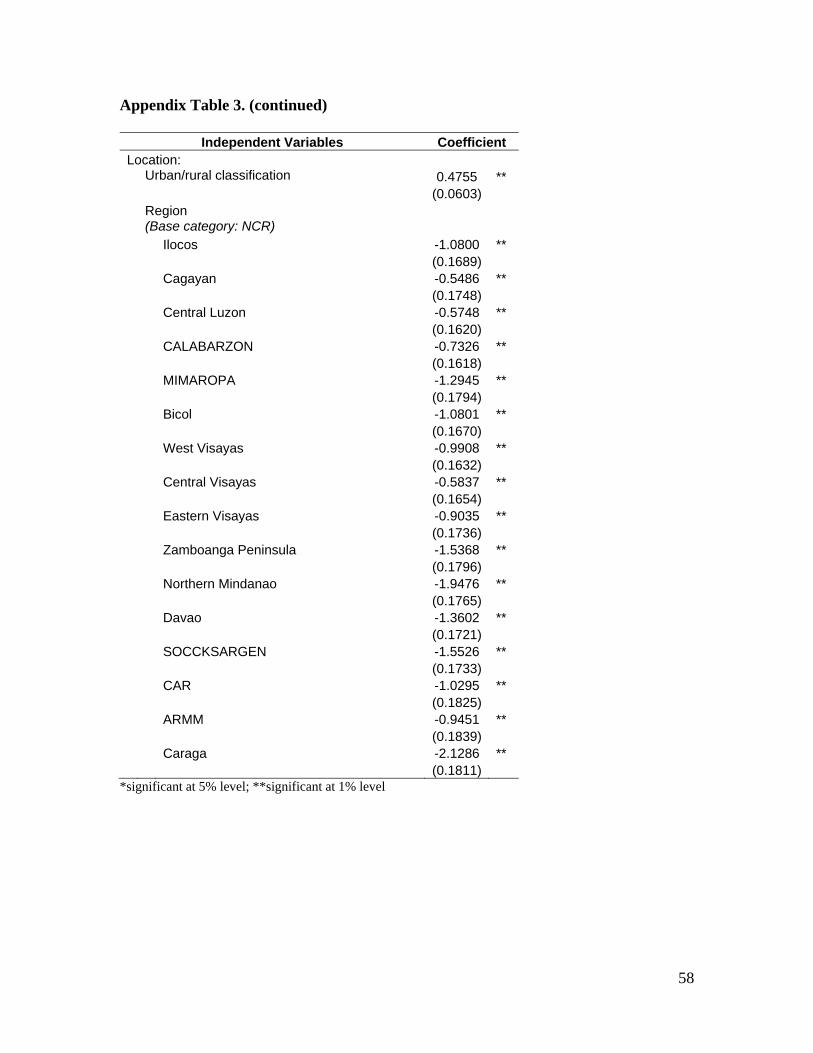
58
Appendix Table 3. (continued)
Independent Variables Coefficient Location:
Urban/rural classification 0.4755 ** (0.0603)Region (Base category: NCR)
Ilocos -1.0800 ** (0.1689)
Cagayan -0.5486 ** (0.1748)
Central Luzon -0.5748 ** (0.1620)
CALABARZON -0.7326 ** (0.1618)
MIMAROPA -1.2945 ** (0.1794)
Bicol -1.0801 ** (0.1670)
West Visayas -0.9908 ** (0.1632)
Central Visayas -0.5837 ** (0.1654)
Eastern Visayas -0.9035 ** (0.1736)
Zamboanga Peninsula -1.5368 ** (0.1796)
Northern Mindanao -1.9476 ** (0.1765)
Davao -1.3602 ** (0.1721)
SOCCKSARGEN -1.5526 ** (0.1733)
CAR -1.0295 ** (0.1825)
ARMM -0.9451 ** (0.1839)
Caraga -2.1286 ** (0.1811)
*significant at 5% level; **significant at 1% level
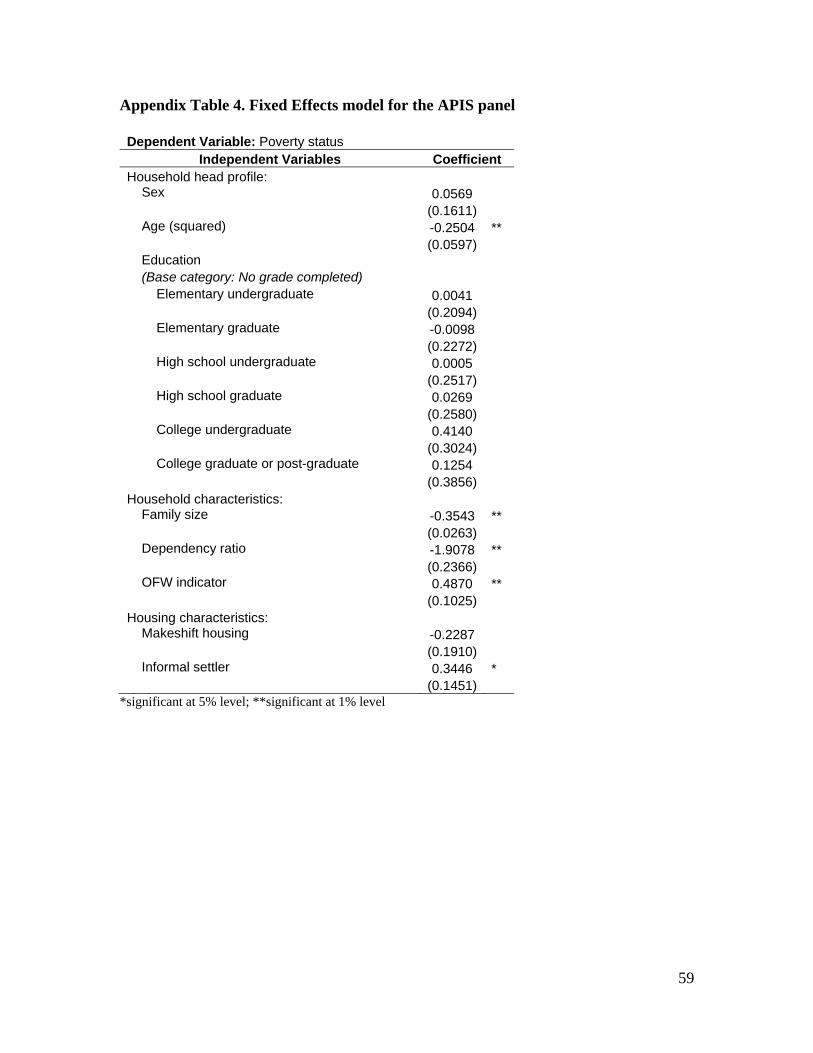
59
Appendix Table 4. Fixed Effects model for the APIS panel Dependent Variable: Poverty status
Independent Variables Coefficient Household head profile:
Sex 0.0569 (0.1611)Age (squared) -0.2504 ** (0.0597)Education (Base category: No grade completed) Elementary undergraduate 0.0041 (0.2094) Elementary graduate -0.0098 (0.2272) High school undergraduate 0.0005 (0.2517) High school graduate 0.0269 (0.2580) College undergraduate 0.4140 (0.3024) College graduate or post-graduate 0.1254 (0.3856)
Household characteristics: Family size -0.3543 ** (0.0263)Dependency ratio -1.9078 ** (0.2366)OFW indicator 0.4870 ** (0.1025)
Housing characteristics: Makeshift housing -0.2287 (0.1910)Informal settler 0.3446 * (0.1451)
*significant at 5% level; **significant at 1% level
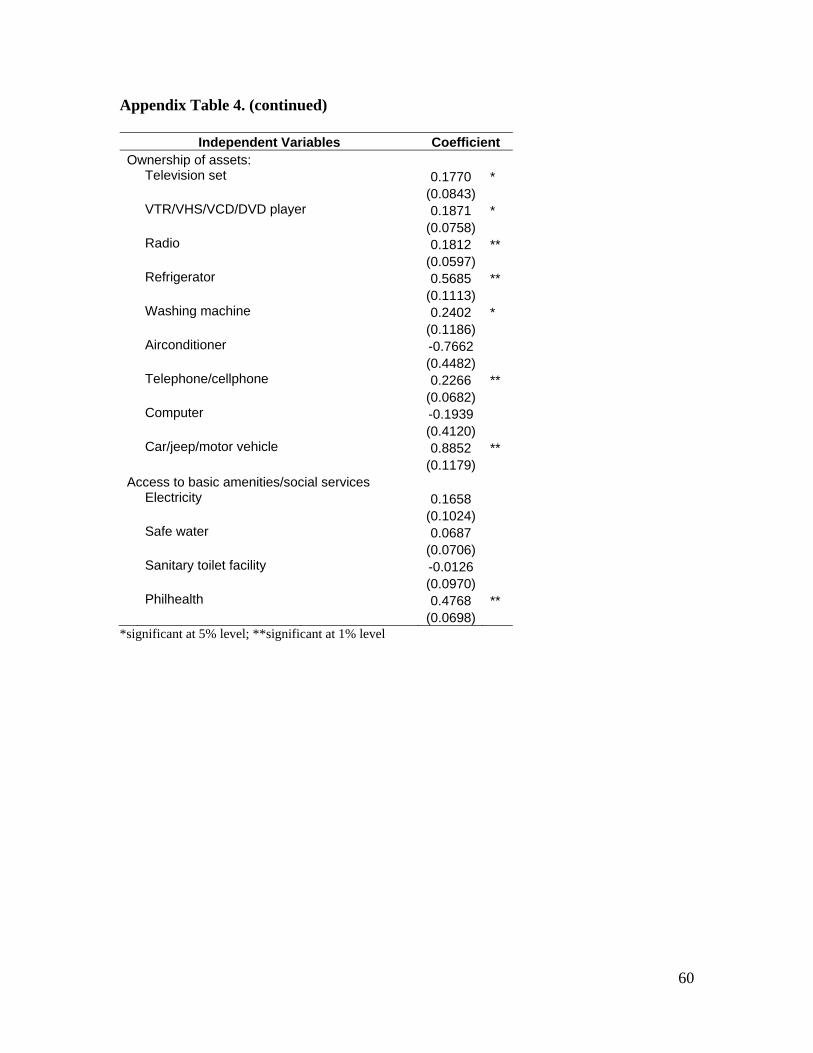
60
Appendix Table 4. (continued)
Independent Variables Coefficient Ownership of assets:
Television set 0.1770 * (0.0843)VTR/VHS/VCD/DVD player 0.1871 * (0.0758)Radio 0.1812 ** (0.0597)Refrigerator 0.5685 ** (0.1113)Washing machine 0.2402 * (0.1186)Airconditioner -0.7662 (0.4482)Telephone/cellphone 0.2266 ** (0.0682)Computer -0.1939 (0.4120)Car/jeep/motor vehicle 0.8852 ** (0.1179)
Access to basic amenities/social services Electricity 0.1658 (0.1024)Safe water 0.0687 (0.0706)Sanitary toilet facility -0.0126 (0.0970)Philhealth 0.4768 **
(0.0698) *significant at 5% level; **significant at 1% level

61
Appendix Table 5. Random Effects model for the 5-year panel Dependent Variable: Poverty status
Independent Variables Coefficient Constant term 2.3291
(0.2649)Household head profile:
Sex -0.2472 ** (0.0710)Age (squared) -0.0557 ** (0.0200)Education (Base category: No grade completed) Elementary undergraduate 0.2619 * (0.1117) Elementary graduate 0.4576 ** (0.1170) High school undergraduate 0.7130 ** (0.1252) High school graduate 0.9311 ** (0.1252) College undergraduate 1.5006 ** (0.1454) College graduate or post-graduate 2.0906 ** (0.1858)
Household characteristics: Family size -0.3978 ** (0.0122)Dependency ratio -2.8652 ** (0.1213)OFW indicator 0.7335 ** (0.0645)
Housing characteristics: Makeshift housing 0.1691 (0.1346)Informal settler 0.1255 (0.0962)
*significant at 5% level; **significant at 1% level
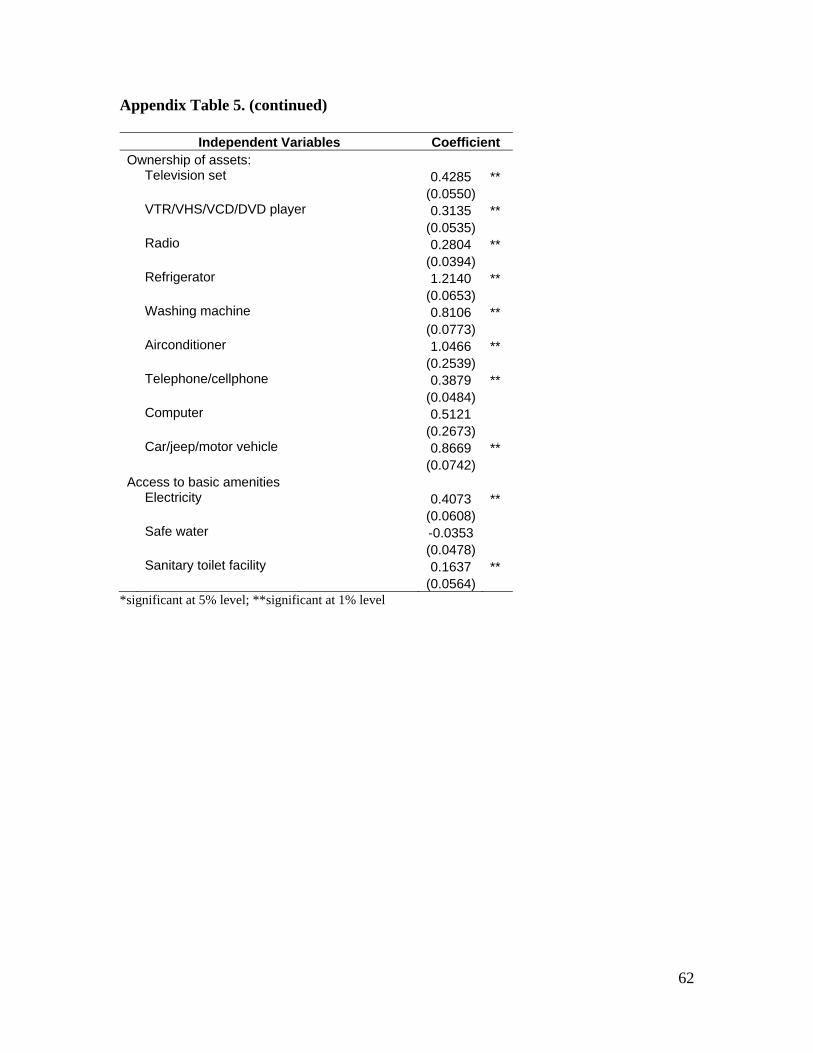
62
Appendix Table 5. (continued)
Independent Variables Coefficient Ownership of assets:
Television set 0.4285 ** (0.0550)VTR/VHS/VCD/DVD player 0.3135 ** (0.0535)Radio 0.2804 ** (0.0394)Refrigerator 1.2140 ** (0.0653)Washing machine 0.8106 ** (0.0773)Airconditioner 1.0466 ** (0.2539)Telephone/cellphone 0.3879 ** (0.0484)Computer 0.5121 (0.2673)Car/jeep/motor vehicle 0.8669 ** (0.0742)
Access to basic amenities Electricity 0.4073 ** (0.0608)Safe water -0.0353 (0.0478)Sanitary toilet facility 0.1637 ** (0.0564)
*significant at 5% level; **significant at 1% level
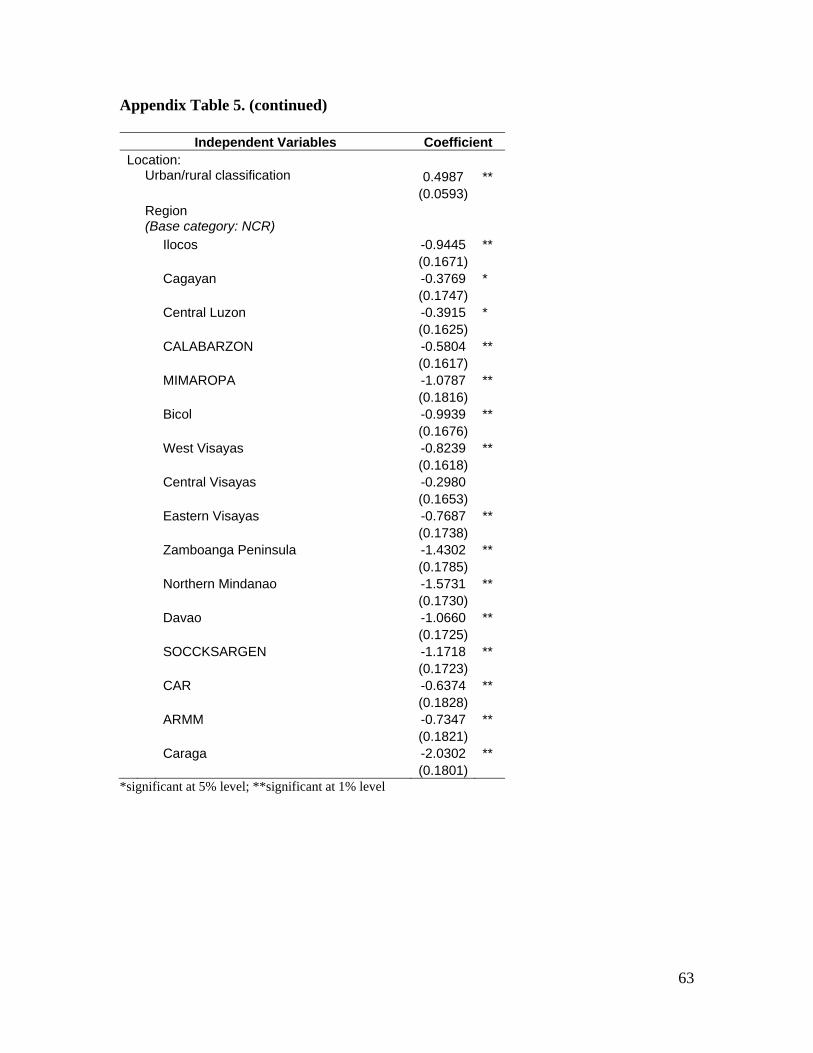
63
Appendix Table 5. (continued)
Independent Variables Coefficient Location:
Urban/rural classification 0.4987 ** (0.0593)Region (Base category: NCR)
Ilocos -0.9445 ** (0.1671)
Cagayan -0.3769 * (0.1747)
Central Luzon -0.3915 * (0.1625)
CALABARZON -0.5804 ** (0.1617)
MIMAROPA -1.0787 ** (0.1816)
Bicol -0.9939 ** (0.1676)
West Visayas -0.8239 ** (0.1618)
Central Visayas -0.2980 (0.1653)
Eastern Visayas -0.7687 ** (0.1738)
Zamboanga Peninsula -1.4302 ** (0.1785)
Northern Mindanao -1.5731 ** (0.1730)
Davao -1.0660 ** (0.1725)
SOCCKSARGEN -1.1718 ** (0.1723)
CAR -0.6374 ** (0.1828)
ARMM -0.7347 ** (0.1821)
Caraga -2.0302 ** (0.1801)
*significant at 5% level; **significant at 1% level
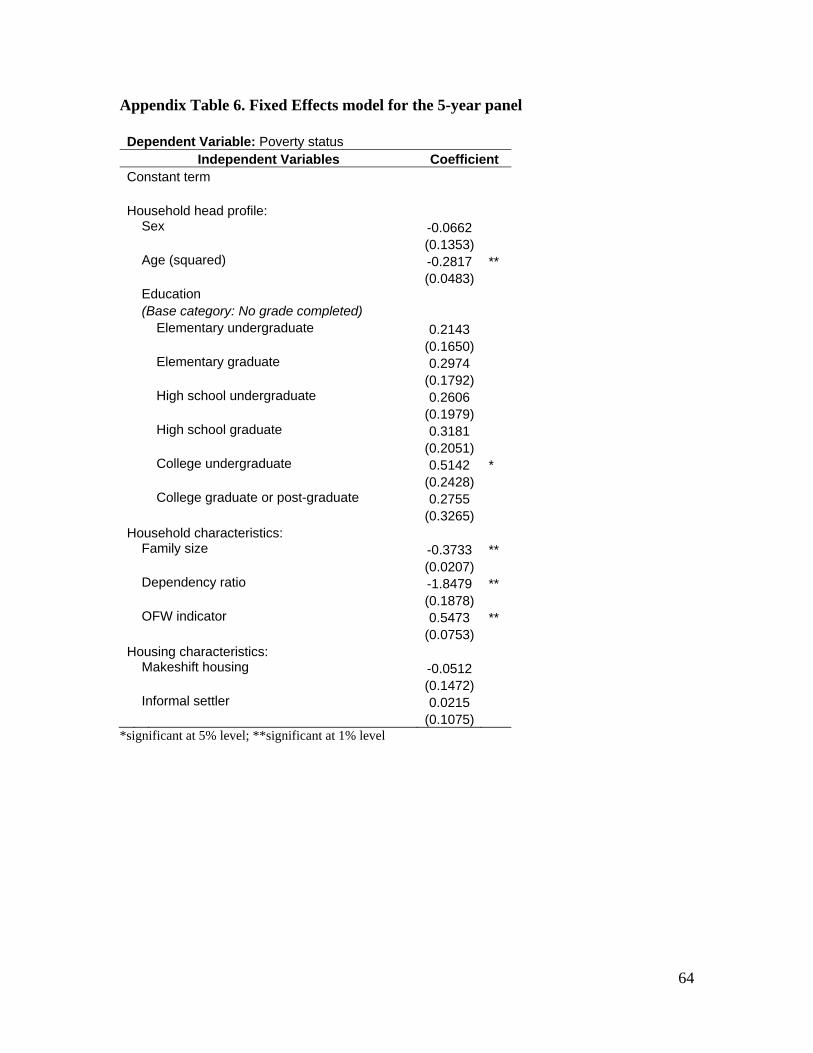
64
Appendix Table 6. Fixed Effects model for the 5-year panel Dependent Variable: Poverty status
Independent Variables Coefficient Constant term
Household head profile: Sex -0.0662 (0.1353)Age (squared) -0.2817 ** (0.0483)Education (Base category: No grade completed) Elementary undergraduate 0.2143 (0.1650) Elementary graduate 0.2974 (0.1792) High school undergraduate 0.2606 (0.1979) High school graduate 0.3181 (0.2051) College undergraduate 0.5142 * (0.2428) College graduate or post-graduate 0.2755 (0.3265)
Household characteristics: Family size -0.3733 ** (0.0207)Dependency ratio -1.8479 ** (0.1878)OFW indicator 0.5473 ** (0.0753)
Housing characteristics: Makeshift housing -0.0512 (0.1472)Informal settler 0.0215 (0.1075)
*significant at 5% level; **significant at 1% level
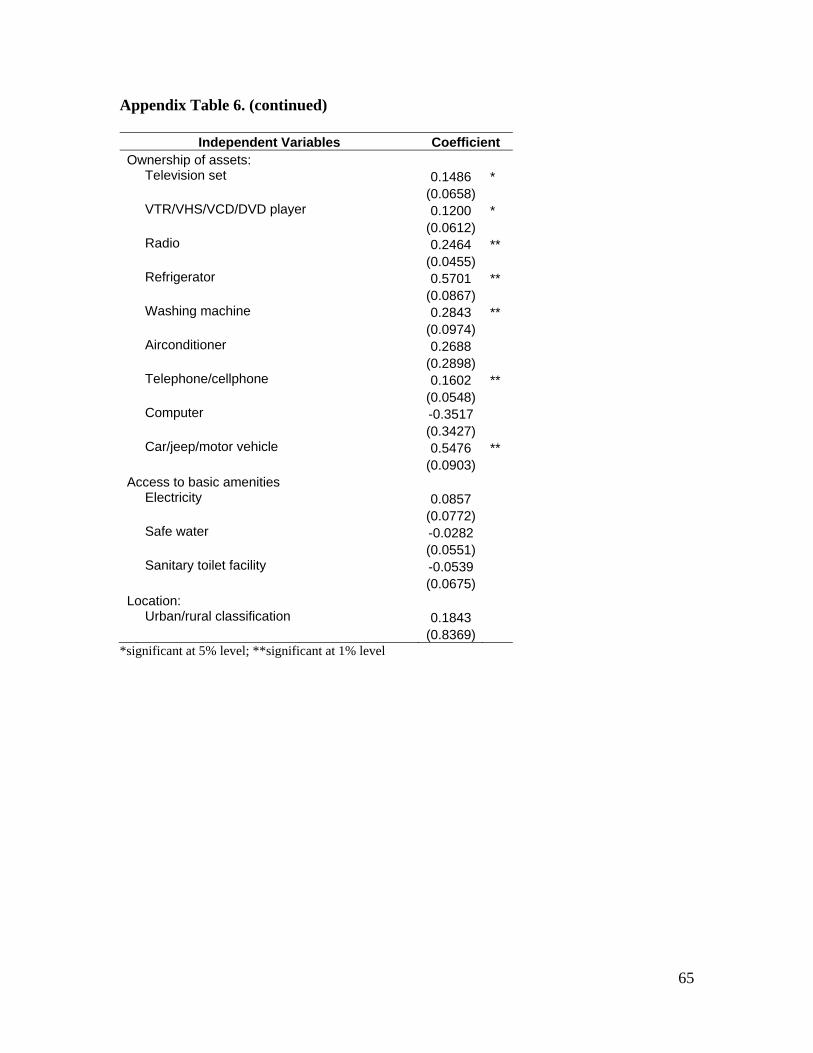
65
Appendix Table 6. (continued)
Independent Variables Coefficient Ownership of assets:
Television set 0.1486 * (0.0658)VTR/VHS/VCD/DVD player 0.1200 * (0.0612)Radio 0.2464 ** (0.0455)Refrigerator 0.5701 ** (0.0867)Washing machine 0.2843 ** (0.0974)Airconditioner 0.2688 (0.2898)Telephone/cellphone 0.1602 ** (0.0548)Computer -0.3517 (0.3427)Car/jeep/motor vehicle 0.5476 ** (0.0903)
Access to basic amenities Electricity 0.0857 (0.0772)Safe water -0.0282 (0.0551)Sanitary toilet facility -0.0539 (0.0675)
Location: Urban/rural classification 0.1843
(0.8369) *significant at 5% level; **significant at 1% level