Embed Size (px)
Citation preview

Independent Report to the Murray-Darling Basin Ministerial Council19 January 2018 | Final Report
Opportunities to recover 450GL in additional environmental water through efficiency measures by 2024, with neutral or positive socio-economic impacts
Analysis of efficiency measures in the Murray-Darling Basin

Ernst & Young121 Marcus Clarke StreetCanberra ACT 2600 Australia
GPO Box 281 Canberra ACT 2601
Tel: +61 2 6267 3888Fax: +61 2 6246 1500ey.com/au
Analysis of efficiency measures in the Murray-Darling Basin - Opportunities to recover 450GL in additional environmental water through efficiency measures by 2024, with neutral or positive socio-economic impacts
Dear Murray-Darling Basin Ministerial Council,
Attached is Ernst and Young’s (“EY”) Independent Report, as commissioned by the Department of Agriculture and Water Resources(“DAWR”), analysing efficiency measures in the Murray-Darling Basin relevant to the delivery 450GL of additional water by 2024, as envisaged in the Basin Plan. DAWR commissioned this report on behalf of the Murray-Darling Basin Ministerial Council (“the Council”), which has a policy, decision-making and advisory role in water resource management in the Murray-Darling Basin.
Our report makes a number of observations and recommendations for moving forward. If adopted, and giving consideration to theidentified risks, we believe the 450GL can be delivered with neutral or positive socio-economic impacts. We strongly advise a collaborative and united approach, to ensure communities and industries are an integral part of the ongoing journey.
As you know, the Murray-Darling Basin extends across 1 million square kilometres over four states and one territory, with over 2.11 million people living in the Basin and using the water resource. In 2014-15, the Basin produced $7.0 billion worth of irrigated agricultural output, forming an integral part of Australia’s economy, society, and environment.
The 2012 Basin Plan, as part of the Water Act 2007, was enacted to achieve a healthy and working Murray-Darling Basin and address an identified over-allocation of water rights. The Plan requires 2680GL to be recovered from the 2009 baseline diversion limit.
As per our Terms of Reference, this report provides advice to the Murray-Darling Basin Ministerial Council on the recovery of 450GL in additional environmental water through efficiency measures, with neutral or improved socio-economic outcomes, to enhance the environmental outcomes that can be achieved by the Basin Plan. The report advises on:
► How to design, target and resource efficiency measures to recover 450GL of water by 2024, with neutral or improved socio-economic outcomes
► The potential socio-economic impacts arising from efficiency measures at a range of scales, including socio-economic concerns that go beyond the specific legal requirements of the Basin Plan
► The extent to which adverse socio-economic impacts could be negated through further refinements to efficiency measures program design, existing Commonwealth programs and further opportunities for Commonwealth-funded activities in support of broader regional development.
The logic and sequence of the chapters in our report is designed to introduce the reader to the Basin, before outlining the potential socio-economic impacts of efficiency measures, the principles of program design, identifying the opportunities and assessing costs, the principles for negating adverse impacts; and ultimately, discussing the design of a program to successfully achieve the 450GL with neutral socio-economic impacts.
Murray-Darling Ministerial Council
C/- The Department of Agriculture and Water Resources
18 Marcus Street, Canberra ACT 2601 19th January 2018

Ernst & Young121 Marcus Clarke StreetCanberra ACT 2600 Australia
GPO Box 281 Canberra ACT 2601
Tel: +61 2 6267 3888Fax: +61 2 6246 1500ey.com/au
Analysis of efficiency measures in the Murray-Darling Basin - Opportunities to recover 450GL in additional environmental water through efficiency measures by 2024, with neutral or positive socio-economic impacts
In preparing this report, we engaged extensively with stakeholders from across the Basin. These included industry representatives, independent experts, irrigators, irrigation infrastructure operators, peak bodies (including environmental and indigenous groups), local businesses, local councils, social enterprises delivery partners (of efficiency measures), government departments (Commonwealth State and Territory), Ministers and water delivery bodies.
As we acknowledge throughout the report, many stakeholders hold different views, have had varied experiences, and have all been impacted by a mix of factors in recent years. We believe that our engagement with them, combined with our evidence-based approach, has been critical in providing the required independent, balanced and objective findings contained in this report. We sincerely appreciate their input and thank them for their contribution.
We have also drawn on the extensive knowledge and experience of an Advisory Panel, consisting of experts in irrigation networks,social and economic analysis, regional development and program design. Further, over the course of the project we have workedclosely with your Basin Officials Committee (BOC). Multiple workshops and one-on-one meetings were held with the Advisory Panel and the BOC to seek information, discuss analysis and test findings. Our Draft Report was provided to the Advisory Panel and BOCfor comment, with their feedback informing this Final Report. Their invaluable perspectives, feedback and support has provided an immense contribution, and we thank them for their time and effort.
In undertaking the analysis, in addition to our own research, we have relied on input from the above stakeholders and data, information and evidence that they have provided to us. It is important however to acknowledging a number of limitations withrespect to this data. Firstly there has been limited data collection that allows insights into the specific socio-economic impacts associated with water efficiency measures and further data needs to be collected to monitor impacts, particularly in relation to labour productivity and employment impacts. Secondly, data is collected inconsistently between different programs and there is not acentralised database across all programs. As such the analysis of the historic cost of efficiency measures has been limited to specific programs where data was available. In relation to the consideration of opportunities, analysis of the individual characteristics and limitations of each individual catchment (e.g., liquidity of the water market) was not able to be undertaken in the time available. We have therefore relied on input from state jurisdictions to inform this analysis. Additional analysis is required to determine the potential implications of unique circumstances and/or considerations.
To address these limitations we recommend that there needs to be a greater focus on centrally collecting information and data specifically relating to water efficiency measures. This is required to better understand the socio-economic impacts of water efficiency measures, the economics of participation, the associated value for money implications and risks in achieving the program within the required statutory budget.
Murray-Darling Ministerial Council
C/- The Department of Agriculture and Water Resources
18 Marcus Street, Canberra ACT 2601 19th January 2018
Ernst & Young121 Marcus Clarke StreetCanberra ACT 2600 Australia
GPO Box 281 Canberra ACT 2601
Tel: +61 2 6267 3888Fax: +61 2 6246 1500ey.com/au
Analysis of efficiency measures in the Murray-Darling Basin - Opportunities to recover 450GL in additional environmental water through efficiency measures by 2024, with neutral or positive socio-economic impacts
We would like to thank the many stakeholders who contributed to this report; our Advisory Panel; the relevant Commonwealth Stateand Territory Officials; the Ministerial Council; and our EY colleagues who assisted with developing this report. Their time, views and advice, have been critical in developing this report, and helping us to identify a way forward for all.
Yours sincerely
Andrew Metcalfe AO Kevin Werksman
Partner Partner
Murray-Darling Ministerial Council
C/- The Department of Agriculture and Water Resources
18 Marcus Street, Canberra ACT 2601 19th January 2018

Analysis of efficiency measures in the Murray-Darling Basin: Opportunities to recover 450GL in additional environmental water through efficiency measures by 2024, with neutral or positive socio-economic impacts | Page 5 of 307
19 January 2018 | Final Report
DashboardTable of contents
1 Terms of reference 7 Opportunities for efficiency ...2 Glossary 8 Cost of efficiency measures3 Executive summary 9 Principles for negating adv ...4 Introduction 10 A program to achieve 450 ...5 Potential socio-economic ... 11 Appendices6 Program design
Chapter Page
1. Terms of Reference 7
2. Glossary 10
3. Executive Summary 16
4. Introduction 46
5. Potential socio-economic impacts of efficiency measures 57
6. Program Design 137
7. Opportunities for efficiency projects 151
8. Cost of efficiency measures 179
9. Principles for negating adverse socio-economic impacts 200
10. A program to achieve 450GL with neutral socio-economic impacts 210
11. Appendices 243

Ernst & Young121 Marcus Clarke StreetCanberra ACT 2600 AustraliaGPO Box 281 Canberra ACT 2601
Tel: +61 2 6267 3888Fax: +61 2 6246 1500ey.com/au
NOTICEErnst & Young (EY) was engaged on the instructions of the Commonwealth Department of Agriculture and Water Resources (“the Department”) to conduct an analysis of efficiency measures, in accordance with the order of services dated 18 July 2017, to inform a decision by the Murray-Darling Basin Ministerial council.
The results of Ernst & Young’s work, including the assumptions and qualifications made in preparing the report, are set out in EY's final report dated 22 December 2017("Report"). The Report should be read in its entirety including this public release notice, the applicable scope of the work and any limitations. A reference to the Report includes any part of the Report. No further work has been undertaken by EY since the date of the Report to update it.
EY has prepared the Report for the benefit of the department and has considered only the interests of the department. EY has not been engaged to act, and has not acted, as advisor to any other party. Accordingly, EY makes no representations as to the appropriateness, accuracy or completeness of the Report for any other party's purposes.
The Report has been constructed based on information current as of 08 November 2017 (being the date of completion of the data collection), and which has been provided by the Client and other stakeholders. Since this date, material events may have occurred since completion which are not reflected in the Report.
No reliance may be placed upon the Report or any of its contents by any recipient of the Report for any purpose and any party receiving a copy of the Report must make and rely on their own enquiries in relation to the issues to which the Report relates, the contents of the Report and all matters arising from or relating to or in any way connected with the Report or its contents.
EY disclaims all responsibility to any other party for any loss or liability that the other party may suffer or incur arising from or relating to or in any way connected with the contents of the Report, the provision of the Report to the other party or the reliance upon the Report by the other party.
No claim or demand or any actions or proceedings may be brought against EY arising from or connected with the contents of the Report or the provision of the Report to any party. EY will be released and forever discharged from any such claims, demands, actions or proceedings.
EY has prepared this analysis in conjunction with, and relying on information provided by the Client and other industry stakeholders. We do not imply, and it should not be construed, that we have performed audit or due diligence procedures on any of the information provided to us. We have not independently verified, or accept any responsibility or liability for independently verifying, any such information nor do we make any representation as to the accuracy or completeness of the information. We accept no liability for any loss or damage, which may result from your reliance on any research, analyses or information so supplied.
EY have consented to the Report being published electronically on the Department website for informational purposes only. EY have not consented to distribution or disclosure beyond this. The material contained in the Report, including the EY logo, is copyright and copyright in the Report itself vests in Department. The Report, including the EY logo, cannot be altered without prior written permission from EY.
It is important to note that the identification of economic impact and contribution is not a precise science.
Liability limited under a scheme approved under Professional Standards Legislation.

Analysis of efficiency measures in the Murray-Darling Basin: Opportunities to recover 450GL in additional environmental water through efficiency measures by 2024, with neutral or positive socio-economic impacts | Page 7 of 307
Terms of reference
1
In this section Page
Terms of reference 8
Analysis of efficiency measures in the Murray-Darling Basin: Opportunities to recover 450GL in additional environmental water through efficiency measures by 2024, with neutral or positive socio-economic impacts | Page 8 of 307
19 January 2018 | Final Report
Terms of Reference for Analysis of Efficiency Measures(Extracted from the COAG Plan agreed by the Ministerial Council, 17 March 2017)PurposeTo provide advice to the Murray-Darling Basin Ministerial Council on the recovery of 450GL in additional environmental water through efficiency measures, with neutral or beneficial socio-economic outcomes, to enhance the environmental outcomes that can be achieved by the Basin Plan, consistent with the Basin Plan, Part 2AA of the Water Act (2007) (the Act), and the terms of the 2013 Intergovernmental Agreement on Implementing Water Reform in the Murray-Darling Basin. This advice is to be considered in the context of the implementation of the Basin Plan to date.As far as is practical the economic analysis should incorporate case studies with examples from previous programs, identifying other factors impacting on communities.ScopeThe Ministerial Council seeks advice on how to recover 450GL of water from efficiency measures by 2024 with neutral or improved socio-economic outcomes within the legal framework of the Basin Plan and Water for the Environment Special Account. Specific advice is sought on:1. How to design, target and resource efficiency measures to recover 450GL of water
by 2024, with neutral or improved socio-economic outcomes, including:a. Scope and timing for efficiency measures to be administered in ways that do
not impede current efforts to bridge the SDL gap under the Basin Plan by30 June 2019.
b. Whether the funding multiple provided to program participants is sufficient to attract genuine interest (noting provisions for reviews of progress under section 86AJ of the Act) and what the multiple should be
c. Whether the design of the program is robust to ensure that participants are not able to gain an unfair advantage through subsequent market participation
d. Opportunities for greater flexibility for the types of measures eligible to receive funding in return for water savings
e. Opportunities for an increased focus on urban water efficiencies
f. Opportunities for integrated program design to better align assistance for irrigation infrastructure operators with the delivery of efficiency measures on-farm and reduce the cost of supply
g. Opportunities for off-farm infrastructure worksh. How notified efficiency measures may be improvedi. The anticipated cost of recovering 450GL of water through efficiency
measures, consistent with statutory requirements, andj. Any other activities that have not been investigated that could provide an
efficiency contribution.2. The potential socio-economic impacts arising from efficiency measures at a range
of scales, including socio-economic concerns that go beyond the specific legal requirements of the Basin Plan, and on strategies that may be required to ensure neutral or improved socio-economic outcomes. The impacts and concerns associated with the recovery of 450GL may include:a. The net impact of on-farm efficiency measures on the viability and productivity
of irrigation districtsb. The impact of efficiency measures on employment opportunities in basin
communitiesc. The impact of efficiency measures on the temporary and permanent water
markets, andd. Consideration of any other information to ensure a comprehensive analysis of
cumulative socio-economic impacts3. The extent to which adverse socio-economic impacts could be negated through
a. Further refinements to efficiency measures program design to maximise socio-economic benefits
b. Existing Commonwealth programs, andc. Any further opportunities for Commonwealth-funded activities in support of
broader regional development.4. The advice must take into account information arising from the Murray-Darling
Basin Authority’s evaluation of the social, economic and environmental outcomes of the implementation of the Basin Plan and any other relevant analysis such as studies by State governments.
Terms of reference1 Terms of reference 1 Terms of reference 7 Opportunities for efficiency ...
2 Glossary 8 Cost of efficiency measures3 Executive summary 9 Principles for negating adv ...4 Introduction 10 A program to achieve 450 ...5 Potential socio-economic ... 11 Appendices6 Program design

Analysis of efficiency measures in the Murray-Darling Basin: Opportunities to recover 450GL in additional environmental water through efficiency measures by 2024, with neutral or positive socio-economic impacts | Page 9 of 307
19 January 2018 | Final Report
EY has addressed the Terms of Reference throughout the report as follows:
Terms of reference1 Terms of reference
Terms of Reference Chapter (Chp.)
1. How to design, target and resource efficiency measures to recover 450GL of water by 2024, with neutral or improved socio-economic outcomes, including:
Chp. 6,7,8 and 10
1.a scope and timing for efficiency measures to be administered in ways that do not impede current efforts to bridge the SDL gap under the Basin Plan by30 June 2019
Chp. 3 and 10
1.b whether the funding multiple provided to program participants is sufficient to attract genuine interest (noting provisions for reviews of progress under section 86AJ of the Act) and what the multiple should be
Chp. 8
1.c whether the design of the program is robust to ensure that participants are not able to gain an unfair advantage through subsequent market participation Chp. 6
1.d opportunities for greater flexibility for the types of measures eligible to receive funding in return for water savings Chp. 6 and 10
1.e opportunities for an increased focus on urban water efficiencies Chp. 7
1.f opportunities for integrated program design to better align assistance for irrigation infrastructure operators with the delivery of efficiency measures on-farm and reduce the cost of supply
Chp. 7
1.g opportunities for off-farm infrastructure works Chp. 7
1.h how notified efficiency measures may be improved Chp. 6
1.i the anticipated cost of recovering 450GL of water through efficiency measures, consistent with statutory requirements Chp. 8
1.j any other activities that have not been investigated that could provide an efficiency contribution. Chp. 6
2. The potential socio-economic impacts arising from efficiency measures at a range of scales, including socio-economic concerns that go beyond the specific legal requirements of the Basin Plan, and on strategies that may be required to ensure neutral or improved socio-economic outcomes. The impacts and concerns associated with the recovery of 450GL may include:
Chp. 5
2.a the net impact of on-farm efficiency measures on the viability and productivity of irrigation districts
Terms of Reference Chapter
2.b the impact of efficiency measures on employment opportunities in basin communities
Chp. 52.c the impact of efficiency measures on the temporary and permanent water markets
2.d consideration of any other information to ensure a comprehensive analysis of cumulative socio-economic impacts
3. The extent to which adverse socio-economic impacts could be negated through:
Chp. 9 and 10
3.a further refinements to efficiency measures program design to maximise socio-economic benefits
3.b existing Commonwealth programs
3.c any further opportunities for Commonwealth-funded activities in support of broader regional development.
4. The advice must take into account information arising from the Murray-Darling Basin Authority’s evaluation of the social, economic and environmental outcomes of the implementation of the Basin Plan and any other relevant analysis such as studies by State governments.
Chp.4 and throughout
1 Terms of reference 7 Opportunities for efficiency ...2 Glossary 8 Cost of efficiency measures3 Executive summary 9 Principles for negating adv ...4 Introduction 10 A program to achieve 450 ...5 Potential socio-economic ... 11 Appendices6 Program design

Analysis of efficiency measures in the Murray-Darling Basin: Opportunities to recover 450GL in additional environmental water through efficiency measures by 2024, with neutral or positive socio-economic impacts | Page 10 of 307
Glossary
2
In this section Page
Acronyms and Abbreviations 11
Glossary 12
Analysis of efficiency measures in the Murray-Darling Basin: Opportunities to recover 450GL in additional environmental water through efficiency measures by 2024, with neutral or positive socio-economic impacts | Page 11 of 307
19 January 2018 | Final Report
Acronyms and Abbreviations2 Glossary
ABARES Australian Bureau of Agriculture Resource Economics and SciencesABS Australian Bureau of StatisticsACCC Australian Competition and Consumer CommissionACT Australian Capital TerritoryBOC Basin Officials CommitteeBoM Bureau of Meteorology CEWH Commonwealth Environmental Water HolderCMA Catchment Management AuthorityCOAG Council of Australian GovernmentsCOFFIE Commonwealth On-Farm Further Irrigation Efficiency ProgramCSIRO Commonwealth Scientific and Industrial Research OrganisationDAF Department of Agriculture and Fisheries (QLD)DAWR Department of Agriculture and Water Resources (Commonwealth)DEE Department of Environment and Energy (Commonwealth)DELWP Department of Environment, Land, Water and Planning (VIC)DEWNR Department of Environment, Water and Natural Resources (SA)
DIRDDepartment of Infrastructure and Regional Development (Commonwealth)
DIIS Department of Industry, Innovation and Science (Commonwealth)DPI Department of Primary Industries (NSW)DRET Department of Resources, Energy and Tourism (Commonwealth)GMID Goulburn-Murray Irrigation DistrictGMW Goulburn Murray WaterHHWUE Healthy HeadWaters Water Use Efficiency project HRWS High reliability water shareIIO Irrigation infrastructure operatorLMW Lower Murray WaterIVT Inter-valley TradeIVA Industry value added
LTAAY long-term average annual yieldOCED Organisation for Economic Co-operation and DevelopmentOFIEP On-Farm Irrigation Efficiency ProgramPIIOP Private Irrigation Infrastructure Operators ProgramMDB Murray-Darling BasinMDBA Murray-Darling Basin AuthorityMI Murrumbidgee IrrigationMIL Murray Irrigation Limited
MINCOMinisterial Council (referenced in this report as the Murray-Darling Basin Ministerial Council)
NPV Net present valueNRM Natural Resource ManagementNSW New South WalesNWI National Water InitiativeQLD QueenslandR&D Research and developmentRDA Regional Development AustraliaSA South AustraliaSARMS South Australian River Murray Sustainability ProgramSDL Sustainable Diversion LimitSEFIA Socio-Economic Indexes for AreasSTEM Science, Technology, Engineering and MathsSTBIFM Sustaining the Basin: Irrigation Farm Modernisation programVIC VictoriaVicCI Victorian Climate InitiativeVWAP Volume weighted average priceWESA Water from the Environment Special AccountWDR Water delivery right
1 Terms of reference 7 Opportunities for efficiency ...2 Glossary 8 Cost of efficiency measures3 Executive summary 9 Principles for negating adv ...4 Introduction 10 A program to achieve 450 ...5 Potential socio-economic ... 11 Appendices6 Program design

Analysis of efficiency measures in the Murray-Darling Basin: Opportunities to recover 450GL in additional environmental water through efficiency measures by 2024, with neutral or positive socio-economic impacts | Page 12 of 307
19 January 2018 | Final Report
Glossary2 Glossary
Term DefinitionAquifer A geological formation which holds and allows for the flow of groundwater.Allocation The specific volume of water issued to access existing water entitlements in a given water accounting period.Barmah Choke A geographical constriction of the River Murray near Barmah. This narrow stretch of river restricts the delivery of water
entitlements (for private or public means). Barrages (as specific to the MDB) Five low and wide weirs built at the Murray Mouth in South Australia to reduce the amount of sea water flowing in and out
of the mouth due to tidal movement, and to help control water levels in the Lower Lakes and River Murray below Lock 1 (Blanchetown, South Australia).
Basin Diversion Limit (BDL) The sum of measured long-term average annual water diversions.Basin States For the purposes of the Basin Plan, the Basin States are defined in the Water Act 2007 as New South Wales, Victoria,
Queensland, South Australia and the Australian Capital Territory.Buyback The sale of water entitlement to the government from willing sellers.Carryover A way to manage water resources and allocations that allows irrigators to take a portion of unused water from one season
into the next irrigation season.Catchment Management Authorities Authorities established to manage regional and catchment planning, and waterway, floodplain, salinity and water quality
management in Victoria.Consumptive use Use of water for irrigation, industry, urban, stock and domestic use, or for other private consumptive purposes.Constraint measures A constraint is anything that affects the delivery of environmental water. It can include physical aspects such as low lying
bridges, or river channel capacity, but can also include operational aspects such as river rules or operating practices that impact on when and how much water can be delivered. Constraints measures are aimed at improving how effectively environmental water can be managed and delivered by addressing these physical and operational constraints.
Conveyance loss Loss of water in delivery to farms, for instance, due to evaporation or seepage in an irrigation distribution system.Decoupling The separation of traditional water and land rights.Delivery partner Private or public organisation who may aid the entity giving up water in applying for the program, implementing and
educating them on the best use of the program. Depending on the program, the delivery partner may have to be pre-selected by the government.
Desalination The process of removing salt from seawater.
1 Terms of reference 7 Opportunities for efficiency ...2 Glossary 8 Cost of efficiency measures3 Executive summary 9 Principles for negating adv ...4 Introduction 10 A program to achieve 450 ...5 Potential socio-economic ... 11 Appendices6 Program design

Analysis of efficiency measures in the Murray-Darling Basin: Opportunities to recover 450GL in additional environmental water through efficiency measures by 2024, with neutral or positive socio-economic impacts | Page 13 of 307
19 January 2018 | Final Report
Glossary2 Glossary
Term DefinitionEfficiency Measure Means to increase productivity of water delivery. This could include replacing or upgrading on-farm irrigation or lining
channels to reduce water losses within an irrigation network. Environmental flow Any river flow pattern provided with the intention of maintaining or improving river health.Environmental water An entitlement of water held by government bodies, to achieve environmental outcomes including benefits to ecosystem
functions, biodiversity, water quality and water resource health.Evapotranspiration Water transfer to the atmosphere through direct evaporation from a surface and transpiration for an organism.Extractive use Water extracted for human (consumptive, stock, irrigation) or environmental useFloodplain Land subjected to overflow during floods.Entitlement security The frequency with which water allocated under a water access entitlement is able to be supplied in full. Giga litre (GL) One billion (1,000,000,000) litres, or one thousand (1,000) mega litres.Greywater Household water which has not been contaminated by toilet discharge and can be reused for non-drinking purposesGroundwater Water held underground (subsurface) in the soil or in pores and crevices in rock.Irrigation district A district which supplies irrigation water to farms through a system of pumps, channels and/or pipelines managed by a self-
governing public corporation, a private company owned by irrigators or a cooperative with irrigator members.Irrigation Infrastructure Operator (IIO) A person (or entity) who owns or operates infrastructure (called water service infrastructure) for one or more of the
following purposes: storing, delivery, or draining water. For the purpose of providing a service to another person.Laser levelling A user guided precision levelling technique used for achieving very fine levelling with desired grade on an agricultural
paddock. Long-term annual average yield (LTAAY)
A defined approach used to standardise the calculation of expected water recoveries across state water access entitlement categories and across catchments within the Murray-Darling Basin.
Marginal user An irrigator whose farming enterprise operates with marginal profitabilityMega litre (ML) One million (1,000,000) litres.Millennium drought Drought in Australia extending from the mid-1990s to 2009, which was said to be the worst on record since European
settlement. An intense dry period with little rain, it adversely impacted communities, industries and the environment which relied on the Murray-Darling Basin to prosper.
Multiple Market analysis ratio used to determine the relative price of water when compared to other transactions and can be interpreted across different catchments and time periods. Multiples may be recognised as unweighted, funding weighted or volume weighted market multiples, with detailed definitions found within the body of the report.
1 Terms of reference 7 Opportunities for efficiency ...2 Glossary 8 Cost of efficiency measures3 Executive summary 9 Principles for negating adv ...4 Introduction 10 A program to achieve 450 ...5 Potential socio-economic ... 11 Appendices6 Program design

Analysis of efficiency measures in the Murray-Darling Basin: Opportunities to recover 450GL in additional environmental water through efficiency measures by 2024, with neutral or positive socio-economic impacts | Page 14 of 307
19 January 2018 | Final Report
Glossary2 Glossary
Term DefinitionRecycled water Water from sewerage systems or industry processes treated to a standard appropriate for its intended use.Reliability of supply Volume and frequency with which water is allocated to entitlement-holders or water users. Reserve policy Governs the balance between water allocated to entitlement-holders in a given year or kept in reserve for the following
year.Reservoir Natural or artificial dam or lake used for the storage of water.Residential use Water to be used in private housing.Reticulation The network of pipelines used to deliver water to end users.Run-off Precipitation or rainfall flowing from a catchment into streams, lakes, rivers or reservoirs.Salinity Amount of water-soluble salts present in the soil or in a stream.Stock and domestic water Water for domestic consumption and stock watering.Storm water Run-off from urban areas resulting from rainfall or snow.Stranded assets Infrastructure with too few customers to pay for its maintenance when it’s no longer required to deliver water entitlements,
due to their trade to other systems.Supply measures New ways to manage the Basin's rivers to more efficiently achieve outcomes for the environment. These can include: new
river operating rules that make environmental water delivery more effective; smarter ways to use dams, locks and weirs to reduce evaporation losses; and building innovative water management structures that deliver water more efficiently. The key aspect of supply measures, is that they allow equivalent environmental outcomes to be achieved with less held environmental water.
Surface water Includes water in a watercourse, lake or wetland, and any water flowing over or lying on the land after rain, or after havingrisen to the surface naturally from underground.
Sustainable Diversion Limit (SDL) The maximum long-term annual average quantities of water that can be taken, on a sustainable basis, from the Basin water resources as a whole, and the water resources, or particular parts of the water resources, of each water resource plan area.
‘Swiss Cheese’ effect Sections of an irrigation supply system which are not operating, resulting in an irrigation district where the landowner does not hold water entitlement or delivery shares.
Temporary trade Transfer of ownership of a seasonal allocation.Termination fee One-off payment by entitlement-holder as they surrender a delivery share. Commonly used as a mechanism to address
‘stranded assets’.
1 Terms of reference 7 Opportunities for efficiency ...2 Glossary 8 Cost of efficiency measures3 Executive summary 9 Principles for negating adv ...4 Introduction 10 A program to achieve 450 ...5 Potential socio-economic ... 11 Appendices6 Program design

Analysis of efficiency measures in the Murray-Darling Basin: Opportunities to recover 450GL in additional environmental water through efficiency measures by 2024, with neutral or positive socio-economic impacts | Page 15 of 307
19 January 2018 | Final Report
Glossary2 Glossary
Term DefinitionTranspiration Transfer of water into the atmosphere from an organism.Unbundling The separation of traditional rights into a water share, delivery share and a water use licence.Unregulated systems River systems with no large dams or weirs to regulate water flow.Water entitlement A perpetual or ongoing entitlement, by or under a law of a State, to exclusive access to a share of the water resources of a
water resource plan. Water entitlement-holder Individual or group holding a water entitlement.Water market Market in which entitlements and allocations are traded under certain conditions.Water share Legally recognised secure share of water available. It can be traded or leased on the water market.
1 Terms of reference 7 Opportunities for efficiency ...2 Glossary 8 Cost of efficiency measures3 Executive summary 9 Principles for negating adv ...4 Introduction 10 A program to achieve 450 ...5 Potential socio-economic ... 11 Appendices6 Program design
Analysis of efficiency measures in the Murray-Darling Basin: Opportunities to recover 450GL in additional environmental water through efficiency measures by 2024, with neutral or positive socio-economic impacts | Page 16 of 307
Executive summary
3
In this section Page
Key messages 17
Introduction 22
Approach 23
Stakeholder consultation findings 24
Socio-economic impacts and pathways 25
Opportunities for efficiency measures 30
Program cost 32
Program to recover 450GL with neutral or positive socio-economic impacts 34
Negating adverse impacts 37
Implementation 41
Risks and mitigation strategies 43
Conclusions 44
Overview 45

Analysis of efficiency measures in the Murray-Darling Basin: Opportunities to recover 450GL in additional environmental water through efficiency measures by 2024, with neutral or positive socio-economic impacts | Page 17 of 307
19 January 2018 | Final Report
Key messages3 Executive summary
Overarching
► There has been substantial change across the Basin in recent years. Global, national and Basin-specific socio-economic influences, such as fluctuating commodity prices, climate change, the Basin Plan, structural change and the water market, all contribute to the present Basin operating environment. Further implementation of the Basin Plan needs to be cognisant of these influences.
► Elements of the Basin Plan already implemented, specifically buybacks, large off-farm infrastructure modernisation programs and environmental watering events have had significant (positive and negative) impacts to date. Looking forward uncertainty in the management of environmental water including State watering plans and the management of constraints is also impacting stakeholders.
► Despite the efforts of Governments to date across the Basin there is diversity of views in relation to water recovery, a general a lack of clarity as to measures and objectives, no common language and an absence of trust. Stakeholders are experiencing fatigue from multiple consultation streams and have expressed a desire to discuss Basin Plan issues on a holistic basis and for deeper two-way engagement. To move forward there is a need to better engage with community and industry leaders, build greater trust and develop a social license.
► Notwithstanding a focus on data collection and research, there needs to be a greater focus on centrally collecting information and data specifically relating to water efficiency measures. This is required to better understand the socio-economic impacts of water efficiency measures, the economics of participation, the associated value for money implications and risks in achieving the program within the required statutory budget.
1 Terms of reference 7 Opportunities for efficiency ...2 Glossary 8 Cost of efficiency measures3 Executive summary 9 Principles for negating adv ...4 Introduction 10 A program to achieve 450 ...5 Potential socio-economic ... 11 Appendices6 Program design

Analysis of efficiency measures in the Murray-Darling Basin: Opportunities to recover 450GL in additional environmental water through efficiency measures by 2024, with neutral or positive socio-economic impacts | Page 18 of 307
19 January 2018 | Final Report
Key messages3 Executive summary
Socio-economic impacts
► Off-farm and urban projects generally generate positive socio-economic impacts. The key issue for off-farm and urban projects is ensuring that a whole of life assessment is taken to determine viability as evidenced by a positive net present value.
► Through undertaking on-farm projects participants experience positive socio-economic impacts. The exchange of water entitlements for funding for infrastructure investment enables improved water efficiency, enhances on-farm productivity and allows for the use of water savings retained by participants for production. There is a net benefit to industry through either enabling or bringing forward water efficiency upgrades, and this offsets the possible lost opportunity if industry was able to invest themselves in the future without support from the Commonwealth. On average, the analysis has indicated that approximately 23% of funding contributes to enhanced production.
► When considering impacts that go beyond the specific legal requirements of the Basin Plan:
► Infrastructure upgrades result in enhanced water efficiency and on-farm productivity for participants. As a result there is a potential for distributional impacts to arise if participants achieve a competitive advantage through participation in the program.
► The evidence gathered suggests that labour productivity impacts are likely to be limited, with the direct reduction in labour resulting from on-farm projects estimated to be small, and a positive impact through the generation of employment opportunities as a result of construction spending and future maintenance of infrastructure. It is also important to monitor if the viability of particular industries is impacted through the distributive impact pathway and this results in long term job losses. As a result further data is required to more comprehensively understand and monitor the impact on labour productivity and employment.
1 Terms of reference 7 Opportunities for efficiency ...2 Glossary 8 Cost of efficiency measures3 Executive summary 9 Principles for negating adv ...4 Introduction 10 A program to achieve 450 ...5 Potential socio-economic ... 11 Appendices6 Program design

Analysis of efficiency measures in the Murray-Darling Basin: Opportunities to recover 450GL in additional environmental water through efficiency measures by 2024, with neutral or positive socio-economic impacts | Page 19 of 307
19 January 2018 | Final Report
Key messages3 Executive summary
Negating adverse impacts
► Measures to address potential adverse impacts have been considered within program design and include:
► To address potential distributive impacts between communities and industry areas it is recommended that the on-farm program is allocated across communities and across industry areas (horticulture, cropping, dairy) so that individual communities or industries are not specifically advantaged over others.
► Distributive impacts on more marginal farms should be managed as part of whole of government resilience and regional development programs to support structural change that is impacting the industry as a whole.
► An agile program design approach will facilitate early adaptation of the program to avoid, address or mitigate impacts.
► Integrated implementation of on-farm and off-farm efficiency measures to allow implementation of infrastructure that maximises net benefits including the efficiency of the network and of on-farm enterprises.
These measures will require a whole of government and cross jurisdictional approach drawing on existing programs and additional data, and will need to be supported by a robust monitoring and evaluation framework.
1 Terms of reference 7 Opportunities for efficiency ...2 Glossary 8 Cost of efficiency measures3 Executive summary 9 Principles for negating adv ...4 Introduction 10 A program to achieve 450 ...5 Potential socio-economic ... 11 Appendices6 Program design

Analysis of efficiency measures in the Murray-Darling Basin: Opportunities to recover 450GL in additional environmental water through efficiency measures by 2024, with neutral or positive socio-economic impacts | Page 20 of 307
19 January 2018 | Final Report
Key messages3 Executive summary
Program design
► A multi-faceted program is recommended to deliver the required water within the time period. This includes:
► Substantial early two-way engagement, intended to enable input from community and industry leaders in co-design of the programs. It is also recommended that behavioural economic insights are leveraged to inform this engagement. Together with investment in education and training, and additional targeted R&D into existing water efficiency programs this is intended to maximise:
► Take-up of the program to achieve 450GL by 2024
► The ability to create and maintain a social licence for continued water recovery
► Value for money and the achievement of the 450GL within statutory budget.
► The ability to avoid or mitigate potential adverse socio-eco impacts.
► Immediate pursuit of off-farm and urban opportunities with zero adverse socio-economic impacts, and other immediate on-farm opportunities or programs with limited (or addressable) adverse socio-economic impacts that can meet the 62GL bridge the gap target by 2019.
► A separate large-opportunities program that involves more targeted market engagement and differential pricing and is designed to maximise either value for money or the ability to achieve 450GL by 2024.
► A set of on-farm programs that build on the principles of the COFFIE pilot, are co-designed with industry or community leaders, are able to be delivered in partnership, and are agile and responsive to the findings of ongoing monitoring and evaluation.
► The program should be flexible and adaptive, with a focus on refinement and continuous improvement, informed by data collection and assessment under a monitoring and evaluation framework. As a minimum annual review and refinement is recommended.
► The program should include a price discovery mechanism to determine the most appropriate multiple going forward, with features to incentivise early participation, and ongoing budget management and assessment.
1 Terms of reference 7 Opportunities for efficiency ...2 Glossary 8 Cost of efficiency measures3 Executive summary 9 Principles for negating adv ...4 Introduction 10 A program to achieve 450 ...5 Potential socio-economic ... 11 Appendices6 Program design

Analysis of efficiency measures in the Murray-Darling Basin: Opportunities to recover 450GL in additional environmental water through efficiency measures by 2024, with neutral or positive socio-economic impacts | Page 21 of 307
19 January 2018 | Final Report
Key messages3 Executive summary
What can be achieved?
► From the analysis and discussions undertaken, and assuming the recommendations in the report are implemented, there is sufficient evidence the 450 GL can likely be recovered from water efficiency projects on a neutral or positive socio-economic basis.
► However, there are a number of overarching risks associated with achieving the desired recovery including in relation to:
► The ability to recover the specified water within the statutory budget and the required timeframe
► Program participation levels, particularly in relation to on-farm projects
► Stakeholder perceptions and understanding of the rationale for water recovery
► The extent that socio-economic impacts are addressed through program design and mitigation.
► Key recommendations from our report to address these risks are:
► Investment in upfront engagement with community and industry leaders
► A partnership approach to program delivery
► An agile and adaptive program delivery approach
► Extensive monitoring and evaluation informed by enhanced data collection.
1 Terms of reference 7 Opportunities for efficiency ...2 Glossary 8 Cost of efficiency measures3 Executive summary 9 Principles for negating adv ...4 Introduction 10 A program to achieve 450 ...5 Potential socio-economic ... 11 Appendices6 Program design

Analysis of efficiency measures in the Murray-Darling Basin: Opportunities to recover 450GL in additional environmental water through efficiency measures by 2024, with neutral or positive socio-economic impacts | Page 22 of 307
19 January 2018 | Final Report
Introduction3 Executive summary
The Murray-Darling Basin (the Basin) covers more than 1 million square kilometres over four states and one territory, with approximately 2.11 million people living in the Basin and using the water resource. Early unplanned development in the Basin led to an over-allocation of water rights at the expense of its environmental needs. During the millennium drought, the need for reform of the over-allocation and overuse of water was exemplified. This was addressed by the Water Act 2007, including the development of the Murray-Darling Basin Plan (the Plan) in 2012, a legislative framework to manage water resources with relevant state and territory governments aspiring to “a healthy and working Murray-Darling Basin”.
The Plan currently requires 2,680GL of surface water to be recovered by 30 June 2019 from consumptive use to benefit the environment. The Basin Plan had a provision for a review of water recovery targets in the Northern Basin (the Northern Basin Review) and flexibility to adjust the SDLs through the operation of the sustainable diversion limit adjustment mechanism (SDLAM). As a result of 2017 amendments made to the Basin Plan following the Northern Basin Review, the water recovery target in the Northern Basin has reduced by 70 GL (that is from 2750GL to 2680GL).
The SDLAM also allows delivery of an additional 450GL of water through efficiency measures, intended to achieve enhanced environmental outcomes for the Basin. The enhanced environmental outcomes from these projects include: further reducing salinity levels in the Coorong and Lower Lakes, ensuring the mouth of the River Murray is open to the sea at least 95% of years, and watering an additional 35,000 hectares of floodplains in South Australia, NSW and Victoria to improve the health of forests, fish and bird habitat, and replenish groundwater.
As part of this EY has been engaged to provide advice on designing a program to recover 450GL of water through efficiency measures by 2024 with neutral or improved socio-economic impacts.
This report responds to the detailed terms of reference described in section 1 of this report. In summary it considers the following questions:
► What are the potential socio-economic impacts from efficiency measures at a range of scales?
► The extent to which adverse socio-economic impacts can be negated through program design, existing Commonwealth programs, and other Commonwealth funded regional development activities?
► How to design, target and resource efficiency measures to recover 450GL of water, with neutral or improved socio-economic outcomes?
The report and this executive summary, steps through the approach we’ve taken to address the terms of reference, and then each of the above questions.
A draft report was provided on the 8 November 2017, and following feedback from all Basin jurisdictions and the advisory panel, the final report (this report) will be provided to the Ministerial Council at the end of December 2017. The Ministerial Council will then consider the report and make any agreed changes on how to implement efficiency measures. Once the changes are agreed, efficiency measures programs will be modified as needed.
Importantly, in late November 2017 the Prime Minister announced a new implementation agenda for delivering the Basin Plan. The agenda included finalising remaining water recovery, including delivering the first tranche of efficiency measures required by June 2019, and agreeing a pathway to recover by 2024 the balance of the efficiency measures as agreed by Basin governments. It also included a commitment to enhancing monitoring and communication through long-term monitoring of water recovery impacts and re invigorating engagement with Basin communities to ensure better outcomes.
1 Terms of reference 7 Opportunities for efficiency ...2 Glossary 8 Cost of efficiency measures3 Executive summary 9 Principles for negating adv ...4 Introduction 10 A program to achieve 450 ...5 Potential socio-economic ... 11 Appendices6 Program design

Analysis of efficiency measures in the Murray-Darling Basin: Opportunities to recover 450GL in additional environmental water through efficiency measures by 2024, with neutral or positive socio-economic impacts | Page 23 of 307
19 January 2018 | Final Report
Approach3 Executive summary 1 Terms of reference 7 Opportunities for efficiency ...
2 Glossary 8 Cost of efficiency measures3 Executive summary 9 Principles for negating adv ...4 Introduction 10 A program to achieve 450 ...5 Potential socio-economic ... 11 Appendices6 Program design
The approach used to undertake this study included working closely with the Basin Officials Committee and an advisory panel, consisting of experts in irrigation networks, social and economic analysis, regional development, and program design and comprised of four phases:
The Terms of Reference also required consideration of information from the MDBA evaluation of the social, economic and environmental outcomes of the implementation of the Basin Plan. However, whilst the Northern Basin review has been completed, the 2017 Basin Plan Evaluation was not completed in time to inform this project.
It is noted that concerns relating to the constraints of the river system and measures to deliver environmental outcomes are not within the projects’ Terms of Reference. However, it is recommended that work is undertaken to engage with communities on these issues to promote trust and build buy-in for the water efficiency program, with the MDBA currently undertaking a review of measures put forward by Basin jurisdictions to address constraints in the river system.
Phase 1
Phase 2
Phase 3
Phase 4
► Initial meetings with all jurisdictions and the MDBA to understand the requirements, collect information, and discuss the proposed methodology including approach to consultation with stakeholders and engagement with the advisory panel.
► Analysis of information collected and development of frameworks for further analysis. This included reviewing over 150 academic articles, stakeholder submissions, program applications, case studies, and previous reports as well as seeking input from the advisory panel on stakeholder consultations.
► Over 65 consultations across New South Wales, Victoria, South Australia, Queensland and the Australian Capital Territory with a range of stakeholders including irrigators, businesses, Government representatives and peak bodies (farm and irrigator, environmental and indigenous). See Appendix A for the complete list of stakeholders consulted and Appendix B for a summary of stakeholder comments.
► Source additional data, perform detailed analysis, prepare draft and final reports and undertake engagement with Basin officials including two workshops with officials, individual meetings to discuss scope, test preliminary socio-economic analysis and receive feedback on the draft report. In addition this phase entailed ongoing input from advisory panel, including three workshops to test findings from stakeholder engagement, socio-economic analysis and draft findings.

Analysis of efficiency measures in the Murray-Darling Basin: Opportunities to recover 450GL in additional environmental water through efficiency measures by 2024, with neutral or positive socio-economic impacts | Page 24 of 307
19 January 2018 | Final Report
Stakeholder consultation findings3 Executive summary
The Basin is made up of a wide variety of stakeholders with differing opinions and values. This makes water reform complex and generates a diversity of views in relation to the pathway forward. Key issues identified by stakeholders during consultations included:
► A concern by the majority of stakeholders that historical water recovery measures have resulted in the decline of regional communities and that further water recovery through efficiency measures would reduce the consumptive pool and further exacerbate the adverse impacts on regional communities. At the same time, individual irrigators consulted who have participated in on-farm efficiency programs largely indicated that they have benefited from funding to upgrade on-farm infrastructure.
► Suggestions that the majority of communities do not understand the detailed reasons or application of the Basin Plan, the expected environmental benefit, supply or constraint measures, as well as the difference between buybacks and efficiency measures. Stakeholders indicated that these complex concepts have not been communicated effectively nor been widely understood.
► Concerns that further water recovery to meet the 450GL target will not be able to be delivered downstream to the Lower Lakes due to constraints in the river system. Many stakeholders further asserted that the focus should be on how best to deliver the environmental outcomes, not water recovery.
► A view that regional communities in all states are disengaged with the attempts to communicate with them. The MDBA, DAWR, CEWH and State Governments all contact individual communities separately, to present information on environmental benefits, efficiency measures, environmental water flows, and local initiatives designed to alleviate adverse impacts. There is no united or singular person/body responsible for the conveyance of information. As a result stakeholders are experiencing consultation fatigue, while at the same time seeking deeper two-way engagement.
► Stakeholder comments suggested a substantial lack of trust within communities, due to complex and inconsistent messaging. Furthermore, concerns expressed by the communities (e.g. as related to buybacks or the ‘Swiss Cheese’ effect) are often felt to be ignored or not genuinely appreciated, with no action taken to either resolve the concern or alter the community perception.
1 Terms of reference 7 Opportunities for efficiency ...2 Glossary 8 Cost of efficiency measures3 Executive summary 9 Principles for negating adv ...4 Introduction 10 A program to achieve 450 ...5 Potential socio-economic ... 11 Appendices6 Program design
Source: MDBA, https://www.mdba.gov.au/sites/default/files/pubs/Murray-Darling_Basin_Boundary.pdf
Over 65 meetings with stakeholders across
NSW, ACT, VIC, SA and QLD.
Met with all stakeholders identified by jurisdictions.

Analysis of efficiency measures in the Murray-Darling Basin: Opportunities to recover 450GL in additional environmental water through efficiency measures by 2024, with neutral or positive socio-economic impacts | Page 25 of 307
19 January 2018 | Final Report
Socio-economic impacts3 Executive summary
There is a wide body of evidence that demonstrates that Basin communities have and continue to experience significant change, and it has occurred at a fast pace. Global national and Basin-specific influences have and will continue to shape the Basin going forward.
The change experienced has been caused by a range of socio-economic influences including an aging population, commodity prices, climate change, population shift to cities and regional centres, a steady decline in agricultural employment, ongoing farm consolidation and corporatisation, changes in water management such as the establishment of the water market, and water recovery as part of the Basin Plan. In particular elements of the Basin Plan already implemented, specifically buybacks, large off-farm infrastructure modernisation programs and environmental watering events have had significant (positive and negative) impacts to date.
Many stakeholders consulted by EY raised significant concerns in relation to socio-economic impacts. However, many of these have been caused by factors other than water efficiency measures. A key challenge has therefore been to isolate the socio-economic impacts of water efficiency measures from other impacts which are being experienced. This is further complicated by a lack of information and data (specific to the impacts of efficiency measures) to provide an appropriate evidence base, as the nature of many impacts varies according to specific circumstances.
Thus, to analyse the impacts of water efficiency measures, socio-economic impact mapping was undertaken to explore the cause and effect of water efficiency measures at a conceptual level. The mapping demonstrates that off-farm, and urban projects generally lead to neutral or improved socio-economic outcomes.
Based on the analysis undertaken, participants in on-farm projects experience positive socio-economic impacts. The exchange of water entitlements for funding for infrastructure investment enables improved water efficiency, enhances on-farm productivity and allows for the use of water savings retained by participants for production. There is a net benefit to industry through either enabling or bringing forward water efficiency upgrades, and this offsets the possible lost opportunity if industry was able to invest themselves in the future without support from the Commonwealth. On average, the analysis has indicated that approximately 23% of funding contributes to enhanced production.
However, looking beyond the specific legal requirements of the Basin Plan, this
report has also considered impacts at a range of scales, including for non-participants, irrigation networks, communities and at the Basin level. The detailed mapping of impacts from on-farm projects combined with consideration of the primary areas of concern identified by stakeholders, led to the identification of four key impact pathways (irrigated production; distributional impacts arising from changed output decisions; network charges; and, labour productivity and employment). Detailed analysis has been undertaken to explore the nature of these impact pathways.
It is acknowledged that there are data limitations, and that this has impacted the precision and level of quantitative analysis that has been undertaken. The report has however examined and where possible provided indicative quantitative analysis of different scenarios and considerations (e.g. different climate scenarios).
The detailed analysis of impact pathways for on-farm water efficiency projects is intended to provide clarity for all stakeholders, to understand the discrete impacts from these projects and importantly, inform program design. An overview of these pathways is outlined on the following pages. In summary the conclusions drawn from the analysis are summarised below:
► On a 20-year NPV basis, water efficiency measures have a net productive benefit as reductions in future production are offset by increased production in the short term and the benefit of Commonwealth funding.
► Distributional impacts could be significant if certain industries or communities do not participate in water efficiency programs as they will be at a competitive disadvantage vis-à-vis those industries or communities which do, with water flowing to more productive and efficient users. However, the size and nature of this impact cannot be determined without further data.
► On-farm water efficiency measures are unlikely to significantly impact on network charges. In the short to medium term, termination fees should largely negate pricing impacts to irrigators.
► Both on and off-farm efficiency projects are associated with increasing labour productivity. While there is insufficient evidence to conclusively determine the net impacts on employment, the evidence gathered to date suggests that employment impacts are likely to be limited.
1 Terms of reference 7 Opportunities for efficiency ...2 Glossary 8 Cost of efficiency measures3 Executive summary 9 Principles for negating adv ...4 Introduction 10 A program to achieve 450 ...5 Potential socio-economic ... 11 Appendices6 Program design

Analysis of efficiency measures in the Murray-Darling Basin: Opportunities to recover 450GL in additional environmental water through efficiency measures by 2024, with neutral or positive socio-economic impacts | Page 26 of 307
19 January 2018 | Final Report
Socio-economic impact pathway 1: Impact on irrigated production overview3 Executive summary
On-farm program participants transfer entitlements equivalent to the modernisation water savings (less retained savings) to the Commonwealth, in exchange for funding for infrastructure upgrades.
If Commonwealth funding brings forward investment in water efficiency measures, short term production is enhanced. Furthermore, the multiple generally funds additional productive capacity.
However, if efficiency measures were invested in by irrigators themselves using their own capital, then the water savings could support additional future production.
This pathway therefore considers the opportunity cost associated with participation and the net impact of on-farm efficiency measures on irrigated production.
► Would infrastructure upgrades occur without Commonwealth funding?
► Would the transferred water have been used for production?
► Are there alternative water efficiency gains that could be invested in, and a longer timeframe before productive capacity is lost?
► Can some water savings be retained for production?
► Can further farm productivity improvements or changes in inputs further offset reduced consumptive water entitlements?
► Which commodities would water have been used to produce?
► What financial benefit does Commonwealth funding provide participating irrigators?
Discounted over 20 years, the net financial benefit to industry is estimated to be between $70-302 million depending on the produced commodity. This is comprised of:
► A cost in lost future production of $39-$373 million
► A benefit of $66-$632 million in increased short-term production
► A benefit of $43 million in relation to the foregone cost of capital.
Sensitivity analysis has demonstrated that the key determinant is the ability to realise short-term benefits.
For example if no benefits are achieved a net cost to industry of up to $330 million could arise. Short term production needs to increase by up to 16% for a positive net financial benefit to industry to occur.
Infrastructure upgrades bring forward investment, allowing irrigators to increase short-term production. This represents an opportunity cost in forgone future production.
Based on the data and information available, on a 20-year NPV basis, on-farm water efficiency projects have a net financial benefit to industry as reductions in future production are offset by increased production in the short-term and the benefit of Commonwealth funding.
On average, the analysis has indicated that approximately 23% of funding contributes to enhanced production.
However, if short-term production does not increase (as a result of irrigators either not being able to retain water savings or on-farm productivity not improving) then there may be a net cost to industry.
► Invest in community engagement to promote understanding of the impacts from water efficiency measures. Also invest in a monitoring and evaluation framework to better analyse impacts of efficiency measures.
► Supporting measures such as education and training, R&D and facilitation of knowledge sharing, should be included as part of water efficiency programs to ensure that participants are able to take advantage of productivity improvements.
Implication for program designConclusionAssessing the
impactKey considerationsPotential issue
1 Terms of reference 7 Opportunities for efficiency ...2 Glossary 8 Cost of efficiency measures3 Executive summary 9 Principles for negating adv ...4 Introduction 10 A program to achieve 450 ...5 Potential socio-economic ... 11 Appendices6 Program design

Analysis of efficiency measures in the Murray-Darling Basin: Opportunities to recover 450GL in additional environmental water through efficiency measures by 2024, with neutral or positive socio-economic impacts | Page 27 of 307
19 January 2018 | Final Report
Socio-economic impact pathway 2: Distributional impact arising from changed production decisions by participants
3 Executive summary
As part of undertaking infrastructure upgrades, participants improve water efficiency and productivity, enhancing their competitiveness.
They also face new decisions in relation to production levels which impact on water use and have the potential to create corresponding influences on water prices.
Changes in water prices impact on buyers and sellers of water, particularly those most sensitive to price changes (marginal users).
This impact pathway explores whether on-farm efficiency measures generate distributional impacts as a result of participants changing their output decisions.
► Is water usage and demand likely to increase as a result of modernisation?
► Would increased water demand have resulted in the absence of on-farm efficiency measures programs?
► When will increased demand result in water market price changes?
► What is the magnitude of any price change?
► Do water market prices have a significant impact on business viability?
In the water market, water flows to the most efficient and productive users. If water prices were to increase as a result of efficiency measures projects generating additional demand for water, irrigators who purchase water and have marginal profitability may be adversely impacted. This could also affect their communities.
Marginal profitability is linked to the prevailing operating environment – primarily commodity prices, climate and individual business strategies and farming enterprises.
A hypothetical example suggests that if 350GL was recovered from on-farm programs and participants increased their water demand by 25% this could equate to a reduction of around 174 businesses (1%). If all marginal users exited from one industry, this could result in a 3 to 14% impact on a specific industries value add.
Available evidence suggests that on-farm efficiency measures projects result in increased competitiveness by participants. This may generate increased water demand. However, a variety of factors impact the price of water and empirical data is limited.
If prices increase, adverse distributional impacts may disproportionally fall on irrigators reliant on purchasing temporary water. This is primarily affected by the choice of produced commodity. Other influences include seasonal allocations, prevailing commodity prices and strategic business plans (including current infrastructure).
Given the geographic clustering of commodity production, certain communities would also be disproportionally impacted, potentially accelerating existing structural changes.
► To address potential distributive impacts between communities and industry areas it is recommended that the on-farm program is allocated across communities and across industry areas (horticulture, cropping, dairy) so that individual communities or industries are not specifically advantaged over others.
► Distributive impacts on more marginal farms should be managed as part of whole of government resilience and regional development programs to support structural change that is impacting the industry as a whole.
Implication for program designConclusionAssessing the
impactKey considerationsPotential issue
1 Terms of reference 7 Opportunities for efficiency ...2 Glossary 8 Cost of efficiency measures3 Executive summary 9 Principles for negating adv ...4 Introduction 10 A program to achieve 450 ...5 Potential socio-economic ... 11 Appendices6 Program design

Analysis of efficiency measures in the Murray-Darling Basin: Opportunities to recover 450GL in additional environmental water through efficiency measures by 2024, with neutral or positive socio-economic impacts | Page 28 of 307
19 January 2018 | Final Report
Socio-economic impact pathway 3: Impact on network charges overview3 Executive summary
An irrigator participating in an on-farm water efficiency program transfers water entitlements to the Commonwealth in exchange for funding for infrastructure upgrades.
The volume of water flowing through a particular network may be reduced given the transfer of entitlements to the environment. This may impact on a network’s revenue base or require additional spending to ensure water flow rates are maintained as required.
At the same time, off-farm programs can improve the efficiency of networks and the ability to deliver water.
This impact pathway explores these issues and therefore whether efficiency measures are likely to impact on network charges.
► How are network changes currently determined?
► What else is impacting network operations?
► What is the nature of water efficiency measures?
► How would reduced volumes impact on costs and charges?
► Will a reduction of water delivery volume occur?
► Do termination fees mitigate impacts to network charges for irrigators?
► Is infrastructure spending required to maintain delivery and are off-farm programs being funded?
The 450GL of water recovery represents a relatively small proportion of irrigation water volumes (between 4.7% and 5.6% of the total water delivery rights on issue).
Despite this some networks may experience a disproportional impact of volume reduction, if program uptake is relatively larger.
However, the analysis demonstrates that participants do not necessarily reduce the volume of water demanded nor their water delivery rights.
Further, termination fees cover most of the exiting irrigator’s network access charges, up to ten years. Therefore, where water delivery rights are reduced, these fees should offset reductions in revenue bases in the short-to-medium term.
On-farm water efficiency measures are unlikely to significantly impact on network charges. In the short-to-medium term, termination fees should largely negate pricing impacts to irrigators.
Despite this, networks are still facing long-term structural challenges in their cost recovery relating to historical issues such as buybacks and changing regulatory regimes. However, it is noted for networks which have participated in off-farm projects, government investment may offset some of these cost pressures.
Across the Basin, 450GL represents a relatively small volume water delivery rights. Unless participation is concentrated across a few networks, networks are unlikely to require significant additional investment to maintain water delivery.
► Integration of on-farm and off-farm efficiency measures to allow maximum efficiency of both the network and on-farm irrigation. This may include the consolidation of IIOs where practical.
► Additional investment in networks may be required where it can be demonstrated through a business case that water efficiency measures have impacted their costs (such as where additional investment is needed to maintain delivery flow rates) or revenue (such as reduced fees).
► Where off-farm works are undertaken the key issue is ensuring that a whole of life assessment is taken to determine viability as evidenced by a positive net present value.
Implication for program designConclusionAssessing the
impactKey considerationsIssue
1 Terms of reference 7 Opportunities for efficiency ...2 Glossary 8 Cost of efficiency measures3 Executive summary 9 Principles for negating adv ...4 Introduction 10 A program to achieve 450 ...5 Potential socio-economic ... 11 Appendices6 Program design

Analysis of efficiency measures in the Murray-Darling Basin: Opportunities to recover 450GL in additional environmental water through efficiency measures by 2024, with neutral or positive socio-economic impacts | Page 29 of 307
19 January 2018 | Final Report
Socio-economic impact pathway 4: Impact on labour productivity and employment overview
3 Executive summary
Water efficiency measures have the potential to reduce the amount of labour required by irrigators and networks given many projects involve elements of automation. However, water efficiency measures also increase on-farm productivity and associated production which may enhance labour requirements.
At the same time construction spending generates short term employment opportunities within communities and longer term there is the potential for additional skilled workers to support maintenance of on and off-farm infrastructure.
This impact pathway explores the impact of efficiency measures on labour productivity and employment.
► Are employment impacts related to modernisation or efficiency measures programs?
► Will increased on-farm output lead to an increase in the agricultural workforce?
► Is farm employment correlated with agricultural production?
► What is the employment impact from infrastructure construction?
► Could there be a distributional labour impact?
While many infrastructure upgrades involve automation, evidence suggests that while this can enhance labour productivity, labour is often redeployed to other farm tasks. Further, post-project required labour is likely to be more technically proficient than pre-project. These employees may experience increased wages.
During the construction phase additional employment opportunities are created, supporting employment in Basin communities.
However, where marginal users are impacted by water efficiency measures via distributional impacts, employment is likely to be reduced and existing structural change accelerated.
Downstream employment impacts may result as these irrigators are likely to produce the same types of commodities.
Based on the data available there is insufficient evidence to conclusively determine the net impacts on labour. However, available evidence suggests that labour productivity impacts are likely to be limited:
► The net reduction in labour resulting from on and off-farm efficiency measures is estimated to be small
► At the community level there are short-to-medium term benefits from the construction of infrastructure and longer-term potential benefits from maintenance of infrastructure.
The key factor to monitor is if the viability of particular industries is impacted (particularly through impacts on marginal users) and this results in long-term job losses.
► Given the limited data and evidence, the impact on labour productivity and employment needs to be monitored on an ongoing basis with a particular focus on tipping points for industries.
► Whole of government approach to regional development, including development of employees with appropriate skills within communities (or the attraction of those people with required skills).
Implication for program designConclusionAssessing the
impactKey considerationsIssue
1 Terms of reference 7 Opportunities for efficiency ...2 Glossary 8 Cost of efficiency measures3 Executive summary 9 Principles for negating adv ...4 Introduction 10 A program to achieve 450 ...5 Potential socio-economic ... 11 Appendices6 Program design

Analysis of efficiency measures in the Murray-Darling Basin: Opportunities to recover 450GL in additional environmental water through efficiency measures by 2024, with neutral or positive socio-economic impacts | Page 30 of 307
19 January 2018 | Final Report
Opportunities for efficiency measures3 Executive summary
Based on analysis of available information on water recovery achieved across different types of programs to date across the Basin, an indicative size of the future water recovery opportunity is summarised in the table below. Between 209GL to 450GL+ of water efficiencies are estimated through: 1) stakeholder input; and 2) applying assumptions of further water efficiencies to catchments or types of projects based on available data on historical efficiencies achieved.
Next steps in implementing a water efficiency program is discussed in Chapter 10, including how best to achieve 62GL by 2019.
Source: Data from the Department of Agriculture and Water Resources, stakeholder estimates, and EY analysis.
1 Total potential savings is 209GL to 690GL noting that only 450GL will be recovered. Note totals may not add due to rounding differences. 2 This large range reflects the upper bound potential for water savings which may require a significantly higher cost than invested historically, and hence not be achievable alone within the proposed multiple.
1 Terms of reference 7 Opportunities for efficiency ...2 Glossary 8 Cost of efficiency measures3 Executive summary 9 Principles for negating adv ...4 Introduction 10 A program to achieve 450 ...5 Potential socio-economic ... 11 Appendices6 Program design
Potential water savings (GL)Location Type / Basis of Estimation Potential Savings
Off-farm opportunities nominated by stakeholders
Victorian Murray/Goulburn Stakeholder estimates 0 - 2392
NSW Murray Stakeholder estimates 10 – 25
Murrumbidgee Stakeholder estimates <10
Queensland Stakeholder estimates 6
Sub-total 26 – 280
On-farm opportunities (EY estimates)
Victorian Murray/Goulburn On-farm (increase of 200-400 irrigator participants) 26 – 52
Murrumbidgee On-farm (sensitivities to OFIEP participation figures) 26 – 35
NSW Murray On-farm (sensitivities to OFIEP participation figures) 29 – 44
SA Murray Reaching 10%-20% of interested irrigators in SARMS 6 - 12
Lachlan On-farm ( increase to 2-4% of SDL) 10 – 21
Macquarie-Castlereagh On-farm ( increase to 6% of SDL) N/A – 2
Namoi On-farm ( increase to 2-4% of SDL) 3 – 12
Gwydir On-farm ( increase to 2-4% of SDL) 3 – 11
Condamine Balonne On-farm ( increase to 2-4% of SDL) 7 – 24
Border Rivers (QLD) On-farm ( increase to 4.5% of SDL) N/A – 2
Warrego On-farm ( increase to 2-4% of SDL) 2 – 4
Moonie On-farm ( increase to 2-4% of SDL) 0 – 2
Nebine On-farm ( increase to 2-4% of SDL) 1 – 1
Potential water savings (GL)Location Type / Basis of Estimation Potential Savings
Border Rivers (NSW) On-farm ( increase to 2-4% of SDL) 2 – 8
Barwon Darling On-farm ( increase to 2-4% of SDL) N/A – 1
Intersecting Streams On-farm ( increase to 2-4% of SDL) 2 – 5
Lower Darling On-farm ( increase to 2-4% of SDL) N/A – 1
Wimmera Stakeholder estimates -
Loddon On-farm ( increase to 2-4% of SDL) 3 – 6
Campaspe On-farm ( increase to 2-4% of SDL) 2 – 5
Ovens On-farm ( increase to 2-4% of SDL) 2 – 3
Broken On-farm ( increase to 2-4% of SDL) 1 – 2
Sub-total 125 – 253
Integration of on and off-farm opportunities (EY estimates)
Northern Basin On and off-farm (65% to 93% network efficiency) 5 – 9
Southern Basin On and off-farm (65% to 93% network efficiency) 29 – 61
Sub-total 34 – 70Urban and industrial opportunities (EY estimates)
South Australia Urban and industrial <= 50
Australian Capital Territory Urban and industrial 20 – 30
Urban areas within the MDB Urban and industrial (80% to 85% or 90% efficiency) 4 – 9
Sub-total 24 – 89Total1 209 – 450+

Analysis of efficiency measures in the Murray-Darling Basin: Opportunities to recover 450GL in additional environmental water through efficiency measures by 2024, with neutral or positive socio-economic impacts | Page 31 of 307
19 January 2018 | Final Report
Opportunities for efficiency measures3 Executive summary
The basis for the analysis on opportunities is summarised below and discussed in detail in chapter 7 of the report. In general, the opportunities have been based on stakeholder consultation, analysis of existing data and reports, and the application of a conservative approach to assumptions made. Due to data limitations, the estimate of potential savings only provides an indicative analysis and range.
Off-Farm opportunities
During consultations, irrigation infrastructure operators (IIOs) put forward a number of off-farm opportunities that are likely to provide savings of around 71GL. Many IIOs consulted also put forward the view that where modernisation programs have already been applied, further opportunities for modernisation may require greater capital investment than made previously, and new technology.
While in some cases the cost of capital investment may be higher, there is also potential for non-traditional infrastructure options to be pursued, for example, investment in IT ‘infrastructure’ that supports better coordination of water delivery to reduce delivery losses.
On-Farm opportunities
Based on consultations undertaken, there remains interest from irrigators inon-farm efficiency projects. There is scope to increase participation by providing greater flexibility in the types of on-farm projects that are funded, provided that they improve on-farm water productivity and reduce the reliance on water.
Analysis was undertaken to estimate the potential savings from further on-farm modernisation through the current level of participation (where data is available), and the level of water recovery through efficiency measures historically. To refine the analysis, further data is needed, for example, on the size of irrigators in catchments, the industry profiles, the demographics of program participants and an understanding of their reasons for participating in efficiency programs.
Integrated Off-Farm and On-Farm opportunities
For smaller IIOs that have not undertaken infrastructure upgrades, there are opportunities to take an integrated approach towards on and off-farm projects. An integrated approach provides for greater efficiencies as the off-farm network is upgraded to the level that meets users’ requirements at the same time as on-farm works are undertaken.
To estimate the potential savings for off-farm opportunities for smaller IIOs, a proxy for the level of efficiency that was shown to be achieved for a similar sized IIO was applied to other IIOs that have not fully upgraded their network.
Urban opportunities
In relation to urban opportunities, there is the opportunity to achieve water savings and release urban water entitlements in a range of urban centres, however with the exception of Canberra and Adelaide this is limited in scale and may require co-investment by the relevant communities in the benefits of urban water security projects. For the ACT, there is the opportunity to release urban water entitlements that currently provide capacity for future growth, in exchange for infrastructure efficiency projects and/or a project fund that supports sustainable growth for Canberra. The ACT Government would need to be involved in conjunction or in coordination with Icon Water in developing and implementing opportunities. The capacity to trade water out of the ACT involves the ACT Government. Further, there are key issues in water planning that would also involve the ACT Government. For South Australia there is the opportunity to substitute water from the Adelaide Desalination Plant for extractions from the River Murray in exchange for investment in renewable energy and/or other infrastructure. These urban opportunities will require further analysis of the potential costs and benefits.
1 Terms of reference 7 Opportunities for efficiency ...2 Glossary 8 Cost of efficiency measures3 Executive summary 9 Principles for negating adv ...4 Introduction 10 A program to achieve 450 ...5 Potential socio-economic ... 11 Appendices6 Program design

Analysis of efficiency measures in the Murray-Darling Basin: Opportunities to recover 450GL in additional environmental water through efficiency measures by 2024, with neutral or positive socio-economic impacts | Page 32 of 307
19 January 2018 | Final Report
Historic program cost3 Executive summary
Under the Water Act, $1.575 billion has been set aside to recover the 450GL through efficiency programs. A variety of factors will play a role in determining the overall funding requirements for the program including the value of water entitlements, funding multiple applied, participation levels, environmental conditions and commodity prices, technology advancements, government policy and utilisation of infrastructure associated with the water network.
In order to provide an indication of what an appropriate multiple might be going forward, the costing analysis has explored data from a number of historical programs, analysing the water savings per round and over time. These programs included On-Farm Irrigation Efficiency Program (OFIEP), New South Wales Private Irrigation Infrastructure Operators Program (PIIOP), Queensland Healthy HeadWaters Program (HHWUE), and the Private Irrigation Infrastructure Program for South Australia (PIIP-SA). It is noted that given data limitations and inconsistencies these were the only programs able to be analysed in this way.
Historical averages (program round basis) of the funding per ML and unweighted funding multiples for both on and off-farm projects have been assessed, demonstrating:
► The average unweighted funding multiple for on-farm projects under OFIEP decreased from a high of 2.34x in round 2 to a low of 1.77x in round 4.
► Under HHWUE, the average unweighted funding multiple varied from a low 1.70x in round two towards a high of 2.46x in round 7.
► The average funding requirement of PIIOP was at its highest in round three ($4,874), compared to the lowest in round two ($3,680). However, this trend was not represented within the unweighted funding multiple with an average program low of 1.87x in round 3.
► PIIP-SA possessed the highest average unweighted funding multiple of 2.51x across both rounds of program funding.
Whilst the costing analysis utilises historical programs to provide an indication as to the most appropriate multiple for future water recovery programs, stakeholder input suggests that certain programs (such as OFIEP Rd 5, VFM, SARMS) are more representative of what future programs may require to attract participation. Throughout the consultation process, many stakeholders suggested that funding multiples of 2.0x or greater would be required in order to attract program participation. However it is noted that this is not based on detailed financial evaluation, and that there would be benefit in providing tools and support for participants to be able to undertake this evaluation.
Source: Data received from the Department of Agriculture and Water Resources, EY analysis.
Source: Data received from the Department of Agriculture and Water Resources, EY analysis.
1 Terms of reference 7 Opportunities for efficiency ...2 Glossary 8 Cost of efficiency measures3 Executive summary 9 Principles for negating adv ...4 Introduction 10 A program to achieve 450 ...5 Potential socio-economic ... 11 Appendices6 Program design
On-farm market multiple Off-farm market multipleMinimum 1.70x 1.87xAverage 2.11x 2.25xMaximum 2.46x 2.68x
0.00x
0.50x
1.00x
1.50x
2.00x
2.50x
3.00x
Mar
ket m
ultip
le
Historical water efficiency funding multiples
On-farm cost per ML Off-farm cost per MLMinimum $2,399 $3,680Average $3,599 $4,554Maximum $4,852 $5,773
$-
$1,000
$2,000
$3,000
$4,000
$5,000
$6,000
$7,000
Cos
t per
ML
($/M
L)
Historical water efficiency cost per ML

Analysis of efficiency measures in the Murray-Darling Basin: Opportunities to recover 450GL in additional environmental water through efficiency measures by 2024, with neutral or positive socio-economic impacts | Page 33 of 307
19 January 2018 | Final Report
Assessing cost going forward3 Executive summary
Efficiency measures programs recover water from a range of catchments and entitlement types (each of these possess different LTAAY factors and costs). Therefore scenario analysis has been used to examine the feasibility of achieving the water recovery target with the existing statutory budget at different average prices and associated funding multiples. Three scenarios have been developed with a different reliability class applied to each to demonstrate the impact of different entitlement classes, LTAAY factors, funding multiples and VWAP may play in achieving the 450GL.
The scenario analysis demonstrates that recovering water entitlements within those catchments with a Low Reliability entitlement class (scenario 2) will require lower market water prices in order to achieve the 450GL compared to that of scenario 1 with a High Reliability entitlement class. This trend is also repeated when analysing the funding multiple, which plays a significant role in determining the overall cost and feasibility of achieving the 450GL within the statutory budget.
Given current water prices and the increase in the price of water over time, which many stakeholders anticipate will continue into the future, there is a significant risk in achieving the recovery of the 450GL within the statutory budget.
There are two components to this risk. While lower multiples will reduce the potential need for additional funding they are likely to result in reduce uptake of efficiency measures. Conversely, while higher multiples will increase uptake, there is a greater risk additional funding may be required in later stages of the program. Given the uncertainty in relation to the most appropriate multiple, a price discovery approach is recommended throughout the program to ensure value for money is maintained whilst also achieving required participation.
Determining an appropriate multiple for the program will be based on a range of factors including the cost of infrastructure, water prices and the willingness of irrigators to participate in programs
As a result it is recommended that the program includes ongoing price discovery to continually monitor the appropriateness of the funding multiple applied. For example large changes in the water price, changes in infrastructure costs and/or the development of new technology would impact on the appropriateness of the multiple to be offered as would the level of participation.
Source: Data received from the Department of Agriculture and Water Resources, EY analysis.
1 Terms of reference 7 Opportunities for efficiency ...2 Glossary 8 Cost of efficiency measures3 Executive summary 9 Principles for negating adv ...4 Introduction 10 A program to achieve 450 ...5 Potential socio-economic ... 11 Appendices6 Program design
$1,880
$1,645
$1,462$1,316
$1,196$1,097
$1,460
$1,278$1,136
$1,022$929
$852$980
$858$762
$686 $624 $572
$0
$200
$400
$600
$800
$1,000
$1,200
$1,400
$1,600
$1,800
$2,000
1.75x 2.00x 2.25x 2.50x 2.75x 3.00x
Volu
me
Wei
ghte
d Av
erag
e Pr
ice
($)
Unweighted market multiple
Scenario comparison (presents the combinations of “VWAPs” and “multiples” at which 450GL is achieved and the statutory budget is fully utilised)
Scenario 1: High Reliability (94%LTAAY) - combinations of VWAPs andMultiples at which the target MLs(450,000ML / 94% = 478,723ML) arereached and budget is fully utilised
Scenario 2: Low Reliability (73%LTAAY) - combinations of VWAPs andMultiples at which target MLs(450,000ML / 73% = 616,438ML) arereached and budget is fully utilised
Scenario 3: Unregulated orSupplementary (49% LTAAY) -combinations of VWAPs and Multiplesat which target MLs (450,000ML / 49%= 918,367ML) are reached and budgetis fully utilised

Analysis of efficiency measures in the Murray-Darling Basin: Opportunities to recover 450GL in additional environmental water through efficiency measures by 2024, with neutral or positive socio-economic impacts | Page 34 of 307
19 January 2018 | Final Report
Program to recover 450GL with neutral or positive socio-economic impacts3 Executive summary
Based on stakeholder feedback, which suggests there is a lack of understanding and trust, it is recommended that the program begin with two-way engagement with community and industry leaders to overcome this, and increase participation moving forward. Together with investment in education and research and development projects, this would build interest in the community and promote understanding of the benefits of the program.
The program to recover 450GL with neutral or positive socio-economic impacts should include the following streams to build capacity and support:
► Substantial early-two way engagement with community and industry leaders to facilitate input and enable the co-design of programs. This would include a long-term community and industry engagement strategy that disentangles impacts from the Basin Plan, promotes trust and understanding of the need and benefits of the program. It also provides the opportunity for regions and industries to understand the benefits of taking leadership for the delivery of programs. Behavioural economic insights should be leveraged to inform this engagement.
► Investment in education, and research and development targeted at water efficiency. This includes education and training that helps irrigators undertake business planning and how to make the best decisions for their business. Similarly, research and development activities can assist industries and regions maintain or improve productivity with less water.
Together these program elements are intended to maximise take-up of the program, support the creation and maintenance of a social licence for continued water recovery, drive value for money and the achievement of the 450GL within the statutory budget and assist in avoiding and mitigating potential adversesocio-economic impacts.
► The pursuit of off-farm and urban opportunities with zero socio-economic impacts should begin immediately, together with other immediate on-farm opportunities or programs with limited (or addressable) adverse socio-economic impacts that can meet the 62GL bridge the gap target by 2019.
► A separate large-opportunities program that involves more targeted market engagement and differential pricing and is designed to maximise either value for money or the ability to achieve 450GL by 2024. Whilst larger opportunities may require a different approach, it would be undertaken as part of the broader water efficiency program, subject to input from industry and monitoring and evaluation.
► A set of on-farm programs that build on the principles of the COFFIE pilot, should be co-designed with industry or community leaders, able to be delivered in partnership, and be agile and responsive to the findings of ongoing monitoring and evaluation.
► These programs should include:
► A regional based approach to designing programs that maximises opportunities for partnership with industries and communities. Funding for programs should be initially allocated across communities and across industry areas (horticulture, cropping, dairy) so that individual communities or industries are not specifically advantaged over others.
► A monitoring and evaluation framework that allows for agile programs. Data is collected that allows for assessment of program impacts and program performance through key indicators. Programs can then be adjusted based on review of data collected. Program review should occur annually.
The water recovery programs should be designed to:
► Provide flexibility in the types of infrastructure projects funded, provided they improve water efficiency and productivity
► Be agile and adaptive, with a focus on refinement and continuous improvement, informed by data collection and assessment under a monitoring and evaluation framework. As a minimum annual review and refinement is recommended.
► Include a price discovery mechanism to determine the most appropriate multiple going forward, with features to incentivise early participation, and ongoing budget management and assessment.
A phased implementation approach is also recommended:
► Phase 1 (2018 to 2019) – community and industry engagement, investment in building capacity and interest, pursue existing and larger opportunities and developing regional and industry delivery plans.
► Phase 2 (2020 to 2024) – full implementation of all program elements and ongoing program review and refinement.
The recommended design of the program and timeframe for implementation is shown in the following page.
1 Terms of reference 7 Opportunities for efficiency ...2 Glossary 8 Cost of efficiency measures3 Executive summary 9 Principles for negating adv ...4 Introduction 10 A program to achieve 450 ...5 Potential socio-economic ... 11 Appendices6 Program design

Analysis of efficiency measures in the Murray-Darling Basin: Opportunities to recover 450GL in additional environmental water through efficiency measures by 2024, with neutral or positive socio-economic impacts | Page 35 of 307
19 January 2018 | Final Report
Program to recover 450GL with neutral or positive socio-economic impacts3 Executive summary
On-farm program► Regional delivery plans developed in partnership with industries on implementation► Education and support to identify productivity improvements and maximise benefits
post implementation
Set up a large opportunities program► Urban and industrial► Larger on-farm users► Off-farm projects► Leveraging consultants/brokers
Agile program ► Program review
and refinement every 12 months
► Funding allocated by industry
► Funding allocated for communities which buy in
Pursue existing opportunities► E.g., LWM, MIL, MI, large farming corporates, urban projects
► Execution
Investment in building capacity and interest► Whole of government support for regional development programs► Targeted R&D► Knowledge sharing between irrigators and education for farm management and
planning
Community and industry engagement to build support► Establish a community engagement strategy to build social licence for
continued water recovery► The strategy acknowledges the factors that are affecting regional communities► A clear outline of the objectives of water efficiency projects and how the impacts
will be evaluated and mitigated ► Input from community and industry on their involvement in delivery &
evaluation/evolution► Opportunity for individual communities or industry bodies to volunteer to take
leadership and ownership
Approach to socio-economic impacts
► Program design that avoids impacts including focus on off-farm, industry and local ownership, monitoring and evaluation
► Monitoring of labour impacts, particularly in relation to the viability of downstream businesses
► R,D&E to support industries and maximise benefits of participation
► Network impacts negated or infrastructure investment provided
► Support for actions identified in regional development plans
► These are projects with limited adverse impacts or those where a business case can be developed to directly mitigate any adverse impacts
► Acknowledgement of variety of socio-economic influences and impacts that have occurred to date
► Helping people understand impact pathways with ongoing impact monitoring through data collection
2018 2019 2020 2021 2022 2023 2024
Setting up for success and realising existing opportunities Agile program delivery, monitoring socio-economic impact
WES
A fu
ndin
g O
ther
exi
stin
gfu
ndin
g pr
ogra
ms
WES
A fu
ndin
g 1 Terms of reference 7 Opportunities for efficiency ...2 Glossary 8 Cost of efficiency measures3 Executive summary 9 Principles for negating adv ...4 Introduction 10 A program to achieve 450 ...5 Potential socio-economic ... 11 Appendices6 Program design
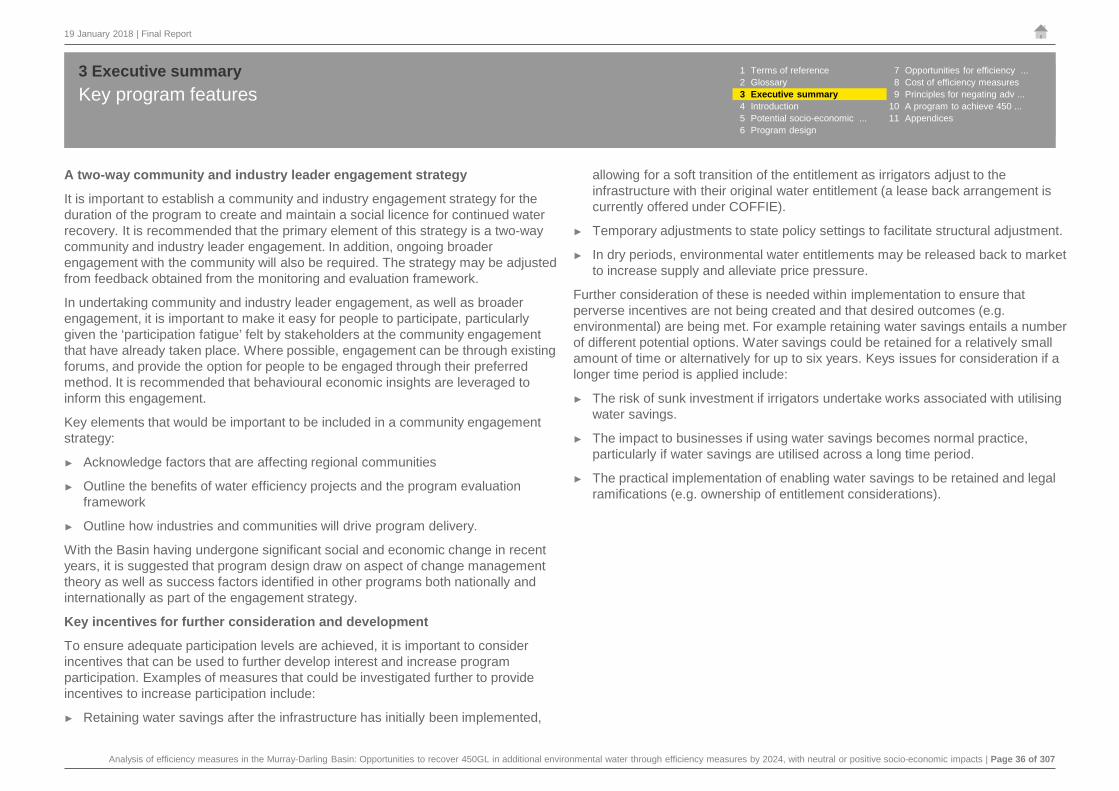
Analysis of efficiency measures in the Murray-Darling Basin: Opportunities to recover 450GL in additional environmental water through efficiency measures by 2024, with neutral or positive socio-economic impacts | Page 36 of 307
19 January 2018 | Final Report
Key program features3 Executive summary
A two-way community and industry leader engagement strategy
It is important to establish a community and industry engagement strategy for the duration of the program to create and maintain a social licence for continued water recovery. It is recommended that the primary element of this strategy is a two-way community and industry leader engagement. In addition, ongoing broader engagement with the community will also be required. The strategy may be adjusted from feedback obtained from the monitoring and evaluation framework.
In undertaking community and industry leader engagement, as well as broader engagement, it is important to make it easy for people to participate, particularly given the ‘participation fatigue’ felt by stakeholders at the community engagement that have already taken place. Where possible, engagement can be through existing forums, and provide the option for people to be engaged through their preferred method. It is recommended that behavioural economic insights are leveraged to inform this engagement.
Key elements that would be important to be included in a community engagement strategy:
► Acknowledge factors that are affecting regional communities
► Outline the benefits of water efficiency projects and the program evaluation framework
► Outline how industries and communities will drive program delivery.
With the Basin having undergone significant social and economic change in recent years, it is suggested that program design draw on aspect of change management theory as well as success factors identified in other programs both nationally and internationally as part of the engagement strategy.
Key incentives for further consideration and development
To ensure adequate participation levels are achieved, it is important to consider incentives that can be used to further develop interest and increase program participation. Examples of measures that could be investigated further to provide incentives to increase participation include:
► Retaining water savings after the infrastructure has initially been implemented,
allowing for a soft transition of the entitlement as irrigators adjust to the infrastructure with their original water entitlement (a lease back arrangement is currently offered under COFFIE).
► Temporary adjustments to state policy settings to facilitate structural adjustment.
► In dry periods, environmental water entitlements may be released back to market to increase supply and alleviate price pressure.
Further consideration of these is needed within implementation to ensure that perverse incentives are not being created and that desired outcomes (e.g. environmental) are being met. For example retaining water savings entails a number of different potential options. Water savings could be retained for a relatively small amount of time or alternatively for up to six years. Keys issues for consideration if a longer time period is applied include:
► The risk of sunk investment if irrigators undertake works associated with utilising water savings.
► The impact to businesses if using water savings becomes normal practice, particularly if water savings are utilised across a long time period.
► The practical implementation of enabling water savings to be retained and legal ramifications (e.g. ownership of entitlement considerations).
1 Terms of reference 7 Opportunities for efficiency ...2 Glossary 8 Cost of efficiency measures3 Executive summary 9 Principles for negating adv ...4 Introduction 10 A program to achieve 450 ...5 Potential socio-economic ... 11 Appendices6 Program design

Analysis of efficiency measures in the Murray-Darling Basin: Opportunities to recover 450GL in additional environmental water through efficiency measures by 2024, with neutral or positive socio-economic impacts | Page 37 of 307
19 January 2018 | Final Report
Negating adverse impacts 3 Executive summary 1 Terms of reference 7 Opportunities for efficiency ...
2 Glossary 8 Cost of efficiency measures3 Executive summary 9 Principles for negating adv ...4 Introduction 10 A program to achieve 450 ...5 Potential socio-economic ... 11 Appendices6 Program design
The table below and overleaf outlines the key features of the program to ensure adverse impacts are negated. In addition to the pre-emptive measures to prevent adverse impacts and the program elements to avoid adverse impacts outlined in the tables, the program also includes a monitoring and evaluation framework to address primary adverse impacts, to mitigate flow on adverse impacts and to help address residual risks following the application of the identified measures. The monitoring and evaluation framework includes collecting and analysing data on potential impacts on a regular basis to allow program design to be adjusted if needed.
EY acknowledges that many stakeholders are concerned about the rate of change in the agricultural sector and whether any structural adjustment measures are needed. Stakeholders also commented that there is limited analysis on the extent that education and training, and a whole of government resilience and regional development program would negate identified negative impacts from additional water recovery. As a result EY’s recommended starting point for negating potential adverse impacts is through program design elements that seek to avoid these impacts occurring and are not structural adjustment measures. EY has only started with education and training as a program design measure where there is an impact pathway with net positive impacts and where education is therefore required to help people understand how to best benefit from the impact pathway. EY’s other recommendations are pre-emptive measures that could either mitigate impacts if avoidance via program design is not effective, and/or assist in the efficacy of the program design recommendations. It is noted that these measures are secondary to the primary program measures. EY also acknowledges stakeholder comments that it cannot be assumed that state government regional development programs will be temporarily realigned to mitigate risks of a Commonwealth program. Whilst it is recommended that a whole of government approach to regional development program is undertaken, this is to ensure that community benefits are maximised. State priorities would also be taken into account in a whole of government regional development program. EY’s recommendation on the roll out of regional development plans is about communities understanding their competitive strengths and future pathways, not about government funding of structural adjustment.
.Key impact pathway Implication identified for program design
Program elements to avoid adverse impacts
Pre-emptive measures to mitigate adverse impacts
Consideration of residual risks
Impact on irrigated production
► On a 20-year NPV basis, water efficiency measures have a net productive benefit as reductions in future production are offset by increased production in the short term and the benefit of Commonwealth funding.
► Invest in community engagementto promote understanding of the impacts from water efficiency measures. Also invest in a monitoring and evaluation framework to better analyse impacts of efficiency measures.
► Supporting measures such as education and training, R&D and facilitation of knowledge sharing, should be included as part of water efficiency programs to ensure that participants are able to take advantage of productivity improvements.
► Projects should be selected to ensure that they include sufficient productivity benefits. As part of this, irrigators should be provided with sufficient tools and information to take advantage of productivity benefits.
► R&D to improve productivity.► Knowledge sharing between
irrigators.► Education for irrigators on
farm management and planning.
► The analysis suggests that there will be a positive impact and the negation measures have been designed to maximise the benefit. The potential for a residual risk only arises where there are very limited increases in short term production as a result of efficiency measures.

Analysis of efficiency measures in the Murray-Darling Basin: Opportunities to recover 450GL in additional environmental water through efficiency measures by 2024, with neutral or positive socio-economic impacts | Page 38 of 307
19 January 2018 | Final Report
Negating adverse impacts 3 Executive summary 1 Terms of reference 7 Opportunities for efficiency ...
2 Glossary 8 Cost of efficiency measures3 Executive summary 9 Principles for negating adv ...4 Introduction 10 A program to achieve 450 ...5 Potential socio-economic ... 11 Appendices6 Program design
Key impact pathway Implication identified for program design
Program elements to avoid adverse impacts
Pre-emptive measures to mitigate adverse impacts
Consideration of residual risks
Distributional impact arising from changed on-farm output decisions by participants
► Distributional impacts could be significant if certain industries or communities do not participate in water efficiency programs as they will be at a competitive disadvantage vis-à-vis those industries or communities which do, with water flowing to more productive and efficient users. However, the size and nature of this impact cannot be determined without further data.
► Mechanisms should be included within the program to encourage all industries and communities to participate equally in programs to negate distributional impacts; with equal access to funding.
► Whole of government approach to regional development, including targeted R&D projects to support structural change.
► Regional delivery plans developed in partnership with industries to increase participation.
► Program funding is allocated across communities and industries.
► Initial priority on off-farm and urban opportunities.
► R&D to improve productivity.► Whole of government
resilience and regional development program.
► Education and training for irrigators on farm management and planning, including measures to improve productivity.
► Distributional impacts to industries and communities should largely be negated via mechanisms included in the program to encourage all industries and communities to participate equally in programs and through equal access to funding.
► The potential for residual risk is to be managed through a whole of government approach to regional development and ongoing monitoring and evaluation to assess participation and monitor impacts.

Analysis of efficiency measures in the Murray-Darling Basin: Opportunities to recover 450GL in additional environmental water through efficiency measures by 2024, with neutral or positive socio-economic impacts | Page 39 of 307
19 January 2018 | Final Report
Negating adverse impacts3 Executive summary 1 Terms of reference 7 Opportunities for efficiency ...
2 Glossary 8 Cost of efficiency measures3 Executive summary 9 Principles for negating adv ...4 Introduction 10 A program to achieve 450 ...5 Potential socio-economic ... 11 Appendices6 Program design
Key impact pathway Implication identified for program design
Program elements to avoid adverse impacts
Pre-emptive measures to mitigate adverse impacts
Consideration of residual risks
Impact on network charges
► On-farm water efficiency measures are unlikely to significantly impact on network charges. In the short to medium term, termination fees should largely negate pricing impacts to irrigators.
► Integration of on-farm and off-farm efficiency measures to allow maximum efficiency of both the network and on-farm. This may include the consolidation of IIOs where practical.
► Integrated implementation of on-farm and off-farm efficiency measures to allow implementation of infrastructure that maximises the efficiency of the network and on-farm.
► Additional investment in networks where it can be demonstrated through a business case that water efficiency measures have impacted their costs (such as where additional investment is needed to maintain delivery flow rates) or revenue (such as reduced fees).
► Use of environmental water to maintain flows/provide revenue
► Consolidate IIOs where practicable
► The program includes the ability of impacted networks to put forward business cases for additional investment where it can be demonstrated that water efficiency measures have impacted their costs (such as where additional investment is needed to maintain delivery flow rates) or revenue (such as reduced fees). As a result there should be no residual risk associated with this impact pathway.

Analysis of efficiency measures in the Murray-Darling Basin: Opportunities to recover 450GL in additional environmental water through efficiency measures by 2024, with neutral or positive socio-economic impacts | Page 40 of 307
19 January 2018 | Final Report
Negating adverse impacts3 Executive summary 1 Terms of reference 7 Opportunities for efficiency ...
2 Glossary 8 Cost of efficiency measures3 Executive summary 9 Principles for negating adv ...4 Introduction 10 A program to achieve 450 ...5 Potential socio-economic ... 11 Appendices6 Program design
Key impact pathway Implication identified for program design
Program elements to avoid adverse impacts
Pre-emptive measures to mitigate adverse impacts
Consideration of residual risks
Impact on labour productivity and employment
► Both on and off-farm efficiency projects are associated with increasing labour productivity. However, based on the data available there is. However while there is insufficient evidence to conclusively determine the net impacts on employment, the evidence gathered to date suggests that employment impacts are likely to be limited.
► Given the limited data and evidence, the impact on labour productivity and employment needs to be monitored on an ongoing basis with a particular focus on tipping points for industries.
► Whole of government approach to regional development, including development of employees with appropriate skills within communities (or the attraction of those people with required skills).
► All communities are to have equal access to program funding.
► Program funding is allocated across communities and industries.
► Initial priority on off-farm and urban opportunities.
► More coordinated use of the IIO system, for example through greater use of IIO systems to deliver environmental water
► Whole of government resilience and regional development program
► Both positive and adverse impacts on labour productivity and employment have been identified. To manage this the program has included a whole of government approach to regional development and the ongoing monitoring and evaluation of impacts, with an agile approach suggested to ensure program design is responsive to issues identified.

Analysis of efficiency measures in the Murray-Darling Basin: Opportunities to recover 450GL in additional environmental water through efficiency measures by 2024, with neutral or positive socio-economic impacts | Page 41 of 307
19 January 2018 | Final Report
Implementation3 Executive summary
Next steps in program implementationPursuing existing opportunities
Off-farm opportunities that have been put forward by stakeholders during consultations and urban opportunities should be developed as a priority, these are discussed in Chapter 6. The adjacent table outlines next steps in pursuing these opportunities. Further, DAWR has received unsolicited proposals of up to 66GL across the Basin, these should also be pursued as a priority in order to achieve 62GL prior to 2019. To ensure these opportunities are progressed quickly some financial support and/or government expertise and resource support may be needed to undertake preliminary activities.
The development of urban opportunities require strong commitment and cooperation across governments. Particularly important is an open-book approach to obtaining information in order to undertake the relevant analysis. Financial support may also be needed to develop these proposals in an expedited manner.
Next steps in pursuing existing opportunities
Project Next steps
Adelaide Desalination Plant ► Undertake cost benefit analysis► Verify cost of producing 50GL► Develop options ► Develop initial business case
Icon Water ► Review existing analysis on proposed projects
► Review forecast population growth for Canberra region and water requirement
► Develop options for infrastructure projects that can support sustained growth of the Canberra region and transfer 29GL to the Commonwealth.
► Note relevant water resource plan need to be amended prior to implementation of projects
► Choose delivery partner► Consult with stakeholders► Develop initial business cases, which could
include establishing a fund to support future infrastructure projects.
LMW off-farm and private diverters ► Consult with the IIO
► IIO choose delivery partner/ technical expert ► Consult with stakeholders► Develop options for infrastructure solutions► Develop initial business cases
MI off-farm
MIL off-farm
WMI metering
1 Terms of reference 7 Opportunities for efficiency ...2 Glossary 8 Cost of efficiency measures3 Executive summary 9 Principles for negating adv ...4 Introduction 10 A program to achieve 450 ...5 Potential socio-economic ... 11 Appendices6 Program design

Analysis of efficiency measures in the Murray-Darling Basin: Opportunities to recover 450GL in additional environmental water through efficiency measures by 2024, with neutral or positive socio-economic impacts | Page 42 of 307
19 January 2018 | Final Report
Implementation3 Executive summary
Options for immediate implementation of COFFIE to support on-farm water recovery to achieve 62GL by 2019
The adjacent table outlines some options for rolling out COFFIE in order to achieve 62GL by 2019, and to maintain momentum for achievement of 450GL by 2024.
EY’s recommendation is to undertake capacity building and develop regional delivery plans in partnership with industries as part of on-farm programs. Based on stakeholder consultations, time and resources invested to obtain community and industry buy-in is important for the success of the program. The base case reflects this recommendation.
Options 1, 2 and 3 apply in addition to the base case and progressively increase in the scale of COFFIE implementation, ranging from running an early expression of interest to a program where the volume to be recovered is capped. The trade-off from option 1 to option 3, as the scale of COFFIE implementation increases, is that while the larger scale COFFIE implementation maximises the ability to achieve 62GL by 2019, there is the risk that communities and industries do not support the program.
Options for implementing COFFIE
Options
Risk that buy-in and trust from industries and communities can be achieved
Risk that 62GL can be achieved by 2019
Comment
Base case: Invest in building capacity and interest
► Maximises ability to design program based on community and industry engagement
1. Run an early expression of interest
► Allows price discovery
► Low risk approach that builds on option 1
2. Run smaller COFFIE pilots in selected catchments
► Opportunity for CMAs or other local groups to take the lead
3. Run COFFIE where the volume to be recovered under the program is capped
► Maximises ability to achieve 62GL by 2019
► Messaging would need to be carefully managed as this approach has the potential to derail the capacity building and community and industry leadership buy-in approach
1 Terms of reference 7 Opportunities for efficiency ...2 Glossary 8 Cost of efficiency measures3 Executive summary 9 Principles for negating adv ...4 Introduction 10 A program to achieve 450 ...5 Potential socio-economic ... 11 Appendices6 Program design

Analysis of efficiency measures in the Murray-Darling Basin: Opportunities to recover 450GL in additional environmental water through efficiency measures by 2024, with neutral or positive socio-economic impacts | Page 43 of 307
19 January 2018 | Final Report
Risks and mitigation strategies3 Executive summary
Risks Mitigation Strategies
The ability to recover the specified water within the required timeframe and statutory budget
There is a risk that the volume of water may not be able to be recovered in the required timeframe and budget due participation levels and/or a potential lack of opportunities.
Purse existing opportunities as a priority and invest in upfront engagement with community and industry leaders
Program design elements includes early two-way engagement with community and industry leaders to enable input and facilitate co-design. In addition it is suggested that this engagement draws on behavioural economic insights to maximise success. Flexibility in the types of projects to be funded is recommended, provided they enhance water efficiency and productivity. A price discovery mechanism is also recommended to continually assess value for money and determine the most appropriate funding multiple.
Stakeholder acceptance of water recovery and willingness to engage in the program
The ability to recover water within the timeframe and budget may be exacerbated by limited understanding of water recovery objectives and processes and a lack of trust. Stakeholders are experiencing consultation fatigue but want greater clarity and input going forward. Ongoing complexities, diverse viewpoints and inconsistent messaging from various sources has left communities and individuals disengaged and mistrusting of authority. As a result, they may not engage in future efficiency measures.
Investment in upfront community and industry leader engagement and a partnership approach to program design
As per above, early two-way engagement with community and industry leaders is recommended. In addition a partnership approach where industry and communities work with Governments during implementation will enhance buy-in.
Adverse socio-economic impacts are not negated through program design and mitigation
Program design aims to negate adverse socio-economic impacts. However, noting the data limitations and the variety of ways in which impacts manifest there is a risk that adverse socio-economic impacts occur and are not addressed through program design and mitigation.
Focus on data collection, monitoring and ongoing assessment
Greater focus should be placed on centrally collecting information and data specifically relating to water efficiency measures. This data should enable the monitoring of impacts and direct negation measures and changes to program design on an ongoing basis.
1 Terms of reference 7 Opportunities for efficiency ...2 Glossary 8 Cost of efficiency measures3 Executive summary 9 Principles for negating adv ...4 Introduction 10 A program to achieve 450 ...5 Potential socio-economic ... 11 Appendices6 Program design

Analysis of efficiency measures in the Murray-Darling Basin: Opportunities to recover 450GL in additional environmental water through efficiency measures by 2024, with neutral or positive socio-economic impacts | Page 44 of 307
19 January 2018 | Final Report
Conclusions3 Executive summary
From the analysis and discussions undertaken, and assuming the recommendations in the report are implemented, there is sufficient evidence the 450 GL can likely be recovered from water efficiency projects on a neutral or positive socio-economic basis.
However, there are a number of overarching risks associated with achieving the desired recovery including in relation to:
► The ability to recover the specified water within the statutory budget and the required timeframe
► Program participation levels, particularly in relation to on-farm projects
► Stakeholder perceptions and understanding of the rationale for water recovery
► The extent that socio-economic impacts are addressed through program design and mitigation.
Key recommendations from our report to address these risks are:
► Investment in upfront engagement with community and industry leaders
► A partnership approach to program delivery
► An agile and adaptive program delivery approach
► Extensive monitoring and evaluation informed by enhanced data collection.
1 Terms of reference 7 Opportunities for efficiency ...2 Glossary 8 Cost of efficiency measures3 Executive summary 9 Principles for negating adv ...4 Introduction 10 A program to achieve 450 ...5 Potential socio-economic ... 11 Appendices6 Program design

Analysis of efficiency measures in the Murray-Darling Basin: Opportunities to recover 450GL in additional environmental water through efficiency measures by 2024, with neutral or positive socio-economic impacts | Page 45 of 307
19 January 2018 | Final Report
Overview3 Executive summary
Structure of this report
This report is structured as follows:
► Chapter 4: background information on the Murray-Darling Basin and context for this project
► Chapter 5: potential socio-economics impacts from efficiency measures at different scales.
► Chapter 6: program design principles and considerations based on lessons learnt from previous programs and stakeholder feedback.
► Chapter 7: opportunities for efficiency measures as nominated by stakeholders and analysed by EY.
► Chapter 8: cost of previous efficiency projects and implications for funding multiple for the program.
► Chapter 9: principles for mitigation adverse impacts from efficiency measures based on literature review and case studies.
► Chapter 10: the design of a program to recover 450GL with neutral or positive socio-economic impacts.
1 Terms of reference 7 Opportunities for efficiency ...2 Glossary 8 Cost of efficiency measures3 Executive summary 9 Principles for negating adv ...4 Introduction 10 A program to achieve 450 ...5 Potential socio-economic ... 11 Appendices6 Program design

Analysis of efficiency measures in the Murray-Darling Basin: Opportunities to recover 450GL in additional environmental water through efficiency measures by 2024, with neutral or positive socio-economic impacts | Page 46 of 307
Introduction
4
In this section Page
Overview 47
Murray-Darling Basin – Need for a Plan 48
Murray-Darling Basin Plan overview 49
State of play 52
How this project fits into other work undertaken 53
External factors 54
EY's task 55
EY's approach 56

Analysis of efficiency measures in the Murray-Darling Basin: Opportunities to recover 450GL in additional environmental water through efficiency measures by 2024, with neutral or positive socio-economic impacts | Page 47 of 307
19 January 2018 | Final Report
Overview4 Introduction
1 This follows an amendment to the Basin Plan in November 2017 which reduced the water recovery target in the Northern Basin by 70GL.2 Following assessment of the environmental outcomes that could be achieved through a package of supply measures that will improve river operations and infrastructure. This would have the effect of reducing the “bridging the gap” target.
The Murray-Darling Basin The Basin Plan and “bridging the gap” Environmental outcomes from anadditional 450GL
► The Murray-Darling Basin covers more than 1 million square kilometres over four states and one territory.
► There are approximately 2.11 million people who live in the Basin and use the water resource.
► Early unplanned development in the Basin led to an over-allocation of water rights at the expense of its environmental needs. The Murray-Darling Basin has now undergone several decades of water reform, including the establishment of a water market.
► During the Millennium Drought, the need for reform over the over-allocation and overuse of water became urgent, and was addressed by the Water Act 2007, which included the Basin Plan.
► Coordination across the relevant state and territory governments led to the 2012 Basin Plan, as an agreement aspiring to “a healthy and working Murray-Darling Basin”.
► The Plan requires 2,680GL of water be recovered by 2019 (“bridge the gap”) from household, industry and farm use through water purchase and infrastructure modernisation1.
► The Basin Plan provides for 450GL of water recovery in addition to the SDL, through efficiency measures. This water would benefit the environment through:► Reducing salinity levels in the Coorong and Lower
Lakes► Ensuring the mouth of the River Murray is open in
at least 95% of the time► Providing opportunities for environmental watering
of 35,000 hectares of floodplains in SA, NSW, and VIC to improve the health of forests, fish and bird habitat, as well as replenish groundwater.
State of play Other factors affecting communities EY’s task
► As of 31 October 2017, approximately 2,107.7GL of water has been secured by the Commonwealth for the Basin's environment.
► Water efficiency projects, and supply projects provide flexibility in how the SDLs are achieved, and help ensure the equivalent environmental benefits from 3,200GL are realised with less water recovery.
► The Murray-Darling Basin Authority (MDBA) has recommended an adjustment of 605GL to the surface water SDLs in the Southern Basin.
► There are a multitude of independent factors outside the Basin which impact Basin communities. These include:► Commodity prices► Climate► Urbanisation► Technology.
► To conduct a review on how to best design, target and resource a program for efficiency measures to recover 450GL of water with neutral or improved socio-economic outcomes.
► This final report has involved data collection, analysis, extensive stakeholder consultation and delivery of preliminary findings.
► Throughout the process, EY has engaged with an expert Advisory Panel nominated by each state, territory and the Basin Officials Committee.
1 Terms of reference 7 Opportunities for efficiency ...2 Glossary 8 Cost of efficiency measures3 Executive summary 9 Principles for negating adv ...4 Introduction 10 A program to achieve 450 ...5 Potential socio-economic ... 11 Appendices6 Program design

Analysis of efficiency measures in the Murray-Darling Basin: Opportunities to recover 450GL in additional environmental water through efficiency measures by 2024, with neutral or positive socio-economic impacts | Page 48 of 307
19 January 2018 | Final Report
What is the Murray-Darling Basin?
The Murray-Darling Basin (MDB) is a river system located in the south-east of Australia, covering an area in excess of 1 million square kilometres1. The Basin covers four states and one territory, SA, VIC, NSW, QLD and ACT.
Approximately 2.11 million people live in the Basin and use its water resources directly. However, there are many more Australians who benefit from and use the system by consuming the produce of the Basin or by visiting its many recreational, cultural and historic places2. In 2012-13, the Basin produced $6.7 billion worth of irrigated agricultural output, and accounted for over 50% of Australia's irrigated produce3.
Why was the Basin Plan developed?4
Throughout the twentieth century, investment from both government and the private sector supported the expansion and development of agriculture within the Basin. The development of the agriculture sector and rights to water, prior to the Water Act 2007 had unintended consequences on the Basin's environment. The health of the system was declining and no action would have resulted in further degradation of water dependent eco-systems. This in turn would have had negative consequences for the communities that depended on it.
Water reform in the Murray-Darling Basin began several decades ago through COAG processes and state reforms, followed by the National Water Initiative (NWI). Reform has included the establishment of a water market to allow trade of allocation and entitlements.
The Millennium Drought saw annual rainfall within south-eastern Australia drop 73mm below average. Additionally, aging infrastructure resulted in transmission and other losses, lowering and depleting water available for consumption. Overall changes in the quality and quantity of water within the Basin have social and economic implications. Over-allocation resulted in reduced water reliability with some irrigators receiving limited or no water during dry conditions. Poor water quality limited water availability for stock and horticulture and damaged equipment due to the high salinity.
Murray-Darling Basin – Need for a Plan4 Introduction
1 MDBA 2009, Socio-Economic Context for the Murray–Darling Basin.2 ibid.3 MDBA 2011, Economy of the Basin, https://www.mdba.gov.au/discover-basin/people/economy-basin. 4 MDBA 2012, Regulation impact statement Basin Plan, intro.
Source: MDBA.
MDB catchments
1 Terms of reference 7 Opportunities for efficiency ...2 Glossary 8 Cost of efficiency measures3 Executive summary 9 Principles for negating adv ...4 Introduction 10 A program to achieve 450 ...5 Potential socio-economic ... 11 Appendices6 Program design

Analysis of efficiency measures in the Murray-Darling Basin: Opportunities to recover 450GL in additional environmental water through efficiency measures by 2024, with neutral or positive socio-economic impacts | Page 49 of 307
19 January 2018 | Final Report
Water Act 2007 1
The Water Act 2007 (“the Act”) was enacted to address the over-allocation and overuse of Basin water to people and industry. The Act enables the Commonwealth, in conjunction with Basin States, to manage the Basin water resources in the national interest. The aim is to ensure sufficient water is returned to the environment to create a sustainable water supply for ongoing use. The Act includes a specific objective to “ensure the return to environmentally sustainable levels of extraction for water resources that are over-allocated or overused”. At the same time the Act aims to “improve water security for all users of Basin water resources”. It also gives effect to relevant international agreements to promote the use and management of Basin water resources to optimise economic, social and environmental outcomes.
Objectives of the Basin Plan
The Basin Plan was established in 2012 as a requirement of the Act. Besides achieving a healthy and working Murray-Darling Basin, key elements of the Act include:
► A maximum long-term annual average quantity of water that can be taken on a sustainable basis
► A sustainable diversion limit adjustment mechanism
► An environmental watering plan
► Requirements for Basin state water resource plans to be accredited by the Commonwealth Minister
► A provision for critical human water needs
► Rules for the trading and transfer of tradeable water rights in the Basin.
In summary, the Plan seeks to restore and protect the water-dependent ecosystems, make them resilient to threats, and support productive and resilient water-dependent industries.
Sustainable Diversion Limits2
The Basin Plan sets new limits on the amount of water that can be taken for consumptive use by effectively placing a “cap” on water use known as the sustainable diversion limit (SDL). The SDL is broken down for each catchment and aquifer in the Basin.
Consistent with government strategy and based on science, the SDL balances the needs of the environment with the ongoing need of communities and industry. The MDBA determined that on average, 13,693GL is taken from the Basin every year for consumptive use. The MDBA has assessed that the long-term average environmentally sustainable level of uptake of surface water is 10,943GL per year (GL/y).
The Plan requires 2,680GL be recovered from the 2009 baseline diversion level. This recovery target was reduced by 70GL in the Northern Basin following 2017 amendments to the Basin Plan following the Northern Basin Review. Groundwater was found to be at a sustainable level in all but one of the 664 groundwater units within the basin. The Central Condamine Alluvium groundwater recovery requires recovery of 40.4GL. The recovered entitlements will be retained in the aquifer.
Murray-Darling Basin Plan overview4 Introduction
1 MDBA 2009, Socio-Economic Context for the Murray–Darling Basin.2 MDBA n.d., ‘Whats in the Basin Plan?’, Murray-Darling Basin Authority, viewed 30th October 2017, retrieved from: https://www.mdba.gov.au/basin-plan/whats-basin-plan.
1 Terms of reference 7 Opportunities for efficiency ...2 Glossary 8 Cost of efficiency measures3 Executive summary 9 Principles for negating adv ...4 Introduction 10 A program to achieve 450 ...5 Potential socio-economic ... 11 Appendices6 Program design

Analysis of efficiency measures in the Murray-Darling Basin: Opportunities to recover 450GL in additional environmental water through efficiency measures by 2024, with neutral or positive socio-economic impacts | Page 50 of 307
19 January 2018 | Final Report
Sustainable Diversion Limits Adjustment Mechanism
The Basin Plan provides flexibility in how the SDL can be met through a mechanism that could reduce the volume of water to be recovered. The mechanism takes into account more efficient ways to deliver water for the environment, as well as more efficient ways to use water in industries and communities.
The mechanism provides for a net 5% adjustment of the Basin-wide surface water SDL through:
► Supply measures to encourage more efficient management of the Basin's rivers, allowing more water for consumptive use while maintaining equivalent environmental outcomes. For example, installing regulators on a floodplain to enable inundation events using a smaller than usual amount of water.
► Efficiency measures to make water delivery systems more efficient allowing more water available for the environment with neutral or positive social economic outcomes. For example, lining irrigation channels and installing an automated sprinkler system.
The simple principle behind the sustainable diversion limit adjustment mechanism is to do more with less. The same or equivalent outcomes for the environment will be achieved with the need to recover less water.
If Basin Plan environmental outcomes can be achieved with less water, more water can remain in the system for other users including households, industry and irrigated agriculture. Similarly, if farming practices can be made more efficient, more water can be made available for the environment.
Undertaking both supply and efficiency measures will not only decrease the water recovery target, but also provide the added benefit of increasing the efficiency of existing water infrastructure.
In addition, it has been found that constraints projects can operate similar to supply measure projects by providing for equivalent environmental outcomes using less water. As a result, State Governments have also nominated some constraint relaxation projects as supply measures.
Constraint measures overcome some of the barriers that impede delivering environmental watering including physical features such as bridges and crossings and management constraints such as river operating rules.
Through the implementation of the sustainable diversion adjustment mechanism and by subsequent legislative amendments to be adopted by the Minister for Water Resources, the water recovery target in the Southern Basin would be reduced by up to 605GL.
The 605GL reduction is made possible by more efficient management of the Basin's rivers through supply measures and by innovative water saving projects on-farm, off-farm and in urban areas through efficiency measures. This approach is also intended to increase the productivity of irrigated agriculture in the Basin.
The sustainable diversion adjustment mechanism also allows delivery of an additional 450GL of water through efficiency measures in ways that have neutral or positive socio-economic outcomes. This volume is around 4% of total water delivery rights on issue and is likely to achieve enhanced environmental outcomes in the Basin.
When 450GL of efficiency measures is combined with the implementation of the 605GL from supply measures, the environmental benefits that could be achieved from 3,200GL of water can instead be achieved with 2,525GL of water recovery.
Murray-Darling Basin Plan overview4 Introduction 1 Terms of reference 7 Opportunities for efficiency ...
2 Glossary 8 Cost of efficiency measures3 Executive summary 9 Principles for negating adv ...4 Introduction 10 A program to achieve 450 ...5 Potential socio-economic ... 11 Appendices6 Program design

Analysis of efficiency measures in the Murray-Darling Basin: Opportunities to recover 450GL in additional environmental water through efficiency measures by 2024, with neutral or positive socio-economic impacts | Page 51 of 307
19 January 2018 | Final Report
Enhanced environmental outcomes from implementing the SDL adjustment mechanism
Schedule 5 of the Basin Plan sets out the additional enhanced environmental outcomes from modelling the recovery of 3,200GL per year in the Basin. Effectively this is the enhanced environmental outcomes that can be achieved if the SDL adjustment mechanism is implemented, but with a water recovery target of just 2,525GL. This is because supply and efficiency measures operate to optimise water use through clever and innovative projects.
The enhanced environmental outcomes from recovering an additional 450GL are set out in Schedule 5 provided in the adjacent table.
Under Part 2AA of the Act, the Water for the Environment Special Account (WESA) was set up to provide funding for the recovery of 450GL through efficiency measures and alleviating constraints.
The WESA enables payment to address detrimental social or economic impacts associated with these activities should that be necessary.
Murray-Darling Basin Plan overview4 Introduction
Schedule 5 - Enhanced environmental outcomes referred to in paragraph 7.09(e)
See paragraph 7.09(e) of the Act
1 The outcomes listed below are ones that will be pursued under the Commonwealth's program to increase the volume of water resources available for environmental use by 450GL per year.
2 The outcomes that will be pursued are:
a Further reducing salinity levels in the Coorong and Lower Lakes so that improved water quality contributes to the health of macroinvertebrates, fish and plants that form important parts of the food chain, for example:
(i) Maximum average daily salinity in the Coorong South Lagoon is less than 100 grams per litre
(ii) Maximum average daily salinity in the Coorong North Lagoon is less than 50 grams per litre
(iii) Average daily salinity in Lake Alexandrina is less than 1000EC for 95% of years and 1500EC all of the time
b Keeping water levels in the Lower Lakes above 0.4 metres AHD for 95% of the time and above 0.0 metres AHD at all times to help maintain flows to the Coorong, prevent acidification, prevent acid drainage and prevent riverbank collapse below Lock 1
c Ensuring the mouth of the Riser Murray is open without the need for dredging in at least 95% of years, with flows every year through the Murray Mouth Barrages
d Exporting 2 million tonnes per year of salt from the Murray-Darling Basin as a long-term average
e Increasing flows through the barrages to the Coorong and supporting more years where critical fish migrations can occur
f In conjunction with removing or easing constraints, providing opportunities for environmental watering of an additional 35,000 ha of floodplain in South Australia, New South Wales and Victoria, improving the health of forests and fish and bird habitat, imposing the connection to the river, and replenishing groundwater
g Achieving enhanced in-stream outcomes and improved connections with low to middle level floodplain and habitats adjacent to rivers in the Southern Murray-Darling Basin.
1 Terms of reference 7 Opportunities for efficiency ...2 Glossary 8 Cost of efficiency measures3 Executive summary 9 Principles for negating adv ...4 Introduction 10 A program to achieve 450 ...5 Potential socio-economic ... 11 Appendices6 Program design

Analysis of efficiency measures in the Murray-Darling Basin: Opportunities to recover 450GL in additional environmental water through efficiency measures by 2024, with neutral or positive socio-economic impacts | Page 52 of 307
19 January 2018 | Final Report
State of play4 Introduction
Bridging the gap to the sustainable diversion limit► As of the 31 October 2017, 2,107.7GL has been recovered or
contracted to “bridge the gap” to the surface water SDLs.► The MDBA has recommended an adjustment of 605GL to the
surface water SDLs in the Southern Basin following an assessment of the package of supply measures agreed by Basin governments. The adjustment is constrained by a 5% Basin-wide adjustment limit (that is, 543GL), meaning that 62GL of efficiency measures need to be implemented by 30 June 2019 to realise the full supply contribution. This adjustment will only take effect if the Commonwealth Minister for Water adopts the Basin Plan legislative amendments.
► Amendments to the Basin Plan in November 2017 reduced the water recovery target in the Northern Basin by 70GL lessoning the Basin water recovery target to 2,680GL. The amendments are tabled in the Federal Parliament and are the subject of a disallowance motion.
450GL Efficiency measures (focus of this project)► The water efficiency program is intended to be implemented in a way
that complements existing programs and does not involve water purchasing or target particular communities.
► The 450GL of water to be recovered from efficiency projects is around 4% of total water delivery rights currently issued.
► The efficiency measures will build on considerable government investment under the Basin Plan to return water savings to the environment including: ► Off-farm irrigation systems► Improving water use efficiency on farms► Improving the ecological health and restoring natural flows► Water saving municipal projects► Water purchasing► Environmental works► Changes to river operations.
Water Recovery Strategy Program and Funding Source
450GL additional environmental water recover through Efficiency Measures where there are neutral or improved
social and economic outcomes
Supply Measures Offset Gap may be reduced by 605GL as
recommended by the MDBA
Purchase < 1500GL
Infrastructure
> 650GL
Other Commonwealth Recoveries (including SARMSP) 49GL*
State Recoveries 162GL*
2680_
2075_ SDL
Adju
stm
ent M
echa
nism
Brid
ging
the
Gap
to S
urfa
ce W
ater
SD
Ls
Water for the Environment Special Account
$1.775 bn (including funding for Constraints)
to 2024
Supply Measuresup to $1.3 bn to 2024
Purchase (Restoring the Balance)
up to $3.1 bn
Infrastructure
Up to $4 bn^
Various including SARMSP
State run projects
SDL
Adju
stm
ent M
echa
nism
Sust
aina
ble
Rur
al W
ater
use
d an
d In
frast
ruct
ure
Prog
ram
Source: DAWR.
1 Terms of reference 7 Opportunities for efficiency ...2 Glossary 8 Cost of efficiency measures3 Executive summary 9 Principles for negating adv ...4 Introduction 10 A program to achieve 450 ...5 Potential socio-economic ... 11 Appendices6 Program design

Analysis of efficiency measures in the Murray-Darling Basin: Opportunities to recover 450GL in additional environmental water through efficiency measures by 2024, with neutral or positive socio-economic impacts | Page 53 of 307
19 January 2018 | Final Report
Other reviews and their relevance to the EY review
EY has been engaged by DAWR, on behalf of the Murray-Darling Basin Ministerial Council, to investigate the recovery of an additional 450GL of water through efficiency measures with neutral or improved socio-economic outcomes. This must take into account any information arising from MDBA reviews into social, economic and environmental outcomes of the implementation of the Basin Plan.
The MDBA is required to assess the effectiveness of the Basin Plan against its objectives and outcomes after the first five years, and then thereafter every 10 years. The key questions that should be assessed are also set out in the Basin Plan, and include the question of how the Plan has contributed to changes to the environmental, social and economic conditions in the Murray-Darling Basin.
The following key pieces of Basin Plan implementation have been conducted to date or are currently in progress.
Northern Basin Review1
The Northern Basin Review, completed in November 2016 by the MDBA, explores the relationship between the economic, social and environmental outcomes in the region as a result of the Basin Plan. The outcomes for businesses, communities and the environment under different water recovery targets have been analysed and formed the basis of recommend changes. The primary recommendation was the reduction of the recovery water target from 390GL to 320GL. This reduction of 70GL is now law.
2017 Basin Plan Evaluation
As it has been five years since the Basin Plan was adopted, an interim evaluation of the Basin Plan is currently being conducted by the MDBA on all aspects of Basin Plan implementation and associated outcomes. The evaluation will examine the economic, environmental, social and cultural outcomes from the Basin Plan against what was expected to be seen five years in.
SDL Adjustment Determination
The MDBA has recommended an adjustment of 605GL to the surface water SDLs in the Southern Basin following an assessment of the package of supply measures agreed by Basin governments. The adjustment is constrained by a 5% Basin-wide adjustment limit (that is, 543GL), meaning that 62GL of efficiency measures need to be implemented by 30 June 2019 to realise the full supply contribution. This adjustment will only take effect if the Commonwealth Minister for Water adopts the Basin Plan legislative amendments.
How this project fits into other work undertaken4 Introduction
1 MDBA 2016, Northern Basin Review.
1 Terms of reference 7 Opportunities for efficiency ...2 Glossary 8 Cost of efficiency measures3 Executive summary 9 Principles for negating adv ...4 Introduction 10 A program to achieve 450 ...5 Potential socio-economic ... 11 Appendices6 Program design

Analysis of efficiency measures in the Murray-Darling Basin: Opportunities to recover 450GL in additional environmental water through efficiency measures by 2024, with neutral or positive socio-economic impacts | Page 54 of 307
19 January 2018 | Final Report
Other factors affecting the Basin
There are a multitude of factors, beyond the establishment SDLs and water recovery, which impact Basin communities. The Basin, its communities and industries will continue to face impacts from many influences. These include: commodity drivers, climate trends, urbanisation, rural and regional population change, technology, as well as the Basin Plan.
Climate
Climate change studies have concluded there will be changes in Australian seasonal rainfall, including lower rainfall in southern Australia and more severe droughts and floods. Studies in the Basin over the last 10 years have shown that changes in climate could have a significant impact on water resources1. Research conducted by the Victorian Climate Initiative (VicCI), in partnership with the BoM and CSIRO, has found multiple lines of evidence to suggest a drier future for the state2. Across the Basin, the seasonal variation in climate will make farm planning more difficult in establishing annual or perennial crops that have no guarantee of water. The seasonal variability of rainfall and weather has elevated the risk profile of farmers, reducing certainty of climatic conditions for their crops. It is important to consider the extent that water efficiency measures may provide resilience against climate change as well as the extent to which climate change affects identified impacts.
Urbanisation
The structure of Australia’s population is changing, urban populations are growing and there is an overall trend towards an aging population. Declining demand for on-farm labour is causing the population of regional communities to diminish. As this occurs, demand for local services is also reduced, resulting in populations migrating to urban areas to access opportunities.
Water Market
The water market in the Basin has gradually evolved since government reforms allowed the trading of water allocation and entitlements in the 1980s. Improvementsin the market trade rules, lower transaction costs and increases in water scarcity has increased trading volumes.3 Water trading is generally permitted providing it is
physically possible to do so.
Commodity Prices
Commodity prices and the value of the Australian dollar have a significant effect on the economic success of the Basin region.
Water Entitlements and Allocations
► Water entitlements are a permanent share of the total amount of water available within a system.4
► A water allocation is the specific volume of water allocated to water access entitlements in a given water accounting period. This is done by a State government agency, taking into account the volume of water in storage.7
Key Market Drivers5
► Rainfall and allocation volumes - rainfall can reduce the requirement and demand for water resources.
► Environmental purchases - the Australian Government recovered a portion of the water entitlement through a combination of market purchases and infrastructure projects.
► Carryover rule changes - allows allocated water to be stored from year to year.► Trade restrictions - the ability to buy and sell water within a region.► Commodity prices and land use change - market price of key irrigation
commodities will influence price and market.Technology
Significant advances in technology within the fields of digital genetics and materials science has changed the way the sector produces and transports food and fibre7. Common technology trends include:
► Genetic modification, allowing increased yields► Automation, decreasing demand for labour► Data and connectivity, increasing accuracy, efficiency and accountability.8
As technological advancement continues, services required in the agricultural industry will change accordingly.
External factors4 Introduction
1.MDBA 2016, Northern Basin Review.2 VicCI 2017, A synthesis of findings from the Victorian Climate Initiative, https://www.water.vic.gov.au/__data/assets/pdf_file/0030/76197/VicCI-25-07-17-MR.pdf. 3 ABARES 2016, Lessons from the water market.
4 MDBA 2015, Water markets in the Murray–Darling Basin.5 ABARES 2016, Op.Cit.6 ibid.7 Hajkowicz, S. and Eady, S. 2015, Rural Industry Futures.8 OECD 2016, OECD Science, Technology and Innovation Outlook 2016, https://www.oecd.org/sti/Megatrends%20affecting%20science,%20technology%20and%20innovation.pdf.
1 Terms of reference 7 Opportunities for efficiency ...2 Glossary 8 Cost of efficiency measures3 Executive summary 9 Principles for negating adv ...4 Introduction 10 A program to achieve 450 ...5 Potential socio-economic ... 11 Appendices6 Program design
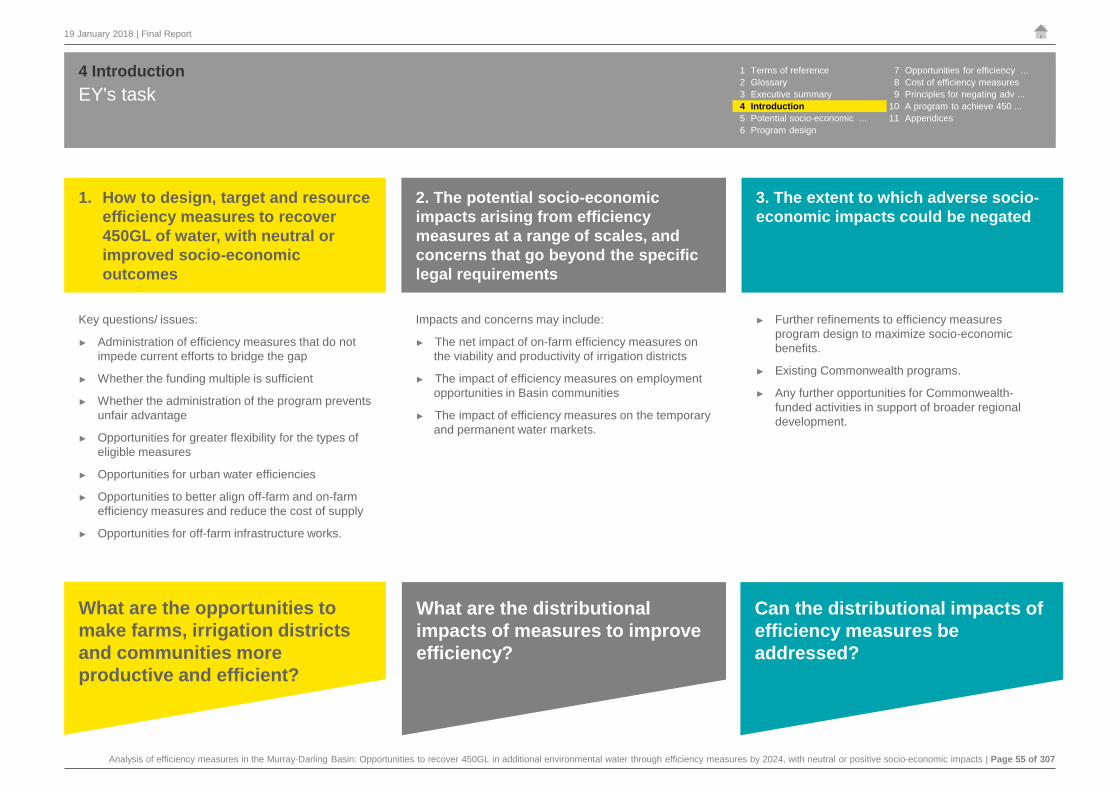
Analysis of efficiency measures in the Murray-Darling Basin: Opportunities to recover 450GL in additional environmental water through efficiency measures by 2024, with neutral or positive socio-economic impacts | Page 55 of 307
19 January 2018 | Final Report
EY's task4 Introduction
1. How to design, target and resource efficiency measures to recover 450GL of water, with neutral or improved socio-economic outcomes
Key questions/ issues:
► Administration of efficiency measures that do not impede current efforts to bridge the gap
► Whether the funding multiple is sufficient
► Whether the administration of the program prevents unfair advantage
► Opportunities for greater flexibility for the types of eligible measures
► Opportunities for urban water efficiencies
► Opportunities to better align off-farm and on-farm efficiency measures and reduce the cost of supply
► Opportunities for off-farm infrastructure works.
2. The potential socio-economic impacts arising from efficiency measures at a range of scales, and concerns that go beyond the specific legal requirements
Impacts and concerns may include:
► The net impact of on-farm efficiency measures on the viability and productivity of irrigation districts
► The impact of efficiency measures on employment opportunities in Basin communities
► The impact of efficiency measures on the temporary and permanent water markets.
3. The extent to which adverse socio-economic impacts could be negated
► Further refinements to efficiency measures program design to maximize socio-economic benefits.
► Existing Commonwealth programs.
► Any further opportunities for Commonwealth-funded activities in support of broader regional development.
What are the opportunities to make farms, irrigation districts and communities more productive and efficient?
What are the distributional impacts of measures to improve efficiency?
Can the distributional impacts of efficiency measures be addressed?
1 Terms of reference 7 Opportunities for efficiency ...2 Glossary 8 Cost of efficiency measures3 Executive summary 9 Principles for negating adv ...4 Introduction 10 A program to achieve 450 ...5 Potential socio-economic ... 11 Appendices6 Program design

Analysis of efficiency measures in the Murray-Darling Basin: Opportunities to recover 450GL in additional environmental water through efficiency measures by 2024, with neutral or positive socio-economic impacts | Page 56 of 307
19 January 2018 | Final Report
EY's approach4 Introduction
4321
Project overviewEY’s project comprised of four phases:
► Phase 1: Initial meetings with all jurisdictions and the MDBA to understand the requirements, collect information, and discuss methodology; which included consultation arrangements with stakeholders, and next steps in engaging the Advisory Panel.
► Phase 2: Analysis of information collected and frameworks developed for further analysis. Input sought from the Advisory Panel on stakeholder consultations
► Phase 3: Stakeholder consultations conducted and preliminary findings tested with the Advisory Panel and Basin Officials Committee (BOC).
► Phase 4: Preparation of draft and final reports and test findings with BOC and the Advisory Panel.
Prepare draft and final reports(Oct 2017 – Dec 2017)► Draft report complete.
► Tested draft report findings with BOC Principals and the Advisory Panel.
► Draft report delivered to MinisterialCouncil.
► Feedback from jurisdictions on draft report.
► Final report complete, taking into account comments received on draft report.
Conduct stakeholder consultation and develop preliminary findings(Aug – Sep 2017)► Initial workshop with Advisory Panel
to gain input on stakeholder consultation strategy.
► Met with stakeholders to gain input on issues in the Terms of Reference.
► Developed preliminary findings following stakeholder consultations.
► Provided a verbal report on preliminary findings to the BOC.
Analyse information collected (Jul –Aug 2017)► Understand objectives of previous
and current programs, and differences of previous programs toCOFFIE.
► Understanding of socio-economicanalysis undertaken by the MDBA.
► Understanding of distributive impacts of efficiency measures at different scales.
► Initial input from the Advisory Panel on stakeholder consultations.
Project initiation including data collection(Jun - Jul 2017)
► Initial meetings held with all jurisdictions.
► Collection of information on currentand previous efficiency programs, and socio-economic impact studies.
► Advisory panel established.
► Stakeholder consultation strategy developed.
1 Terms of reference 7 Opportunities for efficiency ...2 Glossary 8 Cost of efficiency measures3 Executive summary 9 Principles for negating adv ...4 Introduction 10 A program to achieve 450 ...5 Potential socio-economic ... 11 Appendices6 Program design
Analysis of efficiency measures in the Murray-Darling Basin: Opportunities to recover 450GL in additional environmental water through efficiency measures by 2024, with neutral or positive socio-economic impacts | Page 57 of 307
Potential socio-economic impacts of efficiency measures
5
In this section Page
Overview 58
Key findings 59
Understanding neutrality and socio-economic impacts 65
Negating socio-economic impacts 66
Approach for identifying potential socio-economic impacts arising from efficiency measures
67
Applying the framework 68
Global risk landscape, megatrends and socio-economic context of the Basin 69
Identification of the impacts of water efficiency 76
Summary of impact mapping 77
Off-farm impacts 78
On-farm impacts 84
Socio-economic impact pathway 1: Impact on irrigated production 92
Socio-economic impact pathway 2: Distributional impact arising from changed production decisions by participants
105
Socio-economic impact pathway 3: Impact on network charges 119
Socio-economic impact pathway 4: Impact on labour productivity and employment 127
The impact of urban and transformational projects 136

Analysis of efficiency measures in the Murray-Darling Basin: Opportunities to recover 450GL in additional environmental water through efficiency measures by 2024, with neutral or positive socio-economic impacts | Page 58 of 307
19 January 2018 | Final Report
Overview5 Potential socio-economic impacts of efficiency measures
Defining the issue Socio-economic influences Impact mapping and pathways
► The Basin Plan definition of socio-economic neutrality equates voluntary individual participation with socio-economic neutrality.
► EY’s Terms of Reference for the project require the analysis of socio-economic impacts arising from efficiency measures at a range of scales, and concerns that go beyond the specific legal requirements.
► The key considerations for this project are to explore the impacts across the range of scales and how any adverse impacts can be negated.
► There are a variety of underlying megatrends and socio-economic influences, external to water efficiency measures, impacting regional communities across Australia, and in particular the Murray-Darling Basin.
► Understanding the socio-economic influences on the Murray-Darling Basin allows for a better appreciation of the operating environment in which irrigators, industries and communities live and work; it helps provide a clearer picture of the context in which future water efficiency measures will occur.
► Socio-economic impact mapping has been utilised to consider the impacts of on and off-farm projects, tracing their impacts to identify the different parties affected by each activity, including flow-on impacts.
► The impact mapping and stakeholder consultation identified four key impact pathways for further analysis: the impact on irrigated production, distributional impacts arising from changing output decisions, the impact on network charges and the impact on labour productivity and employment.
On-farm project impacts Off-farm project impacts Urban project impacts
► Generate a net financial benefit to industry (on an NPV basis) through bringing forward water productivity and other on-farm productivity improvements.
► Have the potential to enhance structural change through distributional impacts on marginal users which can impact on the viability of downstream businesses and community employment.
► Increased community employment through capital expenditure in the short-term.
► The evidence gathered suggests that labour productivity impacts are likely to be limited, with the direct reduction in labour resulting from on-farm projects estimated to be small, and a positive impact through the generation of employment opportunities as a result of construction spending and future maintenance of infrastructure.
► Impacts to the network, irrigators, community and Basin are generally positive. In particular, modernised network infrastructure (installed to reduce water losses), may improve network delivery management. This includes increasing the timeliness of water deliveries to irrigators and potentially reducing operating fees over the life of the infrastructure.
► Significant and sustained capital expenditure increases community employment in the short to medium term.
► Urban projects can potentially free up water that was used for consumption, but was not previously used for production. As such, they do not impact on irrigators or the irrigation network.
► Urban projects have a range of impacts; including improved water security for communities, enhanced resilience, environmental benefits and enhanced liveability
1 Terms of reference 7 Opportunities for efficiency ...2 Glossary 8 Cost of efficiency measures3 Executive summary 9 Principles for negating adv ...4 Introduction 10 A program to achieve 450 ...5 Potential socio-economic ... 11 Appendices6 Program design

Analysis of efficiency measures in the Murray-Darling Basin: Opportunities to recover 450GL in additional environmental water through efficiency measures by 2024, with neutral or positive socio-economic impacts | Page 59 of 307
19 January 2018 | Final Report
Key findings5 Potential socio-economic impacts of efficiency measures
5.1 A diversity of factors are driving a variety of impacts
There are multiple influences driving socio-economic impacts across the Basin.
► Stakeholders often attribute impacts to water recovery, but various other factors are also at play.
► The Basin, its communities and industries have, and will continue to face structural change arising from a diversity of influences. These include, but are not limited to: urbanisation, rural and regional population changes, agricultural, technological, climatic and employment trends, fluctuating commodity price and the Basin Plan.
► Understanding the drivers of structural change and distilling the cause and effect of these is complex; the full extent of changes occurring over long timeframes. Regional structural change has been significant and in recent years has occurred at a fast pace.
5.2 Water efficiency measures have a variety of impacts which occur at a range of scales
Efficiency measures have a variety of impacts depending on the project type and the specific circumstances in which they are undertaken.
► There are a range of both positive and adverse socio-economic impacts resulting from on andoff-farm efficiency measures projects.
► Impacts depend on the type of project delivered, the operating environment and context of businesses (particularly the commodity produced). Impacts also vary in their magnitude, timing and nature. Furthermore, they have complex interrelation with other changes occurring including wider community, demographic, commodity and climatic factors.
► While many outcomes are economically efficient, there are both positive and adverse impacts on the various parties involved, including irrigators who have not participated in an efficiency measure program.
► In assessing the impacts, data limitations have impacted the precision and level of quantitative analysis that has been undertaken. The report has however examined and where possible provided indicative quantitative analysis of different scenarios and considerations (e.g. different climate scenarios).
5.3 Off-farm projects generally have a positive socio-economic impact
Off-farm efficiency measures primarily impact irrigators on the network.
► Off-farm water efficiency projects generally have the potential to improve network delivery timeliness and reliability, as well as potentially reducing maintenance costs over the life of the infrastructure.
► Commonwealth construction and funding for off-farm infrastructure projects has been significant. This has created short to medium-term employment outcomes for communities, who may also benefit in the longer-term from the skills acquired from these projects.
1 Terms of reference 7 Opportunities for efficiency ...2 Glossary 8 Cost of efficiency measures3 Executive summary 9 Principles for negating adv ...4 Introduction 10 A program to achieve 450 ...5 Potential socio-economic ... 11 Appendices6 Program design

Analysis of efficiency measures in the Murray-Darling Basin: Opportunities to recover 450GL in additional environmental water through efficiency measures by 2024, with neutral or positive socio-economic impacts | Page 60 of 307
19 January 2018 | Final Report
Key findings5 Potential socio-economic impacts of efficiency measures
5.4 On-farm projects are associated with both positive and potentially adverse impacts
While participants generally experience positive outcomes, some non-participants may be adversely impacted.
► Participants in on-farm efficiency measures programs generally experience positive outcomes.
► However, a potential for adverse impacts has been identified for non-participants which flow into their communities and the Basin. These have been analysed in further detail to make an assessment of their impact and include whether:
5.5 Urban projects generally have a positive socio-economic impact
These projects generally provide positive benefits to the community.
► Urban water projects effectively create new water that was not previously used for production. Consequently, they do not impact irrigators or irrigation networks.
► Urban projects generally have positive impacts for the community, including increased water quality and security. However, these may be offset against potentially significant upfront and on-going costs. If consumers are not appropriately compensated for these costs, adverse socio-economic impacts may occur.
► The key issue for urban projects is ensuring that a whole of life assessment is taken to determine viability as evidenced by a positive NPV.
► Future agricultural production is constrained
► Production decisions change, resulting in distributional impacts
► Network charges could increase
► Changes in labour productivity result in changes to employment outcomes.
1 Terms of reference 7 Opportunities for efficiency ...2 Glossary 8 Cost of efficiency measures3 Executive summary 9 Principles for negating adv ...4 Introduction 10 A program to achieve 450 ...5 Potential socio-economic ... 11 Appendices6 Program design

Analysis of efficiency measures in the Murray-Darling Basin: Opportunities to recover 450GL in additional environmental water through efficiency measures by 2024, with neutral or positive socio-economic impacts | Page 61 of 307
19 January 2018 | Final Report
Key findings5 Potential socio-economic impacts of efficiency measures
5.6 Water efficiency measures increase irrigated production
Infrastructure upgrades bring forward investment and productivity improvements and allow irrigators to increase production in the short-term, albeit leading to an opportunity cost of forgone future production.
► In the short-term, water efficiency measures allow for current agricultural production to remain stable or increase through water productivity, retained water savings and/or other on-farm productivity improvements. However, the transfer of water entitlements for environmental purposes leads to an opportunity cost in foregone future production.
► The extent to which increases in short-term production outweigh reductions in long-term production depends on a number of key considerations, particularly whether the investment in water efficiency would have occurred in the absence of Commonwealth funding and the ability for participants in on-farm infrastructure upgrades to increase production in the short to medium term.
► Stakeholder consultation has informed the development of assumptions which suggest that there is a net financial benefit to industry of between $70 million and $302 million (on a 20 year NPV basis) as a result of water efficiency measures. However, if short-term production does not increase (as a result of irrigators either not being able to retain water savings, on-farm productivity not improving or water being sold in dry years) there may be an adverse impact on production. Short term production needs to increase by up to 16% for a positive net benefit to industry to occur.
► Implications for program design:
► Invest in community engagement to promote understanding of the impacts from water efficiency measures. Also invest in a monitoring and evaluation framework to better analyse impacts of efficiency measures.
► Supporting measures such as education and training, R&D and facilitation of knowledge sharing, should be included as part of water efficiency programs to ensure that participants are able to take advantage of productivity improvements.
1 Terms of reference 7 Opportunities for efficiency ...2 Glossary 8 Cost of efficiency measures3 Executive summary 9 Principles for negating adv ...4 Introduction 10 A program to achieve 450 ...5 Potential socio-economic ... 11 Appendices6 Program design
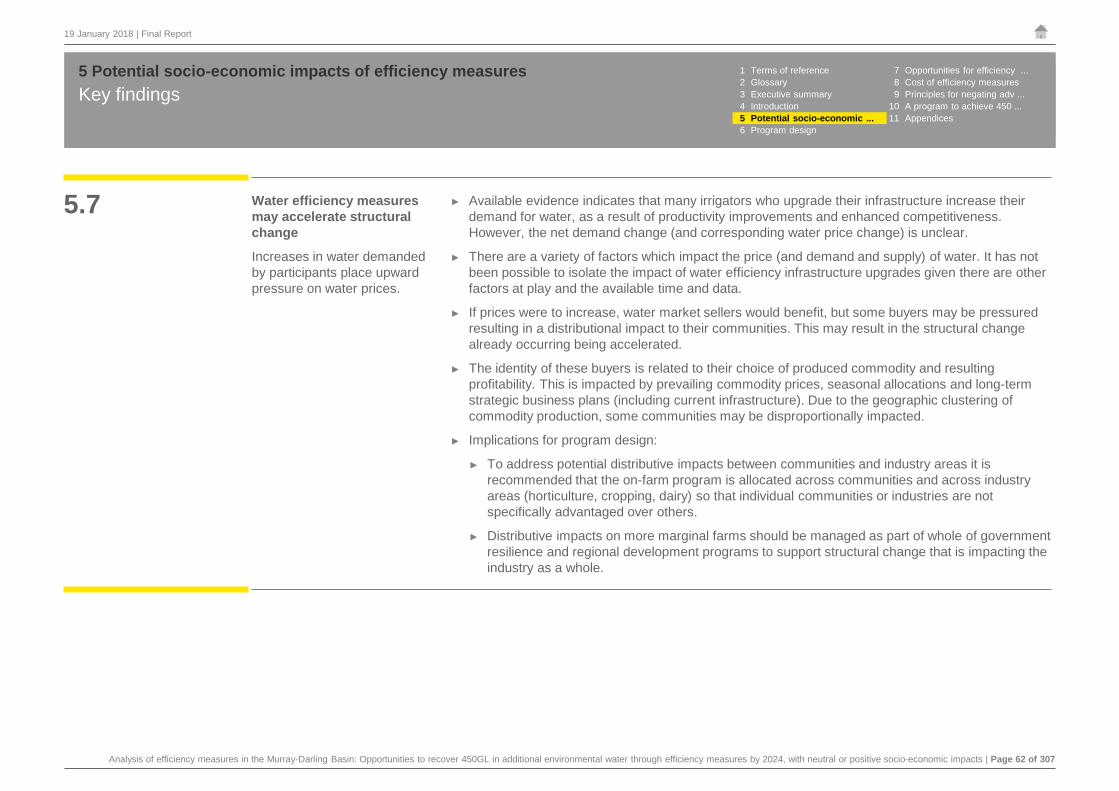
Analysis of efficiency measures in the Murray-Darling Basin: Opportunities to recover 450GL in additional environmental water through efficiency measures by 2024, with neutral or positive socio-economic impacts | Page 62 of 307
19 January 2018 | Final Report
Key findings5 Potential socio-economic impacts of efficiency measures
5.7 Water efficiency measures may accelerate structural change
Increases in water demanded by participants place upward pressure on water prices.
► Available evidence indicates that many irrigators who upgrade their infrastructure increase their demand for water, as a result of productivity improvements and enhanced competitiveness. However, the net demand change (and corresponding water price change) is unclear.
► There are a variety of factors which impact the price (and demand and supply) of water. It has not been possible to isolate the impact of water efficiency infrastructure upgrades given there are other factors at play and the available time and data.
► If prices were to increase, water market sellers would benefit, but some buyers may be pressured resulting in a distributional impact to their communities. This may result in the structural change already occurring being accelerated.
► The identity of these buyers is related to their choice of produced commodity and resulting profitability. This is impacted by prevailing commodity prices, seasonal allocations and long-term strategic business plans (including current infrastructure). Due to the geographic clustering of commodity production, some communities may be disproportionally impacted.
► Implications for program design:
► To address potential distributive impacts between communities and industry areas it is recommended that the on-farm program is allocated across communities and across industry areas (horticulture, cropping, dairy) so that individual communities or industries are not specifically advantaged over others.
► Distributive impacts on more marginal farms should be managed as part of whole of government resilience and regional development programs to support structural change that is impacting the industry as a whole.
1 Terms of reference 7 Opportunities for efficiency ...2 Glossary 8 Cost of efficiency measures3 Executive summary 9 Principles for negating adv ...4 Introduction 10 A program to achieve 450 ...5 Potential socio-economic ... 11 Appendices6 Program design

Analysis of efficiency measures in the Murray-Darling Basin: Opportunities to recover 450GL in additional environmental water through efficiency measures by 2024, with neutral or positive socio-economic impacts | Page 63 of 307
19 January 2018 | Final Report
Key findings5 Potential socio-economic impacts of efficiency measures
5.8 Reduction in water volumes from water efficiency projects are unlikely to impact network charges
There is no evidence to suggest that network charges have increased as a result of water efficiencies projects or programs.
► Water efficiency projects can lead to a reduction in the volume of water passing through irrigation networks. Where this occurs, subject to the pricing models of the network, fixed costs may be spread across reduced water volumes in the network.
► Stakeholders suggested that this may increase the cost of water delivery and in some circumstances may adversely impact on non-participants (participants can reduce their delivered water due to increased water efficiency as well as offset higher costs through other benefits associated with infrastructure upgrades).
► The analysis indicates that where off-farm works have been undertaken this has improved efficiency of irrigation networks. Where reduced flows have arisen from on-farm transfer of entitlements, the analysis indicated that this is unlikely to result in an increase in network charges, noting that buy-backs and other factors, such as the changes to the regulatory pricing regime, have had an impact on networks.
► Implication for program design:
► Integration of on-farm and off-farm efficiency measures to allow maximum efficiency of both the network and on-farm irrigation. This may include the consolidation of IIOs where practical.
► Additional investment in networks may be required where it can be demonstrated through a business case that water efficiency measures have impacted their costs (such as where additional investment is needed to maintain delivery flow rates) or revenue (such as reduced fees).
► Where off-farm works are undertaken the key issue is ensuring that a whole of life assessment is taken to determine viability as evidenced by a positive net present value.
1 Terms of reference 7 Opportunities for efficiency ...2 Glossary 8 Cost of efficiency measures3 Executive summary 9 Principles for negating adv ...4 Introduction 10 A program to achieve 450 ...5 Potential socio-economic ... 11 Appendices6 Program design
Analysis of efficiency measures in the Murray-Darling Basin: Opportunities to recover 450GL in additional environmental water through efficiency measures by 2024, with neutral or positive socio-economic impacts | Page 64 of 307
19 January 2018 | Final Report
Key findings5 Potential socio-economic impacts of efficiency measures
5.9 Labour productivity improvements are unlikely to have a significant impact on employment
The direct reduction in labour resulting from on-farm efficiency measures is small and likely to be offset by infrastructure funding in the short to medium term.
► Based on the evidence gathered labour productivity impacts resulting from on-farm efficiency measures are not likely to significantly impact employment, with labour often redeployed or owner operators being able to achieve lifestyle benefits from automation. Furthermore, if participating irrigators increase production, there may be an increase in employment. More data is required to determine the impact to off-farm employment, but it is unlikely to be large in scale. In both on and off-farm cases, post-project required labour is likely to be more technically proficient than pre-project. This may lead to increased wages for these workers.
► The competitive advantage experienced by participating irrigators could reduce the viability of other irrigators. These irrigators may reduce their employment of hired workers and contractors.
► Employment impacts could be significant where structural change occurs within specific industries, leading to impacts on the viability of downstream businesses. However, efficiency measures involve significant capital investment from the Commonwealth which provides economic stimulus and requires workers from within and outside communities in the short-term.
► Implications for program design:
► Given the limited data and evidence, the impact on labour productivity and employment needs to be monitored on an ongoing basis with a particular focus on tipping points for industries.
► Whole of government approach to regional development, including development of employees with appropriate skills within communities (or the attraction of those people with required skills).
1 Terms of reference 7 Opportunities for efficiency ...2 Glossary 8 Cost of efficiency measures3 Executive summary 9 Principles for negating adv ...4 Introduction 10 A program to achieve 450 ...5 Potential socio-economic ... 11 Appendices6 Program design
Analysis of efficiency measures in the Murray-Darling Basin: Opportunities to recover 450GL in additional environmental water through efficiency measures by 2024, with neutral or positive socio-economic impacts | Page 65 of 307
19 January 2018 | Final Report
Understanding neutrality and socio-economic impacts5 Potential socio-economic impacts of efficiency measures 1 Terms of reference 7 Opportunities for efficiency ...
2 Glossary 8 Cost of efficiency measures3 Executive summary 9 Principles for negating adv ...4 Introduction 10 A program to achieve 450 ...5 Potential socio-economic ... 11 Appendices6 Program design
Socio-economic impacts are considered as any form of social or economic impact resulting from an action or activity, in this case policy implementation.
The Basin Plan1 sets out the following requirements for determining whether an efficiency measure delivers neutral or improved socio-economic impacts:
“The efficiency contributions to the proposed adjustments achieve neutral or improved socio-economic outcomes compared with the outcomes under benchmark conditions of development as evidenced by:
I. The participation of consumptive water users in projects that recover water through works to improve irrigation water use efficiency on their farms
II. The participation of consumptive water users in projects that recover water through works to improve water use efficiency off-farm
III. Alternative arrangements proposed by a Basin State, assessed by that State as achieving water recovery with neutral or improved socio-economic outcomes.”
1 Developed as a requirement of the Water Act 2007 (Cwth).2 Aither 2017, A review of socio-economic neutrality in the context of the Murray-Darling Basin plan implementation.
Defining neutrality (specific legal requirements)
Defining the issueThe Terms of Reference for this independent review required the analysis of socio-economic impacts arising from efficiency measures at a range of scales, and concerns that go beyond the specific legal requirements.
As noted by Aither (2017), the legal definition does not account for:
1. Impacts on non-participants (including other irrigators, networks and communities)
2. Cumulative or aggregate impacts
3. Distribution of impacts across non-participants, as some groups may be disproportionately affected.2
Socio-economic impacts occurring across a variety of scales and caused by a range of factors have been identified by previous studies conducted by the MDBA, DAWR and third-party consultants as engaged by state departments and irrigator suppliers.
There is evidence to suggest that past programs of water recovery and on andoff-farm water efficient infrastructure have affected irrigators, irrigation networks, communities and the Basin as a whole. These impacts vary in their magnitude, timing and nature and have complex interrelations with other changes occurring such as demographic, industry and climatic changes.
At the same time, there are a variety of underlying megatrends and socio-economic influences, external to water efficiency measures impacting regional communities across Australia and in particular the Murray-Darling Basin. A key consideration for this project is therefore to explore the distribution of impacts:
► Efficiency measures at the farm level and irrigation networks level have indirect impacts at the town, region and ultimately Basin level
► How these impacts change across scale, location and communities needs to be understood to identify adverse impacts
► In understanding the distribution of impacts, mechanisms to negate adverse impacts can be included in program design.
The legal definition of socio-economic neutralityThe Basin Plan definition equates voluntary individual participation in water efficiency projects with socio-economic neutrality. That is, participants are anticipated to experience the same or improved post-project outcomes as a result of undertaking water efficiency measures.
This is supported by the University of Canberra’s Regional Well Being Survey (2016) results, which found that 94% of surveyed irrigators who had participated in an on-farm efficiency project reported positive or neutral outcomes to their farm. Similarly, 87% of surveyed irrigators who were aware that their networks had participated in an off-farm project experienced overall neutral or positive outcomes.

Analysis of efficiency measures in the Murray-Darling Basin: Opportunities to recover 450GL in additional environmental water through efficiency measures by 2024, with neutral or positive socio-economic impacts | Page 66 of 307
19 January 2018 | Final Report
Negating socio-economic impacts5 Potential socio-economic impacts of efficiency measures 1 Terms of reference 7 Opportunities for efficiency ...
2 Glossary 8 Cost of efficiency measures3 Executive summary 9 Principles for negating adv ...4 Introduction 10 A program to achieve 450 ...5 Potential socio-economic ... 11 Appendices6 Program design
Approach to the negation of impactsThe Terms of Reference require the study to explore the extent to which adverse socio-economic impacts could be negated through:
► Further refinements to efficiency measures program design to maximise socio-economic benefits
► Existing Commonwealth programs
► Any further opportunities for Commonwealth-funded activities in support of broader regional development.
This study has defined the negation of adverse socio-economic impacts to include avoiding impacts, addressing impacts and mitigating impacts, where mitigating impacts entails both pre-emptive actions to mitigate impacts before they occur and post-impact actions to mitigate impacts after they occur. After the process of negating impacts there may be residual risks, which need to be considered.
Drawing on the identification of adverse impacts in this chapter, activities, actions and components of program design have been developed to negate impacts. These are discussed in Chapter 10.
Avoid Address Mitigate
► Pre-emptive mitigation –undertaking activities and actions that seek to respond to impacts before they occur
► Post impact mitigation -Mitigation of impacts after they have occurred
► Addressing primary adverse impacts before they result in flow-on impacts
► Ensure adverse impact pathways are avoided such as through program design
Residual Risk
► Risks associated with the action of negation, exacerbating or causing additional adverse impacts, to be considered

Analysis of efficiency measures in the Murray-Darling Basin: Opportunities to recover 450GL in additional environmental water through efficiency measures by 2024, with neutral or positive socio-economic impacts | Page 67 of 307
19 January 2018 | Final Report
Approach for identifying potential socio-economic impacts arising from efficiency measures
5 Potential socio-economic impacts of efficiency measures 1 Terms of reference 7 Opportunities for efficiency ...2 Glossary 8 Cost of efficiency measures3 Executive summary 9 Principles for negating adv ...4 Introduction 10 A program to achieve 450 ...5 Potential socio-economic ... 11 Appendices6 Program design
Framework: Four key elements
1 Defining the types of projects: exploring the types of projects which form efficiency measures.
2 Understanding activities resulting from the projects: detailing the activities undertaken under each type of project.
4 Identifying and assessing the various impacts: identifying how various affected parties are impacted, taking into account other information and data.
3 Ascertaining who is impacted: understanding the distribution of impacts.
In order to identify the positive, neutral and adverse impacts of efficiency measures and strategies that may be implemented to ensure neutral or improved socio-economic outcomes, it is necessary to understand what activities are occurring; who is impacted and how these parties are impacted. To undertake this analysis, a framework was developed as an assessment tool, seeking to demonstrate the cause and effect of efficiency measures.
The framework enables analysis of the activities undertaken for specific project types, mapping the activities to the parties affected and analysing the impacts on these parties. The framework comprises of four key elements.
A framework for assessment
Guiding Questions
A guiding question has been developed for each stage to demonstrate the information that the stage is seeking to provide. Further, within each stage specific elements have been identified for consideration. This framework has allowed a comprehensive understanding of the full suite of impacts occurring as a result of efficiency measures.
3. Ascertain
who is impacted
1. Define types of projects
Irrigators
Irrigation network
Community
On-farm
Off-farm
Urban
2. Understand
resulting activities
4.Identify and
assess impacts
Nature – positive, neutral, adverse
Distribution
Interrelation
Cumulative or thresholdBasin
Gui
ding
qu
estio
nEl
emen
tEl
emen
ts to
exp
lore
What project? What occurs? What is the distribution?
How are they impacted?
Change in irrigation method
Improved productivity / automation
Rationalisation
Industry
Change in water
demandedTransformational1
1Transformational projects are non-traditional approaches to water efficiency, that enhance productivity and provide means to innovate current methods of production, or provide routes to alternative industries. For instance, providing sheds for dairy or netting for perennial plantings.

Analysis of efficiency measures in the Murray-Darling Basin: Opportunities to recover 450GL in additional environmental water through efficiency measures by 2024, with neutral or positive socio-economic impacts | Page 68 of 307
19 January 2018 | Final Report
Applying the framework5 Potential socio-economic impacts of efficiency measures
Socio-economic impact mapping
This entails a first principles approach to understanding the cause and effect of efficiency measures. The mapping considers theimpacts of on and off-farm projects and traces these to identify the different parties affected by each activity, including flow-on impacts. This mapping has been informed by:
► Desktop analysis – drawing on impacts identified by previous studies
► Stakeholder consultation – to identify the types of impacts experienced and the distribution of impacts
► Road testing with targeted stakeholders – to ensure robustness of mapping (all impacts are accounted for, interrelation is appropriately considered and flow-on impacts are adequately accounted for).
Exploration of key impact pathways
The mapping undertaken in Step 1 was used to ensure that the impacts (positive, neutral and adverse) of efficiency measures are understood. This analysis has then informed an assessment of impacts in the key areas specifically identified in the Terms ofReference. This approach allows for a comprehensive understanding of the impacts in these areas. Importantly, the impact pathways consider the specific impacts outlined in the Terms of Reference and cumulative impacts, including where individual impacts may be minor but could be major if they cause a tipping point (i.e. an industry or an irrigation network to get to the point of unviability).
The impact mapping and stakeholder consultation identified four key impact pathways for further analysis: the impact on irrigated production, distributional impacts arising from changing output decisions, the impact on network charges and the impact on labour productivity and employment.
Identifying activities and actions to negate impacts
Following the exploration of impacts and, in particular, the analysis of pathways which may result in adverse impacts, activities and actions have been developed alongside program design considerations to negate these adverse impacts. Further details are outlinein Chapter 10.
1
2
3
The framework has been applied to identify impacts and their distribution at a conceptual level and then to inform analysis of the magnitude of these impacts. The assessment of magnitude has been undertaken after taking into account information from stakeholder consultations, existing socio-economic reports and any data that has been provided from the MDBA’s Southern Basin socio-economic study (noting that the timeframe for this study to be completed has been delayed). This analysis provides an understanding of where impacts are occurring and how adverse impacts can be negated. The following methodology has been used to apply the framework:
1 Terms of reference 7 Opportunities for efficiency ...2 Glossary 8 Cost of efficiency measures3 Executive summary 9 Principles for negating adv ...4 Introduction 10 A program to achieve 450 ...5 Potential socio-economic ... 11 Appendices6 Program design
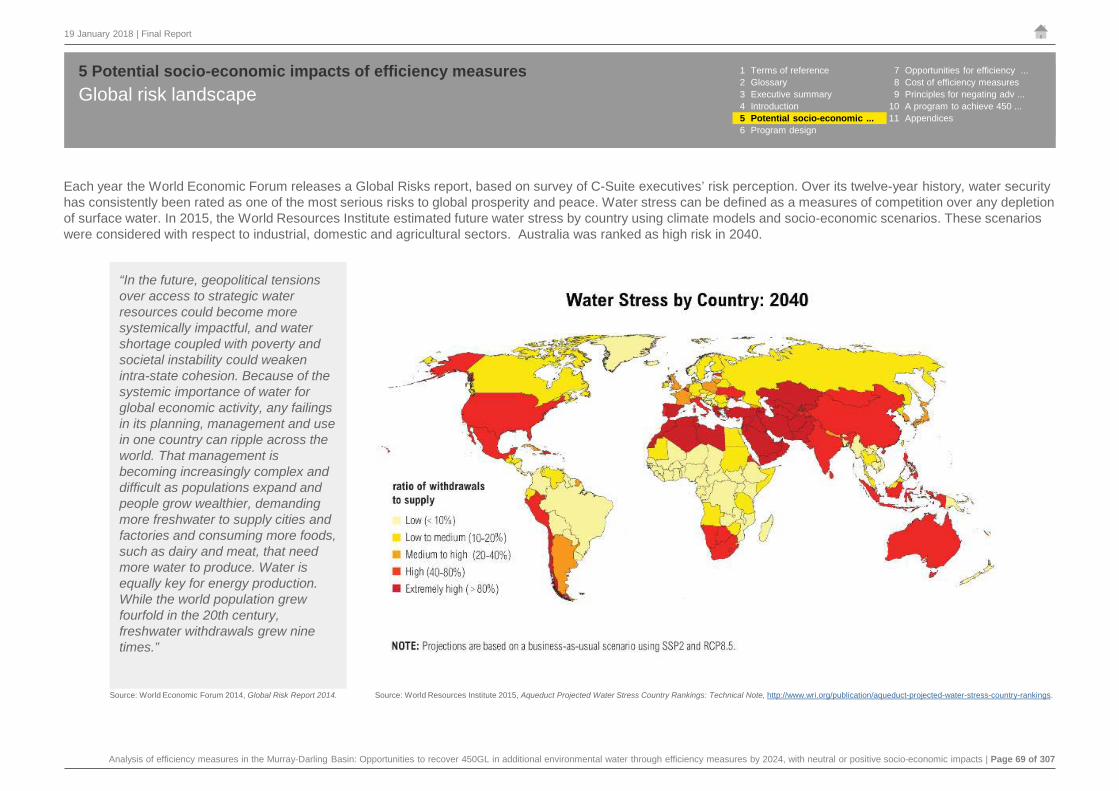
Analysis of efficiency measures in the Murray-Darling Basin: Opportunities to recover 450GL in additional environmental water through efficiency measures by 2024, with neutral or positive socio-economic impacts | Page 69 of 307
19 January 2018 | Final Report
Global risk landscape5 Potential socio-economic impacts of efficiency measures 1 Terms of reference 7 Opportunities for efficiency ...
2 Glossary 8 Cost of efficiency measures3 Executive summary 9 Principles for negating adv ...4 Introduction 10 A program to achieve 450 ...5 Potential socio-economic ... 11 Appendices6 Program design
Each year the World Economic Forum releases a Global Risks report, based on survey of C-Suite executives’ risk perception. Over its twelve-year history, water security has consistently been rated as one of the most serious risks to global prosperity and peace. Water stress can be defined as a measures of competition over any depletion of surface water. In 2015, the World Resources Institute estimated future water stress by country using climate models and socio-economic scenarios. These scenarios were considered with respect to industrial, domestic and agricultural sectors. Australia was ranked as high risk in 2040.
Source: World Economic Forum 2014, Global Risk Report 2014.
“In the future, geopolitical tensions over access to strategic water resources could become more systemically impactful, and water shortage coupled with poverty and societal instability could weaken intra-state cohesion. Because of the systemic importance of water for global economic activity, any failings in its planning, management and use in one country can ripple across the world. That management is becoming increasingly complex and difficult as populations expand and people grow wealthier, demanding more freshwater to supply cities and factories and consuming more foods, such as dairy and meat, that need more water to produce. Water is equally key for energy production. While the world population grew fourfold in the 20th century, freshwater withdrawals grew nine times.”
Source: World Resources Institute 2015, Aqueduct Projected Water Stress Country Rankings: Technical Note, http://www.wri.org/publication/aqueduct-projected-water-stress-country-rankings.

Analysis of efficiency measures in the Murray-Darling Basin: Opportunities to recover 450GL in additional environmental water through efficiency measures by 2024, with neutral or positive socio-economic impacts | Page 70 of 307
19 January 2018 | Final Report
Megatrends impacting Australia’s economy and society5 Potential socio-economic impacts of efficiency measures 1 Terms of reference 7 Opportunities for efficiency ...
2 Glossary 8 Cost of efficiency measures3 Executive summary 9 Principles for negating adv ...4 Introduction 10 A program to achieve 450 ...5 Potential socio-economic ... 11 Appendices6 Program design
01
More from lessEarth has limited supplies of minerals, energy, food and water resources that are essential to sustain life. These resources are being depleted at an alarming pace, which is accelerating due to continued economic and sustained population growth. Communities, companies and governments need to determine strategies for maintaining living standards within the confines of theplanet’s natural resources.
Going, going…. Gone?Many plant and animal species across the globe are in decline and at risk of extinction. Policy and resource usage decisions made in the coming decades will ultimately determine their survival. Humans need to react in the face on continually rising populations and sustained economic growth to ensure their preservation.
02
The silk highwayThe balance of economic power is shifting away from Europe and North America towards Africa, Asia and South America. Sustained growth, fuelled by growing populations and an abundance of natural resources. This trend also provides significant new opportunities for Australia, as new markets emerge for local goods and services, including agricultural products and tourism.
03
04
Forever youngLike many developed world economies, Australia is facing a rapidly ageing population. This presents both challenges and opportunities.
A rapidly deteriorating shortfall in retirement savings, allied to a steadfastly increasing health expenditure will necessitate significant lifestyle changes and force governments to rethink the way they fund the provision of essential services.
Virtually hereSocieties are more connected than ever before due to advances in communications and computer technologies. Society is increasingly using technology for social interactions, accessing services and executing transactions, putting pressure on existing business models and social customs.
Labour markets, business models and city designs will necessarily evolve to remain competitive in more connected markets.
05
Great expectationsA key trend is emerging where consumers value experiences over material wealth. Consumers are increasingly demanding unique, personalised experiences that can still be delivered as efficiently as mass-marketed services. This has implications for both the delivery of essential services and the marketing of consumer products.
06
The CSIRO1 has identified six key megatrends that will influence Australia over the next 20 years. These megatrends will impact on Basin communities and will be influential in shaping the future of the Basin.
1 CSIRO, 2012, Our future world: Global megatrends that will change the way we live.

Analysis of efficiency measures in the Murray-Darling Basin: Opportunities to recover 450GL in additional environmental water through efficiency measures by 2024, with neutral or positive socio-economic impacts | Page 71 of 307
19 January 2018 | Final Report
Socio-economic context of the Murray-Darling Basin5 Potential socio-economic impacts of efficiency measures
The introduction of the Murray-Darling Basin Plan has created an impetus for significant changes in irrigation communities across the Basin. However, regional communities have been experiencing structural changes for decades. These factors have shaped the agricultural industry and impacted the regional communities who rely, directly or indirectly, on agricultural production. This is in addition to government intervention through water recovery. These changes include, but are not limited to:
Population trends
Between 2011 and 2016 population growth was lower across the Basin communities (5.9%) compared to other parts of Australia (9.1%).1 This may be driven by a range of factors, including the inland location – as coastal areas are known to usually grow at a faster rate.
However, in general the structure and demographics of rural communities has been changing over time due to declining employment in the agricultural industry, an ageing population of farmers and a shift from rural towns to regional centres.2
That is, as the demand for on-farm labour has decreased, residents of Basin communities have had to seek opportunities and services elsewhere. This has caused the population in rural communities to decline, and the population in regional centres to rise.3 Rapid urbanisation compounded by a decline in rural communities has led to a halo effect around cities. This has left rural communities more exposed and vulnerable to additional factors of change, with a decreased population and smaller economic base.
1 Terms of reference 7 Opportunities for efficiency ...2 Glossary 8 Cost of efficiency measures3 Executive summary 9 Principles for negating adv ...4 Introduction 10 A program to achieve 450 ...5 Potential socio-economic ... 11 Appendices6 Program design
1 ABS 2016 Census of Population and Housing Time Series Profile Cat. No. 2003.0. 2 TC&A and Frontier Economics 2017, Social and economic impacts of the Basin Plan in Victoria , p98.3 Op Cit. TC&A and Frontier Economics 2017,p.12.
Basin population growth between 2011 and 2016 (%)
Source: MDBA n.d., Social and economic outcomes: methodology and data, PP. provided to EY by MDBA 5 July 2017.
Analysis of efficiency measures in the Murray-Darling Basin: Opportunities to recover 450GL in additional environmental water through efficiency measures by 2024, with neutral or positive socio-economic impacts | Page 72 of 307
19 January 2018 | Final Report
Socio-economic context of the Murray-Darling Basin5 Potential socio-economic impacts of efficiency measures 1 Terms of reference 7 Opportunities for efficiency ...
2 Glossary 8 Cost of efficiency measures3 Executive summary 9 Principles for negating adv ...4 Introduction 10 A program to achieve 450 ...5 Potential socio-economic ... 11 Appendices6 Program design
Employment trends
Since the 1980s, there has been a steady structural decline in agricultural employment. For instance, in 2006, around 6.4% of all workers across Australia were employed in the agricultural industry. This decreased to 5% by 2011, whilst remaining stable in 2016.1
More specific to the Murray-Darling Basin, in 2016, roughly 45% of all workers in Australia employed in the agricultural industry lived in Basin communities. This proportion has been steadily declining since 2006, were it represented almost 53% of those employed in the agricultural industry. Ostensibly, this is led by reduced agricultural employment within Basin communities and increased agricultural employment in non-Basin communities across Australia. That is, between 2006 and 2011 total agricultural employment fell by around 11%. In Basin communities this decline was 12.7% compared to non-Basin communities which had reduced sector employment of 10.2%.2
Between 2011 and 2016, agricultural employment recovered somewhat, increasing by around 7%. This appears to be led by non-Basin communities which increased agricultural employment by 10.9% over the same period. In contrast, there was a negative sector employment growth experienced across Basin communities of 1.1%.3
These results may reflect an overall slower labour force growth rate across the Basin communities – 3.2% compared to 8.1% for the rest of Australia, between 2011 and 2016. However, over the same period, unemployment, those not in the labour force, has grown at a slower rate in the Basin (6.9% compared to 10.3%).4
In 2011, the average age of a farmer was 53, compared with 40 years for people in other occupations. 5 Despite an overall decrease in farmers between 2001 and 2006, the average age of a farmer increased to 52.6 This is consistent with broader population aging trends, where the average median age across Basin communities has increased from 41 to 43 between 2011 and 2016. In comparison, the average median age for non-Basin communities increased from 38 to 40 over the same time period.7
Outcomes of the Northern Basin Review
The Northern Basin Review involved comprehensive environmental, social and economic research into the impact of water recovery, with respect to other contextual factors. The water recovery in the Northern Basin has included water purchases and some efficiency measures projects. In the social and economic assessment, community consultation indicated that infrastructure investment was preferred to buybacks, as water remains in the communities. In particular, water purchase was strongly associated with an adverse employment impact and reduction in communities. The Review recommended that the 390GL Northern Basin target be reduced to 320GL. It was determined that the 70GL represented a slight reduction to the Basin Plan environmental outcomes. However, it was also advised that the reduction only occur with a ‘toolkit’ of measures intended to minimise any reduction in environmental outcomes.
Source: MDBA 2016, The Northern Basin Review and MDBA 2016, The Northern Basin Review: Community Consultation report.
1 ABS 2016 Census of Population and Housing Time Series Profile Cat. No. 2003.0. 2 Ibid.3 Ibid.4 Ibid.
5 Frontier Economics 2010, Structural adjustment pressures in the irrigated agriculture sector in the Murray–Darling Basin, p.31.6 ibid., p.31.7 Op Cit. ABS Cat. No. 2003.0.
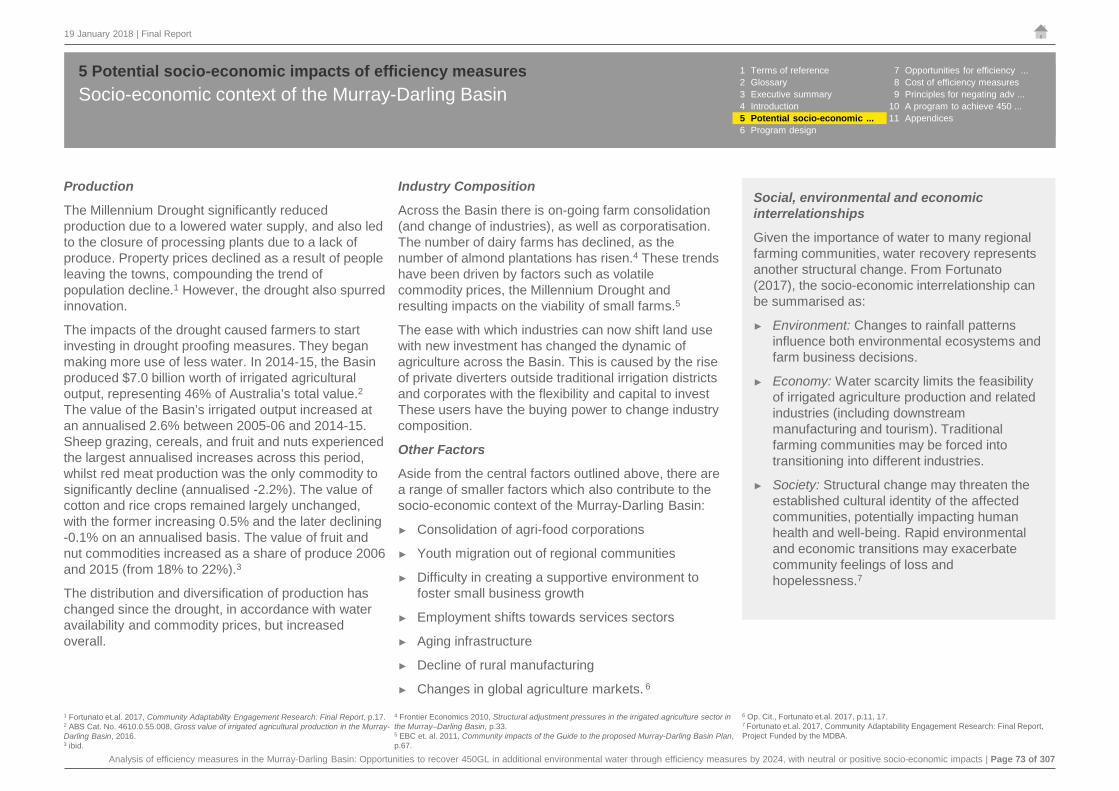
Analysis of efficiency measures in the Murray-Darling Basin: Opportunities to recover 450GL in additional environmental water through efficiency measures by 2024, with neutral or positive socio-economic impacts | Page 73 of 307
19 January 2018 | Final Report
Socio-economic context of the Murray-Darling Basin5 Potential socio-economic impacts of efficiency measures 1 Terms of reference 7 Opportunities for efficiency ...
2 Glossary 8 Cost of efficiency measures3 Executive summary 9 Principles for negating adv ...4 Introduction 10 A program to achieve 450 ...5 Potential socio-economic ... 11 Appendices6 Program design
Production
The Millennium Drought significantly reduced production due to a lowered water supply, and also led to the closure of processing plants due to a lack of produce. Property prices declined as a result of people leaving the towns, compounding the trend of population decline.1 However, the drought also spurred innovation.
The impacts of the drought caused farmers to start investing in drought proofing measures. They began making more use of less water. In 2014-15, the Basin produced $7.0 billion worth of irrigated agricultural output, representing 46% of Australia’s total value.2The value of the Basin’s irrigated output increased at an annualised 2.6% between 2005-06 and 2014-15. Sheep grazing, cereals, and fruit and nuts experienced the largest annualised increases across this period, whilst red meat production was the only commodity to significantly decline (annualised -2.2%). The value of cotton and rice crops remained largely unchanged, with the former increasing 0.5% and the later declining -0.1% on an annualised basis. The value of fruit and nut commodities increased as a share of produce 2006 and 2015 (from 18% to 22%).3
The distribution and diversification of production has changed since the drought, in accordance with water availability and commodity prices, but increased overall.
Industry Composition
Across the Basin there is on-going farm consolidation (and change of industries), as well as corporatisation. The number of dairy farms has declined, as the number of almond plantations has risen.4 These trends have been driven by factors such as volatile commodity prices, the Millennium Drought and resulting impacts on the viability of small farms.5
The ease with which industries can now shift land use with new investment has changed the dynamic of agriculture across the Basin. This is caused by the rise of private diverters outside traditional irrigation districts and corporates with the flexibility and capital to invest These users have the buying power to change industry composition.
Other Factors
Aside from the central factors outlined above, there are a range of smaller factors which also contribute to the socio-economic context of the Murray-Darling Basin:
► Consolidation of agri-food corporations
► Youth migration out of regional communities
► Difficulty in creating a supportive environment to foster small business growth
► Employment shifts towards services sectors
► Aging infrastructure
► Decline of rural manufacturing
► Changes in global agriculture markets. 6
1 Fortunato et.al. 2017, Community Adaptability Engagement Research: Final Report, p.17.2 ABS Cat. No. 4610.0.55.008, Gross value of irrigated agricultural production in the Murray-Darling Basin, 2016. 3 ibid.
Social, environmental and economic interrelationships
Given the importance of water to many regional farming communities, water recovery represents another structural change. From Fortunato (2017), the socio-economic interrelationship can be summarised as:
► Environment: Changes to rainfall patterns influence both environmental ecosystems and farm business decisions.
► Economy: Water scarcity limits the feasibility of irrigated agriculture production and related industries (including downstream manufacturing and tourism). Traditional farming communities may be forced into transitioning into different industries.
► Society: Structural change may threaten the established cultural identity of the affected communities, potentially impacting human health and well-being. Rapid environmental and economic transitions may exacerbate community feelings of loss and hopelessness.7
4 Frontier Economics 2010, Structural adjustment pressures in the irrigated agriculture sector in the Murray–Darling Basin, p.33.5 EBC et. al. 2011, Community impacts of the Guide to the proposed Murray-Darling Basin Plan, p.67.
6 Op. Cit., Fortunato et.al. 2017, p.11, 17.7 Fortunato et.al. 2017, Community Adaptability Engagement Research: Final Report, Project Funded by the MDBA.

Analysis of efficiency measures in the Murray-Darling Basin: Opportunities to recover 450GL in additional environmental water through efficiency measures by 2024, with neutral or positive socio-economic impacts | Page 74 of 307
19 January 2018 | Final Report
Socio-economic context of the Murray-Darling Basin5 Potential socio-economic impacts of efficiency measures
The Basin, alongside the rest of regional Australia has been impacted by a variety of socio-economic trends. However, there are particular events and factors that have had influence in shaping the Basin social and economic fabric.
Water entitlements reflect a permanent share of the total amount of water available, whilst allocations refer to a volume of water allocated against the permanent share, depending on seasonal conditions in a given year. The allocation market experiences much higher trading volumes than the entitlements market (57% of irrigators traded allocations in 2015-16 compared to 22% for entitlements).1 The tradability of water has been a key driver of many agricultural trends in the Basin. Buybacks as part of water recovery by the Government have resulted in an overall reduction in consumptive entitlements. This may have increased some participating irrigators’ reliance on water market trading.
The water market has evolved since the 1980s when government reform first allowed the trading of water allocation and entitlement through the unbundling of water from land rights. When physically possible, the water market provides opportunity for water to move to the most efficient user.2 During the recent Millennium Drought, this reduced the impact of water scarcity on the horticulture industry.3
Trading in water markets was relatively limited until the early 2000s, when market reforms, reduced barriers to trade and more recent increases in water scarcity has increased participation.4 Currently, the Australian water markets are some of the most sophisticated and valuable water markets in the world. The Murray-Darling Basin is Australia’s main water entitlement and allocation market with over 80% of all entitlements and over 90% of allocation trades and traded volumes in 2015-16. This was predominately across the southern connected Basin,5 where in 2016, the volume of these trades represented 3,260GL.6
The Southern Basin comprises several hydrologically connected catchments across South Australia, Victoria and New South Wales. As such, a range of commodity producers can access the market. Where as in contrast, Northern Murray-Darling Basin catchments are unconnected. As such, there are fewer trading counterparties. Additionally, most users in a single catchment exhibit homogenous demand, as single crop types tend to dominate, so overall trade opportunities are relatively lower.7 In 2016, the total volume of water traded across the Northern Basin markets was 1,165GL.8
As part of the five year evaluation of the Basin Plan the MDBA is undertaking an analysis of temporary trade and trade activity to examine net water flows between areas in the Basin (over the short and long term). This information will help inform a view on the extent of changing patterns of water use and provide an indication of how quickly distributional impacts will be felt.
Establishment of a water market
During the Millennium Drought, several towns lost access to water. The Basin Plan, enacted in 2012, was one of the key pieces of legislation intended to prevent this from occurring in another dry period. It aimed to address water over-allocations and to guide government, regional authorities and communities to sustainably manage and use the waters of the Murray–Darling Basin.
The Basin Plan
1 Terms of reference 7 Opportunities for efficiency ...2 Glossary 8 Cost of efficiency measures3 Executive summary 9 Principles for negating adv ...4 Introduction 10 A program to achieve 450 ...5 Potential socio-economic ... 11 Appendices6 Program design
1 ABS Cat. No. 4610.0.55.008.2 MDBA n.d., Water markets and trade: https://www.mdba.gov.au/managing-water/water-markets-and-trade.3 Mallawaarachchi and Foster 2009, Dealing with irrigation drought: the role of water trading in adapting to water shortages in 2007-08 in the southern Murray-Darling Basin.4ABARES, 2016, Australian water markets report 2014-15, ABARES, https://www.mdba.gov.au/sites/default/files/pubs/ABARES-water-market-report-14-15.pdf.
5 Op. Cit., ABS Cat No. 4610.0.55.008.6 ibid.7 Aither 2016, Water Markets in New South Wales.8 Op. Cit., ABS Cat No. 4610.0.55.008.

Analysis of efficiency measures in the Murray-Darling Basin: Opportunities to recover 450GL in additional environmental water through efficiency measures by 2024, with neutral or positive socio-economic impacts | Page 75 of 307
19 January 2018 | Final Report
Socio-economic context of the Murray-Darling Basin5 Potential socio-economic impacts of efficiency measures
The Millennium Drought, from 2001 to 2009, created a significant adverse impact to communities, industries and the environment, all of which rely on secure water supplies to prosper. A combination of low rainfall and the lowest inflows into the river in recorded history meant flows over the border into South Australia virtually ceased, with unprecedented impacts.
The Millennium Drought had a significant economic and social impact on the Basin’s irrigators. That is, severely reduced water availability resulted in significant output reductions, job layoffs and declining rural populations.1 Cotton and rice crops suffered especially, due to insufficient water allocations, and experienced sustained production declines. This further led to reductions in downstream employment due to the closure of processing facilities.2 This reduced the population of rural communities, resulting in property price decreases and dwindling school populations amongst other social impacts.
As a result of all of these impacts, the agricultural production mix of the Basin has changed over time and is expected to continue to change due to the uncontrollable external factors relating to market forces and environmental conditions.3
Since the drought, production has increased, innovation continued, rationalisation, corporatisation and consolidation risen. The drought acted as a catalyst for Australian agriculture to move away from the traditional model operation of soldier settler blocks.
Millenium Drought
Water purchases by the government were used to support environmental assets. They were considered relatively cheaper and faster to implement than water efficiency measures. Healthy rivers and wetlands can help sustain Basin communities by contributing to the physical and mental wellbeing of people and contribute to local economies through industries such as agriculture, fishing, real estate and tourism.4
Between 2007 and 2013, 1,138GL of water was purchased in the Basin. The speed and volume led to widespread community concern regarding potential adverse socio-economic impacts including:
► Job loss, population decline and reduced local spending5
► The ‘Swiss Cheese’ effect (where an irrigation network has sections of the supply system which are not operating) and increased risk of stranded assets
► Increased reliance on purchasing allocations, thus elevating the risk profile of these irrigators.6
Consequently since 2013-14 only 90GL of buybacks occured, mainly strategic purchases. Additionally, in 2015, the Commonwealth passed legislation to limit purchases to 1,500GL. As of October 2017, 1,228GL of water has been purchased. Of this 1,255GL is counted towards the 1,500GL cap.
Buybacks ConclusionWhile in some cases there is limited evidence of adverse impacts occurring as a direct result of purchases,7 rural communities have faced multiple significant challenges over the past few decades. Overall, these will integrate and cumulate making it difficult to separate individual impacts. This helps explain why communities are concerned about the potential for additional adverse socio-economic impacts resulting from further water recovery measures under the Basin Plan.
1 Terms of reference 7 Opportunities for efficiency ...2 Glossary 8 Cost of efficiency measures3 Executive summary 9 Principles for negating adv ...4 Introduction 10 A program to achieve 450 ...5 Potential socio-economic ... 11 Appendices6 Program design
1 MDBA 2016, Northern Basin Review.2 EBC et. al. 2011, Community impacts of the Guide to the proposed Murray-Darling Basin Plan, p19.3 Aither 2016, Contemporary trends and drivers of irrigation in the southern Murray-Darling Basin.4. Victorian Environmental Water Holder, Why do we need environmental water?, http://www.vewh.vic.gov.au/environmental-water/why-do-we-need-environmental-water.
5 Tim Cummins and Associates, and Frontier Economics 2017, Social and economic impacts of the Basin Plan.6 Op. Cit., Aither 2016.7 Wheeler, S. et al 2014, Reviewing the adoption and impact of water markets in the Murray-Darling Basin.

Analysis of efficiency measures in the Murray-Darling Basin: Opportunities to recover 450GL in additional environmental water through efficiency measures by 2024, with neutral or positive socio-economic impacts | Page 76 of 307
19 January 2018 | Final Report
Identification of the impacts of water efficiency5 Potential socio-economic impacts of efficiency measures
Determining the impacts of water efficiency programs is complex. In the first instance, positive and adverse impacts can accrue to participating and non-participating irrigators and their irrigation networks. This can be affected by the interrelations between on and off-farm projects. Impacts at different scales flow through to other network users, the community (including workers employed or contracted in irrigation or downstream industries) and the Basin stakeholders as seen in the diagram below.
Starting at the irrigator level, irrigators who participate in on-farm projects can directly impact their irrigation network, community and the Basin. Indirectly, non-participating irrigators are affected by both participating irrigators and any flow-on impacts from the irrigation network. Next, irrigation networks participating in off-farm efficiency measures will directly impact the irrigators on that network. This results in flow-on, indirect impacts to the community and the Basin. To a lesser extent, participating irrigation networks will also directly impact their local community as well as the Basin.
It is important to note, and as outlined previously, there are numerous contextual influences external to efficiency measures such as the on-going structural change of the agricultural industry. These factors may affect the nature and magnitude of the on and off-farm efficiency measure impacts.
Source: EY analysis.
Irrigator
Community impact Basin impactProgram participant
Program non-participant
On-farm efficiency measure
Off-farm efficiency measure
Participating network
Non-participating
network
► Water market evolution
► Previous buy-backs
► Structural change of agricultural industry
► Commodity prices
► Seasonal rainfall
► Rise of regional centres and geographic changes in employmentDirect impact
Indirect impact
Contextual influences
Irrigation network
1 Terms of reference 7 Opportunities for efficiency ...2 Glossary 8 Cost of efficiency measures3 Executive summary 9 Principles for negating adv ...4 Introduction 10 A program to achieve 450 ...5 Potential socio-economic ... 11 Appendices6 Program design

Analysis of efficiency measures in the Murray-Darling Basin: Opportunities to recover 450GL in additional environmental water through efficiency measures by 2024, with neutral or positive socio-economic impacts | Page 77 of 307
19 January 2018 | Final Report
Summary of impact mapping5 Potential socio-economic impacts of efficiency measures
The impacts of water efficiency measures have been identified through the use of impact mapping. These trace the socio-economic impacts of on and off-farm water efficiency measures to understand the cause and effect of activities. Detailed mapping is presented in Appendix F.
An overview of the impact mapping is shown below, with further explanation on subsequent pages.
Off-farm efficiency measures
On-farm efficiency measures
Source: EY analysis.*Includes changes to network configuration, water delivery management, employment and water quality.
1. Pipes installation and/or channel remediation
2. Channel automation
3. Rationalisation
4. Installation of stock and domestic pipelines
Individual farm
Irrigation network
Community impact Basin impact
By
proj
ect t
ype
Entitlement transfer
Decreased transmission
losses
Project specific impacts*
Infrastructure funding
1. Water efficiency gains
3. Entitlements transfer
4. Labour productivity changes
Community impact Basin impact
2. Infrastructure funding
5. Non-labour productivity changes
By
proj
ect i
mpa
ct
Participant profitability
Irrigation network
Other irrigator profitability
Production
Project specific impacts
Employment
Water volume demanded
1 Terms of reference 7 Opportunities for efficiency ...2 Glossary 8 Cost of efficiency measures3 Executive summary 9 Principles for negating adv ...4 Introduction 10 A program to achieve 450 ...5 Potential socio-economic ... 11 Appendices6 Program design

Analysis of efficiency measures in the Murray-Darling Basin: Opportunities to recover 450GL in additional environmental water through efficiency measures by 2024, with neutral or positive socio-economic impacts | Page 78 of 307
19 January 2018 | Final Report
Off-farm impact mapping: introduction5 Potential socio-economic impacts of efficiency measures 1 Terms of reference 7 Opportunities for efficiency ...
2 Glossary 8 Cost of efficiency measures3 Executive summary 9 Principles for negating adv ...4 Introduction 10 A program to achieve 450 ...5 Potential socio-economic ... 11 Appendices6 Program design
Off-farm impact mappingOff-farm water efficiency measures occur through a variety of different projects. There are four main off-farm projects which have been considered in this analysis:
1. Installing/constructing pipes and/or channel lining, channel remediation through re-lining (plastic, clay or concrete), replacing/upgrading pumps
2. Channel automation3. Rationalisation4. Installing stock and domestic pipelines.
Understanding the off-farm impact mappingIn the first instance, the analysis explores the transfer of water entitlements to the Commonwealth. Depending on the irrigation network, delivery water could be:► Conveyance water, used for water delivery so is not part of the consumptive pool;
and/or ► Water owned by the irrigation network, which is used to trade in the temporary
allocation market.
Therefore, the transfer may or may not have an impact on productive water and the temporary water market. Both cases are explored.
Subsequently analysis of the impact of reducing run-offs is considered. Water run-offs have a potential positive externality, for other irrigators on the network and/or the environment. For instance, in some circumstances, end of system releases could be potentially used by other irrigators in production. This increases profits as the water is effectively ‘free’. Alternatively, this water may provide positive environmental (and flow-on economic) impacts to the local community. The distributional impacts affect the irrigation network, individual irrigators, communities and the Basin.
The analysis maps specific impacts by each of the four off-farm projects. As these projects are quite different in nature and scope, there is little overlap. Understanding the impacts of these gives rise to a broader range of scenarios to explore the direct network and irrigator and indirect community and Basin impacts.
Off-farm water losses
Water can be lost through the irrigation network via seepage, evaporation, or leakage before it ever gets to the farm gate. This is primarily delivery water, not water intended for production by an irrigator.
Depending the condition of network infrastructure, this water loss is potentially large. For instance, prior to the Goulbourn-Murray Water’s off-farm efficiency measures project, it was estimated that in a full allocation year, around 830GL of water was lost through the network.1
Case studyIrrigation scheme modernisation in Trangie Nevertire, NSW
Program: Private Irrigation Infrastructure Operators Program (PIIOP)
Irrigation network: a 240km open channel network delivering up to 700ML of water per day across more than 90 properties.
Water saved: approximately 32,151ML.
Project details:
► Modernising around 143km of the open channel system (involving channel reforming and lining, upgrading structures, metering and telemetry) and rationalising around 97km.
► Separating the delivery of stock and domestic water from irrigation by installing an underground pipeline.
► Funding for on-farm work.
Benefits from project:
► Modelling indicates that off-farm water network loss has fallen from 34% to 7%, over the long run. As delivery reliability is therefore higher, there are more opportunities for crop production, increasing irrigator profitability.
► More assured supply of quality water for stock and domestic purposes.
1 Goulbourn Murray Water 2016, Submission to the Senate Select Committee on the Murray-Darling Basin Plan, http://www.g-mwater.com.au/downloads/gmw/1_Current/Publications/16022016_-_4064235-v8-SENATE_INQUIRY_IMPLEMENTATION_OF_BASIN_PLAN_GMW_SUBMISSION.pdf.
Source: Trangie Nevertire Irrigation Scheme 2016, Trangie Nevertire Co-operative Ltd (TNCL) Final Project Report under Round One of the Private Irrigation Infrastructure Operators Program in NSW,
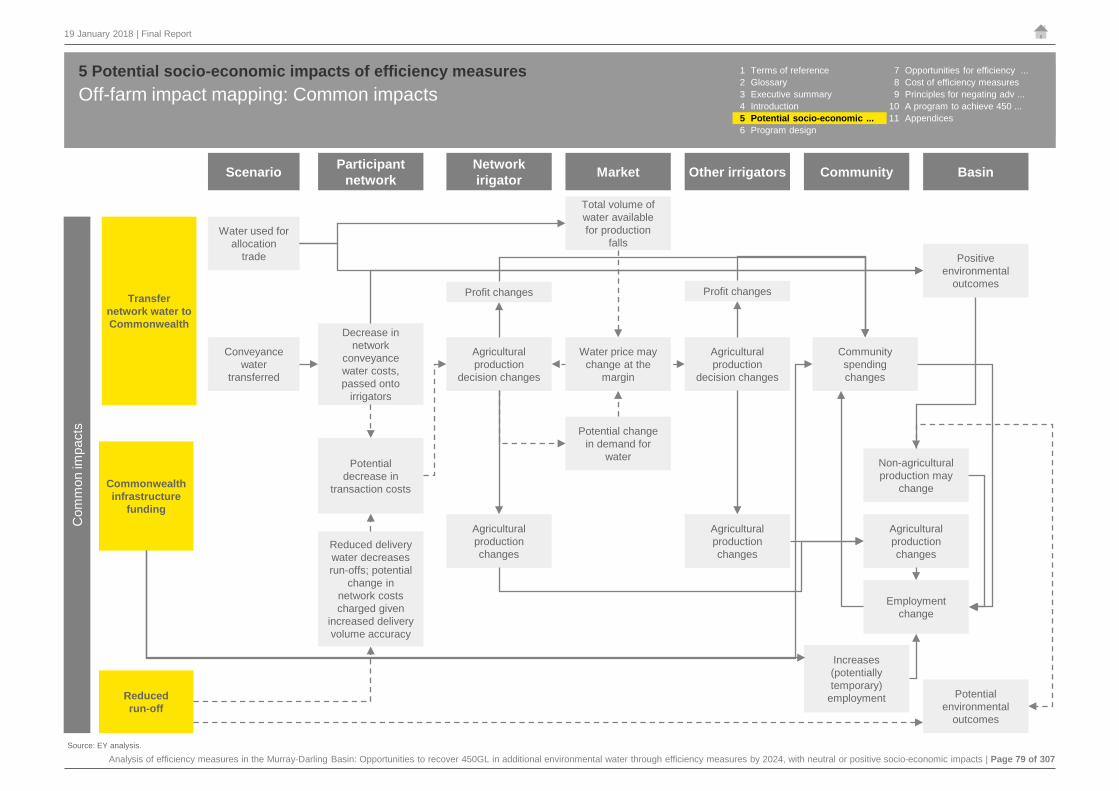
Analysis of efficiency measures in the Murray-Darling Basin: Opportunities to recover 450GL in additional environmental water through efficiency measures by 2024, with neutral or positive socio-economic impacts | Page 79 of 307
19 January 2018 | Final Report
Off-farm impact mapping: Common impacts5 Potential socio-economic impacts of efficiency measures
Source: EY analysis.
Transfer network water to Commonwealth
Scenario Participant network Market Other irrigators Community BasinNetwork
irigator
Commonwealth infrastructure
funding
Reducedrun-off
Com
mon
impa
cts
Water used for allocation
trade
Conveyance water
transferred
Decrease in network
conveyance water costs, passed onto
irrigators
Agricultural production changes
Profit changes
Community spending changes
Agricultural production changes
Agricultural production
decision changes
Potential decrease in
transaction costs
Positive environmental
outcomes
Water price may change at the
margin
Potential change in demand for
water
Increases (potentially temporary)
employment Potential environmental
outcomes
Reduced delivery water decreases run-offs; potential
change in network costs charged given
increased delivery volume accuracy
Total volume of water available for production
falls
Agricultural production changes
Non-agricultural production may
change
Employment change
Agricultural production
decision changes
Profit changes
1 Terms of reference 7 Opportunities for efficiency ...2 Glossary 8 Cost of efficiency measures3 Executive summary 9 Principles for negating adv ...4 Introduction 10 A program to achieve 450 ...5 Potential socio-economic ... 11 Appendices6 Program design

Analysis of efficiency measures in the Murray-Darling Basin: Opportunities to recover 450GL in additional environmental water through efficiency measures by 2024, with neutral or positive socio-economic impacts | Page 80 of 307
19 January 2018 | Final Report
Off-farm impact mapping: Project specific impacts 5 Potential socio-economic impacts of efficiency measures
Source: EY analysis.
Scenario Market Other irrigators Community BasinNetwork irigator
Com
mon
impa
cts
1. Installing/ constructing
and/or channel remediation,
replacing/ upgrading
pumps
2. Channel gates and automation
Profit changes
Potential increase in the reliability
and/or timeliness of water delivery
Potential increase in deliveries (costs also
passed through)
Reduced maintenance
(passed through)
Agricultural production
decision changes
Profit changes
Agricultural production
decision changes
Network irrigators may have a competitive advantage
against other irrigators
Covered pipes instead of open channels can
increase water quality
Change in required labour
(passed through)
Received wages for labourers
change
Community spending changes
Agricultural production changes
Non-agricultural production may
change
Employment changes
Agricultural production changes
Agricultural production changes
Participant network
1 Terms of reference 7 Opportunities for efficiency ...2 Glossary 8 Cost of efficiency measures3 Executive summary 9 Principles for negating adv ...4 Introduction 10 A program to achieve 450 ...5 Potential socio-economic ... 11 Appendices6 Program design

Analysis of efficiency measures in the Murray-Darling Basin: Opportunities to recover 450GL in additional environmental water through efficiency measures by 2024, with neutral or positive socio-economic impacts | Page 81 of 307
19 January 2018 | Final Report
Off-farm impact mapping: Project specific impacts (cont.)5 Potential socio-economic impacts of efficiency measures
Scenario Market Other irrigators Community BasinNetwork irigator
Com
mon
impa
cts
Participant network
4. Stock and domestic
3. Rationalisation
Farm still used as productively
Farm not used as productively
Fewer users on network
Decreased maintenance costs from
reduced network footprint
Change in passed through network costs
Community spending changes
Agricultural production changes
Non-agricultural production may
change
Employment changes
Profit changes
Agricultural production
decision changes
Lifestyle benefit
Covered pipes instead of open channels can
increase water quality for stock and domestic
purposes
Rationalised receive
disconnection completion payment
Improved financial
outcomes, like reduced vet bills
Agricultural production changes
Source: EY analysis.
1 Terms of reference 7 Opportunities for efficiency ...2 Glossary 8 Cost of efficiency measures3 Executive summary 9 Principles for negating adv ...4 Introduction 10 A program to achieve 450 ...5 Potential socio-economic ... 11 Appendices6 Program design

Analysis of efficiency measures in the Murray-Darling Basin: Opportunities to recover 450GL in additional environmental water through efficiency measures by 2024, with neutral or positive socio-economic impacts | Page 82 of 307
19 January 2018 | Final Report
Off-farm impacts5 Potential socio-economic impacts of efficiency measures
Network
► Network delivery management is improved with channel automation and improved metering. In particular, the former can assist in managing ongoing operational costs, especially maintenance, labour and repair, by quickly detecting areas requiring channel remediation. Maintenance costs are also reduced if a gravity system is replaced by a pressurised one. Noting that new meters are more expensive than dethridge wheels and require more frequent replacement.
► Channel automation and other off-farm measures may decrease the number of employed workers or contractors on the irrigation network. In addition, the nature of work may change to be more technically proficient. Consequently, operating wages costs may change. Given the time-consuming and labour-intensive work required for manual operation, remaining workers may receive a lifestyle benefit.
► Switching from a gravity-fed to pressurised network will increase a participating networks’ reliance on variable input costs such as electricity or diesel. In terms of operating costs, this may have a positive, neutral or adverse impact. It is also dependent on the energy profile of the network (for instance, if solar panels are used).
Considerations
The directional change in network costs from an off-farm efficiency measure are difficult to determine. That is, operating costs should fall via lower maintenance, repair (rationalisation and pipes) and labour (channel automation) costs, but the network may face increased reliance on a variable input cost (electricity) and increased replacement costs for new meters. Finally, rationalisation could result in a smaller network cost base, potentially increasing fixed costs per irrigator if they are not offset by the corresponding operating cost decrease from reduced network footprint. It is noted that while there may be some increases in operating expenses, it is anticipated that accrued benefits to the network outweigh these.
Irrigators
► Any changes in network charges will flow through to irrigators on the network. The type of transferred water may change delivery costs, depending on the network pricing structure.
► Irrigators on the participating network can potentially increase their profits through better water management. That is, a network’s improved service delivery potentially improves its timeliness, responsiveness and certainty of water delivery.
► Given the substantial capital expenditure involved, networks may not have the capacity to modernise without Commonwealth funding – or modernise to the same extent over the same timeframe. Irrigators on non-participating networks compete with those on participating networks. The state of the network infrastructure in either case may cause some irrigators to receive a competitive advantage. This is considered further in impact pathways 2 and 4.
Considerations
Network costs are also impacted by irrigator behaviour. For instance, if usage increased because irrigators take advantage of on-demand water, electricity costs will likely also increase. The impact on network charges is outlined in impact pathway 3.
Most networks operate as cooperatives, where irrigators own shares. As such, irrigators on non-participating networks could influence network participation in off-farm programs to reduce potential competitive disadvantage.
Community
► A proportion of Commonwealth funding for the installation or construction of infrastructure will flow into local communities, creating employment and providing non-agricultural income over the short to medium-term. Further, these projects cause contracted organisations to develop skills and increase their capacity to deliver such work, making them more competitive in the future.
► Channel automation could change the number and nature of required labour. That is, fewer workers may be employed, but these workers may demand a higher wage. These employment and wage changes (if any) will impact the affected workers’ local spending.
Considerations
Commonwealth funding may not necessarily have a long-term impact on community employment (particularly if local contractors and suppliers are not used). However, it may help a community adjust to a more diversified income stream, by reducing their reliance on agricultural income in the short to medium terms. If a community has existing diversified income streams, there may be a reduced impact (e.g. dependence on irrigation will have more significant community impacts if water is impacted). This is considered in more detail in impact pathway 4.
Basin ► Positive impact from Commonwealth funding and construction spending.
1 Terms of reference 7 Opportunities for efficiency ...2 Glossary 8 Cost of efficiency measures3 Executive summary 9 Principles for negating adv ...4 Introduction 10 A program to achieve 450 ...5 Potential socio-economic ... 11 Appendices6 Program design

Analysis of efficiency measures in the Murray-Darling Basin: Opportunities to recover 450GL in additional environmental water through efficiency measures by 2024, with neutral or positive socio-economic impacts | Page 83 of 307
19 January 2018 | Final Report
Off-farm impact conclusions5 Potential socio-economic impacts of efficiency measures
Summary of socio-economic impacts of off-farm projects
Impacts resulting from off-farm efficiency measures programs potentially accrue to:
Impact on participating network
Infrastructure upgrades installed to reduce water losses often improve network delivery management. For instance, using channel automation technology to quickly identify areas which require remediation. This impacts the networks’ operating costs in both potentially positive and adverse ways:► Operating costs could fall via lower maintenance, repair (rationalisation and
pipes) and wages (channel automation) costs.
► The network is more reliant on a variable input cost (energy), particularly if networks usage increases. This could increase costs if networks are fully dependent on electricity networks. Additionally, new meters are more expensive and require more frequent replacement.
It is noted that infrastructure upgrades involve significant capital expenditure (supported by Commonwealth funding) and while there may be some increases in operating expenses, it is anticipated that for a network to participate the benefits accruing to the network would outweigh these.
Impact on irrigators
Improvements in network delivery management can flow to irrigators on the network, particularly if water delivery is more timely. This would allow irrigators increased flexibility over their water management decisions, such as being able to take account of short-term weather conditions. This may be offset if network charges increase as a result of modernisation and increasing network usage (again noting that for a network to participate the benefits accruing to the network would outweigh these and operating costs may fall as a result of reduced maintenance). It may also provide network users with a competitive advantage over irrigators on an unmodernised network (by enhanced flexibility in water use).
Impact on the local community
Depending on the pre-project state of network infrastructure, network modernisation could require significant capital expenditure and take several years to fully build and implement. At least some of the Commonwealth funding for this construction and commissioning work would be expected to flow into local communities, including increased employment opportunities over the short to medium term and other flow-on impacts.
Local employment may fall over the long-term, if improved labour productivity leads to fewer required workers. However, there is no evidence to suggest that reductions in employment will be significant.
Impact on other communities
Non-local communities may be adversely impacted, flowing from the potentially increased competitive pressures facing irrigators on unmodernised networks. For instance, if these irrigators reduce their production and farm employment.
Impact on the Basin
The Basin impacts are the cumulative result of preceding impacts. See page 90 for stakeholder feedback regarding the environmental benefit of water recovery.
ConclusionsThe impacts of off-farm efficiency measures generally lead to positive outcomes. This is consistent with stakeholder discussions. The identified potential adverse impacts are considered further as part of impact pathways. Specifically:
► Impact pathways 2 and 4 explore potential distributional impacts arising from changed output decisions by participants and the impact on labour productivity and employment.
► Impact pathway 3 explores the impact on network charges.
► The participating network
► Irrigators on the network
► Communities
► The Basin.
1 Terms of reference 7 Opportunities for efficiency ...2 Glossary 8 Cost of efficiency measures3 Executive summary 9 Principles for negating adv ...4 Introduction 10 A program to achieve 450 ...5 Potential socio-economic ... 11 Appendices6 Program design

Analysis of efficiency measures in the Murray-Darling Basin: Opportunities to recover 450GL in additional environmental water through efficiency measures by 2024, with neutral or positive socio-economic impacts | Page 84 of 307
19 January 2018 | Final Report
On-farm impact mapping: introduction5 Potential socio-economic impacts of efficiency measures 1 Terms of reference 7 Opportunities for efficiency ...
2 Glossary 8 Cost of efficiency measures3 Executive summary 9 Principles for negating adv ...4 Introduction 10 A program to achieve 450 ...5 Potential socio-economic ... 11 Appendices6 Program design
On-farm impact mappingSocio-economic impacts of on-farm efficiency measures vary depending on the type of on-farm project undertaken. There are eight primary on-farm projects which have been considered in this analysis (refer to Appendix E for project and impact identification):
1. Surface to drip irrigation2. Surface to centre pivot or lateral
move irrigation3. Reconfigure surface irrigation 4. Improve water application
These projects have been used to understand the type of impacts which occur as a result of water efficiency measures. Importantly, the projects considered have not limited the considerations of the impact mapping, rather they have provided a starting point to identifying the activities which occur on-farm and how these flow through directly and indirectly to generate impacts at a range of scales. Different scenarios (or participant decisions) lead to different impacts on participants and non-participants, the water market, irrigation networks, the community and the Basin.
Understanding the on-farm impact mappingThe following pages outline:► The common impacts identified across all on-farm projects – all on-farm projects
involve the construction or installation of infrastructure (including equipment and raw materials), the transfer of water entitlements (in exchange for Commonwealth funding), and new output decisions. There are four output and water demand scenarios that will be considered by a profit-maximising irrigator. In each scenario, the water price impact will depend on whether any savings were retained and whether changes in demand are offset by the transfer of water entitlements. The distributional impact of these are mapped across the irrigation network, community and Basin.
► Project specific on-farm impacts – there are also a number of project specific impacts. Dependant on the project these may include changes in the reliance on
variable costs, labour productivity impacts resulting from the automation of irrigation systems (drip, surface, lateral move, moisture monitoring) with associated changes to on-farm employment and other on-farm non-labour productivity impacts.
5. Improve storage and delivery6. Soil moisture monitoring7. Mulching8. Planting more water efficient crops1
Case studyWine grape irrigation scheme modernization in Renmark, SA
Program: On-Farm Efficiency Program
Project timeframe: Completed August 2012
Delivery partner: SA Murray-Darling Basin Natural Resources Management Board
Water saved: 48ML per year
Project included:
► Replacing 21.5 hectares of wine grape production form lower level sprinklers with automated drips system.
► Installation of soil moisture monitoring system.
► New pumps, filtration and fertigation.
Benefits from project:
► A reduction in labour to maintain and repair the old system as was more prone to blockage with a total of 185 hours expected to be saved.
► A reduction in vehicle costs as the new system requires less repairs and maintenance (estimated to be $800/year).
► A reduction in water usage from 185ML/year to 137ML/year.
► An increase in yield from 2.9 t/ML to 4t/ML.
► A decrease in energy costs as a result of smaller, more efficient pumps.
1 Water efficient crops were not considered an irrigation water saving infrastructure under all on-farm programs. However, it is considered under the COFFIE program.
Source: RMCG 2016, Case Studies to inform MERI for Irrigation Efficiency Programs.

Analysis of efficiency measures in the Murray-Darling Basin: Opportunities to recover 450GL in additional environmental water through efficiency measures by 2024, with neutral or positive socio-economic impacts | Page 85 of 307
19 January 2018 | Final Report
On-farm impact mapping: Common impacts across all projects5 Potential socio-economic impacts of efficiency measures
Source: EY analysis.
Scenario Network Other irrigators Community BasinMarket
The
new
pro
duct
ion
deci
sion
Participant
Increases in water
productivity causes an irrigator to
require less water at the
farm-gate (the water
demanded) for the same
production. The input mix may
change, of which water is only one factor
Commonwealth infrastructure
funding
Transfer water entitlements to Commonwealth
Same production (decrease
demand for water)
Increased production (decrease
demand for water)
Increased production (increase
demand for water)
Increased production
(unchanged demand for
water)
Total water demanded or
supplied changes
Total volume of water available for production
falls
Water price changes at the
marginAgricultural production changes
Network charges may change
Positive environmental
outcomes
Community spending changes
Profit is the same or increases
Profit changes
Agricultural production
decision changes, including input
mix
Water demanded at the farm-gate changes/water sold changes
Agricultural production
unchanged or increased
Increases (potentially temporary)
employment
Potential change in volumes of
water delivered
Agricultural production changes
Non-agricultural production may
change
Employment changes
Potential change in volumes of
water delivered
1 Terms of reference 7 Opportunities for efficiency ...2 Glossary 8 Cost of efficiency measures3 Executive summary 9 Principles for negating adv ...4 Introduction 10 A program to achieve 450 ...5 Potential socio-economic ... 11 Appendices6 Program design

Analysis of efficiency measures in the Murray-Darling Basin: Opportunities to recover 450GL in additional environmental water through efficiency measures by 2024, with neutral or positive socio-economic impacts | Page 86 of 307
19 January 2018 | Final Report
On-farm impact mapping: Project specific impacts5 Potential socio-economic impacts of efficiency measures
Labour productivity
change
Non-labour productivity
change
Increased reliance on
variable inputs, reduced
flexibility in on-selling water
Scenario Network Other irrigators Community BasinMarketParticipant
Thes
e im
pact
s al
so fe
ed in
to th
e ne
w p
rodu
ctio
n de
cisi
on
Increase employment
(output increase)
Decrease employment (output same or increased)
Unchanged employment (output same or increased)
Unchanged employment but required skills may increase
Profit is the same or increases
Profit changes
Potential reduction in anti-
social hours
Labourer wages input cost change
Received wages for labourers
change
Increased uncertainty, profit
may change
Community spending changes
Agricultural production changes
Non-agricultural production may
change
Employment changes
Agricultural production
unchanged or increased
Agricultural production
decision changes, including input
mix
Agricultural production changes
Note: while these impacts feed into the new output decision, their effect depends on the type of on-farm measure that has been undertaken.
1 Terms of reference 7 Opportunities for efficiency ...2 Glossary 8 Cost of efficiency measures3 Executive summary 9 Principles for negating adv ...4 Introduction 10 A program to achieve 450 ...5 Potential socio-economic ... 11 Appendices6 Program design
Source: EY analysis.

Analysis of efficiency measures in the Murray-Darling Basin: Opportunities to recover 450GL in additional environmental water through efficiency measures by 2024, with neutral or positive socio-economic impacts | Page 87 of 307
19 January 2018 | Final Report
On-farm project impacts for participating irrigators5 Potential socio-economic impacts of efficiency measures
Positive
Potential to increase profits by:
► Increasing crop quality and/or yield by: optimally watering crops, better distribution and/or application of water to crops and/or feeding crops more nutrients through mulching.
► Better water management improving an irrigators’ timeliness, responsiveness and flexibility through on-site water storage.
► Planting higher value crops.
► Reducing labour costs through automation.
► Changing production levels and water demanded, regardless of whether the irrigator can retain some water savings.
Potential lifestyle benefits through:
► Automated irrigation scheduling, reducing the amount of anti-social hours required on the farm or in transit.
ConsiderationsIf a participating irrigator changes their demand for water both the marginal price of water in the temporary market and an irrigation networks’ cost base may be impacted. Further, increases to farm business profit may not occur if the prevailing commodity prices decline, or other input prices change. In addition, stakeholders have also suggested that water efficiency measures may also increase resilience to climate change e.g. if evaporation is greater in the future, investing in efficiency measures that reduce evaporation ay enhance benefits and improve resilience.
Even if there is automation or other increased labour productivities, the irrigator may redeploy hired workers or agricultural contractors instead of reducing them. Labour redeployment resulting from upgrades has the potential to lead to the training and upskilling of workers from unskilled to semi-skilled to meet new irrigation needs. If this is the case, the irrigator may have to increase their wages cost for the higher skilled labour, noting that it is anticipated these employees would be more productive. If irrigators are assumed to be profit-maximising, this is not a net adverse impact. If the automated labour is the irrigators’ own, they may only experience a potential lifestyle benefit. This benefit is in the form of reduced anti-social working hours and/or transportation hours getting to and from a farm. As such, irrigators may have increased opportunity to gain additional off-farm income. This is further considered in impact pathway 4.
Adverse
Potential issues:
► Any increase in reliance on variable inputs (electricity, diesel, temporary water market prices) may increase uncertainty. Further, transferring water entitlements reduces a participant’s flexibility to on-sell water, increasing their dependence on agricultural income. Together, an irrigators’ ability to forward plan may be reduced.
► Increased risk of unutlised assets if upgrades are undertaken and participants subsequently sell their water or exit production.
ConsiderationsUnder the Basin Plan definition of neutrality, and the assumption that a participant is profit-maximising, any adverse impacts should at least be balanced against the positive impacts i.e. it can be assumed that participation means that the benefits are equal to or outweigh the costs. However, if irrigators do not have the right skillset to correctly utilise their new infrastructure, they may not benefit to the extent anticipated.
Some projects will increase an irrigator’s reliance on variable input costs such as electricity or diesel, as automation generally substitutes labour for power. In terms of profit, this may have a positive, neutral or adverse impact depending on the price of these inputs at any particular time. Given increasing productive water and reduced consumptive entitlements, a participating irrigator is only more reliant on the temporary market if they increase production (noting that increased production could result from a change in inputs, of which water is only one part). However, all else being equal, they can afford to pay more for temporary water, given that they can produce more output with it, compared to a non-participating irrigator. See impact pathway 2 for more information.
Participants who are intermittent producers may have sold water allocations in dry seasons pre-project, due to high water prices in these periods. Post-project they have less allocation to sell. They are therefore more reliant on agricultural income and may be more vulnerable in a downturn.
Participating irrigators decrease their on-farm water losses in exchange for transferring some or all of the savings to the Commonwealth. This analysis assumes that irrigators are profit-maximising. Consequently, any on-farm decision (for instance the production input mix) will leave them the same or better off, all else being equal.
.
1 Terms of reference 7 Opportunities for efficiency ...2 Glossary 8 Cost of efficiency measures3 Executive summary 9 Principles for negating adv ...4 Introduction 10 A program to achieve 450 ...5 Potential socio-economic ... 11 Appendices6 Program design

Analysis of efficiency measures in the Murray-Darling Basin: Opportunities to recover 450GL in additional environmental water through efficiency measures by 2024, with neutral or positive socio-economic impacts | Page 88 of 307
19 January 2018 | Final Report
On-farm project impacts for other irrigators and the network5 Potential socio-economic impacts of efficiency measures
Other irrigators
Non-participating irrigators may be adversely impacted if:
► Participating irrigators increase their demand for water on the temporary market and the marginal price increases. This will increase input costs (decreasing profits) for those who are net buyers and increase revenue (increasing profits) for net sellers. However, the magnitude depends on the required volume of water, specifically, a marginal unit compared to significant volumes.
► Participating irrigators sold less temporary allocations in dry seasons, due to the entitlements transfer. As such, accessing water on the temporary allocation market may be more difficult. This may impact more heavily on irrigators with permanent plantings.
► There are participating irrigators on the same network who reduce their water delivery rights, as they require less water in production. As fixed costs are generally allocated against these rights, network charges f may increase over the long-term.
The above impacts may be neutral or positive, for instance if:
► The price of temporary water does not increase or if a non-participant is a not a market participant. Alternatively, if an irrigator is a net seller, higher prices will provide additional revenue.
► If a participating irrigator purchase further water entitlements, do not reduce their water delivery right, or pay an appropriate termination fee, non-participants may not be impacted.
Considerations
Non-participating irrigators may be affected by behavioral changes from participating irrigators. In particular, irrigators may face the same water markets, marginal water prices and may be serviced by the same irrigation network.
However, the magnitude of any adverse impact will depend on a range of factors including their current debt levels, whether they’ve modernised, produced commodities and related operating environment (including commodity specific input and sale prices).
Irrigators with a high reliance on purchasing temporary water may be more vulnerable to higher water prices. This includes irrigators who:
► Have previously participated in a buyback
► Are unestablished (for instance, a young entrant with limited capital), or
► Engage in annual cropping rather than growing permanent plantings.
This adverse impact may be worse in a dry year, compared to a wet year (as rainfall is a direct substitute for temporary water). These distributional considerations are further considered in impact pathway 2.
The long-term impact to network costs as a result of water efficiency projects will depend on total changes in water delivery rights, the termination fees collected and how these fees are used.
If water market sellers are not irrigators in the Murray-Darling Basin, (for instance, if the water is sold by a financial institution), the benefit of higher prices will not be experienced by the Basin region.
Network
► Transferring water entitlements to the Commonwealth reduces the total volume of water that can be delivered through networks across the Basin. This can impact a network as network pricing structures are determined either wholly or at least partially against water delivery rights.
► If an on-farm efficiency measure increases a participating irrigators viability (by increasing their profit potential), they may be less inclined to leave the network, increasing resilience. However, the reverse is likely true as well.
Considerations
Similar to an electricity network, an irrigation network ‘death spiral’ may theoretically occur when irrigators (and their water) leave a network en masse. Participation (both on and off-farm) is likely to decrease the chances of this occurring as efficiency measures generally results in increased business viability. However, all else being equal, non-participants may be more inclined to leave the network due to their relative competitive disadvantage. The impact to remaining irrigators will depend on how the irrigation network utilises any recovered termination fees and how the exiting irrigator’s water and land is used. This is considered in more detail in impact pathway 3.
Non-participating irrigators are those who have not upgraded their on-farm water efficiency using Commonwealth funding. However they may have modernised through private funding. These users operate in the same markets as participating irrigators, leading to potential changes in input costs. This analysis assumes that irrigators are profit-maximising. Additionally, irrigators on the same network may have participated in an on-farm efficiency measure program.
1 Terms of reference 7 Opportunities for efficiency ...2 Glossary 8 Cost of efficiency measures3 Executive summary 9 Principles for negating adv ...4 Introduction 10 A program to achieve 450 ...5 Potential socio-economic ... 11 Appendices6 Program design

Analysis of efficiency measures in the Murray-Darling Basin: Opportunities to recover 450GL in additional environmental water through efficiency measures by 2024, with neutral or positive socio-economic impacts | Page 89 of 307
19 January 2018 | Final Report
On-farm project impacts for communities and the Basin5 Potential socio-economic impacts of efficiency measures
Community
► Participating irrigators with increased profits may increase their local spending. This could have positive flow-on impacts by increasing local employment in agricultural support services. This could also occur for non-participating irrigators if their variable input costs decrease or revenue increases with changes in the marginal price of water.
► However, for non-participating irrigators, if their input costs increase (through increased network costs or water prices etc.) or variable revenue decreases, they may reduce their local spending, potentially decreasing community employment in agricultural support services. These non-participants may be more likely to produce certain commodities and live in the same regions.
► Community spending by irrigators (both participants and non-participants) will also change due to changes in production. That is, the volume produced and type and amount of inputs.
► Commonwealth funding for the installation or construction of infrastructure flows into the local communities, increasing employment outcomes over the short to medium term and general local spending.
► Some projects may increase labour productivity. As such, participating irrigators may change the number of employed workers (including hired farm workers and agricultural contractors) and/or require workers with increased technical proficiency. These labour changes (if any) will impact the affected workers’ local spending.
Considerations
Whether an irrigator changes the location of their spending (either on-farm services or non-agricultural) will likely be influenced by the current goods available in the local community. That is, smaller communities may be more vulnerable to a reduction in spending than larger ones, particularly if smaller vendors are slow to adjust. This could occur even if local irrigators experience higher profits, as they may still move their spending to a larger regional centre.
Community impacts may vary depending on the context. For instance, during dry conditions, participating irrigators (and unmodernised non-participants) may be better able to maintain production, reducing adverse impacts to communities. This implies an increased resilience. However, the transfer of water entitlements may prevent them receiving income from selling water allocations in these conditions, resulting in a potential adverse impact as they have less income to spend in a community. See impact pathway 2 for more information.
Commonwealth funding may not necessarily have a long-term impact on community employment (particularly if local contractors and suppliers are not used). However, it may help a community adjust to a more diversified income stream, to reduce their reliance on agricultural income.
Automation may also provide lifestyle benefits to remaining workers, particularly if they only impact the farm owner. That is because the first hours likely to be reduced are the anti-social hours, and/or transportation hours getting to and from a farm. This may also provide an opportunity for these irrigators to gain additional income from other work. On-farm and Commonwealth employment outcomes are further considered in impact pathway 4.
Community resilience may be increased if the improved Basin Plan environmental outcomes can support new industries, such as tourism. That is, communities could have a diversified income stream, decreasing their reliance on agriculture. However, some communities will be more able to support these new industries than others.
Basin
► The community impacts from above (both positive and negative) will flow through to the Basin. In particular, even if a participating irrigator is not increasing their spending in their local community, they could still be increasing it within the Basin.
► Production changes in agricultural output from participating and non-participating irrigators will impact domestic and international trade and result in impacts at the Basin level.
Considerations
An irrigator changing the geographic location of their spending will still lead to a distributional impact between the effected communities. It is likely that a community with a relatively strong reliance on agricultural income may be more adversely impacted by a reduction in spending than a diversified one. Similarly, any population changes in the Basin could be concentrated in regional centres, potentially hiding a fall in other communities.
The decrease in consumptive water through entitlements transfer may constrain the potential long-term agricultural output of the Basin. However this water is now used for environmental purposes, so the counterfactual (of no decrease in consumptive water) is not necessarily unconstrained agricultural output. The value of affected production is calculated in impact pathway 1.
Positive, neutral and adverse Impacts from irrigators (participants and non-participants) and the irrigation network will flow into communities and the Basin.
1 Terms of reference 7 Opportunities for efficiency ...2 Glossary 8 Cost of efficiency measures3 Executive summary 9 Principles for negating adv ...4 Introduction 10 A program to achieve 450 ...5 Potential socio-economic ... 11 Appendices6 Program design

Analysis of efficiency measures in the Murray-Darling Basin: Opportunities to recover 450GL in additional environmental water through efficiency measures by 2024, with neutral or positive socio-economic impacts | Page 90 of 307
19 January 2018 | Final Report
On-farm project impact conclusions5 Potential socio-economic impacts of efficiency measures 1 Terms of reference 7 Opportunities for efficiency ...
2 Glossary 8 Cost of efficiency measures3 Executive summary 9 Principles for negating adv ...4 Introduction 10 A program to achieve 450 ...5 Potential socio-economic ... 11 Appendices6 Program design
On-farm summary of impacts
Impacts resulting from on-farm efficiency measures programs can potentially accrue to:
Impact on participating irrigators
Participants are likely to experience net positive outcomes from efficiency measures programs given the potential for increased profit resulting from improved water efficiency and production productivity, as well as freeing up labour for more productive purposes and/or generating lifestyle benefits for irrigators.
Impact on non-participating irrigators
Non-participating irrigators face the same water markets and marginal water prices as participating irrigators and may be serviced by the same irrigation network. As such, behavioural changes in water demanded by participants could impact non-participants in positive, adverse or neutral ways.
The nature and magnitude of an impact will depend on non-participant characteristics and their prevailing operating environment. Non-participants who may be particularly vulnerable include those who are unmodernised and grow commodities which are currently experiencing low sale prices.
Impact on the irrigation networks
Depending on how termination fees are utilised, changes in demanded water volumes could impact irrigation network pricing structures and their ability to recover fixed costs in the long-run.
Impact on communities
Irrigator outcomes will flow into communities. Positive impacts include:
► Improved long-term employment outcomes if downstream industries expand as a result of increased production
► Improved short to medium employment due to the Commonwealth funded construction and installation phases of on-farm infrastructure. This funding flows into communities through other spending such as equipment, supplies and fuel
► Improved environmental outcomes under the Basin Plan could support new industries in some communities.
Adverse impacts could occur if production falls as there may be resulting employment impacts. Certain communities may be disproportionally impacted and their viability may be threatened.
Impact on the Basin
The culmination of the previous impacts. However over the long-term, decreases in consumptive water through entitlements transfer may constrain future agricultural production. But this water is now used to deliver improved environmental outcomes, which acts to secure the long-term health of the Basin.
► Participating irrigators► Non-participating irrigators► Irrigation network
► Communities, and► The Basin.
Feedback from stakeholders
The following points were expressed by stakeholders during consultations:► Additional environmental water has increased the benefits of tourism,
attracting people to a longer water sports season (recreational activities) and healthier ecosystem (increased opportunities for fishing).
► There is concern regarding environmental water management, particularly relating to the transparency of flows and the potential for non-optimal allocation. There are concerns for potential damage if water is released down rivers which have previously not had large volumes of water (e.g. increase risk of flooding) with natural physical constraints.
► There may be further opportunities for irrigators and the CEWH to work together to achieve broader environmental water system efficiencies.
► Greater education on the management of environmental water, and the purpose of the Basin Plan would help stakeholders to understand and support environmental water initiatives.
► There are areas of the Basin which have benefited from the environmental water, with an increase in the health of local ecosystems and increased wildlife.
Source: Stakeholder consultations.

Analysis of efficiency measures in the Murray-Darling Basin: Opportunities to recover 450GL in additional environmental water through efficiency measures by 2024, with neutral or positive socio-economic impacts | Page 91 of 307
19 January 2018 | Final Report
On-farm project impact conclusions5 Potential socio-economic impacts of efficiency measures 1 Terms of reference 7 Opportunities for efficiency ...
2 Glossary 8 Cost of efficiency measures3 Executive summary 9 Principles for negating adv ...4 Introduction 10 A program to achieve 450 ...5 Potential socio-economic ... 11 Appendices6 Program design
Conclusions
Participants in on-farm efficiency measures programs generally experience positive outcomes. However, there are some potential adverse impacts identified for non-participants which flow into their communities and the Basin. These issues were raised throughout stakeholder consultation and have been considered as part of the impact pathways. Specifically:
► Impact pathway 1: explores the impact on irrigated production
► Impact pathway 2: considers the distributional impact arising from changed output decisions by participants
► Impact pathway 3: examines the impact on network charges
► Impact pathway 4: analyses the impact on labour productivity and employment.
Case study
Improved low level sprinklers for almondsDave and Hilary Santee produce almonds on 35 hectares using old low level sprinklers. Conversion to new low level sprinklers has resulted in water savings of 100ML/year and an increase in yield from 0.2 t/ML to 0.3 t/ML.
“We were struggling before this update”
“We should have done it ourselves years ago”
“We probably would not have done this investment without the program”
Source: RMCG 2016, Case Studies to inform MERI for Irrigation Efficiency Programs.

Analysis of efficiency measures in the Murray-Darling Basin: Opportunities to recover 450GL in additional environmental water through efficiency measures by 2024, with neutral or positive socio-economic impacts | Page 92 of 307
19 January 2018 | Final Report
Socio-economic impact pathway 1: Impact on irrigated production overview5 Potential socio-economic impacts of efficiency measures
On-farm program participants transfer entitlements equivalent to the modernisation water savings (less retained savings) to the Commonwealth, in exchange for funding for infrastructure upgrades.
If Commonwealth funding brings forward investment in water efficiency measures, short term production is enhanced. Furthermore, the multiple generally funds additional productive capacity.
However, if efficiency measures were invested in by irrigators themselves using their own capital, then the water savings could support additional future production.
This pathway therefore considers the opportunity cost associated with participation and the net impact of on-farm efficiency measures on irrigated production.
► Would infrastructure upgrades occur without Commonwealth funding?
► Would the transferred water have been used for production?
► Are there alternative water efficiency gains that could be invested in, and a longer timeframe before productive capacity is lost?
► Can some water savings be retained for production?
► Can further farm productivity improvements or changes in inputs further offset reduced consumptive water entitlements?
► Which commodities would water have been used to produce?
► What financial benefit does Commonwealth funding provide participating irrigators?
Discounted over 20 years, the net financial benefit to industry is estimated to be between $70-302 million depending on the produced commodity. This is comprised of:
► A cost in lost future production of $39-$373 million,
► A benefit of $66-$632 million in increased short-term production
► A benefit of $43 million in relation to the foregone cost of capital.
Sensitivity analysis has demonstrated that the key determinant is the ability to realise short-term benefits.
For example if no benefits are achieved a net cost to industry of up to $330 million could arise. Short term production needs to increase by up to 16% for a positive net financial benefit to industry to occur.
Infrastructure upgrades bring forward investment, allowing irrigators to increase short-term production. This represents an opportunity cost in forgone future production.
Based on the data and information available, on a 20-year NPV basis, on-farm water efficiency projects have a net financial benefit to industry as reductions in future production are offset by increased production in the short-term and the benefit of Commonwealth funding.
On average, the analysis has indicated that approximately 23% of funding contributes to enhanced production.
However, if short-term production does not increase (as a result of irrigators either not being able to retain water savings or on-farm productivity not improving) then there may be a net cost to industry.
► Invest in community engagement to promote understanding of the impacts from water efficiency measures. Also invest in a monitoring and evaluation framework to better analyse impacts of efficiency measures.
► Supporting measures such as education and training, R&D and facilitation of knowledge sharing, should be included as part of water efficiency programs to ensure that participants are able to take advantage of productivity improvements.
Implication for program designConclusionAssessing the
impactKey considerationsPotential issue
1 Terms of reference 7 Opportunities for efficiency ...2 Glossary 8 Cost of efficiency measures3 Executive summary 9 Principles for negating adv ...4 Introduction 10 A program to achieve 450 ...5 Potential socio-economic ... 11 Appendices6 Program design

Analysis of efficiency measures in the Murray-Darling Basin: Opportunities to recover 450GL in additional environmental water through efficiency measures by 2024, with neutral or positive socio-economic impacts | Page 93 of 307
19 January 2018 | Final Report
Socio-economic impact pathway 1: Impact on irrigated production5 Potential socio-economic impacts of efficiency measures
IssueOn-farm water efficiency measures have the potential to reduce future irrigated production by transferring water entitlements to the Commonwealth, in exchange for investment in infrastructure upgrades that generate water productivity improvements.
On-farm efficiency measures do not reduce agricultural production in the short-term, as water entitlements are exchanged for increased water efficiency and productivity. However, if efficiency measures were invested in by irrigators leveraging the equity value of the water entitlements (or selling part of the entitlement to the market), then the generated water savings could have supported additional future production rather than being transferred for environmental purposes. Note the timeframe for this occurring (leveraging equity of water entitlements) is approximately 10-20 years, compared to 1-2 years from leveraging the multiple paid by the Commonwealth.
That is, without water recovery measures, future production could have increased through the use of water saved (which under efficiency programs is transferred to the environment) for irrigation. Theoretically this results in a reduction in the future consumptive pool. This would create an effective increase in the amount of water available for production (as water losses are reduced), thereby increasing the potential for future production. As such, the transfer of entitlements for infrastructure funding leads to an opportunity cost of future production.
In addition to bringing the gain forward, the multiple paid under water efficiency programs (historically over two times prevailing water prices), also funds additional productivity investment brought forward for the sole benefit of the irrigator and industry.
It is noted that the assessment below assumes as a counterfactual that water use could continue at current levels. However, a key driver of the Murray-Darling Basin Plan was that extraction was unsustainable and therefore water needed to be returned to the environment. As such, some stakeholders noted that an alternative counterfactual is that less agricultural production could be undertaken across the
Basin in the future. However it is also noted that the 450GL is one component of the overall Basin Plan and water has already been recovered through other means.
Commonwealth funding brings forward investment in water efficiency (as demonstrated in the chart below). This can enhance production in the short-term (where some water savings are retained by the participant or through improved on-farm productivity) at the expense of long-term production. The nature and magnitude of the impact on production involves the consideration of a number factors as discussed under the Considerations.
Appendix H provides a further explanation of this issue.
Production increases without efficiency measures
Efficiency measure
implemented
Benefit of earlier implementation
Production loss due to entitlement
transfer
Time
Agricultural production value
Upgrade in absence of
Commonwealth funding
Other on-farm productivity
Retained savings
Source: MDBA consultation, and EY analysis.
Production increases under efficiency measures
Figure: Impact of modernisation over time
1 Terms of reference 7 Opportunities for efficiency ...2 Glossary 8 Cost of efficiency measures3 Executive summary 9 Principles for negating adv ...4 Introduction 10 A program to achieve 450 ...5 Potential socio-economic ... 11 Appendices6 Program design

Analysis of efficiency measures in the Murray-Darling Basin: Opportunities to recover 450GL in additional environmental water through efficiency measures by 2024, with neutral or positive socio-economic impacts | Page 94 of 307
19 January 2018 | Final Report
Socio-economic impact pathway 1: Impact on irrigated production5 Potential socio-economic impacts of efficiency measures 1 Terms of reference 7 Opportunities for efficiency ...
2 Glossary 8 Cost of efficiency measures3 Executive summary 9 Principles for negating adv ...4 Introduction 10 A program to achieve 450 ...5 Potential socio-economic ... 11 Appendices6 Program design
Source: EY analysis
Scenario Network Other irrigators Community BasinMarketParticipant
The
new
pro
duct
ion
deci
sion
Increases in water
productivity causes an irrigator to
require less water at the
farm-gate (the water
demanded) for the same
production. The input mix may
change, of which water is only one factor
Commonwealth infrastructure
funding
Transfer water entitlements to Commonwealth
Irrigator is more water
efficient; further water efficiencies
may occur at a reduced rate Total water
demanded or supplied changes
Water price changes at the
marginAgricultural production changes
Network charges may change
Positive environmental
outcomes
Community spending changes
Profit is the same or increases
Profit changes
Agricultural production
decision changes, including input
mix
Water demanded at the farm-gate changes/water sold changes
Agricultural production
unchanged or increased
Increases (potentially temporary)
employment
Potential change in volumes of
water delivered
Potential change in volumes of
water delivered
Agricultural production changes
Non-agricultural production may
change
Employment changes
Future agricultural production potentially reduced
Total volume of water available for production
falls
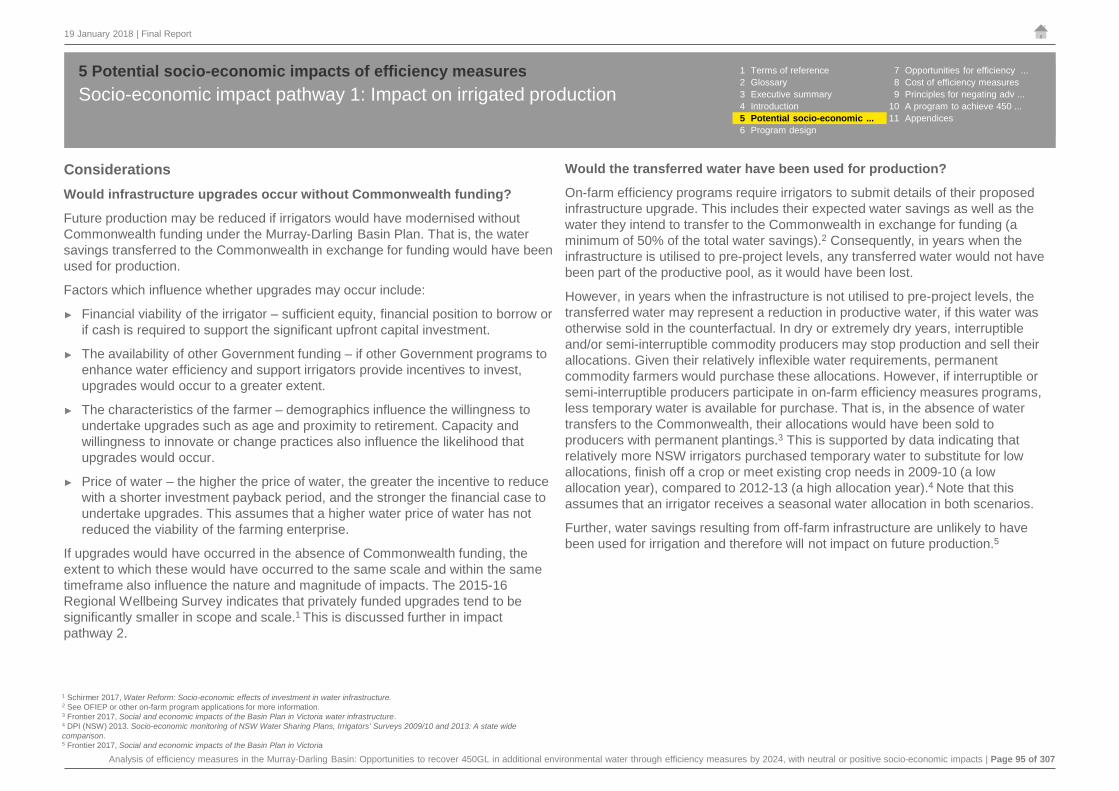
Analysis of efficiency measures in the Murray-Darling Basin: Opportunities to recover 450GL in additional environmental water through efficiency measures by 2024, with neutral or positive socio-economic impacts | Page 95 of 307
19 January 2018 | Final Report
Socio-economic impact pathway 1: Impact on irrigated production5 Potential socio-economic impacts of efficiency measures
ConsiderationsWould infrastructure upgrades occur without Commonwealth funding?
Future production may be reduced if irrigators would have modernised without Commonwealth funding under the Murray-Darling Basin Plan. That is, the water savings transferred to the Commonwealth in exchange for funding would have been used for production.
Factors which influence whether upgrades may occur include:
► Financial viability of the irrigator – sufficient equity, financial position to borrow or if cash is required to support the significant upfront capital investment.
► The availability of other Government funding – if other Government programs to enhance water efficiency and support irrigators provide incentives to invest, upgrades would occur to a greater extent.
► The characteristics of the farmer – demographics influence the willingness to undertake upgrades such as age and proximity to retirement. Capacity and willingness to innovate or change practices also influence the likelihood that upgrades would occur.
► Price of water – the higher the price of water, the greater the incentive to reduce with a shorter investment payback period, and the stronger the financial case to undertake upgrades. This assumes that a higher water price of water has not reduced the viability of the farming enterprise.
If upgrades would have occurred in the absence of Commonwealth funding, the extent to which these would have occurred to the same scale and within the same timeframe also influence the nature and magnitude of impacts. The 2015-16 Regional Wellbeing Survey indicates that privately funded upgrades tend to be significantly smaller in scope and scale.1 This is discussed further in impact pathway 2.
Would the transferred water have been used for production?
On-farm efficiency programs require irrigators to submit details of their proposed infrastructure upgrade. This includes their expected water savings as well as the water they intend to transfer to the Commonwealth in exchange for funding (a minimum of 50% of the total water savings).2 Consequently, in years when the infrastructure is utilised to pre-project levels, any transferred water would not have been part of the productive pool, as it would have been lost.
However, in years when the infrastructure is not utilised to pre-project levels, the transferred water may represent a reduction in productive water, if this water was otherwise sold in the counterfactual. In dry or extremely dry years, interruptible and/or semi-interruptible commodity producers may stop production and sell their allocations. Given their relatively inflexible water requirements, permanent commodity farmers would purchase these allocations. However, if interruptible or semi-interruptible producers participate in on-farm efficiency measures programs, less temporary water is available for purchase. That is, in the absence of water transfers to the Commonwealth, their allocations would have been sold to producers with permanent plantings.3 This is supported by data indicating that relatively more NSW irrigators purchased temporary water to substitute for low allocations, finish off a crop or meet existing crop needs in 2009-10 (a low allocation year), compared to 2012-13 (a high allocation year).4 Note that this assumes that an irrigator receives a seasonal water allocation in both scenarios.
Further, water savings resulting from off-farm infrastructure are unlikely to have been used for irrigation and therefore will not impact on future production.5
1 Schirmer 2017, Water Reform: Socio-economic effects of investment in water infrastructure.2 See OFIEP or other on-farm program applications for more information.3 Frontier 2017, Social and economic impacts of the Basin Plan in Victoria water infrastructure.4 DPI (NSW) 2013. Socio-economic monitoring of NSW Water Sharing Plans, Irrigators’ Surveys 2009/10 and 2013: A state wide comparison. 5 Frontier 2017, Social and economic impacts of the Basin Plan in Victoria
1 Terms of reference 7 Opportunities for efficiency ...2 Glossary 8 Cost of efficiency measures3 Executive summary 9 Principles for negating adv ...4 Introduction 10 A program to achieve 450 ...5 Potential socio-economic ... 11 Appendices6 Program design

Analysis of efficiency measures in the Murray-Darling Basin: Opportunities to recover 450GL in additional environmental water through efficiency measures by 2024, with neutral or positive socio-economic impacts | Page 96 of 307
19 January 2018 | Final Report
Socio-economic impact pathway 1: Impact on irrigated production5 Potential socio-economic impacts of efficiency measures
Are there alternative water efficiency gains that could be invested in, and a longer timeframe before productive capacity is lost?
The extent to which production is reduced over the long-term is dependent on whether water efficiency gains achieved are finite (i.e. could further efficiency measures be invested in by the participating irrigator to enhance the productivity of the remaining water?).
If there are other areas for investment then capital that would have been used to undertake infrastructure upgrades can be redeployed for these. Where further efficiency gains are possible and economically viable, investment in these may support additional production and therefore reduce the impact on future production. However, it is noted that efficiency gains are likely to diminish the greater the investment (i.e. they have a diminishing marginal return), as per the figure below.
If other efficiency gains are possible, then the time where the productivity is lost will only be once these are exhausted which could be much longer than 10 years into the future.
If capital cannot be redeployed into other productivity improvements, then reduced production from a reduction in water cannot be offset by further productivity enhancements and there will be a decrease in production.
Can some water savings be retained for production?
Generally, after an on-farm infrastructure upgrade, entitlements representing the pre-project nominated water savings are transferred to the Commonwealth. This is equal to the pre-project estimated total water savings less the nominated retained savings.
However, the effective volume of retained savings is dependent on the infrastructure efficiency. That is, theoretically actual retained savings could be higher or lower than estimated. If the infrastructure results in further water savings, this would not be classified as retained savings as it is not a water entitlement.
Where savings can be retained and infrastructure investment bought forward, short-term production is likely to be enhanced (compared to no upgrade). Where savings cannot be retained, then short-term production is not increased (beyond any on-farm production improvements, as discussed under the next consideration) to offset any potential reductions in future production.
Cost
Water productivity
1 unit increase in water productivity
Cost increases as the irrigator implements more water productivity measures
Costs of implementing 1 extra unit of water
productivity
Source: EY analysis.
Retaining water savingsOn average, irrigators participating in water efficiency programs have retained 30% of water savings. This increases the water available for use (vis-à-vis pre-project) so production can increase, assuming there are no other constraints. This is illustrated below. That is, if there are no retained savings, productive water remains the same pre and post-project. But if some water is retained, additional water is made available for use.
Figure: Water productivity curve
1 Terms of reference 7 Opportunities for efficiency ...2 Glossary 8 Cost of efficiency measures3 Executive summary 9 Principles for negating adv ...4 Introduction 10 A program to achieve 450 ...5 Potential socio-economic ... 11 Appendices6 Program design

Analysis of efficiency measures in the Murray-Darling Basin: Opportunities to recover 450GL in additional environmental water through efficiency measures by 2024, with neutral or positive socio-economic impacts | Page 97 of 307
19 January 2018 | Final Report
Socio-economic impact pathway 1: Impact on irrigated production5 Potential socio-economic impacts of efficiency measures
Can further farm productivity improvements or changes in inputs further offset reduced consumptive water entitlements?
It is noted that on-farm water efficiency programs fund infrastructure to offset reduced water available for production.
The extent that reduced water is offset and that production actually increases depends on the ability for irrigators to harness other productivity improvements in addition to water efficiency infrastructure, or to change their mix of inputs to produce the same level of production.
MDBA has identified that there is evidence that water efficiency measures can result in a range of on-farm production productivity enhancements such as improving crop yields or quality and/or enabling the planting of higher value crops.1
Where a different mix of inputs can be used, the impact of the reduction in water entitlements may be reduced or eliminated. If irrigators are able to alter other inputs, such as levels of fertiliser or chemical use, this will impact production levels.
Case study
Netting investment for citrus producer, Pyap SA Program: South Australian River Murray Sustainability (SARMS) – Irrigation Industry Improvement Program (3IP)
Delivery Partner: Department of Primary Industries and Regions SA
Water returned: 132 ML returned to MDB
Grant: $1.3 million
Total project cost: $1.36 million (note water recovery programs do not require co-contributions)
Project includes:
► 18.6 hectares of netting over mixed citrus tree crop.
► Business and succession planning.
Benefits from project
► Producers have seen up to around 30% drop in irrigation required on netted crops, with some crops showing 30% higher yield and associated quality improvements.
► Significant improvement with overall fruit quality - particularly with Navels where there has been a big reduction in wind blemish and fruit appearance.
► Results show more consistent higher class pack outs, which is leading to improved fruit marketability.
► Netting has helped reduce cross variety pollination of some mandarin varieties which has improved seedless outcomes.
► In regards to crop management, the efficacy of spraying is also improved under netting.
Source: From email correspondence with PIRSA, 11th December 2017.1 MDBA 2016. Northern Basin Review.
1 Terms of reference 7 Opportunities for efficiency ...2 Glossary 8 Cost of efficiency measures3 Executive summary 9 Principles for negating adv ...4 Introduction 10 A program to achieve 450 ...5 Potential socio-economic ... 11 Appendices6 Program design

Analysis of efficiency measures in the Murray-Darling Basin: Opportunities to recover 450GL in additional environmental water through efficiency measures by 2024, with neutral or positive socio-economic impacts | Page 98 of 307
19 January 2018 | Final Report
Socio-economic impact pathway 1: Impact on irrigated production5 Potential socio-economic impacts of efficiency measures
Which commodities would water have been used to produce?
The mix of commodities (and their assumed value) will impact the value of foregone production. This is highly dependent on relative commodity prices and other value-adding activities, which fluctuate for a variety of reasons external to irrigators. It will also be driven by the relative efficiency of the farming enterprise, climatic conditions and how these factors influence the operations of the water markets. For instance, as identified by Frontier, in dry periods, participants who would have sold water allocations have reduced available water due to entitlement transfers.1 In general, the operation of the water markets should divert water to its most efficient user. While this is influenced by producers of commodities with the highest value, all industries have farming enterprises with marginal productivity. As such, short-term production would be reduced across a range of commodities.
What financial benefit does Commonwealth funding provide participating irrigators?
In the absence of Commonwealth funding irrigators would have to pay for the infrastructure upgrades. This would require the use of cash reserves or borrowing to cover upfront costs of upgrades. With Commonwealth funding these funds can either be redeployed to other farm investment or improvements, invested off-farm to generate returns or mean that borrowing is not required (thereby avoiding associated financing costs).
Case study Case study
Surface drip irrigation system in Deniliquin, NSW
Overhead spray irrigation system for Watson Property
Michael and Simone Hughes grow rice on a 568 hectare property in Deniliquin, NSW.
As part of the On-Farm Efficiency Program they have constructed three kilometres of channel, new water storage of nearly 100 ML and refurbishments to an existing dam to hold approximately 200 ML, 70 hectares of land-forming and a new storage dam pump.
The upgrades are expected to save 210 ML.
“We will see significant gains in crop yield, water savings and improve farm profit.”
“Greater water use efficiency will help the farm to produce during extreme weather events.”
”There will be yield benefits as we can meet crop water needs during dry times and minimise water logging during wet times.”
Andrew Watson operates a 900 hectare cotton and winter cereals farm in Boggabri. The millennium drought prompted a decision to move to a STBFIM project to secure water supply and avoid risk.
The STBIFM project included:► Construction of new supply
channels.
► Two lateral move irrigators with a buried guidance wire and telemetry system.
As a result, there has been 240 ML of water savings, improved nutrient management, reduced moisture stress and waterlogging, reduced labour costs and improved management of rainfalls.
“Our wheat yielded about 2.08 t/ML under the (new) lateral move compared to 1.5 t/ML on furrow.”
Source: NSW DPI 2013, Sustaining the Basin: Irrigation Farm Modernisation (STBIFM) Program.
Source: Department of Environment 2014, On-Farm Irrigation Efficiency Program Case Study, Deniliquin.1 Frontier 2017, Social and economic impacts of the Basin Plan in Victoria.
1 Terms of reference 7 Opportunities for efficiency ...2 Glossary 8 Cost of efficiency measures3 Executive summary 9 Principles for negating adv ...4 Introduction 10 A program to achieve 450 ...5 Potential socio-economic ... 11 Appendices6 Program design

Analysis of efficiency measures in the Murray-Darling Basin: Opportunities to recover 450GL in additional environmental water through efficiency measures by 2024, with neutral or positive socio-economic impacts | Page 99 of 307
19 January 2018 | Final Report
Socio-economic impact pathway 1: Impact on irrigated production5 Potential socio-economic impacts of efficiency measures
Assessing the impactIn assessing the impact there are three primary elements:
► The extent to which short-term production is increased
► The extent to which future production is reduced, and
► The benefit of Commonwealth funding.
These are discussed below.
The extent to which short-term production is increased
Assuming that there is no market downturn or other changes in the prevailing operating environment, the key determinants of increased short-term production are the levels of retained water savings and other available on-farm productivity improvements. On average, irrigators participating in water efficiency programs have retained 30% of water savings, enabling them to increase production in the short-term.1 This suggests that on average 23% of funding contributes to enhanced production (based on the fact that for every entitlement transferred, there is on average a 30% level of water savings retained that can be used for production). Upgrades are assumed to not have been undertaken in the short-term, in the absence of a Commonwealth program and therefore this is enhanced production that otherwise would not have been achieved in the short-term.
Modernised infrastructure can enhance production as well as water efficiency. For instance, reconfiguring a surface irrigation layout reduces seepage and run-off, as well as distributing water more evenly which can improve crop health and yield. However, the extent of increased productivity is dependent on multiple factors, including the specific individual characteristics of an upgrade. Conservatively, the increase in short-term production has only been calculated based on the ability to utilise water savings.
The impact on production has been calculated based on a 20-year NPV. Estimating the value of short-term production increase has been undertaken using the following method:
Value of short-term increase in production in year X =
Gross value of production per ML * value add per ML
* Volume of water recovered through on-farm water efficiency
* proportion of water recovered in year X
* proportion of retained savings
The cumulative impact was then calculated (i.e. the ongoing impact of reduced production until the point that upgrades would have occurred), and the results discounted. The assumptions used in calculating the impact on production are outlined on the next page.
The extent to which future production is reduced
The key determinate regarding the magnitude of reduced future production is the extent to which upgrades would have occurred in the absence of Commonwealth funding and the associated timeframe. Stakeholder consultation and the findings od Schirmer suggests that a large number of irrigators may not have upgraded in the absence of the Commonwealth funding, at least to the same extent and under the same timeframe, due to the high costs of private funding.2 Stakeholders suggested that given this significant capital, the timeframe is likely over ten years. Due to the lack of specific data available, a conservative estimate of 60% of farmers privately upgrading over a 10 to 20-year timeframe is applied. It is also assumed that over this longer timeframe, the cost and scale of privately funded modernisation would be equivalent to the value of the water entitlement. This may be a conservative assumption, given evidence from the 2015-16 Regional Wellbeing Survey indicates privately funded modernisations tend to be significantly smaller in scope and scale.3
The impact on production has been calculated using the following method:
Value of future production forgone in year X =
Gross value of production per ML * value add per ML
* volume of water recovered through on-farm water efficiency
* proportion of farmers who would have upgraded in year X
The cumulative impact was then calculated (i.e. the ongoing impact of reduced production) and the results then discounted. The assumptions used in calculating the impact on production are outlined on the next page.
1 Based on average levels of retained savings provided by the Commonwealth DAWR.2 Schirmer 2017, Water Reform: Socio-economic effects of investment in water infrastructure.3 Ibid.
1 Terms of reference 7 Opportunities for efficiency ...2 Glossary 8 Cost of efficiency measures3 Executive summary 9 Principles for negating adv ...4 Introduction 10 A program to achieve 450 ...5 Potential socio-economic ... 11 Appendices6 Program design

Analysis of efficiency measures in the Murray-Darling Basin: Opportunities to recover 450GL in additional environmental water through efficiency measures by 2024, with neutral or positive socio-economic impacts | Page 100 of 307
19 January 2018 | Final Report
Socio-economic impact pathway 1: Impact on irrigated production5 Potential socio-economic impacts of efficiency measures 1 Terms of reference 7 Opportunities for efficiency ...
2 Glossary 8 Cost of efficiency measures3 Executive summary 9 Principles for negating adv ...4 Introduction 10 A program to achieve 450 ...5 Potential socio-economic ... 11 Appendices6 Program design
The benefit of Commonwealth funding
In the absence of Commonwealth funding irrigators would have to independently pay for the infrastructure upgrades. As such, when considering the increased future production in the absence of Commonwealth programs, the cost of capital associated with upgrades has been included in calculations.
Potential magnitude
The financial impact has been calculated using a net present value (NPV) formula to determine the value of foregone production for two different commodity types –rice and fruit and nuts. These represent high and low value commodities (based on their 2014-15 values, the most recent year of data) and, consequently, the potential range of impacts.1 The analysis calculated the benefit of increased short-term production (from year 1 through to year 20) through increases in industry value added (IVA) based on the assumption that program upgrades start in year 1 and occur over the first ten years. The benefit has been estimated to be an increase in the IVA of production of 30% based on the average proportion of water savings retained (noting that this can be viewed as conservative as it does not account for other productivity improvements such as increased crop yields). This benefit peaks in year 10 and reduces as upgrades that are assumed to have occurred in the absence of Commonwealth funding are completed.
In the absence of the program, it has been assumed that upgrades would only occur in year 10 and be completed in year 20. Further, since only a proportion (60%) of irrigators are conservatively estimated to undertake upgrades then only this proportion of the IVA of production has been assumed to be forgone. At the same time, irrigators would have had to invest their own capital if upgrades are privately funded and therefore the cost of capital has been included as a cost.
This profile of costs (foregone IVA of production) and benefits (short-term IVA of production increase and foregone capital cost) is seen in the charts over the next page, for rice and fruit and nuts respectively. As can be seen for rice, the cost of capital exceeds future production benefit in years 10 to 20, based on commodity value add. As such, it would be anticipated that these upgrades would not occur in the absence of funding. For fruit and nut producers, since the IVA of their commodities is significantly larger, capital costs are proportionally lower.
Assumptions Value Rationale
Capital value $1,643 per ML
Estimation based on the average price paid for water (without any application of multiples) under indicative on-farm programs.This provides a conservative approach as it assumes that the cost of upgrades would be equivalent to the value of the entitlements (with no multiple applied). This has been tested in the sensitivity analysis in Appendix G.2
Volume of water removed from production
350GLBased on an estimated 100GL to be recovered from off-farm or urban projects, the remaining volume will be recovered from on-farm infrastructure upgrades.
Retained savings under efficiency program
30% Based on average levels of retained savings provided by the Commonwealth Department of Agriculture and Water Resources.
Proportion of irrigators who would have upgraded in the absence of the program
60%
The 2016-17 Regional Wellbeing survey found that 48% of survey participants planned to modernise within the next 5 years. However, a conservative estimate has been applied with an assumption that 60% of farmers would have upgraded, albeit over longer timeframes (10 years) which was supported by anecdotal evidence. This has been tested in the sensitivity analysis in Appendix G.
Proportion of water recovered each year
10% per year for 10 years
Profile based on anecdotal evidence that suggests that upgrades would occur over a 10 year timeframe.
Gross value of production per ML
Rice $311, Fruit and Nut $2,984
Calculation, based on information inABS Cat. No. 4618.0 for commodities in the Murray-Darling Basin.
Proportion of value add to industry turnover
34%Calculation, based on information inABS Cat. No. 8155.0 regarding agricultural industry value added and total income.
Discount rate 7.00% As per the ‘Office of Best Practice Regulation Cost – Benefit Analysis Guidance Note’ (2006) and in line with industry WACC estimates.
Note: All calculations are based on data from the 2014-15 financial year.
1 The utilised datasets do not present consistent commodity categories, making the calculation of a commodity basket more complex.Therefore, for illustrative purposes only rice and fruit and nuts are analysed to give an indication of the impact range. Using high and low value commodities illustrates that since it is likely a mix of commodities will be impacted, the results would lie within this range. The analysis is not assuming that only the rice or fruit and nut industries are impacted.2 The results of the sensitivity analysis indicate that the benefit of foregone cost of capital (due to Commonwealth funding) increases the total value of the NPV, in particular for growers of lower value commodities, as the benefit increasingly outweighs the cost of foregone production.

Analysis of efficiency measures in the Murray-Darling Basin: Opportunities to recover 450GL in additional environmental water through efficiency measures by 2024, with neutral or positive socio-economic impacts | Page 101 of 307
19 January 2018 | Final Report
Socio-economic impact pathway 1: Impact on irrigated production5 Potential socio-economic impacts of efficiency measures
The assessment demonstrates that it is likely that on a 20-year NPV basis production will increase as a result of participation in water efficiency programs, assuming the prevailing market conditions continue. However, as demonstrated through the sensitivity testing undertaken, there is the potential for a reduction in net production (subject to certain considerations and corresponding assumptions). A key lever to ensuring that there are short-term benefits on production (which can offset and/or outweigh reductions in long-term production) is either the ability to retain water savings or increase on-farm productivity (in addition to water efficiency). It is therefore suggested that to ensure participants can fully benefit from infrastructure upgrades, program design should consider educational and training opportunities to support irrigators in utilising new infrastructure. This approach to negate impacts is discussed further in Chapter 10.
Discounted over 20 years, the net benefit to industry ranges from around $70 million, if only rice producers modernised, to around $302 million if only fruit and nut producers modernised. However in practice, water will be recovered from a range of industries, but the effective change in production should lie within the range of rice and fruit and nuts. Additionally, note that this analysis reflects only the direct production impacts and does not consider flow-on impacts across the Basin.
A number of assumptions have been used to estimate this impact, with a limited amount of data to provide an evidence base for a number of these. As such, sensitivity testing has been undertaken to demonstrate the impact of changing assumptions (see subsequent page and Appendix G). From this analysis it can be seen that while the analysis is sensitive to changes in assumptions, under most cases a net benefit to industry is still estimated. The exception to this is where there are no benefits to short-term production. In this case, a net cost to industry of up to $330 million could arise. Alternatively, short-term production needs to increase by more than 0 to 16% (for rice and fruit and nut producers respectively) for a positive net benefit to industry to occur.
Benefits to short-term production may be reduced if water savings are not able to be retained or if productivity improvements are not achieved. The latter could either be a result of a lack of expertise or knowledge in utilising new systems and technology. Further, if modernised irrigators were to sell water to buyers who are less efficient, the net benefit to industry of short-term production will be reduced.
(30)
(20)
(10)
-
10
20
30
40
1 2 3 4 5 6 7 8 9 10 11 12 13 14 15 16 17 18 19 20
$ M
illion
s
Rice benefits and costs
Benefit of short term production increase Cost of foregone long term production
Benefit of foregone cost of capital
(250)
(200)
(150)
(100)
(50)
-
50
100
150
1 2 3 4 5 6 7 8 9 10 11 12 13 14 15 16 17 18 19 20
$ M
illion
s
Fruit and nuts benefits and costs
Cost of foregone long term production Benefit of short term production
Benefit of foregone cost of capital
Source: ABS Cat. No. 4618.0, EY analysis. Calculations are based on 2014-15 data.
Source: ABS Cat. No. 4618.0, EY analysis. Calculations are based on 2014-15 data.
1 Terms of reference 7 Opportunities for efficiency ...2 Glossary 8 Cost of efficiency measures3 Executive summary 9 Principles for negating adv ...4 Introduction 10 A program to achieve 450 ...5 Potential socio-economic ... 11 Appendices6 Program design

Analysis of efficiency measures in the Murray-Darling Basin: Opportunities to recover 450GL in additional environmental water through efficiency measures by 2024, with neutral or positive socio-economic impacts | Page 102 of 307
19 January 2018 | Final Report
Socio-economic impact pathway 1: Impact on irrigated production5 Potential socio-economic impacts of efficiency measures 1 Terms of reference 7 Opportunities for efficiency ...
2 Glossary 8 Cost of efficiency measures3 Executive summary 9 Principles for negating adv ...4 Introduction 10 A program to achieve 450 ...5 Potential socio-economic ... 11 Appendices6 Program design
Summary of sensitivity analysisPartial sensitivity testing has been undertaken across the main variables for the analysis in Appendix G. These are summmarised in the table below. The sensitivity testing alters these assumptions independently to identify the impact that changes to these variables have on the results of the analysis.
In relative terms, the ranges were relatively insensitive (either upside or downside) to changes in the discount rate, cost of capital and multiple. The ranges were relatively sensitive to changes in short-term production and the proportions of irrigators assumed to upgrade in the absence of Commonwealth funding.
Variable tested Description of assumptions NPV of production
Base case Assumptions - Real discount rate 7%, short-term production increased by 30%, cost of capital 7%, 60% of irrigators would have upgrade in the absence of funding, capital value of water is $1,643 per ML
$70-$302 million
Discount rate Real discount rate 3%, all other assumptions as per base case $104-$308 million
Real discount rate 10%, all other assumptions as per base case
$53-$276 million
Short term increase in production
Short term production increased by 50%, all other assumptions as per base case
$114-$723 million
Short term production not increased, all other assumptions as per base case
-$330- $0 million
Cost of capital Cost of capital 3%, all other assumptions as per base case $45-$277 million Cost of capital 10%, all other assumptions as per base case $88-$320 million
Proportion of irrigators who would have upgraded in the absence of funding
20% of irrigators would have upgrade in the absence of funding, all other assumptions as per base case
$75-$596 million
80% of irrigators would have upgrade in the absence of funding, all other assumptions as per base case
$67-$154 million
Capital cost Capital value of water $2,875 per ML (1.75x multiple) , all other assumptions as per base case
$102-$333 million
Capital value of $3,286 per ML (2x multiple), all other assumptions as per base case
$112-$344 million
Limitations of current quantitative assessment
Quantitative analysis is limited as a result of a data gaps. Further data required includes:
Additionally, the current analysis is limited due to the use of:
The issue of practical data monitoring is discussed in Chapter 10.
► Information regarding the number of irrigators who would modernise in absence of Commonwealth funding, including the scale and timeframe
► The value of required capital to fund infrastructure upgrades
► Productivity improvements arising from upgrading.
► 2014-15 data for commodity value (commodity values change due to a range of factors including global supply and demand drivers)
► Inconsistent data to estimate impacts on a commodity basket without further assumptions
► IVA as a proxy for irrigated commodity IVA (this is not commodity specific and the proportion of IVA to turnover may vary)
► 2014-15 as the production impact will vary depending on the actual volume of water recovered and the timeframe
► The assumption that even over a longer time-frame, the scope of privately funded modernisation is equivalent to Commonwealth funded upgrades (including the retained savings).

Analysis of efficiency measures in the Murray-Darling Basin: Opportunities to recover 450GL in additional environmental water through efficiency measures by 2024, with neutral or positive socio-economic impacts | Page 103 of 307
19 January 2018 | Final Report
Socio-economic impact pathway 1: Impact on irrigated production5 Potential socio-economic impacts of efficiency measures
Case study
Irrigation scheme modernisation in Red Cliffs, Mildura and Merbein Districts, Victoria
Program: Sunraysia Modernisation Project (SMP)
Project timeframe: construction from January 2015 to August 2016
Delivery partner: Lower Murray Water
Irrigation network: open channel networks requiring yearly maintenance shutdowns between late May and late September. Further, pumps and meters were inefficient, outdated and/or missing.
Water saved: 7GL
Project details:
► Partial or total pipelining of 21.8km of open channel, automating 11.6km and rationalizing another 17.8km.
► Retrofitting several existing pump stations.
► Upgrading over 1,800 irrigation meters and over 2,400 Stock and Domestic meters.
Benefits from project:
► Increased number of irrigators able to irrigate at peak times and with full-year access. The latter also allows for more crop diversity as the previous restricted access limited the ability of irrigators to plant over winter.
► Improved water quality for irrigators serviced through the new pipelines (around 8,600ha), also leading to cost savings as on-farm pumps and filters require less cleaning and servicing.
► Reduced risk of system failure with the upgrade of pump stations and replacement of high-risk channels. This is estimated to increase irrigated production by 400ha over the next five years.
Feedback from stakeholders
The following points were expressed by stakeholders during consultations:
► Efficiency measures have enabled on-farm expansion at an accelerated rate, rather than waiting for years to establish the finances.
► Water savings measures lead to more efficient water usage and a more assured bottom line.
► Increased production has led to more opportunities for vertical integration for irrigators.
► Less water leads to reduced irrigation production and adverse socio-economic impacts. Without sufficient water to utilise modernised infrastructure to their full capacity their benefit will be short-lived.
► Water removed from the consumptive pool (either through buybacks or efficiency measures) will lead to increased risk to downstream industries.
Source: Stakeholder consultations.
Case studyIrrigation scheme modernisation for Lacton Pty Ltd
Water saved: 1.7-1.5 ML/hectare (projected 332.5ML over 5 years)
Project put 42.6ha of almond trees onto new drip irrigation
Benefits from project:
► Decreased water consumption by 1.5 to 1.7 ML per hectare.
► Increased long-term average yields from 2.5 tonnes to 3.2/3.4 tonnes per hectare due to daily water and precision nutrient application.
► Water savings help to safeguard future production by making the property more robust and productive though a drought.
Source: Australian Government et. al. 2016, Sunraysia Modernisation Project: Interim Final Report. Source: Natural Resources SA MDB n.d., On-farm Irrigation Efficiency Program: Case Study: Lacton Pty Ltd,.
1 Terms of reference 7 Opportunities for efficiency ...2 Glossary 8 Cost of efficiency measures3 Executive summary 9 Principles for negating adv ...4 Introduction 10 A program to achieve 450 ...5 Potential socio-economic ... 11 Appendices6 Program design

Analysis of efficiency measures in the Murray-Darling Basin: Opportunities to recover 450GL in additional environmental water through efficiency measures by 2024, with neutral or positive socio-economic impacts | Page 104 of 307
19 January 2018 | Final Report
Socio-economic impact pathway 1: Impact on irrigated production5 Potential socio-economic impacts of efficiency measures 1 Terms of reference 7 Opportunities for efficiency ...
2 Glossary 8 Cost of efficiency measures3 Executive summary 9 Principles for negating adv ...4 Introduction 10 A program to achieve 450 ...5 Potential socio-economic ... 11 Appendices6 Program design
ConclusionInfrastructure upgrades bring forward investment and allow irrigators to increase production in the short-term, albeit leading to an opportunity cost in forgone future production. The exchange of water entitlements for funding for infrastructure investment enables improved water efficiency, enhances on-farm productivity and allows for the use of water savings retained by participants for production. There is a net financial benefit to industry through either enabling or bringing forward water efficiency upgrades, and this offsets the possible lost opportunity if industry was able to invest themselves in the future without support from the Commonwealth. On average, the analysis has indicated that approximately 23% of funding contributes to enhanced production.
However, if short-term production does not increase (as a result of irrigators either not being able to retain water savings or on-farm productivity not improving) then there may be an adverse impact on production.
Implications for program design
► Invest in community engagement to promote understanding of the impacts from water efficiency measures. Also invest in a monitoring and evaluation framework to better analyse impacts of efficiency measures.
► Supporting measures such as education and training, R&D and facilitation of knowledge sharing, should be included as part of water efficiency programs to ensure that participants are able to take advantage of productivity improvements.
Program implicationsA number of stakeholders raising the issue of constrained future production during consultations viewed water efficiency measures as a cost to their industry. However, most of these stakeholders did not consider the benefits of short-term increases in production or the benefit of capital provided by the Commonwealth. This highlights a significant disconnect between perceived and actual impacts.
The assessment demonstrates that it is likely (on a 20 year NPV basis) production will increase as a result of participation in water efficiency programs. However, as demonstrated through the sensitivity testing undertaken, there is the potential for a reduction in net production (subject to certain considerations and corresponding assumptions). A key lever to ensuring that there are short-term benefits on production – which can offset and/or outweigh reductions in long-term production – is either the ability to retain water savings or increase on-farm productivity, in addition to water efficiency. It is therefore suggested that to ensure participants can fully benefit from infrastructure upgrades, program design should consider educational and training opportunities to support irrigators in utilising new infrastructure. Knowledge sharing between irrigators and further investment in R&D to improve productivity, can further prevent adverse impacts.
This approach to negate impacts is discussed further in Chapters 9 and 10.
Evidence from other reportsWhile past reports have calculated the value of reduced production on the Basin arising from water recovery, most have focused on the impact of buybacks.1 An RMCG report2 is the primary exception, calculating the impact to the dairy industry under on-farm efficiency measures. The report estimated the 74GL of saved water generated by projects undertaken was equivalent to an annual value of $40 million for dairy production and $60 million for value-adding.
These figures were based on the following assumptions:
1. In absence of Government funding, all irrigators would modernise their infrastructure
2. Modernisation would occur immediately and therefore discounting was not applied
3. Modernised infrastructure does not produce a productivity benefit in production.
1MJA 2017 summarises several of these reports. Under water purchase, reductions in consumptive water are not offset by increased productivities from on-farm modernisation. 2RMCG 2016. Basin Plan – GMID socio-economic impact assessment: Final Report.

Analysis of efficiency measures in the Murray-Darling Basin: Opportunities to recover 450GL in additional environmental water through efficiency measures by 2024, with neutral or positive socio-economic impacts | Page 105 of 307
19 January 2018 | Final Report
Socio-economic impact pathway 2: Distributional impact arising from changed production decisions by participants overview
5 Potential socio-economic impacts of efficiency measures
As part of undertaking infrastructure upgrades, participants improve water efficiency and productivity, enhancing their competitiveness.
They also face new decisions in relation to production levels which impact on water use and have the potential to create corresponding influences on water prices.
Changes in water prices impact on buyers and sellers of water, particularly those most sensitive to price changes (marginal users).
This impact pathway explores whether on-farm efficiency measures generate distributional impacts as a result of participants changing their output decisions.
► Is water usage and demand likely to increase as a result of modernisation?
► Would increased water demand have resulted in the absence of on-farm efficiency measures programs?
► When will increased demand result in water market price changes?
► What is the magnitude of any price change?
► Do water market prices have a significant impact on business viability?
In the water market, water flows to the most efficient and productive users. If water prices were to increase as a result of efficiency measures projects generating additional demand for water, irrigators who purchase water and have marginal profitability may be adversely impacted. This could also affect their communities.
Marginal profitability is linked to the prevailing operating environment – primarily commodity prices, climate and individual business strategies and farming enterprises.
A hypothetical example suggests that if 350GL was recovered from on-farm programs and participants increased their water demand by 25% this could equate to a reduction of around 174 businesses (1%). If all marginal users exited from one industry, this could result in a 3 to 14% impact on a specific industries value add.
Available evidence suggests that on-farm efficiency measures projects result in increased competitiveness by participants. This may generate increased water demand. However, a variety of factors impact the price of water and empirical data is limited.
If prices increase, adverse distributional impacts may disproportionally fall on irrigators reliant on purchasing temporary water. This is primarily affected by the choice of produced commodity. Other influences include seasonal allocations, prevailing commodity prices and strategic business plans (including current infrastructure).
Given the geographic clustering of commodity production, certain communities would also be disproportionally impacted, potentially accelerating existing structural changes.
► To address potential distributive impacts between communities and industry areas it is recommended that the on-farm program is allocated across communities and across industry areas (horticulture, cropping, dairy) so that individual communities or industries are not specifically advantaged over others.
► Distributive impacts on more marginal farms should be managed as part of whole of government resilience and regional development programs to support structural change that is impacting the industry as a whole.
Implication for program designConclusionAssessing the
impactKey considerationsPotential issue
1 Terms of reference 7 Opportunities for efficiency ...2 Glossary 8 Cost of efficiency measures3 Executive summary 9 Principles for negating adv ...4 Introduction 10 A program to achieve 450 ...5 Potential socio-economic ... 11 Appendices6 Program design

Analysis of efficiency measures in the Murray-Darling Basin: Opportunities to recover 450GL in additional environmental water through efficiency measures by 2024, with neutral or positive socio-economic impacts | Page 106 of 307
19 January 2018 | Final Report
IssueThis assessment explores the impact of water efficiency measures on the temporary and permanent water markets and the resulting impact on water users and communities.
As part of infrastructure upgrades participants face decisions in relation to production levels which may impact on the water market and water users. A distributional impact may arise from changed output decisions by participants based on the following pathway:
► Water efficiency programs facilitate on-farm infrastructure upgrades which reduce on-farm water losses by exchanging water entitlements for Commonwealth funding.
► Modernised infrastructure allows existing levels of production to be maintained or increased (with less water used) due to associated productivity improvements and level of retained savings.
► Given increased water efficiency, participants face a new production decision. Irrigators will choose a production level that maximises profits, subject to their business strategy, production limitations and the prevailing operating environment, including commodity-specific trends.
► If modernised irrigators demand more water to increase their production, there is a net demand increase on the water market. This will, all else being equal, put upward pressure on the price of water at the margin (though the total magnitude will depend on a range of factors).
► As a result, buyers of water will pay relatively more per unit of water purchased (potentially reducing the total volume of purchased water) while sellers will receive more revenue per unit of water. An adverse impact could occur to marginal users who purchase water allocations and are sensitive to price increases. The latter is with respect to a variety of other contextual factors.
► Marginal users’ business responses (for instance reducing production or employment or exiting irrigation) flow through to local communities and downstream industries. This can accelerate existing structural change
► In the long-run, the impact on prices dissipate, as irrigators exit and the market returns to equilibrium.
► While marginal users may reduce production, total Basin production (by value if not volume) should increase as water flows to the most efficient users. However, the production mix may change.
The impact pathway is represented on the following slide.
Socio-economic impact pathway 2: Distributional impact arising from changed production decisions by participants
5 Potential socio-economic impacts of efficiency measures
Definition of the marginal userIn this analysis, a marginal user is defined as an irrigator whose farming enterprise operates with marginal profitability. These irrigators may be non-participants or may have previously participated in on-farm efficiency measures programs. The identity of the marginal user is likely driven by commodity-specific trends, the prevailing operating environment and the irrigator’s own business strategy (including reliance on the temporary water market). As such, they can be growers of permanent or intermittent commodities.
Interrelationships between water usage, production, land and communitiesAn irrigator’s production decision is determined jointly by their land and input mix, particularly water. That is, while commodities have heterogeneous water requirements, all else being equal, more land will require more water for irrigation.1
Land can be considered a fixed production input. That is, the location of land, its area, elevation and soil type will often dictate its suitability for certain types of irrigated production. As such, while a range of commodities are produced across the Basin, they are often geographically clustered.
This can produce economies of scale which can allow for viable local downstream industries and represent increased opportunity for vertical integration in irrigated farming enterprises, improving community outcomes. However, communities without diversified income streams may be subject to the same prevailing trends as the local irrigators.
1 Aither 2016c, Contemporary trends and drivers of irrigation in the southern Murray-Darling Basin.
1 Terms of reference 7 Opportunities for efficiency ...2 Glossary 8 Cost of efficiency measures3 Executive summary 9 Principles for negating adv ...4 Introduction 10 A program to achieve 450 ...5 Potential socio-economic ... 11 Appendices6 Program design
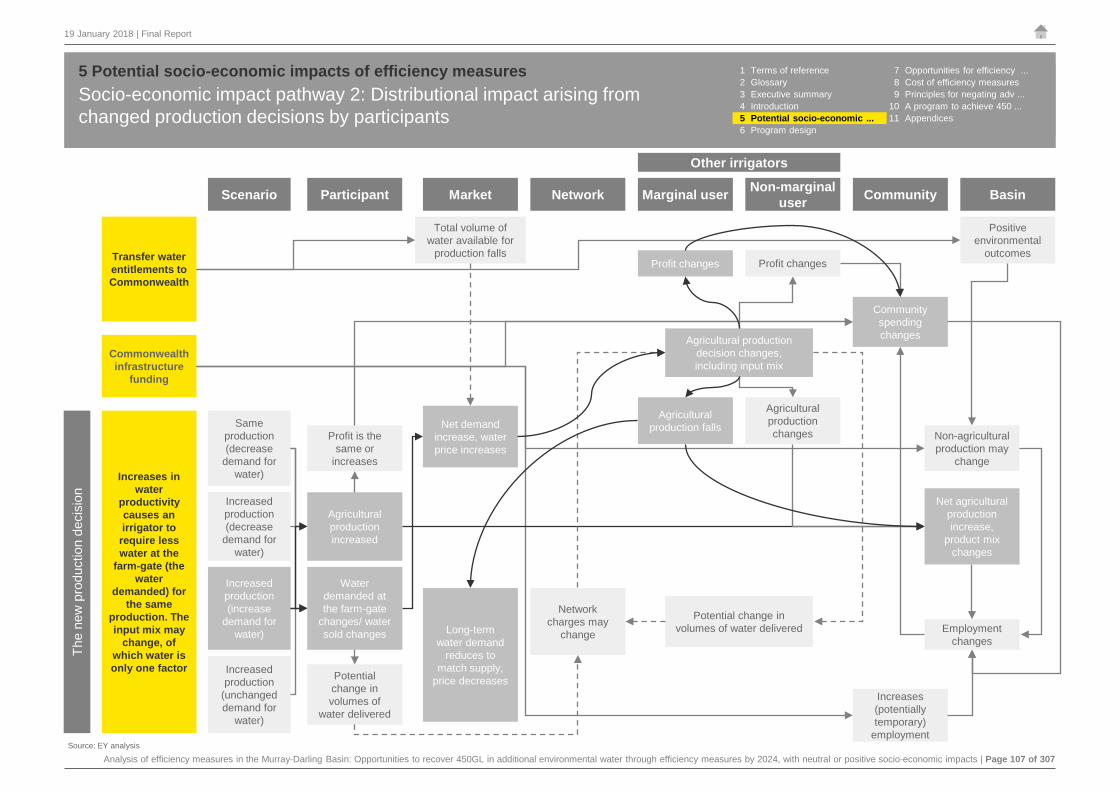
Analysis of efficiency measures in the Murray-Darling Basin: Opportunities to recover 450GL in additional environmental water through efficiency measures by 2024, with neutral or positive socio-economic impacts | Page 107 of 307
19 January 2018 | Final Report
Socio-economic impact pathway 2: Distributional impact arising from changed production decisions by participants
5 Potential socio-economic impacts of efficiency measures 1 Terms of reference 7 Opportunities for efficiency ...2 Glossary 8 Cost of efficiency measures3 Executive summary 9 Principles for negating adv ...4 Introduction 10 A program to achieve 450 ...5 Potential socio-economic ... 11 Appendices6 Program design
The
new
pro
duct
ion
deci
sion
Increases in water
productivity causes an irrigator to
require less water at the
farm-gate (the water
demanded) for the same
production. The input mix may
change, of which water is only one factor
Commonwealth infrastructure
funding
Transfer water entitlements to Commonwealth
Source: EY analysis
Scenario Network Marginal user Non-marginal user CommunityMarketParticipant Basin
Other irrigators
Same production (decrease
demand for water)
Increased production (decrease
demand for water)
Increased production (increase
demand for water)
Increased production
(unchanged demand for
water)
Net demand increase, water price increases
Total volume of water available for
production falls
Long-term water demand
reduces to match supply,
price decreases
Agricultural production changes
Network charges may
change
Positive environmental
outcomes
Community spending changes
Profit is the same or
increases
Profit changes
Water demanded at the farm-gate
changes/ water sold changes
Agricultural production increased
Increases (potentially temporary)
employment
Potential change in volumes of
water delivered
Net agricultural production increase,
product mix changes
Non-agricultural production may
change
Employment changes
Agricultural production decision changes, including input mix
Potential change in volumes of water delivered
Agricultural production falls
Profit changes

Analysis of efficiency measures in the Murray-Darling Basin: Opportunities to recover 450GL in additional environmental water through efficiency measures by 2024, with neutral or positive socio-economic impacts | Page 108 of 307
19 January 2018 | Final Report
Socio-economic impact pathway 2: Distributional impact arising from changed production decisions by participants
5 Potential socio-economic impacts of efficiency measures 1 Terms of reference 7 Opportunities for efficiency ...2 Glossary 8 Cost of efficiency measures3 Executive summary 9 Principles for negating adv ...4 Introduction 10 A program to achieve 450 ...5 Potential socio-economic ... 11 Appendices6 Program design
1Schirmer 2017, Water Reform: Socio-economic effects of investment in water infrastructure. 2Growing Solutions 2014, 2014 Irrigation Infrastructure Report – Rounds One and Two; survey of 114 South Australian irrigators who had previously participated in OFIEP rounds 1 or 2. Aside from the geographic focus, those surveyed produced only fruit or nuts, so the sample may not be representative for other producers in other areas.
Key considerationsIs water usage and demand likely to increase as a result of modernisation?
On-farm infrastructure upgrades decrease an irrigator’s on-farm water losses, such that an irrigator can increase production or produce the same output with less water. These upgrades can also increase farm productivity. For instance, laser grading a flood irrigated field allows water to spread faster, decreasing seepage and evaporation. As water is also more evenly distributed and applied to crops, yield and/or crop quality can also be enhanced. Consequently, agricultural production and/or revenue can increase even though total water usage is reduced. This enhanced efficiency and productivity can increase an irrigators demand for water.
Increased water usage can occur in two ways: intensifying production on the same area of land by applying more water, or expanding the area of land irrigated. These changes will increase agricultural production, but may also increase costs. The 2015-16 Regional Wellbeing Survey indicates (see table) that upgrading infrastructure is associated with a:
► Higher likelihood of increasing area of land irrigated in the last 12 months. More than a quarter (27%) of irrigators who had modernised within the last two years increased the area of land irrigated in the last 12 months, compared to only 2% of irrigators who had not modernised at all in the last eight years and 11% of those who had undertaken modernisation works 3-8 years ago.
► Additionally, irrigators who had modernised in the last two years were more likely to have purchased additional farm land in the last 12 months (18% compared to 9% of those who modernised 3-8 years ago and 6% of those who hadn’t modernised in the last 8 years); and to have expanded the land area they farmed through leasing or sharefarming (9% compared to 5% and 3% respectively).
► Somewhat higher likelihood in increasing production intensity. In total, 30% of irrigators who had modernised reported intensifying production on their land in the last 12 months, compared to 18% of irrigators who had not modernised in the eight years to 2016, and 22% of those who had most recently modernised3-8 years before completing the survey.1
While this data does not conclusively prove that modernisation results in increased water use (as it depends on the water use efficiency gains achieved, with some of the intensification and expansion of irrigation potentially able to be achieved based on a smaller volume of water use) it is highly likely that in many cases where production expanded, this was supported by increased water demand.
Further, many stakeholders consulted by EY and for other reports, suggested that demand for water has increased beyond the level of retained water savings. One delivery partner estimated that between 80-90% of its irrigators had increased their water demanded post-project. Despite this, it is noted that evidence is mixed with 85% of participants surveyed by Growing Solutions and the South Australian Department of Water and Natural Resources in 2014 indicating that they were not required to use the temporary or permanent water markets as a result of modernising.2
In the past 12 months has: Participant Modernised non-participant
Unmodernised non-participant
Irrigated land
Increased 22% 22% 3%
Been purchased 13% 14% 7%
Otherwise expanded* 10% 9% 2%
Decreased 32% 32% 29%
Been sold 9% 7% 5%
Been leased 4% 4% 3%
ProductionIntensified 24% 27% 18%
Deintensified 20% 20% 18%
Source: Schirmer 2017.
* Includes leasing and share farming.

Analysis of efficiency measures in the Murray-Darling Basin: Opportunities to recover 450GL in additional environmental water through efficiency measures by 2024, with neutral or positive socio-economic impacts | Page 109 of 307
19 January 2018 | Final Report
Socio-economic impact pathway 2: Distributional impact arising from changed production decisions by participants
5 Potential socio-economic impacts of efficiency measures 1 Terms of reference 7 Opportunities for efficiency ...2 Glossary 8 Cost of efficiency measures3 Executive summary 9 Principles for negating adv ...4 Introduction 10 A program to achieve 450 ...5 Potential socio-economic ... 11 Appendices6 Program design
Increased demand could theoretically occur in either the allocations or entitlements markets, with on-farm efficiency measures potentially impacting both the demand and supply sides of the water allocation market. Consequently, the theoretical pricing impact could be positive, negative or neutral. It is noted that this represents economic efficiency as water is being utilised by its highest value users, with respect to potential profitability.
Would increased water demand have resulted in the absence of on-farm efficiency measures programs?
Some stakeholders have suggested that increases in production and water demand may have occurred regardless of participation in water efficiency programs. Stakeholders have also suggested that participation may also reflect self-selection i.e. participants may have already had strategic plans to improve their efficiency and/or expand their operations regardless of programs.
Participants in on-farm efficiency programs transfer water entitlements to the Commonwealth in exchange for infrastructure funding. In contrast, irrigators who privately upgrade must save and/or borrow fund infrastructure upgrades. As discussed in Pathway 1, on average, irrigators participating in water efficiency programs have retained 30% of water savings, enabling them to increase production in the short-term, with the analysis indicating that an average of 23% of funding contributes to enhanced production. Further, the 2015-16 Regional Wellbeing Survey indicates that non-participant upgrades tend to be significantly smaller in scope and scale, despite non-participants being just as likely to be expanding farm production.1 Additionally, as demonstrated in pathway 1, there are differences in the timeframe over which upgrades will occur.
As such, it is likely that participation is an enabler of increased water demand, providing funding for enhanced production, increasing the scope and scale of upgrades and bringing these forward.
It is noted that the above discussion is based on an assumption that irrigators would upgrade without Commonwealth funding (at some point in time). If they would not, then full extent of increased water demand and associated adverse distributional impact could be attributed to participation in efficiency programs.
When will increased demand result in water market price changes?
Allocation water market prices are influenced by various supply and demand drivers. The former is primarily driven by water availability, including seasonal allocations and previous carryover decisions. Supply drivers can also include modernisation, as reduced water losses effectively increase water supply (to the extent that they are used for production).1 Demand drivers include rainfall and commodity specific factors, such as sale prices. Infrastructure upgrades can also increase demand due to increased productivity, profitability and increase in operations.
Efficiency measures can change water allocation prices, depending on participant:
► Post project production decisions, specifically post-project production levels (agnostic of potential yield changes)
► The ability to retain water savings from infrastructure upgrades, or
► Post-project water demanded (a function of the post-project production decision).
These factors create four different potential pathways resulting from on-farm participation in water efficiency measures, though only three price impacts (increased, decreased or unchanged), as discussed subsequently. The detailed mapping for these scenarios and their flow-on positive and adverse impacts are presented in Appendix F.
Currently, there is no empirical evidence to indicate the effect of on-farm efficiency measures on water prices or the magnitude of any impact. ABARES summarised the issue as:
“…the net effect of infrastructure projects should be to increase the volume of water available for use and/or to improve farm water use efficiency (by an amount greater than any environmental water recovery)—both of which would lead to lower water prices. However, infrastructure projects can also help farmers achieve improvements in productivity. General improvements in irrigation farm productivity and profitability may result in increased demand for water. Thus, the precise effect of infrastructure projects on the water allocation price is difficult to measure...” 2
Each potential price directional change is discussed in detail below and on the next page.1 ABARES 2016a, Lessons from the water market: The southern Murray-Darling Basin water allocation market 2000-01 to 2015-16.
2 Ibid.

Analysis of efficiency measures in the Murray-Darling Basin: Opportunities to recover 450GL in additional environmental water through efficiency measures by 2024, with neutral or positive socio-economic impacts | Page 110 of 307
19 January 2018 | Final Report
Socio-economic impact pathway 2: Distributional impact arising from changed production decisions by participants
5 Potential socio-economic impacts of efficiency measures 1 Terms of reference 7 Opportunities for efficiency ...2 Glossary 8 Cost of efficiency measures3 Executive summary 9 Principles for negating adv ...4 Introduction 10 A program to achieve 450 ...5 Potential socio-economic ... 11 Appendices6 Program design
1. Allocation prices do not change
This occurs if a participant’s pre and post-project water use is unchanged and if the participant does not retain any of the savings in water losses.
If water prices and agricultural production is unchanged, there is no impact to the participant or any non-participant. Further there will be no flow-on impact across communities or the Basin.
2. Allocation prices decrease
This occurs if water savings can be retained and participant post-project production is unchanged or increased slightly, with overall water demand falling.
Water savings flow into the allocations market via increased supply (if pre-project the participant was a net seller in the market) or reduced demand (if net buyer). This effectively increases the net supply of water on the market, reducing prices.1
All else being equal, an increase in available water allows for increased production across the Basin.2 However, this is dependent on the additional volume of available water (and the resulting price reduction magnitude) and when the additional net supply is available for purchase. That is, if it is after seasonal allocations have been announced, production decisions are relatively set so water demand is relatively inelastic.
This may create a distributional impact in the short-term – for instance, intermittent producers may be able to take immediate advantage of increased water. However, as demand increases, the price of water will return to its normal level. Until this occurs, reduced prices will decrease revenue for net water sellers.
In the medium to longer term, all producers can factor the additional effective supply into their production decisions, negating any potential distributional consequences.
In both cases the water market will act efficiently, such that water flows to the highest value user. The net result is an overall increase in production across the Basin.
3. Allocation prices increase
Allocation price increases will generally occur if participant post-project production target has:
► Increased, and there is increased water demanded3 to reach this target
► Increased by a small or moderate amount, such that the water required to reach the target has declined relative to the counterfactual. However, as water has been transferred to the Commonwealth, a net demand impact results. This only occurs if the participant cannot retain any savings.
All else being equal, higher prices will reduce agricultural production by marginal users through increasing input costs for these irrigators. It will also increase revenue for net sellers. The magnitude of reduced production depends on the level of price increase and in the very short-term, when the reduced net supply is available for purchase. As previously outlined, commodities tend to be geographically clustered to benefit from any land-based competitive advantage (such as soil types and climate). Consequently, marginal users may be concentrated in certain communities. These communities may experience an adverse flow-on impact associated with higher prices, which may also affect downstream business viability. This is likely to accelerate structural change, as it represents another community strain. For instance, if the marginal user reduces employment, while overall rural and regional employment is declining.
However, in the longer term, based on experiences in the Millennium drought, marginal users will either increase their productivity to remain competitive, borrow to sustain operations or exit.4 Therefore, in the longer term, temporary allocation prices should return to their long-run levels, in real prices taking into account market evolution and other regulatory and behavioral changes.
Even during the transition period, the water market acts efficiently, as water is used by the highest value irrigator. While some irrigators will reduce production at the same time that others expand, the net production will likely increase (in terms of value, if not quantity), though the overall production mix will change.
1 ABARES 2016a, Lessons from the water market: The southern Murray-Darling Basin water allocation market 2000-01 to 2015-16.2 Aither 2016c, Contemporary trends and drivers of irrigation in the southern Murray-Darling Basin.3 While total water required may be unchanged from the pre-project counterfactual, the participant has transferred entitlements to the Commonwealth, so effective water demand could increase to replace transferred entitlements.4 Op.Cit., Aither 2016c..

Analysis of efficiency measures in the Murray-Darling Basin: Opportunities to recover 450GL in additional environmental water through efficiency measures by 2024, with neutral or positive socio-economic impacts | Page 111 of 307
19 January 2018 | Final Report
Socio-economic impact pathway 2: Distributional impact arising from changed production decisions by participants
5 Potential socio-economic impacts of efficiency measures
What is the magnitude of any price change?
If temporary allocation prices increase, the magnitude of this is dependent on the extent to which production and land use is expanded and therefore the volume of additional water demand. It will also be impacted by:
► The ability to retain savings: Where programs allow the ability to retain some water savings, although entitlements are reduced, participants are able to use retained savings to increase production. However, if the program does not allow retained savings, or if the realised water efficiency is less than assumed pre-project, all of the additional volume of water demanded will need to be purchased from the market
► The timing and use of the water: Demand is likely to be much more inelastic if it is the last unit required to finish off a planted crop, compared to the first (prior to decided production)
► The area of additional land available for irrigated agriculture
► Any prevailing commodity-specific factors which influence a producers’ willingness to pay: for instance, sales prices and costs of other inputs.
Since 2008, 56% of Basin irrigators have reported modernising their on-farm infrastructure, with 36% participating in efficiency measures programs and 20% using only private funds.1 However, there is no empirical evidence to determine the extent of any production expansion. One potential price ceiling could be the impact of buybacks, as it represents a direct reduction in the supply of consumptive water, with ABARES determining that buybacks caused allocations markets to increase by $22-$25 per ML between 2012 and 2015.2
Allocation price Production target Water demanded at the farm gate Any retained savings? Description
Unchanged Unchanged Decreased No All savings are transferred to Commonwealth. However, production is maintained due to enhanced water efficiency.
Decreased
Unchanged Decreased Yes The effective supply of water increases as participants can sell the retained savings (or can purchase less water).
Small increase Decreased YesThis is a marginal case. While required water has reduced due to modernisation, production has increased slightly. As the irrigator can retain some water savings, there is a net supply impact.
Increased
Small increase Decreased No As above, but given that all water losses were transferred to the Commonwealth, a net demand increase results.
Larger increase Decreased Yes or No
More water is required to reach the increased production target. That is, while total water demand decreases post-project, this is more than offset by the transfer of water to the Commonwealth (even with retained savings), requiring the irrigator to purchase or sell less temporary water.
Increased Unchanged or Increased Yes or No Unchanged or increased water required to reach an increased production target
will increase net demand.
The table below summarises the three price impacts and describes the situation(s) under which they occur.
Source: EY analysis.
1 Schirmer 2017, Water Reform: Socio-economic effects of investment in water infrastructure. This report prepares data specific to irrigators across the Murray-Darling Basin, from the 2015-16 Regional Wellbeing Survey for the DAWR.2 ABARES 2011, Modelling the economic effects of the Murray-Darling Basin Plan.
1 Terms of reference 7 Opportunities for efficiency ...2 Glossary 8 Cost of efficiency measures3 Executive summary 9 Principles for negating adv ...4 Introduction 10 A program to achieve 450 ...5 Potential socio-economic ... 11 Appendices6 Program design

Analysis of efficiency measures in the Murray-Darling Basin: Opportunities to recover 450GL in additional environmental water through efficiency measures by 2024, with neutral or positive socio-economic impacts | Page 112 of 307
19 January 2018 | Final Report
Socio-economic impact pathway 2: Distributional impact arising from changed production decisions by participants
5 Potential socio-economic impacts of efficiency measures 1 Terms of reference 7 Opportunities for efficiency ...2 Glossary 8 Cost of efficiency measures3 Executive summary 9 Principles for negating adv ...4 Introduction 10 A program to achieve 450 ...5 Potential socio-economic ... 11 Appendices6 Program design
1 ABARES 2017, Murray-Darling Basin Irrigation Survey, http://www.agriculture.gov.au/abares/research-topics/surveys/irrigation. 2 Schirmer 2017, Water Reform: Socio-economic effects of investment in water infrastructure. This report prepares data specific to irrigators across the Murray-Darling Basin, from the 2015-16 Regional Wellbeing Survey for DAWR.3 Frontier 2017, Social and economic impacts of the Basin Plan in Victoria.
Do water market prices have a significant impact on business viability?
All irrigators work under different operating conditions and water represents part of business management and one of the many elements that influence the viability of businesses. For instance, other inputs include energy, fertilizer, seeds and salaries – all of which have their own markets and pricing drivers.
The ABARES Murray-Darling Basin Irrigation Survey reported that between 2006-07 and 2015-16, water costs (including bulk water charges and temporary allocation purchases) represented low average proportions of total farm cash costs. This is seen in the table opposite, where water represents an average of 3% of total cash costs for cotton producers to over 9% for grape producers.1 Depending on the commodity produced, the highest average cost component ranges from fuel to labour to fodder, not water. Note however, that for many irrigators the cost of water is a capital cost of their entitlement and this is not captured in cash costs.
In contrast, the Regional Wellbeing Survey (2017) indicates that water costs (including water market prices, fixed costs and delivery costs) made up a large portion of most unmodernised irrigators’ farm expenditure in 2015-16. Specifically, 82% of survey respondents reported that water costs (including water market purchases and water delivery charges) represented up to 30% of their farm expenditure. For 12% of unmodernised irrigators, their water costs represented more than 40% of expenditure.2
As can be seen there is a large discrepancy between the two surveys regarding the proportional cost of water for irrigated businesses. This may be due to the fact that for many irrigators the cost of water is a capital cost and therefore not picked up in the ABARES survey data or additional cost categories captured in this survey. Additionally, since the Regional Wellbeing survey statistics are related to unmodernised irrigators, water may be a proportionally greater cost for this subset of irrigators.
Irrigators with water costs making up larger proportions of operating costs are more likely to experience a significant impact to business viability if water prices increase (assuming that water delivery costs are a small proportion of total water costs).
However, cost of production is only one side to business viability – the other is revenue, where the key determinate is likely to be specific commodity prices. Commodity prices are influenced by global markets and trends and like all markets,
are subject to waves of optimism and pessimism which impact investment decisions. This can influence, or be influenced by commodity sales prices, exchange rates, technological advancements and trade policy and tariffs. Therefore, all irrigators are also subject to both domestic and global market forces, with recognition that even small changes in commodity prices will have a large impact on irrigators.3
Selected cost component
Proportion of total cash costsby commodity producer, average over 2006-07 and 2015-16
Cotton Dairy Grapes Horticulture Rice
Contracts 9% 3.25% 13% 15% 7%
Electricity 2% 2.75% 4% 3.25% 1.5%
Fertiliser 10.5% 4.5% 5.75% 4.5% 13%
Fodder 0.25% 32% NA NA NA
Freight 3% 3.5% 4.75% 4% 2.75%
Fuel 11.5% 3% 4.5% 3.5% 10%
Hired labour 7% 7% 14% 20% 4%
Interest 15% 6.25% 10.25% 7.5% 12%
Repairs and maintenance 8% 6.5% 8.8% 7.5% 9.25%
Water 2.75% 6% 9.25% 6% 9%
Source: ABARES 2017.Note: Figures represent the approximate average. Discrepancies between this and the Regional Wellbeing Survey may be due to averaging and the additional cost categories captured in the ABARES Irrigation Survey.

Analysis of efficiency measures in the Murray-Darling Basin: Opportunities to recover 450GL in additional environmental water through efficiency measures by 2024, with neutral or positive socio-economic impacts | Page 113 of 307
19 January 2018 | Final Report
Socio-economic impact pathway 2: Distributional impact arising from changed production decisions by participants
5 Potential socio-economic impacts of efficiency measures 1 Terms of reference 7 Opportunities for efficiency ...2 Glossary 8 Cost of efficiency measures3 Executive summary 9 Principles for negating adv ...4 Introduction 10 A program to achieve 450 ...5 Potential socio-economic ... 11 Appendices6 Program design
Assessing the impactBased on the available evidence, it is likely that participant production will increase as a result of efficiency measures. It has been assessed that as a result, water demanded is also likely to increase.
If net water demand increases, prices of water in the allocation market would also increase in the short-term. This would result in adverse distributional impacts for some marginal users and their communities (Marginal users being defined as irrigators reliant on the allocations market and/or as irrigators for whom a marginal price change will result in them reducing their production before other irrigators due to their lower profitability).
However, market participation (and therefore the impact of water price changes) is influenced by the commodity produced, in particular whether an intermittent or a permanent commodity is produced. Specific business characteristics will also influence impacts. While some irrigators may be more likely to be significantly adversely impact by a price increase (for instance, those who are unestablished, had previously participated in buybacks or are otherwise particularly reliant on the allocations market), others may only experience little or no adverse impacts. Further, marginal profitability is driven by the prevailing operating environment which includes commodity prices and individual business strategy. Consequently, the magnitude and nature of any flow-on community impact is dependent on factors such as:
► The significance of any potential price change
► Community dependence on irrigated agriculture
► The relative homogeneity of these irrigators.
Case study
Irrigation scheme modernisation in Narrabri, NSW
Program: On-Farm Efficiency Program
Project timeframe: 12 months
Delivery partner: STBIFM
Water saved: 98 ML returned to MDB
Project included:
► Raise the height of a storage dam.
► Upgrade fields to bankless channel irrigation.
► Regrade one field.
► Replace supply channel.
Benefits from project:
► A decrease in water evaporation due to the water storage and greater efficiency due to a reduction in ponding resulting in in 98 ML returned to the MDB.
► Ability to develop three additional field by laser levelling to reduce ponding and yield losses.
► By being more viable they can employ the same amount of labour despite less labour required to produce greater yields.
► Greater efficiency can result in community benefits – “Simply put, strong farms means strong towns. This means we can retain our schools, hospitals and businesses providing rural goods and services.”
Uncertainty and adverse social and economic outcomes for irrigators
Stakeholders have advised that uncertainty regarding changes to government policies and regulations has increased irrigators anxiety and stress. This could adversely impact on their social relationships, including their families and their relationships - potentially flowing onto general community well-being. This is supported by survey evidence collected by the NSW Department of Primary Industries for the general farming community in 2012. It also found that uncertainty decreased a farmers’ ability to plan for unfavourable conditions.1
1 Forbes, P. et.al. 2012, The long-term impact of Property Management Planning (Farming for the Future) in NSW. Source: NSW DPI 2013, Sustaining the Basin: Irrigation Farm Modernisation (STBIFM) Program.

Analysis of efficiency measures in the Murray-Darling Basin: Opportunities to recover 450GL in additional environmental water through efficiency measures by 2024, with neutral or positive socio-economic impacts | Page 114 of 307
19 January 2018 | Final Report
Socio-economic impact pathway 2: Distributional impact arising from changed production decisions by participants
5 Potential socio-economic impacts of efficiency measures 1 Terms of reference 7 Opportunities for efficiency ...2 Glossary 8 Cost of efficiency measures3 Executive summary 9 Principles for negating adv ...4 Introduction 10 A program to achieve 450 ...5 Potential socio-economic ... 11 Appendices6 Program design
Assessing the impact (cont.)The table below presents the results of the 2015-16 Regional Well Being Survey for irrigators in the Murray-Darling Basin, presented by commodity produced. From the table, it can be seen that irrigators with flexible or semi-flexible annual production decisions may be more likely to purchase water on the allocations market and may be more likely to be impacted.
Commodity production is known to be geographically clustered, due to the relatively fixed characteristics of land (such as soil type, climate and elevation) dictating suitability for certain types of irrigated production. Consequently, commodity production in some communities may be predominately one type of crop. This may make some communities disproportionally adversely affected if many of their irrigators are the marginal user.
The magnitude of any impact cannot be determined without further data – in particular, the magnitude of increased water demand from on-farm efficiency programs, the magnitude of any short-term price increases from increased water demand and the subsequent impact on business viability. A potential ceiling on the impact of water prices could reflect the market impact from buybacks (which increased allocation prices between $22-25 per ML, or by 32-39%),2 noting that these figures represent a much larger volume of water, recovered specifically through water markets, and not offset by infrastructure efficiencies. Additionally, the future distributional impact will likely be determined by the prevailing operating environment and the irrigator’s strategic decision-making.
Based on present commodity prices, the current marginal users are likely to be some dairy and rice producers (discussed further overleaf). Both dairy and rice are interruptible or semi-interruptible commodities. While this may predispose these producers to become the marginal user under certain circumstances, other factors are still relevant. For instance, even permanent horticulture crops can be dried-off under the right conditions (such as during the last drought).3 In particular, the decline of wine grapes can largely be attributed to the increased currency appreciation of the Australian dollar since 2001.4
Due to the lack of available data on the increase in water demanded and the resulting impact on water prices, a hypothetical example has been developed to illustrate the potential outcomes of this impact pathway, as seen outlined on page 116.
Commodity Entitlement market participation Allocation market participation
Produced Production type Buy Sell Buy Sell
Crops: rice, grain, oilseed and
cottonFlexible 19% 9% 51% 26%
Dairy Semi-flexible 11% 15% 65% 9%
Horticulture: fruit and nuts Fixed 13% 15% 14% 33%
Beef, sheep or mixed crop-
grazingSemi-flexible 7% 7% 19% 30%
Other N/A 7% 5% 15% 42%
Source: Schirmer 2017.
1 As the 2015-16 year had high seasonal allocations, water prices may have been relatively cheaper than in low or moderate allocation years (hence the relatively lower proportion of these irrigators selling water). In a low allocation year, they may be therefore more likely to sell their water on the allocations market (given anticipated higher prices), or less likely due to lower water availability.2 Aither 2016c, Contemporary trends and drivers of irrigation in the southern Murray-Darling Basin, and ABARES 2016a, Lessons from the water market: The southern Murray-Darling Basin water allocation market 2000-01 to 2015-16.3 Frontier 2017, Social and economic impacts of the Basin Plan in Victoria.4 Anderson 2013, Growth and Cycles in Australia’s’ Wine Industry, https://www.adelaide.edu.au/wine-econ/databases/winehistory/winehistory-compendium-front-0215.pdf .

Analysis of efficiency measures in the Murray-Darling Basin: Opportunities to recover 450GL in additional environmental water through efficiency measures by 2024, with neutral or positive socio-economic impacts | Page 115 of 307
19 January 2018 | Final Report
Socio-economic impact pathway 2: Distributional impact arising from changed production decisions by participants
5 Potential socio-economic impacts of efficiency measures 1 Terms of reference 7 Opportunities for efficiency ...2 Glossary 8 Cost of efficiency measures3 Executive summary 9 Principles for negating adv ...4 Introduction 10 A program to achieve 450 ...5 Potential socio-economic ... 11 Appendices6 Program design
Some dairy farmers as the marginal user
The Australian dairy industry was deregulated in 1999. Since then the dairy industry has undergone significant structural adjustment, and the introduction of $1 per litre milk.4 Additionally, a number of dairy properties in Northern Victoria exited due to extended drought conditions and low water allocation environments from the Millennium Drought.5 That is, between 2006-10, the number of dairy properties in Northern Victoria (the main dairy production region in Australia) fell by 57%. These were mainly smaller farms as the reduction in land decreased by 47% and total production by only 32%.6
More recently in 2015 in Europe, quotas for milk originally introduced in the 1980s were removed, resulting in a significant increase in global production of milk. Rapid supply increases and new market opportunities, a culture of stockpiling milk powder in China (reducing demand), as well as international sanctions and trade agreements, has seen prices fall.7 These global market shifts adversely impact the local dairy farmers who predominantly export.8
Many dairy farmers are highly exposed to the allocations market, particularly those who had previously participated in buybacks.9 This is supported by results from the 2015-16 Regional Wellbeing Survey where 65% of unmodernised dairy farmers reported that the high price of temporary water allocations had been a large barrier to running their farm business over the past three years. In comparison, only 31% of unmodernised non-dairy farmers reported the same. Further, relatively more dairy farmers who had modernised (around 75%), reported that high prices in the temporary allocations market were a large barrier.10 This is likely due to changes in their potential profitability, brought about by the decline in milk prices.
Some rice farmers as the marginal user
Rice is an annual summer crop prevalent across the Riverina region of Australia. With over 1500 growers in the Murrumbidgee Valley of NSW and the Murray Valley of NSW and Victoria, there is potential to produce over 1 million tonnes, and earn over $800 million in revenue each year.1
Australian growers are almost 50% more water efficient than international counterparts, using 12.6 ML/ha of rice produced,2 and depending on the variety produce an average of 16 tonne/ha, at a price of $415 per tonne.3
Rice farmers, as general water license holders, receive water after the environment, towns, livestock and permanent plantings. This potential of an irregular water supply, compounded by changing climate has reduced the water available and consequently increased the input costs of the crop, lowering the overall value of production. The sustainability of the crop could be challenged with the decrease in water availability. However, many rice farmers have now diversified their cropping – a production possibility made easier with intermittent crops.
1 RGA 2017, About the Rice Industry, http://www.rga.org.au/the-rice-industry.aspx.2 Cotton Australia 2016, Water Use Efficiency in the Cotton Industry, http://cottonaustralia.com.au/cotton-library/fact-sheets/cotton-fact-file-water.3 SunRice 2016, 2016 Riverina Rice Harvest: Stronger Yields Results, https://www.sunrice.com.au/corporate/newsroom/media-releases/2016-riverina-rice-harvest-stronger-yields-results.4 Dairy Australia 2017, History of Australian dairy industry deregulation, https://www.dairyaustralia.com.au/about-dairy-australia/about-the-industry/history-of-australian-dairy-industry-deregulation.5 HMC Property Group 2010, Changing land use in the GMID 2006-2010: Where have all the dairies gone?.6 Ibid.7 Op. Cit., Dairy Australia 2017.8 The Conversation 2016, Milk price cuts reflect the reality of sweeping changes in global dairy market. https://theconversation.com/milk-price-cuts-reflect-the-reality-of-sweeping-changes-in-global-dairy-market-59251 .9 Frontier 2017, Social and economic impacts of the Basin Plan in Victoria.10 Schirmer 2017, Water Reform: Socio-economic effects of investment in water infrastructure.

Analysis of efficiency measures in the Murray-Darling Basin: Opportunities to recover 450GL in additional environmental water through efficiency measures by 2024, with neutral or positive socio-economic impacts | Page 116 of 307
19 January 2018 | Final Report
Socio-economic impact pathway 2: Distributional impact arising from changed production decisions by participants
5 Potential socio-economic impacts of efficiency measures 1 Terms of reference 7 Opportunities for efficiency ...2 Glossary 8 Cost of efficiency measures3 Executive summary 9 Principles for negating adv ...4 Introduction 10 A program to achieve 450 ...5 Potential socio-economic ... 11 Appendices6 Program design
Hypothetical example of distributional impact
Using ABS data1 a hypothetical scenario has been developed to indicate the impact of an increase in water demand resulting from participating in on-farm efficient measures programs. That is, this assessment calculates the potential number of irrigating enterprises businesses2 which could exit the Basin as their water is purchased by higher value users. It also presents the resulting reductions in IVA, if all marginal users exited from one industry.
This hypothetical example demonstrates the potential impact on irrigated businesses and industry resulting from an increase in water demand, equivalent to 25% of the water entitlements released (and water efficiency savings gained).
Note that on the Basin scale, this reduction will be more than offset by increased production from more efficient users and therefore this analysis should not be interpreted as lost production, rather it has been undertaken to demonstrate the potential scale of impact. The specific parameters and assumptions used are outlined below.
. Increased water demanded is calculated as:
Volumetric increase in water demand =
Water recovered * percentage of participants who will increase demand * percentage increase in water demanded
The impact is calculated from two perspectives, the first where the increase in water demand comes from businesses across the Basin and the second, where all marginal users exit from one type of commodity production.
1. Business impact across the Basin:
The impact of increased water demand of 25% is estimated to result in the exit of 174 farms, representing around 1% of irrigating enterprises across the Basin.
Assumptions Value Rationale
Proportion of value add to industry turnover 34%
Calculation, based on ABS 8155.0; industry value added/total income for 2014-15.
Water recovered 350GLBased on an estimated 100GL to be recovered from off-farm or urban projects, the remaining volume will be recovered from on-farm infrastructure upgrades.
Percentage of participants who will increase demand 80% Based on stakeholder estimations.
Percentage increase in water demand 25% Value unknown, assumption used for illustrative purposes.
Source: ABS Cat No. 8155.0 and EY stakeholder consultation.
Number of businesses exiting =
𝑉𝑉𝑉𝑉𝑉𝑉𝑉𝑉𝑉𝑉𝑉𝑉𝑉𝑉𝑉𝑉𝑉𝑉𝑉𝑉 𝑉𝑉𝑖𝑖𝑉𝑉𝑉𝑉𝑉𝑉𝑖𝑖𝑖𝑖𝑉𝑉 𝑉𝑉𝑖𝑖 𝑤𝑤𝑖𝑖𝑉𝑉𝑉𝑉𝑉𝑉 𝑑𝑑𝑉𝑉𝑉𝑉𝑖𝑖𝑖𝑖𝑑𝑑𝑉𝑉𝑑𝑑𝐴𝐴𝐴𝐴𝑉𝑉𝑉𝑉𝑖𝑖𝐴𝐴𝑉𝑉 𝑤𝑤𝑖𝑖𝑉𝑉𝑉𝑉𝑉𝑉 𝑉𝑉𝑖𝑖𝑖𝑖𝐴𝐴𝑉𝑉
Where Average water usage =
𝑊𝑊𝑖𝑖𝑉𝑉𝑉𝑉𝑉𝑉 𝑖𝑖𝑎𝑎𝑎𝑎𝑉𝑉𝑉𝑉𝑉𝑉𝑑𝑑 𝑓𝑓𝑉𝑉𝑉𝑉 𝑉𝑉𝑉𝑉𝑉𝑉𝑉𝑉𝐴𝐴𝑖𝑖𝑉𝑉𝑉𝑉𝑉𝑉𝑖𝑖𝑁𝑁𝑉𝑉𝑉𝑉𝑁𝑁𝑉𝑉𝑉𝑉 𝑉𝑉𝑓𝑓 𝑁𝑁𝑉𝑉𝑖𝑖𝑉𝑉𝑖𝑖𝑉𝑉𝑖𝑖𝑖𝑖𝑉𝑉𝑖𝑖 𝑉𝑉𝑖𝑖 𝑉𝑉𝑡𝑉𝑉 𝐵𝐵𝑖𝑖𝑖𝑖𝑉𝑉𝑖𝑖
1 ABS Cat No. 4618.0 and 4610.0.2 Based on average water applied in 2014-15. Note that this was a reasonably dry year (ABARES 2016b), so figures may be overstated compared to a wet or normal allocation year.

Analysis of efficiency measures in the Murray-Darling Basin: Opportunities to recover 450GL in additional environmental water through efficiency measures by 2024, with neutral or positive socio-economic impacts | Page 117 of 307
19 January 2018 | Final Report
Socio-economic impact pathway 2: Distributional impact arising from changed production decisions by participants
5 Potential socio-economic impacts of efficiency measures 1 Terms of reference 7 Opportunities for efficiency ...2 Glossary 8 Cost of efficiency measures3 Executive summary 9 Principles for negating adv ...4 Introduction 10 A program to achieve 450 ...5 Potential socio-economic ... 11 Appendices6 Program design
Program implicationsParticipation in water efficiency projects helps irrigators enhance their competiveness against other irrigators (and other industries). Further, increased demand for water can have short-term impacts on the price of water and adversely impact marginal users. These distributional socio-economic impacts lead to two considerations for program design:
► Program design should be cognisant of enabling all industries to have equal
opportunity to participate in the program to ensure that programs are not enhancing the competitiveness of any particular industries vis-à-vis other industries
► Consideration could be given to investment in accelerating current research and development into water productivity. This would increase the capacity of industries to adapt to reduced water.
This approach to negate impacts is discussed further in Chapters 9 and 10.
2. Industry impacts are calculated as:
This example shows that if all of the marginal users were to exit from one industry, the impact to that industry ranges from between 3% of IVA for dairy and 16% of IVA for grape producers. Due to the high value of fruit and nuts, reduced water for these producers leads to a reduced IVA of over $14.5 million. However, on the Basin scale a reduction in IVA from any single industry is more than offset by increased production by efficient producers.
Commodity1 Percentage of industry IVA Total impact on IVA ($m)
Cereals for grain and seed 10% -$2,860,000
Cotton 6% -$3,690,000
Rice 8% -$1,520,000
Fruit and nuts 14% -$14,620,000
Grapes 16% -$8,980,000
Livestock and dairy 3% -$5,220,000
Source: ABS Cat. No. 4618.0, 4610.0 and EY analysis. Calculations are based on 2014-15 data.
IVA per business =
𝐼𝐼𝑉𝑉𝐴𝐴 𝑉𝑉𝑓𝑓 𝑉𝑉𝑖𝑖𝑑𝑑𝑉𝑉𝑖𝑖𝑉𝑉𝑉𝑉𝑖𝑖𝑁𝑁𝑉𝑉𝑉𝑉𝑁𝑁𝑉𝑉𝑉𝑉 𝑉𝑉𝑓𝑓 𝑁𝑁𝑉𝑉𝑖𝑖𝑉𝑉𝑖𝑖𝑉𝑉𝑖𝑖𝑖𝑖𝑉𝑉𝑖𝑖 𝑉𝑉𝑖𝑖 𝑉𝑉𝑖𝑖𝑑𝑑𝑉𝑉𝑖𝑖𝑉𝑉𝑉𝑉𝑖𝑖
Where IVA of industry =
Commodity GVIAP * Proportion of value add to industry turnover
Feedback from stakeholders
The following points were expressed by stakeholders during consultations:
► Irrigators have a greater capacity to wear shocks relating to water since the drought due to diversification. Water efficiency measures have enabled fields to be set up (e.g. with lasering) to change seasonal crops depending on prices and the weather forecast.
► If on-farm production falls, there is a wider flow-on effect to the community relating to money spent, employment opportunities and services required. Ongoing and consistent supply is of key concern to processing plants in particular. With any water removed from the consumptive pool introducing new risk to the viability of the operation (potential to reduce production).
► Water markets and efficiency measures have compounded existing influences, such as technology.
► Uncertainty regarding whether the 450GL water recovery will go ahead, and future water availability, causes economic uncertainty, discouraging potential investment. This has also caused mental health concerns in communities.
Source: Stakeholder consultations.
1 Some commodity groups were removed from this analysis as their total volume of applied water was small.

Analysis of efficiency measures in the Murray-Darling Basin: Opportunities to recover 450GL in additional environmental water through efficiency measures by 2024, with neutral or positive socio-economic impacts | Page 118 of 307
19 January 2018 | Final Report
Socio-economic impact pathway 2: Distributional impact arising from changed production decisions by participants
5 Potential socio-economic impacts of efficiency measures
Conclusion
Available evidence suggests that on-farm efficiency measures projects result in increased competitiveness by participants. This may result in increased water demand. However, a variety of factors impact the price of water and empirical data is limited.
If prices increase, adverse distributional impacts may disproportionally fall on irrigators reliant on purchasing temporary water. This is primarily affected by the choice of produced commodity. Other influences include seasonal allocations, prevailing commodity prices and strategic business plans (including current infrastructure).
Given the geographic clustering of commodity production, certain communities would also be disproportionally impacted, potentially accelerating existing structural changes
Implications for program design
► To address potential distributive impacts between communities and industry areas it is recommended that the on-farm program is allocated across communities and across industry areas (horticulture, cropping, dairy) so that individual communities or industries are not specifically advantaged over others.
► Distributive impacts on more marginal farms should be managed as part of whole of government resilience and regional development programs to support structural change that is impacting the industry as a whole.
Limitations of current quantitative assessment
It is difficult to make more than a hypothetical quantitative assessment regarding the nature of any distributional impact. To assess impacts on the marginal user, additional farm-level data would be required, including:
The volume of any increased demand (and related price impact) still requires empirical establishment. Additional work could be done using the ABARES water market model to help provide guidance on what could happen in the water market over the next few years as a result of efficiency programs and separating the competing price influences.
As part of the five year evaluation of the Basin Plan the MDBA is undertaking an analysis of temporary trade and trade activity to examine net water flows between areas in the Basin (over the short and long term). This information will help inform a view on the extent of changing patterns of water use and provide an indication of how quickly distributional impacts will be felt.
The issue of practical data monitoring is discussed in Chapter 10.
► Income from the farm as well as other sources
► Commodities sold
► Current infrastructure productivity and water efficiency
► Current scope for expansion (including whether privately funded or through an efficiency program)
► Held water entitlements
► Average water purchased on temporary and permanent markets each wet/dry/moderate allocation year
► Average water sold on temporary and permanent markets each wet/dry/moderate allocation year.
1 Terms of reference 7 Opportunities for efficiency ...2 Glossary 8 Cost of efficiency measures3 Executive summary 9 Principles for negating adv ...4 Introduction 10 A program to achieve 450 ...5 Potential socio-economic ... 11 Appendices6 Program design
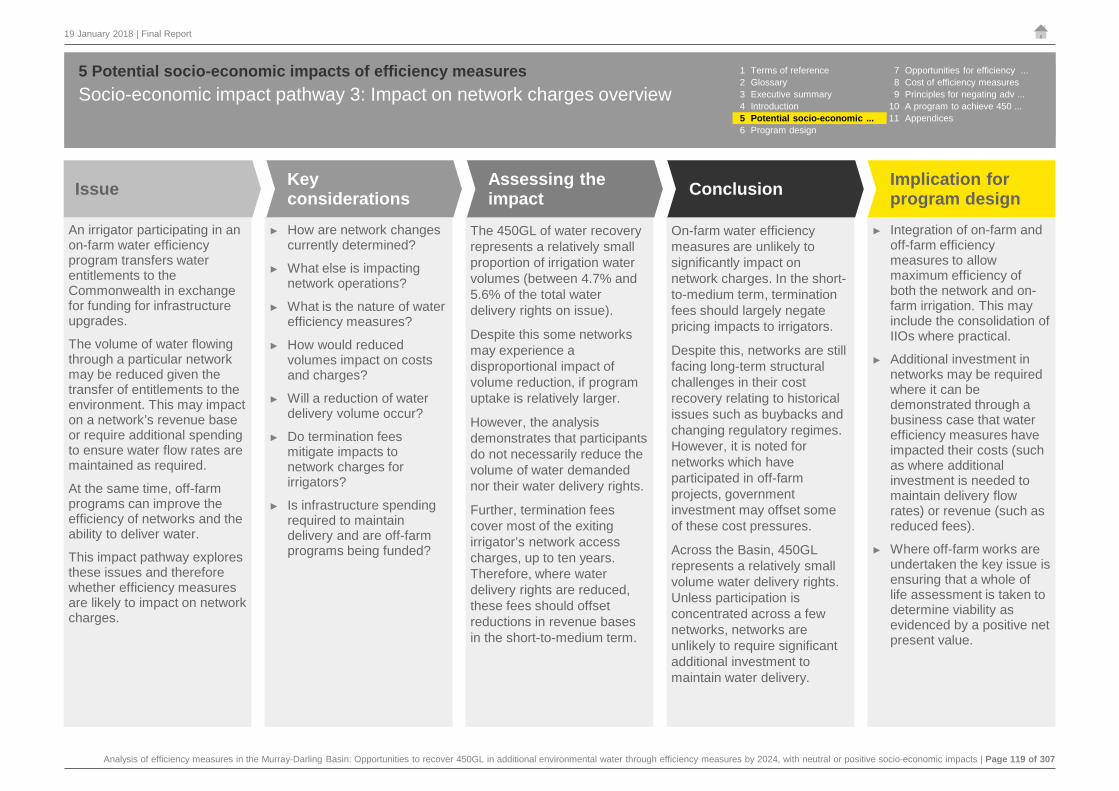
Analysis of efficiency measures in the Murray-Darling Basin: Opportunities to recover 450GL in additional environmental water through efficiency measures by 2024, with neutral or positive socio-economic impacts | Page 119 of 307
19 January 2018 | Final Report
Socio-economic impact pathway 3: Impact on network charges overview5 Potential socio-economic impacts of efficiency measures
An irrigator participating in an on-farm water efficiency program transfers water entitlements to the Commonwealth in exchange for funding for infrastructure upgrades.
The volume of water flowing through a particular network may be reduced given the transfer of entitlements to the environment. This may impact on a network’s revenue base or require additional spending to ensure water flow rates are maintained as required.
At the same time, off-farm programs can improve the efficiency of networks and the ability to deliver water.
This impact pathway explores these issues and therefore whether efficiency measures are likely to impact on network charges.
► How are network changes currently determined?
► What else is impacting network operations?
► What is the nature of water efficiency measures?
► How would reduced volumes impact on costs and charges?
► Will a reduction of water delivery volume occur?
► Do termination fees mitigate impacts to network charges for irrigators?
► Is infrastructure spending required to maintain delivery and are off-farm programs being funded?
The 450GL of water recovery represents a relatively small proportion of irrigation water volumes (between 4.7% and 5.6% of the total water delivery rights on issue).
Despite this some networks may experience a disproportional impact of volume reduction, if program uptake is relatively larger.
However, the analysis demonstrates that participants do not necessarily reduce the volume of water demanded nor their water delivery rights.
Further, termination fees cover most of the exiting irrigator’s network access charges, up to ten years. Therefore, where water delivery rights are reduced, these fees should offset reductions in revenue bases in the short-to-medium term.
On-farm water efficiency measures are unlikely to significantly impact on network charges. In the short-to-medium term, termination fees should largely negate pricing impacts to irrigators.
Despite this, networks are still facing long-term structural challenges in their cost recovery relating to historical issues such as buybacks and changing regulatory regimes. However, it is noted for networks which have participated in off-farm projects, government investment may offset some of these cost pressures.
Across the Basin, 450GL represents a relatively small volume water delivery rights. Unless participation is concentrated across a few networks, networks are unlikely to require significant additional investment to maintain water delivery.
► Integration of on-farm and off-farm efficiency measures to allow maximum efficiency of both the network and on-farm irrigation. This may include the consolidation of IIOs where practical.
► Additional investment in networks may be required where it can be demonstrated through a business case that water efficiency measures have impacted their costs (such as where additional investment is needed to maintain delivery flow rates) or revenue (such as reduced fees).
► Where off-farm works are undertaken the key issue is ensuring that a whole of life assessment is taken to determine viability as evidenced by a positive net present value.
Implication for program designConclusionAssessing the
impactKey considerationsIssue
1 Terms of reference 7 Opportunities for efficiency ...2 Glossary 8 Cost of efficiency measures3 Executive summary 9 Principles for negating adv ...4 Introduction 10 A program to achieve 450 ...5 Potential socio-economic ... 11 Appendices6 Program design

Analysis of efficiency measures in the Murray-Darling Basin: Opportunities to recover 450GL in additional environmental water through efficiency measures by 2024, with neutral or positive socio-economic impacts | Page 120 of 307
19 January 2018 | Final Report
Socio-economic impact pathway 3: Impact on network charges5 Potential socio-economic impacts of efficiency measures
Defining key termsWater delivery rights
A water delivery right (WDR) is separate to water entitlements. A WDR entitles its holder to a share of a network’s delivery capacity. It is generally used to determine who has the responsibility to pay the fixed network costs (charged per ML of held WDR). Therefore, all else being equal, an irrigator with more WDRs will pay a higher share of the network’s fixed costs than someone with less WDRs. Once held, WDRs can only be reduced by termination or trade within the network.1
Termination fees
Irrigation networks exhibit characteristics of natural monopolies, as their assets:
► Require substantial investment
► Are long lived
► Exhibit significant economies of scale
► Have few alternative uses so that costs are largely fixed and sunk.
These characteristics have implications for network pricing structure as charges must recover variable and fixed costs. Fixed costs include maintenance and capital expenditure, which is often larger than variable costs, but can be spread across the entire revenue base.2
Given these complexities, termination fees are intended to smooth revenue and cost implications resulting from irrigators terminating their WDRs, mitigating impacts on remaining irrigators. However, networks are not required to charge termination fees and may waive part or all of them, for instance, to encourage rationalisation (ACCC 2017).3 Additionally, networks have flexible use of termination fees. For instance, they may draw down on them to immediately mitigate the exit impact, or invest the funds to support their general revenue and assist with future planning activities.
If a termination fee is charged, the Water Charges (Infrastructure) Rules 2010 regulate the maximum amount payable as ten times the ‘total network access charge’. This is the sum of all amounts payable to access the network over a full financial year, including any disconnection fees.4
IssueThis assessment explores the impact of water efficiency measures on irrigation network charges. Stakeholders have advised that on-farm efficiency measures have the potential to increase network prices as:
► An irrigator participating in an on-farm water efficiency program transfers water entitlements to the Commonwealth. This reduces the volume of water flowing through the networks.
► All else being equal, the network’s revenue base effectively contracts, potentially requiring them to increase prices and/or change their pricing structure, to recover the same fixed costs.
► In addition, further infrastructure spending may need to be undertaken to maintain water delivery flow rates.
► There may be a distributional impact resulting from the network cost recovery, depending on any potential changes in cost structure. For instance, if charges remained allocated based on water delivery and participants reduced their volumes in line with the entitlements transfer, their costs would reduce, while a non-participant’s cost could increase.
However, networks currently have mechanisms to manage this, chiefly termination fees (representing up to ten years annual charges) and the tradability of water delivery rights within networks.
Additionally, stakeholders have reported that there is pressure on networks for a variety of reasons including issues relating to historical changes in network pricing regimes, the impact of buybacks on revenue and recent increases in electricity costs.
1 ACCC 2017, ACCC Water Monitoring Report 2015-16.2 ACCC 2008, Water charge (termination fees) rules: advice development. 3 Op. Cit., ACCC 2017.4 Ibid.
1 Terms of reference 7 Opportunities for efficiency ...2 Glossary 8 Cost of efficiency measures3 Executive summary 9 Principles for negating adv ...4 Introduction 10 A program to achieve 450 ...5 Potential socio-economic ... 11 Appendices6 Program design

Analysis of efficiency measures in the Murray-Darling Basin: Opportunities to recover 450GL in additional environmental water through efficiency measures by 2024, with neutral or positive socio-economic impacts | Page 121 of 307
19 January 2018 | Final Report
Socio-economic impact pathway 3: Impact on network charges5 Potential socio-economic impacts of efficiency measures 1 Terms of reference 7 Opportunities for efficiency ...
2 Glossary 8 Cost of efficiency measures3 Executive summary 9 Principles for negating adv ...4 Introduction 10 A program to achieve 450 ...5 Potential socio-economic ... 11 Appendices6 Program design
Scenario Network Other network irrigators Community BasinMarketParticipant
The
new
pro
duct
ion
deci
sion
Commonwealth infrastructure
funding
Increases in water
productivity causes an irrigator to
require less water at the
farm-gate (the water
demanded) for the same
production. The input mix may
change, of which water is only one factor
Transfer water entitlements to Commonwealth
Same production (decrease
demand for water)
Increased production (decrease
demand for water)
Increased production (increase
demand for water)
Increased production
(unchanged demand for
water)
Total water demanded or
supplied changes
Total volume of water available for production
falls
Water price changes at the
margin Agricultural production changes
Network charges may change
Positive environmental
outcomes
Community spending changes
Profit is the same or increases
Profit changes
Agricultural production
decision changes, including input
mix
Water demanded at the farm-gate changes/water sold changes
Agricultural production
unchanged or increased
Increases (potentially temporary)
employment
Potential change in volumes of
water delivered
Agricultural production changes
Non-agricultural production may
change
Employment changes
Potential change in volumes of
water delivered
Source: EY analysis

Analysis of efficiency measures in the Murray-Darling Basin: Opportunities to recover 450GL in additional environmental water through efficiency measures by 2024, with neutral or positive socio-economic impacts | Page 122 of 307
19 January 2018 | Final Report
Socio-economic impact pathway 3: Impact on network charges5 Potential socio-economic impacts of efficiency measures
ConsiderationsHow are network changes currently determined?
Under the Water Charge (Infrastructure) Rules 2010, the Australian Competition and Consumer Commission (ACCC) can approve or determine regulated charges for irrigation networks in the Murray-Darling Basin if the network:
► Is not a member-owned operator
► Holds more than 250GL in water entitlements (for either themselves or their customers).
The ACCC can also accredit the relevant state agencies for this purpose. At present the Essential Services Commission of Victoria and New South Wales’ Independent Pricing and Regulatory Tribunal have been accredited. Pricing determinations are decided or approved over a three to five year period and are reviewed annually. As such, any changes in network charges should be considered as part of the broader regulatory environment, more specifically, the allowable cost recovery of irrigation networks (see the right textbox for more information).
There are 19 irrigation networks across the Murray-Darling Basin. Each has their own infrastructure delivery systems, economies of scales, billing terminology, pricing approach and potential geographic sub-systems, making comparison difficult.
Since 2010, the ACCC has produced a range of hypothetical bills to translate network charges into individual customer bills under different conditions. While these allow prices to be benchmarked between systems, they do not take into account the differing service provision (for instance, peak flows and on-demand delivery of water).1 However, this does not facilitate a true quantitative analysis of any cost impact to the network, and resulting network charge outcomes.
What else is impacting network operations?
The ‘Swiss Cheese Effect’
The ‘Swiss Cheese Effect’ is an often cited as an unintentional, adverse impact of
buybacks. It was defined by the 2011 Senate inquiry as:
“…what happens when some entitlement holders along an irrigation channel sell their entitlements and stop irrigating. The effect of this is to create ‘holes’ in irrigation areas, reducing the efficiency of delivering water down that channel, stranding assets and increasing the maintenance costs and delivery fees for the entitlement holders who remain.” 1
Stakeholders note that irrigation network operations and planning considerations are still being impacted as a result of this effect. In particular, the impact of untargeted buybacks can be dispersed through a network, making rationalisation opportunities harder to both identify and realise.2 And in addition, the associated reduction in volumes of water delivered. This can impact a network’s long-term ability to recover fixed costs. That is, while it could increase network charges (as fixed costs are spread across fewer users), termination fees should offset some of the impact in the short to medium term (up to at least ten years).
However, networks can flexibly utilise received termination fees, so any short-term impact could be masked by other changes. More information is required to determine longer-term impacts.
Historical changes to network pricing
Prior to the 1990s, prices charged by irrigation networks did not cover the fixed cost of supply, and State-owned networks were not operating commercially. As such, water policy was part of the micro-economic reform package released by the Council of Australian Governments in 1994. A key tenant was a commitment to ‘lower bound pricing’ so water charges covered fixed network costs, but did not earn a commercial return. In contrast, ‘upper bound pricing’ was defined as recovering fixed costs as well as a provision for capital return (but below the level of monopoly rents). Subsequent water policy has encouraged pricing principles to move towards ‘upper bound pricing’ where practicable. Consequently, network charges have been increasing over time due to changes in the regulatory environment.
Source: Parker and Speed 2010. 1 ACCC 2017, ACCC Water Monitoring Report 2015-16.2 Frontier 2017, Social and economic impacts of the Basin Plan in Victoria.
1 Terms of reference 7 Opportunities for efficiency ...2 Glossary 8 Cost of efficiency measures3 Executive summary 9 Principles for negating adv ...4 Introduction 10 A program to achieve 450 ...5 Potential socio-economic ... 11 Appendices6 Program design

Analysis of efficiency measures in the Murray-Darling Basin: Opportunities to recover 450GL in additional environmental water through efficiency measures by 2024, with neutral or positive socio-economic impacts | Page 123 of 307
19 January 2018 | Final Report
Socio-economic impact pathway 3: Impact on network charges5 Potential socio-economic impacts of efficiency measures 1 Terms of reference 7 Opportunities for efficiency ...
2 Glossary 8 Cost of efficiency measures3 Executive summary 9 Principles for negating adv ...4 Introduction 10 A program to achieve 450 ...5 Potential socio-economic ... 11 Appendices6 Program design
1 Senate Inquiry 2011, Inquiry into Chapter 5 Water purchase and infrastructure investment.2 CIT 2015, The manner in which electricity network companies have presented information to the Australian Energy Regulator (AER) and whether they have misled the AER, Senate Submission, https://www.aph.gov.au/Parliamentary_Business/Committees/Senate/Environment_and_Communications/Electricity_and_AER/Submissions.3 Australian Department of the Environment and Energy, n.d.. About Commonwealth environmental water, http://www.environment.gov.au/water/cewo/about-commonwealth-environmental-water.
Off-farm modernisation upgrades
Off-farm modernisation works should reduce network charges, as is the aim of most projects is to replace aging infrastructure and/or reduce the network footprint via rationalisation in exchange for water entitlements. However this will also depend on the nature of any changes to operating costs.
This provides a significant capital injection for infrastructure without the corresponding increase in network charges if networks had to undertake and fund works themselves, as Commonwealth funding is provided in exchange for water losses (either conveyance or general entitlement). Some, off-farm works should lead to decreased operating costs in the long run, where the network can be run more efficiently. However, in cases where greater efficiency relies on reducing a network’s footprint via rationalisation this requires agreement from relevant irrigators to be dried off. Some stakeholders have advised that in practice, this can be a difficult, and time-consuming process for the network to manage and may not lead to the desired outcome.
Some off-farm works can also lead to changes in the operating cost profile. For instance, upgrading a gravity-fed network with a pressurised system generally increases energy reliance as energy generated by gravity is replaced with energy generated by other sources (usually electricity). As pressurised systems can deliver water more quickly, overall network energy usage can increase. This could occur if irrigators take advantage of increased system flexibility by receiving smaller volumes of water, delivered more frequently. In recent times, electricity costs have increased. These are expected to be passed onto irrigators and other users on the network and may offset any potential decrease other operating costs. Further, in a 2015 submission to a Senate inquiry, CIT reported that:
“We have seen [electricity] network charges almost double [….] which is substantially greater than forecasted in the 2010-2015 SA Power Networks’ pricing path. No other input cost in our business has risen anywhere near these levels and in comparison the retail component of our bills has remained static over the same period.” 2
While stakeholders also noted changes in operating costs and the potential subsequent adverse impacts associated with these, it is anticipated that for a network to chose to participate, the benefits accruing to the network would outweigh these costs.
Use of networks for environmental water delivery
While the transfer of water to the Commonwealth reduces the physical volume of water available for irrigation (though net supply has not been decreased due to increased water efficiency), there is a corresponding increase in water available for environmental purposes. As part of its annual portfolio management, the Commonwealth Environmental Water Holder (CEWH) can decide how this water is utilised – that is, for an environmental asset, carryover or trade – in line with its long-term environmental goals. This can involve the delivery of environmental water through irrigation networks, as the CEWH’s water holdings are spread across 17 Basin Plan regions.3 This can provide networks with supplementary income, to offset reduced water volumes from irrigators.
Other water and commodity trends
Commodities tend to exhibit geographic clustering. Additionally, the connected catchments of the MDB allow for extensive water trade across irrigation networks, particularly in the Southern Basin. Consequently, networks can become net exporters or importers of water as heterogeneous commodity influences (including seasonal water allocations) drive water demand towards the most efficient users. However, thus far there have not been sustained trends in the patterns of water trade between catchments. Additionally, a network’s fixed costs against WDRs are still payable even if seasonal allocations are exported. As such, networks will recover their fixed costs in low allocation years and/or years in which their irrigators export water.
What is the nature of water efficiency measures?
The extent to which the proportion of water comes from on-farm projects versus off-farm or urban projects will also influence the impacts. In the case where water savings come from recovery of off-farm network losses will not reduce volumes to irrigators and therefore have limited impact on revenue. The exception is if this water would have been sold on the temporary market or otherwise provided to irrigators for productive purposes.

Analysis of efficiency measures in the Murray-Darling Basin: Opportunities to recover 450GL in additional environmental water through efficiency measures by 2024, with neutral or positive socio-economic impacts | Page 124 of 307
19 January 2018 | Final Report
Socio-economic impact pathway 3: Impact on network charges5 Potential socio-economic impacts of efficiency measures 1 Terms of reference 7 Opportunities for efficiency ...
2 Glossary 8 Cost of efficiency measures3 Executive summary 9 Principles for negating adv ...4 Introduction 10 A program to achieve 450 ...5 Potential socio-economic ... 11 Appendices6 Program design
How would reduced volumes impact on costs and charges?
Some network pricing structures are further split geographically or by system (i.e. gravity-fed or pressurised), given the different costs involved. That is, out of the 19 irrigation networks, 39 separate pricing structures exist. Each pricing structure has a different proportion of fixed and variable charges to recover from irrigators. In the ACCC’s most recent calculation of hypothetical network bills, fixed charges ranged from around 30% in Buddah Lake to around 90% in Sun Water (St. George region). For the same year, the average fixed cost proportion across all networks was 60% of all charges.1
Fixed costs are allocated on the basis of held WDR, while variable are recovered against water actually delivered (water delivery above WDR accrue additional fees). Any impact of reduced water volumes would come from changes in held WDRs.2
Will a reduction of water delivery volume occur?
While participants must transfer entitlements to the Commonwealth in exchange for on-farm funding, it does not necessarily follow that they will reduce their water delivery rights. For instance using data from the ACCC’s most recent Water Monitoring Report, the total volume of WDRs issued as at 30 June 2016 is only 6% lower compared to 1 July 2009,3 less than the volume of water purchase.4,5
Furthermore, in South Australia, irrigators on CIT’s irrigation network transferred 13.67GL in water entitlement to the Commonwealth in exchange for modernised infrastructure.6 However, between 2009-10 and 2015-16, their WDRs on issue increased by 13GL.7 Irrigators on RIT transferred 5.93GL, but their WDRs reduced by only 0.21GL over the same periods.
It should however be noted that while participants may not reduce their water use, overall water flowing through the system for consumptive purposes will decrease. The systems that are impacted by this reduced flow will depend on the distributional impact and which irrigators reduce their water demand.
Do termination fees mitigate impacts to network charges for irrigators?
Termination fees are typically charged to reflect up to 10 years of annual fixed charges. This revenue may be used by the network to offset their reduction in ongoing fixed charge revenue – for instance, by subsidising remaining irrigators so their charges do not increase. It could also be invested and utilised.
In the 2011 Senate Inquiry, the Coleambally Irrigation Co-operative noted the difference:
“If a farmer sells his water, he pays a termination fee and, for a period of time, that termination fee is used to offset the loss of water from that area so that we do not have to hike our rates for the remaining farmers. Eventually that runs out. When it runs out—and we have calculated it with the SDL settings in front of us—we will have to double our water charges. That puts those who had decided to tough it out and stay out of business.”8
This implies that networks may still incur long-term pricing issues from irrigator exit. However, it is difficult to separate this from the changes in regulatory pricing regimes and other structural adjustments that networks have been undergoing, which impact on their price structure. There is little data and analysis available around the usage and effectiveness of termination fees in smoothing long-term prices. However, in the short to medium term, it is likely that the impact is negated.
Is infrastructure spending required to maintain delivery and are off-farm programs being funded?
Some stakeholders raised a concern that a reduction in water volumes may require additional investment to ensure that the delivery of water is maintained at required service levels. In particular, this would be required where certain flow rates were required for efficient operations. It is noted that this would only occur as a result of efficiency measures where reductions in volume are significant or where tipping points (critical volumes) are reached. Furthermore, where networks have undertaken off-farm upgrades, their capacity to operate with reduced volumes may be enhanced. Additionally, off-farm investment has meant that some IIOs are able to improve service levels and operate at lower flow rates.
1 ACCC 2017. ACCC Water Monitoring Report 2015-16.2 Ibid. 3 This is a net result – in some cases, terminations have been offset by newly issued WDRs. 4 Op. Cit., ACCC 2017.5 Advice from MDBA, September 2017. 6 Information provided by the South Australian Department of Environment, Water and Natural Resources, October 2017. Does not include water purchases. 7 Data provided by the MDBA, September 2017, from the ACCC’s 2015-16 Water Monitoring Report. 8 Senate Inquiry 2011, Inquiry into Chapter 5 Water purchase and infrastructure investment.

Analysis of efficiency measures in the Murray-Darling Basin: Opportunities to recover 450GL in additional environmental water through efficiency measures by 2024, with neutral or positive socio-economic impacts | Page 125 of 307
19 January 2018 | Final Report
Socio-economic impact pathway 3: Impact on network charges5 Potential socio-economic impacts of efficiency measures
Assessing the impactNetwork charges are increasing for a range of historical reasons – including changes in the regulatory pricing regime, past buybacks and increasing electricity costs. In some cases, these are offset against other organisations (including the CEWH, MDBA and Water NSW) paying to use the network infrastructure for environmental water delivery. Given the lack of data, designating the appropriate quantitative impact of increased charges specific to efficiency programs is difficult.
If the entire 450GL is recovered through on-farm water efficiency measures, it would represent between 4.7% and 5.6% of total WDRs on issue.1 However, charges are unlikely to increase by this amount in the short to medium term, even if all 450GL were recovered through on-farm efficiency programs.
More specifically, as outlined in impact pathway 2, anecdotal evidence suggests that between 80-90% of participants could increase their demand for water as a result of on-farm efficiency measures. Consequently, these participants would be unlikely to reduce their WDRs and may require additional delivery rights. The latter could occur due to the financial penalties for receiving water delivery volumes over the WDR.
Participation may also create an adverse distributional impact on the marginal user. That is, non-participants may reduce their WDRs in response to the changing competition from their modernised counterparts. As a consequence, some marginal users may exit, terminate or trade their WDRs:
► Terminating WDRs will provide the network with up to 10 years of cost recovery, allowing them time to plan for a lower revenue base (for instance, rationalisation). While prices can increase (as termination fees can be used flexibly by the network), it is unlikely to be by a large amount.
► If trade can be arranged between participants and other irrigators on the network, it may cheaper than either party paying the termination fee. Additionally, trading WDRs will not reduce network fixed cost recovery.
Therefore, while some reduction could come from marginal users, it is unlikely to come from participants, unless their demand for water falls. Additionally, the high cost of termination may make it unlikely for reductions in volume to hit networks immediately. So impacts to network charges arising from on-farm efficiency
programs are likely to be minimal in the short to medium term, past the ten years from on-farm project implementation, due to the time taken for competitive pressures to lead to terminations.
Nevertheless, in the long-term if terminations occur, prices may increase if networks has been unable to plan over the ten years. Any increases will be allocated amongst the remaining irrigators. This may create an adverse distributional impact to the marginal user, the identity of which depends on the prevailing operating environment and commodity-specific trends.
If all of the 450GL was recovered through off-farm efficiency measure programs, there would also be minimal impact to network charges. The network’s base for fixed cost recovery would only be affected through rationalisation, the basis for which is reducing inefficient service delivery, so it should be offset by the reduction in operating costs, particularly where areas rationalised are low water users. Otherwise, modernising infrastructure should reduce network operating costs (particularly maintenance and potentially labour) or if there are increases (e.g. from energy for pumping) these should be considered in the investment decision. Further, the capital expenditure that irrigators would have paid for upgraded infrastructure has been funded by the Commonwealth in exchange for delivery water. This reduces the potential future network charges facing irrigators.
1 Data provided by the MDBA, September 2017, from the ACCC’s 2015-16 Water Monitoring Report. In the data, WDR for Goulburn-Murray Water is presented as ML/day where ‘day’ is either a 270-day season in a gravity-fed district or 365 days in a pressurised network.
Feedback from stakeholders
The following points were expressed by stakeholders during consultations:
► Costs for irrigation districts will have to change in the future with fewer irrigators in the system to pay operation costs. The fixed costs may change in the long run.
► There is concern for the ongoing viability of the irrigation district if water continues to leave these.
Source: Stakeholder consultations.
1 Terms of reference 7 Opportunities for efficiency ...2 Glossary 8 Cost of efficiency measures3 Executive summary 9 Principles for negating adv ...4 Introduction 10 A program to achieve 450 ...5 Potential socio-economic ... 11 Appendices6 Program design

Analysis of efficiency measures in the Murray-Darling Basin: Opportunities to recover 450GL in additional environmental water through efficiency measures by 2024, with neutral or positive socio-economic impacts | Page 126 of 307
19 January 2018 | Final Report
Socio-economic impact pathway 3: Impact on network charges5 Potential socio-economic impacts of efficiency measures
ConclusionOn-farm water efficiency measures are unlikely to significantly impact on network charges. In the short to medium term, termination fees should largely negate pricing impacts to irrigators.
Despite this, networks are still facing long-term structural challenges in their cost recovery relating to historical issues such as buybacks and changing regulatory regimes. However, it is noted for networks which have participated in off-farm projects, government investment may offset some of these cost pressures.
Across the Basin, 450GL represents a relatively small volume of water delivery rights. Unless participation is concentrated across a few networks, networks are unlikely to require significant additional investment to maintain water delivery.
Implications for program design
► Integration of on-farm and off-farm efficiency measures to allow maximum efficiency of both the network and on-farm irrigation. This may include the consolidation of IIOs where practical.
► Additional investment in networks may be required where it can be demonstrated through a business case that water efficiency measures have impacted their costs (such as where additional investment is needed to maintain delivery flow rates) or revenue (such as reduced fees).
► Where off-farm works are undertaken the key issue is ensuring that a whole of life assessment is taken to determine viability as evidenced by a positive net present value.
Limitations of quantitative assessmentFew organisations collect holistic data regarding network charges. Further, even the available data is difficult to compare due to differences in terminology and other characteristics across each network. For a more quantitative analysis, additional data would be required, including:
► Changes in WDRs (including trades and terminations) for the networks, pre and post-project
► Information regarding how termination fees are used
► Costings for network viability, including the current pricing split between fixed and variable charges, by held WDR.
The issue of practical data monitoring is discussed in Chapter 10.
Program implicationsIt has been assessed that on-farm efficiency projects are unlikely to cause network charges to increase in the short to medium term due to the recovery of termination fees. Off-farm projects may impact network charges if the profile of operating costs change. However, off-farm participation implies any costs will be outweighed by the benefits of better service delivery. The overall net impact would be limited.
Given risks around future operating costs (e.g. due to uncertainty around the price of energy), it is important that IIOs undertake a comprehensive whole of life analysis of the investment decision.
Additionally, benefits to networks have been significant where on and off-farm projects can be undertaken as a package. It is therefore suggested that program design should prioritise off-farm projects, particularly those which can occur as a package with on-farm projects.
This approach to negate impacts is discussed further in Chapters 9 and 10.
1 Terms of reference 7 Opportunities for efficiency ...2 Glossary 8 Cost of efficiency measures3 Executive summary 9 Principles for negating adv ...4 Introduction 10 A program to achieve 450 ...5 Potential socio-economic ... 11 Appendices6 Program design

Analysis of efficiency measures in the Murray-Darling Basin: Opportunities to recover 450GL in additional environmental water through efficiency measures by 2024, with neutral or positive socio-economic impacts | Page 127 of 307
19 January 2018 | Final Report
Socio-economic impact pathway 4: Impact on labour productivity and employment overview
5 Potential socio-economic impacts of efficiency measures
Water efficiency measures have the potential to reduce the amount of labour required by irrigators and networks given many projects involve elements of automation. However, water efficiency measures also increase on-farm productivity and associated production which may enhance labour requirements.
At the same time construction spending generates short term employment opportunities within communities and longer term there is the potential for additional skilled workers to support maintenance of on and off-farm infrastructure.
This impact pathway explores the impact of efficiency measures on labour productivity and employment.
► Are employment impacts related to modernisation or efficiency measures programs?
► Will increased on-farm output lead to an increase in the agricultural workforce?
► Is farm employment correlated with agricultural production?
► What is the employment impact from infrastructure construction?
► Could there be a distributional labour impact?
While many infrastructure upgrades involve automation, evidence suggests that while this can enhance labour productivity, labour is often redeployed to other farm tasks. Further, post-project required labour is likely to be more technically proficient than pre-project. These employees may experience increased wages.
During the construction phase additional employment opportunities are created, supporting employment in Basin communities.
However, where marginal users are impacted by water efficiency measures via distributional impacts, employment is likely to be reduced and existing structural change accelerated.
Downstream employment impacts may result as these irrigators are likely to produce the same types of commodities.
Based on the data available there is insufficient evidence to conclusively determine the net impacts on labour. However, available evidence suggests that labour productivity impacts are likely to be limited:
► The net reduction in labour resulting from on and off-farm efficiency measures is estimated to be small
► At the community level there are short-to-medium term benefits from the construction of infrastructure and longer-term potential benefits from maintenance of infrastructure.
The key factor to monitor is if the viability of particular industries is impacted (particularly through impacts on marginal users) and this results in long-term job losses.
► Given the limited data and evidence, the impact on labour productivity and employment needs to be monitored on an ongoing basis with a particular focus on tipping points for industries.
► Whole of government approach to regional development, including development of employees with appropriate skills within communities (or the attraction of those people with required skills).
Implication for program designConclusionAssessing the
impactKey considerationsIssue
1 Terms of reference 7 Opportunities for efficiency ...2 Glossary 8 Cost of efficiency measures3 Executive summary 9 Principles for negating adv ...4 Introduction 10 A program to achieve 450 ...5 Potential socio-economic ... 11 Appendices6 Program design

Analysis of efficiency measures in the Murray-Darling Basin: Opportunities to recover 450GL in additional environmental water through efficiency measures by 2024, with neutral or positive socio-economic impacts | Page 128 of 307
19 January 2018 | Final Report
Socio-economic impact pathway 4: Impact on labour productivity and employment
5 Potential socio-economic impacts of efficiency measures
IssueThis assessment considers the impact of water efficiency measures on labour productivity and total employment within the Basin.
Infrastructure upgrades have the potential to impact on employment through:
► Increased on and off-farm labour productivity
► Infrastructure construction spending
► Impacts to the viability of specific industries in certain locations which can lead to downstream employment impacts
► Changes in competition to non-participating irrigators, which may impact their labour hire decisions
► Flow-on employment impacts to communities.
Water efficiency measures have the potential to reduce the amount of labour required by farmers, by increasing labour productivity through infrastructure upgrades, many of which include elements of automation. There are concerns that this increased labour productivity will reduce on-farm employment, consequently impacting on communities.
Employment is also impacted by Commonwealth infrastructure construction spending on efficiency measures programs as these may generate short-term employment opportunities within communities across the Basin.
Impact pathway 2 outlined how other irrigators could be impacted through a participant’s behavioural change. This may impact the employment of their hired workers and contractors, particularly farming enterprises with marginal profitability.
At the same time, adverse employment impacts could be significant, where water efficiency measures impact on the viability of downstream industries and these enhance structural changes within irrigated industries. Similar to impact pathway 2, adverse employment impacts for communities may be disproportionately experienced, due to the potential geographic clustering of marginal users.
The impact pathway is represented on the following slide.
Case study
Irrigation scheme modernisation in Binya, NSW
Program: On-Farm Efficiency Program
Project timeframe: April 2011 to June 2012
Irrigation network: Contour layout with many narrow irrigation bays and supply and drainage channels
Water saved: 330 ML
Project included:
► Converting existing irrigation system with overhead spray irrigation and recirculation system on 17h hectares.
► Updating machinery such as on guidance system on tractor.
► Moisture monitoring system.
Benefits from project:
► The recirculation of tailwater back into the water supply system results in a productive irrigation system. This could not be achieved previously due to the steep grade of the land.
► The new system has allowed new machinery to be purchased which is better suited to overhead spray. This has allowed more crops to be planted and a 20% grain in machine efficiency.
► The amount of labour required has decreased from 6-8 hours per day to two hours.
► Job creation for local businesses, engineers and local contractors who performed the work.
Source: Department of Environment 2014, On-Farm Irrigation Efficiency Program Case Study, Binya.
1 Terms of reference 7 Opportunities for efficiency ...2 Glossary 8 Cost of efficiency measures3 Executive summary 9 Principles for negating adv ...4 Introduction 10 A program to achieve 450 ...5 Potential socio-economic ... 11 Appendices6 Program design

Analysis of efficiency measures in the Murray-Darling Basin: Opportunities to recover 450GL in additional environmental water through efficiency measures by 2024, with neutral or positive socio-economic impacts | Page 129 of 307
19 January 2018 | Final Report
Socio-economic impact pathway 4: Impact on labour productivity and employment
5 Potential socio-economic impacts of efficiency measures 1 Terms of reference 7 Opportunities for efficiency ...2 Glossary 8 Cost of efficiency measures3 Executive summary 9 Principles for negating adv ...4 Introduction 10 A program to achieve 450 ...5 Potential socio-economic ... 11 Appendices6 Program design
On-farm Labour productivity
change
This
impa
ct fe
eds
into
the
new
pro
duct
ion
deci
sion
Scenario Labourers Marginal user Non-marginal user CommunityNetworkParticipant Basin
Other irrigators
Commonwealth infrastructure
funding
Off-farm Labour productivity
change
On-farm project could change the number of
employed or the type of
employment
Agricultural production
unchanged or increased
Profit is the same or
increases
Potential reduction in anti-social
hours
New employment
decision
Received wages change
Community spending changes
Agricultural production decision may change due to changes in competitive
environment
Profit changes
Agricultural production may change
New employment
decision
Increases (potentially temporary)
employment
Agricultural production changes
Non-agricultural production may
change
Employment changes
Off-farm project could change the number of
employed or the type of
employmentNew
employment decision
Passed through changes in
operating costs
Source: EY analysis

Analysis of efficiency measures in the Murray-Darling Basin: Opportunities to recover 450GL in additional environmental water through efficiency measures by 2024, with neutral or positive socio-economic impacts | Page 130 of 307
19 January 2018 | Final Report
Socio-economic impact pathway 4: Impact on labour productivity and employment
5 Potential socio-economic impacts of efficiency measures
ConsiderationsDoes modernisation result in direct employment being reduced or redeployed?
On-farm
Increased labour productivities arising from modernised infrastructure may either cause workers to be redeployed elsewhere on the farm or made redundant (with the latter reducing employment).
In 2012, 56% of all Australian farm workers were farm owner-managers, with 17% managing farms on others behalf, and the remaining 27% being employees.1Farmers with no workers were far more likely (68%) to install automated irrigation systems than those with part-time or full-time farm workers (25% and 8% respectively).2 This indicates that labour productivity benefits from more efficient irrigation primarily accrue to farm owners.3
Skilled farm workers possess expertise beyond irrigation, so automating irrigation systems does not necessarily make their labour or skills redundant. Although the opportunity exists to redeploy labour to other areas of the farm, studies undertaken have largely focused on the relationship between automation of irrigation and employment for irrigation purposes. Some stakeholders in the Riverina area note that demand has increased for more skilled agricultural workers, but potential workers lack the required skills.
It is noted that technological advances in automation and connected devices will likely continue to exert pressure on full-time employment in agriculture. For instance, if computers, drones and robots perform workers’ current tasks, such as weed spraying to soil monitoring, the need for labour resources could be significantly reduced.4
1 ABS Cat. No. 4102.0 2012. 2 Schirmer 2017, Water Reform: Socio-economic effects of investment in water infrastructure.3 RMCG 2016, Case studies to inform MERI for irrigation efficiency programs: Final report.4 AFR 2017, High-tech grads wanted to work with Australian farmers.
Case study
Irrigation Trust upgrade and modernisation –Renmark, SAProgram: South Australian River Murray Sustainability (SARMS) – Irrigation Industry Improvement Program (3IP)
Delivery Partner: Department of Primary Industries and Regions SA
Water returned: 3.5GL returned to MDB
Total project cost: $16.3 million
Project timeline: 26 months
Project includes
► 11km of new pipeline laid down.
► Nine major valves and flowmeters installed across three distribution mains.
► Technology upgrade including automated water scheduling service.
Benefits from project
► Pipeline expansion and upgrade has facilitated entry of new business into the Trust, with an expanded and more efficient water delivery network.
► Technology upgrades that enable automated scheduling service, allowing individual irrigators to improve on farm water use efficiency and reduce costs through remote monitoring and control.
► This drive for better efficiencies and better technology will give the Trust the ability to manage according to water demand and availability and make best use of network capacity.
Source: Email correspondence with PIRSA, 11th December 2017.
1 Terms of reference 7 Opportunities for efficiency ...2 Glossary 8 Cost of efficiency measures3 Executive summary 9 Principles for negating adv ...4 Introduction 10 A program to achieve 450 ...5 Potential socio-economic ... 11 Appendices6 Program design

Analysis of efficiency measures in the Murray-Darling Basin: Opportunities to recover 450GL in additional environmental water through efficiency measures by 2024, with neutral or positive socio-economic impacts | Page 131 of 307
19 January 2018 | Final Report
Socio-economic impact pathway 4: Impact on labour productivity and employment
5 Potential socio-economic impacts of efficiency measures
Off-farm
As outlined in Impact pathway 3, network charges may fall due to decreased operating costs, resulting from off-farm modernisation. Part of this is likely to come from reduced employment costs through systems automations and reduced repair and maintenance work.1 Marsden Jacobs and Associates defined this impact (and all on-farm impacts) as a net ‘neutral’ in the short run as they are offset by equivalent income increases by the irrigators. Further, there is no available evidence to suggest that these projects result in significant reductions in employment. However, it is noted that in in small communities, an adverse impact could be triggered through employment reductions of only a few workers.
Is farm employment correlated with agricultural production?
Impact pathway 2 outlined that it is likely to increase for modernised irrigators. To support this, additional employment may be required. This is supported by data from the NSW Department of Primary Industries Irrigators’ Survey, where in 2013, irrigators with larger volumes of water entitlements were more likely to employ non-family workers.2
Multiple analyses have also found that farm owners seek to maintain skilled workforces during periods of drought due to the difficulty and expense of replacing workers with specialised skills. As a result, farmers, especially those with large properties, tend to have ‘core’ teams of experienced workers that are scaled up as necessary to meet demand in productive seasons. KPMG estimated in their modelling of the economic impacts of water recovery scenarios that farmers tend to gradually add employees when their irrigated hectares exceed 50% of their property.
Conversely, KPMG estimated that a farm reaches its maximum employment when 80% of the property is under irrigation.3 For this reason, permanent labour is significantly less volatile than the number of hectares under irrigation.4 However,
this analysis is tempered by the relatively low proportion of farms employing labour (vis-à-vis owner operators).
As yet, there is no evidence to suggest that automation is a major factor in farm employment decisions.
Will increased on-farm output lead to an increase in the agricultural workforce?
Long-term employment outcomes cannot be assessed without knowing how the proceeds from infrastructure upgrade programs are invested. An analysis of the impact of on and off-farm efficiency measures in the Murrumbidgee area found that long-term employment was likely to increase by approximately 0.5% from the control scenario due to improved productivity.5 According to several case studies compiled by RMCG to examine the implementation of various automated irrigation systems, in most instances, and subject to other variables such as crop age, the new systems had boosted production yields.6 This increase in yield may generate a requirement for additional employment on-farm and/or in downstream industries. There is also evidence from stakeholders that increased production could lead to more opportunities for vertical integration (for instance, in supply chain and logistics). This could also lead to additional employment, in occupations outside agricultural workers.
Are employment impacts related to modernisation or efficiency measures programs?
Similar to impact pathways 1 and 2, if modernisation occurs without Commonwealth funding, any related employment changes may not represent distributional impacts of water efficiency programs. Instead, analysis turns to any differences between the two, such as the timeframe of upgrades and scale of construction funding.
1 MJA 2017. Economic effects of the Commonwealth water recovery programs in the Murrumbidgee Irrigation Area.2 NSW DPI 2013, Socio-economic monitoring of NSW Water Sharing Plans, Irrigators’ Surveys 2009/10 and 2013: A state wide comparison. 3 KPMG 2016, Northern Basin Community Modelling: Economic Assessment of Water Recovery Scenarios.4 Ibid.5 Op. Cit., MJA 2017.6 RMCG 2016. Case studies to inform MERI for irrigation efficiency programs: Final report.
1 Terms of reference 7 Opportunities for efficiency ...2 Glossary 8 Cost of efficiency measures3 Executive summary 9 Principles for negating adv ...4 Introduction 10 A program to achieve 450 ...5 Potential socio-economic ... 11 Appendices6 Program design

Analysis of efficiency measures in the Murray-Darling Basin: Opportunities to recover 450GL in additional environmental water through efficiency measures by 2024, with neutral or positive socio-economic impacts | Page 132 of 307
19 January 2018 | Final Report
What is the employment impact from infrastructure construction?
Under the Basin Plan, the Commonwealth has spent around $3.2 billion1 on infrastructure modernisation (both on and off-farm) in the Murray-Darling Basin. This modernisation has direct employment impact as infrastructure needs to be installed and commissioned during the construction phase. The required workers include electricians, logistics, machine operators, plumbers, engineers, technicians, labourers and builders.
According to the MJA report (2017), which modelled the impact of on and off-farm efficiency measures programs in the Murrumbidgee area, full-time local employment was estimated to have increased between 168 to 298 jobs by the end of the construction phase. Through the implementation phase, this was expected to reduce to an annual additional 75 to 112 full time equivalent jobs. Commonwealth expenditure for efficiency measures programs in the Murrumbidgee area was estimated to be $387.9m.2
Consequently, there is likely to be a medium term positive employment impact throughout the construction and implementation phases of efficiency programs.
Could there be a distributional labour impact?
The previous impact pathways have outlined how participating in on-farm efficiency projects could make irrigators more competitive, and cause an adverse disproportional impact to the marginal user (the identity of which is determined by the prevailing operating environment and other commodity-specific trends). This could manifest as a reduction in employment, if marginal users decrease production or exit.
The vulnerability of downstream industries was exemplified by SPC-Ardmona’s near collapse in 2014 from factors including an ongoing drought and the inability to trade necessary water entitlements.
This could cause flow-on employment impacts, including downstream industries (which particularly operate on economics of scale) and their workers. This could result in a permanent workforce reduction, impacting community economic and
social viability.
Impact pathway 2 identified that some dairy farmers may be marginal users. These irrigators, reported in the 2015-16 Wellbeing survey, being more likely to have reduced their hired workers than non-dairy farmers (34% compared to 10%) between 2014-15 and 2015-16. However, unmodernised dairy farmers were more likely to have reduced workers, 41% compared to around 32% percent of modernised (both with private funding and/or Commonwealth funding).3
Nevertheless, if improved water efficiency and enhanced labour productivity are directed towards increasing output, more part-time and seasonal employment may be generated across the agricultural and food manufacturing industries to bring that produce to market.
Socio-economic impact pathway 4: Impact on labour productivity and employment
5 Potential socio-economic impacts of efficiency measures
1.
1 As at 30 June 2017. See Chapter 7 for further information.2 MJA 2017. Economic effects of the Commonwealth water recovery programs in the Murrumbidgee Irrigation Area.3 Schirmer 2017; in the Regional Well Being Survey 2015-16 irrigators were asked whether they had reduced employed workers in the previous twelve months.
1 Terms of reference 7 Opportunities for efficiency ...2 Glossary 8 Cost of efficiency measures3 Executive summary 9 Principles for negating adv ...4 Introduction 10 A program to achieve 450 ...5 Potential socio-economic ... 11 Appendices6 Program design

Analysis of efficiency measures in the Murray-Darling Basin: Opportunities to recover 450GL in additional environmental water through efficiency measures by 2024, with neutral or positive socio-economic impacts | Page 133 of 307
19 January 2018 | Final Report
Socio-economic impact pathway 4: Impact on labour productivity and employment
5 Potential socio-economic impacts of efficiency measures 1 Terms of reference 7 Opportunities for efficiency ...2 Glossary 8 Cost of efficiency measures3 Executive summary 9 Principles for negating adv ...4 Introduction 10 A program to achieve 450 ...5 Potential socio-economic ... 11 Appendices6 Program design
Assessing the impact
Even before the MDBP’s introduction and the development of water efficiency measures, farm workers represented a relatively small proportion of total farm labour (with labour primarily supplied by owner operators). Increasing labour productivity is therefore more likely to reduce the total labour burden on irrigators (owner operators) rather than materially reducing employment. As a result, there is unlikely to be a significant impact on local employment arising from on-farm efficiency measures projects.
Further, farm owners may be generally disinclined to reduce their skilled workforces unless necessary for their financial survival. That is, farm labour employment may be less volatile than hectares under irrigation. Additionally, if participating irrigators increase their production, they may require more seasonal workers, increasing direct and indirect employment. The latter could be through downstream product manufacturing and processing or secondary industries like packing, transportation and logistics.
However, adverse distributional impacts may accrue to marginal irrigators, leading to reduced employment outcomes. This could occur if increasing competitive pressures lead to marginal users reducing or ceasing production. Downstream employment impacts may result as these irrigators are likely to produce the same types of commodities.
The extent to which this occurs as a result of efficiency measures programs is unclear because these irrigators, by definition, were already predisposed to be sensitive to any changes, particularly price increases. However, the Northern Basin communities which experienced the largest adverse impacts from the introduction of the Basin Plan (including Dirranbandi, Collarenebri and Warren), have demonstrated that the shortfall between held water entitlements and water needs has been the primary contributor to decline in economic output and employment, above automation of irrigation.1 The impacts of water buybacks on these communities were exacerbated by their reliance on water-intensive crops, especially cotton.2
In particular, stakeholders have advised that reduced employment (both immediate and in any associated agricultural services) leads to individuals and families leaving the district. This raises viability issues for communities with many marginal users, for instance:
► Employment ‘gaps’ resulting from non-agricultural workers leaving the community, such as the spouse of an agricultural worker. Potential (if local business profitability falls due to declining customers) 3 for further flow-on employment decreases.
► Economic impacts, such as increased costs for services and potentially reduced value of commercial and non-commercial property
► Social impacts, if community lifestyle decreases as a result of the reduced population. For instance, the loss of volunteer workers in sports clubs and schools, among other organisations. Additionally, the potential for increased mental health issues.
Program implications
The limited evidence suggests that on-farm labour productivity does not have a significant impact on employment and that at the community level construction spending will increase employment. However, distributional impacts as discussed in impact pathway 2 may arise. This may lead to an adverse impact on employment if the viability of particular industries is impacted (through impacts on marginal users). In addition, there may be a significant impact on employment in downstream industries where tipping points are reached and business viability is influenced. As a result of the limited data to fully understand this impact, program design has included the continuous monitoring of impacts. Furthermore, avoiding distributive impacts across industries and communities through program design will also negate labour impacts.
Some stakeholders suggested that while there were additional labour opportunities associated with the maintenance of new infrastructure, these employment opportunities required specific skills, many of which were not held by employees within the community. As a result, while opportunities were being created it was difficult for community members to take advantage of these. To enable communities to take advantage of these opportunities, programs can support the development of technical expertise and support services.
This approach to negate impacts is discussed further in Chapters 9 and 10.
1 ABC News 2017, Murray-Darling Basin Plan: Dirranbandi changes tack in fight for survival over water buybacks.http://www.abc.net.au/news/rural/2017-02-15/dirranbandi-water/8272292. 2 MDBA 2016. Northern Basin Review.3 ibid.

Analysis of efficiency measures in the Murray-Darling Basin: Opportunities to recover 450GL in additional environmental water through efficiency measures by 2024, with neutral or positive socio-economic impacts | Page 134 of 307
19 January 2018 | Final Report
Socio-economic impact pathway 4: Impact on labour productivity and employment
5 Potential socio-economic impacts of efficiency measures
ConclusionBased on the data available there is insufficient evidence to conclusively determine the net impacts on labour. However, available evidence suggests that labour productivity impacts are likely to be limited:
► The net reduction in labour resulting from on and off-farm efficiency measures is estimated to be small
► At the community level there are short to medium term benefits from the construction of infrastructure and longer-term potential benefits from maintenance of infrastructure.
The key factor to monitor is if the viability of particular industries is impacted (particularly through impacts on marginal users) and this results in long-term job losses.
Implications for program design
► Given the limited data and evidence, the impact on labour productivity and employment needs to be monitored on an ongoing basis with a particular focus on tipping points for industries.
► Whole of government approach to regional development, including development of employees with appropriate skills within communities (or the attraction of those people with required skills).
Feedback from stakeholders
The following points were expressed by stakeholders during consultations:
► Some regional communities are losing population (with simultaneous urbanisation of larger regional centres), as individuals leave the district due to the loss of jobs. Consequently, there is a further loss of associated services and potential growth. There is growing concern that those remaining will have to pay more for the remaining services, or travel greater distances to access them.
► Farmers are dependent on local community services. There is a need to generate economic activity with employment and in town services to keep family farms in operation as they work in conjunction.
► There is reduced demand for on-farm labour due to modernisation, and simultaneously a growing skill deficit in labour supply. However, different areas of the Basin have experience a net increase in employment.
► Family farms are moving away from labour due to the increase in costs, supply issues and HR concerns and are instead relying on family labour.
Source: Stakeholder consultations.
1 Terms of reference 7 Opportunities for efficiency ...2 Glossary 8 Cost of efficiency measures3 Executive summary 9 Principles for negating adv ...4 Introduction 10 A program to achieve 450 ...5 Potential socio-economic ... 11 Appendices6 Program design

Analysis of efficiency measures in the Murray-Darling Basin: Opportunities to recover 450GL in additional environmental water through efficiency measures by 2024, with neutral or positive socio-economic impacts | Page 135 of 307
19 January 2018 | Final Report
Socio-economic impact pathway 4: Impact on labour productivity and employment
5 Potential socio-economic impacts of efficiency measures
Limitations of quantitative assessment
It is difficult to make a quantitative assessment regarding the total change in the number of employed workers and contractors. Each individual farm or network participating in an efficiency measures program will have a different change in required workers because each type of project has a different implication for labour productivity.
► For on-farm projects, the individual scope for changes in production and potential for worker redeployment makes the final on-farm employment decision difficult to predict.
► For off-farm projects, there is little evidence regarding changes in employment – whether they be reduction or changes in skill requirements.
For a more quantitative analysis, more regular and granular community employment data (including industry and occupation of employment and qualification held along with further unemployment information and other data) would be required.
The issue of practical data monitoring is discussed in Chapter 10.
Case study Case study
Improved water security in Waverly, NSW
Outlet automation in Dairy
Steve Carolan operates a 109 hectare cotton farm in Waverley near Wee Waa.
As part of STBIFM the project, the existing siphon irrigation is replaced by pipes to the bank which includes:
► An automated structure feeding a secondary channel.
► Upgrading headditches to act as sub-supply channels.
► 75mm buried pipes to banks.
The benefits of the program include labour savings, flexibility in irrigation run times and adjusting irrigations flow rates to improve water efficiency.
“If the rest of the farm was set-up like this, we would have every paddock
‘turn-key’ ready to irrigate at any time”
Outlet automation has allowed Dehne, a dairy farmer, to convert 200 acres of unproductive land into production and simultaneously reduce labour costs. This flexibility has now allowed him to focus on other jobs on the farm.
“Automation has allowed me to eliminate the effect of over watering losses, which with high flows could
lose up to 40% of the water I put on.”
Source: Waterfind 2014, Waterfind & On-Farm, Issue 5, December.
Source: NSW DPI 2013, Sustaining the Basin: Irrigation Farm Modernisation (STBIFM) Program.
1 Terms of reference 7 Opportunities for efficiency ...2 Glossary 8 Cost of efficiency measures3 Executive summary 9 Principles for negating adv ...4 Introduction 10 A program to achieve 450 ...5 Potential socio-economic ... 11 Appendices6 Program design

Analysis of efficiency measures in the Murray-Darling Basin: Opportunities to recover 450GL in additional environmental water through efficiency measures by 2024, with neutral or positive socio-economic impacts | Page 136 of 307
19 January 2018 | Final Report
The impact of urban and transformational projects5 Potential socio-economic impacts of efficiency measures
Urban water projectsUrban water projects enhance the sustainability and resilience of water supply services to communities. Two key types of urban water projects have been considered – those which provide delivery efficiencies and those which reduce the volume of river water required to meet user's needs.
Urban projects which provide delivery efficiencies are akin to off-farm projects, reducing evaporation and seepage losses. Urban projects which reduce the volume of river water required to meet users' needs include projects which entail the development of alternate sources of water (such as desalination) or projects which recycle water (as shown in the diagram).
Urban projects generally involve significant upfront capital expenditure and as such usually would not be undertaken in the absence of government support for long periods into the future. They may also involve significant operating costs which need to be considered when assessing viability.
These projects do not impact on the productive pool and as such do not adversely impact on production, irrigators or irrigation networks. They may have positive social and health benefits on communities through improved water security, supply and enhanced water quality. In addition, some urban water projects (such as the development of locally integrated systems), have significant liveability, environmental and urban amenity benefits.
Transformational projectsTransformational projects are non-traditional approaches to water efficiency that enhance productivity and provide means to innovate current methods of production, or provide routes to alternative industries.
Since these projects are bespoke, broadly defined and diverse in nature, an assessment of the associated socio-economic impacts is not possible. As such, each project should be considered based on its individual characteristics whilst giving consideration to the operating environment in which it will be implemented, including network, industry and community considerations.
For more information, refer to Chapter 6.
Centralised systems Locally integrated systems
Piped watersupply
InfiltrationSewage & greywater
Stormwaterrunoff
Drinking water
IrrigationRecycled water
Wetlands
Evaporation Evaporation
Infiltration
Stormwaterrunoff
Piped watersupply
Sewage & greywater
Source: EY analysis.
Conclusion
► Urban projects have significant positive impacts for communities and do not adversely impact on irrigators or irrigation networks.
► The case for urban projects needs to ensure ongoing operating costs are included assessing project viability.
► Transformational projects are bespoke projects and could have a range of socio-economic impacts.
► Given the diverse nature of transformational projects, an assessment of the socio-economic impacts is required for each type of project being considered.
1 Terms of reference 7 Opportunities for efficiency ...2 Glossary 8 Cost of efficiency measures3 Executive summary 9 Principles for negating adv ...4 Introduction 10 A program to achieve 450 ...5 Potential socio-economic ... 11 Appendices6 Program design

Analysis of efficiency measures in the Murray-Darling Basin: Opportunities to recover 450GL in additional environmental water through efficiency measures by 2024, with neutral or positive socio-economic impacts | Page 137 of 307
Program design
6
In this section Page
Overview 138
Key findings 139
Types of projects and implications for program design 141
Lessons from on-farm programs 142
Lessons from off-farm programs 144
Profile of on-farm modernisation program participants 145
Implementing design principles 147
Unfair advantage 150

Analysis of efficiency measures in the Murray-Darling Basin: Opportunities to recover 450GL in additional environmental water through efficiency measures by 2024, with neutral or positive socio-economic impacts | Page 138 of 307
19 January 2018 | Final Report
Overview6 Program design
Objective of water efficiency program Program design considerations Key lessons from previous programs
► Recover 450GL by 2024 with neutral or improved socio-economic outcomes.
► Deliver improved environmental outcomes.► Deliver the efficiency programs cost effectively.► Improve on and off-farm productivity, as well as water
efficiency.
► Most stakeholders agree that it will be challenging to recover 450GL and that the program needs to be flexible on eligible projects.
► A program that funds different types of projects will need to consider tailoring information requirements and assessment criteria for different types of projects, suitable delivery partner expertise and adequate resources for program administration and development.
► Fast approval times to reduce uncertainty.► Transparency in the assessment of projects to promote
trust.► Flexibility in types of projects that could be considered
encourages innovation and engages a wider range of participants.
► Local knowledge and tailoring project plans to the local area is important to the success of the project, and engaging the community.
► Benefit in obtaining input from independent specialists in the planning stages of projects, to ensure the appropriate project is specified.
Program design principles Profile of program participants
► Use of market and industry experience.► Sharing of knowledge.► Transparency.► Easy to understand assessment criteria.► Encourage or improve productivity with neutral or
positive socio-economic impact.► Streamlined processing.► Accountability.► Value for money.
► Based on survey results summarised in Schirmer (2017):► Demographic of participants: on-farm infrastructure
modernisation is more likely to be completed by full-time educated irrigators under the age of 65 with larger turnover and volumes of water entitlements.
► Demand for on-farm efficiency programs: about 50% of irrigators surveyed in the Basin have plans to modernise on-farm infrastructure in the next five years.
1 Terms of reference 7 Opportunities for efficiency ...2 Glossary 8 Cost of efficiency measures3 Executive summary 9 Principles for negating adv ...4 Introduction 10 A program to achieve 450 ...5 Potential socio-economic ... 11 Appendices6 Program design

Analysis of efficiency measures in the Murray-Darling Basin: Opportunities to recover 450GL in additional environmental water through efficiency measures by 2024, with neutral or positive socio-economic impacts | Page 139 of 307
19 January 2018 | Final Report
Key findings6 Program design
6.1 Program design principles
Key principles to guide program design based on lessons from previous infrastructure programs
► Use of market and industry experience.
► Sharing of knowledge.
► Transparency.
► Easy to understand assessment criteria.
► Encourage or improve productivity with neutral or positive socio-economic impact.
► Streamlined processing.
► Accountability.
► Value for money.
6.2 Program design considerations
Key considerations for designing a program to recover 450GL of water
► Information requirements – consider the level of technical information required for different types of projects and limited requirements for smaller projects or traditional on-farm infrastructure projects.
► Assessment criteria and process – projects should be separated into different streams to allow tailored assessment criteria and streamlined processing.
► Delivery partner and independent assessor expertise – a panel of suitably qualified delivery partners and independent assessors need to be established and include expertise that will be able to handle a wider range of eligible projects.
► Resources for program administration and development – the program administrator needs to be resourced with adequate staff that can deal with different types of projects. Some projects may also require resources to initially develop the concept, knowledge and interest with stakeholders, who may be suffering from reform fatigue and lack trust.
1 Terms of reference 7 Opportunities for efficiency ...2 Glossary 8 Cost of efficiency measures3 Executive summary 9 Principles for negating adv ...4 Introduction 10 A program to achieve 450 ...5 Potential socio-economic ... 11 Appendices6 Program design

Analysis of efficiency measures in the Murray-Darling Basin: Opportunities to recover 450GL in additional environmental water through efficiency measures by 2024, with neutral or positive socio-economic impacts | Page 140 of 307
19 January 2018 | Final Report
Key findings6 Program design
6.3 Unfair advantage
Program design to ensure no unfair advantage
► There is no unfair advantage where program participants purchase additional water on the market due to benefits received from participation, where the program is open to all. However, some farmers may not be able to participate in on-farm programs as they do not hold adequate water entitlements or have limited access to capital.
► It is important the funding provided by the Commonwealth is invested in water efficiency projects (i.e. productive investments, not buybacks)
► To ensure equity, where irrigators buy entitlements to transfer to the Commonwealth under an efficiency program, the following can be implemented:
► Funds are disbursed in instalments with full payment upon evidence of works being close to completion
► Regular check points with participants throughout the implementation of project
► Establish a monitoring and evaluation framework for the program
► Provide irrigators with the tools to plan and chose options that best fit with their business
► Use of an expert technical panel to provide recommendations on project viability.
1 Terms of reference 7 Opportunities for efficiency ...2 Glossary 8 Cost of efficiency measures3 Executive summary 9 Principles for negating adv ...4 Introduction 10 A program to achieve 450 ...5 Potential socio-economic ... 11 Appendices6 Program design

Analysis of efficiency measures in the Murray-Darling Basin: Opportunities to recover 450GL in additional environmental water through efficiency measures by 2024, with neutral or positive socio-economic impacts | Page 141 of 307
19 January 2018 | Final Report
Types of projects and implications for program design6 Program design
The following are key types of infrastructure projects implemented as part of water efficiency programs, with a complete list of notified efficiency measures listed in Appendix C:
1. Traditional on-farm water efficiency projects
► Redevelop surface irrigation (e.g. change an irrigation layout or to move from gravity-fed to sprinkler/spray systems)
► Laser levelling land to use water more efficiently and to reduce labour.
► Upgrade reticulation system and pumping station.
► Storage dam and reuse system.
► Pipeline for stock and domestic water delivery.
2. Traditional off-farm water efficiency projects
► Replace open channel systems with piped ones.
► Install automated and accurate metering and flow regulation.
► Rationalisation program to include provision of funds for alternative infrastructure (e.g. conversion to dryland).
► Sub-system reconfiguration, for example to deliver stock and domestic water via a piped system rather than by open channel. Also sub-system retirement which sees the involved irrigators moving completely to bore operations and/or storages or converting to dryland farming.
3. Urban and industrial projects
► Water recycling plant.
► Storm water recycling.
► Urban efficiency projects (e.g. leakage reduction).
► Demand management.
4. Other projects that improve on-farm productivity
Infrastructure or activities that maintain or improve agricultural production and/or productivity. For example:
► Changes to on-farm management practices. For example dairy farms, changing from pasture to grain fed. The change in practice means less water is used, greater control over the feed and higher conversion from input to output.
► Use of technology to improve both production and water productivity. For instance:
► use of netting to reduce evaporation and improve production
► the use of accelerometers and pedometers, for precision dairy cattle monitoring.
► Changing to lower water use crops.
Implications for program designProjects will differ by type and size and call for different:
► Information requirements, for example traditional on-farm projects may require less technical detail than new business model transformation projects.
► Assessment criteria and process, for example guidance on projects that would be eligible may be less well defined for new productivity improvement projects. Also anticipated water savings would be less understood for new productivity improvement projects.
► Importance of delivery partner expertise.
Feedback from stakeholders
The following points were expressed by stakeholders during consultations:
► There is desire for flexibility in the types of project that could be funded, including business transformation projects.
► There is some demand from irrigators for funding to exit the industry.
► There are some smaller irrigation networks that have not participated in infrastructure modernisation works previously that could benefit from funding to upgrade current infrastructure. Also, there is the opportunity to combine on and off-farm projects to better allow the irrigation network to be rationalised.
Source: Stakeholder consultations.
1 Terms of reference 7 Opportunities for efficiency ...2 Glossary 8 Cost of efficiency measures3 Executive summary 9 Principles for negating adv ...4 Introduction 10 A program to achieve 450 ...5 Potential socio-economic ... 11 Appendices6 Program design

Analysis of efficiency measures in the Murray-Darling Basin: Opportunities to recover 450GL in additional environmental water through efficiency measures by 2024, with neutral or positive socio-economic impacts | Page 142 of 307
19 January 2018 | Final Report
Lessons from on-farm programs6 Program design
Feedback in relation to on-farm infrastructure programs
Feedback from current and previous on-farm program participants and delivery partners and a variety of government, industry and community stakeholders was sought by DAWR in setting up the Commonwealth On-Farm Further Irrigation Efficiency (COFFIE) program. COFFIE was set up to help irrigators improve the efficiency of their on-farm water use to help in recovering the 450GL of water under the Basin Plan. A pilot is currently underway in SA to test the design of the program.
Key feedback received from stakeholders included:
► Strong support for adoption of a contemporary/current water price, and mixed support for publicly advertising the water price offered for project funding (with those against believing it would increase supplier quotes).
► Concern that the 1.75 market multiple is too low.
► Support for broadening the eligible activities to include stock and domestic pipelines, groundwater access and solar equipment
► Uncertainty regarding the requirement to return all of the technically feasible minimum water savings from a project, in terms of what this actually meant, and also whether this would be seen as value for money or put irrigators at risk if savings were not achieved.
► Support for ongoing project approval and fast approval time.
► Concern delivery partners will not be able to bundle projects of different values to average costs, which provided flexibility for delivery partners, has been removed.
The key features of COFFIE and how it compares to other programs are listed on the following page.
How is OFIEP administered?
► Proposals are assessed in funding rounds (time constrained).
► Delivery partners put forward an initial bid, if approved, the delivery partners then submit a detailed individual irrigator project for second stage assessment.
► Bids that offer the greatest value for money are chosen within the funding envelop available in each round (i.e. it’s a competitive process). This can mean irrigators are often involved in multiple applications with different delivery partners and accept the best bid, leaving delivery partners to find other ways of fulfilling the original approved bid. This risk is conveyed to delivery partners prior to applying to OFIEP rounds.
► Market price was historically not provided to delivery partners (except in round 5, and this was provided after stage one assessment had been completed).
► A project may take between 12 to 18 months from commencement of round to final approval.
► Delivery partners can bundle smaller/less expensive projects with larger/more expensive projects to provide a competitive bid to DAWR.
► Water savings are shared between the irrigator and the Commonwealth.
Previous and current on-farm programs have provided lessons for future design. The On-Farm Irrigation Efficiency Program (OFIEP) is an example of a previous program to date, from which lessons can be derived.
1 Terms of reference 7 Opportunities for efficiency ...2 Glossary 8 Cost of efficiency measures3 Executive summary 9 Principles for negating adv ...4 Introduction 10 A program to achieve 450 ...5 Potential socio-economic ... 11 Appendices6 Program design

Analysis of efficiency measures in the Murray-Darling Basin: Opportunities to recover 450GL in additional environmental water through efficiency measures by 2024, with neutral or positive socio-economic impacts | Page 143 of 307
19 January 2018 | Final Report
Lessons from on-farm programs6 Program design
► Project proposals can be submitted at any time for approval. OFIEP have funding rounds.
► Project proposals are not subject to a competitive assessment process.
► Water entitlement price and funding multiple are advertised by the Department on a regular basis.
► Delivery partners assist irrigators with developing project ideas and application for funding. Delivery partners are required to advertise their administration fees to irrigators unlike OFIEP.
► An independent accredited irrigation professional is used to assess the technical feasibility of a proposed project when it is submitted. OFIEP had a panel to do assessment of all projects for each round.
► Projects offer for transfer no more than the conservatively estimated water savings, with surplus savings retained by the irrigator
► Non-irrigation equipment and structures which increase on-farm productivity may be funded in combination with water saving infrastructure and activities.
► Energy-saving equipment (such as solar panels and batteries) may be funded if associated with the project.
► The delivery partner works with the irrigator to submit a fully developed and costed proposal, and a response is provided within 10 business days. If approved, water entitlements and funds are then exchanged. There is reduced requirement to provide technical details of the project and financial records.
Key features of COFFIE and how it compares to other programs Conclusions
The Key lessons from other programs that have been incorporated into COFFIE are:
► Fast approval times
► Transparent use of market price and funding multiple
► Reduced requirement for detailed technical information and financial records.
1 Terms of reference 7 Opportunities for efficiency ...2 Glossary 8 Cost of efficiency measures3 Executive summary 9 Principles for negating adv ...4 Introduction 10 A program to achieve 450 ...5 Potential socio-economic ... 11 Appendices6 Program design

Analysis of efficiency measures in the Murray-Darling Basin: Opportunities to recover 450GL in additional environmental water through efficiency measures by 2024, with neutral or positive socio-economic impacts | Page 144 of 307
19 January 2018 | Final Report
Lessons from off-farm programs6 Program design
1 Goulburn Murray Water 2016, Connections Project Reset Delivery Plan Summary, 2 Coleambally Irrigation 2016, CICL Round 2 Private Irrigation Infrastructure Operators’ Program, 3 Examples of off-farm projects that were undertaken is discussed on the previous page, and listed in Appendix J. Chapter 7 outlines some of the specific off-farm programs undertaken in each state.
In developing program design principles, there are lessons to be obtained from existing programs3.
GMW Connections Project1
► Importance of clear definition of project scope and objectives.
► A clear and consistent communication strategy and the importance of stakeholder consultations.
► Importance of an experienced project team and clear governance structures for managing the project.
► Significant time is needed to overcome the difficulty in reaching agreements with landowners.
► Importance of local knowledge and tailoring project plans to the local area.
Private Irrigation Infrastructure Operators Program – PIIOP)2
► Benefit in obtaining input from independent specialists in the planning stages of the project.
► The importance of working with contractors that have proven experience in working with the IIO where there are tight deadlines involved.
► Direct action undertaken to address concerns of impacted parties, including structural adjustment (e.g. support for fencing) as well as other works, particularly stock and domestic water provision to achieve support.
► Developing infrastructure upgrades as a holistic
package enabling both on and off-farm work to be undertaken with significant synergies between the two.
► Significant time was needed to achieve buy in by all stakeholders, comprising 2-3 years of discussions with meetings as often as every two weeks in a variety of environments (including on-farm) to discuss concerns and explain the project.
► Where rationalisation of the system is planned, affected users were heavily involved in the process from planning to execution.
► Further work could be undertaken in promoting successful projects to incentivise other similar projects to be undertaken.
► Early engagement with the irrigation infrastructure operator (IIO) and industry on the design of the program.
► Understanding of tax implications and IIO’s operating processes before program roll out.
► Provide some flexibility in variations that could occur without lengthy approval processes.
► Technical specialists engaged by government agencies to assist in the program should have direct access to IIOs.
► Two stage process to assess IIO bids has worked well. The process means that an IIO does not need to submit a fully developed business case in the first stage. A more developed business case is only
submitted once there is an indication that the project proceed to next stage assessment.
► On-farm works should be allowed to be included in IIO proposals for off-farm projects as there are benefits from undertaking on and off-farm projects in an integrated fashion.
► Flexibility in the types of projects that would be eligible, including value adding joint proposals between IIO and industry.
Conclusions► The importance of a clear and consistent
communication strategy and stakeholder consultations.
► The time needed and difficulty in reaching agreements with landowners. Also time needed to develop projects.
► Importance of local knowledge and tailoring project plans to the local area.
► Benefit in obtaining input from independent specialists in the planning stages of the project.
► Early engagement of IIOs to develop program design elements.
► Two stage assessment process important so that IIOs only spend time developing a detailed business case once they receive the go-ahead from the first round assessment.
1 Terms of reference 7 Opportunities for efficiency ...2 Glossary 8 Cost of efficiency measures3 Executive summary 9 Principles for negating adv ...4 Introduction 10 A program to achieve 450 ...5 Potential socio-economic ... 11 Appendices6 Program design

Analysis of efficiency measures in the Murray-Darling Basin: Opportunities to recover 450GL in additional environmental water through efficiency measures by 2024, with neutral or positive socio-economic impacts | Page 145 of 307
19 January 2018 | Final Report
Profile of on-farm modernisation program participants6 Program design
ConclusionsProfile of participants: on-farm infrastructure modernisation is more likely to be completed by full-time educated irrigators under the age of 65 with large turnover and large volumes of water entitlement. They are more likely to be rice growers, vegetable growers or dairy farmers, and live in MIL, MIA or GMID areas.
Demand for efficiency programs: about 50% of irrigators surveyed in the Basin have plans to modernise on-farm infrastructure in the next five years.
of Basin irrigators have reported modernising their on-farm infrastructure since 2008. Although not all irrigation districts have experienced such high rates of modernization.
56%
Wellbeing Surveys from 2014 to 2016 and Schirmer (2017), which surveyed over 1,000 irrigators in the Basin, found:
of those who modernised reported receiving a grant, and around 47% who received a grant used a combination of self-funding, loans and grant funds. Irrigators who used a grant were more likely to undertake larger scale works, and the grant enabled work to happen more rapidly.
36%
► Had larger turnover (gross value of agricultural production)
► Used larger volumes of irrigation water,
► Did not have off-farm work
► Were rice growers, vegetable growers or dairy farmers
Those who were more likely to upgrade: ► Lived in Murray Irrigation Ltd (MIL), MurrumbidgeeIrrigation Area (MIA) or Goulburn-Murray Irrigation District (GMID)
► whereas those in the Northern Basin and Lower Murray/Western Murray irrigation regions were less likely to have modernized
► Were younger than 65
► Had completed year 12 or higher levels of education attained.
of irrigators reported they planned to modernise/upgrade in the next 2 years, and 24% in 3-5 years' time, while 52% had no plans to modernise or upgrade their on-farm water infrastructure in the next five years. 24%
Who would likely invest in on-farm modernisation in the future?
► Have already modernised water infrastructure (since 2008)
► Live in MIA or MIL, and were not located in Queensland or Victoria
► Be engaged in cropping for grain, oilseeds, rice and cotton (60%)
Those planning on investing are more likely to:
► Use more water (those planning to modernise in the next two years used an average of 300ML of irrigation water in the 2015 water year, compared to an average of 80ML for those who had no plans to modernise)
► Own a larger farm - in terms of area, water use and turnover (the median farm size of those planning to modernise in the next two years was 330 hectares compared to 117 hectares for those not planning to modernise).
► Be younger farmers (45% of those who had no plans to modernise in the next 5 years were aged 65 or older)
► With little off-farm employment (37% of those who had no plans to modernise earned more than half their household income off the farm)
1 Terms of reference 7 Opportunities for efficiency ...2 Glossary 8 Cost of efficiency measures3 Executive summary 9 Principles for negating adv ...4 Introduction 10 A program to achieve 450 ...5 Potential socio-economic ... 11 Appendices6 Program design

Analysis of efficiency measures in the Murray-Darling Basin: Opportunities to recover 450GL in additional environmental water through efficiency measures by 2024, with neutral or positive socio-economic impacts | Page 146 of 307
19 January 2018 | Final Report
Profile of on-farm modernisation program participants6 Program design
ConclusionsKey barriers to program participation include cost, complexity, perceived risk and lack of time and trust.
Profile of participants: those who have already undertaken on-farm modernisation, were also more likely to engage in non-infrastructure modernisation (e.g. timing of water delivery) to increase productivity.
The Wellbeing Surveys from 2014 to 2016 and Schirmer (2017), have identified multiple factors which will influence the adoption of new technologies and practices:
► Cost: The financial burden of adapting, and upfront contributions required may limit the capacity of some irrigators to participate. In particular, for younger and smaller irrigators. Younger farmers are typically burdened with higher debt, and fewer assets to borrow against.
► Complexity: Complexity in applying for access, adopting new practices or in the reporting requirements of the programs.
► Time: Limited time of irrigators (who may work on and off-farm) give them limited capacity to engage with efficiency measures and implement the opportunities.
► Trust: The confidence of farmers in the efficiency measure being a “good” thing for their farm is limited to due to historical distrust of some delivery organisations.
► Risk and resilience: The perceived risk of adoption may limit the likelihood of action.
34% of those who have already modernised on-farm infrastructure were more likely to change timing of water delivery, 48% were located in the Lower Murray/Western Murray Irrigation region, 28% were under 50, with 18% older than 65, had larger farms, 31% of both groups were dairy farmers or grain/oilseed/cotton growers.
Based on Schirmer (2017), there were irrigators who participated in efficiency measures other than infrastructure modernisation.
► In the MIA and MIL regions (16% in each)
► Where on-farm infrastructure modernisation has already occurred
► Under the age of 65 with larger farms
► Grain/oilseed/cotton/rice growers.
Changing timing of crop seeding/planting were more likely to be conducted by those:
Changing use of inputs other than water (e.g. soil or fertiliser) was more often done by:
► Those who had modernised their on-farm infrastructure
► Irrigators under the age of 50 with larger farms.
Switching to more water-efficient crop or pasture varieties were more likely done by those:
► Who had modernised their on-farm infrastructure
► Who were under the age of 50 with larger farms, and were dairy farmers.
Changing intensity of crop seed/planting was:
► More likely conducted by those in MIL
► More likely conducted by those already upgraded on-farm infrastructure, aged under 50 with larger farms.
Non-infrastructure options to improve productivity
1 Terms of reference 7 Opportunities for efficiency ...2 Glossary 8 Cost of efficiency measures3 Executive summary 9 Principles for negating adv ...4 Introduction 10 A program to achieve 450 ...5 Potential socio-economic ... 11 Appendices6 Program design

Analysis of efficiency measures in the Murray-Darling Basin: Opportunities to recover 450GL in additional environmental water through efficiency measures by 2024, with neutral or positive socio-economic impacts | Page 147 of 307
19 January 2018 | Final Report
Implementing design principles6 Program design
Key design principles, based on lessons from COFFIE and stakeholder feedback are outlined below. Also outlined below are consideration for implementing the program design principles for a water efficiency program.
Recommendations for investing in program success and mitigation measures are discussed in Chapter 10.
Implementing design principlesPrinciple Design considerations On-farm Off-farm
Use of market and industry experience
► Use a panel of delivery partners with different areas of expertise and industry knowledge.
► Use of a panel of qualified independent experts to assess the proposed level of water recovery on projects.
► Use of consultancy panels.
► Provide seed funding for consultancy panels to develop ideas.
Sharing of knowledge
► Part of program funding can be used to enable delivery partners or consultants to run community workshops to share knowledge from efficiency programs and/or knowledge sharing outlets (e.g social networking, websites).
► Undertake extension programs - advice and training programs for farmers, for example on how to get the most out of existing and new infrastructure.
► Regularly engage with industry groups to gain feedback and improve on program delivery.
Easy to understand assessment criteria
► Develop assessment criteria in conjunction with industry representatives to ensure it is practical and easy to understand.
► Clearly set out by different project streams, for example, on-farm, off-farm projects, and urban project.
► For new productivity improvement projects, set out the information requirement, key factors that will be assessed and how they will be assessed.
Importance of delivery partners
Delivery partners under COFFIE and OFIEP are responsible for developing project proposals with irrigators and submitting a proposal that meets the program requirements in terms of technical and financial detail. Delivery partners can be industry bodies, consultants or government organisations. Smaller organisations (e.g. Indigenous groups) may also be encouraged to become delivery partners, as per our stakeholder consultations.
Delivery partners are important to the program design as they can provide independent expertise and remove some of the administrative burden for the program administrator in dealing with a large number of proponents. Specifically:
► They can identify opportunities for water recovery
► They provide the financial and technical support to irrigators to develop a project
► They can be part of a network that shares knowledge and learnings from efficiency projects, as well as foster interest in improving productivity.
Given the critical role of delivery partners, it is important that adequate due diligence is conducted before delivery partners are added to a panel. This could include1:
► Disclosure of financial interests (e.g. water entitlements)
► Disclosure of conflict of interest
► At least two referees/references
► Qualifications and experience of key personnel, for example engineering degree and practical irrigation experience
► Financial viability.
1 These due diligence requirements are consistent with the requirements under the COFFIE program.
Source: EY analysis.
1 Terms of reference 7 Opportunities for efficiency ...2 Glossary 8 Cost of efficiency measures3 Executive summary 9 Principles for negating adv ...4 Introduction 10 A program to achieve 450 ...5 Potential socio-economic ... 11 Appendices6 Program design

Analysis of efficiency measures in the Murray-Darling Basin: Opportunities to recover 450GL in additional environmental water through efficiency measures by 2024, with neutral or positive socio-economic impacts | Page 148 of 307
19 January 2018 | Final Report
Implementing design principles6 Program design
Implementing design principles (cont’d)
Principle Design considerations On-farm Off-farm
Streamlined processing
► A variety of independent assessors with the relevant areas of expertise need to be established to assess different types of projects.
► Different assessment processes could apply to different sized projects. For example, small to medium sized traditional infrastructure projects below $1 million, where there is a well understood relationship between change in infrastructure and water savings, could require less technical and financial detail.
► For larger projects, there needs to be clear guidelines on the information requirement and assessment criteria. A multi-stage process that asks for greater level of information to support the business case as projects proceed past initial assessments would ease the burden on proponents. There also needs to be appropriately skilled independent assessors to review projects efficiently.
► For minor changes in project scope that can be justified, a reduced approval process.
Accountability ► Funds are disbursed in instalments with full payment upon evidence of works being close to completion.
► Regular check points with participants throughout the implementation of project.
► Establish a monitoring and evaluation framework for the program.
Source: EY analysis. Source: Stakeholder consultations.
Feedback from stakeholders
The following points were expressed by stakeholders during consultations:
► Irrigators should manage subcontractors on projects as they own the infrastructure and to encourage them to find the best value subcontractor.
► Irrigators would like the ability to lease back the water returned to the government after participating in a program. So that they can transition to a new model of operation without increased exposure to the water market.
► A reduction in red tape and complexity of the application process is desired.
► Qualified experts in providing assistance in understanding the best options for the farmer and for business case development are good.
► Delivery partners are important in identifying and developing projects due to their technical skill set and knowledge of the process.
► Short approval times are important to remove uncertainty.
► Transparency of pricing and funding is important to allow equal access to information.
► Education for irrigators on how to use upgraded irrigation infrastructure to achieve best results.
► Experience and knowledge from on-farm improvements could be better shared to increase participation on efficiency programs.
► There is a need to consider regional development and community based programs alongside efficiency projects.
1 Terms of reference 7 Opportunities for efficiency ...2 Glossary 8 Cost of efficiency measures3 Executive summary 9 Principles for negating adv ...4 Introduction 10 A program to achieve 450 ...5 Potential socio-economic ... 11 Appendices6 Program design

Analysis of efficiency measures in the Murray-Darling Basin: Opportunities to recover 450GL in additional environmental water through efficiency measures by 2024, with neutral or positive socio-economic impacts | Page 149 of 307
19 January 2018 | Final Report
Implementing design principles6 Program design
Implementing design principles (cont’d)
Principle Design considerations On-farm Off-farm
Encourage or improve productivity with neutral or positive socio-economic impact
► Provide irrigators with the tools to plan and chose options that best fit with their business.
► Flexibility in the types of projects that would be eligible and the type of water entitlements that could be transferred.
► Program design to consider regional development projects to offset any adverse impacts.
► No minimum irrigator contribution required.
► Ability to lease back water from the Commonwealth after an efficiency project for a limited period of time.
Value for money ► Project assessment includes comparison of proposed cost against similar projects previously delivered1.
► Program participants have a choice of delivery partners and the cost of delivery partners are advertised.
► Use of a competitive bid/auction process for large projects2.
Transparency ► Regularly advertise the water market price applicable in a catchment and the associated funding multiple.
Source: EY analysis.
Source: Stakeholder consultations.
1 This comparison is intended for internal data collection and monitoring. For use of the government, opposed to a competitive mechanism.2 For more detail see Chapter 10.
Feedback from stakeholders
The following points were expressed by stakeholders during consultations:
► Flexibility in the type of projects that could be funded and the way the projects are administered is recommended.
► Flexibility in the type of entitlements that would be eligible. Further, if an irrigator has multiple properties with water entitlements attached, flexibility in where the works are undertaken.
► Anecdotal evidence of farmers taking advantage of arbitrage opportunities by purchasing water entitlements on the market and transferring entitlements to the Commonwealth at a profit through participating in efficiency programs.
► Funds for program participants should only be transferred once there is evidence that on-farm works have begun.
► The delivery partner should be at arm's length of the negotiations between the supplier and irrigator.
► There should be post-project checks to understand works undertaken and the impact on-farm operations and water use.
1 Terms of reference 7 Opportunities for efficiency ...2 Glossary 8 Cost of efficiency measures3 Executive summary 9 Principles for negating adv ...4 Introduction 10 A program to achieve 450 ...5 Potential socio-economic ... 11 Appendices6 Program design

Analysis of efficiency measures in the Murray-Darling Basin: Opportunities to recover 450GL in additional environmental water through efficiency measures by 2024, with neutral or positive socio-economic impacts | Page 150 of 307
19 January 2018 | Final Report
Unfair advantage6 Program design
Under the Terms of Reference, EY was required to address whether the design of the program is robust to ensure that participants are not able to gain an unfair advantage through subsequent market participation.
Unfair advantage through subsequent market participation
From discussions with stakeholders, unfair advantage in the context of the Terms of Reference could occur under two main scenarios:
► Scenario 1: program participants purchase additional water on the market due to the benefits achieved from participation.
► Scenario 2: irrigators buy entitlements to transfer to the Commonwealth under an efficiency program, but do not undertake suitable infrastructure works.
In the first scenario, program participants are able to achieve productivity gains and as a consequence purchase water entitlements or allocations to allow expansion of their operations. This does not constitute an unfair advantage. Efficiency programs are or should be available to all individuals and businesses to participate.
During consultation, stakeholders raised concerns that some farmers may not be able to participate in on-farm programs as they do not hold adequate water entitlements or have limited access to capital. It is noted that under the COFFIE pilot in SA, the minimum amount of water savings required is 2ML, although it is intended that the minimum under a full program would be 10ML.
In the second scenario, there are program design elements that can be implemented to overcome this concern. As suggested by stakeholders, the following measures can be implemented to overcome concerns relating to unsuitable infrastructure works being implemented:
► Funds are disbursed in instalments with full payment upon evidence of works being close to completion.
► Regular check points with participants throughout the implementation of project.
► Community led economic development projects
► Establish a monitoring and evaluation framework for the program.
► Provide irrigators with the tools to plan and chose options that best fit with their business.
► Use of an expert technical panel to provide recommendations on project viability.
Recommendations in relation to the above program design elements are further discussed in Chapter 10.
ConclusionsThere is no unfair advantage where program participants purchase additional water on the market due to productivity benefits from participation. However, some irrigators may not be able to participate due to limited water entitlements or access to capital
Where irrigators buy entitlements to transfer to the Commonwealth under an efficiency program, but do not undertake suitable infrastructure works, the following can be implemented to overcome these concerns:
► Funds are disbursed in instalments with full payment upon evidence of works being close to completion.
► Regular check points with participants throughout the implementation of project.
► Establish a monitoring and evaluation framework for the program.
► Provide irrigators with the tools to plan and chose options that best fit their business.
► Use of an expert technical panel to provide recommendations on project viability.
1 Terms of reference 7 Opportunities for efficiency ...2 Glossary 8 Cost of efficiency measures3 Executive summary 9 Principles for negating adv ...4 Introduction 10 A program to achieve 450 ...5 Potential socio-economic ... 11 Appendices6 Program design

Analysis of efficiency measures in the Murray-Darling Basin: Opportunities to recover 450GL in additional environmental water through efficiency measures by 2024, with neutral or positive socio-economic impacts | Page 151 of 307
Opportunities for efficiency projects
7
In this section Page
Overview 152
Key findings 153
Potential efficiency opportunities - overview 155
Methodology and considerations 156
Overview of existing and prior efficiency programs 157
Opportunities in large catchments 158
Opportunities in medium catchments 163
Opportunities for integration of on and off-farm projects 166
Opportunities in small catchments 167
Other opportunities to improve on-farm efficiency 169
Opportunities for urban and industrial projects 170
Improvements to notified efficiency measures 177
How to ensure efficiency measures do not impede focus on bridge the gap efforts 178

Analysis of efficiency measures in the Murray-Darling Basin: Opportunities to recover 450GL in additional environmental water through efficiency measures by 2024, with neutral or positive socio-economic impacts | Page 152 of 307
19 January 2018 | Final Report
Overview7 Opportunities for efficiency projects
Estimating scope for future opportunities Future Off-farm opportunities Future On-farm opportunities
► In estimating the potential future efficiency opportunities, EY has used data sourced from stakeholders and publicly available sources.
► Estimates of potential future efficiency opportunities have been provided for indicative purposes, based on available data on historical water recoveries.
► Further analysis is required as part of implementing a water recovery program and as part of an ongoing monitoring and evaluation framework. This is also discussed in Chapter 10.
► Medium to large IIOs consulted in NSW, QLD, VIC have put forward off-farm opportunities that are likely to be up to 71GL.
► There are opportunities for smaller IIOs to apply an integrated on and off-farm program approach to achieve greater efficiencies, with up to 70GL identified through increased network efficiencies.
► There is continued interest from larger farming corporations in on-farm efficiency programs.
► As outlined in Chapter 6, there is interest for further on-farm modernisation from a proportion of irrigators in the Basin. Additional water efficiencies are estimated and discussed in this chapter based on historical water recovered from water infrastructure programs.
► On-farm opportunities are estimated at between 134GL to 263GL across the Basin.
Future urban opportunities Efficiency measures needed before 2024
► Opportunity to release urban water entitlements in the ACT that are retained to support growth with water efficiency projects.
► Opportunity to substitute unused capacity from the Adelaide Desalination Plant for extractions from the River Murray.
► Other urban water opportunities are estimated at 7.7GL.
► For the full SDL offset of 605GL to be realised within the 5% limit on the SDL adjustment, at least 62GL of efficiency measures will be required to be recovered using funding from the WESA.
► 217GL could be achieved through existing off-farm opportunities identified by stakeholders (71GL excluding GMW), large urban opportunities (80GL) and unsolicited proposals received by DAWR (66GL).
► There are a number of options to roll out COFFIE that could support water recovery.
1 Terms of reference 7 Opportunities for efficien ...2 Glossary 8 Cost of efficiency measures3 Executive summary 9 Principles for negating adv ...4 Introduction 10 A program to achieve 450 ...5 Potential socio-economic ... 11 Appendices6 Program design

Analysis of efficiency measures in the Murray-Darling Basin: Opportunities to recover 450GL in additional environmental water through efficiency measures by 2024, with neutral or positive socio-economic impacts | Page 153 of 307
19 January 2018 | Final Report
Key findings7 Opportunities for efficiency projects
7.1 Off-farm opportunities
Opportunities in irrigation networks to improve efficiency
► IIOs in the Southern Basin have suggested opportunities for further efficiency measures up to 65GL.
► In the Northern Basin, SunWater has suggested off-farm efficiency projects that could deliver more than 6GL.
► There may be opportunities with small IIOs that have not previously participated in programs to undertake an integrated on and off-farm program approach to achieve greater efficiencies, potentially up to 70GL. These smaller IIOs will require assistance to understand opportunities and develop projects.
► There is potential for non-infrastructure opportunities (tailored to user requirements) to reduce delivery losses.
7.2 On-farm opportunities
Opportunities on-farm to improve water efficiency and overall productivity
► Large farming corporations would continue to be interested in water efficiency projects for existing or new developments.
► In the Victorian Goulburn Murray Irrigation District, there could be water use efficiencies from the 600 irrigators that have recently been connected to the backbone and have not previously participated in on-farm modernisation programs, potentially 26GL to 52GL.
► In NSW, further on-farm opportunities exist. As an example, if the level of participation in the Murrumbidgee catchment followed historical trends (based on OFIEP participation), this could deliver additional savings of about 26GL to 35GL.
► If the level of participation in on-farm efficiency programs increased across the majority of other medium to small catchments across the Basin, there could be additional savings of 55GL to 136GL.
► Anecdotal evidence from stakeholder consultations suggest that there is interest in on-farm efficiency opportunities. However, this varies depending on circumstances of the farmer and the characteristics of the region.
► There is demand from some irrigators for funding to exit the industry.
► There are opportunities for on-farm productivity improvements and business transformational projects such as changing from a pasture grazing dairy farming model to a more intensive farming model.
1 Terms of reference 7 Opportunities for efficien ...2 Glossary 8 Cost of efficiency measures3 Executive summary 9 Principles for negating adv ...4 Introduction 10 A program to achieve 450 ...5 Potential socio-economic ... 11 Appendices6 Program design

Analysis of efficiency measures in the Murray-Darling Basin: Opportunities to recover 450GL in additional environmental water through efficiency measures by 2024, with neutral or positive socio-economic impacts | Page 154 of 307
19 January 2018 | Final Report
Key findings7 Opportunities for efficiency projects
7.3 Urban opportunities
Opportunities in improving urban and industrial uses of water
► Icon Water currently returns 29GL of water to the system and this entitlement is retained to support sustainable growth. Further work is needed to develop a business case for infrastructure options in exchange for transferring water entitlements to the Commonwealth.
► Potential for SA to substitute water from the desalination plant for extractions from the River Murray if funding is provided to offset its costs. It is estimated that up to 50GL could be obtained through this efficiency measure. Further work is needed to develop a business case.
► General urban and industrial opportunities within the major centres within the MDB may present an additional 7.7GL through water efficiencies and recycling water systems.
7.4 Notified efficiency measures
Improvements to notified efficiency measures
► The notified efficiency measures schedule could be amended to include a reference to any other efficiency projects that improves the value of production on-farm and reduces the reliance on water.
7.5 Gap to ‘bridging the gap’
Some efficiency measures are needed by 30 June 2019 to allow for the full SDL offset
► For the full SDL offset of 605GL to be realised within the 5% limit on the SDL adjustment, at least 62GL of efficiency measures will be required to be recovered by 30 June 2019. This could be a mixture of ‘new efficiency measures’, using funding from the Water from the Environment Special Account (WESA), and potentially transferring some existing water into efficiency measures up to the difference between the gap-bridge target and the available supply measures.
1 Terms of reference 7 Opportunities for efficien ...2 Glossary 8 Cost of efficiency measures3 Executive summary 9 Principles for negating adv ...4 Introduction 10 A program to achieve 450 ...5 Potential socio-economic ... 11 Appendices6 Program design

Analysis of efficiency measures in the Murray-Darling Basin: Opportunities to recover 450GL in additional environmental water through efficiency measures by 2024, with neutral or positive socio-economic impacts | Page 155 of 307
19 January 2018 | Final Report
Potential efficiency opportunities - overview7 Opportunities for efficiency projects
Based on analysis of available information on water recovery achieved across different types of programs to date across the Basin, an indicative size of the future water recovery opportunity is summarised in the table below. Between 209GL to 450GL+ of water efficiencies are estimated through: 1) stakeholder input; and 2) applying assumptions of further water efficiencies to catchments or types of projects based on available data on historical efficiencies achieved. The rest of this chapter provides the analysis of water recovery achieved across different sized catchments in the Basin and the methodology for the estimated future opportunities.
Next steps in implementing a water efficiency program is discussed in Chapter 10, including how best to achieve 62GL by 2019.
Source: Data from the Department of Agriculture and Water Resources, stakeholder estimates, and EY analysis.
1 Total potential savings is 209GL to 690GL noting that only 450GL will be recovered. Note totals may not add due to rounding differences.2 This large range reflects the upper bound potential for water savings which may require a significantly higher cost than invested historically, and hence not be achievable alone within the proposed multiple.
1 Terms of reference 7 Opportunities for efficien ...2 Glossary 8 Cost of efficiency measures3 Executive summary 9 Principles for negating adv ...4 Introduction 10 A program to achieve 450 ...5 Potential socio-economic ... 11 Appendices6 Program design
Potential water savings (GL)Location Type / Basis of Estimation Potential Savings
Off-farm opportunities nominated by stakeholders
Victorian Murray/Goulburn Stakeholder estimates 0 - 2392
NSW Murray Stakeholder estimates 10 – 25
Murrumbidgee Stakeholder estimates <10
Queensland Stakeholder estimates 6
Sub-total 26 – 280
On-farm opportunities (EY estimates)
Victorian Murray/Goulburn On-farm (increase of 200-400 irrigator participants) 26 – 52
Murrumbidgee On-farm (sensitivities to OFIEP participation figures) 26 – 35
NSW Murray On-farm (sensitivities to OFIEP participation figures) 29 – 44
SA Murray Reaching 10%-20% of interested irrigators in SARMS 6 - 12
Lachlan On-farm ( increase to 2-4% of SDL) 10 – 21
Macquarie-Castlereagh On-farm ( increase to 6% of SDL) N/A – 2
Namoi On-farm ( increase to 2-4% of SDL) 3 – 12
Gwydir On-farm ( increase to 2-4% of SDL) 3 – 11
Condamine Balonne On-farm ( increase to 2-4% of SDL) 7 – 24
Border Rivers (QLD) On-farm ( increase to 4.5% of SDL) N/A – 2
Warrego On-farm ( increase to 2-4% of SDL) 2 – 4
Moonie On-farm ( increase to 2-4% of SDL) 0 – 2
Nebine On-farm ( increase to 2-4% of SDL) 1 – 1
Potential water savings (GL)Location Type / Basis of Estimation Potential Savings
Border Rivers (NSW) On-farm ( increase to 2-4% of SDL) 2 – 8
Barwon Darling On-farm ( increase to 2-4% of SDL) N/A – 1
Intersecting Streams On-farm ( increase to 2-4% of SDL) 2 – 5
Lower Darling On-farm ( increase to 2-4% of SDL) N/A – 1
Wimmera Stakeholder estimates -
Loddon On-farm ( increase to 2-4% of SDL) 3 – 6
Campaspe On-farm ( increase to 2-4% of SDL) 2 – 5
Ovens On-farm ( increase to 2-4% of SDL) 2 – 3
Broken On-farm ( increase to 2-4% of SDL) 1 – 2
Sub-total 125 – 253
Integration of on and off-farm opportunities (EY estimates)
Northern Basin On and off-farm (65% to 93% network efficiency) 5 – 9
Southern Basin On and off-farm (65% to 93% network efficiency) 29 – 61
Sub-total 34 – 70Urban and industrial opportunities (EY estimates)
South Australia Urban and industrial <= 50
Australian Capital Territory Urban and industrial 20 – 30
Urban areas within the MDB Urban and industrial (80% to 85% or 90% efficiency) 4 – 9
Sub-total 24 – 89Total1 209 – 450+

Analysis of efficiency measures in the Murray-Darling Basin: Opportunities to recover 450GL in additional environmental water through efficiency measures by 2024, with neutral or positive socio-economic impacts | Page 156 of 307
19 January 2018 | Final Report
Methodology and considerations7 Opportunities for efficiency projects 1 Terms of reference 7 Opportunities for efficien ...
2 Glossary 8 Cost of efficiency measures3 Executive summary 9 Principles for negating adv ...4 Introduction 10 A program to achieve 450 ...5 Potential socio-economic ... 11 Appendices6 Program design
Methodology
The analysis outlined in this chapter provides an indicative view on potential opportunities. It is acknowledged that there were limitations in the data available at the time of reporting and further analysis is needed as part of program implementation, which is further discussed in Chapter 10.
A range has been provided in estimating the potential opportunities to illustrate the uncertainties in the estimate. It is noted that the water recovery target to bridge the gap for the Northern Basin has been reduced. It is assumed for illustrative purposes that further opportunities for water efficiencies is available in the Northern Basin, provided a multi-faceted program as outlined in this report is implemented to build support.
In calculating the opportunities for further water recoveries, SDL by catchment has been used as a proxy for the volume of water in productive use in each catchment, and additional water recoveries are viewed in the context of the volume of SDL by catchment. Note water recoveries represent the progress towards bridging the gap between SDL and BDL.
All water recoveries as shown is this chapter are in LTAAY terms.
Timing of data
The water recovery data within this chapter is based on information current as at 30 June 2017. Since this date, material events may have occurred which are not reflected within this Report. It is noted that this approach was purposefully pursued for consistency purposes.
Utilisation of assumptions and proxy indicators
The inability to obtain complete data sets for all MDB catchment areas has meant that in some cases, assumptions and proxy indicators based on historical and anticipated water infrastructure programs have been utilised. Acknowledgements have been made where such assumptions and proxy indicators have been utilised.
Limitations
In undertaking the analysis, the following limitations were found:
► Data is held by multiple stakeholders across the Basin and there could be a lack of consistency between data provided by stakeholders. EY has not undertaken a
detailed cross-checking and verification exercise.
► Lack of readily available data on the details of water recovery to date, for example water recovery by industry and size of participant.
► Stakeholder estimates have not been verified and may be subject to future amendments through a more detailed analysis.
► Opportunities have not been assessed for financial viability and further analysis would be required to determine the viability on a stand-alone basis.
► The individual characteristics and limitations of each individual catchment or IIO (e.g., liquidity of the water market) have not been taken into consideration, unless input has been provided by state jurisdictions. EY has relied on input from state jurisdictions to undertake this analysis. Further analysis would be required to determine the potential implications of unique circumstances and/or considerations.
Required data for further analysis
In order to conduct a more detailed analysis of the MDB and potential efficiency measures, it is recommended that a more comprehensive dataset is compiled. This will include water used and recovered by:
► MDB catchment / geographical location
► Cost (water recovered)
► Time series (over multiple program rounds and years)
► Type of project (on-farm, urban and industrial)
► Industry (e.g. dairy or rice).
Refining the analysis on potential efficiency opportunities also needs to be in the context of any catchment specific characteristics. Also useful is additional information on the motivations for those participating in on-farm efficiency programs and a better understanding of the demographics of catchments and program participants.
Collection of the above information would allow better identification of opportunities across the Basin.

Analysis of efficiency measures in the Murray-Darling Basin: Opportunities to recover 450GL in additional environmental water through efficiency measures by 2024, with neutral or positive socio-economic impacts | Page 157 of 307
19 January 2018 | Final Report
Overview of existing and prior efficiency programs7 Opportunities for efficiency projects
A number of on and off-farm efficiency programs to recover water have been implemented across Basin States. Some of the main programs are illustrated below1.
1 Terms of reference 7 Opportunities for efficien ...2 Glossary 8 Cost of efficiency measures3 Executive summary 9 Principles for negating adv ...4 Introduction 10 A program to achieve 450 ...5 Potential socio-economic ... 11 Appendices6 Program design
Source: Data from the Department of Agriculture and Water Resources. All figures are current as at 30 June 2017.1 Water recovery figures reflect both water actually transferred to the Commonwealth and water which is contracted to be transferred. All water recoveries figures are expressed in long term average annual yield (LTAAY) terms. Water recovery amounts are calculated using the current long-term diversion limit equivalent factors (v2.05) agreed to by Ministerial Council in November 2011 or are consistent with accredited Water Resource Plans. All overland flow water recoveries have their factors individually modelled. Water recovery is reported at the point at which water savings have been received, estimated or agreed in signed contracts. Until water transfer contracts have been exchanged however, these figures may be subject to change over time.2 Note The Nimmie-Caira was largely a land and water purchase agreement with reconfiguration of water delivery infrastructure. 3 The total water transferred to the Commonwealth under the GMW Connections project was 204GL. However, 102GL was transferred under a water sale agreement and did not relate to the delivery of water infrastructure and has been excluded from the above summary.
NSW VIC SA QLD
$1.63b for 442GL $1.36b for 191GL $0.17b for 48GL $0.11b for 24GL$3,688 per ML $7,095 per ML $3,623 per ML $4,583 per ML
Included programs► Private Irrigation Infrastructure
Operators Program (PIIOP) – off-farm and on-farm projects (155GL)
► On-farm Irrigation Efficiency Program (OFIEP) – Commonwealth managed on-farm program (97GL)
► Irrigated Farm Modernisation (IFM) – on-farm projects (19GL)
► Basin Pipes – upgrading stock and domestic infrastructure (28GL)
► Metering – installing or upgrading meters (8GL)
► Nimmie-Caira – implemented by the NSW Office of Water (133GL)2
► Water Smart – development and uptake of smart technologies (2GL)
Included programs► Goulburn-Murray Connections
Stage 2 (GMW) – modernisation of off-farm irrigation network (102GL)3
► Victorian Farm Modernisation Project (VFM) – on-farm projects (30GL)
► Northern Victoria Irrigation Renewal Project (NVIRP 2) – on-farm projects (10GL)
► Sunraysia modernisation – off-farm project (7GL)
► OFIEP – Commonwealth managed on-farm program (42GL)
Included programs► Private Irrigation Infrastructure
Program SA (PIIPSA) – off-farm and on-farm projects (3GL)
► OFIEP– Commonwealth managed on-farm program (9GL)
► South Australia River Murray Sustainability Program (SARMS) -on and off-farm projects (36GL)
Included programs► Healthy Headwaters Water Use
Efficiency (HHWUE) – on-farm projects (24.0GL)

Analysis of efficiency measures in the Murray-Darling Basin: Opportunities to recover 450GL in additional environmental water through efficiency measures by 2024, with neutral or positive socio-economic impacts | Page 158 of 307
19 January 2018 | Final Report
Opportunities in large catchments - summary7 Opportunities for efficiency projects
Potential off-farm water savings nominated by IIOs
Catchment IIO Water Access Entitlements held by IIO (2015/16)1
Likely Off-farm Savings
Victorian Murray/GoulburnLMW 137.6GL <30
GMW 1,029.4GL 0 – 209
NSW MurrayMIL 1,321.2GL 10 – 20
WMI 41.4GL <5
Murrumbidgee MI 1,105.6GL <10
Total N/A N/A <274
Potential on-farm water savings
Victorian Murray/Goulburn Increased program participation 26 – 52
Murrumbidgee Based on historical participation rates 26 – 35
NSW Murray Based on historical existing participation rates 29 – 44
Total N/A 81 – 131Source: ACCC 2016 and EY stakeholder consultations.
-
500
1,000
1,500
2,000
2,500
3,000
Murrumbidgee Murray (NSW) Goulburn Murray (VIC)
Volu
me
(GL)
Large MDB catchment total water recovery
Efficiency measures Buyback Other BDL SDL
Source: Data from the DAWR and EY analysis.Note water recoveries represent the progress towards bridging the gap between SDL and BDL
1 Terms of reference 7 Opportunities for efficien ...2 Glossary 8 Cost of efficiency measures3 Executive summary 9 Principles for negating adv ...4 Introduction 10 A program to achieve 450 ...5 Potential socio-economic ... 11 Appendices6 Program design
The four largest catchments in the Basin are: Murrumbidgee, Murray (NSW), Goulburn and Murray (VIC). Each of these catchments consist of between 12% to 19% of the total BDL. The graph below shows the level of water recovery across these four catchments in relation to their SDL and BDL, proxies for the size of these catchments2. Further opportunities to achieve on and off-farm efficiencies are summarised below and discussed in the following pages, including the methodology for estimating the size of the opportunities.
On-farm opportunities
As outlined in the table below:
► Murrumbidgee: It is estimated that if participation amongst irrigators were to continually increase as historical figures suggest (based on OFIEP rounds 1 to 5), an additional 35GL of water efficiencies may be achieved. Assuming a decrease from historical participation by 25%, a hypothetical low point estimate, this would provide 26GL in water efficiencies.
► Goulburn/VIC Murray: irrigators that are newly connected to the backbone in the Goulburn Murray Water’s network could participate in efficiency programs with an estimated 26GL – 52GL in water efficiencies, based on the hypothetical participation rate of between 0.33% to 0.67%.
► NSW Murray: It is estimated that if participation amongst irrigators were to continually decrease as historical figures suggest (based on OFIEP rounds 1 to 5), additional water efficiencies could range between 29GL to 44GL.
Off-farm opportunities
The table below summarises the potential size of water efficiency opportunities put forward by the IIOs. Other smaller IIOs in these catchments that have not fully upgraded are discussed at page 163.
1 ACCC 2017, Water Monitoring Report 2015-16.2 SDL=BDL minus local reduction target minus shared reduction target apportioned using the default apportionment method in the Basin Plan.

Analysis of efficiency measures in the Murray-Darling Basin: Opportunities to recover 450GL in additional environmental water through efficiency measures by 2024, with neutral or positive socio-economic impacts | Page 159 of 307
19 January 2018 | Final Report
Opportunities in large catchments – on-farm7 Opportunities for efficiency projects
1 Department of Agriculture and Water Resources, October 2017.2 Email correspondence from DAWR, 27 October 2017.
Interest in on-farm modernisation works were expressed by some irrigators during consultations across the Basin. In particular, large farming corporations expressed interest in undertaking efficiency measures on existing and new developments.
The reach of OFIEP has largely been around the Murray, Goulburn and the Murrumbidgee, as shown on the adjacent map.1
Over the five rounds of OFIEP, the majority of participants have been small to medium sized irrigators with land sizes below 1,000ha. As per the below table, the smallest group of participants are those with large properties, 10,000ha to 45,000ha. There is opportunity to reach more of the medium to large irrigators.
Size of OFIEP participants2
Size (ha) % of participants Category
1-100ha 32% Small
100-1000ha 55% Medium
1000-10,000ha 10% Medium/ Large
10,000-45,000ha 4% Large
OFIEP rounds 1 – 5 participation map
Source: Department of Agriculture and Water Resources.
1 Terms of reference 7 Opportunities for efficien ...2 Glossary 8 Cost of efficiency measures3 Executive summary 9 Principles for negating adv ...4 Introduction 10 A program to achieve 450 ...5 Potential socio-economic ... 11 Appendices6 Program design

Analysis of efficiency measures in the Murray-Darling Basin: Opportunities to recover 450GL in additional environmental water through efficiency measures by 2024, with neutral or positive socio-economic impacts | Page 160 of 307
19 January 2018 | Final Report
Opportunities in large catchments – on-farm7 Opportunities for efficiency projects
Goulburn / VIC Murray
GMW has over 14,000 customers in the Goulburn Murray Irrigation District (GMID), noting that customers with two properties are recorded as two customers.1 Of those customers, there are about 3,000 commercial irrigators within the GMID.2 The dairy industry is the largest industry in the district, using about half of all water in the district.4
It is estimated that about 600 irrigators have become newly connected to the GMW backbone over the last twelve months and could participate in on-farm irrigation efficiency programs.3 Furthermore, stakeholders also reported that infrastructure for an additional 70,000 hectares within the GMID could still be modernised through future water efficiency programs.
In rounds 1 to 4 of the GMID on-farm modernisation scheme, the level of water recovery achieved was 0.13GL per project.4 By applying this historical proxy of 0.13GL per project, and assuming on an indicative basis 33% of the 600 irrigators participate, this would achieve 26GL. If 67% of the 600 irrigators participate, this would achieve 52GL. These estimates are summarised in the table below.
Murrumbidgee
The number of participants from the Murrumbidgee catchment to participate in OFIEP increased by 67%, from 55 participants in round 1 to 92 participants in round 5 (a total of 228 participants over 5 rounds).5 On the high end of the estimated future water efficiencies, it is assumed that if participation continued in line with historical levels, i.e. 228 participants can be reached before 2024, and using historical program efficiencies (0.15GL water efficiencies achieved per participant), an additional 35GL of water efficiencies may be achieved. At the low end of the estimated future water efficiencies, if it is assumed on an indicative basis that participation is at 75% of historical levels (171 participants), this would equate to an additional 26GL of water efficiencies.
NSW Murray
The number of participants from the Murray catchment to participate in OFIEP decreased by 28% from round 1 to round 5 (from 153 to 110 participants and a total of 569 participants over 5 rounds).6 With participation gradually decreasing, it has been assumed that this trend will continue into the future. As such, it is assumed that if participation were to decrease by 25% (as a hypothetical) on historical levels, (i.e. 427 participants), and using historical water efficiencies achieved (0.10GL water efficiencies achieved per participant), an additional 44GL of water efficiencies may be achieved. If a lower level of participation is assumed, (i.e. 50% of historical participation, 285 participants), it is estimated that an additional 29GL of water efficiencies may be achieved.
1 Email correspondence from GMW, 30 October 2017. 2 Discussions with NCCMA, 11 October 2017.3 Email correspondence GMW, 30 October 2017.4 Ibid.5 Department of Agriculture and Water Resources.6 Ibid.
Potential on-farm efficiencies
Catchment Calculation methodology Water efficiency savings
Victorian Murray/Goulburn Participation by 200-400 irrigators 26 – 52
Murrumbidgee Participation of 171 irrigators or 228 irrigators 26 – 35
NSW Murray Participation of 427 irrigators or 285 irrigators 29 – 44
Total N/A 81 – 131
Source: ACCC 2016, EY stakeholder consultations and EY analysis.
1 Terms of reference 7 Opportunities for efficien ...2 Glossary 8 Cost of efficiency measures3 Executive summary 9 Principles for negating adv ...4 Introduction 10 A program to achieve 450 ...5 Potential socio-economic ... 11 Appendices6 Program design

Analysis of efficiency measures in the Murray-Darling Basin: Opportunities to recover 450GL in additional environmental water through efficiency measures by 2024, with neutral or positive socio-economic impacts | Page 161 of 307
19 January 2018 | Final Report
Opportunities in large catchments – off-farm7 Opportunities for efficiency projects
1 Email correspondence from GMW, 4 September 2017.2 Ibid.3 Ibid. 4 Teleconference with LMW 26 September 2017.5 Minister for Agriculture 2016, Sunraysia Modernisation Project, http://minister.agriculture.gov.au/joyce/Pages/Media-Releases/Sunraysia-modernisation-project.aspx.
1 Terms of reference 7 Opportunities for efficien ...2 Glossary 8 Cost of efficiency measures3 Executive summary 9 Principles for negating adv ...4 Introduction 10 A program to achieve 450 ...5 Potential socio-economic ... 11 Appendices6 Program design
Further off-farm opportunities for large catchments are discussed below, based on input from stakeholders
VictoriaGoulburn Murray Water
The modernisation program originally proposed under NVIRP envisaged rationalisation of 3,000km of channels. Under the Reset Delivery Plan, only about 1,800km of channels were rationalised.1
In the GMID, about 730GL is lost per year due to a number of factors including evaporation, seepage, leakage and meter inaccuracy. About 652GL is lost in the GMID backbone and connection channels and the rest are through natural carriers. Through the various water saving programs in the GMID, about 550GL will have been recovered by 2020.2 About 85% efficiency will be achieved in the GMID network.
GMW provided information on water savings delivered under previous and current water savings projects and on the water losses in distribution systems prior to modernisation to highlight the challenges; socially, economically, and technically to find water savings in an already modernised system. This information has been used to estimate a potential upper bound on water opportunities. It is noted that any achievement of these water savings may require a significantly higher cost than what has been allowed for historically and not be achievable alone within the proposed multiple applied for efficiency measures. Hence a lower bound of zero has been applied.
Potential opportunities in the GMID could come from the following, noting that these would require
significantly higher cost than historically:3
► Evaporation minimisation: minimising evaporation over a 3,000km channel stretch may deliver up to 40GL savings (36GL – 44GL +/- 10% sensitivity), equating to approximately 13ML/km.
► Channel lining: installation of channel lining for approximately 2,900km of water systems may deliver up to 150GL in water efficiency savings (135GL – 165GL +/- 10% sensitivity), equating to approximately 50ML/km.
Lower Murray Water
In the Lower Murray Water network, further efficiencies could come from private diverters in the area, and the next stage of the Sunraysia Modernisation Project.4
Private diverters
► Storage: installation of storages to decrease current water losses, which presently occur through:
► Storage seepage losses (potentially losing 260ML p.a.)
► Open channels seepage losses (potentially losing 2GL p.a.).
► Pumping Relocation: in the current environment, increased seepage is occurring due to the requirement of maintaining a full creek for pumping purposes. The relocation of pumps to a central point may allow more efficient water extraction and for the creek to return to a natural wet and dry cycle.
Overall, it is estimated that 20-25GL of water efficiency
savings may be achieved from the above measures. These opportunities have not been subject to detailed analysis of feasibility and costs and further analysis is needed. Implementation of these opportunities could require new technologies and cost significantly more than historical projects.
Sunraysia Modernisation Project (SMP)
With an anticipated delivery of 7GL in annual water savings already delivered annually through the SMP, it is noted that the balance of the SMP is yet to be delivered, which includes the replacement of open irrigation channels with pipelines and automated pumping stations5. Further work is needed to estimate the potential water savings. For the purpose of this report, EY conservatively include 5GL as potential further savings under the next stage of SMP.
Conclusions
Goulbourn Murray Water may deliver up to 171GL – 209GL (+/- 10% sensitivity) in water efficiency savings through evaporation minimisation and channel lining. However, this will require higher investment or new engineering technologies. A range of 0 to 209GL in further efficiencies has been included, noting that given the size of the opportunity there may still be some level of recovery that represents value for money.
Up to 25GL of water efficiency savings may be achieved through reducing seepage losses in storages and open channels used by private diverters in the Lower Murray Water network.
Further work is needed to determine savings under the next stage of the SMP, a conservative estimate is 5GL.

Analysis of efficiency measures in the Murray-Darling Basin: Opportunities to recover 450GL in additional environmental water through efficiency measures by 2024, with neutral or positive socio-economic impacts | Page 162 of 307
19 January 2018 | Final Report
Other opportunities in Sunraysia
Other opportunities for efficiency measures were identified by stakeholders in the Sunraysia region. These included:
► Supply upgrades specific to channels, dams, creeks, and billabongs across floodplain areas.
► Property rationalisation to provide scale for more efficient systems, opportunities for water authorities to remove outlets, meters, redundant lines and other services.
NSWMurrumbidgee Irrigation Ltd (MI)
The current network modernisation works have delivered the majority of the savings. Further efficiencies could come from the following areas:1
► Automation of outlets, regulators and installation of channel lining, with an emphasis on the smaller areas of the network which were not modernised previously.
► Installation of in-line water storage systems. Although the current water losses are difficult to quantify, storage systems may supplement demand downstream and provide a greater degree of control over the timing water delivery and improve efficiency.
Overall, it is noted that up to 10GL of water efficiency
savings may be available, at an estimated cost of at least $8,000/ML.
Western Murray Irrigation (WMI)
Western Murray Irrigation noted the network has been largely modernised and that it would be more difficult to obtain future savings. However, there could be further efficiencies (EY estimates up to 5GL) in upgrading or installing an automated metering system.2
Murray Irrigation Ltd (MIL) 3
The current network has a capacity of about 1,500GL per year and the current utilisation rate is about 50%. After implementation of PIIOP, the network will be about 90% efficient.
The priority for MIL going forward is to increase system utilisation by, for example, connecting nearby smaller IIOs located close to MIL's backbone to its network.
Further network efficiencies could come from channel remediation works, with about 10GL to 20GL of savings.
Opportunities in large catchments – off-farm7 Opportunities for efficiency projects
1 Teleconference with Murrumbidgee Irrigation Corporation 27 September 2017.2 Meeting with Western Murray Irrigation, 8 September 2017.3 Teleconference with MIL 25 October 2017.
Conclusions
MI estimates around 10GL of water efficiency savings may be available at a cost of $8,000/ML.
Western Murray Irrigation could achieve further efficiencies through upgrading the metering system.
Channel remediation works for MIL could achieve 10GL to 20GL of savings.
1 Terms of reference 7 Opportunities for efficien ...2 Glossary 8 Cost of efficiency measures3 Executive summary 9 Principles for negating adv ...4 Introduction 10 A program to achieve 450 ...5 Potential socio-economic ... 11 Appendices6 Program design

Analysis of efficiency measures in the Murray-Darling Basin: Opportunities to recover 450GL in additional environmental water through efficiency measures by 2024, with neutral or positive socio-economic impacts | Page 163 of 307
19 January 2018 | Final Report
Opportunities in medium catchments - summary7 Opportunities for efficiency projects
Source: Data from the DAWR and EY analysis.Note water recoveries represent the progress towards bridging the gap between SDL and BDL
-
200
400
600
800
1,000
1,200
Lachlan Namoi Macquarie-Castlereagh
Gwydir Murray (SA) CondamineBalonne
Volu
me
(GL)
Medium MDB catchment total water recovery
Efficiency measures Buyback Other BDL SDL
Potential efficiencies for Northern and Southern Basins
Catchment Calculation methodology Water efficiency savings (GL)
Northern Basin Assumed efficiency improvements from 65% effective network to 93% 5 – 9
Southern Basin Assumed efficiency improvements from 65% effective network to 93% 29 – 61
Total N/A 34 – 70
Using the efficiency levels achieved from Trangie-Nevertire (65% to 93%) as an efficiency benchmark to estimate the level of savings that may be achieved from IIOs that have not fully modernised their network, it is estimated between 34GL to 70GL could be achieved from those IIOs that have not fully modernised.
The following table provides an overview of the potential water efficiency savings achieved both within the Northern and Southern Basin.
1 Terms of reference 7 Opportunities for efficien ...2 Glossary 8 Cost of efficiency measures3 Executive summary 9 Principles for negating adv ...4 Introduction 10 A program to achieve 450 ...5 Potential socio-economic ... 11 Appendices6 Program design
In the medium sized catchments, the size ranged from 3% to 7% of the total BDL. Four of the catchments in the graph below are located in the Northern part of the Basin, where the system is largely unregulated.
On-farm opportunities
As seen in the graph below, SA Murray has achieved the largest proportion of water recovery through infrastructure measures indicating a strong appetite for program participation. Using SARMS as a proxy for SA Murray water efficiency savings, it is estimated that if on an indicative basis 20% – 30% of the 413 irrigators who were previously not successful in their application as a part of SARMS participated, an additional 16GL – 24GL in water savings may be achieved in SA
Murray. These estimates are further discussed on the subsequent pages. Other opportunities for water efficiencies are estimated at 23GL to 70GL, assuming these catchments can achieve efficiencies of 2% to 4% of the catchment SDL.1
Off-farm opportunities
SunWater has proposed projects with known savings of up to 6GL, with further details provided on page 165. These opportunities include the St George Water Supply Scheme Irrigation Modernisation, St George Water Supply Scheme and Cunnamulla Water Supply Scheme.
Opportunities for integration of on and off-farm projects
Source: ACCC 2016, data from the Department of Agriculture and Water Resources, and EY analysis. 1 SDL=BDL minus local reduction target minus shared reduction target apportioned using the default apportionment method in the Basin Plan.

Analysis of efficiency measures in the Murray-Darling Basin: Opportunities to recover 450GL in additional environmental water through efficiency measures by 2024, with neutral or positive socio-economic impacts | Page 164 of 307
19 January 2018 | Final Report
Opportunities in medium catchments – on-farm 7 Opportunities for efficiency projects
1 Email correspondence from Department of Primary Industries and Regions SA, 6 November 2017. Note the SARMS program also included off-farm projects. For indicative purposes, it is assumed the savings are largely on-farm. 2 Email correspondence from DEWNR, 15 January 2018 that 0.15GL water savings per project and that 20% of unsuccessful applicants participated.
Note: The above water efficiencies were calculated utilising the assumption that individual catchments can increase their efficiency measures to between 2% – 4% of SDL. However it is acknowledged that Macquarie-Castlereagh was assumed to increase to a maximum of 6.0% from it’s current level of 5.8%. Note totals may not add due to rounding differences.
Source: Data from the DAWR and EY analysis.Source: Data from the DAWR and EY analysis.
1 Terms of reference 7 Opportunities for efficien ...2 Glossary 8 Cost of efficiency measures3 Executive summary 9 Principles for negating adv ...4 Introduction 10 A program to achieve 450 ...5 Potential socio-economic ... 11 Appendices6 Program design
Further on-farm opportunities in medium catchments are estimated based on the level of water recovery achieved historically.
South AustraliaThere are about 3,000 water users (includes irrigators within the larger irrigation trusts) in the MDB in South Australia, and it is noted that 672 irrigators applied to SARMS for on-farm efficiency measures and from those applications, 259 were eventually contracted.1Further details of the SARMS program is included in Chapter 9. Given the interest in SARMS that was not met, there is opportunity to reach other irrigators that may be interested in water efficiency programs. For illustrative purposes and using SARMS as a proxy for SA Murray water efficiency savings (0.15GL water savings per project), if on an indicative basis 10% –20% of the remaining 413 irrigators who were previously not successful in their application as a part of SARMS participated, it is estimated that an additional 6GL – 12GL in water savings may be
achieved in SA Murray.2
New South Wales
As shown in the table below, only a small amount of water has been recovered through water infrastructure programs in the majority of catchments apart from Murray (SA) and Macquarie. Across the Lachlan, Namoi, and Gwydir catchments, 13GL has been recovered through water infrastructure programs.
Across all catchmentsThe level of water recovered through water infrastructure programs is approximately 3.2% of the SDL across all the medium sized catchments.
If an efficiency program were able to reach more irrigators such that the total efficiency recovered increased in all catchments to a minimum of 2% of the SDL across the medium sized catchments, that would remain a small proportion of the SDL, whilst delivering an additional 23GL of water efficiencies to the MDB.
The increased water recovery by catchment (2% to 4%) illustrates the potential water efficiencies recovered if each nominated catchment was able to achieve 2% to 4% water savings of SDL through infrastructure programs.
It is noted that these scenarios are for illustrative purposes only and do not take into account the specific characteristics and/or circumstances of the individual catchments. Further, the attractive design of SARMS may have contributed to the higher level of uptake in SA. If similar programs were available in other catchments then results similar to what has been seen in SA might be achieved.
Water recovery by catchment
Catchment SDL Water saving (GL) Water saving/ SDL
Murray (SA) 483.1 48.3 10.0%
Lachlan 570.4 1.5 0.3%
Macquarie-Castlereagh 645.4 37.3 5.8%
Namoi 479.0 6.8 1.4%
Gwydir 389.9 5.1 1.3%
Condamine Balonne 838.2 9.4 1.2%
Total 3,406.0 108.4 3.2%
Increased water recovery by catchment – 2-4% of SDL scenario analysis
Catchment Increase required to achieve 2-4% of SDL (GL)
Water efficiencies at 2-4% of SDL (GL)
Murray (SA) Already achieved Already achieved
Lachlan 10 – 21 11 – 23
Macquarie-Castlereagh* N/A – 2 N/A – 39
Namoi 3 – 12 10 – 19
Gwydir 3 – 11 8 – 16
Condamine Balonne 7 – 24 17 – 34
Total 23 – 70 45 – 130
Conclusions
If an efficiency program was able to reach more irrigators such that the total efficiency recovered increased in medium catchments to 2% to 4% of the SDL, this is estimated to deliver an additional 23GL to 70GL of water efficiencies to the MDB.

Analysis of efficiency measures in the Murray-Darling Basin: Opportunities to recover 450GL in additional environmental water through efficiency measures by 2024, with neutral or positive socio-economic impacts | Page 165 of 307
19 January 2018 | Final Report
Off-farm opportunities in Queensland are outlined below based on stakeholder input.
QueenslandSunWater
SunWater supplies approximately 40% of all commercial water use in Queensland.1 Opportunities for efficiency measures in SunWater could include:2
St George Water Supply Scheme (SGWSS) Irrigation Modernisation
The SGWSS program involves increasing the volume further and enhancing overall capacity to manage flows of water available for environmental purposes in the river systems of the Northern MDB. Taking prior investigations into consideration, it was considered that the four most cost effective water efficiency strategies could include:
► Meter replacement – replace all dethridge wheels
► Evaporation – replace end of line channels with pipelines and reduce length of channels
► Seepage – replace end of line channels with pipelines and reduce length of channels
► Uncontrolled flows – implement automatic channel control to allow demand driven direct control of channel regulation system.
It is estimated that up to 5.5GL of water efficiency savings may be achieved on an annual basis through the above efficiency measures.
St George Water Supply Scheme
► Pipeline Installation: Installation of a pipeline to the downstream extent of the SGWSS, providing an opportunity to save on evaporation from the weir pool and also significant transmission losses for the water sent down the river. It is noted that SunWater presently sends 20% extra downstream water to cover transmission losses under the current arrangements.
► Pump Station Upgrade: Reconfiguration of the St George Pump Station and SGWSS irrigation channel system for the first 10km, providing an opportunity to pipe water to high frequency but low volume users and avoid keeping water in a sandy channel for their extraction (seepage losses). It is noted that maximum water efficiencies could be realised during the off season when the channel system also provides water into the main part of the irrigation area.
► Minimising Channel Seepage: Lining of the first 7km of the Thuraggi Channel (and potentially additional sections) which traverses a sand ridge. Lining the first section has the potential to minimise water losses currently incurred through seepage losses.
Cunnamulla Water Supply Scheme
Installation of stock and domestic pipelines for downstream riparian requirements. In the current environment, small flows of water are released for stock and domestic purposes, which do not reach
downstream users due to the sandy nature of the weir. Installing stock and domestic pipelines would better suit those users who require smaller quantities of water in an ongoing capacity. It is anticipated that water savings would arise from the reduced evaporation and spillage overflow.
However, it is acknowledged that stakeholder consultation indicated that such measures have the potential to cost significantly more than existing efficiency measures. As such, it is recommended further analysis is conducted to verify the financial viability of the proposals.
Opportunities in medium catchments – off-farm7 Opportunities for efficiency projects
Conclusions
SunWater may deliver more than 5.5GL of annual water efficiency savings through more effective management of water flows in the NMDB.
1 SunWater n.d., SunWater, http://www.sunwater.com.au/about-sunwater. 2 SunWater 2010, St George Water Supply Scheme Modernisation Plan.
1 Terms of reference 7 Opportunities for efficien ...2 Glossary 8 Cost of efficiency measures3 Executive summary 9 Principles for negating adv ...4 Introduction 10 A program to achieve 450 ...5 Potential socio-economic ... 11 Appendices6 Program design

Analysis of efficiency measures in the Murray-Darling Basin: Opportunities to recover 450GL in additional environmental water through efficiency measures by 2024, with neutral or positive socio-economic impacts | Page 166 of 307
19 January 2018 | Final Report
Opportunities for smaller irrigation networks
The Commonwealth has previously funded IIO led modernisation projects that combined both on and off-farm infrastructure works. The benefit of a combined on and off-farm program is that the level of network modernisation is undertaken taking into account the level of water demanded and the network footprint after on-farm modernisation works have been implemented. Another important benefit is that it facilitates rationalisation of the network, where it benefits the community, maximises on-farm participation and avoids a Swiss Cheese effect.
Given the level of off-farm modernisation that has already taken place in the larger irrigation networks, further opportunities for an integrated approach is more likely in smaller irrigation networks where modernisation has not yet taken place. The further adoption of operational practices which promote economies of scale and increased collaboration which support the long term sustainability of smaller irrigation networks should also be taken into consideration when identifying further integrated opportunities.
As an example, a combined on and off-farm program generated 32GL of savings in the Trangie Nevertire Irrigation Scheme, with network efficiency improving from 65% to 93%.
The program involved four primary work components:1
► Stock and domestic pipeline system, replacing an aging open channel delivery system.
► Modernisation of 68% of the open channel system, involving channel reform and lining, structure upgrades, metering and telemetry.
► Upgrading of on-farm irrigation infrastructure within the rationalised scheme, involving modern centre pivot and linear move sprinkler technology installation, upgrading tail water systems, laser levelling of paddocks and installation of modernised water monitoring equipment.
► Rationalisation of 32% of scheme channels and scheme irrigation footprint.
Similar to the work that’s been done at Trangie Nevertire, there is scope in other schemes to combine on and off-farm modernisation works.
Using the level efficiency achieved from Trangie-Nevertire, from 65% to 93% as an efficiency benchmark to estimate the level of savings that may be achieved from IIOs that have not fully modernised their network, it is estimated between 34GL to 70GL could be achieved from those IIOs that have not fully modernised.
The following table provides an overview of the potential water efficiency savings achieved both within the Northern and Southern Basin. Each scenario analyses the network from 65% to 93% efficieny utilising the water access entitlements held by individual operators (2015-16) as the basis of water access entitlements (GL).
It is noted that these scenarios are for illustrative purposes only and do not take into account the specific characteristics and/or circumstances of the individual IIOs.
Opportunities for integration of on and off-farm projects7 Opportunities for efficiency projects
Conclusions
Opportunities for integration of on and off-farm projects exist, particularly for smaller irrigation networks.
There could be between 34GL to 70GL of water savings from modernising smaller irrigation networks that have not previously participated in infrastructure upgrade programs.
1 TNCL Final Project Report under Round 1 of the PIIOP in NSW, 2016.2 Teleconference with DAWR, 18 October 2017.
Potential efficiencies for Northern and Southern Basin
Catchment Calculation methodology Water efficiency savings (GL)
Northern Basin Assumed efficiency improvements from 65% effective network to 93% 5 – 9
Southern Basin Assumed efficiency improvements from 65% effective network to 93% 29 – 61
Total N/A 34 – 70Source: ACCC 2016, data from the DAWR and EY analysis.
1 Terms of reference 7 Opportunities for efficien ...2 Glossary 8 Cost of efficiency measures3 Executive summary 9 Principles for negating adv ...4 Introduction 10 A program to achieve 450 ...5 Potential socio-economic ... 11 Appendices6 Program design

Analysis of efficiency measures in the Murray-Darling Basin: Opportunities to recover 450GL in additional environmental water through efficiency measures by 2024, with neutral or positive socio-economic impacts | Page 167 of 307
19 January 2018 | Final Report
Opportunities in small catchments - summary7 Opportunities for efficiency projects
In this report, smaller catchments are those where it comprises less than 2% of the BDL. The diagrams below have split the catchments between those in the Northern and Southern Basin as the Northern Basin have largely unregulated systems. In most of these catchments, on-farm programs have had limited success in reaching irrigators. Apart from the Border Rivers (QLD) which recovered 11.9GL and the Barwon Darling (6.2GL), water savings through on-farm efficiency programs in all other catchments were all below 5GL.
It is estimated that if each small catchment within the MDB was to increase their efficiency measures to a minimum 2% of SDL, an additional 16GL may be obtained from these MDB catchments. Further details are provided in the following pages.
Source: Data from the DAWR and EY analysis.Note water recoveries represent the progress towards bridging the gap between SDL and BDL.
Source: Data from the DAWR and EY analysis.
-
50
100
150
200
250
300
350
BorderRivers(NSW)
BarwonDarling
IntersectingStreams
BorderRivers(QLD)
Warrego Moonie Nebine
Volu
me
(GL)
Small MDB (Northern Basin) catchment total water recovery
Efficiency measures Buyback Other BDL SDL
-
20
40
60
80
100
120
140
160
180
200
LowerDarling
Broken Loddon Campaspe Wimmera Ovens
Volu
me
(GL)
Small MDB (Southern Basin) catchment total water recovery
Efficiency measures Buyback Other BDL SDL
1 Terms of reference 7 Opportunities for efficien ...2 Glossary 8 Cost of efficiency measures3 Executive summary 9 Principles for negating adv ...4 Introduction 10 A program to achieve 450 ...5 Potential socio-economic ... 11 Appendices6 Program design

Analysis of efficiency measures in the Murray-Darling Basin: Opportunities to recover 450GL in additional environmental water through efficiency measures by 2024, with neutral or positive socio-economic impacts | Page 168 of 307
19 January 2018 | Final Report
Opportunities in small catchments – on-farm7 Opportunities for efficiency projects
Conclusions
Assuming more irrigators in small catchments participate in efficiency programs such that the level of water efficiencies reach 2% to 4% of the catchment SDL, it is estimated an additional 14GL to 38GL could be recovered.
Water recovery by catchment
Catchment State SDL Water saving (GL) Water saving/ SDL
Border Rivers (QLD) QLD 298.5 11.9 4.0%
Warrego QLD 117.2 0.4 0.3%
Moonie QLD 82.3 1.4 1.7%
Nebine QLD 29.9 - 0.0%
Border Rivers (NSW) NSW 283.9 3.3 1.2%
Barwon Darling NSW 180.9 6.2 3.4%
Intersecting Streams NSW 113.8 - 0.0%
Lower Darling NSW 45.5 1.3 2.9%
Wimmera VIC 105.5 - 0.0%
Loddon VIC 155.8 0.6 0.4%
Campaspe VIC 120.9 0.2 0.2%
Ovens VIC 80.3 0.1 0.1%
Broken VIC 54.6 0.5 0.9%
Total 1,669.1 25.9 1.6%
Increased water recovery by catchment – 2-4% of SDL scenario analysis
Catchment Increase required to achieve 2-4% of SDL (GL)
Water saving at 2-4% of SDL (GL)
Border Rivers (QLD) N/A – 2 N/A – 13
Warrego 2 – 4 2 – 5
Moonie 0 – 2 2 – 3
Nebine 0 – 1 1 – 1
Border Rivers (NSW) 2 – 8 6 – 11
Barwon Darling N/A – 1 N/A – 7
Intersecting Streams 2 – 5 2 – 5
Lower Darling N/A – 1 N/A – 1.8
Wimmera1 - -
Loddon 3 – 6 3 – 6
Campaspe 2 – 5 2 – 5
Ovens 2 – 3 2 – 3
Broken 1 – 2 1 – 2
Total 14 – 38 21 – 64Source: EY analysis.Source: Data from the DAWR and EY analysis.Note: The above water efficiencies were calculated utilising the assumption that individual catchments can increase their efficiency measures to between 2% – 4% of SDL. However it is acknowledged that Border Rivers was assumed to increase to a maximum of 4.5% from it’s current level of 4.0%. Note totals may not add due to rounding differences.
1 Terms of reference 7 Opportunities for efficien ...2 Glossary 8 Cost of efficiency measures3 Executive summary 9 Principles for negating adv ...4 Introduction 10 A program to achieve 450 ...5 Potential socio-economic ... 11 Appendices6 Program design
In the small catchments, total water recovered through water infrastructure programs to date is 25.9GL (as at 30 June 2017), representing 1.6% of their combined SDL.2
For illustrative purposes, if each small catchment within the MDB were able to increase their efficiency measures to 2% SDL, an additional 14GL may be obtained from the MDB catchments. If this increase in efficiency measures was extrapolated to 4% of SDL, an additional 38GL in water savings may be achieved.
It is noted that this scenario analysis does not take into consideration the characteristics and circumstances of each catchment on an individual basis (unless advised by state jurisdictions) and that the high end of the range of potential savings may be an optimistic estimate. As such, it is recommended that further analysis is carried out to determine the feasibility of the illustrated potential savings in water.
1 VIC advises that on-farm irrigation water efficiencies are not achievable in Wimmera due to the closure of the Wimmera irrigation system.2 SDL=BDL minus local reduction target minus shared reduction target apportioned using the default apportionment method in the Basin Plan.

Analysis of efficiency measures in the Murray-Darling Basin: Opportunities to recover 450GL in additional environmental water through efficiency measures by 2024, with neutral or positive socio-economic impacts | Page 169 of 307
19 January 2018 | Final Report
Other opportunities to improve on-farm efficiency7 Opportunities for efficiency projects
During the consultation phase, stakeholders acknowledged the desire for greater flexibility in the types of projects that could be funded. The following are some examples of productivity improvement projects.
Cultivation diversification
A move to less water intensive forms of cropping may decrease overall water consumption and increase climate resilient farming practices. This may involve changing annual crops to reflect the climate conditions, or installing hydroponic operations. Hydroponic crops have the potential to deliver significantly higher crop yields than conventionally grown crops, utilising less inputs and requiring less land for growth.
Changing farming practices
The adoption of intensive farming practices (increased yields per unit of agricultural land) has the potential to maximise farming profitability whilst decreasing required inputs, including water, capital and labour. This may include transferring from traditional pasture grazing to more intensive farming models (i.e. forage budgeting, pesticide application), with the aim of maximising yields from available land.
An example of evolving farming practices may include the utilisation of Free-Stall Barn Systems (FBS) in the dairy sector, to house livestock within a controlled environment for extended periods of time. The aim of constructing this particular infrastructure includes improved feed ration utilisation, subsequently decreasing production losses and minimising farm operational expenses following the outlay of the required capital for installation. Greater water efficiencies may also be achieved through minimising the livestock’s exposure to severe climates and a more controlled delivery system. However, it is noted this increases the intensity of production (increasing labour and operating costs), and consequent exposure to different risk.
The ability for farmers to increase crop resilience, ultimately delivering higher yields is one pathway to achieving greater water efficiencies through on-farm practices. Modern farming techniques have provided farmers with the opportunity to diversify their crops to better reflect the weather patterns for the region in which they reside. Alternatively, if local weather patterns are not suited to a certain method of farming
practices, more resilient crops may be planted to further maximise on-farm returns.
Technology
Another innovative example of evolving farming practices is the use of devices similar to “fitbits” to monitor dairy cow mastication. The data gathered from this and other similar technologies has enabled more effective feed and grazing approaches and improved productivity from earlier detection of health issues.
It is noted that farmers require support to identify, implement and transition to transformational opportunities, if they are to adapt to more water efficiency practices.
1 Terms of reference 7 Opportunities for efficien ...2 Glossary 8 Cost of efficiency measures3 Executive summary 9 Principles for negating adv ...4 Introduction 10 A program to achieve 450 ...5 Potential socio-economic ... 11 Appendices6 Program design

Analysis of efficiency measures in the Murray-Darling Basin: Opportunities to recover 450GL in additional environmental water through efficiency measures by 2024, with neutral or positive socio-economic impacts | Page 170 of 307
19 January 2018 | Final Report
Opportunities for urban and industrial projects7 Opportunities for efficiency projects
1 A blank cell indicates a zero value or data is not available at the SDL resource unit scale.2 Includes industrial entitlements.3 Urban supplies for local water utilities.4 Includes domestic and stock, industrial and commercial.5 Includes industrial and stock & domestic.6 DAWR, email correspondence, 19 July 2017.
State SDL Resource UnitEntitlement Volume1
(GL)
Stock and Domestic1
(GL)
Total(GL)
Queensland2 Condamine-Balonne 10.66 10.66Qld Border Rivers 2.68 2.68Moonie 0.01 0.01Nebine 0.16 0.16WarregoParoo 0.04 0.04Total Qld 13.54 13.54
New South Wales3 NSW Border Rivers 0.62 1.00 1.62Gwydir 3.84 2.74 6.58Namoi 19.19 2.28 21.46Macquarie-Castlereagh 18.85 5.96 24.81Barwon-Darling Watercourse 5.44 0.92 6.36Lachlan 15.55 12.88 28.43Murrumbidgee 43.59 35.04 78.63Lower Darling 10.14 1.37 11.51NSW Murray 36.69 17.09 53.78Total NSW 153.88 79.29 233.17
Australian Capital Territory Icon Water Dam Extractions 71.00 71.00Victoria4 Goulburn 37.77 37.77
Broken 2.32 2.32Campaspe 51.03 51.03Loddon 7.32 7.32Kiewa 1.11 1.11Ovens 11.62 11.62Victorian Murray 59.41 59.41Wimmera-Mallee 47.14 47.14Total Victoria 217.72 217.72
South Australia5 SA River MurrayMetro Adelaide 130.00 130.00SA Country Towns 50.00 50.00Private industrial, S&D 14.06 14.06
SA Murray (non-prescribed groundwater and surface water and prescribed groundwater sources)Eastern Mount Lofty RangesTotal SA 194.90 194.06
Urban Basin Total N/A N/A N/A 729.49
Regional centres across the MDB also possess water entitlements for urban use. The following table provides an indication of the number of urban water entitlements across the MDB.6
As shown, there is 729.49GL of urban entitlements in the MDB, and the majority of catchments have less than 50GL in entitlements.
In analysing urban water opportunities, there are restrictions and complexities in each state. For example, in NSW they cannot be traded out on a permanent basis (i.e. sold). In addition, urban entitlements may be held by states, water utilities, or regional councils. Therefore, any arrangements to transfer entitlements to the Commonwealth may be lengthy and complex.
Due to the huge range of stakeholders involved across the Basin, a collaborative and open book approach is required to progress existing urban opportunities quickly, as well as build potential initiatives.
Source: Data from the DAWR and EY analysis.
1 Terms of reference 7 Opportunities for efficien ...2 Glossary 8 Cost of efficiency measures3 Executive summary 9 Principles for negating adv ...4 Introduction 10 A program to achieve 450 ...5 Potential socio-economic ... 11 Appendices6 Program design

Analysis of efficiency measures in the Murray-Darling Basin: Opportunities to recover 450GL in additional environmental water through efficiency measures by 2024, with neutral or positive socio-economic impacts | Page 171 of 307
19 January 2018 | Final Report
Urban and industrial projects need to be considered as part of opportunities to recover 450GL under the Terms of Reference.
Previous programs4
The Commonwealth has previously funded urban water projects, primarily with the objective of improving water security for metropolitan and regional communities; returning approximately 42GL of water in the Murray-Darling Basin.
Previous programs have included:
► National Urban Water and Desalination Plan (NUWDP)
► National Water Security Plan for Cities and Towns (Cities and Towns)
► Strengthening Basin Communities Programme (SBC).
Projects funded under the programs included:
► Large scale desalination plants
► Stormwater and wastewater reuse schemes
► Demand management and improved technology
► Water pipeline leakage and pressure reduction.
Lessons from previous urban water programs► Larger projects (water savings in excess of
1,000ML per year) were the most cost effective.
► Larger projects tended to involve large industrial or municipal end users to provide the necessary economies of scale.
► Some types of smaller scale projects can be competitive. Recycled water projects can produce water savings cost effectively, potentially due to the ability to leverage existing water treatment infrastructure.
Smaller projects can be cost effective depending on the following factors:
► Available land for wetlands, storage, and treatment
► Ability to construct a distribution network (e.g. greenfield or brownfield sites)
► Demand for non-potable use
► Ability to discharge surplus.
Cost of urban recycled water schemesThe indicative range of costs of building water recycling into a new development is between $5,000 to $20,000 per household for recycled water infrastructure1. For a new development of 1,000 households, in a high efficiency system (85% of waste water recycled), there is a potential saving of approximately 161ML per annum (0.062ML waste per person2 to be recovered in high efficient system and 2.6 people per household3) in recycled waste water. To obtain this water, the Commonwealth could afford to contribute between approximately $700,000 to $1,000,000 in exchange for water entitlements (using the value of 16ML for the new development, a range of multipliers between 1.75 and 2.5, and assuming a market cost of $2,500 per ML), or up to $1,000 per household.
While this government spend may not be sufficient to
install recycled water infrastructure in each household, communities may already be investing or operating infrastructure that could be leveraged (or supported) to save further water for the environment. Local councils may invest in order to experience additional benefits such as:
► Water security
► Urban amenity; including health benefits from reducing heat island through additional water used for park/garden watering, and green drought resistant parks and gardens
► Investment in large-scale water/waste water treatment and network.
Opportunities for urban and industrial projects7 Opportunities for efficiency projects
Conclusions
Larger projects are more cost effective.
At a minimum, governments should provide information and education to local councils and licensees of urban licences in the Murray-Darling Basin (where these might be different), to raise awareness of the potential. Raising the possibility for greater conversation and funding of initiatives regarding urban water.
Investment in recycling water initiatives to coincide with or leverage local investment (e.g. councils, communities, or water bodies).
1 As per recent analysis EY has undertaken with a number of water utilities and with developers.2 DEHP (QLD) 2016, Waste Water, https://www.ehp.qld.gov.au/water/monitoring/wastewater.html and EY analysis (200L waste per person per day x 365 days x 0.85 x 0.000001).3 ABS 2016, 2016 Census QuickStats, http://www.censusdata.abs.gov.au/census_services/getproduct/census/2016/quickstat/036. 4 Email correspondence from DAWR, July 2017.
1 Terms of reference 7 Opportunities for efficien ...2 Glossary 8 Cost of efficiency measures3 Executive summary 9 Principles for negating adv ...4 Introduction 10 A program to achieve 450 ...5 Potential socio-economic ... 11 Appendices6 Program design

Analysis of efficiency measures in the Murray-Darling Basin: Opportunities to recover 450GL in additional environmental water through efficiency measures by 2024, with neutral or positive socio-economic impacts | Page 172 of 307
19 January 2018 | Final Report
Opportunities for urban and industrial projects7 Opportunities for efficiency projects
Urban opportunities can be considered broadly – when looking at the multiple rural communities across the Basin. However, there are larger opportunities that should be developed as a priority.
Opportunities in the MDBSouth AustraliaAdelaide Desalination Plant (ADP)
The ADP was completed in 2012 to provide a climate-independent source of water for metropolitan Adelaide, in addition to the state’s traditional sources (including the Mount Lofty Ranges reservoirs and the River Murray). The combination of these resources provides the necessary water security to underpin economic and population growth to 2050.
In full operation, the ADP is capable of delivering 100GL per annum – approximately half of Adelaide’s annual water needs. In recent years the plant has been operated at minimum production to avoid shut-down and restart energy costs, contributing on average 30ML per day for nine months of the year (producing approximately 8GL per year). This operating approach has been verified as being prudent and efficient by the Essential Services Commission of South Australia (ESCOSA), in its determination of SA Water’s Regulatory Business Proposal 2016-2020.
There is opportunity to undertake a cost-benefit analysis, to consider whether additional investments could be made in the ADP; to allow it to be operated at a higher rate and offset existing River Murray water requirements for metropolitan Adelaide and thereby
increase the volume of water provided to the environment. This study would need to consider current and projected future demand for water for metropolitan Adelaide, as well as the total costs that would be incurred through preferential use of the ADP.
The proposal assumes the measure would operate on a temporary basis, accessing spare ADP capacity when not otherwise required to meet the water requirements of metropolitan Adelaide water users. In future years it is predicted that the full available ADP capacity will be required to meet increased water demands associated with projected growth, and therefore may no longer be available to offset existing licenced demand from the River Murray. If the proposal was to be considered on a permanent basis, fixed and capital costs would also need to be considered given replacement water supply may be required. The net present value of this future fixed and capital cost and whether it is a significant cost, will be dependent on a number of factors including when new investment would be required, what technologies might be applied in the future, and the cost of those technologies.
A 2016 study by Marsden Jacobs Associates1 explored the potential use of the ADP to offset reductions in irrigator’s allocations in dry periods. The study reported that under current water demands for metropolitan Adelaide, and wet conditions in the Mount Lofty Ranges (the cheapest and preferred source of water for metropolitan Adelaide), the minimum volume of take from the River Murray that could be offset by increasing operation of the ADP would be 4.27GL at an incremental variable cost of $950/ML. This volume could increase to 72.89GL at a cost of $510/ML in dry
years in the Mount Lofty Ranges.
It should be noted however that under the new Water Allocation Plan for the River Murray Prescribed Watercourse 2, the volume available from the River Murray for metropolitan Adelaide during dry years has been reduced by 50GL per annum (when irrigators are on allocations of less than 100%). This would reduce the remaining capacity of the ADP that could be freed up for the purposes of participating in an efficiency measure from what was considered in the Marsden Jacobs analysis.
It should also be noted that the Marsden Jacobs study focussed on the potential value of irrigator’s allocations, but did not include a value engineering analysis of the current and future potential costs, risks and opportunities of operating the ADP versus alternative supply approaches.
Furthermore, analysis has not been undertaken on what infrastructure investments could be made to reduce the cost of operation of the ADP. For example, the largest operating cost differentiator between desalinated water treatment and traditional treatment is energy cost. At present, the ADP has a contract with AGL to provide roughly 57MW in energy capacity per year 3 to alleviate energy costs. If the ADP was to produce 50GL of water per annum, and the Commonwealth paid for each GL based on the price of water entitlement (assuming a market price of $2,500 per ML) and a multiple between 1.75 and 2.5, the Commonwealth could fund energy and other infrastructure costing between $220 to $310 million
1 Marsden Jacob Associates 2016, Benefit Cost Analysis: Potential Use of Adelaide desalinisation plant to offset reductions in irrigator’s dry periods. 2 Natural Resources SA Murray-Darling Basin n.d., Water Allocation Plan: River Murray Prescribed Watercourse, http://www.naturalresources.sa.gov.au/samurraydarlingbasin/water/water-allocation-plans/river-murray-wap.3 AGL 2009, South Australian desalination renewable energy contract underlines strength of AGL’s renewable energy position, https://www.agl.com.au/about-agl/media-centre/asx-and-media-releases/2009/september/south-australian-desalination-renewable-energy-contract-underlines-strength-of-agls-position.
1 Terms of reference 7 Opportunities for efficien ...2 Glossary 8 Cost of efficiency measures3 Executive summary 9 Principles for negating adv ...4 Introduction 10 A program to achieve 450 ...5 Potential socio-economic ... 11 Appendices6 Program design

Analysis of efficiency measures in the Murray-Darling Basin: Opportunities to recover 450GL in additional environmental water through efficiency measures by 2024, with neutral or positive socio-economic impacts | Page 173 of 307
19 January 2018 | Final Report
Opportunities for urban and industrial projects7 Opportunities for efficiency projects
1 In conversation with ICON Water 27th September 2017.
This funding could provide investment to increase ADP operation up to 50GL per year through investment in an alternative energy source and in other measures used to reduce the cost of ADP to support long term sustainable water supply for Adelaide.
The capital cost for a windfarm is approximately $2.1m per MW, as well as an upfront development cost of between $3 to $5m. Hence, for a 60MW plant the cost would be around $130m.
Given the size of this opportunity, the potential for an infrastructure investment by the Commonwealth to offset large components of the operating cost of the plant, and the potential for the ADP to be part of a solution for the 62GL bridging the gap commitment, it is recommended that further cost-benefit analysis work is undertaken to better develop this opportunity.
Australian Capital TerritoryIcon Water
Icon Water currently provides Canberra with drinking water and wastewater services, delivering more than 100ML of water each day. During stakeholder consultation, it was noted that Icon Water receives approximately 71GL in water entitlements annually for urban consumption, of which up to 29GL represents capacity for future growth in the ACT.
Accommodating for forecasted population growth in the Canberra region, there is a potential amount of up to 29 GL of returns which could then become available for a future entitlement that could be transferred to the
CEWH.1 There is potential, that in exchange for the entitlements, a fund for future infrastructure investment could be developed as an alternative to immediate projects. This fund may include funding for measures such as energy efficiency, sewage treatments or wetland construction.
Specific infrastructure projects that could be invested to support the sustainable growth of Canberra and allow the release of 29GL of entitlements could include:
► A miniature hydro system at the STP discharge cascades to offset energy costs at the plant
► Energy generation from sludge digestion at STP to offset energy and other operational costs associated with solids handling, generate heat for biological treatment etc.
► Wetland construction associated with the discharge pathway to ensure additional water quality treatment
► Improved in-network monitoring to identify and manage risks of illegal substance inputs to sewer, understand sewage characteristics and monitor flows to ensure better control over inflows to the plant to ensure continued high standards of effluent discharge.
In addition to the maximum of 29GL of consumable water already returned to the system, it was acknowledged that further savings could be obtained through substituting potable water with recycled water.
The ACT Government would need to be involved in conjunction or in coordination with Icon Water in
developing and implementing opportunities. The capacity to trade water out of the ACT involves the ACT Government. Further, there are key issues in water planning that would also involve the ACT Government.
Conclusions
The ADP is currently operating at minimum production to avoid shut-down and restart energy costs, contributing to about 8GL per year to South Australia’s water requirements.
The time required to increase production at the ADP is shorter than alternative sources.
The ADP has the potential to contribute up to 50GL from available capacity if further investment such as in a renewable energy source facility could be used to make production cost competitive, and subject to maintaining capacity for the sustainable growth for Adelaide.
Icon Water currently has 29GL of water entitlements available for future growth in the ACT that could be released in exchange for investment in water efficiency projects or a water efficiency fund. ACT has the potential to achieve further savings through water recycling.
1 Terms of reference 7 Opportunities for efficien ...2 Glossary 8 Cost of efficiency measures3 Executive summary 9 Principles for negating adv ...4 Introduction 10 A program to achieve 450 ...5 Potential socio-economic ... 11 Appendices6 Program design

Analysis of efficiency measures in the Murray-Darling Basin: Opportunities to recover 450GL in additional environmental water through efficiency measures by 2024, with neutral or positive socio-economic impacts | Page 174 of 307
19 January 2018 | Final Report
Opportunities for urban and industrial projects7 Opportunities for efficiency projects
Other urban opportunitiesEfficiencies can be generated in even the smallest of catchments, but these may come at a greater cost than efficiencies generated in larger catchments due to a limit on resourcing, ability to achieve economies of scale and ability to invest in the business case.
There may be greater potential for further efficiency measures in larger catchment regions. Goulburn Valley Water was identified as an example of a smaller water user (less than 28GL annually), for which opportunities are not as readily available. Although, it was acknowledged that Victorian urban regions could further optimise their networks through intelligent metering and remote leakage locating technology.
Through stakeholder consultations it was noted that a majority of councils hold a theoretical understanding of how they may achieve additional water efficiency measures. However, these councils may experience difficulties in achieving these through application and implementation phases. It was noted that in order to assist in maximising water efficiencies, councils would welcome further support in identifying and actioning efficiency programs.
Water Delivery Efficiency Opportunities
The opportunity for further urban water efficiencies was analysed only in those urban centres with a population of greater than 50,000 residents. This population parameter was pursued for illustrative purposes only and the large number of small urban centres within the MDB meant that estimating for all small regional centres without taking into consideration the specific circumstances of the community may lead to
unintended consequences. Adelaide and Canberra were excluded as it is considered to have already developed initiatives.
The urban water efficiency scenarios explore the potential for decreased water losses through further optimisation of the water network within the urban centre. With an assumed operating efficiency of 80% amongst all nominated regional centre, each scenario explores the potential to minimise water losses through an increase/decrease in the networks operating efficiency.
Assuming 0.18ML2 of water usage per person per year (including business use), the following conclusions regarding delivery efficiency can be made from the table on the next page:
► For a smaller community, such as Wagga Wagga, moving from 75% efficiency to 95%, would result in a saving of 2,002ML (i.e. 3.5% of annual water used).
► Consequently, cities or towns with smaller populations will not be able to generate the same level of water savings/efficiency gains. There is an increase in cost for smaller communities in terms of infrastructure cost per head. However, there are townships of less than 50,000 which may have the ability to perform strongly or grow.
It is assumed that each of the five regional centres (excluding Canberra) operate at 80% efficiency, but can move to 85% or 90% efficiency, there is a potential water saving of 3,854ML to 7,708ML for the five communities.
Conclusions
Smaller catchment regions encounter additional difficulties (i.e. resourcing, scale) when attempting to realise efficiency measures, meaning on average they are likely to be less cost effective than larger projects.
The ability of smaller catchment regions to recycle will continue to exist. However, a limit on resourcing and ability to achieve substantial efficiency measures will limit the impact on achieving the 450GL.
Optimising water delivery or enabling stormwater harvesting could be an opportunity for Adelaide. The city has had previous success on a regional scale, the expansion or interconnection of these networks could produce increased demand and utility.
1 In conversation with ICON Water 27th September 2017.2 Riverina Water County Council 2016, Average Water Use, https://www.rwcc.nsw.gov.au/save-water/average-water-use, and EY analysis.
1 Terms of reference 7 Opportunities for efficien ...2 Glossary 8 Cost of efficiency measures3 Executive summary 9 Principles for negating adv ...4 Introduction 10 A program to achieve 450 ...5 Potential socio-economic ... 11 Appendices6 Program design

Analysis of efficiency measures in the Murray-Darling Basin: Opportunities to recover 450GL in additional environmental water through efficiency measures by 2024, with neutral or positive socio-economic impacts | Page 175 of 307
19 January 2018 | Final Report
Opportunities for urban and industrial projects7 Opportunities for efficiency projects
Water Delivery Opportunities cont.
The urban water scenarios explore the potential for improving delivery efficiency of water networks and reducing losses. Both low recovery (75%) and high recovery (85%) scenarios arose through stakeholder consultation and may be subject to specific external considerations within different regional areas (e.g. varying energy costs).
It is noted that these scenarios are for illustrative purposes only and do not take into account the specific characteristics and/or circumstances of the individual regional centres and the suitability for increased utilisation of recycling water.
Conclusions
Existing infrastructure can be leveraged or improved to return water entitlements to the Basin
Potential savings of 3.9GL to 7.7GL across the larger council areas, assuming delivery system efficiency moves from 80% efficiency to 85% or 90% efficiency respectively.
Urban water efficiency scenario analysis
System efficiency, limitations relating to water loss (ML) (assuming)
Town State Urban population (2016)
Annual water usage per urban community (ML) 75% 80% 85% 90% 95%
Canberra ACT 402,851 72,050 (18,012) (14,410) (10,807) (7,205) (3,602)
Toowoomba QLD 153,201 27,400 (6,850) (5,480) (4,110) (2,740) (1,370)
Albury-Wodonga NSW / VIC 102,348 18,305 (4,576) (3,661) (2,746) (1,830) (915)
Shepparton VIC 64,888 11,605 (2,901) (2,321) (1,741) (1,161) (580)
Wagga Wagga NSW 55,960 10,008 (2,502) (2,002) (1,501) (1,001) (500)
Mildura VIC 54,564 9,759 (2,440) (1,952) (1,464) (976) (488)Source: Riverina Water County Council (2016) and EY analysis.
1 Terms of reference 7 Opportunities for efficien ...2 Glossary 8 Cost of efficiency measures3 Executive summary 9 Principles for negating adv ...4 Introduction 10 A program to achieve 450 ...5 Potential socio-economic ... 11 Appendices6 Program design

Analysis of efficiency measures in the Murray-Darling Basin: Opportunities to recover 450GL in additional environmental water through efficiency measures by 2024, with neutral or positive socio-economic impacts | Page 176 of 307
19 January 2018 | Final Report
Opportunities for urban and industrial projects7 Opportunities for efficiency projects
Recycled Water Opportunities
Water recycling is generally carried out at a council’s waste water treatment plant (WWTP) or sewage treatment plant (STP). Through stakeholder consultations, it was noted that additional treatment of water is declining due to low demand and/or higher costs. At present, recycled water is treated to ‘fit for purpose’ standards under each jurisdiction’s regulations.
The table below is based on assumptions of 200L waste water produced per person1, and the potential efficiency of a waste water treatment plant. The following conclusions can be drawn:
A high recovery rate (85%) delivers on average 242.4 extra ML (using the five examples below, excluding Canberra).
The higher the population, the more water in the system, and consequently the more water recovered. But water recovered per person remains the same
regardless of population; under a high recovery rate of 0.023ML per person.
As previously noted, the cost of recycled water or stormwater schemes may not be economic in their own right without investment from governments and communities to value the wider socio-economic benefits (such as water security) arising from the schemes.
Assuming each of the five regional communities in the previous page (not including Canberra), increased water reuse from 75% to 85%, there is the potential for a further 1,212ML in savings.
Aside from recycled water and delivery management changes, the smart management of water (e.g. to direct funding to commercial users to improve their on-site management) is an education opportunity available to all communities, irrigators and industry bodies.
There is also the opportunity to invest in stormwater harvesting as a source for water recycling. However,
the viability of stormwater harvesting as an efficiency measure would need to be considered due to its variability in yield.
1 Department of Environment and Heritage Protection 2016, Waste Water, https://www.ehp.qld.gov.au/water/monitoring/wastewater.html.
Conclusions
Leveraging existing infrastructure is more cost effective when compared to building a new structure.
Increasing the recycled water recovery from 80% to 90% would provide approximate between an additional 0 to 1.2GL in saving.
Urban waste water scenario analysis
Reuse of waste water (ML)
Town State Urban population (2016) Waste water per annum (ML) Low recovery (75%) High recovery (85%) Difference between high and low
Canberra ACT 402,851 11,311 8,483 9,614 1,131Toowoomba QLD 153,201 4,301 3,226 3,656 430Albury-Wodonga NSW / VIC 102,348 2,874 2,155 2,443 288Shepparton VIC 64,888 1,822 1,366 1,549 183Wagga Wagga NSW 55,960 1,571 1,178 1,336 158Mildura VIC 54,564 1,532 1,149 1,302 153
Source: DEHP (QLD) 2017, ABS 2016 data and EY analysis.
1 Terms of reference 7 Opportunities for efficien ...2 Glossary 8 Cost of efficiency measures3 Executive summary 9 Principles for negating adv ...4 Introduction 10 A program to achieve 450 ...5 Potential socio-economic ... 11 Appendices6 Program design

Analysis of efficiency measures in the Murray-Darling Basin: Opportunities to recover 450GL in additional environmental water through efficiency measures by 2024, with neutral or positive socio-economic impacts | Page 177 of 307
19 January 2018 | Final Report
The Terms of Reference asks EY to provide advice on the notified efficiency measures to recover the 450GL.
Notified efficiency measuresOn 22 April 2016, the Ministerial Council agreed to a package of supply, constraint and efficiency measures. The package agreed by the Ministerial Council in relation to efficiency measures set out a wide range of on-farm, off-farm, urban, industrial and mining projects. The notified efficiency measures are included in Appendix C.
Feedback from stakeholders during consultations was that there needs to be flexibility in the types of projects that are undertaken, both in relation to on-farm and off-farm projects. This flexibility is important to encourage innovation and new technologies, and to reaching the water recovery target of 450GL.
Efficiency projects to recover 450GL of water should improve value of production on-farm and reduce reliance on water.
It is recommended that the notified efficiency measures schedule be amended to include a reference to any other efficiency projects that improves the value of production on-farm and reduces the reliance on water.
Improvements to notified efficiency measures7 Opportunities for efficiency projects
Conclusions
The notified efficiency measures schedule could be amended to include a reference to any other efficiency projects that improves the value of production on-farm and reduces the reliance on water.
1 Terms of reference 7 Opportunities for efficien ...2 Glossary 8 Cost of efficiency measures3 Executive summary 9 Principles for negating adv ...4 Introduction 10 A program to achieve 450 ...5 Potential socio-economic ... 11 Appendices6 Program design

Analysis of efficiency measures in the Murray-Darling Basin: Opportunities to recover 450GL in additional environmental water through efficiency measures by 2024, with neutral or positive socio-economic impacts | Page 178 of 307
19 January 2018 | Final Report
How to ensure efficiency measures do not impede focus on bridge the gap efforts
7 Opportunities for efficiency projects
The ‘bridge the gap’ target of 2,680GL to the current SDL (down from 2,750GL following the Northern Basin review) looks on track to be met. The table below reflects the contracted volume water recovery as at 31 October 2017.
Progress of 'bridging the gap‘ (31 October 2017)
Source: DAWR
The Sustainable Diversion Limit (SDL) and the SDL Adjustment Mechanism (SDLAM)
Under the Basin Plan, the Commonwealth and Basin States are committed to the introduction of new long-term sustainable diversion limits to fully bridge the water recovery gap by 2019. The SDL of 10,873GL will be implemented through water resource plans to be completed by Basin States by 2019. The SDL may be adjusted through the SDL Adjustment Mechanism, discussed in Chapter 4.
The gap to ‘bridging the gap’
The remaining surface water gap to be bridged in the Southern Basin as at 31 October 2017 is estimated to be around 565GL. Basin governments have agreed to a suite of projects which make the delivery of water more efficient and flexible. An assessment by the MDBA has determined a proposed offset of 605GL through the SDL Adjustment Mechanism.
At the time the Terms of Reference were set out there was uncertainty on the supply measures and volume of supply measures that would be determined. There may have been concern that if these had not been approved and if the bridge the gap was not on target, efficiency measures could have impeded focus.
For the full SDL offset of 605GL to be realised within the 5% limit on the SDL adjustment, at least 62GL of efficiency measures will be required to be recovered using funding from the Water from the Environment Special Account and potentially the transfer of gap-bridging water into efficiency measures.
Given supply measures have been determined and bridge the gap efforts are now on track, delivering efficiency measures is not likely to impede the bridge the gap efforts. In fact, delivering efficiency measures is needed by 2019 to enable the full offset of 605GL of supply measures.
There may be scope to transfer some existing currently held water into efficiency measures up to the difference between the gap-bridge target and the available supply measures. Currently this could be an amount of up to 35GL, refer to Chapter 8.
In the Northern Basin, as at 31 October 2017, the remaining volume to be recovered is approximately 77GL. The water recovery target volume (390GL target) has subsequently been reduced by 70GL to 320GL following the conclusion of the Northern Basin Review.
These revised water recovery targets are based on current estimates of the actual and forecast water recovery outcomes of contracted and planned projects and do not take into consideration any changes to recovered water volumes that may occur through the accreditation of water resource plans which contain finalised capped factors that are used in the calculation long term average annual yields.
Catchment Target Recovery progress Remaining
Northern Basin Total 390.0 313.2 76.8
Southern Basin
NSW zone 1,048.0 774.7 273.3
ACT zone 4.9 4.9 0.0
VIC zone 1,052.3 800.5 251.8
SA zone 183.8 143.9 39.9
Southern Basin Total 2,289.0 1,723.9 565.1
Other
Disconnected NSW (Lachlan)
48.0 48.0 0.0
Disconnected VIC (Wimmera-Mallee)
23.0 22.6 0.4
Other Total 71.0 70.6 0.4
TOTAL BASIN 2,750.0 2,107.7 642.3
1 Terms of reference 7 Opportunities for efficien ...2 Glossary 8 Cost of efficiency measures3 Executive summary 9 Principles for negating adv ...4 Introduction 10 A program to achieve 450 ...5 Potential socio-economic ... 11 Appendices6 Program design

Analysis of efficiency measures in the Murray-Darling Basin: Opportunities to recover 450GL in additional environmental water through efficiency measures by 2024, with neutral or positive socio-economic impacts | Page 179 of 307
Cost of efficiency measures
8
In this section Page
Overview 180
Key findings 181
Investing in water efficiency measures – irrigators and the Commonwealth 183
Assessment methodology - approach 184
Assessment methodology – data sources and limitations 185
Variability in the market and program water price 186
Water recovery by program – On-Farm Irrigation Efficiency Program (OFIEP) 188
Water recovery by program – NSW Private Irrigation Infrastructure Operators Progra ... 189
Water recovery by program – QLD Healthy HeadWaters Program (HHWUE) 190
Water recovery by program – PIIP-SA 191
Summary of funding multiples and funding per ML of programs 192
Recovering the 450GL within the statutory budget 195
Scenario analysis of differing LTAAYs 196
Factors influencing the future cost of water efficiency measures (risks and opportunities) 198
Implications for program design - price discovery 199

Analysis of efficiency measures in the Murray-Darling Basin: Opportunities to recover 450GL in additional environmental water through efficiency measures by 2024, with neutral or positive socio-economic impacts | Page 180 of 307
19 January 2018 | Final Report
Overview8 Cost of efficiency measures
Statutory requirements Factors influencing the future cost Cost of on-farm programs
► The Terms of Reference require advice on the anticipated cost of recovering the 450GL of water through efficiency measures, consistent with statutory requirements.
► Under the Water Act, $1.575 billion has been set aside to recover the 450GL through efficiency programs.
► A range of factors could affect the future cost of water recovery including, but not limited to:► Value of water entitlements and multiple applied► Environmental conditions and commodity prices► Technology, cost and use of infrastructure► Government policy► Ability to use some of the projects nominated to
bridge the gap as efficiency measures to meet the 450GL target.
► The cost of OFIEP and HHWUE has been analysed over time.
► The average unweighted funding multiple under OFIEP decreased from a high of 2.34 in round 2 to 1.77x in round 5.
► Under HHWUE, average unweighted funding multiple varied from 1.70x in round 2 to 2.46x in round 7.
Cost of off-farm program Stakeholders’ views on cost of projects Scenarios on recovering the 450GL
► The PIIOP and PIIPSA program cost over time has been analysed over time.
► The cost of the PIIOP program varied over time, with a minimum funding per ML of $3,680 in round 2 and maximum of $4,874 per ML in round 3.
► Under PIIP-SA the average unweighted funding multiple decreased from 2.68x in round 1 to 2.30x in round 2.
► Under PIIOP, the average unweighted funding multiple decreased from 2.34x in round 1 to 1.87x in round 3.
► Stakeholders’ views are generally that a funding multiple of greater than 2.0x is required to attract further on-farm opportunities.
► Stakeholders’ have also suggested that further off-farm opportunities where systems have already been modernised would come at significantly greater cost than historical programs, ranging between $6,500 to $11,000 per ML.
► Scenario analysis was undertaken to determine the feasibility in achieving the 450GL water recovery target on a long term average annual yield (LTAAY) basis under multiple scenarios (49% / 73% / 94% LTAAY).
► The scenario analysis demonstrates that the ability to recover the 450GL within the statutory budget and at different multiples will be dependent on the mix of entitlements and associated price and LTAAY factor.
1 Terms of reference 7 Opportunities for efficiency ...2 Glossary 8 Cost of efficiency measures3 Executive summary 9 Principles for negating adv ...4 Introduction 10 A program to achieve 450 ...5 Potential socio-economic ... 11 Appendices6 Program design

Analysis of efficiency measures in the Murray-Darling Basin: Opportunities to recover 450GL in additional environmental water through efficiency measures by 2024, with neutral or positive socio-economic impacts | Page 181 of 307
19 January 2018 | Final Report
Key findings8 Cost of efficiency measures
8.1 There are a variety of factors influencing the future cost of water efficiency measures
► A broad range of variables have the potential to affect the future cost of water recovery including the value of water entitlements, the funding multiple applied, environmental conditions, commodity prices, technology, cost and use of infrastructure, government policy and the ability to use some of the projects nominated to bridge the gap as efficiency measures to meet the 450GL target.
8.2 Funding multiple for on-farm efficiency projects
► Historical average on-farm funding multiples (unweighted) ranged from 1.70x to 2.46x, whilst average funding per ML ranged from $2,399 to $4,852 on a program round basis.
► Stakeholders have indicated an unweighted funding multiple of greater than 2.0x would be needed to attract further on-farm opportunities.
8.3 Cost of off-farm efficiency projects
► Historical average off-farm funding multiples (unweighted) ranged from 1.87x to 2.68x, whilst average funding per ML ranged from $3,680 to $5,773 on a program round basis.
► Stakeholders have indicated that further off-farm efficiencies where systems have already been modernised will come at significantly greater cost, potentially requiring funding of $8,000 to $10,000 per ML.
8.4 Scenarios on recovering the 450GL
► The scenario analysis demonstrates that the ability to recover the 450GL within the statutory budget and at different multiples will be dependent on the mix of entitlements and associated price and LTAAY factor. At an LTAAY factor of 0.73, the 450GL can be recovered within the statutory budget at water prices up to $1,460 and an associated funding multiple of 1.75x.
8.5 Cost risk ► Given the volatility of the water market price and anticipated increase in future water prices over time, there is a significant risk in achieving the recovery of the 450GL within the statutory budget.
► The requirement to provide funding multiples high enough to encourage early and ongoing participation and efficiency measure uptake needs to be balanced with ensuring that the multiple and early spending does not lead to funding requirements greater than the statutory budget over the full period.
1 Terms of reference 7 Opportunities for efficiency ...2 Glossary 8 Cost of efficiency measures3 Executive summary 9 Principles for negating adv ...4 Introduction 10 A program to achieve 450 ...5 Potential socio-economic ... 11 Appendices6 Program design

Analysis of efficiency measures in the Murray-Darling Basin: Opportunities to recover 450GL in additional environmental water through efficiency measures by 2024, with neutral or positive socio-economic impacts | Page 182 of 307
19 January 2018 | Final Report
Key findings8 Cost of efficiency measures
8.6 Price discovery ► A price discovery mechanism is recommended to determine an appropriate funding multiple for the program, taking into consideration a range of externalities including, cost of infrastructure, water prices and willingness of irrigators to participate within efficiency measures.
1 Terms of reference 7 Opportunities for efficiency ...2 Glossary 8 Cost of efficiency measures3 Executive summary 9 Principles for negating adv ...4 Introduction 10 A program to achieve 450 ...5 Potential socio-economic ... 11 Appendices6 Program design

Analysis of efficiency measures in the Murray-Darling Basin: Opportunities to recover 450GL in additional environmental water through efficiency measures by 2024, with neutral or positive socio-economic impacts | Page 183 of 307
19 January 2018 | Final Report
Investing in water efficiency measures – irrigators and the Commonwealth8 Cost of efficiency measures
In deciding to participate in water efficiency measures, irrigators face a number of decisions, with each individual’s view on participation different given their varied circumstances such as businesses characteristics, financial position, view of risk as well as various other specific considerations. At the same time, the Commonwealth has a statutory budget within which to operate.
The investment and participation decision
Irrigators face a decision making process when deciding whether to participate in programs, noting the voluntary nature of participation. The key areas of consideration are outlined opposite. Irrigators will only participate in programs where the benefit of the project outweighs the value of the water entitlements exchanged for funding, including the consideration of risk (i.e. if infrastructure provides equivalent or enhanced production relative to the entitlement foregone as seen in the below figure). The key insights from this are:
► The program should be designed to gather interest for projects not already being funded (i.e. projects where cost + risk>1)
► The program should only fund projects the combination of cost + risk + profit < program funding and multiple (1.75x in the figure)
► A better understanding of the cost of infrastructure and total project risk is required to the appropriateness of a multiple going forward.
The statutory funding envelope
In order to achieve the additional 450GL beyond the 2,750GL for enhanced environmental outcomes (efficiency measures and constraints management), $1.775 billion in Government funding has been allocated from the Water for the Environment Special Account. It is noted that the additional 450GL is expressed in long-term annual average yield (LTAAY) terms. LTAAY is the long-term average annual allocation that has been applied to each entitlement class for each catchment, allowing the calculation of water recovery across the basin and modelling of water usage for compliance with water limits1.
The market value of water entitlements varies depending on the classification and volume of each type. The volatility of the market water price will therefore impact the achievement of the 450GL within the statutory funding envelope.
Figure: Drivers for program participation
Source: EY analysis.
Risk of operation and maintenance Risk of project delivery
Cost of infrastructure
Profit and/or additional productive capacity
Multiple1.75
1.00
0.00
Assessmentof ability toparticipate
Considerations of project options
Assessment of value of
infrastructure upgrade
Determining program
participation
► Capacity and capability to benefit from upgrades which are dependent on specific farm characteristics. This is influenced by a variety of factors such as financial viability, price of water and farmer and business characteristics.
► Type of project to be undertaken (each with varying level of water efficiency and differing impacts on profitability).
► Project costs including administration and support costs.
► Identifying the benefit of upgrading through an assessment of the value of:► Water efficiency improvements► Non-water productivity improvements► Water entitlement to be exchanged for funding.
► Calculate costs and benefits of project.► Explore program requirements including funding available
administrative burden.► Determine risks associated with participation.► Decide participation.
1 Terms of reference 7 Opportunities for efficiency ...2 Glossary 8 Cost of efficiency measures3 Executive summary 9 Principles for negating adv ...4 Introduction 10 A program to achieve 450 ...5 Potential socio-economic ... 11 Appendices6 Program design
1 It is noted that although LTAAY factors are equivalent to long-term diversion limit equivalent (LTDLE) factors, conceptually they are different. LTAAY is a yield based on past water usage, whilst LTDLE is an assessment of future water use. These factors will be revised when the States put forward water resource plans which are compliant with the Basin Plan requirements. The LTDLE factor is the long-term average annual volume of water expected to be used over the next decade (2029), applied over the historical climate period (1895 to 2009).

Analysis of efficiency measures in the Murray-Darling Basin: Opportunities to recover 450GL in additional environmental water through efficiency measures by 2024, with neutral or positive socio-economic impacts | Page 184 of 307
19 January 2018 | Final Report
Assessment methodology - approach8 Cost of efficiency measures
In order to provide an indication of what an appropriate multiple might be going forward changes in water prices, average market water price per program and historic program multiples have been analysed. The analysis explores data from a number of previous programs, analysing the water savings per round and over time.
Given the uncertainty and broad range of external factors which may play a role in influencing cost associated with achieving the 450GL the total program cost requirements are uncertain. As such, a number of scenarios have been developed to provide further insights into the required factors (types of entitlement, multiple and entitlement price) in order to achieve the water savings within the statutory budget. The following provides an overview as to the approach taken to the costing analysis utilised in this chapter.
Approach
The following information was utilised to form the basis of the detailed analysis undertaken as a part of this chapter:
Water recovery by program
► Commonwealth funding ($m) / Volume of Commonwealth entitlements (GL) = funding per ML ($/ML).
► Unweighted average funding multiple (inclusive of funding for both water and infrastructure installation and/or upgrades).
Average market water price
► Average market water price ($/ML) per project round recorded at the time of allocating program funding.
► It is acknowledged that data was not available for the Queensland Healthy HeadWaters Program (HHWUE) on a project basis, meaning all recorded prices are the average prices provided in the available dataset.
Multiple
► Market analysis ratio used to determine the relative price of water when compared to other transactions and can be interpreted across different catchments and time periods. Multiples within this Report may be recognised as unweighted, funding weighted or volume weighted multiples, with detailed definitions found within the body of the Report.
Unweighted funding multiple
► Funding per ML ($/ML) paid by / Market water price ($/ML).
Average multiple weighted by funding
► Commonwealth funding ($m) * funding multiple / Commonwealth funding ($m).
Average multiple weighted by volume
► Volume of Commonwealth entitlements (GL) * funding multiple / Volume of Commonwealth entitlements (GL).
Historical range of funding multiple and funding per ML of programs
► Minimum, maximum and average on and off-farm market water price ($/ML) across all project rounds
► Minimum, maximum and average on and off-farm unweighted funding multiple across all project rounds (inclusive of funding for both water and infrastructure installation and/or upgrades).
Scenarios for recovering 450GL
► With different entitlements possessing varying entitlement types and associated costs, the scenario analysis explores the feasibility of achieving the Government’s water recovery target within the existing statutory budget at differing LTAAY factors. Detailed explanations and assumptions for each scenario can be located in the body of the Chapter.
Funding per ML
The funding costs per ML highlighted throughout this Chapter are inclusive of the costs associated with water savings through water entitlements transferred to the Commonwealth ($/ML), infrastructure costs and administrative costs associated with project delivery and on delivering both water entitlements and additional private productive benefit to participants.
Given the lack of transparency on the share of private benefit and/or on the cost of infrastructure, inferences can not be made about value for money delivered to government solely using this multiple and is also why funding weighted and volume weighted multiples are included within the analysis.
1 Terms of reference 7 Opportunities for efficiency ...2 Glossary 8 Cost of efficiency measures3 Executive summary 9 Principles for negating adv ...4 Introduction 10 A program to achieve 450 ...5 Potential socio-economic ... 11 Appendices6 Program design

Analysis of efficiency measures in the Murray-Darling Basin: Opportunities to recover 450GL in additional environmental water through efficiency measures by 2024, with neutral or positive socio-economic impacts | Page 185 of 307
19 January 2018 | Final Report
Assessment methodology – data sources and limitations8 Cost of efficiency measures
Data sources
The information assessed has been provided by the Australian Government Department of Agriculture and Water Resources. It is noted that the accuracy of the data or the information and explanations provided have not been independently verified.
All water recoveries as shown is this chapter are in LTAAY terms.
Limitations
In order to estimate the appropriateness of the funding multiple, an analysis of the costs including multiples of previous programs has been undertaken. The results of this analysis, combined with feedback from stakeholders, as well as assumptions and proxy indicators have been used to undertake the analysis. In such cases, assumptions or proxy indicators have been highlighted.
The followings limitations should be taken into consideration when reading this chapter and have limited the ability to conduct a more thorough analysis of the cost of efficiency measures within the MDB. These include:
► A lack of consistent reporting metrics across all water recovery programs within the MDB has limited the analysis to the following programs1:
► OFIEP Pilot Program, plus Rounds 1 to 5
► QLD HHWUE Rounds 1 to 11
► NSW PIIOP Rounds 1 to 3
► PIIP-SA Rounds 1 and 2.
► Data sources provided by government agencies have been utilised on face value and not cross-referenced against alternative MDB data sources provided by different sections of government or industry participants. As such, discrepancies in the estimated cost of water savings may result from the utilisation of alternative datasets (i.e. reporting metrics).
► Stakeholders have identified various programs that are believed to represent
programs that would be undertaken in the future and therefore have similar indicative costs of future water efficiency measures. In addition they also identified programs they believe are outliers which will not be representative of future costs. In the absence of a more comprehensive dataset, these were unable to be quantitatively analysed.
► It is noted that commentary within this Chapter qualitatively explores the factors in which should be taken into consideration when analysing whether the past performance of water efficiency programs are indicative of future programs.
► The data utilised in this analysis was current as of 30 June 2017. Since this date, material events may have occurred since completion which are not reflected within this Report. Further, the multiples highlighted were current at the time in which project funding was agreed and may have changed leading up to or during implementation phase. Without information about changes throughout the various phases, the multiples at the time of funding have been assessed.
Required data for further analysis
In order to conduct a more detailed analysis of the MDB and cost of efficiency measures, it is recommended that a more comprehensive dataset is compiled. This may include the following information for all water recovery:
► Total funding – including infrastructure costs, water costs, delivery costs and administrative costs).
► Industry in which participants operate – primary industry, including historical/proposed industry changes.
► Water savings – total water savings, proportion transferred to government, water source and entitlement class.
► Efficiency measures – type, size, cost and proposed benefits of proposed efficiency measures.
► Productivity and financial benefits for participants.
1 It is noted that data limitations prevented further analysis of water recovery programs across all jurisdictions. Programs were selected on the basis that analysis could be conducted on a time series basis. Additionally, the analysis within this Chapter did not explicitly analyse entitlement types on a project basis.
1 Terms of reference 7 Opportunities for efficiency ...2 Glossary 8 Cost of efficiency measures3 Executive summary 9 Principles for negating adv ...4 Introduction 10 A program to achieve 450 ...5 Potential socio-economic ... 11 Appendices6 Program design

Analysis of efficiency measures in the Murray-Darling Basin: Opportunities to recover 450GL in additional environmental water through efficiency measures by 2024, with neutral or positive socio-economic impacts | Page 186 of 307
19 January 2018 | Final Report
Market prices
Water trading within the MDB allows for water to be bought and sold and ultimately enables allocation to its highest value use. The need for varying levels of water is particularly relevant in water intensive farming practices where the demand for water is managed alongside the cyclical nature of farming. The MDB water market is developed on a ‘cap and trade’ system, where the cap represents the total pool of water available for consumptive use. Available water is distributed to users via water rights, which are administered by the basin states. The two primary types of rights which are traded within the MDB are1:
► Water access entitlements – ongoing rights to a share of the total amount of water available in a system
► Water allocations – actual amount of water available under water access entitlements in a given season.
Due to the different classifications and geographical demand of water within the MDB, the market price is a result of market forces at the time of sale (supply and demand). The water entitlement trade history graph below illustrates that volume weighted average price (VWAP) and traded water volumes have fluctuated significantly over the last decade.
However as can be seen, since 2013-14 there has been a trend of increasing water
prices. Stakeholders have raised the question of what it means for program participation if this trend continues. The price of water itself should not necessarily influence participation levels. While there may be a stronger incentive for irrigators to undertake upgrades themselves as a result of higher water prices (given a stronger incentive to enhance water efficiency) they may still access the program to leverage the multiple available. Other factors which will influence participation are the cost of infrastructure and the private benefit able to be achieved, amongst others.
Off-farm programs - water entitlement price over time
► The average off-farm water market price on a project basis over time (limited to those identified programs) was $2,063. Water market prices are based on the trading water evaluation price at the point in time in which government funding was committed for the program.
► The average market price decreased by 12% between rounds one and two of PIIP-SA. However, it is noted that a large range of factors may be influencing the relatively small sampling size.
► NSW PIIOP was the only program analysed in which the average water market price increased over time. Between rounds one and three, the average market increased by 56% to a price of $2,679 in round three.
Variability in the market and program water price8 Cost of efficiency measures
Source: Australian Government Bureau of Meteorology.
$0
$200
$400
$600
$800
$1,000
$1,200
$1,400
$1,600
$1,800
0200,000400,000600,000800,000
1,000,0001,200,0001,400,0001,600,0001,800,0002,000,000
2007-08 2008-09 2009-10 2010-11 2011-12 2012-13 2013-14 2014-15 2015-16 2016-17 2017-18
Volu
me
wei
ghte
d av
erag
e pr
ice
(VW
AP)
($/M
L)
Volu
me
trad
ed (M
L)
MDB water entitlement trade history
Groundwater Surface water VWAP ($/ML) $-
$500
$1,000
$1,500
$2,000
$2,500
$3,000
PIIP-SA Rd 1 PIIP-SA Rd 2 NSW PIIOP Rd1
NSW PIIOP Rd2
NSW PIIOP Rd3
Aver
age
mar
ket p
rice
($/M
L)
Off-farm average water market price ($/ML) over time
Source: Data from the DAWR and EY analysis.1 MDBA n.d., Water markets and trade, https://www.mdba.gov.au/managing-water/water-markets-and-trade.
1 Terms of reference 7 Opportunities for efficiency ...2 Glossary 8 Cost of efficiency measures3 Executive summary 9 Principles for negating adv ...4 Introduction 10 A program to achieve 450 ...5 Potential socio-economic ... 11 Appendices6 Program design

Analysis of efficiency measures in the Murray-Darling Basin: Opportunities to recover 450GL in additional environmental water through efficiency measures by 2024, with neutral or positive socio-economic impacts | Page 187 of 307
19 January 2018 | Final Report
Variability in the market and program water price8 Cost of efficiency measures
Implications for program cost
This trend of volatility is also reiterated through the scatter plot graph of the analysed programs below, with prices as high as $5,000 and low as $680 at the time of allocating program funding.
The current funding strategy to achieving water efficiencies is to apply a funding multiple to the current market water price, which is inclusive of the project infrastructure costs, administrative costs and water costs. Consequently, the total cost will vary depending on the market water price.
On-farm programs - water entitlement price over time
► The average on-farm water market price on a project basis over time (limited to those identified programs) was $1,575, approximately 24% cheaper than those identified within off-farm programs.
► HHWUE possessed an average market price of $1,927 over the eleven rounds, compared to the $1,477 average of the OFIEP pilot and rounds one to five.
► Between the OFIEP pilot and round five, the average market price decreased by 35% to $1,475. However, this trend was not as evident over the eleven rounds of the HHWUE, with the market price only decreasing by 2% between rounds one and eleven.
Source: Data from the DAWR and EY analysis.
Conclusions
The ability to deliver the 450GL within the statutory budget will be impacted by the market water price, which varies over time, and has moved between $900 and $1,600 over the last decade when analysed on an annual VWAP basis and varied between $680 and $5,000 within programs analysed.
Source: Data from the DAWR and EY analysis.Note: The data provided has not enabled the identification of the types of entitlements that these prices relate to.
1 Terms of reference 7 Opportunities for efficiency ...2 Glossary 8 Cost of efficiency measures3 Executive summary 9 Principles for negating adv ...4 Introduction 10 A program to achieve 450 ...5 Potential socio-economic ... 11 Appendices6 Program design
$0
$1,000
$2,000
$3,000
$4,000
$5,000
$6,000
Mar
ket w
ater
pric
e ($
/ML)
Overview of program market water price
OFIEP QLD HHWUE NSW PIIOP PIIP-SA
$-
$500
$1,000
$1,500
$2,000
$2,500
Aver
age
mar
ket p
rice
($/M
L)
On-farm average water market price ($/ML)

Analysis of efficiency measures in the Murray-Darling Basin: Opportunities to recover 450GL in additional environmental water through efficiency measures by 2024, with neutral or positive socio-economic impacts | Page 188 of 307
19 January 2018 | Final Report
Water recovery by program – On-Farm Irrigation Efficiency Program (OFIEP)
8 Cost of efficiency measures
OFIEP Pilots, 2.0, 1%
OFIEP Rd 1, 32.7, 17%
OFIEP Rd 2, 37.8, 19%
OFIEP Rd 3, 30.2, 16%
OFIEP Rd 4, 30.7, 16%
OFIEP Rd 5, 58.9, 31%
OFIEP water savings by round
Source: Data from the DAWR and EY analysis.
Source: Data from the DAWR and EY analysis.
Under OFIEP, individual irrigators did not receive direct funding for on-farm infrastructure works. Instead, delivery partners, would submit a portfolio of projects (representing a number of irrigators) to the Commonwealth, including expected funding requirements and water savings.
A competitive grants process was used to select delivery partners. There was no maximum or minimum funding limit for delivery partners or sub-projects, subject to the total funding for that round. The delivery partners would also act as project managers in implementing the projects.
OFIEP water recovery
► From the pilot to round 1 the average cost decreased slightly, before peaking in round 2, and steadily decreasing to round 4.
► There is a 32% difference between the highest funding per ML (round 2, $3,162) and the lowest (round 4, $2,399).
► From the pilot round to round 2, there was a steady increase in the multiple agreed to, peaking at an average multiple of 2.34x in round 2. However, the multiple then decreased over the next three rounds, with the lowest average multiple occurring in round 5 (1.77x).
► Across the pilot, and following five rounds of funding, the average unweighted funding multiple was 2.04x, funding weighted multiple was 2.06x and volume weighted multiple was 2.08x. This was the lowest average compared to other programs analysed: HHWUE, PIIOP and PIIP-SA.
► Round 5 delivered the most water savings (31%), whilst the Pilot Round (1%) delivered the least. However, it is acknowledged that OFIEP round 5 funding was delivered over multiple tranches which may have influenced the participant uptake figures.
► Overall, there were consistent delivery of water savings between rounds 1 to 4 under OFIEP, each accounting for approximately 16% to 19% of overall savings.
Note: The OFIEP Pilot program is included for contextual purposes and is acknowledged that it was a separate program to rounds 1 to 5.
$-
$500
$1,000
$1,500
$2,000
$2,500
$3,000
$3,500
0.0x
0.5x
1.0x
1.5x
2.0x
2.5x
3.0x
OFIEP Pilots OFIEP Rd 1 OFIEP Rd 2 OFIEP Rd 3 OFIEP Rd 4 OFIEP Rd 5
Fund
ing
per M
L ($
/ML)
Aver
age
unw
eigh
ted
fund
ing
mul
tiple
OFIEP over time
Average Market Multiple (Unweighted) Average Multiple Wighted by Funding
Average Multiple Wighted by Volume Funding per ML ($/ML)
1 Terms of reference 7 Opportunities for efficiency ...2 Glossary 8 Cost of efficiency measures3 Executive summary 9 Principles for negating adv ...4 Introduction 10 A program to achieve 450 ...5 Potential socio-economic ... 11 Appendices6 Program design
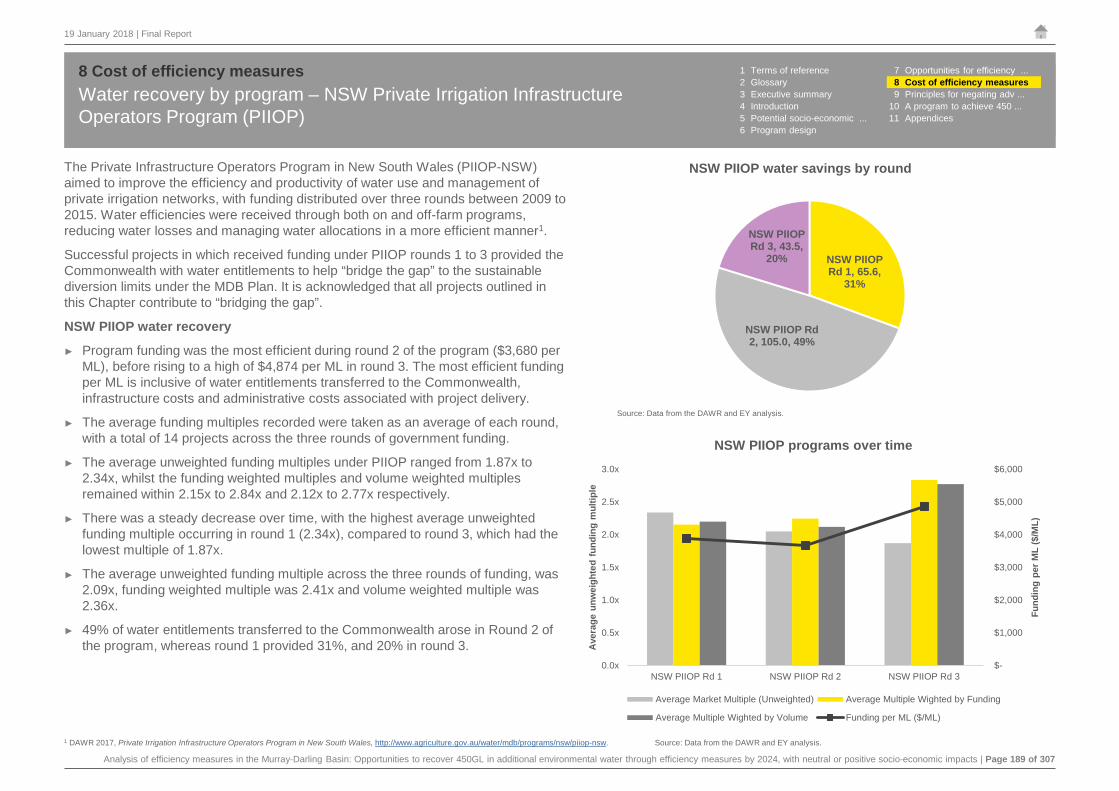
Analysis of efficiency measures in the Murray-Darling Basin: Opportunities to recover 450GL in additional environmental water through efficiency measures by 2024, with neutral or positive socio-economic impacts | Page 189 of 307
19 January 2018 | Final Report
Water recovery by program – NSW Private Irrigation Infrastructure Operators Program (PIIOP)
8 Cost of efficiency measures
The Private Infrastructure Operators Program in New South Wales (PIIOP-NSW) aimed to improve the efficiency and productivity of water use and management of private irrigation networks, with funding distributed over three rounds between 2009 to 2015. Water efficiencies were received through both on and off-farm programs, reducing water losses and managing water allocations in a more efficient manner1.
Successful projects in which received funding under PIIOP rounds 1 to 3 provided the Commonwealth with water entitlements to help “bridge the gap” to the sustainable diversion limits under the MDB Plan. It is acknowledged that all projects outlined in this Chapter contribute to “bridging the gap”.
NSW PIIOP water recovery
► Program funding was the most efficient during round 2 of the program ($3,680 per ML), before rising to a high of $4,874 per ML in round 3. The most efficient funding per ML is inclusive of water entitlements transferred to the Commonwealth, infrastructure costs and administrative costs associated with project delivery.
► The average funding multiples recorded were taken as an average of each round, with a total of 14 projects across the three rounds of government funding.
► The average unweighted funding multiples under PIIOP ranged from 1.87x to 2.34x, whilst the funding weighted multiples and volume weighted multiples remained within 2.15x to 2.84x and 2.12x to 2.77x respectively.
► There was a steady decrease over time, with the highest average unweighted funding multiple occurring in round 1 (2.34x), compared to round 3, which had the lowest multiple of 1.87x.
► The average unweighted funding multiple across the three rounds of funding, was 2.09x, funding weighted multiple was 2.41x and volume weighted multiple was 2.36x.
► 49% of water entitlements transferred to the Commonwealth arose in Round 2 of the program, whereas round 1 provided 31%, and 20% in round 3.
NSW PIIOP Rd 1, 65.6,
31%
NSW PIIOP Rd 2, 105.0, 49%
NSW PIIOP Rd 3, 43.5,
20%
NSW PIIOP water savings by round
Source: Data from the DAWR and EY analysis.
Source: Data from the DAWR and EY analysis.
$-
$1,000
$2,000
$3,000
$4,000
$5,000
$6,000
0.0x
0.5x
1.0x
1.5x
2.0x
2.5x
3.0x
NSW PIIOP Rd 1 NSW PIIOP Rd 2 NSW PIIOP Rd 3
Fund
ing
per M
L ($
/ML)
Aver
age
unw
eigh
ted
fund
ing
mul
tiple
NSW PIIOP programs over time
Average Market Multiple (Unweighted) Average Multiple Wighted by Funding
Average Multiple Wighted by Volume Funding per ML ($/ML)
1 DAWR 2017, Private Irrigation Infrastructure Operators Program in New South Wales, http://www.agriculture.gov.au/water/mdb/programs/nsw/piiop-nsw.
1 Terms of reference 7 Opportunities for efficiency ...2 Glossary 8 Cost of efficiency measures3 Executive summary 9 Principles for negating adv ...4 Introduction 10 A program to achieve 450 ...5 Potential socio-economic ... 11 Appendices6 Program design

Analysis of efficiency measures in the Murray-Darling Basin: Opportunities to recover 450GL in additional environmental water through efficiency measures by 2024, with neutral or positive socio-economic impacts | Page 190 of 307
19 January 2018 | Final Report
Water recovery by program – QLD Healthy HeadWaters Program (HHWUE)
8 Cost of efficiency measures
The Queensland Healthy HeadWaters Water Use Efficiency (HHWUE) program aims to assist irrigators, communities and the environment in the Queensland MDB by funding on-farm irrigation infrastructure improvements and supporting projects. The HHWUE program is delivered with funding from the Australian Government's Sustainable Rural Water Use and Infrastructure Program, with irrigators required to contribute a minimum of 10% of the costs and 50% of the water savings to the Australian Government. Eligible irrigators can apply for up to 90% of the total cost to undertake on-farm infrastructure projects, with infrastructure required to relate to water storages, water distribution or in-field systems1.
HHWUE water recovery
► Without data available on a project-specific basis, the following points are based on the average figures recorded for each program round. Unlike other program analysis, data limitations prevented the direct calculation of program averages during each round of government funding.
► There is a 39% difference between the highest funding per ML (round 11, $4,852) and the lowest (round 2, $3,482). Round 11 also delivered the least savings.
► Programs over time did not necessarily result in greater efficiencies (e.g. round 1 of $4,161 per ML compared to round 11, $4,852 per ML).
► The average funding multiple across the eleven different rounds of funding was 2.16x.
► The long-term analysis of average funding multiples and funding per ML indicates that establishing a direct link between program demand and the market water price has not been possible.
Commonwealth water savings by program round
► Round 7 delivered the most savings (21%), whilst round 3 and 11 (4%) both delivered the least.
► Over each round, savings varied considerably. For instance in round 1 there was 17% savings, where as in round 2 and 3 the savings decreased to 5% and 4% respectively, before increasing to 10% in round 5. These variable savings across various rounds made be attributed to the size of projects taken on board each time.
Source: Data from the DAWR and EY analysis.
Source: Data from the DAWR and EY analysis.
1 DNRM (QLD) n.d., Healthy Headwaters, https://www.dnrm.qld.gov.au/water/catchments-planning/healthy-headwaters/water-use-efficiency-project.
1 Terms of reference 7 Opportunities for efficiency ...2 Glossary 8 Cost of efficiency measures3 Executive summary 9 Principles for negating adv ...4 Introduction 10 A program to achieve 450 ...5 Potential socio-economic ... 11 Appendices6 Program design
HHWUE Rd 1, 4.9, 17%
HHWUE Rd 2, 1.3, 5%
HHWUE Rd 3, 1.3, 4%
HHWUE Rd 5, 2.9, 10%
HHWUE Rd 6 , 2.8, 10%
HHWUE Rd 7 , 6.0, 21%
HHWUE Rd 8 , 1.5, 5%
HHWUE Rd 9 , 2.6, 9%
HHWUE Rd 10 , 4.2, 15%
HHWUE Rd 11 , 1.0, 4%
QLD HHWUE water savings by round
$-
$1,000
$2,000
$3,000
$4,000
$5,000
$6,000
0.0x
0.5x
1.0x
1.5x
2.0x
2.5x
3.0x
HHWUERd 1
HHWUERd 2
HHWUERd 3
HHWUERd 5
HHWUERd 6
HHWUERd 7
HHWUERd 8
HHWUERd 9
HHWUERd 10
HHWUERd 11
Cos
t per
ML
($/M
L)
Aver
age
unw
eigh
ted
fund
ing
mul
tiple
)
HHWUE programs over time
Average Market Multiple Cost per ML ($/ML)

Analysis of efficiency measures in the Murray-Darling Basin: Opportunities to recover 450GL in additional environmental water through efficiency measures by 2024, with neutral or positive socio-economic impacts | Page 191 of 307
19 January 2018 | Final Report
Water recovery by program – PIIP-SA8 Cost of efficiency measures
The Private Irrigation Infrastructure Program for South Australia (PIIP-SA) funds irrigation infrastructure efficiency improvements for MDB operators in South Australia. As part of the Sustainable Rural Water Use and Infrastructure Program, eligible PIIP-SA participants transferred 50% - 100% of total water savings to the Government for environmental water purposes.
In order to be eligible for program funding, participants must be categorised as either IIO’s, delivery partner or individual irrigators and demonstrate a high merit in improving the efficiency and productivity of irrigation water use and management. Over the two existing rounds, PIIP-SA has provided over $14 million in funding in exchange for more than 3GL in water efficiencies transferred to the government1.
PIIP-SA water recovery
► The average cost of round 1 per ML was $5,773, before the average decreased in round 2 to $4,546 per ML. The funding per ML decreased by 21% between Round 1 and 2.
► Each funding multiple was taken as an average of each round, with a total of 13 projects across the two rounds of government funding.
► Between round 1 and round 2, there was a 14% decrease in the average unweighted funding multiple. Round 1 had a higher multiple of 2.68x, whereas round 2 had a lower average multiple of 2.30x.
► The average unweighted funding multiple across the two rounds of funding was 2.51x. This was the highest average compared to other programs: HHWUE, COFFIE and OFIEP.
Commonwealth water savings by program round
► Round 2 delivered 80% of water savings transferred to the Commonwealth as part of the program, whilst round 1 provided the remaining 20%.
► Round 1 funding came to a total of $3.4m, whilst round 2 was $11m total. This differential between funding is also reflective to the greater amount of water savings transferred to the Commonwealth in round 2.
PIIP-SA Rd 1, 0.6,
20%
PIIP-SA Rd 2, 2.4, 80%
PIIP-SA water savings by round
Source: Data from the DAWR and EY analysis.
Source: Data from the DAWR and EY analysis.1 DAWR 2017, Irrigation Infrastructure Program for South Australia, http://www.agriculture.gov.au/water/mdb/programs/sa/piip-sa.
1 Terms of reference 7 Opportunities for efficiency ...2 Glossary 8 Cost of efficiency measures3 Executive summary 9 Principles for negating adv ...4 Introduction 10 A program to achieve 450 ...5 Potential socio-economic ... 11 Appendices6 Program design
$-
$1,000
$2,000
$3,000
$4,000
$5,000
$6,000
$7,000
0.0x
0.5x
1.0x
1.5x
2.0x
2.5x
3.0x
PIIP-SA Rd 1 PIIP-SA Rd 2
Cos
t per
ML
($/M
L)
Cw
th fu
ndin
g ($
m)
PIIP-SA over time
Average Market Multiple Average Multiple Wighted by Funding
Average Multiple Wighted by Volume Funding per ML ($/ML)

Analysis of efficiency measures in the Murray-Darling Basin: Opportunities to recover 450GL in additional environmental water through efficiency measures by 2024, with neutral or positive socio-economic impacts | Page 192 of 307
19 January 2018 | Final Report
Summary of funding multiples and funding per ML of programs8 Cost of efficiency measuresSummary of funding multiples and funding per ML of programs
The following provides a summary of the average individual program data outlined previously. Due to inconsistencies in datasets available, the summary of funding multiples and funding per ML illustrated on this page have taken the average on a program round basis and are not representative of the individual projects within each round. This approach was adopted for consistency purposes when comparing both on and off-farm programs.
Cost of water efficiency measures1 (funding multiples)
► On average, the unweighted average on-farm funding multiple was 2.11x, slightly lower than the average unweighted off-farm funding multiple of 2.25x, representing a 6% discount to off-farm activities. This suggests that off-farm programs require higher funding requirements.
► The differential between minimum and maximum funding multiples for on and off-farm activities was 44% and 43% respectively, indicating similar levels of volatility within the levels of funding provides for efficiency measures.
Cost of water efficiency measures1 (funding per ML)
► The average on-farm funding per ML was $3,599, which was lower than the average off-farm cost of $4,554.
► The minimum off-farm funding per ML ($3,680) was 53% higher than the minimum on-farm cost of $2,399 per ML. This trend continued for the maximum funding per ML at a reduced rate, with the maximum off-farm funding per ML 19% higher than the on-farm maximum.
1 It is noted that for the purpose of this analysis, all water entitlements have been averaged together and not categorised on a more granular basis (i.e. security, reliability, supplementary, etc.). It is noted that Commonwealth water savings utilised for this analysis is based off water savings received or agreed under works contracts.
Source: Data from the DAWR and EY analysis.
Conclusions
Funding per ML varied significantly for both on and off-farm projects, with a minimum of $2,399 per ML and maximum of $5,773 per ML. This volatility was also seen within funding multiples (range of 1.70x to 2.68x).
The potential for data points within individual projects categorised as outliers have the potential to influence overall averages. The appropriateness of historical multiples is explored in greater detail on the subsequent pages.
Volatility within the unweighted funding multiples indicates a cost risk to achieving 450GL. This is explored through analysis on the subsequent pages
On-farm market multiple Off-farm market multipleMinimum 1.70x 1.87xAverage 2.11x 2.25xMaximum 2.46x 2.68x
0.00x
0.50x
1.00x
1.50x
2.00x
2.50x
3.00x
Mar
ket m
ultip
le
Historical water efficiency funding multiples
Source: Data from the DAWR and EY analysis.
1 Terms of reference 7 Opportunities for efficiency ...2 Glossary 8 Cost of efficiency measures3 Executive summary 9 Principles for negating adv ...4 Introduction 10 A program to achieve 450 ...5 Potential socio-economic ... 11 Appendices6 Program design
On-farm cost per ML Off-farm cost per MLMinimum $2,399 $3,680Average $3,599 $4,554Maximum $4,852 $5,773
$-
$1,000
$2,000
$3,000
$4,000
$5,000
$6,000
$7,000
Cos
t per
ML
($/M
L)
Historical water efficiency cost per ML
Analysis of efficiency measures in the Murray-Darling Basin: Opportunities to recover 450GL in additional environmental water through efficiency measures by 2024, with neutral or positive socio-economic impacts | Page 193 of 307
19 January 2018 | Final Report
Having assessed the previous multiples applied within programs it is important to consider the appropriateness of these in providing an indication of future requirements. It is noted that many stakeholders consulted suggested that funding multiples would need to be set at or above 2.0x to attract interest.
On-farm assessment
The Commonwealth Department of Agriculture and Water Resources have provided the below commentary on previous programs, indicating that in their view OFIEP Rd 5, VFM and SARMS are more representative of future programs, while HHWUE and IFM are outliers.
The SA program manager for COFFIE has said that experience to date in delivering the pilot indicates that the current funding multiple offered by COFFIE (1.75x market price) may not be high enough to incentivise a broad range of potential participants in South Australia. This assessment is supported by NSW stakeholder conversations and a comparatively higher level of interest and participation in the South Australian River Murray Sustainability Program which offered a funding multiple of 2.50x.
OFIEP Rd 5 - The most recent round of OFIEP involved targeted grants, in that only irrigators in the NSW Murray and Murrumbidgee catchments were eligible. These projects are being undertaken in the current water market.
The most recent round of OFIEP data indicates that the average unweighted funding multiple was 1.77x, with market price ranging between $1,196 and $1,991. This may provide a more recent indication of anticipated multiples and the cost of future on-farm
efficiency measures.
VFM – Run by the Victorian Government, funding amounts for the various tranches for VFM Project were based on a volume weighted average water market prices ($/ML) for each trading zone at the time of negotiating each funding tranche with a 1.8x market multiplier. For the last sub-tranche (2b) under the Project the price agreed per ML recovered was up to $5,083/ML ($5,350/ML LTAAY). This upper bound reflects the more expensive zones like the Greater Goulburn and the Vic Murray where the bulk of the high reliability water shares (HRWS) have originated. However, as mentioned above the design included a price per trading zones and there were some lower value trading zones in the mix i.e. well below the Victorian proposed market price at the time of $2,800/ML. Under Tranche 2(b) the average price per ML (LTAAY), including the market multiplier, is $4,297.
SARMS – Run by the SA Government, the water recovery through infrastructure component of SARMS reflect just the cost of an infrastructure program (like OFIEP or COFFIE). $80 million of this program was for water efficiency projects and 16.8GL (LTAAY) to be transferred to the CEWH.
It should be noted that the $240+ million program consist several parts, three of which are managed by the DAWR. Part A consists $80 million for water efficiency measures and $40 million for water purchasing. Part B is managed outside the Water Division and is designed to improve productivity on irrigated properties and is not designed to recover water.
IFM – Run by the NSW Government, this program offered a 2.5x funding multiple. It also offered
additional training and extension services (typically professional courses – elements that were built into the final costs. It was run in northern part of NSW MDB, where water markets are smaller and water prices are comparatively higher than in the south. Hence its overall costs would not properly reflect just the cost of an infrastructure program in the south, but could be useful for estimating approximate costs of recovering 40-50GL of efficiency measures from the northern Basin.
HHWUE – Run by the QLD Government, this program possessed an average unweighted funding multiple of 2.16x over the first eleven rounds. It also offered additional training and extension services – elements that were built into the final costs. While people could get training through OFIEP, it was generally free training from suppliers. As it was run in the QLD MDB, water markets are smaller and water prices are comparatively higher than in the south. Hence its overall costs would not properly reflect the cost of an infrastructure program in the south, but could be useful for estimating approximate costs of recovering 40-50GL of efficiency measures from the northern Basin.
Assessing the appropriateness of historic multiples – on-farm programs8 Cost of efficiency measures
Conclusions
While past programs can be used to indicate the most appropriate multiple for future programs stakeholder input suggests that certain programs (OFIEP Rd 5, VFM, SARMS) are more representative of future programs.
At the same time consultations suggested a higher multiple will be required going forward which is consistent with the experience of COFFIE.
1 Terms of reference 7 Opportunities for efficiency ...2 Glossary 8 Cost of efficiency measures3 Executive summary 9 Principles for negating adv ...4 Introduction 10 A program to achieve 450 ...5 Potential socio-economic ... 11 Appendices6 Program design

Analysis of efficiency measures in the Murray-Darling Basin: Opportunities to recover 450GL in additional environmental water through efficiency measures by 2024, with neutral or positive socio-economic impacts | Page 194 of 307
19 January 2018 | Final Report
Assessing the appropriateness of historic – off-farm programs8 Cost of efficiency measures
Off-farm assessment
The Commonwealth Department of Agriculture and Water Resources have provided the view there are no specific outliers in relation to previous off-farm programs.
It has been suggested that costs associated with IIO participation at Trangie, Hay and Nevertire are representative of costs for smaller PIDs, noting that there are plans for consolidation of some smaller PID with larger IIOs (e.g. Moira with Murray).
However, there is recognition that future infrastructure in IIOs that have already participated could well be more expensive.
Further work is required to more comprehensively understand the costs associated with future participation through off-farm programs. In particular this would entail considering the works that need to be done, and estimating the associated costs of future off-farm participation. For example data on PIIOP participants to date would give indicative costs for different works. These costs incorporate funding for IIOs to optimise their networks for future, including finding opportunities for doing on and off-farm works within a single project. Costs also reflect that up to different water entitlement types are offered as water savings, dependent on the type of upgrade works being done.
Conclusions
While previous programs are thought to be representative of future costs for off-farm programs, it is noted that costs are anticipated to be higher if additional modernisation is sought from already modernised systems.
1 Terms of reference 7 Opportunities for efficiency ...2 Glossary 8 Cost of efficiency measures3 Executive summary 9 Principles for negating adv ...4 Introduction 10 A program to achieve 450 ...5 Potential socio-economic ... 11 Appendices6 Program design

Analysis of efficiency measures in the Murray-Darling Basin: Opportunities to recover 450GL in additional environmental water through efficiency measures by 2024, with neutral or positive socio-economic impacts | Page 195 of 307
19 January 2018 | Final Report
Recovering the 450GL within the statutory budget8 Cost of efficiency measures
Market price differences across entitlements and the Basin
Efficiency measures programs recover water from a range of catchments and entitlement types (each of these possess different LTAAY factors and costs). In some cases, such as PIIOP, up to three different water entitlement types were offered as water savings. These programs have all offered different elements for participants and have been rolled out at different times, with the market prices fluctuating from round to round.
In considering the total program costs account needs taken of different market characteristics in the Northern Basin and Queensland compared to the Southern Basin. For example:
► There is a lot less liquidity in these markets making price discovery difficult and prices more variable.
► The characteristics of irrigated agriculture is different in the Northern and Southern Basin and difficult to make a direct comparison (e.g. properties with different levels of acreage and onsite storage facilities).
► Data is frequently missing due to the lower levels of liquidity.
Given the varied location and type of entitlements to be recovered, there is significant program cost uncertainty. As a result, scenario analysis has been conducted to illustrate the various average prices and associated funding multiples that can be applied to deliver the program within the required statutory budget.
The 450GL is required to be recovered on a long-term average annual volume basis. Since different entitlements have varying LTAAY factors and different market prices, the cost associated with achieving the 450GL will be influenced by the mix of entitlements exchanged for infrastructure funding.
Approach to scenario analysis on different reliability classes
Three scenarios have been developed with a different reliability class applied to each to demonstrate the impact of different entitlement classes, LTAAY factors and prices on the multiple and VWAP that can be applied to recover the 450GL within the statutory budget.
The scenario analysis includes three scenarios that differ among them in theirrespective LTAAY factor:► Scenario 1 presents High Reliability (based on an estimated 94% LTAAY factor),
which increases the target MLs from 450,000 ML to 478,723 ML.
► Scenario 2 presents Low Reliability (based on an estimated 73% LTAAY factor), which increases the target MLs from 450,000 ML to 616,438 ML.
► Scenario 1 presents a Unregulated or Supplementary (event based) (based on an estimated 49% LTAAY factor), which increases the target MLs from 450,000 ML to 918,267 ML.
The analysis explores the range of potential prices under different entitlement class assumptions to explore the combination of multiples and VWAPs that are possible under the statutory budget under varied water entitlements.
Each of the points in the graph on the following page presents the combination of VWAP and funding multiple that would entails the full utilisation of the statutory budget ($1.575 billion) for each of the scenarios.
The scenarios that present a lower water recovery efficiency (e.g. Unregulated or Supplementary (event based)) utilise the full amount of statutory budget at lower VWAPs for each given multiple.
The above result reflects that Unregulated or Supplementary (event based) water entitlement classes utilise the budget expenditure quicker than if retrieved through High Reliability entitlement classes.
1 Correspondence from DAWR, November 2017.
1 Terms of reference 7 Opportunities for efficiency ...2 Glossary 8 Cost of efficiency measures3 Executive summary 9 Principles for negating adv ...4 Introduction 10 A program to achieve 450 ...5 Potential socio-economic ... 11 Appendices6 Program design

Analysis of efficiency measures in the Murray-Darling Basin: Opportunities to recover 450GL in additional environmental water through efficiency measures by 2024, with neutral or positive socio-economic impacts | Page 196 of 307
19 January 2018 | Final Report
Scenario analysis of differing entitlements and LTAAYs8 Cost of efficiency measures
Source: Data from the DAWR and EY analysis.
The following graph explores a range of potential prices under different entitlement classes factors, each demonstrating the impact of varying LTAAY factors and prices on the multiple and VWAP that can be applied to recover the 450GL within the statutory budget.
1 Volume weighted average price * unweighted market multiple provides the maximum funding per ML in which can be provided in order to achieve 450GL within the statutory budget of $1.575 billion and is inclusive of the project infrastructure costs, administrative costs and water costs.
1 Terms of reference 7 Opportunities for efficiency ...2 Glossary 8 Cost of efficiency measures3 Executive summary 9 Principles for negating adv ...4 Introduction 10 A program to achieve 450 ...5 Potential socio-economic ... 11 Appendices6 Program design
$1,880
$1,645
$1,462
$1,316
$1,196
$1,097
$1,460
$1,278
$1,136
$1,022$929
$852
$980
$858$762
$686$624
$572
$0
$200
$400
$600
$800
$1,000
$1,200
$1,400
$1,600
$1,800
$2,000
1.75x 2.00x 2.25x 2.50x 2.75x 3.00x
Volu
me
Wei
ghte
d Av
erag
e Pr
ice
($)
Unweighted market multiple
Scenario comparison (presents the combinations of “VWAPs” and “multiples” at which 450GL is achieved and the statutory budget is fully utilised)
Scenario 1: High Reliability (94%LTAAY) - combinations of VWAPsand Multiples at which the targetMLs (450,000ML / 94% =478,723ML) are reached andbudget is fully utilised
Scenario 2: Low Reliability (73%LTAAY) - combinations of VWAPsand Multiples at which target MLs(450,000ML / 73% = 616,438ML)are reached and budget is fullyutilised
Scenario 3: Unregulated orSupplementary (49% LTAAY) -combinations of VWAPs andMultiples at which target MLs(450,000ML / 49% = 918,367ML)are reached and budget is fullyutilised

Analysis of efficiency measures in the Murray-Darling Basin: Opportunities to recover 450GL in additional environmental water through efficiency measures by 2024, with neutral or positive socio-economic impacts | Page 197 of 307
19 January 2018 | Final Report
Scenario analysis of differing entitlements and LTAAYs8 Cost of efficiency measures
Scenario analysis and historical outcomes
The findings illustrated within the scenario analysis highlight the variabilities which influence the ability of achieving the 450GL of water recovery within the statutory budget. The market water price, which varies over time, is one of the primary factors influencing the ability to achieve the 450GL and is subject to considerable market volatility as demonstrated through the scatter plot of historical market water prices for those programs analysed. It is noted that the market water price has moved between $900 and $1,600 over the last decade when analysed on an annual VWAP basis and varied between $680 and $5,000 within the programs analysed.
On a historical basis, some infrastructure programs have delivered water entitlements to the Commonwealth within these prices while others have been more expensive. The average off-farm water market price on a project basis over time (limited to those identified programs) was $2,063, whilst the average on-farm water market price on a project basis over time (limited to those identified programs) was $1,575, approximately 24% cheaper than those identified within off-farm programs.
By pursuing a funding strategy which applies a funding multiple to the current market water price, the risk of achieving the 450GL within the statutory budget is subject to the willingness of Basin irrigators to participate within programs and overall market conditions, in particular market water prices.
Conclusions
The scenario analysis demonstrates that the ability to recover the 450GL within the statutory budget and at different multiples will be dependent on the mix of entitlements and associated price and LTAAY factor. For example, at an LTAAY factor of 0.73, the 450GL can be recovered within the statutory budget at water prices up to $1,460 and an associated funding multiple of 1.75x.
It is noted that given current water prices and the increase in the price of water over time, which many stakeholders anticipate will continue into the future, there is a significant risk in achieving the recovery of the 450GL within the statutory budget.
Further, there are two components to this risk. While lower multiples will reduce the potential need for additional funding they are likely to result in reduce uptake of efficiency measures. Conversely, while higher multiples will increase uptake, there is a greater risk additional funding may be required in later stages of the program.
It is noted that this analysis has not included costs for addition elements of the program, with the assumption that existing programs and associated funding will be leveraged to achieve this. Where other program elements require funding this will influence the market price and associated multiple.
1 Terms of reference 7 Opportunities for efficiency ...2 Glossary 8 Cost of efficiency measures3 Executive summary 9 Principles for negating adv ...4 Introduction 10 A program to achieve 450 ...5 Potential socio-economic ... 11 Appendices6 Program design

Analysis of efficiency measures in the Murray-Darling Basin: Opportunities to recover 450GL in additional environmental water through efficiency measures by 2024, with neutral or positive socio-economic impacts | Page 198 of 307
19 January 2018 | Final Report
A broad range of variables can affect the future cost of water recovery. The following are some examples of variables that will affect the cost of water recovery measures (it is noted that this is not an exhaustive list).
Value of water entitlements
The market price of water entitlements will impact on the total program cost, given program funding is calculated based on the application of a multiple to the value of entitlements. Changes in the price of water entitlements are examined in further subsequently in this chapter with water prices being influenced by a variety of supply and demand factors.
The funding multiple applied
As discussed above the total program cost is a factor of the value of water entitlements and the application of a funding multiple. As such the multiple applied will have a direct impact on total program cost, noting it will also impact on the level of interest and program participation. Historic multiples have been analysed later in the chapter to provide an indication of what an appropriate multiple might be going forward.
Environmental conditions
Environmental (or seasonal) conditions may be categorised as the largest variable influence impacting the cost of recovering measures. The level of rainfall and associated requirements from producers within regional areas has a significant impact on the level of water flow within the MDB and farming demand.
Commodity prices
The commodity prices for produce farmed within the MDB will influence the strategy and intensity of farming
throughout any season, directly influencing the demand and appetite of water from irrigators in the network. As a result, this will influence the demand of water, impacting the market price.
Technology
The increased adoption of technology by irrigators will influence the amount of water required to produce the same amount of output. As a result, increased yields may be achieved from new technology in the future, influencing the future demand of water.
Cost and type of infrastructure
With funding provided in exchange for infrastructure upgrades, the cost of upgrades will have an impact on the willingness of participants to take part in programs. Reductions in infrastructure costs or as above improved (cheaper technology) is likely to reduce the funding required and therefore the cost of water recovery.
In addition, providing flexibility and a breadth of choice as to the types of infrastructure eligible for funding may also reduce pricing. For example soft infrastructure such as IT and data analytical investment.
Use of infrastructure
The ability of irrigators and irrigation networks to maximise the benefits from existing and new infrastructure will affect their future demand for water and therefore the market price of water. The perception of irrigators and irrigation networks of the benefits from modernisation will also affect their appetite for further efficiency measures and their willingness to accept a lower funding multiple.
Government policy
The policy developed by governments across all three tiers (local, state, federal) directly influences the appetite for water across the MDB and cost of water recovery measures.
Projects nominated to bridge the gap
The operation of the Supply Measures component of the SDLAM is currently expected to result in the bridging the gap requirements for the southern basin being reduced by 605GL. The current gap-bridge target for the southern Murray-Darling Basin stands at approximately 570GL. This would mean that the SDL adjustment would not need to be fully utilised to meet the gap bridge target. Consequently, there may be scope to transfer some existing currently held water into efficiency measures up to the difference between the gap-bridge target and the available supply measures. Currently this could be an amount of up to 35GL. As this water has already been paid for, this would reduce the call on WESA funds to meet the remaining efficiency measures required.
Factors influencing the future cost of water efficiency measures (risks and opportunities)
8 Cost of efficiency measures
Conclusions
There are a range of factors that could affect the future cost of water recovery including, but not limited to, the value of water entitlements, the funding multiple applied, environmental conditions, commodity prices, technology, cost and use of infrastructure, Government policy and the ability to use some of the projects nominated to bridge the gap as efficiency measures to meet the 450GL target.
1 Terms of reference 7 Opportunities for efficiency ...2 Glossary 8 Cost of efficiency measures3 Executive summary 9 Principles for negating adv ...4 Introduction 10 A program to achieve 450 ...5 Potential socio-economic ... 11 Appendices6 Program design

Analysis of efficiency measures in the Murray-Darling Basin: Opportunities to recover 450GL in additional environmental water through efficiency measures by 2024, with neutral or positive socio-economic impacts | Page 199 of 307
19 January 2018 | Final Report
Given the uncertainty in relation to the most appropriate multiple, a price discovery approach is recommended throughout the program to ensure value for money is maintained whilst also achieving required participation.
As noted in the above analysis determining an appropriate multiple for the program will be based on a range of factors including:
► The cost of infrastructure
► Water prices
► Willingness of irrigators to participate.
As a result it is recommended that the program includes ongoing price discovery to continually monitor the appropriateness of the funding multiple applied. For example large changes in the water price, changes in infrastructure costs and/or the development of new technology would impact on the appropriateness of the multiple to be offered as would the level of participation.
In regards to the latter, if participation was not sufficient to meet required volumes the multiple may need to be increased to enhance this. As part of the price discovery process, it is recommended that further work is undertaken to understand the investment and participation decision and related financials associated with water efficiency measures.
This should include gathering information on the economics of participation including the benefits achieved as a result of funding (as discussed in
Chapter 5) as well as the differing costs of the various potential infrastructure upgrades. This would allow for a deeper understanding of the financial impact on participants of undertaking water efficiency measures based on a bottom up assessment of costs and benefits. This could also be used as a basis for discussions with potential participants to enhance interest and uptake and establish a greater understanding of what participation means to specific businesses.
This information as well as enhanced data on historic program participation (such as uptake by catchment and total costs) should be assessed as part of the monitoring and evaluation framework as described in Chapter 10 to inform an ongoing assessment of the appropriateness of the multiples applied and whether adjustments are required and ensure the Government is achieving value for money throughout the program.
It is noted that if there is a perception that multiples could be increased as the program progresses, participants may hold off and not participate in the program in early stages in the belief that a higher multiple may be offered in latter stages. As such some incentives may need to be included for participation early in the program. Some examples are outlined in Chapter 10.
The below table provides an example of the how a price discovery mechanism can work.
Example of implementation: the funding multiple:
Implications for program design - price discovery8 Cost of efficiency measures
Conclusions
A price discovery mechanism should be used to continually adjust the funding multiple for the program, ensuring adequate participation while driving value for money outcomes.
Year 1 (e.g. multiple of 1.75)
Data gathered on uptake to determine multiple for year 2
Year 2 (e.g. multiplemay rise to 2.5)
Based on take-up (will need average per annum to meet 450GL target), funding multiple is flexible to change
A higher multiple could be considered in instances where large volumes of water (e.g. >5GL) are able to be recovered from a single project. These projects should be evaluated on a case by case basis
1 Terms of reference 7 Opportunities for efficiency ...2 Glossary 8 Cost of efficiency measures3 Executive summary 9 Principles for negating adv ...4 Introduction 10 A program to achieve 450 ...5 Potential socio-economic ... 11 Appendices6 Program design

Analysis of efficiency measures in the Murray-Darling Basin: Opportunities to recover 450GL in additional environmental water through efficiency measures by 2024, with neutral or positive socio-economic impacts | Page 200 of 307
Principles for negating adverse socio-economic impacts
9
In this section Page
Overview 201
Key Findings 202
Pathways to negate socio-economic impacts 203
Existing programs 207
Key principles 208
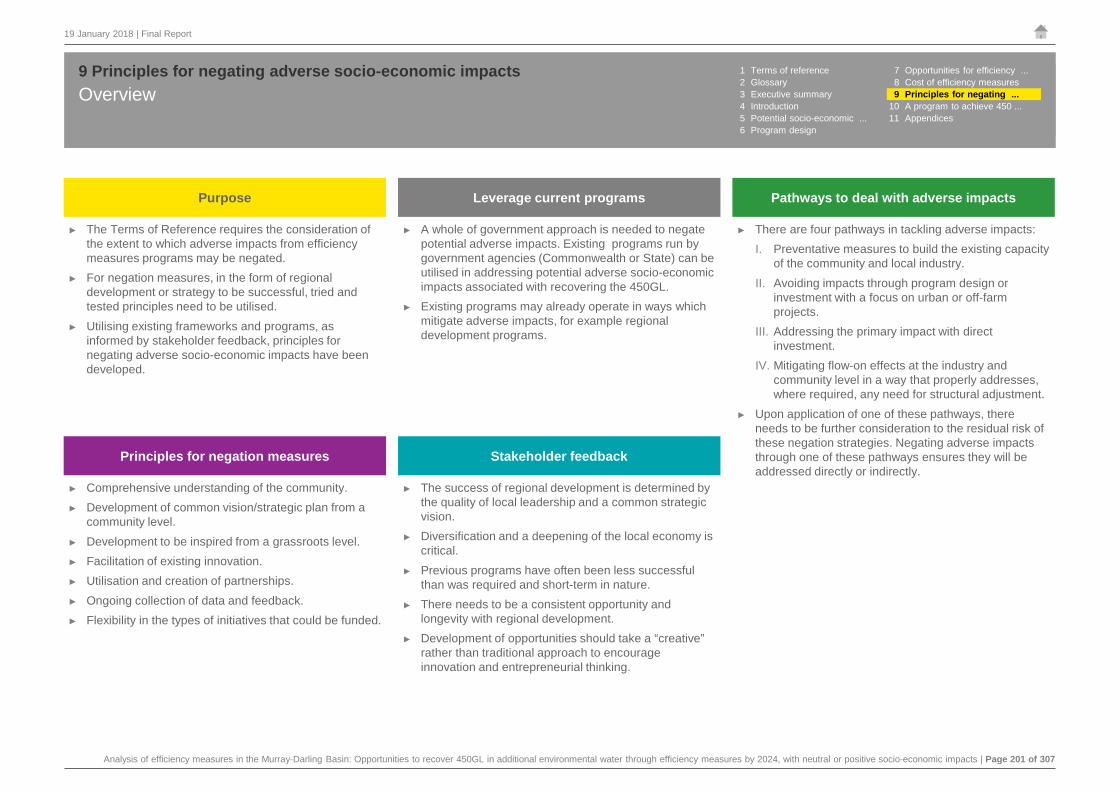
Analysis of efficiency measures in the Murray-Darling Basin: Opportunities to recover 450GL in additional environmental water through efficiency measures by 2024, with neutral or positive socio-economic impacts | Page 201 of 307
19 January 2018 | Final Report
Overview9 Principles for negating adverse socio-economic impacts
Purpose Leverage current programs Pathways to deal with adverse impacts
► The Terms of Reference requires the consideration of the extent to which adverse impacts from efficiency measures programs may be negated.
► For negation measures, in the form of regional development or strategy to be successful, tried and tested principles need to be utilised.
► Utilising existing frameworks and programs, as informed by stakeholder feedback, principles for negating adverse socio-economic impacts have been developed.
► A whole of government approach is needed to negate potential adverse impacts. Existing programs run by government agencies (Commonwealth or State) can be utilised in addressing potential adverse socio-economic impacts associated with recovering the 450GL.
► Existing programs may already operate in ways which mitigate adverse impacts, for example regional development programs.
► There are four pathways in tackling adverse impacts: I. Preventative measures to build the existing capacity
of the community and local industry.II. Avoiding impacts through program design or
investment with a focus on urban or off-farm projects.
III. Addressing the primary impact with direct investment.
IV. Mitigating flow-on effects at the industry and community level in a way that properly addresses, where required, any need for structural adjustment.
► Upon application of one of these pathways, there needs to be further consideration to the residual risk of these negation strategies. Negating adverse impacts through one of these pathways ensures they will be addressed directly or indirectly.
Principles for negation measures Stakeholder feedback
► Comprehensive understanding of the community.► Development of common vision/strategic plan from a
community level.► Development to be inspired from a grassroots level.► Facilitation of existing innovation.► Utilisation and creation of partnerships.► Ongoing collection of data and feedback.► Flexibility in the types of initiatives that could be funded.
► The success of regional development is determined by the quality of local leadership and a common strategic vision.
► Diversification and a deepening of the local economy is critical.
► Previous programs have often been less successful than was required and short-term in nature.
► There needs to be a consistent opportunity and longevity with regional development.
► Development of opportunities should take a “creative” rather than traditional approach to encourage innovation and entrepreneurial thinking.
1 Terms of reference 7 Opportunities for efficiency ...2 Glossary 8 Cost of efficiency measures3 Executive summary 9 Principles for negating ...4 Introduction 10 A program to achieve 450 ...5 Potential socio-economic ... 11 Appendices6 Program design
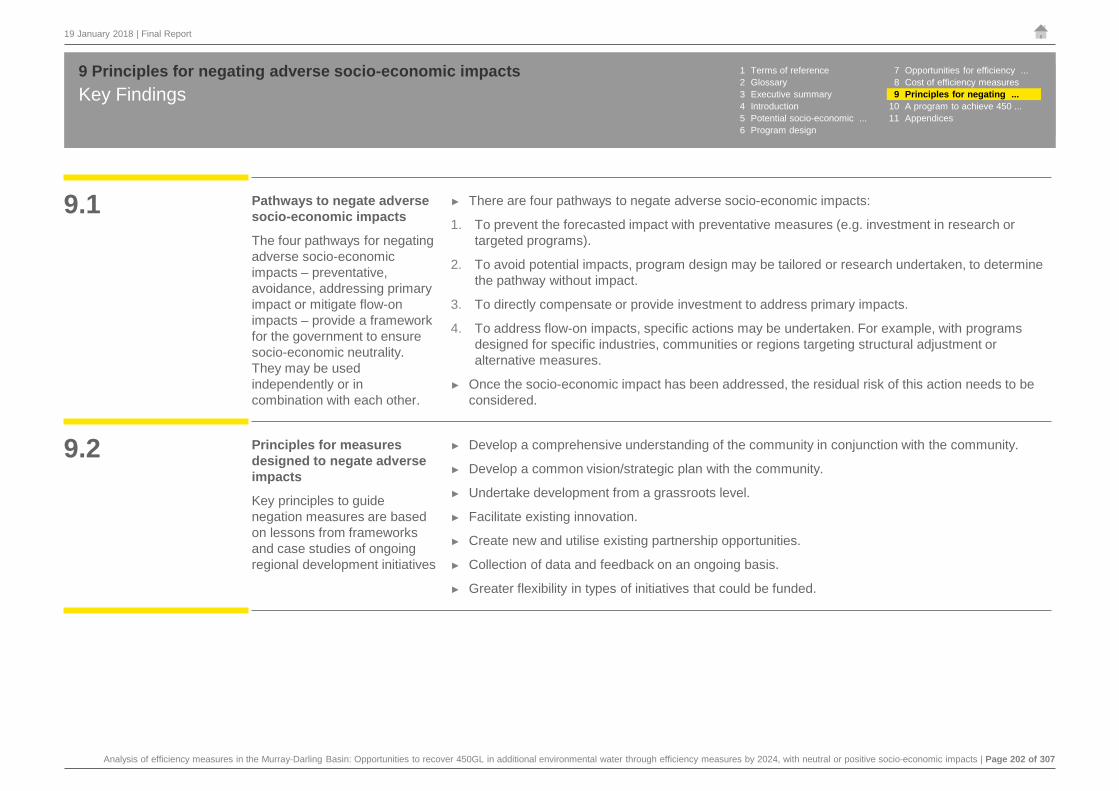
Analysis of efficiency measures in the Murray-Darling Basin: Opportunities to recover 450GL in additional environmental water through efficiency measures by 2024, with neutral or positive socio-economic impacts | Page 202 of 307
19 January 2018 | Final Report
Key Findings9 Principles for negating adverse socio-economic impacts
9.1 Pathways to negate adverse socio-economic impacts
The four pathways for negating adverse socio-economic impacts – preventative, avoidance, addressing primary impact or mitigate flow-on impacts – provide a framework for the government to ensure socio-economic neutrality. They may be used independently or in combination with each other.
► There are four pathways to negate adverse socio-economic impacts:
1. To prevent the forecasted impact with preventative measures (e.g. investment in research or targeted programs).
2. To avoid potential impacts, program design may be tailored or research undertaken, to determine the pathway without impact.
3. To directly compensate or provide investment to address primary impacts.
4. To address flow-on impacts, specific actions may be undertaken. For example, with programs designed for specific industries, communities or regions targeting structural adjustment or alternative measures.
► Once the socio-economic impact has been addressed, the residual risk of this action needs to be considered.
9.2 Principles for measures designed to negate adverse impacts
Key principles to guide negation measures are based on lessons from frameworks and case studies of ongoing regional development initiatives
► Develop a comprehensive understanding of the community in conjunction with the community.
► Develop a common vision/strategic plan with the community.
► Undertake development from a grassroots level.
► Facilitate existing innovation.
► Create new and utilise existing partnership opportunities.
► Collection of data and feedback on an ongoing basis.
► Greater flexibility in types of initiatives that could be funded.
1 Terms of reference 7 Opportunities for efficiency ...2 Glossary 8 Cost of efficiency measures3 Executive summary 9 Principles for negating ...4 Introduction 10 A program to achieve 450 ...5 Potential socio-economic ... 11 Appendices6 Program design

Analysis of efficiency measures in the Murray-Darling Basin: Opportunities to recover 450GL in additional environmental water through efficiency measures by 2024, with neutral or positive socio-economic impacts | Page 203 of 307
19 January 2018 | Final Report
Pathways to negate socio-economic impacts9 Principles for negating adverse socio-economic impacts
The Terms of Reference required the exploration of how socio-economic impacts may be negated. While, the program is anticipated to have primarily positive impacts, four pathways to negating adverse impacts have been examined: preventative measures (pre-project), avoiding adverse impacts, addressing adverse impacts, and post-project mitigation.
Preventative measures (pre) Avoid impacts Address/offset primary impact Mitigate consequential impacts (post)
Before new water efficiency programs are initiated to obtain the 450GL, programs are recommended to be designed to build the capacity of the community and industry. These programs may include, but are not limited to:
► Preparing regional delivery plans with industry and community
► Engaging industry and community to support for program delivery
► Improving the resilience of communities
► Undertaking targeted research and development activities.
Preventative measure are also likely to support greater program involvement and/or be part of an existing suite of government regional support programs.
Adverse impacts may be avoided through program design: projects with positive or neutral impacts such as:
► Delivery of off-farm projects
► Urban projects
► Delivery of on-farm projects using a program design approach that avoids adverse impacts.
Primary adverse impacts can be addressed before they have flow-on impacts through direct investment in a measure to offset the impact. For example, in an irrigation network, there may be investment in infrastructure to mitigate lower flows through parts of a network.
The investment to offset the primary impact would be tailored, and decided by the government. It may take various forms, and potentially be invested across multiple projects. For example, case managing individuals.
Once the primary impact has occurred, mitigation of the flow-on impacts could be in the form of:
► Structural adjustment programs
► Industry specific programs
► Community projects.
Upon application of these pathways, there is to be additional consideration of residual risk. For instance, due to a structural adjustment program there may be a residual risk relating to some participants receiving unfair advantage depending on the adaption strategies.
The principles and methods to address impacts, whether that be preventative, through avoidance, addressing primary impacts or flow-on, can be drawn from current programs run by public or private bodies, such as SARMs and the Goulburn Murray Water Connections Project Reset. Details of these are outlined on the subsequent pages.
1 Terms of reference 7 Opportunities for efficiency ...2 Glossary 8 Cost of efficiency measures3 Executive summary 9 Principles for negating ...4 Introduction 10 A program to achieve 450 ...5 Potential socio-economic ... 11 Appendices6 Program design

Analysis of efficiency measures in the Murray-Darling Basin: Opportunities to recover 450GL in additional environmental water through efficiency measures by 2024, with neutral or positive socio-economic impacts | Page 204 of 307
19 January 2018 | Final Report
Pathways to negate socio-economic impacts9 Principles for negating adverse socio-economic impacts
SARMS was designed in 2011-12 by the Water Industry Alliance to achieve a large component of South Australia's water recovery commitments under the Basin Plan. Funded by the Commonwealth Government, it is being delivered by the Department of Primary Industries and Regions, South Australia (PIRSA) over 6 years, finishing mid-2019.
Program Design
Of the $265 million allocated for programs to recover water, $25 million was allocated to support regional diversification and economic development across the region from which water was being recovered for the Basin Plan. This stream of investment, the Regional Economic Development (RED), is separated in 3 central streams:
1. Regional Development & Innovation Fund (RDIF), comprising of $12.5m2. Industry-led Research Sub-Program (IRSP), comprising of $5.0m3. Loxton Research Centre Redevelopment, comprising of $7.5m.
These programs were intended to support communities adapt to changes as a result of implementation of the Basin Plan, as well as build upon the innovation of the SARMs Irrigation Industry Improvement program:
► RDIF is a competitive grant process for non-irrigators:
► To deliver employment opportunities and economic diversification with the development of infrastructure, expansion of regional services, educational programs, training and research.
► 15 grants to operations across the Murray region.
► IRSP is grant scheme for industry-led research applicants:
► To improve regional productivity and innovation.► Projects address industry priorities in market research, utilising waste product, management of
regional risk factors, optimisation of regional businesses, new technology, as well as water and/or business management.
► The Loxton Research Centre Redevelopment focused on re-invigorating the existing centre.
► A showcase for the Murray Region and centre for collaboration between industry, research, education and government.
South Australian River Murray Sustainability (SARMS) Regional Economic Development (RED)
Outcomes
Each of these streams of the RED program have facilitated local business and community development with access to new technology and fast-tracked capacity for change:
► 26 projects (17 regional development, 9 research)► $28.2 million in co-investment ($2 co-investment
for every $1 in grant funding)► Contributing toward the creation of over 1,000 jobs► Contributed to regional diversification, economic
development, innovative research► Project outcomes supported workplace safety and
reinvigoration of townships and communities.
Source: PIRSA 2017, South Australian River Murray Sustainability Program.
Pathway 1: Prevent ImpactsIn reference to the SARMS case study, program design could include R&D initiatives, and industry-led programs to prevent impacts before they occur. These initiatives could act as preventative measures –researching resolutions to impacts, or providing guidance on where impacts can be addressed.
Preventative measures such as engagement with industry and targeted research was articulated and successfully executed as part of the SARMS program.
1 Terms of reference 7 Opportunities for efficiency ...2 Glossary 8 Cost of efficiency measures3 Executive summary 9 Principles for negating ...4 Introduction 10 A program to achieve 450 ...5 Potential socio-economic ... 11 Appendices6 Program design

Analysis of efficiency measures in the Murray-Darling Basin: Opportunities to recover 450GL in additional environmental water through efficiency measures by 2024, with neutral or positive socio-economic impacts | Page 205 of 307
19 January 2018 | Final Report
Pathways to negate socio-economic impacts9 Principles for negating adverse socio-economic impacts
The Connection Project (CP) is a $2 billion irrigation modernisation project in the GMID (Goulburn Murray Irrigation District). The project is required to deliver 429GL in water savings as per the funding agreement with the Commonwealth, and also deliver a sustainable GMID.
The mid-term Review of the Connections Project concluded that to successfully complete the project it needed to be reset. Throughout December 2015 and January 2016, the primary agency undertook a comprehensive consultation program with customers and stakeholders. The objective was to seek customer and stakeholder views and advice on four high-level delivery model options to complete the CP. These options included:
1. Capture water savings from channels that have the highest population density of primary producers
2. Treat the meters of high use customers (Water Use Licences) and capture water savings from high loss channels
3. Treat all meters and capture water savings from high loss channels4. Efficiency optimisation (preferred for community consultation).
The stakeholder engagement program consisted of:
► Five full day sessions at towns spread across the GMID so to minimise distance travelled by attendees
► All day ‘drop-in’ sessions providing opportunity for one-to-one discussions with Connections or GMW staff
► Individual consultations with staff if individuals felt a greater need to try and resolve issues at the property scale.
Over 300 people attended the consultations. Another 30 individuals responded to a separate online survey. Feedback from the roundtable discussions held at the full day sessions supported efficiency optimisation (option 4), with only three tables over the course of the ten meetings providing feedback favouring other options. 74% of respondents in the online survey showed similar backing for this option.
Goulburn Murray Water Connections Project Reset Pathway 2: Avoid ImpactsAdverse impacts could be avoided through the design and assessment of a program that include community and industry leaders. Programs could be chosen which don’t have any or minimal impacts, or made flexible to adjust to identified impacts.
The Goulburn Murray Water Connections Project used stakeholder engagement to attain feedback from the community to ensure their stakeholders were given a genuine opportunity to have their views heard.
As seen in the case study, the $2 billion infrastructure modernisation project in the GMID initially had four alternatives to move forward. Through various forms of consultation – such as town halls, individual interviews and open meetings – stakeholders were communicated the options and concerns heard. Ultimately consensus was reached as to the appropriate option that was determined to have the least impacts and optimal outcomes.
This approach to program design meant potential impacts were identified prior to implementation and the program could be adjusted accordingly.
Source: Tim Cummins and Associates 2016, Goulburn-Murray Water Connections Project Reset Community Consultation,
1 Terms of reference 7 Opportunities for efficiency ...2 Glossary 8 Cost of efficiency measures3 Executive summary 9 Principles for negating ...4 Introduction 10 A program to achieve 450 ...5 Potential socio-economic ... 11 Appendices6 Program design

Analysis of efficiency measures in the Murray-Darling Basin: Opportunities to recover 450GL in additional environmental water through efficiency measures by 2024, with neutral or positive socio-economic impacts | Page 206 of 307
19 January 2018 | Final Report
Pathways to negate socio-economic impacts9 Principles for negating adverse socio-economic impacts
1 Regional Development Victoria 2017, Regional Partnerships, http://www.rdv.vic.gov.au/regional-partnerships.2 Labour Party 2012, Support for Tasmanian Forestry Workers, http://www.billshorten.com.au/support_for_tasmanian_forestryworkers. 3 Job Active n.d., Help for workers who have recently lost their jobs in the forestry industry in Tasmania, https://jobsearch.gov.au/content/documents/help_for_workers_who_have_recently_been_made_redundant_in_the_forestry_industry_in_tasmania_0.pdf.
Pathway 3: Address primary impactIf an efficiency measure has an identifiable immediate or primary impact, this impact can be mitigated with direct investment in a targeted program. Tailored to the unique impact, this measure can ensure the impact becomes neutral or positive.
The Forestry Workers Assistance Program, as referred to in the case study, was tailored to support those who became redundant with an industry downturn. Providing specific support services and with the immediate goal of resolving the impact, it addressed these adverse impacts.
In 2012 ForestWorks was contracted to deliver the $3.9m Forestry Workers Assistance Program as part of the State Government’s Tasmanian Forestry Industry Structural Adjustment Program, in response to the downturn in the industry2.
Program Design3
As part of the program ForestWorks coordinators connected affected workers and contractors with Job Services Australia providers, registered training organisations and other services (including skills assessments).
Through relationships with local employers, ForestWorks coordinators ensured workers had access to training and employment opportunities that met the needs of the local region. The coordinators provided a range of services including:
► Connecting workers to Job Services Australia (JSA), and Centrelink► Assisting with resume building► Meeting prospective employers to find employment opportunities► Assisting in the application of jobs.► Aiding in interview preparation and transport to the location.
Outcomes
Since inception in 2000, the ForestWorks Workers Assistance Service has assisted over 1,400 forestry workers and businesses regain employment in regional areas nationally. From 2012 to 2014, 95% of workers actively seeking re-employment were able to find new work in Tasmania, assisting over 500 businesses in gaining new skilled employees.
Forestry Workers Assistance Program
Across Victoria, nine regional partnerships have been established to provide communities with greater opportunities to be heard by the government directly. These partnerships are aimed at increasing collaboration between communities, industry, businesses and government to address challenges or opportunities.
Program Design
Each partnership is managed by a diverse range of members from local communities, business and all levels of government. The partnerships present their priorities directly to the Victorian Government’s Rural and Regional Ministerial Committee. Prior to this consultation, members may engage with their communities to establish feedback and ideas for building upon existing strategies and plans.
Regional Partnership Program, Regional Development VIC1
Pathway 4: Mitigate consequential impactsAfter the primary impact, there may be further secondary or lagged impacts. To mitigate against these impacts programs could include structural adjustment or be specific to the community or industry experiencing the downturn. However, a monitoring program can aid in identifying where these can occur. Like the case study on Regional Partnership, engaging regional communities can give stakeholders a voice and a platform for identification of consequential impacts.
1 Terms of reference 7 Opportunities for efficiency ...2 Glossary 8 Cost of efficiency measures3 Executive summary 9 Principles for negating ...4 Introduction 10 A program to achieve 450 ...5 Potential socio-economic ... 11 Appendices6 Program design

Analysis of efficiency measures in the Murray-Darling Basin: Opportunities to recover 450GL in additional environmental water through efficiency measures by 2024, with neutral or positive socio-economic impacts | Page 207 of 307
19 January 2018 | Final Report
Existing programs9 Principles for negating adverse socio-economic impacts
Programs targeted at the Murray-Darling Basin
► The Murray-Darling Basin Regional Economic Diversification Programme, DIRD
► South Australian River Murray Sustainability Program, SA
► The Living Murray Indigenous Partnerships Program, MDBA
Regional Development Programs
► Regional Development Australia, Cwth
► Creating Inspiring Rural Community Leadership and Engagement programme, Cwth
► Building Better Regions Fund, DIRD
► National Stronger Regions Fund, DIRD
► Drought Communities Program, DIRD
► Community Development Grants Programme, DIRD
► Regional Growth Fund, DIRD
► Regional Jobs and Investment Package, DIRD
► Stronger Communities Program, DIRD
► Regional Partnership Program, VIC
► Regional Infrastructure Fund, VIC
► Rural Skills Connect Program, VIC
► Drought Response Package, VIC
► Regional Jobs Fund, VIC
► Stronger Regional Communities Plan, VIC
► Royalties for the Regions, QLD
► Building out Regions, QLD
► Regional Development Fund, SA
► Growing Local Economies, NSW
► Regional Growth Fund, NSW
Water
► National Water Infrastructure Fund, DAWR
► Sustainable Rural Water Use and Infrastructure Program, DAWR
► Water Infrastructure Loan Facility, DAWR
Energy
► Solar Towns Program, Dept. Environment and Energy (DEE)
► Clean Energy Finance Corporation, DEE
► CEFC Investment Mandate, DEE
► Cooperative Research Centres Programme, Dept.
Industry, Innovation and Science (DIIS)
► Australian Renewable Energy Agency, DISS
► Advancing Renewables Program, DIIS
► Research and Development Program, DISS
► Solar PV Research
► Solar Excellence
► Industry Researcher Collaboration
► Renewable Energy Venture Capital Fund, DIIS
► Clean Energy Innovation Fund, DIIS
► Carbon Capture and Storage Flagships Program, Dept. of Resources, Energy and Tourism (DRET)
Business Grants or Assistance
► Innovation Connections, DIIS
► Cooperative Research Centres Program, DIIS
► Incubator Support, DIIS
► Entrepreneurs Programme, DIIS
► Venture Capital Limited Partnerships, DIIS
► Venture Capital, DIIS
► Supplier Improvement Plan, DIIS
There is potential for negation measures to leverage programs that already exist. These programs run by State or Commonwealth Governments, have a range of objectives and assessment criteria, as well as sources of funding. However, where these solutions or programs already exist to address particular impacts these can be utilised as an alternative to building a new program. Enabling individuals to gain access to these programs or expanding successful programs may be effective at negating impacts. Some of the programs that already exist are:
Further analysis of these programs in relation to their objectives and assessment criteria is needed to determine how they can assist in a whole of government resilience and regional development program.
1 Terms of reference 7 Opportunities for efficiency ...2 Glossary 8 Cost of efficiency measures3 Executive summary 9 Principles for negating ...4 Introduction 10 A program to achieve 450 ...5 Potential socio-economic ... 11 Appendices6 Program design

Analysis of efficiency measures in the Murray-Darling Basin: Opportunities to recover 450GL in additional environmental water through efficiency measures by 2024, with neutral or positive socio-economic impacts | Page 208 of 307
19 January 2018 | Final Report
Key principles9 Principles for negating adverse socio-economic impacts
The Terms of Reference requires the consideration of the extent to which adverse impacts from efficiency measures programs may be negated through: refining the design of efficiency measures programs, existing Commonwealth programs, or establishing further opportunities to support broader regional development.
Based on a review of the literature and existing funding programs, key principles for programs aimed at negating socio-economic impacts have been developed, and can be seen on the following page.
The existing programs and frameworks used to develop these principles can be found in Appendix D.
Feedback from stakeholders on measures to negate or mitigate adverse impacts
The following points were expressed by stakeholders during consultations:
► Prior programs have not reached communities who need mitigation measures.
► Councils or representative community groups should be given the opportunity to decide their future strategy as appropriate to their circumstances.
► Extension or educational programs on what opportunities may exist for regional development (international or national, Basin or outside) would be beneficial in enabling communities to understand their prospective future. This could be focused on local businesses, individuals, councils or irrigators.
► Direction is required moving forward. There needs to be a plan or strategy (which may involve transition) to create investment certainty and establish community understanding of where they are moving to.
► A request for consistent opportunity and longevity with regional development. Programs established by one government and abandoned by the next are often detrimental.
► Existing initiatives which have proven to be successful should be empowered with additional funding and support as opposed to creating something new.
► The success of regional development is determined by the capability of local leadership.
► Diversification and a deepening of a local economy is critical.
► Diversification may occur when a community has good structural support.
► Development opportunities should take a more "creative" rather than traditional approach to encourage innovation and entrepreneurial thinking.
► Mitigation measures may have to accommodate circumstances that are yet to occur (e.g. the next dry period may have uncertain ramifications).
► Grassroots level development is required for long-term sustainable investment; to target R&D opportunities and facilitate partnerships where there are existing gaps in the market.
Source: Stakeholder consultations.
1 Terms of reference 7 Opportunities for efficiency ...2 Glossary 8 Cost of efficiency measures3 Executive summary 9 Principles for negating ...4 Introduction 10 A program to achieve 450 ...5 Potential socio-economic ... 11 Appendices6 Program design

Analysis of efficiency measures in the Murray-Darling Basin: Opportunities to recover 450GL in additional environmental water through efficiency measures by 2024, with neutral or positive socio-economic impacts | Page 209 of 307
19 January 2018 | Final Report
Key principles9 Principles for negating adverse socio-economic impacts
Principles Design considerations
Facilitate existing innovation
► Appropriate local programs or initiatives should be identified, and consequently given the opportunity to expand with additional funding or support.
► Program design to empower and reward local entrepreneurs.
Create new and utilise existing partnership opportunities
► Initial investigation of a community to determine the proximity and potential of existing and prospective partnerships with educational institutions, government, industry or research bodies.
► Establish opportunity for private investment and encourage opportunities to integrate businesses in the future.
Ongoing collection of data and feedback
► Programs to have inbuilt mechanisms to measure and collect data on progress, including effectiveness of partnerships. This allows for greater accountability and transparency in providing evidence of success or failure.
Provide greater flexibility in the types of initiatives that could be funded
► Utilising the collated data to establish the progress of programs - the approach and investment should have a degree of flexibility on what initiatives can be funded, to adapt to new circumstances or feedback.
► Traditional schemes to be valued, but not considered as universal ‘best practice’. Unique approaches to be encouraged with additional flexibility to cater for a wider variety of ideas.
Principles Design considerationsComprehensive understanding of the community
► Stakeholder engagement to include a diverse range of community members to establish context such as: existing impacts, attitude towards change, wellbeing, capacity for change, resilience, and perception of community.
► Time required to enable understanding of community context (e.g. previous regional development initiatives, demographics, population structure, economic base, regional interdependencies, current levels of investment).
► In allocating program funding, an understanding of the community profile, as well as potential needs is necessary. Investment to be directed towards the genuine gaps in data and information with the most potential for greater understanding.
Development of common vision/strategic plan with the community
► Ensure the community is empowered to build a common and realistic vision of what could occur in the future with the appropriate level of investment.
Development to be inspired from a grassroots level
► New industries or opportunities to be identified by the community.
► Program funding may allow for external consultants or studies to be conducted, but the community is to drive the direction of investment.
Source: EY Analysis.
1 Terms of reference 7 Opportunities for efficiency ...2 Glossary 8 Cost of efficiency measures3 Executive summary 9 Principles for negating ...4 Introduction 10 A program to achieve 450 ...5 Potential socio-economic ... 11 Appendices6 Program design

Analysis of efficiency measures in the Murray-Darling Basin: Opportunities to recover 450GL in additional environmental water through efficiency measures by 2024, with neutral or positive socio-economic impacts | Page 210 of 307
A program to achieve 450GL with neutral socio-economic impacts
10
In this section Page
Overview 211
Key findings 212
Elements of a program to recover water with neutral or positive socio-economic impacts 215
Program to recover 450GL with neutral socio-economic impacts 216
Negating adverse impacts 217
A two-way community and industry leader engagement strategy 221
Drawing on change management principles 222
Programs with successful community engagement 223
Investment in building capacity and interest 224
A water efficiency program that improves productivity and develops existing and larger opportunities as a priority
226
A regional based approach to program design in partnership with industry 228
A monitoring and evaluation framework 229
Program implementation 236

Analysis of efficiency measures in the Murray-Darling Basin: Opportunities to recover 450GL in additional environmental water through efficiency measures by 2024, with neutral or positive socio-economic impacts | Page 211 of 307
19 January 2018 | Final Report
Overview10 A program to achieve 450GL with neutral socio-economic impacts
Two-way engagement with community and industry leaders to build trust Investment in building capacity and interest A program that improves productivity and
develops existing and larger opportunities as a priority
► Establish early two-way engagement to create and maintain a social licence for continued water recovery.
► The engagement strategy should acknowledge the factors that are affecting regional communities.
► The program should include a clear outline of the objectives and environmental benefits of water efficiency projects, as well as how the impacts will be evaluated and mitigated.
► The program should provide opportunity for regions and industries to provide input to program design.
► Education and training can build capacity and interest in water efficiency programs, such as better sharing of knowledge.
► Research and development activities that improve regional productivity with less reliance on water can also build capacity and interest.
► Whole of government resilience and regional development programs to improve regional productivity.
► Develop off-farm and urban opportunities as a priority to meet the 62GL bridge the gap target by 2019.
► A large opportunities program that involves more targeted market engagement and differential pricing.
► A water efficiency program which is flexible to the types of projects, if it can improve the productivity on and off-farm and reduce the reliance on water.
A monitoring and evaluation framework that allows for agile programs
A regional based approach to program design in partnership with industries
► A monitoring and evaluation framework needs to be in place for the duration of the program.
► The framework should collect data from projects and feedback from program participants.
► It will inform the assessment of program impacts at different scales and program performance through key indicators.
► Program design should be adjusted based on analysis of data collected.
► On-farm programs to be co-designed with industry and community leaders.
► Funding for programs should be allocated by industry and region so that individual communities or industries are not advantaged over others.
Program implementation is phased
► Phase 1 (2018 to 2019) – community and industry engagement, investment in building capacity and interest, pursue existing and larger opportunities and develop regional and industry delivery plans.
► Phase 2 (2020 to 2024) – full implementation of all program elements and ongoing program review and refinement.
1 Terms of reference 7 Opportunities for efficiency ...2 Glossary 8 Cost of efficiency measures3 Executive summary 9 Principles for negating adv ...4 Introduction 10 A program to achieve ...5 Potential socio-economic ... 11 Appendices6 Program design

Analysis of efficiency measures in the Murray-Darling Basin: Opportunities to recover 450GL in additional environmental water through efficiency measures by 2024, with neutral or positive socio-economic impacts | Page 212 of 307
19 January 2018 | Final Report
10 A program to achieve 450GL with neutral socio-economic impactsKey findings
10.1 A multi-faceted program to deliver the required water within the time period
A comprehensive approach is needed to recover 450GL by 2024
► A two-way engagement with community and industry leaders that creates and maintains a social licence for continued water recovery.
► Investment in building capacity and interest which requires a whole of government approach.
► A water efficiency program that develops off-farm and urban opportunities as a priority. Large opportunities are pursued using a more targeted market engagement and differential pricing approach.
► A comprehensive monitoring and evaluation framework that allows for agile programs.
► A regional based approach to designing water efficiency programs in partnership with industries and communities.
10.2 A two-way community and industry leader engagement strategyA strategy that provides the structure for communicating and engaging with the community and industry to boost interest and capacity to participate
► Two-way community engagement with community and industry leaders needs to:
► Acknowledge the factors that are affecting regional communities
► Outline the benefits of water efficiency projects and how the impacts will be evaluated and mitigated
► Provide opportunities for industry and community to take leadership in regional delivery plans.
1 Terms of reference 7 Opportunities for efficiency ...2 Glossary 8 Cost of efficiency measures3 Executive summary 9 Principles for negating adv ...4 Introduction 10 A program to achieve ...5 Potential socio-economic ... 11 Appendices6 Program design

Analysis of efficiency measures in the Murray-Darling Basin: Opportunities to recover 450GL in additional environmental water through efficiency measures by 2024, with neutral or positive socio-economic impacts | Page 213 of 307
19 January 2018 | Final Report
10 A program to achieve 450GL with neutral socio-economic impactsKey findings
10.3 Investment in building capacity and interest
Education, research and development and support for regional productivity can build interest in a water efficiency program
► A whole of government approach to building capacity and interest that leverages existing programs.
► Education and training aimed at improving the knowledge and capacity of irrigators can build interest in water efficiency programs.
► Research and development activities can assist industries and regions increase productivity and water efficiency, using funding from existing programs.
► A whole of government resilience and regional development program that supports communities and industries undergoing structural change and leverages existing programs.
10.4 Water efficiency programProgram includes on-farm, off-farm and urban projects
► Immediate pursuit of off-farm and urban opportunities with zero adverse socio-economic impacts and other immediate on-farm opportunities or programs with limited (or addressable) adverse socio-economic impacts. Unsolicited proposals received by DAWR should also be pursued as a priority.
► A separate large opportunities program that involves targeted market engagement and differential pricing to maximise value for money or the ability to achieve 450GL by 2024.
► Pre project assessment on the best options for productivity improvement and post project extension programs to ensure the maximum benefits are extracted from the investment should be part of the on-farm water efficiency program.
10.4 Regional based approach to program design in partnership with industriesRegional delivery plans are developed by or with the input of irrigators, industry bodies and communities
► Regional delivery plans developed by or with the input of irrigators, industry bodies and communities that take into account characteristics of the region are recommended, as part of the roll out of on-farm efficiency programs.
► Regional taskforces can be established to allow structured engagement and lead the development and implementation of regional and industry plans. It is important that the leadership of regional taskforces includes individuals with commercial expertise and acumen.
► Funding is allocated by industry and region to ensure equal opportunity. Initial funding allocation is subject to change based on data collected from the monitoring and evaluation framework.
1 Terms of reference 7 Opportunities for efficiency ...2 Glossary 8 Cost of efficiency measures3 Executive summary 9 Principles for negating adv ...4 Introduction 10 A program to achieve ...5 Potential socio-economic ... 11 Appendices6 Program design

Analysis of efficiency measures in the Murray-Darling Basin: Opportunities to recover 450GL in additional environmental water through efficiency measures by 2024, with neutral or positive socio-economic impacts | Page 214 of 307
19 January 2018 | Final Report
10 A program to achieve 450GL with neutral socio-economic impactsKey findings
10.6 A comprehensive monitoring and evaluation framework
A framework that collects data and information to enable agile programs
► A monitoring and evaluation framework is needed to allow a focus on program refinement and continuous improvement. The framework should provide for:
► Collection of data from projects and feedback from program participants
► Monitoring of the impacts of the program at different scales and assessment of the performance of the program through feedback and other key performance indicators
► Adjustments to program design based on analysis of data collected.
10.7 Implementation is phasedTwo phases from 2018 to 2024
► Phase 1 (2018 to 2019) – community and industry engagement, investment in building capacity and interest, pursue existing and larger opportunities and develop regional and industry delivery plans.
► Phase 2 (2020 to 2024) – full implementation of all program elements and ongoing program review and refinement.
10.8 Program governanceA clear governance structure with dedicated teams including community and industry representation
► A governance structure for the program should include the following elements:
► Program steering committee that provides regular updates to the Ministerial Council
► A single agency to deliver the program
► Dedicated teams for monitoring and evaluation, community engagement, and project implementation.
► Technical panels should be set up to provide advice to regional taskforces on the merits of proposed projects and whether it achieves improvements to farm productivity with less reliance on water.
1 Terms of reference 7 Opportunities for efficiency ...2 Glossary 8 Cost of efficiency measures3 Executive summary 9 Principles for negating adv ...4 Introduction 10 A program to achieve ...5 Potential socio-economic ... 11 Appendices6 Program design

Analysis of efficiency measures in the Murray-Darling Basin: Opportunities to recover 450GL in additional environmental water through efficiency measures by 2024, with neutral or positive socio-economic impacts | Page 215 of 307
19 January 2018 | Final Report
Elements of a program to recover water with neutral or positive socio-economic impacts
10 A program to achieve 450GL with neutral socio-economic impacts 1 Terms of reference 7 Opportunities for efficiency ...2 Glossary 8 Cost of efficiency measures3 Executive summary 9 Principles for negating adv ...4 Introduction 10 A program to achieve ...5 Potential socio-economic ... 11 Appendices6 Program design
Based on stakeholder consultations conducted, the analysis on socio-economic impacts from efficiencies measures and potential for further water efficiencies outlined in this report, a multi-faceted program to recover 450GL with neutral or positive socio-economic impacts is recommended to include the elements outlined below. Diagrams that summarise these elements are provided in the following two pages. Each of these elements are then discussed in further detail in the rest of this chapter.
A two-way community and industry leader engagement strategy
During consultations conducted for this report, stakeholders have expressed a lack of understanding of the need for additional water recovery (refer to Appendix B). Therefore, a community and industry leader engagement strategy is needed to build a social license for water recovery. The strategy should acknowledge the factors that are affecting regional communities, the benefits of a water recovery program for the environment and the community and provide a plan to engage with the community to build a vision for the future.
It is important to maintain engagement with community and industry on an ongoing basis through the duration of the program. This could be done through the establishment of regional taskforces.
Investment in building capacity and interest
Education and training can help build capacity and interest in water efficiency programs. Measures such as knowledge sharing sessions amongst irrigators can help articulate the benefits of participation and address
any perceived risks from efficiency programs.
Further, a whole of government resilience and regional development program that supports industries and communities undergoing structural change will build interest in the program from the community.
Research and development initiatives to improve the productivity on-farm with less reliance on water would also build interest in the water efficiency program.
Measures to build capacity and interest require whole of government support through leveraging current programs.
A water efficiency program that improves productivity and develops existing and larger opportunities as a priority
A water efficiency program which is flexible to the types of projects, if they can improve productivity on farms. On-farm, off-farm, combination of on and off-farm and urban projects should all be included.
Immediate pursuit of off-farm and urban opportunities with zero adverse socio-economic impacts and other immediate on-farm opportunities or programs with limited (or addressable) adverse socio-economic impacts. Unsolicited proposals received by DAWR should also be pursued as a priority. These opportunities could be used to meet any gap to the water recovery target by 2019.
A regional based approach to program design in partnership with industries
Regional delivery plans that are developed by or with the input of irrigators, industry bodies and communities
that take into account characteristics of the region are recommended, as part of the roll out of on-farm efficiency programs. Regional taskforces can be established to be responsible for the regional delivery plans.
Funding is allocated by industry and regions so that individual regions or industries are not advantaged over others. The initial funding allocation can be assessed and revised as part of an agile program approach based on data collected through a monitoring and evaluation framework.
A monitoring and evaluation framework that allows for agile programs
A comprehensive monitoring and evaluation framework which collects data, assesses impacts at different scales and provides feedback to improve program delivery.
Under the framework, data needs to be collected on changes in on-farm conditions such as labour, water use, crop types and land irrigated. Mechanisms to capture the flow-on changes at an industry and community level are also needed.
Assessment of program performance is needed at least annually to understand areas where adjustments to program design may be required.

Analysis of efficiency measures in the Murray-Darling Basin: Opportunities to recover 450GL in additional environmental water through efficiency measures by 2024, with neutral or positive socio-economic impacts | Page 216 of 307
19 January 2018 | Final Report
10 A program to achieve 450GL with neutral socio-economic impactsProgram to recover 450GL with neutral socio-economic impacts
Agile program ► Program review and
refinement every 12 months
► Funding allocated by industry
► Funding allocated for communities which buy in
Approach to socio-economic impacts
Community and industry engagement to build support► Establish a community engagement strategy to build social licence for continued water
recovery► The strategy acknowledges the factors that are affecting regional communities► A clear outline of the objectives of water efficiency projects and how the impacts will be
evaluated and mitigated ► Input from community and industry on their involvement in delivery & evaluation/evolution► Opportunity for individual communities or industry bodies to volunteer to take
leadership and ownership
Investment in building capacity and interest► Whole of government support for regional development programs► Targeted R&D► Knowledge sharing between irrigators and education for farm management and planning
Pursue existing opportunities► E.g., LWM, MIL, MI, large farming corporates, urban projects
► Program design that avoids impacts including focus on off-farm, industry and local ownership, monitoring and evaluation
► Monitoring of labour impacts, particularly in relation to the viability of downstream businesses
► R,D&E to support industries and maximise benefits of participation
► Network impacts negated or infrastructure investment provided
► Support for actions identified in regional development plans
► These are projects with limited adverse impacts or those where a business case can be developed to directly mitigate any adverse impacts
► Acknowledgement of variety of socio-economic influences and impacts that have occurred to date
► Helping people understand impact pathways with ongoing impact monitoring through data collection
Execution
WES
A fu
ndin
g W
ESA
fund
ing
O
ther
exis
ting
fund
ing
prog
ram
s
Set up a large opportunities program► Urban and industrial► Larger on-farm users► Off-farm projects► Leveraging consultants/brokers
On-farm program► Regional delivery plans developed in partnership with industries on implementation► Education and support to identify productivity improvements and maximises benefits post
implementation
2018 2019 2020 2021 2022 2023 2024
Setting up for success and realising existing opportunities Agile program delivery, monitoring socio-economic impact
1 Terms of reference 7 Opportunities for efficiency ...2 Glossary 8 Cost of efficiency measures3 Executive summary 9 Principles for negating adv ...4 Introduction 10 A program to achieve ...5 Potential socio-economic ... 11 Appendices6 Program design

Analysis of efficiency measures in the Murray-Darling Basin: Opportunities to recover 450GL in additional environmental water through efficiency measures by 2024, with neutral or positive socio-economic impacts | Page 217 of 307
19 January 2018 | Final Report
10 A program to achieve 450GL with neutral socio-economic impactsNegating adverse impacts
1 Terms of reference 7 Opportunities for efficiency ...2 Glossary 8 Cost of efficiency measures3 Executive summary 9 Principles for negating adv ...4 Introduction 10 A program to achieve ...5 Potential socio-economic ... 11 Appendices6 Program design
The table below and overleaf outlines the key features of the program to ensure adverse impacts are negated. In addition to the pre-emptive measures to prevent adverse impacts and the program elements to avoid adverse impacts outlined in the tables, the program also includes a monitoring and evaluation framework to address primary adverse impacts, to mitigate flow on adverse impacts and to help address residual risks following the application of the identified measures. The monitoring and evaluation framework includes collecting and analysing data on potential impacts on a regular basis to allow program design to be adjusted if needed.
EY acknowledges that many stakeholders are concerned about the rate of change in the agricultural sector and whether any structural adjustment measures are needed. Stakeholders also commented that there is limited analysis on the extent that education and training, and a whole of government resilience and regional development program would negate identified negative impacts from additional water recovery. As a result EY’s recommended starting point for negating potential adverse impacts is through program design elements that seek to avoid these impacts occurring and are not structural adjustment measures. EY has only started with education and training as a program design measure where there is an impact pathway with net positive impacts and where education is therefore required to help people understand how to best benefit from the impact pathway. EY’s other recommendations are pre-emptive measures that could either mitigate impacts if avoidance via program design is not effective, and/or assist in the efficacy of the program design recommendations. It is noted that these measures are secondary to the primary program measures. EY also acknowledges stakeholder comments that it cannot be assumed that state government regional development programs will be temporarily realigned to mitigate risks of a Commonwealth program. Whilst it is recommended that a whole of government approach to regional development program is undertaken, this is to ensure that community benefits are maximised. State priorities would also be taken into account in a whole of government regional development program. EY’s recommendation on the roll out of regional development plans is about communities understanding their competitive strengths and future pathways, not about government funding of structural adjustment.
.Key impact pathway Implication identified for program design
Program elements to avoid adverse impacts
Pre-emptive measures to mitigate adverse impacts
Consideration of residual risks
Impact on irrigated production
► On a 20-year NPV basis, water efficiency measures have a net productive benefit as reductions in future production are offset by increased production in the short term and the benefit of Commonwealth funding.
► Invest in community engagementto promote understanding of the impacts from water efficiency measures. Also invest in a monitoring and evaluation framework to better analyse impacts of efficiency measures.
► Supporting measures such as education and training, R&D and facilitation of knowledge sharing, should be included as part of water efficiency programs to ensure that participants are able to take advantage of productivity improvements.
► Projects should be selected to ensure that they include sufficient productivity benefits. As part of this, irrigators should be provided with sufficient tools and information to take advantage of productivity benefits.
► R&D to improve productivity.► Knowledge sharing between
irrigators.► Education for irrigators on
farm management and planning.
► The analysis suggests that there will be a positive impact and the negation measures have been designed to maximise the benefit. The potential for a residual risk only arises where there are very limited increases in short term production as a result of efficiency measures.

Analysis of efficiency measures in the Murray-Darling Basin: Opportunities to recover 450GL in additional environmental water through efficiency measures by 2024, with neutral or positive socio-economic impacts | Page 218 of 307
19 January 2018 | Final Report
10 A program to achieve 450GL with neutral socio-economic impactsNegating adverse impacts
Key impact pathway Implication identified for program design
Program elements to avoid adverse impacts
Pre-emptive measures to mitigate adverse impacts
Consideration of residual risks
Distributional impact arising from changed on-farm output decisions by participants
► Distributional impacts could be significant if certain industries or communities do not participate in water efficiency programs as they will be at a competitive disadvantage vis-à-vis those industries or communities which do, with water flowing to more productive and efficient users. However, the size and nature of this impact cannot be determined without further data.
► Mechanisms should be included within the program to encourage all industries and communities to participate equally in programs to negate distributional impacts; with equal access to funding.
► Whole of government approach to regional development, including targeted R&D projects to support structural change.
► Regional delivery plans developed in partnership with industries to increase participation.
► Program funding is allocated across communities and industries.
► Initial priority on off-farm and urban opportunities.
► R&D to improve productivity.► Whole of government
resilience and regional development program.
► Education and training for irrigators on farm management and planning, including measures to improve productivity.
► Distributional impacts to industries and communities should largely be negated via mechanisms included in the program to encourage all industries and communities to participate equally in programs and through equal access to funding.
► The potential for residual risk is to be managed through a whole of government approach to regional development and ongoing monitoring and evaluation to assess participation and monitor impacts.
1 Terms of reference 7 Opportunities for efficiency ...2 Glossary 8 Cost of efficiency measures3 Executive summary 9 Principles for negating adv ...4 Introduction 10 A program to achieve ...5 Potential socio-economic ... 11 Appendices6 Program design

Analysis of efficiency measures in the Murray-Darling Basin: Opportunities to recover 450GL in additional environmental water through efficiency measures by 2024, with neutral or positive socio-economic impacts | Page 219 of 307
19 January 2018 | Final Report
10 A program to achieve 450GL with neutral socio-economic impactsNegating adverse impacts
Key impact pathway Implication identified for program design
Program elements to avoid adverse impacts
Pre-emptive measures to mitigate adverse impacts
Consideration of residual risks
Impact on network charges
► On-farm water efficiency measures are unlikely to significantly impact on network charges. In the short to medium term, termination fees should largely negate pricing impacts to irrigators.
► Integration of on-farm and off-farm efficiency measures to allow maximum efficiency of both the network and on-farm. This may include the consolidation of IIOs where practical.
► Integrated implementation of on-farm and off-farm efficiency measures to allow implementation of infrastructure that maximises the efficiency of the network and on-farm.
► Additional investment in networks where it can be demonstrated through a business case that water efficiency measures have impacted their costs (such as where additional investment is needed to maintain delivery flow rates) or revenue (such as reduced fees).
► Use of environmental water to maintain flows/provide revenue.
► Consolidate IIOs where practicable.
► The program includes the ability of impacted networks to put forward business cases for additional investment where it can be demonstrated that water efficiency measures have impacted their costs (such as where additional investment is needed to maintain delivery flow rates) or revenue (such as reduced fees). As a result there should be no residual risk associated with this impact pathway.
1 Terms of reference 7 Opportunities for efficiency ...2 Glossary 8 Cost of efficiency measures3 Executive summary 9 Principles for negating adv ...4 Introduction 10 A program to achieve ...5 Potential socio-economic ... 11 Appendices6 Program design

Analysis of efficiency measures in the Murray-Darling Basin: Opportunities to recover 450GL in additional environmental water through efficiency measures by 2024, with neutral or positive socio-economic impacts | Page 220 of 307
19 January 2018 | Final Report
10 A program to achieve 450GL with neutral socio-economic impactsNegating adverse impacts
Key impact pathway Implication identified for program design
Program elements to avoid adverse impacts
Pre-emptive measures to mitigate adverse impacts
Consideration of residual risks
Impact on labour productivity and employment
► Both on and off-farm efficiency projects are associated with increasing labour productivity. However, based on the data available there is. However while there is insufficient evidence to conclusively determine the net impacts on employment, the evidence gathered to date suggests that employment impacts are likely to be limited.
► Given the limited data and evidence, the impact on labour productivity and employment needs to be monitored on an ongoing basis with a particular focus on tipping points for industries.
► Whole of government approach to regional development, including development of employees with appropriate skills within communities (or the attraction of those people with required skills).
► All communities are to have equal access to program funding.
► Program funding is allocated across communities and industries.
► Initial priority on off-farm and urban opportunities.
► More coordinated use of the IIO system, for example through greater use of IIO systems to deliver. environmental water
► Whole of government resilience and regional development program.
► Both positive and adverse impacts on labour productivity and employment have been identified. To manage this the program has included a whole of government approach to regional development and the ongoing monitoring and evaluation of impacts, with an agile approach suggested to ensure program design is responsive to issues identified.
1 Terms of reference 7 Opportunities for efficiency ...2 Glossary 8 Cost of efficiency measures3 Executive summary 9 Principles for negating adv ...4 Introduction 10 A program to achieve ...5 Potential socio-economic ... 11 Appendices6 Program design
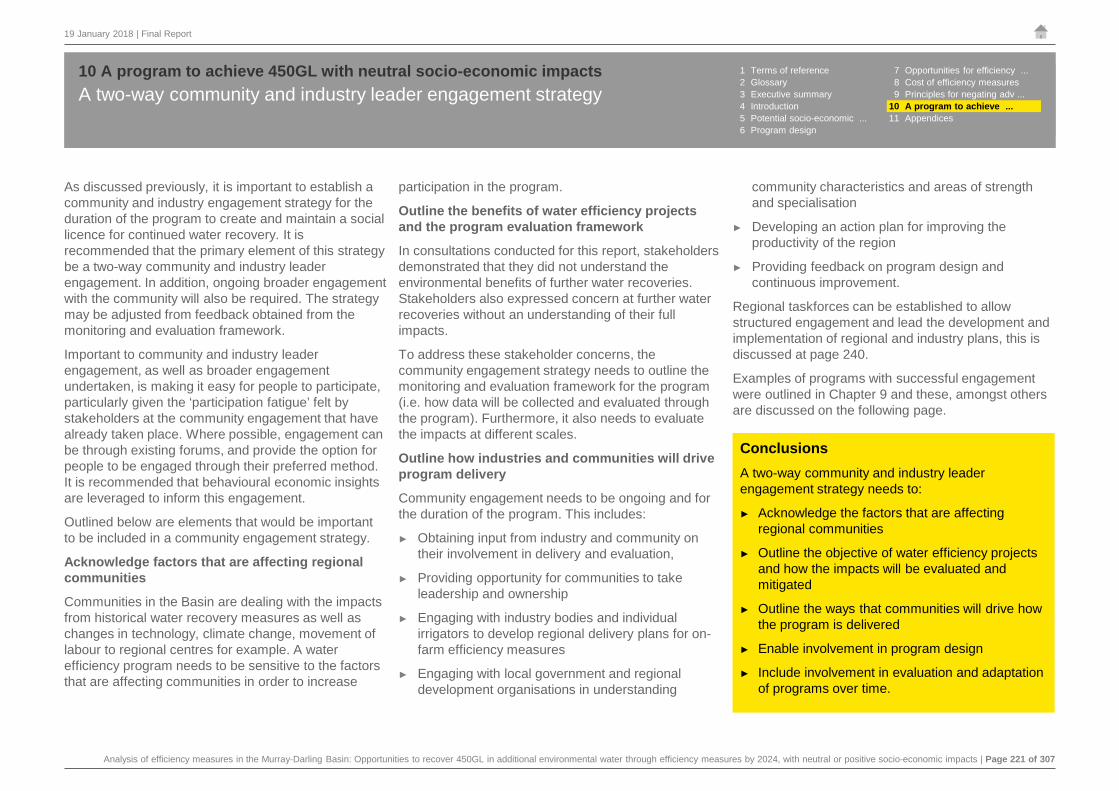
Analysis of efficiency measures in the Murray-Darling Basin: Opportunities to recover 450GL in additional environmental water through efficiency measures by 2024, with neutral or positive socio-economic impacts | Page 221 of 307
19 January 2018 | Final Report
A two-way community and industry leader engagement strategy10 A program to achieve 450GL with neutral socio-economic impacts
As discussed previously, it is important to establish a community and industry engagement strategy for the duration of the program to create and maintain a social licence for continued water recovery. It is recommended that the primary element of this strategy be a two-way community and industry leader engagement. In addition, ongoing broader engagement with the community will also be required. The strategy may be adjusted from feedback obtained from the monitoring and evaluation framework.
Important to community and industry leader engagement, as well as broader engagement undertaken, is making it easy for people to participate, particularly given the ‘participation fatigue’ felt by stakeholders at the community engagement that have already taken place. Where possible, engagement can be through existing forums, and provide the option for people to be engaged through their preferred method. It is recommended that behavioural economic insights are leveraged to inform this engagement.
Outlined below are elements that would be important to be included in a community engagement strategy.
Acknowledge factors that are affecting regional communities
Communities in the Basin are dealing with the impacts from historical water recovery measures as well as changes in technology, climate change, movement of labour to regional centres for example. A water efficiency program needs to be sensitive to the factors that are affecting communities in order to increase
participation in the program.
Outline the benefits of water efficiency projects and the program evaluation framework
In consultations conducted for this report, stakeholders demonstrated that they did not understand the environmental benefits of further water recoveries. Stakeholders also expressed concern at further water recoveries without an understanding of their full impacts.
To address these stakeholder concerns, the community engagement strategy needs to outline the monitoring and evaluation framework for the program (i.e. how data will be collected and evaluated through the program). Furthermore, it also needs to evaluate the impacts at different scales.
Outline how industries and communities will drive program delivery
Community engagement needs to be ongoing and for the duration of the program. This includes:
► Obtaining input from industry and community on their involvement in delivery and evaluation,
► Providing opportunity for communities to take leadership and ownership
► Engaging with industry bodies and individual irrigators to develop regional delivery plans for on-farm efficiency measures
► Engaging with local government and regional development organisations in understanding
community characteristics and areas of strength and specialisation
► Developing an action plan for improving the productivity of the region
► Providing feedback on program design and continuous improvement.
Regional taskforces can be established to allow structured engagement and lead the development and implementation of regional and industry plans, this is discussed at page 240.
Examples of programs with successful engagement were outlined in Chapter 9 and these, amongst others are discussed on the following page.
ConclusionsA two-way community and industry leader engagement strategy needs to:
► Acknowledge the factors that are affecting regional communities
► Outline the objective of water efficiency projects and how the impacts will be evaluated and mitigated
► Outline the ways that communities will drive how the program is delivered
► Enable involvement in program design
► Include involvement in evaluation and adaptation of programs over time.
1 Terms of reference 7 Opportunities for efficiency ...2 Glossary 8 Cost of efficiency measures3 Executive summary 9 Principles for negating adv ...4 Introduction 10 A program to achieve ...5 Potential socio-economic ... 11 Appendices6 Program design

Analysis of efficiency measures in the Murray-Darling Basin: Opportunities to recover 450GL in additional environmental water through efficiency measures by 2024, with neutral or positive socio-economic impacts | Page 222 of 307
19 January 2018 | Final Report
Drawing on change management principles10 A program to achieve 450GL with neutral socio-economic impacts
As discussed, the Basin has undergone significant social and economic change in recent years. It is suggested that program design draw on aspect of change management theory as well as success factors identified in other programs both nationally and internationally. The later are discussed on the following page.
Change management
Many organisational change tools have originated from the work of John Kotter, a professor at Harvard Business School and world-renowned change expert, Kotter introduced his eight-step change process in his 1995 book, "Leading Change”.
Kotter developed an eight step process for leading change, with these steps outlined in the figure.
Create a sense of urgency
Help others see the need for change through a bold, aspirational opportunity statement that communicates the importance of acting immediately.
Building a guiding coalition
A volunteer army needs a coalition of effective people – born of its own ranks –to guide it, coordinate it, and communicate its activities.
Form a strategic vision and initiatives
Clarify how the future will be different from the past and how you can make that future a reality through initiatives linked directly to the vision.
Enlist a volunteer army
Large-scale change can only occur when massive numbers of people rally around a common opportunity. They must be bought-in and urgent to drive
change and moving in the same direction.
Enable action by removing barriers
Removing barriers such as inefficient processes and hierarchies provides the freedom necessary to work across silos and generate real impact.
Generate Short-Term Wins
Wins are the molecules of results. They must be recognized, collected and communicated – early and often – to track progress and energize volunteers to
persist.
Sustain Acceleration
Press harder after the first successes. Your increasing credibility can improve systems, structures and policies. Be relentless with initiating change after
change until the vision is a reality.
Institute ChangeArticulate the connections between the new behaviours and organizational
success, making sure they continue until they become strong enough to replace old habits.
Source: Kotter, J. 2017, The 8 Step Process for Leading Change, https://www.kotterinc.com/8-steps-process-for-leading-change/.
1 Terms of reference 7 Opportunities for efficiency ...2 Glossary 8 Cost of efficiency measures3 Executive summary 9 Principles for negating adv ...4 Introduction 10 A program to achieve ...5 Potential socio-economic ... 11 Appendices6 Program design

Analysis of efficiency measures in the Murray-Darling Basin: Opportunities to recover 450GL in additional environmental water through efficiency measures by 2024, with neutral or positive socio-economic impacts | Page 223 of 307
19 January 2018 | Final Report
Programs with successful community engagement10 A program to achieve 450GL with neutral socio-economic impacts
Programs supporting successful change
Chapter 9 outlines a number programs which are illustrative of negating socio-economic impacts. These programs which include SARMs, Trangie-Nevertire Irrigation Scheme, Goulburn Murray Water Connections Project Reset, the Forestry Workers Assistance Program and the Regional Partnership Program also include elements of successful engagement including:
► Working with industry to design the program
► Support for adapting to changes such as research programs
► Genuine opportunities for feedback to be heard and incorporated into future activities
► Flexibility in design to adapt to concerns or issues
► Building direct relationships with stakeholders
► Mechanisms to enable a diversity of views to be heard and to drive future direction.
In addition to these programs other national and international examples should be drawn upon to inform best practice. One such example is the approach taken to significant changes to payroll tax requirements in the Midlands in the United Kingdom. Key success factors of this change included:
► Changing from a macro economic focus of changes and impacts to a microeconomic focus, particularly in understanding impacts at an individual business level.
► Ensuring time was taken to understand the specific impacts to different stakeholders and their individual circumstances.
► An approach which entailed a focus on listening before implementing change.
► Education of industry leaders and tax agents to support broader communication and a shared understanding.
Another example is the application of collective impact solutions in human services. Collective Impact is an emerging method for solving a complex social problem which aims to use the commitment of a group of people or organisations from different sectors to contribute to solving social problems. The focus of the approach is to shift from “isolated impact” (where individuals may benefit) to “collective impact” (where groups or communities are the beneficiaries). The underlying premise of Collective Impact is that no single organisation or agency can create large-scale, lasting social change alone. The Collective Impact approach provides a framework and process for effective collaboration, particularly in relation to formulating place-based solutions. What is critical to such an approach is:
► The development of agreed and robust outcome measures
► Establishing clear and relevant incentives for participants and stakeholders
► Taking a preventative or proactive approach in the design of place-based solutions
► Sharing of risks and benefits across government and non-government sectors.
The WA Government Regional Services Reform Unit (RSRU) has undertaken work to develop the capacity and capability of District Leadership Groups (DLGs) to
formulate collaborative solutions using the Collective Impact approach. DLGs comprise leaders from all tiers of government and the community and collectively they identified a number of community priorities to pilot collaboration initiatives.
The East Kimberly DLG identified juvenile offending as a priority and developed the Kununurra Empowering Youth (KEY) initiative, which engages community organisations and government agencies to provide a wide range of diversionary activities during school holidays when there is a spike in crime and juvenile incarcerations. KEY has had a dramatic impact on rates of offending and reduction in juvenile incarcerations, and most importantly on the life trajectories of many young people. KEY has created new relationships across organisations and between government and community.
Also in Western Australia a Collective Impact initiative in Broome (the ‘Broome Model”) has generated a range of initiatives including one that focussed on local employment pathways for young people, which combined a work program based on native trees and fruits, social enterprise, cultural experience, youth services and the Aboriginal Medical Service. This program has generated outcomes relating to the wellbeing and culture as well as employment of vulnerable young people.
The Broome Model has stimulated collaborative initiatives relating to housing and homelessness, and a Broome Collaborative Care Model led by Nyamba Buru Yawuru (NBY) that brings together key primary health organisations with a range of community organisations to drive a step change in community health and wellbeing.
1 Terms of reference 7 Opportunities for efficiency ...2 Glossary 8 Cost of efficiency measures3 Executive summary 9 Principles for negating adv ...4 Introduction 10 A program to achieve ...5 Potential socio-economic ... 11 Appendices6 Program design

Analysis of efficiency measures in the Murray-Darling Basin: Opportunities to recover 450GL in additional environmental water through efficiency measures by 2024, with neutral or positive socio-economic impacts | Page 224 of 307
19 January 2018 | Final Report
A key part of achieving the 450GL water recovery is obtaining the support of industry and community groups. These groups can propose ideas for achieving water recovery and where feasible lead the implementation of those ideas. However there can be constraints to the capacity of these groups to participate due to, for example lack of trust of governments, lack of knowledge on the best options to improve productivity, lack of resources to put together project proposals, and other stressful events such as market downtown and drought.
Outlined below are some measures to enable better knowledge of actions to improve productivity in regions. Page 227 also includes a discussion on program design elements to address a lack of resources and knowledge to participate.
Education as part of building capacity and interest
Feedback from stakeholders on measures that are important in building interest in on-farm efficiency programs include:
► Knowledge sharing sessions, where farmers in a region tour neighboring farms to learn about technologies and farming practices that have provided benefits
► Financial management and business planning training and tools to help farmers understand the profitability drivers of their business, and the best options for them to improve their productivity and profitability.
Examples of existing or previous programs that offer
the above measures include the Farm2Plan program in Victoria, and the NSW Sustaining the Basin Irrigated Farm Modernisation program.
Investment in assessment of social and economic outcomes would also be important in building a common understanding and knowledge base. A monitoring and evaluation framework is discussed at page 229.
During consultations, stakeholders raised the issue of reform fatigue and lack of capacity in some parts of the community to deal with further changes. Appendix D outlines examples of programs that aim to improve the capacity of communities. Examples of specific measures that have been implemented to improve the capacity of communities include:
► Forums and meetings for individuals to share challenges faced. Aimed at building trust, confidence, common goals and leadership based on shared experiences
► Training on understanding an individual’s personality style and consequent adaption to a successful team environment. To gauge individual strengths and weaknesses for effective teamwork in and outside the program, and to enhance local capacity and leadership.
Whole of government resilience and regional development program
As outlined in Chapter 9, under the SARMS program, to improve irrigation efficiency in SA funding for regional economic development was included. The
program received the support of industry and applications to the irrigation efficiency program have been in excess of the number of contracted participants.
Measures to support regional productivity should be tailored to the characteristics of the region and in response to the impacts from water efficiency measures.
The following indicators could be used to understand the characteristics of a region:
► Level of reliance on water (for example, through a proxy such as the percentage of employment in agriculture)
► Level of relative socio-economic advantage and disadvantage
► Age of population (for example, whether there is a reduction in the working age population in the community).
Some regions in the Basin are less able to adapt to changes in water availability due to a number of factors (e.g. a high reliance on a single or limited number of industries). These regions need assistance to establish a vision for their future economic development. For example, the Smart Specialisation framework (refer to Appendix D) could be used to understand the strengths of the community. This engagement could be through workshops that challenges perceptions, and action orientated conversations with a diverse range of community representatives.
Investment in building capacity and interest10 A program to achieve 450GL with neutral socio-economic impacts 1 Terms of reference 7 Opportunities for efficiency ...
2 Glossary 8 Cost of efficiency measures3 Executive summary 9 Principles for negating adv ...4 Introduction 10 A program to achieve ...5 Potential socio-economic ... 11 Appendices6 Program design

Analysis of efficiency measures in the Murray-Darling Basin: Opportunities to recover 450GL in additional environmental water through efficiency measures by 2024, with neutral or positive socio-economic impacts | Page 225 of 307
19 January 2018 | Final Report
Investment in building capacity and interest10 A program to achieve 450GL with neutral socio-economic impacts
Research and development (R&D)
R&D activities can assist industries and regions increase productivity. As part of an overall program for water recovery and resilience, R&D can also increase overall interest in the program. As an example, under SARMS, funding was set aside for industry led research. The focus of the R&D should be on measures that can increase agriculture productivity with less reliance on water.
Draw on existing program funding
There are existing funding programs that provide education and research and development projects. These funding programs can be utilised as part of delivering a whole of government resilience and regional development program that supports industries and communities undergoing structural change.
Refer to Chapter 9 on current programs that could be leveraged to provide a whole of government approach to building capacity and interest in efficiency programs.
Key incentives for further consideration and development
To ensure adequate participation levels are achieved, it is important to consider incentives that can be used to further develop interest and increase program participation. Examples of measures that could be investigated further to provide incentives to increase participation include:
► Retaining water savings after the infrastructure has initially been implemented, allowing for a soft transition of the entitlement as irrigators adjust to the infrastructure with their original water entitlement (a lease back arrangement is currently offered under COFFIE)
► Temporary adjustments to state policy settings to facilitate structural adjustment
► In dry periods, environmental water entitlements may be released back to market to increase supply and alleviate price pressure.
Further consideration of these is needed within implementation to ensure that perverse incentives are not being created and that desired outcomes (e.g. environmental) are being met. For example retaining water savings entails a number of different potential options. Water savings could be retained for a relatively small amount of time or alternatively for up to six years. Keys issues for consideration include:
► The risk of sunk investment if irrigators undertake works associated with utilising water savings
► The impact to businesses if using water savings becomes normal practice, particularly if water savings are utlised across a long time period
► The practical implementation of enabling water savings to be retained and legal ramifications (e.g. ownership of entitlement considerations).
ConclusionsMeasures to build capacity and interest include:
► Knowledge sharing between irrigators and education for farm management and planning.
► Whole of government resilience and regional development program that supports regions and industries undergoing structural change.
► Research and development activities that improves on-farm productivity and reduces reliance on water.
Funding from existing programs can be leveraged to deliver measures that builds capacity and interest.
1 Terms of reference 7 Opportunities for efficiency ...2 Glossary 8 Cost of efficiency measures3 Executive summary 9 Principles for negating adv ...4 Introduction 10 A program to achieve ...5 Potential socio-economic ... 11 Appendices6 Program design

Analysis of efficiency measures in the Murray-Darling Basin: Opportunities to recover 450GL in additional environmental water through efficiency measures by 2024, with neutral or positive socio-economic impacts | Page 226 of 307
19 January 2018 | Final Report
As previously discussed in Chapter 6 and 7, a range of opportunities need to be pursued to recover water to meet the 450GL target. This involves the immediate pursuit of off-farm and urban opportunities with zero adverse socio-economic impacts and other immediate on-farm opportunities or programs with limited (or addressable) adverse socio-economic impacts.
Existing opportunities
Existing off-farm and urban opportunities should be developed as a priority to achieve the water recovery target within the set timeframe, in particular as 62GL needs to be achieved by 2019. Unsolicited proposals received by DAWR should also be pursued as a priority. The next steps in developing existing opportunities are discussed at page 237.
Larger opportunities program
Larger opportunities involve a more targeted market engagement and differential pricing approach (refer to Chapter 8) to maximise value for money and the ability to achieve 450GL by 2024. Next steps in implementing larger opportunities are discussed at page 239.
It is noted that stakeholders commented that targeting of large farm operations to achieve water savings could result in unintended market distortion. As discussed in Chapter 5 of this report on impact pathways, there are a number of considerations to take into account for each individual circumstance to determine the extent this may or may not occur. The report recommends the establishment of a large opportunities program, both to better source these
opportunities, and to better manage them (including the use of individual business cases to determine and create measures to avoid negative impacts).
Whilst larger opportunities may require a different approach, it would be undertaken as part of the broader water efficiency program, subject to input from industry and monitoring and evaluation.
Sub-program 1: urban
Under this sub-program, work is needed with councils to develop opportunities where local government area population is greater than say 50,000 people, to take advantage of economies of scale. Support from State Government agencies may be required to develop and implement these projects.
Further, technical expertise may be required to work with the larger councils to determine the urban opportunities. During consultations, most local councils did not put forward specific opportunities.
Sub-program 2: large on-farm
Opportunities for larger farming operations for:
► Modernisation of water infrastructure
► Productivity improvement or business transformations, for example by changing to a different crop type or changing to a different farming model that requires investment in infrastructure.
Productivity improvement projects may be untested and require time to develop business cases and different types of expertise in delivery partners to develop and assess.
Projects in unregulated systems should also be pursued as a priority as anecdotally there has been limited participation in these areas, and typically irrigation methods are less modern in such areas.
Delivery partners are important in working with industry and irrigators to identify projects and develop business cases as discussed in Chapter 6.
Sub-program 3: off-farm projects
Off-farm projects can be split into the following:
► Stream 1: smaller IIOs
► Stream 2: medium to large IIOs.
Smaller IIOs lack the resources of larger IIOs and will require greater technical support to identify opportunities and develop business cases. Medium to large IIOs have indicated as part of consultations a potential pipeline of projects that could be implemented. These identified projects can be developed in the first instance, subject to the consideration of costs.
Stakeholders consulted have also indicated that the easy to obtain and more cost effective options have been implemented. Different technical solutions or expertise may need to be engaged to identify further efficiencies.
It is also recommended that there is flexibility for projects to combine on and off-farm measures, including rationalisation of the network and non-infrastructure options such as improved water delivery regimes.
A water efficiency program that improves productivity and develops existing and larger opportunities as a priority
10 A program to achieve 450GL with neutral socio-economic impacts 1 Terms of reference 7 Opportunities for efficiency ...2 Glossary 8 Cost of efficiency measures3 Executive summary 9 Principles for negating adv ...4 Introduction 10 A program to achieve ...5 Potential socio-economic ... 11 Appendices6 Program design

Analysis of efficiency measures in the Murray-Darling Basin: Opportunities to recover 450GL in additional environmental water through efficiency measures by 2024, with neutral or positive socio-economic impacts | Page 227 of 307
19 January 2018 | Final Report
Other on-farm opportunities
Flexibility in the types of projects described for larger on-farm opportunities would also apply to other smaller on-farm opportunities (refer to Chapter 6 for examples of different types of on-farm opportunities).
For smaller on-farm opportunities, delivery partners are also important in working with industry and irrigators to identify projects and develop business cases.
Design elements under COFFIE could be used as a basis for implementing on-farm water efficiency programs.
Regional delivery plans that are developed by or with the input of irrigators, industry bodies and communities that takes into account characteristics of the region are recommended as part of the roll-out of on-farm efficiency programs. This is further discussed onpage 240.
Education as part of an on-farm efficiency program
Through consultations, stakeholders have raised the importance of education as part of any on-farm efficiency program. This could entail the following:
► Assessment of on-farm practices and options for productivity improvements
► Post project training to ensure farmers get the most out of their infrastructure upgrades.
In some previous on-farm infrastructure programs, delivery partners have undertaken pre and post project training. This could continue to be a model for future programs.
A water efficiency program that improves productivity and develops existing and larger opportunities as a priority
10 A program to achieve 450GL with neutral socio-economic impacts
Conclusionsimmediate pursuit of off-farm and urban opportunities with zero adverse socio-economic impacts and other immediate on-farm opportunities or programs with limited (or addressable) adverse socio-economic impacts.
Larger opportunities involves a more targeted market engagement and differential pricing approach to maximise value for money and the ability to achieve 450GL by 2024.
1 Terms of reference 7 Opportunities for efficiency ...2 Glossary 8 Cost of efficiency measures3 Executive summary 9 Principles for negating adv ...4 Introduction 10 A program to achieve ...5 Potential socio-economic ... 11 Appendices6 Program design

Analysis of efficiency measures in the Murray-Darling Basin: Opportunities to recover 450GL in additional environmental water through efficiency measures by 2024, with neutral or positive socio-economic impacts | Page 228 of 307
19 January 2018 | Final Report
Important to building support for a water efficiency program is to ensure that industry and communities are invited to provide input into the program and that their input is part of the decision making process.
A point of difference with previous water infrastructure programs is the recommendation of a regional based approach to implementation in partnership with industry and communities. This approach provides a structured process for industry and community to provide input into the decision making process and to drive how the program is implemented in their region.
Principles for a regional based approach in partnership with industries
Key principles for a regional based approach in partnership with industries include:
► Ensure those who engage with regions have appropriate links to decision making processes. This means that decisions made on program implementation can be influenced by communities and industries.
► A clear and transparent process for decision making, including setting clear expectations on which aspects of program implementation can be influenced by industries and communities, and feedback on reasons for decisions.
► Ensure the process is not captured by local powerful interests by providing for opportunities to engage with different groups within the community.
Taskforce to lead regional delivery plans
A taskforce should be established for each region in the Basin that is responsible for the development of regional delivery plans and providing input into a community engagement strategy. The members of the taskforce need to be selected based on qualification and expertise and include representatives from the community and industries. Members of the taskforce should include those with commercial expertise and acumen. The task force would also include a member from DAWR.
Regional delivery plans
Regional delivery plans should outline how on-farm water efficiency program is rolled out by answering questions such as:
► What kind of stakeholder engagement is needed to get interest in the program?
► Who are the existing irrigators that would be interested in further on-farm efficiency?
► What are the industries / commodities in the region and what is the scope for each industry to participate in on-farm efficiency programs?
► How can knowledge and experience of on-farm efficiencies be shared more broadly?
► What kind of data can be collected on the impact of on-farm efficiency programs?
► What kind of assistance is needed by irrigators to identify and implement productivity improvements
on-farm?
► What are the characteristics of the region in terms of resilience indicators and what measures to improve regional productivity are needed?
► What are existing program funding that can assist with regional development?
► How to attract the necessary skills / support services to the region?
All regions have the opportunity to take ownership of regional delivery plans. Funding can be initially allocated by industry and region to ensure equal access and that individual regions and industries are not advantaged over others. The initial allocation can be revised through an adaptive approach based on information collected through the monitoring and evaluation framework discussed in this chapter.
Page 240 outlines the next steps in implementing on-farm efficiency programs through regional delivery plans and the establishment of a taskforce.
A regional based approach to program design in partnership with industry10 A program to achieve 450GL with neutral socio-economic impacts
ConclusionsRegional taskforces can be established to allow structured engagement and lead the development and implementation of regional and industry plans. It is important that the leadership of regional taskforces include individuals with commercial expertise and acumen. Funding is initially allocated by industry and region, subject to data collected from a monitoring and evaluation framework.
1 Terms of reference 7 Opportunities for efficiency ...2 Glossary 8 Cost of efficiency measures3 Executive summary 9 Principles for negating adv ...4 Introduction 10 A program to achieve ...5 Potential socio-economic ... 11 Appendices6 Program design

Analysis of efficiency measures in the Murray-Darling Basin: Opportunities to recover 450GL in additional environmental water through efficiency measures by 2024, with neutral or positive socio-economic impacts | Page 229 of 307
19 January 2018 | Final Report
A comprehensive monitoring and evaluation framework for the program should allow the program administrator to take an agile approach to program design. It would involve the collection of:
► Relevant data pre and post implementation of projects
► Feedback from program participants on program design.
And assessment of:
► Impacts of the program on the farm, the irrigation network and the community
► Performance of the program through feedback on key performance indicators.
Based on this analysis of data and feedback collected, adjustments can be made to program design .
Data collection
Data should be collected on the:
► Profile of the participant (i.e. operations and business) before and after project implementation. For example, data on the area irrigated, type of crop, water use, labour used, water entitlements held, location, water savings.
► Profile of the irrigation network before and after project implementation. For example, data on asset value, number of irrigators, areas irrigated, price structure, crops irrigated and water used by industry.
► Profile of community (e.g. indicators of resilience)
► Feedback on program design. For example, transparency of the funding multiple, and capability of the delivery partners.
Data analysis
Analysis of the impact of efficiency measures should be undertaken after the project has been implemented.
Furthermore, an assessment of the performance of the program should be undertaken annually including:
► The program participation by location
► Cost of projects proposed and implemented.
Program adjustment
Depending on the results of the data analysis, adjustments should be made to program design. For example, the funding multiple for on-farm projects could be assessed and adjusted if it is determined that it is not attracting to irrigators.
Data Limitations
The analysis for this report, including the quantification of socio-economic impacts, was limited by what data was available. For instance, determining the number of irrigated enterprises in the Murray-Darling Basin is difficult due to scoping limitations of ABS and ABARES surveys. The survey questions were insufficient in providing evidence for the particular socio-economic issues raised by stakeholders. In particular, the water demanded on the temporary and permanent markets, and the labour required in irrigation. While independent data collection (e.g. UC Wellbeing Survey) can help fill the gaps, further information regarding the effect of
efficiency measures programs on the participating irrigators and networks is still required. In particular, program evaluation data is currently limited by contractual privacy restrictions, so participants cannot be contacted to participate in surveys. To establish effective program monitoring and evaluation, these clauses should be examined to allow for further data collection, while still allowing for participant privacy.
There should be a wider, collaborative effort to attain the data to determine how effective, or what impacts programs have had - including information on non-participants. This can be used to establish a baseline to inform future program design.
A monitoring and evaluation framework10 A program to achieve 450GL with neutral socio-economic impacts
ConclusionsExisting data limitations have limited extensive quantitative analysis of socio-economic impacts. These limitations need to be overcome for appropriate monitoring and evaluation moving forward.A monitoring and evaluation framework needs to be in place before any further up-water is recovered and for the duration of the program thereafter. The framework needs to provide a governance structure for:► Collection of data from projects and feedback
from program participants► Assessment of the impacts of the program at
different scales and of the program performance through feedback and other key performance indicators
► Adjustments to program design based on analysis of data and feedback collected.
1 Terms of reference 7 Opportunities for efficiency ...2 Glossary 8 Cost of efficiency measures3 Executive summary 9 Principles for negating adv ...4 Introduction 10 A program to achieve ...5 Potential socio-economic ... 11 Appendices6 Program design

Analysis of efficiency measures in the Murray-Darling Basin: Opportunities to recover 450GL in additional environmental water through efficiency measures by 2024, with neutral or positive socio-economic impacts | Page 230 of 307
19 January 2018 | Final Report
10 A program to achieve 450GL with neutral socio-economic impactsA monitoring and evaluation framework
An appropriate monitoring and evaluation framework allows for an assessment of impacts and the effectiveness of a water efficiency program. Ongoing feedback will also allow adjustments to improve program design. The MDBA has responsibilities in undertaking monitoring and evaluating the impacts from the Basin Plan. Therefore a monitoring and evaluation framework should be built in conjunction with the MDBA for this program.
Data collection
Data should be collected in relation toparticipants, the irrigation networks and communities before, during and after program implementation.
Data analysis
Analysis of the impact of efficiency measures should be undertaken during and after the projects have been implemented.
An assessment of the performance of the program annually through a range of performance indicators that cover efficiency and effectiveness.
Program adjustment
Depending on the results of the data analysis (looking at program design, delivery and impacts), adjustments are made to the program.
1 Terms of reference 7 Opportunities for efficiency ...2 Glossary 8 Cost of efficiency measures3 Executive summary 9 Principles for negating adv ...4 Introduction 10 A program to achieve ...5 Potential socio-economic ... 11 Appendices6 Program design

Analysis of efficiency measures in the Murray-Darling Basin: Opportunities to recover 450GL in additional environmental water through efficiency measures by 2024, with neutral or positive socio-economic impacts | Page 231 of 307
19 January 2018 | Final Report
10 A program to achieve 450GL with neutral socio-economic impactsA monitoring and evaluation framework
Enhancing the evidence base and monitoring impacts
The analysis in Chapter 5 examined four key areas of potential adverse socio-economic impact with the following conclusions:
► On a 20-year NPV basis, water efficiency measures have a net productive benefit as reductions in future production are offset by increased production in the short term and the benefit of Commonwealth funding.
► Distributional impacts could be significant if certain industries or communities do not participate in water efficiency programs as they will be at a competitive disadvantage vis-à-vis those industries or communities which do, with water flowing to more productive and efficient users. However, the size and nature of this impact cannot be determined without further data.
► On-farm water efficiency measures are unlikely to significantly impact on network charges. In the short to medium term, termination fees should largely negate pricing impacts to irrigators.
► Both on and off-farm efficiency projects are associated with increasing labour productivity. However, based on the data available there is. However while there is insufficient evidence to conclusively determine the net impacts on employment, the evidence gathered to date suggests that employment impacts are likely to be limited.
As noted in Chapter 5, further data should be gathered to refine the analysis. In particular in relation to the distributional and employment analysis. While there has been a number of studies into the impacts on the Basin and in specific regions, there has been limited data collection that allows insights into specific socio-economic impacts associated with water efficiency measures water efficiency measures. In addition a greater understanding of the financial viability and impact of upgrades is needed. This will also aid in the development of a financial template to assist participants better understand the implications of participation.
Also discussed in Chapter 7, further analysis on the level of participation in previous water efficiency programs, for example participation by size of the participant and industry, and the factors that drive irrigators to participate in efficiency programs would help with designing a water efficiency program that will increase uptake.
In addition, data should be collected on program performance in relation to efficiency and effectiveness so programs can be adapted and improved over time.
A key existing limitation is that data is collected inconsistently between different programs and there is not a centralised database across all programs. Going forward, uniform data collection and better information-sharing between agencies would also help monitor adverse impacts and inform program evaluation. Comprehensive data collection will enable impact monitoring, a greater understanding of the cost and funding requirements of programs and support the adaptation of the program over time.
The analysis in this report is in relation to the impact of efficiency measures, this is in contrast to the experience of stakeholders, who are being impacted by a variety of socio-economic influences that are not specific to efficiency measures. In particular, stakeholder concern was raised over the impacts to non-participants, including: other irrigators, their employees and contractors, the networks and communities. Enhanced data will be important in engaging with these stakeholders, opening a dialogue and building trust.
Further data and information can be used to inform benefit cost analysis to determine whether projects are worth pursuing or which alternatives provide better value. Benefit cost analysis accounts for the effects on the community and economy and emphasises valuing the gains and losses in dollar terms and would measure the efficiency and calculate the gains and losses for all affected (irrigators and the community). In addition, data and information could be used to undertake lifecycle analysis, which would consider the full lifecycle costs and benefits of modernisation projects.
1 Terms of reference 7 Opportunities for efficiency ...2 Glossary 8 Cost of efficiency measures3 Executive summary 9 Principles for negating adv ...4 Introduction 10 A program to achieve ...5 Potential socio-economic ... 11 Appendices6 Program design

Analysis of efficiency measures in the Murray-Darling Basin: Opportunities to recover 450GL in additional environmental water through efficiency measures by 2024, with neutral or positive socio-economic impacts | Page 232 of 307
19 January 2018 | Final Report
10 A program to achieve 450GL with neutral socio-economic impactsA monitoring and evaluation framework
Data need Data required Timeframe Question to answer
Common data for all potential impacts
and program evaluation
Baseline and ongoing data on the profile of participant operations before project implementation, for example, area irrigated, type of crop, water use, labour used, water entitlements held, location, water savings, production per ha or ML
Pre and ongoing
What are the baseline characteristics of participants before participation? How does participation influence behaviour and business operations?
Type of infrastructure funded and cost Pre What is the cost of infrastructure?
Profiling of Basin communities to establish non participant baseline (continuation of Wellbeing survey, analysis of ABS and ABARES data etc.)
Ongoing How is the Basin changing over time?
Profile of irrigation network before project implementation, for example, asset value, number of irrigators serviced, areas irrigated, price and cost structure, crops irrigated and water used by industry.
Pre What is the baseline for network operations?
Monitoring of socio-economic impact –
impact on production
Production and/or productivity benefits of infrastructure upgrade (such as through the completion of financial template) Post
Are benefits accruing to participants? Water savings retained Post
Monitoring of socio-economic impact –
distributional impacts
Volume of water purchased/sold from the temporary allocation market
Pre and periodically post program, to take into account seasonal rainfall
Do participants increase their net water demand?Volume of water purchased/sold from the permanent entitlement market
Pre and periodically post program, to take into account seasonal rainfall
Land purchased and used for irrigation and area irrigated Pre and post project
Indicators of resilience such as: percentage of community employed in agriculture, Index of Relative Socio-Economic Advantage and Disadvantage, and population aged under 45.
Ongoing How will a specific community be impacted?
The below table therefore outlines suggested areas of information and data that should be collected and analysed as the program is implemented. It is noted that by definition, program data is only collected on participants, however a key element of socio-economic impact analysis is to enable the monitoring of adverse impacts accruing to non-participants. As such, the collected data intends to cover areas where participants could affect non-participants. Additionally, participants by nature could be self-selected. That is, if participants would have made the same decisions without Commonwealth funding, the resulting behavioural changes do not represent an adverse distributional impact, but potentially, an acceleration of existing structural change. Taking these issues into account, data requests are outlined in the table below and across the page.
1 Terms of reference 7 Opportunities for efficiency ...2 Glossary 8 Cost of efficiency measures3 Executive summary 9 Principles for negating adv ...4 Introduction 10 A program to achieve ...5 Potential socio-economic ... 11 Appendices6 Program design

Analysis of efficiency measures in the Murray-Darling Basin: Opportunities to recover 450GL in additional environmental water through efficiency measures by 2024, with neutral or positive socio-economic impacts | Page 233 of 307
19 January 2018 | Final Report
10 A program to achieve 450GL with neutral socio-economic impactsA monitoring and evaluation framework
Data need Data required Timeframe Question to answer
Monitoring of socio-economic impact –impact on network
charges
Volume of water delivery rights held on the irrigation network Pre and post program What is the network impact from participants?
Irrigation network of participant (if applicable) Pre How many irrigators are participating from a given network?
Profile of irrigation network after project implementation, for example, asset value, number of irrigators, areas irrigated, price and cost structure, crops irrigated and water used by industry.
Post program What is the impact on networks of off-farm projects?
Monitoring of socio-economic impact –impact on labour productivity and
employment
Type and amount of labour required, from participating irrigators and the network Pre and post program What is the on and off-farm farm employment
impact from participants?
Commodities grown Pre (including historically) and periodically post program
Does participation affect commodities produced and does this impact labour requirements?
Change in operation of business and related change in employment Post program How does participation affect businesses and
does this impact labour requirements?
Monitoring and evaluation of
program performance
Feedback on program design, for example, transparency of the funding multiple, capability of the delivery partners. During and post program What elements of program design are working
well and where can improvements be made?
Cost of infrastructure compared with the prevailing water market price During and post program How appropriate is the defined multiple?
Satisfaction with participation, including administrative burden, timeliness, support providedWater recovered for the environmentOther data related to demonstrating performance against specific to KPIs (see next page for further information)
During and post program Are KPIs being met?
1 Terms of reference 7 Opportunities for efficiency ...2 Glossary 8 Cost of efficiency measures3 Executive summary 9 Principles for negating adv ...4 Introduction 10 A program to achieve ...5 Potential socio-economic ... 11 Appendices6 Program design

Analysis of efficiency measures in the Murray-Darling Basin: Opportunities to recover 450GL in additional environmental water through efficiency measures by 2024, with neutral or positive socio-economic impacts | Page 234 of 307
19 January 2018 | Final Report
10 A program to achieve 450GL with neutral socio-economic impactsA monitoring and evaluation framework
Developing clear KPIs
In order to evaluate program performance, clear objectives must be developed. KPIs should be created to align with these objectives, which aids in the monitoring and evaluation process. This section presents a possible framework for determining program objectives and outlines some indicative KPIs. These should be refined once objectives are developed.
Potential framework: EY’s Total Value Framework
EY’s Total Value Framework provides assistance to identify, measure and report how value is created beyond traditional financial measures, in order to include broader social and environmental value and to measure the change in value created over time. There are five guiding questions to answer:
1. How does the program add value?
2. What type(s) of value is created?
3. Which stakeholders capture the created value?
4. What aspects of the program are utilised to create value?
5. What is the longer-term value that is created?
These are presented in the diagram below and are explored through three dimensions:
► The 6 Capitals from Integrated Reporting: financial, manufactured, intellectual, human, social and relationship, and natural.
► Stakeholders: including irrigators, networks, government agencies and wider communities.
► Time: short, medium and long term measurement.
1. Identify & baseline value creation
2. Measure change in value creation
3. Model the change
4. Report the baseline & change in value
Key tasks1. Stakeholders &
capital inputs2. Business processes
used to create value 3. Type of value
created 4. Value created for
each stakeholder group
5. Baseline value
Key tasks1. Measure what you
can 2. Highlight areas that
are unknown, based on assumptions, estimates
Considerations1. Time2. Attribution3. Forward projection
Key tasks 1. Modelling
5. Assurance
Key tasks 1. Integrated report
Key tasks1. Internal assurance to
improve the method and data
2. External assurance on published results
EY’s Total Value Framework
1 Terms of reference 7 Opportunities for efficiency ...2 Glossary 8 Cost of efficiency measures3 Executive summary 9 Principles for negating adv ...4 Introduction 10 A program to achieve ...5 Potential socio-economic ... 11 Appendices6 Program design

Analysis of efficiency measures in the Murray-Darling Basin: Opportunities to recover 450GL in additional environmental water through efficiency measures by 2024, with neutral or positive socio-economic impacts | Page 235 of 307
19 January 2018 | Final Report
10 A program to achieve 450GL with neutral socio-economic impactsA monitoring and evaluation framework
Aspect ► Indicative KPIs
Programperformance
► Number of participating irrigators that participated in programs by communities and catchments.
► Number of irrigators that participated in education and training programs.
► Volume of water recovered by communities and catchments.
► Participant satisfaction with process (for instance support and administrative burden).
► Recording approval and implementation times.
► Dollar cost per ML of recovered water.
Program impact
► Infrastructure cost.
► Area irrigated.
► Water use per hectare.
► Water delivery loss.
► Number of people employed or contracted on-farm.
► Number of people employed or contracted off-farm.
Impact monitoring
► How is the Basin changing over time?
► Volume of irrigated agricultural production over time.
► Volume of water allocation/entitlements purchased/sold by industry over time.
Some indicative KPIs are presented in the table below. They reflect the following design principles:
► Related to the objectives of the program, for instance, water recovered for the environment, increase in productivity, irrigators making better decisions through access to training and education.
► Separate program performance and program impacts indicators
► Use data that would be readily gathered from program participants/ publicly available sources.
1 Terms of reference 7 Opportunities for efficiency ...2 Glossary 8 Cost of efficiency measures3 Executive summary 9 Principles for negating adv ...4 Introduction 10 A program to achieve ...5 Potential socio-economic ... 11 Appendices6 Program design
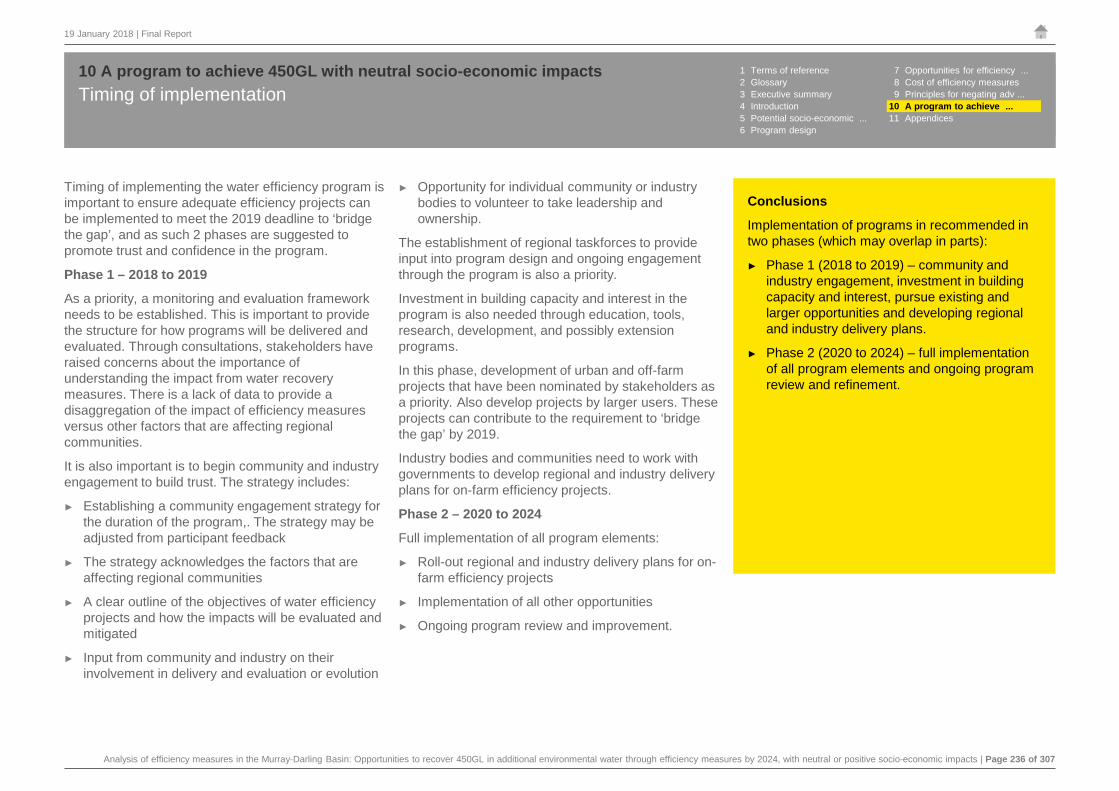
Analysis of efficiency measures in the Murray-Darling Basin: Opportunities to recover 450GL in additional environmental water through efficiency measures by 2024, with neutral or positive socio-economic impacts | Page 236 of 307
19 January 2018 | Final Report
Timing of implementing the water efficiency program is important to ensure adequate efficiency projects can be implemented to meet the 2019 deadline to ‘bridge the gap’, and as such 2 phases are suggested to promote trust and confidence in the program.
Phase 1 – 2018 to 2019
As a priority, a monitoring and evaluation framework needs to be established. This is important to provide the structure for how programs will be delivered and evaluated. Through consultations, stakeholders have raised concerns about the importance of understanding the impact from water recovery measures. There is a lack of data to provide a disaggregation of the impact of efficiency measures versus other factors that are affecting regional communities.
It is also important is to begin community and industry engagement to build trust. The strategy includes:
► Establishing a community engagement strategy for the duration of the program,. The strategy may be adjusted from participant feedback
► The strategy acknowledges the factors that are affecting regional communities
► A clear outline of the objectives of water efficiency projects and how the impacts will be evaluated and mitigated
► Input from community and industry on their involvement in delivery and evaluation or evolution
► Opportunity for individual community or industry bodies to volunteer to take leadership and ownership.
The establishment of regional taskforces to provide input into program design and ongoing engagement through the program is also a priority.
Investment in building capacity and interest in the program is also needed through education, tools, research, development, and possibly extension programs.
In this phase, development of urban and off-farm projects that have been nominated by stakeholders as a priority. Also develop projects by larger users. These projects can contribute to the requirement to ‘bridge the gap’ by 2019.
Industry bodies and communities need to work with governments to develop regional and industry delivery plans for on-farm efficiency projects.
Phase 2 – 2020 to 2024
Full implementation of all program elements:
► Roll-out regional and industry delivery plans for on-farm efficiency projects
► Implementation of all other opportunities
► Ongoing program review and improvement.
Timing of implementation10 A program to achieve 450GL with neutral socio-economic impacts
Conclusions
Implementation of programs in recommended in two phases (which may overlap in parts):
► Phase 1 (2018 to 2019) – community and industry engagement, investment in building capacity and interest, pursue existing and larger opportunities and developing regional and industry delivery plans.
► Phase 2 (2020 to 2024) – full implementation of all program elements and ongoing program review and refinement.
1 Terms of reference 7 Opportunities for efficiency ...2 Glossary 8 Cost of efficiency measures3 Executive summary 9 Principles for negating adv ...4 Introduction 10 A program to achieve ...5 Potential socio-economic ... 11 Appendices6 Program design

Analysis of efficiency measures in the Murray-Darling Basin: Opportunities to recover 450GL in additional environmental water through efficiency measures by 2024, with neutral or positive socio-economic impacts | Page 237 of 307
19 January 2018 | Final Report
Next steps in program implementation
Pursuing existing opportunities
Off-farm opportunities that have been put forward by stakeholders during consultations and urban opportunities should be developed as a priority, these are discussed in Chapter 7. The table below outlines next steps in pursuing these opportunities. Further, DAWR has received unsolicited proposals of up to
66GL across the Basin, these should also be pursued as a priority in order to achieve 62GL prior to 2019.
The development of urban opportunities require strong commitment and cooperation across governments. Particularly important is an open-book approach to obtaining relevant information in order to undertake the relevant analysis. Some financial support may also be needed to develop these proposals.
The two stage business case development process discussed in this chapter for larger opportunities could also apply for pursuing existing opportunities.
Program implementation – pursue existing opportunities to achieve 62GL by 2019 and options for the roll out of COFFIE
10 A program to achieve 450GL with neutral socio-economic impacts
Program design elements from COFFIE that could be implemented for on-farm water efficiency programs
As discussed in Chapter 6, COFFIE has been run as a pilot program in SA to recover water to meet the 450GL target. The program design of COFFIE has taken into account feedback from stakeholders and lessons from previous on-farm efficiency programs. COFFIE provides an example of program design elements, provided as a package, that is able to elicit interest from irrigators at a funding multiple of 1.75.
Specific design elements of COFFIE that could be included in an on-farm water efficiency program are discussed in Chapter 6, for example:
► Use of delivery partners and consultancy panels to assist in identifying suitable projects and developing proposals
► The ability to lease back the water entitlements for a limited period of time
► No irrigator contribution required
► Small projects are eligible, minimum volume of water transferred is 2ML
► Flexibility in the types of projects that could be eligible.
Next steps in pursuing existing opportunities
Project Next steps
Adelaide Desalination Plant ► Review cost benefit analysis► Verify cost of producing 50GL► Develop options ► Develop initial business case
Icon Water ► Review existing analysis on proposed projects► Review forecast population growth for Canberra region and
water requirement► Develop options for infrastructure projects that can support
sustained growth of the Canberra region and transfer 29GL to the Commonwealth.
► Note relevant water resource plan need to be amended prior to implementation of projects
► Choose delivery partner► Consult with stakeholders► Develop initial business cases, which could include
establishing a fund to support future infrastructure projects.
LMW off-farm and private diverters ► Consult with the IIO ► IIO choose delivery partner/ technical expert ► Consult with stakeholders► Develop options for infrastructure solutions► Develop initial business cases
MI off-farm
MIL off-farm
WMI metering
1 Terms of reference 7 Opportunities for efficiency ...2 Glossary 8 Cost of efficiency measures3 Executive summary 9 Principles for negating adv ...4 Introduction 10 A program to achieve ...5 Potential socio-economic ... 11 Appendices6 Program design

Analysis of efficiency measures in the Murray-Darling Basin: Opportunities to recover 450GL in additional environmental water through efficiency measures by 2024, with neutral or positive socio-economic impacts | Page 238 of 307
19 January 2018 | Final Report
Options for implementing COFFIE for on-farm water recovery
Stakeholders have raised the question of how COFFIE can be implemented as the next stage of rolling out on-farm water efficiency programs. The following table outlines some options for further rolling out COFFIE. The base case, as outlined in this chapter, requires investing in time and resources in building capacity and interest and obtaining buy-in from industries and communities. Options 1 to option 3 then increases in the scale of COFFIE implementation, ranging from running an early expression of interest to a program where the volume to be recovered is capped. The trade-off from option 1 to option 3, as the scale of COFFIE implementation increases, is that while the larger scale COFFIE implementation maximises the ability to achieve 62GL by 2019, there is the risk that communities and industries do not support the program.
EY’s recommendation as outlined in this chapter is the base case, undertake capacity building and develop regional delivery plans in partnership with industries prior to further on-farm programs. Based on stakeholder consultations, time and resources invested to obtain community and industry buy-in is important for the success of the program.
Program implementation – options for the roll out of COFFIE10 A program to achieve 450GL with neutral socio-economic impacts
Options for implementing COFFIE
Options
Risk that buy-in and trust from industries and communities can be achieved
Risk that 62GL can be achieved by 2019
Comment
Base case: Invest in building capacity and interest
► Maximises ability to design program based on community and industry engagement
1. Run an early expression of interest
► Allows price discovery
► Low risk approach that builds on option 1
2. Run smaller COFFIE pilots in selected catchments
► Opportunity for CMAs or other local groups to take the lead
3. Run COFFIE where the volume to be recovered under the program is capped
► Maximises ability to achieve 62GL by 2019
► Messaging would need to be carefully managed as this approach has the potential to derail the capacity building and community and industry leadership buy-in approach
1 Terms of reference 7 Opportunities for efficiency ...2 Glossary 8 Cost of efficiency measures3 Executive summary 9 Principles for negating adv ...4 Introduction 10 A program to achieve ...5 Potential socio-economic ... 11 Appendices6 Program design

Analysis of efficiency measures in the Murray-Darling Basin: Opportunities to recover 450GL in additional environmental water through efficiency measures by 2024, with neutral or positive socio-economic impacts | Page 239 of 307
19 January 2018 | Final Report
Large opportunities program
Urban
The next key steps to develop urban opportunities with councils are to:
► Refine analysis to identify larger councils
► Consult with larger councils and choose delivery partner to work with councils to understand current water and wastewater systems
► Engage with a delivery partner to develop business cases on potential opportunities.
Off-farm and on-farm
The diagram below outlines the steps that could be taken to develop larger projects. The first step is to
collect data and engage stakeholders to understand the opportunities. This is followed by a two stage process in developing a business case.
Auction / competitive bid process for larger projects
As discussed in Chapter 6, a two stage competitive bid process can be used whereby irrigators are asked to put in expressions of interest with high level details of the project including estimated cost and volume of water. Projects are assessed based on a transparent criteria such as value for money, meeting government standards and improving water productivity. Projects that meet the criteria are selected to develop more detailed business cases and submit a revised bid based on comments provided on the first round.
Program implementation – setting up a large opportunities program10 A program to achieve 450GL with neutral socio-economic impacts
Analysis on sourcing large projects
For example, through:► data analysis,► stakeholder
engagement,► establishment of
consulting network, or► an auction /
competitive bid process.
Identify and
build a business
case
I
IIGateway:
To identify:► Is it value for money?► What are the impacts?
► Can impacted be addressed, mitigated or avoided?
► Does it have or can programs obtain Commonwealth support?
IIIBuild a detailed business case
Engagement with the Commonwealth
IV
Delivery
1 Terms of reference 7 Opportunities for efficiency ...2 Glossary 8 Cost of efficiency measures3 Executive summary 9 Principles for negating adv ...4 Introduction 10 A program to achieve ...5 Potential socio-economic ... 11 Appendices6 Program design

Analysis of efficiency measures in the Murray-Darling Basin: Opportunities to recover 450GL in additional environmental water through efficiency measures by 2024, with neutral or positive socio-economic impacts | Page 240 of 307
19 January 2018 | Final Report
Pursue smaller on-farm opportunities
The next key steps to pursuing smaller on-farm opportunities are:
► Informed by the community and industry engagement strategy and consultations, set up a taskforce for each catchment in the MDB to develop region delivery plans. The members of the taskforce need to be selected based on qualification and expertise and include representatives from the community and industries. The task force would also include a member from DAWR.
► Chose a delivery partner/consultant to work with the taskforce in developing regional delivery plans.
► In developing the regional delivery plans, the taskforce needs to take into account:
► Characteristics of the region, including land use mapping studies
► Stakeholders’ views
► Education and training that would be provided as part of the program
► Strategies to share knowledge from irrigators.
The taskforce also need to develop a charter or an agreement on how it will operate, for example its objectives, functional and governance structure, and reporting requirements.
Program implementation – setting up an on-farm program10 A program to achieve 450GL with neutral socio-economic impacts
Governance for regional delivery plans
DAWR
Regional taskforce► Rep from DAWR► Rep from industry► Reps from community
Delivery partner
1 Terms of reference 7 Opportunities for efficiency ...2 Glossary 8 Cost of efficiency measures3 Executive summary 9 Principles for negating adv ...4 Introduction 10 A program to achieve ...5 Potential socio-economic ... 11 Appendices6 Program design

Analysis of efficiency measures in the Murray-Darling Basin: Opportunities to recover 450GL in additional environmental water through efficiency measures by 2024, with neutral or positive socio-economic impacts | Page 241 of 307
19 January 2018 | Final Report
The governance structure for the program needs to be clearly defined and a single agency tasked with program delivery.
Program steering committee established
A program steering committee should be established to set the direction of program and oversee project implementation. The members of the committee should be drawn from the Basin Officials Committee and could also include external experts. The use of external experts could inject project management expertise, irrigation technology knowledge and economic analysis expertise.
The program steering committee should provide regular updates to the Ministerial Council.
Single agency to deliver program
In the past, infrastructure upgrade programs have been undertaken and implemented by multiple government agencies across the Basin. As a result, data on the impact of programs has been collected differently and it is difficult to obtain information and analysis on the impacts of the full range of programs.
Having a single agency, the DAWR being accountable for the delivery of the program would allow a coordinated approach towards monitoring and evaluation, and community engagement.
Dedicated teams
The following dedicated teams are needed:
► Monitoring and evaluation – sets the framework and responsible for ongoing assessment of impacts and program performance, and recommendations for
program design improvements.
► Community engagement – responsible for establishing community reference groups and governance structure for ongoing engagement through the program.
► Efficiency project implementation – administers the panel of delivery partners and technical experts to identify and develop projects, and deliver training and education programs.
► Mitigation project implementation – works closely with community reference groups, other identified stakeholders, as well as government departments to deliver mitigation initiatives.
Data sharing mechanism
A data sharing mechanism should be set up to share information collected with the relevant State Government agencies.
Program implementation – governance structures10 A program to achieve 450GL with neutral socio-economic impacts
ConclusionsA governance structure for the program includes the following:
► Program steering committee
► A single agency to delivery the program
► Dedicated teams for monitoring and evaluation, community engagement, and project implementation.
Mitigation projects
DAWR
Efficiency projectsMonitoring and evaluation
Community engagement
On and off-farmUrban
Program Steering Committee
Ministerial Council
External experts Basin Officials Committee
Data sharing mechanism
1 Terms of reference 7 Opportunities for efficiency ...2 Glossary 8 Cost of efficiency measures3 Executive summary 9 Principles for negating adv ...4 Introduction 10 A program to achieve ...5 Potential socio-economic ... 11 Appendices6 Program design

Analysis of efficiency measures in the Murray-Darling Basin: Opportunities to recover 450GL in additional environmental water through efficiency measures by 2024, with neutral or positive socio-economic impacts | Page 242 of 307
19 January 2018 | Final Report
Technical panel to provide advice on “best practice” projects
In addition to the governance structure outlined in the previous page, technical panels should be established to review projects and provided advice to regional taskforces in developing regional delivery plans. A technical panel could be established in each region to assess whether:
► The project provide whole of farm productivity improvement with less reliance on water
► The project is consistent with achieving overall catchment environmental outcomes
► There is the potential for stranded investment.
The technical panel should comprise of suitably qualified experts with prior experience in implementing water efficiency projects.
Program implementation – governance structures10 A program to achieve 450GL with neutral socio-economic impacts 1 Terms of reference 7 Opportunities for efficiency ...
2 Glossary 8 Cost of efficiency measures3 Executive summary 9 Principles for negating adv ...4 Introduction 10 A program to achieve ...5 Potential socio-economic ... 11 Appendices6 Program design

Analysis of efficiency measures in the Murray-Darling Basin: Opportunities to recover 450GL in additional environmental water through efficiency measures by 2024, with neutral or positive socio-economic impacts | Page 243 of 307
Appendices
11
In this section Page
Appendix A: Stakeholders consulted 244
Appendix B: Stakeholder comments 247
Appendix C: Notified efficiency measures 268
Appendix D: Frameworks and current programs for Chapter 9 270
Appendix E: Summary table of on-farm efficiency measures 276
Appendix F: Impact Mapping 277
Appendix G: Socio-economic impact pathway 1: Sensitivity testing 290
Appendix H: Impact on future production 292
Appendix I: Bibliography 294
Appendix J: Overview of existing and prior efficiency programs 302
Appendix K: Indicators to understand communities 305

Analysis of efficiency measures in the Murray-Darling Basin: Opportunities to recover 450GL in additional environmental water through efficiency measures by 2024, with neutral or positive socio-economic impacts | Page 244 of 307
19 January 2018 | Final Report
Appendix A: Stakeholders consulted11 Appendices
New South Wales
Albury
► NSW Department of Primary Industries
Sydney
► WaterNSW
► NSW Irrigators’ Council
Deniliquin
► Murray Irrigation Ltd.
► Murray River Council
► Edward River Council
► Rice Growers’ Association of Australia
► Yanco Creek & Tributaries Advisory Council
► Moira Private Irrigation District
► Murray Valley Private Diverters
► Southern Riverina Irrigators
► Berriquin Irrigators’ Council
► Wakool Landholders’ Association
► West Berriquin Irrigations Inc.
► Big Sky Ideas
Griffith
► NSW Irrigators (program participants)
► The Risorsa Group Pty. Ltd.
► Murrumbidgee Irrigation Ltd.
► NSW Farmers Association
► Murrumbidgee Food & Fibre Association.
► Murrumbidgee Private Diverters
► Coleambally Irrigation Co-operative Limited
► Griffith Business Chamber
► Coleambally Business Chamber
► Murrumbidgee Council
► Leeton Shire Council
► Griffith City Council
Coomealla
► Western Murray Irrigation
Dubbo
► Trangie-Nevertire Irrigation Scheme
► Western Land Planning
Other
► Sunraysia Citrus Growers
► Albury City Council
Adelaide
► Department of Environment, Water and Natural Resources (DEWNR)
► Department of Primary Industry & Regions South Australia (PIRSA)
► SA Water
Murray Bridge
► Coorong District Council
► SA Murray-Darling Basin Natural Resource Management Board
► SA irrigators (program participants)
► Mid-Murray Council
Barmera
► Renmark Irrigation Trust
► South Australian Murray Irrigators
► Regional Development Australia (SA)
► Renmark Paringa Council
► Central Irrigation Trust
► District Council of Loxton Waikerie
► SA irrigator (program participants)
Other
► The Murraylands and Riverland Local Government Association
South Australia
1 Terms of reference 7 Opportunities for efficiency ...2 Glossary 8 Cost of efficiency measures3 Executive summary 9 Principles for negating adv ...4 Introduction 10 A program to achieve 450 ...5 Potential socio-economic ... 11 Appendices6 Program design

Analysis of efficiency measures in the Murray-Darling Basin: Opportunities to recover 450GL in additional environmental water through efficiency measures by 2024, with neutral or positive socio-economic impacts | Page 245 of 307
19 January 2018 | Final Report
Appendix A: Stakeholders consulted11 Appendices
Melbourne
► Department of Environment, Land, Water and Planning (DELWP)
► Department of Economic Development, Jobs, Transport and Roads (by phone)
► Dairy Australia
► Australian Dairy Farmers
► Australian Dairy Industry Council
► Victorian Farmers’ Federation (VFF)
Shepparton
► GMID Leadership Forum
► Goulburn Broken Catchment Management Authority
► Goulburn Murray Water
► Northern Central Catchment Management Authority
► Murray Dairy
► Goulburn Valley Water
► VIC irrigators (program participants)
► Young Dairy Farmers Australia
► Greater Shepparton City Council
► Upper Goulburn River Catchment Association
► Goulburn Valley Environment Group
► Loddon Valley Water Services Committee
► Central Goulburn Water Services Committee
► Regional Partnerships Goulburn (RDA VIC)
► Environmental Farmers’ Network
Echuca
► Murray River Group of Councils
► Campaspe Shire Council
► Moira Shire Council
Mildura
► Mildura Rural City Council
► Lower Murray Water
► Department of State Development, Business and Innovation (VIC)
► Mallee Catchment Management Authority
► Murray Valley Winegrowers
► Swan Hill Rural City Council
► Southern Cross Farms
► Dried Fruit Australia
► DELWP (Sunraysia)
► VFF (Sunraysia)
Other
► Gannawarra Shire Council
► Loddon Shire Council
► Environment Victoria
► Australian Processing Tomato Research Council
► Murray Lower Darling Rivers Indigenous Nations
► Kilter Rural
► Fonterra Milk
► Tatura Milk
► Bega Cheese
► North East Central Management Authority
Victoria
1 Terms of reference 7 Opportunities for efficiency ...2 Glossary 8 Cost of efficiency measures3 Executive summary 9 Principles for negating adv ...4 Introduction 10 A program to achieve 450 ...5 Potential socio-economic ... 11 Appendices6 Program design

Analysis of efficiency measures in the Murray-Darling Basin: Opportunities to recover 450GL in additional environmental water through efficiency measures by 2024, with neutral or positive socio-economic impacts | Page 246 of 307
19 January 2018 | Final Report
Appendix A: Stakeholders consulted11 Appendices
Brisbane
► Department of Natural Resources and Mining
► Department of Agriculture and Fisheries
► Water Engagement Forum Attendees:
► Local Government Association of Queensland
► Seqwater
► SunWater
► Australian Bankers’ Association (Suncorp)
► The Wilderness Society
► Irrigation Australia
► AgForce
► Queensland Farmers’ Federation
► World Wild Life Fund
► SEQ Catchments
► Environmental Defenders’ Office
► International Water Association
► Border Rivers Food and Fibre
Other
► Central Downs Irrigators Ltd
► Goondiwindi Regional Council
Queensland
Canberra
► Environment Planning, and Sustainable Development Directorate
► Department of Agriculture and Water Resources
► Commonwealth Environmental Water Holder
► Murray-Darling Basin Authority
Other
► Department of Infrastructure and Regional Development
Australian Capital Territory
► River Lakes and Coorong Action Group
► Australian Floodplain Association
► Inland Rivers Network
► Wentworth Group of Concerned Scientists
► Landcare Australia
► Northern Basin Aboriginal Nations
► National Irrigators’ Council
► National Farmers’ Federation
► Murray-Darling Association
► First Nations People
► Waterfind Australia
Other Peak Groups
1 Terms of reference 7 Opportunities for efficiency ...2 Glossary 8 Cost of efficiency measures3 Executive summary 9 Principles for negating adv ...4 Introduction 10 A program to achieve 450 ...5 Potential socio-economic ... 11 Appendices6 Program design

Analysis of efficiency measures in the Murray-Darling Basin: Opportunities to recover 450GL in additional environmental water through efficiency measures by 2024, with neutral or positive socio-economic impacts | Page 247 of 307
19 January 2018 | Final Report
State Government bodies
► The SARMS program is on track to deliver on target with its 3 streams; irrigation efficiencies, water purchase, irrigation industry assistance (which is inaccessible without the 1st or 2nd streams).
► Demand for the 3rd stream continues to exist, and the flexibility offered by the program has been shown to be highly desirable to irrigators.
► Early consultation in the SARM program enabled PIRSA to understand and work directly with industry to establish trust and an accessible program for irrigators. It was critical to its success.
► Example of business improvement projects include netting projects that increase water efficiency, productivity and quality of produce, as well as energy projects that can provide continuity of water supply, which in turn is able to provide water savings.
► Between 500 to 1500 direct and indirect jobs have been created as part of the SARMs program.
► Individual irrigators generally have a positive view of efficiency projects.
► As a public water supplier, SA Water is centrally concerned about ensuring customers have water security and potable drinking water.
► SA Water’s primary source of water is reservoirs, secondary source is the Murray and then the desalination plant (in order of priority and cost effectiveness).
► Federal funding for storm water is no longer available, and there could be opportunities in storm water schemes if funding becomes available. Although use of stormwater is likely to be additional to current use, rather than displacing potable water use.
► SA Water has looked at projects for improving water delivery efficiency (e.g., reducing evaporation and leakage), but has found it is not economically viable.
► There is limited recycled water opportunities based on the current cost structure.
Local Government Bodies
► There is concern for river management to address risk of flooding, inundation and the need to upgrade barrages.
► It is important to deliver the 450GL for the river system.
► Water is not the only factor influencing agriculture or regional areas (e.g. technology).
► There is overall positive feedback from local irrigators. They're happy with the measures they've undertaken.
► flow-on impacts to community from water recovery measures can be mitigated if councils take a proactive approach. Organisations such as Regional Development Australia can assist.
► Potential for use of grey water or recycled water in moving away from river water use.
► Water efficiency measures have been an economic driver for growth within the region; irrigators have upskilled, production increased and environmental water is available downstream for tourism.
► Energy is a concern for farmers with uncertain availability and increased cost.
► Facilitation of knowledge sharing and government support for research has seen positive responses from local communities and irrigators, as the information is made more digestible and presented by trusted individuals.
Appendix B: Stakeholder comments from South Australia11 Appendices
The consolidated key points put forward by stakeholders from consultations conducted to 25 October 2017 are summarised below (excluding consultations with BOC member jurisdictions). These key points are drawn directly from stakeholder discussions held in the relevant states, teleconferences held with stakeholders based in the relevant states (and have been sent to those stakeholders as key points drawn from the meetings) and from emails sent to EY by stakeholders.
South Australia
1 Terms of reference 7 Opportunities for efficiency ...2 Glossary 8 Cost of efficiency measures3 Executive summary 9 Principles for negating adv ...4 Introduction 10 A program to achieve 450 ...5 Potential socio-economic ... 11 Appendices6 Program design

Analysis of efficiency measures in the Murray-Darling Basin: Opportunities to recover 450GL in additional environmental water through efficiency measures by 2024, with neutral or positive socio-economic impacts | Page 248 of 307
19 January 2018 | Final Report
Local Government bodies cont.
► Reduction of red tape important to encourage participation in efficiency programs.
► Flexibility of efficiency measures (e.g., netting to improve quality of fruit and reduces evaporation) ensures wider interest and opportunity.
► Leadership and community culture is critical to regional development. Also building on existing strengths. Efficiency measures to be seen as an opportunity, not as a threat.
► Transparency key for investment (e.g. what trigger will cause the desalination plan to go into use). Knowing this information enables greater detailed planning and business capability (importantly risk planning).
► Irrigators are accustomed to having all the water they need, and have a concept of 'reserve' or ‘in case’ water (i.e. they hold an entitlement beyond requirement). Hence, they may be unwilling to part with this water as it provides security.
► Environmental water is critical for evolving the tourism industry (including fishing). Consequently it’s management is very important.
► Within the commodity market there is a risk of oversupply, as farmers change their production to suit the latest hike in commodity prices.
► There is now a larger irrigation footprint per farm due to increased capacity.
► Mitigation measures may have to accommodate circumstances that are yet to occur; impacts won’t occur until the next dry period.
► Leadership is critical. Efficiency measures to be seen as an opportunity, not as a threat.
► Leadership across all levels in government, industry and communities is important for regional development. Further, water efficiency measures can be an opportunity for regional development.
► Diversification of industries in a community is important. A healthy river system is important for communities to diversify their industries/services into tourism.
► Short project approval times for COFFIE is a major improvement compared to OFIEP. The COFFIE program also allows for better pricing transparency.
► The ability to lease back water after participating in COFFIE also received positive feedback from participants.
► Obstacle to more participation in water efficiency programs may be due to attitude of older generation of farmers, who see water as superannuation for retirement and not as a business investment opportunity.
► For delivery partners, the administration cost of small projects may not be offset by the revenue from administration fees.
► Under COFFIE, there is no time pressure for irrigators to apply. Delivery partners need to be proactive to promote opportunity.
► Energy cost is a major concern for irrigators and is causing them to look for opportunities to reduce their energy costs.
► Important for efficiency projects funded to deliver water savings.
► No problem with the concept of on and off-farm efficiency gains, but MRLGA have significant concerns over only 50% of these efficiency gains finding their way back into the River Murray. This means MRLGA is missing out on approximately 300GL of environmental water back into the river. A very poor return of investment.
► The MRLGA association would therefore request an independent audit of return flows from irrigation works back to the environment.
► MRLGA has called for an urgent COAG meeting to commission a judicial inquiry of the New South Wales Government's handling of River Murray water.
► There are major concerns over any proposal to reduce the outflows from the Northern Basin. Unlike the Southern Basin, the Northern Basin is an unregulated catchment and questions would have to be asked over any analysis that supports a reduction in water recoveries from 390GL to 320GL as proposed in a letter from the Federal Minister for Agriculture and Water Resources in letter to MRLGA dated 9 May 2017.
Appendix B: Stakeholder comments from South Australia11 Appendices 1 Terms of reference 7 Opportunities for efficiency ...
2 Glossary 8 Cost of efficiency measures3 Executive summary 9 Principles for negating adv ...4 Introduction 10 A program to achieve 450 ...5 Potential socio-economic ... 11 Appendices6 Program design

Analysis of efficiency measures in the Murray-Darling Basin: Opportunities to recover 450GL in additional environmental water through efficiency measures by 2024, with neutral or positive socio-economic impacts | Page 249 of 307
19 January 2018 | Final Report
SA Irrigators
► On-farm diversification, as facilitated by water efficiency measures, has enabled the expansion of the property, and further drought proofing.
► Obstacles to further participation in efficiency programs may be due to emotive reactions associated with water and information gaps. Extension programs may not fail to completely overcome this attitude.
► Coming out of the drought, buybacks and efficiency measures were welcome in aiding irrigators to overcome the damage done (e.g. laser land previously cracked by dry weather).
► Farming is moving to a more complex business system. Efficiency measures can assist irrigators as they develop and adapt their business operations.
► Having participated in OFFIEP, COFFIE and SARMs, the size of the business has increased, employment has increased, alongside additional profit from a favourable commodity prices.
► The delivery partner is invaluable to the success of program applications.
► Majority of professional growers have engaged in the efficiency projects. As early adopted neighbours engage they become word of mouth champions across the district.
► There remain a number of small or “hobby” farms with no significant need (at present) to change practices or engage with water efficiency measures.
► The most desirable programs increase efficiency and productivity.
► The percentage of permanent entitlement held is a personal management decision of the irrigator depending on their risk preferences.
► Water efficiency measures have enabled growth/opportunity of on-farm infrastructure. It has enabled progress to occur at a faster rate, rather than waiting for 3 years to establish finances, investment can occur in just 1 year.
► There are further opportunities for on-farm efficiency measures.
► Diversification on-farm has enabled complementary business operations, creating greater resilience on-farm and drought proofing against future dry periods.
Irrigation Infrastructure bodies
► The impact of water efficiency measures will not be seen until the next dry period. They are presently being 'masked' by other factors and impacts on the region (e.g. high commodity prices).
► The water market is now accessible by investment companies and those who don’t own land due to the decoupling of rights.
► Energy is growing as a significant input cost, as efficiency measures and infrastructure upgrades place increased pressure on energy consumption. The high energy prices affects business decisions and planning.
► Any mitigation measures should be sustainable and require creative thinking (e.g. investment in education faculties is a good example).
► Diversity of crops is needed for the sustainability of the agriculture industry in the Basin to withstand weather events and cycles in commodity prices.
► Recovery of the 450GL needs to provide tangible benefits for irrigators in terms of water security.
► Need to look at whether water recovered can actually be delivered to the Southern end of the system (i.e. need to look at system constraints and innovative solutions).
► In SA, there is a proportion of farmers that would like a buyback to be offered.
► A unified central message is needed to address issues around water recovery.
Appendix B: Stakeholder comments from South Australia11 Appendices 1 Terms of reference 7 Opportunities for efficiency ...
2 Glossary 8 Cost of efficiency measures3 Executive summary 9 Principles for negating adv ...4 Introduction 10 A program to achieve 450 ...5 Potential socio-economic ... 11 Appendices6 Program design

Analysis of efficiency measures in the Murray-Darling Basin: Opportunities to recover 450GL in additional environmental water through efficiency measures by 2024, with neutral or positive socio-economic impacts | Page 250 of 307
19 January 2018 | Final Report
Appendix B: Stakeholder comments from New South Wales11 Appendices
State government bodies
► As system operator WaterNSW faces a significantly changed and changing customer use profile (change from extractive use to environmental use and, within extractive category, significant crop selection changes) which presents delivery challenges:
► Opportunity to look at changes in storage and delivery to achieve changed profiles and timing for delivery rather than simply increased flows.
► WaterNSW informs the community and customers about system status/ flow rates etc. etc. and the environmental water customers inform the community of why they are doing what they are doing. WaterNSW considers it is fairly universally acknowledged that environmental water customers should be doing better in terms of informing the community what they are aiming to achieve from watering events and following up on whether their actions were successful in delivering the intended environmental outcome:
► Communities see a lot of water going down rivers and neither of the environmental water holders have done a good job of explaining what they want to achieve, putting targets around it and reporting back.
► There is a lack of clarity of definitions e.g. what would be a complementary measure or what wouldn't - and hence the areas of operation where WaterNSW could focus to receive funding/achieve water savings.
► A key problem is the complexity of rules with limited understanding of them. Associated is getting the community on board with changes and issues.
Local Government bodies
► The net impact of on-farm efficiency to irrigators is significant and potentially terminal.
► Communities continue to adapt to structural adjustment from previous and ongoing measures, experiencing a cumulative impact. The government could allow and facilitate adaption to consequences of the 2750GL, before additional pressure is added with more water taken from the system.
► Communities are facing ongoing concerns for mental health, stable agribusiness, ensuring a stable investment environment, withdrawing government services with centralisation, and a reduction in labour opportunities – to name a few.
► For irrigators these impacts include; the risks of trading an appreciating asset for a depreciating asset, exposure to the risk of estimated savings, accelerating the rate of change beyond what may be realistic for the irrigator, and labour savings.
► The 450GL measures could look at water outside the productive pool:
► The river is 20-30% efficient, opposed 90% efficiency of some irrigation districts. Can the improvement of environmental water delivery be counted towards the 450GL?
► OEH have arrangements with the farmer responsible for environmental watering. Is there opportunity for expansion of this program and recognition of the 450GL?
► Is there opportunity for irrigation district infrastructure to be used for the delivery of environmental water? If more water is diverted from these districts (such as MI or MIL), the billions invested in infrastructure (on and off-farm) will be wasted.
► Removal of the 450GL will decrease supply in the water market and increase prices, adding to existing cost pressures on irrigators.
► The Swiss Cheese effect (as exacerbated by on-farm efficiencies) has reduced demand on the supply system. This has developed a situation requiring increased water charges for remaining users or alternatively rationalisation.
► There is appetite for extension programs and community investment, but it needs to be conducted in conjunction with local community - consultation and partnership are key to successful investment.
► There are opportunities in the R&D space, and potential to empower existing programs as decided by the local community.
New South Wales
1 Terms of reference 7 Opportunities for efficiency ...2 Glossary 8 Cost of efficiency measures3 Executive summary 9 Principles for negating adv ...4 Introduction 10 A program to achieve 450 ...5 Potential socio-economic ... 11 Appendices6 Program design

Analysis of efficiency measures in the Murray-Darling Basin: Opportunities to recover 450GL in additional environmental water through efficiency measures by 2024, with neutral or positive socio-economic impacts | Page 251 of 307
19 January 2018 | Final Report
Appendix B: Stakeholder comments from New South Wales11 Appendices
Local Government bodies cont.
► Water recovery measures limit the growth of industry, due to reduced water (input). There is fear of stagnation.
► There is a skills deficit in labour supply currently in regional communities.
► The rise of corporates has led to the potential of FIFO communities; the economic benefit of employing that individual does not remain in the community.
► If 450GL is further recovered, water prices will be unsustainable.
► There are flow-on effects from efficiency measures beyond the individual, to the community and wider region.
► Regional development requires visionary thinking and targeted funding in pushing rural communities into the future. It is critical this comes from a regional perspective, rather than just from individual councils.
► There should be a State "Settlement Strategy" developed. i.e. inclusive of all of NSW not just the regions. Such a strategy will identify that the trend in population drift to metropolitan areas is not sustainable. It will also identify strategies which can work to more equitably spread population across the State to sustain all areas.
► There is a lack of confidence at the community level as to what will happen next (with the 450GL).
► The net benefit of environmental water is not communicated to regional communities, who would like to appreciate and understand what the water is being used for. There should be better monitoring and evaluation of environmental impacts.
► There is concern of flooding if environmental water recovered was allowed to flow through the system without flood mitigation measures.
► Previous regional development programs (such as new national parks) are not benefiting the local economy (e.g. tourism is not increasing) as initially planned.
► Reducing red-tape can encourage regional investment.
► There are under-utilised assets in regional communities.
► Efficiency measures attract construction and further industry, but there is no strategic plan for what may occur when the efficiency measures stop.
► There will be a lag in impact due to nature of farmers. They may buy water above affordable costs to maintain their asset for a period before having to stop operations.
► Water brokers are distorting the market ue to the resources and technology they can commit to understanding and monitoring the market and their superior understanding of the complex rules that impact on water trading.
► No one knew the implications of opening the water market. The government needs to better understand the impacts on the water market as a result of less water in the future.
Industry Representatives
► Concern in relation to removing productive water from the system and community impacts.
► Some opportunity to recover water strategically.
► Concern whether the socio-economic impact can be mitigated.
► Current socio-eco test at the farm is too simplistic and doesn't take into account broader factors, particularly the increased demand on the temporary water market.
► Ongoing nature of COFFIE program is seen as a positive. However, there is a concern that the easily accessible water has already been taken and that a multiplier of 1.75 won't stimulate the appetite for additional projects.
► Opportunities to look at some of the schemes to rationalise (reduce footprint) and make them more efficient.
1 Terms of reference 7 Opportunities for efficiency ...2 Glossary 8 Cost of efficiency measures3 Executive summary 9 Principles for negating adv ...4 Introduction 10 A program to achieve 450 ...5 Potential socio-economic ... 11 Appendices6 Program design

Analysis of efficiency measures in the Murray-Darling Basin: Opportunities to recover 450GL in additional environmental water through efficiency measures by 2024, with neutral or positive socio-economic impacts | Page 252 of 307
19 January 2018 | Final Report
Appendix B: Stakeholder comments from New South Wales11 Appendices
Industry Representatives cont.
► Would like potential mitigation to include how the CEWO utilises its allocation and making some of their allocation available to the market at points in time.
► CEWO has been very restricted in terms of trading its entitlements.
► Changes to the CEWOs rules may allow changes in portfolio management.
► There may be some benefit in program design exploring opportunities from an industry perspective - improving industry sustainability, innovation and competitive advantage.
► In the Western Murray irrigation network, most farmers have moved from furrow irrigation to more water efficient systems.
► On-farm efficiency measures provide some savings from labour.
► Farmers would prefer to keep surplus water for water security purposes.
► Farmers would be interested in measures that save time, labour, and are more efficient irrigation systems, as well as in regards to water monitoring.
► Additional research can be done on crop varieties that use less water.
► There is local community support for building the Wellington Weir, noting that this may be outside EY’s Terms of Reference to consider.
► Some farmers do not necessarily undertake business planning to understand if they're truly benefiting from on-farm modernisation.
► Efficiency measures have enabled more efficient/aggressive use of water in larger quantities. It has given the business the best chance for success.
► There are external concerns (beyond water) impacting irrigators, including rising energy prices, which place a constraint on operations and potential productivity.
► Further water recovery may present risks to existing investments, with major modernised systems not being fully utilised.
► There are opportunities to reduce conveyance losses.
► There may be further opportunities for the consolidation of farms (to mitigate “Swiss Cheese” effect and rationalise system), to run the network better with less variability, better coordination with water ordering time, better metering, inline storages, irrigators to help each other (and be encouraged to do so) by utilising on-farm infrastructure with irrigation networks to store water, to target 'weak' spots in relation to conveyance loss, for irrigation networks to be used to move environmental water around in a more efficient manner.
► Recognition of environmental benefits from on-farm practices.
► The communication and campaigns conveying the work of regional communities to urban areas to be improved. This includes political cohesion in recognising the work of farmers.
► There is a lack of community confidence in the management of environmental water.
► There is concern that constraints in the system will result in instances of flooding, if the environmental water recovered is to flow through the system.
► There may be opportunity to create a special economic zone, in order to facilitate strategic recovery or structural adjustment.
NSW Irrigators
► Around 10-20% of the Griffith region have participated, and there is ongoing demand in the Riverina area for on-farm efficiency measures from the individuals who have already participated.
► Due to more complex systems (new infrastructure, as well as farming techniques) and a holistic business approach, labourers and farmers are required to upskill to maximise their productive capacity. There has been a significant increase in the technical requirements (including IT skills) for farming. This has led to the outsourcing of knowledge and engagement with individuals such as agronomists and water brokers (around 95% of irrigators don't understand the water market). This addresses the new complexity, but also results in a dependence on the services provided by local communities (e.g. mechanics are required to fix the latest machinery when it breaks down).
1 Terms of reference 7 Opportunities for efficiency ...2 Glossary 8 Cost of efficiency measures3 Executive summary 9 Principles for negating adv ...4 Introduction 10 A program to achieve 450 ...5 Potential socio-economic ... 11 Appendices6 Program design

Analysis of efficiency measures in the Murray-Darling Basin: Opportunities to recover 450GL in additional environmental water through efficiency measures by 2024, with neutral or positive socio-economic impacts | Page 253 of 307
19 January 2018 | Final Report
Appendix B: Stakeholder comments from New South Wales11 Appendices
NSW Irrigators cont.
► The 450GL will decrease the supply of water on the market and result in an increased price for water.
► Water efficiency measures have enabled expansion and farm development at a faster rate than otherwise.
► The mentality of the older generation, who may be adverse to change, restricts the development of family farms.
► On-farm efficiency measures has allowed capacity for adapting to change, and the ability to change crops depending on market outlook.
► Due to efficiency measures and consequent expansion, water use has increased.
► Concern for continued viability of irrigation district if there’s further water recovery. Potential for stranded assets in the face of rising input costs.
► SunRice is the backbone of Deniliquin community. There are jobs along the entire value chain and there is community dependence on its survival.
► Individual farmers are benefiting from the measures, but the communities are suffering. In designing mitigation measures, consider whether each ML sold out of the area can have an attached amount for community funding.
► Water efficiency measures have increased productivity on-farm and inspired expansion.
► Experience with delivery partners is that some do not provide value for money in terms of knowledge and experience.
► Soil quality in the area is poor and different crops are being trialled.
► Irrigators in the Deniliquin area need direction on what might be viable crops, if rice is no longer viable.
Irrigation Infrastructure bodies
► Some regions of the Basin were proactive prior to the plan and already have
significant off-farm infrastructure that does not require further improvement.
► There remain issues with vacant land that is unused for irrigation, but remains connected to the irrigation network.
► There may be efficiency opportunities with upgrading or installing meters.
► Fundamental concern of how water to going to get through the system. Is there an opportunity for irrigation districts to run environmental water through their modernised systems?
► Concern for development outside irrigation district (private diverters), in relation to the implications to the water market and how delivery is to occur.
► There remain willing sellers, but the benefit to farmer is not carried through to the district.
► Increase demand in temporary market. Irrigators have sold water back through efficiency measures which have caused an increase in price due to the decrease in supply.
► Operations of the MIL are around 85%. The river does not have these efficiencies. Could the 450GL come from environmental water efficiencies?
► There may be opportunity for irrigation districts to remodel their footprint, in encouraging dry land or alternative measures. However, this must come from a community level.
► There are new corporates in irrigation who interact with inter-valley trading to the detriment of local farmers.
► The communication (and measure) of the benefits of environmental water is to be improved.
► Small businesses are not supported when landholders sell back their water. Money leaves the local economy, and the wider community is impacted.
► There may be minimal further opportunity with conveyance water and storage evaporation.
1 Terms of reference 7 Opportunities for efficiency ...2 Glossary 8 Cost of efficiency measures3 Executive summary 9 Principles for negating adv ...4 Introduction 10 A program to achieve 450 ...5 Potential socio-economic ... 11 Appendices6 Program design
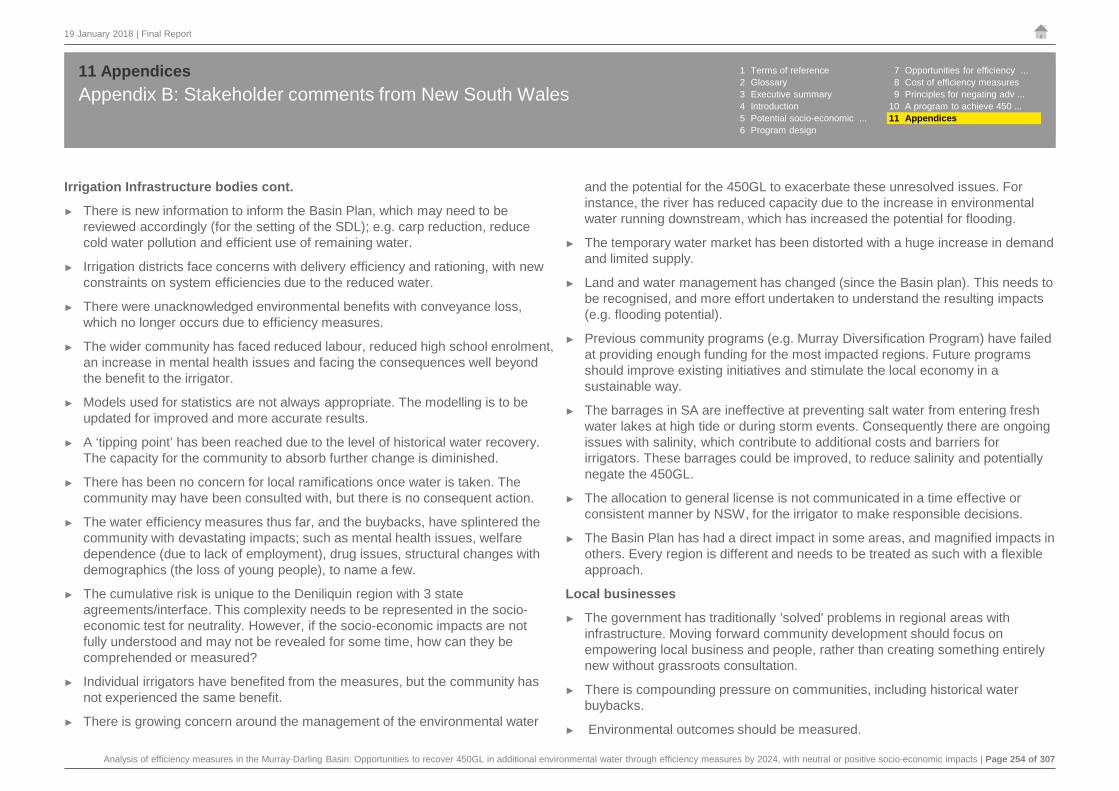
Analysis of efficiency measures in the Murray-Darling Basin: Opportunities to recover 450GL in additional environmental water through efficiency measures by 2024, with neutral or positive socio-economic impacts | Page 254 of 307
19 January 2018 | Final Report
Appendix B: Stakeholder comments from New South Wales11 Appendices
Irrigation Infrastructure bodies cont.
► There is new information to inform the Basin Plan, which may need to be reviewed accordingly (for the setting of the SDL); e.g. carp reduction, reduce cold water pollution and efficient use of remaining water.
► Irrigation districts face concerns with delivery efficiency and rationing, with new constraints on system efficiencies due to the reduced water.
► There were unacknowledged environmental benefits with conveyance loss, which no longer occurs due to efficiency measures.
► The wider community has faced reduced labour, reduced high school enrolment, an increase in mental health issues and facing the consequences well beyond the benefit to the irrigator.
► Models used for statistics are not always appropriate. The modelling is to be updated for improved and more accurate results.
► A ‘tipping point’ has been reached due to the level of historical water recovery. The capacity for the community to absorb further change is diminished.
► There has been no concern for local ramifications once water is taken. The community may have been consulted with, but there is no consequent action.
► The water efficiency measures thus far, and the buybacks, have splintered the community with devastating impacts; such as mental health issues, welfare dependence (due to lack of employment), drug issues, structural changes with demographics (the loss of young people), to name a few.
► The cumulative risk is unique to the Deniliquin region with 3 state agreements/interface. This complexity needs to be represented in the socio-economic test for neutrality. However, if the socio-economic impacts are not fully understood and may not be revealed for some time, how can they be comprehended or measured?
► Individual irrigators have benefited from the measures, but the community has not experienced the same benefit.
► There is growing concern around the management of the environmental water
and the potential for the 450GL to exacerbate these unresolved issues. For instance, the river has reduced capacity due to the increase in environmental water running downstream, which has increased the potential for flooding.
► The temporary water market has been distorted with a huge increase in demand and limited supply.
► Land and water management has changed (since the Basin plan). This needs to be recognised, and more effort undertaken to understand the resulting impacts (e.g. flooding potential).
► Previous community programs (e.g. Murray Diversification Program) have failed at providing enough funding for the most impacted regions. Future programs should improve existing initiatives and stimulate the local economy in a sustainable way.
► The barrages in SA are ineffective at preventing salt water from entering fresh water lakes at high tide or during storm events. Consequently there are ongoing issues with salinity, which contribute to additional costs and barriers for irrigators. These barrages could be improved, to reduce salinity and potentially negate the 450GL.
► The allocation to general license is not communicated in a time effective or consistent manner by NSW, for the irrigator to make responsible decisions.
► The Basin Plan has had a direct impact in some areas, and magnified impacts in others. Every region is different and needs to be treated as such with a flexible approach.
Local businesses
► The government has traditionally 'solved' problems in regional areas with infrastructure. Moving forward community development should focus on empowering local business and people, rather than creating something entirely new without grassroots consultation.
► There is compounding pressure on communities, including historical water buybacks.
► Environmental outcomes should be measured.
1 Terms of reference 7 Opportunities for efficiency ...2 Glossary 8 Cost of efficiency measures3 Executive summary 9 Principles for negating adv ...4 Introduction 10 A program to achieve 450 ...5 Potential socio-economic ... 11 Appendices6 Program design

Analysis of efficiency measures in the Murray-Darling Basin: Opportunities to recover 450GL in additional environmental water through efficiency measures by 2024, with neutral or positive socio-economic impacts | Page 255 of 307
19 January 2018 | Final Report
Appendix B: Stakeholder comments from New South Wales11 Appendices
Local businesses cont.
► Communities need to have an "adaptive mindset" to succeed, or be aided in attaining that mindset with education and involvement of community groups.
► Communities to champion change from within community, and be empowered to do so.
► To find way to reward on-farm efficiencies. For instance, recognition of carbon neutral farms.
► Can the government consider delaying measures to recover the 450GL until impacts are understood and communities have a chance to adapt?
► New programs should have flexible arrangements to allow for more unique opportunities (such as business transformation projects), take account of the time period to ensure quality of work, and to prioritise proposals (in identifying areas which should be rationalised rather than modernised).
► In the long-term transition occurring across agriculture, there will be winners and losers. Targeted investment is needed for structural change.
► There are external impacts on irrigators, including energy costs and a shortage in skilled labour.
► When upgrading irrigation technologies, irrigators are not budgeting for the depreciation of their assets and the next required renewal.
► High security water underpins the local economy. In dry periods, high security water users are able to continue farming. There is a need for high security water, as production can continue across all weather variability (inherent resilience).
► There remains potential for off-farm measures with networks who were late adopters. There is a need to better connect on and off-farm works.
► There are concerns farmers do not complete appropriate business planning when engaging with efficiency measures. There are education and extension
opportunities (and a need) pre and post implementation.
► Water efficiency measures have accelerated impacts across the whole Basin.
► There needs to be recognition that delivery partners take on risks in projects and areas where delivery partners have no control (such as suppliers).
1 Terms of reference 7 Opportunities for efficiency ...2 Glossary 8 Cost of efficiency measures3 Executive summary 9 Principles for negating adv ...4 Introduction 10 A program to achieve 450 ...5 Potential socio-economic ... 11 Appendices6 Program design

Analysis of efficiency measures in the Murray-Darling Basin: Opportunities to recover 450GL in additional environmental water through efficiency measures by 2024, with neutral or positive socio-economic impacts | Page 256 of 307
19 January 2018 | Final Report
Appendix B: Stakeholder comments from Victoria11 Appendices
Local Government bodies
► The Shepparton region has experienced significant economic impact, including job losses since 2012 with the Basin Plan Implementation.
► Population has increased by about 1.2% per annum.
► There are external pressures underlying impacts of water (e.g. commodity prices and freight logistics).
► Greater Shepparton is part of Regional Partnership Program with the VIC government for a centre of excellence in the region to support irrigated agriculture.
► Around $2 billion has been spent irrigation measure so far, and the community has invested in law courts and the hospital. These investment should not be wasted moving forward.
► The money spent on the Connections project has not been value for money.
► Taking 450GL out of the consumptive pool will have further negative impacts.
► On-farm efficiency programs can provide benefits for the individual but there are adverse impacts to the broader economy.
► Retraining and education are considerations for mitigating against adverse impacts from efficiency measures.
► Economic diversity is key to communities adjusting to any adverse impacts from efficiency measures, and the transition to higher value agriculture.
► A ‘tipping point’ is being approached as the funding for irrigation comes to an end. This is being conflated by further reductions in the consumptive pool, which will reduce deliveries across the GMID. This will increase costs and risk a tipping point placing $2 billion investment at risk. Furthermore, the substantial investment in irrigation in our region has masked some of the negative impact of water recovery.
► Communities are still dealing with the structural adjustment required due to the historical water recovery measures. The rate of change has been accelerated
and amplified the negative impact of those changes, as well as reduced community resilience. Uncertainty around the future availability of water has affected investment decisions, meaning that opportunities to expand production in response to increased food demand have been lost.
► Ensuring neutral socio-economic impacts, the mitigation of impacts could include extension programs, facilitating farmers to transition to more valuable commodities, funding for entrepreneurs and diversification of local economies (e.g. renewables or tourism). Offsetting or mitigating the negative impact of water recovery would require significant investment providing new and enduring economic activity and diversification. This means long range investment in areas like regional and rural entrepreneurialism, digital connectivity, renewable energy and infrastructure that improves connectivity and access to markets.
► There could be greater focus on the most appropriate way to achieve the desired environmental outcomes, rather than the sole focus being on efficiency measures. Environmental watering is a new and developing area of expertise and that there are potentially significant efficiencies that can be achieved in this area. Recovering water through efficiency measures is pointless without simultaneously easing or removing constraints to delivering that water to the lower end of the system.
► The type of on-farm efficiency program, where and when it occurs is important in considering whether it has a positive or negative socio-economic impact. on-farm efficiency measures have had clear financial benefits for some irrigators. The assumption that these benefits have flowed through to provide a positive cumulative economic impact is not borne out by what MRGC councils have seen on the ground.
► There needs to be greater clarity and transparency on the basis of reports commissioned by the MBDA, the Commonwealth, the States, Councils and CMAs and/or other stakeholders. There needs to be clarity and transparency around the assumptions and methodologies of socio economic assessments by the MDBA to ensure the findings of the independent reports are incorporated into any advice to the Ministerial Council.
Victoria
1 Terms of reference 7 Opportunities for efficiency ...2 Glossary 8 Cost of efficiency measures3 Executive summary 9 Principles for negating adv ...4 Introduction 10 A program to achieve 450 ...5 Potential socio-economic ... 11 Appendices6 Program design

Analysis of efficiency measures in the Murray-Darling Basin: Opportunities to recover 450GL in additional environmental water through efficiency measures by 2024, with neutral or positive socio-economic impacts | Page 257 of 307
19 January 2018 | Final Report
Appendix B: Stakeholder comments from Victoria11 Appendices
Local Government bodies cont.
► There is concern that water entitlements are being held by investors waiting for the next drought. Concern remains around the impact of speculation and the role of investors. Any water that is held and not used for agricultural production, amplifies the negative impact of the reduction in the consumptive pool.
Victoria Irrigators
► On-farm opportunities continue to exist, and there is demand for these efficiency measures to be made available.
► Existing on-farm efficiency measures have created positive socio-economic outcomes for the farmers choosing to participate.
► Business planning is critical to a farms success. It is possible that other farms/operations have not had access, interest, or a full understanding of the previous efficiency schemes. Consequently extension programs, best practice or educational campaigns may enable greater participation and interest in efficiency measures.
► There is a number of older farmers, with no plans for succession, who currently own land and water rights. These owners have no interest or potentially capability in accessing efficiency measures.
► Equally there are younger farmers entering the industry, who buy land, but choose to enter the temporary market due to the high cost of the permanent water rights.
► The dairy industry needs funding to make the long-term adjustment to a more infrastructure intensive operation and less reliance on pasture grazing.
► The change in farm model and investment in infrastructure means feed can be stored, greater conversion from input (feed and water) to output (milk). The investment in infrastructure would increase production and employ more labour.
► Farmers would be reluctant to give up water entitlements, as they require certainty as operations become more complex.
Irrigation Infrastructure bodies
► Victorian regulation (e.g. salinity levy on new development and housing regulation on regional blocks) is restricting opportunities.
► Recent investment by the industries such as almond means it is anticipated that there will be a huge increase in the demand for water in future years as these plantings mature.
► There are off and on-farm opportunities remaining (e.g. upgrading pumps, channels and delivery mechanisms, filtration and metering, reducing evaporative losses on dams).
► The diversification of crops in the district can smooth out the timing of demand for water.
► There are urban efficiency opportunities in the area, for example water treatment plants.
► Support would be needed to develop business case for efficiency projects.
► The consolidation of small blocks could attract investment and deliver network efficiencies.
► The lack of water security means there is a lack of investment in properties in the region and hence there has not been capital gains growth.
► Irrigators in the GMID have to pay delivery share charges, even if they have sold their water entitlements.
► The Connections project did not deliver on promised efficiencies, the calculation of water savings were inaccurate and the project has taken water away from productive use.
► Future revenue of GMW will not cover its costs due to reduced customer base and the remaining customers can’t afford to pay the charges.
► Removing a further 450GL from the system will have impacts at every level.
► It is an economic cost for people to continually provide input on reviews but the issues are not being resolved.
1 Terms of reference 7 Opportunities for efficiency ...2 Glossary 8 Cost of efficiency measures3 Executive summary 9 Principles for negating adv ...4 Introduction 10 A program to achieve 450 ...5 Potential socio-economic ... 11 Appendices6 Program design

Analysis of efficiency measures in the Murray-Darling Basin: Opportunities to recover 450GL in additional environmental water through efficiency measures by 2024, with neutral or positive socio-economic impacts | Page 258 of 307
19 January 2018 | Final Report
Appendix B: Stakeholder comments from Victoria11 Appendices
Irrigation Infrastructure bodies cont.
► Efficiency measures will take water away from the consumptive pool and is not supported.
► Expanding footprint of horticulture means there will be a significant impact on the industry in the next drought, if an extra 450GL is taken out of the consumptive pool.
► Energy cost is now a key input cost concern.
► The Murray-Darling Basin Plan is based on outdated data.
► The EY review needs to look at the impact of the supply measures and constraints in the river as all the issues are connected.
► Flooding is a concern if the recovered water is to be delivered downstream.
► Farmers continue to deal with the structural adjustment required due to the historical water recovery measures.
► Impacts have only been considered on an individual farm level, but there are wider impacts across the communities and different agriculture industry.
► On-farm efficiency measures have allowed farmers to increase production, but the consumptive pool has decreased. Hence, there is greater reliance on the temporary water market, exposing farmers to increased risk. Furthermore, this water is no longer available for crop production and this has an ongoing socio-economic impact.
► Important for infrastructure projects planning and assessment to be underpinned by technical research and whole of farm management planning.
► For on-farm infrastructure projects, it is important for works to begin before full funds are disbursed. Furthermore, irrigators should manage the sub-contractor.
► With the planned off-farm projects, GMW’s delivery efficiency will be 85%-90% and it will be expensive to chase further delivery efficiencies without system rationalisation.
► There could be greater focus on the most appropriate way to achieve the
desired environmental outcomes, rather than the sole focus being on efficiency measures.
► The COFFIE (450GL) should not be rolled out any further until the 2750GL has been met, and an agreed and rigorous assessment has been completed on the socio-economic impacts on regional communities.
► The extra 450GL water going down to SA may result in worse outcomes for the Goulburn River as one of the priority (icon) environmental sites, due to large consistent flows at the wrong time of the year.
► The Victorian Farm Modernisation Program (run in conjunction with VIC DELWP and DAWR) is a more efficient and effective model than OFIEP or COFFIE (including the ability for the GB CMA to be able to keep an eye on WEEs and potential arbitrage).
► The 100% transfer based on “minimum technically feasible water savings” is a concern and removes confidence in a potential future model (e.g. it encourages irrigators and Delivery Partners to create figures). Irrigators are making significant decisions on business investment and need to have some confidence in water savings (e.g. the GB CMA water calculator and estimated water savings is based on 20 years of local research and has credibility and has been field tested and validated over 6 years now).
► There is dubious technical capability (and motivations) of some Delivery Partners, and reducing the technical assessment under COFFIE does not hold them accountable.
► There is no link between a water price and the value of the infrastructure needed. To conflate the two can lead to perverse outcomes.
► Issues of potential, perceived and real conflicts of interest and arbitrage by some Delivery Partners and irrigators and the way processes are managed needs to be recognised in any new program.
► The consequence of having Delivery Partners who are ‘for profit’ only, needs to be recognised. They have limited concern for the long-term sustainability of the regional community nor the environment. They are driven by short-term profits which may not be in the best interests of the irrigator or the region.
1 Terms of reference 7 Opportunities for efficiency ...2 Glossary 8 Cost of efficiency measures3 Executive summary 9 Principles for negating adv ...4 Introduction 10 A program to achieve 450 ...5 Potential socio-economic ... 11 Appendices6 Program design

Analysis of efficiency measures in the Murray-Darling Basin: Opportunities to recover 450GL in additional environmental water through efficiency measures by 2024, with neutral or positive socio-economic impacts | Page 259 of 307
19 January 2018 | Final Report
Appendix B: Stakeholder comments from Victoria11 Appendices
Irrigation Infrastructure bodies cont.
► The key consideration for governments is whether they are prepared to make a long-term commitment to helping irrigation communities adjust. This will need to extend beyond the short-term jobs the construction aspects of the efficiency programs generate. Without sufficient water to use these investments to full capacity their benefit will be short-lived.
► There is potential to invest to transform regional economies and offer real opportunity. This will require investment in and support for institutions and infrastructure – in regional tertiary education, health, transport, telecommunications, clean energy & tourism. These are the foundations of creating enduring, high quality jobs and creating attractive lifestyles for regional people in the 21st century.
► The region has relatively minor raw water users in the Goulburn Basin, with an underlying water supply for customers at the typical baseline for urban water corporations.
► The total volume of water losses is made up of leakage (”real losses”), under-billed consumption due to metering inaccuracies (not relevant to raw water consumption), and unauthorised consumption. The two areas in which a water utility can reduce its raw water consumption is by reducing water losses or “unnecessary” water consumption.
► Leakage (”real losses”) are usually the major component of the total water losses. Potential contributing factors include leaking service connections, leaking water mains or fittings, water main bursts, leaking water storages, overflow from storages, water treatment plant losses (e.g. filter backwash water), and inadequate bulk flow metering to be able to identify when a major leak occurs.
► GVW has a range of systems in place to control water losses, such as routine leak detection of water networks (conventional acoustic leak detection with noise correlators), non-revenue water audits, water main replacement program, condition assessment of water storages and repair works, pressure reduction stations in networks with high pressure, activities to reduce network pressure
spikes, time constraints to ensure that water mains are repaired quickly, and temporary network pressure and flow monitoring.
► A significant proportion of network leakage (roughly estimated at 50%) is “unavoidable”, in that it is not detectable with conventional acoustic leak detection technology.
► GVW has 27 Wastewater Management Facilities (WMF) over 54 towns. Most of these rely on lagoon treatment followed by irrigated pasture practices to reuse the recycled water in a productive way. 95% of GVW recycled water can be returned to land for beneficial reuse in any one year, and are recognised as having one of the highest % returns in Victoria.
► GVW is a regional leader working with government to facilitate regional partnerships and opportunities in this area. They recently negotiated an outcome with the EPA (Kilmore WMF Environmental Offsets Project) that will enable treated recycled water to be returned to a waterway in Kilmore for the benefit of the community and local waterway health. GVW continues to work with Councils on other initiatives, including facilitating projects within their remit like stormwater reuse initiatives.
► GVW is open to opportunity and could benefit from Federal funding or would like further discussion about potential projects that they could help shape and trial.
► “Unnecessary” demand for water can be reduced through measures such as water saving rules (e.g. sprinklers can only be operated at night time), using water efficient devices (e.g. trigger nozzle for gardening, water efficient shower heads), educating customers how to identify and fix their household leaks, using water appropriately (e.g. using brooms or blowers to clean hard surfaces rather than high pressure hoses).
► GVW manages demands through its permanent water saving rules and water efficiency educational material.
► There are ongoing opportunities in this space relating to ‘Intelligent Metering’ and ‘Remote Leakage Location’.
1 Terms of reference 7 Opportunities for efficiency ...2 Glossary 8 Cost of efficiency measures3 Executive summary 9 Principles for negating adv ...4 Introduction 10 A program to achieve 450 ...5 Potential socio-economic ... 11 Appendices6 Program design

Analysis of efficiency measures in the Murray-Darling Basin: Opportunities to recover 450GL in additional environmental water through efficiency measures by 2024, with neutral or positive socio-economic impacts | Page 260 of 307
19 January 2018 | Final Report
Appendix B: Stakeholder comments from Victoria11 Appendices
Industry Representatives
► There is still interest from farmers for on-farm efficiency measures.
► After on-farm modernisation works, farmers are able to expand their operations, and increase cropping cycles; which results in additional water use.
► Current requirements for on-farm projects are not flexible and onerous for delivery partners. Requirements need to be practical.
► The APTRC Supports efficiency measures as farmers compete in a global market place.
► There would be greater impact on communities where farmers miss out on on-farm efficiency programs, and have to pay for water on the market. If on-farm efficiency programs are offered in the future is must be offered to growers in all parts of the Basin, as water is traded between districts. So, it’s either all in or none, as otherwise some growers in some areas of the Basin will be able to upgrade their irrigation infrastructure while others miss out. This puts those with the upgraded infrastructure in a better position and ability to generate more $/ML of water used. Water in dry years will be traded to those growers who can generate the highest $/ML.
► Basin Plan has not had a significant impact on the irrigators or the community. It aided farmers who wanted to leave after the drought with buybacks and enabled the local economy and regions to diversify.
► The Basin Plan did not cause the Swiss cheese effect. That was already occurring in the 1990s, but water efficiency measures may have contributed to the rate of change.
► Irrigations feel "entitled" to water access at a cheap cost.
► Peak groups do not represent all individual irrigators.
► Need long-term sustainable environment and regional economies.
► Individual irrigators may have problems in accessing programs due to their debt and diminished cash flow.
► The MDBA has failed to connect sufficiently with grass roots irrigators, consequently there remains ongoing distrust and confusion regarding the plan.
► The plan has not been accepted as legitimate by substantial numbers of irrigators and Basin residents, many of whom believed, or still believe, that water was taken from irrigators without consent or compensation.
► Factors other than water recovery are affecting water prices, such as:
► Increased urban demand
► Existing and future plantations
► Corporates, and
► Free Trade Agreement's.
► Economic factors and not water availability have caused rural incomes to fall:
► An ongoing decline
► Low commodity prices, and
► Australia's supermarket duopoly.
► Effect of the MDBP buybacks going forward-impact balanced by benefit.
► Risk that shortfall in target will mean long economic and social benefits negated. Increased risk that entitlement holders will be required to return without compensation.
► Water security is an ongoing issue.
► The capacity of irrigators and local community to wear shocks relating to water has increased, but water supply still underpins the economic base of the region.
► The use of environmental water is not transparent. It is not visible whether their work is contributing to environmental benefits and consequently angers communities and irrigators.
► There are remaining on-farm opportunities and off-farm opportunities. There are further opportunities to reuse water for stock and domestic use.
1 Terms of reference 7 Opportunities for efficiency ...2 Glossary 8 Cost of efficiency measures3 Executive summary 9 Principles for negating adv ...4 Introduction 10 A program to achieve 450 ...5 Potential socio-economic ... 11 Appendices6 Program design

Analysis of efficiency measures in the Murray-Darling Basin: Opportunities to recover 450GL in additional environmental water through efficiency measures by 2024, with neutral or positive socio-economic impacts | Page 261 of 307
19 January 2018 | Final Report
Appendix B: Stakeholder comments from Victoria11 Appendices
Industry Representatives cont.
► The rise of corporates in regional areas and their ability to outcompete the local family operations on the water market, is of concern.
► The consolidation of small blocks can attract investment and deliver network efficiencies.
► The irrigation footprint is expanding and water scarcity will be an even greater problem in the next drought.
► Economic certainty is required for business planning and investment. The local economy needs to diversify and build on existing projects to build a more sustainable economy moving into the future.
► There is support from two councils and an industry peak body for the implementation of SDL adjustment projects in the region.
► A ‘tipping point’ has been reached in VIC due to the level of historical water recovery.
► Risks from program funding being disbursed prior to works being undertaken on-farm and transparency of funding multiple packages offered by some delivery partners.
► Impacts of efficiency measures include reduced use of labour and equipment on-farm and the adverse flow-on effects to communities, and higher irrigation system costs.
► Whilst there may be opportunities, for example off-farm projects, impacts from current infrastructure programs need to be understood before further efficiency measures are undertaken. Furthermore, the funding of supply measures need to be agreed.
► There could be greater focus on the most appropriate way to achieve the desired environmental outcomes, rather than the sole focus being on efficiency measures. Further, there are system constraints and it is questionable whether water recovered can be fully delivered to the end of the system.
► On-farm efficiency measures have allowed farmers to increase production, but the consumptive pool has decreased. Hence, there is greater reliance on the temporary water market, exposing dairy farmers to increased risk.
► Dairy farmers are dealing with the structural adjustment required due to the historical water recovery measures, in particular impacts from buybacks.
► Although dairy farmers would like to undertake measures to improve on-farm efficiency and profitability, they would not want to give up additional water due to the cumulative impacts of historical water recovery measures.
► There could be greater focus on the most appropriate way to achieve the desired environmental outcomes, rather than the sole focus being on efficiency measures.
► On-farm efficiency measures have allowed farmers to increase production, but the consumptive pool has decreased. Hence, there is greater reliance on the temporary water market, exposing dairy farmers to increased risk.
► Structural adjustment is not possible in all areas. There are regions particularly suited to dairy and cannot simply ‘swap’ to a new production model (e.g. almonds).
► While dairy farmers are adjusting, it is not without financial and other stress to do so. Many farms have not undertaken on-farm improvements, either because they are not yet connected to the modernised GMID system and therefore able to apply for OFIEP funding, or because they don’t have the capital for their contribution under OFIEP or to do the works themselves. The result is that adaption is costly, and profitability is eroding as a result.
► While on-farm efficiency has allowed some farmers to increase production, they do by using more water. The on-farm works were based on an assumption by DAWR that the upgrades would allow farmers to produce the same but using less water.
1 Terms of reference 7 Opportunities for efficiency ...2 Glossary 8 Cost of efficiency measures3 Executive summary 9 Principles for negating adv ...4 Introduction 10 A program to achieve 450 ...5 Potential socio-economic ... 11 Appendices6 Program design

Analysis of efficiency measures in the Murray-Darling Basin: Opportunities to recover 450GL in additional environmental water through efficiency measures by 2024, with neutral or positive socio-economic impacts | Page 262 of 307
19 January 2018 | Final Report
Appendix B: Stakeholder comments from Victoria11 Appendices
Industry Representatives cont.
► Overall the industry is producing 25% less milk in northern Victoria, with a large proportion of that step change due directly to the Basin Plan water recovery (a point agreed now by MDBA). This has implications for the investment and viability status of regional processing facilities.
► Dairy farmers continue to deal with the structural adjustment required due to the historical water recovery measures, in particular impacts from buybacks. The full extent of these impacts are not fully realised and will occur over a long period.
► Some farmers have undertaken infrastructure investment such that the farming model is less reliant on pasture grazing. The change in farming model is to drive better profitability. However, the change also adds greater complexity and not all farms are able to sustain operations.
► Although dairy farmers would like to undertake measures to improve on-farm efficiency and profitability, they would not want to give up additional water due to the cumulative reductions in the consumptive pool.
► There could be greater focus on the most appropriate way to achieve the desired environmental outcomes, rather than the sole focus being on efficiency measures.
► On-farm efficiency measures have allowed farmers to increase production, but the consumptive pool has decreased. Hence, there is greater reliance on the temporary water market, exposing dairy farmers to increased risk.
► Measures that could assist dairy farmers may include: on-farm infrastructure to allow flexibility in farming operations, risk planning, R&D, and the development of a services sector for a changing industry.
► Loss of water in the region has flow-on impacts on communities and services and the region cannot afford to lose more water.
► Under a “mixed” farming model, infrastructure investment stands idle when there’s low water availability. Further, the mixed farming model means farmers are subject to greater exposure of input costs (e.g. electricity costs).
► Irrigators that participated in on-farm infrastructure projects often buy additional water from the market after the project finishes, as the reduced level of water entitlements are not adequate for the increase in productive capacity.
► There is a lack of investment certainty because of reductions in the consumptive pool.
► There could be a greater focus on the most appropriate way to achieve the desired environmental outcomes, rather than the sole focus being on efficiency measures.
► Past programs are not achieving desired outcomes and people are critical of this. Much of this criticism is unfounded and have been part of a campaign to undermine the Plan’s implementation. Apart from energy intensification with many projects, farmers are maintaining or increasing farm outputs.
► The use of delivery partners needs to consider any conflict of interest and whether they provide value for money proposition.
► Funding should be directed towards projects that deliver against a long-term strategy. There is a need to reduce the current footprint of irrigation in many areas. Despite $2 billion being spent on system upgrades, opportunities are missed to contract this footprint and ensure long-term viability.
► Some funding is being invested in farms that may not be viable in the future, i.e. funding for works in areas that may not have long-term viability.
► There are opportunities for farms to transition to a more productive model, e.g., growing tomatoes in glasshouses which reduces the water requirement. Industries are changing quickly, and the program could expand to include not only irrigation upgrades but also changes to the management system.
1 Terms of reference 7 Opportunities for efficiency ...2 Glossary 8 Cost of efficiency measures3 Executive summary 9 Principles for negating adv ...4 Introduction 10 A program to achieve 450 ...5 Potential socio-economic ... 11 Appendices6 Program design

Analysis of efficiency measures in the Murray-Darling Basin: Opportunities to recover 450GL in additional environmental water through efficiency measures by 2024, with neutral or positive socio-economic impacts | Page 263 of 307
19 January 2018 | Final Report
Appendix B: Stakeholder comments from Victoria11 Appendices
Industry Representatives cont.
► Irrigators would be interested if an efficiency program allowed new technologies.
► An extension program would be important to highlight the successes from efficiency programs.
Environmental and Indigenous Representatives
► Need to untangle the impact of other factors on the industry from the impact of efficiency measures. The ultimate impact depends on the decisions made by the farmer.
► There’s been a lot of investment in irrigation districts, for example the almond industry, which is changing the way water is being used.
► There needs to be greater communication on why water recovery is needed and the consequent benefits of water recovery (such as salinity and water quality benefits), and the flow of these to social benefits to the community.
► Mitigations measures need to look at measures to build resilience in the community, develop opportunities, and support people to make changes.
► There is a need for a coordinated plan of how to best use the land and water in the region. A new organisation needs to be created or existing organisations (CMAs) be given the authority for regional development that encompasses land, water and energy, with the initial focus being land being withdrawn from irrigation. The Melbourne Metro Rail Authority/Latrobe Valley Authority are examples of such an organisation. There is enormous potential to use closed loop processes coupled with green chemistry to create a range of new industries.
► Investment by large corporates are being made in the region. The list of recent investment is considerable, Grain Corp, Fonterra, Unilever, ARENA, 3000-5000 head dairy farms, new abattoirs, new cool storage, Pactum dairies. In Shepparton a new hospital $180m and Court house $40 are under construction and a new art gallery will start construction next year -$40m. Several large PV solar plants each 100MW are planned across the Southern Basin. Investment at
all levels is significant throughout the region.
► Opportunity to invest in new energy technology projects. Embrace renewable energy across the entire Basin. Solar energy is boundless and can replace water to achieve improved agricultural output. Hydroponics use 5-7% of water and achieve the same economic output on a fraction of the land. If Sundrop at Port Augusta can desalinate sea water using solar energy to produce ultimately 20% of the fresh tomatoes Coles, sell surely we can do the same at Boort.
► There are broader changes in the economy, other than the Basin Plan, that are affecting communities; there are changes to every facet of community life. For example buying $150k of chemical direct from the importer in Sydney, or direct from China and bypassing local businesses to getting your groceries on line. Driverless tractors will be the norm shortly, leading to less people in remote communities. Opportunities to get more out of our NBN.
► The reallocation of water is blamed for all the problems across the Basin. However, there are many other factors influencing the structural changes.
► MLDRIN supports the recovery of 450GL and there needs to be more focus on this water recovery.
► Positive impact associated with water recovery for the Indigenous communities, including positive health and wellbeing impacts. This needs to be factored into socio-economic impacts.
► Infrastructure upgrades such as those that require earthworks can have cultural heritage impacts.
► Assessments on potential cultural heritage impacts should be undertaken by delivery partners on projects.
► Consideration of opportunities for Aboriginal employment on efficiency projects.
► Aboriginal community would like to own water entitlements and have access to water market.
1 Terms of reference 7 Opportunities for efficiency ...2 Glossary 8 Cost of efficiency measures3 Executive summary 9 Principles for negating adv ...4 Introduction 10 A program to achieve 450 ...5 Potential socio-economic ... 11 Appendices6 Program design

Analysis of efficiency measures in the Murray-Darling Basin: Opportunities to recover 450GL in additional environmental water through efficiency measures by 2024, with neutral or positive socio-economic impacts | Page 264 of 307
19 January 2018 | Final Report
Appendix B: Stakeholder comments from Queensland11 Appendices
State Government bodies
► Current and future extension programs to focus on on-farm demonstrations and training (best practice), with opportunities for irrigators to share knowledge.
► DAF’s program has been very successful with the introduction of improved monitoring and measuring technology. This has enabled more informed planning and potential for enhanced farm management and benchmarking.
► Shifting of industries, from broadacre to high value horticulture crops has potential. But this will need to be simultaneously matched with improvements with transport (roads, rail etc.) and connectivity to enable access to the market.
► Engagement with private sector in delivery of efficiency measures is critical for providing ongoing services needed on farms (e.g. education).
► Co-investment by irrigators in efficiency measures is important to ensure buy-in and to avoid gold-plating.
► There is room for more efficiency measures on farms, particularly for the horticulture industry, provided productivity is not impacted.
► In terms of improvements to irrigation networks, there may be efficiency opportunities such as lining of channels.
► Labour supply is an issue in some regions; particularly skilled labour. Investment decisions in response to labour availability may result in the purchase of systems which certainly reduce labour but they may also increase energy use (e.g. overhead irrigation systems like lateral moves and centre pivots). These can be very efficient in water use as well (but so to can properly designed and managed surface irrigation systems).
► Investment in “bankless” channel systems (a type of surface irrigation) is primarily driven by labour considerations – the efficiency with which these systems supply irrigation water compared with existing furrow irrigation systems is still uncertain.
Local Government bodies
► The council is strongly opposed to water buybacks. Funding for water efficiency works and measures is preferred.
► The final water recovery from individual catchments needs quantifying to allow producers and communities to have certainty.
► Shared component penalises catchments that have achieved the reduction in SDL.
► 450GL additional recovery with neutral outcomes is the "best expected result“.
Industry Representatives (including environmental and Indigenous groups)
► There’s a short-term increase in productivity after on-farm modernisation but then there’s a drop off in the longer term.
► Support services are needed to improve on-farm efficiency, for example extension programs to provide training on farm management skills.
► Training is needed for farmers to get the maximum benefit from newly installed infrastructure.
► The Northern system experiences higher variability in water availability and water availability is the key limiting factor.
► There is a need to take into account the benefits from increased environmental water, e.g. increase in tourism and recreational activities.
► Energy costs are another key issue and farms are investing into reducing energy costs.
Irrigation Infrastructure bodies
► There is a high use of groundwater in the Central Downs irrigation network, making it more complex for efficiency measures to occur.
Queensland
1 Terms of reference 7 Opportunities for efficiency ...2 Glossary 8 Cost of efficiency measures3 Executive summary 9 Principles for negating adv ...4 Introduction 10 A program to achieve 450 ...5 Potential socio-economic ... 11 Appendices6 Program design

Analysis of efficiency measures in the Murray-Darling Basin: Opportunities to recover 450GL in additional environmental water through efficiency measures by 2024, with neutral or positive socio-economic impacts | Page 265 of 307
19 January 2018 | Final Report
Appendix B: Stakeholder comments from Australian Capital Territory11 Appendices
Irrigation Infrastructure bodies cont.
► There is likely to be less opportunities for efficiency measures upstream of Cecil Plains, due to smaller size of farms, different types of licences and complexity of requirements before entitlements can be transferred.
► There will be more opportunities for efficiency measures downstream of Cecil Plains.
► Individual property owners have already invested in overheads, as they work well given the soil type in the area and current crops. However, there are further opportunities.
► Overheads can allow greater crop variety and intensity, (e.g. from broadacre to vegetables). Increase in production can mean an increase in labour employed on farm.
► An important element of regional development is investment in providing better access to market, domestic and overseas.
► The biggest current barrier to using the HHWUE program in this area has been the hydrologic studies required to decouple river water from overland flow and ground water sources. These reports have been expensive and difficult to produce. The decoupling process also means issues whereby a reduction in licensed take may increase air space in dams to increase overland flow take. These issues combine to make it prohibitive for people to get involved.
CEWH
► There is a lack of understanding of the plan. However, people are not trying to understand the issues. There is information available but people are not accessing it.
► The Basin plan represents the outcomes of decisions that have already been agreed.
► Opportunities in relation to urban water, need to result in water that the CEWH can use.
► CEWH have spoken to a number of individual farmers that have a positive story, both in terms of productivity and community.
► There is a generational transition in terms of how people view the water (as a commodity rather than as a right).
► There is a difficulty in demonstrating the environmental benefit when it is a 20-30 year journey.
► The CEWH have started to talk about the milestones in the journey and are trying to localise the narrative.
► The CEWH has limited resources to document or tell this story.
► The plan needs time to show a demonstrated impact, and its’ aims/outcomes should be reviewed or amended across time.
► Time is a significant factor, as there has been a significant amount of change in a short amount of time.
► Ecologically the timeframes are 20-40 years so aligning the economic and social change to these timeframes may help address concerns.
Australian Capital Territory
1 Terms of reference 7 Opportunities for efficiency ...2 Glossary 8 Cost of efficiency measures3 Executive summary 9 Principles for negating adv ...4 Introduction 10 A program to achieve 450 ...5 Potential socio-economic ... 11 Appendices6 Program design

Analysis of efficiency measures in the Murray-Darling Basin: Opportunities to recover 450GL in additional environmental water through efficiency measures by 2024, with neutral or positive socio-economic impacts | Page 266 of 307
19 January 2018 | Final Report
Appendix B: Stakeholder comments from Peak Bodies11 Appendices
Industry Representatives (including environmental and Indigenous groups)
► There is a need to build trust across the Basin. Communicating the success and failures of the Basin Plan should be part of this. In particular, some of the positive outcomes of water recovery programs include environmental benefits, drought-proofing, industry diversification and a businesses increased ability to vertically integrate.
► Recovery of the entire 450GL is important for the environmental sustainability of the entire Murray-Darling Basin. However, there is concern over how this can be achieved without formal measurement and accountability measures. Installing compliant meters could support this, but may be difficult to implement in the Northern Basin.
► Additionally, there is a potential measurement issue around return flows. As these may have a positive environmental impact, efficiency measures which reduce these flows may only reallocate environmental water, not increase it.
► Education in water literacy is required to ensure that everyone has the same understanding of the issues (for instance how the Commonwealth funding is spent and the resulting environmental outcomes).
► Conversations around water recovery have traditionally involved irrigators, but another perspective may be in-river programs (such as the Carp Allocation Program).
► Allowing communities to have greater involvement in these programs may be a viable mitigation for any negative socio-economic impacts. In particular, Indigenous involvement in these programs have been limited and could be improved.
► Opportunities for enhancing farm productivity are being realised as a result of the Basin Plan but more could be considered. For instance some of the current water infrastructure programs are too constrained, so program design could take into account a broader scope, increased flexibility and streamlined administration.
► Irrigators and communities have been significantly impacted and are therefore opposed to the 450GL.
► Irrigators, farmers and communities require regulatory certainty to provide them confidence in their long-term planning. Environmental outcomes, such as healthy rivers, are also important for these groups.
► There are concerns regarding the on-farm efficiency measures programs including the distribution of negative socio-economic impacts under the current Basin Plan neutrality test (particularly any negative flow-on impacts from rationalisation) and the reduction of consumptive water.
► The single property test is fundamentally floored as it doesn’t consider flow-on impacts.
► There is concern that if COFFIE was the only program, then this would contribute to adverse impacts; impacting on the economic structure and viability.
► Some irrigators believe that the COFFIE program involves rationalisation. However, the scope for COFFIE only considers on-farm water infrastructure projects.
► There is a commonality of views across Councils, that is they are keen to contribute to the success of the Basin Plan, but have concerns regarding the negative socio-economic impacts.
► Given the recent 4Corners and Lateline programs, program design should incorporate appropriate integrity and compliance measures. Additionally, a strong communications strategy may be required (there is a need to re-set the narrative), including engaging with all three levels of Government.
► Targeted funding for community structural adjustment may be a viable mitigation for negative socio-economic impacts, potentially done in partnership with a local government organisation.
► There may be further opportunities for irrigators and the CEWH to work together to achieve broader environmental water system efficiencies.
Peak Bodies
1 Terms of reference 7 Opportunities for efficiency ...2 Glossary 8 Cost of efficiency measures3 Executive summary 9 Principles for negating adv ...4 Introduction 10 A program to achieve 450 ...5 Potential socio-economic ... 11 Appendices6 Program design

Analysis of efficiency measures in the Murray-Darling Basin: Opportunities to recover 450GL in additional environmental water through efficiency measures by 2024, with neutral or positive socio-economic impacts | Page 267 of 307
19 January 2018 | Final Report
Appendix C: Notified efficiency measures11 Appendices 1 Terms of reference 7 Opportunities for efficiency ...
2 Glossary 8 Cost of efficiency measures3 Executive summary 9 Principles for negating adv ...4 Introduction 10 A program to achieve 450 ...5 Potential socio-economic ... 11 Appendices6 Program design
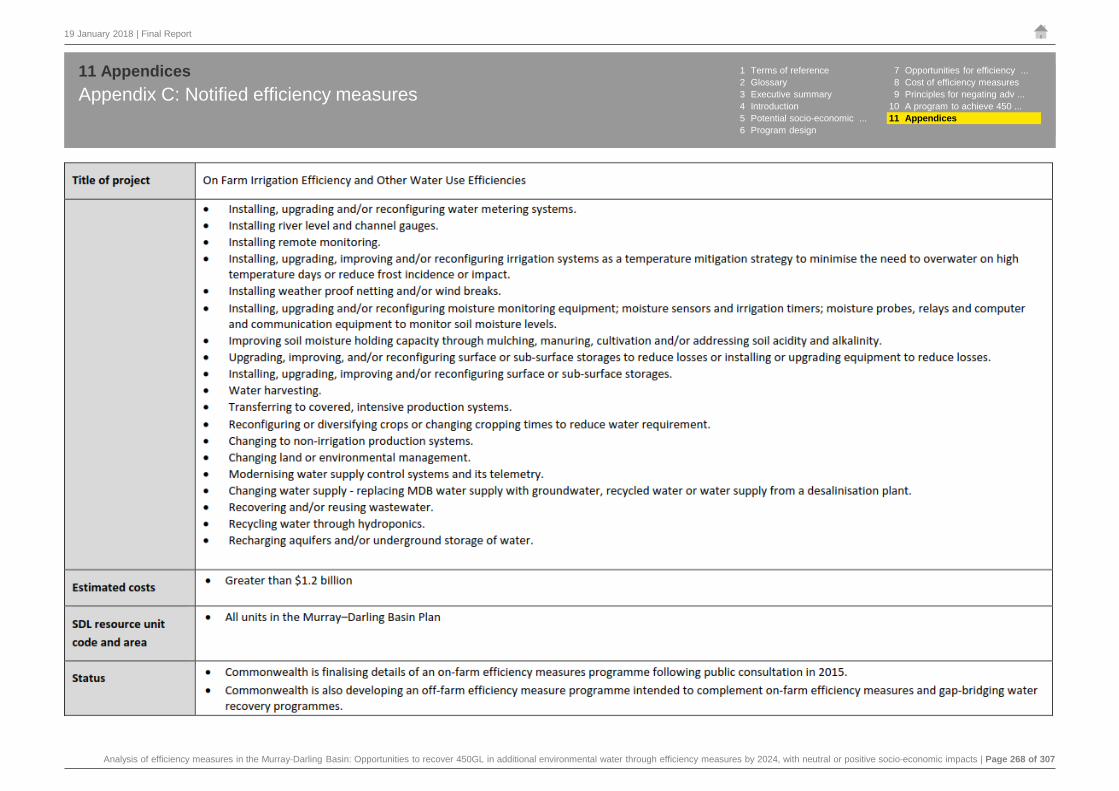
Analysis of efficiency measures in the Murray-Darling Basin: Opportunities to recover 450GL in additional environmental water through efficiency measures by 2024, with neutral or positive socio-economic impacts | Page 268 of 307
19 January 2018 | Final Report
Appendix C: Notified efficiency measures11 Appendices 1 Terms of reference 7 Opportunities for efficiency ...
2 Glossary 8 Cost of efficiency measures3 Executive summary 9 Principles for negating adv ...4 Introduction 10 A program to achieve 450 ...5 Potential socio-economic ... 11 Appendices6 Program design

Analysis of efficiency measures in the Murray-Darling Basin: Opportunities to recover 450GL in additional environmental water through efficiency measures by 2024, with neutral or positive socio-economic impacts | Page 269 of 307
19 January 2018 | Final Report
Appendix C: Notified efficiency measures11 Appendices 1 Terms of reference 7 Opportunities for efficiency ...
2 Glossary 8 Cost of efficiency measures3 Executive summary 9 Principles for negating adv ...4 Introduction 10 A program to achieve 450 ...5 Potential socio-economic ... 11 Appendices6 Program design

Analysis of efficiency measures in the Murray-Darling Basin: Opportunities to recover 450GL in additional environmental water through efficiency measures by 2024, with neutral or positive socio-economic impacts | Page 270 of 307
19 January 2018 | Final Report
All regions across the world, are undergoing a transition due to a range of factors. The Regional Innovation Smart Specialisation (RIS3) is an OECD framework for enabling regional economic transition.
OECD: Smart Specialisation strategy
Through analysis of existing and potential strengths of a community, the RIS3 partners with industry, educational institutions and government to identify priority areas for knowledge-based investments.
Framework1
The key characteristics of RIS3 are:
► Smart discovery or entrepreneurial discovery process: focus on private sector activities and knowledge to discover areas of innovation.
► Activities (not sectors): as the level for priority setting for knowledge investments, strategic and specialised diversification.
► Evaluation and monitoring: allowing for flexibility in policy setting.
The key steps in the RIS3 framework are:
► Step 1 - Analysis of the regional context covering existing regional assets, global links and dynamics of entrepreneurial environment. To establish the current attributes/status of the local economy.
► Step 2 – Seek participation and ownership from a diverse range of stakeholders from all levels and industries. To collaboratively build leadership and governance arrangements.
► Step 3 – Evidence collected to build a comprehensive picture of the local economy, society and environment. This picture provides a base for working with stakeholders on a shared vision for the region.
► Step 4 - Identification of local objectives that align with national priorities and regional vision, in areas of specialisation, and future development.
► Step 5 – Outline a roadmap for implementing the vision for one region, including specific actions and budgets.
► Step 6 – Implement a monitoring and evaluation mechanism which allow for ongoing program improvements.
Application – The Hunter Region2
The Hunter Valley (NSW) has experienced a decline in traditional industries. While the region maintains a diverse economy, there is continued demand and concern in transitioning to a future with less jobs in the traditional industrial base. Consequently, in 2014/5 RDA Hunter engaged with the OECD framework and established connections with the EU, to develop a strategy for the Hunter region.
In 2014/15, the RDA Hunter used the RIS3 framework, to identify seven areas of strengths and potential growth, and develop a strategy to develop these areas with targeted investment:
► Advanced Manufacturing
► Creative Industries
► Defence
► Food and Agribusiness
► Medical Technologies and Pharmaceuticals
► Mining Equipment, Technology and Services, and
► Oil, Gas and Energy Resources.
The transition to a high-tech economy and knowledge based services industry is facilitated with the ongoing focus on educational and public service institutions. For instance, the Hunter Valley leveraged graduates and the expertise of the University of Newcastle.
Application – Algarve, Portugal3
The economy of the Algarve region of Portugal relies heavily on its tourism industry. After the global financial crisis, the region needed to diversity the economy. Using the RIS3, they developed niche products within tourism, and then linked tourism to other sectors creating new economic activities. For instance, integrating services required for aged care, with Algarve established as a leader for delivery and export.
Appendix D: Frameworks and current programs for Chapter 9 11 Appendices
1 OECD 2014, Smart Specialisation, http://www.oecd.org/sti/inno/smartspecialisation.htm.2 Regional Development Australia Hunter 2016, Hunter Plan for Regional Growth 2016-2019.3 European Commission 2016, Portugal: Diversification from a dominant industry, http://s3platform.jrc.ec.europa.eu/-/diversification-from-a-dominant-industry?inheritRedirect=true.
Conclusions► Establish a local competitive advantage that
allows for targeted investment.
► Partnerships important to developing skills and knowledge.
► Success may be linked to existing economic base and diversification.
1 Terms of reference 7 Opportunities for efficiency ...2 Glossary 8 Cost of efficiency measures3 Executive summary 9 Principles for negating adv ...4 Introduction 10 A program to achieve 450 ...5 Potential socio-economic ... 11 Appendices6 Program design

Analysis of efficiency measures in the Murray-Darling Basin: Opportunities to recover 450GL in additional environmental water through efficiency measures by 2024, with neutral or positive socio-economic impacts | Page 271 of 307
19 January 2018 | Final Report
The “Just Transition” framework is a process aimed at moving communities towards economic, environmental and social justice under a common vision.
The “Just Transition” Framework1
Framework
The framework is based on a common aspirational vision. Utilising community leadership, political will is built to change systems. The principles of the framework include:
► To improve quality of life for people and communities affected by economic disruption, environmental damage, and inequality
► Foster inclusion, participation and collaboration
► Generate jobs with equal access
► Promote innovation, self-reliance and local wealth
► Protect and restore public health and environment
► Respect the past while strengthening communities and culture
► Consider the effects of decisions on future generations.
Application
The “Just Transition” approach was used in the Appalachian region to support communities moving from a coal based economy to a more sustainable economy.
In April 2017, the Productivity Commission (PC) released their initial report, reflecting on the preliminary results on their study into geographic impacts of the transition of the Australian economy following the resources investment boom.
Productivity Commission Initial Report –Transitioning Regional Economies2
The PC identified the following factors that led to successful transition strategies:
► Identified and led by the local community, in partnership with all levels of government
► Aligned with the region’s strengths
► Supported by targeted investment in developing the capability of the people in the local community to deal with transition, adaptation, and securing an economic future
► Designed with clear objectives and measurable performance indicators and subject to rigorous evaluation.
Application
Understanding not all regions have the same capacity to change, regional development must initially establish what that capacity is before funding infrastructure; the development has to match the demand and context of each community.
Appendix D: Frameworks and current programs for Chapter 9 11 Appendices
Conclusions► Common vision to be established.
► Inevitable transition to be acknowledged and collective action taken.
► Community engagement and buy in critical.
► Build potential, while respecting economic base and history of community.
► Consider future generations.
► Proactive management of situation.
► Local community to lead change.
► Partnership with all levels of government.
► Ensure strategy is aligned to regional capabilities and strengths.
► Clear, measurable objectives and performance indicators which are subject to evaluation.
1 Environment Victoria 2017, “Communities in Transition”: Roundtable Summary.2 Productivity Commission 2017, Transitioning Regional Economies Initial Report.
1 Terms of reference 7 Opportunities for efficiency ...2 Glossary 8 Cost of efficiency measures3 Executive summary 9 Principles for negating adv ...4 Introduction 10 A program to achieve 450 ...5 Potential socio-economic ... 11 Appendices6 Program design

Analysis of efficiency measures in the Murray-Darling Basin: Opportunities to recover 450GL in additional environmental water through efficiency measures by 2024, with neutral or positive socio-economic impacts | Page 272 of 307
19 January 2018 | Final Report
Using two theories of community engagement to focus on enhancing the ability of communities to respond to alterations in water management practices proactively.
Institutional Innovation, as framed by the Facilitated Rural/Urban Integrative Transformational System (FRUITS) ModelFramework of the FRUITS Model
The FRUITS model, is a theory of community change. It approaches community engagement as a method of integrating perspectives towards problem solving.
Recognising the situation of imperfect information within a community the diversity of views is engaged in working to:
► Identify common threats and values
► Co-create solutions with the aid of expert knowledge
► Build cohesion and continuity behind citizen action
► Increase awareness of higher, system-level forces that influence group decisions.
Framework of the Institutional Innovation Approach
The community engagement method of stimulating Institutional Innovation and action, requires participants to be challenged over a four step process:
1. Facilitating a representative group of the “Community” with diverse backgrounds
2. To challenge the group with new ideas and perspectives. To "Get Uncomfortable" with concepts or people that are not familiar
3. To “Challenge” the group with multiple problems
4. “Action” orientated outcomes for real tasks.
Utilising the FRUITS model, in line with Institutional Innovation, the policies and framework can help establish problem solving from a grass roots level.
Appendix D: Frameworks and current programs for Chapter 9 11 Appendices
Sourced: Fortunato et.al. 2017, Community Adaptability Engagement Research: Final Report,
Conclusions► Proactive management of change.
► Diverse community representatives.
► Common goals.
► Challenge traditional ways of thinking.
► Action orientated conversations
► Partnerships between community and government for local problems.
1 Terms of reference 7 Opportunities for efficiency ...2 Glossary 8 Cost of efficiency measures3 Executive summary 9 Principles for negating adv ...4 Introduction 10 A program to achieve 450 ...5 Potential socio-economic ... 11 Appendices6 Program design

Analysis of efficiency measures in the Murray-Darling Basin: Opportunities to recover 450GL in additional environmental water through efficiency measures by 2024, with neutral or positive socio-economic impacts | Page 273 of 307
19 January 2018 | Final Report
Appendix D: Frameworks and current programs for Chapter 9 11 Appendices
Big Sky Ideas is “on a mission to inspire every individual who lives in a small town throughout NSW to think like an entrepreneur”.
Program Design
The approach of Big Sky Ideas for transitioning regional economies in decline, is to start by providing individuals with the analytical tools for understanding the decision making processing and developing problem solving skills. These skills enable individuals to adapt to change and respond positively.
Big Sky Ideas offers programs to build the entrepreneur mindset. These programs are designed around 4 fundamental principles:
► Provoking open thought – enabling the ability to look inward in addressing perception of what’s real, to challenge assumptions, and enable critical thinking.
► Providing support – establishing a framework to encourage and enable individuals to act on their ideas as entrepreneurs.
► Creating environments free of judgement – to remove the barrier of perceived judgement from the actions of individuals.
► Inspiring people to dream – to provide examples of others within the local or wider community, and share the stories of what is possible. To facilitate a ripple effect in communities in inspiring change.
The programs include: “The Riverina Collective” (a women's collective hosting 3 events per annum building networks and learning opportunities), the "Rural Women’s Innovation program" (a 12 week program teaching entrepreneurial thinking), and "The Collective Workspace" (designed as a space to support those working from home or in collaboration).
Big Sky Ideas Conclusions► Focus on building capacity of individuals.
► Establish entrepreneurial mindset.
► Community development and problem solving through facilitating innovation through the empowerment of local ideas.
► Attitude and the wellbeing of a community is critical to the success of the regional development programs.
Source: Purbrick, H. 2017, Big Sky Ideas, https://bigskyideas.com.au/what-we-do.
1 Terms of reference 7 Opportunities for efficiency ...2 Glossary 8 Cost of efficiency measures3 Executive summary 9 Principles for negating adv ...4 Introduction 10 A program to achieve 450 ...5 Potential socio-economic ... 11 Appendices6 Program design

Analysis of efficiency measures in the Murray-Darling Basin: Opportunities to recover 450GL in additional environmental water through efficiency measures by 2024, with neutral or positive socio-economic impacts | Page 274 of 307
19 January 2018 | Final Report
Appendix D: Frameworks and current programs for Chapter 9 11 Appendices
Source: Department of Industry, Innovation and Science 2017, Building Better Regions Fund (BBRF), https://www.business.gov.au/assistance/building-better-regions-fund
Historical investment by DIRD in regional development had a focus on grants to local business and infrastructure, with the aspiration of building jobs and new opportunities for regional economies.
Program Design
The $297.7 million Building Better Regions Fund aims to support the creation of jobs, drive economic growth and build stronger regional communities into the future.
There are 2 streams available under the fund: Community Investment Scheme (funding community building activities such as new/expanded local events, strategic regional plans, as well as building leadership and capability) or the Infrastructure Projects Stream (supporting new infrastructure or the upgrade/extension of existing).
Eligibility under either stream is determined by location (outside a capital city), seeking a grant of $5000 to $10 million, evidence of co-funding contribution and prospective completion within 12 months.
Building Better Regions Fund, DIRD Conclusions► Flexible approach allowing for communities to
decide what investment was required.
► Infrastructure grants as option for development.
► Community projects could be primarily based on a business or LGA area, not necessarily through a regional approach.
1 Terms of reference 7 Opportunities for efficiency ...2 Glossary 8 Cost of efficiency measures3 Executive summary 9 Principles for negating adv ...4 Introduction 10 A program to achieve 450 ...5 Potential socio-economic ... 11 Appendices6 Program design

Analysis of efficiency measures in the Murray-Darling Basin: Opportunities to recover 450GL in additional environmental water through efficiency measures by 2024, with neutral or positive socio-economic impacts | Page 275 of 307
19 January 2018 | Final Report
Appendix D: Frameworks and current programs for Chapter 9 11 Appendices
The MDBREDP was established in 2014 to assist Basin communities. The commitment of $72.65 million in funding from the from the Australian Government is to support the economic base of communities most likely to be impacted by the implementation of the Basin Plan, with encouraged development, diversification initiatives and partnerships.1
Program DesignEach State holds individual responsibility for the funds allocated, with the NSW DPI, running the program over two streams2:► The Regional Business Investment Fund ($10m)
► Over two rounds, provided grants to business, local government, NSW government agencies, not-for-profits and other organisations for business investment projects
► Projects funded included business expansion, establishment and infrastructure projects.► The Energise Enterprise Funds ($4.1m)
► Over 40 successfully funded projects across two rounds► Facilitated economic development with diversification and support of the economic base of regional
communities with funding to NSW local councils and not-for profit organisations► Types of projects included small economic development projects, skills capability building projects
and economic development studies with actionable and supported outcomes.Whereas, Victoria has developed a program for irrigators who are part of the GMW Strategic Connections Plan areas. The initial trial of this program is designed to assist irrigators:
► Be better informed about decision making relating to their farm enterprise► To determine farm enterprise goals and preferred mix of irrigated land and dryland► To identify preferred farm configuration to achieve maximum benefits from irrigation modernisation► Identify the need for any potential farm irrigation upgrades► Better understand how much of their property to connect to the modernised G-MW backbone.
Commonly known as ‘Plan to Farm’, this program is being trialled across the State3.
Conclusions
► Enable skill development programs as decided by the local community.
► To build capacity of local community.
► Ensure communities with different measures of resilience, are approached with measures appropriate to their needs.
► Importance of equitable distribution.
► Business development training to match technology upgrades and new technical nature of farming.
Outcomes
The NSW DPI funding has had positive outcomes for those involved. However, there was criticism of the perceived inequality in the application process. The extent of adverse impacts was not taken into account in the eligibility criteria. Some communities who were able to gain access to funding, while benefiting, were in some instances better-off from the baseline than others who missed out.
The Victorian program trial had promising results and is presently in the process of expansion.
1 Department of Infrastructure and Regional Development n.d., The Murray-Darling Basin Regional Economic Diversification Program, http://regional.gov.au/regional/programs/murray-darling-basin-regional-economic-diversification.aspx. 2 New South Wales Department of Industry n.d., Strengthening the Murray-Darling Basin economy, https://www.industry.nsw.gov.au/business-and-industry-in-nsw/assistance-and-support/strengthening-the-murray-darling-basin-economy. 3 State Government of Victoria n.d., Innovative Farming Future Farm Connect Workbook Trial, https://www.tenders.vic.gov.au/tenders/tender/display/tender-details.do?id=5237&action=display-tender-details.
The Murray-Darling Basin Regional Economic Diversification Programme (MDBREDP)
1 Terms of reference 7 Opportunities for efficiency ...2 Glossary 8 Cost of efficiency measures3 Executive summary 9 Principles for negating adv ...4 Introduction 10 A program to achieve 450 ...5 Potential socio-economic ... 11 Appendices6 Program design

Analysis of efficiency measures in the Murray-Darling Basin: Opportunities to recover 450GL in additional environmental water through efficiency measures by 2024, with neutral or positive socio-economic impacts | Page 276 of 307
19 January 2018 | Final Report
Appendix E: Summary table of on-farm efficiency measures11 Appendices
The below table presents a summary for which impacts are applicable for the eight on-farm project types. Note that impacts are considered in isolation with respect to other on-farm impacts.
Impact Surface to drip
Surface to pivot/move
Reconfigure surface
Improve application
Improve storage and delivery
Soil moisture monitoring Mulching
Water efficient crops
Water efficiency gains
Funding for on-farm work
Entitlements transfer
Labour productivity change
Better application of water to crop
Better distribution of water to crop
Increase crop quality
Ability to plant higher value crops
Better ability to manage water
Replacement cost
Increased reliance on variable input costs (electricity and diesel)
Source: EY stakeholder consultation and analysis.
1 Terms of reference 7 Opportunities for efficiency ...2 Glossary 8 Cost of efficiency measures3 Executive summary 9 Principles for negating adv ...4 Introduction 10 A program to achieve 450 ...5 Potential socio-economic ... 11 Appendices6 Program design

Analysis of efficiency measures in the Murray-Darling Basin: Opportunities to recover 450GL in additional environmental water through efficiency measures by 2024, with neutral or positive socio-economic impacts | Page 277 of 307
19 January 2018 | Final Report
Appendix F: Impact Mapping11 Appendices
The impacts of water efficiency measures have been identified through the use of impact mapping. These trace the socio-economic impacts of on and off-farm water efficiency measures to understand the cause and effect of activities. However they do not demonstrate the nature (positive, adverse or neutral) of impacts, which varies depending on circumstances. This Appendix outlines the detailed mapping.
Source: EY analysis.*Includes changes to network configuration, water delivery management, employment and water quality.
Off-farm efficiency measures
1.Pipes installation and/or channel remediation
2.Channel automation
3.Rationalisation
4. Installation of stock and domestic pipelines
By
proj
ect t
ype
Entitlement transfer
Decreased transmission losses
Project specific impacts*
Individual farm
Irrigation network
Community impact Basin impact
Infrastructure funding
1.Water efficiency gains
2. Infrastructure funding
3.Entitlements transfer
4.Labour productivity changes
5.Non-labour productivity changes
By
proj
ect i
mpa
ct
Water volume demanded
Project specific impacts
Employment
Participant profitability
Irrigation network
Community impact Basin impact
Production
Other irrigator profitability
On-farm efficiency measures
1 Terms of reference 7 Opportunities for efficiency ...2 Glossary 8 Cost of efficiency measures3 Executive summary 9 Principles for negating adv ...4 Introduction 10 A program to achieve 450 ...5 Potential socio-economic ... 11 Appendices6 Program design

Analysis of efficiency measures in the Murray-Darling Basin: Opportunities to recover 450GL in additional environmental water through efficiency measures by 2024, with neutral or positive socio-economic impacts | Page 278 of 307
19 January 2018 | Final Report
Appendix F: Impact Mapping11 Appendices
Positive impact Neutral impact Adverse impact
On-farm: Impact of unchanged output and decreased demand for water on the marginal price of temporary water
1.Ke
ep o
utpu
t the
sam
e (d
ecre
ased
dem
and
for w
ater
)
Scenario Other irrigator impactOn-farm impact Basin outcomeCommunity outcome
No retained savings
Retained savings
Price of water falls at the margin; decreasing input costs for buyers. This increases agricultural production for lower value users. Revenue for sellers is also reduced.
Irrigators retain some of their water productivity and can therefore reduce their demand for water or will be able to sell more water.
Agricultural production increases from lower value users (e.g. dairy and rice). This may increase other economic activity in these communities. However, sellers receive less revenue so may decrease their spending.
Increase in agricultural production. Increase or decrease in economic activity and population (or stable)
The entitlement transfer completely offsets the water productivity increase, resulting in unchanged water required for production. However, less water is still required to be delivered at the farm gate.
Price of water is unchanged at the margin.
Decrease water demanded at the farm gate
Decrease variable network costs, increasing profits
Potential increase to other network users, if variable costs have a fixed element
Decrease or same community spend
Increase community spend
Decrease or same economic activity
Increase economic activity
Increased profit (same output, input costs fall)
or
Source: EY analysis.
1 Terms of reference 7 Opportunities for efficiency ...2 Glossary 8 Cost of efficiency measures3 Executive summary 9 Principles for negating adv ...4 Introduction 10 A program to achieve 450 ...5 Potential socio-economic ... 11 Appendices6 Program design

Analysis of efficiency measures in the Murray-Darling Basin: Opportunities to recover 450GL in additional environmental water through efficiency measures by 2024, with neutral or positive socio-economic impacts | Page 279 of 307
19 January 2018 | Final Report
Appendix F: Impact Mapping11 Appendices
No retained savings
Retained savings: high output
increase
Price of water falls at the margin; decreasing input costs for buyers. This increases agricultural production. Revenue for sellers is also reduced.
Irrigators retain some of their water productivity and can therefore reduce their demand for water or will be able to sell more water, and increase output.
Agricultural production increases from all irrigators. This may increase other economic activity. However, sellers receive less revenue so may decrease their spending.
Increase in agricultural production. Increase or decrease in economic activity and population (or stable)
The entitlement transfer completely offsets the water productivity increase. But with higher output water demand increases relative to Case 1, (but less than the counterfactual). Irrigators will buy more water or sell less.
Decrease water demanded at the farm gate
Decrease variable network costs, increasing profits
Potential increase to other network users, if variable costs have a fixed element
Decrease or same community spend
Increase community spend Increase economic activity
Decrease or same economic activity
Increased profit (same output, input costs fall)
Or
Retained savings: low output increase
As above, the higher output still increases water demand relative to Case 1. However, with retained savings the water market impact is reduced.
Price of water increases at the margin; increases input costs for buyers. Total agricultural production increases (water flows to more productive users, who have higher willingness to pay), but the commodity mix may change. Revenue for sellers is increased.
Agricultural production increases from the irrigator but decreases from lower value users (e.g. dairy and rice). This may change economic activity in these communities. However, sellers receive more revenue so may increase spending.
Net increase in agricultural production. Increase or decrease in economic activity and population (or stable)
Source: EY analysis.
Positive impact Neutral impact Adverse impact
On-farm: Impact of increased output and decreased demand for water on the marginal price of temporary water
Scenario Other irrigator impactOn-farm impact Basin outcomeCommunity outcome
2.In
crea
se o
utpu
t (de
crea
sed
dem
and
for w
ater
)1 Terms of reference 7 Opportunities for efficiency ...2 Glossary 8 Cost of efficiency measures3 Executive summary 9 Principles for negating adv ...4 Introduction 10 A program to achieve 450 ...5 Potential socio-economic ... 11 Appendices6 Program design

Analysis of efficiency measures in the Murray-Darling Basin: Opportunities to recover 450GL in additional environmental water through efficiency measures by 2024, with neutral or positive socio-economic impacts | Page 280 of 307
19 January 2018 | Final Report
Appendix F: Impact Mapping11 Appendices
No retained savings
Retained savings
The entitlement transfer completely offsets the water productivity increase. But with higher output water demand increases relative to the counterfactual). Irrigators will buy more water or sell less.
Decrease or same economic activity
Increase variable network costs, reducing profits
Increase water demanded at the farm gate; this is more than offset by decreased water demanded by other users
Decrease or same community spend
Potential change to other network users, if variable costs have a fixed element
Or
Price of water increases at the margin; increases input costs for buyers. Total agricultural production increases (water flows to more productive users, who have higher willingness to pay), but the commodity mix may change. Revenue for sellers is increased.
Net increase in agricultural production, but potential change in commodity mix. Increase or decrease in economic activity and population (or stable)As above, the higher
output still increases water demand relative to the counterfactual. However, with retained savings the water market impact is reduced.
Increase or same community spend
Increase or same economic activity
Increased or same profit (increased output and input costs)
Agricultural production increases from the irrigator but may decrease from lower value users (e.g. dairy and rice). This may change economic activity in these communities. However, sellers receive more revenue so may increase spending.
Source: EY analysis.
Positive impact Neutral impact Adverse impact
On-farm: Impact of increased output and demand for water on the marginal price of temporary water
Scenario Other irrigator impactOn-farm impact Basin outcomeCommunity outcome
3.In
crea
se o
utpu
t (in
crea
sed
dem
and
for w
ater
)1 Terms of reference 7 Opportunities for efficiency ...2 Glossary 8 Cost of efficiency measures3 Executive summary 9 Principles for negating adv ...4 Introduction 10 A program to achieve 450 ...5 Potential socio-economic ... 11 Appendices6 Program design
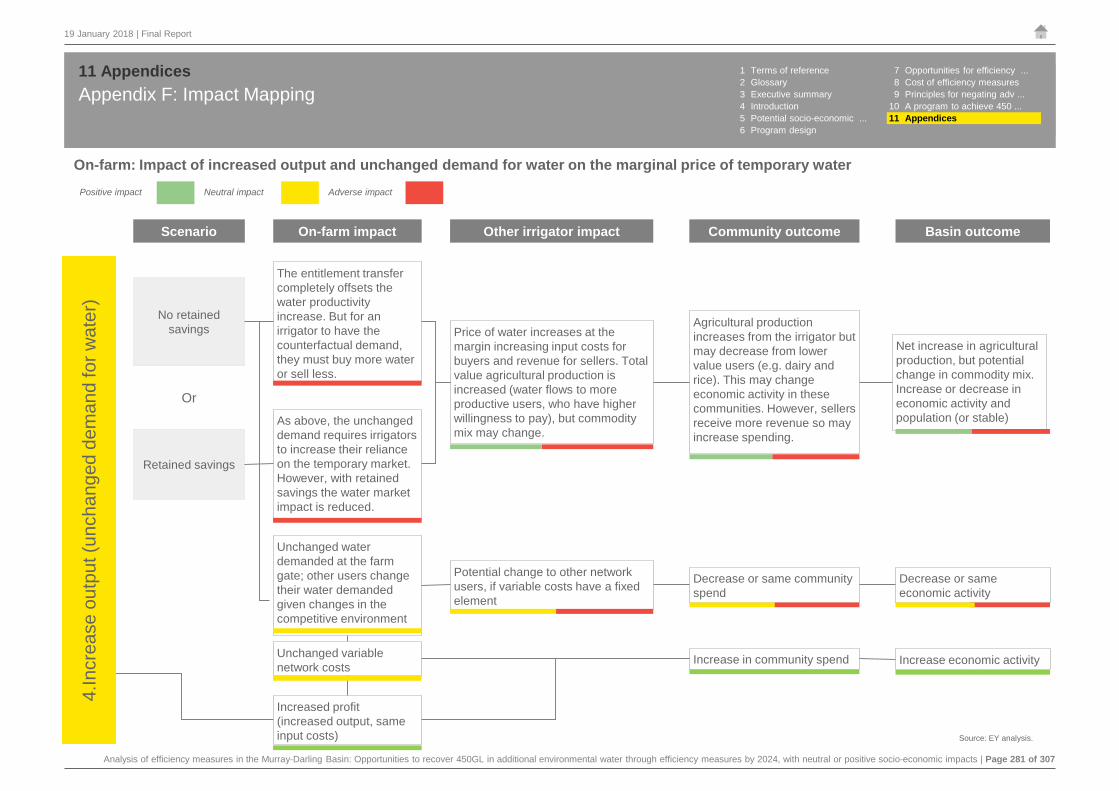
Analysis of efficiency measures in the Murray-Darling Basin: Opportunities to recover 450GL in additional environmental water through efficiency measures by 2024, with neutral or positive socio-economic impacts | Page 281 of 307
19 January 2018 | Final Report
Appendix F: Impact Mapping11 Appendices
No retained savings
Retained savings
The entitlement transfer completely offsets the water productivity increase. But for an irrigator to have the counterfactual demand, they must buy more water or sell less.
Unchanged water demanded at the farm gate; other users change their water demanded given changes in the competitive environment
Unchanged variable network costs
Potential change to other network users, if variable costs have a fixed element
Decrease or same community spend
Increase in community spend
Decrease or same economic activity
Increase economic activity
Increased profit (increased output, same input costs)
OrAs above, the unchanged demand requires irrigators to increase their reliance on the temporary market. However, with retained savings the water market impact is reduced.
Price of water increases at the margin increasing input costs for buyers and revenue for sellers. Total value agricultural production is increased (water flows to more productive users, who have higher willingness to pay), but commodity mix may change.
Agricultural production increases from the irrigator but may decrease from lower value users (e.g. dairy and rice). This may change economic activity in these communities. However, sellers receive more revenue so may increase spending.
Net increase in agricultural production, but potential change in commodity mix. Increase or decrease in economic activity and population (or stable)
Source: EY analysis.
Positive impact Neutral impact Adverse impact
On-farm: Impact of increased output and unchanged demand for water on the marginal price of temporary water
Scenario Other irrigator impactOn-farm impact Community outcome
4.In
crea
se o
utpu
t (un
chan
ged
dem
and
for w
ater
)
Basin outcome
1 Terms of reference 7 Opportunities for efficiency ...2 Glossary 8 Cost of efficiency measures3 Executive summary 9 Principles for negating adv ...4 Introduction 10 A program to achieve 450 ...5 Potential socio-economic ... 11 Appendices6 Program design

Analysis of efficiency measures in the Murray-Darling Basin: Opportunities to recover 450GL in additional environmental water through efficiency measures by 2024, with neutral or positive socio-economic impacts | Page 282 of 307
19 January 2018 | Final Report
Appendix F: Impact Mapping11 Appendices
1. Increase labour demand to increase output
Increase community spend from additional labour wages
Increase labour and general economy
Increase economic activity / population growth or stable
Increased or same profit (more output but higher
wages costs)
Increase or same community spend Increase or same labour and general economy
Increase or same economic activity / population growth or
stable
2.Decrease labour demand such that output is the
same or increased
Decrease in community spend from reduced labour wages
Decrease labour and general economy
Decrease economic activity / population stable or fall
Increased profit (lower wages cost for at least the
same output)Increase community spend Increase labour and general
economy Increase economic activity /
population growth stable or fall
3.Unchanged labour demand so output
increasesIncreased profit
(unchanged wages cost with more output)
Increase community spend Increase labour and general economy
Increase economic activity / population growth or stable
Unchanged community spend
4.Unchanged net labour demand so output
increases, but workers require increased
technical proficiancy Increased or same profit (wages may increase for
more skilled worker)
Increase or same community spend, potential structural change if
upskilling
Increase or same labour and general economy
Increase or same economic activity / population growth or
stable
Increase or same in community spend, depending on whether there
are additional labour wagesIncrease or same labour and
general economy
Increase or same economic activity / population growth or
stable
Labourer
Labourer
Labourer
Labourer
Irrigator
Irrigator
Irrigator
Irrigator
Potential reduction in antisocial hours
OR
OR
OR
Source: EY analysis.
Positive impact Neutral impact Adverse impact
On-farm: Impact of changing labour requirements
Labour demand On-farm outcome Community impact Basin outcomeCommunity outcome
Cha
nge
in re
quire
d la
bour
1 Terms of reference 7 Opportunities for efficiency ...2 Glossary 8 Cost of efficiency measures3 Executive summary 9 Principles for negating adv ...4 Introduction 10 A program to achieve 450 ...5 Potential socio-economic ... 11 Appendices6 Program design

Analysis of efficiency measures in the Murray-Darling Basin: Opportunities to recover 450GL in additional environmental water through efficiency measures by 2024, with neutral or positive socio-economic impacts | Page 283 of 307
19 January 2018 | Final Report
Appendix F: Impact Mapping11 Appendices
1.Better application of water to crops
Yield may increase, increased or same profit
Increase or same in community spend and agricultural production
Increase or same labour and general economy
Agricultural production may increase. Increase or same economic activity/ population
2.Better distribution of water to crop
3.Ability to plant higher value crops
Different crop, increased or same profit
4.Crops may be fed more nutrients
Better quality crop, increased or same profit
5.Crops are optimally watered
6.Better ability to manage water Increased or same profit
7.Potential decrease in infrastructure useful life if modernised infrastructure requires more frequent replacement
Relatively more frequent infrastructure spending
Increase in community spend on infrastructure, potentially decreased spending on other goods
Potential impact on labour and general economy
Potential change in economic activity and population
Source: EY analysis.
Positive impact Neutral impact Adverse impact
On-farm: Project-specific on-farm impacts
Oth
er in
put i
mpa
cts
On-farm change On-farm impact Community impact Basin outcomeCommunity outcome
1 Terms of reference 7 Opportunities for efficiency ...2 Glossary 8 Cost of efficiency measures3 Executive summary 9 Principles for negating adv ...4 Introduction 10 A program to achieve 450 ...5 Potential socio-economic ... 11 Appendices6 Program design

Analysis of efficiency measures in the Murray-Darling Basin: Opportunities to recover 450GL in additional environmental water through efficiency measures by 2024, with neutral or positive socio-economic impacts | Page 284 of 307
19 January 2018 | Final Report
Appendix F: Impact Mapping11 Appendices
Construction / installation of new system or supply paid by Commonwealth
Increase in community spendIncrease labour and general economy. Potential increase in industry diversification, leading to increased resilience
8. Increased reliance on variable input costs (such as water prices, electricity or diesel). Reduced ability to on-sell water due to entitlements transfer, decreasing flexibility.
Change in profit depends on reliance and direction of periodic costs as well as other infrastructure purchased to decrease reliance (e.g. solar panels)
Change in community spend Change in labour and general economy
Increased uncertainty (profits), potentially a decreased ability to plan
Transfer water entitlements to the Commonwealth for environmental purposes
Increase in environmental water
More environmental water could allow diversification into other industries (for some communities), such as tourism.
Increase or same labour and general economy. Potential increase in industry diversification and resilience
Note: the other impacts of transferring water entitlements are considered in the changing output/water demanded scenarios, as they primarily relate to the potential impact on water prices.
Increase labour (potentially temporary). Increase community
spend from additional labour wages
Source: EY analysis.
On-farm change On-farm impact Community impact Basin outcomeCommunity outcome
Increase economic activity / population growth or stable
Change economic activity / population
Increase or same economic activity /population increase or stable
Positive impact Neutral impact Adverse impact
Other common on-farm impacts: construction/installation and the transfer of water entitlements to the Commonwealth
Oth
er c
omm
on im
pact
sO
ther
inpu
t im
pact
s1 Terms of reference 7 Opportunities for efficiency ...2 Glossary 8 Cost of efficiency measures3 Executive summary 9 Principles for negating adv ...4 Introduction 10 A program to achieve 450 ...5 Potential socio-economic ... 11 Appendices6 Program design
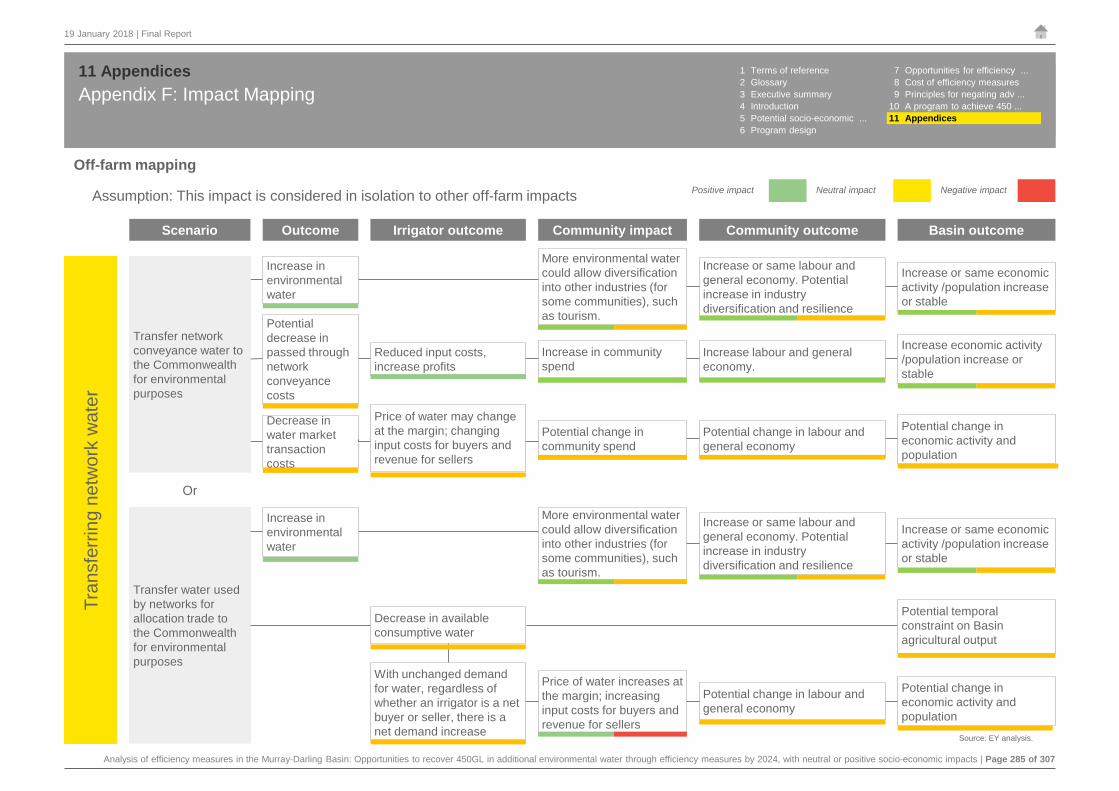
Analysis of efficiency measures in the Murray-Darling Basin: Opportunities to recover 450GL in additional environmental water through efficiency measures by 2024, with neutral or positive socio-economic impacts | Page 285 of 307
19 January 2018 | Final Report
Appendix F: Impact Mapping11 Appendices
Community impact Basin outcomeIrrigator outcomeScenario
Transfer water used by networks for allocation trade to the Commonwealth for environmental purposes
Increase in environmental water
Increase in environmental water
Reduced input costs, increase profits
Increase labour and general economy.
Increase economic activity /population increase or stable
More environmental water could allow diversification into other industries (for some communities), such as tourism.
Increase or same economic activity /population increase or stable
Potential decrease in passed through network conveyance costs
Or
Outcome Community outcome
Increase or same labour and general economy. Potential increase in industry diversification and resilience
Price of water may change at the margin; changing input costs for buyers and revenue for sellers
Potential change in labour and general economy
Potential change in community spend
Increase in community spend
Decrease in water market transaction costs
Potential change in economic activity and population
More environmental water could allow diversification into other industries (for some communities), such as tourism.
Increase or same economic activity /population increase or stable
Increase or same labour and general economy. Potential increase in industry diversification and resilience
Price of water increases at the margin; increasing input costs for buyers and revenue for sellers
With unchanged demand for water, regardless of whether an irrigator is a net buyer or seller, there is a net demand increase
Potential change in labour and general economy
Potential change in economic activity and population
Potential temporal constraint on Basin agricultural output
Decrease in available consumptive water
Assumption: This impact is considered in isolation to other off-farm impacts
Transfer network conveyance water to the Commonwealth for environmental purposes
Source: EY analysis.
Off-farm mappingPositive impact Neutral impact Negative impact
Tran
sfer
ring
netw
ork
wat
er1 Terms of reference 7 Opportunities for efficiency ...2 Glossary 8 Cost of efficiency measures3 Executive summary 9 Principles for negating adv ...4 Introduction 10 A program to achieve 450 ...5 Potential socio-economic ... 11 Appendices6 Program design

Analysis of efficiency measures in the Murray-Darling Basin: Opportunities to recover 450GL in additional environmental water through efficiency measures by 2024, with neutral or positive socio-economic impacts | Page 286 of 307
19 January 2018 | Final Report
Appendix F: Impact Mapping11 Appendices
Other common impacts - off-farm mapping
Reduced (partly or fully) need for delivery water decreases run-offs to the environment
Reduced beneficial run-offs to irrigators causes an effective increase in input costs
Irrigator does not waste water, resulting in a net cost savings.
Increased input costs, decreased profits
Decreased labour and general economy.
Decrease economic activity /population decrease or stable
Decrease in environmental water
Less environmental water could reduce diversification into other industries, such as tourism. However, this water may not have been flowing into environmentally significant sites.
Decrease or same economic activity /population fall or stable
Decrease or same labour and general economy. Potential decrease in industry diversification and resilience
Decrease in community spending
Decreased input costs, increased profits
Increased labour and general economy.
Increase economic activity /population growth or stable
Increase in community spending
Construction / installation of new system or supply paid by Commonwealth
Increase in community spend
Increase labour and general economy. Potential increase in industry diversification, leading to increased resilience
Increase economic activity / population growth or stable
Increase labour (potentially temporary). Increase community spend from additional labour wages Source: EY analysis.
Community impact Basin outcomeIrrigator outcomeScenario Outcome Community outcome
Con
stru
ctio
nR
educ
ed ru
n-of
f
Reduced (partly or fully) need for delivery water decreases run-offs to irrigators
Assumption: This impact is considered in isolation to other off-farm impacts Positive impact Neutral impact Negative impact
1 Terms of reference 7 Opportunities for efficiency ...2 Glossary 8 Cost of efficiency measures3 Executive summary 9 Principles for negating adv ...4 Introduction 10 A program to achieve 450 ...5 Potential socio-economic ... 11 Appendices6 Program design

Analysis of efficiency measures in the Murray-Darling Basin: Opportunities to recover 450GL in additional environmental water through efficiency measures by 2024, with neutral or positive socio-economic impacts | Page 287 of 307
19 January 2018 | Final Report
Appendix F: Impact Mapping11 Appendices
Irrigation network impact / outcome Community outcome Basin outcomeIrrigator impact
1.Potential increase in reliability of water delivery
Increased ability to manage water improves irrigator planning certainty, may influence production decisions. Increased or same profit.
Increase or same labour and general economy
Increase or same economic activity / population growth or stable
2.Potential increase in the number of water deliveries per year
Increased cost of more frequent water delivery passed through to irrigators, but they also have an increased certainty around planning
As above, but irrigator must take into account additional input costs of additional deliveries. Increased or same profit
3.Reduced maintenance requirements
Decreased maintenance costs passed through
Reduced input costs, increased profits
Increase labour and general economy
Increase economic activity / population growth or stable
Increased water quality Reduced input costs (filtration), increased profits
Decreased OHS risk of person falling into uncovered channel
Source: EY analysis.
Off-farm mapping: project specific - pipes
Assumption: This impact is considered in isolation to other off-farm impacts
Inst
allin
g/co
nstru
ctin
g an
d/or
cha
nnel
rem
edia
tion,
re
plac
ing/
upgr
adin
g pu
mps
4.Covered pipes instead of open channels
Positive impact Neutral impact Adverse impact
1 Terms of reference 7 Opportunities for efficiency ...2 Glossary 8 Cost of efficiency measures3 Executive summary 9 Principles for negating adv ...4 Introduction 10 A program to achieve 450 ...5 Potential socio-economic ... 11 Appendices6 Program design
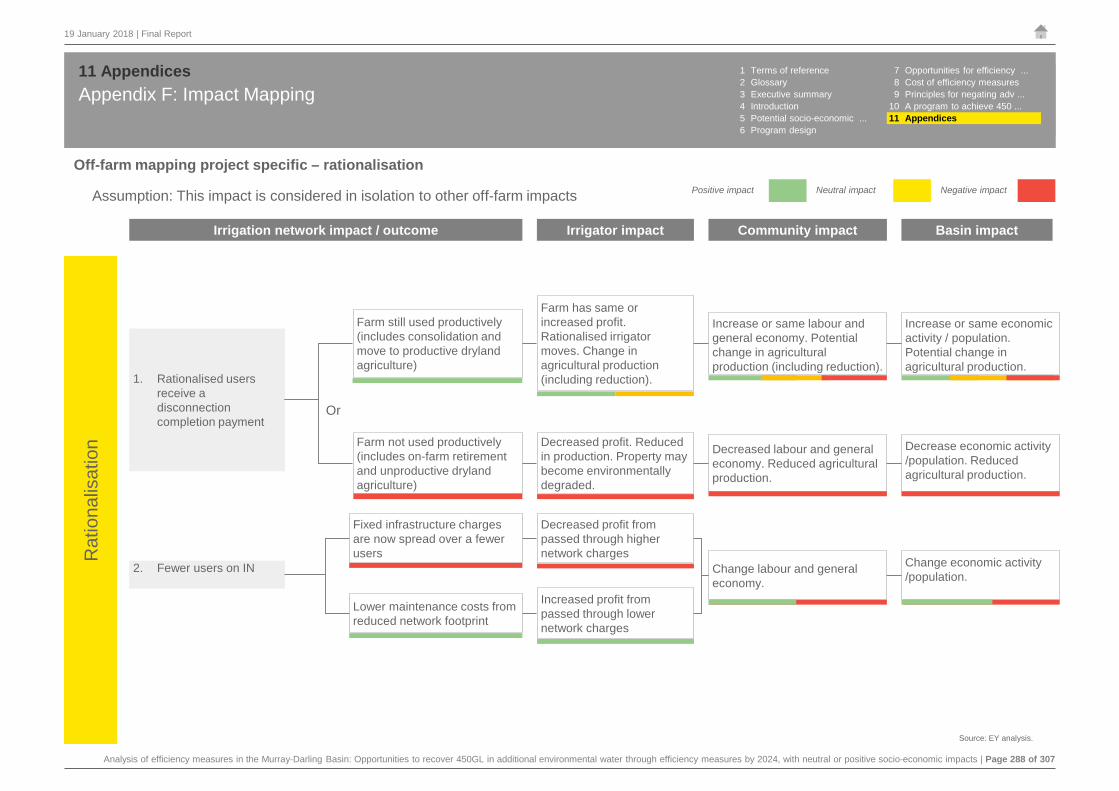
Analysis of efficiency measures in the Murray-Darling Basin: Opportunities to recover 450GL in additional environmental water through efficiency measures by 2024, with neutral or positive socio-economic impacts | Page 288 of 307
19 January 2018 | Final Report
Appendix F: Impact Mapping11 Appendices
Off-farm mapping project specific – rationalisation
1. Rationalised users receive a disconnection completion payment
2. Fewer users on IN
Farm still used productively (includes consolidation and move to productive dryland agriculture)
Farm not used productively (includes on-farm retirement and unproductive dryland agriculture)
Fixed infrastructure charges are now spread over a fewer users
Lower maintenance costs from reduced network footprint
Decreased profit from passed through higher network charges
Increased profit from passed through lower network charges
Change labour and general economy.
Change economic activity /population.
Farm has same or increased profit. Rationalised irrigator moves. Change in agricultural production (including reduction).
Increase or same labour and general economy. Potential change in agricultural production (including reduction).
Decreased profit. Reduced in production. Property may become environmentally degraded.
Decreased labour and general economy. Reduced agricultural production.
Decrease economic activity /population. Reduced agricultural production.
Increase or same economic activity / population. Potential change in agricultural production.
Or
Source: EY analysis.
Assumption: This impact is considered in isolation to other off-farm impacts
Irrigation network impact / outcome Community impact Basin impactIrrigator impact
Positive impact Neutral impact Negative impact
Rat
iona
lisat
ion
1 Terms of reference 7 Opportunities for efficiency ...2 Glossary 8 Cost of efficiency measures3 Executive summary 9 Principles for negating adv ...4 Introduction 10 A program to achieve 450 ...5 Potential socio-economic ... 11 Appendices6 Program design

Analysis of efficiency measures in the Murray-Darling Basin: Opportunities to recover 450GL in additional environmental water through efficiency measures by 2024, with neutral or positive socio-economic impacts | Page 289 of 307
19 January 2018 | Final Report
Appendix F: Impact Mapping11 Appendices
Off-farm mapping project specific – automation and stock and domestic
2.Change in irrigation network labour requirements
Unchanged labour demand
Unchanged labour demand; required labour changes to semi-skilled
Increased profit from passed through decreased operating costs
Increase in community spend Increase economic activity / population growth or stable
Unchanged community spend
Increased flexibility
1. Increased timeliness of water delivery orders
Increased or same profit Increase or same in community spend
Increase or same economic activity / population growth or stable
Increase, decrease or same economic activity / population growth, stable or fall
Increase, decrease or same in community spend
Increase, decrease or same profit
Greater exposure to variable network input costs
Decrease in community spend from reduced labour wages
Decrease economic activity / population stable or fall
Labourer
Increase or same community spend; depending on whether there are additional labour wages
Increase or same economic activity / population growth or stable
Lifestyle improvement; users have a regular supply of water.
Or
Or
Replacing open channel with pipeline
Source: EY analysis.
Stoc
k an
d do
mes
ticC
hann
el g
ates
and
aut
omat
ion
Irrigation network impact / scenario Community impact Basin outcomeIrrigator impact
Positive impact Neutral impact Adverse impactAssumption: This impact is considered in isolation to other off-farm impacts
Decreased labour demand
1 Terms of reference 7 Opportunities for efficiency ...2 Glossary 8 Cost of efficiency measures3 Executive summary 9 Principles for negating adv ...4 Introduction 10 A program to achieve 450 ...5 Potential socio-economic ... 11 Appendices6 Program design

Analysis of efficiency measures in the Murray-Darling Basin: Opportunities to recover 450GL in additional environmental water through efficiency measures by 2024, with neutral or positive socio-economic impacts | Page 290 of 307
19 January 2018 | Final Report
Appendix G: Socio-economic impact pathway 1: Sensitivity testing11 Appendices
Sensitivity to short-term increases in production
The base case assumes a short-term increase in production of 30% based on the average proportion of water savings retained. If short-term production is increased by 50% (through a greater level of retained savings or increases in on-farm productivity) then the NPV of increased production is between $114 and $723 million for rice and fruit and nut production respectively.
If short-term production is not increased then the cost of foregone future production outweighs the benefit of capital for fruit and nut producers and results in reduced production in NPV terms of $330 million. For rice producers, the benefit of the cost of capital foregone capital equals the cost of future production foregone and therefore has there no net impact.
Short term production needs to increase by more than 0 to 16% (for rice and fruit and nut producers respectively) for a positive net benefit to occur.
Sensitivity to short-term increase in production
Sensitivity testing
Partial sensitivity testing has been undertaken across the main variables for the analysis - the discount rate, the short-term increase in production under infrastructure upgrades, the cost of capital and the proportion of irrigators estimated to have upgraded in the absence of Commonwealth funding. The sensitivity testing alters these assumptions independently to identify the impact that changes to these variables have on the results of the analysis.
Sensitivity to discount rate
The Office of Best Practice Regulation recommends the use of a real discount rate of 7%. Hence this has been used for the base case estimate. In addition, the Office of Best Practice Regulation recommends the use of real discount rates of 3 and 10% to test the sensitivity of costs and benefits to changes in interest rates.
Since the analysis calculates the NPV of all costs and benefits, changes to the discount rate alter the current value of future costs and benefits. As can be seen in the table below, a lower discount rate (3%) increases the NPV of production, while a higher discount rate reduces the NPV of production. Importantly, with a reduced discount rate, the lower end of the range (rice production) increases more than the higher end of the range (fruit and nut production) as the cost of capital offsets the additional future production for rice growers and since these benefits occur in future years they are discounted by less (increasing NPV). In relation to fruit production, the value of future production is greater than the cost of capital in future years at the same time that total benefits outweigh costs, so while the NPV increases, it does so by a lesser extent.
Sensitivity to discount rates
Description Financial Benefit (NPV)
Base case – real discount rate 7% $70-$302 million
Real discount rate 3% $104-$308 million
Real discount rate 10% $53-$276 million
Description Financial Benefit (NPV)
Base case – short-term production increased by 30% $70-$302 million
Short term production increased by 50% $114-$723 million
Short term production not increased -$330- $0 million
Source: EY analysis.
Source: EY analysis.
1 Terms of reference 7 Opportunities for efficiency ...2 Glossary 8 Cost of efficiency measures3 Executive summary 9 Principles for negating adv ...4 Introduction 10 A program to achieve 450 ...5 Potential socio-economic ... 11 Appendices6 Program design
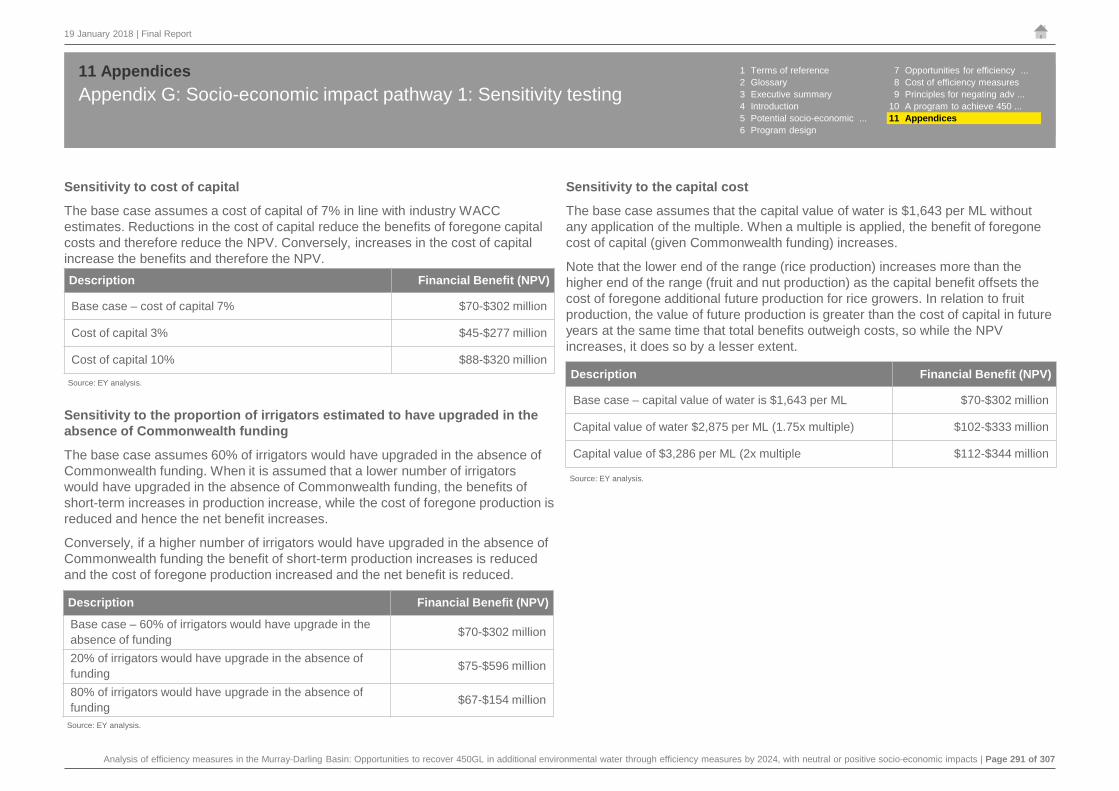
Analysis of efficiency measures in the Murray-Darling Basin: Opportunities to recover 450GL in additional environmental water through efficiency measures by 2024, with neutral or positive socio-economic impacts | Page 291 of 307
19 January 2018 | Final Report
Appendix G: Socio-economic impact pathway 1: Sensitivity testing11 Appendices
Sensitivity to the capital cost
The base case assumes that the capital value of water is $1,643 per ML without any application of the multiple. When a multiple is applied, the benefit of foregone cost of capital (given Commonwealth funding) increases.
Note that the lower end of the range (rice production) increases more than the higher end of the range (fruit and nut production) as the capital benefit offsets the cost of foregone additional future production for rice growers. In relation to fruit production, the value of future production is greater than the cost of capital in future years at the same time that total benefits outweigh costs, so while the NPV increases, it does so by a lesser extent.
Sensitivity to cost of capital
The base case assumes a cost of capital of 7% in line with industry WACC estimates. Reductions in the cost of capital reduce the benefits of foregone capital costs and therefore reduce the NPV. Conversely, increases in the cost of capital increase the benefits and therefore the NPV.
Sensitivity to the proportion of irrigators estimated to have upgraded in the absence of Commonwealth funding
The base case assumes 60% of irrigators would have upgraded in the absence of Commonwealth funding. When it is assumed that a lower number of irrigators would have upgraded in the absence of Commonwealth funding, the benefits of short-term increases in production increase, while the cost of foregone production is reduced and hence the net benefit increases.
Conversely, if a higher number of irrigators would have upgraded in the absence of Commonwealth funding the benefit of short-term production increases is reduced and the cost of foregone production increased and the net benefit is reduced.
Description Financial Benefit (NPV)
Base case – cost of capital 7% $70-$302 million
Cost of capital 3% $45-$277 million
Cost of capital 10% $88-$320 million
Description Financial Benefit (NPV)
Base case – 60% of irrigators would have upgrade in the absence of funding $70-$302 million
20% of irrigators would have upgrade in the absence of funding $75-$596 million
80% of irrigators would have upgrade in the absence of funding $67-$154 million
Source: EY analysis.
Source: EY analysis.
Description Financial Benefit (NPV)
Base case – capital value of water is $1,643 per ML $70-$302 million
Capital value of water $2,875 per ML (1.75x multiple) $102-$333 million
Capital value of $3,286 per ML (2x multiple $112-$344 million
Source: EY analysis.
1 Terms of reference 7 Opportunities for efficiency ...2 Glossary 8 Cost of efficiency measures3 Executive summary 9 Principles for negating adv ...4 Introduction 10 A program to achieve 450 ...5 Potential socio-economic ... 11 Appendices6 Program design

Analysis of efficiency measures in the Murray-Darling Basin: Opportunities to recover 450GL in additional environmental water through efficiency measures by 2024, with neutral or positive socio-economic impacts | Page 292 of 307
19 January 2018 | Final Report
Appendix H: Impact on future production11 Appendices
Land area = 10 ha
Water use per ha = 10ML/ha
Total water use = 100ML
Inputs Production
Tonnes per ha = 10 T/ha
Total tonnes = 100 T
Production in absence of upgrade
10haland
100MLinput
100T for the irrigator
+ =
Land area = 10 ha
Water use per ha = 8ML/ha (water productivity)
Total water use = 80ML
Inputs Production
Tonnes per ha = 10.2 T/ha
Total tonnes = 102 T
CoA supported upgrade – without retained savings
10ha land
80MLinput
102T for the irrigator
+ =
Other productivity Improvements
Improvements due to increased crop quality etc.
Improvement on existing crop of 2% = 2T
20ML for the environment
+
Environmental Water
Transfer of 20ML to environment
Source: EY analysis.
1 Terms of reference 7 Opportunities for efficiency ...2 Glossary 8 Cost of efficiency measures3 Executive summary 9 Principles for negating adv ...4 Introduction 10 A program to achieve 450 ...5 Potential socio-economic ... 11 Appendices6 Program design

Analysis of efficiency measures in the Murray-Darling Basin: Opportunities to recover 450GL in additional environmental water through efficiency measures by 2024, with neutral or positive socio-economic impacts | Page 293 of 307
19 January 2018 | Final Report
Appendix H: Impact on future production11 Appendices
Note: This example does not consider costs, production limitations (such as availability of land) or the time value of money.
Land area = 12.5 ha (expansion)Water use per ha = 8ML/ha (water productivity)
Total water use = 90ML
Inputs
Production
Tonnes per ha = 10.2 T/ha
Total tonnes = 114.5 T
12.5ha land
90MLinput
114.5T for the irrigator
+ =
Environmental Water
Transfer of 10ML to environment
Other productivity improvements
Improvements due to increased crop quality etc.
Improvement on existing crop of 2% = 2T
10ML for the environment
+
Additional land for irrigation
10ML for additional production @ 8ML/ha=1.25ha =Total additional 12.5 T
Land area = 12.45 ha (expansion)Water use per ha = 8ML/ha (water productivity)
Total water use = 100ML
Inputs
Production
Tonnes per ha = 11.4 T/ha
Total tonnes = 127 T
12.45ha land
100MLinput
127T for the irrigator
+ =
Other productivity Improvements
Improvements due to increased crop quality etc.
Improvement on existing crop of 2% = 2T
Additional land for irrigation
20ML for additional production @ 8ML/ha=2.5ha =Total additional 25 T
Source: EY analysis.
CoA supported upgrade – retained savings
Upgrade by irrigator (in ten years)
1 Terms of reference 7 Opportunities for efficiency ...2 Glossary 8 Cost of efficiency measures3 Executive summary 9 Principles for negating adv ...4 Introduction 10 A program to achieve 450 ...5 Potential socio-economic ... 11 Appendices6 Program design

Analysis of efficiency measures in the Murray-Darling Basin: Opportunities to recover 450GL in additional environmental water through efficiency measures by 2024, with neutral or positive socio-economic impacts | Page 294 of 307
19 January 2018 | Final Report
ABARES 2011, Modelling the economic effects of the Murray-Darling Basin Plan, report prepared for the MDBA, Canberra
ABARES 2015, Dairy farms in the Murray-Darling Basin, report prepared for DAWR, Canberra
ABARES 2016, Lessons from the water market: The southern Murray-Darling Basin water allocation market 2000-01 to 2015-16, report prepared for DAWR, Canberra
Australian Bureau of Agricultural and Resource Economics 2016, Australian water markets report, ABARESretrieved from: https://www.mdba.gov.au/sites/default/files/pubs/ABARES-water-market-report-14-15.pdf
Australian Bureau of Statistics 2008, ‘Water and the Murray-Darling Basin - A Statistical Profile’, ABS, 2000-01 to 2005-06, ABS Cat. No. 4610.0, retrieved from: http://www.abs.gov.au/ausstats/[email protected]/mf/4610.0.55.007
Australian Bureau of Statistics 2012, ‘Australian Social Trends’, ABS, ABS Cat. No. 4102.0, retrieved from: http://www.abs.gov.au/AUSSTATS/[email protected]/allprimarymainfeatures/E0094FF470CFB2A0CA257A840015FA3D?opendocument
Australian Gas Light Energy 2009, ‘South Australian desalination renewable energy contract underlines strength of AGL’s renewable energy position’, AGL, retrieved from: https://www.agl.com.au/about-agl/media-centre/asx-and-media-releases/2009/september/south-australian-desalination-renewable-energy-contract-underlines-strength-of-agls-position
Aither 2016, Supply-side drivers of water allocation prices - Identifying and modelling the supply-side drivers of water allocation prices in the southern Murray-Darling Basin, report prepared for DAWR, Melbourne
Aither 2016, Water market drivers in the southern MDB: Implications for the dairy
industry, report prepared for Dairy Australia, Melbourne
Aither 2017, A review of socio-economic neutrality in the context of the Murray-Darling Basin plan implementation, report prepared for the New South Wales Department of Primary Industries – Water, Melbourne
Aither 2017, Water markets in New South Wales, report prepared for NSW Department of Primary Industries Water, Melbourne
Anderson K. 2013, ‘Growth and Cycles in Australia’s’ Wine Industry’, The University of Adelaide, retrieved from: https://www.adelaide.edu.au/wine-econ/databases/winehistory/winehistory-compendium-front-0215.pdf
Australian Bureau of Statistics 2011, ‘2011 Census of Population and Housing’, TableBuilder, retrieved from https://auth.censusdata.abs.gov.au/webapi/jsf/dataCatalogueExplorer.xhtml
Australian Bureau of Statistics 2014, ‘IRSAD’, ABS, retrieved from: http://www.abs.gov.au/ausstats/[email protected]/Lookup/2033.0.55.001main+features100042011
Australian Bureau of Statistics 2016, ‘2016 Census QuickStats’, ABS, retrieved from http://www.censusdata.abs.gov.au/census_services/getproduct/census/2016/quickstat/036
Australian Bureau of Statistics 2016, ‘2016 Census of Population and Housing’, TableBuilder, retrieved from https://auth.censusdata.abs.gov.au/webapi/jsf/dataCatalogueExplorer.xhtml
Australian Bureau of Statistics 2017, ‘SEIFA by Local Government Area (LGA)’, ABS, retrieved from http://stat.data.abs.gov.au/Index.aspx?DataSetCode=ABS_SEIFA_LGA
Appendix I: Complete bibliography and reference list 11 Appendices
EY received documents from Commonwealth and State Departments, the MDBA, industry bodies, local councils, irrigation districts, community groups and individual farmers. The case studies, senate submissions, newspaper articles and reports provided are listed below. Any informal document, data or discussion papers prepared specifically for EY purposes remain confidential and are not listed.
1 Terms of reference 7 Opportunities for efficiency ...2 Glossary 8 Cost of efficiency measures3 Executive summary 9 Principles for negating adv ...4 Introduction 10 A program to achieve 450 ...5 Potential socio-economic ... 11 Appendices6 Program design

Analysis of efficiency measures in the Murray-Darling Basin: Opportunities to recover 450GL in additional environmental water through efficiency measures by 2024, with neutral or positive socio-economic impacts | Page 295 of 307
19 January 2018 | Final Report
Australian Competition & Consumer Commission 2008, ‘Water charge (termination fees) rules: advice development’, ACCC, retrieved from: https://www.accc.gov.au/regulated-infrastructure/water/water-charge-termination-fees-rules-advice-development/issues-paper
Australian Competition and Consumer Commission 2017, ACCC Water Monitoring Report 2015-16, ACCC, Canberraretrieved from: https://www.accc.gov.au/system/files/1144_Water%20Report%202015-16_Text_FA4.pdf
Australian Department of the Environment and Energy n.d., ‘About Commonwealth environmental water’, DEE, retrieved from: http://www.environment.gov.au/water/cewo/about-commonwealth-environmental-water
Australian Government et. al. 2016, Sunraysia Modernisation Project: Interim Final Report, Canberra, retrieved from: http://www.lmw.vic.gov.au/LowerMurrayWaterSite/media/General-Reports/SMP/SMP-Interim-Final-Report.pdf
ARCHE Consulting 2012, Assessing the socio-economic Impacts of Sustainable Diversion Limits and water for the future investments: an assessment of the short-term impacts at a local scale, report prepared for the Department of Sustainability, Environment, Water, Population and Communities (now DAWR), Sydney
CIT 2015, ‘The manner in which electricity network companies have presented information to the Australian Energy Regulator (AER) and whether they have misled the AER’, Parliament of Australia, Senate Submission for Senate Inquiry into ‘the performance and management of electricity network companies’, retrieved from: https://www.aph.gov.au/Parliamentary_Business/Committees/Senate/Environment_and_Communications/Electricity_and_AER/Submissions
Clarke, J., Alston, M. and Whittenbury, K. 2017, Social Sustainability in dairying communities impacted by the Murray-Darling Basin Plan, Monash University, Melbourne
Council of Australian Governments 2017, Intergovernmental Agreement on implementing Water Reform in the Murray-Darling Basin, COAG
Cotton Australia 2016, ‘Water Use Efficiency in the Cotton Industry’, Cotton Australia, retrieved from http://cottonaustralia.com.au/cotton-library/fact-sheets/cotton-fact-file-water
CSIRO 2010, Beyond the Traffic Light Approach, prepared for the Northern Victoria Irrigation Renewal Project, Canberra
CSIRO 2012, Assessment of the ecological and economic benefits of environmental water in the Murray–Darling Basin, report prepared for the MDBA, Canberra
Dairy Australia 2013, Cost Benefit Analysis of Farm irrigation Modernisation, report prepared by RMCG, Bendigo
Dairy Australia 2012, Murray-Darling Basin Plan – Implications on Milk Production in the Goulburn Murray Irrigation District, report prepared by RMCG, Bendigo
Dairy Australia 2017, ‘History of Australian dairy industry deregulation’, Dairy Australia, retrieved from https://www.dairyaustralia.com.au/about-dairy-australia/about-the-industry/history-of-australian-dairy-industry-deregulation
Department of Agriculture and Water Resources 2017, ‘On-Farm Irrigation Efficiency Program’, DAWR, retrieved from: http://www.agriculture.gov.au/water/mdb/programs/basin-wide/ofiep
Department of Agriculture and Water Resources 2017, ‘Private Irrigation Infrastructure Operators Program in New South Wales’, DAWR, retrieved from: http://www.agriculture.gov.au/water/mdb/programs/nsw/piiop-nsw
Department of Agriculture and Water Resources 2017, ‘Irrigation Infrastructure Program for South Australia’, DAWR, retrieved from: http://www.agriculture.gov.au/water/mdb/programs/sa/piip-sa
Department of Environment 2014, On-Farm Irrigation Efficiency Program Case Study, Ricegrower’s Association of Australia Inc., Binya
Appendix I: Complete bibliography and reference list 11 Appendices 1 Terms of reference 7 Opportunities for efficiency ...
2 Glossary 8 Cost of efficiency measures3 Executive summary 9 Principles for negating adv ...4 Introduction 10 A program to achieve 450 ...5 Potential socio-economic ... 11 Appendices6 Program design

Analysis of efficiency measures in the Murray-Darling Basin: Opportunities to recover 450GL in additional environmental water through efficiency measures by 2024, with neutral or positive socio-economic impacts | Page 296 of 307
19 January 2018 | Final Report
Department of Environment 2014, On-Farm Irrigation Efficiency Program Case Study, Ricegrower’s Association of Australia Inc., Deniliquin
Department of Environment and Heritage Protection (QLD) 2016, ‘Waste Water’, DEHP, retrieved from https://www.ehp.qld.gov.au/water/monitoring/wastewater.html
Department of Environment, Land, Water and Planning (VIC) 2017, ‘Sustainable Irrigation Program’, DEWLP, retrieved from: https://www.water.vic.gov.au/water-for-agriculture/sustainable-irrigation-program
Department of Natural Resources and Mines (QLD) n.d., Healthy Headwaters, DNRM, retrieved from: https://www.dnrm.qld.gov.au/water/catchments-planning/healthy-headwaters/water-use-efficiency-project
Department of Industry, Innovation and Science 2017, ‘Building Better Regions Fund (BBRF)’, DIIS, retrieved from https://www.business.gov.au/assistance/building-better-regions-fund
Department of Infrastructure and Regional Development (Cwth) n.d., ‘The Murray-Darling Basin Regional Economic Diversification Program’, DIRD, retrieved from http://regional.gov.au/regional/programs/murray-darling-basin-regional-economic-diversification.aspx
Department of Sustainability and Environment (VIC) 2009, Northern Region Sustainable Water Strategy, DSE, Melbourne,
Department of Sustainability, Environment, Water, Population and Communities (Cwth) 2010, Northern Victoria Irrigation Renewal Project Stage 2, DSEWLC, Canberra, retrieved from: http://155.187.2.69/water/policy-programs/pubs/nvirp-stage2.pdf
Environment Victoria 2017, “Communities in Transition”: Roundtable Summary, Summary document, Melbourne
European Commission 2016, ‘Portugal: Diversification from a dominant industry’, EU, retrieved from http://s3platform.jrc.ec.europa.eu/-/diversification-from-a-dominant-industry?inheritRedirect=true
European Commission 2016, Spain: A territorial perspective on smart specialisation, EU, retrieved from http://s3platform.jrc.ec.europa.eu/-/a-territorial-perspective-on-smart-specialisation?inheritRedirect=true
Forbes, P. et.al. 2012, The long-term impact of Property Management Planning (Farming for the Future) in NSW, Report prepared for the NSW Department of Primary Industries, Sydney
Fortunato, M., Ross, A. and Davidson, N. 2017, Community Adaptability Engagement Research, project funded by MDBA, Center for Rural Studies Research & Outreach, USA
Foundation for Rural & Regional Renewal n.d., ‘Creating Inspiring Rural Community Leadership & Engagement (CIRCLE)’, FRRR, retrieved from: http://www.frrr.org.au/cb_pages/creating_inspiring_rural_community_lship__engage_circle.php
Frontier Economics 2010, Structural adjustment pressures in the irrigated agriculture sector in the Murray–Darling Basin, A report prepared for the MDBA, Canberra
Goulburn Broken CMA 2017, Regional Irrigated Land and Water Use Mapping in the Goulburn Murray Irrigation District, GB CMA, Victoria
Goulbourn Murray Water 2016, ‘Submission to the Senate Select Committee on the Murray-Darling Basin Plan’, Goulburn Murray Water, retrieved from: http://www.g-mwater.com.au/downloads/gmw/1_Current/Publications/16022016_-_4064235-v8-SENATE_INQUIRY_IMPLEMENTATION_OF_BASIN_PLAN_GMW_SUBMISSION.pdf
Goulburn Murray Water n.d., ‘Project aims and benefits’, Connections Project, retrieved from: http://www.connectionsproject.com.au/about-the-project/project-aims/
Gunders, J. 2017, ‘Murray-Darling Basin Plan: Dirranbandi changes tack in fight for survival over water buybacks’, ABC News, 15 February, retrieved from: http://www.abc.net.au/news/rural/2017-02-15/dirranbandi-water/8272292
Appendix I: Complete bibliography and reference list 11 Appendices 1 Terms of reference 7 Opportunities for efficiency ...
2 Glossary 8 Cost of efficiency measures3 Executive summary 9 Principles for negating adv ...4 Introduction 10 A program to achieve 450 ...5 Potential socio-economic ... 11 Appendices6 Program design

Analysis of efficiency measures in the Murray-Darling Basin: Opportunities to recover 450GL in additional environmental water through efficiency measures by 2024, with neutral or positive socio-economic impacts | Page 297 of 307
19 January 2018 | Final Report
Hajkowicz, S. and Eady, S. 2015, Rural Industry Futures, Rural Industries Research & Development Corporation and CSIRO, Canberra
Grafton, R.Q. 2017, ‘Water Reform and Planning in the Murray-Darling Basin’, Water Economics and Policy, Vol. 3, No. 3
HMC Property Group 2010, Changing land use in the GMID 2006 – 2010, prepared for Northern Victoria Irrigation Renewal Project and Department of Primary Industries, Kyabram
Howard J., Williams, T. and Pro. Agarwal, R. 2016, ‘Smart Specialisation as an Engagement Framework for Triple Helix Interactions’, XIV International Triple Helix Conference 2016, 25-27 September Heidelberg Germany
Hume, Loddon Mallee and Grampians Regional Development Australia Committees 2012, Predicting socioeconomic impacts of the proposed Basin Plan on Victoria, report prepared by RMCG, Melbourne
Job Active n.d., ‘Help for workers who have recently lost their jobs in the forestry industry in Tasmania’, Job Search, retrieved from: https://jobsearch.gov.au/content/documents/help_for_workers_who_have_recently_been_made_redundant_in_the_forestry_industry_in_tasmania_0.pdf
Kotter, J. 2017, ‘The 8 Step Process for Leading Change’, Kotter Inc., retrieved from: https://www.kotterinc.com/8-steps-process-for-leading-change/.
KPMG Economics 2016, Northern Basin Community Modelling, KPMG, Sydney
Labour Party 2012, ‘Support for Tasmanian Forestry Workers’, Labour Party, Media Release, retrieved from: http://www.billshorten.com.au/support_for_tasmanian_forestryworkers
Lefort, C 2017, ‘High-tech grads wanted to work with Australian farmers’, The Australian Financial Review, 7 February
Lockhart, J. et. al. 2016, ‘Milk price cuts reflect the reality of sweeping changes in global dairy market’, The Conversation, retrieved from: https://theconversation.com/milk-price-cuts-reflect-the-reality-of-sweeping-changes-in-global-dairy-market-59251
Mallawaarachchi and Foster 2009, Dealing with irrigation drought: the role of water trading in adapting to water shortages in 2007-08 in the southern Murray-Darling Basin, ABARES, Research Report 09.6
Mallee Catchment Management Authority 2016, 2015 Irrigated Horticulture Crop Report, Mildura
Marsden Jacob and Associates 2012, Preliminary Assessment of the benefits of the Basin Plan for the recreational boating industries, report prepared for the MDBA, Melbourne
Marsden Jacob and Associates 2016, Benefit Cost Analysis: Potential Use of Adelaide desalinisation plant to offset reductions in irrigator’s dry periods, report prepared for Department of Environment, Water and Natural Resources (SA), Melbourne
Marsden Jacob and Associates 2017, Economic effects of the Commonwealth water recovery programs in the Murrumbidgee Irrigation Area, Report prepared for the DAWR, Melbourne
Martin, W. and Turner, G. 2015, SDL Adjustment Stocktake Report, August
Maskey, R. et.al. 2014, ‘Efficiency gains from irrigation upgrades on dairy farms in northern Victoria: lessons from farm case studies’, Proceedings of the 5th Australasian Dairy Science Symposium 2014, pp.96-99
McClumpla, W. 2015, Submission to the Senate Select Committee on the Murray-Darling Basin Plan, Sunraysia Branch Victorian Farmers Federation Red Cliffs
MDBA 2011, Community impacts of the Guide to the proposed Murray-Darling Basin Plan, prepared EBC, RMCG, MJA, EconSearch, Geoff McLeod, Tim Cummins, Guy Roth and David Cornish with special advice from Chris Miller, Australia, Canberra
Michael Connell and Associates 2014, Summary Report: Economic Impact Assessment of Murray-Darling Basin Plan on Wakool Shire, MCa
Mildura Rural City Council n.d., Mildura Future Ready: Funding and Advocacy Strategy, MRCC, Mildura
Appendix I: Complete bibliography and reference list 11 Appendices 1 Terms of reference 7 Opportunities for efficiency ...
2 Glossary 8 Cost of efficiency measures3 Executive summary 9 Principles for negating adv ...4 Introduction 10 A program to achieve 450 ...5 Potential socio-economic ... 11 Appendices6 Program design

Analysis of efficiency measures in the Murray-Darling Basin: Opportunities to recover 450GL in additional environmental water through efficiency measures by 2024, with neutral or positive socio-economic impacts | Page 298 of 307
19 January 2018 | Final Report
Minister for Agriculture 2016, ‘Sunraysia Modernisation Project’, Media Release, DAWR, retrieved from: http://minister.agriculture.gov.au/joyce/Pages/Media-Releases/Sunraysia-modernisation-project.aspx
Morrison, M. and Hatton MacDonald, D. 2010, Economic Valuation of Environmental Benefits in the Murray-Darling Basin, report prepared for the MDBA, Canberra
Murray Dairy and Dairy Australia 2017, Regional Irrigated Land and Water Use Mapping in the Goulburn Murray Irrigation District, Victoria
Murray Dairy and Dairy Australia 2018, Dairy Summit 10 May 2017, Shepparton
Murray-Darling Basin Authority 2009, Socio-Economic Context for the Murray-Darling Basin, report prepared by ABS/ABARES/BRS, Canberra
Murray-Darling Basin Authority 2011, Economy of the Basin, MDBA, retrieved from: https://www.mdba.gov.au/discover-basin/people/economy-basin
Murray-Darling Basin Authority 2014, Murray-Darling Basin water reforms: Framework for evaluating progress, MDBA, Canberra.
Murray-Darling Basin Authority 2016, Northern Basin Review, MDBA, Canberra
Murray-Darling Basin Authority 2016, Northern Basin Review: Community consultation report, MDBA, Canberra
Murray-Darling Basin Authority n.d., ‘Water markets and trade’, MDBA, retrieved from: https://www.mdba.gov.au/managing-water/water-markets-and-trade
Murray-Darling Basin Ministerial Council 2012, Notice by Murray-Darling Basin Ministerial Council under section 43A(4) of the Water Act 2007, Canberra
Murray-Darling Basin Ministerial Council 2017, Implementing the Basin Plan, 17 March, Murray-Darling Basin Ministerial Council to the Council of Australian Governments, Canberra
Murray-Darling Basin Authority 2011, Socioeconomic analysis and the draft Basin Plan Part A and B, MDBA, Canberra
Milne, G. representing the Murray River Group of Councils 2015, Submission to the Senate Select Committee Inquiry into the Impacts of the Murray-Darling Basin Plan, MRGC, Victoria
Natural Resources SA Murray-Darling Basin 2014, ‘Case Study: Angove Family Winemakers’, On-farm Irrigation Efficiency Program, Natural Resources SA MDB, South Australia
Natural Resources SA Murray-Darling Basin n.d., ‘Case Study: Curtis Vineyards’, On-farm Irrigation Efficiency Program, Natural Resources SA MDB, South Australia
Natural Resources SA Murray-Darling Basin n.d., ‘Case Study: Lacton Pty Ltd’, On-farm Irrigation Efficiency Program, Natural Resources SA MDB, South Australia
Natural Resources SA Murray-Darling Basin n.d., ‘Water Allocation Plan: River Murray Prescribed Watercourse’, Natural Resources SAMDB, retrieved from: http://www.naturalresources.sa.gov.au/samurraydarlingbasin/water/water-allocation-plans/river-murray-wap
Natural Resources South Australia Murray-Darling Basin and Growing Solutions 2014, 2014 Irrigation Infrastructure Report – Rounds One & Two, Natural Resources SAMDB and Growing Solutions
New South Wales Department of Industry n.d., ‘Strengthening the Murray-Darling Basin economy’, NSW DPI, retrieved from https://www.industry.nsw.gov.au/business-and-industry-in-nsw/assistance-and-support/strengthening-the-murray-darling-basin-economy
New South Wales Department of Industry 2013, Sustaining the Basin: Irrigation Farm Modernisation (STBIFM) Program, NSW DPI, Albury
New South Wales Department of Industry 2013, Sustaining the Murray-Darling Basin, NSW DPI, Albury, retrieved from http://www.water.nsw.gov.au/water-management/water-recovery/sustaining-the-basin
Appendix I: Complete bibliography and reference list 11 Appendices 1 Terms of reference 7 Opportunities for efficiency ...
2 Glossary 8 Cost of efficiency measures3 Executive summary 9 Principles for negating adv ...4 Introduction 10 A program to achieve 450 ...5 Potential socio-economic ... 11 Appendices6 Program design

Analysis of efficiency measures in the Murray-Darling Basin: Opportunities to recover 450GL in additional environmental water through efficiency measures by 2024, with neutral or positive socio-economic impacts | Page 299 of 307
19 January 2018 | Final Report
Organisation for Economic Co-operation and Development 2014, ‘Smart Specialisation’, OECD, retrieved from http://www.oecd.org/sti/inno/smartspecialisation.htm
Organisation for Economic Co-operation and Development 2016, ‘OECD Science, Technology and Innovation Outlook 2016’, OECD, retrieved from: https://www.oecd.org/sti/Megatrends%20affecting%20science,%20technology%20and%20innovation.pdf
Parker and Speed 2010, Agricultural Water Pricing: Australia, prepared for the OECD, Franceretrieved from: https://www.oecd.org/australia/45014987.pdf
Pearce, L. 2014, 2014 Irrigation Infrastructure Report – Rounds One & Two, Prepared for DEWNR (SA) and Natural Resources SA Murray-Darling Basin, South Australia
Peel, D. Schirmer, J. and Mylek, M. 2016, Farming challenges & farmer wellbeing, University of Canberra and Health Research Institute, Canberra
PIRSA 2017, South Australian River Murray Sustainability Program, Public Information Sessions for Round Four, Adelaide, received September 2017
Productivity Commission 2017, Transitioning Regional Economies Initial Report, Canberra
Purbrick, H. 2017, ‘Cool Stuff’, Big Sky Ideas, retrieved from https://bigskyideas.com.au/what-we-do
Purbrick, H. 2017, ‘What is Think Big’, Think Big Rural Women, retrieved from: https://ruralwomenmakingchange.com.au/
Regional Development Australia Hunter 2016, Hunter Plan for Regional Growth 2016-2019, RDA Hunter
Regional Development Australia Murraylands and Riverland SA 2016, Regional Roadmap 2016-2020, RDA SA
Regional Development Victoria 2017, ‘Regional Partnerships’, RDV, retrieved from http://www.rdv.vic.gov.au/regional-partnerships
Ricegrower’s Association of Australia Inc. n.d., Case Study: The Hibmas Centre Pivot Irrigation System, RGA, Leeton
Ricegrower’s Association of Australia Inc. n.d., Case Study: The Molloys Lateral Move Irrigation System, RGA, Leeton
Ricegrower’s Association of Australia Inc. n.d., Case Study: The Stotts Surface Irrigation System Upgrade, RGA, Leeton
Rice Growers Association 2017, ‘About the Rice Industry’, Rice Growers Association, retrieved from http://www.rga.org.au/the-rice-industry.aspx
Riverina Water County Council 2016, ‘Average Water Use’, RWCC, retrieved from https://www.rwcc.nsw.gov.au/save-water/average-water-use
RMCG 2016, Case Studies to inform MERI for Irrigation Efficiency Programs, report prepared for the SA MDB NRM Board, Bendigo
RMCG 2017, Basin Plan - GMID socio-economic Impact Assessment, report prepared for the GMID Leadership Forum, Bendigo
RMCG 2017, Basin Plan Socio-economic impacts NSW Murray Valley, report prepared for the Murray Group, Bendigo
Rural Industries Research and Development Corporation n.d., Contemporary trends and drivers of irrigation in the southern Murray-Darling Basin, report prepared by Aither, Melbourne
Schirmer, J. 2017, Water Reform: Socio-economic effects of investment in water infrastructure, report prepared for DAWR, Canberra
Schirmer, J. et.al. 2016, The 2015 Regional Wellbeing Survey: Wellbeing, Resilience and Liveability in Regional Australia, June, University of Canberra
Schirmer, J., Mylek, M. and Yabsley, B. 2015, Wellbeing, community connections and resilience of dairy farmers, University of Canberra, Canberra
Appendix I: Complete bibliography and reference list 11 Appendices 1 Terms of reference 7 Opportunities for efficiency ...
2 Glossary 8 Cost of efficiency measures3 Executive summary 9 Principles for negating adv ...4 Introduction 10 A program to achieve 450 ...5 Potential socio-economic ... 11 Appendices6 Program design
Analysis of efficiency measures in the Murray-Darling Basin: Opportunities to recover 450GL in additional environmental water through efficiency measures by 2024, with neutral or positive socio-economic impacts | Page 300 of 307
19 January 2018 | Final Report
Senate Inquiry 2011, ‘Inquiry into Chapter 5 Water purchase and infrastructure investment’, Australian Parliament House, retrieved from: https://www.aph.gov.au/parliamentary_business/committees/house_of_representatives_committees?url=ra/murraydarling/report/chapter5.htm
South Australia Murray Irrigators 2017, Irrigation Industry Business Enhancement Options Below Lock 1 in the South Australia Murray-Darling Basin, Discussion Paper, SAMI
State Government of Victoria n.d., ‘Innovative Farming Future Farm Connect Workbook Trial’, State Government of Victoria, retrieved from https://www.tenders.vic.gov.au/tenders/tender/display/tender-details.do?id=5237&action=display-tender-details
SunRice 2016, ‘2016 Riverina Rice Harvest: Stronger Yields Results’, SunRice, retrieved from https://www.sunrice.com.au/corporate/newsroom/media-releases/2016-riverina-rice-harvest-stronger-yields-results/
SunWater n.d., ‘About SunWater’, SunWater, retrieved from: http://www.sunwater.com.au/about-sunwater
SunWater 2010, St George Water Supply Scheme Modernisation Plan, prepared for DAWR, Brisbane
Sustainable Soils Management Pty Ltd n.d., Tenandra Scheme Modernisation Project Final Report, Warren
The Senate: Economics References Committee 2017, Australia's dairy industry: rebuilding trust and a fair market for farmers, August, Canberra
Tim Cummins and Associates 2016, Goulburn-Murray Water Connections Project Reset Community Consultation, prepared for the Goulburn Murray Water Connections Project, TC&A, Melbourneretrieved from: http://www.connectionsproject.com.au/wp-content/uploads/2016/06/Report-ResetConsultation.pdf
Tim Cummins and Associates 2016, Water Market Trends: Trends in Northern Victorian Water Trade 2001-2015, TC&A, prepared for the State of Victoria
Department of Environment, Land, Water and Planning, Melbourne
Tim Cummins and Associates, and Frontier Economics 2017, Social and economic impacts of the Basin Plan, TC&A and Frontier Economics, Melbourne
Trangie Nevertire Irrigation Scheme 2016, Trangie Nevertire Co-operative Ltd (TNCL) Final Project Report under Round One of the Private Irrigation Infrastructure Operators Program in NSW, Trangie
Victorian Climate Initiative 2017, ‘A synthesis of findings from the Victorian Climate Initiative’, VicCL, retrieved from: https://www.water.vic.gov.au/__data/assets/pdf_file/0030/76197/VicCI-25-07-17-MR.pdf
Victorian Environmental Water Holder n.d., ‘Why do we need environmental water?’, VEWH, retrieved from: http://www.vewh.vic.gov.au/environmental-water/why-do-we-need-environmental-water
Waterfind 2014, ‘Waterfind & On-Farm’, Waterfind Newsletter, OFIEP (Round 3), Issue 2, January
Waterfind 2014, ‘Waterfind & On-Farm’, Waterfind Newsletter, OFIEP, Issue 5, December
WaterNSW n.d., NSW Metering Scheme, Water NSW, Sydney, retrieved from http://www.waternsw.com.au/projects/metering
Weaver, A. 2016, Economic and Social Impacts of Basin Plan Infrastructure Investment: PIIOP, report prepared for DAWR, Canberra
Wentworth Group of Concerned Scientists 2017, Five actions necessary to deliver the Murray-Darling Basin Plan ‘in full and on time, Sydney
Wentworth Group of Concerned Scientists 2010, Sustainable Diversions in the Murray-Darling Basin, Sydney
Wheeler, S. et al (2014), Reviewing the adoption and impact of water markets in the Murray-Darling Basin, Journal of Hydrology, 518. 28-41.
Appendix I: Complete bibliography and reference list 11 Appendices 1 Terms of reference 7 Opportunities for efficiency ...
2 Glossary 8 Cost of efficiency measures3 Executive summary 9 Principles for negating adv ...4 Introduction 10 A program to achieve 450 ...5 Potential socio-economic ... 11 Appendices6 Program design

Analysis of efficiency measures in the Murray-Darling Basin: Opportunities to recover 450GL in additional environmental water through efficiency measures by 2024, with neutral or positive socio-economic impacts | Page 301 of 307
19 January 2018 | Final Report
Wilson, L. and Maher, S. 2014, ‘Growers face ruin as cannery’s future hangs in balance’, The Australian, 30 January
World Economic Forum 2014, Global Risk Report 2014, WEF, Switzerland
World Resources Institute 2015, ‘Aqueduct Projected Water Stress Country Rankings: Technical Note’, WRI, retrieved from: http://www.wri.org/publication/aqueduct-projected-water-stress-country-rankings
Data list
► ABARES 2017, ‘Murray-Darling Basin Irrigator Survey’, ABARES, retrieved from: http://www.agriculture.gov.au/abares/research-topics/surveys/irrigation
► ABS Cat. No. 2003.0, 2016 Census of Population and Housing Time Series Profile
► ABS Cat. No. 4610.0 2008, Water and the Murray-Darling Basin - A Statistical Profile, 2000-01 to 2005-06
► ABS Cat. No. 4618.0, Water use on Australian farms
► ABS Cat. No. 4610.0.55.008, Gross value of irrigated agricultural production
► ABS Cat. No. 8155.0, Australian Industry
► Schirmer 2017, Water Reform: Socio-economic effects of investment in water infrastructure. Note that this presents additional data from the University of Canberra’s 2015-16 Regional Wellbeing Survey
► Primary Industries and Regions SA provided data on SARMS programs between September and November 2017.
► MDBA, provided data from the 2015-16 ACCC Water Monitoring Report
► Department of Primary Industries 2013, Socio-economic monitoring of NSW Water Sharing Plans, Irrigators’ Surveys 2009/10 and 2013: A state wide comparison.
► Growing Solutions 2014, 2014 Irrigation Infrastructure Report – Rounds One and Two, produced by Leighton Pearce, Growing Solutions in collaboration with the Department of Natural Resources South Australian Murray-Darling Basin.
Appendix I: Complete bibliography and reference list 11 Appendices 1 Terms of reference 7 Opportunities for efficiency ...
2 Glossary 8 Cost of efficiency measures3 Executive summary 9 Principles for negating adv ...4 Introduction 10 A program to achieve 450 ...5 Potential socio-economic ... 11 Appendices6 Program design

Analysis of efficiency measures in the Murray-Darling Basin: Opportunities to recover 450GL in additional environmental water through efficiency measures by 2024, with neutral or positive socio-economic impacts | Page 302 of 307
19 January 2018 | Final Report
Appendix J: Overview of existing and prior efficiency programs11 Appendices
Private Irrigation Infrastructure Operators Program (PIIOP)1
The PIIOP aims to improve the efficiency and productivity of water use and management of private irrigation networks to deliver water savings for the environment. Water entitlements resulting from water savings generated from eligible projects, both off and on-farm, will help to secure a sustainable future for irrigation communities.
PIIOP projects allow private irrigation infrastructure operators and their customers to reduce water losses and manage their water allocations more efficiently, whilst assisting irrigation communities to adapt to a future scenario of reduced water availability due to climate change.
Irrigated Farm Modernisation (IFM)2
The New South Wales (NSW) Department of Primary Industries (DPI) will implement the $83 million project by investing in management, information and technological farm infrastructure to modernise irrigated farms within the State. The investment as a part of the project will improve water use efficiency, water savings, and increase water related productivity in irrigated farming systems. Applications for funding under Round 9 of the program are currently being assessed.
Basin Pipe3
Led by the NSW DPI, the Basin Pipes project replaces wasteful replenishment systems, open drains, channels and dams with pipeline schemes to provide farmers with improvements and more efficient supplies of stock and domestic water. The Basin Pipe was a $137 million water efficiency infrastructure project, with an expected 38GL of water efficiency gains to deliver additional water to the inland rivers of NSW for the aquatic environment.
Metering4
The Australian Government has agreed in principle to commit up to $221 million to the NSW Metering Scheme to improve the measurement of water extracted from groundwater, regulated and unregulated rivers throughout the Murray-Darling Basin. The purpose of the NSW Metering Project was to install high accuracy, tamper proof and low maintenance meters across the NSW Murray-Darling Basin to achieve greater efficiencies and environmental benefits. The scheme was carried out in a staged approach, with the aim of ensuring at least 95% of total extractions in the regulated, unregulated river and groundwater systems are metered.
Goulburn-Murray Connections Stage 2 (GMWCP2)5
The GMWCP2 project is designed to increase water efficiencies by creating a world leading irrigation system to boost irrigator productivity, help communities and foster healthy waterways and wetlands. The GMWCP2 is a significant investment to upgrade irrigation infrastructure to ensure the future of irrigated agriculture and bolster the economy. The project is recovering water lost from system inefficiencies through channel automation and remediation, upgrading meters and realigning the historical layout of the irrigation channels. By creating modernised irrigation systems, it is anticipated that Australian farmer’s will better leverage irrigation systems and technology to deliver water more efficiently to the farm gate.
1 DAWR (Cwth) 2017, Private Irrigation Infrastructure Operators Program in New South Wales, http://www.agriculture.gov.au/water/mdb/programs/nsw/piiop-nsw2 DPI (NSW) 2013, Sustaining the Murray-Darling Basin, http://www.water.nsw.gov.au/water-management/water-recovery/sustaining-the-basin3 ibid.,4 WaterNSW n.d., NSW Metering Scheme, http://www.waternsw.com.au/projects/meteriing
5 Connections Project n.d., Project aims and benefits, http://www.connectionsproject.com.au/about-the-project/project-aims/
1 Terms of reference 7 Opportunities for efficiency ...2 Glossary 8 Cost of efficiency measures3 Executive summary 9 Principles for negating adv ...4 Introduction 10 A program to achieve 450 ...5 Potential socio-economic ... 11 Appendices6 Program design

Analysis of efficiency measures in the Murray-Darling Basin: Opportunities to recover 450GL in additional environmental water through efficiency measures by 2024, with neutral or positive socio-economic impacts | Page 303 of 307
19 January 2018 | Final Report
Appendix J: Overview of existing and prior efficiency programs11 Appendices
Victorian Farm Modernisation Project (VFMP)1
The VFMP is a Commonwealth government-funded project, providing up to $100 million in funds to Goulburn-Murray irrigators. The VFMP funds the adoption of improved farm water delivery technologies, such as laser grading, installation of pressurised irrigation systems and soil moisture monitoring equipment.
The objective of the VFMP is to provide funds to irrigators undertaking on-farm works, which will improve water use efficiencies and reduce “losses” occurring in the farm supply of water for irrigation. A portion of the “agreed savings” generated through this work is transferred to the CEWH, while a portion is retained with the irrigator for the use.
North Victoria Irrigation Renewal Project Stage 2 (NVIRP 2)2
NVIRP 2 is a Commonwealth (90%) and Victorian (10%) government-funded project, aiming to further improve irrigation efficiency of irrigation water connection and supply in the Goulburn Murray Irrigation District. The NVIRP 2 is expected to deliver water savings of at least 200GL, of which will be shared equally between holders of Goulburn Murray entitlements (100GL) and the Commonwealth for environmental use (100GL). NVIRP 2 includes the following activities:
► The connections program
► Improvements to the backbone system
► A number of water savings and environmental projects.
Sunraysia Modernisation Project (SMP)3
SMP is a Commonwealth ($103 million) and Victorian ($17 million) government-funded Basin State Priority Project, with the objectives of improving water quality and irrigation application rates, providing year-round access to irrigation water via the water ordering system and generating 7GL of water efficiency savings to the region. The SMP includes the following activities:
► The pipelining of lengths of open main channels
► Upgrade of pump stations to provide a range of flows with more efficient energy use
► Decommissioning of redundant infrastructure
► Automation of the remaining channels
► Installation of a modern irrigation and domestic and stock meter fleet.
On-Farm Irrigation Efficiency Program (OFIEP)4
The OFIEP is Commonwealth government-funded program with the aim of improving the efficiency and productivity of on-farm irrigation water use and management. The OFIEP assists irrigators within the Southern connected system of the Murray–Darling Basin to modernise their on-farm irrigation infrastructure while returning water savings to the environment. Water entitlements resulting from water savings generated from eligible projects assist in securing a more sustainable future for irrigation communities. The OFIEP includes the following activities:
► Installing new or upgrading existing irrigation infrastructure or technology, including automated water management systems and sensing equipment
► Improving irrigated area layout or design
► Upgrading of, or conversion to, surface or sub-surface drip systems and overhead spray systems such as lateral move or centre pivots
► Ancillary equipment necessary for new or upgraded irrigation systems to function.
1 DELWP (Vic) 2017, Sustainable Irrigation Program, https://www.water.vic.gov.au/water-for-agriculture/sustainable-irrigation-program
2 DSEWPC (Cwth) 2010, Northern Victoria Irrigation Renewal Project Stage 2, http://155.187.2.69/water/policy-programs/pubs/nvirp-stage2.pdf
3 Lower Murray Water et. al. 2016, Sunraysia Modernisation Project: Interim Final Report, http://www.lmw.vic.gov.au/LowerMurrayWaterSite/media/General-Reports/SMP/SMP-Interim-Final-Report.pdf
4 DAWR (Cwth) 2017, On-Farm Irrigation Efficiency Program, http://www.agriculture.gov.au/water/mdb/programs/basin-wide/ofiep
1 Terms of reference 7 Opportunities for efficiency ...2 Glossary 8 Cost of efficiency measures3 Executive summary 9 Principles for negating adv ...4 Introduction 10 A program to achieve 450 ...5 Potential socio-economic ... 11 Appendices6 Program design
Analysis of efficiency measures in the Murray-Darling Basin: Opportunities to recover 450GL in additional environmental water through efficiency measures by 2024, with neutral or positive socio-economic impacts | Page 304 of 307
19 January 2018 | Final Report
Appendix J: Overview of existing and prior efficiency programs11 Appendices
Private Irrigation Infrastructure Program for South Australia (PIIP-SA1)
The PIIP-SA is a Commonwealth government-funded program with the aim of funding irrigation infrastructure efficiency improvements for Murray-Darling Basin operators in South Australia, with a share of the water savings achieved from those projects to be used for environmental water purposes. Successful program applicants receive Commonwealth funding once they are able to demonstrate a high merit in improving the efficiency and productivity of irrigation water use and management in the South Australian Murray-Darling Basin. Eligible program applicants were required to draw on the water resources within the South Australian Murray-Darling Basin and be a legal entity under one of the following categories:
► Irrigation Infrastructure Operators
► Delivery Partners
► Individual Irrigators directly
► An off-farm efficiency improvement was also required for a project to be eligible.
Healthy Headwaters Water Use Efficiency (HHWUE2)
The HHWUE project helps irrigators, communities and the environment in the Queensland Murray-Darling Basin by funding on-farm irrigation infrastructure improvements and supporting projects. HHWUE projects are aimed at upgrading on-farm infrastructure, broadly relating to water storage, water distribution or in-field water systems. Presently, more than 80 eligible HHWUE projects represent over 46GL of water efficiency savings in Queensland’s Murray-Darling Basin. In order for applicants to receive government funding, irrigators must contribute at least 10% of the infrastructure expenditure, as well as at least 50% of the water savings (by permanent transfer of water allocation) to the Commonwealth Government for environmental use. However, it is noted that the 10% contribution required from irrigators may be made up of any combination of cash, ‘in-kind’ or additional water for transfer.
1 DAWR (Cwth) 2017, Irrigation Infrastructure Program for South Australia, http://www.agriculture.gov.au/water/mdb/programs/sa/piip-sa2 DNRM (QLD) n.d., Healthy Headwaters, https://www.dnrm.qld.gov.au/water/catchments-planning/healthy-headwaters/water-use-efficiency-project
1 Terms of reference 7 Opportunities for efficiency ...2 Glossary 8 Cost of efficiency measures3 Executive summary 9 Principles for negating adv ...4 Introduction 10 A program to achieve 450 ...5 Potential socio-economic ... 11 Appendices6 Program design

Analysis of efficiency measures in the Murray-Darling Basin: Opportunities to recover 450GL in additional environmental water through efficiency measures by 2024, with neutral or positive socio-economic impacts | Page 305 of 307
19 January 2018 | Final Report
Indicators in assessing Basin Plan impacts
In 2011, the MDBA commissioned a report to understand the potential impact of the Basin Plan on communities.1 The following factors were used to assess the resilience of communities:
► Population
► Agriculture dependence (% employed on-farm and value chain).
The MDBA’s overarching framework for evaluating the progress2 of the Plan sets out the following socio-economic indicators:
► Area irrigated and output by crop type,
► Patterns of water trading,
► Water used by irrigated agriculture,
► Measures of productivity,
► Rate of return per unit of water used,
► Value of production of floodplain agriculture,
► Benefits from improved environmental outcomes,
► Certainty and confidence
► Indigenous values.
More recently, in the MDBA’s Northern Basin Review3, the impact on Basin communities was assessed using indicators such as adjustments in irrigated land to then establish the change in employment.
Potential Indicators of resilience
Based on the work by the MDBA and discussions with the Advisory Panel, the key indicator for the level of resilience of the community is the level of reliance on agriculture for the economy of that community. Qualitative factors that affect a community’s existing capacity to adapt to change, due to historical events (for
example the level of water recovered historically through buybacks), is also important to take into account.
The following indicators could be used to categorise communities into high or low resilience. However, further work will be needed to develop the indicators and the thresholds for determining whether communities fall into high or low resilience categories.
Indicator 1: Dependence on Agriculture and Water
Based on work previously commissioned by the MDBA, if the percentage employed in agriculture exceeds 15%,4 the community may be considered to have low resilience.
Indicator 2: Community Advantage
The ABS Socio Economic Indexes for Areas (SEIFA) uses four indexes to determine relative socio-economic advantage and disadvantage across Australia. The score produced by the index (as determined by a range of census data) provides each LGA with a rank across their geographic area (state and national).
Of the four indexes, the Index of Relative Socio-Economic Advantage and Disadvantage (IRSAD) is best suited to determine the net advantage of a community. This index uses census data such as overcrowding, level of education, the cost of mortgage, and income, to summarise information on the economic and social conditions of people and households within an area4. A low score on this index reflects relatively greater disadvantage and lack of advantage (e.g. could indicate many households with low income with unskilled occupations), where as a high score indicates greater advantage in general (e.g. many households with high incomes in skilled occupations).
Using SEIFA, if the IRSAD ranking is below 150, a region may be considered to have low resilience. The value of 150 was determined through an initial trial of looking at Basin communities, but greater research and trials, may provide a more accurate rank or decile to distinguish between communities with high or low resilience.
Appendix K: Indicators to understand communities11 Appendices
1 MDBA 2011, Community impacts of the Guide to the proposed Murray-Darling Basin Plan, pp.122 MDBA 2016, The Northern Basin Review, 3 ibid.4 MDBA 2011, Op. Cit..
1 Terms of reference 7 Opportunities for efficiency ...2 Glossary 8 Cost of efficiency measures3 Executive summary 9 Principles for negating adv ...4 Introduction 10 A program to achieve 450 ...5 Potential socio-economic ... 11 Appendices6 Program design

Analysis of efficiency measures in the Murray-Darling Basin: Opportunities to recover 450GL in additional environmental water through efficiency measures by 2024, with neutral or positive socio-economic impacts | Page 306 of 307
19 January 2018 | Final Report
Indicator 3: Population decline
Community decline may be reflected with changes to demographics. Significant or continued decline in the working age population provides an indication of the economic activity and the capacity of that community to accommodate further structural changes. As an example, if the population of a community aged under 45 decreased by more than 6%, the community may be classified as having low resilience.1
Application of Indicators
The table below applies the above indicators to some communities in the Basin for illustrative purposes.
In Hay (NSW), 44% of the labour force is employed in agriculture, which is a key indicator of dependence on the industry. Hay also has a low IRSAD index and according to population data from 2016, there has been a decline in population of those under the age of 45 of up to 7%.
In Murray Bridge (SA), 24% of the labour force are employed directly or indirectly in agriculture. Murray Bridge also has a low IRSAD index, but its working age population has not declined. Satisfying two of the indicators would likely place Murray Bridge in the category of low resilience.
In contrast, Mildura would be considered to fall in the high resilient category with 17% of the labour force employed in agriculture, high IRSAD index showing relative high social advantage, and steady rate of working age population. Only one of the indicators is associated with relative lower resilience.
In establishing qualitative considerations, the level of water recovered through buybacks for these communities could also be considered as part of the historical context. Of all entitlements (buybacks and water efficiency measures) transferred from Hay, 76% were through buyback (54,300ML), which was 22% of total entitlements (247,200ML) for the region. In Murray Bridge, 84% of all entitlements transferred were through buybacks (4,200ML), which was 15% of their total entitlements (27,400ML). For Mildura, 2,300ML was transferred with buybacks 2.
These quantitative background considerations, give greater understanding to the existing resilience of the area and the specific circumstances of each community. Hay and Murray Bridge had large portions of entitlement taken through purchase, so the negative socio-economic impacts relating to buyback remain unclear. Although the amount taken may provide insight into the historical impacts.
Greater consideration of external factors may influence the weight of the indicators, as specific to each community. For instance, the location of Murray Bridge means large proportion of workers commute to Adelaide or Mt Barker for work. Consequently, there are other considerations (beyond water reliant business) in the region which diversify the local economy and income stream. Under these circumstances, Murray Bridge should not be considered as ‘low resilience’. Hence, in application these indicators are to be taken as a suggestion opposed to a framework ready for implementation.
Appendix K: Indicators to understand communities11 Appendices
LGA
Indicator 1 Indicator 2 Indicator 3
% employed directly or indirectly
by agriculture
SEIFA, Index IRSAD (rank within AU)
% Change in population under 45
Hay, NSW 44% 97 -6.55%
Murray Bridge, SA 24% 55 1.11%
Mildura, VIC 17% 117 0.61%
1 via email correspondence with MDBA, and documents received 14 July 2017.2 ibid.
Source: MDBA (2017), ABS (2011, 2016), ABS SEIFA Index and EY analysis.
1 Terms of reference 7 Opportunities for efficiency ...2 Glossary 8 Cost of efficiency measures3 Executive summary 9 Principles for negating adv ...4 Introduction 10 A program to achieve 450 ...5 Potential socio-economic ... 11 Appendices6 Program design

EY | Assurance | Tax | Transactions | AdvisoryAbout EY EY is a global leader in assurance, tax, transaction and advisory services. The insights and quality services we deliver help build trust and confidence in the capital markets and in economies the world over. We develop outstanding leaders who team to deliver on our promises to all of our stakeholders. In so doing, we play a critical role in building a better working world for our people, for our clients and for our communities.
EY refers to the global organization, and may refer to one or more, of the member firms of Ernst & Young Global Limited, each of which is a separate legal entity. Ernst & Young Global Limited, a UK company limited by guarantee, does not provide services to clients. For more information about our organization, please visit ey.com.
Ernst & Young LLP is a client-serving member firm of Ernst & Young Global Limited operating in the US.
© 2017 Ernst & Young LLP.All Rights Reserved.


