Embed Size (px)
Citation preview

Engineering Fracture Mechanics 76 (2009) 761–780
Contents lists available at ScienceDirect
Engineering Fracture Mechanics
journal homepage: www.elsevier .com/locate /engfracmech
Analysis of fracture and delamination in laminates using 3Dnumerical modelling
Marcela V. Cid Alfaro a, Akke S.J. Suiker a,*, René de Borst b, Joris J.C. Remmers b
a Chair of Engineering Mechanics, Faculty of Aerospace Engineering, Delft University of Technology, Kluyverweg 1, 2629 HS Delft, The Netherlandsb Chair of Numerical Methods in Engineering, Department of Mechanical Engineering, Eindhoven University of Technology, Eindhoven, The Netherlands
a r t i c l e i n f o
Article history:Received 31 January 2008Received in revised form 17 July 2008Accepted 1 September 2008Available online 18 September 2008
Keywords:Interface damage modelDoubly-deflected crackCrack tunnelingCentre-cracked tensile specimenFibre–metal laminatesGLARE
0013-7944/$ - see front matter � 2008 Elsevier Ltddoi:10.1016/j.engfracmech.2008.09.002
* Corresponding author. Tel.: +31 015 2781629; fE-mail address: [email protected] (A.S.J. Suik
a b s t r a c t
The static failure behaviour of the fibre–metal laminate GLARE is examined using 3D finiteelement simulations. The configuration analysed is a centre-cracked tensile specimen com-posed of two aluminium layers sandwiching a cross-plied, fibre-epoxy layer. The crack anddelamination growths are simulated by means of interface elements equipped with amixed-mode damage model. The mode-mixity is derived from an energy criterion typicallyused in linear elastic fracture mechanics studies. The damage kinetic law is rate-depen-dent, in order to simulate rate effects during interfacial delamination and to avoid numer-ical convergence problems due to crack bifurcations. The numerical implementation of theinterface damage model is based on a backward Euler approach. In the boundary valueproblem studied, the failure responses of GLARE specimens containing elastic aluminiumlayers and elasto-plastic aluminium layers are compared. The development of plasticdeformations in the aluminium layers stabilizes the effective failure response, andincreases the residual strength of the laminate. For a ‘quasi-brittle’ GLARE specimen withelastic aluminium layers, the residual strength is governed by the toughness for interfacialdelamination, and is in close correspondence with the residual strength obtained from aclosed-form expression derived from energy considerations. Conversely, for a ‘ductile’GLARE specimen with elasto-plastic aluminium layers, the residual strength is also deter-mined by the relation between the fracture strength and the yield strength of the alumin-ium. The amount of constraint by the horizontal displacements at the vertical specimenedges has a moderate to small influence on the residual strength. Furthermore, the ulti-mate laminate strength is lower for a larger initial crack length, and shows to be in goodcorrespondence with experimental values.
� 2008 Elsevier Ltd. All rights reserved.
1. Introduction
Failure under tensile loading is a design limiting characteristic of fibre-reinforced, layered composites. Experimental stud-ies have shown that the effective tensile response of these materials is bounded by the development of various failure mech-anisms at a lower scale, such as transverse matrix cracking, fibre decohesion and fracture, and interfacial delamination, seefor example [1–7] and references therein. In addition, modelling studies have demonstrated that the cracking and delami-nation patterns typically observed in layered composites depend upon local geometrical and material properties, such as thenumber, location and size of initial flaws, the stacking sequence, the fibre volume fraction, the toughness and stiffness char-acteristics of the individual plies, the interfacial delamination toughness, and the presence of residual stresses [8–16].
. All rights reserved.
ax: +31 015 2611465.er).

2 2
Mechanism 1 Mechanism 2 Mechanism 3
21
22
12
1
Mode crack
Tunneling directionTunneling directionTunneling direction
constant delamination lengthH−shape crack with
Iwithout delamination
Unstable delamination growthin all directions
Fig. 1. Three possible failure scenarios for a brittle laminate composed of two dissimilar, isotropically elastic materials subjected to uniaxial tension (takenfrom Suiker and Fleck [17]). Mechanism 1: Tunneling of a stable mode I crack with delamination absent. Mechanism 2: Tunneling of a stable H-shape crackwith constant delamination length. Mechanism 3: A tunneling crack with unstable delamination developing in all directions.
762 M.V. Cid Alfaro et al. / Engineering Fracture Mechanics 76 (2009) 761–780
Recently, Suiker and Fleck [17] studied the competition of three possible failure scenarios for a laminate composed of twodissimilar isotropically elastic layers, subjected to uniaxial tension, see Fig. 1. These failure scenarios are assumed to havegrown from a large pre-existing flaw in the mid-layer (material #1), where ‘mechanism 1’ reflects the tunneling of a stablemode I crack in the mid-layer with delamination absent, ‘mechanism 2’ represents the tunneling of a stable H-shape crackwith constant delamination length and ‘mechanism 3’ relates to a tunneling crack with unstable delamination growth in alldirections. It was found that the operative failure mechanism is strongly determined by the relative toughness of layer andinterface, and to a lesser extent by the stiffness mismatch of the layers, the location(s) of the initial flaws(s), and the numberof plies.
The results presented in [17] were determined combining 2D linear elastic fracture mechanics solutions for the problemsof (i) plane-strain delamination of an H-shape crack and (ii) steady-state tunneling of an H-shape crack. In line with this ap-proach, the crack nucleation phase was ignored, as well as the presence of plastic deformations in the individual layers.These effects, however, may contribute to the static failure behaviour of laminates containing ductile layers, such as thefibre–metal laminates ARALL and GLARE.1 In the present paper, the effects of plasticity and crack nucleation on the tensile fail-ure response of GLARE are examined by means of 3D finite element analyses. The configuration studied is composed of two alu-minium alloy sheets sandwiching a cross-plied, fibre-epoxy layer, where a horizontal initial crack is placed at the centre of thespecimen, across the thickness of the aluminium sheets, i.e., a centre-cracked tensile specimen is studied. After imposing thetensile loading, the centre crack starts to tunnel in the aluminium layers and induces delamination at the interfaces betweenthe aluminium and fibre-epoxy layers, effects that are simulated by means of interface elements equipped with a mixed-modedamage model, see also [18–24]. For the interface damage model used in the present study, the formulation of the mode-mixityis based upon an energy criterion regularly applied in linear elastic fracture mechanics studies [12,25], using a derivation pro-cedure similar to the one proposed recently by Turon et al. [26]. In addition, the kinetic law describing the evolution of the dam-age process is taken as rate-dependent. This is done to account for rate effects generated during interfacial delamination, and toavoid numerical convergence problems induced by crack bifurcations. The incorporation of these two features in the interfacedamage formulation distinguishes the present model from most other models presented in the literature. The individual alu-minium and fibre-epoxy layers of the laminate are modelled by solid-like shell elements [22,24,27]. These elements allowfor a linear strain field in thickness direction, which avoids the effect of Poisson-thickness locking that appears in conventionalvolume elements with a high aspect ratio in spatial dimensions, i.e., ‘slender’ volume elements [28]. The isotropic, elasto-plasticbehaviour of the aluminium layer is simulated using a J2-plasticity model with an exponentially saturating hardening law. Thecross-plied, fibre-epoxy layer is modelled as isotropically elastic. This simplification, which is reasonable if the elastic mismatchbetween fibres and matrix is moderate, allows part of the numerical results to be quantitatively compared to those presented inSuiker and Fleck [17]. Furthermore, the fracture mechanisms observed in the present study can then be adequately validatedagainst the failure scenarios depicted in Fig. 1.
The paper is organised as follows: Section 2 contains the formulation of the interface damage model used for the simu-lation of fracture within the laminate layers, and mixed-mode delamination along the interfaces between the layers. The
1 ARALL and GLARE are laminates composed of an alternating stack of aluminium sheets and fibre-epoxy (prepreg) layers, where ARALL is reinforced byaramid fibres and GLARE is reinforced by glass fibres, see [5] for more details on the characteristic properties, manufacturing procedures and applications ofthese materials.
M.V. Cid Alfaro et al. / Engineering Fracture Mechanics 76 (2009) 761–780 763
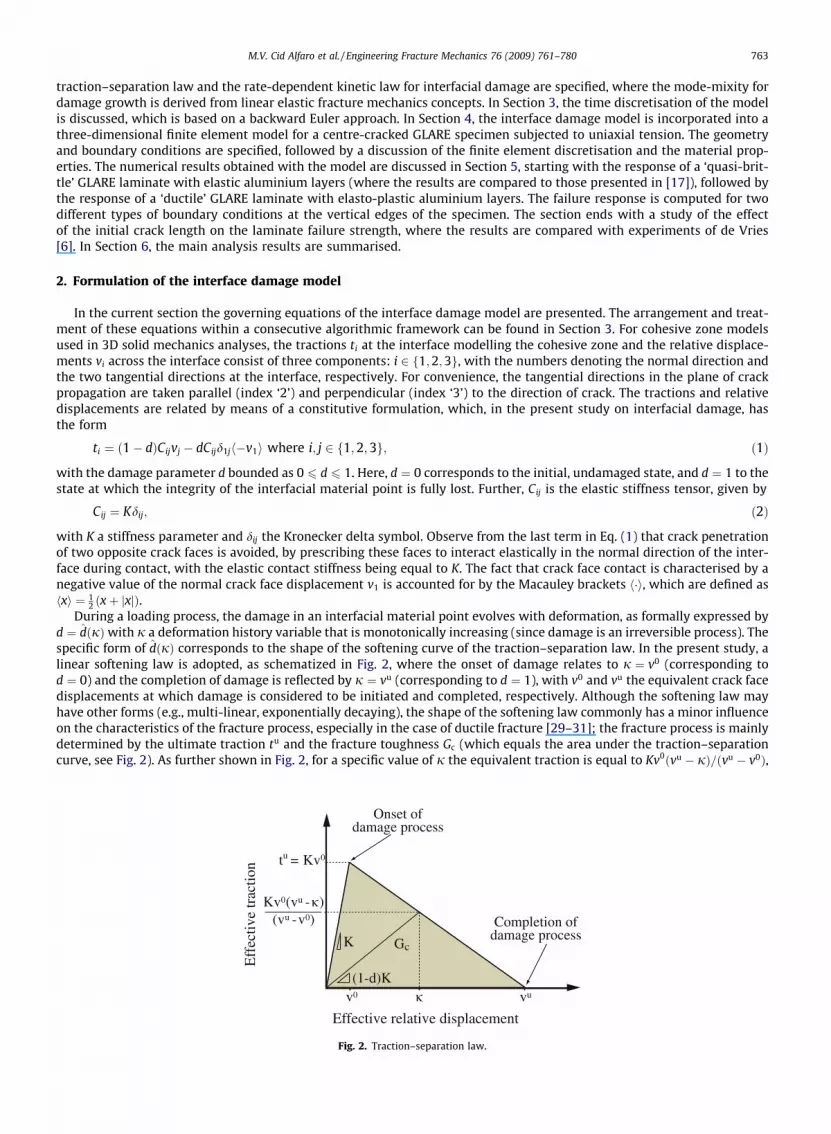
traction–separation law and the rate-dependent kinetic law for interfacial damage are specified, where the mode-mixity fordamage growth is derived from linear elastic fracture mechanics concepts. In Section 3, the time discretisation of the modelis discussed, which is based on a backward Euler approach. In Section 4, the interface damage model is incorporated into athree-dimensional finite element model for a centre-cracked GLARE specimen subjected to uniaxial tension. The geometryand boundary conditions are specified, followed by a discussion of the finite element discretisation and the material prop-erties. The numerical results obtained with the model are discussed in Section 5, starting with the response of a ‘quasi-brit-tle’ GLARE laminate with elastic aluminium layers (where the results are compared to those presented in [17]), followed bythe response of a ‘ductile’ GLARE laminate with elasto-plastic aluminium layers. The failure response is computed for twodifferent types of boundary conditions at the vertical edges of the specimen. The section ends with a study of the effectof the initial crack length on the laminate failure strength, where the results are compared with experiments of de Vries[6]. In Section 6, the main analysis results are summarised.
2. Formulation of the interface damage model
In the current section the governing equations of the interface damage model are presented. The arrangement and treat-ment of these equations within a consecutive algorithmic framework can be found in Section 3. For cohesive zone modelsused in 3D solid mechanics analyses, the tractions ti at the interface modelling the cohesive zone and the relative displace-ments vi across the interface consist of three components: i 2 f1;2;3g, with the numbers denoting the normal direction andthe two tangential directions at the interface, respectively. For convenience, the tangential directions in the plane of crackpropagation are taken parallel (index ‘2’) and perpendicular (index ‘3’) to the direction of crack. The tractions and relativedisplacements are related by means of a constitutive formulation, which, in the present study on interfacial damage, hasthe form
ti ¼ ð1� dÞCijvj � dCijd1jh�v1i where i; j 2 f1;2;3g; ð1Þ
with the damage parameter d bounded as 0 6 d 6 1. Here, d ¼ 0 corresponds to the initial, undamaged state, and d ¼ 1 to thestate at which the integrity of the interfacial material point is fully lost. Further, Cij is the elastic stiffness tensor, given by
Cij ¼ Kdij; ð2Þ
with K a stiffness parameter and dij the Kronecker delta symbol. Observe from the last term in Eq. (1) that crack penetrationof two opposite crack faces is avoided, by prescribing these faces to interact elastically in the normal direction of the inter-face during contact, with the elastic contact stiffness being equal to K. The fact that crack face contact is characterised by anegative value of the normal crack face displacement v1 is accounted for by the Macauley brackets h�i, which are defined ashxi ¼ 1
2 ðxþ jxjÞ.During a loading process, the damage in an interfacial material point evolves with deformation, as formally expressed by
d ¼ dðjÞwith j a deformation history variable that is monotonically increasing (since damage is an irreversible process). Thespecific form of dðjÞ corresponds to the shape of the softening curve of the traction–separation law. In the present study, alinear softening law is adopted, as schematized in Fig. 2, where the onset of damage relates to j ¼ v0 (corresponding tod ¼ 0) and the completion of damage is reflected by j ¼ vu (corresponding to d ¼ 1), with v0 and vu the equivalent crack facedisplacements at which damage is considered to be initiated and completed, respectively. Although the softening law mayhave other forms (e.g., multi-linear, exponentially decaying), the shape of the softening law commonly has a minor influenceon the characteristics of the fracture process, especially in the case of ductile fracture [29–31]; the fracture process is mainlydetermined by the ultimate traction tu and the fracture toughness Gc (which equals the area under the traction–separationcurve, see Fig. 2). As further shown in Fig. 2, for a specific value of j the equivalent traction is equal to Kv0ðvu � jÞ=ðvu � v0Þ,
tu = Kv0
Kv0(vu -κ)(vu -v0)
v0 κ vu
K
(1-d)K
Gc
Eff
ectiv
e tr
actio
n
Onset of damage process
Completion ofdamage process
Effective relative displacement
Fig. 2. Traction–separation law.

764 M.V. Cid Alfaro et al. / Engineering Fracture Mechanics 76 (2009) 761–780
or, alternatively, in terms of the damage parameter d, equal to ð1� dÞKj. Equating these two expressions for the tractionleads to the following expression for the damage parameter:
d ¼ dðjÞ ¼ vuðj� v0Þjðvu � v0Þ : ð3Þ
In contrast to rate-independent damage processes, for rate-dependent damage processes the evolution of the damageparameter d is not set by the deformation only, but also by its rate, as described by a specific kinetic law. The actual valueof the corresponding history variable j is then obtained by the inverted form of Eq. (3). In the present study, the followingrate-dependent kinetic law is proposed:
_d ¼Fðk;jÞ
gfor k P j and v0
6 j < vu;
0 for 0 6 k < j or j ¼ vu;
8><>: ð4Þ
where g is a relaxation parameter (with dimension of time) and Fðk;jÞ is the damage loading function. In Eq. (4), the upperexpression reflects the rate of damage when the effective deformation k exceeds the threshold j, whereas the lower expres-sion sets the rate of damage equal to zero when (i) the threshold value has not (yet) been reached, (ii) the interfacial materialpoint is in a state of unloading, or (iii) the damage process has completed. The deformation measure k is taken here as theEuclidean norm of the vector of relative crack face displacements, k ¼ jvj ¼
ffiffiffiffiffiffiffiffiffiffiffiffiffiffiffiffiffiv2
1 þ v2sh
q, with vsh the total shear displacement,
vsh ¼ffiffiffiffiffiffiffiffiffiffiffiffiffiffiffiffiv2
2 þ v23
q. Furthermore, the loading function has the form
Fðk;jÞ ¼ f ðkÞ � dðjÞ ¼ vuðk� v0Þkðvu � v0Þ �
vuðj� v0Þjðvu � v0Þ ; ð5Þ
where the right expression is obtained by substituting Eq. (3) for dðjÞ, and choosing the form of f ðkÞ to be similar as dðjÞ.The specific form of the kinetic law, Eq. (4), is analogous to the form often used in visco-plasticity modelling (see e.g. [32]),
with the equivalent plastic strain rate being replaced by the damage rate and the static yield function by the damage loadingfunction. In the limit of the relaxation parameter going to zero, g! 0, the kinetic law, Eq. (4), turns into the rate-indepen-dent loading condition, Fðk;jÞ ¼ 0, which, as can be observed from Eq. (5), is identical to k ¼ j. Under these circumstances,the loading–unloading conditions are represented by the Kuhn–Tucker relations
ðk� jÞ _j ¼ 0; k� j 6 0; _j P 0: ð6Þ
Hence, the present interface damage model can be used for describing both (virtually) rate-independent fracture in themetal layers of GLARE and rate-dependent delamination at the metal-prepreg interfaces, by setting the relaxation parameterg accordingly.
In mixed-mode fracture processes, the equivalent crack face displacements v0 and vu appearing in Eq. (5) are dependenton the relation between the normal and shear displacements at the interface. As recently proposed by Turon et al. [26], thisrelation may be captured by the following mode-mixity parameter:
b ¼ vsh
vsh þ hv1i: ð7Þ
In this definition, pure mode I loading is reflected by vsh ¼ 0, and thus by b ¼ 0, whereas pure shear loading relates tov1 ¼ 0, and thus to b ¼ 1. Turon et al. [26] demonstrated that the functions v0 ¼ v0ðbÞ and vu ¼ vuðbÞ can be computed adopt-ing a specific mixed-mode failure criterion from linear elastic fracture mechanics. The mixed-mode criterion adopted in thepresent study is a model regularly used to characterise mixed-mode toughness data for brittle interfacial fracture [12,25], i.e.
GI
GI;cþ GII
GII;cþ GIII
GIII;c¼ 1; ð8Þ
where GI, GII and GIII are the mode I, mode II and mode III energy release rates, and GI;c, GII;c and GIII;c are the toughnessesunder pure mode I, pure mode II and pure mode III loading conditions. For simplicity, the mode II and mode III fracturetoughnesses are assumed to have a common value, Gsh;c ¼ GII;c ¼ GIII;c, as a result of which the criterion (8) reduces to
GI
GI;cþ Gsh
Gsh;c¼ 1; ð9Þ
with Gsh ¼ GII þ GIII. Essentially, the above fracture criterion is an extension of the well-known Griffiths’ criterion, G ¼ Gc,where G is the total energy release rate measured at the crack tip and Gc is the effective fracture toughness (which thus de-pends on the mode-mixity of the loading). As already mentioned, the fracture toughness Gc is represented by the area underthe traction–separation curve in Fig. 2, and thus can be computed as
Gc ¼ bGcðbÞ ¼12
Kv0ðbÞvuðbÞ: ð10Þ
In the limits of pure mode I loading (b ¼ 0) and pure shear loading (b ¼ 1), the fracture toughness in Eq. (10), respectivelyreduces to:

2 Anmateria[12]. Thboundadiscrep
M.V. Cid Alfaro et al. / Engineering Fracture Mechanics 76 (2009) 761–780 765
GI;c ¼ Gcðb ¼ 0Þ ¼ 12
Kv01vu
1;
Gsh;c ¼ Gcðb ¼ 1Þ ¼ 12
Kv0shvu
sh;
ð11Þ
where v01 ¼ tu
1=K is the displacement at which damage is initiated under pure mode I loading, with tu1 being the ultimate nor-
mal traction, v0sh ¼ tu
sh=K is the displacement related to damage initiation under pure shear loading, and vu1 and vu
sh are thecorresponding ultimate displacements at which damage is completed, with the ultimate shear traction tu
sh being computed
from the two tangential traction components as tush ¼
ffiffiffiffiffiffiffiffiffiffiffiffiffiffiffiffiffiffiffiffiffiffiffiffiffiffiðtu
2Þ2 þ ðtu
3Þ2
q.
In order to find expressions for v0 and vu in terms of the mode-mixity b, Griffiths’ criterion, G ¼ Gc, is incorporated into Eq.(9), which leads to
GI
GI;cþ Gsh
Gsh;c¼ G
Gc: ð12Þ
This expression can be further developed by writing the total energy release rate as2 G ¼ GI þ Gsh and substituting thisform into the right-hand side of Eq. (12). In line with this decomposition, the individual crack mode components of the energyrelease rate are expressed in terms of the relative crack face displacements as GI ¼ cv2
1 and Gsh ¼ cv2sh, with c a proportionality
factor (with dimension of force � length-3) that depends on the stiffness and geometry properties of the configuration underconsideration and on the actual position along the crack faces at which the relative crack face displacements are evaluated(commonly measured with respect to the origin of the crack tip, see [12]). Invoking Eq. (10), and using the definition of themode-mixity parameter b, Eq. (7), to express the relative normal displacement in terms of the relative shear displacement asv1 ¼ vshð1� bÞ=b, Eq. (12) can be elaborated into an expression for vu:
vu ¼ vuðbÞ ¼ 2ð1þ 2b2 � 2bÞKv0
ð1� bÞ2
GI;c
!þ b2
Gsh;c
!" #�1
; ð13Þ
with GI;c and Gsh;c given by Eq. (11). An explicit expression for the parameter v0 can be found by substituting Eq. (11)1,2 intoEq. (13), replacing vu, vu
1 and vush by the corresponding initial values v0, v0
1 and v0sh, and solving for v0. This results in
v0 ¼ v0ðbÞ ¼ v01v0
sh
ffiffiffiffiffiffiffiffiffiffiffiffiffiffiffiffiffiffiffiffiffiffiffiffiffiffiffiffiffiffiffiffiffiffiffiffiffiffiffiffiffiffiffiffiffiffiffi1þ 2b2 � 2b
bv01
� �2 þ ð1� bÞv0sh
� �2
vuut : ð14Þ
Note from Eqs. (13) and (14) that the mode-mixity b is indeed the only variable in the expressions for vu and v0 (since theother parameters represent interfacial fracture data).
3. Time discretisation of the interface damage model
In order to perform finite element simulations with the interface damage model presented in the previous section, themodel formulation needs to be discretised in time. Using a backward Euler approach, for each discrete time interval½tn; tnþ1� the model variables in an interfacial integration point are evaluated at time tnþ1 (¼ tn þ Dtnþ1) assuming the corre-sponding values at the previous time step tn are known. In a displacement-based finite element method, the incrementalupdate at integration point level is governed by the relative displacements vnþ1 across the interface. These displacementsare provided as input from the global iterative procedure at the system level. With the relative displacements, the deforma-tion measure k is updated as knþ1 ¼ kðvnþ1Þ ¼ kvnþ1k. This value is compared against the history parameter jn computed atthe previous time step, where for knþ1 > jn damage is assumed to occur, and for knþ1 6 jn the response is considered to beelastic (i.e., no damage has occurred (yet), or the integration point is subjected to elastic unloading). The history parameter isinitialised as j0
n ¼ v0nþ1 ¼ v0ðbnþ1Þ, using Eq. (14) with bnþ1 ¼ vsh;nþ1=ðvsh;nþ1 þ hv1;nþ1iÞ. Subsequently, the damage increment
Ddnþ1 is computed by combining Eqs. (4) and (5) (with all parameters evaluated at tnþ1), with the time discretisation of thedamage rate in accordance with Ddnþ1 � _dnþ1Dtnþ1. This leads to
Ddnþ1 ¼ðfnþ1 � dnÞDtnþ1
gþ Dtnþ1for knþ1 > jn;
0 for 0 6 knþ1 6 jn:
8<: ð15Þ
additive decomposition of the energy release rate into its individual crack mode components is allowed if the stiffness properties of the two elastic bulkls separated by a propagating, brittle interfacial crack are in agreement with the second Dundur’s stiffness mismatch parameter being equal to zero, seeis condition is not met strictly for most of the elastic fracture configurations studied in this work. Moreover, the present interface crack model is used inry value problems where the bulk materials experience plastic yielding. However, based on heuristic reasoning it may be assumed that the effect of thisancy on the computational results remains relatively small.

766 M.V. Cid Alfaro et al. / Engineering Fracture Mechanics 76 (2009) 761–780
where fnþ1 is given by
fnþ1 ¼vu
nþ1 knþ1 � v0nþ1
� �knþ1 vu
nþ1 � v0nþ1
� � ; ð16Þ
and vunþ1 ¼ vuðbnþ1Þ is calculated from Eq. (13). Formally, the damage process is completed if the damage parameter reaches
unity. Correspondingly, in the present algorithm completion of damage is checked by means of the condition:dn þ Ddnþ1 > 1� e, where e is a small positive value (0 < e� 1), introduced here to improve the global numerical conver-gence behaviour when locally damage has completed. If the above condition holds, the damage process is considered to havefinished and, accordingly, the damage parameter is then set equal to the maximum value, dnþ1 ¼ 1� e. Hence, the update ofthe damage parameter can be concisely formulated as
dnþ1 ¼ min dn þ Ddnþ1;1� eð Þ: ð17Þ
For any damage value within the range 0 6 dnþ1 6 1� e, the traction vector, tnþ1 ¼ tðvnþ1; dnþ1Þ, is computed by substitut-ing the relative displacement vector, vnþ1 together with the updated damage variable, dnþ1 ¼ dðvnþ1Þ, into Eq. (1), which re-sults in
ti;nþ1 ¼ ð1� dnþ1ÞK vi;nþ1 � dnþ1Kd1ih�v1;nþ1i with i 2 f1;2;3g; ð18Þ
where use has been made of Eq. (2). In addition, the history parameter j is updated using the inverted form of Eq. (3), i.e.
jnþ1 ¼v0
nþ1vunþ1
vunþ1 � ðvu
nþ1 � v0nþ1Þdnþ1
: ð19Þ
From the above expression, it can be confirmed that completion of damage corresponds to jnþ1 ¼ vunþ1 (when ignoring the
contribution by the small value e in Eq. (17)). Note that the present time integration procedure can be performed withoutany iterations, due to the use of the specific damage loading function, Eq. (5), in the kinetic law, Eq. (4). Alternative, morecomplex forms of the damage loading function require an iterative time integration procedure at the integration point level,which obviously is computationally more expensive.
The tangent operator necessary for constructing the stiffness matrix at the system level follows from
dtnþ1
dvnþ1¼ otnþ1
ovnþ1þ otnþ1
odnþ1
odnþ1
ovnþ1; ð20Þ
which, with Eq. (18), leads to
dti;nþ1
dvj;nþ1¼ Kdij � dnþ1K dij þ d1i
h�v1;nþ1iv1;nþ1
d1j
� �� odnþ1
ovj;nþ1K vi;nþ1 þ d1ih�v1;nþ1i� �
: ð21Þ
Here, the derivative odnþ1=ovnþ1 can be determined from Eqs. (15) to (17) as
odnþ1
ovj;nþ1¼
v0nþ1vu
nþ1
k3nþ1ðvu
nþ1 � v0nþ1Þ
Dtnþ1
gþ Dtnþ1vj;nþ1 1þ h�v1;nþ1i
vj;nþ1d1j
� �for knþ1 > jn and 0 < dnþ1 < 1� e;
0 else;
8>>><>>>: ð22Þ
where the multiplication factor ð1þ d1jhv1;nþ1i=vj;nþ1Þ has been added in the upper expression to account for the fact that thederivative in the normal direction of the interface, odnþ1=ov1;nþ1, is zero during (elastic) crack face contact. For reasons of sim-plicity, the extensive terms related to the derivatives ov0
nþ1=ovj;nþ1 and ovunþ1=ovj;nþ1 are ignored in Eq. (22). This simplification
is acceptable if the mode-mixity b varies rather slowly with deformation, causing these derivatives to remain relativelysmall. However, for boundary value problems where the mode of fracture changes abruptly with deformation, additionalcomputations not presented here have shown that the tangent operator given by Eq. (22) may induce a drastic collapsein the global convergence rate (i.e., a transition from a quadratic to a quasi-linear convergence rate). Under these circum-stances it may be preferential to compute the tangent operator numerically (see [33] for the case of small deformationsand [34,35] for the case of finite deformations), in order to preserve the quadratic convergence rate at the system leveland to avoid the analytical determination of the extensive derivatives ov0
nþ1=ovj;nþ1 and ovunþ1=ovj;nþ1.
4. Numerical model of a centre-cracked 2/1 GLARE laminate subjected to uniaxial tension
4.1. Geometry and boundary conditions
The interface damage model presented in the previous section is used to study mode I fracture and interfacial delamina-tion in a centre-cracked 2/1 laminate subjected to uniaxial tension, see Fig. 3. The 2/1 lay-up refers to a laminate composed oftwo aluminium layers sandwiching a single fibre-epoxy layer. Laminates reinforced by glass fibres are commercially known

u
u
W = 40 mm
L =
60
mm
2/1 GLARE laminate 2a 0
Length centre crack: 2a 0 = 4.8 mm
Fig. 3. Dimensions of a centre-cracked tensile specimen made of 2/1 GLARE.
M.V. Cid Alfaro et al. / Engineering Fracture Mechanics 76 (2009) 761–780 767
as GLARE. For this material the aluminium and fibre-epoxy layers commonly have thicknesses of 0.3 mm and 0.25 mm,respectively (see e.g. [6]), which leads to a total specimen thickness of 0.85 mm. The specimen length is taken as L ¼ 60mm and its width equals W = 40 mm. The initial pre-crack at the centre of the specimen is placed across the completethickness of the two aluminium layers, and has a length of 2a0 ¼ 0:12W ¼ 4:8 mm. The tensile loading is imposed by pre-scribing a remote normal displacement u1 at the top and bottom edges of the laminate, which induces a uniform remotetensile stress r1 in the aluminium layer at short distance from the top and bottom edges. Quasi-static loading conditionsare warranted by applying a relatively small nominal strain rate _u1=L ¼ 10�5 s�1. As demonstrated by experimental andmodelling studies on the static and fatigue failure behaviour of centre-cracked laminates [5,6,17,36–38], under the appliedremote tensile loading the initial pre-crack will start to tunnel as a mode I crack through the aluminium sheet, thereby ini-tiating delamination along the interface between the aluminium (material #1) and fibre-epoxy (material #2) layers. Thecomplete fracture mechanism has been sketched in Fig. 4 (Left), and can be denoted as a tunneling, doubly-deflected crack[17]. Since the doubly-deflected cracks in the two outer layers of the 2/1 specimen taken together resemble an H-shapecrack, this fracture mechanism is comparable to the failure scenarios depicted in Fig. 1.
Tunneling
direction
Delaminationlength
u
u
u
u
#1#1 #2 #1#1 #2
xy
z
Fig. 4. Left: doubly-deflected crack in the two outer layers of a 2/1 GLARE laminate subjected to uniaxial tension (imposed by a remote displacement u1).The laminate is composed of two aluminium (material #1) layers sandwiching a single, cross-plied, fibre-epoxy (material #2) layer. Right: One symmetricaloctant of the centre-cracked tensile specimen, used in the numerical simulations.

768 M.V. Cid Alfaro et al. / Engineering Fracture Mechanics 76 (2009) 761–780
In order to examine how plasticity in the aluminium layer affects the failure characteristics of the specimen, simulationsin which the aluminium layer behaves isotropically elastic are compared to simulations where the aluminium is modelled asisotropically elasto-plastic. In both cases the fibre-epoxy layer is modelled as isotropically elastic. This is an acceptable sim-plification if the internal structure of the fibre-epoxy layer is cross-plied, i.e., made of two sublayers of 0.125 mm thicknesswith the uni-directional fibres oriented under 0� and 90�, respectively, see Fig. 4 (Left), and the elastic mismatch between thefibres and the epoxy is moderate. The assumption of an isotropic fibre-epoxy layer increases the degree of symmetry of theproblem, such that only one octant of the actual geometry may be modelled, see Fig. 4 (Right). Trivially, this significantlyreduces the computational time of the analysis. Furthermore, this simplification allows the present computational resultsto be compared to results reported by Suiker and Fleck [17], which relate to fracture and delamination processes in lay-ups composed of brittle, isotropic elastic layers. The symmetry of the configuration depicted in Fig. 4 (right) is warrantedby fixed and roller supports, and by using a customized interface element that relates the interface tractions of the modeI crack in the aluminium (propagating along the horizontal x–y symmetry plane half-way the specimen) to half of the relativecrack face displacements across the interface.
The effect of the boundary conditions at the right edge of the specimen on the failure response is studied by consideringtwo cases. The first case, referred to as ‘BC1’, reflects the unconstrained situation, where the normal traction at the right ver-tical edge of the specimen (i.e., the normal traction in the x-direction) is prescribed as zero. The second case, referred to as‘BC2’, reflects a constrained situation, where the normal displacement at the right vertical edge of the specimen (i.e., the dis-placement in x-direction) is set to zero. For both cases the shear tractions at all specimen boundaries are prescribed to bezero.
4.2. Finite element discretisation
The numerical analyses are performed within a large-displacement, small-strain framework, where the aluminium andfibre-epoxy layers are meshed with 16-node, iso-parametric solid-like shell elements, with a 2 � 2 � 2 Gauss quadrature[22,24,27]. As illustrated in Fig. 5, these elements have eight nodes at their element corners (indicated by the solid circles‘1–8’) and eight nodes half-way each element side (indicated by the open circles ‘9–16’).
In addition, they have four internal nodes (indicated by the open squares ‘a–d’), which are positioned at the four cornersof the mid-surface that is located half-way the element thickness. The internal nodes are used for constructing a linear strainfield in the thickness direction (i.e., the f-direction) of the element, which remedies the problem of Poisson-thickness lockingthat characterises conventional volume elements with a high length-to-thickness ratio see [22,24,27] for more details. At theplane at which interfacial delamination between the aluminium layer and the fibre-epoxy layer is expected, the top (or bot-tom) surface of the solid-like shell element, which is spanned by eight nodes in the n� g plane, is connected to a sixteen-node interface element, see Detail A in Fig. 6. This interface element has eight nodes per surface, and is equipped with a 3 � 3Newton–Cotes quadrature. The numerical formulation of the geometrically non-linear interface element is based on [18,19],see also [22]. At the plane along which mode I fracture in the aluminium layer develops, the side surface of the solid-likeshell element, which consists of six nodes in the g� f (or n� f) plane, is attached to a 12-node interface element (whichhas six nodes per surface), equipped with a 3 � 2 Newton–Cotes quadrature. The total number of solid-like shell elementsused for meshing the aluminium layer and the fibre-epoxy layer is 2 � 700 = 1400, see Fig. 6. Correspondingly, the number ofsixteen-node interface elements used for meshing the plane along which delamination is expected equals 700. In addition,
15
5
16
8
10
7
6
Geometrical corner node
Internal node
Geometrical mid−side node
a
b
c
3
d
1213
9
1
2
11144
ηζ
ξ
Fig. 5. Geometry of a 16-node, iso-parametric solid-like shell element. The element is composed of 16 geometrical nodes (indicated by the circles ‘1–16’)and four internal nodes (indicated by the squares ‘a–d’).

2.4Initial crack
17.6
Tunneling direction
{
Inte
rfac
e el
emen
ts
20
Point A
( All measures are in [mm] )
0.425
30
Sym
met
ry
plan
e
Symmetry plane
z
x
Sym
met
ry
plan
e
uy 0
verticalspecimen
edge
BC 1
z
x
BC 2
x
sls elements(aluminium)
interface elements
sls elements(fibre-epoxy)
yz
DETAIL A
DETAIL A∞
Fig. 6. Finite element mesh and boundary conditions for the GLARE 2/1 specimen. The case ‘BC1’ refers to a specimen where the horizontal displacement atthe vertical specimen edge is unconstrained, i.e., a traction-free boundary, whereas for the case ‘BC2’, depicted in the lower right inset, these horizontaldisplacements are fully constrained. The upper right inset shows the details of the connection between the solid-like shell (sls) elements and the interfaceelements, close to the initial pre-crack.
M.V. Cid Alfaro et al. / Engineering Fracture Mechanics 76 (2009) 761–780 769
the number of 12-node interface elements used for modelling the plane along which the mode I crack in the aluminiumdevelops is 22. This results into a total number of 2122 elements.
As further illustrated in Fig. 6, the finite element mesh is relatively fine close to the plane along which the mode I crackpropagates, and becomes coarser towards the top edge of the specimen at which the loading is applied. The relatively smallinterface elements capturing the mode I crack growth and the initial part of the interfacial delamination process are approx-imately square-shaped, having a size D. For the fracture problems studied in [39], convergence of the numerical results uponmesh refinement was observed when the value of D was chosen smaller than 4 times the ultimate separation vu used in thetraction–separation law. Accordingly, in the present study the size of the interface elements at the mode I crack tip and at thedelamination tip is chosen such that D=vu is approximately equal to 1.5 and 2.5, respectively.
4.3. Material properties
The material data used in the numerical model is listed in Table 1. The elasto-plastic response of the aluminium layers issimulated using a standard J2-flow theory (Von Mises plasticity), where the yield strength ry evolves in accordance with anexponentially-saturating hardening law:
ry ¼ ry jpð Þ ¼ r0y þ ru
y � r0y
� �1� exp �njpð Þð Þ: ð23Þ
The evolution from the initial yield strength r0y (= 305 MPa) to the ultimate yields strength ru
y (= 430 MPa) (repre-senting the saturation state) is in correspondence with uniaxial stress–strain data reported in [40] for the aluminiumalloy 2024-T3 typically used in GLARE. The yielding saturation state of this type of aluminium is reached at an equiv-alent plastic strain jp of about 15%, which is captured by setting the hardening rate parameter in Eq. (23) as n ¼ 27[–].The effective Young’s modulus and the Poisson’s ratio of the fibre-epoxy layer are computed by averaging the stiffnessvalues and Poisson’s ratios in the fibre-direction and perpendicular to the fibre-direction, as reported in [40]. The dum-my elastic stiffness K of the interface elements modelling the mode I crack and the delaminating crack is taken relatively

Table 1Material properties of a GLARE laminate
Parameter(s) Value(s)
Aluminium layerYoung’s modulus E ¼ 72 [GPa]Poisson’s ratio m ¼ 0:33 [–]Initial yield strength r0
y ¼ 305 [MPa]Ultimate yield strength ru
y ¼ 430 [MPa]Hardening rate parameter n ¼ 27 [–]
Fibre-epoxy layerYoung’s modulus E ¼ 32 [GPa]Poisson’s ratio m ¼ 0:20 [–]
Mode I crack in aluminiumElastic stiffness K ¼ 1� 108 [N/mm3]Ultimate normal traction (3 cases) tu
1 ¼ 430 [MPa] (= 1.4r�), 610 [MPa] (= 2.0r�), 915 [MPa] (= 3.0r�), with r� ¼ 305 [MPa])Fracture toughness GI;c ¼ 112 [N/mm]Relaxation parameter g ¼ 2� 10�5 [s]Numerical offset at damage completion e ¼ 10�8 [–]
Interfacial delaminationElastic stiffness K ¼ 1� 106 [N/mm3]Ultimate normal traction tu
1 ¼ 50 [MPa]Ultimate shear traction tu
2 ¼ tu3 ¼ 25 [MPa]
Fracture toughnesses GI;c ¼ GII;c ¼ GIII;c ¼ 4 [N/mm]Relaxation parameter g ¼ 2� 10�3 [s]Numerical offset at damage completion e ¼ 10�6 [-]
770 M.V. Cid Alfaro et al. / Engineering Fracture Mechanics 76 (2009) 761–780
high, such that in the elastic regime the interfacial deformations remain negligibly small. Observe from Table 1 that thestiffness value for the delaminating crack is taken a little lower than that of the mode I crack in the aluminium, whichhas been done in order to optimise the convergence behaviour of the numerical simulations. The value of the mode Ifracture toughness, GI;c, is determined adopting the value for the critical mode I stress intensity factor K I;c ¼ 89:6 MPa
ffiffiffiffiffimp
reported in Hashagen [22] (which was obtained by calibrating the crack mouth opening displacement and the effectivecrack length in a centre-cracked aluminium sheet subjected to uniaxial tension), and substituting this value into Irwin’srelation, GI;c ¼ K2
I;c=E, where E is the Young’s modulus of the aluminium. Values for the ultimate normal traction of themode I crack in the aluminium, tu
1, have not been widely reported in the literature. In Hashagen [22], the ultimate nor-mal traction was taken approximately 1.3 times higher than the initial yield strength of the aluminium layer. Further-more, the studies of Tvergaard and Hutchinson [29] and Chen et al. [39] showed that the ratio between the ultimatenormal traction of the crack and the initial yield strength of the surrounding elasto-plastic bulk material may have asignificant influence on the effective crack growth resistance. Correspondingly, in the present analysis the ultimate trac-tion is varied, considering the following three values: tu
1 ¼ 1:4r�, 2:0r� and 3:0r�, with the reference stress taken asr� ¼ 305 MPa (which equals the initial yield strength r0
y in the elasto-plastic model for the aluminium). The mode I frac-ture toughness of a delaminating crack is obtained from test data for a 2/1 GLARE specimen subjected to mode I delam-ination [41]. For simplicity, the mode II and III delamination toughnesses are chosen to have the same value as the modeI toughness, so that the effective delamination toughness Gc becomes independent of the mode-mixity. The ultimatetractions for the delaminating crack, tu
1, tu2 and tu
3, are taken equal to the values reported in Hashagen [22], which weredetermined from shear and tensile tests on a prepreg material typically used in GLARE. The relaxation parameter g forthe mode I crack is taken very small such that under quasi-static loading conditions the crack advancement occurs vir-tually rate-independently. For the delaminating crack, the relaxation parameter g is chosen slightly larger in order toavoid convergence problems due to crack bifurcations; additional simulations not presented here have shown that inthe limit of a truely rate-independent fracture behaviour (i.e., g! 0) the convergence of the present numerical simula-tions cannot be warranted. A detailed analysis on rate effects during interfacial delamination is considered to be a topicfor future studies. Finally, both for the mode I crack and the delaminating crack the parameter e, which represents the(small) numerical offset at damage completion, see Eq. (17), is taken equal to the inverse value of the correspondingelastic stiffness K of the interface.
5. Modelling results
In Table 2 an overview of the numerical simulations is given. With the present selection of simulations, the influence ofthe following four aspects on the effective failure response is studied: (i) The value of the ultimate traction of the mode Icrack in the aluminium, (ii) the generation of plasticity in the aluminium layers, (iii) the type of boundary conditions atthe vertical specimen edge, and (iv) the initial crack length.

M.V. Cid Alfaro et al. / Engineering Fracture Mechanics 76 (2009) 761–780 771
5.1. 2/1 lay-up with elastic aluminium layers
For the case where the aluminium layer behaves elastically, Fig. 7a depicts the remote stress in the aluminium layer (eval-uated at the top of the laminate, near the horizontal edge at which the loading is applied) plotted against the normal openingof the mode I crack in the aluminium (measured at the tip position of the initial pre-crack, as represented by point A in Fig. 6)for three different values of the ultimate normal traction, tu
1, of the mode I crack (as listed in Table 1).The characters ‘a–f’, which indicate different deformation stages, correspond to the delamination profiles in Fig. 7b and c
for the cases where the ultimate traction of the mode I crack is tu1 ¼ 1:4r� and tu
1 ¼ 2:0r�, respectively. Since the delamina-tion evolution for the case with tu
1 ¼ 3:0r� looks similar to that of the case with tu1 ¼ 2:0r� (with the only difference being a
somewhat stronger delamination development during the initial loading stage), the former case has not been visualized.From Fig. 7a it can be observed that the remote stress initially increases, subsequently reaches a maximum value, then de-creases (thus representing an unstable, softening response) and finally asymptotes to a (residual) stress level that remainsapproximately constant under continuing crack opening. Clearly, the value of the maximum remote stress is higher for ahigher value of the fracture strength tu
1 of the aluminium, i.e., r1max ¼ 720 MPa, 760 MPa and 913 MPa for tu1 ¼ 1:4r�, 2:0r�
and 3:0r�, respectively. The fact that the local ultimate traction influences the remote stress indicates that the size of thefracture process zone of the tunneling crack cannot be ignored with respect to its length and/or the total specimen width.If this would be the case, the crack would be of the Griffith type, where the remote stress only depends on the local tough-ness characteristics of the crack [12]. However, due to the crack bridging behaviour by the fibre-epoxy layer, the size of theprocess zone of the tunneling crack is significant. A more detailed discussion on the size of the process zone of the aluminiumcrack will follow later in this section.
The delamination profiles in Fig. 7b and c are obtained by graphically connecting the integration points in which the dam-age d has just exceeded the value of 0.99 (which thus is close to the maximum damage value d ¼ 1). The x- and z-coordinatesused for denoting the location of the profiles are in correspondence with the coordinate system depicted in Fig. 6, with theorigin taken at the centre of the initial pre-crack. It can be observed that the differences in delamination growth fortu
1 ¼ 1:4r� and tu1 ¼ 2:0r� are small. In both cases, the delamination profile initially develops with increasing length of the
mode I crack in the aluminium (stages ‘a’ and ‘b’), where the maximum delamination takes place at the specimen centre.When the mode I crack reaches the vertical specimen edge, the delamination starts to develop mainly in the vertical direc-tion. After stage ‘d’ the delamination profile has become almost uniform across the specimen width (only near the free edgethe delamination is slightly larger), where the growth process closely approximates the condition of steady-state delamina-tion. In Suiker and Fleck [17] a closed-form expression has been presented for the remote failure stress for steady-statedelamination that propagates along the two outermost plies of a uniaxially-loaded, brittle laminate. This expression is de-rived from the energy difference upstream and downstream of the delamination front, and reads
Table 2Overvietraction
Aluminfibre-
Aluminand fi
r1ss ¼
ffiffiffiffiffiffiffiffiffiffiffiffiffiffiffiffiffiffiffiffiffiffiffiffiffiffiffiffiffiffiffiffiffiffiffiffiffiffiffiffiffiffiffiffiffiffiffiffiffiffiffiffiffiffiffiffiffiffiffiffiffiffiffiffiffiffiffiffiffiffiffiffiffiffiffi4�E1Gc ðn� 2Þw1
�E1 þ ðn� 1Þw2�E2
� �2w1 nw1
�E1 þ ðn� 1Þw2�E2
� �s: ð24Þ
Here, r1ss is the remote stress in the aluminium layer, n is the number of material #1 layers, Gc is the delamination tough-ness, and w1 and w2 are the thicknesses of the material #1 and #2 layers. Further, the stiffness �Ei is defined by
�Ei ¼Ei=ð1� m2
i Þ for plane strain;Ei for plane stress;
(ð25Þ
where Ei and mi are the Young’s moduli and Poisson’s ratios of materials i ¼ 1 (aluminium) and 2 (fibre-epoxy). During uni-form, steady-state delamination the laminate approaches a plane-stress condition, since the right edge of the specimen istraction-free, in accordance with the boundary conditions of case BC1 depicted in Fig. 6. Substitution of the material param-eters listed in Table 1 into Eq. (24), with the delamination toughness taken as Gc ¼ 4 N/mm (recall that the effective delam-ination toughness is independent of the mode-mixity and thus equals the toughness value of the individual fracture modes),and the number of aluminium layers as n ¼ 2 (in correspondence with a 2/1 lay-up), for a plane-stress condition leads to aremote stress of r1ss ¼ 547 MPa. This stress value, which is represented in Fig. 7a by a horizontal, dashed line, is in closeagreement with the residual strength following from the numerical analyses.
w of the simulations, which are characterised by variations of the boundary conditions, BC1 and BC2 (see Fig. 6), different values of the ultimate mode Itu
1 of the mode I crack in the aluminium, different lamellae properties, and a different relative initial crack length 2a0=W
tu1 ¼ 1:4r� tu
1 ¼ 2:0r� tu1 ¼ 3:0r�
ium elastic and BC1 & BC2 BC1 BC1epoxy elastic 2a0=W ¼ 0:12 2a0=W ¼ 0:12 2a0=W ¼ 0:12
ium elasto-plastic BC1 & BC2 BC1 BC1bre-epoxy elastic 2a0=W ¼ 0:12, 0.28, 0.48 2a0=W ¼ 0:12 2a0=W ¼ 0:12

fed
c
b
a
d
b
Rem
ote
stre
ss
[M
Pa]
0
250
500
750
1000
0 0.5 1 1.5Normal crack opening v1 [mm]
σss = 547 [MPa]
tu1 = 1.4σ*
tu1 = 2.0σ*
tu1 = 3.0σ*
0
5
10
15
20
25
30
z-co
ordi
nate
[m
m]
0 5 10 15 20x-coordinate [mm]
bc
d
e
f
a
0
5
10
15
20
25
30
z-co
ordi
nate
[m
m]
0 5 10 15 20x-coordinate [mm]
bc
d
e
f
a
c
σ
a
b
Fig. 7. Failure response for a 2/1 lay-up with elastic aluminium layers. (a) Normal opening v1 of the mode I crack in the aluminium (measured at point A, seeFig. 6) versus the remote stress r1 in the aluminium layer, for three different values of the ultimate normal traction tu
1 of the mode I crack in the aluminium.The horizontal, dashed line indicates the steady-state remote stress r1ss ¼ 547 MPa computed with Eq. (24), and the characters ‘a–f’ indicate differentdeformation stages during the loading process. (b) Delamination profiles for deformation stages ‘a–f’ (see (a)), for the case where the ultimate traction of themode I crack in the aluminium is tu
1 ¼ 1:4r� (= 430 MPa). The x- and z-coordinates relate to the coordinate system in Fig. 6. (c) Delamination profiles fordeformation stages ‘a–f’ (see (a)), for the case where the ultimate traction of the mode I crack in the aluminium is tu
1 ¼ 2:0r� (= 610 MPa). The x- andz-coordinates relate to the coordinate system in Fig. 6.
772 M.V. Cid Alfaro et al. / Engineering Fracture Mechanics 76 (2009) 761–780
As illustrated by Eq. (24), the residual strength during steady-state delamination mainly depends on the delaminationtoughness Gc, and is independent of the aluminium fracture strength tu
1. The latter aspect can also be observed fromFig. 7a,b and c, which illustrate that at stages ‘e’ and ‘f’ both the r1 � 1 response and the delamination profiles are virtually

M.V. Cid Alfaro et al. / Engineering Fracture Mechanics 76 (2009) 761–780 773
identical for the different fracture strengths tu1. The brittle, almost rate-independent behaviour of the delamination process is
further confirmed by the appearance of a relatively small process zone at the delamination tip, which actually can be ignoredwith respect to the specimen length L.
The mode-mixity during steady-state delamination may be evaluated in accordance with the definition given by Eq. (7).An alternative measure for the mode-mixity, typically used in linear elastic fracture mechanics [12], is
w ¼ tan�1 rzyðrÞryyðrÞ
� �r¼l
; ð26Þ
which is based on the shear (rzy) and normal (ryy) stresses evaluated at a specified horizontal distance r ¼ l ahead of thecrack (or delamination) tip. Note that the definition, Eq. (26), assumes that the crack propagates in the z-direction along aplane separating two (possibly dissimilar) bulk materials, with the normal to the cracking plane pointing in the y-direction,where pure mode I conditions correspond to w ¼ 0, and pure mode II conditions relate to w ¼ 90. In cohesive zone mod-elling there is no standard procedure to identify the crack tip from a traction–separation law. However, a definition regularlyused is based on relating the crack tip to the point at which the interface traction reaches the peak value tu [42], which isconsistent with the experimental observation that micromechanical processes are not only active ahead of the crack tip,but also in the wake of the crack tip [43]. With this definition, the present numerical results show that during steady-statedelamination the mode-mixity, Eq. (26), for the case tu
1 ¼ 1:4r� varies between a minimum value w ¼ 31 measured at asmall distance ahead of the crack tip, and a maximum value w ¼ 90 measured exactly at the crack tip. The maximum valuereflects a purely mode II condition. This condition is reached since the crack faces at the crack tip are in contact, as a result ofwhich the mode I contribution vanishes. In Suiker and Fleck [17], the mode-mixity for the case of steady-state delaminationin a brittle, uniaxially-loaded 2/1 laminate with a stiffness mismatch of �E2=�E1 � 0:4 (which is in correspondence with theelastic parameters of the aluminium and fibre-epoxy layers presented in Table 1) has been measured as w � 54, wherethe distance l has been arbitrarily specified as the semi-width of the mode I crack in the aluminium, l ¼ 0:15 mm. Obviously,this value falls within the range 31 < w < 90 following from the present numerical analyses. In the wake of the crack tip,the mode-mixity in the present simulations varies between a value w ¼ 90 measured exactly at the crack tip and a valuew ¼ 85 measured when the damage is close to unity, d � 1, and the adherence between the crack faces is virtually lost.Hence, it may be concluded that in the wake of the crack tip the failure process is mode II dominated. For the cases witha higher maximum traction, tu
1 ¼ 2:0r� and tu1 ¼ 3:0r�, the mode-mixities ahead and behind the crack tip have similar ranges,
with the main difference being that the minimum value ahead of the crack tip is somewhat larger, i.e., w ¼ 38 and w ¼ 40
for tu1 ¼ 2:0r� and tu
1 ¼ 3:0r�, respectively.The traction profile of the mode I crack in the aluminium is plotted in Fig. 8a (tu
1 ¼ 1:4r�) and Fig. 8b (tu1 ¼ 2:0r�) across
the complete specimen width, during various deformation stages of the loading process. The curve indicated by an asterisk,0 � 0, represents the elastic response of the interface (plotted by a dashed line) prior to cracking (i.e., before the ultimate trac-tion tu
1 is reached at the tip of the initial pre-crack), while the curves ‘a–d’, which relate to the deformation stages ‘a–d’ indi-cated in Fig. 7, correspond to a mode I crack developing in the aluminium. At deformation stage ‘a’, the integration pointsnext to the initial pre-crack have just entered the softening regime, while the integration points at larger distance fromthe pre-crack still have not reached the ultimate traction tu
1 and therefore respond elastically. During deformation stages‘b’ and ‘c’ all integration points across the specimen width have reached the softening regime. Note that during softeningthe tractions vary only weakly in the x-direction, such that the size of the process zone of the aluminium crack substantiallyexceeds the specimen width. As expected, close to the pre-crack the variation in the softening profile is slightly larger for alarger ultimate traction tu
1, indicating that the fracture process occurs a little less spread out. Finally, at stage ‘d’ all integra-tion points across the specimen width have reached the end of the softening regime, and the crack faces of the aluminiumcrack have become fully separated.
During the final phase of the crack tunneling process (i.e., between stages ‘c’ and ‘d’), significant delamination has devel-oped, see Figs. 7b and c, where the effective response of the laminate has become unstable, see Fig. 7a. In the study of Suikerand Fleck [17] on laminates subjected to uniaxial tension, this unstable tunneling mechanism was named ‘mechanism 3’, seeFig. 1. Although the study in [17] relates to an ‘ideally brittle’ laminate of infinite size, where the size of the process zone ofthe tunneling crack is equal to zero, the typical features of mechanism 3 thus also are observed in a ‘quasi-brittle’ laminatewhere the tunneling crack is characterised by a process zone of substantial length. Essentially, the appearance of mechanism3 can be explained from the specific material parameters that characterise the 2/1 GLARE laminate, i.e., the elastic stiffness ofthe fibre-epoxy layer, which, as already mentioned, is about 0.4 times smaller than the elastic stiffness of the aluminiumlayer, and the ratio between the delamination toughness and the mode I fracture toughness, which has a rather low valueof 0.04, see Table 1. The failure mechanism map presented in Fig. 18 of Suiker and Fleck [17] confirms that for these materialparameters ‘mechanism 3’ is indeed the operative failure mechanism during crack tunneling in a 2/1 laminate. This failuremechanism map further indicates that the stiffness mismatch between the fibre-epoxy layer and the aluminium layer has amoderate influence on the appearance of this specific fracture mechanism, and that it is mainly determined by the relativelylow toughness for interfacial delamination. In fact, it is shown that the delamination during crack tunneling remains absentif the delamination toughness becomes larger than the toughness for mode I fracture in the aluminium. For such a relativelyhigh delamination toughness the tunneling crack becomes stable and of the pure mode I type (i.e., ‘mechanism 1’ in Fig. 1), incorrespondence with a remote, steady-state tunneling stress that is about three to four times larger than that obtained for

0 5 10 15 20x-coordinate [mm]
Nor
mal
tra
ctio
n t 1
[M
Pa]
0
100
200
300
400
500* Elastic response prior to mode I cracking
b
c
d
*
a
0 5 10 15 20x-coordinate [mm]
Nor
mal
tra
ctio
n t 1
[M
Pa]
0
150
300
450
600
750 * Elastic response prior to mode I cracking
b
c
*
a
d
b
a
Fig. 8. Normal traction t1 of the mode I crack tunneling in the elastic aluminium layer, evaluated across the specimen width, at various deformation stages.The curve ‘*’ refers to an elastic interfacial response and the curves ‘a–d’ (which correspond to the deformation stages ‘a–d’ indicated in Fig. 7a) reflect thefracture process. (a) Case where the ultimate traction of the mode I crack is tu
1 ¼ 1:4r� . (b) Case where the ultimate traction of the mode I crack is tu1 ¼ 2:0r�
(=610 MPa).
774 M.V. Cid Alfaro et al. / Engineering Fracture Mechanics 76 (2009) 761–780
the present delamination toughness. Obviously, this conclusion holds as long as the aluminium layers do not deform plas-tically. The influence of plasticity in the aluminium on the effective failure response of the laminate is investigated in thesubsequent section.
5.2. 2/1 lay-up with elasto-plastic aluminium layers
In Fig. 9a the remote stress in the aluminium layers is plotted versus the normal opening of the mode I crack in the elasto-plastic aluminium layers. It can be observed that a higher fracture strength tu
1 of the aluminium leads to a higher remotestress, i.e., at a crack opening v1 ¼ 1:9 mm the remote stress in the aluminium equals r1 ¼ 557 MPa, 611 MPa and642 MPa for tu
1 ¼ 1:4r�, 2:0r� and 3:0r�, respectively. For the case with the highest aluminium fracture strength,tu
1 ¼ 3:0r�, at v1 1.9 mm the continuum elements close to the crack tip have become strongly distorted, which is due tothe generation of substantial plastic deformations in these elements. Consequently, at this stage the numerical procedurefails to converge. Although it is expected that this problem can be overcome by further decreasing the size of the elementsnear the crack tip, this strategy has not been explored in more detail due to the already large computational times of thepresent simulations (i.e., the solid-like shell elements used in the numerical model are computationally expensive). Note thatthe curves depicted in Fig. 9a do not show a softening branch, which is in contrast to the effective response of a lay-up withelastic aluminium layers, see Fig. 7a. Hence, it may be concluded that the energy dissipation in the plastic zone ahead of thecrack in the aluminium stabilizes the effective failure response of the laminate. For a larger fracture strength tu
1 of the alu-minium, the plastic zone, and thus the energy dissipation in this zone, becomes larger, as a result of which the failure re-sponse becomes more stable, see Fig. 7a.
The delamination profiles for the deformation stages ‘a–f’ indicated in Fig. 9a are plotted in Fig. 9b (tu1 ¼ 1:4r�) and 9c
(tu1 ¼ 2:0r�). Apparently, during crack tunneling the delamination front for a specimen with elasto-plastic aluminium layers

Rem
ote
stre
ss [
MP
a]
0
250
500
750
1000
0 0.5 1 1.5 2 2.5 3 3.5Normal crack opening v1 [mm]
fe
dc
b
a
d
bfe
a c
tu1 = 1.4σ*
tu1 = 2.0σ*
tu1 = 3.0σ*
0
5
10
15
20
25
30
z-co
ordi
nate
[m
m]
0 5 10 15 20x-coordinate [mm]
bc
d
e
f
a
0
5
10
15
20
25
30
z-co
ordi
nate
[m
m]
0 5 10 15 20x-coordinate [mm]
bc
de
f
a b,c,d
a
σ
b
c
Fig. 9. Failure response for a 2/1 lay-up with elasto-plastic aluminium layers. (a) Normal opening v1 of the mode I crack in the aluminium (measured atpoint A, see Fig. 6) versus the remote stress r1 in the aluminium layer, for three different values of the ultimate normal traction tu
1 of the mode I crack in thealuminium. The characters ‘a–f’ indicate different deformation stages during the loading process. (b) Delamination profiles for deformation stages ‘a–f’ (see(a)), for the case where the ultimate traction of the mode I crack in the aluminium is tu
1 ¼ 1:4r� (¼ 1:4r0y ¼ 430 MPa). The x- and z-coordinates relate to the
coordinate system in Fig. 6. (c) Delamination profiles for deformation stages ‘a–f’ (see (a)), for the case where the ultimate traction of the mode I crack in thealuminium is tu
1 ¼ 2:0r� ð¼ 2:0r0y ¼ 610 MPa). The x- and z-coordinates relate to the coordinate system in Fig. 6.
M.V. Cid Alfaro et al. / Engineering Fracture Mechanics 76 (2009) 761–780 775
is much steeper than for a specimen with elastic aluminium layers, see Fig. 7b and c. In addition, plastic deformations in thealuminium layer induce substantial free-edge delamination along the vertical specimen edge. Essentially, near the free edgethe plastic deformations in the aluminium layer increase the mismatch in deformation with the fibre-epoxy layer that wantsto contract laterally. This gives rise to the development of stress concentrations at the interface between the two layers,

776 M.V. Cid Alfaro et al. / Engineering Fracture Mechanics 76 (2009) 761–780
which are relaxed through the appearance of free-edge delamination. When the delamination has fully developed and isapproximately uniform across the specimen width (i.e., stage ‘f’), for the case tu
1 ¼ 1:4r� the mode-mixity, Eq. (26), aheadof the crack tip on average varies between a value w ¼ 60 measured at a small distance from the crack tip and a valuew ¼ 90 measured exactly at the crack tip. In the wake of the crack tip the mode-mixity varies between a value w ¼ 90 mea-sured at the crack tip and a value w ¼ 86 measured at a position where damage has approached unity, d � 1. The latter var-iation in mode-mixity is similar to that for the case of a 2/1 laminate with elastic aluminium layers, and indicates that thefracture process in the wake of the crack is mode II dominated. Note that the variation of the mode mixity ahead of the cracktip is somewhat smaller than for the 2/1 laminate with elastic layers, from which it may be concluded that the generation ofplasticity in the aluminium reduces the mode I contribution to delamination. Furthermore, as for the case of a specimen withelastic layers, the influence of the value of the ultimate traction tu
1 on the mode-mixity is relatively small.The evolution of the normal traction of the mode I crack in the aluminium has been plotted in Figs. 10a (tu
1 ¼ 1:4r�) and b(tu
1 ¼ 2:0r�), for all integration points across the specimen width. The characters ‘a–e’ correspond to the deformation stages‘a–e’ indicated in Fig. 9a. Comparing the profiles in Fig. 10a and b shows that ahead of the crack tip the increase in tractionwith distance is stronger for a higher ultimate traction, tu
1, of the aluminium crack. Correspondingly, the length of the fractureprocess zone, which relates to the distance between the integration point in which all traction is lost and the integrationpoint that has just reached the maximum traction value tu
1, decreases if the ultimate traction tu1 becomes larger. A similar
result was found by Tvergaard and Hutchinson [29] for a purely mode I crack propagating in an elasto-plastic medium. Inaddition, it can be noticed that the fracture process zone for a laminate with elasto-plastic aluminium layers is considerablyshorter than for a laminate with elastic aluminium layers, see Fig. 7b and c. Essentially, a compliant, elasto-plastic alumin-ium layer is less constrained to deformation, and therefore induces a shorter fracture process zone than a stiff elastic alu-minium layer. Combining Figs. 10a and b with Figs. 9b and c, it can be observed that a tunneling crack with a higherfracture strength and a shorter fracture process zone (i.e., the case with tu
1 ¼ 2:0r�) is characterised by a steeper delamina-tion front near the crack tip. In addition, a tunneling crack with a higher fracture strength and a shorter fracture process zone
0 5 10 15 20x-coordinate [mm]
Nor
mal
tra
ctio
n t 1
[M
Pa]
0
100
200
300
400
500* Elastic response prior to mode I cracking
b
c
d
*
a
0 5 10 15 20x-coordinate [mm]
Nor
mal
tra
ctio
n t 1
[M
Pa]
0
150
300
450
600
750* Elastic response prior to mode I cracking
b c
d
e
*
a
b
a
Fig. 10. Normal traction t1 of the mode I crack tunneling in the elasto-plastic aluminium layer, evaluated across the specimen width, at various deformationstages. The curve ‘*’ refers to an elastic interfacial response and the curves ‘a–e’ (which correspond to the deformation stages ‘a–e’ indicated in Fig. 9a)reflect the fracture process. (a) Case where the ultimate traction of the tunneling mode I crack is tu
1 ¼ 1:4r� (¼ 1:4r0y ¼ 430 MPa). (b) Case where the
ultimate traction of the tunneling mode I crack is tu1 ¼ 2:0r� (¼ 2:0r0
y ¼ 610 MPa).

M.V. Cid Alfaro et al. / Engineering Fracture Mechanics 76 (2009) 761–780 777
requires the application of more external work in order for the crack tip to reach the vertical specimen edge and to evolveinto an (almost) uniform delamination pattern. Accordingly, at the level of uniform delamination (stage ‘f’), the normal crackopening v1 and the remote failure strength r1 are larger for a higher fracture strength tu
1 of the aluminium, see Fig. 9a. Recallthat this effect has not been observed for the 2/1 laminate with elastic aluminium layers; the strength and deformation char-acteristics at uniform delamination are independent of the fracture strength of elastic aluminium layers, see stages ‘e’ and ‘f’in Fig. 7a and b and c and Eq. (24). It is further interesting to notice that during uniform delamination the remote strength fora laminate containing elasto-plastic aluminium layers may be somewhat higher than for a laminate containing elastic alu-minium layers, especially for higher values of the aluminium fracture strength tu
1, see Figs. 9a and 7a. Hence, the plasticdeformation history developed during crack tunneling then provides a positive contribution to the final residual strengthof the laminate specimen.
5.3. Influence of boundary conditions on failure response
In accordance with Fig. 6 and Table 2, the effect of the boundary conditions at the right specimen edge on the effectivefailure response is studied by comparing the cases BC1 (unconstrained boundary) and BC2 (horizontally constrained bound-ary), using tu
1 ¼ 1:4r� in the traction–separation law for the aluminium crack. In Fig. 11 the remote stress in the aluminiumlayer is plotted against the normal crack opening in the aluminium (measured at point A, see Fig. 6), for the cases where thealuminium layer behaves elastically (Fig. 11a) and elasto-plastically (Fig. 11b). For a specimen with elastic aluminium layersthe remote failure response is initially similar for both types of boundary conditions. However, when the crack has tunnelledacross the complete specimen width and uniform delamination starts to develop, the remote stress related to the con-strained boundary, BC2, becomes somewhat larger than for the unconstrained boundary, BC1. Essentially, the boundary con-
Rem
ote
stre
ssσ∞
[MPa
]
0
250
500
750
1000
0 0.5 1 1.5Normal crack opening v1 [mm]
BC 1BC 2
σ∞ss = 547 [MPa]
σ∞ss,* = 562 [MPa]
Rem
ote
stre
ssσ∞
[MPa
]
0
250
500
750
1000
0 0.5 1 1.5 2 2.5 3 3.5Normal crack opening v1 [mm]
BC 1BC 2
a
b
Fig. 11. Normal opening v1 of the mode I crack in the aluminium (measured at point A, see Fig. 6) versus the remote stress r1 in the aluminium, for alaminate with an unconstrained right specimen edge (BC1) and a horizontally constrained right specimen edge (BC2), see Fig. 6. The ultimate traction for themode I crack in the aluminium is tu
1 ¼ 1:4r� (= 430 MPa). The horizontal, dashed lines in (a) indicate the steady-state remote stress computed with Eqs. (24)and (25), which reflects a plane-stress condition (with r1ss ¼ 547 MPa) for the case BC1 and a plane-strain condition (with r1ss;� ¼ 562 MPa) for the case BC2.(a) 2/1 lay-up with elastic aluminium layers. (b) 2/1 lay-up with elasto-plastic aluminium layers.

778 M.V. Cid Alfaro et al. / Engineering Fracture Mechanics 76 (2009) 761–780
ditions BC1 then approach a plane-stress condition and the boundary conditions BC2 approach a plane-strain condition. Thecorresponding remote stresses respectively are r1ss ¼ 547 MPa and r1ss;� ¼ 562 MPa, as computed with Eqs. (24) and (25)using the numerical values in Table 1. Fig. 11a illustrates that these remote stresses are in close agreement with the corre-sponding numerical results.
As shown in Fig. 11b, the difference in failure response for the two boundary conditions becomes negligible when plasticdeformations develop in the aluminium. Since the delamination patterns corresponding to case BC2 are similar to those ofcase BC1 (see Figs. 7 and 9 for lay-ups with elastic aluminium layers and elasto-plastic aluminium layers, respectively), thoseare not presented here. The only difference between the delamination patterns for the two cases is that for case BC2 free-edge delamination remains absent due to the constraint of the horizontal displacement at the right specimen edge.
5.4. Effect of initial crack length on failure strength
In this section, the effect of the initial crack length on the overall laminate strength is examined. In addition to the con-figuration depicted in Fig. 3, for which the initial crack length is relatively small, 2a0 ¼ 0:12W , samples with a larger initialcrack length are considered, i.e., 2a0 ¼ 0:28W and 0:48W , for the case where tu
1 ¼ 1:4r� and the aluminium layers behaveelasto-plastically, see also Table 2. The results of the computations are illustrated in Fig. 12, where the remote gross stress�r1 of the laminate is plotted against the relative initial crack size 2a0=W . The gross stress is computed as the weighted aver-age of the remote stresses over the total thickness of the laminate, and is evaluated when somewhere in the prepreg layerthe axial strain becomes equal to the fracture strain of 4.7 % (as reported in [6]). The computations show that this strainvalue is first reached in the wake of the aluminium crack, close to the centre of the specimen. It is assumed that at the pre-preg fracture strain the gross stress reaches its maximum, and is going to drop under continued loading due to (substantial)fibre failure. With this assumption, the computed gross stress may be considered as the residual strength of the centre-cracked specimen, which is typically defined as the ultimate static strength in the presence of damage [6]. Fig. 12 illustratesthat the calculated maximum gross stress drops with about 100 MPa when the initial crack length is increased from2a0 ¼ 0:12W to 0:48W . Furthermore, the numerical predictions appear to be in good correspondence with the residualstrengths measured experimentally by de Vries [6] for centre-cracked 2/1 GLARE laminates with widths ranging from 100mm to 400 mm. In the experiments the initial crack is generated through the application of a fatigue load with constantamplitude, which results in a residual strength that is about 200 MPa higher than when the initial crack is generated bya saw cut [6]. In spite of the good correspondence between the model and the experiments, it should be mentioned thatthe fibre-epoxy layers of the tested 2/1 laminates are unidirectional with the fibres oriented in the loading direction, whichdiffers from the cross-plied fibres-epoxy layers considered in the numerical simulations. Furthermore, the laminate widthsused in the experiments are somewhat larger than that in the simulation (i.e., W = 40 mm, see Fig. 3). These two discrepan-cies are expected to lead to, respectively, (relatively small) under- and overpredictions of the experimental strengths, as canbe concluded from experimental variation studies on laminates with alternative lay-ups [6]. A more detailed analysis of theeffects of fibre-orientation and specimen width on the overall laminate failure response is a topic for future modellingstudies.
6. Summary of results and concluding remarks
Three-dimensional numerical simulations have been performed on a centre-cracked 2/1 GLARE laminate subjected to uni-axial tension. The laminate is composed of two aluminium layers sandwiching a cross-plied fibre-epoxy layer. The fracture
Num. predictionExp. (W = 100 mm)Exp. (W = 200 mm)Exp. (W = 400 mm)
400
500
600
700
800
Gro
ss s
tres
s σ
[M
Pa]
0 0.1 0.2 0.3 0.4 0.5 0.6Relative initial crack length 2ao/W
Fig. 12. Maximum gross stress �r1 of the centre-cracked laminate specimen versus the relative initial crack length 2a0=W . The experimental values aretaken from de Vries [6].

M.V. Cid Alfaro et al. / Engineering Fracture Mechanics 76 (2009) 761–780 779
and delamination characteristics are simulated with an interface model, in which the mode-mixity is derived from an energycriterion typically used in linear elastic fracture mechanics studies. The response for a lay-up with elastic aluminium layersshows that during the final phase of the loading process the delamination becomes virtually uniform across the specimenwidth, reaching a steady state. The corresponding residual failure strength of the laminate strongly depends on the delami-nation toughness. These results appear to be in close correspondence with those obtained by Suiker and Fleck [17] for a uniax-ially-loaded laminate composed of brittle, elastic layers. During the initial, crack nucleation phase, which cannot be simulatedwith the model presented in [17], a higher fracture strength of the aluminium leads to a higher ultimate failure strength of thelaminate. The transition from the deformation stage at which the ultimate failure strength is reached to the deformation stageat which the residual failure strength is reached is characterised by an unstable response, in correspondence with ‘mechanism3’ depicted in Fig. 1. This unstable behaviour vanishes when the aluminium is able to deform plastically. Furthermore, bothduring the phases of crack tunneling and uniform delamination, the strength of the laminate with elasto-plastic aluminiumlayers strongly depends upon the fracture strength of the aluminium. Essentially, a higher aluminium fracture strength pro-vides the aluminium crack with a shorter fracture process zone and a steeper delamination front at the crack tip, which leadsto a higher effective failure strength of the laminate. In addition, the final residual strength at uniform delamination may behigher than for a laminate composed of elastic aluminium layers, especially at higher values of the aluminium fracturestrength. When the horizontal displacements at the vertical boundaries of the laminate specimen are unconstrained, the gen-eration of plasticity in the aluminium layers induces free-edge delamination. The free-edge delamination remains absentwhen the horizontal displacements at these boundaries are fully constrained. In addition, the gross strength drops withincreasing initial crack length 2a0, and shows to be in good correspondence with the experimental values reported in [6].
In the discussion of the simulation results, the effect of several length scales on the overall failure response of the lam-inate has been addressed and analysed, i.e., the size of the fracture and delamination process zones, the size of the plasticzone ahead of the mode I crack tip and the size of initial crack length. However, the interactive effect on the response bythese length scales and higher-scale, geometrical lengths, such as the width of the laminate, has not been studied in detail.This would require the variation of the laminate specimen size, which is kept constant in the present analyses. More infor-mation about the interaction between material length scales and geometrical length scales and their effect on the global fail-ure strength, as often conveniently described by means of so-called size-effect laws, can be found in the textbook of Bazantand Planas [44] and references therein.
The present interface damage model has proven to behave robustly and accurately in the numerical boundary value prob-lems studied in this manuscript. It is emphasised that the excellent numerical performance of the interface damage model isnot limited to the specific type of boundary value problems examined here; a similar qualitative behaviour has been ob-served in recent micro-mechanical simulations, where a heterogeneous system of a large number of fibres embedded inan epoxy matrix is subjected to a remote tensile loading. The interface damage model has proven to adequately simulatethe resulting, rather complex, fracture process, which is characterised by numerous events of crack coalescence and crackbifurcation. The outcome of these numerical simulations will be presented in forthcoming work.
Acknowledgements
This work is part of the research project DLR.5790 - DFG 509 ‘‘Multiscale Methods in Computational Mechanics”. Theauthors gratefully acknowledge the financial support of this research project by the Stichting Technische Wetenschappen(STW), the Netherlands, and the Deutsche Forschungsgemeinschaft (DFG), Germany. Furthermore, the authors appreciatethe helpful discussions with Dr. Erik-Jan Lingen from the software company Habanera, Delft, the Netherlands, on numericalimplementation issues within the finite element framework JEM/JIVE.
References
[1] Pryce AW, Smith PA. Behaviour of unidirectional and crossply ceramic matrix composites under quasi-static tensile loading. J Mater Sci1992;27:2695–704.
[2] Leaity MA, Smith PA, Bader MG, Curtis PT. The behaviour of cross-ply hybrid matrix composite laminates. Part 1: Experimental results. Composites1992;23:387–95.
[3] Tong J, Guild FJ, Ogin SL, Smith PA. On matrix crack growth in quasi-isotropic laminates – I. Experimental investigation. Compos Sci Technol1997;57:1527–35.
[4] Chohan V, Galiotis C. Effects of interface, volume fraction and geometry on stress redistribution in polymer composites under tension. Compos SciTechnol 1997;57:1089–101.
[5] Vlot A, Gunnink JW, editors. Fibre metal laminates – an introduction. Dordrecht: Kluwer Academic Publishers; 2001.[6] de Vries TJ. Blunt and sharp notch behaviour of GLARE laminates. PhD thesis, Delft University of Technology, The Netherlands; 2001.[7] Ermel R, Beck T, Kerscher E. Analysis of failure behaviour of carbon/carbon composite made by chemical vapour infiltration considering fibre, matrix
and interface properties. Int J Mater Res 2006;97:1401–9.[8] Hutchinson JW, Mear M, Rice J. Crack paralleling an interface between dissimilar materials. J Appl Mech (ASME) 1987;54:828–32.[9] Suo Z, Hutchinson JW. Interface crack between two elastic layers. Int J Fract 1990;43:1–18.
[10] Dollar A, Steif PS. Stresses in fibres spanning an infinite matrix crack. Int J Solids Struct 1991;27:1011–24.[11] Beuth JL. Cracking of thin bonded films in residual tension. Int J Solids Struct 1992;29:1657–75.[12] Hutchinson J, Suo Z. Mixed mode cracking in layered materials. Adv Appl Mech 1992;29:63–189.[13] Ho S, Suo Z. Tunneling cracks in constrained layers. J Appl Mech (ASME) 1993;60:890–4.[14] He M-Y, Evans AG, Hutchinson JW. Crack deflection at an interface between dissimilar elastic materials: role of residual stresses. Int J Solids Struct
1994;31:3443–55.[15] Cox BN, Marshall DB. Crack initiation in fiber-reinforced brittle laminates. J Am Ceram Soc 1996;79:1181–8.

780 M.V. Cid Alfaro et al. / Engineering Fracture Mechanics 76 (2009) 761–780
[16] Lu TJ. Crack branching in all-oxide ceramic composites. J Am Ceram Soc 1996;79:266–74.[17] Suiker ASJ, Fleck NA. Crack tunneling and plane-stain delamination in layered solids. Int J Fract 2004;125:1–32.[18] Schellekens JCJ, de Borst R. A nonlinear finite-element approach for the analysis of mode I free edge delamination in composites. Int J Solids Struct
1993;30(9):1239–53.[19] Schellekens JCJ, de Borst R. On the numerical integration of interface elements. Int J Numer Methods Engn 1993;36:43–66.[20] Allix O, Ladeveze P, Corigliano A. Damage analysis of interlaminar fracture specimens. Compos Struct 1995;31:66–74.[21] Allix O, Corigliano A. Modelling and simulation of crack propagation in mixed-mode interlaminar fracture specimens. Int J Fract 1996;77:111–40.[22] Hashagen F. Numerical analysis of failure mechanisms in fibre metal laminates. PhD thesis, Delft University of Technology; 1998.[23] Alfano G, Crisfield MA. Finite element interface models for the delamination analysis of laminated composites: mechanical and computational issues.
Int J Numer Methods Engng 2001;77:111–70.[24] Remmers JJC. Discontinuities in materials and structures. PhD thesis, Delft University of Technology, The Netherlands; 2006.[25] Jensen HM. Mixed mode interface fracture criteria. Acta Metal Mater 1990;38:2637–44.[26] Turon A, Camanho PP, Costa J, Dávila CG. A damage model for the simulation of delamination in advanced composites under variable-mode loading.
Mech Mater 2006;38:1072–89.[27] Parisch H. A continuum-based shell theory for non-linear applications. Int J Numer Methods Engn 1995;38(11):1855–83.[28] Bischoff M, Ramm E. Shear deformable shell elements for large strains and rotations. Int J Numer Methods Engn 1997;40:4427–49.[29] Tvergaard V, Hutchinson JW. The relation between crack growth resistance and fracture process parameters in elastic–plastic solids. J Mech Phys Solids
1992;40:1377–97.[30] Tvergaard V, Hutchinson JW. Effect of T-stress on mode I crack growth resistance in a ductile solid. Int J Solids Struct 1994;31:823–33.[31] Suo Z, Ho S, Gong X. Notch ductile-to-brittle transition due to localized inelastic band. J Engn Mater Technol 1993;115:319–26.[32] Heeres OM, Suiker ASJ, de Borst R. A comparison between the Perzyna viscoplastic model and the consistency viscoplastic model. Eur J Mech A/Solids
2002;21:1–12.[33] Pérez-Foguet A, Rodríguez-Ferran A, Huerta A. Numerical differentiation for local and global tangent operators in computational plasticity. Comput
Methods Appl Mech Engn 2000;189:277–96.[34] Miehe C. Numerical computation of algorithmic (consistent) tangent moduli in large-strain computational inelasticity. Comput Methods Appl Mech
Engn 1996;134:223–40.[35] Suiker ASJ, Turteltaub S. Computational modelling of plasticity induced by martensitic phase transformations. Int J Numer Methods Engn
2005;63:1655–93.[36] Takamatsu T, Matsumura T, Ogura N, Shimokawa T, Kakatu Y. Fatigue crack growth properties of a GLARE-3-5/4 fiber/metal laminate. Engn Fract Mech
1999;63:253–72.[37] Shim DJ, Alderliesten RC, Spearing SM, Burianek DA. Fatigue crack growth in GLARE hybrid laminates. Compos Sci Technol 2003;63:1759–67.[38] Suiker ASJ, Fleck NA. Modelling of fatigue crack tunneling and delamination in layered composites. Compos Part A – Appl Sci Manufact
2006;37:1722–33.[39] Chen C, Fleck NA, Lu TJ. The mode I crack growth resistance of metallic foams. J Mech Phys Solids 2001;49:231–59.[40] Vermeeren CAJR. The residual strength of fibre metal laminates. PhD thesis, Delft University of Technology; 1995.[41] van den Brande J, Sinke J. FIMELAS – numerical modelling of fibre–metal laminates: microscopic damage models. Technical report B2V-04-02, Delft
University of Technology, The Netherlands; 2004.[42] Shet C, Chandra N. Analysis of energy balance when using cohesive zone models to simulate fracture processes. J Engn Mater Technol
2002;124:440–50.[43] Hutchinson JW, Evans AG. Mechanics of materials: top-down approaches to fracture. Acta Mater 2000;48:125–35.[44] Bazant ZP, Planas JP. Fracture and size effect in concrete and other quasibrittle materials. CRC Press; 1997.


