Embed Size (px)
Citation preview

�������� � ����� ���� ����������� ���� ��� ���� � ������� ��� ������������� ��� ����� ����� ������
���� �� ��������� �� �� ��� � ! ��� "��� #� ���$�%
���������� � � �������� ������� ���������� �������� �� ����������� ������� ��� !���� � � ����"�#��"�� $�" �%��� & �����"��� �' �" � #�� ( � �������� )* ���+,� ���-,��������� � � �������� ���.�� ���������� � ��� ��� ��� �� ����'� ���'(�%#����� � ������"�� �"��"��� /��"0 & �-� �-1- 2. '� 3� ���,�� 3��� ���� �� ��'��� ���
Received 11 October 2002; accepted 5 December 2002
ABSTRACT: Micellar electrokinetic chromatography (MEKC) was investigated as a technique for the separation and analysis of thefollowing related glycopeptide antibiotics: �-avoparcin, �-avoparcin, ristocetin A, ristocetin B and vancomycin. Sodium dodecylsulfate (SDS) micelles were employed as the pseudostationary phase in conjunction with borate or CHES buffers at pH 9.2. Acomplete separation of the glycopeptides was achieved only when two separation mechanisms were employed simultaneously: (i)differential partitioning of the glycopeptides into SDS micelles; and (ii) differential complexation of the glycopeptides with the borateanion from the borate buffer. Quantitatively, linearity was confirmed for each antibiotic from 0.5 to 40 ppm, with correlationcoefficients (r2) ranging from 0.9996 (vancomycin and �-avoparcin) to 0.9986 (�-avoparcin). Detection limits ranging from 0.01 ppm(vancomycin) to 0.2 ppm (avoparcin) were achieved, and the mean recovery of avoparcin at the 10 ppm level was 99.2%. Copyright� 2003 John Wiley & Sons, Ltd.
KEYWORDS: glycopeptide antibiotics; avoparcin; vancomycin; micellar electrokinetic chromatography (MEKC); boratecomplexation; capillary electrophoresis (CE)
&'()*+,�(&*'
Since the first studies on micellar electrokinetic chroma-tography (MEKC) by Terabe and co-workers in 1984,numerous applications in various fields have beenreported. MEKC is complementary to capillary zoneelectrophoresis (CZE) and offers several advantages overreversed-phase chromatography (e.g. high separationefficiency, low sample requirements and absolute detec-tion limits, and short analysis time) as well as theexpected disadvantage of high concentration detectionlimits when absorbance detection is employed undernonstacking or nonextended light-path conditions.Although MEKC makes use of the same instrumentationas CZE, it is more versatile in that differences inelectrophoretic mobility can be exploited to separateionic analytes and, simultaneously, differences in phasedistribution can be exploited to separate neutral analytes.The main applications of MEKC have been in theanalysis of pharmaceuticals (Nishi et al., 1989; Nishi andMatsuo, 1991; Snopek et al., 1991; Nishi 1996, 1997;
Nishi and Terabe, 1996; Otsuka and Terabe, 2000;Hilhorst et al., 2001), biologicals (Burton et al., 1986;Cole et al., 1992; Pietta et al., 1993), and environmentalcompounds (Desiderio and Fanali, 1992; Song et al.,1997; Takeda et al., 1999).
While CE has been successfully used in the analysis ofsome macromolecules (Honda et al., 1989; Landers et al.,1992), the analysis of biologically active macromoleculeswith minor differences in structural characteristics hasbeen difficult.
To the best of our knowledge there are no reports of achromatographic method for the simultaneous determi-nation of the vancomycin family of antibiotics, a closelyrelated group of glycopeptide antibiotics which includes�-avoparcin, �-avoparcin, ristocetin A and ristocetin B,and vancomycin. The principle objective of this studywas to develop an MEKC method for their collectiveseparation and analysis. Although an MEKC method forvancomycin was recently reported (Kang et al., 2001), itwas devoted exclusively to vancomycin and its degrada-tion products and did not address the other glycopeptideantibiotics mentioned here. In addition, the previousreport employed a Tris-phosphate buffer and a cationicsurfactant (CTAC), whereas the present study utilizes ananionic surfactant (SDS) and compares the resultsobtained with a borate buffer and a zwitterionic buffer(CHES).
BIOMEDICAL CHROMATOGRAPHYBiomed. Chromatogr. 17: 172–181 (2003)Published online in Wiley InterScience (www.interscience.wiley.com).DOI: 10.1002/bmc.235
*Correspondence to: J. P. Foley, Department of Chemistry, DrexelUniversity, Philadelphia, PA 19104, USA.E-mail: [email protected]
Abbreviations used: CHES, 2-[N-cyclohexylamino] ethane sulfonicacid; EOF, electroosmotic flow; MBA, Microbiological assay; MEKC,Micellar electrokinetic chromatography.
Copyright 2003 John Wiley & Sons, Ltd.
ORIGINAL RESEARCH

-�.�*�"�(&+" �'(&/&*(&�#
Vancomycin, �- and �-avoparcin, and ristocetin aremembers of a group of glycopeptide antibiotics whichinterfere with the biosynthesis of bacterial cell walls. Thisgroup of glycopeptide antibiotics possess closely related
structures (Fig. 1) and is referred to as the vancomycingroup. Vancomycin, which lends its name to the group asa whole, was the first to be discovered by McCormick etal. (1956).
All members of the group were obtained from variousspecies of actinomycetes, typically isolated from soil
Figure 1. Structures, showing stereochemical detail, of closely related glycopeptide antibiotics: (A) vancomycin (MW 1448); (B)ristocetin A (MW 2063 � 5); and (C) avoparcin (MW 1905). In ristocetin B, ristobiose [O-�-L-rhamnopyranosyl-(1–6)-O-�-D-glucopyranosyl] rather than ristotetrose [O-�-D-arabinofuranosyl-(1–2)-O-�-D-mannopyranosyl-(1–2)-O-�-L-rhamnopyranosyl-(1–6)-O-�-D-glucopyranosyl] is attached to ring II.
Copyright 2003 John Wiley & Sons, Ltd. Biomed. Chromatogr. 17: 172–181 (2003)
Analysis of glycopeptide antibiotics ORIGINAL RESEARCH 173

samples of widely varying origins, and all are activeagainst Gram-positive bacteria (Gale et al., 1981).
Glycopeptide antibiotics are composed of a peptideaglycone, neutral sugars and an amino sugar. Theseaglycones consist of heptapeptides of cross-linkedunusual aromatic amino acids, and conventional aminoacids such as aspartic acid (Fig. 1). All members of thegroup are soluble in aqueous or polar organic solvents butinsoluble in non-polar organic solvents.
As shown in Fig. 1(B) and (C), both ristocetin andavoparcin are produced in two biologically active forms.As indicated, the two forms of ristocetin differ only intheir carbohydrate content. These features, among others,make the chromatographic separation of the glycopeptideantibiotics a major challenge.
While vancomycin and ristocetin have wide applica-tions in the medical field (Gale et al., 1981), avoparcin isstrictly used in the agricultural industry as an animal feedadditive (American Cyanamid Co.). Currently, there ismuch interest in studying further the properties of thisgroup of antibiotics which are often present in pharma-ceutical preparations.
As discussed in an earlier manuscript (Lucas et al.,1999), the conventional microbiological assay (MBA)used to determine glycopeptide antibiotics in pharma-ceutical preparations is restricted to the determination oftotal antibiotic activity. Owing to the similar chromo-phore systems of these structurally related antibiotics andtheir degradation products, more specific methods need tobe investigated.
"0�")&1"'(��
�� ������ ��� � � ���� The structural formulas of the compoundsstudied are shown in Fig. 1. Avoparcin sulfate, �-avoparcin, and �-avoparcin were supplied by Lederle Divisional Laboratory, Cyanamid ofGreat Britain Ltd. Vancomycin and ristocetin were obtained from SigmaChemicals (St Louis, MO, USA).
Sodium tetraborate decahydrate (Na2B4O7�10H2O) and 2-[N-cyclohex-ylamino] ethane sulfonic acid (CHES) were obtained from AldrichChemical Co. Inc. (Milwaukee, WI, USA). A stock solution of sodiumdodecyl sulfate [CH3(CH2)11OSO3
�Na�] was obtained from J. T. BakerInc. (Phillipsburg, NJ, USA) and was used as received, in concentrationsranging from 35 to 75 mM after dilution. Purified water was obtained from aMilli-Q purifying system (Millipore, Bedford, MA, USA), and the 0.45 �mnylon filters were obtained from Gelman Sciences (Ann Arbor, MI, USA).
&������ �������� All CZE experiments were carried out using a P/ACESystem 5000 equipped with a UV absorbance detector (BeckmanInstruments, Fullerton, CA, USA). An HP 3350A Lab Automation Systemwas used for data acquisition and quantitative analysis. Bare fused silicacapillaries were obtained from Applied Biosystems Inc. (ABI), Beckmanand Polymicro Technologies (Phoenix, AZ, USA). Separation capillarieswere 57 cm long (length of 50 cm to detector window) and had innerdiameters of 75 �m. Hydrodynamic injections were made at 30°C using aconstant voltage of �15 kV. In all experiments the UV detector was set at200 nm unless otherwise noted.
����� � � ������� �� ��������� Two carrier electrolytes whichconsisted of aqueous pH buffers were prepared at specified concentrationsin water. The CHES buffer pH was adjusted by adding concentrated (50%w/v) sodium hydroxide to the buffer solution.
#���� �� ��������� Stock solutions of glycopeptide antibiotics (0.1 mg/mL) were prepared by weighing exactly 10.0 mg of the component anddissolving it in 100 mL of purified water. These solutions were diluted tothe desired concentrations with purified water to give working standardsolutions.
)"#,�(# �'+ +&#�,##&*'
/���� ����� ������ �������� � � ���������
Since the glycopeptide antibiotics studied all contained acis-glycol system in their sugar moiety (Fig. 1), it was ofinterest to determine their borate complexation constants.
Several authors (Branch et al., 1934; Onak et al., 1959;Knoeck and Taylor 1969) have come to the conclusionthat complexes are formed by borate and several cis-glycol compounds in a pH-dependent fashion.
As shown in Fig. 1, the glycopeptides all containedsugar moieties with cis-glycol. Compared with vanco-mycin and ristocetin, �- and �-avoparcin also containamino sugars with cis-diol functional groups, whichprovide alternative sites for borate complexation.
Under alkaline conditions, borate (pKal 9.14) isexpected to complex with a cis-diol group of glucose.This complexation may be described by a simplechemical equilibrium as shown below,
A�aq� � B��aq� � AB��aq�
where A represents the glycopeptide, B� representsborate, and AB� represents the glycopeptide–boratecomplex. This equilibrium can also be represented as adissociation,
AB��aq� � A�aq� � B��aq�
According to an investigation concerning the borate-complexation process (Landers et al., 1992), it can beassumed that the extent of borate complexation dependson borate concentration, and that it should be directlyrelated to the decrease in migration time of theglycopeptide antibiotics studied. In the absence of SDS,a plot of the difference in migration time between theglycopeptide in the absence of borate and the glycopep-tide–borate complex against the logarithm of the borateconcentration resulted in a sigmoidal saturation curve(plots not shown). The apparent borate complexationconstant (Kd) for each glycopeptide was determinedusing the relationship below (Antikainen and Huttunen,1973):
pKd � pB � logAB�A
� �
This equation, analogous to the Henderson–Hassel-balch equation (Harris, 2003), assumes that at 50% of themaximum retardation, the ratio of free to boundglycopeptide will be unity and the dissociation constant
Copyright 2003 John Wiley & Sons, Ltd. Biomed. Chromatogr. 17: 172–181 (2003)
174 ORIGINAL RESEARCH C. Lucas et al.
(Kd) will be equal to the corresponding borate concentra-tion.
As indicated in Table 1, the apparent dissociationconstants for the glycopeptides range from 6.6 mM forvancomycin to 15.2 mM for �-avoparcin.
Although only one Kd value was calculated forvancomycin, the data revealed two dissociation curves,indicating perhaps two borate-complex transitions (datanot shown). Vancomycin has the ability to dimerize inaqueous solutions even in the low concentration (10 ppm)used (Nieto and Perkins, 1971). This phenomenon mayoffer an explanation for the two borate-complex transi-tions observed. Furthermore, vancomycin has limitedstability in aqueous solution and is easily degraded. Itmay be that one of the borate-complex transitions isassociated with a degradation product of vancomycin,although no additional peaks were observed duringseparation. It is not known whether borate complexedwith a cis-diol group prior to or after dimerization. Themean value of the two dissociation constants(data notshown) is 14.1 mM. Similar values (�13.1 mM) havebeen reported for ribose–borate complexes (Boeseken,1949).
Owing to the very complex nature of these glycopep-
tide antibiotics, it is not clear whether the minordifference in the apparent Kd values is indicative of thedifference in the degree of complexation. For instance, �-and �-avoparcin have five possible sites (C5 and C6sugars) where borate complexation could occur and it isnot clear whether borate binds to more than one cis-diolgroup. More studies will have to be done to determine theexact binding site. It is to be expected, however, thatfactors such as (1) the difference in the net charge of theglycopeptides, (2) ionic strength and (3) pH of therunning buffer would influence Kd values.
Furthermore, as shown in Table 1, the thermodynamicquantity, �G°, was computed at room temperature for allthe borate–glycopeptide complexations. The �G° valueswere in the range of � 1.02 to � 1.48 (kcal/mol),indicating that the complex reaction between borate andthe glycopeptides studied is exergonic in the standard
Table 1. Dissociation constants of the glycopeptide–boratecomplexes
Glycopeptide Kd (mM) ��G° (kcal/mol)
Ristocetin 12.9 1.39�-Avoparcin 10.0 1.25Vancomycin 6.6 1.02�-Avoparcin 15.2 1.48
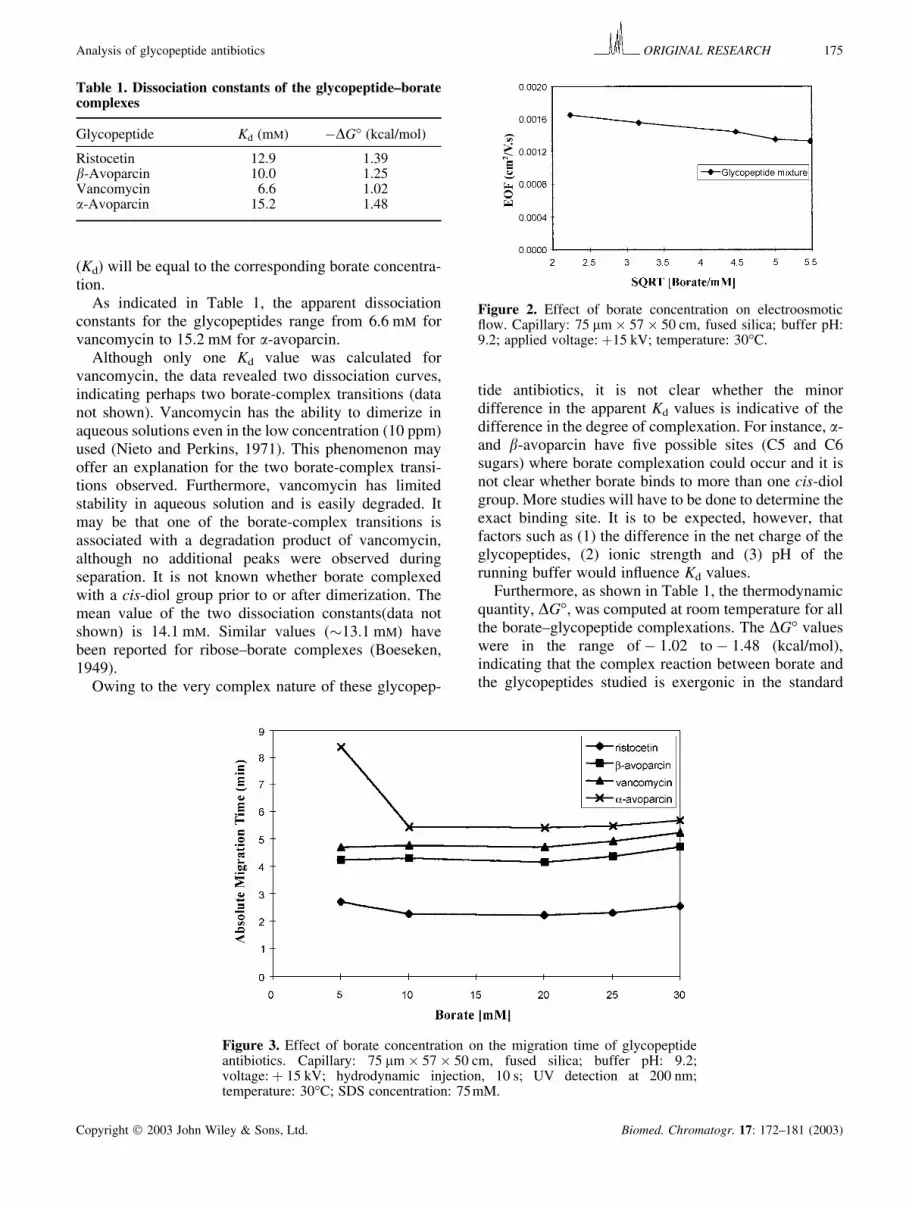
Figure 2. Effect of borate concentration on electroosmoticflow. Capillary: 75 �m � 57 � 50 cm, fused silica; buffer pH:9.2; applied voltage: �15 kV; temperature: 30°C.
Figure 3. Effect of borate concentration on the migration time of glycopeptideantibiotics. Capillary: 75 �m � 57 � 50 cm, fused silica; buffer pH: 9.2;voltage: � 15 kV; hydrodynamic injection, 10 s; UV detection at 200 nm;temperature: 30°C; SDS concentration: 75mM.
Copyright 2003 John Wiley & Sons, Ltd. Biomed. Chromatogr. 17: 172–181 (2003)
Analysis of glycopeptide antibiotics ORIGINAL RESEARCH 175
state. In addition, the small difference in the free energiesof the borate–glycopeptide complexes suggests that themode of complex formation is similar for all theglycopeptides studied.
" �� � ����� ���� �������� �� � �����������2�3 ��� � ��������
The effect of borate concentration on electroosmotic flow(EOF) is shown in Fig. 2. As indicated, the measuredvelocity of the EOF (water peak), veo, is plotted as afunction of the square root of the borate concentration. A
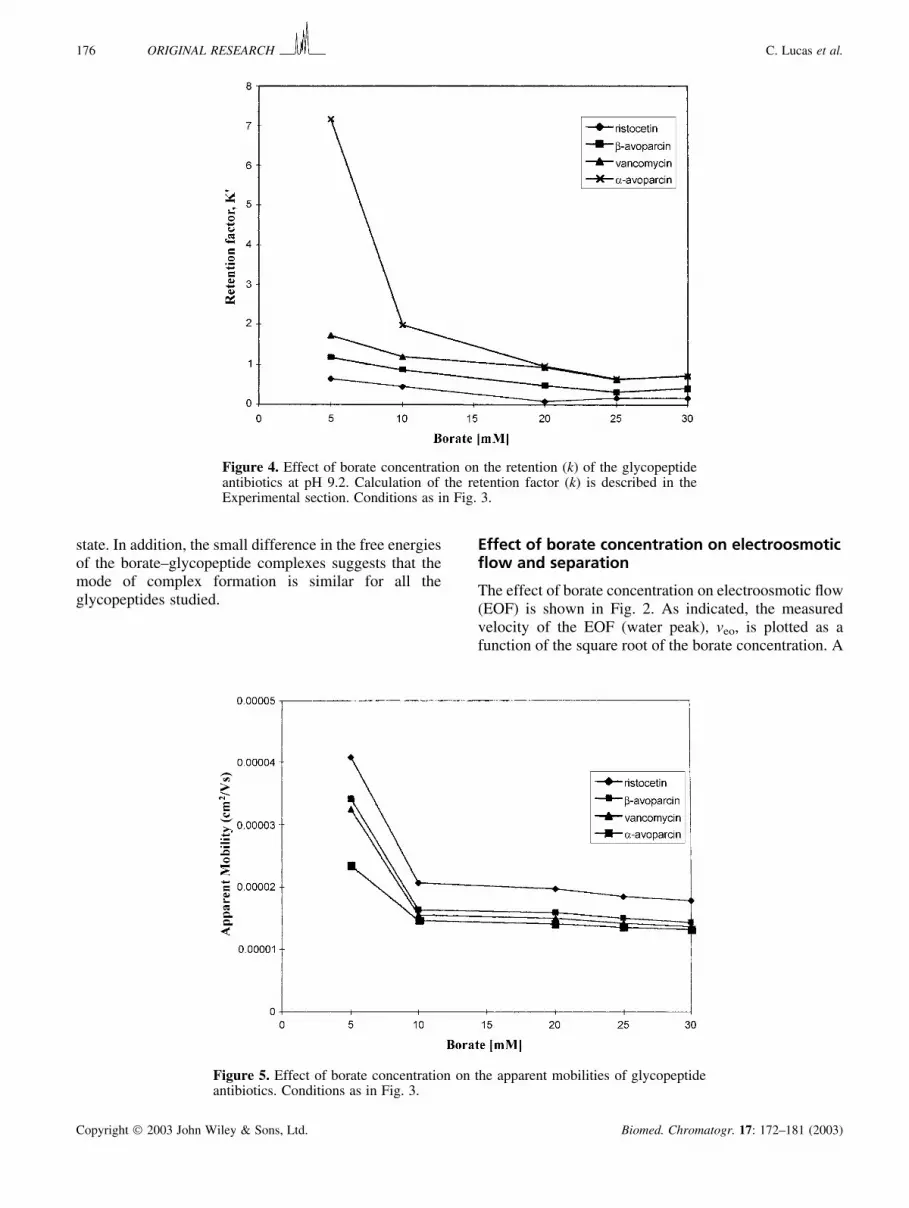
Figure 4. Effect of borate concentration on the retention (k) of the glycopeptideantibiotics at pH 9.2. Calculation of the retention factor (k) is described in theExperimental section. Conditions as in Fig. 3.
Figure 5. Effect of borate concentration on the apparent mobilities of glycopeptideantibiotics. Conditions as in Fig. 3.
Copyright 2003 John Wiley & Sons, Ltd. Biomed. Chromatogr. 17: 172–181 (2003)
176 ORIGINAL RESEARCH C. Lucas et al.

linear relationship was observed indicating that veo
decreased with an increase in borate concentration.Indeed with an increase in the borate ions, the ionicstrength increased causing the zeta potential and, hence,the EOF, to decrease. The slight fluctuation in EOF couldbe due to the increase in Joule heat observed. The powerdensity increased from 1.2 to 2.7 W/m over the 5–30 mM
range of borate concentrations.The effect of borate concentration on the absolute
migration time of the glycopeptide antibiotics is shown inFig. 3. Importantly, increasing the borate concentrationwhile keeping the SDS concentration constant enhancedthe difference in the retention of all the glycopeptidecomponents. Interestingly, when the borate concentrationwas increased from 5 to 10 mM, the absolute migrationtime of �-avoparcin dropped sharply from 8.5 to 5.4 min.Within the studied range of borate concentration (0–30 mM), migration times and resolution were measured,and a complete separation was obtained at 20 mM.
The effect of borate concentration on the retentionfactor (k) was also investigated. The difference in kbetween 5 and 30 mM is shown in Fig. 4. The retentionfactor (k) was observed to decrease with increasingborate concentration and reached a plateau around 25–30 mM borate. As already discussed above, �-avoparcinwas much more retained than the other glycopeptidesstudied. There is also the likelihood (vide infra) that theglycopeptides may partition into the SDS micellesdifferently, which would be in agreement with the boratecomplexation data in Table 1. The elution range was
observed to increase slightly (1.8–2.4) with increasingborate concentration; this resulted in a slight increase inthe optimum retention factor (Foley, 1990).
The effect of borate ion upon the apparent mobility ofthe glycopeptide components is shown in Fig. 5. Asobserved, mobility values decreased for all the glycopep-tides due to borate complexation. The apparent mobilityof �-avoparcin was much lower, suggesting a muchstronger complex with borate. The relative difference inapparent mobility from 5 to 10 mM borate was substantial(25–32%) for all the glycopeptides, indicating the onsetof borate complexation. This was confirmed by thecalculated Kd values that averaged around 15.2 mM.
The effect of borate concentration/Joule heating on theseparation efficiency (N) is shown in Fig. 6. As indicated,the average number of theoretical plates is plotted againstthe level of Joule heating (W/m), which was obtained byvarying the borate concentration while maintaining aconstant voltage of 15 kV. Peak efficiency (N) wascalculated using the Foley–Dorsey equation, which ismuch more accurate than Gaussian-based equations foreven slightly asymmetric peaks (Foley and Dorsey,1983). As shown, the efficiency ranged from 1.9 millionto 332,000 plates for �-avoparcin with increasing borateconcentration. Such high efficiency is indicative of theabsence of wall interactions and a well-controlledseparation system. The efficiency for ristocetin wasmuch lower compared with the other glycopeptides.
The presence of all these interfering glycopeptideantibiotics in animal feed requires that any separation
Figure 6. Effect of Joule heating (via increasing borate buffer concentration) onthe efficiency of glycopeptide antibiotics. Borate concentration (low to highpower levels): 5, 10, 20, 25 and 30 mM. Other conditions as in Fig. 3.
Copyright 2003 John Wiley & Sons, Ltd. Biomed. Chromatogr. 17: 172–181 (2003)
Analysis of glycopeptide antibiotics ORIGINAL RESEARCH 177

method used to monitor avoparcin levels be capable ofresolving avoparcin from these related antibiotics.Although all the glycopeptides studied have similar pIs(isoelectric points), as borate complexes in the presenceof SDS micelles, their net electrophoretic mobilities (notshown) were sufficiently different to allow baselineseparation (Fig. 7). As shown in Fig. 7, all theglycopeptide antibiotics including their correspondingminor components are well resolved (Rs � 3). Further-more, ristocetin A and B, which differ only in their sugarmoieties [Fig. 1(B)], were baseline resolved. It isimportant to note that ristocetin is commercially avail-able as one variant. However, this electropherogram wasobtained with a sample solution which was left to stand atroom temperature for 2 days. Apparently, the ristocetinpeak is split into a pair indicating the establishment of anequilibrium between the A and B forms. All theseobservations confirm the ability of this MEKC method tomonitor the stability of these glycopeptide antibiotics inpharmaceutical preparations.
" �� � � 43��� ������ �� � �� � ��������
In an attempt to minimize some of the problemsencountered with buffers of high ionic strength (egborate), the use of a zwitterionic buffer was investigated.Zwitterionic buffers do not contribute much to theconductivity of the solution but are able to associatewith the negatively charged capillary surface and withcharged proteins.
The effect of CHES buffer on separation ofglycopeptides is shown in Fig. 8. As indicated in Fig.8(A), none of the glycopeptides were separated in
20 mM CHES. To compare CHES with the boratesystem, the separation was run under similar conditions.Figure 8(B) shows the MEKC separation in 20 mM
CHES/75 mM SDS. As shown, a great improvement inresolution of the glycopeptides is achieved with theaddition of the SDS micelles. This further illustrates thatthe anionic micelles may help minimize wall interac-tions not only with the zwitterions but also with theglycopeptides. Furthermore, all the major components ofthe glycopeptides were resolved except for ristocetin.The minor components of �-avoparcin eluted as tailingpeaks and were not resolved. A short elution windowwas observed in the CHES buffer system compared withthe borate system.
The effect of buffer composition on the apparentmobility (�app), efficiency (N) and separation of glyco-peptide antibiotics was briefly investigated. The data (not
Figure 7. MEKC separation of glycopeptide antibiotics using a20 mM borate/75 mM SDS buffer (pH 9.2). Compoundidentification: ristocetin A (1), ristocetin B (3), �-avoparcin(5), vancomycin (6), and �-avoparcin (7); multiple peaks 2 and4 are minor components of ristocetin and avoparcin, respec-tively. The micelle ‘marker’ peak (tmc) is Sudan III. Otherconditions as in Fig. 3.
Figure 8. Effect of CHES buffer on the CZE (A) and MEKC(B) separation of glycopeptide antibiotics (10 ppm). (A) Carrierelectrolyte: 20 mM CHES, pH 9.2; operating current: �10 �A.(B) Temperature: 30°C. Carrier electrolyte as in (A), but with75 mM SDS; operating current: 38 �A. Peak assignments as inFig. 7, other conditions as in Fig. 3.
Copyright 2003 John Wiley & Sons, Ltd. Biomed. Chromatogr. 17: 172–181 (2003)
178 ORIGINAL RESEARCH C. Lucas et al.

shown) revealed that increasing the CHES concentrationfrom 20 to 75 mM resulted in higher peak efficiency (N)for �-avoparcin and vancomycin, but resulted in lowerefficiency for ristocetin and �-avoparcin; the efficiency ofthe latter decreased by 1.5-fold.
Overall, inferior results were obtained with thezwitterionic buffer (CHES) compared to borate.
1 ���� 5���������
The MEKC method for the separation and analysis of thevancomycin family of glycopeptide antibiotics wasevaluated with respect to system suitability parameters,specificity, linearity, sensitivity, accuracy and precision.
The specificity of the method was demonstratedqualitatively using MEKC to show that the electropher-ogram of avoparcin is homogeneous and remainsacceptably homogeneous in the presence of other relatedglycopeptides (Fig. 7).
The linearity of response for the mixture of glycopep-tide was evaluated by constructing a calibration graphspanning the range of 0.5–40 ppm. As shown in Fig. 9,correlation coefficients (r2) between 0.9996 (�-avopar-cin) and 0.9986 (�-avoparcin) are obtained for all theglycopeptides. These results do indicate a linear relation-ship between peak area response and concentration ofglycopeptide.
With the linearity of the method established, thedetection limit for each glycopeptide was calculated asthe signal corresponding to three times the noise level. Asshown in Table 2, very low detection limits ranging from
0.01 ppm (vancomycin) to 0.2 ppm (avoparcin) wereachieved.
The accuracy and precision of the method weredetermined with spiked samples of avoparcin preparedin duplicate at one level. Sample preparations wereperformed on three separate days and the assay wascarried on the same instrument with different fused silicacolumns. As summarized in Table 3, the amountrecovered range from 94.5 to 104.4%.
Repeatability, which is defined as the standard error ofthe mean, was estimated from the net variability due tosample preparation (weighing, dilution) and chroma-tography (injection, integration). As shown in Table 3,the standard deviation due to the chromatography is1.2%.
The intermediate precision is defined as the standarderror of the mean including repeatability and variabilitydue to instrumental differences (eg different column). Asshown in Table 3, the estimated intermediate precision is4.2%.
Overall, the data indicate that the variance due to thesefactors is acceptable for avoparcin in the presence ofother related glycopeptides antibiotics.
�*'��,#&*'
The major achievement of this work is the developmentof a new separation process using micellar electrokineticchromatography for the analysis of glycopeptide anti-biotics.
The method is specific, ‘stability-indicating’, and can
Figure 9. Linearity plots for the glycopeptide antibiotics. Each pointrepresents the average of three determinations.
Copyright 2003 John Wiley & Sons, Ltd. Biomed. Chromatogr. 17: 172–181 (2003)
Analysis of glycopeptide antibiotics ORIGINAL RESEARCH 179

be used routinely to identify water-soluble glycopeptideantibiotics in pharmaceutical preparations. Glycopeptidelevels as low as 0.04 ppm (limit of quantitation) can bemonitored. These results suggest that borate complexa-tion chemistry may hold the key to successful character-ization of complex glycopeptide mixtures by micellarelectrokinetic chromatography.
)"�")"'�"#
Antikainen PJ and Huttunen E. A comparative study on the chelationof pentoses with some inorganic oxyacids. Suomen Kemistilehti B1973; 46: 184–190.
Boeseken J. Advances in Carbohydrate Chemistry 1949; 4: 189–219.Branch GE, Yabroff DL and Bettoman B. Journal of the American
Chemistry Society 1934; 56: 936–941.Burton DE, Sepaniak MJ and Maskarinec MP. Analysis of B6 vitamins
by micellar electrokinetic chromatography with laser excitefluorescence detection. Journal of Chromatography 1986; 24:347–351.
Cole RO, Holland RD and Sepaniak MJ. Factors influencing
performance in the rapid separation of aflatoxins by micellarelectrokinetic capillary chromatography. Talanta 1992; 39: 1139–1147.
Desiderio C and Fanali S. Electrophoresis 1992; 13: 698–700.Foley JP. Optimization of micellar electrokinetic chromatography.
Analytical Chemistry 1990; 62: 1302–1308.Foley JP and Dorsey JG. Equations for calculation of chromatographic
figures of merit for ideal and skewed peaks. Analytical Chemistry1983; 55: 730–737.
Gale EF, Cundliffe E, Reynolds PE, Richmond MH and Waring MJ.The Molecular Basis of Antibiotic Action. Wiley: London, 1981.
Harris DC. Quantitative Chemical Analysis. Freeman: New York,2003.
Hilhorst MJ, Somsen GW and De Jong GJ. Capillary electrokineticseparation techniques for profiling of drugs and related products.Electrophoresis 2001; 22: 2542–2564.
Honda S, Iwase S, Makino A and Fujiwara S. Simultaneousdetermination of reducing monosaccharides by capillary zoneelectrophoresis as the borate complexes of N-2-pyridylglycamines.Analytical Biochemistry 1989; 176: 72–77.
Kang JW, Van Schepdael A, Roets E and Hoogmartens J. Analysis ofvancomycin and related impurities by micellar electrokineticcapillary chromatography. Method development and validation.Electrophoresis 2001; 22: 2588–92.
Knoeck J and Taylor JK. Analytical Chemistry 1969; 41: 1730–1734.Landers JP, Madden BJ, Oda RP and Spelsberg TC. Analytical
Biochemistry 1992; 205: 115–124.Lucas C, Gliddon M, Safarpour M, Cardaciotto S, Ahuja ES and Foley
JP. Determination of avoparcin in animal formulations by capillaryelectrophoresis. Journal of Capillary Electrophoresis and Micro-chip Technology 1999; 6: 75–83.
McCormick MH, Stark WM, Pittenger GE, Pittenger RC and McGuireJM. Antibiotic Annals 1956; 1955–56: 606–611.
Nieto M and Perkins HR. Journal of Biochemistry 1971; 123: 773–787.Nishi H. Enantiomer separation of drugs by electrokinetic chroma-
tography. Journal of Chromatography A 1996; 735: 57–76.Nishi H. Pharmaceutical applications of micelles in chromatography
and electrophoresis. Journal of Chromatography A 1997; 780: 243–264.
Nishi H and Matsuo M. Separation of corticosteroids and aromatichydrocarbons by cyclodextrin-modified micellar electrokineticchromatography. Journal of Liquid Chromatography 1991; 14:973–986.
Table 2. MEKC detection limitsa for the vancomycin familyof glycopeptides
Glycopeptide Detection limit (ppm)
Ristocetin 0.05�-Avoparcin 0.2Vancomycin 0.01�-Avoparcin 0.2
a Calculated as the signal corresponding to three times the noise level(peak to peak). Conditions: 20 mM borate buffer/75 mM SDS, pH 9.2;capillary: 75 �m � 57 � 50 cm, fused silica; voltage: �15 kV; hydro-dynamic injection, 15 s; UV detection at 200 nm; temperature: 30°C.
Table 3. Method precision and accuracya
Column (Polymicrob and ABIc fused silica)bRun no. 1 (wt%) cRun no. 2 (wt%) bRun no. 3 (wt%)
Determination no.1 100.8 94.4 102.4Determination no.2 103.5 94.5 104.4Average 102.2 94.4 103.4SD 1.87 0.127 1.45% RSD 1.8 0.13 1.4
ColumnAverage 99.2SD 4.26% RSD 4.3
Repeatability Intermediate precisionGrand average 102.8 Grand Average 100.7Short term 1.67 SD 4.20Test determinations 2 % RSD 4.2SD 1.18 95% CI 18.1% RSD 1.2 k 295% CI 3.8 t 4.30k 3t 3.18
a Conditions: avoparcin (10 ppm); capillary: 75 �m � 57 � 50 cm, fused silica; buffer: 20 mM borate/75 mM SDS, pH 9.2; voltage: �15 kV;detection: UV 200 nm; hydrodynamic injection, 10 s; temperature: 30°C.
Copyright 2003 John Wiley & Sons, Ltd. Biomed. Chromatogr. 17: 172–181 (2003)
180 ORIGINAL RESEARCH C. Lucas et al.

Nishi H and Terabe S. Micellar electrokinetic chromatography:perspectives in drug analysis. Journal of Chromatography A 1996;735: 3–27.
Nishi H, Tsumagari N, Kakimoto T and Terabe S. Separation of watersoluble vitamins by micellar electrokinetic chromatography.Journal of Chromatography 1989; 465: 331–323.
Onak TP, Landesman H, Williams RE and Shapiro I. Journal ofPhysical Chemistry 1959; 1533–1535.
Otsuka K and Terabe S. Enantiomer separation of drugs by micellarelectrokinetic chromatography using chiral surfactants. Journal ofChromatography A 2000; 875: 163–178.
Pietta P, Mauri P, Bruno A and Zini L. High-performance liquidchromatography and micellar electrokinetic chromatography of
flavonol glycosides from tilia. Journal of Chromatography 1993;638: 357–361.
Snopek J, Soini H, Novotny M, Smolkova-Keulemansova E andJelinek I. Selected applications of cyclodextrin selectors in capillaryelectrophoresis. Journal of Chromatography 1991; 559: 215–22.
Song L, Xu Z, Kang J and Cheng J. Analysis of environmentalpollutants by capillary electrophoresis with emphasis on micellarelectrokinetic chromatography. Journal of Chromatography A1997; 780: 297–328.
Takeda S, Environmental Chemistry Section DoE and the Environ-ment ONRIAMIOJ. The fundamental studies on the analysis ofenvironmental pollutants by micellar electrokinetic chromatogra-phy. Chromatography 1999; 20: 11–17.
Copyright 2003 John Wiley & Sons, Ltd. Biomed. Chromatogr. 17: 172–181 (2003)
Analysis of glycopeptide antibiotics ORIGINAL RESEARCH 181


