Embed Size (px)
Citation preview
RESEARCH Open Access
Analysis of long branch extraction and longbranch shorteningTimothy O’Connor1*, Kenneth Sundberg2, Hyrum Carroll2, Mark Clement2, Quinn Snell2
From The 2009 International Conference on Bioinformatics & Computational Biology (BioComp 2009)Las Vegas, NV, USA. 13-16 July 2009
Abstract
Background: Long branch attraction (LBA) is a problem that afflicts both the parsimony and maximum likelihoodphylogenetic analysis techniques. Research has shown that parsimony is particularly vulnerable to inferring thewrong tree in Felsenstein topologies. The long branch extraction method is a procedure to detect a data setsuffering from this problem so that Maximum Likelihood could be used instead of Maximum Parsimony.
Results: The long branch extraction method has been well cited and used by many authors in their analysis butno strong validation has been performed as to its accuracy. We performed such an analysis by an extensive searchof the branch length search space under two topologies of six taxa, a Felsenstein-like topology and Farris-liketopology. We also examine a long branch shortening method.
Conclusions: The long branch extraction method seems to mask the majority of the search space rendering itineffective as a detection method of LBA. A proposed alternative, the long branch shortening method, is alsoineffective in predicting long branch attraction for all tree topologies.
BackgroundDue to its speed and simplicity, one of the most com-mon methods used in phylogenetics is Maximum Parsi-mony [2] (MP). MP is based on the principle of theOccam’s razor, which means the simplest explanationfor any phenomenon is the most probable. Under thisprinciple parsimony makes the claim of using few if anyassumptions, and while this has been disputed, MP’smodel is much more simple with far fewer parametersthan many other phylogenetic methods. Three majorproblems have been cited with MP, stemming from thisassumption of simplicity. Many authors have arguedthat parsimony has under parameterized the problem,then the claim was made that it over parameterizes theproblem [3]. The third problem is that of Long-BranchAttraction (LBA).LBA is the foundation for many of the arguments
against the use of MP in phylogenetics. One foundationalstudy showed that MP can be positively misleading when
two non-sister taxa have long branches compared to therest of the tree [4]. This bias has then been reiterated in anumber of other simulated and empirical studies (seeBergsten [5] for an in-depth review of the current debateon LBA). The crux of the problem is that long branches,whether sister taxa or not, are claded or groupedtogether, creating scenarios where the MP method willconsistently be incorrect. This has the potential to occuroften, when given enough evolutionary time becausemultiple sites will differentiate from each other. Sincethere is a finite set of characters, (i.e. A,C,G,T for DNA)the two sequences will have many sites with matchingcharacters. As more evolutionary time passes, fewer ofthese sites will be due to a common ancestor or homol-ogy, and more of them will be due to the random use ofthe same nucleotide. This non-homologous yet similarsequence of characters adds noise to the phylogeneticsignal. This problem is not unique to parsimony but par-simony suffers from it more extensively than MaximumLikelihood (ML) [6-10].LBA has been found in many real world examples,
one review found 112 examples in a search on the Web* Correspondence: [email protected] of Zoology, University of Cambridge, Cambridge CB2 3EJ, UKFull list of author information is available at the end of the article
O’Connor et al. BMC Genomics 2010, 11(Suppl 2):S14http://www.biomedcentral.com/1471-2164/11/S2/S14
© 2010 O’Connor et al; licensee BioMed Central Ltd. This is an open access article distributed under the terms of the CreativeCommons Attribution License (http://creativecommons.org/licenses/by/2.0), which permits unrestricted use, distribution, andreproduction in any medium, provided the original work is properly cited.
of Science [5]. This illustrates the need for a methodthat can accurately evaluate if a phylogenetic analysis issuffering from LBA. Some methods have been designedin an attempt to fill this gap including: “methodologicaldisconcordance, RASA, separate partition analysis, para-metric simulation, random outgroup sequences, long-branch extraction, split decomposition and spectralanalysis.” [5] Many of these current methods have beenshown to be ineffective or reliant on morphologicaldata. Reliance on morphological data is effective but cre-ates problems due to the difficulty in gathering andsampling this kind of data, so many researchers relyexclusively on molecular data. Long Branch Extraction(LBE), also referred to as Long Branch Abstraction, wasdeveloped by Siddall, Whiting, and Pol as a method todetect LBA. LBE relies on the assumption that if thereare two long sequences, removing one of them shouldmove the other to its correct place in the tree, and ifthis location is different than its original location, thedataset suffers from from LBA [1,9]. In [5] Bergsten pro-poses a six step method to detect LBA based on theLBE method. These steps are:1. If, after completing a full parsimony search you
obtain a tree with a questionable grouping of a certaintaxa that appears basal and makes the formal classifica-tion polyphyletic, suspect LBA.2. Exclude the outgroup and re-run the analysis: does
the questionable taxa form a monophyletic clade of theformal classification?3. Return the outgroup and remove the questionable
taxa and re-run the analysis: does this root the tree dif-ferently then in step 1 (later compare to step 4 and 5 aswell)?4. Return the questionable taxa and reanalyze the data
set by separating the gene information from the mor-phological data: does the morphological data form amonophyletic group of the formal classification whilethe gene data place the questionable taxa basal in thetree?5. Analyze the gene data using a method that takes
into account branch lengths, (i.e. Bayes or Likelihood):does this method form a monophyletic group of the for-mal classification?6. Using the same analysis of step 5: are the branch
lengths of the questionable taxa and the outgroup someof the longest in the tree?If you can answer yes to all the previous questions,
LBA is the least refuted hypothesis. We have chosen toautomate this technique with a few modifications andevaluate it on a series of synthetic data with six taxaunder a variety of branch lengths with verified LBA.The six taxa synthetic data sets were used for two
main reasons. Six taxa data sets are small enough to becalculated in reasonable time but large enough for the
LBE method to work. This gave us an a priori knowl-edge as to which trees were suffering from long branchattraction.
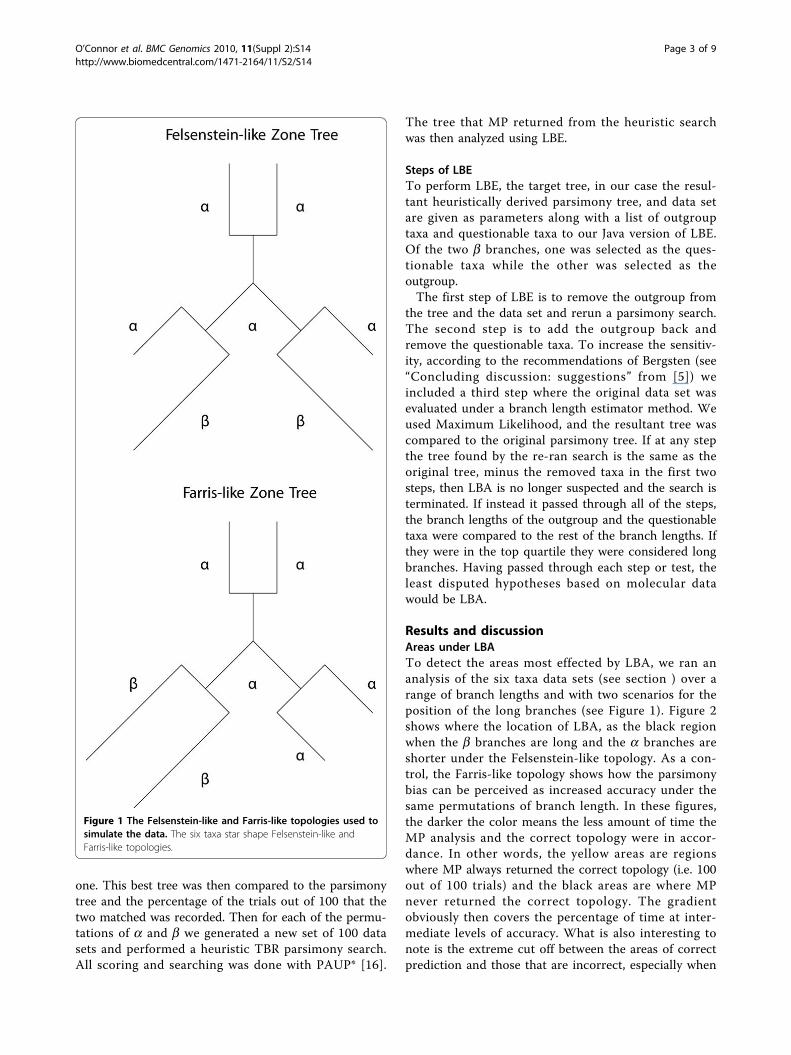
MethodsSynthetic data setsTo evaluate long branch extraction, datasets that allowfor extraction of long branches and differentiation oftopological location are necessary. We chose to performthe analysis using six taxa in a star shape for consistencyand comparability to the more prevalent studies usingfour taxa cases of the Felsenstein and Farris (or reverse-Felsenstein) zone topologies [6,11] (see Figure 1). Thesescenarios present problems to phylogenetic methodsbecause of the challenge to some assumptions theymake. For example, parsimony assumes similar charac-ters to be derived from a common ancestor, but withlong non-sister branches there is a great probability thatthe two sequences are really analogous, meaning theyhave converged to the same character independently.Parsimony generally puts longer branches together in afour taxa case and here the same or similar problemshave been preserved.To produce these data sets we used the program
Dawg [12] under a General Time Reversible (GTR)[13-15] model of evolution. We used similar parametersas those found in the examples included with the pro-gram and explored a range of branch lengths. Thelambda value of 0.1 was used for the indel evolutionrate and can be interpreted as one indel for every tensubstitutions. The sequence length was set to 2000 asthis gives a reasonably sized sequence to allow for theexpected value of any simulation to be seen. Thenucleotide frequencies for the simulation were set to0.2, 0.3, 0.3, and 0.2 for A, C, T, and G respectively withsubstitution parameters set to 1.5, 3.0, 0.9, 1.2, 2.5, and1.0 for AC, AG, AT, CG, CT, GT respectively. Thesesettings were chosen based on examples given with theDawg program.Dawg generated data sets for trees under both topolo-
gies where the a and b branch lengths were varied froma branch length of 0.1 to 2.0, incremented by 0.1. Abranch length of one is interpreted to mean that eachsite is expected to have one substitution from the inter-nal node under the GTR definition of branch length.For each permutation of a and b branch lengths we ran100 replicates to get a percentage of matches betweenthe two methods. This created a total of 40,000 datasets for each topology.
Evaluation of LBA areaEach data set was then analyzed by comparing the bestparsimony tree from an exhaustive search. With six taxathis means scoring all 105 possible trees to find the best
O’Connor et al. BMC Genomics 2010, 11(Suppl 2):S14http://www.biomedcentral.com/1471-2164/11/S2/S14
Page 2 of 9
one. This best tree was then compared to the parsimonytree and the percentage of the trials out of 100 that thetwo matched was recorded. Then for each of the permu-tations of a and b we generated a new set of 100 datasets and performed a heuristic TBR parsimony search.All scoring and searching was done with PAUP* [16].
The tree that MP returned from the heuristic searchwas then analyzed using LBE.
Steps of LBETo perform LBE, the target tree, in our case the resul-tant heuristically derived parsimony tree, and data setare given as parameters along with a list of outgrouptaxa and questionable taxa to our Java version of LBE.Of the two b branches, one was selected as the ques-tionable taxa while the other was selected as theoutgroup.The first step of LBE is to remove the outgroup from
the tree and the data set and rerun a parsimony search.The second step is to add the outgroup back andremove the questionable taxa. To increase the sensitiv-ity, according to the recommendations of Bergsten (see“Concluding discussion: suggestions” from [5]) weincluded a third step where the original data set wasevaluated under a branch length estimator method. Weused Maximum Likelihood, and the resultant tree wascompared to the original parsimony tree. If at any stepthe tree found by the re-ran search is the same as theoriginal tree, minus the removed taxa in the first twosteps, then LBA is no longer suspected and the search isterminated. If instead it passed through all of the steps,the branch lengths of the outgroup and the questionabletaxa were compared to the rest of the branch lengths. Ifthey were in the top quartile they were considered longbranches. Having passed through each step or test, theleast disputed hypotheses based on molecular datawould be LBA.
Results and discussionAreas under LBATo detect the areas most effected by LBA, we ran ananalysis of the six taxa data sets (see section ) over arange of branch lengths and with two scenarios for theposition of the long branches (see Figure 1). Figure 2shows where the location of LBA, as the black regionwhen the b branches are long and the a branches areshorter under the Felsenstein-like topology. As a con-trol, the Farris-like topology shows how the parsimonybias can be perceived as increased accuracy under thesame permutations of branch length. In these figures,the darker the color means the less amount of time theMP analysis and the correct topology were in accor-dance. In other words, the yellow areas are regionswhere MP always returned the correct topology (i.e. 100out of 100 trials) and the black areas are where MPnever returned the correct topology. The gradientobviously then covers the percentage of time at inter-mediate levels of accuracy. What is also interesting tonote is the extreme cut off between the areas of correctprediction and those that are incorrect, especially when
Figure 1 The Felsenstein-like and Farris-like topologies used tosimulate the data. The six taxa star shape Felsenstein-like andFarris-like topologies.
O’Connor et al. BMC Genomics 2010, 11(Suppl 2):S14http://www.biomedcentral.com/1471-2164/11/S2/S14
Page 3 of 9
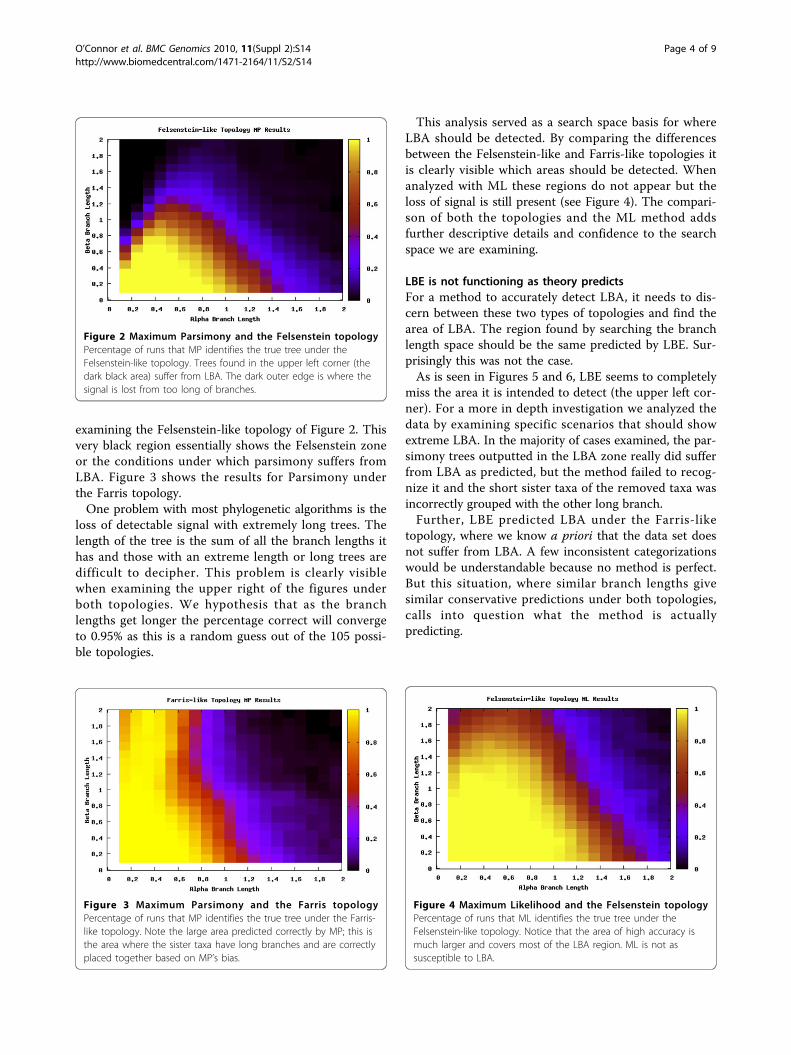
examining the Felsenstein-like topology of Figure 2. Thisvery black region essentially shows the Felsenstein zoneor the conditions under which parsimony suffers fromLBA. Figure 3 shows the results for Parsimony underthe Farris topology.One problem with most phylogenetic algorithms is the
loss of detectable signal with extremely long trees. Thelength of the tree is the sum of all the branch lengths ithas and those with an extreme length or long trees aredifficult to decipher. This problem is clearly visiblewhen examining the upper right of the figures underboth topologies. We hypothesis that as the branchlengths get longer the percentage correct will convergeto 0.95% as this is a random guess out of the 105 possi-ble topologies.
This analysis served as a search space basis for whereLBA should be detected. By comparing the differencesbetween the Felsenstein-like and Farris-like topologies itis clearly visible which areas should be detected. Whenanalyzed with ML these regions do not appear but theloss of signal is still present (see Figure 4). The compari-son of both the topologies and the ML method addsfurther descriptive details and confidence to the searchspace we are examining.
LBE is not functioning as theory predictsFor a method to accurately detect LBA, it needs to dis-cern between these two types of topologies and find thearea of LBA. The region found by searching the branchlength space should be the same predicted by LBE. Sur-prisingly this was not the case.As is seen in Figures 5 and 6, LBE seems to completely
miss the area it is intended to detect (the upper left cor-ner). For a more in depth investigation we analyzed thedata by examining specific scenarios that should showextreme LBA. In the majority of cases examined, the par-simony trees outputted in the LBA zone really did sufferfrom LBA as predicted, but the method failed to recog-nize it and the short sister taxa of the removed taxa wasincorrectly grouped with the other long branch.Further, LBE predicted LBA under the Farris-like
topology, where we know a priori that the data set doesnot suffer from LBA. A few inconsistent categorizationswould be understandable because no method is perfect.But this situation, where similar branch lengths givesimilar conservative predictions under both topologies,calls into question what the method is actuallypredicting.
Figure 2 Maximum Parsimony and the Felsenstein topologyPercentage of runs that MP identifies the true tree under theFelsenstein-like topology. Trees found in the upper left corner (thedark black area) suffer from LBA. The dark outer edge is where thesignal is lost from too long of branches.
Figure 3 Maximum Parsimony and the Farris topologyPercentage of runs that MP identifies the true tree under the Farris-like topology. Note the large area predicted correctly by MP; this isthe area where the sister taxa have long branches and are correctlyplaced together based on MP’s bias.
Figure 4 Maximum Likelihood and the Felsenstein topologyPercentage of runs that ML identifies the true tree under theFelsenstein-like topology. Notice that the area of high accuracy ismuch larger and covers most of the LBA region. ML is not assusceptible to LBA.
O’Connor et al. BMC Genomics 2010, 11(Suppl 2):S14http://www.biomedcentral.com/1471-2164/11/S2/S14
Page 4 of 9
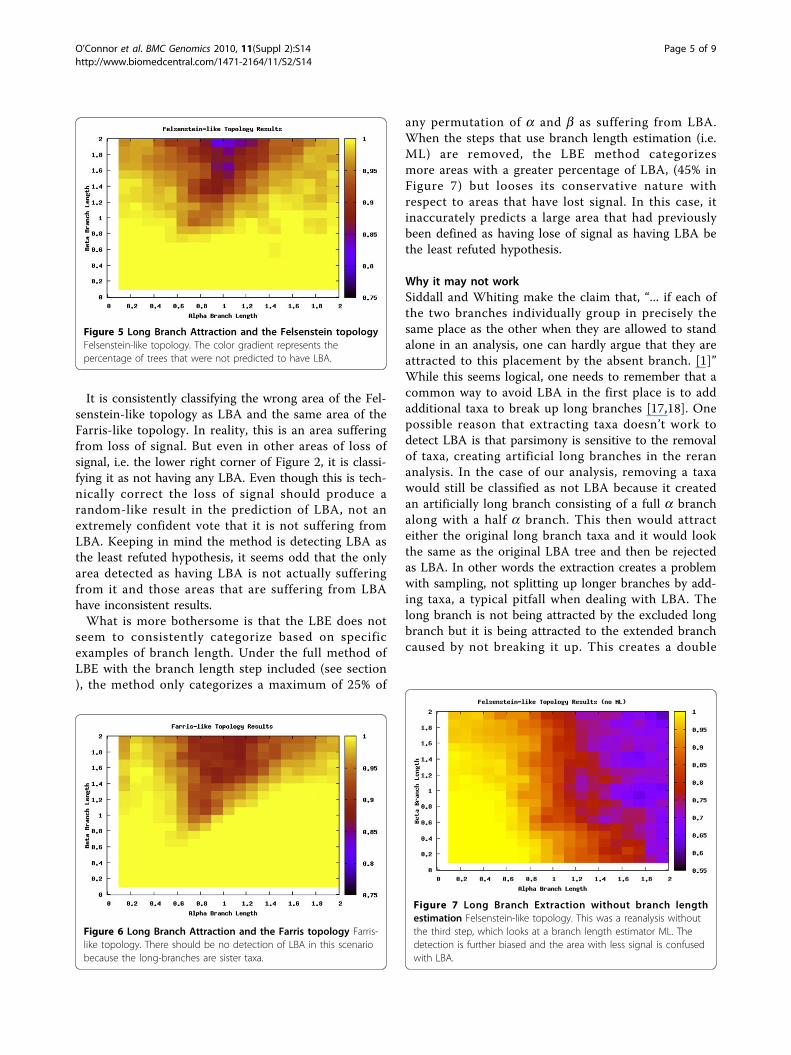
It is consistently classifying the wrong area of the Fel-senstein-like topology as LBA and the same area of theFarris-like topology. In reality, this is an area sufferingfrom loss of signal. But even in other areas of loss ofsignal, i.e. the lower right corner of Figure 2, it is classi-fying it as not having any LBA. Even though this is tech-nically correct the loss of signal should produce arandom-like result in the prediction of LBA, not anextremely confident vote that it is not suffering fromLBA. Keeping in mind the method is detecting LBA asthe least refuted hypothesis, it seems odd that the onlyarea detected as having LBA is not actually sufferingfrom it and those areas that are suffering from LBAhave inconsistent results.What is more bothersome is that the LBE does not
seem to consistently categorize based on specificexamples of branch length. Under the full method ofLBE with the branch length step included (see section), the method only categorizes a maximum of 25% of
any permutation of a and b as suffering from LBA.When the steps that use branch length estimation (i.e.ML) are removed, the LBE method categorizesmore areas with a greater percentage of LBA, (45% inFigure 7) but looses its conservative nature withrespect to areas that have lost signal. In this case, itinaccurately predicts a large area that had previouslybeen defined as having lose of signal as having LBA bethe least refuted hypothesis.
Why it may not workSiddall and Whiting make the claim that, “... if each ofthe two branches individually group in precisely thesame place as the other when they are allowed to standalone in an analysis, one can hardly argue that they areattracted to this placement by the absent branch. [1]”While this seems logical, one needs to remember that acommon way to avoid LBA in the first place is to addadditional taxa to break up long branches [17,18]. Onepossible reason that extracting taxa doesn’t work todetect LBA is that parsimony is sensitive to the removalof taxa, creating artificial long branches in the rerananalysis. In the case of our analysis, removing a taxawould still be classified as not LBA because it createdan artificially long branch consisting of a full a branchalong with a half a branch. This then would attracteither the original long branch taxa and it would lookthe same as the original LBA tree and then be rejectedas LBA. In other words the extraction creates a problemwith sampling, not splitting up longer branches by add-ing taxa, a typical pitfall when dealing with LBA. Thelong branch is not being attracted by the excluded longbranch but it is being attracted to the extended branchcaused by not breaking it up. This creates a double
Figure 5 Long Branch Attraction and the Felsenstein topologyFelsenstein-like topology. The color gradient represents thepercentage of trees that were not predicted to have LBA.
Figure 6 Long Branch Attraction and the Farris topology Farris-like topology. There should be no detection of LBA in this scenariobecause the long-branches are sister taxa.
Figure 7 Long Branch Extraction without branch lengthestimation Felsenstein-like topology. This was a reanalysis withoutthe third step, which looks at a branch length estimator ML. Thedetection is further biased and the area with less signal is confusedwith LBA.
O’Connor et al. BMC Genomics 2010, 11(Suppl 2):S14http://www.biomedcentral.com/1471-2164/11/S2/S14
Page 5 of 9
error and deceives the procedure into thinking it is nota case of LBAWe can thus split the branch length search space into
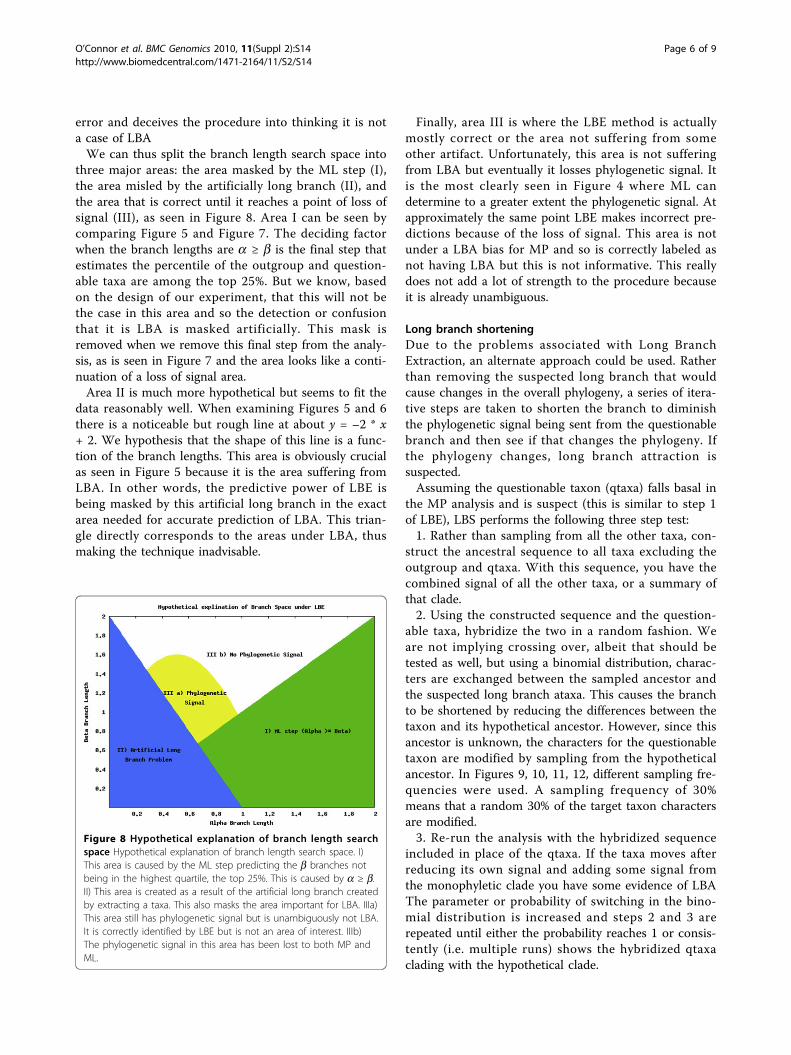
three major areas: the area masked by the ML step (I),the area misled by the artificially long branch (II), andthe area that is correct until it reaches a point of loss ofsignal (III), as seen in Figure 8. Area I can be seen bycomparing Figure 5 and Figure 7. The deciding factorwhen the branch lengths are a ≥ b is the final step thatestimates the percentile of the outgroup and question-able taxa are among the top 25%. But we know, basedon the design of our experiment, that this will not bethe case in this area and so the detection or confusionthat it is LBA is masked artificially. This mask isremoved when we remove this final step from the analy-sis, as is seen in Figure 7 and the area looks like a conti-nuation of a loss of signal area.Area II is much more hypothetical but seems to fit the
data reasonably well. When examining Figures 5 and 6there is a noticeable but rough line at about y = –2 * x+ 2. We hypothesis that the shape of this line is a func-tion of the branch lengths. This area is obviously crucialas seen in Figure 5 because it is the area suffering fromLBA. In other words, the predictive power of LBE isbeing masked by this artificial long branch in the exactarea needed for accurate prediction of LBA. This trian-gle directly corresponds to the areas under LBA, thusmaking the technique inadvisable.
Finally, area III is where the LBE method is actuallymostly correct or the area not suffering from someother artifact. Unfortunately, this area is not sufferingfrom LBA but eventually it losses phylogenetic signal. Itis the most clearly seen in Figure 4 where ML candetermine to a greater extent the phylogenetic signal. Atapproximately the same point LBE makes incorrect pre-dictions because of the loss of signal. This area is notunder a LBA bias for MP and so is correctly labeled asnot having LBA but this is not informative. This reallydoes not add a lot of strength to the procedure becauseit is already unambiguous.
Long branch shorteningDue to the problems associated with Long BranchExtraction, an alternate approach could be used. Ratherthan removing the suspected long branch that wouldcause changes in the overall phylogeny, a series of itera-tive steps are taken to shorten the branch to diminishthe phylogenetic signal being sent from the questionablebranch and then see if that changes the phylogeny. Ifthe phylogeny changes, long branch attraction issuspected.Assuming the questionable taxon (qtaxa) falls basal in
the MP analysis and is suspect (this is similar to step 1of LBE), LBS performs the following three step test:1. Rather than sampling from all the other taxa, con-
struct the ancestral sequence to all taxa excluding theoutgroup and qtaxa. With this sequence, you have thecombined signal of all the other taxa, or a summary ofthat clade.2. Using the constructed sequence and the question-
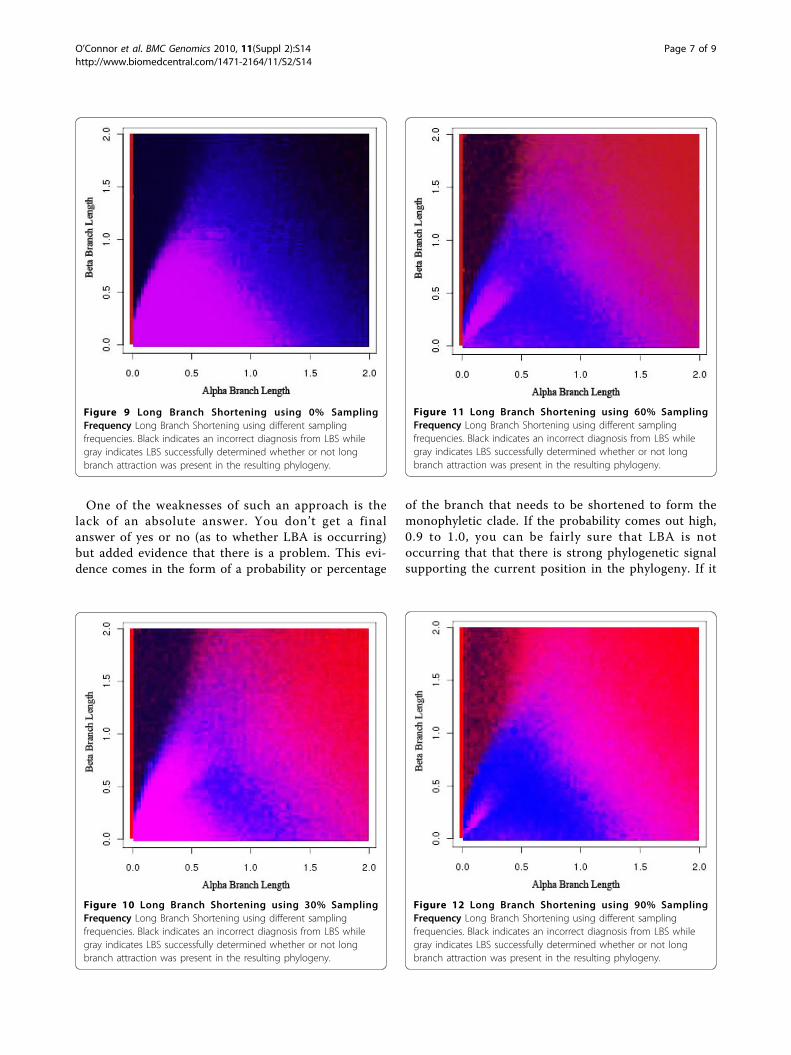
able taxa, hybridize the two in a random fashion. Weare not implying crossing over, albeit that should betested as well, but using a binomial distribution, charac-ters are exchanged between the sampled ancestor andthe suspected long branch ataxa. This causes the branchto be shortened by reducing the differences between thetaxon and its hypothetical ancestor. However, since thisancestor is unknown, the characters for the questionabletaxon are modified by sampling from the hypotheticalancestor. In Figures 9, 10, 11, 12, different sampling fre-quencies were used. A sampling frequency of 30%means that a random 30% of the target taxon charactersare modified.3. Re-run the analysis with the hybridized sequence
included in place of the qtaxa. If the taxa moves afterreducing its own signal and adding some signal fromthe monophyletic clade you have some evidence of LBAThe parameter or probability of switching in the bino-mial distribution is increased and steps 2 and 3 arerepeated until either the probability reaches 1 or consis-tently (i.e. multiple runs) shows the hybridized qtaxaclading with the hypothetical clade.
Figure 8 Hypothetical explanation of branch length searchspace Hypothetical explanation of branch length search space. I)This area is caused by the ML step predicting the b branches notbeing in the highest quartile, the top 25%. This is caused by a ≥ b.II) This area is created as a result of the artificial long branch createdby extracting a taxa. This also masks the area important for LBA. IIIa)This area still has phylogenetic signal but is unambiguously not LBA.It is correctly identified by LBE but is not an area of interest. IIIb)The phylogenetic signal in this area has been lost to both MP andML.
O’Connor et al. BMC Genomics 2010, 11(Suppl 2):S14http://www.biomedcentral.com/1471-2164/11/S2/S14
Page 6 of 9
One of the weaknesses of such an approach is thelack of an absolute answer. You don’t get a finalanswer of yes or no (as to whether LBA is occurring)but added evidence that there is a problem. This evi-dence comes in the form of a probability or percentage
of the branch that needs to be shortened to form themonophyletic clade. If the probability comes out high,0.9 to 1.0, you can be fairly sure that LBA is notoccurring that that there is strong phylogenetic signalsupporting the current position in the phylogeny. If it
Figure 9 Long Branch Shortening using 0% SamplingFrequency Long Branch Shortening using different samplingfrequencies. Black indicates an incorrect diagnosis from LBS whilegray indicates LBS successfully determined whether or not longbranch attraction was present in the resulting phylogeny.
Figure 11 Long Branch Shortening using 60% SamplingFrequency Long Branch Shortening using different samplingfrequencies. Black indicates an incorrect diagnosis from LBS whilegray indicates LBS successfully determined whether or not longbranch attraction was present in the resulting phylogeny.
Figure 10 Long Branch Shortening using 30% SamplingFrequency Long Branch Shortening using different samplingfrequencies. Black indicates an incorrect diagnosis from LBS whilegray indicates LBS successfully determined whether or not longbranch attraction was present in the resulting phylogeny.
Figure 12 Long Branch Shortening using 90% SamplingFrequency Long Branch Shortening using different samplingfrequencies. Black indicates an incorrect diagnosis from LBS whilegray indicates LBS successfully determined whether or not longbranch attraction was present in the resulting phylogeny.
O’Connor et al. BMC Genomics 2010, 11(Suppl 2):S14http://www.biomedcentral.com/1471-2164/11/S2/S14
Page 7 of 9
is very low, then long branch attraction has occurredand is causing an incorrect tree to be inferred. Thisevidence can help the researcher to understand if thequestionable taxa (qtaxa) is sending a strong signal tobe in the current location or a weak one. A weak sig-nal implies that the location is inferred only because ofanalogous evolution and not homology. This implica-tion can then be interpreted as the determination ordetection of LBA.In Figures 9, 10, 11, 12, dark black indicates regions
where Long Branch Shortening(LBS) fails to predictwhether long branch attraction is occurring. Gray areasindicate regions where LBS successfully determinedwhether or not long branch attraction was present inthe resulting phylogeny. With a 0% sampling frequency(Figure 9), the target taxon is not modified at all andthus the phylogeny does not change. LBS then reportsthat no LBA exists anywhere. In this case, the Felsen-stein Zone (the black region in the upper left portion ofthe graph) is clear and LBS is unable to detect longbranch attraction. As the sampling frequency increases,the target taxon becomes more like the clade and LBS ismore able to detect long branch attraction in the Felsen-stein Zone. However, this comes at a price. The regionwhere there is no long branch attraction is nowreported incorrectly (the lower left portion of thegraph). This is due to the fact that the target taxon hasbecome so much more like the other taxa that at 90%sampling (Figure 12), long branch attraction is alwaysreported because the target taxon always moves; result-ing in a different phylogeny.
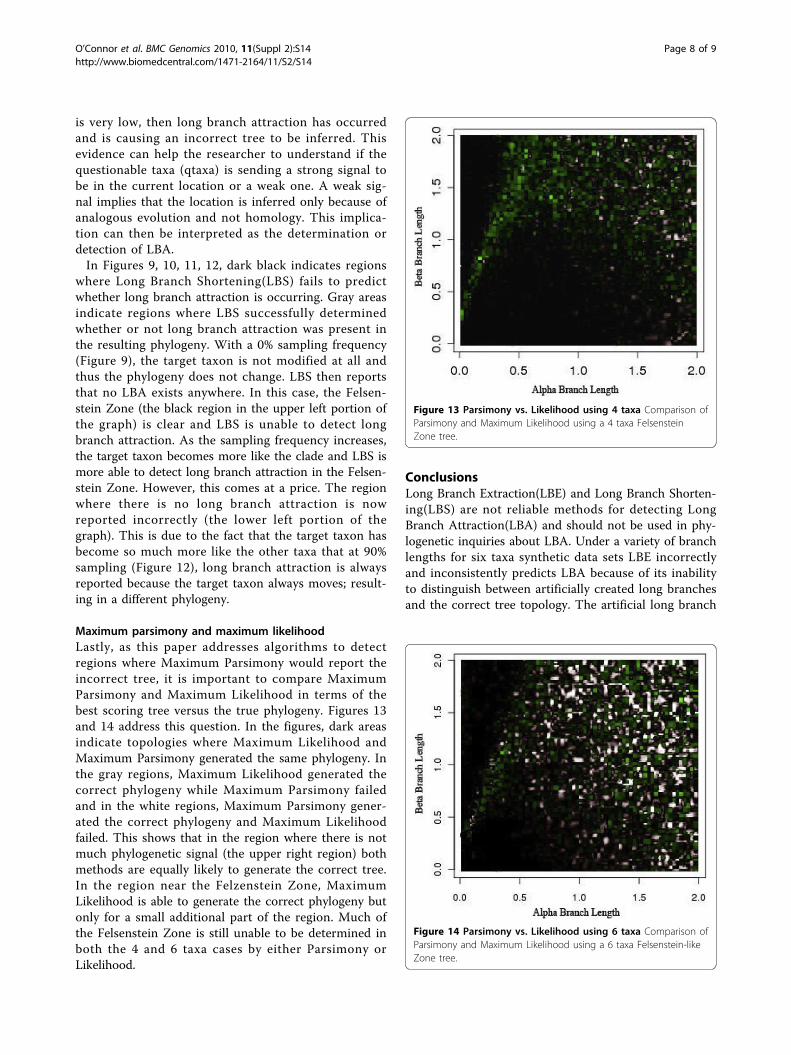
Maximum parsimony and maximum likelihoodLastly, as this paper addresses algorithms to detectregions where Maximum Parsimony would report theincorrect tree, it is important to compare MaximumParsimony and Maximum Likelihood in terms of thebest scoring tree versus the true phylogeny. Figures 13and 14 address this question. In the figures, dark areasindicate topologies where Maximum Likelihood andMaximum Parsimony generated the same phylogeny. Inthe gray regions, Maximum Likelihood generated thecorrect phylogeny while Maximum Parsimony failedand in the white regions, Maximum Parsimony gener-ated the correct phylogeny and Maximum Likelihoodfailed. This shows that in the region where there is notmuch phylogenetic signal (the upper right region) bothmethods are equally likely to generate the correct tree.In the region near the Felzenstein Zone, MaximumLikelihood is able to generate the correct phylogeny butonly for a small additional part of the region. Much ofthe Felsenstein Zone is still unable to be determined inboth the 4 and 6 taxa cases by either Parsimony orLikelihood.
ConclusionsLong Branch Extraction(LBE) and Long Branch Shorten-ing(LBS) are not reliable methods for detecting LongBranch Attraction(LBA) and should not be used in phy-logenetic inquiries about LBA. Under a variety of branchlengths for six taxa synthetic data sets LBE incorrectlyand inconsistently predicts LBA because of its inabilityto distinguish between artificially created long branchesand the correct tree topology. The artificial long branch
Figure 13 Parsimony vs. Likelihood using 4 taxa Comparison ofParsimony and Maximum Likelihood using a 4 taxa FelsensteinZone tree.
Figure 14 Parsimony vs. Likelihood using 6 taxa Comparison ofParsimony and Maximum Likelihood using a 6 taxa Felsenstein-likeZone tree.
O’Connor et al. BMC Genomics 2010, 11(Suppl 2):S14http://www.biomedcentral.com/1471-2164/11/S2/S14
Page 8 of 9
is created by the removal of the outgroup or question-able taxa branch creating a sister taxa that is artificiallylong, having removed the taxa that would break up itslong branch. An additional problem is that the ML stepmasks a large area of the branch length space not givingthe method the specificity that is needed to be effective.This was shown by an in depth search over two topolo-gies, the Felsenstein-like topology that is easily suscepti-ble to LBA and the Farris-like topology in which thelong branches are correctly grouped together. Theresults support our conclusion that LBE is ineffective indetecting LBA.LBS is not effective because it incorrectly estimates
the sequence present at the ancestral node. Statisticalsampling of the other sequences artificially causes thetarget taxon to appear like all the taxa rather than short-ening its branch. This results in a loss of accuracy in thedetection of LBA.Both LBE and LBS suffer from a secondary effect.
When a branch is extracted from the phylogeny or shor-tened, other branches are free to become the longestbranch and will potentially draw other similarly longbranches away from their correct locations. Both Maxi-mum Likelihood and Maximum Parsimony are subjectto LBA in Felsenstein topologies and Likelihood pro-vides superior results in only a small part of the Felsen-stein Zone.
AcknowledgementsThis project was supported by the National Science Foundation under GrantNo. 0120718 and by the Brigham Young University Office of Research andCreative Activity. Publication of this supplement was made possible withsupport from the International Society of Intelligent Biological Medicine(ISIBM).This article has been published as part of BMC Genomics Volume 11Supplement 2, 2010: Proceedings of the 2009 International Conference onBioinformatics & Computational Biology (BioComp 2009). The full contents ofthe supplement are available online at http://www.biomedcentral.com/1471-2164/11?issue=S2.
Author details1Department of Zoology, University of Cambridge, Cambridge CB2 3EJ, UK.2Department of Computer Science, Brigham Young University, Provo, Utah84602, USA.
Authors’ contributionsAll authors designed, analyzed, implemented and tested the proposedalgorithm. Each author contributed equally in writing the paper. All authorsread and approved the final manuscript.
Competing interestsThe authors declare that they have no competing interests.
Published: 2 November 2010
References1. Siddall M, Whiting M: Long-Branch Abstractions. Cladistics 1999, 15:9-24.2. Camin J, Sokal R: A Method for Deducing Branching Sequences in
Phylogeny. Evolution 1965, 19(3):311-326.3. Goloboff P: Parsimony, likelihood, and simplicity. Cladistics 2003,
19(2):91-103.
4. Felsenstein J: Cases in which Parsimony or Compatibility Methods Willbe Positively Misleading. Systematic Zoology 1978, 27(4):401-410.
5. Bergsten J: A review of long-branch attraction. Cladistics 2005,21(2):163-193.
6. Huelsenbeck J, Hillis D: Success of Phylogenetic Methods in the Four-Taxon Case. Systematic Biology 1993, 42(3):247-264.
7. Huelsenbeck J: Performance of Phylogenetic Methods in Simulation.Systematic Biology 1995, 44:17-48.
8. Hillis D, Huelsenbeck J, Cunningham C: Application and accuracy ofmolecular phylogenies. Science 1994, 264(5159):671.
9. Pol D, Siddall M: Biases in Maximum Likelihood and Parsimony: ASimulation Approach to a 10-Taxon Case. Cladistics 2001, 17(3):266-281.
10. Swofford D, Waddell P, Huelsenbeck J, Foster P, Lewis P, Rogers J: Bias inPhylogenetic Estimation and Its Relevance to the Choice betweenParsimony and Likelihood Methods. Systematic Biology 2001,50(4):525-539.
11. Siddall M: Success of Parsimony in the Four-Taxon Case: Long-BranchRepulsion by Likelihood in the Farris Zone. Cladistics 1998, 14(3):209-220.
12. Cartwright R: DNA assembly with gaps (Dawg): simulating sequenceevolution. Bioinformatics 2005, 21(3):31-38.
13. Tavare S: Some probabilistic and statistical problems on the analysis ofDNA sequences. Lect. Math. Life Sci 1986, 17:57-86.
14. Lanave C, Preparata G, Sacone C, Serio G: A new method for calculatingevolutionary substitution rates. Journal of Molecular Evolution 1984,20:86-93.
15. Rodriguez F, Oliver J, Marin A, Medina J: The general stochastic model ofnucleotide substitution. J Theor Biol 1990, 142(4):485-501.
16. Swofford DL: PAUP*. Phylogenetic Analysis Using Parsimony (* andOther Methods). Version 4. Sunderland, Massachusetts: Sinauer Associates2003.
17. Graybeal A: Is It Better to Add Taxa or Characters to a DifficultPhylogenetic Problem? Systematic Biology 1998, 47:9-17.
18. Hillis D: Taxonomic Sampling, Phylogenetic Accuracy, and InvestigatorBias. Systematic Biology 1998, 47:3-8.
doi:10.1186/1471-2164-11-S2-S14Cite this article as: O’Connor et al.: Analysis of long branch extractionand long branch shortening. BMC Genomics 2010 11(Suppl 2):S14.
Submit your next manuscript to BioMed Centraland take full advantage of:
• Convenient online submission
• Thorough peer review
• No space constraints or color figure charges
• Immediate publication on acceptance
• Inclusion in PubMed, CAS, Scopus and Google Scholar
• Research which is freely available for redistribution
Submit your manuscript at www.biomedcentral.com/submit
O’Connor et al. BMC Genomics 2010, 11(Suppl 2):S14http://www.biomedcentral.com/1471-2164/11/S2/S14
Page 9 of 9