Embed Size (px)
Citation preview

Analysis of non-striated faults in a recent extensional setting:
the Plio-Pleistocene Concud fault (Jiloca graben, eastern Spain)
L.E. Arlegui a,*, J.L. Simon a, R.J. Lisle b, T. Orife b,c
a Dep. Geologıa, Universidad de Zaragoza. Pedro Cerbuna, 12, 50009 Zaragoza, Spainb Laboratory for Strain Analysis, Department of Earth, Ocean and Planetary Sciences, Cardiff University, UK
c Now at BG International, Reading, UK
Abstract
The integration of palaeostress results obtained from the analysis of non-striated faults and joints affecting Plio-Pleistocene deposits near the
Concud fault (southern Jiloca graben, eastern Spain) yields a multidirectional tension stress field (vertical s1, s2zs3) where the primary s3
trajectories trend ENE. The results also show strong deflections of stress trajectories, with many local s3 axes being either orthogonal or parallel to
the trace of the Concud fault. The stress field persisted throughout the period of activity of the fault, i.e. Late Pliocene and Pleistocene. The
agreement between the present results and the regional picture gives support to the stress inversion method and shows its usefulness in palaeostress
analysis of young, poorly lithified rocks.
q 2006 Elsevier Ltd. All rights reserved.
Keywords: Stress inversion; Stress field; Stress deflection; Normal fault; Jiloca graben
1. Introduction
Palaeostress reconstruction is often hampered by the lack of
striated faults in sufficient number for analysis by conventional
stress inversion procedures. A new method of stress inversion
based solely on observations of fault plane orientation and slip
sense has been proposed by Lisle et al. (2001) and Orife et al.
(2002), which permits stress interpretation in unlithified clastic
deposits where striations are usually absent. This method has
now been applied to fracture samples measured in Late
Pliocene and Pleistocene alluvial materials of the Teruel and
Jiloca grabens (Arlegui et al., 2005). The resulting picture for
the most recent stress field in the region agrees well with the
Miocene–Early Pliocene stress field inferred from striated
faults (Simon, 1989; Cortes, 1999).
The goal of the present work is a more intensive application
of this new method to non-striated fracture samples collected in
the area surrounding the Concud fault (Jiloca graben, eastern
Iberian Chain). The results are then compared and integrated
with data obtained from extensional fractures collected at the
same sites in order to achieve a more precise model of stress
0191-8141/$ - see front matter q 2006 Elsevier Ltd. All rights reserved.
doi:10.1016/j.jsg.2006.03.009
* Corresponding author. Tel.: C34 976 76 21 27; fax: C34 976 76 11 06.
E-mail addresses: [email protected] (L.E. Arlegui), [email protected]
(J.L. Simon).
distribution around the fault and to check the reliability of the
method. The surveyed deposits range from Late Miocene to
Pleistocene in age. A number of fracture datasets were
collected from previous studies in which those non-striated
faults could not be adequately treated (Simon, 1983, 1989;
Simon and Soriano, 1993), whereas other data sets have been
collected in new dedicated field surveys.
2. Geological setting and macrostructure of the study area
The Iberian Chain is an intraplate, NW–SE-trending chain
resulting from the inversion of the Mesozoic Iberian Basin.
During the Palaeogene and Early Miocene, the region was
compressed along two main directions (SE–NW and NNE–
SSW, parallel and orthogonal to the basin trend, respectively).
During the Neogene, the eastern margin of the Iberian
Peninsula became dominated by the influence of rifting in
the Valencia Trough (Alvaro et al., 1979). As a consequence, a
large network of Neogene–Quaternary extensional basins are
developed at the eastern Iberian Chain, which represent the
onshore deformation of the rift (Roca and Guimera, 1992).
Driven by both rifting processes and crustal uplift, those basins
evolved through two distinct episodes (Simon, 1982, 1983).
The first (Miocene) produced the NNE–SSW-trending Teruel
graben under well defined WNW–ESE s3 trajectories.
The second (Late Pliocene–Quaternary) created the NNW–
SSE-trending Jiloca graben and gave rise to reactivation of the
Teruel graben.
Journal of Structural Geology 28 (2006) 1019–1027
www.elsevier.com/locate/jsg
L.E. Arlegui et al. / Journal of Structural Geology 28 (2006) 1019–10271020
The regional stress field responsible for extensional faulting
in the eastern Iberian Chain is relatively well known (Simon,
1989; Cortes, 1999). It is a nearly ‘multidirectional’ tension (s1
vertical, s2zs3) with s3 trending near ENE, albeit with
frequent deflections, s3 veering to become either parallel or
perpendicular to NNW and NNE major faults. However,
palaeostress determinations in the neighbourhood of the
Concud fault are very scarce, mainly because the abundant
fractures in this area seldom display striations, effectively
disabling most of the usual methods of stress inversion. Results
from fault slickenlines are limited to one site studied by Simon
and Soriano (1993) in Turolian (Upper Miocene) limestones.
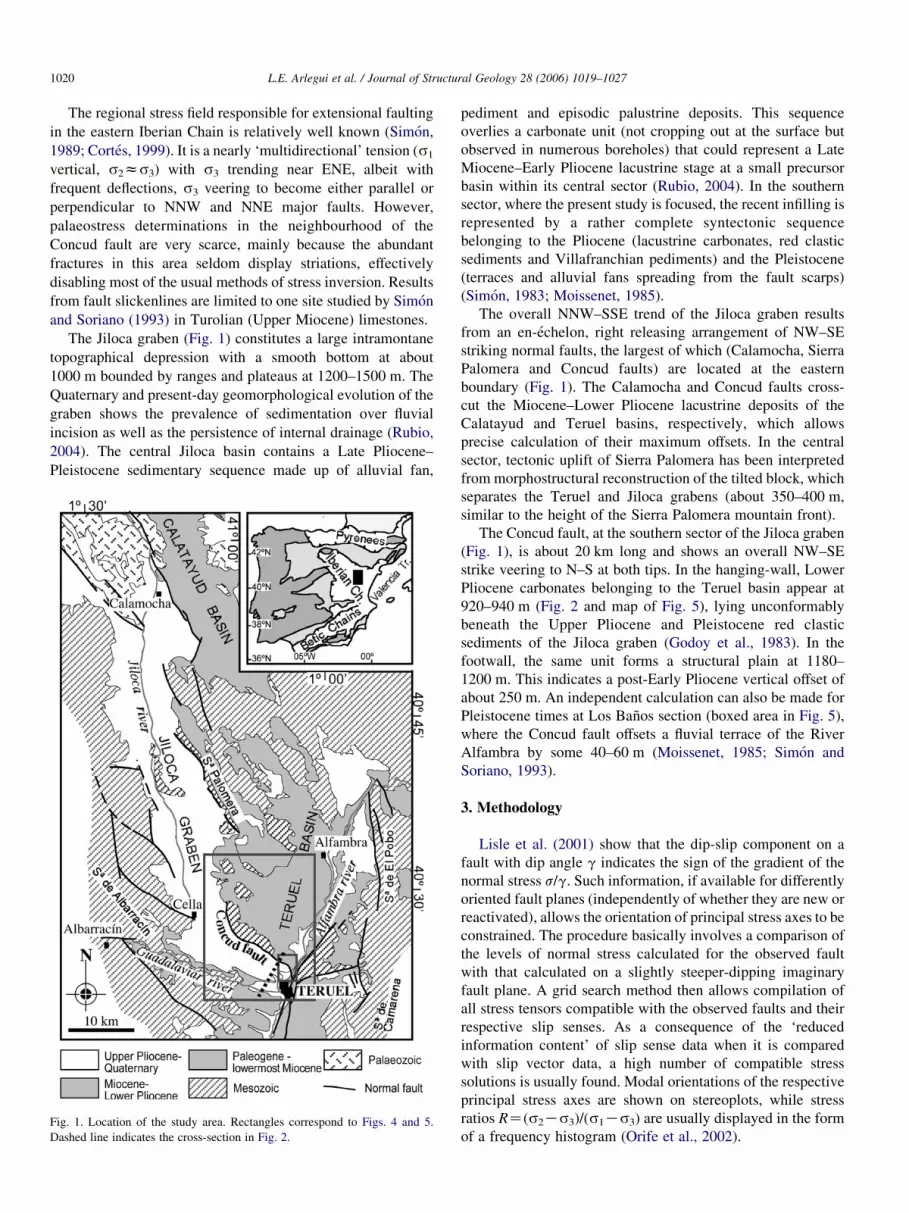
The Jiloca graben (Fig. 1) constitutes a large intramontane
topographical depression with a smooth bottom at about
1000 m bounded by ranges and plateaus at 1200–1500 m. The
Quaternary and present-day geomorphological evolution of the
graben shows the prevalence of sedimentation over fluvial
incision as well as the persistence of internal drainage (Rubio,
2004). The central Jiloca basin contains a Late Pliocene–
Pleistocene sedimentary sequence made up of alluvial fan,
Fig. 1. Location of the study area. Rectangles correspond to Figs. 4 and 5.
Dashed line indicates the cross-section in Fig. 2.
pediment and episodic palustrine deposits. This sequence
overlies a carbonate unit (not cropping out at the surface but
observed in numerous boreholes) that could represent a Late
Miocene–Early Pliocene lacustrine stage at a small precursor
basin within its central sector (Rubio, 2004). In the southern
sector, where the present study is focused, the recent infilling is
represented by a rather complete syntectonic sequence
belonging to the Pliocene (lacustrine carbonates, red clastic
sediments and Villafranchian pediments) and the Pleistocene
(terraces and alluvial fans spreading from the fault scarps)
(Simon, 1983; Moissenet, 1985).
The overall NNW–SSE trend of the Jiloca graben results
from an en-echelon, right releasing arrangement of NW–SE
striking normal faults, the largest of which (Calamocha, Sierra
Palomera and Concud faults) are located at the eastern
boundary (Fig. 1). The Calamocha and Concud faults cross-
cut the Miocene–Lower Pliocene lacustrine deposits of the
Calatayud and Teruel basins, respectively, which allows
precise calculation of their maximum offsets. In the central
sector, tectonic uplift of Sierra Palomera has been interpreted
from morphostructural reconstruction of the tilted block, which
separates the Teruel and Jiloca grabens (about 350–400 m,
similar to the height of the Sierra Palomera mountain front).
The Concud fault, at the southern sector of the Jiloca graben
(Fig. 1), is about 20 km long and shows an overall NW–SE
strike veering to N–S at both tips. In the hanging-wall, Lower
Pliocene carbonates belonging to the Teruel basin appear at
920–940 m (Fig. 2 and map of Fig. 5), lying unconformably
beneath the Upper Pliocene and Pleistocene red clastic
sediments of the Jiloca graben (Godoy et al., 1983). In the
footwall, the same unit forms a structural plain at 1180–
1200 m. This indicates a post-Early Pliocene vertical offset of
about 250 m. An independent calculation can also be made for
Pleistocene times at Los Banos section (boxed area in Fig. 5),
where the Concud fault offsets a fluvial terrace of the River
Alfambra by some 40–60 m (Moissenet, 1985; Simon and
Soriano, 1993).
3. Methodology
Lisle et al. (2001) show that the dip-slip component on a
fault with dip angle g indicates the sign of the gradient of the
normal stress s/g. Such information, if available for differently
oriented fault planes (independently of whether they are new or
reactivated), allows the orientation of principal stress axes to be
constrained. The procedure basically involves a comparison of
the levels of normal stress calculated for the observed fault
with that calculated on a slightly steeper-dipping imaginary
fault plane. A grid search method then allows compilation of
all stress tensors compatible with the observed faults and their
respective slip senses. As a consequence of the ‘reduced
information content’ of slip sense data when it is compared
with slip vector data, a high number of compatible stress
solutions is usually found. Modal orientations of the respective
principal stress axes are shown on stereoplots, while stress
ratios RZ(s2Ks3)/(s1Ks3) are usually displayed in the form
of a frequency histogram (Orife et al., 2002).

Fig. 2. Cross-section at the SE sector of the Concud fault (see location in Fig. 1).
L.E. Arlegui et al. / Journal of Structural Geology 28 (2006) 1019–1027 1021
Palaeostress analysis has been applied to samples of
faults and fractures collected at 19 sites in the vicinity of
the Concud fault (see Table 1). Most of the studied outcrops
show clastic rocks of continental origin, mainly conglom-
erate and siltstone deposits formed in alluvial fans and
pediments from Late Miocene to Late Pliocene in age.
Other sites show Turolian (Late Miocene) lacustrine
carbonates or Pleistocene fluvial terraces including gravel,
sand, silt or calcareous tufa.
Five types of structures were observed. (1) Fault surfaces
showing mesoscopic dip separations, with normal sense in all
cases (Fig. 3). (2) Fractures with negligible offset on a
mesoscopic scale, but showing normal-sense small-scale shear
indicators: millimetre-scale dip separations, minor Riedel
fractures or rotated pebbles. (3) Fractures without any sign of
movement, interpreted as ‘normal’ shear or hybrid fractures on
the basis of geometrical criteria: conjugate sets, smooth
surfaces parallel to fractures of types 1 and 2, or angles with
bedding under 758. (4) Pure extensional joints, irregular
Table 1
Results of palaeostress analysis. Site 16 was studied by Simon and Soriano (1993)
N. Lithology Age Stress analysis fro
No. of data
01 Siltstone, conglomerate Late Pliocene 28
02 Siltstone, conglomerate Late Pliocene 26
03 Conglomerate Late Pliocene 26
04 Conglomerate Late Pliocene 39
05 Gravel, silt Middle Pleistocene 35
06 Gravel, sand Early Pleistocene 22
07 Gravel, silt Late Pliocene 50
08 Limestone Late Miocene 12
09 Conglomerate Middle Pleistocene 12
10 Limestone Late Miocene 8
11 Limestone Late Miocene 11
12 Limestone Late Miocene 13
13 Limestone Late Miocene 11
14 Limestone Late Miocene 16
15 Gravel, sand Early Pleistocene 13
16 Limestone Late Miocene 22
17 Conglomerate Late Miocene 33
18 Silt Early Pleistocene 20
19 Gravel, silt Mid. (Late?) Pleist. 23
surfaces nearly orthogonal to bedding. (5) Ambiguous fractures
whose classification as either type 3 or 4 was not possible from
field observation.
A dataset containing the orientations of several tens of
fracture planes was collected in each outcrop, discarding in all
cases those fractures belonging to type 5. Extensional joints
(type 4) have been analysed separately at outcrops where a
sufficient number of planes could be measured. Local s3 axes
have been interpreted as being orthogonal to significant joint
sets at those sites.
Faults and shear fractures (types 1, 2 and 3) have been
considered for the inversion method of Lisle et al. (2001), with
sample sizes ranging from 8 to 50. According to the description
in the above paragraph, a normal sense has been input for every
fracture. Stress inversion has been carried out assuming that all
fractures within each sample represent a single stress episode.
Actually, the method of Lisle et al. (2001) does not permit the
identification of separate stress tensors that could eventually be
recorded at the same site. Neither do we consider a previous
using the method of Etchecopar et al. (1981). See text for further explanation
m faults Stress analysis from extensional fractures
s1 s3 No. of data s3
Vertical 00, 253 8 075
Vertical 00, 065 9 070
Vertical 00, 246
Vertical 00, 180 21 155
Vertical 00, 253 170
Vertical 00, 126
00, 216 13 075
Vertical 00, 022 16 165
75, 020 16, 146
Vertical 00, 057
75, 000 15, 255
71, 067 18, 251
70, 090 16, 195
85, 275 05, 175
Vertical 00, 090
Vertical 00, 042
Vertical 00, 035
Vertical 00, 065 18 160
Vertical 00, 166
Vertical 00, 066

Fig. 3. View of faults analysed in site 2.
L.E. Arlegui et al. / Journal of Structural Geology 28 (2006) 1019–10271022
separation of fractures (e.g. based upon the geometry of planes)
as an adequate strategy. We should not discard the possibility
of having ‘polyphase’ data sets, from which only an average
stress state could have been obtained.
A number of striated faults were also observed in some
outcrops of Neogene carbonates, but unfortunately the
sample sizes were not large enough to provide reliable
solutions. No further palaeostress result, other than that by
Simon and Soriano (1993; site 16), could therefore be
obtained from analysis of fault slickenlines. This prevents
our testing the new method against those from ‘conventional’
methods in the study area, though such a comparison has
previously been made for the ensemble of the Teruel and
Jiloca grabens (Arlegui et al., 2005). In such a situation,
analysis of tensile fractures provides the only independent
way for checking the solutions obtained by the method of
Lisle et al. (2001).
4. Palaeostress results. Interpretation and discussion
The obtained results of palaeostress analysis are shown in
Table 1 and Figs. 4–6. Stress states inferred using the method
of Lisle et al. (2001) have in all cases vertical or near vertical
s1 axes, which is to be expected with normal faults. On the
whole, the s3 axes have a NE–SW trend, but a closer look
reveals variations as discussed below. Unfortunately, the stress
ratios show very high dispersion, which gives rise to unreliable
solutions, and they have therefore not been included in Table 1.
Nevertheless, most stress solutions suggest a multidirectional
tension regime, since the spectrum of compatible s3 axes
obtained for each sample is widely distributed over the
horizontal plane.
The arrows on maps of Figs. 4 and 5 indicate the modal
azimuth of compatible s3 axes at each data site. Two mutually
orthogonal solutions can be distinguished at site 6, which
suggests s2/s3 axial switching. Two near-orthogonal white
arrows show also the average solutions for sites 10–14 in
Fig. 4, located close to each other within a single outcrop
(a more detailed analysis is discussed in the next section; see
Fig. 6). The result obtained by Simon and Soriano (1993) from
striated faults is also included (site 16).
The trends of s3 axes show three different patterns: (a)
ENE-trending axes inferred from dominantly NNW–SSE
striking fractures (sites 1–3, 5, 10, 17 and 19). (b) ENE–
NNE-trending axes, nearly orthogonal to the Concud fault
trace, inferred from fracture samples with varied strikes (sites
6, 7, 9–11 and 14–16). (c) SE–SSE-trending axes, almost
parallel to the Concud fault trace, also inferred from complex
fracture patterns (sites 6, 8, 13 and 18). The N–S-trending s3
axes inferred at sites 4 and 12 are the only solutions not
included in those patterns.
The orientations of pure tensile fractures, as shown in the
rose diagrams of Figs. 4 and 5, generally agree with the former
results. The NNW–SSE striking sets at sites 1, 2, 7 and 17 are
consistent with well defined ENE–WSW-trending s3 axes, i.e.
one of the stress patterns inferred from shear fractures. In the
case of site 4, the dominant set strikes NE–SW, which indicates
a NW–SE-trending s3 axis nearly parallel to the Concud fault
trace. At this site, the same dominant strike is shown by shear
fractures, though the N–S-trending s3 axis we obtained does
not coincide with the former. Finally, the azimuth distribution
of tensile fractures at site 6 also fits the rather scattered solution
obtained from shear fractures, which suggests multidirectional
tension.
Such a stress regime had been established from the low
stress ratios RZ(s2Ks3)/(s1Ks3) obtained from striated fault
samples in Miocene and Lower Miocene rocks (Simon, 1989;
Cortes, 1999). With respect to stress orientations, those ENE-
trending s3 axes probably mirror the far-field extensional stress
during Late Pliocene and Quaternary times, with trajectories of
the maximum horizontal stress (SHmax) related to recent
intraplate compression and perhaps also responsible for the
general trend of the Jiloca graben (Simon, 1989; Arlegui et al.,
2005). Furthermore, they are parallel to the present-day stress
field that can be inferred from focal mechanisms (Herraiz et al.,
2000).
Stress axes either parallel or perpendicular to the Concud
fault trace should be interpreted in terms of stress deflection,
the observed patterns being usual on a wide range of scales

Fig. 4. Schematic geological map of the Concud fault and results of palaeostress analysis. Arrows: local directions of s3 axes obtained from fracture samples in
Upper Miocene carbonates (white) and in clastic materials of Late Pliocene–Pleistocene age (grey); S: Mesozoic; M: Upper Miocene–Lower Pliocene; V:
Villafranchian (Upper Pliocene); Qt: Pleistocene fluvial terraces and pediments; Qa: Pleistocene alluvial fans; H: Holocene deposits. Pairs of stereoplots show faults
and shear fractures collected in each site and the density of compatible s3 axes obtained by the method of Lisle et al. (2001). Rose diagrams show strike distributions
of tensile fractures. Stereoplot of site 16 includes fault planes and striae, as well as the deviatoric stress tensor obtained using the method of Etchecopar et al. (1981);
RZ(s2Ks3)/(s1Ks3).
L.E. Arlegui et al. / Journal of Structural Geology 28 (2006) 1019–1027 1023
within multidirectional tension stress fields. According to the
numerical models by Simon et al. (1988) and Kattenhorn et al.
(2000), s3 trajectories run orthogonal to the strike of an
extensional fault close to their tips, but parallel to it near its
central zone. On the other hand, switching of s2 and s3
principal stresses, as suggested by the occurrence of two
mutually orthogonal s3 directions at sites 6 and 10–14, is also a
common phenomenon in this type of stress regime. It occurs
owing to stress drop caused by the development of primary
fractures, and gives rise to strain partitioning taking the form of
orthogonal joint sets (Simon et al., 1988; Rives et al., 1994;
Caputo, 1995; Bai et al., 2002) or pairs of conjugate normal

Fig. 5. Geological map of the southern tip of the Concud fault with results of palaeostress analysis. Arrows, stereoplots and rose diagrams have the same meaning as
in Fig. 4. Point A corresponds to the location of Fig. 7b. S: Mesozoic; M1: Vallesian red clastic deposits; M2: Upper Vallesian–Turolien carbonates; M3: Upper
Turolian clay and gypsum; M4: Ruscinian carbonates; V: Villafranchian pediment; Qt2: middle terrace; Qt1: lower terrace; Qa: Pleistocene alluvial fans; H:
Holocene deposits.
L.E. Arlegui et al. / Journal of Structural Geology 28 (2006) 1019–10271024
fault systems striking at right angles to each other (Simon,
1989; Angelier, 1994).
5. Detailed analysis at Los Banos section (sites 10–14)
The Los Banos area, located some 3 km north of Teruel,
is where more information on the Concud fault could be
gathered. The main outcrop is a cutting of the old Ojos
Negros–Sagunto mining railway, where the main fault and
the rocks at both walls can be inspected. Fault orientation is
1708, 758 W, with a striation pitch of 758 S. As can be seen
in Figs. 5, 6 and 7a, the fault brings Turolian limestones and
marls in the footwall into contact with Pleistocene alluvial
fan gravel and silt in the hanging wall. Turolian carbonates
were strongly bent into a large monocline, then unconform-
ably overlain with a portion of the middle terrace of the
River Alfambra made up of a 5–6-m-thick layer of
conglomerates topped by 1–2 m of calcareous tufa. This
terrace is affected by a number of fractures and normal faults
with small-offsets. Beneath the Pleistocene alluvial fan
deposits of the downthrown block, there is a similar
sequence of conglomerate and calcareous tufa that could
represent the same fluvial terrace (Moissenet, 1985; Simon
and Soriano, 1993). Height difference between both
correlative deposits suggests a minimum throw of 39 m.
Most of the displacement on the Concud fault predates the
lower terrace level, which appears not to be offset at Los
Banos. Nevertheless, an outcrop of this terrace recently
exposed by a new road near Teruel (site A in map of Fig. 5)
shows a small normal fault oriented 1528, 708 W, which may
record the latest propagation event of the Concud fault at its SE
tip. The offset of this fault at the base of the lower terrace is 2 m
(Fig. 7b), and it decreases towards the top.
The timing of the deformation can be inferred from the
available age data for both of the fluvial terraces that are
affected by the fault. The middle terrace has been attributed
to the Middle Pleistocene on the basis of its vertebrate fauna
(Godoy et al., 1983; Moissenet, 1985) and thermolumines-
cence dating (138G10 ka; Santonja et al., 1994). This
estimate has been now corroborated by analysis of Th/U
isotopes in two samples collected at the centre and the top of
the calcareous tufa layer at Los Banos. These have given
ages of 169G10 and 116G40 ka BP, the second determi-
nation being the more reliable one (Table 2). The lower
terrace was also attributed to the Middle Pleistocene by
Moissenet (1985) on the basis of the presence of Mammuthus
trogontherii. This age is much too close to the Th/U age of

Fig. 6. The Concud fault at Los Banos section with results from palaeostress analysis. Same symbols as in Fig. 5. Arrows, stereoplots and rose diagrams have the
same meaning as in Fig. 4. Arrows indicate projection of s3 axes on the plane of the section; true s3 axes are close to this plane in the case of sites 9–11 and 14,
whereas they are clearly out-of-plane in the case of sites 12 and 13.
L.E. Arlegui et al. / Journal of Structural Geology 28 (2006) 1019–1027 1025
the middle terrace and probably needs revision; hence the
timing of the latest event on the Concud fault remains
unconstrained.
Two fracture datasets have been collected within the middle
terrace conglomerates at Los Banos, one in each block, and five
more within the Turolien limestones in the footwall of the
Concud fault (see Fig. 6). An abundance of fractures allows us
to draw fine distinctions by carefully recording where in the
section the faults were collected. The results can be
summarized as follows:
(1) The plunge of s3 axes shows varied relationships with
bedding dip: s3 is parallel to bedding in some steeply
dipping beds (sites 10–12), whereas it is almost
horizontal at 9, 13 and 14, even though the beds are
tilted. If we assume that the stress axes were originally
horizontal, the tilted s3 axes should predate the
monocline whereas those that are still horizontal should
be younger. Such time relationships lead us to conclude
that extensional fractures were initiated within the
Miocene strata close to the main fault, and later—after
bending had taken place—they propagated into the
Quaternary levels. The stress states inferred at sites
9–14 are therefore diachronous and span much of the
period during which the fault was active (Late Pliocene
and Pleistocene).
(2) Stresses show heterogeneities that can be interpreted as
perturbations linked to the presence of the Concud fault.
On the one hand, s3 trajectories are deflected and tend to
be perpendicular to the fault trace at sites 9–11, and
parallel to it at sites 8 and 13 (the interpretation is less
clear at sites 12 and 14). On the other hand, minor
fracture planes are parallel to the main fault close to it
(sites 9–11), and become more dispersed when we look
farther from the fault, with a new orthogonal set
appearing at sites 8, 13 and 14. In accordance with

Fig. 7. (a) The Concud fault at Los Banos. (b) View of a small fault close to the southern tip of the Concud fault (site A in Fig. 5) affecting the lower terrace of the
Alfambra river.
L.E. Arlegui et al. / Journal of Structural Geology 28 (2006) 1019–10271026
those fracture patterns, dispersion of s3 axes is smaller
close to the fault and larger at more distant sites, which
suggests that the remote multidirectional tension become
more ‘triaxial’ within the immediate neighbourhood of
the Concud fault. This change in stress ratio had also
been described as an additional aspect of stress
perturbation in finite-element models by Simon et al.
(1988). All these stress heterogeneities seem to be
basically spatial rather than temporal heterogeneities;
they are clearly related to the main fault within Los
Banos section, whereas they do not correlate with the
timing discussed in the previous paragraph.
Table 2
Geochemical results and inferred Th/U ages for two samples collected in the
calcareous tufa unit capping the middle terrace of the River Alfambra. See
location in Fig. 5 (site 8) and Fig. 6 (upper cross-section). Th/U analysis carried
out at the Centre d’Etudes et de Recherches Appliquees au Karst, Faculte
Polytechnique de Mons, Belgium (May 1999)
Sample 1A 2A
Coordinates 1805 036 00 W, 40822 054 00 N 1805 038 00 W, 40822 055 00 N
Location within
the unit
Middle part Top
(U( (ppm) 0.600G0.006 0.579G0.007234U/238U 1.266G0.008 1.258G0.010230Th/234U 0.824G0.020 0.676G0.015230Th/232Th 7.1G0.2 15.3G0.6
Initial 234U/238U 1.427 1.357
Age (ka) 169.4 (C10.0/K9.0) 115.8 (C4.6/K4.4)
6. Conclusions
The stress inversion method developed by Lisle et al. (2001)
for non-striated fault surfaces allowed us to characterize the
Plio-Pleistocene stress field in the vicinity of the Concud fault.
Fracture data long available from clastic Late Pliocene and
Pleistocene sediments allows us to complete earlier studies
based on slickenline analysis (Simon, 1989; Cortes, 1999).
The stress field around the Concud fault retained a number
of characteristics throughout the period of fault activity (Late
Pliocene and Pleistocene). The regional stress field is basically
a multidirectional tension (vertical s1, s2zs3) with primary
ENE–WSW-trending s3 trajectories, driven by a combination
of intraplate remote compression, rifting and crustal uplift
(Simon, 1989; Arlegui et al., 2005). Its activity has continued
up to the present, as inferred from seismic focal mechanisms
(Herraiz et al., 2000).
This stress field is locally perturbed by the Concud fault. In
particular: (a) s3 trajectories are deflected, becoming either
parallel or perpendicular to the fault strike; (b) there is a
tendency for s2 and s3 axes to switch; and (c) the shape of
stress ellipsoids evolves from multidirectional tension to
triaxial tension. All these features can easily be explained by
reference to theoretical models of stress perturbation within an
extensional regime (Simon et al., 1988; Kattenhorn et al.,
2000).
The internal coherence of the new palaeostress results and
its similarity to those obtained from extensional fractures in the

L.E. Arlegui et al. / Journal of Structural Geology 28 (2006) 1019–1027 1027
same materials and sites give a measure of the soundness of the
stress inversion method by Lisle et al. (2001) and of the
advantages of using it in the analysis of fractures affecting
recent sedimentary rocks. They also corroborate previous
results (Arlegui et al., 2005) that were successfully contrasted
with stress solutions inferred from striated faults in the
surrounding region.
Acknowledgements
We are very grateful to C. Vita-Finci and J.M. Gonzalez-
Casado for their helpful and constructive reviews. Th/U
analysis was carried out at the Centre d’Etudes et de
Recherches Appliquees au Karst, Faculte Polytechnique de
Mons, Belgium. Project BTE 2002-04168 of the DGES
(Spanish Government) provided funding for this research.
References
Alvaro, M., Capote, R., Vegas, R., 1979. Un modelo de evolucion geotectonica
para la Cadena Celtiberica. Acta Geologica Hispanica 14, 172–177.
Angelier, J., 1994. Fault slip analysis and paleostress reconstruction. In:
Hancock, P.L. (Ed.), Continental Deformation. Pergamon Press, Oxford,
pp. 53–100.
Arlegui, L.E., Simon, J.L., Lisle, R.J., Orife, T., 2005. Late Pliocene–
Pleistocene stress field in the Teruel and Jiloca grabens (eastern Spain):
contribution of a new method of stress inversion. Journal of Structural
Geology 27, 693–705.
Bai, T., Maerten, L., Gross, M.R., Aydin, A., 2002. Orthogonal cross joints:
do they imply a regional stress rotation. Journal of Structural Geology 24,
77–88.
Caputo, R., 1995. Evolution of orthogonal sets of coeval extension joints. Terra
Nova 7, 479–490.
Cortes, A.L., 1999. Evolucion tectonica reciente de la Cordillera Iberica,
Cuenca del Ebro y Pirineo centro-ocidental. Ph.D. thesis, University of
Zaragoza, 409pp.
Etchecopar, A., Vasseur, G., Daignieres, M., 1981. An inverse problem in
microtectonics for the determination of stress tensors from fault striation
analysis. Journal of Structural Geology 3, 51–65.
Godoy, A., Ramırez, J.I., Olive, A., Moissenet, E., Aznar, J.M., Aragones, E.,
Aguilar, M.J., Ramırez del Pozo, J., Leal, M.C., Jerez Mir, L., Adrover, R.,
Goy, A., Comas, M.J., Alberdi, M.T., Giner, J., Gutierrez Elorza, M.,
Portero, J.M., Gabaldon, V., 1983. Mapa Geologico de Espana 1:50,000,
Hoja 567 (Teruel). I.G.M.E., Madrid.
Herraiz, M., De Vicente, G., Lindo-Naupari, R., Giner, J., Simon, J.L.,
Gonzalez-Casado, J.M., Vadillo, O., Rodrıguez-Pascua, M.A.,
Cicuendez, J.I., Casas, A., Cabanas, L., Rincon, P., Cortes, A.L.,
Ramırez, M., Lucini, M., 2000. The recent (upper Miocene to Quaternary)
and present tectonic stress distributions in the Iberian Peninsula. Tectonics
19, 762–786.
Kattenhorn, S.A., Aydin, A., Pollard, D.D., 2000. Joints at high angles to
normal fault strike: an explanation using 3-D numerical models of fault-
perturbed stress fields. Journal of Structural Geology 22, 1–23.
Lisle, R.J., Orife, T., Arlegui, L.E., 2001. A stress inversion method requiring
only fault slip sense. Journal of Geophysical Research 106 (B2), 2281–
2289.
Moissenet, E., 1985. Le Quaternaire moyen alluvial du fosse de Teruel
(Espagne). Physio-Geo 14-15, 61–78.
Orife, T., Arlegui, L.E., Lisle, R.J., 2002. Dipslip: a QuickBasic stress
inversion program for analyzing sets of faults without slip lineations.
Computers & Geosciences 28, 775–781.
Rives, T., Rawnsley, K.D., Petit, J.P., 1994. Analogue simulation of natural
orthogonal joint set formation in brittle varnish. Journal of Structural
Geology 16, 419–429.
Roca, E., Guimera, J., 1992. The Neogene structure of the eastern Iberian
margin: structural constraints on the crustal evolution of the Valencia
trough (western Mediterranean). Tectonophysics 203, 203–218.
Rubio, J.C., 2004. Los humedales del Alto Jiloca: estudio hidrogeologico e
historico-arqueologico. Ph.D. thesis, University of Zaragoza, 354pp.
Santonja, M., Moissenet, E., Perez-Gonzalez, A., Villa, P., Sese, C., Soto, E.,
Eisenmann, V., Mora, R., Dupre, M., 1994. Cuesta de la Bajada: un
yacimiento del Pleistoceno medio en Aragon. Arqueologıa Aragonesa 21,
61–68.
Simon, J.L., 1982. Compresion y distension alpinas en la Cadena Iberica
Oriental. Ph.D. thesis, University of Zaragoza. Publ. Instituto de Estudios
Turolenses, Teruel (1984), 269pp.
Simon, J.L., 1983. Tectonica y neotectonica del sistema de fosas de Teruel.
Teruel 69, 21–97.
Simon, J.L., 1989. Late Cenozoic stress field and fracturing in the Iberian Chain
and Ebro Basin (Spain). Journal of Structural Geology 11, 285–294.
Simon, J.L., Soriano, M.A., 1993. La falla de Concud (Teruel): actividad
cuaternaria y regimen de esfuerzos asociado. In: Aleixandre, T., Perez
Gonzalez, A. (Eds.), El Cuaternario de Espana y Portugal Instituto
Tecnologico GeoMinero de Espana, Madrid 2, pp. 729–737.
Simon, J.L., Seron, F.J., Casas, A.M., 1988. Stress deflection and fracture
development in a multidirectional extension regime. Mathematical and
experimental approach with field examples. Annales Tectonicae 2, 21–32.


