Embed Size (px)
Citation preview

265
The Jurassic deposits in the Danish Central Graben areof particular interest in relation to hydrocarbon explo-ration, as they include units of reservoir sandstones aswell as oil- and gas-producing source rocks (Fig. 1).
Hydrocarbon discoveries have been made in both Middleand Upper Jurassic sandstones, and the Middle JurassicHarald Field is under production. The distribution ofboth reservoirs and source rocks reflects the complex
Sequence stratigraphy of the Jurassic of the DanishCentral Graben
Jan Andsbjerg and Karen Dybkjær
A sequence stratigraphic framework is established for the Jurassic of the Danish Central Grabenbased primarily on petrophysical log data, core sedimentology and biostratigraphic data from about50 wells. Regional seismic lines are used to assist in the correlation of some wells and in the con-struction of isochore maps. In the Lower Jurassic (Hettangian–Pliensbachian) succession, fivesequences have been identified. The Middle Jurassic is subdivided into four sequences that togetherspan the uppermost Aalenian/lowermost Bajocian to the Callovian. In the Upper Jurassic, betterwell coverage permits greater stratigraphic resolution, and 11 sequences are identified and mapped.
On the basis of the sequence stratigraphic correlation and the construction of isochore mapsfor individual sequences, the Jurassic basin history of the Danish Central Graben can be subdi-vided into seven discrete phases: (1) Shallow marine and offshore sediments deposited in a pre-rift basin extending from the North Sea to the Fennoscandian Border Zone (Hettangian–Pliensbachian).(2) Uplift and erosion in association with a Toarcian–Aalenian North Sea doming event. A majorhiatus represents this phase in the study area. (3) Terrestrial and marginal marine sedimentationduring initial rifting (latest Aalenian/earliest Bajocian – Late Callovian). (4) Early Oxfordian – EarlyKimmeridgian transgression during and after a rift pulse. The sedimentary environment changedfrom coastal plain and marginal marine to fully marine. (5) Regression associated with a cessa-tion or slowing of subsidence during a structural rearrangement that took place in the LateKimmeridgian during a break in the main rift climax. Shallow to marginal marine sandstones weredeposited above an erosion surface of regional extent. (6) Deep-water mudstones deposited ina composite graben with high subsidence rates related to rift pulses (latest Late Kimmeridgian –middle Middle Volgian). (7) Deposition of organic-rich mudstones and turbidite sandstones dur-ing the late Middle Volgian – Early Ryazanian. The main basin shallowed, became more symmetricaland experienced a decreasing rate of subsidence, recording the onset of the post-rift stage.
A relative sea-level curve is constructed for the Middle–Late Jurassic. It shows close similarityto published eustatic (global) and relative (North Atlantic area) sea-level curves in the latestBathonian – late Early Kimmeridgian, but differs in the Late Kimmeridgian – Middle Volgian inter-val, probably due to the high rate of subsidence in the study area.
Keywords: Danish Central Graben, Jurassic, sequence stratigraphy, palaeogeography, basin evolution, sea-level changes
Geological Survey of Denmark and Greenland, Geocenter Copenhagen, Øster Voldgade 10, DK-1350 Copenhagen K,
Denmark. E-mail: [email protected]
Geological Survey of Denmark and Greenland Bulletin 1, 265–300 (2003) © GEUS, 2003

tectonic evolution of the area and a depositional his-tory strongly influenced by relative sea-level changes.
Data from a large number of wells in the study areahave been released in recent years, contributing impor-
tant new information to this study. The aim of this paperis to present a sequence stratigraphic model for theJurassic deposits of the Danish Central Graben.
266
■■
■■
■■
■■
■■
■■
■■
■■
■■
■■
■■
■■
■■
■■
■■
■■
■■
■■
■■
■■
■■
■■
■■
■■
■■
■■
■■
■■
■■
■■
■■
■■
■■
▲▲
▲
■■
■■
■■
■■
■■
■■
■■
■■
■■
■■
■■
■■
■■
■■
■■
■■
■■■■
■■
■■
■■
■■
■■
■■
■■
■■■■
■■
■■
■■
■■
■■
■■
■■
■■
■■
■■
■■
■■
■■
■■
■■
■■
■■
■■
■■
■■
■■
■■
■■
■■
■■
■■
■■
Emma-1
Cleo-1
221
Karl-1
Tordenskjold-1
Gulnare-1
I-1
Elin-1
Deep Adda-1
V-1Ugle-1
M-8U-1
Deep Gorm-1
Anna-3
O-1
2/12-12/11-7
Baron-2
Amalie-1
Ravn-2
Ravn-1
W-1
Eg-1
Liva-1
B-1
Falk-1
Elly-1 Elly-2
Elly-3
Edna-1
Jens-1
N. Jens-1
Bo-1
E-1
Adda-1
Alma-1
Se. Igor-1G-1
Kim-1Lone-1
Diamant-1
Gwen-2
Q-1
Jeppe-1
Mona-1
Nora-1
Iris-1
3/7-4
Lulu-1
2/12-2 Gert-31
4
W. Lulu-3
JohnFlank-1
Søgne B
asin
Piggvar Terrace
Gert Ridge
Feda Graben Inge HighHeno
Plateau
Mads High
Tail End Graben
Arne–Elin G
raben
Poul Plateau
Ro
sa Basin
Gertrud
Plateau/Graben
Mandal High
Ål BasinO
uter Rough Basin
Coffee Soil Fault
SaltDome
Province
Mid NorthSea High
Ringkøbing–Fyn High(East North Sea Block)
Reverse faultTriangles showing dip of fault planeNormal faultBoxes showing dip of fault plane
Salt structure
Well
▲
■■
20 km
N
4°E 5°E
24
56°30'
56°N
500 km
UK
CentralGraben
Moray FirthBasin Viking Graben
Norway
Denmark
Germany
TheNether-
lands
Fig. 1. Maps showing the location of the study area (dark blue) within the Jurassic North Sea rift system, the Jurassic structural ele-ments in the Danish Central Graben and the position of the wells incorporated in the study; note that all wells forming the databasefor the isochore and palaeogeographic maps are indicated, although some are not specifically mentioned in the text or illustrated.The Middle Jurassic Harald Field is delimited by the location of the West Lulu-1, -2 and -3 wells; note that the structural feature denotedthe Gertrud Plateau/Graben is so indicated to reflect the structural evolution of this region in the Late Jurassic, from a positive plateauin the early Late Jurassic to an actively subsiding graben from the Early Volgian.

Regional geologyThe Central Graben forms the southern part of theNorth Sea rift system. Active rifting took place in thisarea both in the Triassic and in the late Middle Jurassic– Late Jurassic (Roberts et al. 1990; Ziegler 1990). The500 km long Central Graben, approximately 150 km ofwhich are situated in the Danish North Sea sector, con-sists of a NNW–SSE-trending complex of half-grabens,and a subordinate N–S-trending segment to the southextending into the German and Dutch sectors. Themain bounding fault in the Danish sector is the CoffeeSoil Fault, which forms the eastern margin of the DanishCentral Graben (Fig. 1).
The Early Jurassic was characterised by a slow rela-tive sea-level rise and deposition of marine muds of theFjerritslev Formation, probably over most of the Danisharea (Fig. 2; Larsen 1966; Michelsen 1978, 1989; Pedersen1986; Michelsen et al. 1987).
In latest Early Jurassic – earliest Middle Jurassic times,the whole area was uplifted and most of the LowerJurassic section was removed by erosion (Hallam &
Sellwood 1976; Ziegler 1982, 1990; Underhill & Parting-ton 1993). The uplift may have occurred in responseto the development of a rift dome extending 700 kmin a north–south direction and 1000 km east–west acrossthe central North Sea (Whiteman et al. 1975; Eynon1981; Ziegler 1990; Underhill & Partington 1993). Domaluplift appears to have been accompanied by the devel-opment of a volcanic complex at the triple junctionbetween the Viking Graben, the Central Graben and theMoray Firth Basin (Ziegler 1990). Sedimentation resumedin the Danish part of the Central Graben during theMiddle Jurassic, with deposition of the sandstone-dom-inated Bryne and Lulu Formations and the mudstone-dominated Middle Graben Formation (Michelsen et al.2003, this volume). These sediments are restricted tothe Søgne Basin, the Tail End Graben and the Salt DomeProvince (Vollset & Doré 1984; Jensen et al. 1986). Thefirst marine transgression in the Danish Central Grabenoccurred during the Callovian–Oxfordian, probablyreflecting the onset of domal collapse combined witheustatic sea-level rise (Ziegler 1990; Underhill & Parting-ton 1993).
267
Upp
er
Volgian
Kimmeridgian
Oxfordian
Callovian
Bathonian
Bajocian
Aalenian
Toarcian
Pliensbachian
Sinemurian
Hettangian
Sand-dominatedformations
Mid
dle
Low
er
S N NW SE
Poul Fm
Lola Fm
Fjerritslev Fm
Farsund Fm
Jura
ssic
Middle GrabenFm
Marine mud-dominatedformations
Paralic mud-dominatedformationOrganic-rich mudstones Missing section
Farsund Fm
Heno Fm
Lulu Fm
Bryne Fm
Heno Fm
Bo MbBo MbRyazanian
Chronostratigraphy
L. Cret.
Fjerritslev Fm
Lola Fm
Middle Graben Fm
Bryne Fm
Fig. 2. Jurassic lithostratigraphy of the Danish Central Graben, based on Jensen et al. (1986) and Michelsen et al. (2003, this volume).L. Cret., Lower Cretaceous.

During Late Jurassic time, the Feda Graben, the HenoPlateau and the Gertrud Graben became actively sub-siding depositional basins, and the depositional area waslater extended to the Outer Rough and Ål Basins (Fig.1). Deep-water conditions were established in the DanishCentral Graben during the Oxfordian–Kimmeridgian,when the marine mudstones of the Lola Formation weredeposited. During the Late Kimmeridgian, shallow marinesandstones of the Heno Formation were deposited onplateau areas. The transgression culminated during theVolgian with deposition of the deep marine mudstonesof the Farsund Formation (Vollset & Doré 1984; Jensenet al. 1986). The Early Cretaceous saw a change to morepassive thermal subsidence (Roberts et al. 1990).
In addition to rift tectonics, basin development in theCentral Graben was also strongly influenced by thepresence of mobile Zechstein salt. Salt movements hada profound influence on the development of depocen-tres in the Søgne Basin, the Tail End Graben and theSalt Dome Province (Korstgaard et al. 1993; Sundsbø& Megson 1993).
Stratigraphic methodsThe stratigraphic analysis is based on data from about50 wells that penetrate Jurassic deposits in the DanishCentral Graben, and a few wells from the NorwegianNorth Sea sector located near the boundary (Fig. 1). Welllogs, including gamma-ray, sonic, neutron/density andresistivity logs, sedimentological core logs, lithologylogs, and biostratigraphic data were used in the study.Furthermore, a number of interpreted regional seismiclines were included to support the generation of iso-chore maps.
BiostratigraphyThe biostratigraphic data used in this study are confinedto palynomorphs because information from other groupsof microfossils is too scarce in most wells to be usefulfor detailed correlation. The biostratigraphic correla-tions are based on events rather than recognition of bio-zones. The events used in our study are mainly lastoccurrence datums (i.e. first downhole appearance) ofdinoflagellate cyst species (Fig. 3). The biostratigraphicinformation utilised in the study includes publisheddata (Birkelund et al. 1983; Hoelstad 1986; Poulsen1986, 1991; Heilmann-Clausen 1987; Johannessen et al.1996), unpublished reports of the Geological Survey of
Denmark and Greenland and of industrial service com-panies, and the results of new analyses made specifi-cally for this study.
Due to poor core coverage, being generally restrictedto sandy successions of relatively few wells, most datawere derived from cuttings samples. Although samplequality in the Lower Jurassic succession was variable,it was possible to establish a palynostratigraphic frame-work based on a small number of events and strati-graphically diagnostic palyno-assemblages (Fig. 3A).A detailed palynostratigraphical subdivision of the Mid-dle Jurassic succession is precluded by the sparseoccurrence of age-diagnostic palynomorphs (Fig. 3B);although scanty, the available records made it possibleto give an approximate age for the sequences and majorevents in the Middle Jurassic. In the Upper Jurassic, thelarge sediment thicknesses, the somewhat better dataquality, the favourable environment, and the higherdiversity of dinoflagellate cyst species probably all con-tribute to a higher biostratigraphic resolution (Fig. 3C).
Sequence stratigraphyThe sequence stratigraphic terminology applied is thatintroduced by the Exxon group (Posamentier et al. 1988;Posamentier & Vail 1988; Van Wagoner et al. 1988, 1990).Sequences are subdivided into lowstand, transgressiveand highstand systems tracts. A four-fold subdivisionwith the addition of the forced regressive systems tract(Hunt & Tucker 1992, 1995) is not attempted due to thescale of the study and the nature of the data.
Construction of the sequence stratigraphic frame-work is based on correlation of well log patterns, com-bined with biostratigraphic datings. The most con-spicuous log patterns, supported by the most importantbiostratigraphic events, were used to produce a coarsegrid, within which more detailed correlations weremade. Most commonly the gamma-ray logs were usedfor high-resolution correlations but resistivity logs formedthe primary tool in some organic-rich mudstone units.Distinct sonic log markers were occasionally used forcorrelation. Maximum flooding surfaces (MFS) are con-sidered the most reliable correlation surfaces in suc-cessions dominated by marine mudstones, whereassequence boundaries (SB), and occasionally floodingsurfaces (FS), are of primary importance in silty andsandy units. Both SB and MFS key surfaces can normallybe traced through most of the basin. In sections dom-inated by marine mudstones and siltstones, the SB isusually picked at the turnaround point between a coars-
268

269
Age
Dapcodiniumpriscum
Cerebropollenitesmacroverrocosus2)
Liasidiumvariabile
Liasidiumvariabile
Dapocodiniumpriscum5)
BorealStandardZones
Bioevents (Palynology)
First appearancedatums
Last occurrencedatums
Time inMa
Epoc
hEa
rly
Jura
ssic
190
195
185
200
205
Late
Tri
assi
c
(Gradsteinet al. 1994)
Late
Late
LLa
teLa
teEa
rly
Earl
yM
iddl
eEa
rly
Earl
yE
Mid
dle
Dispansum
Pseudoradiosa
Aalensis
Thouarsense
Variabilis
Bifrons
Falciferum
Tenuicostatum
Spinatum
Margaritatus
Davoei
Ibex
Jamesoni
Raricostatum
Oxynotum
Obtusum
Turneri
Semicostatum
Bucklandi
Angulata
Liasicus
Planorbis
Marshi
Reticulatus
Rhaetian
Hettangian
Sinemurian
Pliensbachian
Toarcian
First appearance
Last occurrence
Tie to BorealStandard Zonesuncertain
A Fig. 3. Bioevents used for datingthe sequences in the Lower Jurassic(A), Middle Jurassic (B) and UpperJurassic – lowermost Cretaceous (C) of the Danish Central Graben.The tie to Boreal Standard Zonesare according to Riding & Thomas(1992), unless otherwise indicated:1, Fenton & Riding (1987); 2, Dyb-kjær (1991); 3, Poulsen (1991); 4, Costa & Davey (1992); 5, Poul-sen (1992); 6, Poulsen & Riding(2003, this volume). Note in Fig. 3C: (1) The speciesindicated with an asterisk(Muderongia simplex) waspreviously referred to Muderongiasp. A Davey 1979; see furtherdiscussion in Poulsen (1996). (2) Although the LOD is indicatedat the base of the Kerberus Zone,the species Senoniasphaerajurassica (double asterisk) mayoccur sporadically up to theAnguiformis Zone. E, Early; L, Late.

ening-upwards unit and a fining-upwards unit, or atthe sharp base of a relatively coarse-grained bed occu-pying the position of the turnaround point.
Well logs form the primary tool for the identificationof lithologies, sedimentary facies and sedimentary suc-cessions, and thus for the identification of key surfacesand systems tracts. The cored sections have been the sub-ject of more detailed sedimentological facies analysisand palynofacies investigations (Hoelstad 1986; Johan-nessen & Andsbjerg 1993; Johannessen et al. 1996; Ands-bjerg 2003, this volume; Ineson et al. 2003, this volume;Johannessen 2003, this volume); these results have beenused to support the sequence stratigraphic subdivision.
The Lower Jurassic succession shows laterally con-sistent log patterns and, where a unit has not beenremoved by erosion, correlation of key surfaces is pos-sible over wide areas. In the Middle Jurassic section,only two or three key surfaces can be correlated fromone subbasin to another. A more detailed, four-foldsequence subdivision of the Middle Jurassic depositswithin the Søgne Basin is presented by Andsbjerg (2003,this volume). The laterally uniform log patterns of mostof the Upper Jurassic succession allow detailed wellcorrelations. In addition to the gamma-ray log, the resis-tivity logs proved to be a robust tool for high-resolu-tion correlations in the Lower Volgian succession of the
270
Lamberti
Athleta
CoronatumJason
Calloviense
Herveyi
Koenigi
Discus
Orbis
Hodsoni
MorrisiSubcontractus
ProgracilisTenuiplicatus
Zigzag
Parkinsoni
Garantiana
Subfurcatum
Humphriesianum
Sauzei
Laeviuscula
Discites
Concavum
Murchisonae
Opalinum
Callovian
Bathonian
Bajocian
Aalenian
Impletosphaeridiumvarispinosum
Adnatosphaeridiumcaulleryi
Impletosphaeridiumvarispinosum
Kekryphalosporadistincta1)
180
170
165
175
160
Late
Late
Late
LEa
rly
Earl
yEa
rly
EM
id.
Mid
dle
Mid
dle
AgeBoreal
StandardZones
Bioevents (Palynology)
First appearancedatums
Last occurrencedatums
Time inMa
(Gradsteinet al. 1994)
Mid
dle
Jura
ssic
Epoc
h
First appearance
Last occurrence
Tie to BorealStandard Zonesuncertain
B

southern Feda Graben and the northernmost HenoPlateau. Most key surfaces in the Upper Jurassic suc-cession are picked in marine mudstones and siltstones.Of these key surfaces, only one sequence boundary (thebase Kimm-2 SB) shows any sign of significant erosion.
Unusually high organic contents in the Upper Volgian– Ryazanian mudstones of the Bo Member (Michelsen
et al. 2003, this volume) probably influence log responsesand impede sequence stratigraphic interpretation (Inesonet al. 2003, this volume). In the uppermost sequenceof this study, Ryaz-1, a maximum flooding surface isnot identified. It might have been picked at the high-est gamma-ray peak in accordance with conventionalsequence stratigraphic concepts, but in this case all of
271
AgeBoreal
StandardZones
Bioevents (Palynology)
First appearancedatums
Last occurrencedatums
Time inMa
Epoc
h
(Gradsteinet al. 1994)
150
155
140
145
AlbidumStenomphalus
Icenii
Kochi
Runctoni
Lamplughi
PreplicomphalusPrimitivus
OppressusAnguiformisKerberus OkusensisGlaucolithus
AlbaniFittoni
Rotunda Pallasioides
Pectinatus
Hudlestoni
Wheatleyensis
Scitulus
Elegans
Autissiodorensis
Eudoxus
Mutabilis
Cymodoce
Baylei
Rosenkrantzi
RegulareSerratum
Glosense
TenuiserratumDensiplicatum
Cordatum
Mariae
Late
Jura
ssic
Earl
y C
reta
ceou
s
Earl
yEa
rly
Earl
yEa
rly
Late
Late
Late
Late
Mid
dle
Mid
dle
Dingodinium spinosum4)
Dichadogonyaulax culmula4)
Rotosphaeropsis thula4)
Egmontodinium expiratum4)
Egmontodiniumpolyplacophorum Dichadogonyaulax pannea
Glossodinium dimorphumMuderongia simplex*
Gochteodinia mutabilisSenoniasphaera jurassica6)**Scriniodinium inritibile
Occisucysta baliaPerisseiasphaeridium pannosum
Oligosphaeridium patulumCribroperidinium longicorne
Subtilisphaera? paeminosa
Endoscrinium luridum
Stephanelytron scarburghenseEndoscrinium galeritum
Scriniodinium crystallinumNannoceratopsis pellusida
Compositosphaeridiumpolonicum
Rigaudella aemula
Wanaea spp.
Ctenidodinium continuum
Subtilisphaera? paeminosa3)
S.? inaffecta3)
Oxfordian
Ryazanian
Volgian
Kimme-ridgian
First appearance
Last occurrence
Tie to BorealStandard Zonesuncertain
ParatolliaValanginian
C
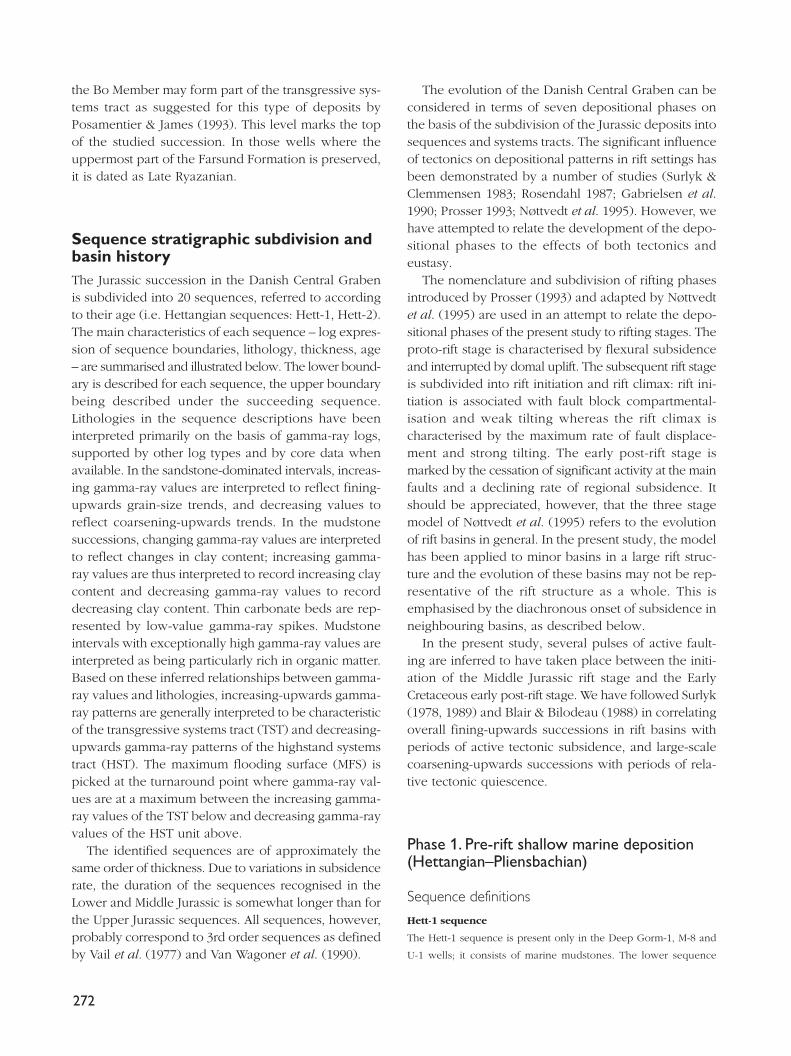
the Bo Member may form part of the transgressive sys-tems tract as suggested for this type of deposits byPosamentier & James (1993). This level marks the topof the studied succession. In those wells where theuppermost part of the Farsund Formation is preserved,it is dated as Late Ryazanian.
Sequence stratigraphic subdivision andbasin historyThe Jurassic succession in the Danish Central Grabenis subdivided into 20 sequences, referred to accordingto their age (i.e. Hettangian sequences: Hett-1, Hett-2).The main characteristics of each sequence – log expres-sion of sequence boundaries, lithology, thickness, age– are summarised and illustrated below. The lower bound-ary is described for each sequence, the upper boundarybeing described under the succeeding sequence.Lithologies in the sequence descriptions have beeninterpreted primarily on the basis of gamma-ray logs,supported by other log types and by core data whenavailable. In the sandstone-dominated intervals, increas-ing gamma-ray values are interpreted to reflect fining-upwards grain-size trends, and decreasing values toreflect coarsening-upwards trends. In the mudstonesuccessions, changing gamma-ray values are interpretedto reflect changes in clay content; increasing gamma-ray values are thus interpreted to record increasing claycontent and decreasing gamma-ray values to recorddecreasing clay content. Thin carbonate beds are rep-resented by low-value gamma-ray spikes. Mudstoneintervals with exceptionally high gamma-ray values areinterpreted as being particularly rich in organic matter.Based on these inferred relationships between gamma-ray values and lithologies, increasing-upwards gamma-ray patterns are generally interpreted to be characteristicof the transgressive systems tract (TST) and decreasing-upwards gamma-ray patterns of the highstand systemstract (HST). The maximum flooding surface (MFS) ispicked at the turnaround point where gamma-ray val-ues are at a maximum between the increasing gamma-ray values of the TST below and decreasing gamma-rayvalues of the HST unit above.
The identified sequences are of approximately thesame order of thickness. Due to variations in subsidencerate, the duration of the sequences recognised in theLower and Middle Jurassic is somewhat longer than forthe Upper Jurassic sequences. All sequences, however,probably correspond to 3rd order sequences as definedby Vail et al. (1977) and Van Wagoner et al. (1990).
The evolution of the Danish Central Graben can beconsidered in terms of seven depositional phases onthe basis of the subdivision of the Jurassic deposits intosequences and systems tracts. The significant influenceof tectonics on depositional patterns in rift settings hasbeen demonstrated by a number of studies (Surlyk &Clemmensen 1983; Rosendahl 1987; Gabrielsen et al.1990; Prosser 1993; Nøttvedt et al. 1995). However, wehave attempted to relate the development of the depo-sitional phases to the effects of both tectonics andeustasy.
The nomenclature and subdivision of rifting phasesintroduced by Prosser (1993) and adapted by Nøttvedtet al. (1995) are used in an attempt to relate the depo-sitional phases of the present study to rifting stages. Theproto-rift stage is characterised by flexural subsidenceand interrupted by domal uplift. The subsequent rift stageis subdivided into rift initiation and rift climax: rift ini-tiation is associated with fault block compartmental-isation and weak tilting whereas the rift climax ischaracterised by the maximum rate of fault displace-ment and strong tilting. The early post-rift stage ismarked by the cessation of significant activity at the mainfaults and a declining rate of regional subsidence. Itshould be appreciated, however, that the three stagemodel of Nøttvedt et al. (1995) refers to the evolutionof rift basins in general. In the present study, the modelhas been applied to minor basins in a large rift struc-ture and the evolution of these basins may not be rep-resentative of the rift structure as a whole. This isemphasised by the diachronous onset of subsidence inneighbouring basins, as described below.
In the present study, several pulses of active fault-ing are inferred to have taken place between the initi-ation of the Middle Jurassic rift stage and the EarlyCretaceous early post-rift stage. We have followed Surlyk(1978, 1989) and Blair & Bilodeau (1988) in correlatingoverall fining-upwards successions in rift basins withperiods of active tectonic subsidence, and large-scalecoarsening-upwards successions with periods of rela-tive tectonic quiescence.
Phase 1. Pre-rift shallow marine deposition(Hettangian–Pliensbachian)
Sequence definitions
Hett-1 sequence
The Hett-1 sequence is present only in the Deep Gorm-1, M-8 and
U-1 wells; it consists of marine mudstones. The lower sequence
272

boundary is located at the change from the low gamma-ray values
of the underlying Triassic deposits to the high gamma-ray values, char-
acteristic of the mudstones of the Hett-1 sequence (Figs 4, 5). The
boundary may be abrupt or gradational. The thickness of the sequence
attains a maximum of 23 m in M-8.
Stratigraphically useful bioevents have not been recorded from
this unit. The sequence is thought to be of Hettangian age due to its
stratigraphic position in the lowermost part of the Fjerritslev Formation,
unconformably overlying Upper Triassic deposits.
Hett-2 sequence
The marine mudstones of the Hett-2 sequence have only been found
in six wells but are considered to extend throughout the Salt Dome
Province. The boundary between the Hett-1 and Hett-2 sequences
is located at a shift to mudstones characterised by somewhat lower
clay contents (Figs 4, 5). In wells where the Hett-2 sequence directly
overlies pre-Jurassic sediments (e.g. Edna-1; Fig. 5), the lower sequence
boundary is marked by an abrupt lithological shift. The thickness of
the sequence shows very little variation, attaining a maximum of
64 m in Edna-1.
The abundance of bisaccate pollen of Pinuspollenites minimus
within this sequence in the Edna-1, John Flank-1 and O-1 wells indi-
cates the presence of the Pinuspollenites–Trachysporites Zone of
Lund (1977). This zone is known from the Danish Basin, Skåne and
northern Germany and is referred to the Hettangian (Lund 1977;
Dybkjær 1991). A Hettangian age is further supported by the occur-
rence of the dinocyst species Dapcodinium priscum in the wells
mentioned above and the absence of the pollen species Cerebro-
pollenites macroverrucosus (Fig. 3A).
Sin-1 sequence
The marine mudstones of this sequence probably extend through-
out the Salt Dome Province. The lower sequence boundary is typi-
cally located at a marked shift to mudstones with higher clay contents
(Figs 4, 5). The thickness of the sequence attains a maximum of 63 m
in Deep Gorm-1.
The last occurrence datum (LOD) of Dapcodinium priscum in the
lower part of the sequence in the O-1 well, and the first appearance
datum (FAD) of Cerebropollenites macroverrucosus in core samples
from the middle part of the sequence in the Deep Gorm-1 well, indi-
cate a latest Hettangian – Early Sinemurian age for the lower part of
the sequence. In combination with the LOD of Liasidium variabile
close to the upper boundary of this sequence in O-1, this indicates
a latest Hettangian – Sinemurian age for the sequence (Fig. 3A).
Pliens-1 sequence
This sequence is only present in the Deep Gorm-1 and Edna-1 wells
situated in the north-western part of the Salt Dome Province. In both
wells, it is represented by marine mudstones. The lower sequence
boundary is located at the top of the well-defined coarsening-upwards
HST of the Sin-1 sequence (Figs 4, 5). The thickness of the sequence
attains a maximum of 63 m in Edna-1.
The common occurrence (in sidewall cores) of pollen referred to
the genus Chasmasporites indicates the presence of the Chasmasporites
Zone (Koppelhus & Nielsen 1994), defined in the Korsodde section,
Bornholm, Denmark. The Chasmasporites Zone is referred to the
Pliensbachian, an age assignment supported by the stratigraphic posi-
tion of this sequence immediately above the LOD of Liasidium vari-
abile. The acme of the small, spherical pollen referred to the genus
Spheripollenites, characteristic of the uppermost Pliensbachian – Lower
Toarcian deposits in the Danish Basin and known from many other
locations in Northwest Europe (Dybkjær 1991), has not been reported
from the Danish Central Graben. This may indicate that deposits of
latest Pliensbachian – Toarcian age are absent in the study area.
Pliens-2 sequence
The marine mudstones of this sequence have only been recognised
in the Deep Gorm-1 and Edna-1 wells (Fig. 4). The sequence bound-
ary is positioned where the lithology changes abruptly from silty
mudstones of the Pliens-1 HST to more clay-rich mudstones (Fig. 5).
In the Deep Gorm-1 well, the sequence is represented by less than
10 m of clay-rich mudstone; in Edna-1, the sequence attains a thick-
ness of 62 m.
The common occurrence (in sidewall cores) of Chasmasporites
sp. pollen in Edna-1 and the absence of a Spheripollenites sp. acme
and of other Toarcian bioevents (such as the FAD of the spore gen-
era Leptolepidites, Ischyosporites, Manumia or Staplinisporites), indi-
cate a Pliensbachian age for this sequence.
Basin evolution
The Early Jurassic was a tectonically quiescent periodbetween phases of active rifting in the Triassic and inthe Middle–Late Jurassic (Cartwright 1991; Nøttvedt et al.1995). A eustatic rise in sea level during the Early Jurassicwas proposed by Hallam (1981) and Haq et al. (1988),compatible with observations from the Danish Basin(Michelsen 1978, 1989; Pedersen 1986; Dybkjær 1988,1991). Uniform lithologies, dominated by shelf mud-stones, indicate that marine conditions existed acrossa major North Sea basin and extended into the DanishBasin (Michelsen 1978, 1982, 1989; Michelsen et al.1987; Pedersen 1985; Nielsen 2003, this volume).
The Lower Jurassic marine mudstones within thestudy area have only been found in the Salt DomeProvince. They were probably deposited over a widerarea, but were removed by erosion during the regionaluplift phase (phase 2) at the Early–Middle Jurassic tran-sition (Andersen et al. 1982; Gowers & Sæbøe 1985;Underhill & Partington 1993). The extent of Lower
273

274
Kim
m-1
Ox-
2 *
* M
iddl
e Ju
rass
ic, u
ndiff
eren
tiate
d
Plie
ns-2
Plie
ns-1
Sin-
1
Het
t-2
Het
t-2
Het
t-1
Cal
-1
Ox-
1
Sin-
1
Baj-1
–Ba
t-1
Cal
-1 –
?Kim
m-1
GR
Soni
c
4164
m
Res
GR
Soni
c
3935
m
Res
GR
Soni
c
3430
m
Res
GR
Soni
c
2314
m
Res
GR
Soni
c
3155
m
Edna
-1D
eep
Gor
m-1
U-1
John
Fla
nk-1
O-1
Res
20 k
m
O-1
John
Fla
nk-1D
eep
Gor
m-1
U-1
Edna
-1
Mar
ine
mud
ston
e
Mar
ine
silts
tone
Mar
ine
and
para
licsa
ndst
one
Fluv
ial s
ands
tone
Floo
dpla
in m
udst
one
and
silts
tone
100
mMax
imum
floo
ding
sur
face
Sequ
ence
bou
ndar
y

Jurassic deposits in the deepest parts of the Tail EndGraben and the Søgne Basin is unknown due to thelack of wells penetrating the base of the Middle Jurassicin these areas.
Five transgressive–regressive cycles, correspondingto the Hett-1 – Pliens-2 sequences are identified in theLower Jurassic succession (e.g. Deep Gorm-1, Edna-1;Fig. 4). Individual sequences show a remarkable lateralconsistency in thickness (Fig. 4), indicating a uniformsubsidence history in the study area during most of theEarly Jurassic.
Phase 2. Uplift and erosion in the proto-riftphase (latest Pliensbachian – latest Aalenian)
Basin evolution
A major unconformity separates Lower Jurassic depositsfrom the overlying Middle and Upper Jurassic depositsover much of the North Sea area. It has been suggestedthat this unconformity was caused by domal uplift inthe Toarcian to Aalenian, centred at the triple junctionbetween the Viking Graben, the Moray Firth Basin andthe Central Graben (Whiteman et al. 1975; Hallam &Sellwood 1976; Eynon 1981; Ziegler 1982; Underhill &Partington 1993). The unconformity may therefore bean example of a proto-rift unconformity, described byNøttvedt et al. (1995) as being typical of rift systems withthermally-induced domal uplift before or at the onsetof active stretching.
As a result of the regional uplift, most of the LowerJurassic deposits were removed. In the southern part ofthe Danish Central Graben, where Lower Jurassic depositsare preserved, differential erosion of the upper part ofthe succession may be due to local salt tectonics. Regionalerosion caused a larger part of the succession to beremoved over the top of the salt structures. The full LowerJurassic succession shows thickness variations from about60 m in U-1 to about 260 m in Edna-1 (Fig. 4).
Reworked Lower Jurassic palynomorphs recordedfrom the Upper Kimmeridgian sandstones of the Heno
275
Facing page:Fig. 4. Sequence stratigraphic correlation of the Lower, Middleand lowermost Upper Jurassic in the Salt Dome Province. TheLower Jurassic succession is truncated by an unconformity atthe base of the Middle Jurassic. The depth given beneath eachwell in this and subsequent correlation panels indicates thedepth of the lowermost tieline (typically base-Jurassic section)below well reference level; for those few wells that did notpenetrate the Jurassic section, the depth indicates the base ofthe logged section (i.e. well total depth). The log suite utilisedin the study and illustrated in this and subsequent figuresincludes gamma-ray (GR), sonic velocity (Sonic) and resistiv-ity (Res) logs.
50 m
GR Sonic Res
Pliens-2
Pliens-1
Sin-1
Hett-2
3864 m b. msl.
Fjer
rits
lev
FmD
udge
onSa
lifer
ous
Fm
Low
er Ju
rass
icT
rias
sic
Het
tan-
gian
Sine
-m
ur.
Plie
nsba
chia
n
M. Jur.
SequencesLitho-strati-graphy
Chrono-strati-graphy
Litho-strati-graphy
Chrono-strati-graphy
Edna-1
GR Sonic Res
Cal-1
Pliens-1
Sin-1
Hett-2
3698 m b. msl.
Fjer
rits
lev
Fm
Low
er Ju
rass
ic
Het
tang
ian
Sine
-m
ur.
Plie
ns-
bach
ian
Sequences
Deep Gorm-1
Hett-1
M.
Jur.
Cal
lo-
vian
M. G
rabe
nFm
BryneFm
Pliens-2
Maximum flooding surfaceSequence boundary
Fig. 5. Lower Jurassic sequences (Hett-1 – Pliens-1) in the Deep Gorm-1 and Edna-1 wells. For reference purposes, the depth (inmetres below mean sea level) is indicated for a selected sequence boundary, typically in the upper levels of the illustrated section(see also Figs 6, 10, 12, 19, 22). Jur., Jurassic; M., Middle; Sinemur., Sinemurian.

Formation in the northern part of the Danish CentralGraben (Gwen-2; Johannessen et al. 1996) supports theassumption that Lower Jurassic deposits were signifi-cantly more extensive prior to mid-Jurassic erosion.
Phase 3. Terrestrial and marginal marinedeposition during the rift initiation stage(latest Aalenian/earliest Bajocian – LateCallovian)
Sequence definitions
Aalen-1 sequence
This sequence is encountered in most wells drilled in the Søgne
Basin and in the Nora-1 well in the Tail End Graben (Figs 6, 7). It
lies unconformably on either pre-Jurassic or Lower Jurassic deposits.
The TST dominates the sequence and consists of a number of minor,
backstepping, fining-upwards sandstone intervals, interpreted as
stacked fluvial channels, with subordinate floodplain or lacustrine mud-
stones. The MFS is a distinct gamma-ray high, situated close to the
strongly erosional upper sequence boundary. The thickness of the
sequence attains a maximum of 69 m in West Lulu-1 (Fig. 6).
No stratigraphically useful bioevents were recorded from this
sequence, but the lack of Toarcian bioevents (as discussed above with
respect to the Pliens-1 and Pliens-2 sequences) and the LOD of
Kekryphalospora distincta in the sequence above, may be seen as
indirect evidence of an Aalenian or earliest Bajocian age.
Baj-1 sequence
The Baj-1 sequence extends throughout the Søgne Basin and the Tail
End Graben (Nora-1), and further south to the northern and eastern
parts of the Salt Dome Province (e.g. Alma-1, O-1). It may also be
present in structurally deep locations elsewhere in the Salt Dome
Province. The lower sequence boundary is a pronounced erosional
surface (Figs 4, 6, 7). The lower part of the sequence typically con-
sists of two laterally extensive channel sandstones separated by a fin-
ing-upwards/coarsening-upwards fine-grained interval (e.g. Amalie-1;
Fig. 6). The channel sandstone interval may be interpreted as a low-
stand systems tract (LST). Overlying this interval is a fining-upwards
TST (Amalie-1, West Lulu-1; Fig. 7). The HST consists of floodplain
sandstones and mudstones. The thickness of the sequence attains a
maximum of 99 m in Amalie-1.
The LOD of Kekryphalospora distincta in the upper part of this
sequence in the Alma-1 well indicates an Aalenian or earliest Bajocian
age for the sequence (Fig. 3B).
Bat-1 sequence
This sequence is present in all wells that encountered Middle Jurassic
deposits in the Søgne Basin, the Tail End Graben, the Salt Dome
Province and the southernmost Heno Plateau (Figs 6, 7). In most wells,
the lower sequence boundary is located at the base of a fining-
upwards channel sandstone (e.g. West Lulu-1; Fig. 6). The MFS is
located in a mudstone interval, several metres thick. The HST is rarely
present due to erosion; where present (e.g. West Lulu-1; Fig. 6), it
consists of a coarsening-upwards interval of interbedded mudstones
and sandstones. The thickness of the sequence attains a maximum
of 64 m in West Lulu-1.
The occurrence (in a core sample) of Adnatosphaeridium caulleryi
in the lower part of this sequence in West Lulu-1 indicates an age no
older than Bathonian (Fig. 3B). In combination with the occurrence
of Impletosphaeridium varispinosum immediately above the upper
boundary of the sequence in West Lulu-3, this indicates a possible
age range for this sequence of latest Bajocian – earliest Callovian.
Cal-1 sequence
This sequence is present in areas where the Bat-1 sequence is also
found (Fig. 8A). In most wells, the lower sequence boundary is a
very distinct erosional surface (see Amalie-1; Fig. 6), which locally
shows truncation of at least 10–20 m (e.g. West Lulu-3; Fig. 7). The
sequence boundary is overlain by a section of fluvial to estuarine chan-
nel sandstones up to 30 m thick (e.g. Amalie-1), which is interpreted
as the fill of an incised valley. This interval probably represents the
LST and the lowermost part of the TST. In the Søgne Basin and the
Tail End Graben, the remainder of the TST consists of a succession
of sandstone-dominated, paralic to shallow marine deposits, over-
lain by fully marine mudstones (Fig. 7). The paralic deposits include
a number of coal beds, up to 3 m thick. The HST consists of a rather
indistinct coarsening-upwards interval of marine mudstones. The
sequence has a depocentre in the northern part of the Tail End
Graben (Fig. 8A). In the Nora-1 well, where the sequence includes
a section that contains tuffaceous sediments (4986–4932 m), it attains
a thickness of 288 m. In other wells, the sequence does not exceed
100 m in thickness.
The LOD of Impletospaeridium varispinosum in the lower part
of this sequence in West Lulu-3 combined with the LOD of
Ctenidodinium continuum in the sequence above (Ox-1) in U-1 and
West Lulu-1 indicate an Early Callovian to earliest Oxfordian age for
this sequence. The occurrence of Wanaea acollaris and W. thysan-
ota in the middle part of the sequence in the John Flank-1 and West
Lulu-1 wells supports this age assignment (Fig. 3A).
Basin evolution
Deposition resumed in the Danish Central Graben withthe accumulation of uppermost Aalenian or lowermostBajocian terrestrial sediments after the regional upliftand possible incipient collapse of the domal structure.Subsequent Middle Jurassic deposits rest unconformablyon pre-Jurassic and Lower Jurassic sediments (Fig. 4).
276

The initiation of syn-rift subsidence is demonstratedby an asymmetric distribution of the sediment packagein the Søgne Basin as shown by seismic evidence (Møller1986, fig. 5; Cartwright 1987; Korstgaard et al. 1993,figs 39, 40) and well log data (Andsbjerg 2003, this vol-ume). Salt tectonics also influenced sediment distribu-tion and the location of local depocentres in the SøgneBasin, the Tail End Graben and the Salt Dome Province(Mogensen et al. 1992; Korstgaard et al. 1993).
Middle Jurassic deposits are preserved in the SøgneBasin, the Tail End Graben and the Salt Dome Provincewith a depocentre located to the east near the CoffeeSoil Fault (Figs 4, 7). Sandstones and mudstones ofsequences Aalen-1 – Bat-1 were deposited in a fluviallydominated environment during the early part of theMiddle Jurassic (latest Aalenian/earliest Bajocian – LateBathonian; Fig. 9A). Deeper parts of the basins wereperiodically inundated by lakes. Lacustrine conditionsin the central parts of the basins were coeval with wetfloodplain conditions in marginal locations.
The occurrence locally of rare marine palynomorphsand tidal indicators such as flaser bedding and doublemud-drapes suggest that deposition took place in a coastalplain setting. However, during this period, fully marineconditions are only reported from the Dutch part of the
Central Graben (van Adrichem Boogaert & Kouwe 1993).A coastline must therefore have been located in thesouthern part of the Danish sector or in the German sec-tor of the Central Graben. The regional transport direc-tion in the Danish Central Graben was probably towardsthe coastline in the south, parallel to the basin axis.
Within the Middle Jurassic succession, several levelsof well-developed, erosionally-based channels, pro-grading deltas and splays, and lacustrine and floodplainmudstone units form correlatable units over a wide area,comprising the Søgne Basin and the Tail End Graben.This suggests a common, external control on base level,such as rift tectonics, eustatic sea-level change, climatechange or a combination of these factors.
In the Søgne Basin, the northern Tail End Graben andpossibly in the Salt Dome Province, the deposits of theAalen-1 – Bat-1 sequences are cut by a significant ero-sion surface, the basal sequence boundary of Cal-1(Fig. 7). The development of this surface was causedby a major fall in relative sea level. At the time of for-mation of this surface, the regional slope had changedfrom a southwards to a northwards dip (Andsbjerg 2003,this volume). The erosional surface, which is commonlydeveloped at the base of extensive fluvial or estuarinechannel sandstones, is suggested to be the bounding
277
SequencesLitho-strati-graphy
Chrono-strati-graphy
Litho-strati-graphy
Chrono-strati-graphy
SequencesGR Sonic Res
Kimm-2
Kimm-1
Baj-1
Aalen-1
4874 m b. msl.
Lola
For
mat
ion
Bryn
e Fo
rmat
ion
Lulu
Fm
Mid
dle
Jura
ssic
Amalie-1
Cal-1
Upp
er Ju
rass
ic
uppe
rmos
tA
alen
ian
Bajo
cian
Bath
onia
nC
allo
vian
Upp
erK
imm
erid
gian
Oxf
. –L.
Kim
m.
GR Sonic Res
Cal-1
Bat-1
Baj-1
3488 m b. msl.
Lola
FmLu
luFm
Mid
dle
Jura
ssic
uppe
rmos
tA
alen
ian
Bajo
cian
West Lulu-1
Aalen-1
U.
Jur.
Tri
assi
cU
.K
imm
.Ba
th.
Cal
lovi
an –
L. K
imm
.
Bryn
e Fo
rmat
ion
Bact
onG
p
Bat-1
Oxf-1
Ox-1 – Kimm-1
50 m
Maximum flooding surfaceFlooding surfaceSequence boundary
Fig. 6. Middle–Late Jurassic sequences in the Amalie-1 and West Lulu-1 wells illustrating, in particular, the characteristics of the MiddleJurassic (Aalen-1 – Cal-1) sequences. Bath., Bathonian; Jur., Jurassic; Kimm., Kimmeridgian; L., Lower; Oxf., Oxfordian; U., Upper.

278
Kim
m-1
Ox-
2
Ox-
1
Cal
-1
Bat-
1
Baj-1
Aal
en-1
Cal
-1 –
Kim
m-1
Baj-1
Aal
en-1
20 k
m
Am
alie
-1
W.L
ulu-
3Lu
lu-1
1
Nor
a-1
Mar
ine
mud
ston
e
Mar
ine
silts
tone
Mar
ine
and
para
licsa
ndst
one
Fluv
ial s
ands
tone
Floo
dpla
in m
udst
one
and
silts
tone
Max
imum
floo
ding
sur
face
Sequ
ence
bou
ndar
y
GR
Soni
c
3831
m
Res
W. L
ulu-
3
GR
Soni
c
3841
m
Res
W. L
ulu-
1
GR
Soni
c
3699
m
Res
Lulu
-1
GR
Soni
c
5343
m
Res
Am
alie
-1
GR
Soni
c
5338
m
Res
Nor
a-1
100
m
Fig.
7. Se
quen
ce s
trat
igra
phic
corr
elat
ion o
f th
e M
iddle
and low
erm
ost
Upper
Jura
ssic
in the
Søgn
e Bas
in a
nd the
norther
n T
ail End G
raben
. An u
nco
nfo
rmity
at th
e bas
e of
the
Cal
-1 s
equen
ce tru
nca
tes
under
lyin
g se
quen
ces.

surface of an incised valley (Andsbjerg 2003, this vol-ume). The valley-fill is dated to the latest Late Bathonian– Early Callovian. In the Søgne Basin, the channel sandswere initially deposited in straight or sinuous rivers,which show an increase in tidal influence with time. Inthe Salt Dome Province, channel sandstones are eitherstacked or isolated and may show fining-upwards trendstypical of sinuous channel fills or blocky gamma-raymotifs, indicating deposition in a straight or braidedriver (e.g. John Flank-1, U-1; Fig. 4; Koch 1983). The
incised valley-fill of the Søgne Basin is capped by a coalbed up to 3 m thick.
Later in the Callovian, a low-energy coastal plain ordelta plain characterised by small distributary channels,lagoons and coal swamps, was established in the south-ern part of the study area (Koch 1983). Contempora-neously, a barrier coast separated tidal lagoons at themargins of the Søgne Basin and the northern Tail EndGraben from a wave-dominated marine bay in the cen-tral and eastern parts of these basins (Fig. 9B).
279
■■
■■
■■
■■
■■
■■
■■
■■
■■
■■
■■
■■
■■
■■
■■
■■
■■
■■
■■
■■
■■
■■
■■
■■
■■
■■
■■
■■
■■
■■
■■
■■
■■
■■
■■
■■
■■
■■
■■
■■
■■
■■
■■
■■
■■
■■
■■
■■
■■
■■
■■
■■
■■
■■
■■
■■
■■
■■
■■
■■
■■
■■
■■
■■
■■
■■
■■
■■
■■
■■
■■
■■
■■
■■
■■
■■
■■
■■
■■
■■
■■
■■
■■
■■
■■
■■
■■300–400 m200–300 m100–200 m50–100 m0–50 mSequence absent
Fault
Well
■■
■■
■■
■■
■■
■■
■■
■■
■■
■■
■■
■■
■■
■■
■■
■■
■■
■■
■■
■■
■■
■■
■■
■■
■■
■■
■■
■■
■■
■■
■■
■■
■■
■■
■■
■■
■■
■■
■■
■■
■■
■■■■
A Cal-1 Ox-1
C Ox-2
B
20 km 20 km
20 km
Fig. 8. Isochore maps of the Cal-1 (A), Ox-1 (B) and Ox-2 (C)sequences. The distribution of the Cal-1 and Ox-1 sequencesillustrates a pronounced depocentre in the northern Tail EndGraben, continuing south into the Rosa Basin. A seconddepocentre is present in the southern Tail End Graben –eastern Salt Dome Province. The three maps chart a progres-sive transgression in the area of the Ravn and Elly wells (Fig. 1), in the south-eastern part of the Heno Plateau.

Phase 4. Rift pulse related transgression (Early Oxfordian – Early Kimmeridgian)
Sequence definitions
Ox-1 sequence
This sequence is restricted to the Tail End Graben, the deeper parts
of the Søgne Basin, the Salt Dome Province and the flanks of the
Heno Plateau (Fig. 8B). The lower boundary of the sequence is
located at the top of a well-developed coarsening-upwards interval
(e.g. Deep Gorm-1; Nora-1; Fig. 10). At the western margin of the
basin, a sandy LST up to 12 m thick may be present, erosionally over-
lying pre-Jurassic deposits (e.g. Elly-2; Fig. 10). In most wells, the
sequence consists of marine mudstones; only in Elly-2 are sandstones
a major component of the sequence. The thickness of the sequence
attains a maximum of 189 m in Nora-1. A significant depocentre
occurs in the northern part of the Tail End Graben (Fig. 8B).
The LOD of Ctenidodinium continuum in the middle part of the
sequence in U-1 indicates an Early Oxfordian age for at least the lower
part of the sequence. Combined with the LOD of Rigeaudella aemula
close to the upper boundary in the Falk-1 well, this indicates an
Early–Middle Oxfordian age for the sequence (Fig. 3C).
280
56°
30’
4° 00’
■■
■■
■■
■■
■■
■■
■■
■■
■■
■■
■■
■■
■■
■■
■■
■■
■■
■■
■■
■■
■■
■■
■■
■■
■■
■■
■■
■■
■■
■■
■■
■■
■■
■■
■■
■■
■■
■■
■■
■■
■■
■■
■■
56°
00’
4° 00’
■■
■■
■■
■■
■■
■■
■■
■■
■■
■■
■■
■■
■■
■■
■■
■■
■■
■■
■■
■■
■■
■■
■■
■■
■■
■■
■■
■■
■■
■■
■■
■■
■■
■■
■■
■■
■■
■■
■■
■■
■■
■■
■■
■■
Shelf
Shoreface/shore
Lagoon and barrier
Bayhead delta
Floodplain with river
Lake
No deposition/no preservation
Fault
Well
■■
■■
■■
■■
■■
■■
■■
■■
■■
■■
■■
■■
■■
■■
■■
■■
■■
■■
■■
■■
■■
■■
■■
■■
■■
■■
■■
■■
■■
■■
■■
■■
■■
■■
■■
■■
■■
■■
■■
■■
■■
■■
■■
A Aalenian –Bathonian/earliest Callovian
Early–MiddleCallovian
B
C Late Callovian –earliest Oxfordian
20 km
20 km
20 km
Fig. 9. Palaeogeographic maps for the Middle – earliest LateJurassic. The maps illustrate the gradual transition from aterrestrially-dominated environment (A) through a tidally-influenced coastal plain (B), to a fully marine environment (C).Deposits of the lowermost part of the Middle Jurassic succes-sion may have been present in the western part of the DanishCentral Graben, and removed by erosion during hanging-walluplift in association with early half-graben subsidence. Due tolack of data, the distribution of Middle Jurassic deposits in theFeda Graben is uncertain.

Ox-2 sequence
The distribution of this sequence corresponds to that of Ox-1 (Fig.
8C). The lower sequence boundary is normally located at the top of
a coarsening-upwards interval (e.g. Nora-1; Fig. 10). In a few wells
situated at the western margin of the basin, the lower sequence
boundary may be located at the sharp base of an up to 10 m thick
sandstone unit referred to the LST (e.g. Elly-2). With the exception
of these sandstones at the basin margin, the sequence consists of marine
mudstones. The thickness of the sequence attains a maximum of
117 m in Nora-1. A depocentre for this sequence extends from the
northern Tail End Graben to the Rosa Basin (Fig. 8C).
The LOD of Rigeaudella aemula immediately below the lower
sequence boundary in Falk-1 combined with the LOD of Com-
positosphaeridium polonicum close to the upper boundary of this
sequence in U-1 indicates an earliest Late Oxfordian age for this
sequence (Fig. 3C).
Kimm-1 sequence
The sequence is missing from the north-western part of the study area
(Fig. 11A). The lower boundary of the sequence is normally located
at the top of a coarsening-upwards interval (e.g. Nora-1; Fig. 10). In
the Heno Plateau area, the MFS is normally situated immediately
above a marked gamma/sonic spike (e.g. Elly-2, Ravn-1; Figs 10, 12).
281
3373 m b. msl.
Cal-1
Pliens-2
Ox -1
Ox-2
Kimm-1
Kimm-2
4226 m b. msl.
Kimm-2
Ox-2
Ox-1
Kimm-1
Cal-1
Upp
er Ju
rass
icTri
as-
sic
*
* Middle OxfordianBryne Fm
*
* Middle Oxfordian
Deep Gorm-1 Elly-2
GR ResSequencesLitho-strati-graphy
Chrono-strati-graphy
GR Sonic ResSequencesLitho-strati-graphy
Chrono-strati-graphy
GR Sonic ResSequencesLitho-strati-graphy
Chrono-strati-graphy
Ox-1
3825 m b. msl.
Kimm-1
Ox-2
Kimm-2
Lola
For
mat
ion
M. G
rab.
FmFa
rsun
dFm
Fjer
rits
lev
Fm
Cal
lo-
vian
L. Oxf
.U
pper
Oxf
ordi
anU
. Oxf
ord.
–L.
Kim
m.
Upp
erK
imm
.Pl
iens
-ba
chia
n
Upp
er Ju
rass
icM
iddl
eJu
rass
icLo
wer
Jura
ssic
Lola
Fm
Hen
oFm
Low
erO
xf.
U. O
xf.–
L. K
im.
Upp
erO
xf.
Upp
erK
imm
.
Fars
und
Fm
Upp
er Ju
rass
ic Upp
er O
xfor
dian
–Lo
wer
Kim
mer
idgi
anLo
wer
Oxf
ordi
an
Lola
For
mat
ion
Cal
lovi
an
Mid
dle
Jura
ssic
M. G
rabe
nFm
Upp
erO
xfor
dian
Upp
erK
imm
erid
gian
Mid
dle
Oxf
ordi
an
Nora-1
Sonic
Maximum flooding surfaceFlooding surfaceSequence boundary
50 m
Fig. 10. Sequence stratigraphic breakdown of thelower Upper Jurassic in the Deep Gorm-1, Elly-1and Nora-1 wells illustrating the features of thesequences Ox-1 – Kimm-1. Kim./Kimm.,Kimmeridgian; L., Lower; M. Grab., MiddleGraben; Oxf./Oxford., Oxfordian; U., Upper.

The sequence consists of marine mudstone. The maximum measured
thickness is 250 m (Nora-1). The sequence has a well-defined depocen-
tre in the central part of the Tail End Graben (Fig. 11A).
The LOD of Compositumsphaeridium polonicum immediately
below the lower boundary of this sequence in U-1 and the LOD of
Scriniodinium crystallinum and of Nannoceratopsis pellucida close
to the upper boundary in a number of wells (e.g. Amalie-1, Anne-3,
Emma-1, John Flank-1, M-8, U-1, West Lulu-2) indicate a Late Oxfordian
– Early Kimmeridgian age for this sequence (Fig. 3C).
Basin evolution
In the Tail End Graben, subsidence along the Coffee SoilFault accelerated in the Early Oxfordian resulting in ahighly asymmetric distribution of the Oxfordian – LowerKimmeridgian sediment package and in very large thick-nesses of sediments in the central and eastern parts ofthe Tail End Graben (Figs 8A, 13; Fig. 13 faces page 294).This suggests that the Tail End Graben had entered therift climax stage. During this phase, fault-controlled sub-
282
A Kimm-1 Kimm-2
C Kimm-3
B
■■
■■
■■
■■
■■
■■
■■
■■
■■
■■
■■
■■
■■
■■
■■
■■
■■
■■
■■
■■
■■
■■
■■
■■
■■
■■
■■
■■
■■
■■
■■
■■
■■
■■
■■
■■
■■
■■
■■
■■
■■
■■
■■
■■
■■
■■
■■
■■
■■
■■
■■
■■
■■
■■
■■
■■
■■
■■
■■
■■
■■
■■
■■
■■
■■
■■
■■
■■
■■
■■
■■
■■
■■
■■
■■
■■
■■
■■
■■
■■
■■
■■
■■
■■
■■
■■
■■300–400 m200–300 m100–200 m50–100 m0–50 mSequence absent
Fault
Well
■■
■■
■■
■■
■■
■■
■■
■■
■■
■■
■■
■■
■■
■■
■■
■■
■■
■■
■■
■■
■■
■■
■■
■■
■■
■■
■■
■■
■■
■■
■■
■■
■■
■■
■■
■■
■■
■■
■■
■■
■■
■■
■■
■■
■■
■■
■■
■■
■■
■■
■■
■■
■■
■■
■■
■■
■■
■■
20 km
20 km
20 km
Fig. 11. Isochore maps of the Kimm-1 (A), Kimm-2 (B) andKimm-3 (C) sequences. Comparison of A and B illustrates theprogressive transgression of the northern Heno Plateau, theGertrud Plateau and the Feda Graben area from the LateOxfordian – earliest Late Kimmeridgian. Subsidence of thesouthern Feda Graben began during the latest Early – earliestLate Kimmeridgian. Note the relatively uniform distribution ofsediments within the northern part of the Tail End Graben.During deposition of sequence Kimm-3 (Late Kimmeridgian), acentral depocentre developed throughout the length of theTail End Graben and the Salt Dome Province, striking roughlyNW–SE.

sidence in the Danish Central Graben mainly occurredalong N–S-trending faults (Møller & Rasmussen 2003,this volume).
The Lower Oxfordian – Lower Kimmeridgian suc-cession is characterised by an overall transgressivedevelopment during which the depositional environmentshifted from paralic to fully marine. The marked trans-gression reflects the interaction of the increased subsi-dence rate (see above) and a eustatic rise in sea levelthat has been documented from the North Sea rift sys-tem and elsewhere (Hallam 1978, 1988; Haq et al. 1988;Surlyk 1990).
Fully marine conditions were established in the SøgneBasin in latest Callovian – earliest Oxfordian times(Cal-1, TST) with the introduction of the shelf mud-stones of the Lola Formation. A coastal plain environ-ment probably still dominated parts of the Salt DomeProvince to the south, indicating that theCallovian–Oxfordian transgression entered the DanishCentral Graben from the north (Figs 9B, C).
During the Early Oxfordian, the Tail End Graben,the south-eastern marginal parts of the Heno Plateau,
283
4029 m b. msl.
Fars
und
Form
atio
n
Kimm-2
Upp
er Ju
rass
ic
Upp
er K
imm
erid
gian
Kimm-1
Ox-2
Upp
er O
xfor
dian
–Lo
wer
Kim
mer
idgi
an
Kimm-3
Lola
For
mat
ion
Upp
er O
xfor
dian
5389 m b. msl.
Upp
er Ju
rass
ic
Fars
und
Form
atio
n
Kimm-3
Kimm-2
Upp
er K
imm
erid
gian
Hen
oFm
Perm
ian
Zec
hste
in G
roup
Hen
oFm
Ox-2
4026 m b. msl.
Upp
er Ju
rass
ic
Upp
erO
xf.
Kimm-2
Kimm-1
U. O
xf. –
L. K
imm
.U
pper
Kim
mer
idgi
anH
eno
FmLo
laFm
Fars
und
Fm
Kimm-3
Kimm-4
Lola
Fm
Kimm-4
Kimm-4
Nora-1GR Sonic ResSequences
Litho-strati-graphy
Chrono-strati-graphy
Gert-4GR Sonic ResSequences
Litho-strati-graphy
Chrono-strati-graphy
Ravn-1GR Sonic ResSequences
Litho-strati-graphy
Chrono-strati-graphy
50 m
Maximum flooding surfaceFlooding surfaceSequence boundary
Fig. 12. Upper Jurassic stratigraphy of the Gert-4, Nora-1 andRavn-1 wells illustrating, in particular, the characteristics of theKimm-2 and Kimm-3 sequences. Kimm., Kimmeridgian; L.,Lower; Oxf., Oxfordian; U., Upper.

the Salt Dome Province, and the Rosa Basin were alsotransgressed (Ox-1, Ox-2; Figs 8B, C, 9C, 13). Theremainder of the Heno Plateau and possibly areas fur-ther west were slowly submerged during the LateOxfordian – Early Kimmeridgian (Kimm-1; Figs 11A,14; Fig. 14 follows page 294). Marginal marine sand-stones were deposited locally on the southern part ofthe Heno Plateau during this transgression (e.g. Elly-2;Fig. 14) but marine mudstones of the Lola Formation
were deposited over most of the basin. A number ofminor transgressive–regressive cycles can be discernedwithin the overall transgressive succession of marinemudstones (e.g. Nora-1; Fig. 13). The main basinal partof the study area was thus characterised by an offshoreenvironment during this period. An inner shelf toshoreface environment developed, however, on theGertrud Plateau and the northern part of the HenoPlateau at the end of this depositional phase (Fig. 15B).
284
■■
■■
■■
■■
■■
■■
■■
■■
■■
■■
■■
■■
■■
■■
■■
■■
■■
■■
■■
■■
■■
■■
■■
■■
■■
■■
■■
■■
■■
■■
■■
■■
■■
■■
■■
■■
■■
■■
■■
■■
■■
■■
■■
■■
■■
■■
■■
■■
■■
■■
■■
■■
■■
■■
■■
■■
■■
■■
■■
■■
■■
■■
■■
■■
■■
■■
■■
■■
■■
■■
■■
■■
■■
■■
■■
■■
■■
■■
■■
■■
■■
■■
■■
■■
■■
■■
■■Shelf
Shoreface
Barrier and strandplain
Lagoon
No deposition/preservation
Fault
Well
■■
■■
■■
■■
■■
■■
■■
■■
■■
■■
■■
■■
■■
■■
■■
■■
■■
■■
■■
■■
■■
■■
■■
■■
■■
■■
■■
■■
■■
■■
■■
■■
■■
■■
■■
■■
■■
■■
■■
■■
■■
■■
■■
A Late Oxfordian –Early Kimmeridgian
Latest Early –earliest LateKimmeridgian
C Late Kimmeridgian
B
20 km
20 km
20 km
Fig. 15. Palaeogeographic maps for the Late Oxfordian – LateKimmeridgian (Late Jurassic). During the Late Oxfordian –Early Kimmeridgian (A), transgression continued across thenorthern Heno Plateau, the Gertrud Plateau and the FedaGraben areas (see also Fig. 9C). After a major regression (baseKimm-2 SB), marginal and shallow marine conditions domi-nated the plateau areas (B). Subsequently, renewed transgres-sion resulted in a westwards shift of the coastline and extensionto the west of paralic and marginal marine conditions (C).

Phase 5. Shallow marine deposits and changingstructural patterns (Late Kimmeridgian)
Sequence definitions
Kimm-2 sequence
This sequence is found throughout the study area east of the
Mads and Inge Highs (Fig. 11B). The lower boundary has been
placed at a conspicuous surface that, even in the deeper parts of
the basin, shows an abrupt shift from high to low gamma-ray val-
ues, probably indicating an erosion surface (Figs 10, 12). In parts
of the study area, such as the Feda Graben, the northern part of
the Gertrud Plateau and the northern part of the Heno Plateau,
this surface coincides with the unconformity that separates the pre-
Jurassic and the Upper Jurassic deposits (e.g. Gert-4; Fig. 12).
On the Heno Plateau, the LST is thought to be represented
by a unit of conglomerates and coarse-grained sandstones less
than 5 m thick (e.g. Ravn-1; Fig. 12) although it should be noted
that Johannessen (2003, this volume) refers this interval to the
lowermost TST. In more distal settings, the LST is represented by
a 10–15 m thick sandstone or sandy siltstone unit (e.g. Elly-2;
Fig. 10). In the proximal settings of the Heno and Gertrud Plateaus
and the southern Feda Graben, the TST consists of paralic and
shallow marine sandstones and mudstones. In basinal settings (e.g.
Nora-1), the TST is represented by a well-defined fining-upwards
interval (Fig. 12). This interval consists of silty claystone, silt-
stone or silty sandstone, becoming coarser grained towards the
Heno Plateau. In the central part of the Heno Plateau (e.g.
Ravn-1), most of the HST was removed by erosion during the
subsequent lowstand. On the northern Heno Plateau, the Gertrud
Plateau and in the southern Feda Graben, the HST consists of a
section that coarsens upwards from sandy siltstones to gravelly
sandstones of shoreface origin (Johannessen et al. 1996; Johannes-
sen 2003, this volume). In basinal settings, the HST consists of a
coarsening-upwards interval of marine mudstones, siltstones and
sandstones. The thickness of the sequence attains a maximum
of 319 m in Cleo-1. Major depocentres for this sequence are
located in the southern Tail End Graben – eastern Salt Dome
Province, in the northern Tail End Graben – Søgne Basin and in
the Feda Graben (Fig. 11B).
A latest Early Kimmeridgian to earliest Late Kimmeridgian age
is indicated by the LOD of Endoscrinium galeritum in the lower
part of the sequence in Edna-1 and West Lulu-1 and the FAD of
Subtilisphaera? paeminosa and S.? inaffecta in the lower part of
the sequence in Gert-1 combined with the LOD in the sequence
above of Stephanelytron scarburghense in the Gert-2, Jeppe-1 and
Lulu-1 wells (Fig. 3C).
Kimm-3 sequence
The distribution of this sequence corresponds to that of the
Kimm-2 sequence (Fig. 11C). In the central part of the Heno
Plateau (e.g. Ravn-1; Fig. 12), the lower sequence boundary is
represented by an erosion surface overlain by shallow marine
conglomerates or gravelly sandstones. Further north, on the Heno
Plateau and in the Gertrud Plateau – Feda Graben area, the se-
quence boundary is marked by a thin conglomerate in several
wells (Johannessen 2003, this volume). In more basinal areas, south
and east of the Heno Plateau, the lower sequence boundary is
located at the top of a well-defined coarsening-upwards interval
(e.g. Nora-1; Fig. 12). In the Heno Plateau – northernmost Salt
Dome Province area (e.g. Ravn-1), the TST is developed as a back-
stepping set of parasequences that consist of marine silty sand-
stones, siltstones and claystones. In the Feda Graben – Gertrud
Plateau area, the TST consists of shallow marine sandstones and
siltstones that grade upwards to marine mudstones (e.g. Gert-4;
Fig. 12). In some wells (e.g. Jeppe-1; Fig. 14), an abrupt change
from marine sandstones to mudstones, interpreted as a flooding
surface, replaces part of the coarsening-upwards section. In the
Tail End Graben (e.g. Nora-1), the TST is represented by a thin
fining-upwards interval of marine mudstones. The HST typically
consists of marine mudstones. In the Feda Graben – Gertrud
Plateau area and in the Søgne Basin, the HST terminates in a dis-
tinct coarsening-upwards interval, which includes silt- and sand-
stones (e.g. Gert-4; Fig. 12). The thickness of the sequence attains
a maximum of 387 m in Cleo-1. Major depocentres are located
in the Søgne Basin, the Feda Graben and the southern Tail End
Graben – Salt Dome Province (Fig. 11C).
The LOD of Stephanelytron scarburghense in the lower to
middle part of this sequence in Gert-2 and Jeppe-1 and the LOD
of Endoscrinium luridum in the succeeding sequence (Kimm-4)
indicate a Late Kimmeridgian age for this sequence (Fig. 3C).
Basin evolution
The basin configuration changed significantly during thelate Early Kimmeridgian – Late Kimmeridgian. Faultactivity and fault-related subsidence waned and at theend of the period a new pattern of dominantly NNW–SSE-trending faults was established (Møller & Rasmussen2003, this volume). This development marked a pausebetween two rift pulses. At this time, the Tail EndGraben, including the Søgne Basin and most of theHeno Plateau, formed one major half-graben with aneastwards-dipping hanging-wall slope. Accommodationspace had been created in the Feda Graben prior to thisphase. The Feda Graben was separated from the TailEnd Graben by a transfer zone (Fig. 11B).
The lack of rift-related subsidence, probably combinedwith a regional fall in sea level in the beginning of thisphase, caused a significant relative sea-level fall. Thissea-level fall caused the development of a distinctive
285

erosional sequence boundary traceable over most of theDanish Central Graben (Figs 13,14); it can be seen onseismic sections as an onlap surface (Erik S. Rasmussen,personal communication 1997).
The succeeding transgression, caused by eustatic orregional relative sea-level rise, gave rise to a gradualflooding of the Heno Plateau, the southern part of theFeda Graben and the Gertrud Plateau area. Two higher-order sea-level cycles can be recognised during thisoverall transgression; the Kimm-2 sequence records thefirst cycle, the Kimm-3 sequence the second.
While marginal areas were characterised by deposi-tion of sand in shallow marine to paralic environments,low-energy marine conditions prevailed in the deeperparts of the basin during the Kimm-2 cycle (Fig. 15B).Sand was deposited in a high-energy shoreface envi-ronment on the southern part of the Heno Plateau andin a back-barrier environment on the northern part ofthe Heno Plateau and in the area of the Gert Ridge(Johannessen et al. 1996; Johannessen 2003, this volume).The flooding of the Heno Plateau area forced the coast-line back from its position near the eastern margin ofthe plateau at the beginning of the transgression to thewestern margin of the Heno Plateau or possibly furtherwest at the time of maximum flooding. Subsequently,the shallow areas in the western part of the basin wereseparated from the marine basin to the east by a zoneof sand-dominated prograding shoreface. The coastlinewas re-established in a position at the eastern edge ofthe Heno Plateau at the end of this cycle (Fig. 15C).
In latest Early Kimmeridgian time (lower Kimm-2sequence), the relatively limited accommodation spacein the central parts of the Heno Plateau was rapidly filledwith deposits of the LST and TST, before maximum flood-ing was attained (e.g. Ravn-1, Falk-1; Fig. 14). A relativelythick TST was deposited in the Feda Graben due to arapidly subsiding basin floor. After the time of maximumflooding, most remaining available accommodation spaceoccurred in the Tail End Graben and the deeper partsof the Feda Graben where a thick HST was deposited(e.g. G-1, Gert-4; Fig. 14). By the end of the first sea-level cycle (Kimm-2), an area consisting of the southernFeda Graben and the Heno and Gertrud Plateaus wasexposed or dominated by shallow-water conditions.Deep-water conditions only prevailed in the central partsof the Tail End Graben and the Søgne Basin.
The Kimm-3 sequence is characterised by a majordepocentre in the Feda Graben where thick marinedeposits are related to the early onset of the next phaseof subsidence. A central depocentre developed through-
out the length of the Tail End Graben and the Salt DomeProvince, striking roughly NW–SE (Fig. 11C).
Coarse-grained conglomeratic shoreface depositswere deposited immediately above the sequence bound-ary (the base Kimm-3 SB) on the Heno Plateau (Johan-nessen 2003, this volume). These deposits were overlainby backstepping parasequences of shallow marine sandand silt (e.g. Falk-1, Ravn-1; Figs 12, 13).
The beginning of the next phase of subsidence causeda gradual change from coarse- to fine-grained shallowmarine deposits in basinal settings of the Feda Graben.An abrupt shift from shallow marine sandstone to off-shore mudstone can be seen in marginal areas of theFeda Graben and on the Gertrud Plateau (e.g. Gert-2,Gwen-2, Jeppe-1; Fig. 14). When fully marine condi-tions were established in the Feda Graben, a very highrate of subsidence in this area impeded the re-estab-lishment of paralic conditions during the highstand partof the cycle. In the Tail End Graben and Søgne Basin,the Kimm-3 sequence consists of a thin unit of marinemudstones.
At the beginning of Kimm-3 time, accommodationspace on the Heno and Gertrud Plateaus was limitedby an initial sea-level fall and a low rate of subsidence.The limited accommodation space available was mainlyfilled by deposits of the TST (Fig. 14). In the remain-der of the study area, there was sufficient accommo-dation space for the development of the HST (e.g.Cleo-1, G-1; Figs 16, 17, following page 294). On thesouthern part of the Gertrud Plateau and adjoining partsof the Heno Plateau, the remaining accommodationspace was filled with shallow marine HST deposits fol-lowed by exposure and bypass (e.g. Gwen-2; Fig. 14).
Phase 6. Deep-water mudstones in acomposite graben: rift pulses and passivesubsidence (latest Late Kimmeridgian –middle Middle Volgian)
Sequence definitions
Kimm-4 sequence
This sequence has the same areal distribution as the Kimm-2 and
Kimm-3 sequences (Fig. 18A). On the Heno Plateau, the lower
sequence boundary is typically placed where the lithology changes
abruptly from the sandstones and siltstones of the underlying sequences
to fully marine mudstones (e.g. Ravn-1; Fig. 12). In basinal areas, the
lower sequence boundary is located at the top of a coarsening-
upwards interval, which in the Feda Graben (e.g. Gert-4) and in the
Søgne Basin (e.g. Lulu-1; Fig. 17) may be distinct. In the Feda Graben
286

– Gertrud Plateau area, the TST is well-developed (e.g. Gert-2,
Gwen-2; Fig. 19), whereas over much of the Heno Plateau, the Salt
Dome Province and in the Tail End Graben, it often occurs in a con-
densed form (e.g. Nora-1; Fig. 12). In general, the HST is much
thicker than the TST (e.g. Gert-2, Nora-1; Figs 12, 19); both the TST
and HST consist of marine mudstones. The thickness of the sequence
attains a maximum of 318 m in Gert-4. The sequence has an elon-
gated depocentre in the eastern part of the Tail End Graben and a
secondary depocentre in the Feda Graben (Fig. 18A).
A Late Kimmeridgian age is indicated for the sequence based on
the LOD of Stephanelytron scarburghense in the sequence below com-
bined with the LOD of Endoscrinium luridum close to the upper
sequence boundary in Amalie-1 and Cleo-1 (Fig. 3C).
Volg-1 sequence
This sequence has the same areal distribution as the previous sequences
(Fig. 18B). In the Feda Graben – Gertrud Plateau area and on the
Heno Plateau, the lower sequence boundary is located at the top of
a thin but conspicuous coarsening-upwards interval (Fig. 19). In the
more basinal settings of the Tail End Graben, the Søgne Basin, and
the Salt Dome Province, the boundary is situated at the turnaround
point between rather indistinct coarsening-upwards and fining-
287
■■■■
■■
■■■■
■■
■■
■■
■■
■■
■■
■■
■■
■■
■■
■■
■■
■■
■■
■■
■■
■■
■■
■■
■■
■■
■■
■■
■■
■■
■■
■■
■■
■■
■■
■■
■■
■■
■■
■■
■■
■■
■■
■■
■■
■■
■■
■■
■■
■■
■■
■■
■■
■■
■■
■■
■■
■■
■■■■
■■
■■
■■
■■
■■
■■
■■
■■
■■
■■
■■
■■
■■
■■
■■
■■
■■
■■
■■
■■
■■
■■
■■
■■
■■
■■
■■
■■
■■
■■
■■
■■
■■
■■
■■
■■
■■
■■
■■
■■
■■
■■
■■
■■
■■
■■
■■
■■
■■
■■
■■
■■
■■
■■
■■
■■
n■■500–600 m400–500 m300–400 m200–300 m100–200 m50–100 m0–50 mSequence absent
Fault
Well
■■
■■
■■
■■
■■
■■
■■
■■
■■
■■
■■
■■
■■
■■■■
■■
■■
■■
■■
■■
■■
■■
■■
■■
■■
■■
■■
■■
■■
■■
■■
■■
■■
■■
■■
■■
■■
■■
■■
■■
■■
■■
■■
■■
■■
■■
■■
■■
■■
■■
■■
■■
A Kimm-4 Volg-1B
C Volg-2
20 km
20 km
20 km
■■
■■ Fig. 18. Isochore maps of the Kimm-4 (A), Volg-1 (B), andVolg-2 (C) sequences. During the latest Kimmeridgian andearliest Volgian (A, B), an asymmetric basin geometry was re-established with an elongate depocentre near the Coffee SoilFault; a secondary depocentre developed in the eastern SøgneBasin during the earliest Early Volgian. The Outer Rough andÅl Basins were transgressed in the Early Volgian (C).
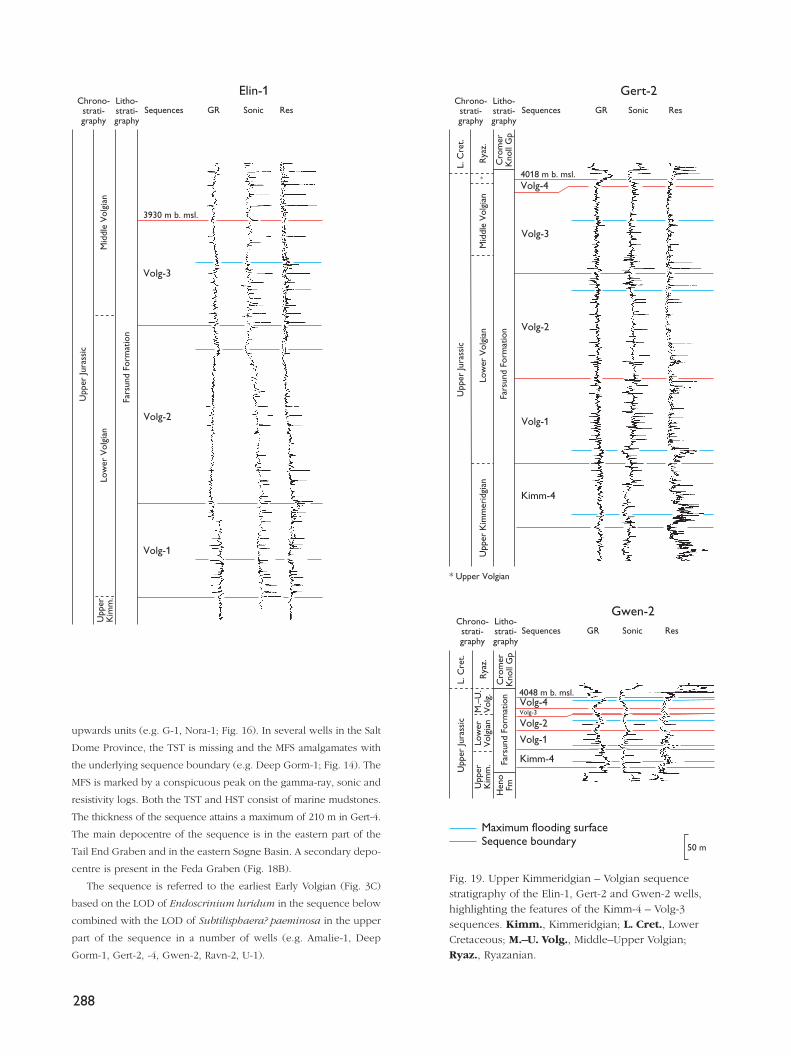
upwards units (e.g. G-1, Nora-1; Fig. 16). In several wells in the Salt
Dome Province, the TST is missing and the MFS amalgamates with
the underlying sequence boundary (e.g. Deep Gorm-1; Fig. 14). The
MFS is marked by a conspicuous peak on the gamma-ray, sonic and
resistivity logs. Both the TST and HST consist of marine mudstones.
The thickness of the sequence attains a maximum of 210 m in Gert-4.
The main depocentre of the sequence is in the eastern part of the
Tail End Graben and in the eastern Søgne Basin. A secondary depo-
centre is present in the Feda Graben (Fig. 18B).
The sequence is referred to the earliest Early Volgian (Fig. 3C)
based on the LOD of Endoscrinium luridum in the sequence below
combined with the LOD of Subtilisphaera? paeminosa in the upper
part of the sequence in a number of wells (e.g. Amalie-1, Deep
Gorm-1, Gert-2, -4, Gwen-2, Ravn-2, U-1).
288
Volg-4
Kimm-4
4048 m b. msl.
Cro
mer
Kno
ll G
pC
rom
erK
noll
Gp
Rya
z.R
yaz.
Upp
erK
imm
. Fars
und
Form
atio
n
Volg-2
Volg-1
Volg-3
Low
erV
olgi
anM
.–U
.V
olg.
Hen
oFm
Volg-44018 m b. msl.
* Upper Volgian
Mid
dle
Vol
gian
Fars
und
Form
atio
n
Volg-3
Volg-2
Volg-1
Kimm-4Lo
wer
Vol
gian
Upp
er K
imm
erid
gian
*
3930 m b. msl.
Fars
und
Form
atio
n
Volg-3
Upp
er Ju
rass
ic
Upp
erK
imm
.M
iddl
e V
olgi
an
Volg-2
Volg-1
Low
er V
olgi
anElin-1
GR Sonic ResSequencesLitho-strati-graphy
Chrono-strati-graphy
Gert-2GR Sonic ResSequences
Litho-strati-graphy
Chrono-strati-graphy
Gwen-2GR Sonic ResSequences
Litho-strati-graphy
Chrono-strati-graphy
Upp
er Ju
rass
icL.
Cre
t.L.
Cre
t.U
pper
Jura
ssic
50 m
Maximum flooding surfaceSequence boundary
Fig. 19. Upper Kimmeridgian – Volgian sequencestratigraphy of the Elin-1, Gert-2 and Gwen-2 wells,highlighting the features of the Kimm-4 – Volg-3sequences. Kimm., Kimmeridgian; L. Cret., LowerCretaceous; M.–U. Volg., Middle–Upper Volgian;Ryaz., Ryazanian.

Volg-2 sequence
Although partly or completely eroded in most wells in the Salt Dome
Province, this sequence is recognised throughout the remainder of
the Danish Central Graben, including the Outer Rough and Ål Basins
(Fig. 18C). The lower sequence boundary of this sequence is rather
indistinct in most wells, being located at the top of a weak coarsen-
ing-upwards trend within the HST of the Volg-1 sequence below
(Fig. 19). In basinal settings, where the sequence is relatively thick,
the TST is four to five times thicker than the HST; in settings where
the sequence is relatively thin, the TST and HST are of comparable
thickness. The sequence consists of marine mudstones. The maxi-
mum thickness of the sequence measured in wells is 344 m (E-1)
although seismic data indicate thicknesses in excess of 400 m in the
prominent Tail End Graben depocentre. A secondary depocentre is
present in the Feda Graben (Fig. 18C).
The LOD of Subtilisphaera? paeminosa in the sequence below
(Volg-1) and of Oligospaeridium patulum in the sequence above
(Volg-3) indicate an Early Volgian age for this sequence. This is fur-
ther supported by the LOD of Cribroperidinium? longicorne in the
lower part of the sequence in the Eg-1 and Emma-1 wells (Fig. 3C).
Volg-3 sequence
The sequence is present over much of the study area but is missing
locally in the south-western part of the Salt Dome Province and in
the area around the Mandal High, probably due to erosion (Fig. 20A).
The lower sequence boundary is positioned at the top of a coars-
ening-upwards interval (e.g. Elin-1, Gert-2; Fig.19). In a number of
wells where the section is relatively thin, the sequence boundary is
placed at the base of a somewhat coarser bed (e.g. Gwen-2; Fig. 19).
The Volg-3 sequence consists of marine mudstones. The thickness
of the sequence attains a maximum of 259 m in E-1. The primary
depocentre in the Tail End Graben branches into the Arne–Elin
Graben. Secondary depocentres are present in the Gertrud and Feda
Grabens and in the Outer Rough Basin (Fig. 20A).
The LOD of Oligosphaeridium patulum in the lower part of this
sequence in a number of wells (e.g. Deep Gorm-1, Elly-2, Falk-1,
Gert-2, Gert-4, I-1, M-8, U-1, V-1) combined with the LOD of
Occisucysta balia in the middle to upper part of the sequence in the
Bo-1, Gert-2, Gwen-2 and Ravn-2 wells indicate a latest Early Volgian
– middle Middle Volgian age for this sequence. This is supported by
the LOD of Perisseiasphaeridium pannosum in the upper part of the
sequence in Gert-1 and Gert-2 (Fig. 3C).
Basin evolution
In this depositional phase, the occurrence of rift pulsesis reflected by syn-rift successions with fining-upwardslog patterns separated by successions with overall coars-ening-upwards patterns, as described from the Mesozoicof East Greenland by Surlyk (1978). A rift pulse in LateKimmeridgian time is indicated by the asymmetric sed-
289
■■
■■
■■
■■
■■
■■
■■
■■
■■
■■
■■
■■
■■
■■■■
■■
■■
■■
■■
■■
■■
■■
■■
■■
■■
■■
■■
■■
■■
■■
■■
■■
■■
■■
■■
■■
■■
■■
■■
■■
■■
■■
■■
■■
■■
■■
■■
■■
■■
■■
■■
■■
■■
■■
■■
■■
■■
■■
■■
■■
■■
■■
■■
■■
■■
■■
■■
■■
■■
■■■■
■■
■■
■■
■■
■■
■■
■■
■■
■■
■■
■■
■■
■■
■■
■■
■■
■■
■■
■■
■■
■■
■■
■■
■■
■■
■■
■■
■■■■
■■
■■
■■
■■
■■
■■
■■
■■
■■200–300 m100–200 m50–100 m0–50 mSequence absent
Fault
Well
A Volg-3 Volg-4B
20 km 20 km
Fig. 20. Isochore maps of the Volg-3 (A) and Volg-4 (B) sequences. In the latest Early – middleMiddle Volgian (A), subordinate depocentres developed in the Arne–Elin Graben and in theOuter Rough Basin. The asymmetric half-graben geometry of the Tail End Graben became lesspronounced during the Middle–Late Volgian (B).

iment distribution of the Kimm-4 deposits in the TailEnd Graben (Fig. 18A). Another pulse in the earliest EarlyVolgian is reflected by fining-upwards log patterns inthe lower part of the Volg-1 sequence (e.g. G-1, Gert-4;Fig. 14) and by seismic data from the Tail End Graben(Møller & Rasmussen 2003, this volume). A further riftpulse in the Early Volgian is interpreted from the abruptchange from low to high gamma-ray values immediatelybelow the Volg-2 MFS (e.g. Gert-4, Nora-1; Figs 14, 16).The latter two rift pulses are recorded on seismic datafrom the Tail End Graben where they resulted in a rota-
tional tilt package (Møller & Rasmussen 2003, this vol-ume, fig. 7).
The Tail End Graben and the Heno Plateau acted ini-tially as one major asymmetric basin, with an elongate,NW–SE-oriented depocentre located in the Tail EndGraben. During the Early Volgian, this depocentreexpanded into the eastern part of the Søgne Basin,where subsidence increased significantly (Fig. 18A, B).The Feda Graben continued as an important depocen-tre. The Gertrud Graben and the Outer Rough and ÅlBasins became actively subsiding elements at the time
290
■■■■
■■
■■
■■
■■
■■
■■
■■
■■
■■
■■
■■
■■
■■
■■
■■
■■
■■
■■
■■
■■
■■
■■
■■
■■
■■
■■
■■
■■
■■
■■
■■
■■
■■
■■
■■
■■
■■
■■
■■
■■
■■
■■
■■
■■
■■
■■
■■
■■
■■
■■
■■
■■
■■
■■
■■
■■
■■Shoreface sands
Offshore/basinal muds
Basin floor sands
Submarine fan
No deposition/no preservation
Fault
Well
■■
■■
■■
■■
■■
■■
■■
■■
■■
■■
■■
■■
■■
■■■■
■■
■■
■■
■■
■■
■■
■■
■■
■■
■■
■■
■■
■■
■■
■■
■■
■■
■■
■■
■■
■■
■■
■■
■■
■■
■■
■■
■■
■■
■■
■■
■■
■■
■■
■■
■■
■■
■■■■
■■
■■
■■
■■
■■
■■
■■
■■
■■
■■
■■
■■
■■
■■
■■
■■
■■
■■
■■
■■
■■
■■
■■
■■
■■
■■
■■
■■
■■
■■
■■
■■
■■
■■
■■
■■
■■
■■
■■
■■
■■
■■
■■
■■
■■
■■
■■
■■
■■
■■
■■
■■
■■
■■
■■
■■
A Late Kimmeridgian Earliest Early –Late Volgian
B
C Late Volgian –Late Ryazanian
20 km
20 km
20 km
Fig. 21. Palaeogeographic maps for the Late Kimmeridgian –Late Ryazanian. In the Early Volgian, the Outer Rough and ÅlBasins were transgressed (compare A and B). Fan and basinfloor sandstones were deposited in deep parts of the basinduring the Late Volgian – Ryazanian (C).

of deposition of the Volg-2 sequence (Figs 17, 18C). Laterduring this phase, increased fault activity resulted in thegeneration of several minor sub-basins, for examplethe Arne–Elin Graben which became a distinct depocen-tre in the early Middle Volgian during deposition of theVolg-3 sequence (Figs 18C, 20A).
Plateau areas draped by Heno Formation sandstoneswere drowned and a coarsening-upwards successionof marine siltstones and mudstones of the FarsundFormation was deposited above the Kimm-4 MFS (e.g.Ravn-1; Fig. 14). Thin storm- or gravity-derived sand lay-ers were occasionally deposited in the Søgne Basin(Figs 17, 21A).
During the Early Volgian, the Outer Rough and ÅlBasins were also transgressed, and fully marine condi-tions were established (Figs 17, 21B). Shoreface sandswere deposited at the western margin of the OuterRough Basin, as documented by data from the UK sec-tor of the Central Graben (Mackertich 1996; Spathopouloset al. 2000).
Phase 7. Organic-rich mudstones and basinaxis turbidites (late Middle Volgian – EarlyRyazanian)
Sequence definitions
Volg-4 sequence
This sequence has not been found in the Søgne Basin and Mandal
High area; it is also missing from parts of the Outer Rough Basin and
the Salt Dome Province. The sequence is present in all other parts
of the study area (Fig. 20B). The lower boundary of the Volg-4
sequence is positioned at the top of the well-defined coarsening-
upwards HST of the Volg-3 sequence below (e.g. Elin-1; Fig. 22). In
a number of wells, the sequence boundary is further marked by the
abrupt base of a slightly more silty or sandy unit (e.g. Jeppe-1).
In many wells (e.g. Iris-1, Jeppe-1), the lower part of the TST typ-
ically shows a fining-upwards/coarsening-upwards pattern; in V-1,
this unit is developed as a 30 m thick sandstone unit (Fig. 23). In
these wells, the remainder of the TST consists of a short, distinct fin-
ing-upwards mudstone section. In other wells, the TST is represented
by a simple fining-upwards interval of marine mudstones (e.g. Bo-1,
Elin-1; Fig. 22). The upper boundary of this sequence is commonly
an erosion surface and the upper part of the HST is thus missing in
many wells (e.g. Gwen-2, Jeppe-1; Figs 19, 22). Where a major part
of the HST is preserved, it typically shows consistently high gamma-
ray values (e.g. Bo-1, Elin-1). Due to the increasingly organic-rich
nature of the sediments (see below), the gamma-ray log is not con-
sidered a fully reliable grain-size indicator. Despite the high gamma-
ray readings, descriptions of the cuttings indicate the presence of sand-
and siltstone in this interval. It is therefore assumed that the high
gamma-ray readings are caused by the presence of organic-rich ‘hot
shales’ and not necessarily by a lack of sand- and silt-sized material.
The sequence consists of marine, organic-rich mudstone with silt- and
sandstone interbeds. The thickness of the sequence attains a maxi-
mum of 189 m in Elin-1. The sequence shows a more even distrib-
ution than the previous sequences, but depocentres are still
recognisable in the Tail End Graben, the Arne–Elin Graben, the Feda
Graben and the Outer Rough Basin (Fig. 20B).
The LOD of Scriniodinium inritibile in the lower part of the
sequence in Bo-1 and of Senoniasphaera jurassica in the lower to
middle part of the sequence in a number of wells (e.g. Bo-1, Deep
Gorm-1, Elin-1, Gwen-2, I-1, Jeppe-1, Ravn-2, W-1) indicate a mid-
dle Middle Volgian age for the lower part of the sequence. In com-
bination with the LOD of Egmontodinium polyplacophorum in the
middle to upper part of the sequence in the Bo-1, Deep Adda-1, E-1,
I-1, Lone-1 and V-1 wells, this indicates a middle Middle Volgian to
Late Volgian age for the sequence. This age assumption is supported
by the LOD of one or more of the dinocyst species Dichadogonyaulax
pannea, Glossodinium dimorphum, Muderongia simplex (the form
previously referred as Muderongia sp. A; Poulsen & Riding 2003, this
volume) and Gochteodinia mutabilis within the sequence in a num-
ber of wells (e.g. Bo-1, Deep Gorm-1, E-1, Elin-1, Gwen-2, I-1, Iris-1,
V-1; Fig. 3C).
Ryaz-1 sequence
The distribution of the Ryaz-1 sequence corresponds to the distribu-
tion of the Volg-4 sequence (see above). The development of the ‘hot
shales’ of the Bo Member within this sequence and the transition to
more calcareous sediments at the top of the Farsund Formation makes
sequence stratigraphic analysis problematic. Neither a MFS nor an
upper boundary of the sequence have been picked. The sequence
is not necessarily limited to the marine mudstones of the Farsund
Formation but may straddle the boundary to the overlying Cromer
Knoll Group. The lower sequence boundary is normally distinct and
often erosional (e.g. Bo-1, Elin-1, Jeppe-1; Fig. 22). Turbidite sand-
stones occur above the boundary in several wells (e.g. Iris-1, Jeppe-1;
Fig. 23). In certain wells that lack such turbidite sandstones (e.g. E-1,
Gert-2), the bioevents of the turbidite-bearing section are absent; this
hiatus is interpreted to have resulted from erosion or sediment bypass,
updip from areas in which turbidite sands accumulated (Ineson et al.
2003, this volume).
The turbidite interval may represent lowstand and possibly early
transgressive deposits. In areas without active turbidite transport or depo-
sition, this interval is characterised by a gradual upwards increase in
gamma-ray values, probably representing the background sedimenta-
tion of the basin (e.g. Bo-1). This increase in the strength of the gamma-
ray signal culminates in the highest gamma-ray values in the entire
Jurassic studied section. This interval corresponds to the ‘hot unit’ of
Jensen et al. (1986), formalised as the Bo Member (Farsund Formation)
by Michelsen et al. (2003, this volume). The dominant lithology is
291

organic-rich marine mudstone; the mudstones are locally interbedded
with turbidite sandstones (Ineson et al. 2003, this volume).The thick-
ness of this interval, from the basal sequence boundary to the top of
the Farsund Formation, attains a maximum of 326 m in Iris-1.
The LOD of Egmontodinium expiratum in the lower part of this
sequence in a number of wells (e.g. Bo-1, Edna-1, Gert-2) and of
Rotosphaerotopsis thula immediately above the ‘hottest’ part of the
Bo Member (e.g. in Anne-3, Bo-1, E-1, Edna-1, Gert-2, Jeppe-1) indi-
cate a Late Volgian – Early Ryazanian age for this part of the sequence.
The uppermost part of the Farsund Formation is of Late Ryazanian
age. This is indicated by the LOD of Dingodinium spinosum which
coincides broadly with the upper boundary of the Farsund Formation
in a number of wells (e.g. Deep Gorm-1, E-1, Edna-1, Jens-1, Jeppe-1,
Kim-1, Lone-1, V-1; Ineson et al. 2003, this volume) and by the LOD
of Dichadogonyaulax culmula at the same stratigraphic level in the
E-1, Edna-1 and Gert-2 wells (Fig. 3C).
Basin evolution
The rate of subsidence decreased in the Tail End Grabenand the Salt Dome Province during this phase; in com-bination with decreased sediment supply, this resultedin stratigraphic condensation. According to the time-scaleof Gradstein et al. (1994), the succession deposited dur-ing phase 7 represents a period of c. 5.5 million years,
292
4392 m b. msl.
Jeppe-1
*
Volg-2
Volg-3
Volg-4
Ryaz-1Rya
zani
an
Volg-3
2577 m b. msl.
Upp
er Ju
rass
icBo-1
Ryaz-1
Volg-4
M. V
olgi
an
Fars
und
Form
atio
n
*
* Upper Volgian
* Upper Volgian
GR Sonic Res
3741 m b. msl.
Cro
mer
Kno
ll G
p
Cro
mer
Kno
ll G
pC
rom
erK
noll
Gp
SequencesLitho-strati-graphy
Chrono-strati-graphy
GR Sonic ResSequencesLitho-strati-graphy
Chrono-strati-graphy
GR Sonic ResSequencesLitho-strati-graphy
Chrono-strati-graphy
Elin-1
Upp
er Ju
rass
ic
U.
Vol
g.
Volg-4
Volg-3
Mid
dle
Vol
gian
Ryaz-1
Fars
und
Form
atio
n
Rya
zani
an
Low
er C
reta
ceou
s
Low
erC
reta
ceou
s
50 mMaximum flooding surfaceSequence boundary
Rya
zani
an
Low
er C
reta
ceou
sU
pper
Jura
ssic
Mid
dle
Vol
gian
Fars
und
Form
atio
n
Fig. 22. Uppermost Jurassic to lowermost Cretaceous stratigraphy of the Bo-1, Elin-1 and Jeppe-1 wells illustrating the characteristicfeatures of the Volg-4 – Ryaz-1 sequences. M., Middle; U. Volg., Upper Volgian.

293
Rya
z-1
Vol
g-4
Vol
g-3
Vol
g-3
Vol
g-4
Rya
z-1
20 k
m
Jepp
e-1
Mon
a-1
Iris
-1
Elin
-1
V-1
Dee
p A
dda-
1
E-1
Mar
ine
mud
ston
e
Mar
ine
silts
tone
Mar
ine
and
para
licsa
ndst
one
Max
imum
floo
ding
sur
face
Sequ
ence
bou
ndar
y
GR
Soni
cR
es
Jepp
e-1
GR
Soni
cR
es
Mon
a-1
GR
Soni
cR
es
Iris
-1
GR
Soni
cR
es
Elin
-1
GR
Soni
cR
es
E-1
GR
Soni
cR
es
Dee
p A
dda-
1G
RSo
nic
Res
V-1
100
m4645
m
4202
m
4550
m41
30 m
3348
m
2979
m
3103
m
Fig.
23.
Seq
uen
ce s
trat
igra
phic
corr
elat
ion o
f th
e upper
most
Upper
Jura
ssic
and low
erm
ost
Cre
tace
ous
in the
Tai
l End G
raben
and the
Ger
trud G
raben
. Fa
n a
nd b
asin
flo
or
sandst
ones
are
com
mon in the
Upper
Volg
ian –
Rya
zania
n s
ucc
essi
on.

approximately equal to the time represented by the2–10 times thicker succession of phase 6.
Fault activity ceased along large segments of the mainboundary fault (Møller & Rasmussen 2003, this volume),and this caused the geometry of the Tail End Graben tochange from an asymmetric rift to a more symmetricalsaucer-like basin with a relatively uniform sediment dis-tribution (Fig. 20B). These changes are the first indica-tions in the Tail End Graben of the beginning of anearly post-rift stage. Minor depocentres continued toexist in the northern part of the Tail End Graben and inthe Arne–Elin Graben. Subsidence continued in the FedaGraben and in the Outer Rough Basin.
The deposits of phase 7 consist of marine mudstonesof the Farsund Formation. They generally show a grad-ual increase in gamma-ray and TOC values culminat-ing in the ‘hot shales’ of the Bo Member in the uppermostpart (Figs 17, 23; Jensen et al. 1986; Ineson et al. 2003,this volume). Below the Bo Member, a well-developedsequence boundary separates the Volg-4 and Ryaz-1sequences. This sequence boundary is strongly ero-sional in most wells on the northern part of the HenoPlateau and along the southern margin of the Feda andGertrud Grabens (e.g. Jeppe-1; Fig. 17). Above thesequence boundary, sandstones are present in a num-ber of wells along the basin axes of the Tail End Grabenand the Gertrud Graben (Figs 21C, 23). The sandstoneswere deposited from turbidity currents (Iris-1) and debrisflows (Jeppe-1) and may have originated from a num-ber of sources, such as the East North Sea Block of theRingkøbing–Fyn High, the Mandal High and the GertRidge (Nielsen 1985; Ineson et al. 2003, this volume).Their occurrence may be related to changed drainagepatterns in the hinterland after subsidence had ceasedalong major segments of the main boundary fault, andto erosion of inverted structures or crests of rotatedfault blocks.
Relative sea-level changesOn the basis of the sequence stratigraphic frameworkpresented here (Fig. 24), a relative sea-level curve canbe constructed for the Middle–Late Jurassic time inter-val and compared with eustatic curves proposed byHaq et al. (1988) and Hallam (1988) based on NorthSea and global data and with the relative sea-level curveof Surlyk (1990) for East Greenland (Fig. 25). The LowerJurassic has only been penetrated by wells in a smallpart of the study area, and no attempt has been madeto construct a sea-level curve for this part of the suc-
cession. Data are lacking from the Toarcian and mostof the Aalenian due to the regional uppermost Aalenianor lowermost Bajocian unconformity. Good biostrati-graphic datings become available from the uppermostBathonian–Callovian and upwards; the sea-level curvethus has its starting point at this level. Wells from thebasin centre and intermediate positions were preferredin selecting data for the construction of the curve.
The relative sea-level changes have been interpretedmainly from lithological changes (e.g. changes in mudcontent in marine sediments) reflecting bathymetricallyrelated changes in energy level. Lithological changeswere interpreted from well log patterns and cores.Sedimentary facies, palynofacies and the extent ofmarine flooding surfaces have also been used.
High uranium contents in some marine mudstones,related to organic matter content rather than clay pro-portion, can cause large deflections on the well logs,thus hampering lithological interpretation. For that rea-son, sea-level interpretations were not attempted in the‘hot shales’ of the Bo Member.
The coastal plain deposits of latest Bathonian – ear-liest Callovian age were transgressed during the Callovian– earliest Oxfordian in most of the Danish Central Graben.A relative sea-level rise caused a rapid, step-wise trans-gression that expanded the basin laterally and drownedprevious sediment sources. The sea-level rise and trans-gression continued throughout the Oxfordian and cul-minated in the Early Kimmeridgian. This development,from the latest Bathonian to the late Early Kimmeridgian,is almost identical to the sea-level curves of Haq et al.(1988) and Hallam (1978, 1981, 1988), based on NorthSea and global data, and the curve of Surlyk (1990) forEast Greenland. The gradual collapse of the North SeaDome (Hallam & Sellwood 1976; Ziegler 1982; Underhill& Partington 1993) and the initiation of rifting in theDanish Central Graben may have influenced transgres-sive trends in the region during this period. However,the resemblance between the relative sea-level curve ofthis study and the curves of Haq et al. (1988), Hallam(1988) and Surlyk (1990) may indicate that a commoncausal factor of super-regional or global extent alsoinfluenced sea-level changes during this interval.
The uppermost Lower Kimmeridgian – Upper Kim-meridgian of the Danish Central Graben is characterisedby a double lowstand peak. The other sea-level curvesare close to their maximum at this level. The lowstandin the Danish Central Graben probably evolved as aresult of a sea-level fall during a pause in rift-inducedsubsidence (phase 5).
294

After the lowstand event, the Late Kimmeridgian –late Middle Volgian interval shows an overall rise inrelative sea level, interrupted by a number of minor falls.This overall trend differs from the fall seen in most ofthe other sea-level curves, probably due to the contin-ued high subsidence rate in the Danish Central Graben,which neutralised the effect of the global sea-level fallindicated by the other curves. The minor relative sea-level falls in the interval may reflect pauses betweenperiods of active subsidence.
Lithology predictionAn important reason for undertaking a sequence strati-graphic study of a hydrocarbon-producing basin is toimprove lithology and reservoir prediction. The pre-dictive potential in syn-rift units is much less than inpost-rift units. This is due to the problems for orderlysediment dispersal caused by the creation of tilted faultblocks and sub-basins, by the continuous presence ofaccommodation space on the lower hanging-wall slopesof tilted fault blocks, and by the local supply of sand
295
Fluvial and estuarine sandstones
Estuarine/lagoonal sandstones,heteroliths, mudstones and coal beds
Shoreface sandstones/siltstones
Offshore mudstones; locallysandy or silty
Deep marine sandstones
Organic-rich offshoremudstones
Floodplain/lacustrine mudstones
Hiatus
Sequence boundary
Chrono-strati-graphy
Sequ
ence
stra
tigra
phy
Ring-købing–Fyn High
NESW Danish Central Graben
Oxfordian
Kimmeridgian
Volgian
Ryazanian
Callovian
Bathonian
Bajocian
L
L
L
L
L
L
U
U
U
U
U
U
M
M
M
M
Aalenian
Aal
en-1
– B
aj-1
Plie
ns-1
,Pl
iens
-2Ba
t-1
Cal
-11
2R
yaz-
1K
imm
-O
x-Vo
lg-
11
22
33
44
Toarcian
Pliensbachian
80 km
FjerritslevFm
BryneFm
LuluFm
Heno Fm
LolaFm
FarsundFm
BoMb
Fig. 24. Generalised sequence strati-graphic diagram of the Middle Jurassic –lowermost Cretaceous succession.Relative duration of stages afterGradstein et al. (1994). L, Lower; M,Middle; U, Upper.

from erosion of uplifted footwall shoulders. However,in the Middle to Upper Jurassic syn-rift deposits of theDanish Central Graben, the sandstone units seem toshow a systematic distribution, which may be relatedto the combination of sea-level changes and periods oflittle tectonic subsidence.
The Bathonian–Callovian sandstones, that are widelydistributed in the Søgne Basin, the Tail End Graben andthe Salt Dome Province, resulted from a generous sup-ply of sand from the active denudation of the North Seadome area and a relatively low and only slowly increas-ing accommodation space in the rift initiation stage. Thebest reservoir sandstones occur in the lowstand andtransgressive systems tracts of the Baj-1, Bat-1 andCal-1 sequences (Figs 4, 7), in the form of laterally exten-sive fluvial channel sandstones and tidal and shorefacesandstones in the uppermost part of the sandstone unit,
deposited prior to the final transgression. The desirablecombination of large fluvial and tidal channels and exten-sive wave-reworked sandstones occurs in the deeperparts of the Søgne Basin and the Tail End Graben. Inthese areas, subsidence was sufficiently fast to createaccommodation space for successions of wave-influ-enced sediments up to 30 m thick during the final MiddleJurassic transgression (Andsbjerg 2003, this volume).
An overall transgressive development is interpretedfor the Late Jurassic. The largest concentration of reser-voir sandstones in this succession (the Heno Formation)was deposited during a pause in the otherwise rapidsubsidence. The sand is concentrated on the HenoPlateau, the Gertrud Plateau and along the southern mar-gin of the Feda Graben. The Heno Plateau constitutedan upper hanging-wall slope of a major half-graben, theTail End Graben, and the Gertrud Plateau probably
296
Valanginian
Age Sea-level curvesLow High
Ryazanian
Volgian
Kimmeridgian
Oxfordian
Callovian
Bathonian
Bajocian
Aalenian
Toarcian
Pliensbachian
Sinemurian
Hettangian
Shortterm
Longterm
dating uncertain
dating uncertain
DanishCentral Graben
(this study)
WollastonForland
Embayment
Jameson Land Embayment
Hallam (1988)
Surlyk(1990)
Haq et al.(1988)
Fig. 25. Comparison of the relative sea-level curve of this study with the sea-level curves presented by Haq et al.(1988), Hallam (1988) and Surlyk (1990).Figure modified after Surlyk (1990),according to the Gradstein et al. (1994)time-scale.

comprised a transfer zone between the Tail End andFeda Grabens (Figs 11, 13, 14). Possible source areasfor the sandstones were to the north-east, where theUla Formation and Bryne Formation sandstones werelocated, and to the west, on the Mid North Sea High(Figs 15B, C). Fluvial systems and/or marine current andwave activity may have facilitated sediment transportto the Gertrud and Heno Plateaus. A similar scenariowas envisaged by Howell et al. (1996) for the southernUK Central Graben.
The turbidite and debris flow sandstones of the UpperVolgian – Ryazanian constitute potential reservoirs(Fig. 23). Most of the sands were deposited during depo-sitional phase 7, when subsidence had decreased, andparts of the Danish Central Graben had broken up intofault-bounded sub-basins. Inactivity of some Coffee SoilFault segments (Møller & Rasmussen 2003, this volume)may have increased the drainage area in the marginalhinterland and opened new sediment transport routes,causing an increased sand supply. Sediment dispersal inthe receiving basin was still hampered by a topographydominated by tilted fault blocks and many small sub-basins. The most extensive sandstones are present imme-diately above the Ryaz-1 basal sequence boundary.
Sandstones have not been encountered in the fewreleased wells drilled in the Danish part of the OuterRough and Ål Basins. However, the presence of Volgianreservoir sandstones of a type similar to the HenoFormation is reported from wells nearby in the UK sec-tor (Mackertich 1996; Spathopoulos et al. 2000).
ConclusionsThe depositional history of the Danish Central Grabenin the Jurassic shows a relationship to contemporaneousrift stages and to relative and eustatic sea-level changes.The basin development in the Jurassic is subdivided intoseven depositional phases that reflect this interplay:
Phase 1 (Hettangian–Pliensbachian). During phase1, pre-rift marine mudstones were deposited in a sta-ble epicontinental sea, that stretched across a majorpart of the North Sea region. The deposits wereremoved from large parts of the central North Searegion by subsequent erosion (phase 2).
Phase 2 (latest Pliensbachian – latest Aalenian/ear-liest Bajocian). This corresponds to the tectonic proto-rift stage, being characterised by domal uplift andregionally extensive erosion.
Phase 3 (latest Aalenian/earliest Bajocian – LateCallovian). The Middle Jurassic sandstones owe theirpresence to erosion of the North Sea dome, and toslow generation of accommodation space during ini-tial rifting (initiation of the tectonic rift stage). Sub-sidence rates increased in the Callovian and Oxford-ian, heralding the onset of the climax of the tectonicrift stage. This resulted in marine flooding and ces-sation of sand deposition.
Phase 4 (Early Oxfordian – Early Kimmeridgian).In the Oxfordian – Early Kimmeridgian, the Tail EndGraben entered the rift climax resulting in the devel-opment of a half-graben. Marine mudstones weredeposited during this phase.
Phase 5 (Late Kimmeridgian). Extensive sand depo-sition took place in the early Late Kimmeridgian dur-ing a halt in subsidence between two rift pulses.Sand was deposited over a large area with low accom-modation space, which was created on the hanging-wall plateau. Exposed highs and land areas outsidethe graben supplied the sand. Due to the decreasein subsidence in the Tail End Graben, input of fine-grained sediment could catch up with accommoda-tion space generation, probably resulting in a flattopography at the end of this phase.
Phase 6 (latest Late Kimmeridgian – middle MiddleVolgian). During this phase, renewed rifting causedrapid subsidence in the study area. Several rift pulsesoccurred during this interval. Due to the high over-all rate of subsidence, sand deposition associatedwith relative sea-level falls did not occur. The DanishCentral Graben began to break up into minor sub-basins during this phase.
Phase 7 (late Middle Volgian – Ryazanian). Sub-sidence decreased over large areas of the basin,which had probably entered an early post-rift stage.Major segments of the Coffee Soil Fault became inac-tive, resulting in a shallower, more symmetrical basin.Active subsidence continued in a number of sub-basins. Highly organic-rich mudstones are prominentin the deposits of this phase. The mudstones areinterbedded with turbidite and debris flow sanddeposits locally, in particular along the Tail End Graben– Gertrud Graben basin axis and along the eastern mar-gin of the Tail End Graben.
297

Comparison of the sea-level curve constructed for theDanish Central Graben with published sea-level curvesindicates that deposition in the periodically very rapidlysubsiding rift basin was strongly influenced by tectonics.In the latest Bathonian – late Early Kimmeridgian, the over-all deepening trend resulted from both eustatic sea-levelrise and rift-related subsidence. During the rest of the LateJurassic, the deepening trend was primarily related to thehigh subsidence rate associated with rifting. Most sedi-ments were deposited between rift pulses in accomoda-tion space that was generated during the rift pulses or bypassive subsidence; only a relatively minor proportion ofthe sediments was deposited during the rift pulses.
AcknowledgementsWe had fruitful discussions with colleagues Jon R. Ineson,Peter N. Johannessen, Jens J. Møller and Erik S. Rasmussen.We gratefully acknowledge the comments of Jon R. Inesonand Erik S. Rasmussen on an early manuscript and thoseof the two referees, M.J. Fisher and D.N. Parkinson. Thework formed part of a Ph.D. study at CopenhagenUniversity for the first author, who extends his gratitudeto supervisor Finn Surlyk for his thorough and criticalcomments. Eva B. Koppelhus and Niels E. Poulsen kindlysupplied us with palynological datings. The work was sup-ported by the Danish Energy Agency (EFP-92, 1313/92-0002), Mærsk Oil and Gas A/S and Norsk Hydro Udforsk-ning a.s./Amerada Hess A/S.
ReferencesAndersen, C., Olsen, J.C., Michelsen, O. & Nygaard, E. 1982:
Structural outline and development. In: Michelsen, O. (ed.):Geology of the Danish Central Graben. Danmarks GeologiskeUndersøgelse Serie B 8, 9–26.
Andsbjerg, J. 2003: Sedimentology and sequence stratigraphy ofthe Bryne and Lulu Formations, Middle Jurassic, northernDanish Central Graben. In: Ineson, J.R. & Surlyk, F. (eds): TheJurassic of Denmark and Greenland. Geological Survey ofDenmark and Greenland Bulletin 1, 301–347 (this volume).
Birkelund, T., Clausen, C.K., Hansen, H.N. & Holm, L. 1983: TheHectoroceras kochi zone (Ryazanian) in the North Sea CentralGraben and remarks on the Late Cimmerian Unconformity.Danmarks Geologiske Undersøgelse Årbog 1982, 53–72.
Blair, T.C. & Bilodeau, W.L. 1988: Development of tectoniccyclothems in rift, pull-apart, and foreland basins: sedimen-tary response to episodic tectonism. Geology 16, 517–520.
Cartwright, J.A. 1987: Transverse structural zones in continentalrifts – an example from the Danish sector of the North Sea.In: Brooks, J. & Glennie, K.W. (eds): Petroleum geology of
North West Europe, 441–452. London: Graham & Trotman.Cartwright, J.A. 1991: The kinematic evolution of the Coffee Soil
Fault. In: Roberts, A.M., Yielding, G. & Freeman, B. (eds): Thegeometry of normal faults. Geological Society SpecialPublication (London) 56, 29–40.
Costa, L.I. & Davey, R.J. 1992: Dinoflagellate cysts of the CretaceousSystem. In: Powell, A.J. (ed.): A stratigraphic index of dinofla-gellate cysts, 99–153. British Micropalaeontological SocietyPublication Series. London: Chapman & Hall.
Davey, R.J. 1979: The stratigraphic distribution of dinocysts in thePortlandian (latest Jurassic) to Barremian (Early Cretaceous)of Northwest Europe. American Association of StratigraphicPalynologists Contributions Series 5B, 49–81.
Dybkjær, K. 1988: Palynological zonation and stratigraphy of theJurassic section in the Gassum No.1-borehole. DanmarksGeologiske Undersøgelse Serie A 21, 73 pp.
Dybkjær, K. 1991: Palynological zonation and palynofacies inves-tigation of the Fjerritslev Formation (Lower Jurassic – basalMiddle Jurassic) in the Danish Subbasin. Danmarks GeologiskeUndersøgelse Serie A 30, 150 pp.
Eynon, G. 1981: Basin development and sedimentation in theMiddle Jurassic of the northern North Sea. In: Illing, L.V. &Hobson, G.D. (eds): Petroleum geology of the continental shelfof North-West Europe, 196–204. London: Heyden & Son Ltd.
Fenton, P.G. & Riding, J.B. 1987: Kekryphalospora distincta gen.et sp. nov., a trilete spore from the Lower and Middle Jurassicof North-West Europe. Pollen et Spores 29, 427–434.
Gabrielsen, R.H., Færseth, R.B., Steel, R.J., Idil, S. & Kløvjan, O.S.1990: Architectural styles of basin fill in the northern VikingGraben. In: Blundell, D.J. & Gibbs, A.D. (eds): Tectonic evo-lution of the North Sea rifts, 158–179. Oxford: Clarendon Press.
Gowers, M.B. & Sæbøe, A. 1985: On the structural evolution ofthe Central Trough in the Norwegian and Danish sectors ofthe North Sea. Marine and Petroleum Geology 2, 298–318.
Gradstein, F.M., Agterberg, F.P., Ogg, J.G., Hardenbol, J., vanVeen, P., Thierry, J. & Huang, Z. 1994: A Mesozoic time scale.Journal of Geophysical Research 99, 24051–24074.
Hallam, A. 1978: Eustatic cycles in the Jurassic. Palaeogeography,Palaeoclimatology, Palaeoecology 23, 1–32.
Hallam, A. 1981: A revised sea-level curve for the early Jurassic.Journal of the Geological Society (London) 138, 735–743.
Hallam, A. 1988: A reevaluation of Jurassic eustasy in the lightof new data and the revised Exxon curve. In: Wilgus, C.K. etal. (eds): Sea-level change – an integrated approach. Societyof Economic Paleontologists and Mineralogists SpecialPublication 42, 261–273.
Hallam, A. & Sellwood, B.W. 1976: Middle Mesozoic sedimenta-tion in relation to tectonics in the British area. Journal ofGeology 84, 301–321.
Haq, B.U., Hardenbol, J. & Vail, P.R. 1988: Mesozoic and Cenozoicchronostratigraphy and cycles of sea-level change. In: Wilgus,C.K. et al. (eds): Sea-level changes – an integrated approach.Society of Economic Paleontologists and Mineralogists SpecialPublication 42, 71–108.
Heilmann-Clausen, C. 1987: Lower Cretaceous dinoflagellate bio-stratigraphy in the Danish Central Trough. Danmarks GeologiskeUndersøgelse Serie A 17, 89 pp.
298

299
Hoelstad, T. 1986: Palynology of the Middle Jurassic Lower GrabenSand Formation of the U-1 well, Danish Central Trough. Dan-marks Geologiske Undersøgelse Serie A 14, 25 pp.
Howell, J.A., Flint, S.S. & Hunt, C. 1996: Sedimentological aspectsof the Humber Group (Upper Jurassic) of the South CentralGraben, UK North Sea. Sedimentology 43, 89–114.
Hunt, D. & Tucker, M.E. 1992: Stranded parasequences and theforced regressive wedge systems tract: deposition during base-level fall. Sedimentary Geology 81, 1–9.
Hunt, D. & Tucker, M.E. 1995: Stranded parasequences and theforced regressive wedge systems tract: deposition during base-level fall – reply. Sedimentary Geology 95, 147–160.
Ineson, J.R., Bojesen-Koefoed, J.A., Dybkjær, K. & Nielsen, L.H.2003: Volgian–Ryazanian ‘hot shales’ of the Bo Member(Farsund Formation) in the Danish Central Graben, North Sea:stratigraphy, facies and geochemistry. In: Ineson, J.R. & Surlyk,F. (eds): The Jurassic of Denmark and Greenland. GeologicalSurvey of Denmark and Greenland Bulletin 1, 403–436 (thisvolume).
Jensen, T.F., Holm, L., Frandsen, N. & Michelsen, O. 1986: Jurassic– Lower Cretaceous lithostratigraphic nomenclature for theDanish Central Trough. Danmarks Geologiske UndersøgelseSerie A 12, 65 pp.
Johannessen, P.N. 2003: Sedimentology and sequence stratigra-phy of paralic and shallow marine Upper Jurassic sandstonesin the northern Danish Central Graben. In: Ineson, J.R. &Surlyk, F. (eds): The Jurassic of Denmark and Greenland.Geological Survey of Denmark and Greenland Bulletin 1,367–402 (this volume).
Johannessen, P.N. & Andsbjerg, J. 1993: Middle to Late Jurassicbasin evolution and sandstone reservoir distribution in theDanish Central Trough. In: Parker, J.R. (ed.): Petroleum geol-ogy of Northwest Europe: proceedings of the 4th conference,271–283. London: Geological Society.
Johannessen, P.N., Dybkjær, K. & Rasmussen, E.S. 1996: Sequencestratigraphy of Upper Jurassic reservoir sandstones in thenorthern part of the Danish Central Trough, North Sea. Marineand Petroleum Geology 13, 755–770.
Koch, J.-O. 1983: Sedimentology of Middle and Upper Jurassic sand-stone reservoirs of Denmark. In: Kaasschieter, J.P.H. & Reigers,T.J.A. (eds): Petroleum geology of the southeastern North Seaand the adjacent onshore areas. Geologie en Mijnbouw 62,115–129.
Koppelhus, E.B. & Nielsen, L.H. 1994: Palynostratigraphy andpalaeoenvironments of the Lower to Middle Jurassic BagåFormation of Bornholm, Denmark. Palynology 18, 139–194.
Korstgård, J.A., Lerche, I., Mogensen, T.E. & Thomsen, R.O. 1993:Salt and fault interactions in the northeastern Danish CentralGraben: observations and inferences. Bulletin of the GeologicalSociety of Denmark 40, 197–255.
Larsen, G. 1966: Rhaetic – Jurassic – Lower Cretaceous sedimentsin the Danish Embayment (a heavy-mineral study). DanmarksGeologiske Undersøgelse II. Række 91, 128 pp.
Lund, J.J. 1977: Rhaetic to Lower Liassic palynology of the onshoresouth-eastern North Sea Basin. Danmarks Geologiske Under-søgelse II. Række 109, 129 pp.
Mackertich, D. 1996: The Fife Field, UK Central North Sea.
Petroleum Geoscience 2, 373–380.Michelsen, O. 1978: Stratigraphy and distribution of Jurassic
deposits of the Norwegian–Danish Basin. Danmarks GeologiskeUndersøgelse Serie B 2, 28 pp.
Michelsen, O. (ed.) 1982: Geology of the Danish Central Graben.Danmarks Geologiske Undersøgelse Serie B 8, 133 pp.
Michelsen, O. 1989: Log-sequence analysis and environmentalaspects of the Lower Jurassic Fjerritslev Formation in theDanish Subbasin. Danmarks Geologiske Undersøgelse SerieA 25, 23 pp.
Michelsen, O., Frandsen, N., Holm, L., Jensen T.F., Møller, J.J. &Vejbæk, O.V. 1987: Jurassic – Lower Cretaceous of the DanishCentral Trough; depositional environments, tectonism, and reser-voirs. Danmarks Geologiske Undersøgelse Serie A 16, 45 pp.
Michelsen, O., Nielsen, L.H., Johannessen, P.N., Andsbjerg, J. &Surlyk, F. 2003: Jurassic lithostratigraphy and stratigraphicdevelopment onshore and offshore Denmark. In: Ineson, J.R.& Surlyk, F. (eds): The Jurassic of Denmark and Greenland.Geological Survey of Denmark and Greenland Bulletin 1,147–216 (this volume).
Mogensen, T.E., Korstgaard, J.A. & Geil, K. 1992: Salt tectonicsand faulting in the NE Danish Central Graben. In: Spencer,A.M. (ed.): Generation, accumulation and production ofEurope’s hydrocarbons II. European Association of PetroleumGeoscientists Special Publication 2, 163–173.
Møller, J.J. 1986: Seismic structural mapping of the Middle andUpper Jurassic in the Danish Central Trough. DanmarksGeologiske Undersøgelse Serie A 13, 37 pp.
Møller, J.J. & Rasmussen, E.S. 2003: Middle Jurassic – EarlyCretaceous rifting of the Danish Central Graben. In: Ineson,J.R. & Surlyk, F. (eds): The Jurassic of Denmark and Greenland.Geological Survey of Denmark and Greenland Bulletin 1,247–264 (this volume).
Nielsen, L.H. 1985: Central Graben core description report 5604/30-1. Description of cores 2–6. Geological Survey of DenmarkConfidential report 7, 13 pp.
Nielsen, L.H. 2003: Late Triassic – Jurassic development of theDanish Basin and the Fennoscandian Border Zone, southernScandinavia. In: Ineson, J.R. & Surlyk, F. (eds): The Jurassicof Denmark and Greenland. Geological Survey of Denmarkand Greenland Bulletin 1, 459–526 (this volume).
Nøttvedt, A., Gabrielsen, R.H. & Steel, R.J. 1995: Tectonostrati-graphy and sedimentary architecture of rift basins, with refer-ence to the northern North Sea. Marine and Petroleum Geology12, 881–901.
Pedersen, G.K. 1985: Thin, fine-grained storm layers in a muddyshelf sequence: an example from the Lower Jurassic in theStenlille 1 well, Denmark. Journal of the Geological Society(London) 142, 357–374.
Pedersen, G.K. 1986: Changes in the bivalve assemblage of anEarly Jurassic mudstone sequence (the Fjerritslev Formationin the Gassum 1 well, Denmark). Palaeogeography, Palaeo-climatology, Palaeoecology 53, 139–168.
Posamentier, H.W. & Vail, P.R. 1988: Eustatic controls on clasticdeposition II – sequence and systems tract models. In: Wilgus,C.K. et al. (eds): Sea-level changes – an integrated approach.Society of Economic Paleontologists and Mineralogists Special

300
Publication 42, 125–154.Posamentier, H.W. & James, D.P. 1993: An overview of sequence-
stratigraphic concepts: uses and abuses. In: Posamentier, H.W.et al. (eds): Sequence stratigraphy and facies associations.International Association of Sedimentologists Special Publica-tion 18, 3–18.
Posamentier, H.W., Jervey, M.T. & Vail, P.R. 1988: Eustatic con-trols on clastic deposition I – conceptual framework. In: Wilgus,C.K. et al. (eds): Sea-level changes – an integrated approach.Society of Economic Paleontologists and Mineralogists SpecialPublication 42, 109–124.
Poulsen, N.E. 1986: Callovian–Volgian dinocyst stratigraphy of theCentral Trough in the Danish North Sea area. Bulletin of theGeological Society of Denmark 35, 1–10.
Poulsen, N.E. 1991: Upper Jurassic dinocyst stratigraphy in theDanish Central Trough. In: Michelsen, O. & Frandsen, N. (eds):The Jurassic of the southern Central Trough. DanmarksGeologiske Undersøgelse Serie B 16, 7–15.
Poulsen, N.E. 1992: Jurassic dinoflagellate cyst biostratigraphy ofthe Danish Subbasin in relation to sequences in England andPoland; a preliminary review. Review of Palaeobotany andPalynology 75, 33–52.
Poulsen, N.E. 1996: Dinoflagellate cysts from marine Jurassicdeposits of Denmark and Poland. American Association ofStratigraphic Palynologists Contributions Series 31, 227 pp.
Poulsen, N.E. & Riding, J.B. 2003: The Jurassic dinoflagellate cystzonation of Subboreal Northwest Europe. In: Ineson, J.R. &Surlyk, F. (eds): The Jurassic of Denmark and Greenland.Geological Survey of Denmark and Greenland Bulletin 1,115–144 (this volume).
Prosser, S. 1993: Rift-related linked depositional systems and theirseismic expression. In: Williams, G.D. & Dobb, A. (eds):Tectonics and seismic sequence stratigraphy. Geological SocietySpecial Publication (London) 71, 35–66.
Riding, J.B. & Thomas, J.E. 1992: Dinoflagellate cysts of theJurassic System. In: Powell, A.J. (ed.): A stratigraphic index ofdinoflagellate cysts, 7–97. British Micropalaeontological SocietyPublication Series. London: Chapman & Hall.
Roberts, A.M., Price, J.D. & Olsen, T.S. 1990: Late Jurassic half-graben control on the siting and structure of hydrocarbonaccumulations: UK/Norwegian Central Graben. In: Hardman,R.F.P. & Brooks, J. (eds): Tectonic events responsible forBritain’s oil and gas reserves. Geological Society SpecialPublication (London) 55, 229–257.
Rosendahl, B.R. 1987: Architecture of continental rifts with spe-cial reference to East Africa. Annual Review of Earth andPlanetary Sciences 15, 445–503.
Spathopoulos, F., Doubleday, P.A. & Hallsworth, C.R. 2000:Structural and depositional controls on the distribution of theUpper Jurassic shallow marine sandstones in the Fife andAngus fields area, Quadrants 31 & 39, UK Central North Sea.Marine and Petroleum Geology 17, 1053–1082.
Sundsbø, G.O. & Megson, J.B. 1993: Structural styles in the DanishCentral Graben. In: Parker, J.R. (ed.): Petroleum geology ofNorthwest Europe: proceedings of the 4th conference,
1255–1267. London: Geological Society.Surlyk, F. 1978: Submarine fan sedimentation along fault scarps on
tilted fault blocks (Jurassic–Cretaceous boundary, East Green-land). Bulletin Grønlands Geologiske Undersøgelse 128, 108 pp.
Surlyk, F. 1989: Mid-Mesozoic syn-rift turbidite systems: controlsand predictions. In: Collinson, J.D. (ed.): Correlation in hydro-carbon exploration, 231–241. London: Graham & Trotman forthe Norwegian Petroleum Society (NPF).
Surlyk, F. 1990: A Jurassic sea-level curve for East Greenland.Palaeogeography, Palaeoclimatology, Palaeoecology 78, 71–85.
Surlyk, F. & Clemmensen, L.B. 1983: Rift propagation and eustacyas controlling factors during Jurassic inshore and shelf sedi-mentation in northern East Greenland. Sedimentary Geology34, 119–143.
Underhill, J.R. & Partington, M.A. 1993: Jurassic thermal domingand deflation in the North Sea: implications of the sequencestratigraphic evidence. In: Parker, J.R. (ed.): Petroleum geol-ogy of Northwest Europe: proceedings of the 4th conference,337–345. London: Geological Society.
Vail, P.R., Mitchum, R.M. & Thompson, S. 1977: Seismic stratigra-phy and global changes of sea level; Part 3: relative changesof sea level from coastal onlap. In: Payton, C.E. (ed.): Seismicstratigraphy – applications to hydrocarbon exploration. AmericanAssociation of Petroleum Geologists Memoir 26, 63–81.
van Adrichem Boogaert, H.A. & Kouwe, W.F.P. (compilers) 1993:Lower and Middle Jurassic (Altena Group). In: van AdrichemBoogaert, H.A. & Kouwe, W.F.P. (compilers): Stratigraphicnomenclature of the Netherlands, revision and update by RijksGeologische Dienst and Netherlands Oil and Gas Explorationand Production Association. Mededelingen Rijks GeologischeDienst 50(section F), 20 pp.
Van Wagoner, J.C., Posamentier, H.W., Mitchum, R.M., Vail, P.R.,Sarg, J.F., Loutit, T.S. & Hardenbol, J. 1988: An overview ofthe fundamentals of sequence stratigraphy and key defini-tions. In: Wilgus, C.K. et al. (eds): Sea-level changes – an inte-grated approach. Society of Economic Paleontologists andMineralogists Special Publication 42, 39–45.
Van Wagoner, J.C., Mitchum, R.M., Campion, K.M. & Rahmanian,V.D. 1990: Siliciclastic sequence stratigraphy in well logs, coresand outcrops: concepts for high-resolution correlation of timeand facies. American Association of Petroleum GeologistsMethods in Exploration Series 7, 55 pp.
Vollset, J. & Doré, A.G. (eds) 1984: A revised Triassic and Jurassiclithostratigraphic nomenclature for the Norwegian North Sea.Norwegian Petroleum Directorate Bulletin 3, 53 pp.
Whiteman, A.J., Rees, G., Naylor, D. & Pegrum, R.M. 1975: NorthSea troughs and plate tectonics. Norges Geologiske Under-søkelse 316, 137–161.
Ziegler, P.A. 1982: Geological atlas of western and central Europe,130 pp. The Hague: Elsevier for Shell Internationale PetroleumMaatschappij.
Ziegler, P.A. 1990: Tectonic and palaeogeographic developmentof the North Sea rift system. In: Blundell, D.J. & Gibbs, A.D.(eds): Tectonic evolution of the North Sea rifts, 1–36. Oxford:Clarendon Press.
Manuscript received 30 May 1997; revision accepted 9 February 2000.

Ryaz-1
Volg-4
Volg-3
Volg-2
Volg-1
Ryaz-1
Volg-4
Volg-3
Volg-2
Volg-1
Kimm-4
Kimm-2
Kimm-3
Kimm-1
Ox-2
Ox-1
Cal-1
Bat-1
Baj-1
Aalen-1
20 km
Elin-1
Falk-1
Ravn-1
Ravn-2
Nora-1Baron-2
Marine mudstone
Marine siltstone
Marine and paralicsandstone
Fluvial sandstone
Floodplain mudstoneand siltstone
Maximum flooding surfaceSequence boundary
GR Sonic
4401 m
Res
Ravn-2
GR Sonic
4307 m
Res
Ravn-1
GR Sonic
4174 m
Res
Falk-1
GR Sonic
5233 m
Res
Baron-2
GR Sonic
4719 m
Res
Elin-1
GR Sonic
5338 m
Res
Nora-1
100 m
Fig. 13. Sequence stratigraphic correlation of the Middle andUpper Jurassic on the Heno Plateau and in the Tail EndGraben; the profile represents a dip section from the HenoPlateau to the Tail End Graben.

Ryaz-1
Volg-4
Volg-3
Volg-2
Volg-1
Kimm-4
Kimm-3
Kimm-2
Kimm-1
Volg-2
Volg-1
Kimm-4
Kimm-3
Kimm-2
100 m
20 km
Gert-4
Gert-2
Jeppe-1
Ravn-1
Falk-1
G-1
Deep Gorm-1
Elly-2
Gwen-2
Marine mudstone
Marine siltstone
Marine and paralicsandstone
Fluvial sandstone
Floodplain mudstoneand siltstone
Maximum flooding surfaceFlooding surfaceSequence boundary
GR Sonic
5352 m
Res
Gert-4
GR Sonic
4876 m
Res
Gert-2
GR Sonic
5041 m
Res
Jeppe-1
GR Sonic
4355 m
Res
Gwen-2
GR Sonic
4307 m
Res
Ravn-1
GR Sonic
4174 m
Res
Falk-1
GR Sonic
4080 m
Res
Elly-2
GR Sonic
3935 m
Res
Deep Gorm-1
GR Sonic
3816 m
Res
G-1
Fig. 14. Sequence stratigraphic correlation of the UpperJurassic succession from the Feda Graben across the HenoPlateau to the southern Tail End Graben. Onlap of the baseJurassic unconformity can be seen on the southern part of theHeno Plateau (i.e. from Deep Gorm-1 to Ravn-2). The baseKimm-2 sequence boundary exhibits a distinct log break,interpreted as an erosional surface that cuts into underlyingmarine mudstones in the southern part of the study area. Theupper part of the Kimm-3 sequence and possibly the lower-most part of the Kimm-4 sequence onlaps the Kimm-3flooding surface in the Feda Graben and on the southernHeno Plateau.

Cleo-1 Amalie-1
Nora-1
E-1
G-1
Volg-1
Kimm-4
Kimm-3
Kimm-2
Cal-1 –Kimm-1
Ryaz-1
Volg-4
Volg-3
Volg-2
Volg-1
Kimm-4
Kimm-3
Kimm-2
Kimm-1
Volg-2
GR Sonic
4622 m
Res GR Sonic
5122 m
Res
GR Sonic
4805 m
Res
GR Sonic
4719 m
Res
GR Sonic
4087 m
Res
GR Sonic
3816 m
Res
Elin-1
20 km
Amalie-1
Cleo-1
Elin-1
Nora-1
G-1
E-1
Marine mudstone
Marine siltstone
Marine and paralicsandstone
Fluvial sandstone
Floodplain mudstoneand siltstone
Maximum flooding surfaceSequence boundary
100 m
Fig. 16. Sequence stratigraphic correlation of the Upper Jurassicsuccession in the Tail End Graben; the profile is parallel to the basinaxis.

Volg-2
Volg-1
Kimm-4
Kimm-3
Kimm-2
Cal-1 –Kimm-1
Bat-1
Baj-1
Volg-2
Volg-3
Volg-4
Ryaz-1
20 km
Cleo-1
Lulu-1
W. Lulu-2
Karl-1
Jeppe-1
Lone-1Kim-1
Torden-skjold-1
Marine mudstone
Marine siltstone
Marine and paralicsandstone
Fluvial sandstone
Floodplain mudstoneand siltstone
Maximum flooding surfaceFlooding surfaceSequence boundary
GR Sonic
3532 m
Res
Tordenskjold-1
GR Sonic
4602 m
Res
Kim-1
GR Sonic
3797 m
Res
Lone-1 GR Sonic
5041 m
Res
Jeppe-1
GR Sonic
4819 m
Res
Karl-1
GR Sonic
3944 m
Res
W. Lulu-2
GR Sonic
3699 m
Res
Lulu-1
GR Sonic
4709 m
Res
Cleo-1
100 m
Fig. 17. Sequence stratigraphic correlation of the Upper Jurassic in the northern part of theDanish Central Graben. The profile is perpendicular to the main structural elements from theOuter Rough Basin in the west to the Søgne Basin in the east. The sub-basins were transgressedin a stepwise manner from east to west from the Middle Jurassic to the earliest Early Volgian.


