Embed Size (px)
Citation preview
Brigham Young University Brigham Young University
BYU ScholarsArchive BYU ScholarsArchive
Theses and Dissertations
2008-03-07
Analysis of the Psychometric Properties of Two Different Analysis of the Psychometric Properties of Two Different
Concept-Map Assessment Tasks Concept-Map Assessment Tasks
Kenneth James Plummer Brigham Young University - Provo
Follow this and additional works at: https://scholarsarchive.byu.edu/etd
Part of the Educational Psychology Commons
BYU ScholarsArchive Citation BYU ScholarsArchive Citation Plummer, Kenneth James, "Analysis of the Psychometric Properties of Two Different Concept-Map Assessment Tasks" (2008). Theses and Dissertations. 1352. https://scholarsarchive.byu.edu/etd/1352
This Dissertation is brought to you for free and open access by BYU ScholarsArchive. It has been accepted for inclusion in Theses and Dissertations by an authorized administrator of BYU ScholarsArchive. For more information, please contact [email protected], [email protected].
ANALYSIS OF THE PSYCHOMETRIC PROPERTIES OF TWO DIFFERENT
CONCEPT-MAP ASSESSMENT TASKS
Kenneth James Plummer
A dissertation submitted to the faculty of
Brigham Young University
in partial fulfillment of the requirements for the degree of
Doctor of Philosophy
Department of Instructional Psychology and Technology
Brigham Young University
April 2008
Copyright © 2008 Kenneth James Plummer
All Rights Reserved
BRIGHAM YOUNG UNIVERSITY
GRADUATE COMMITTEE APPROVAL
of a dissertation submitted by
Kenneth James Plummer
This dissertation has been read by each member of the following graduate committee and by majority vote has been found to be satisfactory. ______________________________ Date
______________________________Richard R Sudweeks, ,Chair
______________________________ Date
______________________________Gary M Booth
______________________________ Date
______________________________Charles R Graham
______________________________ Date
______________________________Patrick T Panos
______________________________ Date
______________________________Stephen C Yanchar
BRIGHAM YOUNG UNIVERSITY
As chair of the candidate’s graduate committee, I have read the dissertation of Kenneth
James Plummer in its final form and have found that (1) its format, citations, and
bibliographical styles are consistent and acceptable and fulfill university and department
style requirements; (2) its illustrative materials including figures, tables, and charts are in
place; and (3) the final manuscript is satisfactory to the graduate committee and is ready for
submission to the university library.
______________________________ Date
______________________________Richard R Sudweeks
Chair, Graduate Committee
______________________________ Accepted for the Department
______________________________Andrew S. Gibbons
Department Chair
______________________________ Accepted for the School
______________________________K. Richard Young
Dean, School of Education
ABSTRACT
ANALYSIS OF THE PSYCHOMETRIC PROPERITES OF TWO DIFFERENT
CONCEPT-MAP ASSESSMENT TASKS
Kenneth James Plummer
Department of Instructional Psychology and Technology
Doctor of Philosophy
The ability to make sense of a wide array of stimuli presupposes the human
tendency to organize information in a meaningful way. Efforts to assess the degree to
which students organize information meaningfully have been hampered by several factors
including the idiosyncratic way in which individuals represent their knowledge either with
words or visually. Concept maps have been used as tools by researchers and educators
alike to assist students in understanding the conceptual interrelationships within a subject
domain. One concept-map assessment in particular known as the construct-a-map task has
shown great promise in facilitating reliable and valid inferences from student concept-map
ratings. With all of its promise, however, the construct-a-map task is burdened with several
rating difficulties. One challenge in particular is that no published rubric has been
developed that accounts for the degree to which individual propositions are important to an
understanding of the overall topic or theme of the map. This study represents an attempt to
examine the psychometric properties of two construct-a-map tasks designed to overcome in
part this rating difficulty.
The reliability of the concept-map ratings was calculated using a person-by-rater-
by-occasion fully crossed design. This design made it possible to use generalizability
theory to identify and estimate the variance in the ratings contributed by the three factors
mentioned, the interaction effects, and unexplained error. The criterion validity of the
concept-map ratings was examined by computing Pearson correlations between concept-
map and essay ratings and concept-map and interview transcript ratings.
The generalizability coefficients for student mean ratings were moderate to very
high: .73 and .94 for the first concept-mapping task and .74 and .87 for the second concept-
mapping task. A relatively large percentage of the rating variability was contributed by the
object of measurement. Both tasks correlated highly with essay and interview ratings: .62
to .81.
ACKNOWLEDGMENTS
I express sincere appreciation to the members of my graduate committee and
particularly my chair, Dr Richard R Sudweeks. Dr. Sudweeks approached me three and
half years ago proposing that we work together on this study. His friendship and mentoring
have inspired not only myself but countless others. I express deep gratitude to my ever
supportive wife, Cecilia Milagros Plummer; my patient children, Ashton, Tanner and
Mckay; and my devoted parents, Roger L. and Linda F. Plummer for their constant
sacrifice and prayers on my behalf. This work is a tribute to their tireless support. I
likewise wish to pay tribute to my Grandfather, Herbert N. Tognazzini for kindling in me a
desire for life-long learning. I am indebted to two dear friends, Dr. Patrick T. Panos and
Dr. Eric P. Rogers, for coming into my life at key moments that made this journey possible.
I express appreciation to Julie M. Brinkerhoff and Laura Jimenez for collaborating with me
for roughly a year and a half on this project. Finally I wish to express my eternal gratitude
for the Divine assistance I have received every step of the way. This experience has been a
wonderfully spiritual as well as intellectual journey.
viii
Table of Contents
List of Tables ...................................................................................................................... xvi
List of Figures .................................................................................................................... xvii
List of Equations ................................................................................................................. xix
Chapter 1: Introduction .......................................................................................................... 1
Concept Maps .................................................................................................................... 1
The Problem....................................................................................................................... 3
Solution.............................................................................................................................. 6
Statement of the Purpose ................................................................................................... 6
Research Questions............................................................................................................ 6
Chapter Organization......................................................................................................... 7
Chapter 2: Literature Review................................................................................................. 9
The Construct of a Person’s Conceptual Framework ........................................................ 9
Concepts......................................................................................................................... 9
Categories .................................................................................................................... 10
Conceptual Framework ................................................................................................ 13
Contemporary Importance ........................................................................................... 14
History of Concept-Map Assessment .............................................................................. 15
Components of Concept-Map Assessments .................................................................... 17
Task.............................................................................................................................. 18
Task Demands.......................................................................................................... 18
Task Constraints....................................................................................................... 19
Content Structures.................................................................................................... 20
ix
Response Format.......................................................................................................... 23
Response Mode........................................................................................................ 23
Response Characteristics ......................................................................................... 24
Mapper ..................................................................................................................... 35
Scoring System ............................................................................................................ 36
Scoring Map Components........................................................................................ 36
Scoring concepts. ................................................................................................. 36
Scoring propositions. ........................................................................................... 37
Scoring map structure .......................................................................................... 43
Scoring examples. ................................................................................................ 45
Comparing Students’ Maps with a Master Map ...................................................... 46
Combination of Strategies ....................................................................................... 46
Holistic Scoring Methods ........................................................................................ 47
Concept-Map Assessment Component Summary ....................................................... 47
Psychometric Properties .................................................................................................. 47
Reliability..................................................................................................................... 48
Classical Test Theory............................................................................................... 50
Stability................................................................................................................ 51
Parallel, alternate or equivalent forms ................................................................. 52
Internal consistency ............................................................................................. 52
Interrater reliability .............................................................................................. 53
Generalizability Theory ........................................................................................... 54
G-study................................................................................................................. 54
x
D-study................................................................................................................. 55
Concept Map Research Using G-Theory................................................................. 56
Validity ........................................................................................................................ 57
Evidence of Content-Related Validity ..................................................................... 58
Evidence of Criterion-Related Validity ................................................................... 60
Evidence of Construct-Related Validity .................................................................. 62
Rationale for the Current Study ....................................................................................... 64
C-Mapping Task .......................................................................................................... 65
Challenges with Scoring C-Mapping Task .................................................................. 65
Solutions Under Investigation...................................................................................... 68
Chapter 3: Method ............................................................................................................... 70
Study Context .................................................................................................................. 70
Participants....................................................................................................................... 70
Instrumentation ................................................................................................................ 71
Concept-Map Measures ............................................................................................... 72
C-mapping Task 1.................................................................................................... 72
C-mapping Task 2.................................................................................................... 73
Criterion Measures....................................................................................................... 73
Essays....................................................................................................................... 73
Task 1................................................................................................................... 73
Task 2................................................................................................................... 74
Interviews................................................................................................................. 74
Rater Training .............................................................................................................. 75
xi
Research Design .............................................................................................................. 76
Student Generated Data ............................................................................................... 76
Rater Generated Data ................................................................................................... 77
Analysis ........................................................................................................................... 79
Research Question 1: Generalizability Study .............................................................. 79
Research Question 2: Generalizability Coefficient...................................................... 80
Research Question 3: D- Study with the Same Design................................................ 80
Research Question 4: D-Study with Different Designs ............................................... 81
Research Question 5: Criterion Validity Study ........................................................... 82
Analysis of Content-Related Validity...................................................................... 82
Analysis of Criterion-Related Validity .................................................................... 83
Procedures........................................................................................................................ 84
Focus on Ends .............................................................................................................. 84
Student Training........................................................................................................... 85
First-Day Training ................................................................................................... 85
Weekly Homework Assignments ............................................................................ 86
Meaningful Feedback............................................................................................... 87
Chapter 4: Results ............................................................................................................... 88
Research Question 1 ........................................................................................................ 88
Exam 1: Task 1 ............................................................................................................ 88
Variance Component for Persons ............................................................................ 88
Variance Component for Rating Occasions............................................................. 89
Variance Components for Raters ............................................................................. 90
xii
Person-by-Occasion Interaction............................................................................... 90
Person-by-Rater Interaction ..................................................................................... 91
Rater-by-Occasion Interaction................................................................................. 91
Residual Variance Component ................................................................................ 91
Exam 1: Task 2 ............................................................................................................ 91
Variance Component for Persons ............................................................................ 91
Error Representing Small Contributions to Total Variability.................................. 92
Exam 2: Task 1 ............................................................................................................ 93
Variance Component for Raters............................................................................... 93
Residual Variance Component ................................................................................ 94
Exam 2: Task 2 ............................................................................................................ 94
Person-by Rater-Interaction and Residual Variance Component ............................ 94
Variance Component for Raters............................................................................... 94
Research Question 2 ........................................................................................................ 95
Research Question 3 ........................................................................................................ 96
Research Question 4 ........................................................................................................ 98
Most Feasible Design for Exam 1 Task 1 .................................................................... 98
Most Feasible Design for Exam 1 Task 2 .................................................................... 99
Most Feasible Design for Exam 2 Task 1 .................................................................... 99
Most Feasible Design for Exam 2 Task 2 .................................................................. 102
Research Question 5 ...................................................................................................... 103
Proposition Similarity between Concept-Map and Criterion Measures .................... 103
Exam 1: Task 1 ...................................................................................................... 105
xiii
Concept maps and essays................................................................................... 105
Concept maps and interviews ............................................................................ 105
Exam 1: Task 2 ...................................................................................................... 110
Concept maps and essays................................................................................... 110
Concept maps and interviews ............................................................................ 111
Exam 2: Task 1 .......................................................................................................... 113
Concept maps and essays................................................................................... 113
Concept maps and interviews. ........................................................................... 115
Exam 2: Task 2 ...................................................................................................... 117
Concept maps and essays................................................................................... 117
Concept maps and interviews ............................................................................ 119
Chapter 5: Conclusions and Recommendations ............................................................... 122
Research Question 1 ...................................................................................................... 122
Object of measurement .............................................................................................. 122
Constrained C-mapping Task ................................................................................ 122
Open C-mapping Task ........................................................................................... 122
Other Sources of Measurement Error ........................................................................ 123
Rater Error ............................................................................................................. 123
Person-by-rater Interaction .................................................................................... 125
Contributions to the Field .......................................................................................... 126
Research Question 2 ...................................................................................................... 128
Research Question 3 ...................................................................................................... 129
Research Question 4 ...................................................................................................... 129
xiv
Research Question 5 ...................................................................................................... 129
Understanding of the Scoring Elements .................................................................... 130
Different Task Constraints ......................................................................................... 131
Constraints Impacted by Assessment Conventions ............................................... 131
Constraints Not Impacted by Assessment Conventions ........................................ 132
Study Contributions ....................................................................................................... 133
Future Research ............................................................................................................. 134
An Appropriate Methodology.................................................................................... 134
Content Domain ..................................................................................................... 135
Familiarity with the Scoring Elements .................................................................. 136
Criterion Measures................................................................................................. 137
Robust Rubric ............................................................................................................ 137
Summary........................................................................................................................ 138
References.......................................................................................................................... 139
Appendix A........................................................................................................................ 147
Appendix B ........................................................................................................................ 150
Appendix C ........................................................................................................................ 152
Appendix D........................................................................................................................ 154
Appendix E ........................................................................................................................ 156
Appendix F......................................................................................................................... 158
Appendix G........................................................................................................................ 160
Appendix H........................................................................................................................ 162
Appendix I ......................................................................................................................... 164

xv
Appendix J ......................................................................................................................... 166
Appendix K........................................................................................................................ 168
Appendix L ........................................................................................................................ 170
Appendix M ....................................................................................................................... 190
xvi
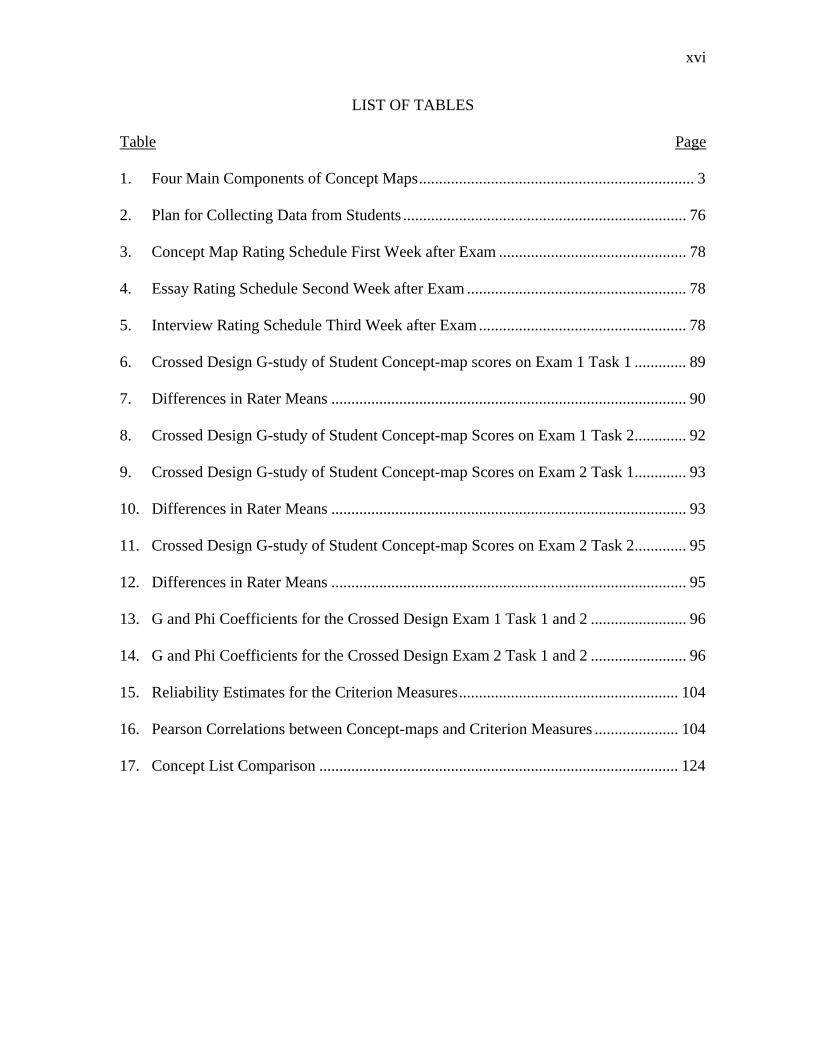
LIST OF TABLES
Table Page
1. Four Main Components of Concept Maps..................................................................... 3
2. Plan for Collecting Data from Students ....................................................................... 76
3. Concept Map Rating Schedule First Week after Exam ............................................... 78
4. Essay Rating Schedule Second Week after Exam ....................................................... 78
5. Interview Rating Schedule Third Week after Exam.................................................... 78
6. Crossed Design G-study of Student Concept-map scores on Exam 1 Task 1 ............. 89
7. Differences in Rater Means ......................................................................................... 90
8. Crossed Design G-study of Student Concept-map Scores on Exam 1 Task 2............. 92
9. Crossed Design G-study of Student Concept-map Scores on Exam 2 Task 1............. 93
10. Differences in Rater Means ......................................................................................... 93
11. Crossed Design G-study of Student Concept-map Scores on Exam 2 Task 2............. 95
12. Differences in Rater Means ......................................................................................... 95
13. G and Phi Coefficients for the Crossed Design Exam 1 Task 1 and 2 ........................ 96
14. G and Phi Coefficients for the Crossed Design Exam 2 Task 1 and 2 ........................ 96
15. Reliability Estimates for the Criterion Measures....................................................... 104
16. Pearson Correlations between Concept-maps and Criterion Measures ..................... 104
17. Concept List Comparison .......................................................................................... 124
xvii
LIST OF FIGURES
Figure Page
1. Example of a concept map............................................................................................. 2
2. Example of a hierarchical map. ................................................................................... 21
3. Example of a chain map............................................................................................... 22
4. Select-the-link assessment. .......................................................................................... 25
5. Select-the-node assessment.......................................................................................... 26
6. Select-the-link and node assessment............................................................................ 27
7. Fill-in-the-link assessment. .......................................................................................... 28
8. Fill-in-the-node assessment. ........................................................................................ 29
9. Fill-in-the-link and node assessment. .......................................................................... 30
10. Assembling concepts and linking phrases assessment................................................. 31
11. List of concepts provided assessment. ......................................................................... 32
12. Construct-a-map from scratch assessment................................................................... 33
13. Construct-a-heirarchical-map. ..................................................................................... 34
14. A concept map demonstrating link complexity. .......................................................... 40
15. Degree of task directedness and the reliability of ratings. ........................................... 49
16. More-knowledgeable student’s map. ........................................................................... 67
17. Less-knowledgeable student’s map. ............................................................................ 67
18. Raters nested within occasion crossed with person. .................................................... 81
19. Two raters nested within person crossed with occasion. ............................................. 82
20. Four raters nested within person crossed with occasion.............................................. 82
21. Projected reliability of relative decisions from exam 1 tasks 1 and 2. ........................ 97
xviii
22. Projected reliability of relative decisions from exam 2 tasks 1 and 2. ........................ 98
23. Projected reliability for person by two raters nested within occasion design ........... 100
24. Projected reliability of two raters nested within person-by-occasion design. ........... 101
25. Projected reliability of four raters nested within person-by-occasion design............ 102
26. Student Y exam 1 task 1 concept map. ...................................................................... 106
27. Student Y exam 1 task 1 essay................................................................................... 107
28. Student Y exam 1 task 1 concept map. ...................................................................... 108
29. Student Y exam 1 task 1 interview transcript. ........................................................... 109
30. Student Y exam 1 task 2 concept map. ...................................................................... 110
31. Student Y exam 1 task 2 essay................................................................................... 111
32. Student Y exam 1 task 2 concept map. ...................................................................... 112
33. Student Y exam 1 task 2 interview transcript. ........................................................... 113
34. Student Z exam 2 task 1 concept map. ...................................................................... 114
35. Student Z exam 2 task 1 essay. .................................................................................. 115
36. Student Z exam 2 task 1 concept map. ...................................................................... 116
37. Student Z exam 2 task 1 interview transcript............................................................. 117
38. Student Z exam 2 task 2 concept map. ...................................................................... 120
39. Student Z exam 2 task 2 interview transcript............................................................. 121

xix
LIST OF EQUATIONS
Equation Page
1. Observed Score Component Parts with Classical Test Theory ............................... 50
2. Variance Decomposed into Component Parts with G-Theory ................................ 54
1
CHAPTER 1: INTRODUCTION
Dissatisfaction with traditional forms of assessment has led many educators to
seek alternative ways to reliably and validly assess student conceptual understanding.
Many traditional assessments such as multiple choice, alternative response, matching,
short answer, and so on can be reliably scored but often test recall or recognition of facts
without regard to how students organize these facts or concepts within a larger
conceptual framework (Ruiz-Primo & Shavelson, 1996).
Those assessments that have the potential to measure the degree of student
conceptual-framework organization, such as essays or interviews, can be time consuming
to administer and to evaluate (Brussow, 2004). Concept maps provide an alternative to
these traditional assessments.
Concept Maps
While concepts maps have been recommended as a useful means of assessing
student-organized understanding, they have generally been used more for instructional
rather than for assessment purposes. Ruiz-Primo, Shavelson, Li, and Schultz (2001) state
that concept maps “follow from the notion that concept interrelatedness is an essential
property of knowledge” (p. 101). They go on to explain that concept maps also follow
from the notion that concept interrelatedness is likewise an important aspect of
competence in a domain or discipline.
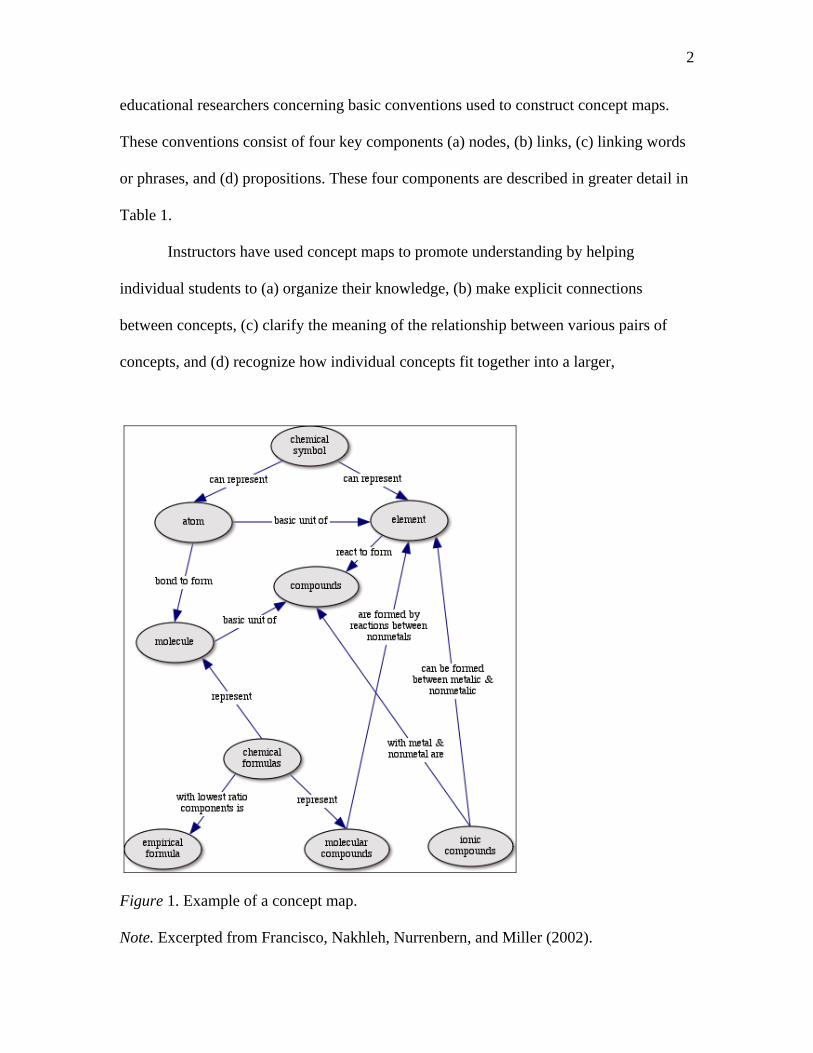
A concept map is a graphic representation intended to reveal a student’s
understanding of how the concepts within a content domain are interrelated. An example
of a concept map is shown in Figure 1. Since concept mapping was first introduced by
Joseph D. Novak and his colleagues during the 1970s a consensus has evolved among
2
educational researchers concerning basic conventions used to construct concept maps.
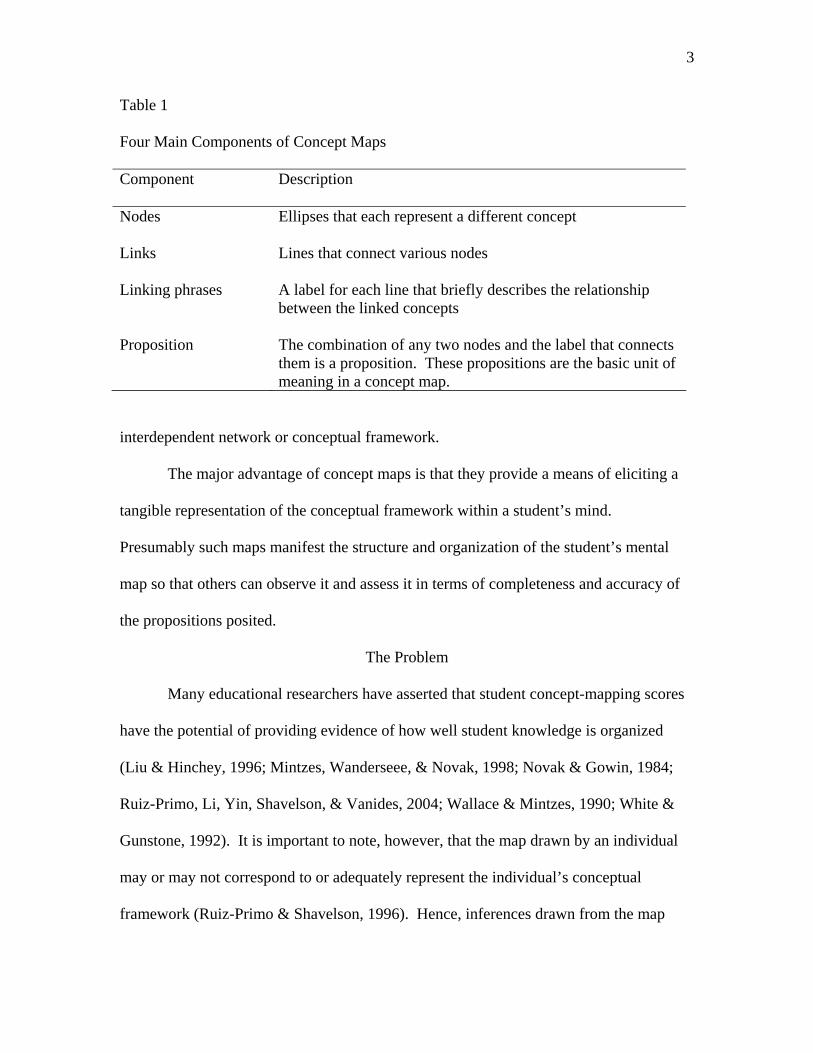
These conventions consist of four key components (a) nodes, (b) links, (c) linking words
or phrases, and (d) propositions. These four components are described in greater detail in
Table 1.
Instructors have used concept maps to promote understanding by helping
individual students to (a) organize their knowledge, (b) make explicit connections
between concepts, (c) clarify the meaning of the relationship between various pairs of
concepts, and (d) recognize how individual concepts fit together into a larger,
Figure 1. Example of a concept map.
Note. Excerpted from Francisco, Nakhleh, Nurrenbern, and Miller (2002).
3
Table 1
Four Main Components of Concept Maps
Component Description
Nodes
Ellipses that each represent a different concept
Links
Lines that connect various nodes
Linking phrases A label for each line that briefly describes the relationship between the linked concepts
Proposition The combination of any two nodes and the label that connects them is a proposition. These propositions are the basic unit of meaning in a concept map.
interdependent network or conceptual framework.
The major advantage of concept maps is that they provide a means of eliciting a
tangible representation of the conceptual framework within a student’s mind.
Presumably such maps manifest the structure and organization of the student’s mental
map so that others can observe it and assess it in terms of completeness and accuracy of
the propositions posited.
The Problem
Many educational researchers have asserted that student concept-mapping scores
have the potential of providing evidence of how well student knowledge is organized
(Liu & Hinchey, 1996; Mintzes, Wanderseee, & Novak, 1998; Novak & Gowin, 1984;
Ruiz-Primo, Li, Yin, Shavelson, & Vanides, 2004; Wallace & Mintzes, 1990; White &
Gunstone, 1992). It is important to note, however, that the map drawn by an individual
may or may not correspond to or adequately represent the individual’s conceptual
framework (Ruiz-Primo & Shavelson, 1996). Hence, inferences drawn from the map
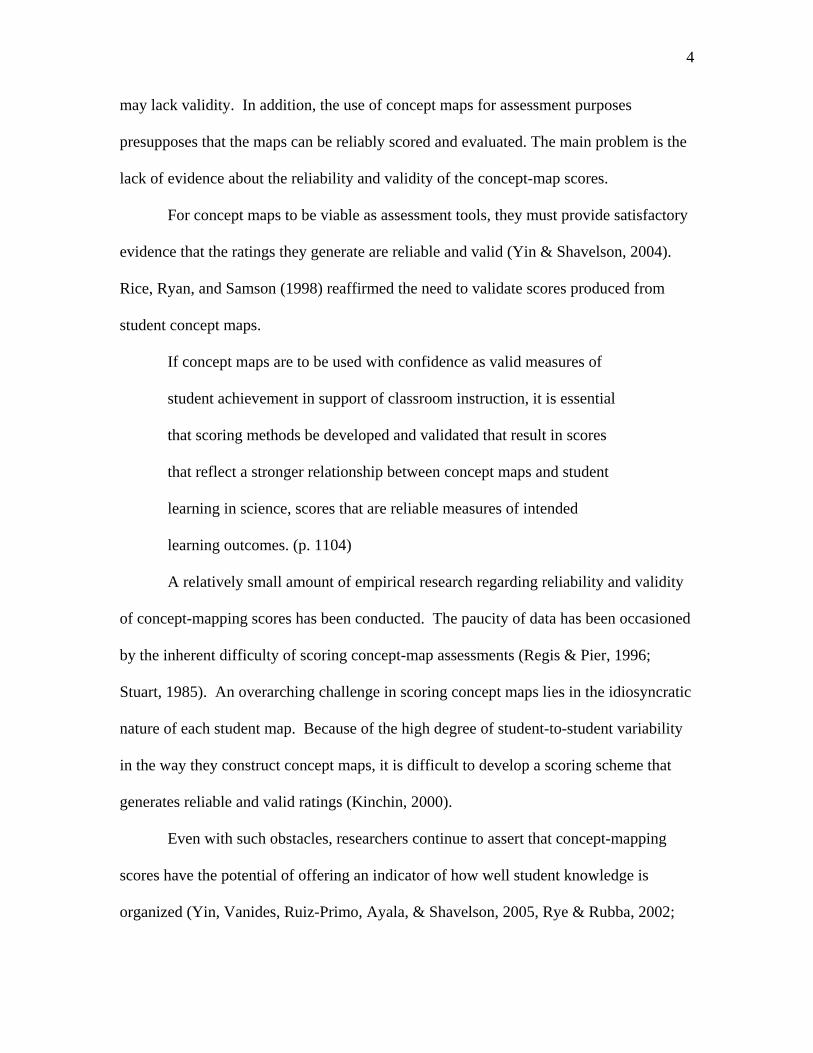
4
may lack validity. In addition, the use of concept maps for assessment purposes
presupposes that the maps can be reliably scored and evaluated. The main problem is the
lack of evidence about the reliability and validity of the concept-map scores.
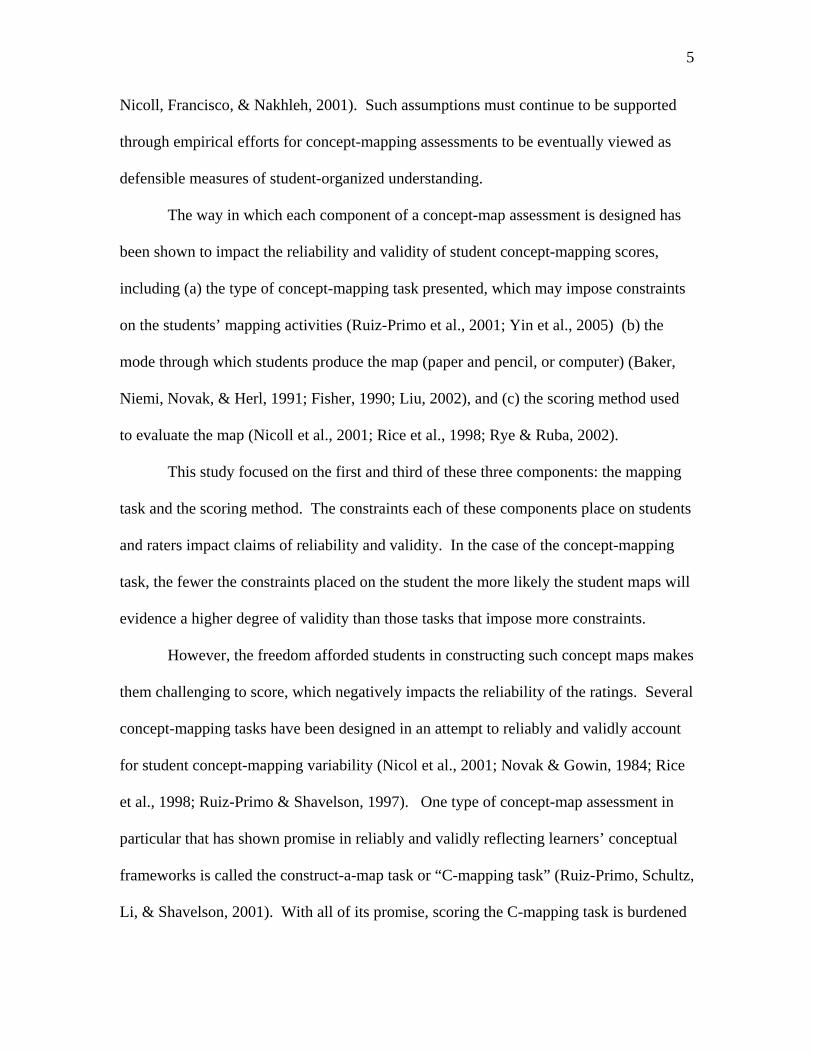
For concept maps to be viable as assessment tools, they must provide satisfactory
evidence that the ratings they generate are reliable and valid (Yin & Shavelson, 2004).
Rice, Ryan, and Samson (1998) reaffirmed the need to validate scores produced from
student concept maps.
If concept maps are to be used with confidence as valid measures of
student achievement in support of classroom instruction, it is essential
that scoring methods be developed and validated that result in scores
that reflect a stronger relationship between concept maps and student
learning in science, scores that are reliable measures of intended
learning outcomes. (p. 1104)
A relatively small amount of empirical research regarding reliability and validity
of concept-mapping scores has been conducted. The paucity of data has been occasioned
by the inherent difficulty of scoring concept-map assessments (Regis & Pier, 1996;
Stuart, 1985). An overarching challenge in scoring concept maps lies in the idiosyncratic
nature of each student map. Because of the high degree of student-to-student variability
in the way they construct concept maps, it is difficult to develop a scoring scheme that
generates reliable and valid ratings (Kinchin, 2000).
Even with such obstacles, researchers continue to assert that concept-mapping
scores have the potential of offering an indicator of how well student knowledge is
organized (Yin, Vanides, Ruiz-Primo, Ayala, & Shavelson, 2005, Rye & Rubba, 2002;
5
Nicoll, Francisco, & Nakhleh, 2001). Such assumptions must continue to be supported
through empirical efforts for concept-mapping assessments to be eventually viewed as
defensible measures of student-organized understanding.
The way in which each component of a concept-map assessment is designed has
been shown to impact the reliability and validity of student concept-mapping scores,
including (a) the type of concept-mapping task presented, which may impose constraints
on the students’ mapping activities (Ruiz-Primo et al., 2001; Yin et al., 2005) (b) the
mode through which students produce the map (paper and pencil, or computer) (Baker,
Niemi, Novak, & Herl, 1991; Fisher, 1990; Liu, 2002), and (c) the scoring method used
to evaluate the map (Nicoll et al., 2001; Rice et al., 1998; Rye & Ruba, 2002).
This study focused on the first and third of these three components: the mapping
task and the scoring method. The constraints each of these components place on students
and raters impact claims of reliability and validity. In the case of the concept-mapping
task, the fewer the constraints placed on the student the more likely the student maps will
evidence a higher degree of validity than those tasks that impose more constraints.
However, the freedom afforded students in constructing such concept maps makes
them challenging to score, which negatively impacts the reliability of the ratings. Several
concept-mapping tasks have been designed in an attempt to reliably and validly account
for student concept-mapping variability (Nicol et al., 2001; Novak & Gowin, 1984; Rice
et al., 1998; Ruiz-Primo & Shavelson, 1997). One type of concept-map assessment in
particular that has shown promise in reliably and validly reflecting learners’ conceptual
frameworks is called the construct-a-map task or “C-mapping task” (Ruiz-Primo, Schultz,
Li, & Shavelson, 2001). With all of its promise, scoring the C-mapping task is burdened
6
with a few rating difficulties. One fundamental problem is that most rubrics used with
the C-mapping task have been designed to rate only the accuracy and completeness of the
links in students’ maps. By focusing only on these two rating elements, less
kowledgeable students have been shown to receive higher ratings than more
knowledgeable students (Kinchin, 2000; Yin, Vanides, Ruiz-Primo, Ayala, & Shavelson,
2005).
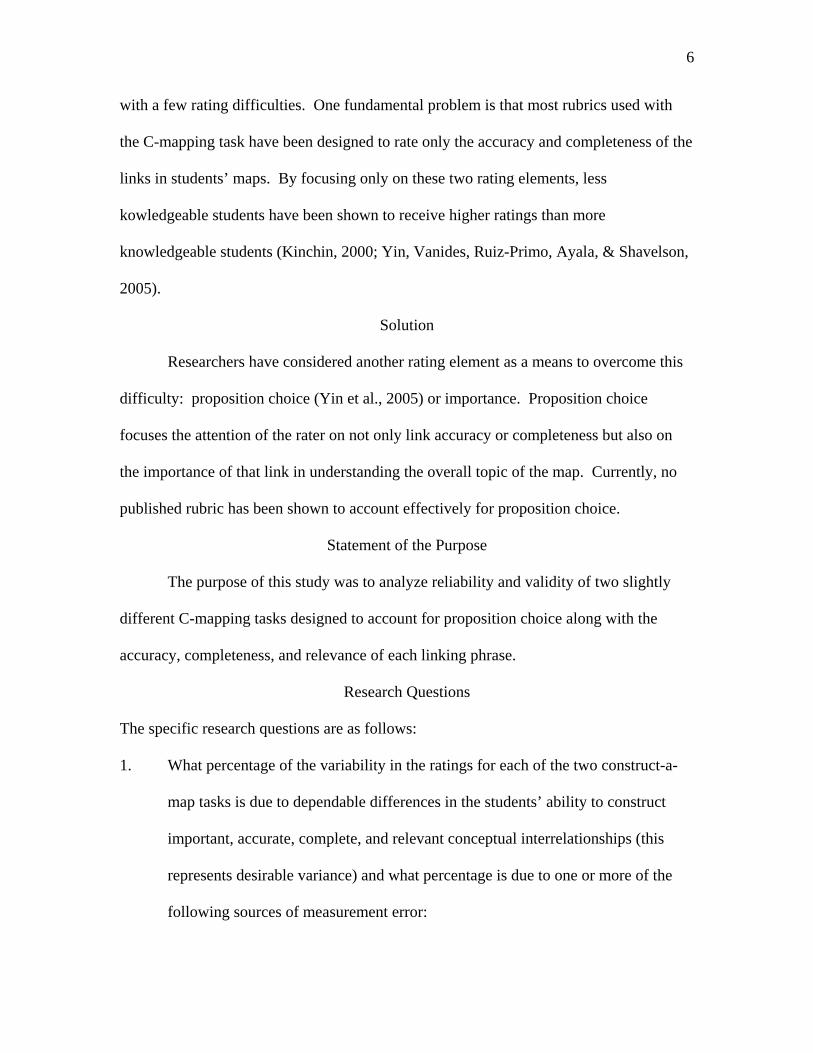
Solution
Researchers have considered another rating element as a means to overcome this
difficulty: proposition choice (Yin et al., 2005) or importance. Proposition choice
focuses the attention of the rater on not only link accuracy or completeness but also on
the importance of that link in understanding the overall topic of the map. Currently, no
published rubric has been shown to account effectively for proposition choice.
Statement of the Purpose
The purpose of this study was to analyze reliability and validity of two slightly
different C-mapping tasks designed to account for proposition choice along with the
accuracy, completeness, and relevance of each linking phrase.
Research Questions
The specific research questions are as follows:
1. What percentage of the variability in the ratings for each of the two construct-a-
map tasks is due to dependable differences in the students’ ability to construct
important, accurate, complete, and relevant conceptual interrelationships (this
represents desirable variance) and what percentage is due to one or more of the
following sources of measurement error:
7
a. inconsistencies between raters,
b. inconsistencies across rating occasions,
c. inconsistencies described by the 3 two-way interactions that can be estimated
from the two-facet, fully crossed design,
d. unexplained error that cannot be attributed to any of the identified sources?
2. How does the reliability of the mean ratings of student’s conceptual
understanding generated by one rater on one occasion compare across the two
scoring methods?
3. How would the reliability of the mean ratings obtained from each method be
increased or decreased by varying the number of raters and rating occasions?
4. How would the reliability be affected by using a more economical design that
does not necessitate having each rater rate every map on every rating occasion?
5. How successfully do the concept-map ratings distinguish between students whose
essays and/or interviews show evidence of important, accurate, complete, and
relevant understanding of conceptual interrelationships and those students who do
not exhibit this degree of understanding?
Chapter Organization
As is the case with most educational research, researchers have the complex task
of studying aspects of instruction, learning, and assessment as they interact with one
another in complex human environments (Cobb, Confrey, di Sessa, Lehrer, & Schauble,
2003). These interactions are of sufficient complexity that it is difficult to construct an
air-tight study that accounts a priori for all of these interacting factors. Another level of
8
complexity was added to this study since concept-map assessments are unfamiliar to most
students and educators in traditional learning environments.
With this challenge in mind the author decided to conduct a pilot study that would
inform the design and implementation of the main study. The lessons learned in the pilot
study and the efforts to make changes to account for these lessons learned are
documented. The organization of the study proceeds as follows: Chapter 2 establishes
the literary support for the foundational assumptions and theoretical framework guiding
this study, chapter 3 lays out the method employed in the study, chapter 4 reports the
results, and chapter 5 presents discussion points along with recommendations for future
studies.
9
CHAPTER 2: LITERATURE REVIEW
This chapter builds a case for the use of concept maps in assessing student
conceptual frameworks by providing a review of the construct concept maps are designed
to target and by highlighting various concept-mapping assessment topics. These topics
include (a) the historical development of concept-map assessments, (b) a framework
outlining concept-map assessment component parts, and (c) the psychometric properties
of concept-map assessment ratings. A rationale is then laid out as to how the current
study draws on and contributes to the concept-mapping assessment literature.
The Construct of a Person’s Conceptual Framework
A rationale for the construct of students’ conceptual frameworks that concept
maps supposedly target is considered in this section. Working definitions and instances
of what constitutes a concept and a conceptual framework are presented along with a
description of the degree of importance contemporary educational researchers place on
organized understanding as it relates to the acquisition of knowledge.
Concepts
A concept is a mental representation of a category (Anglin, 1977; Howard, 1987;
Klausmeier, 1990, 1992; Medin & Smith, 1984; Merrill & Tennyson, 1977; Murphy,
2002; Smith & Medin, 1981; Tennyson & Park, 1980). The category referenced by a
concept may be a set of any of the following:
1. Objects that share some common characteristics (e.g., chemicals, clothing,
enthymemes, euphemisms, gravel, idioms, islands, medicines, metaphors, myths,
parables, planets, poetry, polygons, proteins, sheep, syllogisms, vehicles, and
vitamins)
10
2. Events (e.g., earthquakes, elections, experiments, explosions, floods, games, wars,
accidents, holidays, recesses, robberies, hunting seasons, or filing deadlines)
3. Actions or activities (e.g., singing, dancing, bluffing, joking, filibustering, voting,
washing, mocking, paraphrasing, plagiarizing, procrastinating, questioning, or
teasing)
4. Processes (e.g., digestion, photosynthesis, oxidation, evaporation, long division
hypothesis testing, judicial review, gerrymandering, and oblique factor rotation)
5. Roles (e.g., teacher, principal, plaintiff, defendant, referee, legislator, mediator
victim, partner, predator, supervisor, employer, tourist, or immigrant)
6. Relationships (e.g., above, behind, close, next to, inside of, shorter than, equal to,
cousin, uncle, spouse, grandparent, dependent clause, subordinating conjunction,
and covariate)
7. Situations or conditions (e.g., wet, frozen, empty, inert, asleep, sick, unemployed,
bankrupt, incarcerated, monopoly, recession, retired, dictatorship, democracy, or
anarchy)
8. Hypothetical constructs (e.g., atoms, electrons, genes, imaginary numbers,
sampling error, standard error of the mean, achievement motivation, curiosity,
hypocrisy, and inferiority complex).
Categories
The types of categories listed above overlap somewhat. Hence, some concepts
listed as activities may also be processes, some roles may also be relationships, and some
relationships may also be situations or conditions. Nevertheless, these eight types
illustrate the point that the concept of a concept includes a broad range of different types.
11
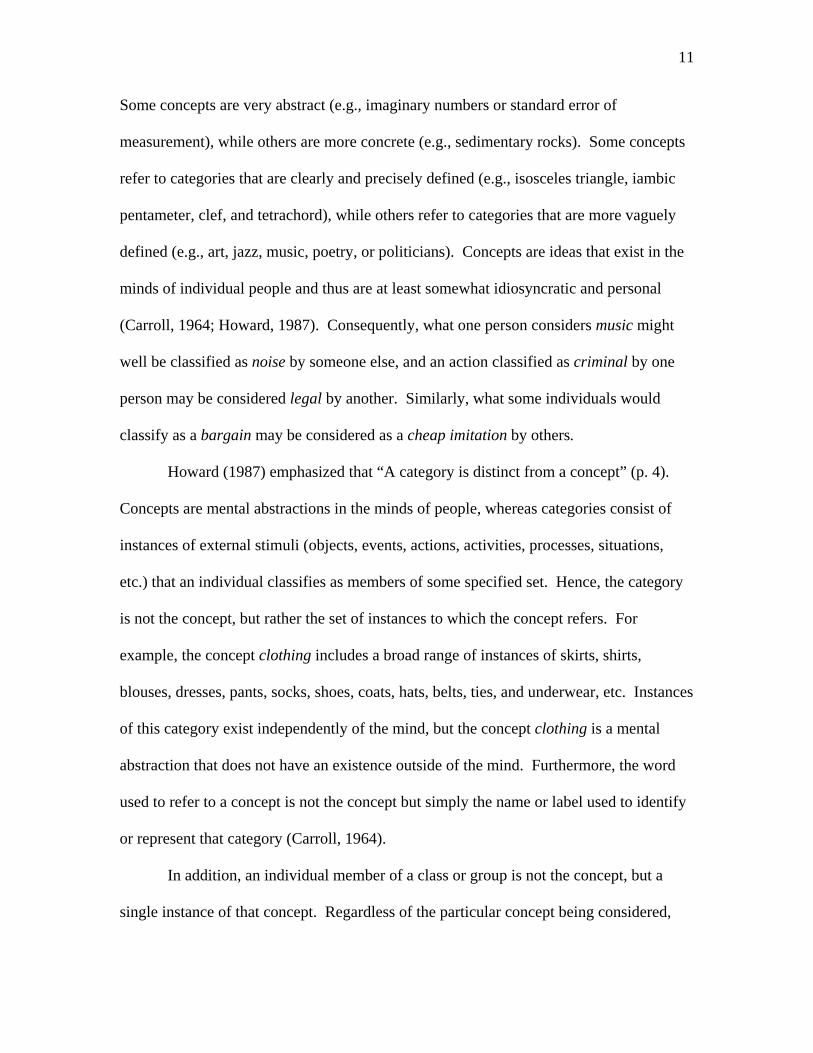
Some concepts are very abstract (e.g., imaginary numbers or standard error of
measurement), while others are more concrete (e.g., sedimentary rocks). Some concepts
refer to categories that are clearly and precisely defined (e.g., isosceles triangle, iambic
pentameter, clef, and tetrachord), while others refer to categories that are more vaguely
defined (e.g., art, jazz, music, poetry, or politicians). Concepts are ideas that exist in the
minds of individual people and thus are at least somewhat idiosyncratic and personal
(Carroll, 1964; Howard, 1987). Consequently, what one person considers music might
well be classified as noise by someone else, and an action classified as criminal by one
person may be considered legal by another. Similarly, what some individuals would
classify as a bargain may be considered as a cheap imitation by others.
Howard (1987) emphasized that “A category is distinct from a concept” (p. 4).
Concepts are mental abstractions in the minds of people, whereas categories consist of
instances of external stimuli (objects, events, actions, activities, processes, situations,
etc.) that an individual classifies as members of some specified set. Hence, the category
is not the concept, but rather the set of instances to which the concept refers. For
example, the concept clothing includes a broad range of instances of skirts, shirts,
blouses, dresses, pants, socks, shoes, coats, hats, belts, ties, and underwear, etc. Instances
of this category exist independently of the mind, but the concept clothing is a mental
abstraction that does not have an existence outside of the mind. Furthermore, the word
used to refer to a concept is not the concept but simply the name or label used to identify
or represent that category (Carroll, 1964).
In addition, an individual member of a class or group is not the concept, but a
single instance of that concept. Regardless of the particular concept being considered,
12
the members of that category are presumed to share sufficient similarities to warrant
classifying them as ostensibly equivalent in spite of their uniqueness and differences. As
explained by Bruner, Goodnow, and Austin (1956), “to categorize is to render
discriminably different things [as if they were] equivalent, to group the objects and events
around us into classes, and to respond to them in terms of their class membership rather
than their uniqueness” (p. 1).
People start learning concepts from the time they are babies and continue
clarifying, refining, and extending these concepts and learning additional concepts
throughout their lives. Much of formal schooling is devoted to helping students identify
and revise misconceptions they may have developed and helping them to acquire new
concepts.
One advantage of the ability to categorize objects, events, processes, and
situations, etc. by using concepts is the cognitive economy that it provides an individual
(Rosch, 1978). Without this ability, Bruner et al. (1956) assert that humans would be
“slaves to the particular” (p. 1) and unable to cope with the broad diversity of their
everyday experience. Medin and Ross (1992) elaborated on this idea in the following
statement:
Without categories we would be unable to make any sense of our
experience or to profit from it. If each thing we encountered was
totally unique and unlike anything else we had ever known, we would
not know how to react to it or make any useful predictions about its
properties. We would be literally lost in a sea of new experiences,
helpless to employ any of our prior knowledge to navigate. (p. 362)
13
Another advantage of concepts is that they provide individuals with ideas to think
with as they engage in categorical reasoning, rule using, problem solving, predicting
future events, and many other forms of thinking (Klausmeier, 1992). A third advantage of
concepts is that persons who have acquired some basic concepts are able to use those
already acquired concepts to learn new concepts. For instance, a student who does not
understand the concepts variance and matrix is unlikely to understand the concept of an
eigenvalue. But a student who already understands variance and matrix can readily learn
what an eigenvalue is.
Conceptual Framework
Concepts generally do not exist in isolation (Jahnke & Nowaczyk, 1998; Lawson,
1995). Rather, they typically exist in clusters, networks, or systems of interrelated
concepts that are organized in some manner. Howard (1987) declared that “All the
concepts a person knows ultimately connect to each other in a maze of taxonomies,
partonomies and other structures. All this knowledge constitutes a person’s cognitive
structure” (p. 11; italics in original).
Other psychologists and cognitive scientists have used the term cognitive
structure to refer to the manner in which knowledge may be represented in the mind of
the knower (Ausubel, 1963). This term refers more to a virtual structure rather than to a
physical configuration. The use of cognitive structure is not meant to suggest that some
sort of physiological edifice actually exists in people’s minds. What it is meant to suggest
is that the process of learning new concepts involves relating them to previously acquired
concepts, making connections between the new concepts, and organizing the set by
linking them together in an integrated manner. This helps the learner understand the
14
nature of the various relationships and how the various components fit together into a
meaningful whole (Ausubel, 1968). Some researchers refer to such clusters of
interrelated concepts as schema or schemata. Others describe them as conceptual
frameworks or semantic networks (Fisher, 2000). Regardless of the label used, these
cognitive structures are not directly observable and their existence can only be inferred.
Contemporary Importance
As evidence of how fundamental the construct of organized understanding or
knowledge is viewed by foremost educational researchers in the United States, several
conclusions regarding its importance are cited here as reported in the book How People
Learn (Bransford, Brown, & Cocking, 2000). This work, published by the National
Research Council (NRC), reports the work of two committees organized by the NRC to
find ways of improving instruction in schools by more closely linking classroom practice
to the findings of research about how humans learn. The two committees included (a) the
Commitee on Developments in the Science of Learning, and (b) the Committee on
Learning Research and Educational Practice. The first committee focused on the results
of research about the nature of human learning and how it occurs. Based on the work of
the first committee, the second committee formulated recommendations for changing
classroom practice to more closely conform to the findings of research regarding factors
that facilitate learning. In the next-to-the last chapter, the editors cite numerous
conclusions reached by the two committees. Four of these conclusions are cited below:
1. “Learning with understanding is more likely to promote transfer than simply
memorizing information from a text or a lecture” (p. 236).
15
2. “Transfer and wide application of learning are most likely to occur when learners
achieve an organized and coherent understanding of the material” (p. 238).
3. “Effective comprehension and thinking require a coherent understanding of the
organizing principles in any subject matter” (p. 238).
4. “Different domains of knowledge, such as science, mathematics, and history, have
different organizing properties. It follows, therefore, that to have an in depth grasp
of an area requires knowledge about both the content of the subject and the
broader organization of the subject” (pp. 237-238).
The first of these four conclusions refers to advantages that learners are presumed
to obtain if they acquire understanding. The last three conclusions all make reference to
the idea that understanding includes knowledge that is organized in some meaningful
manner.
History of Concept-Map Assessment
With this theoretical foundation in mind, the section that follows focuses on the
history of concept-map assessments and the rationale for their use in tapping the
construct or trait of organized knowledge.
In the early 1970s Joseph Novak and his colleagues pursued questions regarding
children’s acquisition and use of scientific concepts. In the course of their efforts, they
became dissatisfied with how functionally limiting traditional test questions, such as
multiple-choice and short-answer test items, were in validly measuring student
knowledge. They found that student responses to these traditional items in many
instances demonstrated little correspondence between the correct answers the students
16
selected and the meaning they expressed in subsequent interviews (Novak & Gowin,
1984).
As they considered the process by which young children acquire concepts, it
became increasingly apparent that children acquire an understanding of concepts by
degrees. For example, a child’s concept of a dog at first may have an exclusive
relationship with the concept four legs. The resulting propositional link (an expression
describing the relationship between two concepts) would read dogs have four legs. Based
on this conceptual connection, when a child sees other four-legged creatures such as a
cow or a horse, he or she may mistakenly call them a dog. Over time, however,
relationships are established between the concept dog and other unique concepts such as
bark or fetch, while at the same time these new concepts are noted to have no relationship
with the concept cow or horse. Novak’s group hypothesized that children develop an
understanding of the meaning of a concept by degrees as they acquire “a growing set of
propositional linkages between the concept of central concern and other related concepts”
(Novak & Gowin, 1984, p. 94).
They concluded that they could not document the changes in a student’s
conceptual understanding over time unless they could design a way to capture those
changes in a student’s cognitive structure, which they asserted consists of a series of
interconnected propositional links. One of Novak’s former research assistants, Richard
Rowell, derived concept maps from the transcripts of clinical interviews he had
conducted. Once constructed, he analyzed the concept maps for meaningful linkages
between related concepts (Novak & Gowin, 1984). Through this and other research
efforts concept maps began to be used not only as instructional but also as evaluative
17
tools. Since that time research has continued through the last thirty years examining
various uses of concept-map assessments as a measure of a student’s conceptual
framework.
Components of Concept-Map Assessments
From the 1980s on into the 1990s concept-map assessment research dealt with
challenges related mostly to the reliability and to a much lesser extent the case for
validity of student concept-map ratings. Ruiz-Primo and Shavelson (1996)
conceptualized a framework that decomposed concept-map assessments into discrete and
overlapping component parts. This framework characterizes a concept map-assessment
as “(a) a task that invites students to provide evidence bearing on their knowledge
structure in a domain, (b) a format for the students’ response, and (c) scoring system by
which students’ concept maps can be evaluated accurately and consistently” (p. 573).
Ruiz-Primo and Shavelson (1996) claimed that without any one of these three
components a concept-map assessment could not be considered an assessment. This
framework has served as a guide for many researchers since its inception, including work
done by Jacobs-Lawson (2001), McClure, Sonak, and Suen (1999), Rice et al. (1998),
Rye and Rubba (2002), West, Park, Pomeroy, and Sandoval (2002), Yin et al. (2005), etc.
In the section that follows, each concept-mapping assessment component from
this framework is defined and illustrated. Studies where research questions have dealt
with one or multiple aspects of these components are described as well. This section
draws heavily on work done by Ruiz-Primo and Shavelson (1996).
18
Task
The first component of a concept-map assessment is a task that invites students to
provide evidence of their knowledge structure in a domain. According to Ruiz-Primo and
Shavelson (1996), a concept-mapping assessment task is composed of three variables:
task demands, task constraints, and content structures. All variations stemming from
these three elements could produce over a thousand different concept-map assessments.
Task Demands
A task demand constitutes the demand placed on students in constructing their
concept maps. For example, a student may be directed to construct a map from scratch,
meaning they are given a blank piece of paper and a main topic and asked to connect all
of the key concepts subsumed under that topic. Such a task would be more cognitively
demanding compared to other tasks where more prompts are presented (Lomask, Baron,
Greig, & Harrison, 1992). Students may be directed to sort a series of words representing
concepts on cards based on the strength of their conceptual association or demonstrate the
hierarchical structure of concepts with most inclusive at the top and least inclusive at the
bottom (White & Gunstone, 1992). The task is more or less demanding based on the
degree to which the activity taxes students working memory.
The nature of the task demands has implications for many aspects of concept-map
assessing activities including feasibility of administration and analysis as well as the
reliability and validity of the resulting ratings. For example, if concept maps are to be
used feasibly for large-scale assessment either a way would need to be devised to
machine score them or resources expended to hire raters to rate them. Cognizant of this
issue Ruiz-Primo et al. (2001) compared two mapping tasks, the first to be scored by
19
machine and the second requiring rater-mediated scoring, to see if they were equivalent.
Unfortunately for those looking to use concept-map assessments in large-scale testing,
they found that the automated scores in many instances were more an artifact of students’
ability to strategize (i.e., process of elimination) than their understanding of how the
concepts were interrelated. The task demands imposed by these two mapping tasks were
found to be different. The authors hypothesized that different prompts and directions
provided in each task caused students to draw upon different cognitive processes.
Few studies have been conducted studying the impact of task demands on the
reliability and validity of concept-map assessments. Those studies that have been
conducted include the comparison of two concept-mapping tasks (Yin et al., 2005; Ruiz-
Primo et al., 2004; Ruiz-Primo et al., 2001), and hierarchical versus nonhierarchical
concept-mapping task directions (Ruiz-Primo et al., 1997).
Task Constraints
Task constraints refer to the restrictiveness of the task. For example, a task that
directs students to construct a hierarchical map would be more restrictive than a task that
provides students the freedom to choose between constructing a hierarchical and a
nonhierarchical map. As another example, a task that provides linking phrases is more
restrictive than a task that directs students to create their own linking phrases.
On the surface it may appear that task constraints and task demands are
essentially the same. However, task constraints may or may not be impacted by the
nature of the task demands. In some instances they may have an inverse relationship.
One mapping task may be more restrictive and less demanding at the same time. A task
that directs students to construct a map from a topic would be less restrictive and more
20
demanding than a task that directs students to construct a map from a list of concepts. In
other instances the degree of restrictiveness and task demands may be highly correlated.
For example, in the study conducted by Ruiz-Primo et al. (2001) cited earlier, one might
expect the automated-scoring technique, while more restrictive, to be less demanding
than the rater-mediated mapping task. However, researchers found that students tended
to take time to monitor their answers more carefully on the more restrictive task than the
less restrictive task. With the restrictive task students tended to engage in a trial-and-
error process not engaged in with the less restrictive task.
Content Structures
According to Ruiz-Primo and Shavelson (1996), “Task content structures refers to
the intersection of the task demands and constraints with the structure of the subject
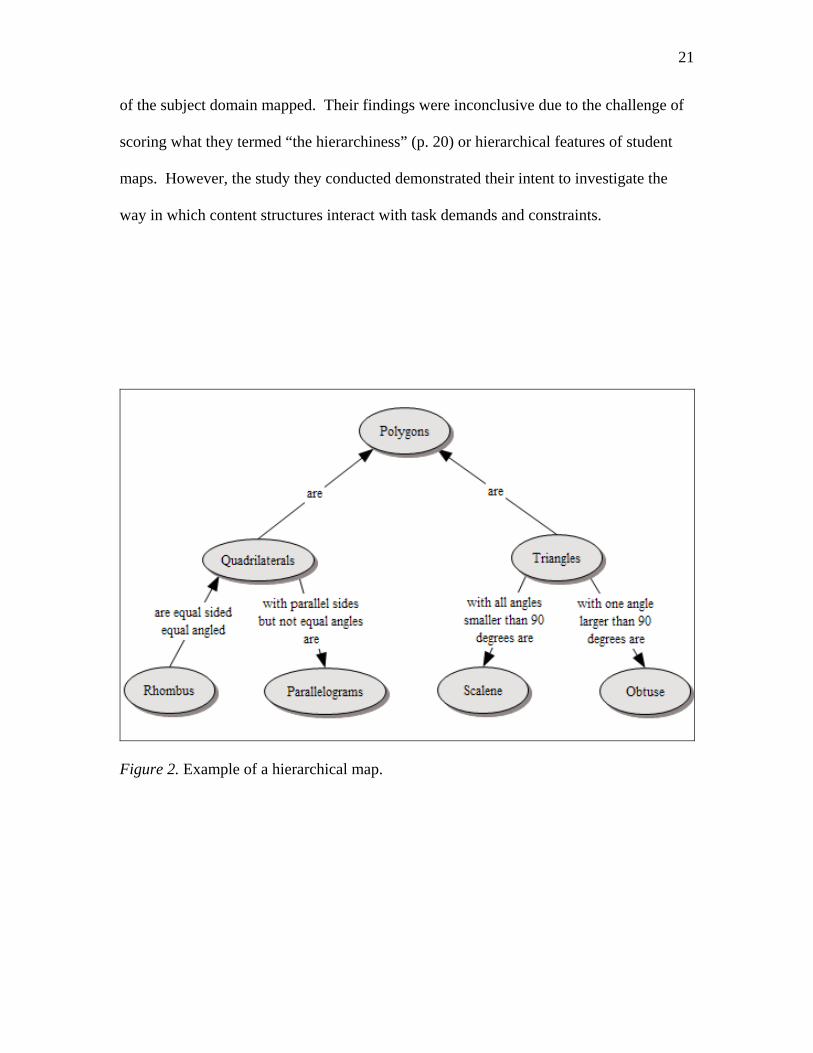
domain to be mapped” (p. 578). For example, if the content domain is hierarchical in
nature, then students may be directed to construct a hierarchical map (Figure 2). If the
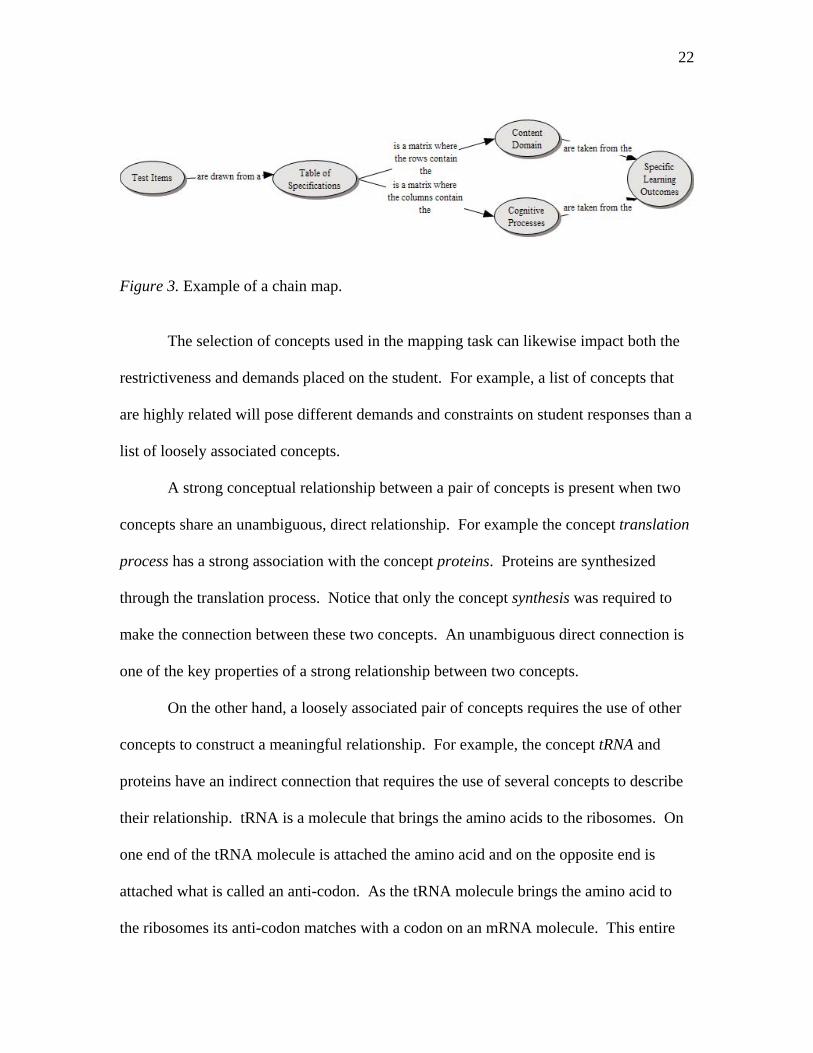
content is more procedural in nature the students may be directed to construct a chain
map (like a flow chart with linking phrases as depicted in Figure 3) (Yin et al., 2005). If
the concepts in a given content domain are more ambiguous, students may be directed to
construct several maps with the same list of concepts in light of varying contexts.
Ruiz-Primo et al. (1997) compared the impact of imposing instructions that
directed students to construct a map of (a) a list of hierarchically related concepts
hierarchically, (b) a list of hierarchically related concepts nonhierarchically, (c) a list of
nonhierarchically related concepts nonhierarchically and finally (d) a list of
nonhierarchcially related concepts hierarchically. Their intent was to assess the degree to
which the imposition of structure on students’ representations interact with the structure
21
of the subject domain mapped. Their findings were inconclusive due to the challenge of
scoring what they termed “the hierarchiness” (p. 20) or hierarchical features of student
maps. However, the study they conducted demonstrated their intent to investigate the
way in which content structures interact with task demands and constraints.
Figure 2. Example of a hierarchical map.
22
Figure 3. Example of a chain map.
The selection of concepts used in the mapping task can likewise impact both the
restrictiveness and demands placed on the student. For example, a list of concepts that
are highly related will pose different demands and constraints on student responses than a
list of loosely associated concepts.
A strong conceptual relationship between a pair of concepts is present when two
concepts share an unambiguous, direct relationship. For example the concept translation
process has a strong association with the concept proteins. Proteins are synthesized
through the translation process. Notice that only the concept synthesis was required to
make the connection between these two concepts. An unambiguous direct connection is
one of the key properties of a strong relationship between two concepts.
On the other hand, a loosely associated pair of concepts requires the use of other
concepts to construct a meaningful relationship. For example, the concept tRNA and
proteins have an indirect connection that requires the use of several concepts to describe
their relationship. tRNA is a molecule that brings the amino acids to the ribosomes. On
one end of the tRNA molecule is attached the amino acid and on the opposite end is
attached what is called an anti-codon. As the tRNA molecule brings the amino acid to
the ribosomes its anti-codon matches with a codon on an mRNA molecule. This entire
23
process, known as translation, makes possible the synthesis of proteins. If a concept-
mapping task has a list of concepts that possess the same weak conceptual
interrelationship as tRNA and proteins than the task demands may make completing the
assignment untenable, because mapping conventions require students to connect those
concepts with the most direct relationships.
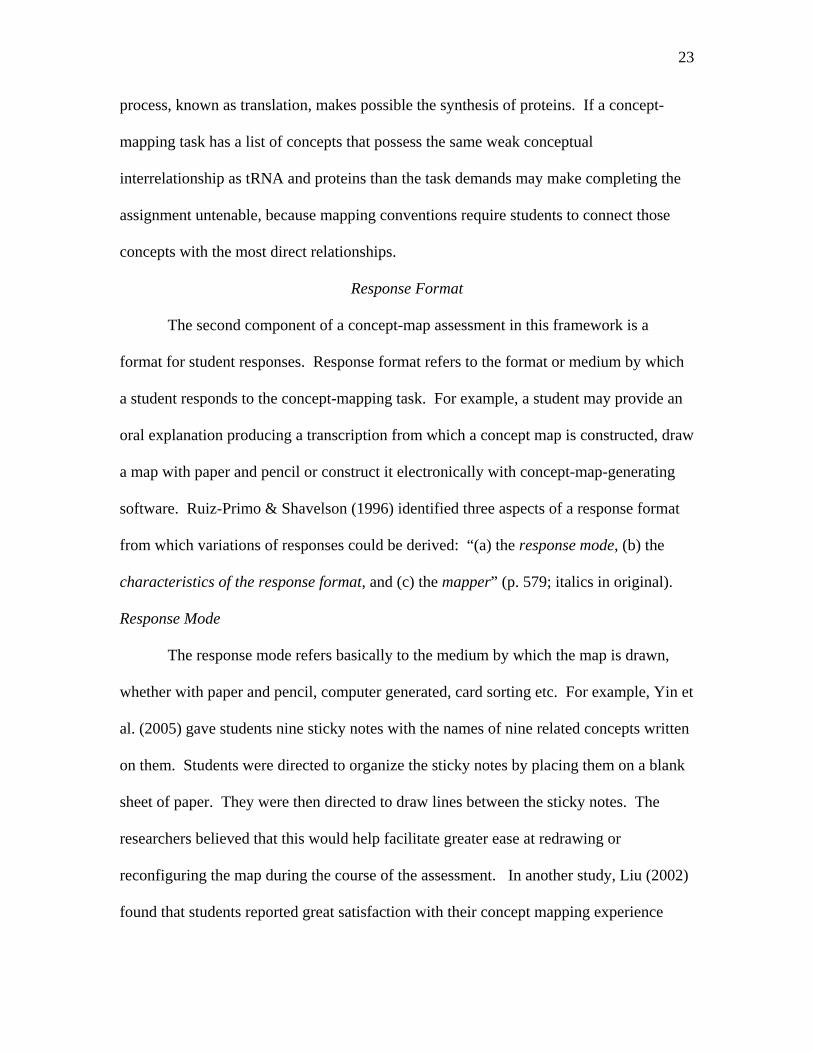
Response Format
The second component of a concept-map assessment in this framework is a
format for student responses. Response format refers to the format or medium by which
a student responds to the concept-mapping task. For example, a student may provide an
oral explanation producing a transcription from which a concept map is constructed, draw
a map with paper and pencil or construct it electronically with concept-map-generating
software. Ruiz-Primo & Shavelson (1996) identified three aspects of a response format
from which variations of responses could be derived: “(a) the response mode, (b) the
characteristics of the response format, and (c) the mapper” (p. 579; italics in original).
Response Mode
The response mode refers basically to the medium by which the map is drawn,
whether with paper and pencil, computer generated, card sorting etc. For example, Yin et
al. (2005) gave students nine sticky notes with the names of nine related concepts written
on them. Students were directed to organize the sticky notes by placing them on a blank
sheet of paper. They were then directed to draw lines between the sticky notes. The
researchers believed that this would help facilitate greater ease at redrawing or
reconfiguring the map during the course of the assessment. In another study, Liu (2002)
found that students reported great satisfaction with their concept mapping experience
24
when they were able to map a list of concepts using computer software designed to
facilitate the mapping process.
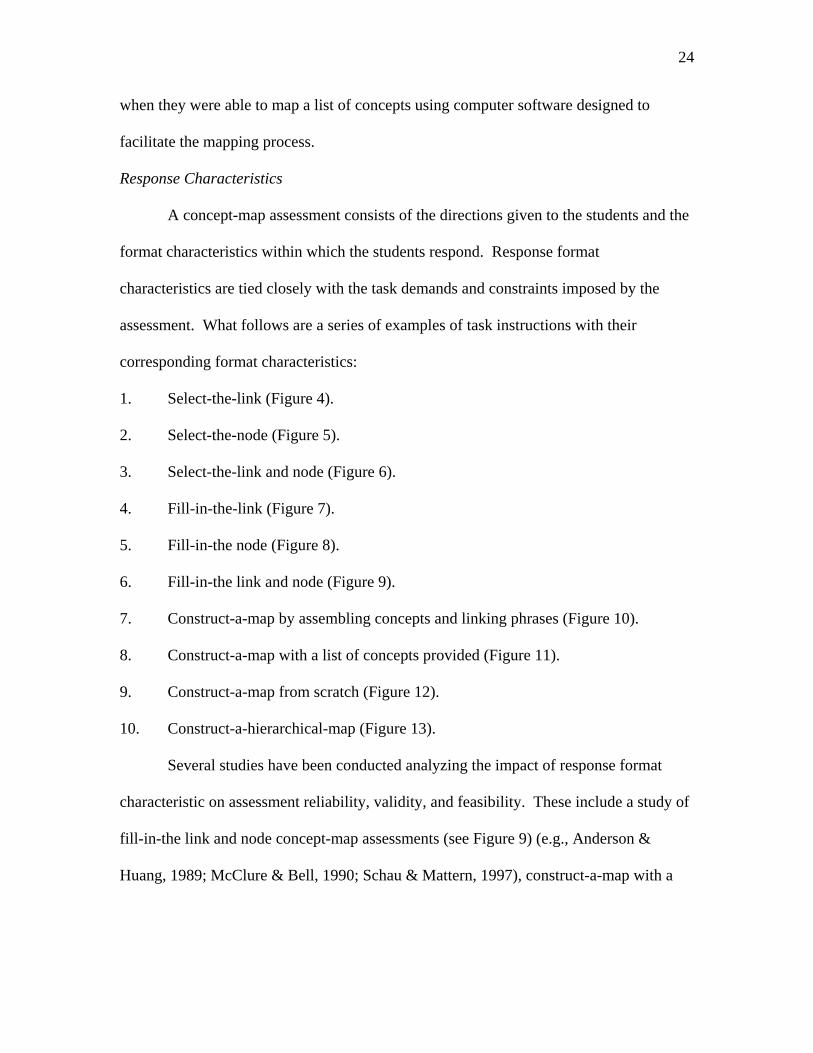
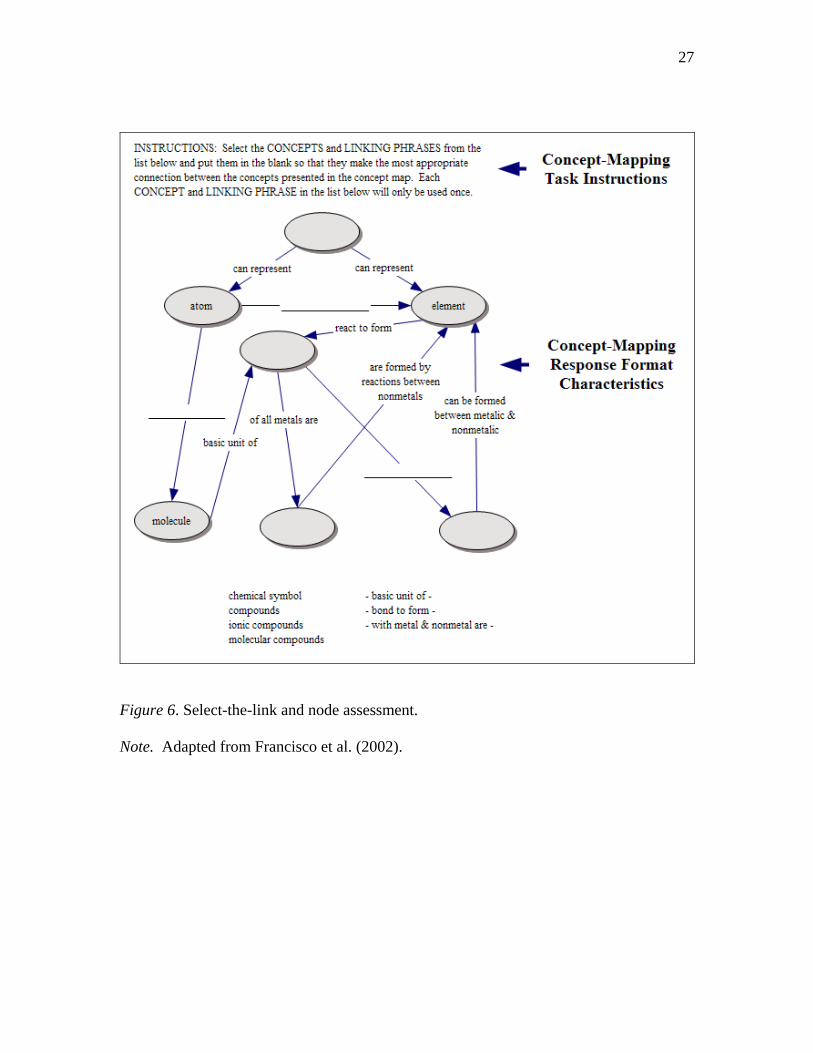
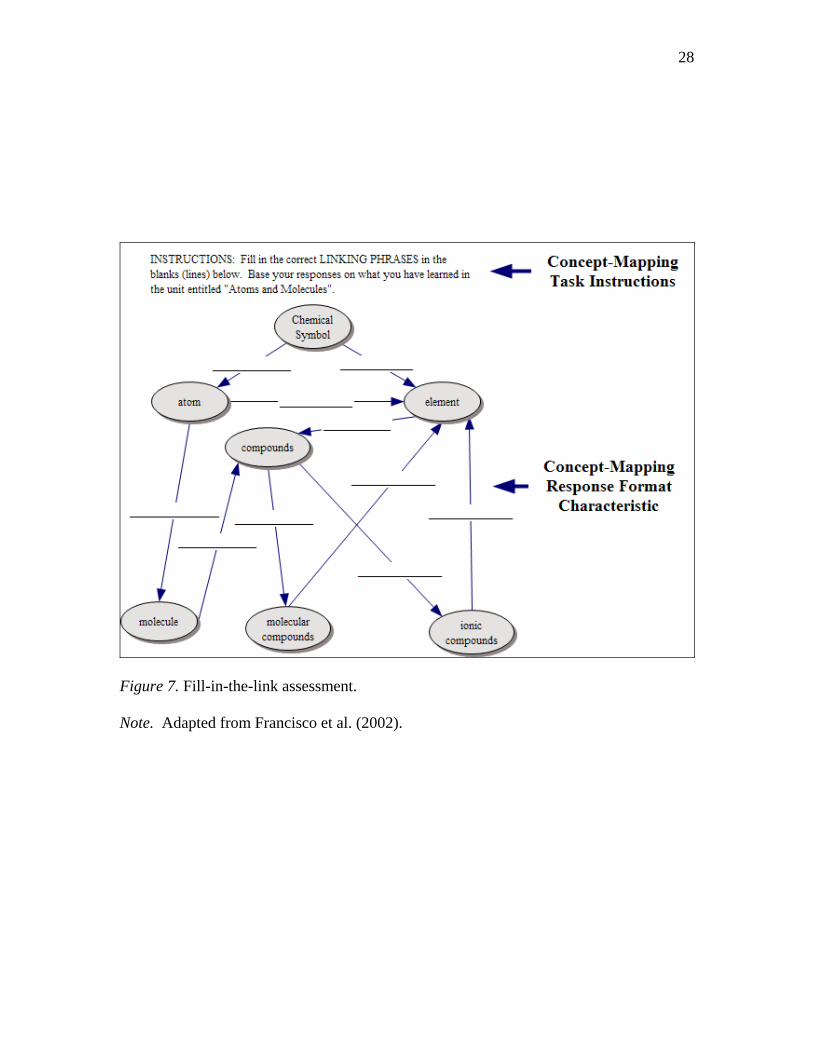
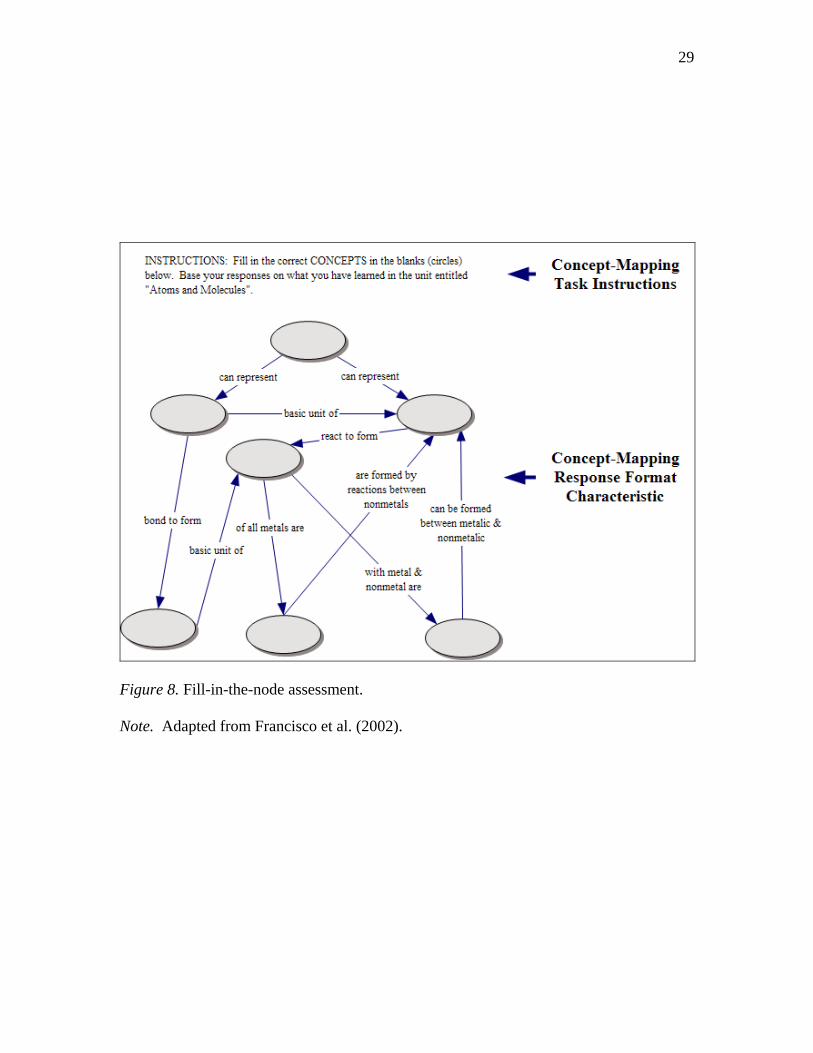
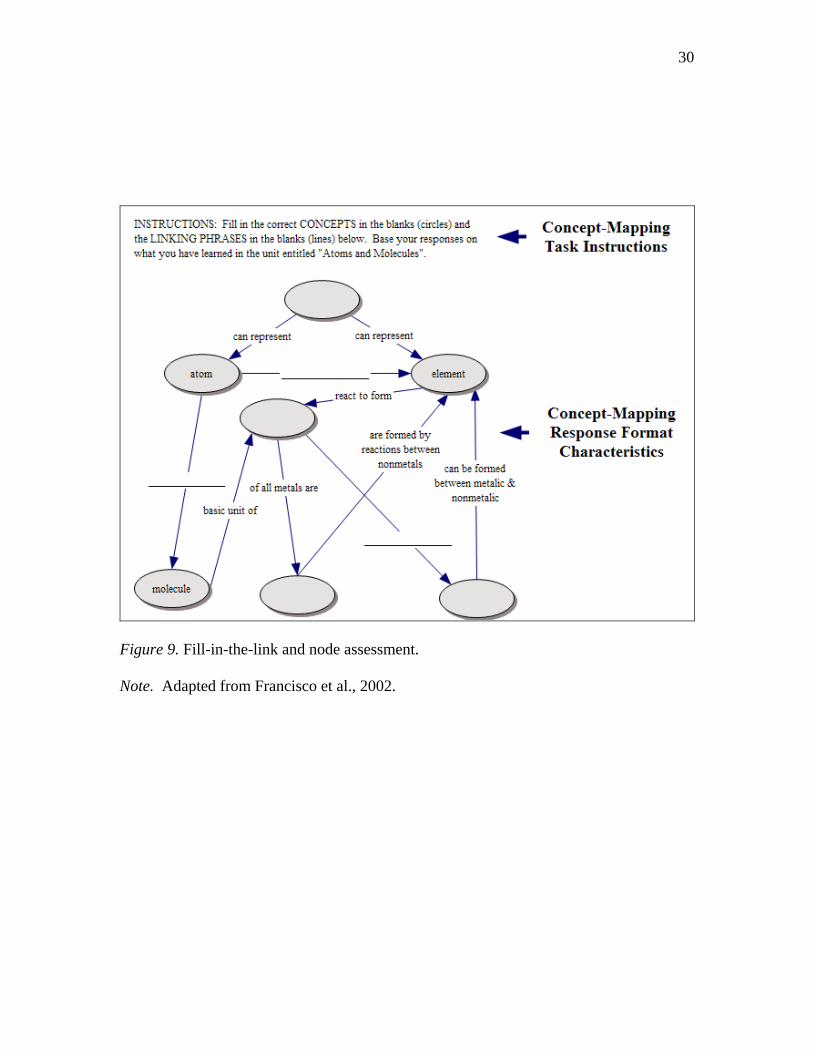
Response Characteristics
A concept-map assessment consists of the directions given to the students and the
format characteristics within which the students respond. Response format
characteristics are tied closely with the task demands and constraints imposed by the
assessment. What follows are a series of examples of task instructions with their
corresponding format characteristics:
1. Select-the-link (Figure 4).
2. Select-the-node (Figure 5).
3. Select-the-link and node (Figure 6).
4. Fill-in-the-link (Figure 7).
5. Fill-in-the node (Figure 8).
6. Fill-in-the link and node (Figure 9).
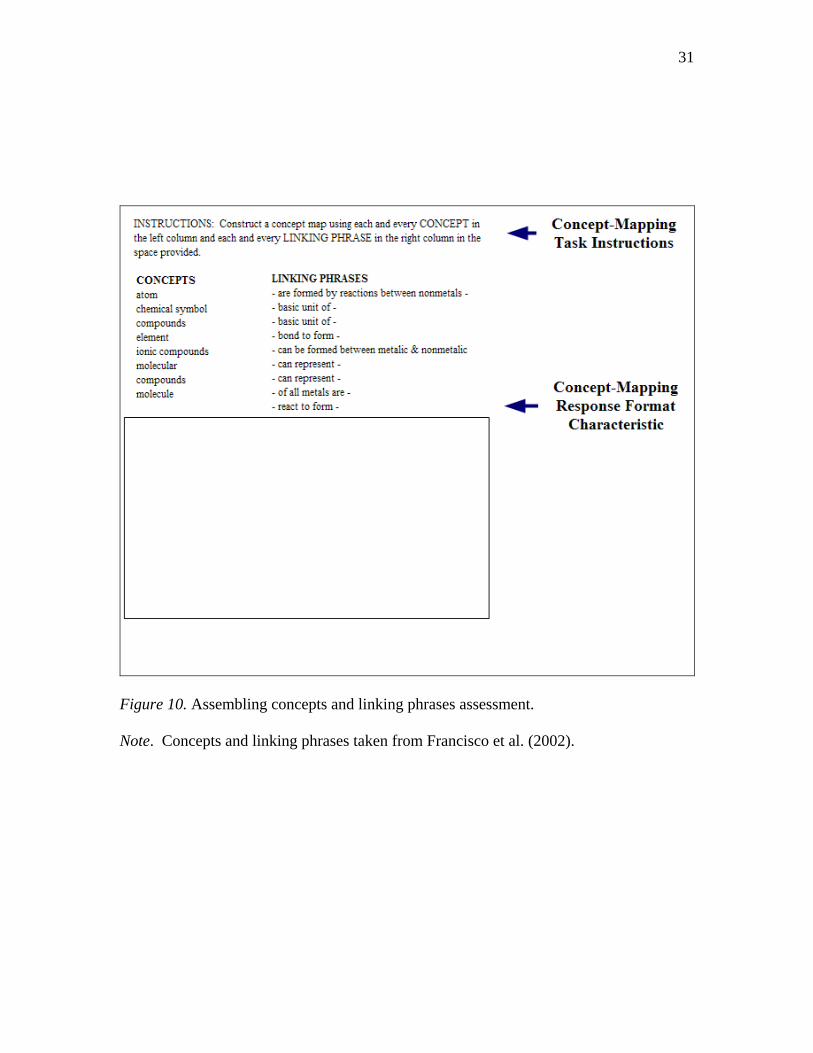
7. Construct-a-map by assembling concepts and linking phrases (Figure 10).
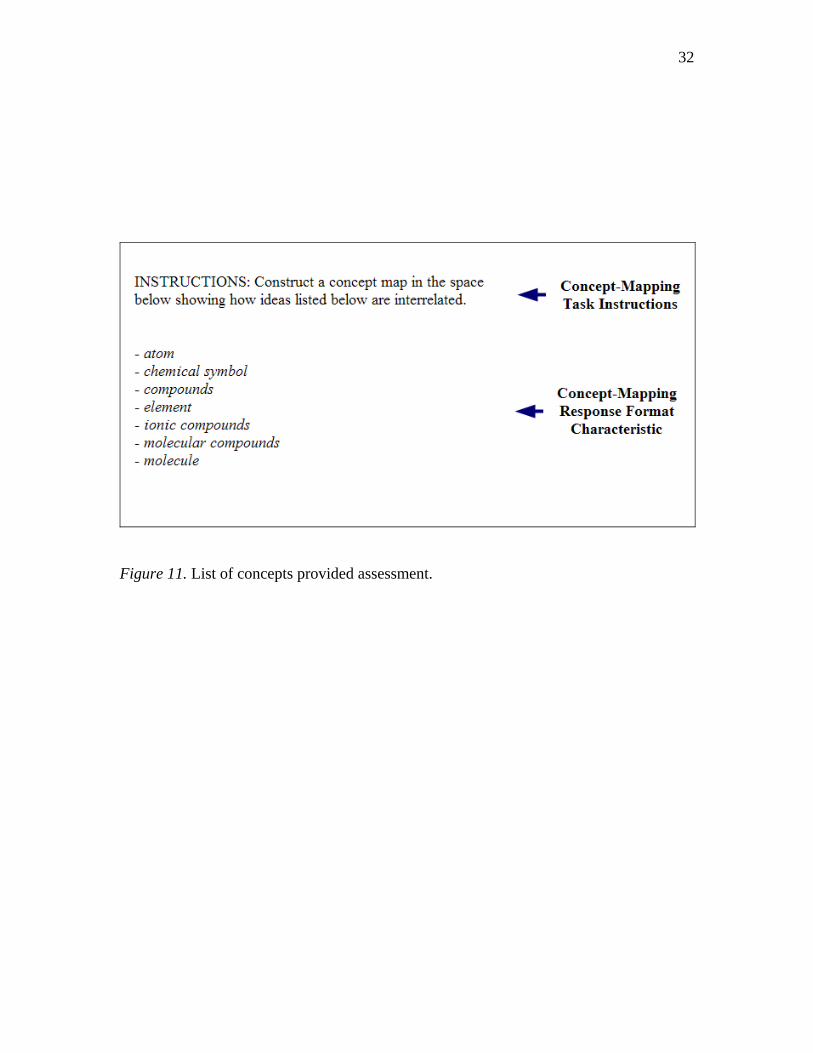
8. Construct-a-map with a list of concepts provided (Figure 11).
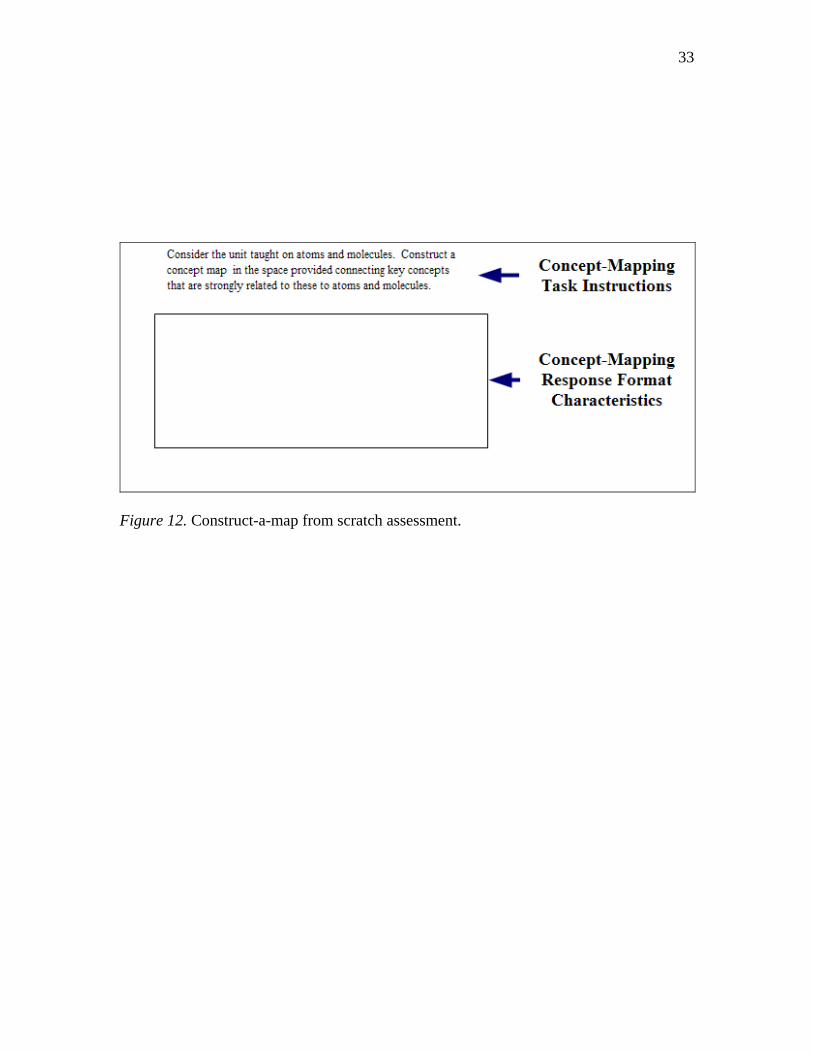
9. Construct-a-map from scratch (Figure 12).
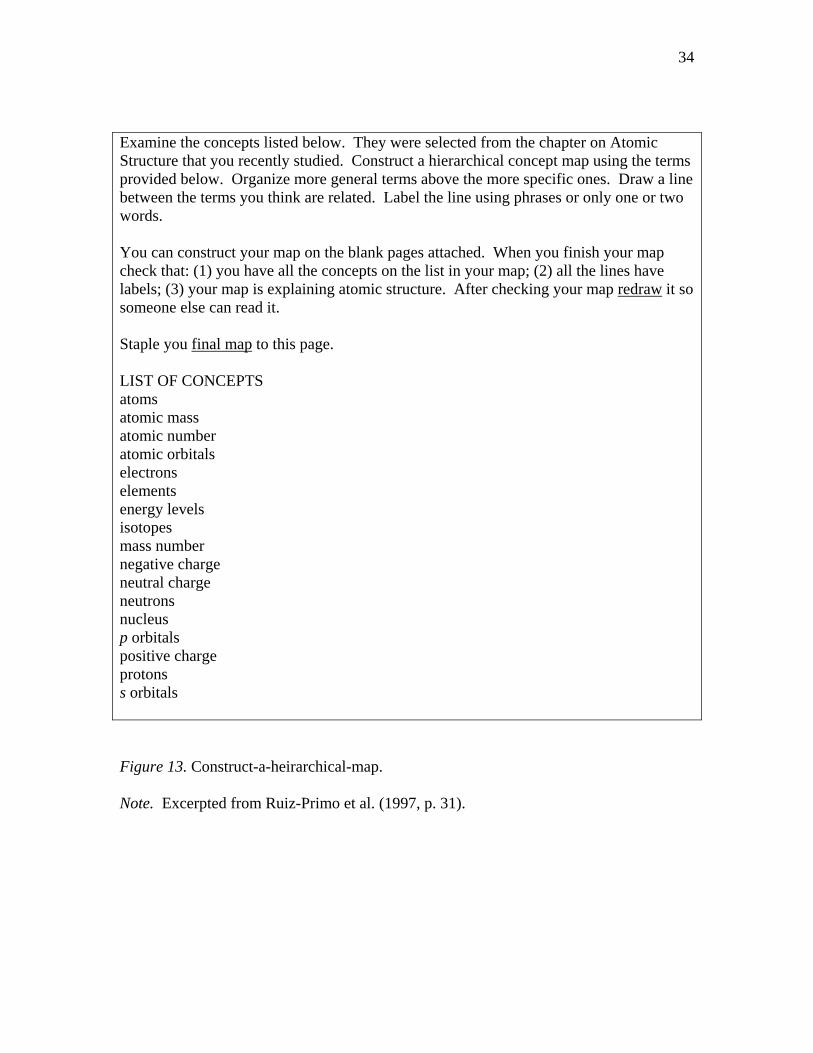
10. Construct-a-hierarchical-map (Figure 13).
Several studies have been conducted analyzing the impact of response format
characteristic on assessment reliability, validity, and feasibility. These include a study of
fill-in-the link and node concept-map assessments (see Figure 9) (e.g., Anderson &
Huang, 1989; McClure & Bell, 1990; Schau & Mattern, 1997), construct-a-map with a
25
Figure 4. Select-the-link assessment.
Note. Adapted from Francisco et al. (2002).
26
Figure 5. Select-the-node assessment.
Note. Adapted from Francisco et al. (2002).
27
Figure 6. Select-the-link and node assessment.
Note. Adapted from Francisco et al. (2002).
28
Figure 7. Fill-in-the-link assessment.
Note. Adapted from Francisco et al. (2002).
29
Figure 8. Fill-in-the-node assessment.
Note. Adapted from Francisco et al. (2002).
30
Figure 9. Fill-in-the-link and node assessment.
Note. Adapted from Francisco et al., 2002.
31
Figure 10. Assembling concepts and linking phrases assessment.
Note. Concepts and linking phrases taken from Francisco et al. (2002).
32
Figure 11. List of concepts provided assessment.
33
Figure 12. Construct-a-map from scratch assessment.
34
Examine the concepts listed below. They were selected from the chapter on Atomic Structure that you recently studied. Construct a hierarchical concept map using the terms provided below. Organize more general terms above the more specific ones. Draw a line between the terms you think are related. Label the line using phrases or only one or two words. You can construct your map on the blank pages attached. When you finish your map check that: (1) you have all the concepts on the list in your map; (2) all the lines have labels; (3) your map is explaining atomic structure. After checking your map redraw it so someone else can read it. Staple you final map to this page. LIST OF CONCEPTS atoms atomic mass atomic number atomic orbitals electrons elements energy levels isotopes mass number negative charge neutral charge neutrons nucleus p orbitals positive charge protons s orbitals
Figure 13. Construct-a-heirarchical-map.
Note. Excerpted from Ruiz-Primo et al. (1997, p. 31).
35
list of concepts provided (see Figure 11) (Yin et al., 2005; Ruiz-Primo et al., 2001;
McClure et al., 1999), and construct-a-map by assembling concepts and linking phrases
(see Figure 10) (Ruiz-Primo et al., 2001).
Of all the concept-mapping tasks, the construct-a-map with a list of concepts
provided (see Figure 11) is considered to be the “gold standard of concept-map”
assessments (Yin et al., 2005, p. 167). Ruiz-Primo et al. (2001) investigated the
possibility of the fill-in-the-map task (see Figures 7 and 8) providing the same picture of
student-connected understanding as the construct-a-map task. Their finding led them to
posit that construct-a-map task scores more “accurately reflected the differences across
students’ knowledge structure” (p. 275) than the fill-in-the-map task scores. It is for this
reason that several studies have used this task as a standard to investigate its degree of
equivalence with other techniques (Ruiz-Primo et al., 2001; Yin et al., 2005) or to study
other concept-map assessment components such as scoring method (McClure et al.,
1999) or response format (Liu 2002).
Mapper
The mapper is the one who draws the map. Students generally draw the map;
however, there are instances when the map is drawn by others. In such instances, concept
maps may be generated from student essays or interview transcripts. For example, Rye
and Rubba (2002) interviewed students about their understanding of chlorofluorocarbons
and then constructed concept maps based on the conceptual relationships expressed by
the students in the interviews. Likewise, Nicoll et al. (2001) derived concept maps from
interview transcripts that documented verbal cues that otherwise would not have been
picked up if the student had drawn the maps themselves.
36
Rice et al. (1998) explained that the age of the mapper has little impact on their
ability to construct a concept map. Novak and Gowin (1984) reported that children as
young as primary grades have been found adept at constructing concept maps. Because
of the relative ease at which concept maps can be constructed varying abilities (e.g.,
Anderson & Huang, 1989) and varying learning styles (Laight, 2004) have been shown
tentatively to not negatively impact students from becoming good concept mappers.
Scoring System
The third and final component of a concept-map assessment is a scoring system
by which student concept maps can be evaluated accurately and consistently. Ruiz-Primo
and Shavelson (1996) explain that a scoring system is a “systematic method with which
students’ concept maps can be evaluated accurately and consistently” (p. 581). They
categorize scoring systems into three general strategies: (a) scoring the components of a
map, (b) comparing the student’s map with a criterion or master map, and (c) using a
combination of these first two strategies. To these three we may add the holistic scoring
method studied by McClure et al. (1999).
Scoring Map Components
The components of a concept map that have been scored include the (a) concepts,
(b) linking phrases between concepts, (c) structural or hierarchical aspects of the map,
and (d) examples that are used to illustrate concepts presented on the map.
Scoring concepts. Scoring the concepts of a map should occur only if the students
rather than the assessor are directed to supply map concepts. For example, in the
construct-a-map from scratch task (see Figure 12) students are given a topic and asked to
construct-a-map that depicts the key concepts and propositions of that topic. In this case
37
students are directed to supply relevant concepts to the topic and then their concept
selection is scored accordingly. Because of the heavy cognitive load imposed upon
students with such a task, in most cases concept selection is already done for the student
and hence, not scored (see Schau & Mattern, 1997). Another task that would require the
scoring of student-concept selection would be requiring the students to add relevant
concepts to a list of assessor-selected concepts (e.g., Rice et al., 1998). This feature adds
a level of complexity to the scoring method in that students may add an innumerable
number of concepts with their resulting propositions, each of which would have to be
accounted for by the raters.
Scoring propositions. When scoring propositions, two strategies are generally
considered: The scoring of individual propositions and the calculation of total map
proposition scores. In order to simplify the scoring process most researchers with the
exception of a few (e.g., Shavelson, Laung, & Lewin, 1993), have not permitted students
to run “sentences through multiple nodes” creating what have been termed “dependent
propositions” (Nicol et al., 2001, p. 870). When this is permitted, raters must account not
only for propositions communicating independent thoughts, but also those
communicating dependent thoughts. For example, the concepts dog and domesticated
may be linked with the phrase: dogs can be domesticated. The concept wild could be an
add-on, dogs can be domesticated unless they are wild. The proposition domesticated
unless they are wild does not communicate an independent thought. Sometimes it is clear
to a rater the meaning of the dependent proposition and other times it is not. Since one of
the purposes of concept mapping is to make explicit student connected understanding,
dependent propositions in many instances require subjective judgments about implicit
38
meanings. Hence a pair of concepts connected with a linking phrase that communicates
an independent thought is considered among most researchers to constitute a proposition.
Individual propositions have generally been evaluated based on their level of
correctness. In some instances the propositions are scored simply as correct or incorrect
(Yin et al., 2005) and in other instances the propositions are rated based on degrees of
correctness (Ruiz-Primo et al., 2001). Some scoring methods take into account
proposition choice (McClure et al., 1999) and others consider the direction of the linking
phrase arrow (Anderson & Huang, 1989).
At the very least a proposition is scored based on how correct or accurate it is. A
correct proposition communicates simply an idea that is accepted as valid by domain or
content experts in a given context. Proposition correctness is also a function of expected
student ability level. For example, in a beginning high school statistics class the correct
relationship between the concepts correlation and covary could read simply, correlation
shows how much two variables covary. However, in an intermediate college statistics
course a correct relationship between these same concepts may read, correlation is a
standardized measure of the degree to which two variables covary.
Proposition choice is another proposition-scoring attribute that has been included
by some researchers in the concept-mapping assessment literature (e.g., Yin et al., 2005;
Rice et al., 1998). As explained previously with the concepts tRNA and proteins, when a
student selects a pair of concepts to be mapped, they connect concepts that vary in
degrees in their strength of association. In a prior example, the concept dog was linked
with the concept bark. However, if a student linked the concept cow with the concept
bark with the linking phrase does not, this proposition, while correct, would not reflect as
39
strong as an association as the proposition a dog has the ability to bark. Propositions
may be weighted based on their associated strength as well as their relevance to the
overall topic. Correctly choosing pairs of concepts to form key, fundamental
propositions is essentially a function of the context or topic of the domain and the level of
domain expertise possessed by the mapper.
Another scoring attribute or property of individual propositions is proposition
completeness (Ruiz-Primo et al., 2004), which describes the degree to which the
information in the proposition demonstrates a complete understanding of the relationship
between two concepts. A proposition can be accurate and vary in its degree of
completeness. For example, the proposition reliability must be present in order to claim
validity is an accurate proposition; however, a more complete expression of their
relationship would be, reliability is necessary but not sufficient in order to infer validity.
Notice that the first proposition essentially communicates that reliability is a requisite of
validity. The second proposition adds the idea that reliability is requisite but not the only
requirement to make a claim of validity.
Researchers such as Nicol et al., (2001) have considered other scoring properties.
In their studies they derived concept maps from student-interview transcripts. They rated
each link based on the following:
1. Proposition utility, which is the degree to which a proposition is considered
correct.
2. Proposition stability, which is the degree to which a student expresses a
proposition with certainty.
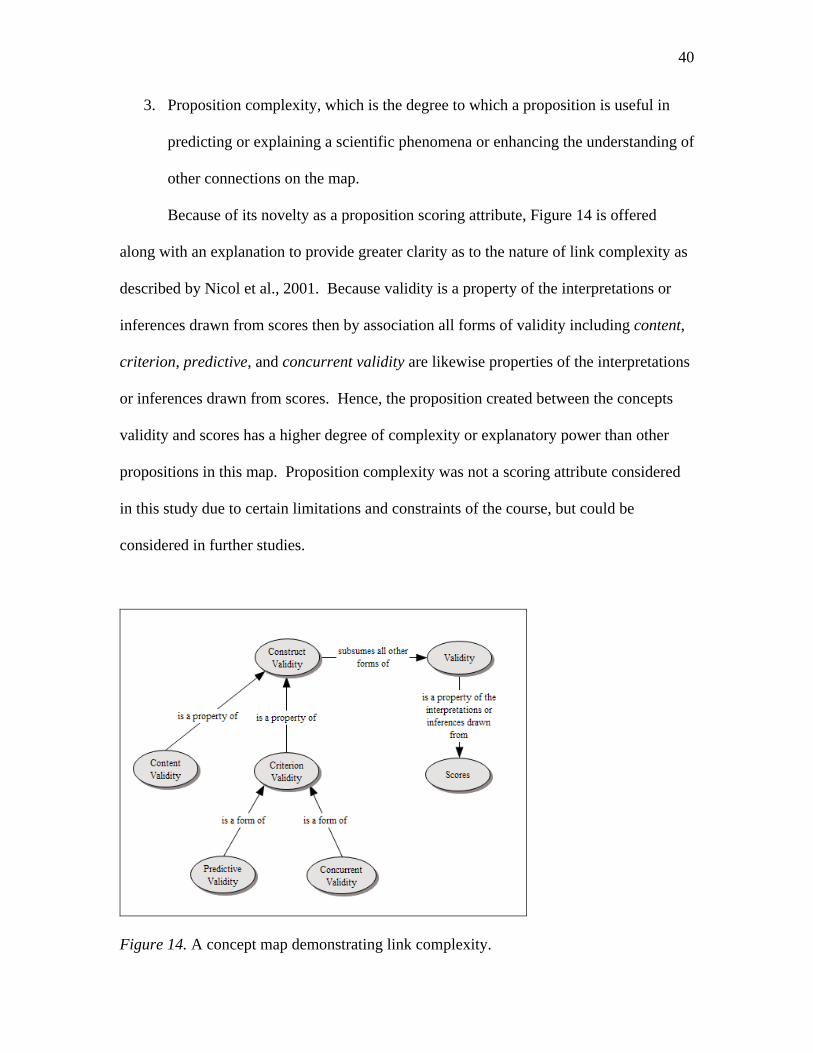
40
3. Proposition complexity, which is the degree to which a proposition is useful in
predicting or explaining a scientific phenomena or enhancing the understanding of
other connections on the map.
Because of its novelty as a proposition scoring attribute, Figure 14 is offered
along with an explanation to provide greater clarity as to the nature of link complexity as
described by Nicol et al., 2001. Because validity is a property of the interpretations or
inferences drawn from scores then by association all forms of validity including content,
criterion, predictive, and concurrent validity are likewise properties of the interpretations
or inferences drawn from scores. Hence, the proposition created between the concepts
validity and scores has a higher degree of complexity or explanatory power than other
propositions in this map. Proposition complexity was not a scoring attribute considered
in this study due to certain limitations and constraints of the course, but could be
considered in further studies.
Figure 14. A concept map demonstrating link complexity.
41
Along with individual proposition scores, total proposition scoring schemes have
also been conceptualized by researchers. Ruiz-Primo et al. (2004) describes three total
proposition scores (a) total proposition accuracy – the sum of all the scored propositions
in a map, (b) convergence score – the percentage or proportion of scores on a student
map found on an expert or criterion map, and (c) salience score – the percentage or
proportion of accurate propositions out of the total number of propositions in the
student’s map.
Summing the scores of all propositions in a map is a simple procedure, yet there
are several issues to consider when doing so. As an extreme case, if every concept could
be meaningfully connected to every other concept on a map, then the number of the total
propositions that could be connected can be calculated using the formula N(N-1) / 2,
where N equals the number of concepts in the list. If the number of concepts were 10,
then the number of total possible propositions would be 45. If a student constructs 45
propositions and each proposition can be scored on a scale of 0 to 2 then the highest total
proposition accuracy score would be 90.
Of course it is inconceivable that an instance could occur where every concept
could be meaningfully linked with every other concept on a map. Additionally, most
concepts within a given subject or discipline differ in the degree to which they
meaningfully relate to one another. This scoring attribute, as described earlier, is called
proposition choice or proposition importance and directs raters to give credit to students
who connect those concepts that should be connected and no credit for those concepts
that should not be connected. The challenge here is for content experts to develop a list
of strongly associated propositions that students should make along with a list of
42
moderately and weakly associated propositions. Such an effort can be daunting because
any one discipline may possess an exhaustive list of closely and moderately related
concepts. If this can be accomplished, however, then a total possible proposition score is
a more viable approach to evaluate student maps (Yin et al., 2005).
Some researchers have not pursued a total proposition score because of this
challenge and have looked to other scoring approaches that reflect student concept-
mapping performance such as convergence and salience scores.
Convergence scores are calculated by comparing the number of propositions
shared by a student map and an expert map. This score is generally calculated as a
percentage or a proportion. If a student constructs 90% of the propositions found on an
expert map then they would receive a .90. There are several challenges associated with
using expert maps to evaluate student maps. These challenges will be identified and
discussed later.
In the case of salience scores, this scoring technique is calculated in several ways
(see Francisco et al., 2002; Ruiz-Primo et al., 1997). The most basic calculation is done
by dividing the number of correct propositions by the total number of propositions on the
map. If a student constructs ten propositions and five are correct then their score would
be .5 or 50 percent correct. A challenge with salience score calculations is that a student
could conceivably score a 1.0 by constructing only one or two accurate propositions.
Hence a score of 1.0 may or may not represent a student who possesses a well-developed
conceptual framework of the material.
Ruiz-Primo et al. (1997) compared the results of concept-mapping scores
calculated using all three methods and found total proposition accuracy and convergence
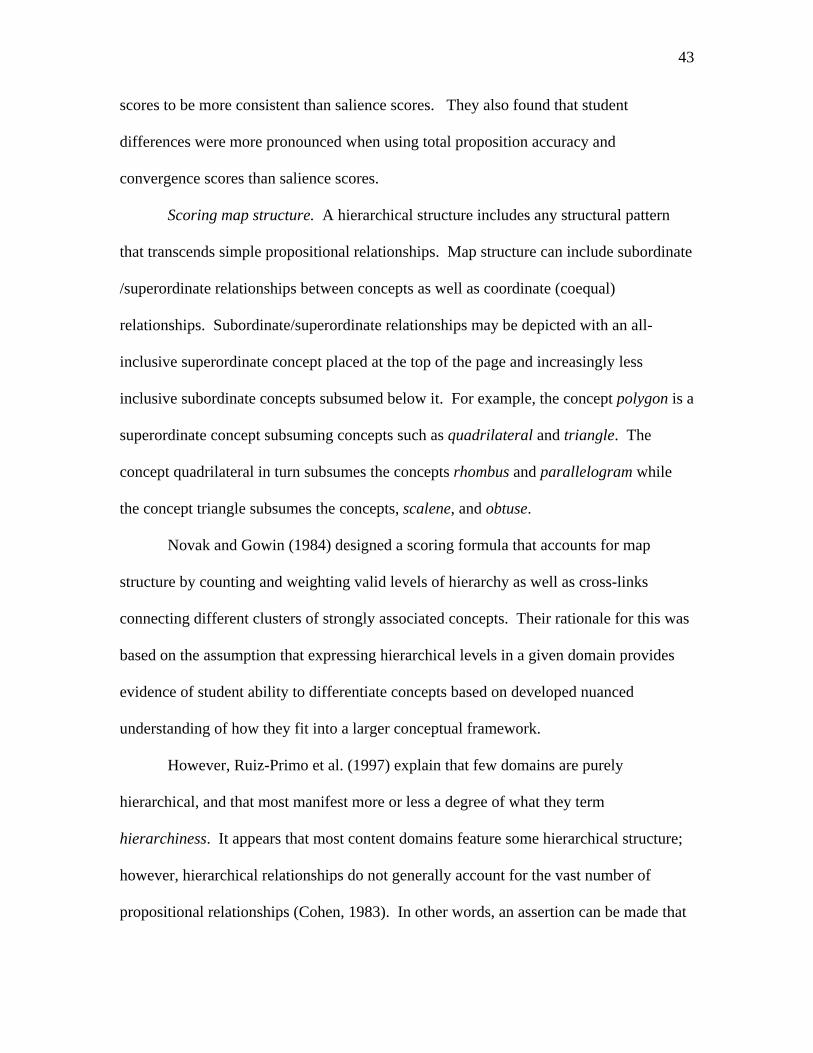
43
scores to be more consistent than salience scores. They also found that student
differences were more pronounced when using total proposition accuracy and
convergence scores than salience scores.
Scoring map structure. A hierarchical structure includes any structural pattern
that transcends simple propositional relationships. Map structure can include subordinate
/superordinate relationships between concepts as well as coordinate (coequal)
relationships. Subordinate/superordinate relationships may be depicted with an all-
inclusive superordinate concept placed at the top of the page and increasingly less
inclusive subordinate concepts subsumed below it. For example, the concept polygon is a
superordinate concept subsuming concepts such as quadrilateral and triangle. The
concept quadrilateral in turn subsumes the concepts rhombus and parallelogram while
the concept triangle subsumes the concepts, scalene, and obtuse.
Novak and Gowin (1984) designed a scoring formula that accounts for map
structure by counting and weighting valid levels of hierarchy as well as cross-links
connecting different clusters of strongly associated concepts. Their rationale for this was
based on the assumption that expressing hierarchical levels in a given domain provides
evidence of student ability to differentiate concepts based on developed nuanced
understanding of how they fit into a larger conceptual framework.
However, Ruiz-Primo et al. (1997) explain that few domains are purely
hierarchical, and that most manifest more or less a degree of what they term
hierarchiness. It appears that most content domains feature some hierarchical structure;
however, hierarchical relationships do not generally account for the vast number of
propositional relationships (Cohen, 1983). In other words, an assertion can be made that
44
all domains have some hierarchical skeletal structure but it generally accounts for a much
smaller percentage of the total propositions that could be constructed from those
domains. Scoring map structure would be important if (a) there is a strong presence of
hierarchical relationships in the content domain and (b) it is the explicit objective of a
course to assist students in understanding the hierarchical nature of the content.
If, however, the spatial features of the map do not account for a conceptual
framework, the individual propositions would be the only map components left to score.
This gives rise to the question, can the content structure of a domain be accounted for by
analyzing solely the linking phrases expressed within each proposition of the map and not
its spatial features? Anderson (1995) makes the following point answering this question
in the affirmative:
The spatial location of elements in a network is totally irrelevant to the
interpretation. A network can be thought of as a tangle of marbles connected by
strings. The marbles represent the nodes, and the strings represent the links
between the nodes. The network represented on a two-dimensional page is that
tangle of marbles laid out in a certain way. We try to lay the network out in a way
that facilitates its understanding but any layout is possible. All that matters is
what elements are connected to which, not where the components lie. (p. 148)
Constraining students’ representation of their conceptual framework by imposing an ideal
structure on their maps may stifle those students who require a process that is less
constraining as they find the framework that best facilitates retention and understanding.
One way to capture student knowledge structure without considering the spatial
layout of the map is to consider two propositional attributes: proposition
45
choice/importance and proposition completeness. If students are to pair concepts that
have hierarchical relationships, then this would be a criterion for appropriate proposition
choice. If the essential relationship between two concepts is hierarchical in nature, then
students would be expected to express a hierarchical relationship in the linking phrase in
order for the proposition to be considered complete.
This issue has important implications for scoring concept maps. While a few
researchers continue to study the possibility of scoring map structure (e.g., Yin et al.,
2005) more theoretical and empirical work needs to be done considering the viability of
accounting for it using methods that are reliable and valid.
Scoring examples. Citing examples provides evidence of a student’s ability to
instantiate abstract concepts. For example, it may be known that a five-year-old boy
knows that a dog is an animal, but if he links dog to the instance Doberman Pincher with
the linking phrase is a type of, it would also be known that he could identify an instance
of the concept dog. When scoring these types of propositions, Novak & Gowin (1984)
weighted each proposition with an example and other propositions equally. The limitation
here is that since concept maps can showcase a students understanding of the essential
relationships between key conceptual pairs in a given domain, it may be of less interest to
depict an example of any one concept. Hence, examples of certain concepts may not
evidence propositional or structural understanding but evidence more an understanding of
an instance of a particular concept. If this is an outcome of interest to the assessor then
students should be directed to add examples where applicable in their maps.
46
Comparing Students’ Maps with a Master Map
Another scoring option that has gained wide acceptance is to compare a student
map with an expert, criterion, or master map. The criterion map functions as a standard
to evaluate (a) the acceptableness of concept selection, (b) proposition choice, (c)
proposition accuracy, (d) map structure, etc. Criterion maps are difficult to construct
because of challenges highlighted in the study by Acton, Johnson, and Goldsmith (1994).
In their study criterion maps were constructed by field experts and a class instructor.
They found that individual experts were highly variable in the specifics and in some
instances the generalities of their maps. The course instructor, however, showed even
greater map variability from the expert maps. To add to the intrigue, the student maps
correlated much less with the instructor map than with the expert maps. This finding has
serious implications for the viability of comparing students’ maps with a mater map.
Combination of Strategies
The third strategy proposed by Ruiz-Primo and Shavelson (1996) is to score
concept maps using both strategies – scoring the components of a map while using the
criterion map as a guide. McClure et al. (1999) investigated six scoring methods that
focused on different aspects of student maps including a holistic, structural, and relational
evaluation. This study will be described in more detail in the section on the reliability
ratings of concept-map scores. Suffice it to say, the relational scoring method (scoring
each propositions separately) guided by a criterion map proved to demonstrate the highest
reliability ratings of the other five methods. Hence, a combination of strategies or a
triangulated method may provide greater reliability as well as build a stronger case for the
validity of concept-map assessments.
47
Holistic Scoring Methods
While not as common, the holistic method has been studied in a few
investigations. As mentioned previously, McClure et al. (1999) studied interrater
reliability of raters rating concept maps with different scoring methods. One of those
methods was the holistic scoring method where raters examined student concept maps
and judged the mapper’s overall connected understanding from the map on a scale of 1 to
10. This particular method was found to generate inconsistent ratings. The researchers
reported that this might have in part been due to how cognitively taxing it is to account
for map quality without a specific guide for scoring the detailed components of the map.
Concept-Map Assessment Component Summary
In conceptualizing the current study task, response format, and scoring method
were each considered in the development and design of the two construct-a-map tasks to
be investigated. As will be explained in greater detail later in this chapter, two variations
of the construct-a-map task with a list of concepts provided (see Figure 11) were selected
to be studied. The scoring methods were developed drawing from several
recommendations made by those researchers who focus their research on the rating of the
concept-map propositions.
Psychometric Properties
Assessment tools, if constructed properly, should provide accurate information
regarding student knowledge, affect, and/or performance in a particular domain. In order
for that to be the case, the student scores generated from an assessment must show
evidence of being reliable and valid (Linn & Gronlund, 1995). The reliability and
validity of ratings generated from an assessment constitute what is termed the
48
psychometric properties of an assessment. These properties must be analyzed with
concept-map assessments as well, or their use cannot be defended as a bona-fide
evaluative tool.
Reliability
Nunnally (1967) defined reliability as “the extent to which measurements are
repeatable.” He added, “any random influence which tends to make measurements
different from occasion to occasion is a source of measurement error” (p. 206). In their
review of concept-map assessment literature, Ruiz-Primo and Shavelson (1996) found
that prior to 1995, few studies reported the reliability of concept-mapping scores. Instead
of reporting reliability coefficients, most researchers provided percentages representing
interrater agreement. Little has changed since their finding, with the exception of a few
studies that have considered other sources of measurement error, such as the consistency
of student rankings between raters (e.g., McClure et al., 1999), equivalence of test forms
(Ruiz-Primo et al., 2001), score stability across test occasion, (Yin & Shavelson, 2004),
internal consistency (Yin & Shavelson, 2004).
Estimates of the reliability of scores are affected by the nature of the task, the
response format, and the scoring scheme that make up the concept-map assessment. For
example, the more directed the task the easier the assessment is to grade and thus
reliability and task directedness increase proportionately. Figure 15 depicts the
relationship between levels of task directedness along with their associated reliability
ratings.
Likewise, the simpler the scoring scheme the more reliable the student concept-
mapping scores tend to be, because the cognitive load placed on raters is less taxing.
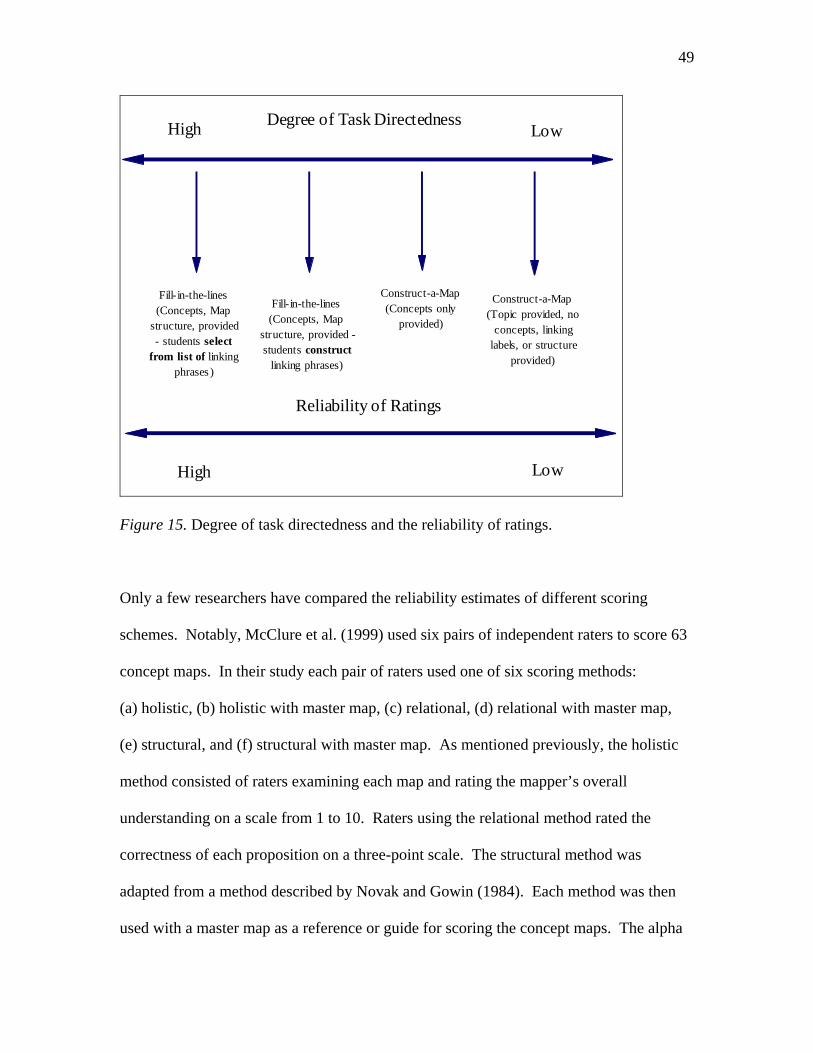
49
Fill-in-the-lines (Concepts, Map
structure, provided - students select
from list of linking phrases )
Construct-a-Map (Concepts only
provided)
Construct-a-Map(Topic provided, no
concepts, linking labels, or structure
provided)
Fill-in-the-lines(Concepts, Map
structure, provided - students construct
linking phrases)
High LowDegree of Task Directedness
Reliability of Ratings
High Low
Figure 15. Degree of task directedness and the reliability of ratings.
Only a few researchers have compared the reliability estimates of different scoring
schemes. Notably, McClure et al. (1999) used six pairs of independent raters to score 63
concept maps. In their study each pair of raters used one of six scoring methods:
(a) holistic, (b) holistic with master map, (c) relational, (d) relational with master map,
(e) structural, and (f) structural with master map. As mentioned previously, the holistic
method consisted of raters examining each map and rating the mapper’s overall
understanding on a scale from 1 to 10. Raters using the relational method rated the
correctness of each proposition on a three-point scale. The structural method was
adapted from a method described by Novak and Gowin (1984). Each method was then
used with a master map as a reference or guide for scoring the concept maps. The alpha
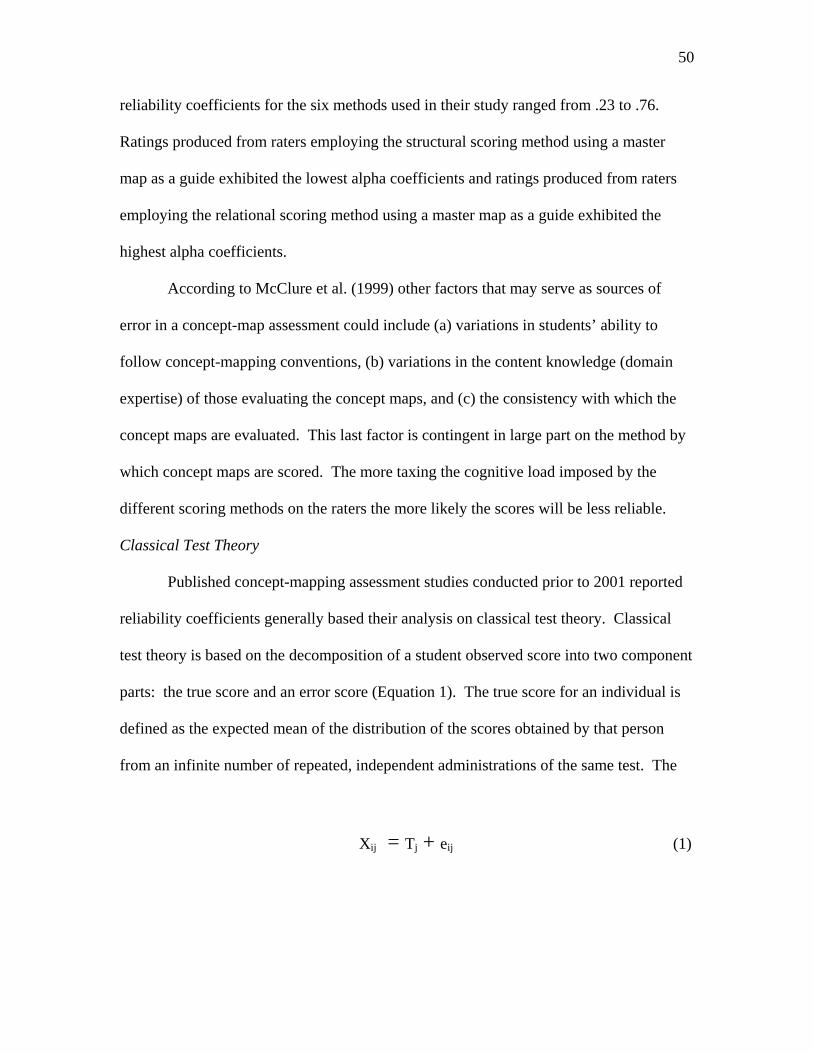
50
reliability coefficients for the six methods used in their study ranged from .23 to .76.
Ratings produced from raters employing the structural scoring method using a master
map as a guide exhibited the lowest alpha coefficients and ratings produced from raters
employing the relational scoring method using a master map as a guide exhibited the
highest alpha coefficients.
According to McClure et al. (1999) other factors that may serve as sources of
error in a concept-map assessment could include (a) variations in students’ ability to
follow concept-mapping conventions, (b) variations in the content knowledge (domain
expertise) of those evaluating the concept maps, and (c) the consistency with which the
concept maps are evaluated. This last factor is contingent in large part on the method by
which concept maps are scored. The more taxing the cognitive load imposed by the
different scoring methods on the raters the more likely the scores will be less reliable.
Classical Test Theory
Published concept-mapping assessment studies conducted prior to 2001 reported
reliability coefficients generally based their analysis on classical test theory. Classical
test theory is based on the decomposition of a student observed score into two component
parts: the true score and an error score (Equation 1). The true score for an individual is
defined as the expected mean of the distribution of the scores obtained by that person
from an infinite number of repeated, independent administrations of the same test. The
Equation 1
Xij = Tj + eij (1)
51
notion of a true score is a statistical concept and is not directly observable. If an
examinee were tested repeatedly on the same test, each obtained score would be either an
over or under estimate of the person’s true score.
Classical test theory assumes that (a) the true score for each examinee is a stable,
fixed value that does not vary from one administration of the test to another
administration of the test and (b) each examinee’s error score and observed score will
vary from one administration of the test to another. Certain types of measurement error
can be measured using classical test theory including score consistency across testing
occasions (stability), consistency across equivalent forms (alternate or parallel forms),
consistency across items designed to measure the same trait (internal consistency), and
consistency across rater-mediated tasks (interrater reliability).
Stability. Score stability represents the degree to which scores are consistent
across testing occasions. Few studies have been conducted analyzing the stability of
concept-mapping scores across testing occasions (see Ruiz-Primo et al., 2001). One of
the reasons for this is that it is not feasible for students to take the same test on different
testing occasions because the first occasion would have an influence on the second. If
score stability is a scoring property of interest, then measures must be taken to diminish
the influence of the first test administration on the second. Another form of score
stability is the degree to which scores are consistent across rating occasions when each
examinee’s map is rated by the same raters on two or more occasions. In this case it is
not the examinee test scores but the ratings given by raters that are examined for evidence
of stability. This type of rater stability is called intrarrater reliability.
52
Parallel, alternate or equivalent forms. Two test forms designed to measure the
same trait by sampling the same domain, are known as parallel or equivalent forms. A
few studies have considered the reliability of equivalent or parallel concept-mapping
forms. The few researchers who have considered it have focused their efforts on
establishing if two forms that impose different constraints on students are parallel. For
example, Ruiz-Primo et al. (2001) conducted a study that sought to determine the degree
to which the construct-a-map and fill-in-the-map concept-mapping tasks were equivalent.
While intuitively these two tasks would not be considered equivalent, the researchers
sought to empirically confirm this assertion and identify and compare the divergent
cognitive processes required to perform each task. This study had important implications
for the potential use of concept-map assessments, for if the two tasks were appreciably
equivalent this would have been taken as evidence that similar conclusions could be
drawn from the ratings from both tasks. In addition, because the fill-in-the-map task is
much easier to score, it could have defensibly been used in large-scale assessments. As
expected, the evidence overwhelmingly demonstrated that the forms were not equivalent.
Internal consistency. As noted, internal consistency is a measure of the degree to
which items in the same test measure the same trait or cognitive process. For example, if
a math test consists mostly of items requiring simple computation plus one or two items
that require mathematical reasoning plus computation, then student responses to these
differing items would probably lack internal consistency. Items must belong to the same
domain or subdomain and assess similar cognitive, affective, or performance outcomes to
be internally consistent. Concept-map assessments are designed to measure some aspect
of connected or organized understanding in a given content domain and must do so
53
consistently to be considered internally consistent. Once again, in the study conducted by
Ruiz-Primo et al. (2001) items on the fill-in-the-map task were randomly sampled in an
effort to study the degree to which all potential propositions were interchangeable in
evoking same cognitive process.
Interrater reliability. Any concept-map assessment that directs students to supply
rather than select answers will require a rater to rate the map. Most mapping tasks
involve rater-mediated scoring. Hence, another potential source of measurement error is
the lack of interrater reliability. It differs from intrarrater reliability in that measurement
error is a function of differences in rater to rater scoring rather than differences within
individual raters across rating occasions. Interrater reliability has been reported in a
several concept-mapping assessment studies (Barenholz & Tamir, 1992; Lomask et al.,
1992; McClure et al, 1999; Lay-Dopyera & Beyerbach, 1983; Nakhleh & Krajcik, 1991;
Ruiz-Primo et al., 2001; Yin & Shavelson, 2004).
As stated previously, in most instances interrater agreement has been reported in
place of interrater reliability (Ruiz-Primo & Shavelson, 1996). Interrater agreement
differs from interrater reliability in that it describes the degree to which raters assign
identical ratings. In contrast interrater reliability describes the degree to which ratings
assigned by the various raters correlate with each other. Ratings assigned by two
different raters may be perfectly correlated even though none of them agree. If one rater
is harsh and the other is lenient, their mean ratings will differ, but they could still have a
high correlation.
54
Generalizability Theory
Generalizability theory is an extension of classical test theory that provides a way
to partition the total variance in a set of ratings into separate, uncorrelated parts that are
each associated with a different source of variability (Brennan, 1992, 2001; Cronbach,
Gleser, Nanda, & Rajaratnam, 1972; Shavelson & Webb, 1991). G-theory is comprised
of a generalizability study (G-study) and a decision study (D-study).
G-theory uses ANOVA to compute estimated variance components. Through the
use of ANOVA both the main effects and interaction effects of more than one factor are
computed. However, instead of computing F-ratios to test hypotheses, the ANOVA in a
G-study produces an estimate of the variance component for each main effect and each
interaction. G-theory thus goes beyond ANOVA in that it can be used to estimate the
relative percentage of measurement error from each of these effects.
G-study. Instead of simply decomposing variance attributed to a person’s ability
and variance contributed by unexplained error variance, G-theory permits the researcher
to decompose the error variance into explainable and unexplainable error components as
depicted in Equation 2. This is calculated by conducting a G-study.
Equation 1
σ2 total score = σ2
object of measurement + σ2 raters + σ2
p x r interation + σ2 residual (2)
If the study were designed to have each student’s map rated by two or more raters
on two or more occasions, then G-theory could be used to partition the total variability in
the ratings into variance components due to each of the following sources of variation:
55
(a) systematic variability between the individual students (p), (b) variability between
raters (r), and (c) variability across rating occasions (o). In addition to the variance
components for each of these main effects, G-theory permits the researcher to obtain
estimates of variance components for the interactions among these effects, including (a)
inconsistencies of raters’ rating of particular persons’ concept map (p x r), (b)
inconsistencies from one occasion to another in particular persons’ concept-map ratings
(p x o), (c) constant effect for all persons due to differences in raters’ stringency from one
occasion to another (r x o), and unexplained error (p x r x o, e). By comparing the
relative size of these estimated variance components, a researcher can determine which
sources of variation are most troublesome and which, if any, need to be addressed in an
attempt to reduce unwanted inconsistencies in the ratings.
D-study. The estimated variance components obtained from a G-study can be used
as a basis for the D-study in making decisions and applications for a particular purpose.
The G-study establishes the general characteristics of the measuring procedure, and then
the D-study assesses those characteristics in a particular decision-making context or
frame of reference. The purpose of the D-study is to make the best use of the information
provided by the G study in applying it to social science measurement decisions
(Shavelson & Webb, 1991). In a D-study, the researcher must do the following:
1. Define a universe of generalization (the number and breadth of facets to be
generalized across such facets as raters, occasions, tasks, scoring schemes, etc.).
2. Specify the proposed interpretation of the measurement: relative decisions—rank
order of individuals standing relative to one another concept-mapping scores, or
56
absolute decisions—an individual’s absolute score without regard to other student
scores.
3. Use the G-study estimates of measurement error and magnitude to evaluate and
maximize the effectiveness of each facet to minimize the error and maximize
reliability; in other words, a D-study would be conducted to project what the
reliability coefficients would be if the levels of raters or occasions were increased
or decreased. Such decisions are made to project the most cost-effective rating
design that could be used in subsequent studies.
4. Use the G-study estimates of measurement error and magnitude to evaluate
alternative D-study designs with crossed or nested, random or fixed, facets
(Shavelson & Webb, 1991).
Concept Map Research Using G-Theory
Very few researchers have utilized G-theory to analyze measurement error
associated with the use of concept maps. The sources of error that could be considered
include concept sampling, proposition sampling, task sampling, response format
sampling, occasion sampling, scoring system sampling, rater sampling, etc. (McClure et
al., 1999; Ruiz-Primo et al., 2004; Yin & Shavelson, 2004). Sources of variation could
also be calculated from the interactions between any of the preceding sources of
measurement error.
McClure et al. (1999) analyzed the error contributed to the overall variation
scores by the person-by-rater interaction. Yin & Shavelson (2004), following the
research design used by Ruiz-Primo et al. (2001) considered the interactions between
student and mapping task, student and sampled items (blank nodes and blank linking
57
phrases), and sampled items and mapping task. Outside of these researchers almost no
others have used G-theory as an analytical method in studying the reliability of concept-
mapping scores.
A fertile ground of research is available for educational researchers to use this
robust analytical method in pinpointing the sources of measurement error that are present
due to the nature of any given concept-mapping task, response format, or scoring method.
Validity
According to Messick, (1988) validity is “an overall evaluative judgment,
founded on empirical evidence and theoretical rationales, of the adequacy and
appropriateness of inferences and actions based on test scores” (p. 33). The theoretical
rationale governing the use of concept-map scores has been outlined in the first part of
this chapter. However, empirical evidence collected from concept-mapping assessments
as a demonstration of the degree to which the theoretical rationale can be substantiated, is
relatively scarce. Included in concept-mapping validity study are questions regarding the
degree to which inferences (interpretations) and actions (decisions) based on the test
scores are appropriate (Ebel & Frisbie, 1991).
Concerning concept-map assessments, Ruiz-Primo et al. (2004) asked two
questions regarding the validity of student concept maps and their scores: “(1) Does the
assessment evoke the intended behaviors? and (2) Is there a correspondence between the
intended behaviors and the performance scores?” (p. 9). The intended behaviors in this
context would consist of a student constructing a map that receives a score that to some
measurable degree reflects their organized understanding of a particular domain or sub-
domain.
58
Hence, the validity of concept-mapping assessments can be studied in an effort to
ascertain the degree to which those scores measure the attribute, trait, or ability they
purport to measure. McClure et al. (1999) explained, “for optimal validity, the concept-
mapping task must result in an artifact (a concept map) that accurately reflects the content
and organization of students’ knowledge” (p. 478). In the case of this study, the focus
was on the degree to which the student concept-map scores (generated from two
construct-a-map tasks) measured student understanding of conceptual interrelationships.
The scores become less valid when they reflect something other than this trait. Several
aspects of concept map validity have been studied by concept-mapping researchers,
including content, criterion, and construct validity.
Evidence of Content-Related Validity
Evidence of content-related validity is collected in an attempt to determine to
what extent the items of an assessment task constitute a representative sample drawn
from the domain being measured. Most tests consist of a sample rather than a census of
all of the possible test items in a content domain. This is because the majority of content
domains contain more items than can feasibly be tested all at once or over time. Well-
designed concept-map assessments are developed after having identified all of the
concepts and propositions within the boundaries of a given domain. According to Ruiz-
Primo and Shavelson (1996),one important criterion for evaluating content validity is
whether domain experts were used at the outset to judge the representativeness of
concepts and linking phrases of expert maps drawn from the target domain. This step is
evident in a study conducted by Rice et al. (1998). In their effort to link concept-map
items with instructional objectives, they created a table of specifications from which all
59
test items including concept-map assessment items were sampled. As noted by their
study along with recommendations made by Ruiz-Primo and Shavelson (1996), ensuring
that test scores evidence a high degree of content validity should occur in the early stages
of test development.
Once the boundaries of the domain are established, key concepts and/or
propositions are randomly selected for use on a test. What is tested (concepts, linking
phrases, or both) is contingent on the learning outcomes to be assessed along with the
corresponding mapping-task that is to be used. For example, Ruiz-Primo et al. (2001)
created an expert map of the key concepts and linking phrases representing the structural
interrelationships of concepts from a unit entitled “Chemical Names and Formulas'' in a
high school chemistry course. The researchers then created an expert map that contained
all of the key concepts from this unit. Three concept-map assessments were then created,
two of which were developed using concept sampling.
In the case of the first assessment, the fill-in-the-node task (see Figure 6), a
certain number of concepts or nodes were randomly blanked out. With the second
assessment, the fill-in-the-link task (see Figure 5), the linking phrases were likewise
randomly blanked out. These blanked out components of the map represented a sample
of the domain that students were required to account for on the test. However with the
third assessment, the construct-a-map task, they did not sample the concepts in this
manner.
The construct-a-map task (see Figure 9), which is the task under investigation in
this study, by its very nature does not permit the type of concept or linking-phrase
sampling just described. That said, other methods could be used for sampling concepts
60
with this assessment. First, a list of key concepts from a strongly interrelated domain
could be randomly generated. The strength of the inter-associations between the
concepts is crucial here; otherwise, if a series of concepts with weak associations are
randomly selected the propositions will either be too general, not important, and/or
forced. Second, if the domain possesses a series of strongly associated clusters of
concepts, then the clusters rather than the concepts could be sampled. The unique nature
of the content structure and conceptual interrelationships in a given domain must be taken
into account before a random sample of concepts or clusters is drawn with this task.
Most researchers create a convenient sample of concepts for this type of task. While
practically more feasible, it is more challenging to ensure content validity when the
concepts and/or the propositions are not randomly sampled.
Evidence of Criterion-Related Validity
To establish criterion validity, scores from a new measure are correlated with the
scores from a criterion measure known to be valid. When the criterion measure is
collected at the same time as the measure being validated the goal is to establish
concurrent validity; when the criterion measure is collected later, the goal is to establish
predictive validity. The challenge associated with attempts to establish criterion validity
is to find another measure that has been shown to generate scores that validly measure the
same construct or trait the target measure under investigation is also designed to assess.
If the scores of the criterion measure have been shown to be valid then this begs the
question, why not use the criterion measure instead of the measure it is being tested
against (e.g., concept-map assessments)? In the case of concept-map assessment scores,
the criterion measures used to establish their validity are either too time-consuming to
61
score (i.e., interviews), are clouded by other constructs (i.e., writing ability with essays),
or do not manifest evidence of students’ conceptual frameworks (i.e., multiple-choice
questions). In other words, while sharing some of the facilitative properties of other
measures to assess organized understanding, it is postulated that concept maps provide
uniquely viable evidence beyond what other criterion measures may contribute. It is for
these and other reasons that concept-map assessments are viewed as an important
alternative source of information regarding students’ conceptual frameworks.
Researchers have hypothesized that concept-map assessment scores will never
correlate perfectly with scores on other traditional assessments, because they measure
more directly student-organized, structural, or connected understanding (Novak &
Gowin, 1984). Novak and Gowin argued that the low correlations between scores on
concept-map and multiple-choice items in their studies provided evidence that concept
maps measure something traditional items cannot or do not. However, more recent
studies have shown concept maps to have much higher correlations with traditional test
items (Rice et al., 1998) and standardized tests (Anderson & Huang, 1989) then was
previously reported by Novak and Gowin. It is important to note that the scoring method
in both of these studies did not include scoring map hierarchy as was the case with Novak
and Gowin’s scoring scheme but focused exclusively on scoring the propositions. Rice et
al. observed the following with regards to this point: “the method of scoring maps,
particularly the criteria for allotting points, is a critical determinant of the strength of the
relationship between map scores and scores on other assessments” (p. 1107). As
established earlier, accounting for map hierarchy is a challenging venture. By removing
62
this scoring feature, score correlations between concept maps and traditional test items
have been reported to increase dramatically.
While it is possible that concept-map scores reflect more of a student’s connected
understanding than other measures, it is also possible that other measures that take into
account proposition accuracy may also measure something of student organized
understanding as well (Rice et al., 1998). If this is the case, then studying the criterion
validity of concept mapping and another valid measure test scores would have merit.
Evidence of Construct-Related Validity
A construct is a theoretical conceptualization posited to drive some facet of
human behavior. Constructs, such as self-efficacy, extraversion, or knowledge structures
are posited by social scientists to be driving observed variables (e.g., charitable acts,
effective problem solving). Building a case for the construct validity of a measure is the
ultimate objective of all test developers. The process of providing evidence of construct-
related validity is called construct validation. Ebel and Frisbie (1991) describe construct
validation as “the process of gathering evidence to support the contention that a given test
indeed measures the psychological construct the maker’s intend for it to measure” (p.
108). It is important to note that efforts to build a case for construct-related validity
almost always include evidence of content and criterion-related validity (Messick, 1995).
Construct validation begins with a working definition of the construct. The
construct definition requires careful consideration, which includes theoretical and
empirical testing in an effort to represent conceptually the construct of interest. As
described in an earlier section of this chapter, concept-map assessments are designed to
tap into the construct of a person’s conceptual framework. Ruiz-Primo and Shavelson
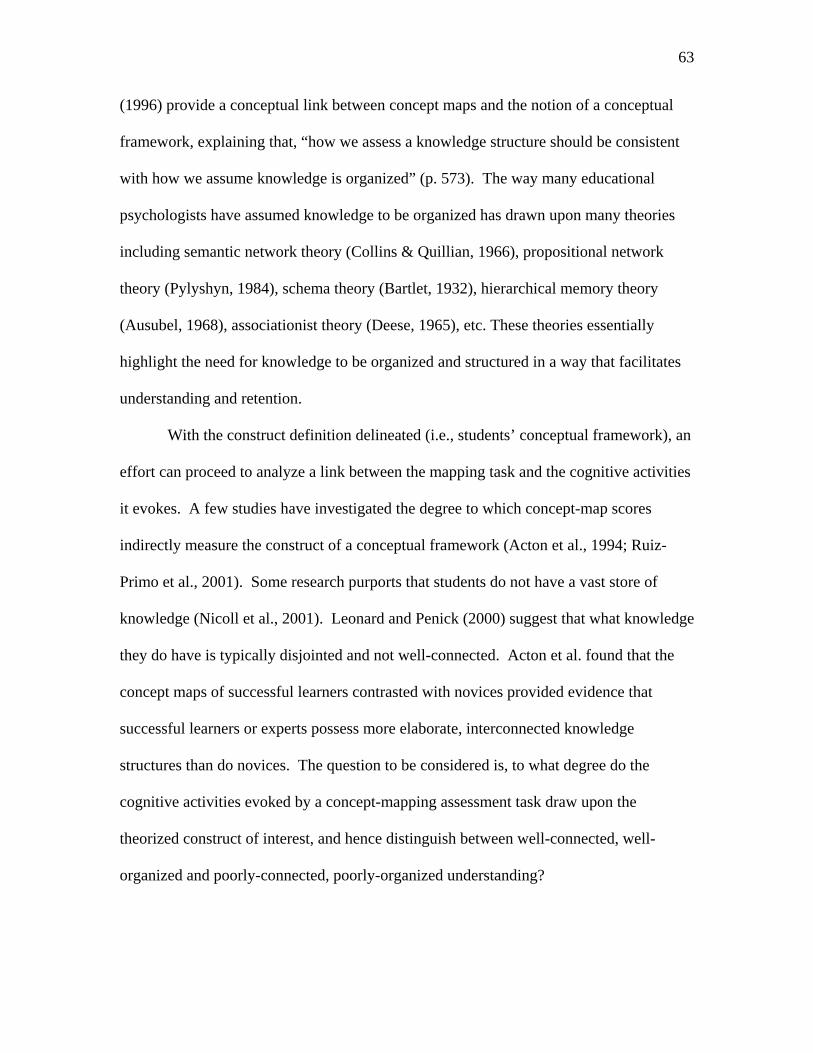
63
(1996) provide a conceptual link between concept maps and the notion of a conceptual
framework, explaining that, “how we assess a knowledge structure should be consistent
with how we assume knowledge is organized” (p. 573). The way many educational
psychologists have assumed knowledge to be organized has drawn upon many theories
including semantic network theory (Collins & Quillian, 1966), propositional network
theory (Pylyshyn, 1984), schema theory (Bartlet, 1932), hierarchical memory theory
(Ausubel, 1968), associationist theory (Deese, 1965), etc. These theories essentially
highlight the need for knowledge to be organized and structured in a way that facilitates
understanding and retention.
With the construct definition delineated (i.e., students’ conceptual framework), an
effort can proceed to analyze a link between the mapping task and the cognitive activities
it evokes. A few studies have investigated the degree to which concept-map scores
indirectly measure the construct of a conceptual framework (Acton et al., 1994; Ruiz-
Primo et al., 2001). Some research purports that students do not have a vast store of
knowledge (Nicoll et al., 2001). Leonard and Penick (2000) suggest that what knowledge
they do have is typically disjointed and not well-connected. Acton et al. found that the
concept maps of successful learners contrasted with novices provided evidence that
successful learners or experts possess more elaborate, interconnected knowledge
structures than do novices. The question to be considered is, to what degree do the
cognitive activities evoked by a concept-mapping assessment task draw upon the
theorized construct of interest, and hence distinguish between well-connected, well-
organized and poorly-connected, poorly-organized understanding?
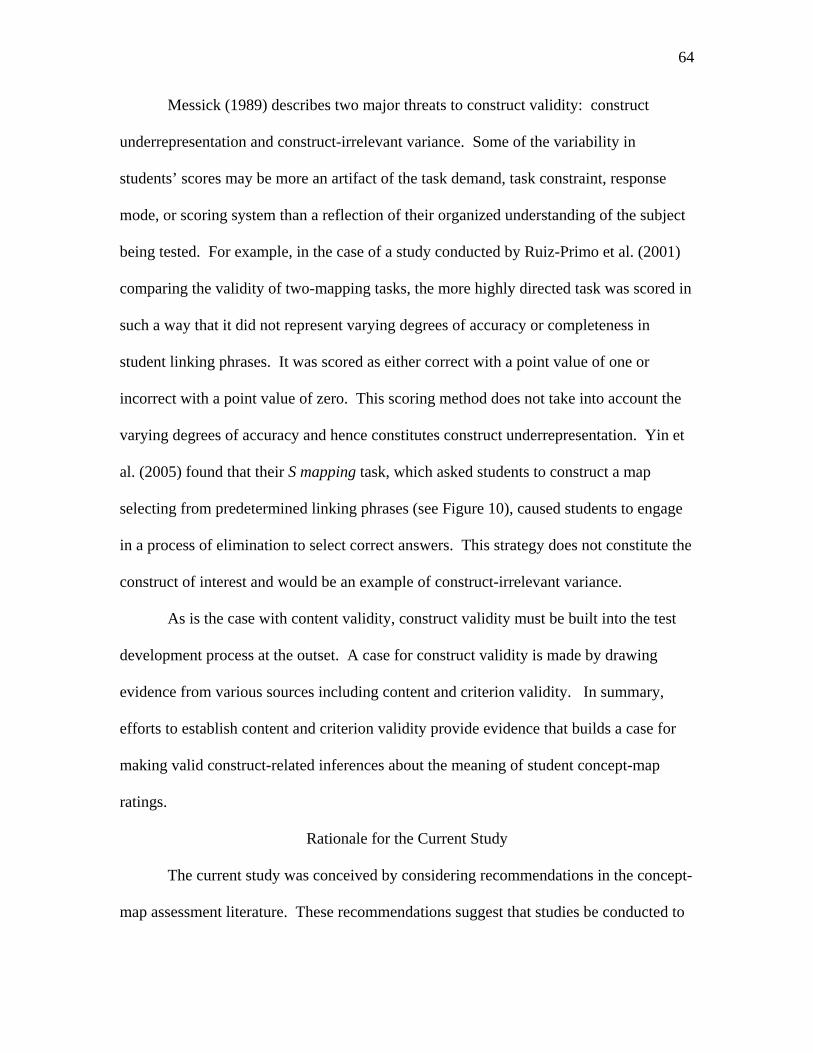
64
Messick (1989) describes two major threats to construct validity: construct
underrepresentation and construct-irrelevant variance. Some of the variability in
students’ scores may be more an artifact of the task demand, task constraint, response
mode, or scoring system than a reflection of their organized understanding of the subject
being tested. For example, in the case of a study conducted by Ruiz-Primo et al. (2001)
comparing the validity of two-mapping tasks, the more highly directed task was scored in
such a way that it did not represent varying degrees of accuracy or completeness in
student linking phrases. It was scored as either correct with a point value of one or
incorrect with a point value of zero. This scoring method does not take into account the
varying degrees of accuracy and hence constitutes construct underrepresentation. Yin et
al. (2005) found that their S mapping task, which asked students to construct a map
selecting from predetermined linking phrases (see Figure 10), caused students to engage
in a process of elimination to select correct answers. This strategy does not constitute the
construct of interest and would be an example of construct-irrelevant variance.
As is the case with content validity, construct validity must be built into the test
development process at the outset. A case for construct validity is made by drawing
evidence from various sources including content and criterion validity. In summary,
efforts to establish content and criterion validity provide evidence that builds a case for
making valid construct-related inferences about the meaning of student concept-map
ratings.
Rationale for the Current Study
The current study was conceived by considering recommendations in the concept-
map assessment literature. These recommendations suggest that studies be conducted to
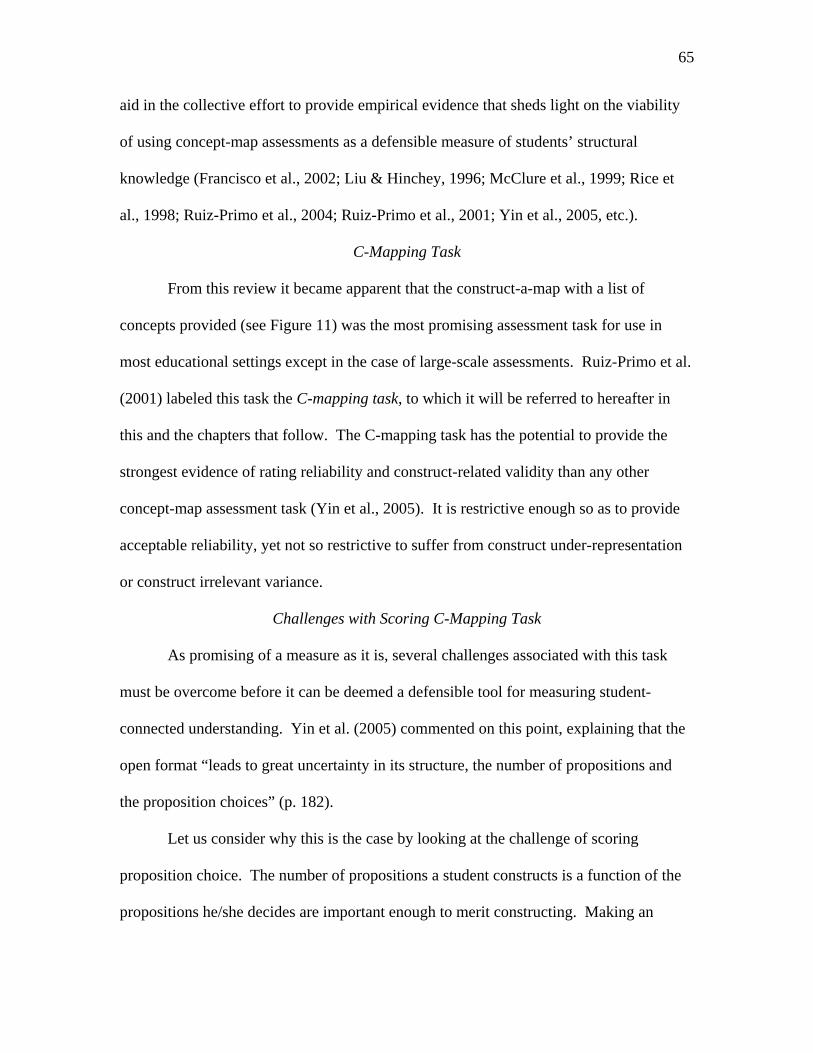
65
aid in the collective effort to provide empirical evidence that sheds light on the viability
of using concept-map assessments as a defensible measure of students’ structural
knowledge (Francisco et al., 2002; Liu & Hinchey, 1996; McClure et al., 1999; Rice et
al., 1998; Ruiz-Primo et al., 2004; Ruiz-Primo et al., 2001; Yin et al., 2005, etc.).
C-Mapping Task
From this review it became apparent that the construct-a-map with a list of
concepts provided (see Figure 11) was the most promising assessment task for use in
most educational settings except in the case of large-scale assessments. Ruiz-Primo et al.
(2001) labeled this task the C-mapping task, to which it will be referred to hereafter in
this and the chapters that follow. The C-mapping task has the potential to provide the
strongest evidence of rating reliability and construct-related validity than any other
concept-map assessment task (Yin et al., 2005). It is restrictive enough so as to provide
acceptable reliability, yet not so restrictive to suffer from construct under-representation
or construct irrelevant variance.
Challenges with Scoring C-Mapping Task
As promising of a measure as it is, several challenges associated with this task
must be overcome before it can be deemed a defensible tool for measuring student-
connected understanding. Yin et al. (2005) commented on this point, explaining that the
open format “leads to great uncertainty in its structure, the number of propositions and
the proposition choices” (p. 182).
Let us consider why this is the case by looking at the challenge of scoring
proposition choice. The number of propositions a student constructs is a function of the
propositions he/she decides are important enough to merit constructing. Making an
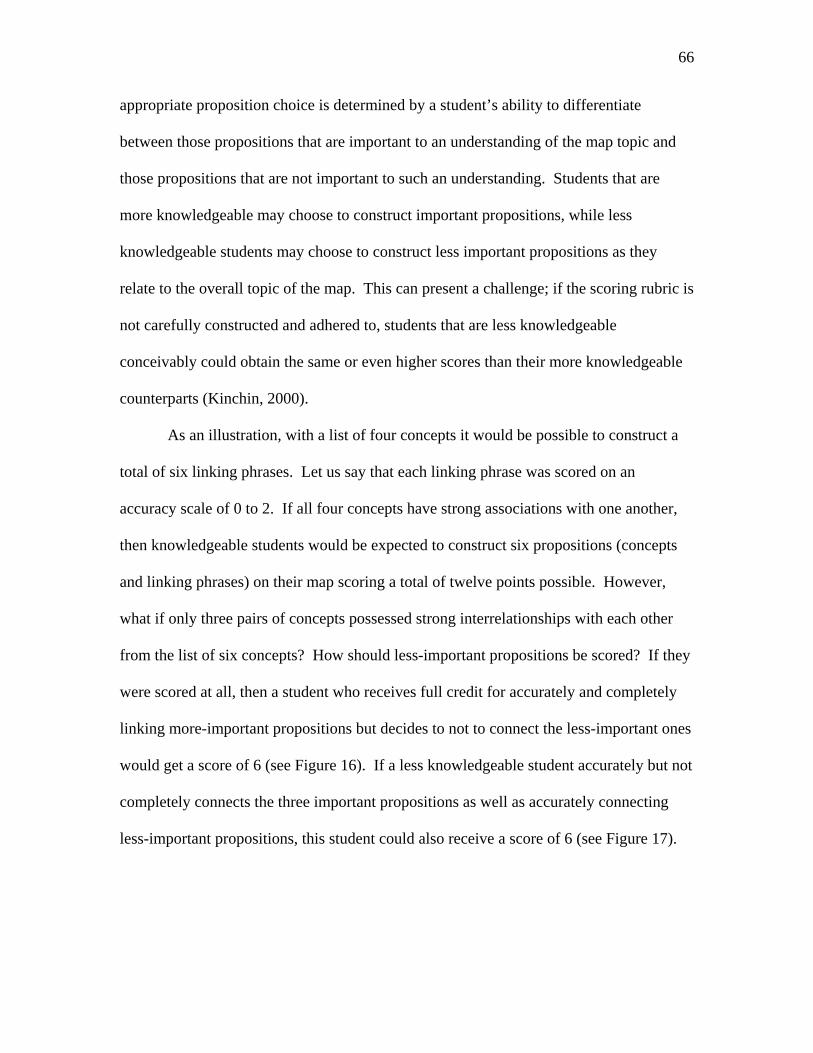
66
appropriate proposition choice is determined by a student’s ability to differentiate
between those propositions that are important to an understanding of the map topic and
those propositions that are not important to such an understanding. Students that are
more knowledgeable may choose to construct important propositions, while less
knowledgeable students may choose to construct less important propositions as they
relate to the overall topic of the map. This can present a challenge; if the scoring rubric is
not carefully constructed and adhered to, students that are less knowledgeable
conceivably could obtain the same or even higher scores than their more knowledgeable
counterparts (Kinchin, 2000).
As an illustration, with a list of four concepts it would be possible to construct a
total of six linking phrases. Let us say that each linking phrase was scored on an
accuracy scale of 0 to 2. If all four concepts have strong associations with one another,
then knowledgeable students would be expected to construct six propositions (concepts
and linking phrases) on their map scoring a total of twelve points possible. However,
what if only three pairs of concepts possessed strong interrelationships with each other
from the list of six concepts? How should less-important propositions be scored? If they
were scored at all, then a student who receives full credit for accurately and completely
linking more-important propositions but decides to not to connect the less-important ones
would get a score of 6 (see Figure 16). If a less knowledgeable student accurately but not
completely connects the three important propositions as well as accurately connecting
less-important propositions, this student could also receive a score of 6 (see Figure 17).
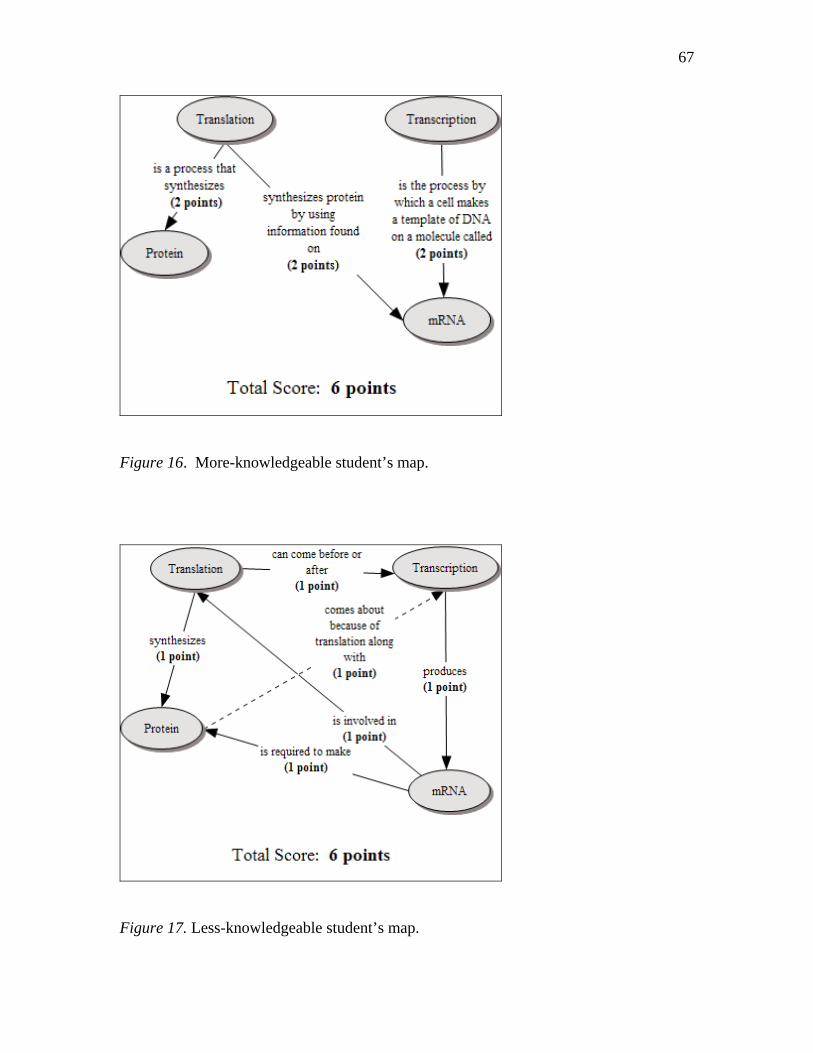
67
Figure 16. More-knowledgeable student’s map.
Figure 17. Less-knowledgeable student’s map.
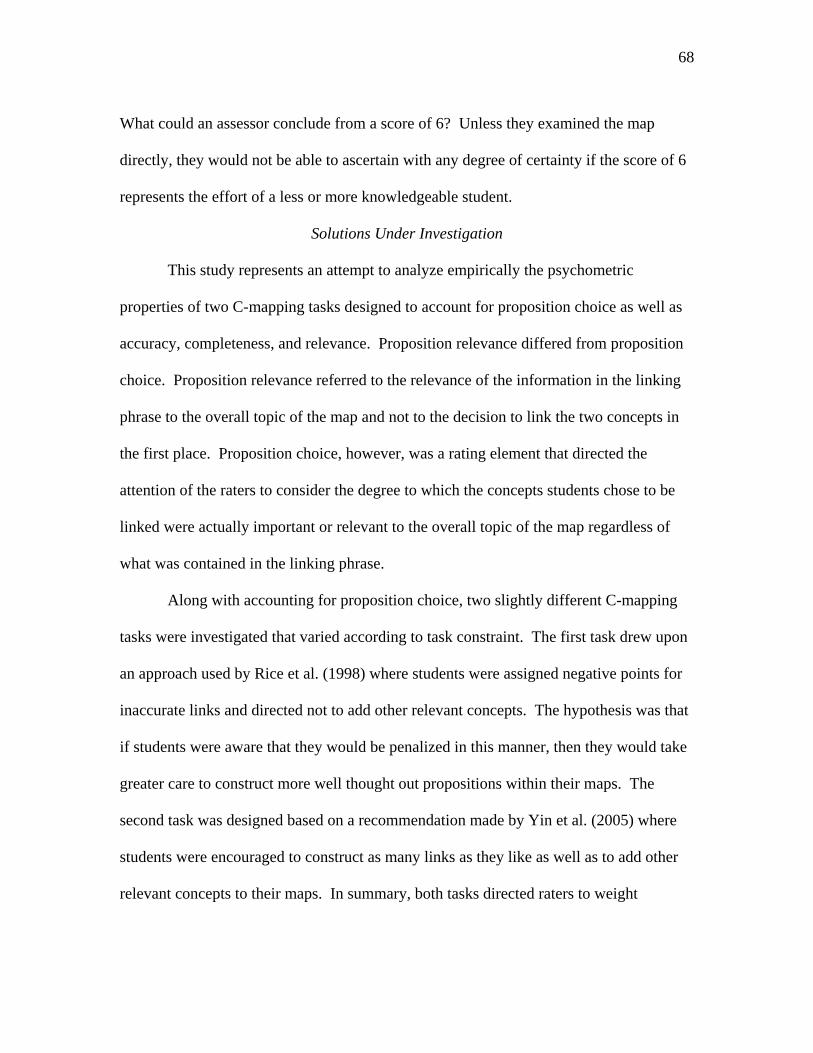
68
What could an assessor conclude from a score of 6? Unless they examined the map
directly, they would not be able to ascertain with any degree of certainty if the score of 6
represents the effort of a less or more knowledgeable student.
Solutions Under Investigation
This study represents an attempt to analyze empirically the psychometric
properties of two C-mapping tasks designed to account for proposition choice as well as
accuracy, completeness, and relevance. Proposition relevance differed from proposition
choice. Proposition relevance referred to the relevance of the information in the linking
phrase to the overall topic of the map and not to the decision to link the two concepts in
the first place. Proposition choice, however, was a rating element that directed the
attention of the raters to consider the degree to which the concepts students chose to be
linked were actually important or relevant to the overall topic of the map regardless of
what was contained in the linking phrase.
Along with accounting for proposition choice, two slightly different C-mapping
tasks were investigated that varied according to task constraint. The first task drew upon
an approach used by Rice et al. (1998) where students were assigned negative points for
inaccurate links and directed not to add other relevant concepts. The hypothesis was that
if students were aware that they would be penalized in this manner, then they would take
greater care to construct more well thought out propositions within their maps. The
second task was designed based on a recommendation made by Yin et al. (2005) where
students were encouraged to construct as many links as they like as well as to add other
relevant concepts to their maps. In summary, both tasks directed raters to weight

69
propositions based on their level of importance and account for other key rating elements
under different mapping constraints.
70
CHAPTER 3: METHOD
Study Context
In the summer of 2006, Dr. Gary Booth, professor of Biology at Brigham Young
University, expressed interest in pursuing ongoing research designed to provide
information regarding the use of concept maps as an instructional and evaluative tool in
his integrative biology course. He had used concept maps for both instructional and
assessment purposes in his classes during the previous two years. Hence, it was not a
new intervention introduced for the purposes of this study. During the Fall 2005
semester, the author conducted a pilot study in the same course taught by Dr. Booth. The
study was conducted with the purpose of better understanding the variables that would
likely impact the success of the current study.
Participants
The participants were selected from 120 freshman academy students enrolled in
Dr. Booth’s introductory biology course at Brigham Young University. Freshman
academy is a learning community consisting of a group of first-year students who share
three or more linked classes and participate in activities that are designed to promote
unity and enhance the academic experience. The demographic composition of freshman
academy students usually reflects that of the incoming freshman class in gender, major
preference, and academic preparation. All incoming freshmen were eligible to participate
in the program on a first-come, first-served basis. The majority of the students came from
the western United States, with large minority from other parts of the country and a small
number of international students. International students were required to attain a high
level of English proficiency in order to be enrolled at the university.
71
All 120 students were invited to sign a document of informed consent (Appendix
A) expressing their willingness to participate in the study. Student participation was
classified into two categories: (a) instructional activities and exercises designed to assist
students in organizing the concepts they learn through the use of concept maps and (b)
evaluative activities designed to assess their organized understanding of the course
concepts. The instructional and evaluative activities were refined based on the
recommendations that came from the pilot study. While the instructional activities were
not the focus of the study, they were deemed critical in helping the students become
familiar with concept-mapping conventions so that ratings generated from the concept-
map assessments would have the best chance possible of reflecting their organized
understanding. Since the instructional portion of the course was not under the purview of
the author, student participation in using concept maps as an instructional tool was not
made part of the informed consent document. The only activities introduced by the study
were student interviews conducted after both midterm exams and the rescoring of
concept-mapping and essay test items on those same exams. Student grades were not
affected by the outcome of the rescoring.
Instrumentation
On both midterm exams three tasks were used as part of the implementation of the
study: Two C-mapping, two essay tasks, and a set of interview questions. Hence, a total
of ten assessment tasks were designed and developed for the purposes of this study.
Under Dr. Booth’s direction the teaching assistants selected key concepts from each unit.
The learning of these concepts and their interrelationship with other key concepts were
deemed critical by the teaching assistants in gaining a meaningful understanding of each
72
unit. Before each exam a list of 13 to 16 concepts were selected from one unit to
comprise the list of concepts to be used in one C-mapping and its corresponding essay
and structured interview tasks.
Concept-Map Measures
The task and rubric for both C-mapping tasks will be described in this section. These
elements were developed iteratively during the pilot study. The rubrics for both tasks
accounted for proposition importance by directing the rater to consider the degree to
which two concepts were closely related within the context of the topic of the map. As
noted these rubrics also accounted for proposition accuracy, completeness, and relevance.
C-mapping Task 1
The first C-mapping task on the first and second midterm exams directed students
to make as many connections as they desired from a list of concepts (Appendix B & C).
However, they were instructed that incorrect propositions would be penalized by
deducting one-half point from their score. Students were directed not to add other
relevant concepts to their map and were provided a copy of the rating rubric as a guide as
they constructed each proposition.
The rubric used for C-mapping task 1 was essentially the same for both exams
with slight modifications made to the rubric on the second exam. These changes were
made in an attempt to overcome rating challenges discovered after conducting a
generalizability study after the first midterm exam. For example C-mapping task 1 on the
first exam directed raters to consider whether students communicated accurate and
essential relationships between two closely related concepts. Several of the raters
suggested to the author that students be reminded on the second midterm concept-
73
mapping task that their linking phrases would be compared to the information set forth in
the course text (syllabus), lecture or lab sessions. Therefore, the new description for one
of the levels of the rubric on the second-exam stated, “Communicates accurately the
essential relationship between two concepts as described in the syllabus, class lecture, or
lab” (Appendix C).
C-mapping Task 2
The second task directed students to make as many connections as they desired;
however, in the case of this task no negative points were assigned for inaccurate
propositions (Appendix D & E). Unlike the previous task students were encouraged to
add other relevant concepts if they so desired. Raters were then on the look out for two
relevant concepts in particular that when connected to one of the concepts from the list
would constitute an important proposition. As was the case with the first C-mapping task
rubric, similar adjustments were made to the second C-mapping task rubric on the second
midterm exam.
Criterion Measures
Essays
Task 1. The first essay item directed students to explain the interrelationships
between the following concepts: activation energy, enzymes, competitive inhibition, and
non-competitive inhibition (Appendix F). Note that these four concepts were also among
those concepts listed on the first C-mapping task.
A slight modification was made to the first essay task on the second midterm
exam. Students were directed to write an essay connecting three concepts that were not
closely related but represented key concepts in one of the units of the course. They were
74
then encouraged to connect the unrelated concepts to one another using additional
relevant concepts. The first essay task on the second exam directed students to explain
the interrelationships between the concepts anti-codons, protein, and transcription
(Appendix G). After several trials this approach was considered to be an effective way
to distinguish between knowledgeable and less knowledgeable students. However,
during the course of the study there were a few instances where students made
connections that the teaching assistants had not anticipated, and hence slightly
confounded one of the analyses. The specifics of these confounds will be reported in
chapter 5.
Task 2. The second essay task on the first midterm exam directed students to
express the interrelationships between the concepts: ATP, ADP, Energy, and Terminal
Phosphate (Appendix H). These four concepts were a part of the list from the second
construct-a-map task. The second essay task on the second midterm exam directed
students to express the interrelationships between the concepts: Anti-bodies, exotoxins,
and microphages (Appendix I). These three concepts were among those concepts form
the list of concepts on the corresponding C-mapping task. The second essay task on the
second exam followed the same structure as the first essay task on the same exam.
Interviews
It was determined at the outset of the study that structured interviews would be
the most appropriate type of interviewing method. This decision was based on the need
to provide specific prompts that would evoke specific expressions regarding conceptual
interrelationships. Within a week after both midterm exams, a sample of students was
invited to respond to 14 and 10 interview questions respectively (Appendix J & K). Each
75
of the twelve interview questions directed students to verbally make meaningful
connections between two to four concepts.
The last two interview questions invited the students to share their impressions of
concept mapping as an instructional and evaluative tool in the course. The first set of
interview questions dealt with interrelationships between concepts found on the first C-
mapping task and the second set of interview questions dealt with interrelationships
between concepts found on the second C-mapping task.
Rater Training
Raters made up a key component of what constitutes the instruments of this study.
The raters and rubrics taken together constituted the ten rating instruments. Along with
their teaching assistant responsibilities, four of Dr. Booth’s teaching assistants were hired
as concept-mapping raters. Three of the four raters had rated concept maps the previous
year during the pilot study along with essays and interview transcripts.
The teaching assistants were retrained on how to construct concept maps during
the first week of the semester. An instructional packet (Appendix L) was used to guide
them through the process of map construction. During the training session the author
rated several propositions using the rubric from the first C-mapping task. Raters were
invited to then rate five other propositions independently of each other. Afterwards each
rater reported their ratings. Discrepant ratings were analyzed with each rater explaining
their rating rationale. This process continued until a consensus was achieved. The same
rater training was implemented for both essays and interview-generated data. Hence, a
person-by-rater-by-occasion fully-crossed design was conducted so as to run G and D-
studies on the essay and interview transcript ratings.
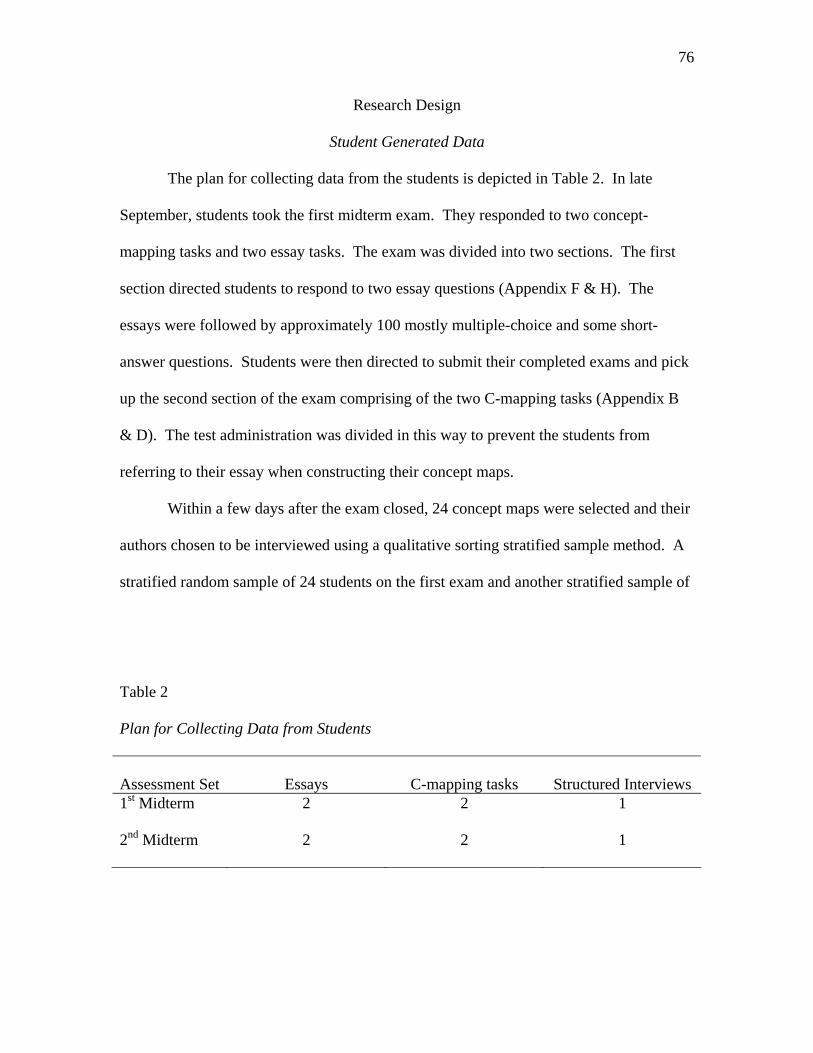
76
Research Design
Student Generated Data
The plan for collecting data from the students is depicted in Table 2. In late
September, students took the first midterm exam. They responded to two concept-
mapping tasks and two essay tasks. The exam was divided into two sections. The first
section directed students to respond to two essay questions (Appendix F & H). The
essays were followed by approximately 100 mostly multiple-choice and some short-
answer questions. Students were then directed to submit their completed exams and pick
up the second section of the exam comprising of the two C-mapping tasks (Appendix B
& D). The test administration was divided in this way to prevent the students from
referring to their essay when constructing their concept maps.
Within a few days after the exam closed, 24 concept maps were selected and their
authors chosen to be interviewed using a qualitative sorting stratified sample method. A
stratified random sample of 24 students on the first exam and another stratified sample of
Table 2
Plan for Collecting Data from Students
Assessment Set
Essays
C-mapping tasks
Structured Interviews
1st Midterm
2 2 1
2nd Midterm
2 2 1
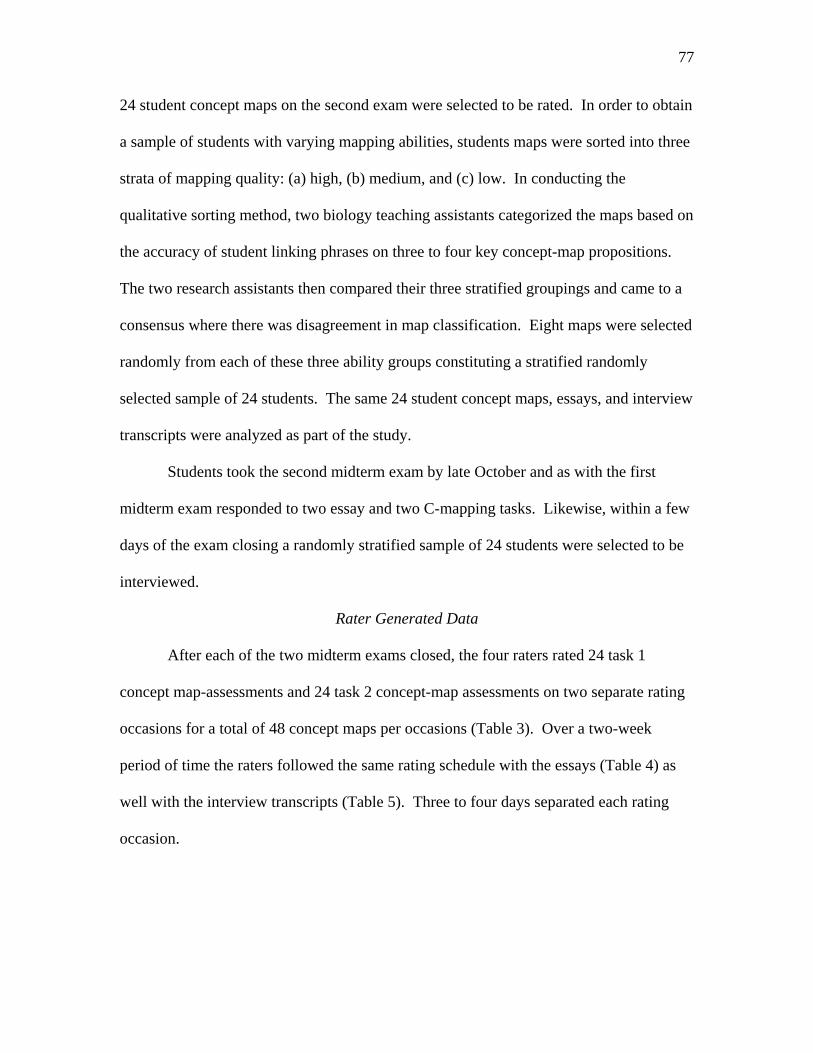
77
24 student concept maps on the second exam were selected to be rated. In order to obtain
a sample of students with varying mapping abilities, students maps were sorted into three
strata of mapping quality: (a) high, (b) medium, and (c) low. In conducting the
qualitative sorting method, two biology teaching assistants categorized the maps based on
the accuracy of student linking phrases on three to four key concept-map propositions.
The two research assistants then compared their three stratified groupings and came to a
consensus where there was disagreement in map classification. Eight maps were selected
randomly from each of these three ability groups constituting a stratified randomly
selected sample of 24 students. The same 24 student concept maps, essays, and interview
transcripts were analyzed as part of the study.
Students took the second midterm exam by late October and as with the first
midterm exam responded to two essay and two C-mapping tasks. Likewise, within a few
days of the exam closing a randomly stratified sample of 24 students were selected to be
interviewed.
Rater Generated Data
After each of the two midterm exams closed, the four raters rated 24 task 1
concept map-assessments and 24 task 2 concept-map assessments on two separate rating
occasions for a total of 48 concept maps per occasions (Table 3). Over a two-week
period of time the raters followed the same rating schedule with the essays (Table 4) as
well with the interview transcripts (Table 5). Three to four days separated each rating
occasion.
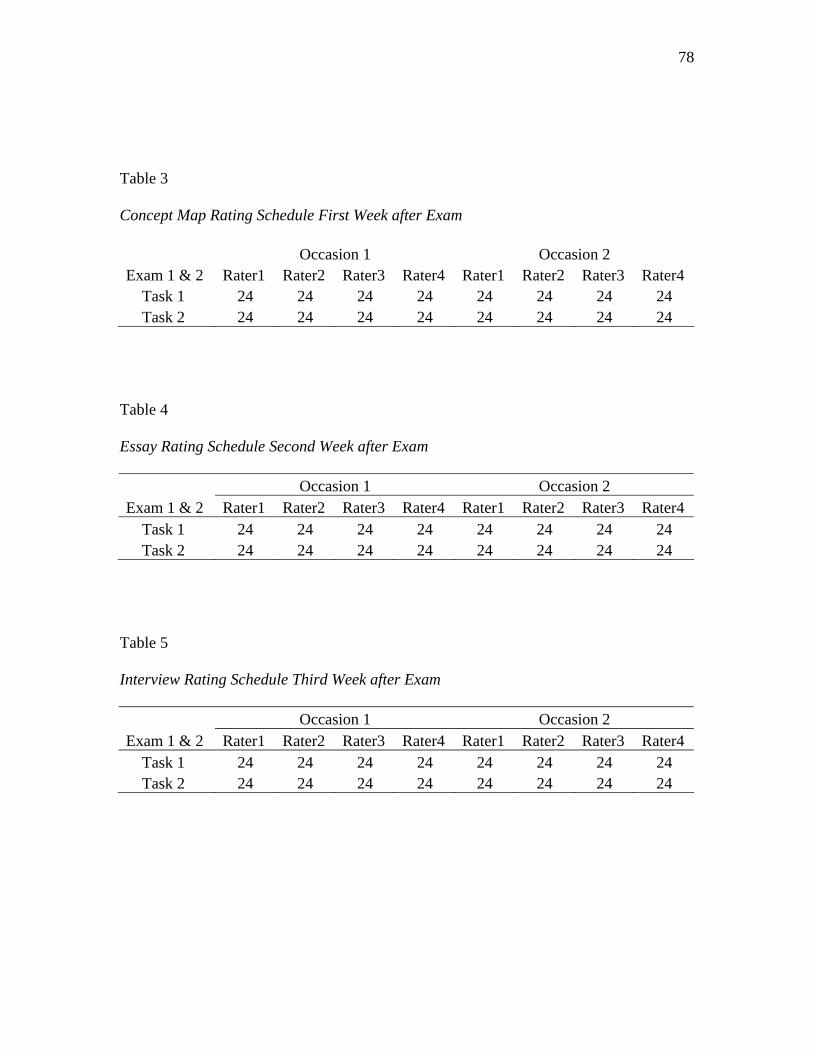
78
Table 3
Concept Map Rating Schedule First Week after Exam
Occasion 1 Occasion 2 Exam 1 & 2 Rater1 Rater2 Rater3 Rater4 Rater1 Rater2 Rater3 Rater4
Task 1 24 24 24 24 24 24 24 24 Task 2 24 24 24 24 24 24 24 24
Table 4
Essay Rating Schedule Second Week after Exam
Occasion 1 Occasion 2 Exam 1 & 2 Rater1 Rater2 Rater3 Rater4 Rater1 Rater2 Rater3 Rater4
Task 1 24 24 24 24 24 24 24 24 Task 2 24 24 24 24 24 24 24 24
Table 5
Interview Rating Schedule Third Week after Exam
Occasion 1 Occasion 2 Exam 1 & 2 Rater1 Rater2 Rater3 Rater4 Rater1 Rater2 Rater3 Rater4
Task 1 24 24 24 24 24 24 24 24 Task 2 24 24 24 24 24 24 24 24
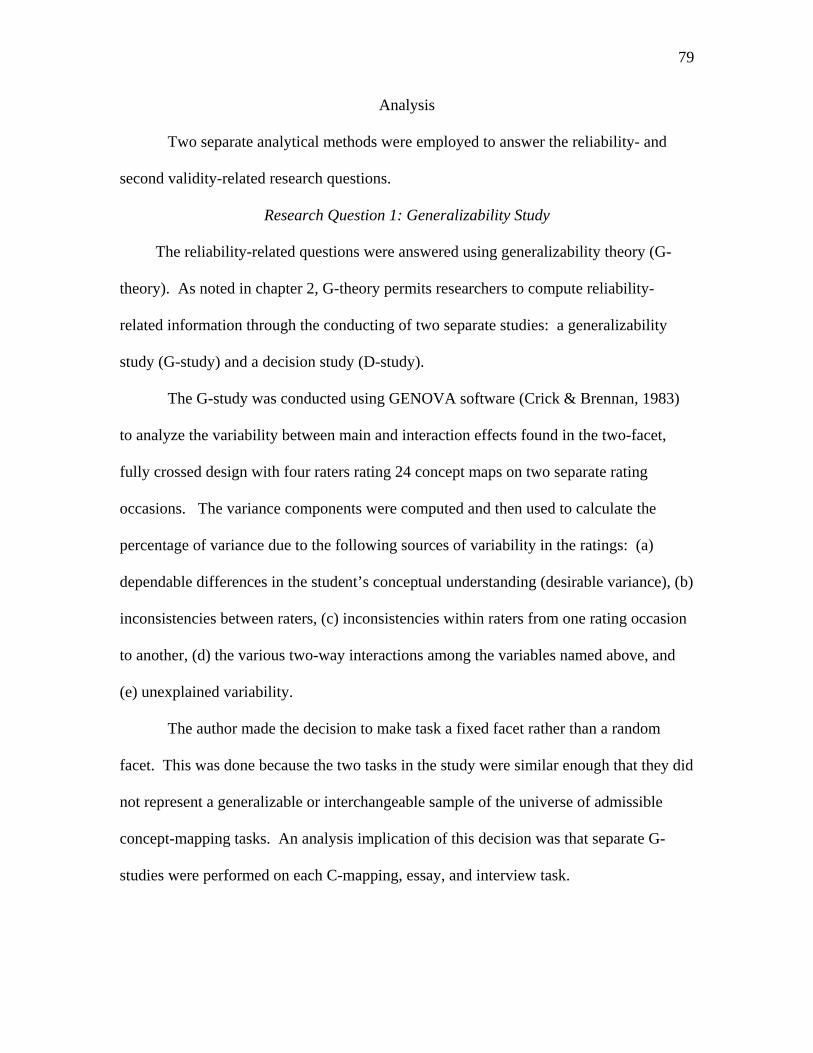
79
Analysis
Two separate analytical methods were employed to answer the reliability- and
second validity-related research questions.
Research Question 1: Generalizability Study
The reliability-related questions were answered using generalizability theory (G-
theory). As noted in chapter 2, G-theory permits researchers to compute reliability-
related information through the conducting of two separate studies: a generalizability
study (G-study) and a decision study (D-study).
The G-study was conducted using GENOVA software (Crick & Brennan, 1983)
to analyze the variability between main and interaction effects found in the two-facet,
fully crossed design with four raters rating 24 concept maps on two separate rating
occasions. The variance components were computed and then used to calculate the
percentage of variance due to the following sources of variability in the ratings: (a)
dependable differences in the student’s conceptual understanding (desirable variance), (b)
inconsistencies between raters, (c) inconsistencies within raters from one rating occasion
to another, (d) the various two-way interactions among the variables named above, and
(e) unexplained variability.
The author made the decision to make task a fixed facet rather than a random
facet. This was done because the two tasks in the study were similar enough that they did
not represent a generalizable or interchangeable sample of the universe of admissible
concept-mapping tasks. An analysis implication of this decision was that separate G-
studies were performed on each C-mapping, essay, and interview task.
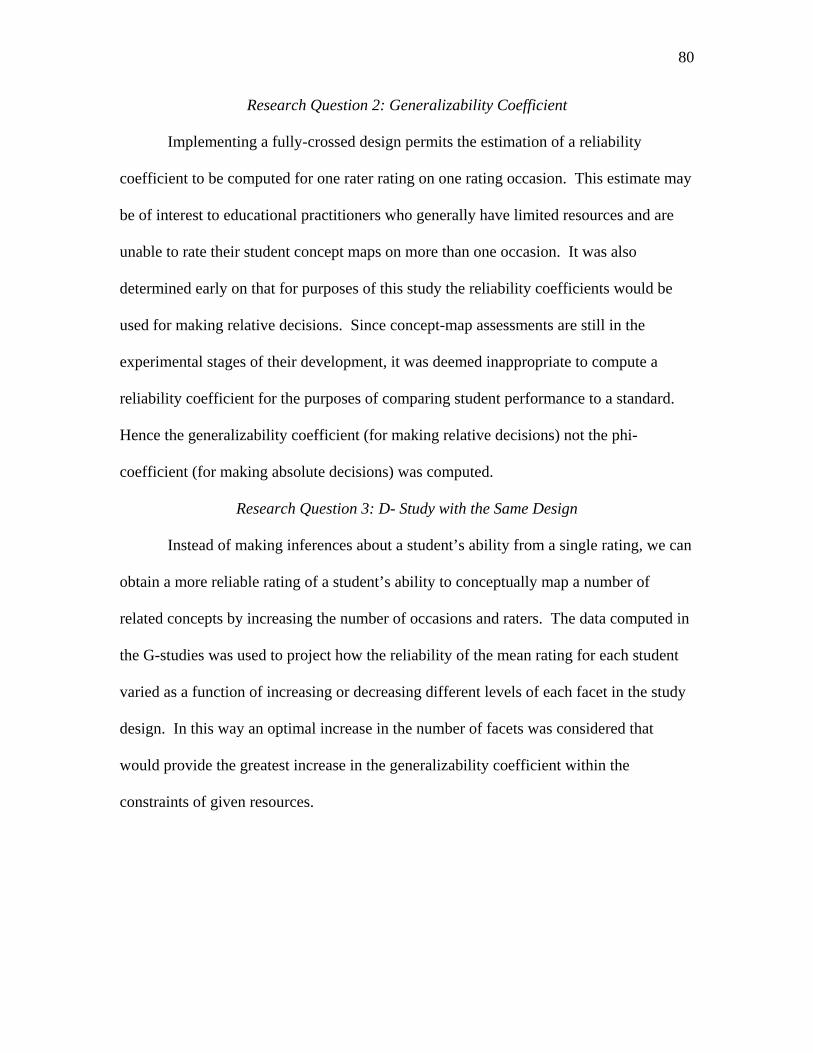
80
Research Question 2: Generalizability Coefficient
Implementing a fully-crossed design permits the estimation of a reliability
coefficient to be computed for one rater rating on one rating occasion. This estimate may
be of interest to educational practitioners who generally have limited resources and are
unable to rate their student concept maps on more than one occasion. It was also
determined early on that for purposes of this study the reliability coefficients would be
used for making relative decisions. Since concept-map assessments are still in the
experimental stages of their development, it was deemed inappropriate to compute a
reliability coefficient for the purposes of comparing student performance to a standard.
Hence the generalizability coefficient (for making relative decisions) not the phi-
coefficient (for making absolute decisions) was computed.
Research Question 3: D- Study with the Same Design
Instead of making inferences about a student’s ability from a single rating, we can
obtain a more reliable rating of a student’s ability to conceptually map a number of
related concepts by increasing the number of occasions and raters. The data computed in
the G-studies was used to project how the reliability of the mean rating for each student
varied as a function of increasing or decreasing different levels of each facet in the study
design. In this way an optimal increase in the number of facets was considered that
would provide the greatest increase in the generalizability coefficient within the
constraints of given resources.
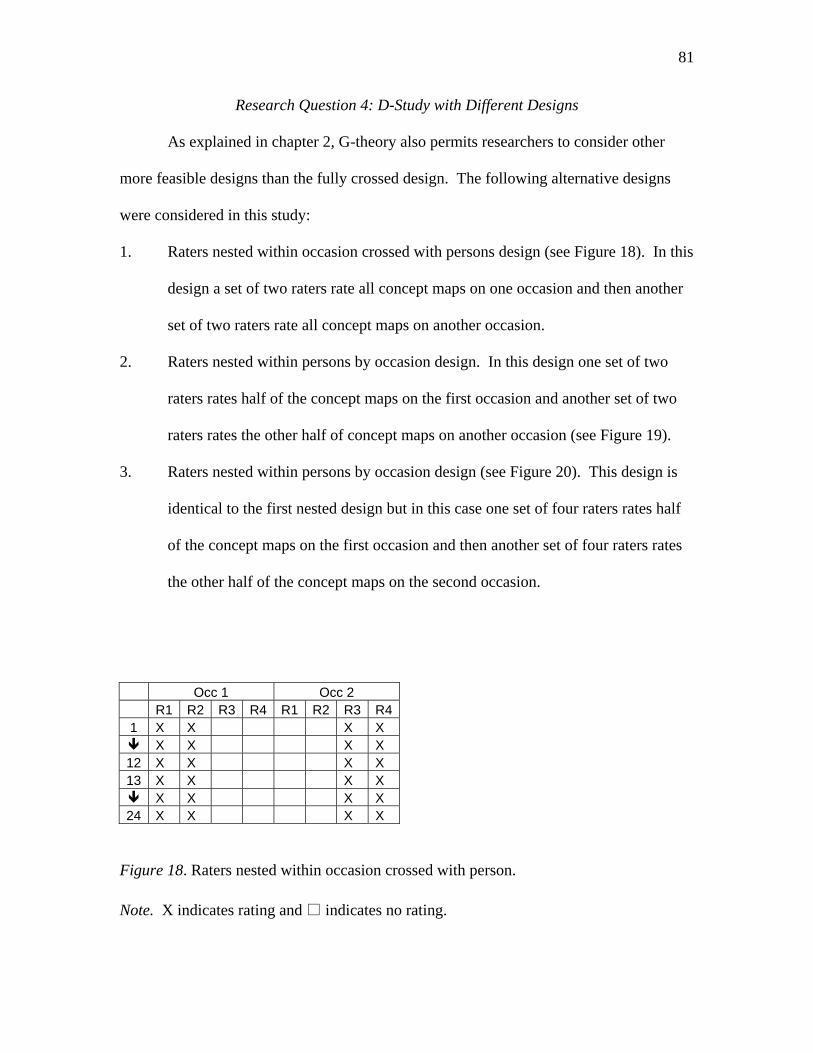
81
Research Question 4: D-Study with Different Designs
As explained in chapter 2, G-theory also permits researchers to consider other
more feasible designs than the fully crossed design. The following alternative designs
were considered in this study:
1. Raters nested within occasion crossed with persons design (see Figure 18). In this
design a set of two raters rate all concept maps on one occasion and then another
set of two raters rate all concept maps on another occasion.
2. Raters nested within persons by occasion design. In this design one set of two
raters rates half of the concept maps on the first occasion and another set of two
raters rates the other half of concept maps on another occasion (see Figure 19).
3. Raters nested within persons by occasion design (see Figure 20). This design is
identical to the first nested design but in this case one set of four raters rates half
of the concept maps on the first occasion and then another set of four raters rates
the other half of the concept maps on the second occasion.
Occ 1 Occ 2 R1 R2 R3 R4 R1 R2 R3 R41 X X X X X X X X
12 X X X X 13 X X X X X X X X
24 X X X X
Figure 18. Raters nested within occasion crossed with person.
Note. X indicates rating and indicates no rating.
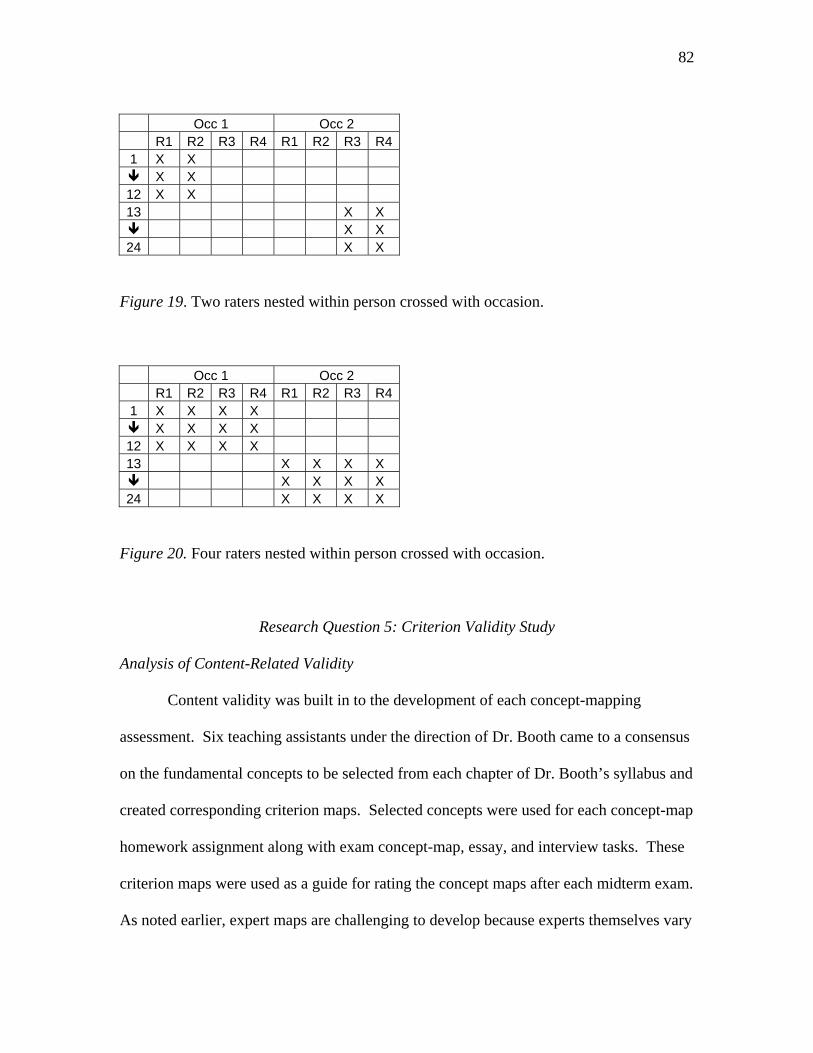
82
Occ 1 Occ 2 R1 R2 R3 R4 R1 R2 R3 R41 X X X X
12 X X 13 X X X X
24 X X
Figure 19. Two raters nested within person crossed with occasion.
Occ 1 Occ 2 R1 R2 R3 R4 R1 R2 R3 R41 X X X X X X X X
12 X X X X 13 X X X X X X X X
24 X X X X
Figure 20. Four raters nested within person crossed with occasion.
Research Question 5: Criterion Validity Study
Analysis of Content-Related Validity
Content validity was built in to the development of each concept-mapping
assessment. Six teaching assistants under the direction of Dr. Booth came to a consensus
on the fundamental concepts to be selected from each chapter of Dr. Booth’s syllabus and
created corresponding criterion maps. Selected concepts were used for each concept-map
homework assignment along with exam concept-map, essay, and interview tasks. These
criterion maps were used as a guide for rating the concept maps after each midterm exam.
As noted earlier, expert maps are challenging to develop because experts themselves vary
83
in the way in which they represent their knowledge structurally via concept maps (Acton
et al., 1994). By coming to a consensus among the course content experts on the list of
key concepts to be selected from each unit for the criterion map, expert variability was
held constant.
Analysis of Criterion-Related Validity
Pearson correlations were calculated between C-mapping task scores and their
corresponding essay scores as a measure of concurrent validity and their corresponding
interview scores as a measure of predictive validity. The Pearson correlations along with
their associated p-values were calculated using SPSS statistical software. A two-facet
fully crossed design (four raters rating on two occasions) was likewise conducted with
the essay and interview tasks to assess the degree to which these criterion measures were
rated reliably.
An average rating for each student across four raters and two rating occasions was
calculated for concept-map, essay, and interview tasks. A Pearson correlation was then
computed between these averaged person ratings. It should be noted the Pearson
correlations were computed only between those propositions that could be made on both
the concept map and the corresponding criterion measures. For example, across the four
essay tasks students were directed to interrelate from three up to seven or more concepts.
The concept maps directed students to construct propositions between ten to sixteen
concepts. The correlations were computed only between propositions that could be
constructed on both the concept map and the essay tasks rather than between those
propositions not shared by both tasks. This was also the case when correlating ratings
between concept-map and interview tasks.
84
Procedures
Modifications were made to the main study based on the author’s experiences
with the pilot study the prior year. These modifications were made in order to enhance
the student learning experience with concept maps and make it more likely that the
assessments would generate ratings evidencing student connected understanding rather
than construct irrelevance. The following changes were made:
1. Putting a greater emphasis on the ends not the means; in other words,, placing
emphasis on student-organized understanding rather than using concept maps as
an end in and of themselves.
2. Providing concept-map training along with meaningful opportunties for feedback
to ensure that student concept maps had the greatest possibility of measuring
student ability to construct important, accurate, complete, and relevant
propositions.
Focus on Ends
During the pilot study, many students concluded that concept mapping was an
incidental but not integral part of the course. Several students explained in their post-
midterm exam interviews that the concept-mapping exercises felt more like busywork
than a meaningful learning activity. Concept maps were marginalized because not only
were students learning new content, but simultaneously they were learning a new system
for structuring that content. Along with this factor, during the pilot study training and
group feedback focused mainly on developing student skill with concept-mapping
conventions and not on the end goal of constructing a meaningful organized conceptual
understanding of the material. Kinchin (2000) explains that concept mapping cannot be
85
simply a “tack on” (p. 67) to other class methods but must be integrated with those
methods in achieving the end goal of student content mastery.
Before the Fall 2006 study commenced, Dr. Booth, the author, and several
teaching assistants decided that one of the course objectives would be for students to
come away with a meaningfully organized understanding of biology concepts taught in
the course. It was further decided that this point would be emphasized repeatedly as
students constructed their maps and received feedback. Dr. Booth’s teaching assistants
reinforced this point through feedback given after weekly homework assignments.
During the first recitation session of the semester it was explained to students that
the objectives of the course included the goal that each student learn and understand
biological facts, biological concepts, and how those concepts interrelate with one another.
It was further explained that several methods could be employed to assist them in
developing a useful organized understanding of the content. They were told that concept
mapping was the tool of choice in Dr. Booth’s Biology 100 courses designed to achieve
that goal.
Student Training
Student training on the construction of concept maps included an initial training
during a recitation session and then weekly homework assignments. These assignments
were graded and returned to the students upon which students were given the opportunity
to meet with their teaching assistant and receive feedback.
First-Day Training
During the first recitation session students were provided with a concept-map
training worksheet (Appendix M). On this sheet they were provided instructions on the
86
purpose of concept mapping, how to concept map, and how to write an appropriate
linking phrase. They were then assigned two concept-mapping exercises where they
were directed to fill in the blank concepts or blank linking phrases on a skeletal map.
Each concept-mapping assessment contained concepts that possessed strong conceptual
interrelationships. The concept-mapping exercises were assigned on a Thursday and due
the following Monday. These exercises corresponded with the very chapters and lectures
the students were assigned to read and process during that week.
Weekly Homework Assignments
Each Monday students were required to turn in their completed concept-mapping
assignments at the end of class. Students also received their next concept-mapping
assignment on that day. Each assignment consisted of two to three concept-mapping
exercises. The first two assignments directed students to fill in the blanks on a skeletal
map (see Figure 9). The third assignment directed students to construct a map from a list
of concepts (see Figure 11). In this way students were exposed to two models of concept
maps containing effective linking phrases between concepts before constructing their
own concept maps using the C-mapping task.
The teaching assistants spent the next three days grading concept maps. These
maps were graded using the open construct-a-map task scoring rubric. This task was
chosen because of the relative ease of its use and because it was decided that if students
were familiar with this scoring rubric they could easily transfer those mapping skills to
the constrained construct-a-map task. The teaching assistants returned students’ graded
concept-mapping assignments and invited them to meet with their assigned teaching
assistant to discuss the reason for missing any points. Students who met with their
87
teaching assistant and corrected their concept map were given full credit for the
assignment. This process continued throughout the course of the semester.
Meaningful Feedback
Prior to grading student concept maps the raters themselves completed the
concept-mapping assignments. This was a change from the pilot study in that the raters
generally had not created the maps themselves and therefore could not fully appreciate
the subtle nuances students dealt with when constructing a concept map. Feedback given
by the raters was more exact and meaningful because of two important factors. First,
concept-mapping assignments were constructed with lists of strongly related concepts,
thus facilitating the construction of meaningful links. Second, students became aware
early on that constructing links between some pairs of concepts by their very nature
requires more careful thinking as opposed to constructing other pairs of concepts.
With these two considerations in mind the teaching assistants graded the
scaffolded (see Figure 9) and less scaffolded (see Figure 11) student concept map
homework assignments. Students were invited to meet with their assigned teaching
assistant during the course of the week to discuss the links that were not given full credit.
If students took the time to engage in a discussion about the links on their map that were
marked as incorrect, they were given full credit for the assignment. In this way students
were motivated to take the opportunity to check their understanding of conceptual
interrelationships with the teaching assistants.
88
CHAPTER 4: RESULTS
Research Question 1
Research question 1 was posed in an effort to determine the source of rating
variability in the ratings for each of the two C-mapping tasks. In particular the intent of
the study was to investigate the degree to which rating variability was due to dependable
differences in students’ ability to construct concept maps that depict important, accurate,
complete, and relevant conceptual interrelationships (this represents desirable variance),
and percentage due to any of the following sources of measurement error: (a)
inconsistencies between raters; (b) inconsistencies within individual raters across rating
occasions; (c) inconsistencies described by the three, 2-way interactions that can be
estimated from the two-facet, fully crossed design; and (d) unexplained error that cannot
be attributed to any of the identified sources. Specific results for each task on both
midterm exams are reported in this chapter.
Exam 1: Task 1
The estimated variance components for each of the seven sources of variation in
the ratings are reported in Table 6. The rows in the table provide several statistics
associated with the possible sources of variation in the ratings that can be estimated from
a two facet, fully crossed design with persons as the object of measurement. These
statistics include the percent of the total variation contributed by each source of rating
variability along with the standard error for each estimated variance component.
Variance Component for Persons
As shown in Table 6, the variance component for persons accounts for 66% of the
variability of the ratings. Hence, two-thirds of the total variability in the ratings is
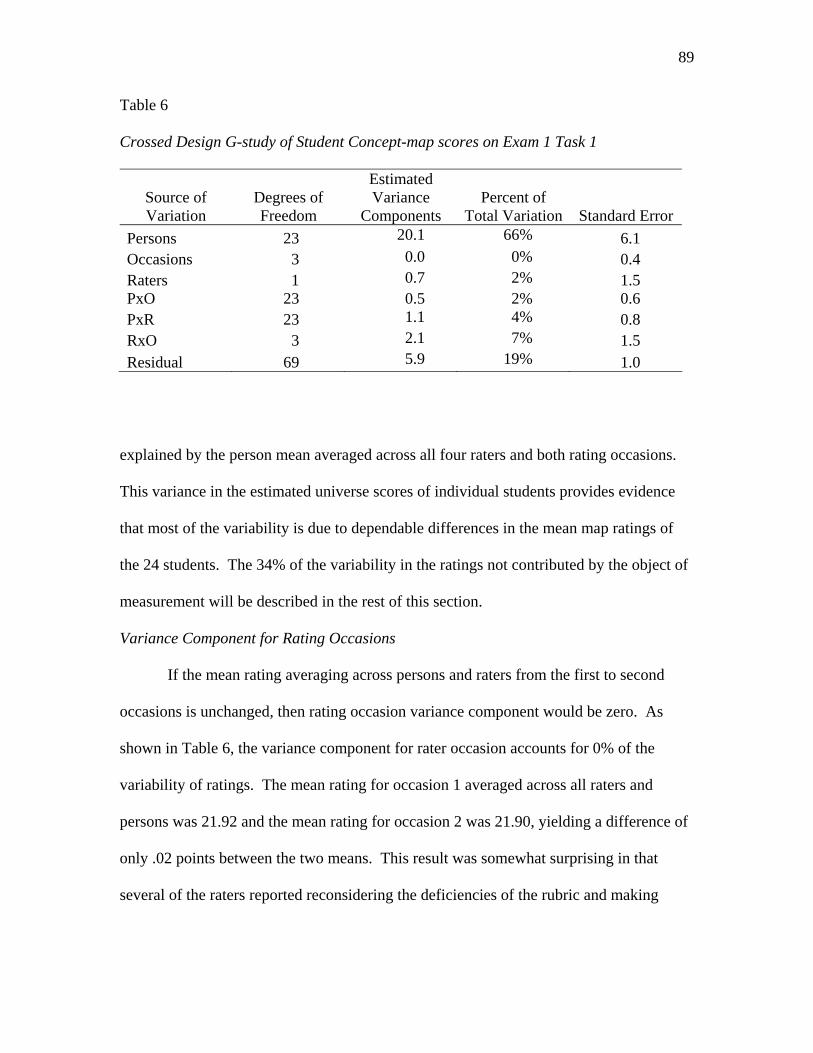
89
Table 6
Crossed Design G-study of Student Concept-map scores on Exam 1 Task 1
Source of Variation
Degrees of Freedom
Estimated Variance
Components Percent of
Total Variation Standard Error
Persons 23 20.1 66% 6.1 Occasions 3 0.0 0% 0.4 Raters 1 0.7 2% 1.5 PxO 23 0.5 2% 0.6 PxR 23 1.1 4% 0.8 RxO 3 2.1 7% 1.5 Residual 69 5.9 19% 1.0
explained by the person mean averaged across all four raters and both rating occasions.
This variance in the estimated universe scores of individual students provides evidence
that most of the variability is due to dependable differences in the mean map ratings of
the 24 students. The 34% of the variability in the ratings not contributed by the object of
measurement will be described in the rest of this section.
Variance Component for Rating Occasions
If the mean rating averaging across persons and raters from the first to second
occasions is unchanged, then rating occasion variance component would be zero. As
shown in Table 6, the variance component for rater occasion accounts for 0% of the
variability of ratings. The mean rating for occasion 1 averaged across all raters and
persons was 21.92 and the mean rating for occasion 2 was 21.90, yielding a difference of
only .02 points between the two means. This result was somewhat surprising in that
several of the raters reported reconsidering the deficiencies of the rubric and making
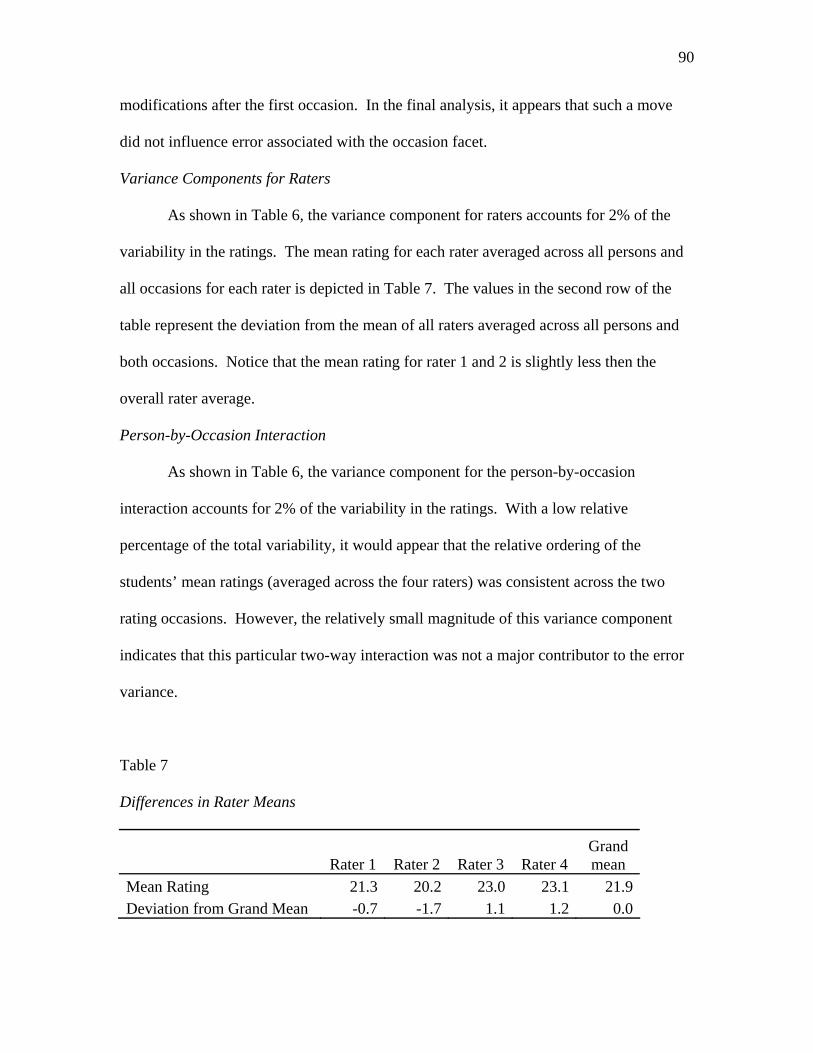
90
modifications after the first occasion. In the final analysis, it appears that such a move
did not influence error associated with the occasion facet.
Variance Components for Raters
As shown in Table 6, the variance component for raters accounts for 2% of the
variability in the ratings. The mean rating for each rater averaged across all persons and
all occasions for each rater is depicted in Table 7. The values in the second row of the
table represent the deviation from the mean of all raters averaged across all persons and
both occasions. Notice that the mean rating for rater 1 and 2 is slightly less then the
overall rater average.
Person-by-Occasion Interaction
As shown in Table 6, the variance component for the person-by-occasion
interaction accounts for 2% of the variability in the ratings. With a low relative
percentage of the total variability, it would appear that the relative ordering of the
students’ mean ratings (averaged across the four raters) was consistent across the two
rating occasions. However, the relatively small magnitude of this variance component
indicates that this particular two-way interaction was not a major contributor to the error
variance.
Table 7
Differences in Rater Means
Rater 1 Rater 2 Rater 3 Rater 4 Grand mean
Mean Rating 21.3 20.2 23.0 23.1 21.9 Deviation from Grand Mean -0.7 -1.7 1.1 1.2 0.0
91
Person-by-Rater Interaction
As shown in Table 6, the variance component for the person-by-rater interaction
accounts for 4% of the variability. While comparatively low with regards to the object of
measurement, this facet was relatively larger than the other sources of error. When this
source of measurement error is relatively high, this indicates that the relative order of the
mean rating for each student (averaged across both rating occasions) differs from rater to
rater.
Rater-by-Occasion Interaction
The variance component for the rater-by-occasion interaction accounts for 7% of
the total rating variability (Table 6). If this variance component is relatively high, then
the relative order of the means of the four raters (averaged across all 24 students) was
different on the first rating occasion compared to the second rating occasion. In other
words a rater who is more stringent than other raters on the first occasion was more or
less stringent in relation to those same raters on the second occasion.
Residual Variance Component
As shown in Table 6, the variance component for the unexplained error accounts
for 19% of the variability of ratings. This variance component consists of the unique
combination of P, R, and O facets and/or random events (Shavelson & Webb, 1991). The
residual variance component contributed the second largest amount of relative variability
in the ratings.
Exam 1: Task 2
Variance Component for Persons
The results of a G-study for student-concept-mapping scores on exam 1 task 2 are
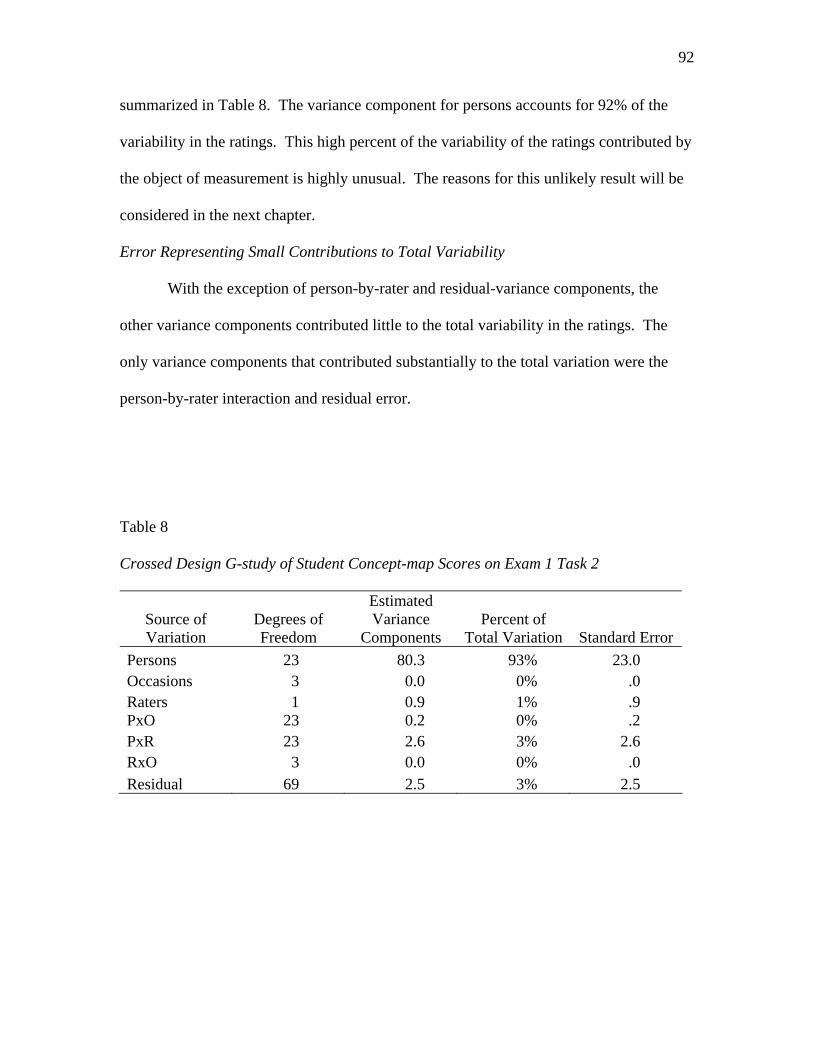
92
summarized in Table 8. The variance component for persons accounts for 92% of the
variability in the ratings. This high percent of the variability of the ratings contributed by
the object of measurement is highly unusual. The reasons for this unlikely result will be
considered in the next chapter.
Error Representing Small Contributions to Total Variability
With the exception of person-by-rater and residual-variance components, the
other variance components contributed little to the total variability in the ratings. The
only variance components that contributed substantially to the total variation were the
person-by-rater interaction and residual error.
Table 8
Crossed Design G-study of Student Concept-map Scores on Exam 1 Task 2
Source of Variation
Degrees of Freedom
Estimated Variance
Components Percent of
Total Variation Standard Error
Persons 23 80.3 93% 23.0 Occasions 3 0.0 0% .0 Raters 1 0.9 1% .9 PxO 23 0.2 0% .2 PxR 23 2.6 3% 2.6 RxO 3 0.0 0% .0 Residual 69 2.5 3% 2.5
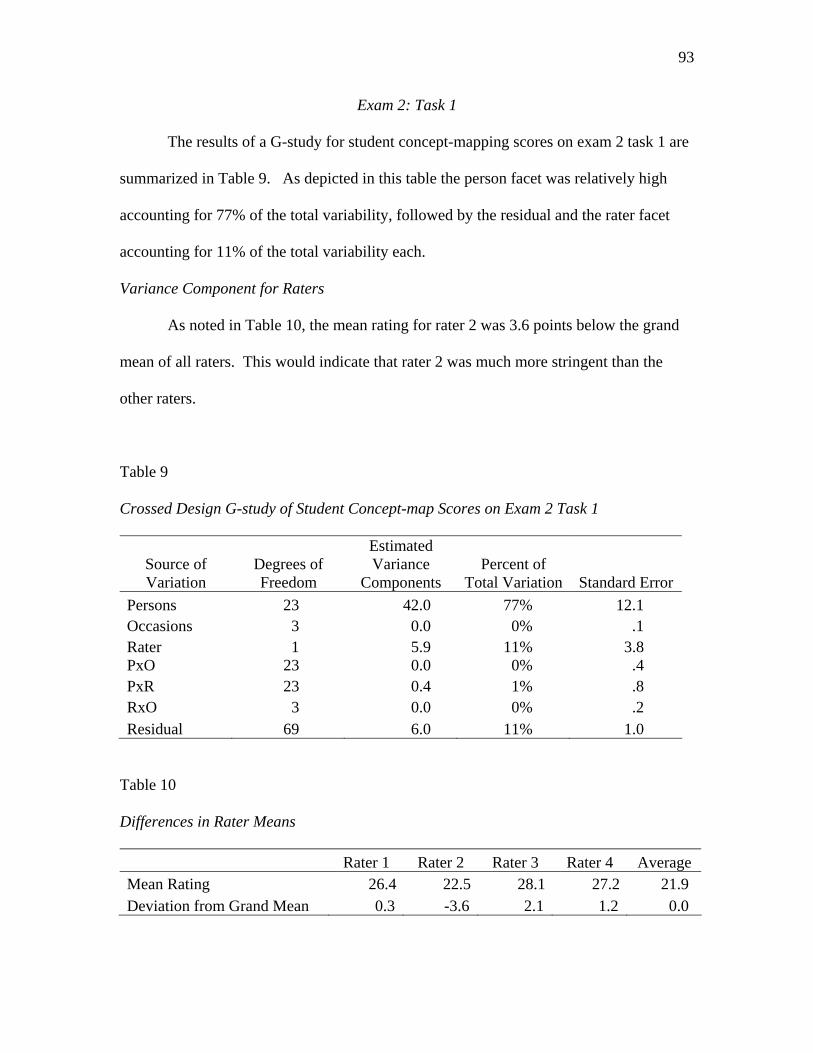
93
Exam 2: Task 1
The results of a G-study for student concept-mapping scores on exam 2 task 1 are
summarized in Table 9. As depicted in this table the person facet was relatively high
accounting for 77% of the total variability, followed by the residual and the rater facet
accounting for 11% of the total variability each.
Variance Component for Raters
As noted in Table 10, the mean rating for rater 2 was 3.6 points below the grand
mean of all raters. This would indicate that rater 2 was much more stringent than the
other raters.
Table 9
Crossed Design G-study of Student Concept-map Scores on Exam 2 Task 1
Source of Variation
Degrees of Freedom
Estimated Variance
Components Percent of
Total Variation Standard Error
Persons 23 42.0 77% 12.1 Occasions 3 0.0 0% .1 Rater 1 5.9 11% 3.8 PxO 23 0.0 0% .4 PxR 23 0.4 1% .8 RxO 3 0.0 0% .2 Residual 69 6.0 11% 1.0
Table 10
Differences in Rater Means
Rater 1 Rater 2 Rater 3 Rater 4 Average Mean Rating 26.4 22.5 28.1 27.2 21.9 Deviation from Grand Mean 0.3 -3.6 2.1 1.2 0.0
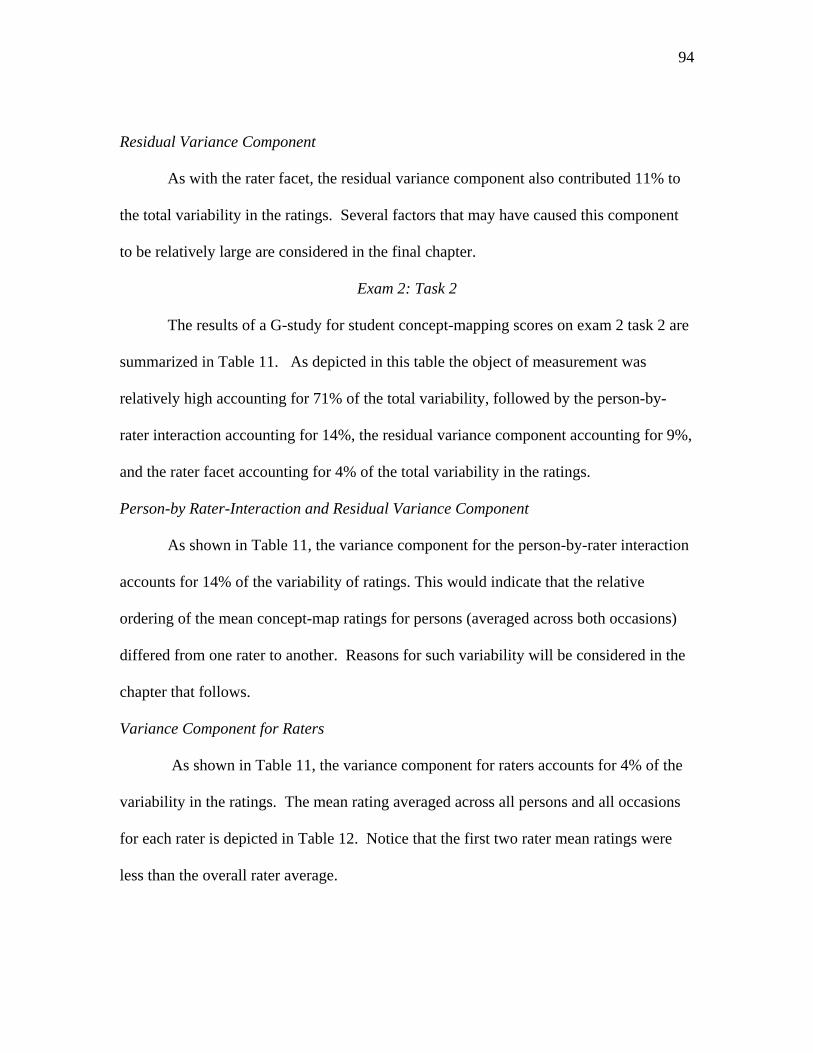
94
Residual Variance Component
As with the rater facet, the residual variance component also contributed 11% to
the total variability in the ratings. Several factors that may have caused this component
to be relatively large are considered in the final chapter.
Exam 2: Task 2
The results of a G-study for student concept-mapping scores on exam 2 task 2 are
summarized in Table 11. As depicted in this table the object of measurement was
relatively high accounting for 71% of the total variability, followed by the person-by-
rater interaction accounting for 14%, the residual variance component accounting for 9%,
and the rater facet accounting for 4% of the total variability in the ratings.
Person-by Rater-Interaction and Residual Variance Component
As shown in Table 11, the variance component for the person-by-rater interaction
accounts for 14% of the variability of ratings. This would indicate that the relative
ordering of the mean concept-map ratings for persons (averaged across both occasions)
differed from one rater to another. Reasons for such variability will be considered in the
chapter that follows.
Variance Component for Raters
As shown in Table 11, the variance component for raters accounts for 4% of the
variability in the ratings. The mean rating averaged across all persons and all occasions
for each rater is depicted in Table 12. Notice that the first two rater mean ratings were
less than the overall rater average.
95
Table 11
Crossed Design G-study of Student Concept-map Scores on Exam 2 Task 2
Source of Variation
Degrees of Freedom
Estimated Variance
Components Percent of
Total Variation Standard Error
Persons 23 34.8 71% 10.6 Occasions 3 0.0 0% 0.1 Rater 1 2.0 4% 1.6 PxO 23 1.0 2% 0.6 PxR 23 6.8 14% 1.5 RxO 3 0.1 0% 0.2 Residual 69 4.3 9% 0.7
Table 12
Differences in Rater Means
Rater 1 Rater 2 Rater 3 Rater 4 Average Mean Rating 24.5 25.7 28.2 26.9 26.3Deviation from Grand Mean -1.8 -0.6 1.9 0.6 0
Research Question 2
Research question 2 was posed to consider how the reliability of the mean ratings
of the students’ conceptual understanding generated by one rater on one occasion
compare across the two C-mapping tasks. Table 13 provides a comparison of each g and
phi coefficient for ratings produced by one rater on one rating occasion for task 1 and 2
on exam 1. Likewise, Table 14 provides the same information for task 1 and 2 on exam
2. With the exception of the phi-coefficient for task 1 on exam 1, the reliability
coefficients for relative and absolute decisions were higher than .70.
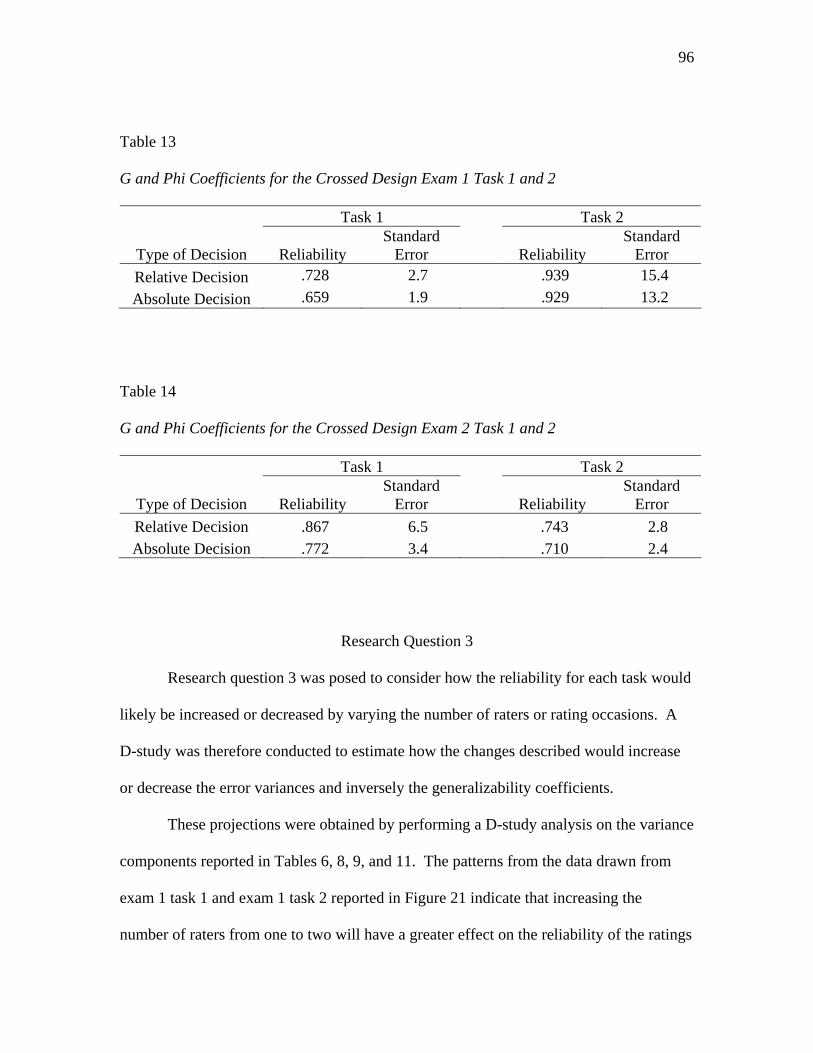
96
Table 13
G and Phi Coefficients for the Crossed Design Exam 1 Task 1 and 2
Task 1 Task 2
Type of Decision Reliability Standard
Error Reliability Standard
Error Relative Decision .728 2.7 .939 15.4 Absolute Decision .659 1.9 .929 13.2
Table 14
G and Phi Coefficients for the Crossed Design Exam 2 Task 1 and 2
Task 1 Task 2
Type of Decision Reliability Standard
Error Reliability Standard
Error Relative Decision .867 6.5 .743 2.8 Absolute Decision .772 3.4 .710 2.4
Research Question 3
Research question 3 was posed to consider how the reliability for each task would
likely be increased or decreased by varying the number of raters or rating occasions. A
D-study was therefore conducted to estimate how the changes described would increase
or decrease the error variances and inversely the generalizability coefficients.
These projections were obtained by performing a D-study analysis on the variance
components reported in Tables 6, 8, 9, and 11. The patterns from the data drawn from
exam 1 task 1 and exam 1 task 2 reported in Figure 21 indicate that increasing the
number of raters from one to two will have a greater effect on the reliability of the ratings
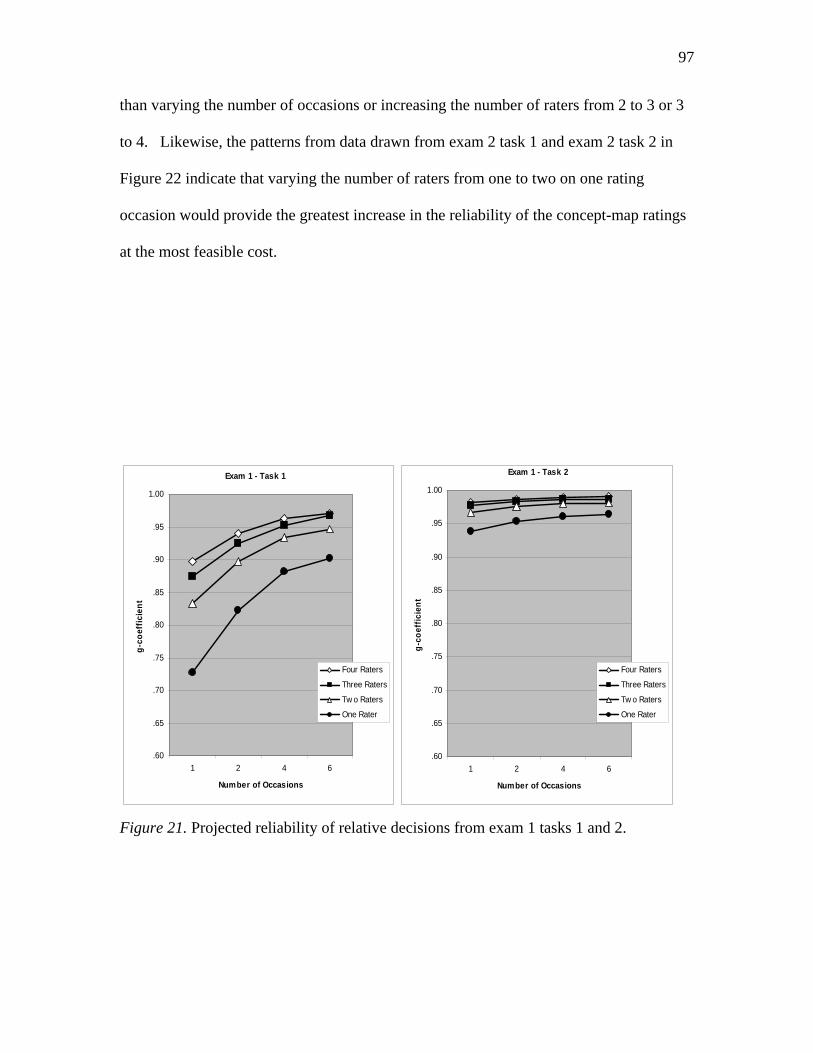
97
than varying the number of occasions or increasing the number of raters from 2 to 3 or 3
to 4. Likewise, the patterns from data drawn from exam 2 task 1 and exam 2 task 2 in
Figure 22 indicate that varying the number of raters from one to two on one rating
occasion would provide the greatest increase in the reliability of the concept-map ratings
at the most feasible cost.
.60
.65
.70
.75
.80
.85
.90
.95
1.00
1 2 4 6
Number of Occasions
g-co
effic
ient
Four Raters
Three Raters
Tw o Raters
One Rater
Exam 1 - Task 1
.60
.65
.70
.75
.80
.85
.90
.95
1.00
1 2 4 6
Number of Occasions
g-co
effic
ient
Four Raters
Three Raters
Tw o Raters
One Rater
Exam 1 - Task 2
Figure 21. Projected reliability of relative decisions from exam 1 tasks 1 and 2.
98
.60
.65
.70
.75
.80
.85
.90
.95
1.00
1 2 4 6
Number of Occasions
g-co
effic
ient
Four Raters
Three Raters
Tw o Raters
One Rater
Exam 2 - Task 1
.60
.65
.70
.75
.80
.85
.90
.95
1.00
1 2 4 6
Number of Occasionsg-
coef
ficie
nt
Four Raters
Three Raters
Tw o Raters
One Rater
Exam 2 - Task 2
Figure 22. Projected reliability of relative decisions from exam 2 tasks 1 and 2.
Research Question 4
The results of the G-study are based on the assumption that every concept map
constructed by every student would be rated by four raters on two separate rating
occasions. Since such a design may not be feasible in more practical settings, other D-
studies were performed to project the effect of using more feasible designs for collecting
the ratings.
Most Feasible Design for Exam 1 Task 1
For exam 1 task 1, the most feasible nested design would include persons crossed
with raters nested within occasions employing two raters instead of four (see the upper
left panel in Figure 23). With this design a set of two raters rates all 24 concept maps on
one occasion and another set of two raters rates all 24 concept maps on another occasion.
The generalizability coefficient (used in relative decisions) for this design is projected to
99
be .833 with a standard error value of approximately 2.7. The other designs reported in
Figures 23 - 25 had a much higher percentage of total variability contributed by
unexplained error. The relative error percentages of these more reliable rating designs
also approximated those calculated in the fully crossed design, as noted in Table 6.
Most Feasible Design for Exam 1 Task 2
As will be explained in more detail shortly, exam 1 task 2 was something of an
anomaly in that the students and raters were so familiar with constructing and rating the
concepts in this task that the generalizability coefficient for this task was .939. Hence, it
comes as no surprise that all of the other designs reported in Figures 23 through 25
produced similar reliability coefficients. Thus, all of the other designs under similar
conditions that existed with exam 1 task 2 could be recommended as more feasible
substitutes to a fully crossed design.
Most Feasible Design for Exam 2 Task 1
As was the case with exam 1 task 1 the person–by-rater within occasion design
(see Figure 18) also would be the most feasible design to employ compared to the fully-
crossed design without a decrease in the generalizability coefficient (see the lower left
panel in Figure 23). The generalizability coefficient for two sets of two raters rating on
separate occasions is projected to be .929 with a standard error of 5.7. The percentage of
the total variability of the ratings contributed by the person facet would be 77%, while in
the Px(R:O) design 72% of the total variability is contributed by the person facet. The
contributions made to the total score variation by the other facets and interactions are
evenly distributed.
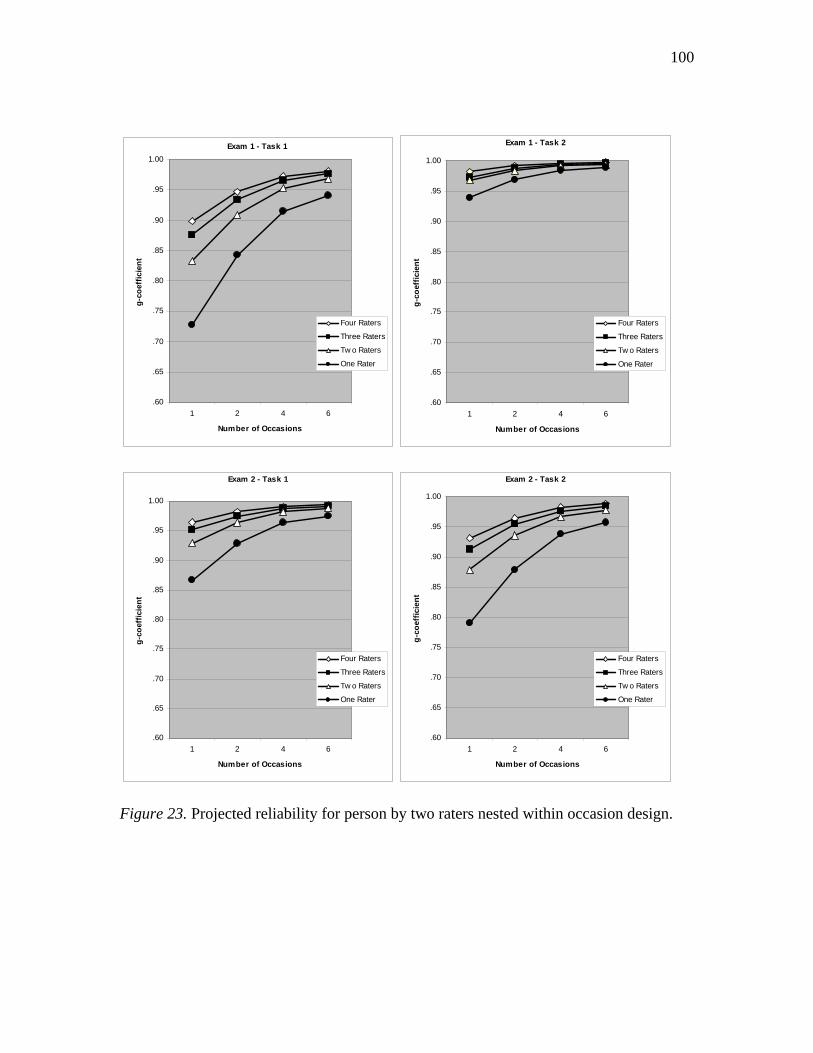
100
.60
.65
.70
.75
.80
.85
.90
.95
1.00
1 2 4 6
Number of Occasions
g-co
effic
ient
Four Raters
Three Raters
Tw o Raters
One Rater
Exam 1 - Task 1 Exam 1 - Task 2
.60
.65
.70
.75
.80
.85
.90
.95
1.00
1 2 4 6
Number of Occasionsg-
coef
ficie
nt
Four Raters
Three Raters
Tw o Raters
One Rater
Exam 2 - Task 1
.60
.65
.70
.75
.80
.85
.90
.95
1.00
1 2 4 6
Number of Occasions
g-co
effic
ient
Four Raters
Three Raters
Tw o Raters
One Rater
Exam 2 - Task 2
.60
.65
.70
.75
.80
.85
.90
.95
1.00
1 2 4 6
Number of Occasions
g-co
effic
ient
Four Raters
Three Raters
Tw o Raters
One Rater
Figure 23. Projected reliability for person by two raters nested within occasion design.

101
.60
.65
.70
.75
.80
.85
.90
.95
1.00
1 2 4 6
Number of Occasions
g-co
effic
ient
Four Raters
Three Raters
Tw o Raters
One Rater
Exam 1 -Task 1
Exam 1 - Task 2
.60
.65
.70
.75
.80
.85
.90
.95
1.00
1 2 4 6
Number of Occasions
g-co
effic
ient
Four Raters
Three Raters
Tw o Raters
One Rater
Exam 2 - Task 1
.60
.65
.70
.75
.80
.85
.90
.95
1.00
1 2 4 6
Number of Occasions
g-co
effic
ient
Four Raters
Three Raters
Tw o Raters
One Rater
Exam 2 - Task 2
.60
.65
.70
.75
.80
.85
.90
.95
1.00
1 2 4 6
Number of Occasions
g-co
effic
ient
Four Raters
Three Raters
Tw o Raters
One Rater
Figure 24. Projected reliability of two raters nested within person-by-occasion design.

102
.60
.65
.70
.75
.80
.85
.90
.95
1.00
1 2 4 6
Number of Occasions
g-co
effic
ient
Four Raters
Three Raters
Tw o Raters
One Rater
Exam 1 - Task 1
Exam 1 - Task 2
.92
.93
.94
.95
.96
.97
.98
.99
1.00
1 2 4 6
Number of Occasions
g-co
effic
ient
Four Raters
Three Raters
Tw o Raters
One Rater
Exam 2 - Task 1
.60
.65
.70
.75
.80
.85
.90
.95
1.00
1 2 4 6
Number of Occasions
g-co
effic
ient
Four Raters
Three Raters
Tw o Raters
One Rater
Exam 2 - Task 2
.60
.65
.70
.75
.80
.85
.90
.95
1.00
1 2 4 6
Number of Occasions
g-co
effic
ient
Four Raters
Three Raters
Tw o Raters
One Rater
Figure 25. Projected reliability of four raters nested within person-by-occasion design.
Most Feasible Design for Exam 2 Task 2
The most feasible design for exam 2 task 2 is the person-by-rater within occasion
design as was the case with task 1 on both exams. Here the generalizability coefficient
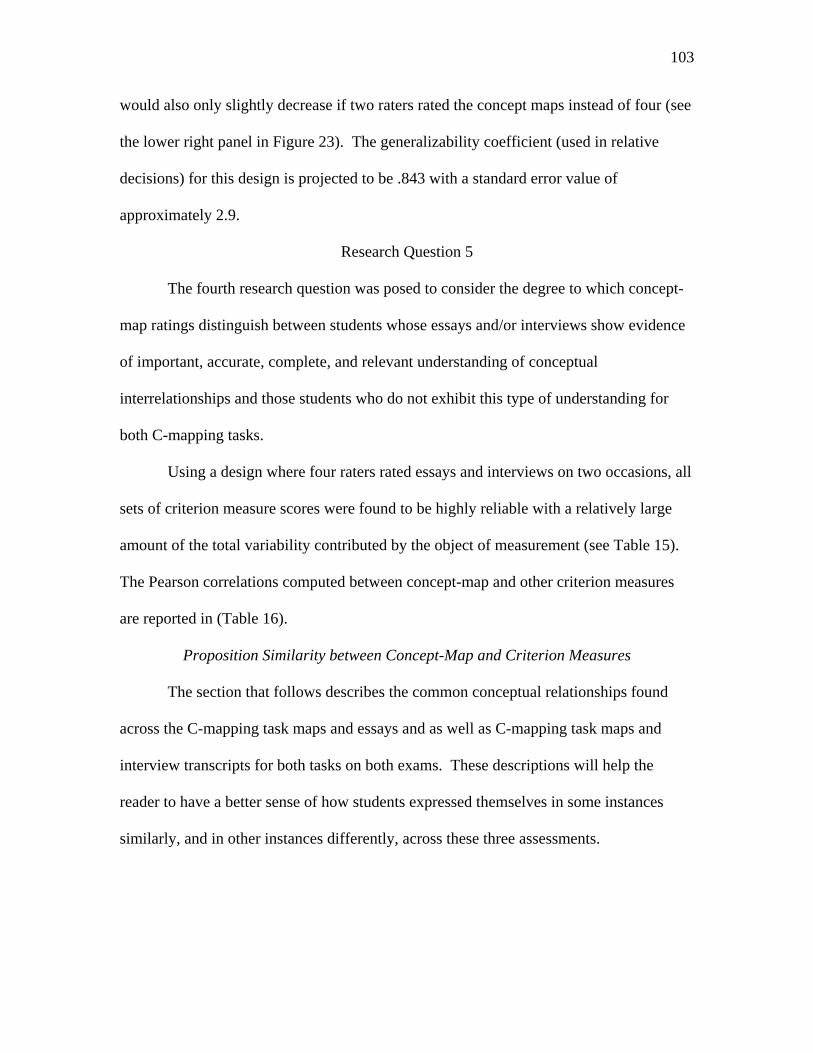
103
would also only slightly decrease if two raters rated the concept maps instead of four (see
the lower right panel in Figure 23). The generalizability coefficient (used in relative
decisions) for this design is projected to be .843 with a standard error value of
approximately 2.9.
Research Question 5
The fourth research question was posed to consider the degree to which concept-
map ratings distinguish between students whose essays and/or interviews show evidence
of important, accurate, complete, and relevant understanding of conceptual
interrelationships and those students who do not exhibit this type of understanding for
both C-mapping tasks.
Using a design where four raters rated essays and interviews on two occasions, all
sets of criterion measure scores were found to be highly reliable with a relatively large
amount of the total variability contributed by the object of measurement (see Table 15).
The Pearson correlations computed between concept-map and other criterion measures
are reported in (Table 16).
Proposition Similarity between Concept-Map and Criterion Measures
The section that follows describes the common conceptual relationships found
across the C-mapping task maps and essays and as well as C-mapping task maps and
interview transcripts for both tasks on both exams. These descriptions will help the
reader to have a better sense of how students expressed themselves in some instances
similarly, and in other instances differently, across these three assessments.
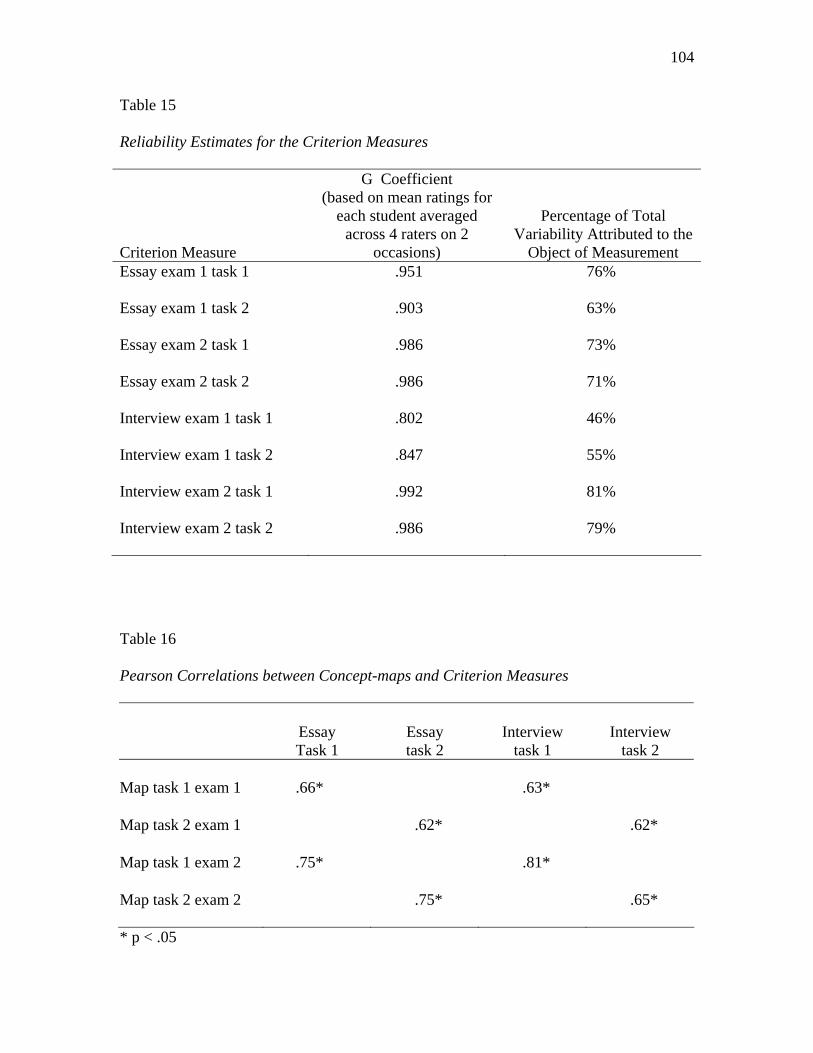
104
Table 15
Reliability Estimates for the Criterion Measures
Criterion Measure
G Coefficient (based on mean ratings for
each student averaged across 4 raters on 2
occasions)
Percentage of Total Variability Attributed to the
Object of Measurement Essay exam 1 task 1 .951 76%
Essay exam 1 task 2 .903 63%
Essay exam 2 task 1 .986 73%
Essay exam 2 task 2 .986 71%
Interview exam 1 task 1 .802 46%
Interview exam 1 task 2 .847 55%
Interview exam 2 task 1 .992 81%
Interview exam 2 task 2 .986 79%
Table 16
Pearson Correlations between Concept-maps and Criterion Measures
Essay Task 1
Essay task 2
Interview task 1
Interview task 2
Map task 1 exam 1
.66*
.63*
Map task 2 exam 1 .62* .62*
Map task 1 exam 2 .75* .81*
Map task 2 exam 2 .75* .65*
* p < .05
105
Exam 1: Task 1
Concept maps and essays. Figures 26 and 27 depict the common propositions
shared between a student’s first essay and concept-map task from exam one. The
common propositions found on this student’s concept map and essay are activation
energy – enzymes, enzymes – competitive inhibitor, and enzymes – noncompetitive
inhibitor. As an example of a common response found on both measures, notice that on
the concept map this student linked the concepts activation energy and enzymes with the
phrase is lowered by. On the essay the student described this same relationship with the
response: “enzymes are proteins used by the cell to speed up a reaction. This lowers the
activation energy” (see Figure 27).
Notice that while the essay provides details like “Enzymes are proteins” or “used
to speed up a reaction,” these phrases are the antecedents for the word “This” in the next
sentence. The student explains that “This” (enzymes and the process they impact)
“lowers the activation energy” (see Figure 26). The relationship expressed in the essay
and the concept map is analogous at the core. The more the conceptual relationships
expressed by the students were similar on both their concept map and essay, the greater
the rating correlations. Concept maps and interviews. Figures 28 and 29 depict the common propositions
shared between a student’s first concept-map task and interview transcript and the first
concept-map task from exam one. A concept-mapping task and an interview task provide
students with different constraints, with regards to how they express their knowledge. In
the interview the students were not directed to be concise in their responses, whereas with
the concept mapping task brevity, accuracy, and completeness were emphasized. Notice
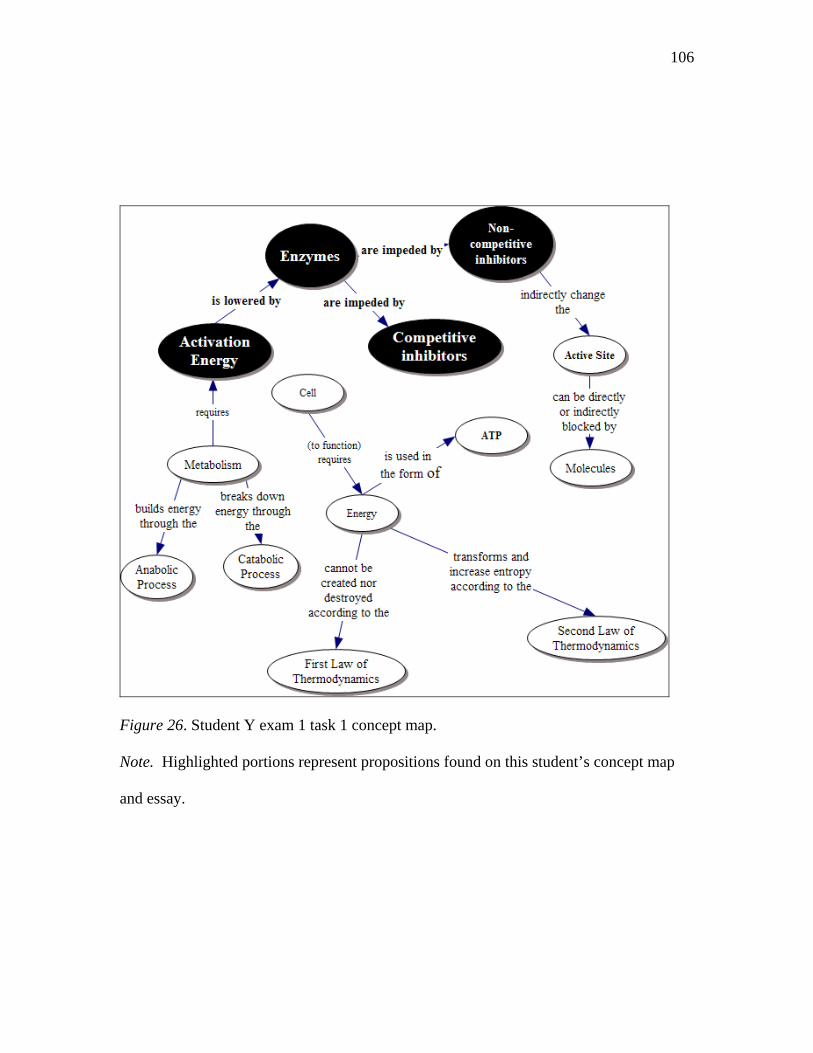
106
Figure 26. Student Y exam 1 task 1 concept map.
Note. Highlighted portions represent propositions found on this student’s concept map
and essay.
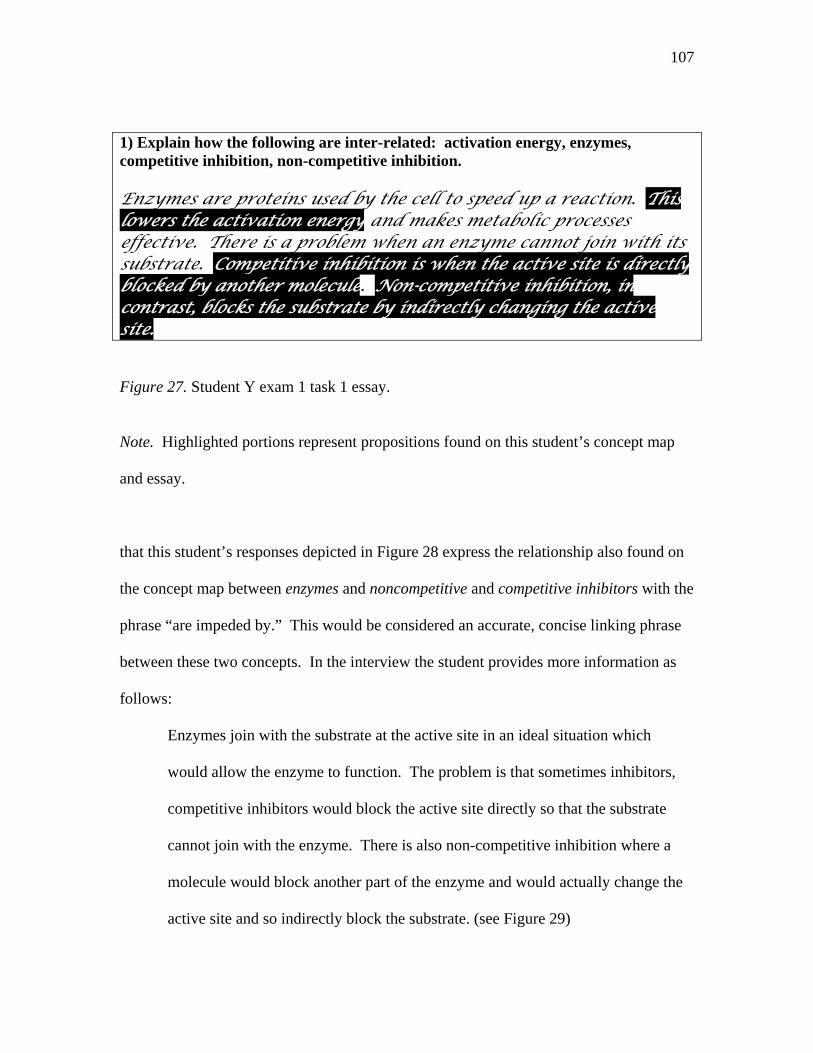
107
1) Explain how the following are inter-related: activation energy, enzymes, competitive inhibition, non-competitive inhibition. Enzymes are proteins used by the cell to speed up a reaction. This lowers the activation energy and makes metabolic processes effective. There is a problem when an enzyme cannot join with its substrate. Competitive inhibition is when the active site is directly blocked by another molecule. Non-competitive inhibition, in contrast, blocks the substrate by indirectly changing the active site.
Figure 27. Student Y exam 1 task 1 essay.
Note. Highlighted portions represent propositions found on this student’s concept map
and essay.
that this student’s responses depicted in Figure 28 express the relationship also found on
the concept map between enzymes and noncompetitive and competitive inhibitors with the
phrase “are impeded by.” This would be considered an accurate, concise linking phrase
between these two concepts. In the interview the student provides more information as
follows:
Enzymes join with the substrate at the active site in an ideal situation which
would allow the enzyme to function. The problem is that sometimes inhibitors,
competitive inhibitors would block the active site directly so that the substrate
cannot join with the enzyme. There is also non-competitive inhibition where a
molecule would block another part of the enzyme and would actually change the
active site and so indirectly block the substrate. (see Figure 29)
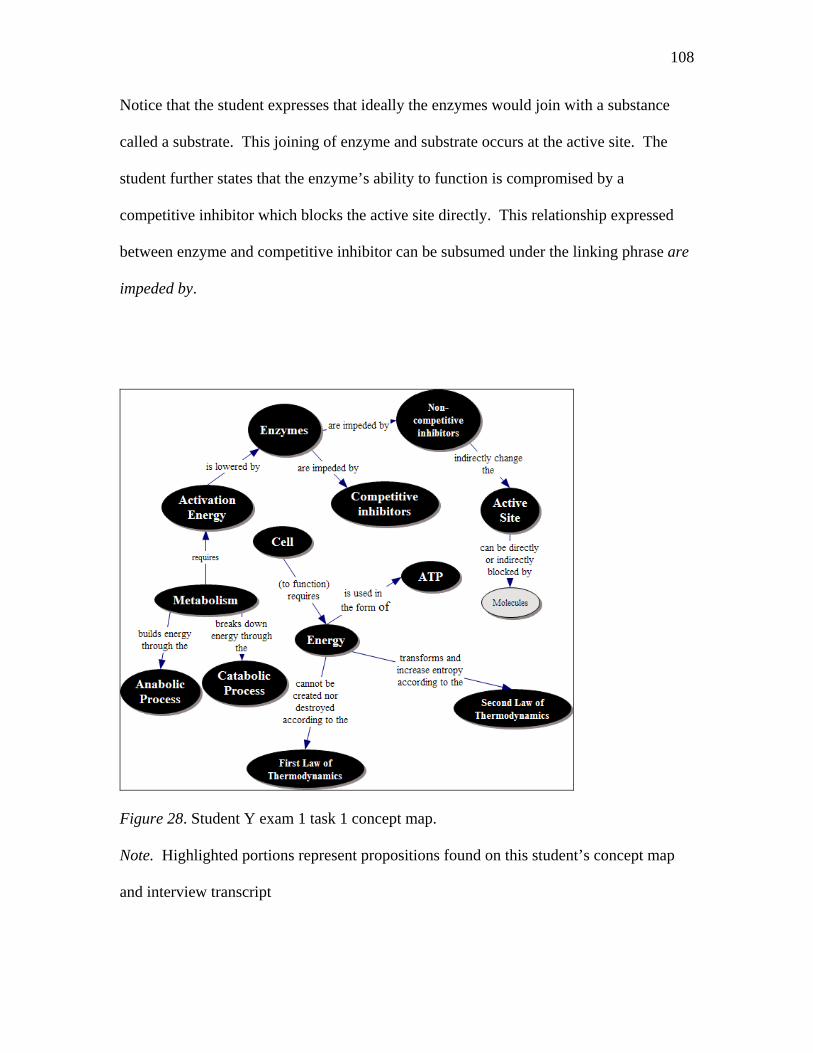
108
Notice that the student expresses that ideally the enzymes would join with a substance
called a substrate. This joining of enzyme and substrate occurs at the active site. The
student further states that the enzyme’s ability to function is compromised by a
competitive inhibitor which blocks the active site directly. This relationship expressed
between enzyme and competitive inhibitor can be subsumed under the linking phrase are
impeded by.
Figure 28. Student Y exam 1 task 1 concept map.
Note. Highlighted portions represent propositions found on this student’s concept map
and interview transcript
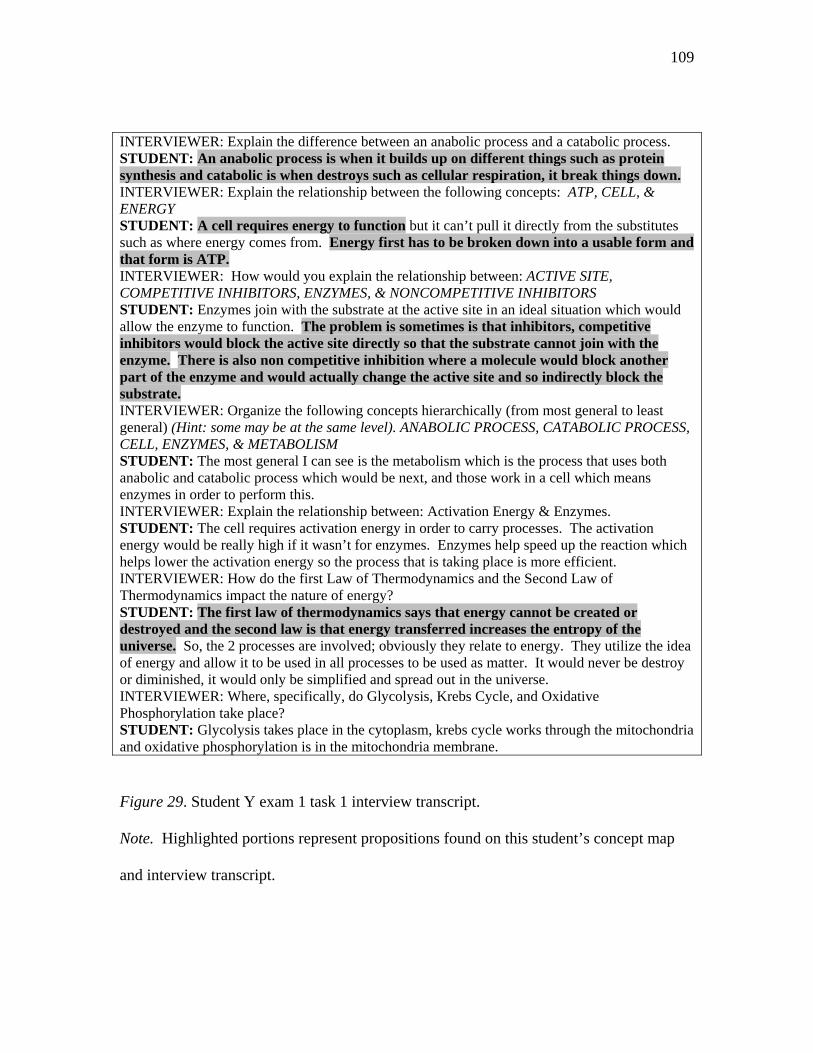
109
INTERVIEWER: Explain the difference between an anabolic process and a catabolic process. STUDENT: An anabolic process is when it builds up on different things such as protein synthesis and catabolic is when destroys such as cellular respiration, it break things down. INTERVIEWER: Explain the relationship between the following concepts: ATP, CELL, & ENERGY STUDENT: A cell requires energy to function but it can’t pull it directly from the substitutes such as where energy comes from. Energy first has to be broken down into a usable form and that form is ATP. INTERVIEWER: How would you explain the relationship between: ACTIVE SITE, COMPETITIVE INHIBITORS, ENZYMES, & NONCOMPETITIVE INHIBITORS STUDENT: Enzymes join with the substrate at the active site in an ideal situation which would allow the enzyme to function. The problem is sometimes is that inhibitors, competitive inhibitors would block the active site directly so that the substrate cannot join with the enzyme. There is also non competitive inhibition where a molecule would block another part of the enzyme and would actually change the active site and so indirectly block the substrate. INTERVIEWER: Organize the following concepts hierarchically (from most general to least general) (Hint: some may be at the same level). ANABOLIC PROCESS, CATABOLIC PROCESS, CELL, ENZYMES, & METABOLISM STUDENT: The most general I can see is the metabolism which is the process that uses both anabolic and catabolic process which would be next, and those work in a cell which means enzymes in order to perform this. INTERVIEWER: Explain the relationship between: Activation Energy & Enzymes. STUDENT: The cell requires activation energy in order to carry processes. The activation energy would be really high if it wasn’t for enzymes. Enzymes help speed up the reaction which helps lower the activation energy so the process that is taking place is more efficient. INTERVIEWER: How do the first Law of Thermodynamics and the Second Law of Thermodynamics impact the nature of energy? STUDENT: The first law of thermodynamics says that energy cannot be created or destroyed and the second law is that energy transferred increases the entropy of the universe. So, the 2 processes are involved; obviously they relate to energy. They utilize the idea of energy and allow it to be used in all processes to be used as matter. It would never be destroy or diminished, it would only be simplified and spread out in the universe. INTERVIEWER: Where, specifically, do Glycolysis, Krebs Cycle, and Oxidative Phosphorylation take place? STUDENT: Glycolysis takes place in the cytoplasm, krebs cycle works through the mitochondria and oxidative phosphorylation is in the mitochondria membrane.
Figure 29. Student Y exam 1 task 1 interview transcript.
Note. Highlighted portions represent propositions found on this student’s concept map
and interview transcript.
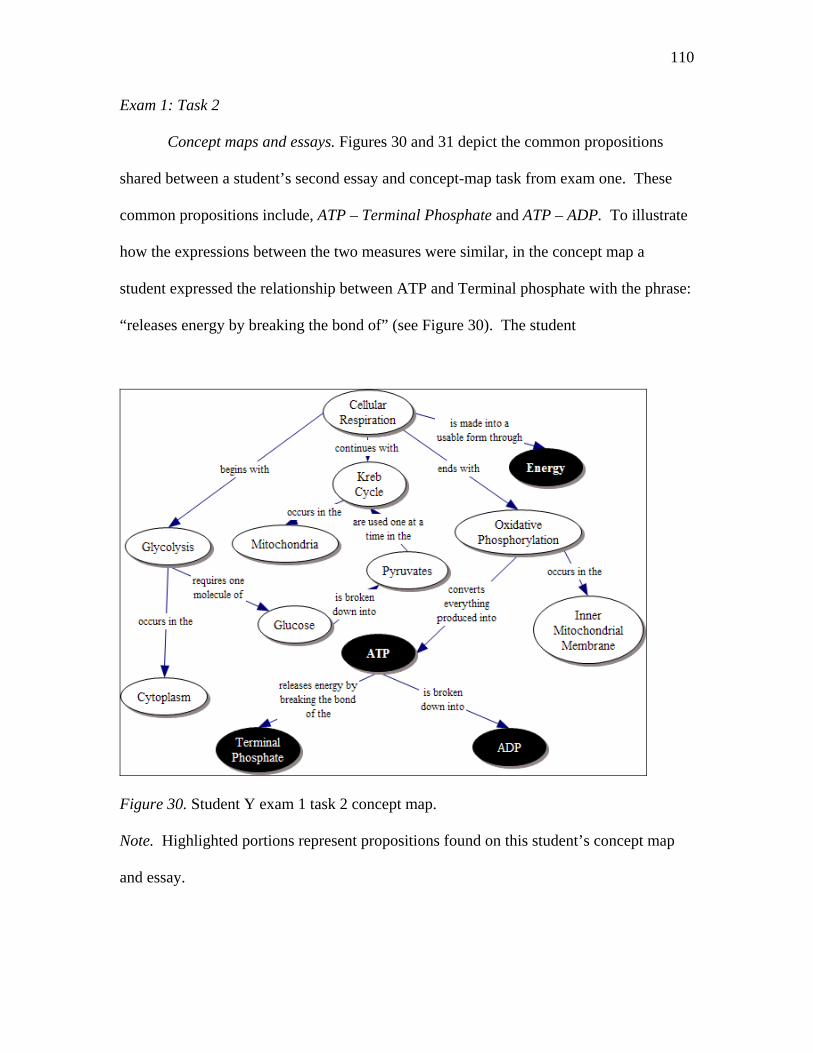
110
Exam 1: Task 2
Concept maps and essays. Figures 30 and 31 depict the common propositions
shared between a student’s second essay and concept-map task from exam one. These
common propositions include, ATP – Terminal Phosphate and ATP – ADP. To illustrate
how the expressions between the two measures were similar, in the concept map a
student expressed the relationship between ATP and Terminal phosphate with the phrase:
“releases energy by breaking the bond of” (see Figure 30). The student
Figure 30. Student Y exam 1 task 2 concept map.
Note. Highlighted portions represent propositions found on this student’s concept map
and essay.
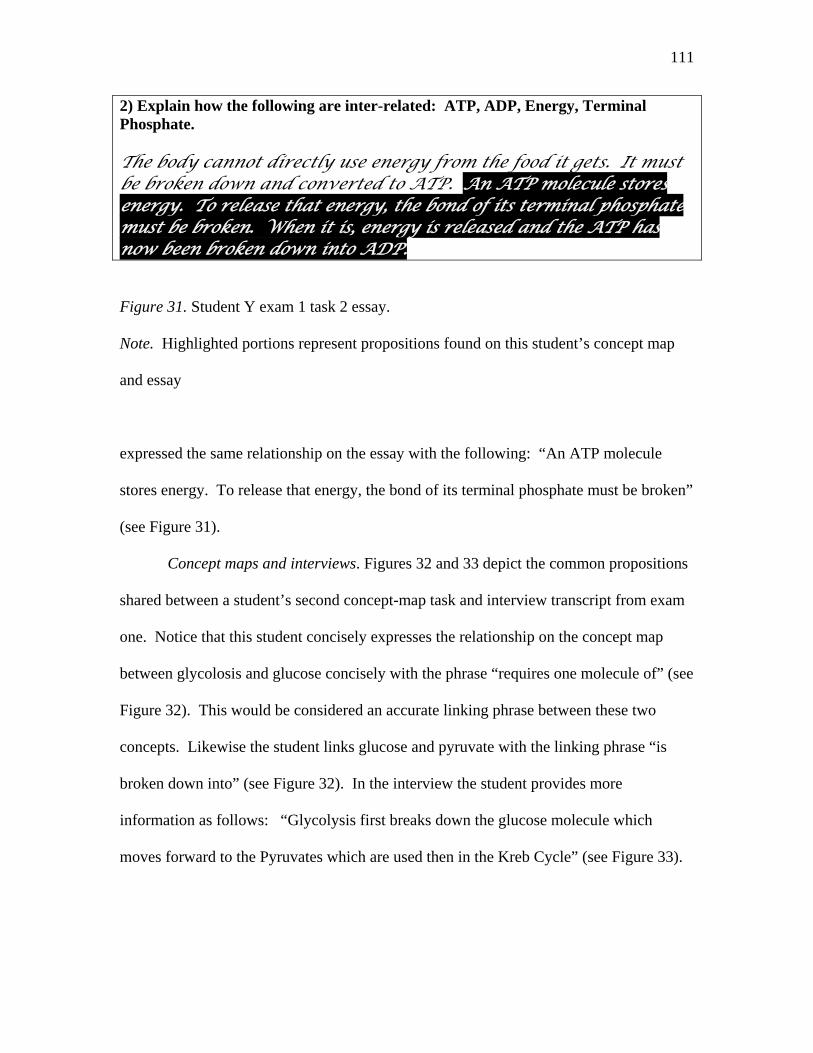
111
2) Explain how the following are inter-related: ATP, ADP, Energy, Terminal Phosphate. The body cannot directly use energy from the food it gets. It must be broken down and converted to ATP. An ATP molecule stores energy. To release that energy, the bond of its terminal phosphate must be broken. When it is, energy is released and the ATP has now been broken down into ADP.
Figure 31. Student Y exam 1 task 2 essay.
Note. Highlighted portions represent propositions found on this student’s concept map
and essay
expressed the same relationship on the essay with the following: “An ATP molecule
stores energy. To release that energy, the bond of its terminal phosphate must be broken”
(see Figure 31).
Concept maps and interviews. Figures 32 and 33 depict the common propositions
shared between a student’s second concept-map task and interview transcript from exam
one. Notice that this student concisely expresses the relationship on the concept map
between glycolosis and glucose concisely with the phrase “requires one molecule of” (see
Figure 32). This would be considered an accurate linking phrase between these two
concepts. Likewise the student links glucose and pyruvate with the linking phrase “is
broken down into” (see Figure 32). In the interview the student provides more
information as follows: “Glycolysis first breaks down the glucose molecule which
moves forward to the Pyruvates which are used then in the Kreb Cycle” (see Figure 33).
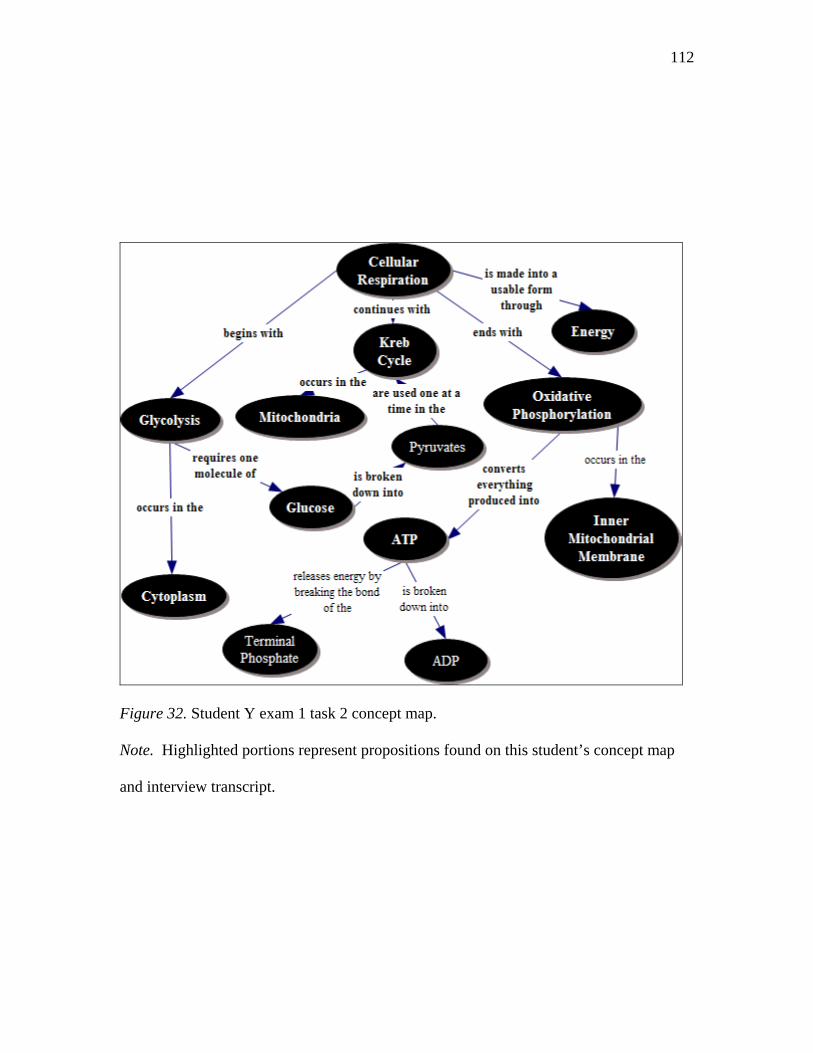
112
Figure 32. Student Y exam 1 task 2 concept map.
Note. Highlighted portions represent propositions found on this student’s concept map
and interview transcript.
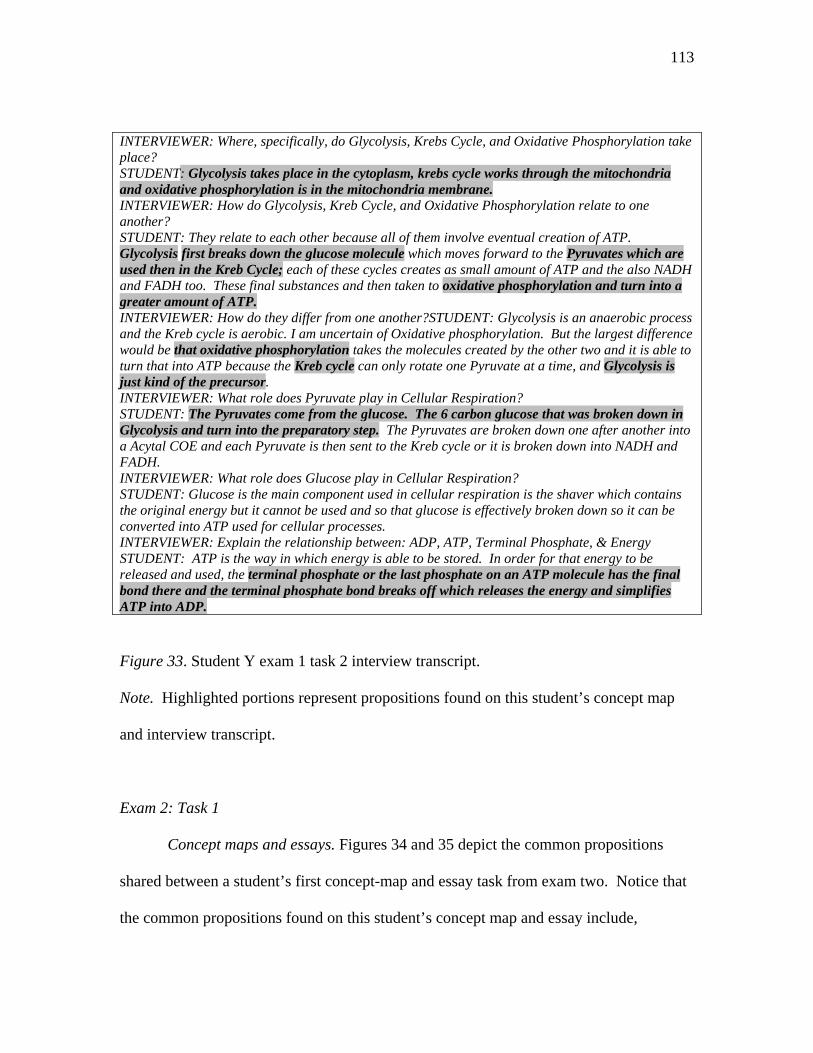
113
INTERVIEWER: Where, specifically, do Glycolysis, Krebs Cycle, and Oxidative Phosphorylation take place? STUDENT: Glycolysis takes place in the cytoplasm, krebs cycle works through the mitochondria and oxidative phosphorylation is in the mitochondria membrane. INTERVIEWER: How do Glycolysis, Kreb Cycle, and Oxidative Phosphorylation relate to one another? STUDENT: They relate to each other because all of them involve eventual creation of ATP. Glycolysis first breaks down the glucose molecule which moves forward to the Pyruvates which are used then in the Kreb Cycle; each of these cycles creates as small amount of ATP and the also NADH and FADH too. These final substances and then taken to oxidative phosphorylation and turn into a greater amount of ATP. INTERVIEWER: How do they differ from one another?STUDENT: Glycolysis is an anaerobic process and the Kreb cycle is aerobic. I am uncertain of Oxidative phosphorylation. But the largest difference would be that oxidative phosphorylation takes the molecules created by the other two and it is able to turn that into ATP because the Kreb cycle can only rotate one Pyruvate at a time, and Glycolysis is just kind of the precursor. INTERVIEWER: What role does Pyruvate play in Cellular Respiration? STUDENT: The Pyruvates come from the glucose. The 6 carbon glucose that was broken down in Glycolysis and turn into the preparatory step. The Pyruvates are broken down one after another into a Acytal COE and each Pyruvate is then sent to the Kreb cycle or it is broken down into NADH and FADH. INTERVIEWER: What role does Glucose play in Cellular Respiration? STUDENT: Glucose is the main component used in cellular respiration is the shaver which contains the original energy but it cannot be used and so that glucose is effectively broken down so it can be converted into ATP used for cellular processes. INTERVIEWER: Explain the relationship between: ADP, ATP, Terminal Phosphate, & Energy STUDENT: ATP is the way in which energy is able to be stored. In order for that energy to be released and used, the terminal phosphate or the last phosphate on an ATP molecule has the final bond there and the terminal phosphate bond breaks off which releases the energy and simplifies ATP into ADP.
Figure 33. Student Y exam 1 task 2 interview transcript.
Note. Highlighted portions represent propositions found on this student’s concept map
and interview transcript.
Exam 2: Task 1
Concept maps and essays. Figures 34 and 35 depict the common propositions
shared between a student’s first concept-map and essay task from exam two. Notice that
the common propositions found on this student’s concept map and essay include,
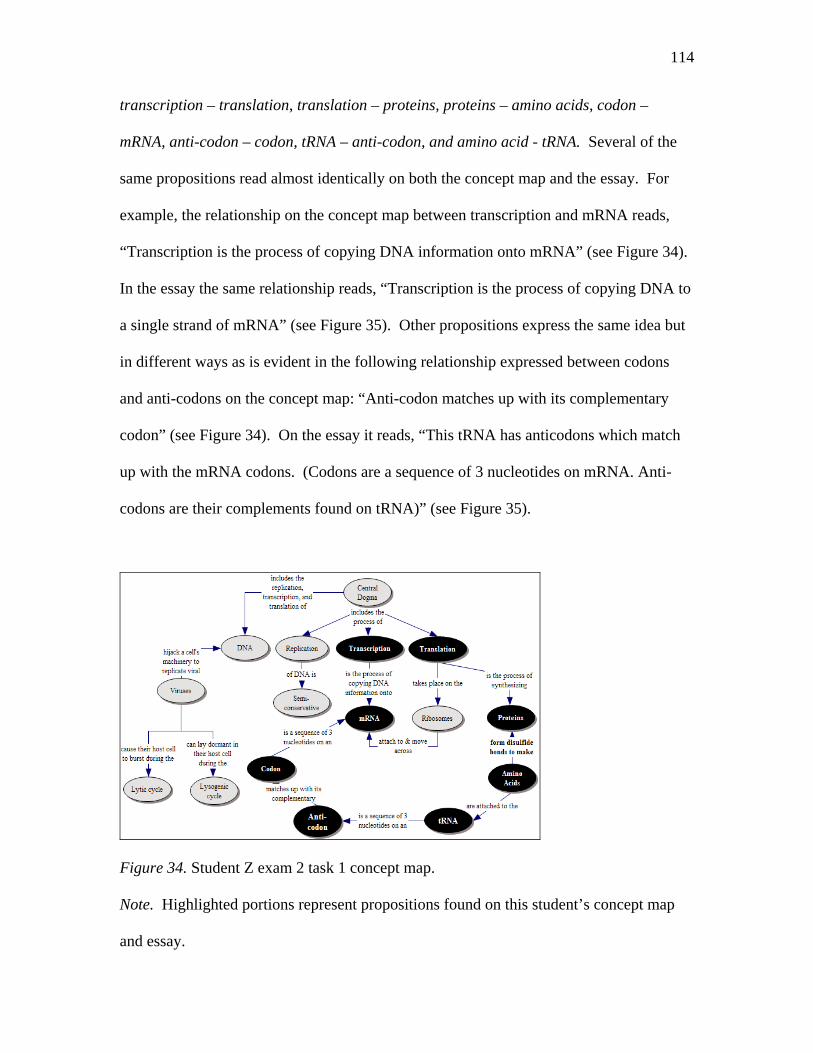
114
transcription – translation, translation – proteins, proteins – amino acids, codon –
mRNA, anti-codon – codon, tRNA – anti-codon, and amino acid - tRNA. Several of the
same propositions read almost identically on both the concept map and the essay. For
example, the relationship on the concept map between transcription and mRNA reads,
“Transcription is the process of copying DNA information onto mRNA” (see Figure 34).
In the essay the same relationship reads, “Transcription is the process of copying DNA to
a single strand of mRNA” (see Figure 35). Other propositions express the same idea but
in different ways as is evident in the following relationship expressed between codons
and anti-codons on the concept map: “Anti-codon matches up with its complementary
codon” (see Figure 34). On the essay it reads, “This tRNA has anticodons which match
up with the mRNA codons. (Codons are a sequence of 3 nucleotides on mRNA. Anti-
codons are their complements found on tRNA)” (see Figure 35).
Figure 34. Student Z exam 2 task 1 concept map.
Note. Highlighted portions represent propositions found on this student’s concept map
and essay.
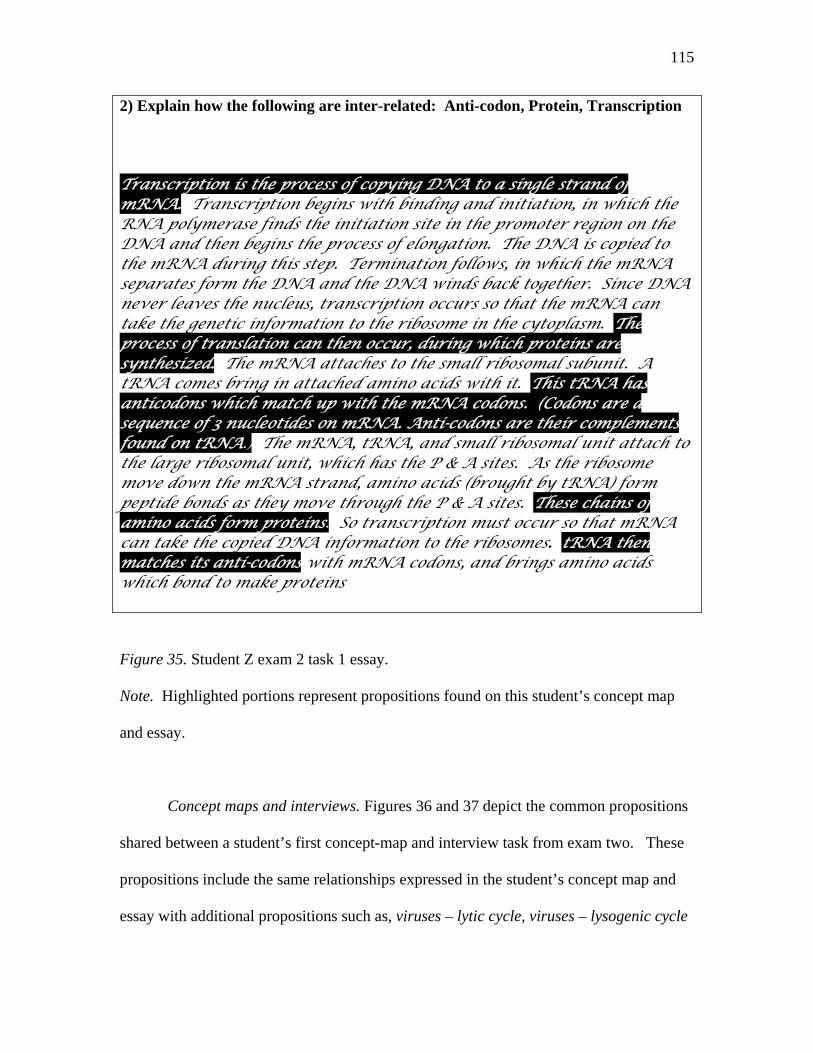
115
2) Explain how the following are inter-related: Anti-codon, Protein, Transcription Transcription is the process of copying DNA to a single strand of mRNA. Transcription begins with binding and initiation, in which the RNA polymerase finds the initiation site in the promoter region on the DNA and then begins the process of elongation. The DNA is copied to the mRNA during this step. Termination follows, in which the mRNA separates form the DNA and the DNA winds back together. Since DNA never leaves the nucleus, transcription occurs so that the mRNA can take the genetic information to the ribosome in the cytoplasm. The process of translation can then occur, during which proteins are synthesized. The mRNA attaches to the small ribosomal subunit. A tRNA comes bring in attached amino acids with it. This tRNA has anticodons which match up with the mRNA codons. (Codons are a sequence of 3 nucleotides on mRNA. Anti-codons are their complements found on tRNA.) The mRNA, tRNA, and small ribosomal unit attach to the large ribosomal unit, which has the P & A sites. As the ribosome move down the mRNA strand, amino acids (brought by tRNA) form peptide bonds as they move through the P & A sites. These chains of amino acids form proteins. So transcription must occur so that mRNA can take the copied DNA information to the ribosomes. tRNA then matches its anti-codons with mRNA codons, and brings amino acids which bond to make proteins
Figure 35. Student Z exam 2 task 1 essay.
Note. Highlighted portions represent propositions found on this student’s concept map
and essay.
Concept maps and interviews. Figures 36 and 37 depict the common propositions
shared between a student’s first concept-map and interview task from exam two. These
propositions include the same relationships expressed in the student’s concept map and
essay with additional propositions such as, viruses – lytic cycle, viruses – lysogenic cycle
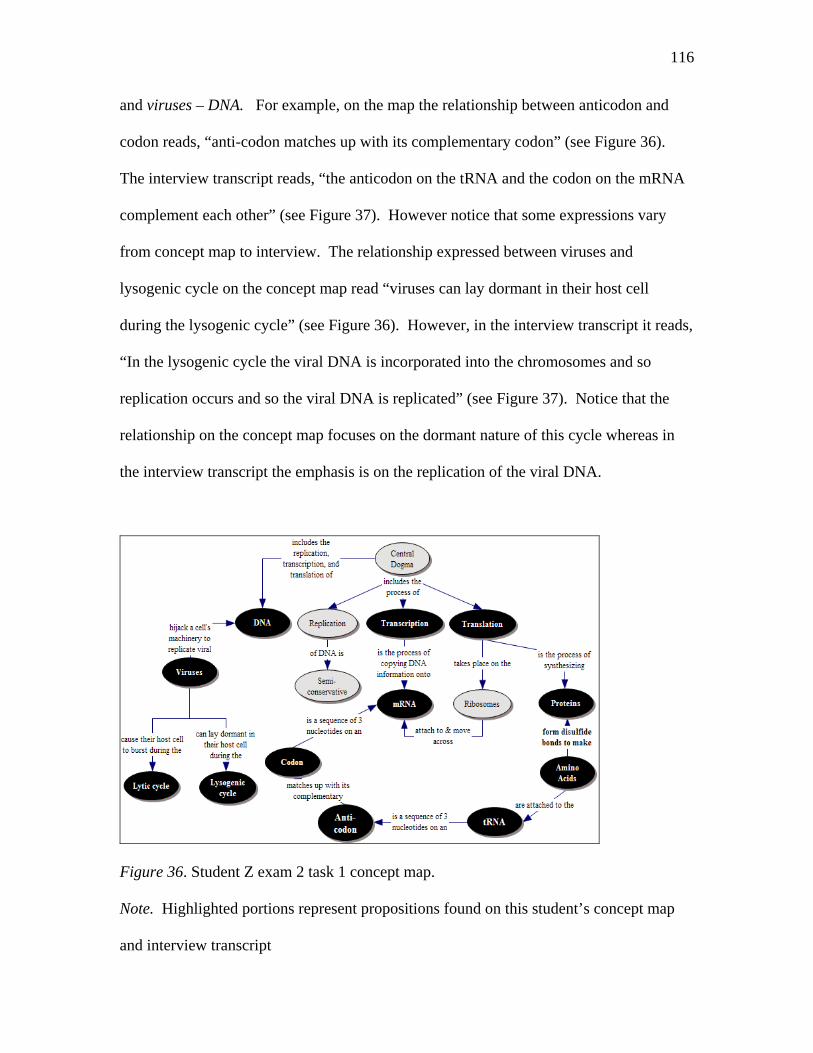
116
and viruses – DNA. For example, on the map the relationship between anticodon and
codon reads, “anti-codon matches up with its complementary codon” (see Figure 36).
The interview transcript reads, “the anticodon on the tRNA and the codon on the mRNA
complement each other” (see Figure 37). However notice that some expressions vary
from concept map to interview. The relationship expressed between viruses and
lysogenic cycle on the concept map read “viruses can lay dormant in their host cell
during the lysogenic cycle” (see Figure 36). However, in the interview transcript it reads,
“In the lysogenic cycle the viral DNA is incorporated into the chromosomes and so
replication occurs and so the viral DNA is replicated” (see Figure 37). Notice that the
relationship on the concept map focuses on the dormant nature of this cycle whereas in
the interview transcript the emphasis is on the replication of the viral DNA.
Figure 36. Student Z exam 2 task 1 concept map.
Note. Highlighted portions represent propositions found on this student’s concept map
and interview transcript
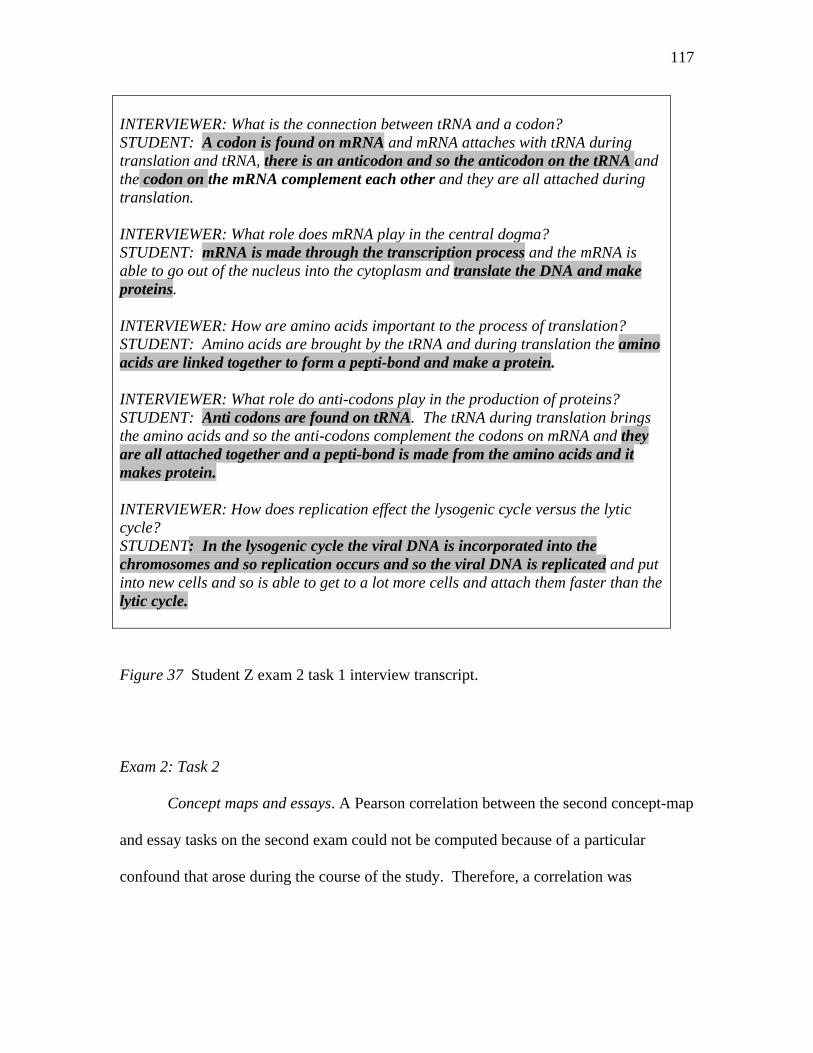
117
INTERVIEWER: What is the connection between tRNA and a codon? STUDENT: A codon is found on mRNA and mRNA attaches with tRNA during translation and tRNA, there is an anticodon and so the anticodon on the tRNA and the codon on the mRNA complement each other and they are all attached during translation. INTERVIEWER: What role does mRNA play in the central dogma? STUDENT: mRNA is made through the transcription process and the mRNA is able to go out of the nucleus into the cytoplasm and translate the DNA and make proteins. INTERVIEWER: How are amino acids important to the process of translation? STUDENT: Amino acids are brought by the tRNA and during translation the amino acids are linked together to form a pepti-bond and make a protein. INTERVIEWER: What role do anti-codons play in the production of proteins? STUDENT: Anti codons are found on tRNA. The tRNA during translation brings the amino acids and so the anti-codons complement the codons on mRNA and they are all attached together and a pepti-bond is made from the amino acids and it makes protein. INTERVIEWER: How does replication effect the lysogenic cycle versus the lytic cycle? STUDENT: In the lysogenic cycle the viral DNA is incorporated into the chromosomes and so replication occurs and so the viral DNA is replicated and put into new cells and so is able to get to a lot more cells and attach them faster than the lytic cycle.
Figure 37 Student Z exam 2 task 1 interview transcript.
Exam 2: Task 2
Concept maps and essays. A Pearson correlation between the second concept-map
and essay tasks on the second exam could not be computed because of a particular
confound that arose during the course of the study. Therefore, a correlation was
118
computed between a composite of essay and interview propositions and similar
propositions also constructed on the concept map.
On the second essay task on the second midterm exam students were directed to
make connections between the concepts anti-bodies, exotoxins, and macrophages. As
was the case for task one on exam two these concepts are actually not directly related
with one another but require the students to add other concepts in the essay in order to
make the logical connections. The idea was that by directing the students to make
connections between the concepts antibodies, exotoxins, and macrophages, students
would have to respond with at the very least the concepts: gram positive bacteria,
antigens or pathogens, B cells, and humoral immunity. It was thought that the more
thorough answers would likewise include the concepts: gram negative, exotoxins, and
potentially peptidoglycan.
After student responses were collected, it was found that the majority of the
students included some but not all of the key additional concepts. This was probably a
result of an inadvertent error committed in the development of the exam. Those in charge
of developing the exam forgot to add this task. As a result none of the students answered
the second essay task while the exam was in session. An effort was made to overcome
this oversight by having the students complete the essay during the last 15 minutes of
class three days later. Students who otherwise might have taken more time to answer the
question more thoroughly may have been impacted by both the time constraint and the
surprise that they were still taking an exam they thought they had already completed.
The time constraints, therefore, potentially made it less likely for students to add the
additional required concepts.
119
With this confound in mind the author decided to not correlate the concept-map
and essay scores, but to create a composite score combining those connections made on
the concept map with those made on both the essay and interview transcript.
Concept maps and interviews. Figures 38 and 39 depict the common propositions
shared between a student’s second concept-map task and interview transcript from exam
two. These propositions include the same paired conceptual relationships from the essay
with additional links between, humoral – antibodies, cell mediated – T lymphcytes, gram
positive and negative – peptidoglycan. On the concept map, the student expressed the
relationship between gram positive bacteria and peptidoglycan with the phrase, “Have
many layers of” (see Figure 38). They also expressed the relationship between gram
negative bacteria and peptidoglycan with the phrase, “Have one layer of” (see Figure 38).
This same relationship was expressed on the student’s interview with the following
phrase: “Gram positive has many layers of peptidoglycan and then the gram negative has
a plasma membrane and one layer of peptidoglycan” (see Figure 39).
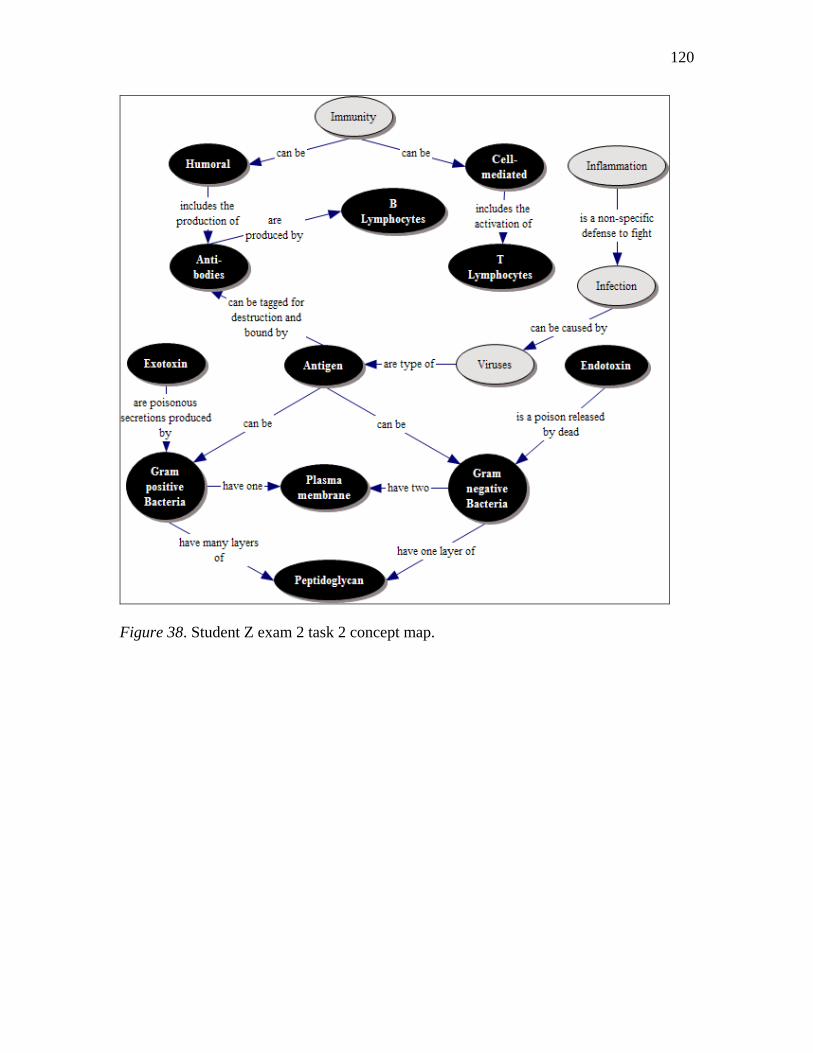
120
Figure 38. Student Z exam 2 task 2 concept map.
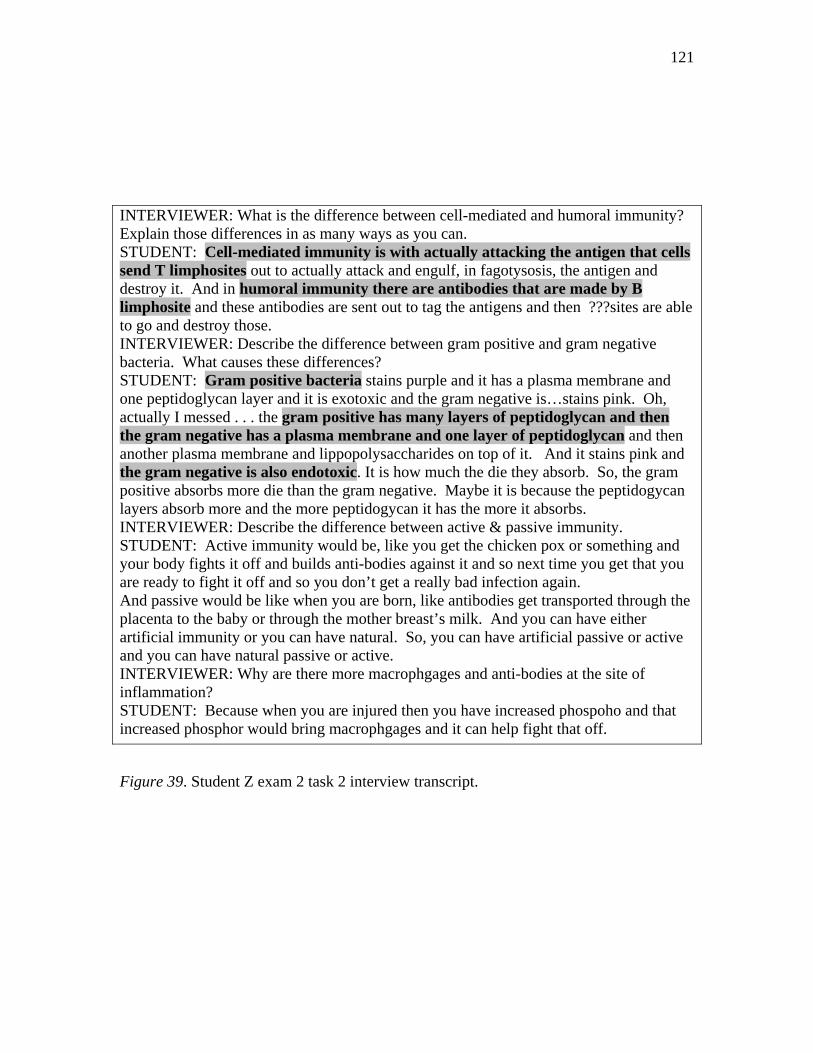
121
INTERVIEWER: What is the difference between cell-mediated and humoral immunity? Explain those differences in as many ways as you can. STUDENT: Cell-mediated immunity is with actually attacking the antigen that cells send T limphosites out to actually attack and engulf, in fagotysosis, the antigen and destroy it. And in humoral immunity there are antibodies that are made by B limphosite and these antibodies are sent out to tag the antigens and then ???sites are able to go and destroy those. INTERVIEWER: Describe the difference between gram positive and gram negative bacteria. What causes these differences? STUDENT: Gram positive bacteria stains purple and it has a plasma membrane and one peptidoglycan layer and it is exotoxic and the gram negative is…stains pink. Oh, actually I messed . . . the gram positive has many layers of peptidoglycan and then the gram negative has a plasma membrane and one layer of peptidoglycan and then another plasma membrane and lippopolysaccharides on top of it. And it stains pink and the gram negative is also endotoxic. It is how much the die they absorb. So, the gram positive absorbs more die than the gram negative. Maybe it is because the peptidogycan layers absorb more and the more peptidogycan it has the more it absorbs. INTERVIEWER: Describe the difference between active & passive immunity. STUDENT: Active immunity would be, like you get the chicken pox or something and your body fights it off and builds anti-bodies against it and so next time you get that you are ready to fight it off and so you don’t get a really bad infection again. And passive would be like when you are born, like antibodies get transported through the placenta to the baby or through the mother breast’s milk. And you can have either artificial immunity or you can have natural. So, you can have artificial passive or active and you can have natural passive or active. INTERVIEWER: Why are there more macrophgages and anti-bodies at the site of inflammation? STUDENT: Because when you are injured then you have increased phospoho and that increased phosphor would bring macrophgages and it can help fight that off.
Figure 39. Student Z exam 2 task 2 interview transcript.
122
CHAPTER 5: CONCLUSIONS AND RECOMMENDATIONS
In this chapter a discussion of the results of the study is offered along with a
description of the contributions made to the field of concept-mapping assessment
research as well as recommendations for future studies.
Research Question 1
Object of measurement
The object of measurement was the largest contributor to total rating variability
on both tasks. A relatively large amount of variance contributed by the object of
measurement is considered to be desirable in that it represents rating variability not
influenced by measurement error but person or student ability. This finding indicates that
an appreciable proportion of what caused the scores to vary was influenced by variability
in students’ abilities to express conceptual interrelationships.
Constrained C-mapping Task
As reported in the previous chapter the percentage of rating variability contributed
by the object of measurement on the constrained C-mapping task was 66% on the first
exam and 72% on the second exam. These results appear to indicate that penalizing
students for inaccurate propositions while simultaneously accounting for proposition
choice did not produce an undo amount of measurement error.
Open C-mapping Task
The percentage of rating variability contributed by the object of measurement on
the less-constrained or open C-mapping task was 93% on the first exam and 71% on the
second exam. It appears that encouraging students to add relevant concepts to their
concept maps while simultaneously accounting for proposition choice did not introduce a
123
relatively large amount of measurement error either. What is unusual about these results
is the inordinately high percentage contributed by student ability on the first task. While
such a result is not impossible, it is improbable. In general, rater-mediated assessments
that measure complex cognitive processes do not produce such high relative rating
variability associated with the object of measurement. Two hypotheses are posited for
this unusually large contribution to total rating variability on the first exam.
First, the rubric used on this task was the same rubric raters had used previously
to rate the weekly homework maps. Thus they were familiar with it by the time they used
it to rate the second concept-mapping task on the first exam. Rater familiarity with this
rubric may have resulted in a decrease in measurement error across all facets of rating on
this particular task compared to the first task where raters were required to consider the
addition of a -.5 level to the rubric.
A much more plausible hypothesis is that the previous homework assignment
contained essentially the same list of concepts as did the concept-map assessment on the
first exam. Students were given master maps along with their returned graded
assignment so as to compare their responses with the criterion map. The list of concepts
for this assignment, along with those listed in task 2 on exam 1, are provided in Table 17.
Notice that with the exception of the concept organisms the lists of concepts are the
same.
Other Sources of Measurement Error
Rater Error
Rater error appeared to be a function of raters deciding when and when not to
give students the benefit of the doubt when the propositions expressed were unclear.
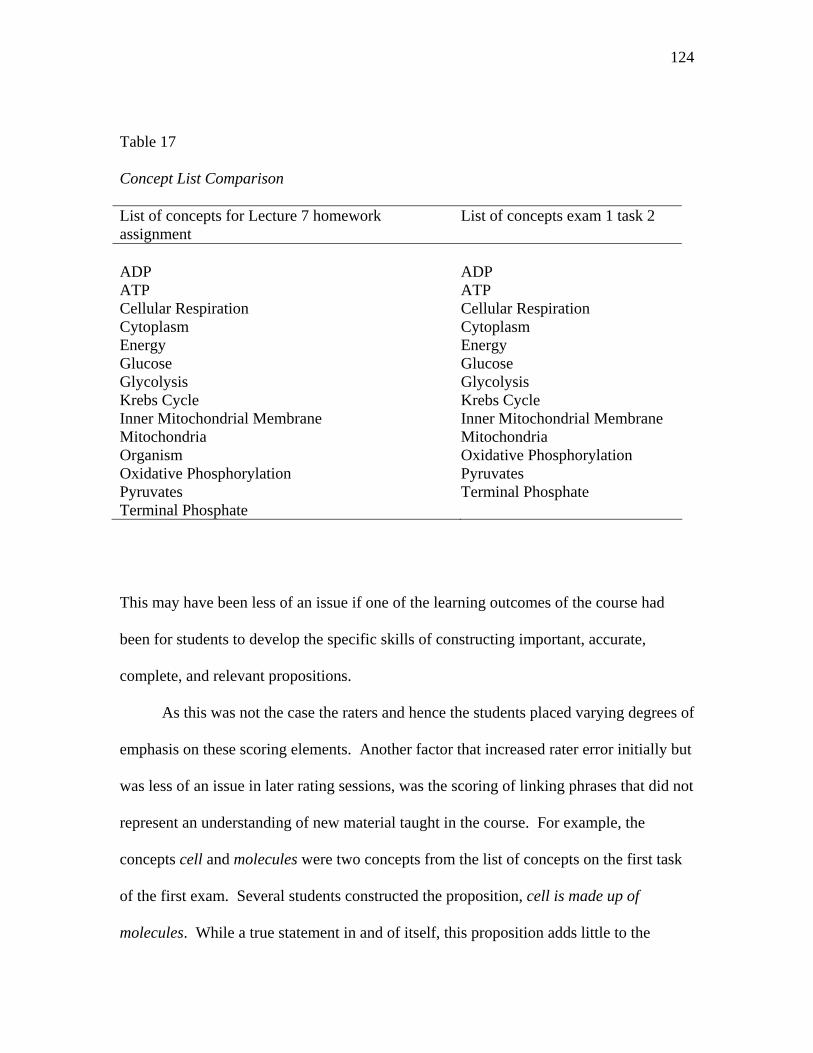
124
Table 17
Concept List Comparison
List of concepts for Lecture 7 homework assignment
List of concepts exam 1 task 2
ADP ATP Cellular Respiration Cytoplasm Energy Glucose Glycolysis Krebs Cycle Inner Mitochondrial Membrane Mitochondria Organism Oxidative Phosphorylation Pyruvates Terminal Phosphate
ADP ATP Cellular Respiration Cytoplasm Energy Glucose Glycolysis Krebs Cycle Inner Mitochondrial Membrane Mitochondria Oxidative Phosphorylation Pyruvates Terminal Phosphate
This may have been less of an issue if one of the learning outcomes of the course had
been for students to develop the specific skills of constructing important, accurate,
complete, and relevant propositions.
As this was not the case the raters and hence the students placed varying degrees of
emphasis on these scoring elements. Another factor that increased rater error initially but
was less of an issue in later rating sessions, was the scoring of linking phrases that did not
represent an understanding of new material taught in the course. For example, the
concepts cell and molecules were two concepts from the list of concepts on the first task
of the first exam. Several students constructed the proposition, cell is made up of
molecules. While a true statement in and of itself, this proposition adds little to the
125
understanding of the map topics that were catabolic and anabolic processes. This
example comes from the first task; however, it appears to have been more of an issue on
the second task. In retrospect, it appears that the rater training did not provide clear
enough direction at the outset of the study to assist the raters in developing a working
understanding of the rating elements represented in the rubric. This understanding
evolved with practice becoming less of an issue in subsequent rating sessions.
Person-by-rater Interaction
Error associated with the person-by-rater interaction seemed to be a result of similar
issues detected by the rating variability contributed by rater error. It would seem that the
refinements in rater understanding and use of the rating criteria that developed between
occasions did not impact the occasion facet but may have impacted the person-by-rater
interaction. This would indicate that as each rater internalized their own clarifications of
the rating criteria they did so in a way that caused the concept-map rating rank order to be
different from rater to rater.
Error contributed by the rater-by-occasion interaction appeared to be a function of
raters developing nuanced understandings of student expressions of conceptual
interrelationships over time. However, instead of raters as a group becoming equally
more or less stringent in their ratings, some raters became more stringent while others
became more lenient. It appears that during the first task on the first exam raters were
trying to feel their way to a coherent understanding of how to use the rubric to rate
propositions. As this understanding became more stable, the magnitude of the rater-by-
occasion interaction diminished dramatically.
126
Finally, residual or unexplained error generally contributed in the double-digit
percentages to the total variability across exams and tasks. Rater fatigue was potentially
one factor along with the fact that raters tended to tighten up their understanding of the
criteria as they progressed through the rating session.
Contributions to the Field
To put these findings in perspective the only other published studies that have
reported total variation of ratings contributed by the object of measurement were
McClure et al. (1999) and Yin and Shavelson (2004). In the case of the study conducted
by McClure et al. (1999) the generalizability coefficients of six scoring methods were
compared using a person-by-rater fully crossed design. For each of the six scoring
methods the object of measurement accounted for 15%, 27%, 33%, 35%, 55%, and 65%
of the total rating variation. The study conducted by Yin and Shavelson compared two
concept-mapping tasks using a person-by-proposition-by-format fully crossed design and
a person-by-proposition-by-occasion fully crossed design. In all four cases, the
percentage of the total rating variability contributed by the object of measurement was
5.9%, 8.1%, 10.4%, and 18.6%. In each case by far the greatest contributor to the total
rating variation was unexplained error.
While there is no definitive explanation for the small percentage of variance
associated with the object of measurement reported in these studies, one possible
hypothesis should be considered. Unlike the studies previously cited, the teaching
assistant/raters in this study had a developed sense of student abilities with the material in
that they attended every one of their classes and recitation sessions along with grading all
of the homework. In this way they gained a thorough understanding of not only the
127
material on which the students were instructed but their level of understanding of that
material. Likewise, the raters became very familiar with the rating rubric as they rated
concept-mapping homework assignments as well as exam test items. The combination of
these factors may have been instrumental in generating such high relative variance
associated with the object of measurement.
Along with the strengths of both rubrics in assisting raters to produce reliable and
valid ratings, several weaknesses became apparent as well. Raters reported that during
the rating sessions when a student’s response was unclear, they tended to guess what they
thought the students meant. All four raters indicated that if a student constructed several
correct propositions adjacent to a proposition that was unclear they generally gave the
student the benefit of the doubt, awarding them full points. This halo effect was not
uniform between or within raters in every instance and no doubt represented a source of
measurement error.
Another issue impacting the reliability of the ratings arose from the requirement
on the first task to penalize students with negative points for inaccurate propositions. In
several instances a student constructed what otherwise would have been an important,
accurate, complete, and relevant proposition but added just one word in the proposition
that rendered it inaccurate. Following the directions in the rubric raters penalized the
student -0.5 points. The raters felt that such a penalty was overly harsh when the student
otherwise gave evidence of being knowledgeable about the subject. In several instances
raters made accommodations for such cases no doubt impacting the consistency of their
ratings.
128
One final factor impacting the reliability of the ratings should be considered.
While the rubrics were designed to account for important rating elements, they presented
some problems for the raters. A review of the C-mapping task rubrics in Appendices B
through E depicts rubrics designed to direct rater attention to proposition choice and the
other rating elements. However, as raters focused their attention on each proposition they
were required to consider all four rating elements simultaneously. It also became
apparent towards the end of the study that the rubric did not account explicitly for all four
rating elements at every level. The taxing cognitive load placed on the raters was
possibly overcome by rater familiarity with the intent of the rubric, the course content,
and student ability levels. Such rater preparation is not always plausible to attain in many
educational settings and hence a rubric should be designed that accounts more clearly for
the four rating elements.
Research Question 2
Because of the challenge with task 2 on first exam documented previously,
conclusive evidence is not available to compare the reliability coefficients between these
two scoring methods. However, some issues became evident as the study unfolded.
First, the reliability coefficients for both concept-mapping tasks were relatively high for
both relative and absolute decisions. As stated before, this was probably a function of the
fact that the teaching assistants were very familiar with what material was and was not
covered in class lectures and lab sessions. Second, the author assumed that the first
scoring scheme where students were more constrained in their responses would have
higher reliability ratings. This was the case with exam 2, but not with exam 1.
129
Regardless of these confounds the generalizability coefficients ranged form .72 to .92
which are considered moderately to very high.
Research Question 3
The D-study results provided projected generalizability coefficients for rating
designs that would be more cost-effective to implement than the fully-crossed design
used in this study. Under similar rating and instructional conditions the increase of one
rater to two raters rating each map on one occasion provided the largest increase in the
generalizability coefficient.
Research Question 4
The most feasible design to be used under similar study conditions would be the
person-by-rater nested within occasion design. This design has one rater rate each map
on one occasion and another rater rate each map on a separate occasion. These designs
could feasibly be used by classroom teachers without an appreciable decrease in the
overall generalizability coefficient.
Research Question 5
In summary the Pearson correlation coefficients were moderately high. They
were higher than some studies such as Novak and Gowin (1984) who compared concept-
map ratings with multiple choice scores, but not as high as others such as Anderson and
Huang (1989) who compared concept-map ratings to standardized exams. In the case of
study reported by Novak and Gowin, the lower correlations were attributed to the
possibility that concept-mapping scores and other test items draw upon different
cognitive processes. The lack of correlation in this study was primarily due to two
factors in particular: (a) student lack of familiarity with scoring elements described in
130
both C-mapping task rubrics, and (b) differences in the constraints imposed on the
students between concept-mapping and criterion measure tasks.
Understanding of the Scoring Elements
Students in this study were familiar with the basic conventions of constructing a
concept map. For example, few students constructed snake-like propositions that weaved
through more than two concepts on the map. Few students failed to put arrows showing
the direction of the propositions. Likewise, few students constructed maps without
linking phrases. Where students lacked awareness was with regards to the scoring
elements of the rubrics used with both tasks. As stated earlier, student propositions were
scored based on proposition importance, accuracy, completeness, and conciseness. It
appears that rater training on how to account for these scoring elements during homework
assignments was not as uniformly clear as it should have been. Consequently, students
were not held as accountable for these proposition rating properties so as to assist them in
developing a working understanding of how to account for them when constructing a
proposition. Hence, students with a solid understanding of how each set of concepts were
interrelated may not have developed working knowledge of how to express that
understanding.
Student motivation became another factor that may have impacted their
investment in becoming familiar with the demands of the rating rubric. It appears that the
overall weighting of concept-mapping scores relative to the entire point total of the class
was not large enough to motivate students to take the time to meet with their assigned
teaching assistant to receive feedback on their maps. The impact of this factor was that
131
as the semester wore on fewer and fewer students visited with their assigned teaching
assistant to review the details of their maps.
Different Task Constraints
It is important to note that a correlation between two measures is a function of the
degree to which the criterion and target assessment tasks tap into the same traits or
cognitive processes. As stated earlier several researchers hypothesized that concept maps
target different cognitive processes than other more traditional test items. In this study
this factor may have contributed to the concept map, essay, and interview scores not
being as highly correlated. Hence, the lack of correlation may have been attributed to the
following factors: (a) the different constraints imposed on student responses between
concept-mapping and criterion measure conventions and (b) the different constraints
imposed on students that were not caused by the differences in assessment conventions.
Constraints Impacted by Assessment Conventions
The main difference in assessment constraints between concept-map and criterion
measures is manifest in the different ways in which propositions are expressed across
these measures. When constructing a proposition on a concept map, the first concept is
expressed at the beginning of the proposition and the second concept is expressed at the
end. Instances exist where this constraint makes it difficult to link two concepts that
otherwise would not be difficult to link in an essay or interview format. Essays and
interview responses are expressed in a narrative format where as concept-map responses
are not.
As raters search for propositions, many relationships eventually become apparent
as students continue to write or verbally explain how everything fits together. For
132
example, the relationship between the concepts ATP and energy could be expressed in an
essay as follows: When the terminal phosphate on an ATP molecule is broken, energy is
released. This energy takes a form that can be processed by the cell. Expressing this
same relationship in a concept-map proposition was challenging for many students.
During Dr. Booth’s lectures students repeated the phrase, ATP is the energy currency of
the cell. ATP and energy were among the list of concepts on the mapping task; however
cell was not. This created a challenge for the students because while they could construct
the proposition ATP is the energy currency of the cell they were at a loss as to how to
express the same idea between ATP and energy, which could be, energy that is usable by
the cell is called ATP.
In summary, the C-mapping task with the unique scoring elements described in
the rubric did not afford students freedom of narrative. Students had to think carefully
about all aspects of each conceptual relationship and then summarize it in an accurate,
complete, and concise way. Such differences in assessment constraints appear to have
had an impact on rating correlations.
Constraints Not Impacted by Assessment Conventions
Some differences in constraints were not a function of varying assessment
conventions, but were more an artifact of how the assessor designed the assessments.
Both C-mapping tasks under investigation in this study directed students to construct
concept maps from a list of twelve to fourteen concepts. Under these conditions students
were tested on their ability to connect the most closely related concepts. No prompts
were given with regards to which concepts were more closely related and which were
not. The essays and interviews on the other hand directed students to describe the
133
relationship between two to four concepts. The questions themselves served as prompts
that these concepts were in some way closely related. The results were that students
made connections in their essays and interviews that they did not make on their concept
maps because they were not prompted to do so. This appeared to have an impact on the
score correlation between concept-map and criterion measures.
Keeping these issues in mind, it appears that there was greater shared variance
between interview and essay scores and concept-mapping scores with task 1 than task 2.
This may have been caused by students taking greater care to construct propositions on
the first task than the second because of the risk of losing points for inaccurate linking
phrases. Several students during the interviews indicated that this was the case. Students
tended to be more focused in their responses on the first task, taking greater care to
connect the key conceptual pairs. The second task proved to have greater conceptual
variability because students were free to add five additional concepts. Those concepts in
many instances were not evident in the essay or interview responses. Although students
were encouraged to add as many concepts as they could to their essay and interview
responses, and several did, they in many instances were not the same additions found on
their corresponding concept maps. More research needs to be conducted analyzing the
link between the constraints of each task with the cognitive activities they evoke (Ruiz-
Primo et al., 2001).
Study Contributions
Studies investigating the degree to which concept-map assessments generate
reliable scores have been conducted over several decades. (Ruiz-Primo et al., 2001; Ruiz-
Primo & Shavelson, 1996). This particular study investigated the reliability of scores
134
generated from two modified C-mapping tasks. What makes the C-mapping task unique
is that it has shown to provide the best evidence of rating reliability while appreciably
diminishing the threat to overall construct validity (Ruiz-Primo et al.). While showing
great promise with regards to these two psychometric properties, several rating
challenges have been raised with regards to their use (Yin et al., 2005). These rating
challenges have been manifest in the difficulty of accounting for proposition choice when
using the C-mapping task. The rubrics used in both C-mapping tasks in this study were
designed to account for proposition choice along with proposition completeness,
accuracy, and conciseness. Both evidenced score reliability, and to some degree (barring
several confounds), criterion-related validity.
Future Research
Several issues emerged from the two studies conducted as part of the present
research that inform the recommendations for future research offered in this section.
First, recommendations are offered with regards to preparing an appropriate methodology
for those interested in conducting similar studies and second, a recommendation is
offered for researching the psychometric properties of a more robust scoring rubric.
An Appropriate Methodology
Three recommendations are offered for those researchers interested in developing
an appropriate study methodology when conducting concept-map assessment research
similar to this study. First, it is critical to choose those concepts from the content domain
that will showcase student ability to produce strong conceptual interrelationships on their
concept maps. Second, it is just as critical to assist students in understanding, practicing,
and receiving feedback on their concept maps with those scoring elements that require
135
students to draw upon targeted cognitive processes. Third, when correlating scores with
a criterion measure, both measures should share as similar task demands, task constraints,
and scoring methods as possible.
Content Domain
Subject matter content domains vary in the degree to which they can be mapped.
Domains that contain concepts with definable boundaries (Donald, 2002) tend to lend
themselves to being mapped more than those with less-definable concepts or boundaries.
Those domains with ambiguously defined or fuzzy concepts (Merrill & Tennyson, 1977)
tend to be less mappable. Nevertheless, even domains with fuzzy concepts could be
mapped if students are provided with working definitions of those concepts based on
specific contexts. For example, certain concepts found in medieval literature can be
defined within the context of the piece of literature being studied. In such a scenario,
quality propositions within such domains could be established based on their degree of
importance, accuracy, completeness, and relevance as depicted within the given context.
The important point to remember is that students must have access to the conceptual
definitions as well as their conceptual interrelationships in order for concept mapping to
be integrated within a course curriculum.
Instructors interested in using concept maps as viable instruction and/or
evaluative tools should invest resources to ensure that their subject domain is clearly
mappable for themselves and also for their students. Instructors who have tacked on
concept-mapping to their curriculum without serious forethought as to the mappability of
their subject have generally been disappointed with the results (Kinchin, 2000). As a
learning, instructional, or evaluative tool, concept mapping can be viable only to the
136
degree that an educator makes important front-end preparations. The following
recommendations should be considered before adding concept mapping to any course
curriculum. It is, therefore, critical that:
1. Each key concept as well as the conceptual interrelationships in the content
domain is clearly defined.
2. The instructor has a command of the conceptual language of the course.
3. Students have access to resources where conceptual interrelationships are either
laid out clearly or can be deduced.
4. The instructor must clearly establish that one of the learning outcomes of their
course can be captured by concept maps. If this is not the case then concept
mapping should not be considered.
5. Assessments targeting the cognitive process of interest must be clearly devised.
6. Resources providing specific and meaningful concept-mapping feedback must be
in place.
Familiarity with the Scoring Elements
Once the scoring elements targeting the cognitive process of interest by the
assessment have been developed, it is important to deploy resources that will provide
students with meaningful training, practice, and feedback on their concept maps. The
formative feedback should assist the students in becoming familiar with the scoring
elements. If those scoring elements target those cognitive processes of greatest interest to
both student and instructor, the formative aspect of their concept-mapping experiences
should provide them with experiences that promote mastery of those cognitive processes.
137
Criterion Measures
The criterion measures should share, to the extent possible, similar task and
scoring properties with the target measures with which they are being compared. Of
course, no criterion measure will be identical to a measure under investigation. If this
were the case, then one of the measures would be irrelevant. That said, it is important to
design the criterion measure task and its corresponding scoring method in such a way to
ensure a link between the concept-map and criterion ratings and the cognitive processes
they are designed to evoke. In other words, while maintaining their distinctness in terms
of being separate assessments both must tap into some shared aspects of the target
construct or cognitive process.
Robust Rubric
It is the opinion of the author that follow-up studies should be considered that
investigate ways in which the scoring elements used in this study could be made more
accessible to raters, students, and instructors. If these scoring elements do reflect some
important aspect of organized understanding such studies would indeed prove valuable to
those practitioners interested in adding concept-maps to their assessment repertoire.
One recommendation in particular is that each proposition on a map be rated
separately using a scale for each rating element. Four distinct scales could be developed
measuring importance, accuracy, completeness, and relevance for each proposition on the
map. A scoring method developed in this vein, would make the rating process less
cognitively taxing for raters and yet assist them in accounting for all four rating elements.
138
Summary
Concept maps as learning and instructional tools have gained great traction over
the last three decades (Liu, 2002; Mintzes et al., 1998) in promoting student-organized
understanding. Concept-map assessments have not gained the same traction because of
the complexity of scoring the idiosyncrasies of students’ maps. This study represents a
small effort to overcome some of the complexity associated with rating concept maps.
Studies related to the development of robust concept-map scoring rubrics represent fertile
ground for research that has yet to be carefully harvested. Such contributions could move
forward a promising research agenda providing evidence of the degree to which concept-
map assessments can be used as viable and defensible assessment tools for educators and
researchers alike.
139
REFERENCES
Acton, W., Peter, J. & Goldsmith, T. (1994). Structural knowledge assessment:
Comparison of referent structures. Journal of Educational Psychology, 86, 303-
311.
Anderson, J. R. (1995). Cognitive psychology and its implications (4th ed.). New York:
W. H. Freeman and Company.
Anderson, T. & Huang, S. (1989). On using concept maps to assess the comprehension
effects of reading expository text (Technical Report No. 483). Center for the
Studying of Reading, University of Illinois at Urbana–Champaign. (ERIC
Document Reproduction Service No. ED310368.
Anglin, J.M. (1977). Word, object and conceptual development. New York: Norton.
Ausubel, D. (1963). The psychology of meaningful verbal learning. New York: Holt,
Rinehart, and Winston.
Ausubel, D. (1968). Educational psychology: A cognitve view. New York: Holt, Rinehart
& Winston.
Baker, E., Niemi, D., Novak, J., & Herl, H. (1991). Hypertext as a strategy for teaching
and assessing knowledge representation. Paper presented at NATO Advanced
Research Workshop on Instructional Design Models for Computer-Based
Learning Environments, Enschede, The Netherlands.
Barenholz, H., & Tamir, P. (1992). A comprehensive use of concept mapping in design
instruction and assessment. Research in Science & Technological Education, 10,
37-52.
Bartlet, F. C. (1932). Remembering. Cambridge, MA: Cambridge University Press
140
Bransford, J. D., Brown, A.L., & Cocking, R.R. (Eds.) (2000). How people learn: Brain,
mind, experience and school. Washington, DC: National Academy Press.
Brennan, R. (1992). Elements of generalizability theory. Iowa City, IA: American
College Testing.
Brennan, R. L. (2001). Generalizability theory. New York: Springer.
Bruner, J. S., Goodnow, J. J. & Austin, G.A. (1968). A study of thinking. New York:
John Wiley.
Brussow, S. (2004). Concept mapping to scaffold the learning process. Paper presented at
the Central University of Technology (CUT), Bloemfontein, South Africa.
Carroll, J. B. (1964). Words, meanings, and concepts. Harvard Educational Review, 34,
178-202.
Cobb, P., Confrey, J., di Sessa, A., Lehrer, R., & Schauble, L. (2003). Design
Experiments in Educational Research. American Educational Research Journal,
32, 9-13
Cohen, G. (1983). The psychology of cognition (2nd edition). London: Academic Press,
Inc.
Collins, A., & Quillian, M. (1969). Retrieval time from semantic memory. Journal of
Verbal Learning and Verbal Behaviour, 8, 240-247.
Crick, J., & Brennan, R. (1983). Manual for GENOVA: A generalized analysis of
variance system (ACT technical bulletin no. 43). Iowa City, IA: American College
Testing Program.
141
Cronbach, L., Gleser, G., Nanda, H., & Rajaratnam, N. (1972). The dependability of
behavioral measuremetns: Theory of generalizability of scores and profiles. New
York: Holt, Rinehart & Winston.
Deese, J. (1965). The structure of association in language and thought. Baltimore: Johns
Hopkins Press.
Donald,,, J. (2000). Learning to think: A disciplinary perspective. San Francisco: Jossey-
Bass.
Ebel R. L. & Frisbie, D. A. (1991). Essentials of educational measurement (5th ed.).
Englewood Cliff, NJ: Prentice Hall.
Fisher, K. (1990). Semantic networking: The new kid on the block. Journal of Research
in Science Teaching, 27, 1001-1018.
Fisher, K. M. (2000). Mapping biology knowledge. Dordrecht, Holland: Kluwer
Francisco, J. S., Nakhjleh, M. B., Nurrenbern, S. C., & Miller, M. L. (2002). Assessing
student understanding of general chemistry with concept mapping. Journal of
Chemical Education, 79, 248-257.
Howard, R. W. (1987). Concepts and schemata: An introduction. London: Cassell.
Jacobs-Lawson, J. M. & Hershey, D. A. (2001). Concept maps as an assessment tool in
psychology courses. Teaching of Psychology, 29, 25-29.
Jahnke, J. C. & Nowaczyk, R. H. (1998). Cognition. Upper Saddle River, NJ: Prentice-
Hall.
Kinchin, I. M. (2000). Using concept maps to reveal understanding: A two-tier analysis.
School Science Review, 81, 41-46
142
Klausmeier, H .J. (1990). Conceptualizing. In B.F. Jones & L. Idol (Eds.), Dimensions of
thinking and cognitive instruction (pp. 93-138). Hillsdale, NJ: Erlbaum.
Klausmeier, H. J. (1992). Concept learning and concept teaching. Educational
Psychologist, 27(3), 267-286.
Laight, D. W. (2004). Attitudes to concept maps as a teaching/learning activity in
undergraduate health professional education: Influence of preferred learning style.
Medical Teacher, 26, 229-333.
Lawson, A. (1995). Science teaching and the development of thinking. Belmont, CA:
Wadsworth Pub. Co.
Lay-Dopyera, M., & Beyerbach, B. (1983). Concept mapping for individual assessment.
Syracuse, NY: School of Education, Syracuse University. (ERIC Document
Reproduction Service No. ED229399).
Leonard, W., & Penick, J. (2000). Limits of learning. The American Biology Teacher, 62,
359-362.
Linn, R.L., & Gronlund, N.E. (1995). Measurement and assessment in teaching (7th ed.).
Englewood Cliffs, NJ: Merrill-Prentice Hall.
Liu, X. (2002). Using concept mapping for assessing and promoting relational conceptual
change in science. Science Education, 88, 373-396.
Liu, X., & Hinchey, M. (1996). The internal consistency of a concept mapping scoring
scheme and its effect on prediction validity. International Journal of Science
Education, 15, 921-937.
Lomask, M., Baron, J. B., Greig, J., & Harrison, C. (1992). ConnMap:
Connecticut's use of concept mapping to asssess the structure of students'
143
knowledge of science. Paper presented at the annual meeting of the National
Association of Research in Science Teaching, Cambridge, MA.
McClure, J. R., & Bell, P. E. (1990). Effects of an environmental education-related STS
approach instruction on cognitive structures of preservice science teachers.
University Park, PA: Pennsylvania State. (ERIC Document Reproduction Service
No. ED341582).
McClure, J., Sonak, B., & Suen, H. (1999). Concept-map assessment of classroom
learning: Reliability, validity, and logistical practicality. Journal of Research in
Science teaching 36, 475-492
Medin, D. L., & Ross, B. H., (1992). Cognitive Psychology. Fort Worth, TX: Harcourt
Brace Jovanovich College Publishers
Medin, D. L., & Smith, E. E. (1984). Concepts and concept formation. Annual Review
of Psychology, 35, 113-138.
Merrill, M.D., & Tennyson, R.D. (1977). Teaching concepts: An instructional design
guide. Englewood Cliffs, NJ: Educational Technology Publications.
Messick, S. (1988). The once and future issues of validity: assessing the meaning and
consequences of measurement. In H. Wainer & H.I. Braun (Eds.), Test validity
(pp. 33-45). Hillsdale, NJ: Erlbaum.
Messick, S. (1989). Validity. In R. L. Linn (ed.), Educational measurement [3rd ed.].
Washington, DC: American Council on Education.
Messick, S. (1995). Validity of psychological assessment: validation of inferences from
persons’ responses and performances as scientific inquiry into score meaning.
American Psychologist, 50, 741-749.
144
Mintzes, J. J., Wandersee, J. H., & Novak, J. D. (1998). Teaching science for
understanding: A human constructivist view. San Diego, CA: Academic.
Murphy, G. L. (2002). The big book of concepts. Cambridge, MA: MIT Press.
Nakhleh, M. B., & Krajcik, J. S. (1991). The effect of level of information as presented by
different technology on students' understanding of acid, base, and pH concepts.
Paper presented at the annual meeting of the National Association for the
Research in Science Teaching, Lake Geneva, WI.
Nicoll, G., Francisco, J., & Nakhleh, M. (2001). An investigation of the value of using
concept maps in general chemistry. Journal of Chemical Education, 78, 1111-
1117.
Novak, J., & Gowin, B. (1984). Learning how to learn. New York: Cambridge University
Press.
Nunnaly, J. (1967). Psychometric theory (1st ed.). New York: McGraw-Hill.
Pylyshyn, Z. (1984). Computation and cognition. Cambridge, MA: MIT Press.
Regis, A., & Pier, G. A. (1996). Concept maps in chemistry education. Journal of
Chemical Education, 73, 1084-1088.
Rice, D. C., Ryan, J. M. & Samson, S. M. (1998). Using concept maps to assess student
learning in the science classroom: Must different method compete? Journal of
Research in Science Teaching, 35, 1103-1127.
Rosch, E., & Lloyd, B. B. (Eds.) (1978). Cognition and categorization. Hillsdale, NJ:
Erlbaum.
145
Ruiz-Primo, M. A., & Shavelson, R. J. (1996). Problems and issues in the use of concept
maps in science assessment. Journal of Research in Science Teaching, 33, 569-
600.
Ruiz-Primo, M. A., Li, M., Yin, Y., Shavelson, R. J., Vanides, J., Schultz, S., & Ayala,
C. (2004). Concept maps as an assessment tool: A framework for examining their
cognitive validity. Paper presented at the annual meeting of the American
Educational Research Association, San Diego, CA.
Ruiz-Primo, M. A., Schultz, S., Li, M., & Shavelson, R. J. (2001). Comparison of the
reliability and validity of scores from two concept-mapping techniques. Journal of
Research in Science Teaching, 8, 260-278.
Ruiz-Primo, M. A., Shavelson, R. J., Li, M., & Schultz, S. (2001). On the validity of
cognitive interpretations of scores from alternative concept-mapping techniques.
Educational Assessment, 7 (2), 99-141.
Ruiz-Primo, M. A., Shavelson, R. J., & Schultz, S. E. (1997). On the validity
of concept map based assessment interpretations: An experiment testing the
assumption of hierarchical concept-maps in science. Paper presented at the
American Educational Research Association, Chicago, IL.
Rye, J., & Rubba, P. (2002). Scoring concept maps: An expert map-based scheme
weighted for relationships. School Science and Mathematics, 102, 33-46.
Schau, C., & Mattern, N. (1997). Use of map techniques in teaching applied statistics
courses. The American Statistician, 51, 171-175
Shavelson, R., Lang, H., & Lewin, B. (1993). On concept maps as potential “authentic”
assessments in science. Los Angeles, CA: National Center for Research on
146
Evaluation, Standards, and Student Testing. (ERIC Document Reproduction Service
No. ED367691)
Shavelson, R. & Webb, N. (1991). Generalizability theory: A primer. Newbury Park,
CA: Sage.
Smith, E., & Medin, D. (1981). Categories and concepts. Cambridge, MA: Harvard
University Press.
Stuart, H. (1985). Should concept maps be scored numerically? European Journal of
Science Education, 7, 73-81.
Tennyson, R. & Park, O. (1980). The teaching of concepts: a review of instructional
design research literature. Review of Educational Research, 50, 55-70.
Wallace, J., & Mintzes, J. (1990). The concept map as a research tool: Exploring
conceptual change in biology. Journal of Research in Science Teaching, 27,
1033-1052.
West, D. C., Park, K. P., Pomeroy, J. R., & Sandoval, J. (2002). Concept-mapping
assessment in medical education: A comparison of two scoring systems. Medical
Education, 36, 820-826
White, R., & Gunstone, R. (1992). Probing Understanding. London: The Falmer Press.
Yin, Y. & Shavelson, R. (2004). Application of generalizability theory to concept-map
assessment research. Paper presented at the annual meeting of the American
Educational Research Association, San Diego, CA.
Yin, Y., Vanides, J., Ruiz-Primo, M., Ayala, C., & Shavelson, R. (2005). Comparison of
two concept-mapping techniques: Implications for scoring, interpretation, and
use. Journal of Research in Science Teaching, 42, 166-184.

147
APPENDIX A
Informed Consent
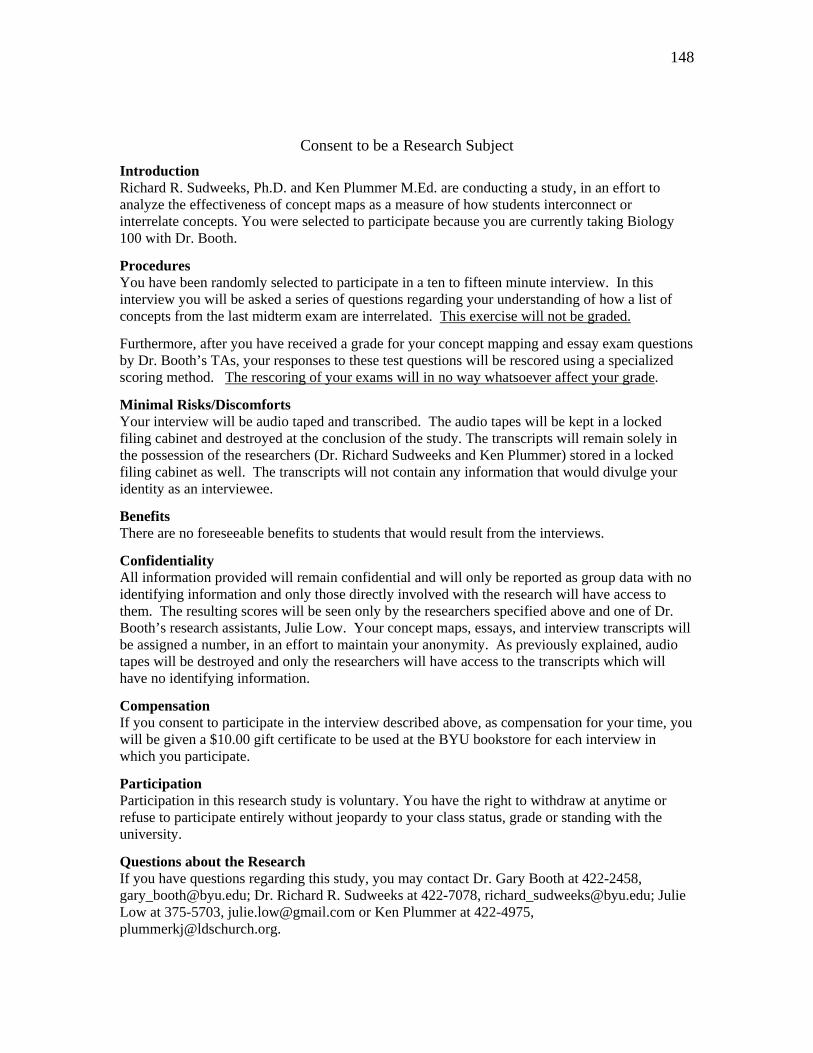
148
Consent to be a Research Subject Introduction Richard R. Sudweeks, Ph.D. and Ken Plummer M.Ed. are conducting a study, in an effort to analyze the effectiveness of concept maps as a measure of how students interconnect or interrelate concepts. You were selected to participate because you are currently taking Biology 100 with Dr. Booth.
Procedures You have been randomly selected to participate in a ten to fifteen minute interview. In this interview you will be asked a series of questions regarding your understanding of how a list of concepts from the last midterm exam are interrelated. This exercise will not be graded.
Furthermore, after you have received a grade for your concept mapping and essay exam questions by Dr. Booth’s TAs, your responses to these test questions will be rescored using a specialized scoring method. The rescoring of your exams will in no way whatsoever affect your grade.
Minimal Risks/Discomforts Your interview will be audio taped and transcribed. The audio tapes will be kept in a locked filing cabinet and destroyed at the conclusion of the study. The transcripts will remain solely in the possession of the researchers (Dr. Richard Sudweeks and Ken Plummer) stored in a locked filing cabinet as well. The transcripts will not contain any information that would divulge your identity as an interviewee.
Benefits There are no foreseeable benefits to students that would result from the interviews.
Confidentiality All information provided will remain confidential and will only be reported as group data with no identifying information and only those directly involved with the research will have access to them. The resulting scores will be seen only by the researchers specified above and one of Dr. Booth’s research assistants, Julie Low. Your concept maps, essays, and interview transcripts will be assigned a number, in an effort to maintain your anonymity. As previously explained, audio tapes will be destroyed and only the researchers will have access to the transcripts which will have no identifying information.
Compensation If you consent to participate in the interview described above, as compensation for your time, you will be given a $10.00 gift certificate to be used at the BYU bookstore for each interview in which you participate.
Participation Participation in this research study is voluntary. You have the right to withdraw at anytime or refuse to participate entirely without jeopardy to your class status, grade or standing with the university.
Questions about the Research If you have questions regarding this study, you may contact Dr. Gary Booth at 422-2458, [email protected]; Dr. Richard R. Sudweeks at 422-7078, [email protected]; Julie Low at 375-5703, [email protected] or Ken Plummer at 422-4975, [email protected].

149
Questions about your Rights as Research Participants If you have questions you do not feel comfortable asking the researcher, you may contact Dr. Renea Beckstrand, IRB Chair, 422-3873, 422 SWKT, [email protected]. I have read, understood, and received a copy of the above consent and desire of my own free will and volition to participate in this study. Signature: Date: ____

150
APPENDIX B
Exam 1 Concept Map Task 1
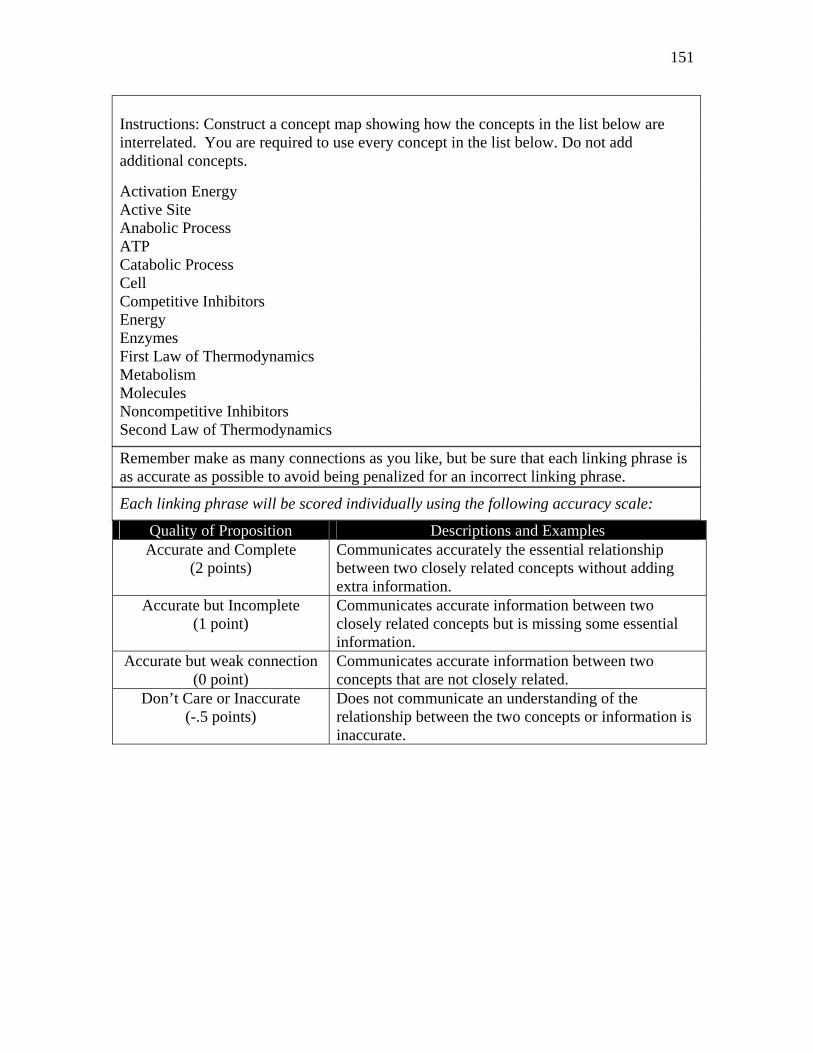
151
Instructions: Construct a concept map showing how the concepts in the list below are interrelated. You are required to use every concept in the list below. Do not add additional concepts. Activation Energy Active Site Anabolic Process ATP Catabolic Process Cell Competitive Inhibitors Energy Enzymes First Law of Thermodynamics Metabolism Molecules Noncompetitive Inhibitors Second Law of Thermodynamics
Remember make as many connections as you like, but be sure that each linking phrase is as accurate as possible to avoid being penalized for an incorrect linking phrase.
Each linking phrase will be scored individually using the following accuracy scale:
Quality of Proposition Descriptions and Examples Accurate and Complete
(2 points) Communicates accurately the essential relationship between two closely related concepts without adding extra information.
Accurate but Incomplete (1 point)
Communicates accurate information between two closely related concepts but is missing some essential information.
Accurate but weak connection (0 point)
Communicates accurate information between two concepts that are not closely related.
Don’t Care or Inaccurate (-.5 points)
Does not communicate an understanding of the relationship between the two concepts or information is inaccurate.

152
APPENDIX C
Exam 2 C-mapping Task 1
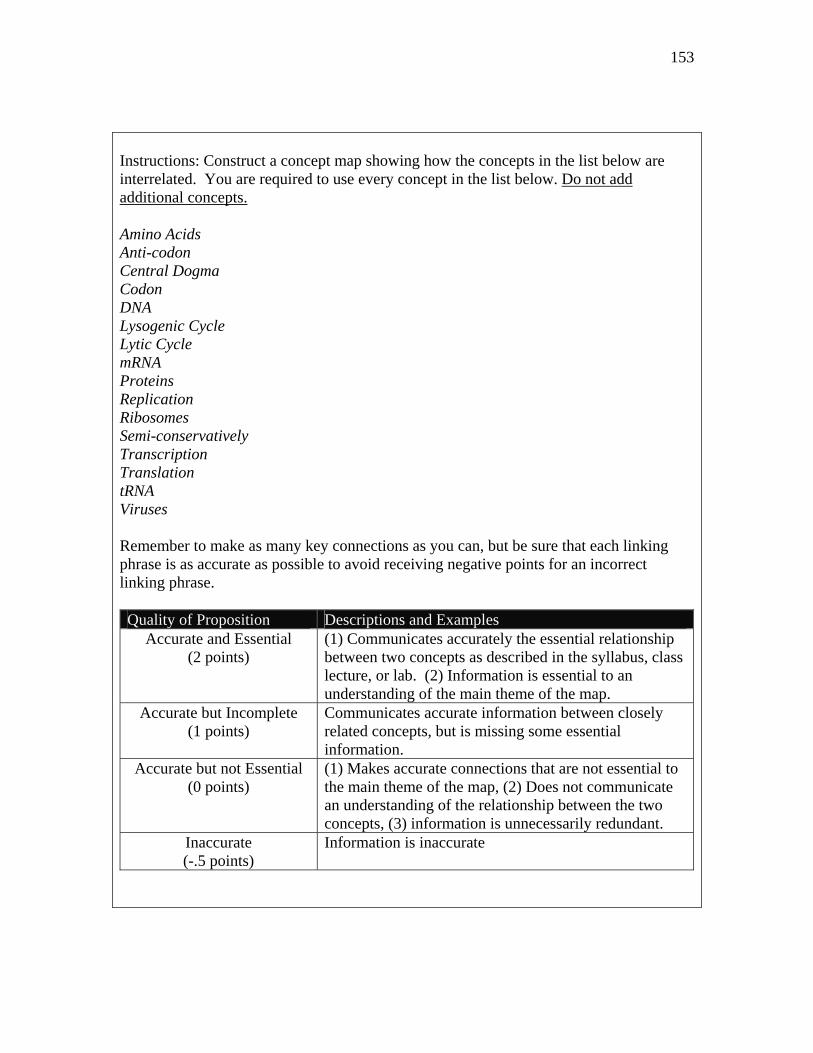
153
Instructions: Construct a concept map showing how the concepts in the list below are interrelated. You are required to use every concept in the list below. Do not add additional concepts. Amino Acids Anti-codon Central Dogma Codon DNA Lysogenic Cycle Lytic Cycle mRNA Proteins Replication Ribosomes Semi-conservatively Transcription Translation tRNA Viruses Remember to make as many key connections as you can, but be sure that each linking phrase is as accurate as possible to avoid receiving negative points for an incorrect linking phrase. Quality of Proposition Descriptions and Examples
Accurate and Essential (2 points)
(1) Communicates accurately the essential relationship between two concepts as described in the syllabus, class lecture, or lab. (2) Information is essential to an understanding of the main theme of the map.
Accurate but Incomplete (1 points)
Communicates accurate information between closely related concepts, but is missing some essential information.
Accurate but not Essential (0 points)
(1) Makes accurate connections that are not essential to the main theme of the map, (2) Does not communicate an understanding of the relationship between the two concepts, (3) information is unnecessarily redundant.
Inaccurate (-.5 points)
Information is inaccurate

154
APPENDIX D
Exam 1 C-mapping Task 2
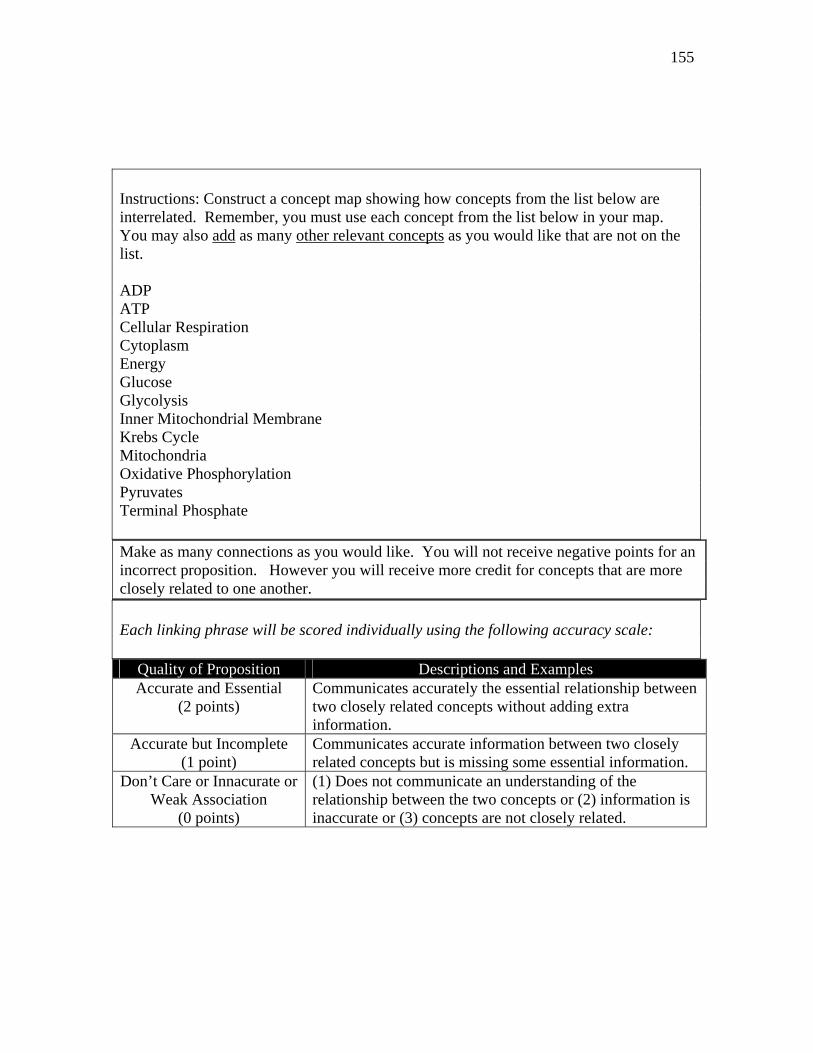
155
Instructions: Construct a concept map showing how concepts from the list below are interrelated. Remember, you must use each concept from the list below in your map. You may also add as many other relevant concepts as you would like that are not on the list. ADP ATP Cellular Respiration Cytoplasm Energy Glucose Glycolysis Inner Mitochondrial Membrane Krebs Cycle Mitochondria Oxidative Phosphorylation Pyruvates Terminal Phosphate Make as many connections as you would like. You will not receive negative points for an incorrect proposition. However you will receive more credit for concepts that are more closely related to one another. Each linking phrase will be scored individually using the following accuracy scale:
Quality of Proposition Descriptions and Examples Accurate and Essential
(2 points) Communicates accurately the essential relationship between two closely related concepts without adding extra information.
Accurate but Incomplete (1 point)
Communicates accurate information between two closely related concepts but is missing some essential information.
Don’t Care or Innacurate or Weak Association
(0 points)
(1) Does not communicate an understanding of the relationship between the two concepts or (2) information is inaccurate or (3) concepts are not closely related.

156
APPENDIX E
Exam 2 C-mapping Task 2
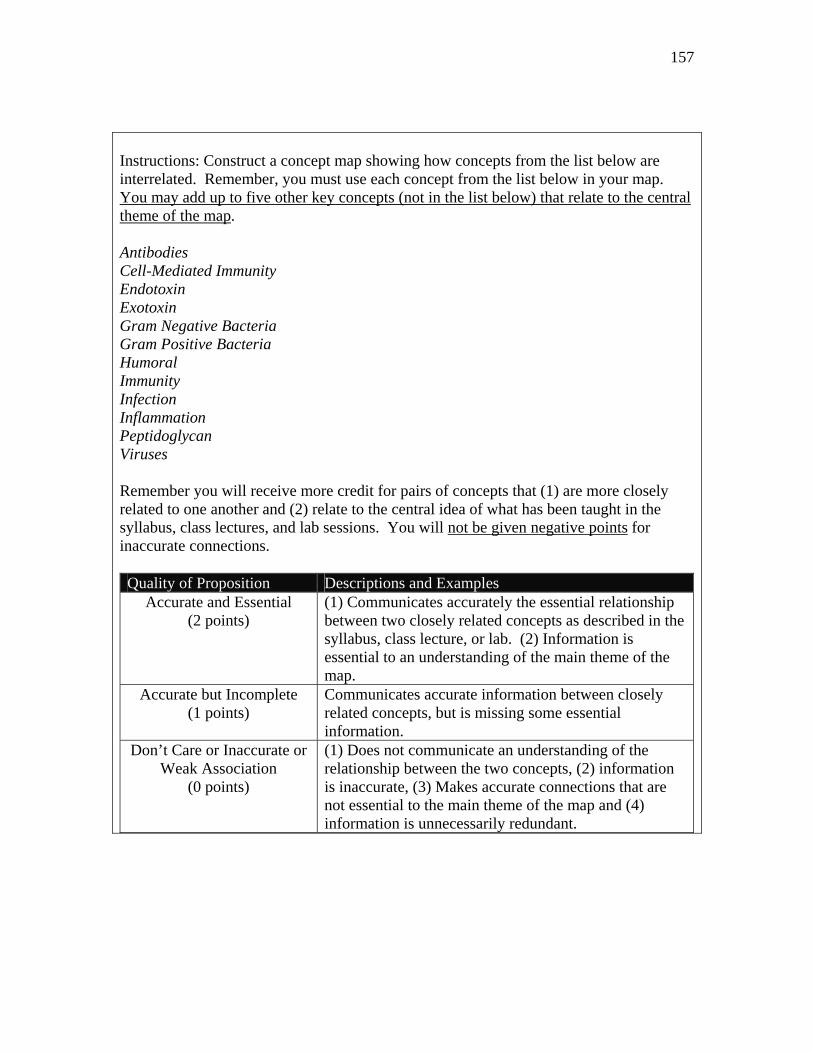
157
Instructions: Construct a concept map showing how concepts from the list below are interrelated. Remember, you must use each concept from the list below in your map. You may add up to five other key concepts (not in the list below) that relate to the central theme of the map. Antibodies Cell-Mediated Immunity Endotoxin Exotoxin Gram Negative Bacteria Gram Positive Bacteria Humoral Immunity Infection Inflammation Peptidoglycan Viruses Remember you will receive more credit for pairs of concepts that (1) are more closely related to one another and (2) relate to the central idea of what has been taught in the syllabus, class lectures, and lab sessions. You will not be given negative points for inaccurate connections. Quality of Proposition Descriptions and Examples
Accurate and Essential (2 points)
(1) Communicates accurately the essential relationship between two closely related concepts as described in the syllabus, class lecture, or lab. (2) Information is essential to an understanding of the main theme of the map.
Accurate but Incomplete (1 points)
Communicates accurate information between closely related concepts, but is missing some essential information.
Don’t Care or Inaccurate or Weak Association
(0 points)
(1) Does not communicate an understanding of the relationship between the two concepts, (2) information is inaccurate, (3) Makes accurate connections that are not essential to the main theme of the map and (4) information is unnecessarily redundant.

158
APPENDIX F
Exam 1 Essay Task 1
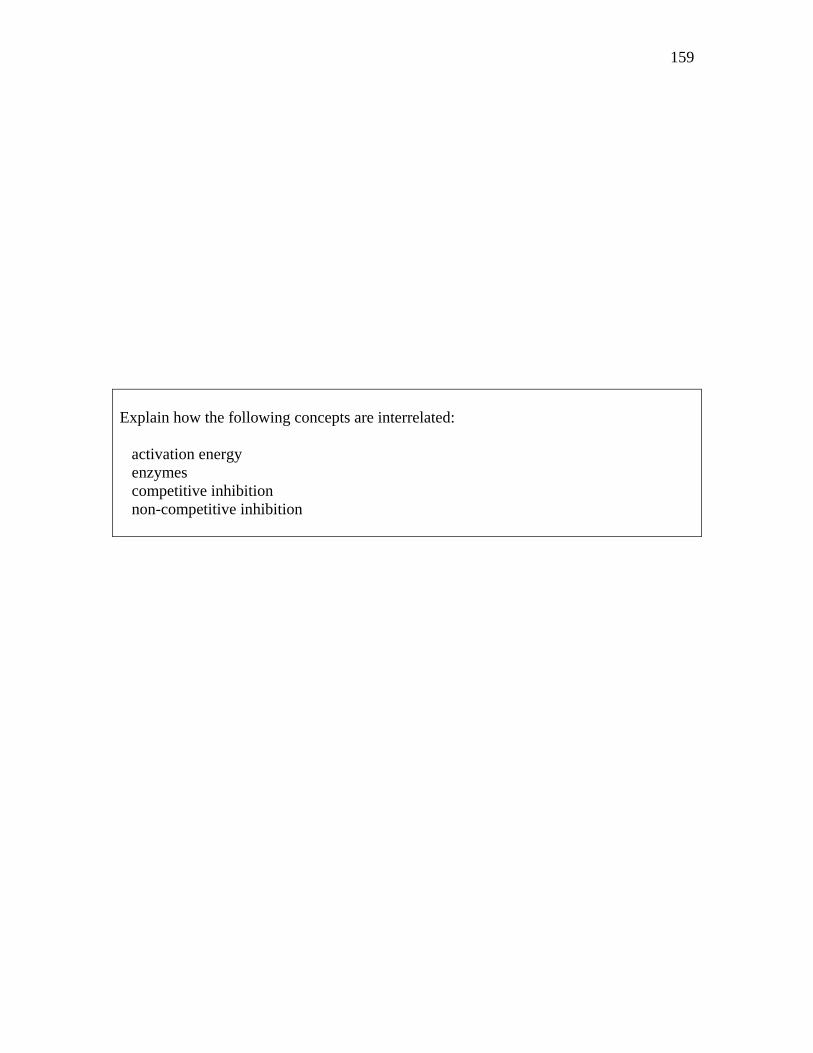
159
Explain how the following concepts are interrelated: activation energy enzymes competitive inhibition non-competitive inhibition

160
APPENDIX G
Exam 2 Essay Task 1
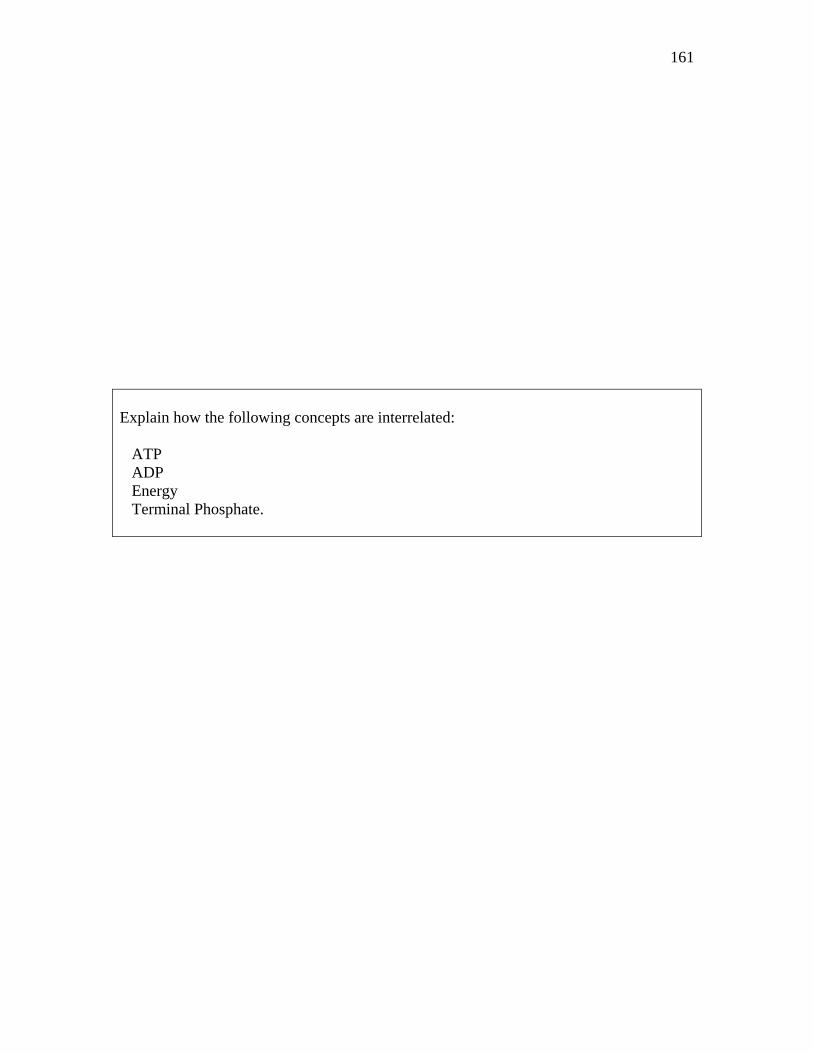
161
Explain how the following concepts are interrelated: ATP ADP Energy Terminal Phosphate.

162
APPENDIX H
Exam 1 Essay Task 2
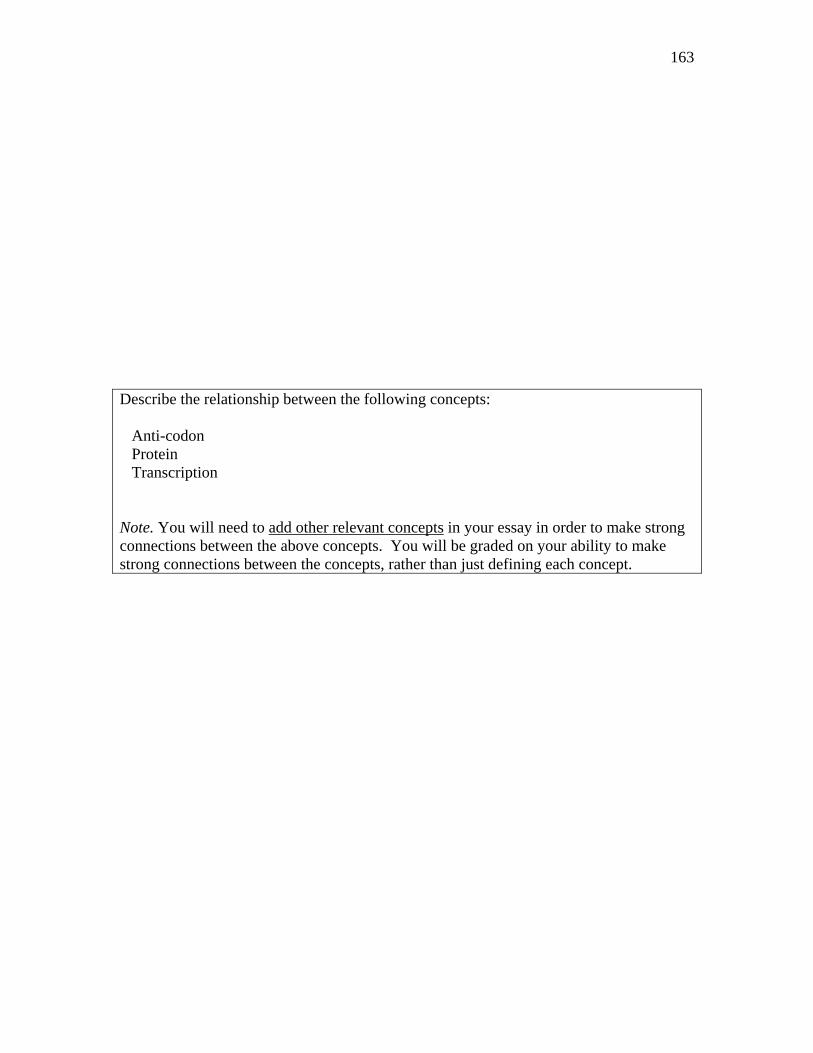
163
Describe the relationship between the following concepts: Anti-codon Protein Transcription Note. You will need to add other relevant concepts in your essay in order to make strong connections between the above concepts. You will be graded on your ability to make strong connections between the concepts, rather than just defining each concept.

164
APPENDIX I
Exam 2 Essay Task 2
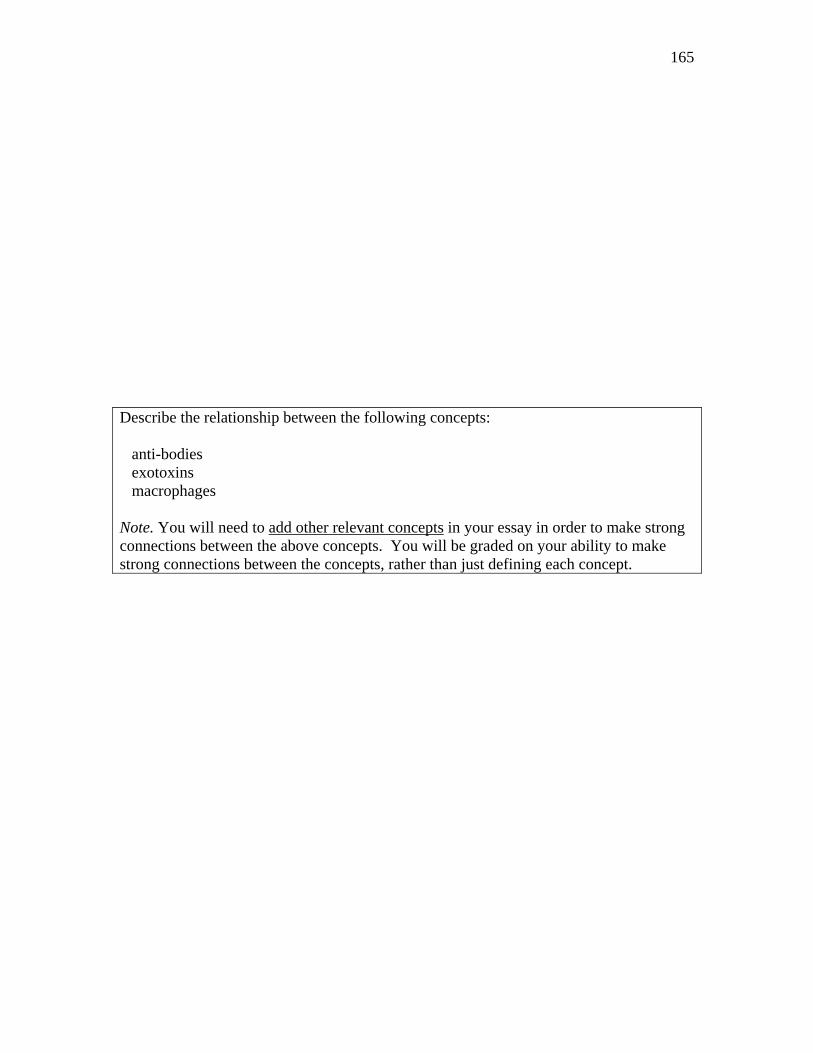
165
Describe the relationship between the following concepts: anti-bodies exotoxins macrophages Note. You will need to add other relevant concepts in your essay in order to make strong connections between the above concepts. You will be graded on your ability to make strong connections between the concepts, rather than just defining each concept.

166
APPENDIX J
Exam 1 Interview
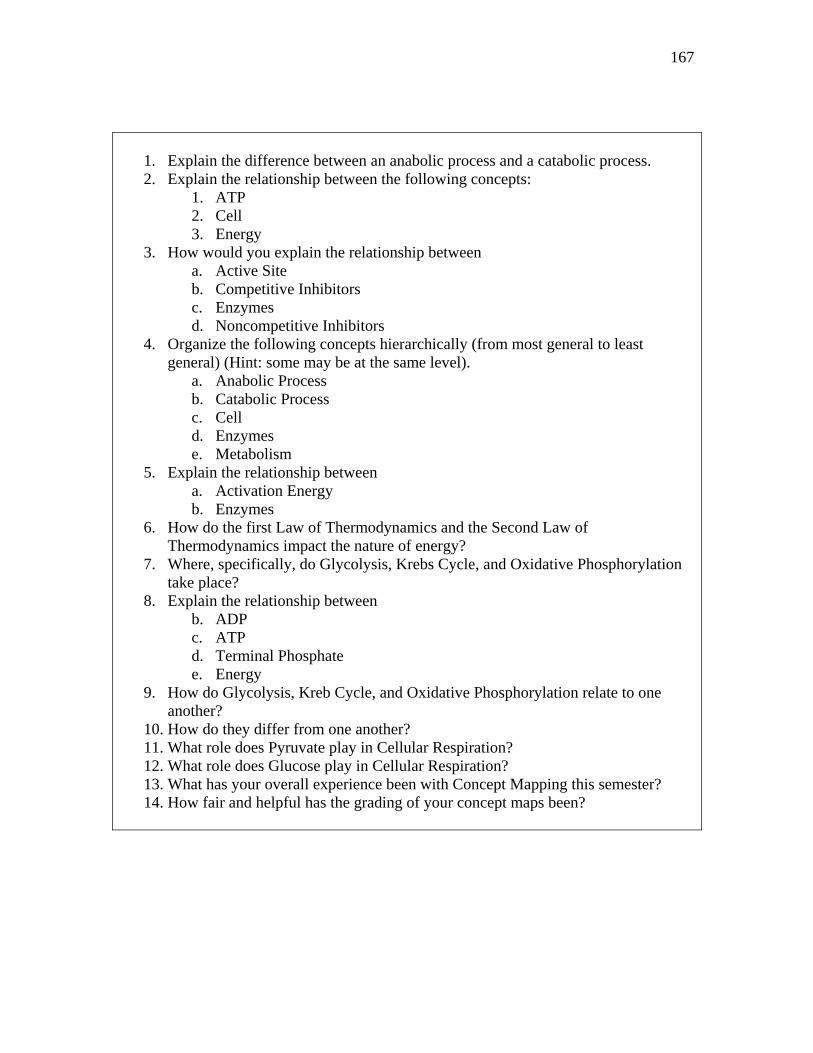
167
1. Explain the difference between an anabolic process and a catabolic process. 2. Explain the relationship between the following concepts:
1. ATP 2. Cell 3. Energy
3. How would you explain the relationship between a. Active Site b. Competitive Inhibitors c. Enzymes d. Noncompetitive Inhibitors
4. Organize the following concepts hierarchically (from most general to least general) (Hint: some may be at the same level).
a. Anabolic Process b. Catabolic Process c. Cell d. Enzymes e. Metabolism
5. Explain the relationship between a. Activation Energy b. Enzymes
6. How do the first Law of Thermodynamics and the Second Law of Thermodynamics impact the nature of energy?
7. Where, specifically, do Glycolysis, Krebs Cycle, and Oxidative Phosphorylation take place?
8. Explain the relationship between b. ADP c. ATP d. Terminal Phosphate e. Energy
9. How do Glycolysis, Kreb Cycle, and Oxidative Phosphorylation relate to one another?
10. How do they differ from one another? 11. What role does Pyruvate play in Cellular Respiration? 12. What role does Glucose play in Cellular Respiration? 13. What has your overall experience been with Concept Mapping this semester? 14. How fair and helpful has the grading of your concept maps been?

168
APPENDIX K
Exam 2 Interview
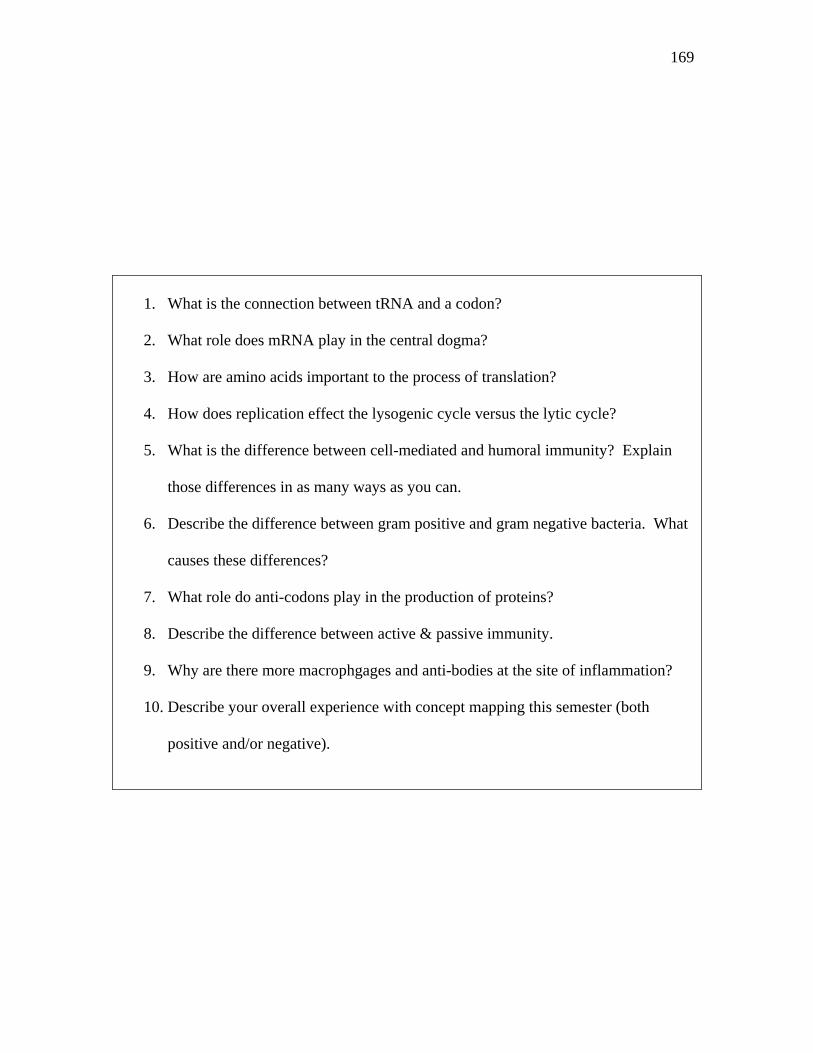
169
1. What is the connection between tRNA and a codon?
2. What role does mRNA play in the central dogma?
3. How are amino acids important to the process of translation?
4. How does replication effect the lysogenic cycle versus the lytic cycle?
5. What is the difference between cell-mediated and humoral immunity? Explain
those differences in as many ways as you can.
6. Describe the difference between gram positive and gram negative bacteria. What
causes these differences?
7. What role do anti-codons play in the production of proteins?
8. Describe the difference between active & passive immunity.
9. Why are there more macrophgages and anti-bodies at the site of inflammation?
10. Describe your overall experience with concept mapping this semester (both
positive and/or negative).

170
APPENDIX L
Concept Mapping Instructional Packet
171
Instructional Unit
Designed to Prepare Students to Use Concept Maps as part of Course
Instruction
By Ken Plummer Brigham Young University
172
Contents
Purpose How to use this Guide 3
Benefits 3
What is a Concept Map? 4
What are Concept Maps used for? 5
What is a Concept? 5
How are concepts connected to one another? 6
What are the components of a Concept Map? 7
How do you create a Concept Map? 8
Frequently Asked Questions 11
First Practice: Elephant Concept Map 12 Points to Consider 14
Second Practice: Science Concept Map 16
Demonstrating your Knowledge 18
Class Assignment 19
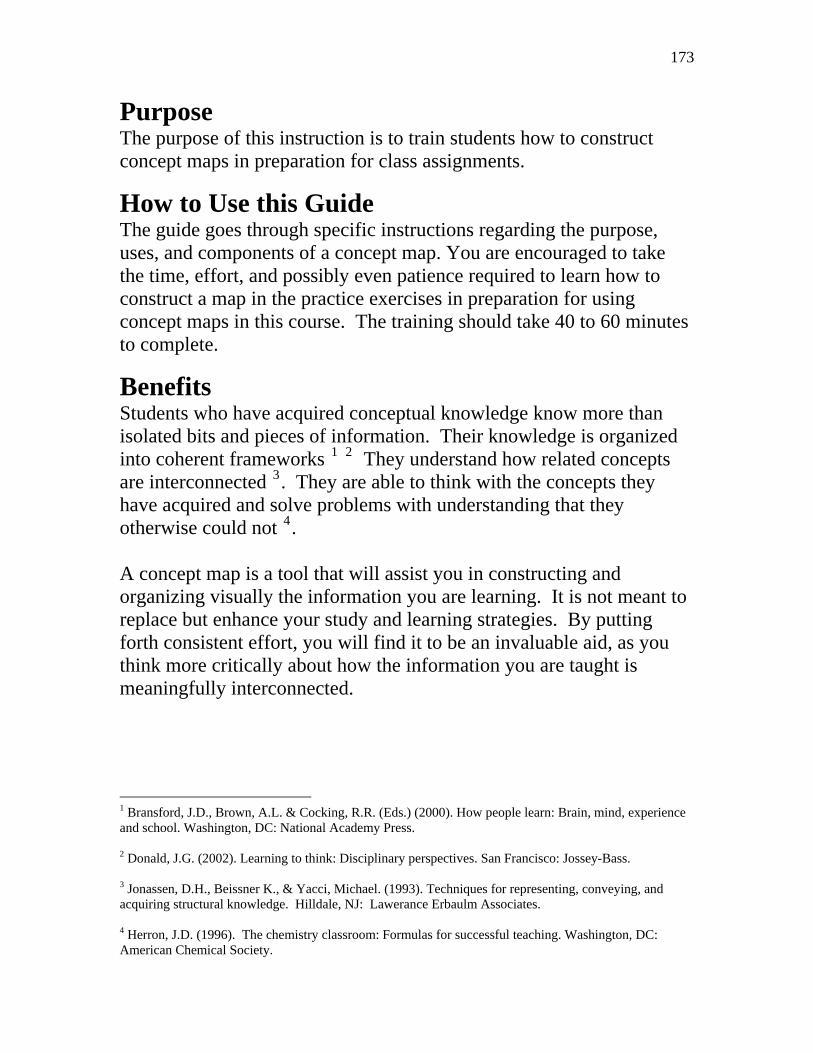
173
Purpose The purpose of this instruction is to train students how to construct concept maps in preparation for class assignments.
How to Use this Guide The guide goes through specific instructions regarding the purpose, uses, and components of a concept map. You are encouraged to take the time, effort, and possibly even patience required to learn how to construct a map in the practice exercises in preparation for using concept maps in this course. The training should take 40 to 60 minutes to complete.
Benefits Students who have acquired conceptual knowledge know more than isolated bits and pieces of information. Their knowledge is organized into coherent frameworks 1 2 They understand how related concepts are interconnected 3. They are able to think with the concepts they have acquired and solve problems with understanding that they otherwise could not 4. A concept map is a tool that will assist you in constructing and organizing visually the information you are learning. It is not meant to replace but enhance your study and learning strategies. By putting forth consistent effort, you will find it to be an invaluable aid, as you think more critically about how the information you are taught is meaningfully interconnected.
1 Bransford, J.D., Brown, A.L. & Cocking, R.R. (Eds.) (2000). How people learn: Brain, mind, experience and school. Washington, DC: National Academy Press. 2 Donald, J.G. (2002). Learning to think: Disciplinary perspectives. San Francisco: Jossey-Bass. 3 Jonassen, D.H., Beissner K., & Yacci, Michael. (1993). Techniques for representing, conveying, and acquiring structural knowledge. Hilldale, NJ: Lawerance Erbaulm Associates. 4 Herron, J.D. (1996). The chemistry classroom: Formulas for successful teaching. Washington, DC: American Chemical Society.
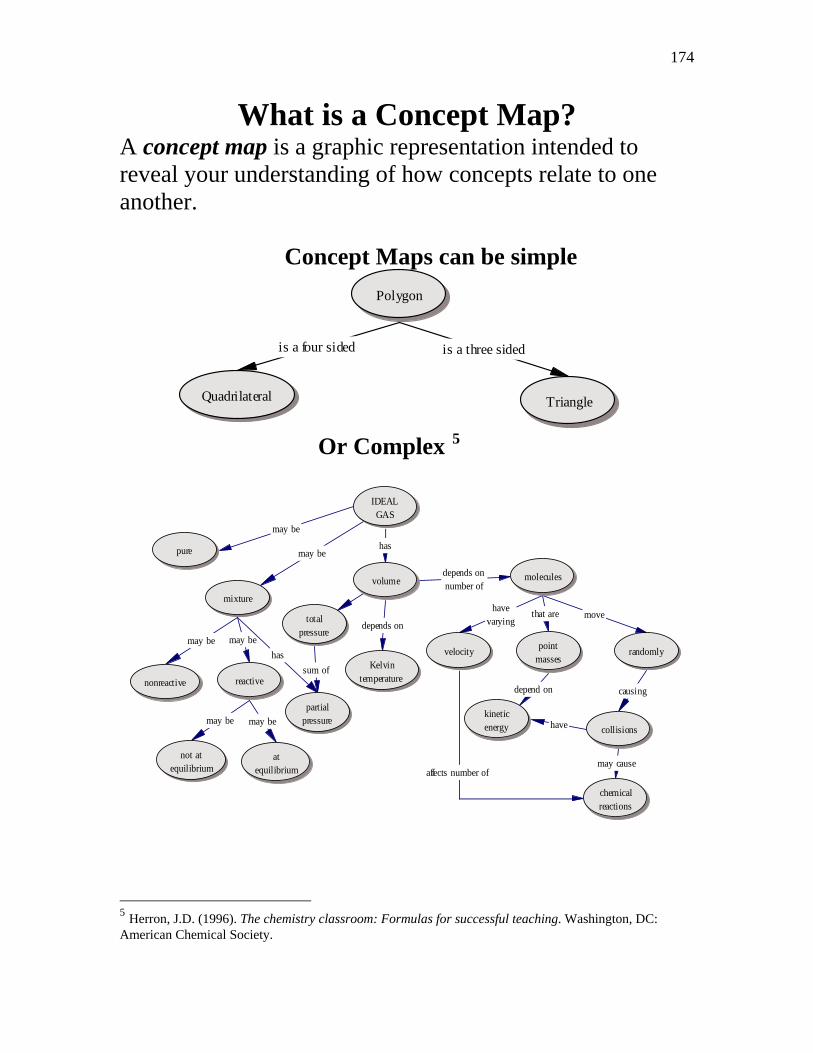
174
What is a Concept Map? A concept map is a graphic representation intended to reveal your understanding of how concepts relate to one another.
Concept Maps can be simple
is a four sided is a three sided
Polygon
Quadrilateral Triangle
Or Complex 5
has
depends onnumber of
movethat arehave varying
causing
have
depend on
may cause
may be
may be
depends onmay be may be
hassum of
may be may be
affects number of
IDEAL GAS
volume
pure
mixture
molecules
velocity point masses
randomly
collisionskinetic energy
chemical reactions
at equilibrium
not at equilibrium
nonreactive reactive
partial pressure
total pressure
Kelvin temperature
5 Herron, J.D. (1996). The chemistry classroom: Formulas for successful teaching. Washington, DC: American Chemical Society.
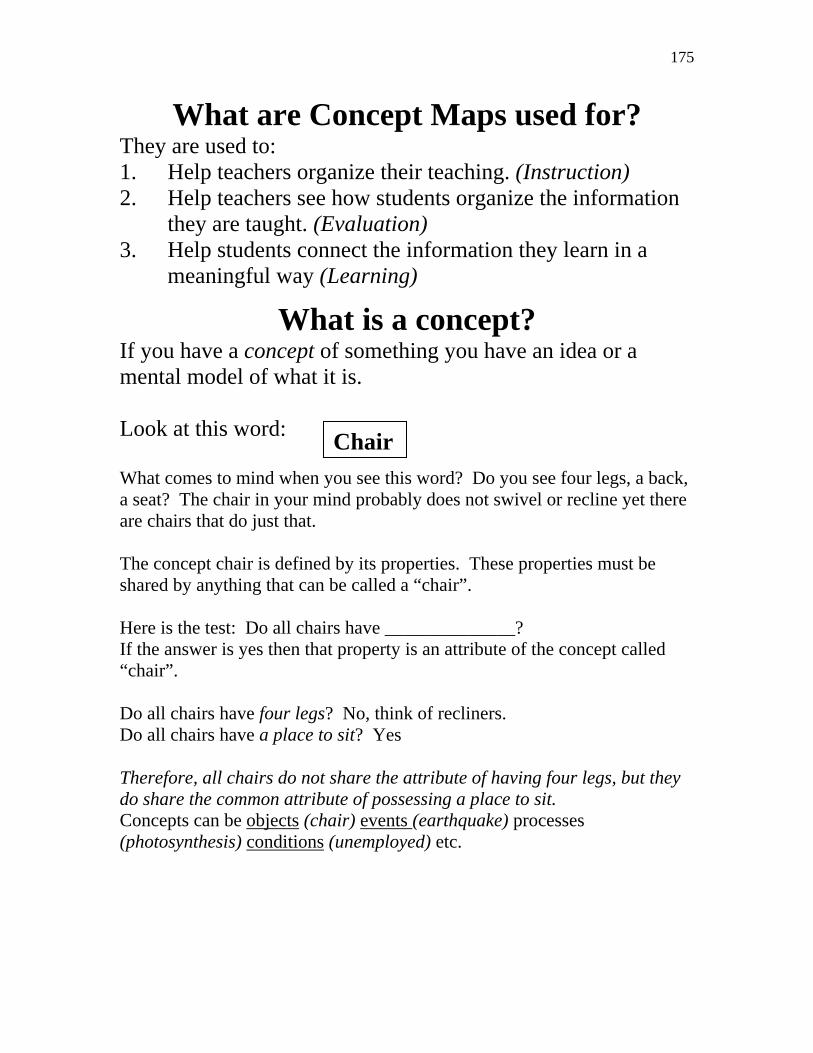
175
What are Concept Maps used for? They are used to: 1. Help teachers organize their teaching. (Instruction) 2. Help teachers see how students organize the information
they are taught. (Evaluation) 3. Help students connect the information they learn in a
meaningful way (Learning)
What is a concept? If you have a concept of something you have an idea or a mental model of what it is. Look at this word: Chair What comes to mind when you see this word? Do you see four legs, a back, a seat? The chair in your mind probably does not swivel or recline yet there are chairs that do just that. The concept chair is defined by its properties. These properties must be shared by anything that can be called a “chair”. Here is the test: Do all chairs have ______________? If the answer is yes then that property is an attribute of the concept called “chair”. Do all chairs have four legs? No, think of recliners. Do all chairs have a place to sit? Yes Therefore, all chairs do not share the attribute of having four legs, but they do share the common attribute of possessing a place to sit. Concepts can be objects (chair) events (earthquake) processes (photosynthesis) conditions (unemployed) etc.
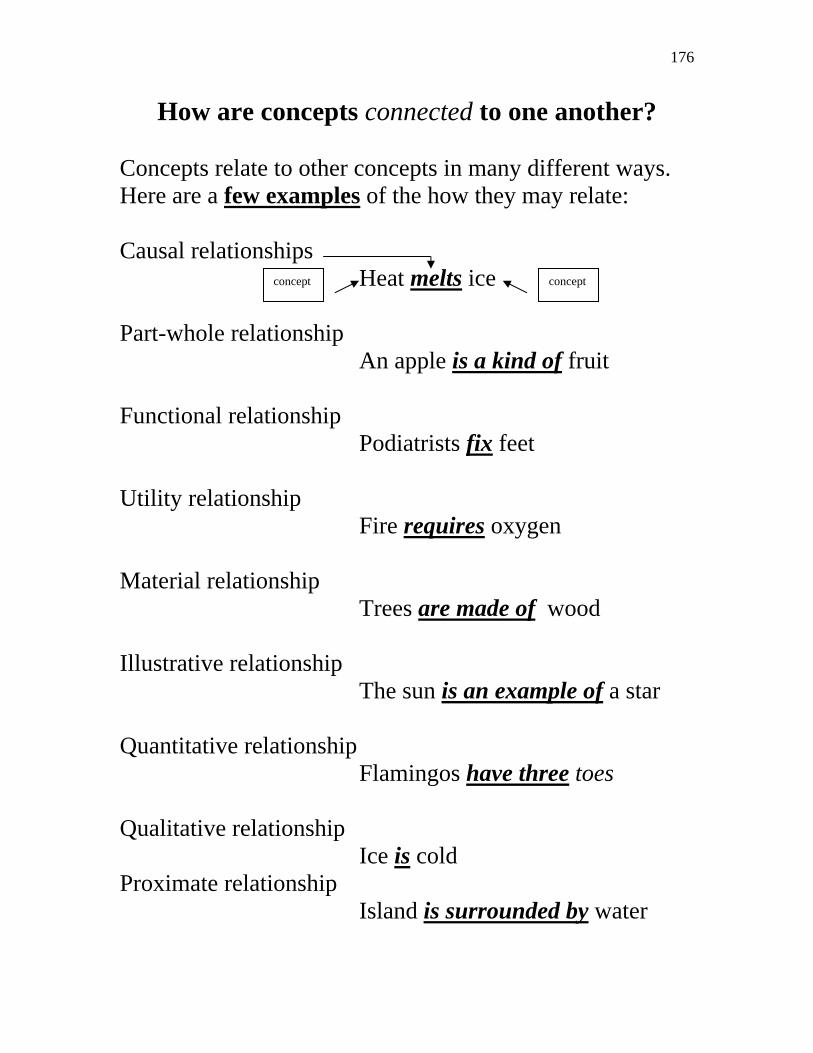
176
How are concepts connected to one another?
Concepts relate to other concepts in many different ways. Here are a few examples of the how they may relate:
Causal relationships
Heat melts ice concept concept
Part-whole relationship An apple is a kind of fruit Functional relationship Podiatrists fix feet Utility relationship Fire requires oxygen Material relationship Trees are made of wood Illustrative relationship The sun is an example of a star Quantitative relationship Flamingos have three toes Qualitative relationship Ice is cold Proximate relationship Island is surrounded by water
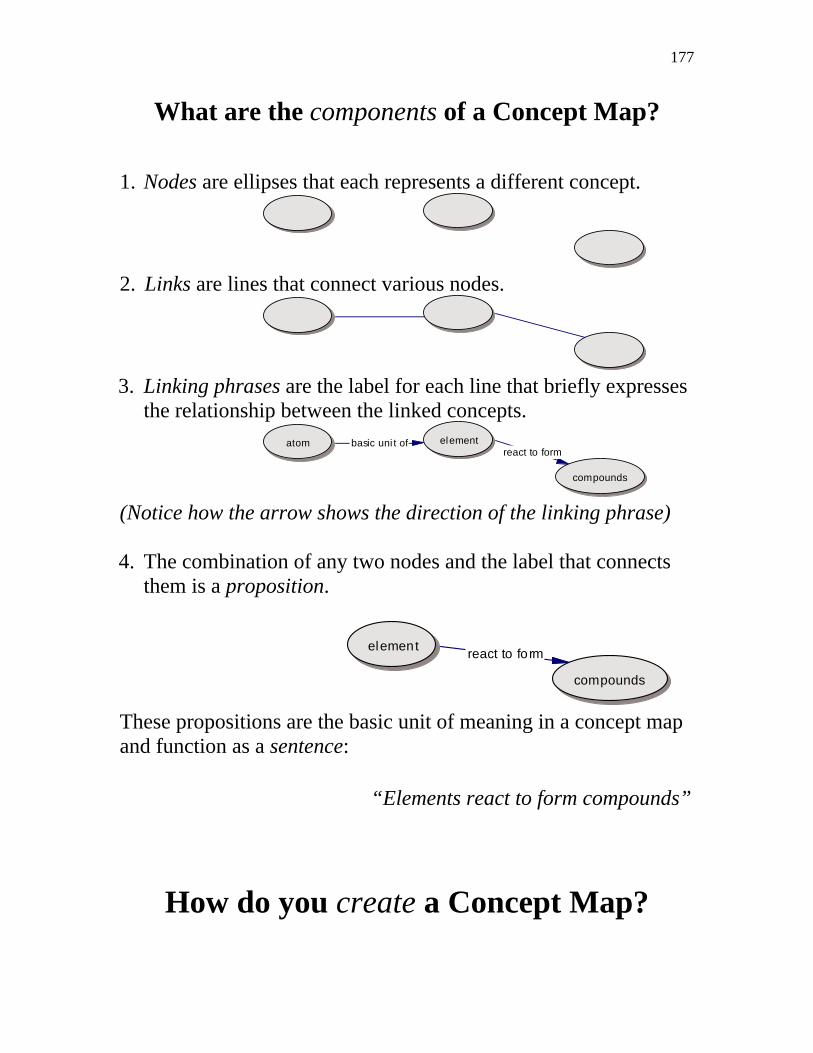
177
What are the components of a Concept Map? 1. Nodes are ellipses that each represents a different concept.
2. Links are lines that connect various nodes.
3. Linking phrases are the label for each line that briefly expresses
the relationship between the linked concepts. basic uni t of
react to formatom element
compounds
(Notice how the arrow shows the direction of the linking phrase)
4. The combination of any two nodes and the label that connects
them is a proposition.
react to formelement
compounds
These propositions are the basic unit of meaning in a concept map and function as a sentence:
“Elements react to form compounds”
How do you create a Concept Map?
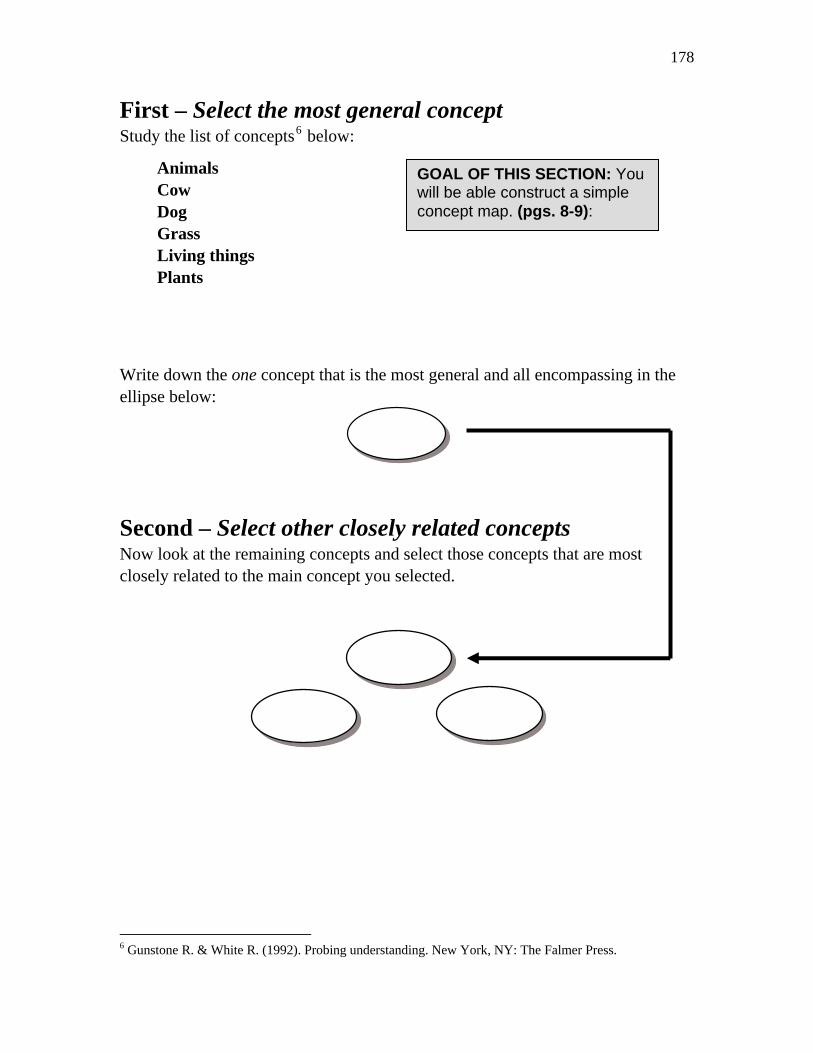
178
First – Select the most general concept Study the list of concepts6 below:
Animals Cow Dog Grass Living things Plants
Write down the one concept that is the most general and all encompassing in the ellipse below:
Second – Select other closely related concepts Now look at the remaining concepts and select those concepts that are most closely related to the main concept you selected.
GOAL OF THIS SECTION: You will be able construct a simple concept map. (pgs. 8-9):
6 Gunstone R. & White R. (1992). Probing understanding. New York, NY: The Falmer Press.
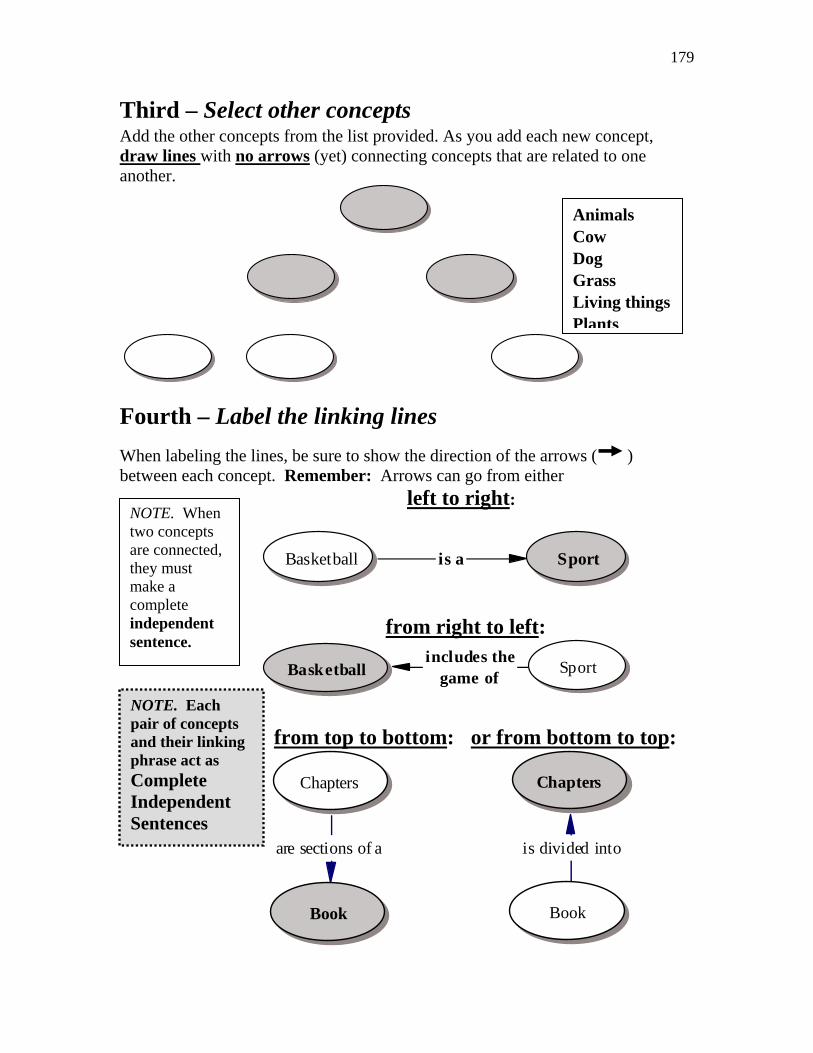
179
Third – Select other concepts Add the other concepts from the list provided. As you add each new concept, draw lines with no arrows (yet) connecting concepts that are related to one another.
Animals Cow Dog Grass Living things Plants
Fourth – Label the linking lines
When labeling the lines, be sure to show the direction of the arrows ( ) between each concept. Remember: Arrows can go from either
left to right: NOTE. When two concepts are connected, they must make a complete independent sentence.
is aBasketball Sport
from right to left:
includes thegame of SportBasketball
from top to bottom
NOTE. Each pair of concepts and their linking phrase act as Complete Independent Sentences
: or from bottom to top:
is divided into
Chapters
Book
Chapters
are sections of a
Book
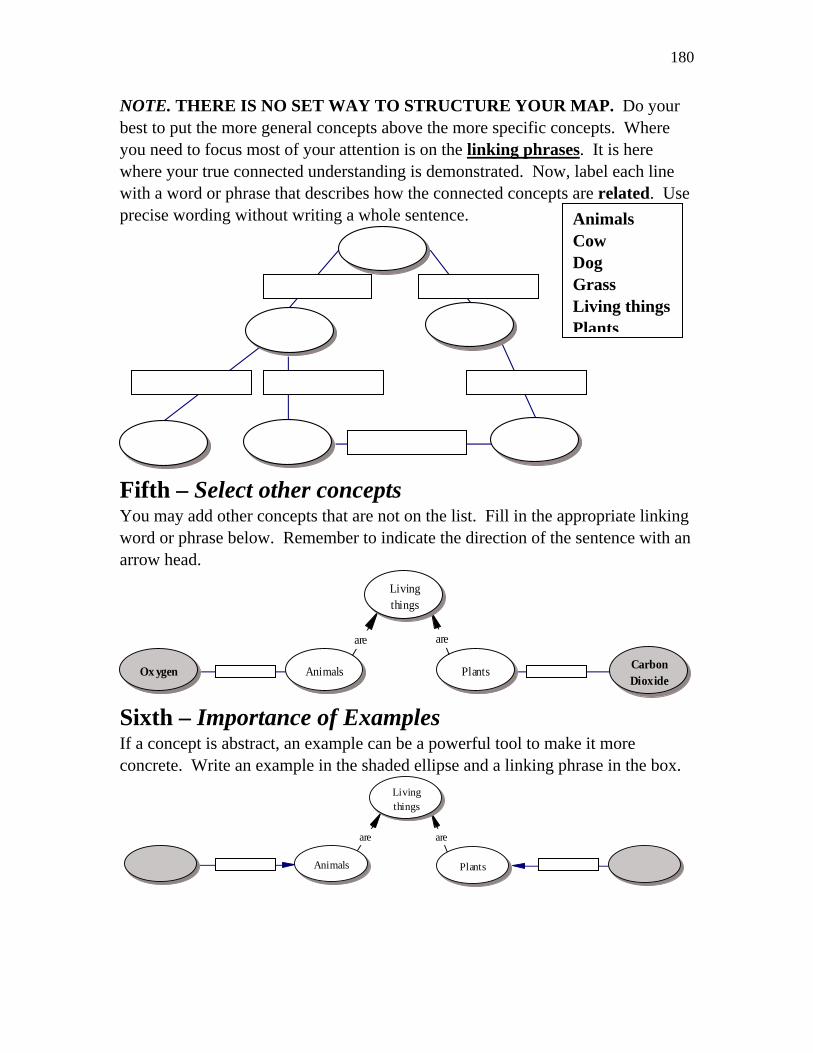
180
NOTE. THERE IS NO SET WAY TO STRUCTURE YOUR MAP. Do your best to put the more general concepts above the more specific concepts. Where you need to focus most of your attention is on the linking phrases. It is here where your true connected understanding is demonstrated. Now, label each line with a word or phrase that describes how the connected concepts are related. Use precise wording without writing a whole sentence.
Animals Cow Dog Grass Living things Plants
Fifth – Select other concepts You may add other concepts that are not on the list. Fill in the appropriate linking word or phrase below. Remember to indicate the direction of the sentence with an arrow head.
are are
Living things
Animals PlantsOx ygen Carbon Dioxide
Sixth – Importance of Examples If a concept is abstract, an example can be a powerful tool to make it more concrete. Write an example in the shaded ellipse and a linking phrase in the box.
are are
Living things
Animals Plants
181
Frequently Asked Questions
What is the hardest part about creating a concept map? 1. Making the Links. The links in our example were fairly simple and straight forward. However, in many instances we don’t realize how fuzzy our understanding really is regarding how concepts are interrelated until we have to actually express that relationship ourselves. Even though this requires hard work, this is also the aspect of concept mapping that stimulates real, meaningful learning. 2. Refining your Map. You will find that constructing a map is like writing an essay. You will refine it, restructure it, and in doing so the organization and the clarity of your connections will improve. When drawing a concept map on paper you will need to be prepared to do a lot of ERASING! The more you spend time on your map the more you will erase, the more you will learn.
Your map should have a Theme. A map that indicates the various materials used to construct a rocket will look differently than a map that shows the processes involved in constructing a rocket. Every link is affected by the overall theme of the map.
How do I know if my concept map is correct? The first cartographers made maps that look silly to us today. However, as they became more experienced and more information became available to them, the maps became better representations of what they were depicting and more useful, too. Such will be the case as you refine your concept mapping skills.
How much effort should I put into organizing the map structure? No two maps will ever be the same. In some cases organization is critical. For example, living things would probably not be placed under cows. However, there could be a rationale for doing just that, depending on your own personal map making style. The linking phrase you make between two concepts is the most critical aspect of concept mapping.
If I am able to map it, does that mean I really understand it? The map on the paper and the map in your mind may not be identical. As you use your map in several different settings (e.g., taking class notes, studying the text, doing homework problems) the map on paper will become a part of the map in your mind.
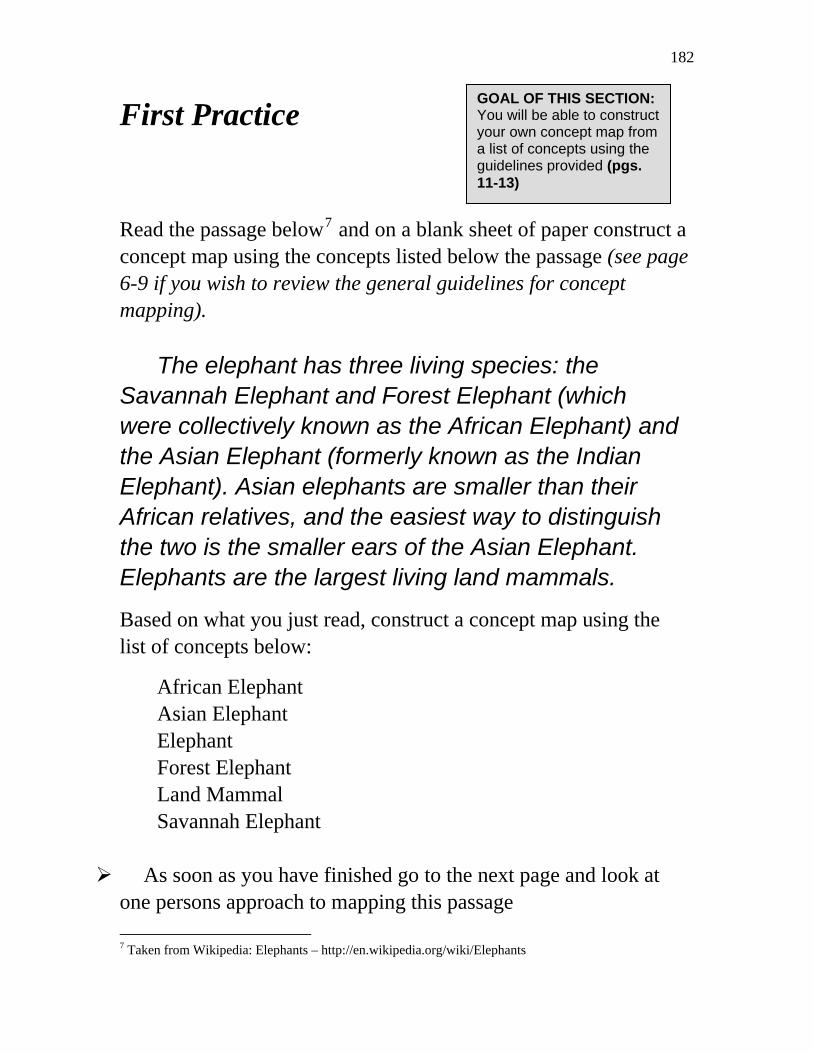
182
GOAL OF THIS SECTION: You will be able to construct your own concept map from a list of concepts using the guidelines provided (pgs. 11-13)
First Practice
Read the passage below7 and on a blank sheet of paper construct a concept map using the concepts listed below the passage (see page 6-9 if you wish to review the general guidelines for concept mapping). The elephant has three living species: the Savannah Elephant and Forest Elephant (which were collectively known as the African Elephant) and the Asian Elephant (formerly known as the Indian Elephant). Asian elephants are smaller than their African relatives, and the easiest way to distinguish the two is the smaller ears of the Asian Elephant. Elephants are the largest living land mammals.
Based on what you just read, construct a concept map using the list of concepts below:
African Elephant Asian Elephant Elephant Forest Elephant Land Mammal Savannah Elephant
As soon as you have finished go to the next page and look at one persons approach to mapping this passage 7 Taken from Wikipedia: Elephants – http://en.wikipedia.org/wiki/Elephants
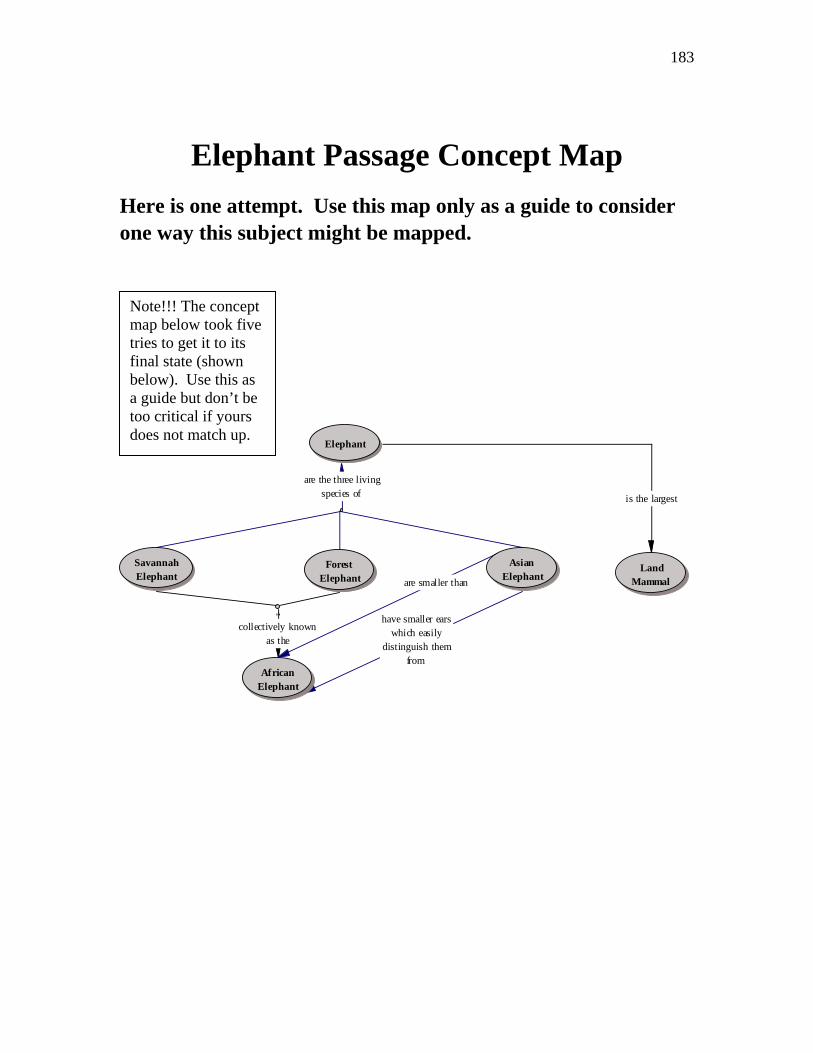
183
Elephant Passage Concept Map
Here is one attempt. Use this map only as a guide to consider one way this subject might be mapped.
collectively known as the
is the largest
are the three living species of
have smaller ears which easily
distinguish them from
are smaller than
Elephant
Savannah Elephant
Forest Elephant
Asian Elephant
African Elephant
Land Mammal
Note!!! The concept map below took five tries to get it to its final state (shown below). Use this as a guide but don’t be too critical if yours does not match up.
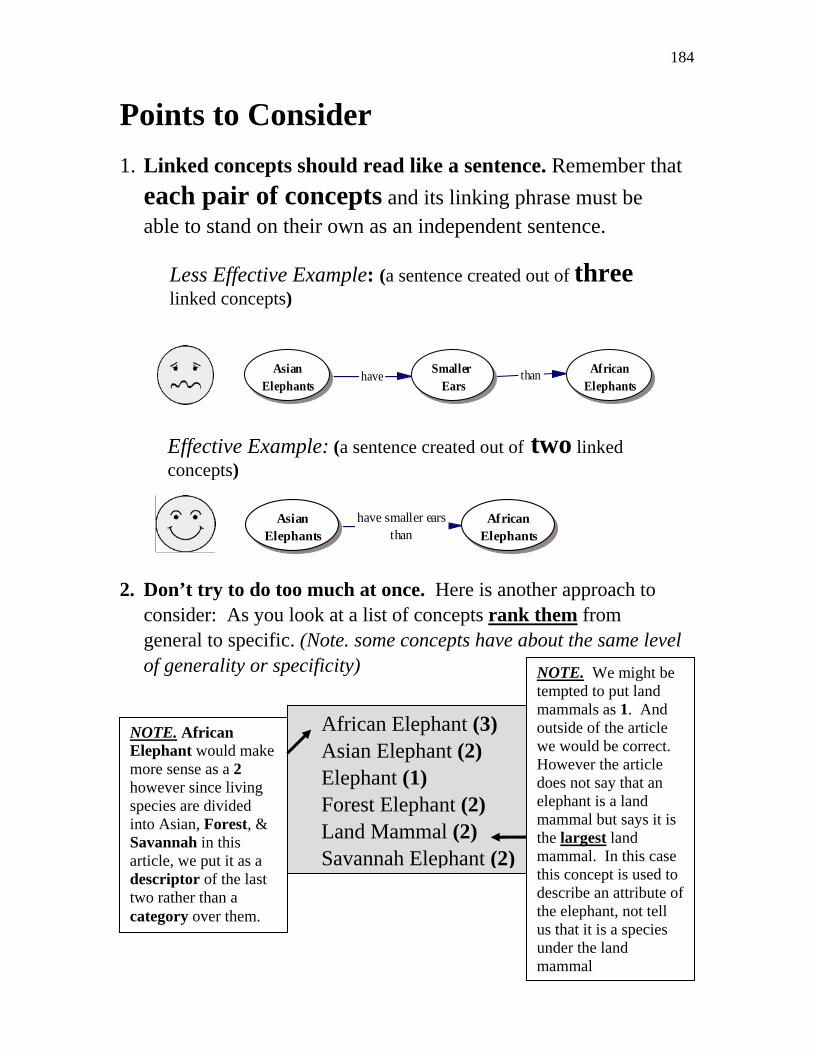
184
Points to Consider
1. Linked concepts should read like a sentence. Remember that each pair of concepts and its linking phrase must be able to stand on their own as an independent sentence.
Less Effective Example: (a sentence created out of three linked concepts)
have thanAsianElephants
Smaller Ears
African Elephants
Effective Example: (a sentence created out of two linked concepts)
have smaller ears than
Asian Elephants
African Elephants
2. Don’t try to do too much at once. Here is another approach to
consider: As you look at a list of concepts rank them from general to specific. (Note. some concepts have about the same level of generality or specificity)
NOTE. African Elephant would make more sense as a 2 however since living species are divided into Asian, Forest, & Savannah in this article, we put it as a descriptor of the last two rather than a category over them.
African Elephant (3) Asian Elephant (2) Elephant (1) Forest Elephant (2) Land Mammal (2) Savannah Elephant (2)
NOTE. We might be tempted to put land mammals as 1. And outside of the article we would be correct. However the article does not say that an elephant is a land mammal but says it is the largest land mammal. In this case this concept is used to describe an attribute of the elephant, not tell us that it is a species under the land mammal
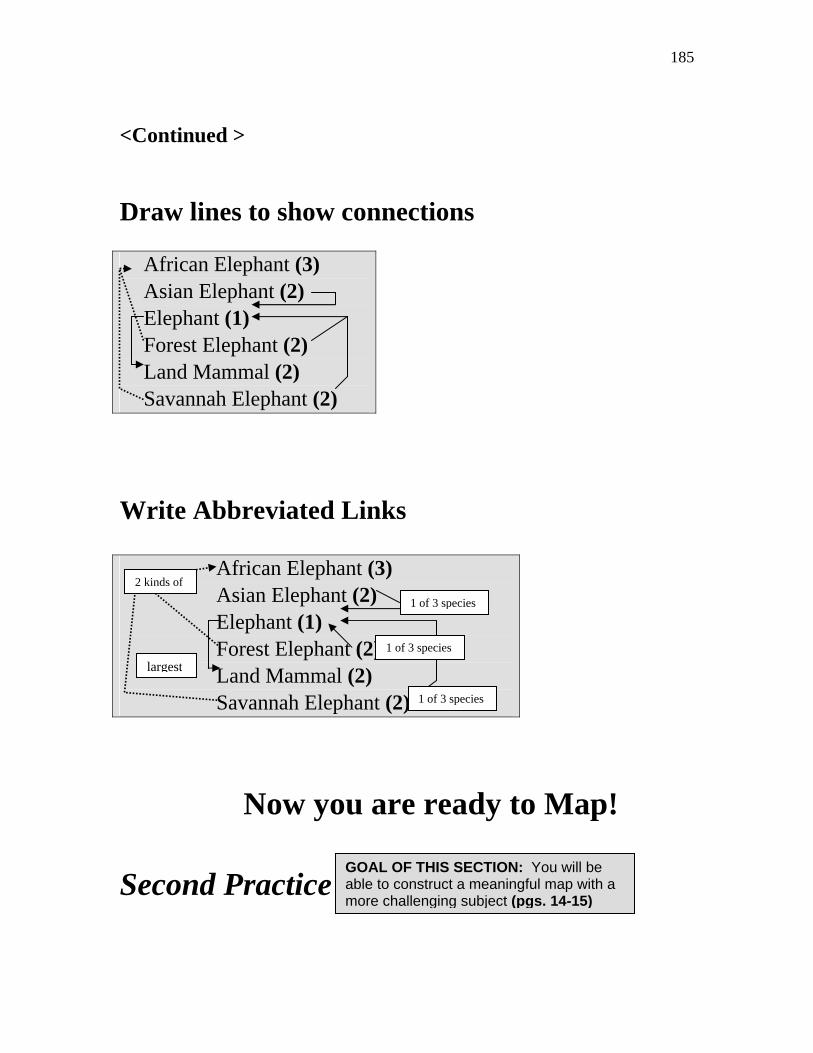
185
<Continued > Draw lines to show connections
African Elephant (3) Asian Elephant (2) Elephant (1) Forest Elephant (2) Land Mammal (2) Savannah Elephant (2)
Write Abbreviated Links
African Elephant (3) Asian Elephant (2) Elephant (1) Forest Elephant (2) Land Mammal (2) Savannah Elephant (2)
largest
2 kinds of
1 of 3 species
1 of 3 species
1 of 3 species
Now you are ready to Map!
Second Practice GOAL OF THIS SECTION: You will be able to construct a meaningful map with a more challenging subject (pgs. 14-15)
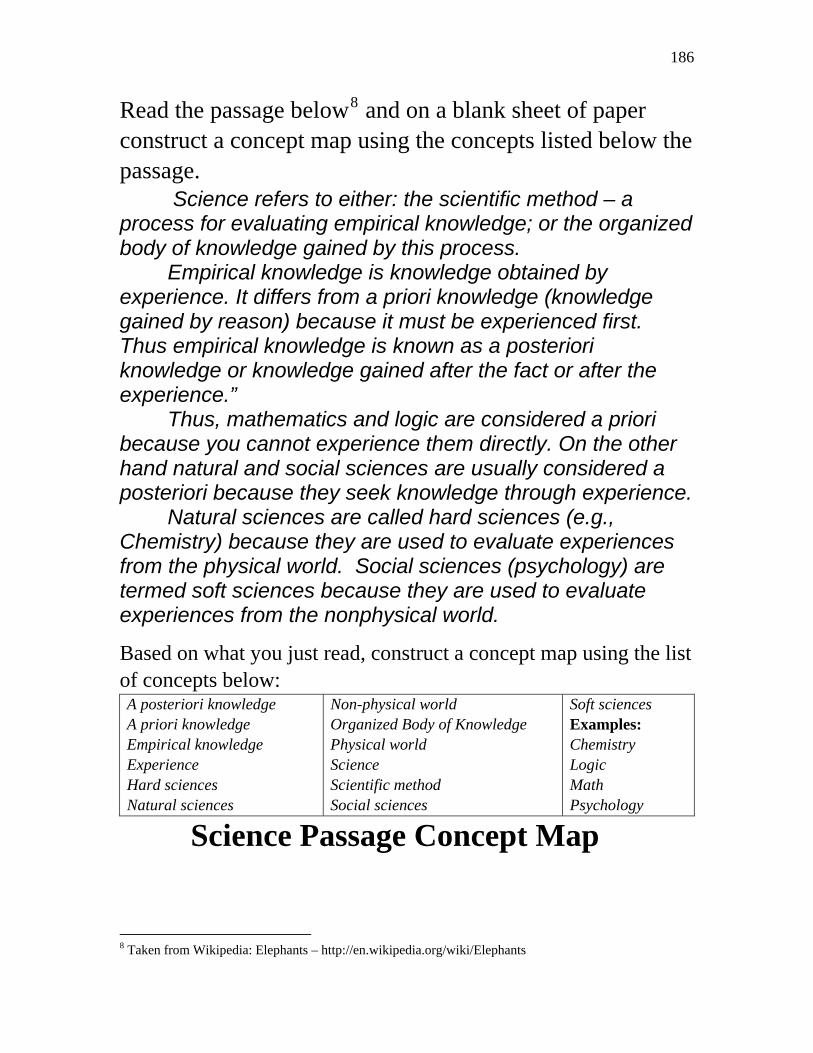
186
Read the passage below8 and on a blank sheet of paper construct a concept map using the concepts listed below the passage.
Science refers to either: the scientific method – a process for evaluating empirical knowledge; or the organized body of knowledge gained by this process.
Empirical knowledge is knowledge obtained by experience. It differs from a priori knowledge (knowledge gained by reason) because it must be experienced first. Thus empirical knowledge is known as a posteriori knowledge or knowledge gained after the fact or after the experience.”
Thus, mathematics and logic are considered a priori because you cannot experience them directly. On the other hand natural and social sciences are usually considered a posteriori because they seek knowledge through experience.
Natural sciences are called hard sciences (e.g., Chemistry) because they are used to evaluate experiences from the physical world. Social sciences (psychology) are termed soft sciences because they are used to evaluate experiences from the nonphysical world.
Based on what you just read, construct a concept map using the list of concepts below: A posteriori knowledge A priori knowledge Empirical knowledge Experience Hard sciences Natural sciences
Non-physical world Organized Body of Knowledge Physical world Science Scientific method Social sciences
Soft sciences Examples: Chemistry Logic Math Psychology
Science Passage Concept Map
8 Taken from Wikipedia: Elephants – http://en.wikipedia.org/wiki/Elephants
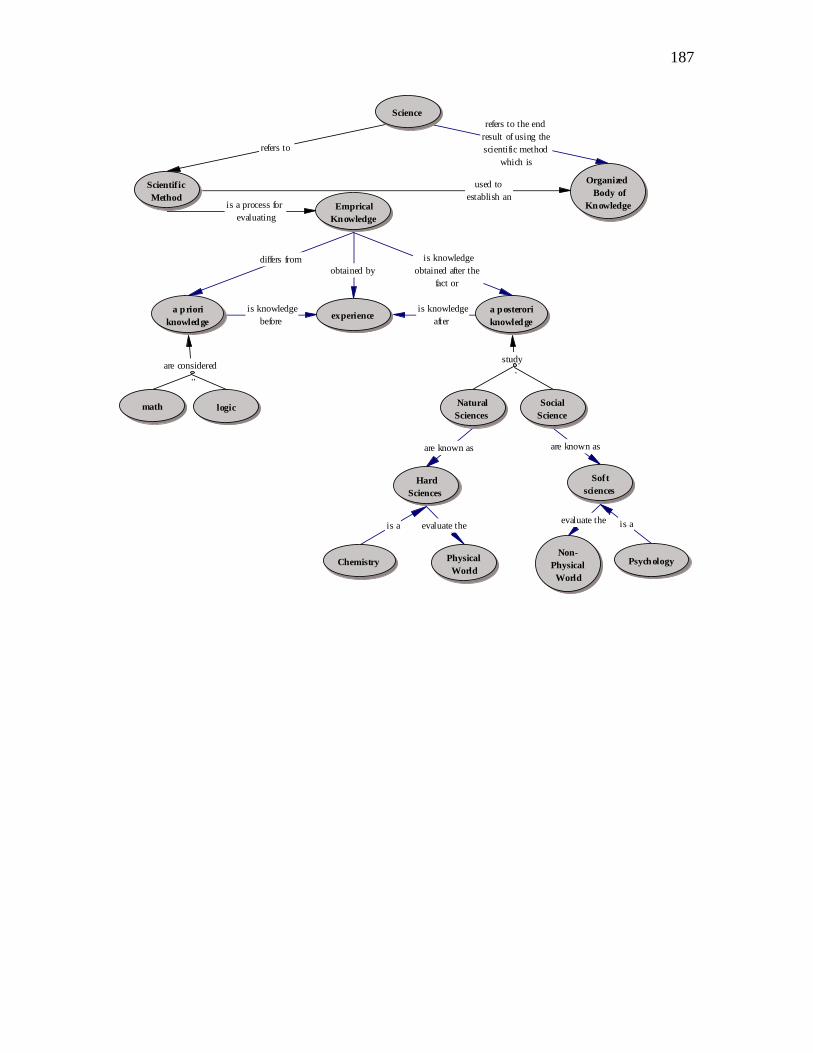
187
refers to
is a process for evaluating
used to establish an
obtained byis knowledge
obtained after the fact or
differs from
are considered
is knowledgebefore
study
refers to the end result of using the scientific method
which is
are known as are known as
evaluate theis a is aevaluate the
is knowledge after
Science
Scientific Method
Organized Body of
KnowledgeEmprical Knowledge
experiencea priori
knowledgea posterori knowledge
math logic Natural Sciences
Social Science
Chemistry Psychology
Hard Sciences
Soft sciences
Physical World
Non-Physical World
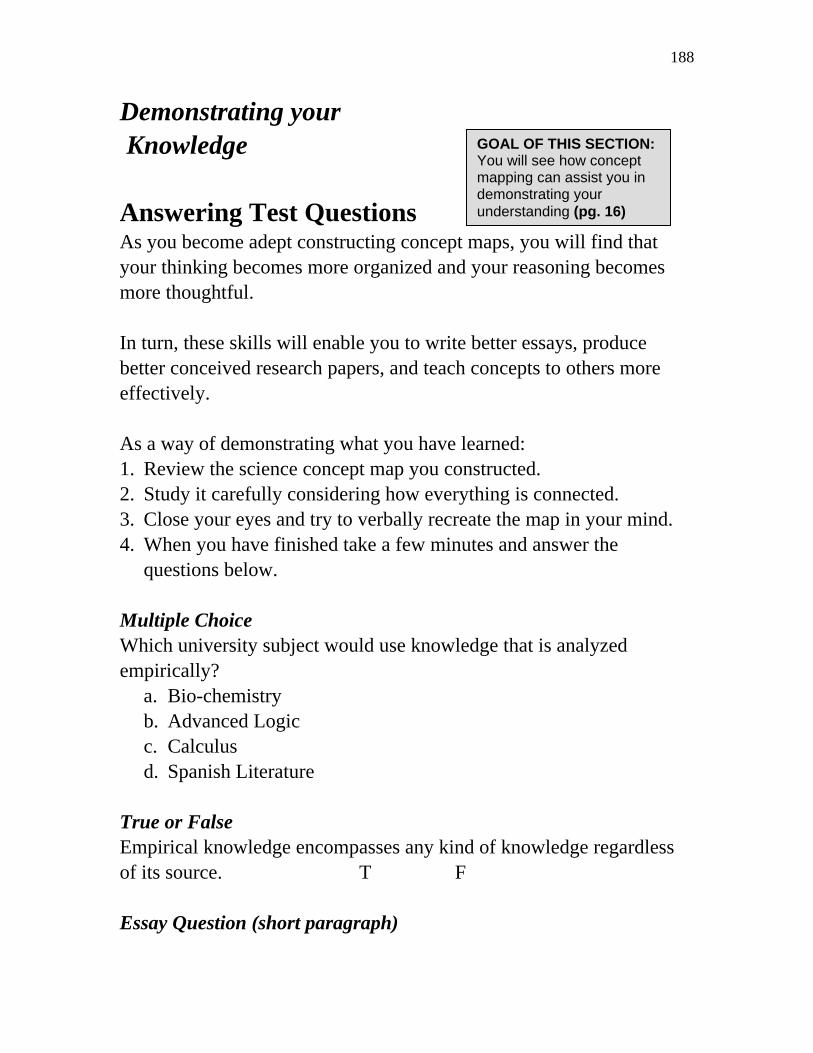
188
Demonstrating your Knowledge GOAL OF THIS SECTION:
You will see how concept mapping can assist you in demonstrating your understanding (pg. 16)
Answering Test Questions As you become adept constructing concept maps, you will find that your thinking becomes more organized and your reasoning becomes more thoughtful. In turn, these skills will enable you to write better essays, produce better conceived research papers, and teach concepts to others more effectively. As a way of demonstrating what you have learned: 1. Review the science concept map you constructed. 2. Study it carefully considering how everything is connected. 3. Close your eyes and try to verbally recreate the map in your mind. 4. When you have finished take a few minutes and answer the
questions below. Multiple Choice Which university subject would use knowledge that is analyzed empirically?
a. Bio-chemistry b. Advanced Logic c. Calculus d. Spanish Literature
True or False Empirical knowledge encompasses any kind of knowledge regardless of its source. T F Essay Question (short paragraph)

189
Describe the true nature of empirical knowledge and contrast it with other kinds of knowledge. (use back side of this page)
Class Assignment 1 Due by ___________

190
APPENDIX M
Biology 100 Concept Map Training
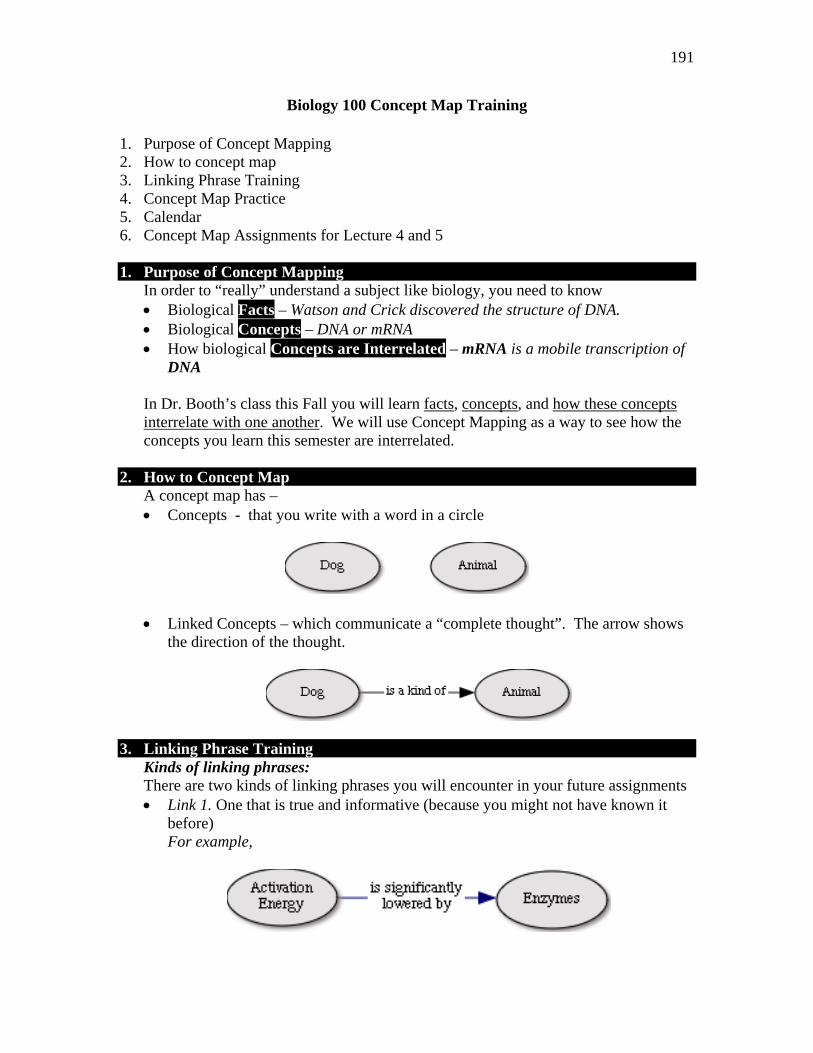
191
Biology 100 Concept Map Training
1. Purpose of Concept Mapping 2. How to concept map 3. Linking Phrase Training 4. Concept Map Practice 5. Calendar 6. Concept Map Assignments for Lecture 4 and 5 1. Purpose of Concept Mapping
In order to “really” understand a subject like biology, you need to know • Biological Facts – Watson and Crick discovered the structure of DNA. • Biological Concepts – DNA or mRNA • How biological Concepts are Interrelated – mRNA is a mobile transcription of
DNA
In Dr. Booth’s class this Fall you will learn facts, concepts, and how these concepts interrelate with one another. We will use Concept Mapping as a way to see how the concepts you learn this semester are interrelated.
2. How to Concept Map
A concept map has – • Concepts - that you write with a word in a circle
• Linked Concepts – which communicate a “complete thought”. The arrow shows
the direction of the thought.
3. Linking Phrase Training
Kinds of linking phrases: There are two kinds of linking phrases you will encounter in your future assignments • Link 1. One that is true and informative (because you might not have known it
before) For example,
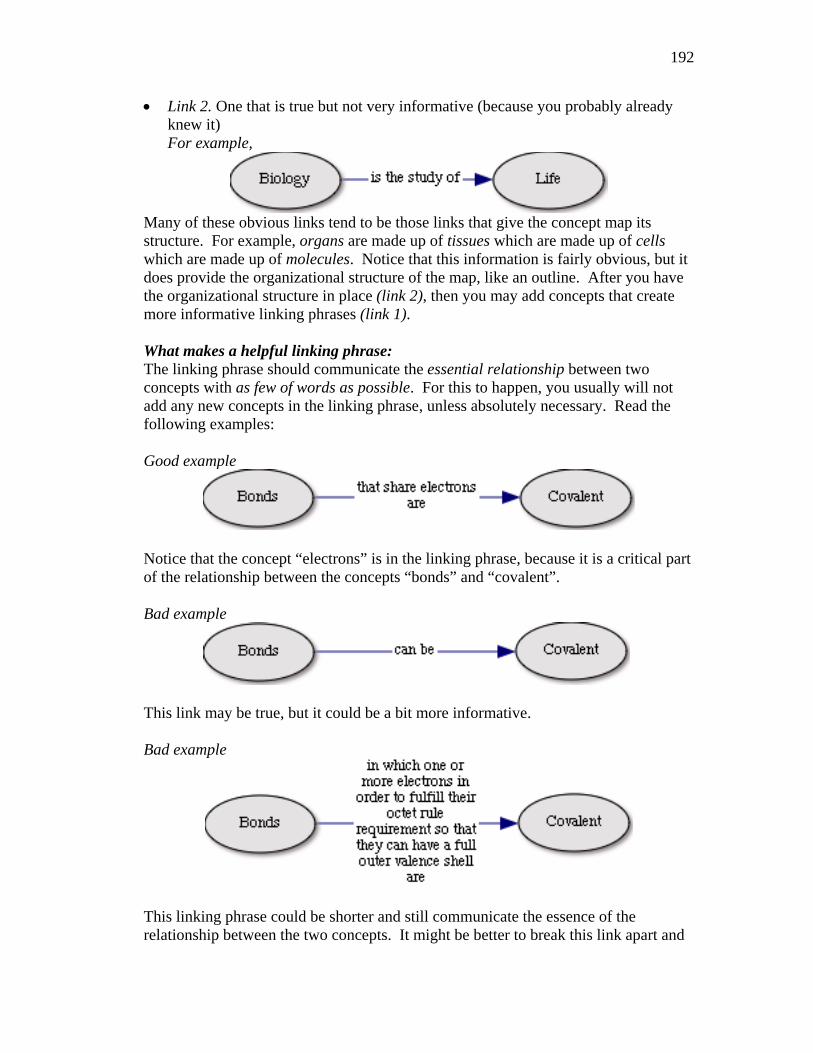
192
• Link 2. One that is true but not very informative (because you probably already knew it) For example,
Many of these obvious links tend to be those links that give the concept map its structure. For example, organs are made up of tissues which are made up of cells which are made up of molecules. Notice that this information is fairly obvious, but it does provide the organizational structure of the map, like an outline. After you have the organizational structure in place (link 2), then you may add concepts that create more informative linking phrases (link 1). What makes a helpful linking phrase: The linking phrase should communicate the essential relationship between two concepts with as few of words as possible. For this to happen, you usually will not add any new concepts in the linking phrase, unless absolutely necessary. Read the following examples: Good example
Notice that the concept “electrons” is in the linking phrase, because it is a critical part of the relationship between the concepts “bonds” and “covalent”. Bad example
This link may be true, but it could be a bit more informative. Bad example
This linking phrase could be shorter and still communicate the essence of the relationship between the two concepts. It might be better to break this link apart and
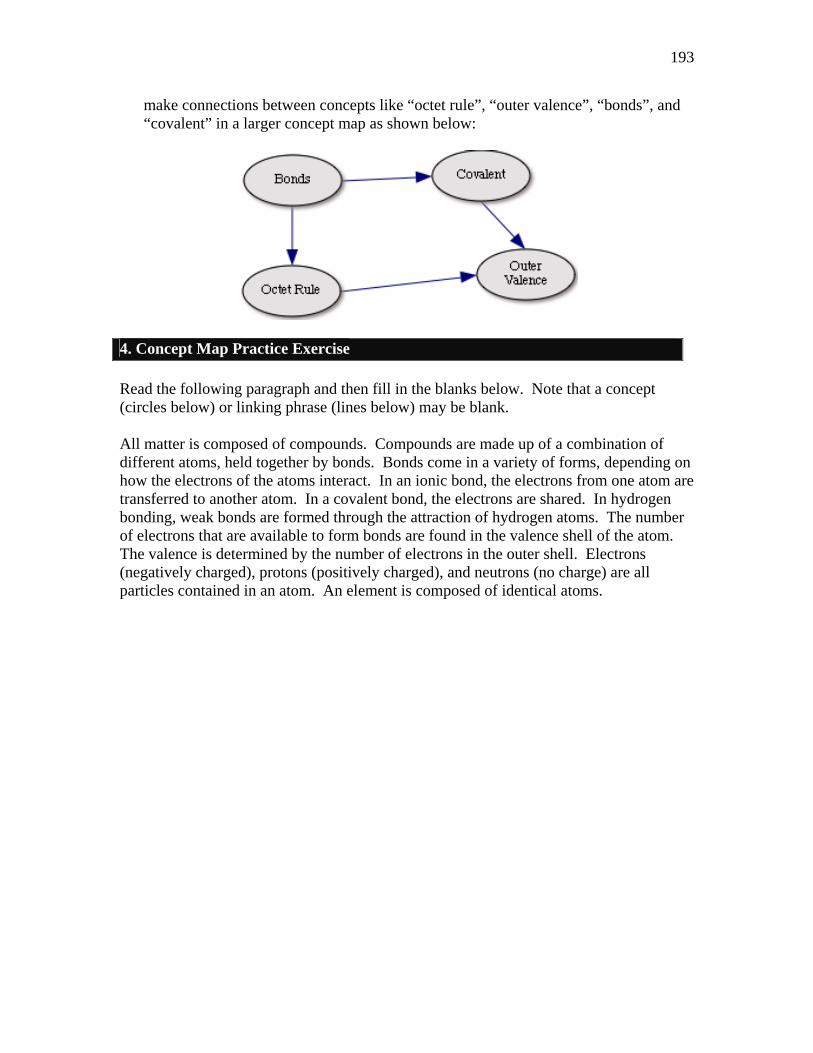
193
make connections between concepts like “octet rule”, “outer valence”, “bonds”, and “covalent” in a larger concept map as shown below:
4. Concept Map Practice Exercise Read the following paragraph and then fill in the blanks below. Note that a concept (circles below) or linking phrase (lines below) may be blank. All matter is composed of compounds. Compounds are made up of a combination of different atoms, held together by bonds. Bonds come in a variety of forms, depending on how the electrons of the atoms interact. In an ionic bond, the electrons from one atom are transferred to another atom. In a covalent bond, the electrons are shared. In hydrogen bonding, weak bonds are formed through the attraction of hydrogen atoms. The number of electrons that are available to form bonds are found in the valence shell of the atom. The valence is determined by the number of electrons in the outer shell. Electrons (negatively charged), protons (positively charged), and neutrons (no charge) are all particles contained in an atom. An element is composed of identical atoms.
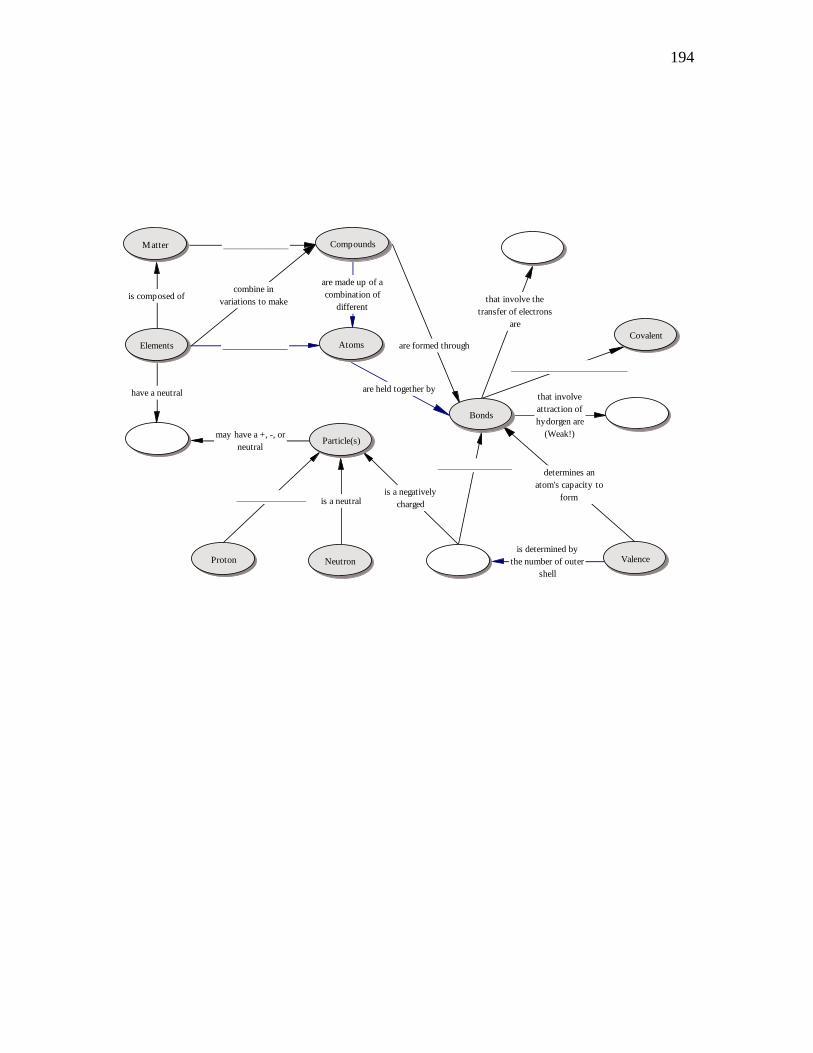
194
_________________________
that involve the transfer of electrons
are
that involve attraction of hydorgen are
(Weak!)
are formed through
combine in variations to make
have a neutral
may have a +, -, or neutral
is a neutral_______________ is a negatively charged
________________determines an
atom's capacity to form
is composed of
______________
is determined by the number of outer
shell
______________
are held together by
are made up of a combination of
different
Matter
Elements
Particle(s)
Compounds
Bonds
NeutronProton
Covalent
Valence
Atoms
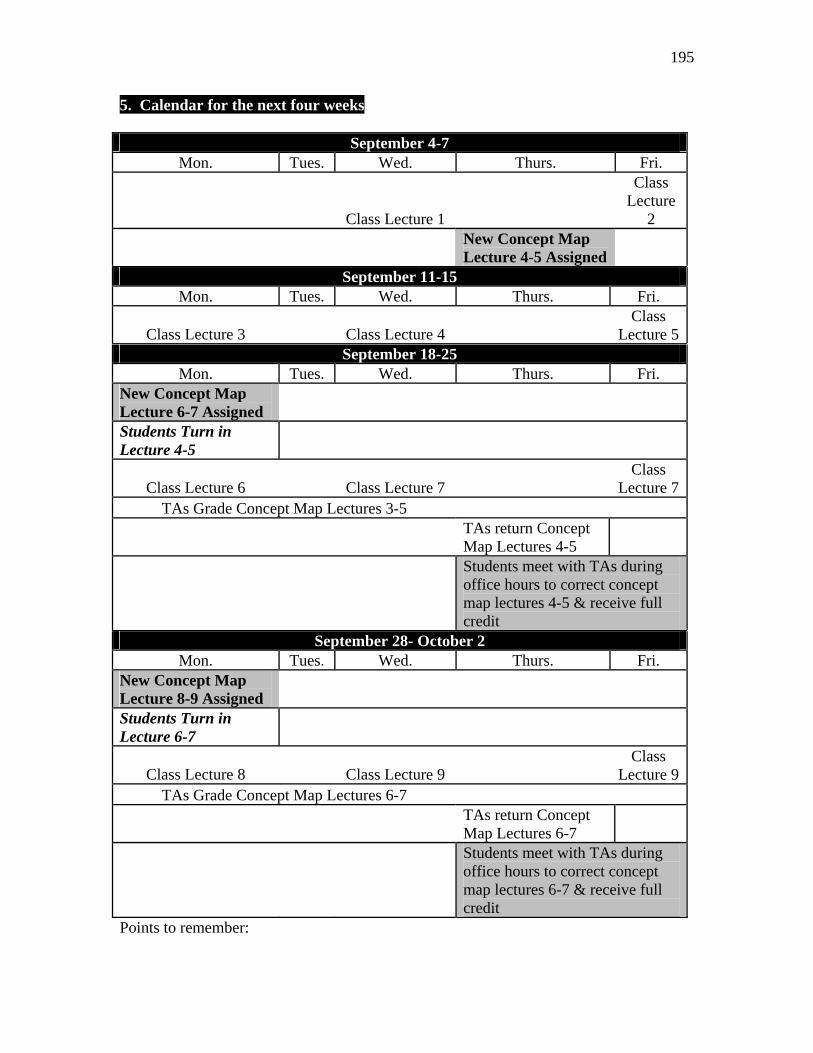
195
5. Calendar for the next four weeks
September 4-7 Mon. Tues. Wed. Thurs. Fri.
Class Lecture 1
Class Lecture
2
New Concept Map Lecture 4-5 Assigned
September 11-15 Mon. Tues. Wed. Thurs. Fri.
Class Lecture 3 Class Lecture 4 Class
Lecture 5 September 18-25
Mon. Tues. Wed. Thurs. Fri. New Concept Map Lecture 6-7 Assigned Students Turn in Lecture 4-5
Class Lecture 6 Class Lecture 7 Class
Lecture 7 TAs Grade Concept Map Lectures 3-5
TAs return Concept Map Lectures 4-5
Students meet with TAs during office hours to correct concept map lectures 4-5 & receive full credit
September 28- October 2 Mon. Tues. Wed. Thurs. Fri.
New Concept Map Lecture 8-9 Assigned Students Turn in Lecture 6-7
Class Lecture 8 Class Lecture 9 Class
Lecture 9 TAs Grade Concept Map Lectures 6-7
TAs return Concept Map Lectures 6-7
Students meet with TAs during office hours to correct concept map lectures 6-7 & receive full credit
Points to remember:
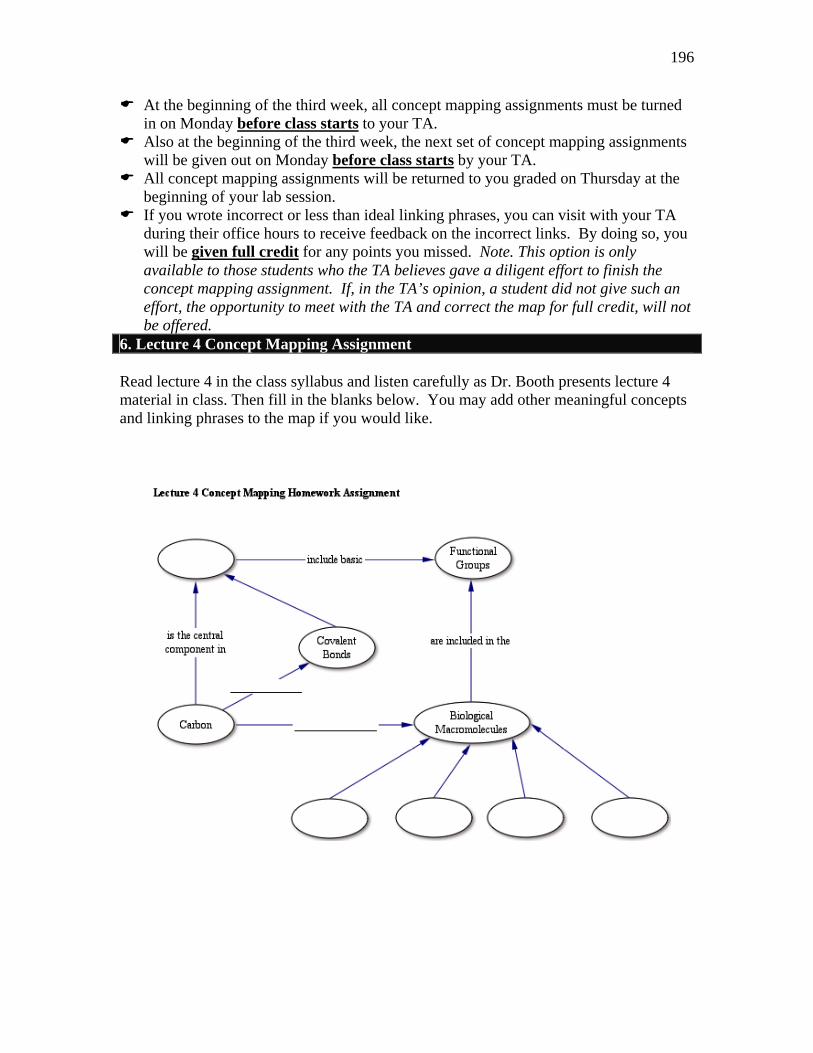
196
At the beginning of the third week, all concept mapping assignments must be turned in on Monday before class starts to your TA.
Also at the beginning of the third week, the next set of concept mapping assignments will be given out on Monday before class starts by your TA.
All concept mapping assignments will be returned to you graded on Thursday at the beginning of your lab session.
If you wrote incorrect or less than ideal linking phrases, you can visit with your TA during their office hours to receive feedback on the incorrect links. By doing so, you will be given full credit for any points you missed. Note. This option is only available to those students who the TA believes gave a diligent effort to finish the concept mapping assignment. If, in the TA’s opinion, a student did not give such an effort, the opportunity to meet with the TA and correct the map for full credit, will not be offered.
6. Lecture 4 Concept Mapping Assignment Read lecture 4 in the class syllabus and listen carefully as Dr. Booth presents lecture 4 material in class. Then fill in the blanks below. You may add other meaningful concepts and linking phrases to the map if you would like.
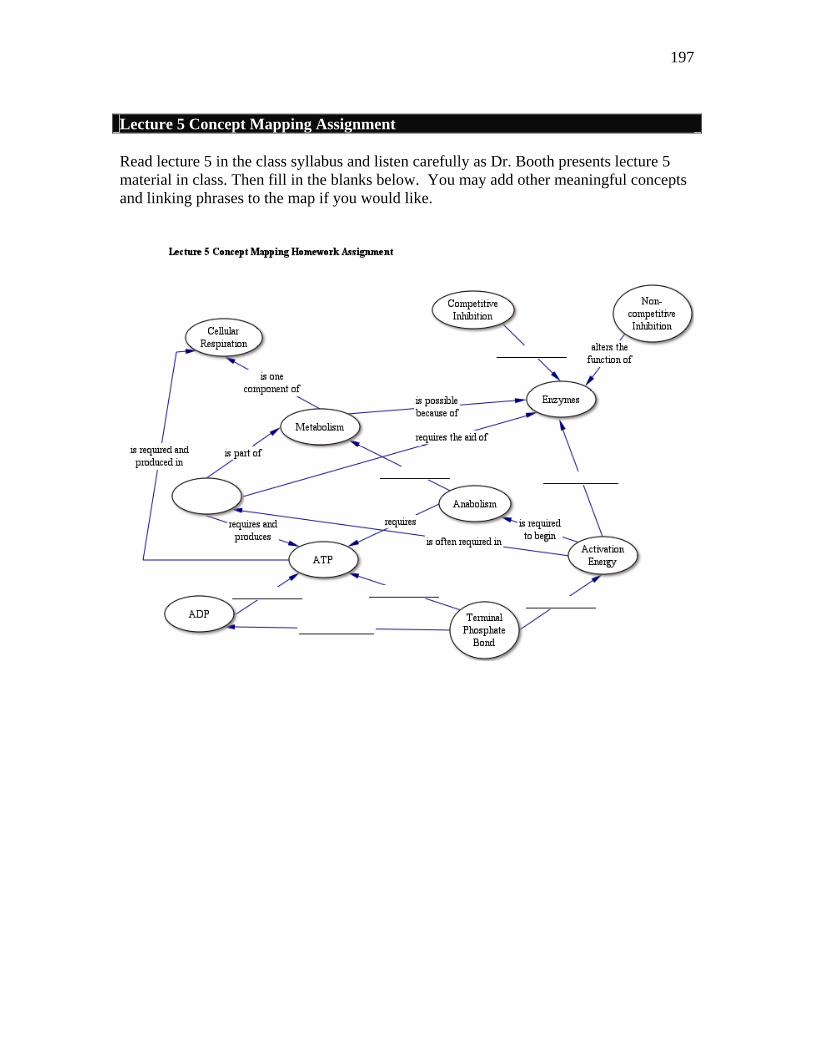
197
Lecture 5 Concept Mapping Assignment Read lecture 5 in the class syllabus and listen carefully as Dr. Booth presents lecture 5 material in class. Then fill in the blanks below. You may add other meaningful concepts and linking phrases to the map if you would like.
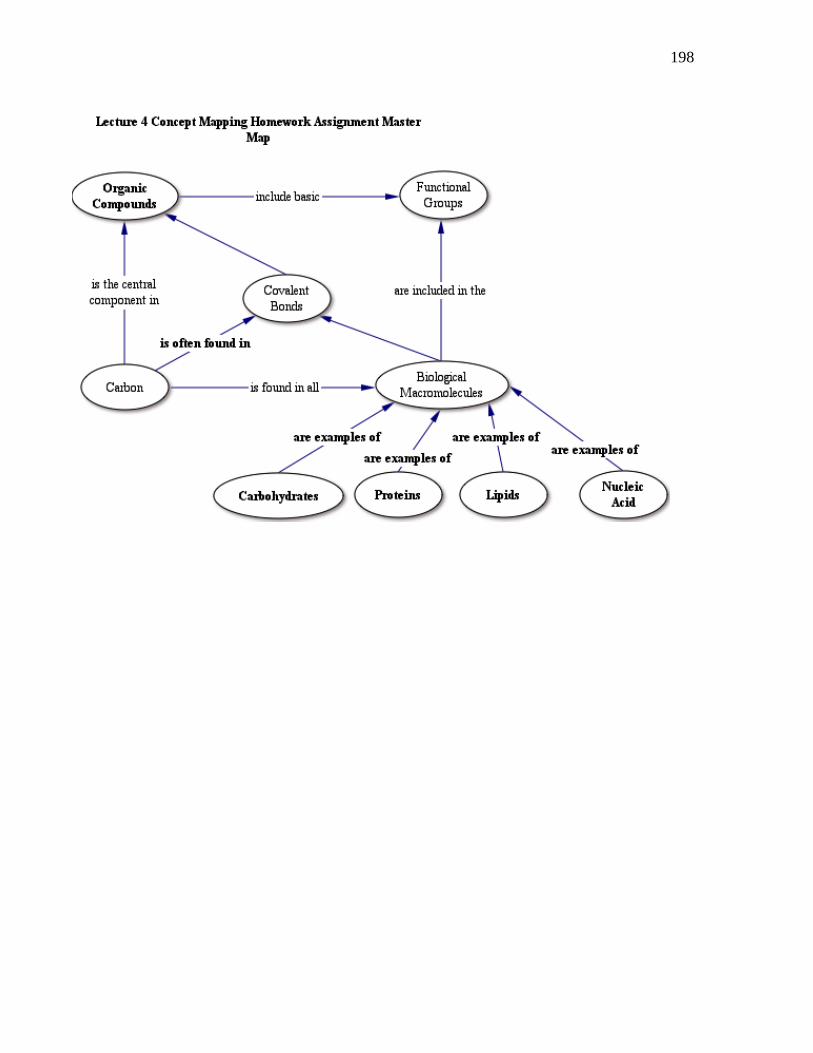
198
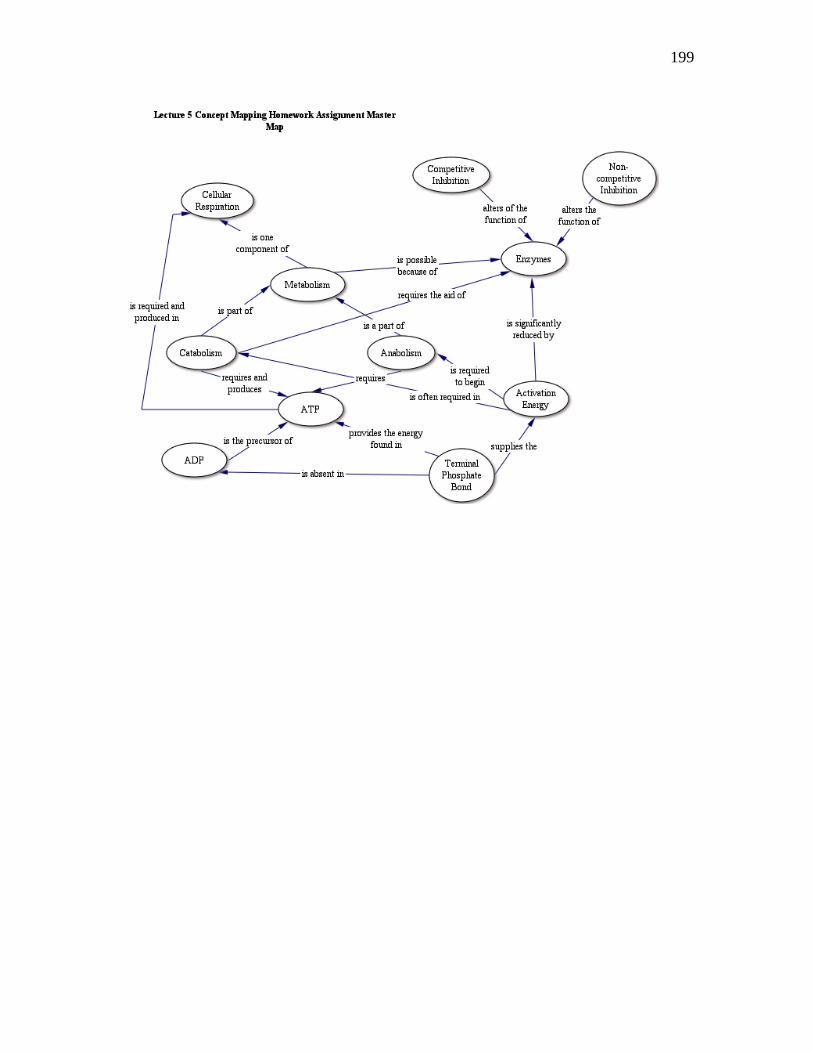
199


