Embed Size (px)
Citation preview

R
Al
Ja
b
a
ARRAA
KLCFH
(
0d
Analytica Chimica Acta 679 (2010) 31–42
Contents lists available at ScienceDirect
Analytica Chimica Acta
journa l homepage: www.e lsev ier .com/ locate /aca
eview
nalytical potential of mid-infrared detection in capillary electrophoresis andiquid chromatography: A review
ulia Kuligowskia, Guillermo Quintása, Miguel de la Guardiaa, Bernhard Lendlb,∗
Department of Analytical Chemistry, Universitat de València, Edifici Jeroni Munoz, 50th Dr. Moliner, 46100 Burjassot, SpainInstitute of Chemical Technologies and Analytics, Vienna University of Technology, Getreidemarkt 9-164, A-1060 Vienna, Austria
r t i c l e i n f o
rticle history:eceived 12 July 2010eceived in revised form 1 September 2010ccepted 3 September 2010vailable online 15 September 2010
eywords:iquid chromatographyapillary electrophoresisourier transform infrared spectrometryyphenated techniques
a b s t r a c t
Literature published in the last decade concerning the use of mid-infrared spectrometry as a detectionsystem in separation techniques employing a liquid mobile phase is reviewed. In addition to the contin-ued use of isocratic liquid chromatographic (LC) techniques, advances in chemometric data evaluationtechniques now allow the use of gradient techniques on a routine basis, thus significantly broadeningthe range of possible applications of LC–IR. The general trend towards miniaturized separation systemswas also followed for mid-IR detection where two key developments are of special importance. Firstly,concerning on-line detection the advent of micro-fabricated flow-cells with inner volumes of only a fewnL for transmission as well as attenuated total reflection measurements enabled on-line mid-IR detec-tion in capillary LC and opened the path for the first successful realization of on-line mid-IR detection incapillary zone electrophoresis as well as micellar electrokinetic chromatography. Secondly, concerning
off-line detection the use of micro-flow through dispensers now enables to concentrate eluting analyteson dried spots sized a few tens of micrometers, thus matching the dimensions for sensitive detection bymid-IR microscopy. Finally in an attempt to increase detection sensitivity of on-line mid-IR detection,mid-IR quantum cascade lasers have been used. Applications cover the field of food analysis, environmen-tal analysis and the characterization of explosives among others. Best detection sensitivities for on-linee been achieved in miniaturized systems and are in the order of 50 ng and 2 ng
© 2010 Elsevier B.V. All rights reserved.
Guillermo Quintás finished his PhD studies in thedepartment of analytical chemistry at the Univer-sity of Valencia (Spain). He joined Bernhard Lendl’sgroup in April 2005 as a postdoctoral scientist fortwo years where he started working on FTIR spectro-scopic detection in hyphenated separation systems. Ina second postdoctoral stay at the University of Valen-cia, he continued this research field. He is currentlyworking at the Research Foundation of the Hospi-
and off-line detection havon column, respectively.
Julia Kuligowski finished her degree in biotechnicalprocesses at the University of Applied Science WienerNeustadt/Tulln (Austria) in 2007. She then joined theresearch group of Bernhard Lendl for her diploma the-sis participating in the development of a portable,quantum cascade laser (QCL) based sensor system.Currently, she is working on her PhD thesis at theUniversity of Valencia (Spain) in the department ofanalytical chemistry. Her research involves the appli-
cation of FTIR spectrometry in hyphenated systems. tal Universitario La Fe Valencia on metabolomics anddrug metabolism using LC–MS.
∗ Corresponding author. Tel.: +43 1 5880115140; fax: +43 1 5880115199.E-mail addresses: [email protected], [email protected]
B. Lendl).
003-2670/$ – see front matter © 2010 Elsevier B.V. All rights reserved.oi:10.1016/j.aca.2010.09.006

3 a Chimica Acta 679 (2010) 31–42
Bernhard Lendl has been professor of AnalyticalChemistry at Vienna University of Technology andhead of the research group Process Analysis and Vibra-tional Spectroscopy since 2001. His research interestlie in the field of infrared and Raman spectroscopyapplied to analytical sciences. Current projects dealwith novel aspects of mid-IR detection in bioprocessmonitoring, quantum cascade lasers for developmentof chemical sensors as well as stand-off Raman detec-tion of explosives, among others. He is currentlymember of the editorial boards of Vibrational Spec-troscopy and Applied Spectroscopy. In addition to hiswork at the university, since 2008 he acts as scientific
advisor at QuantaRed Technologies, a spin-off company, developing instrumentsbased on quantum cascade laser technology.
1
aesaisqdveubi
nssatfUastbisd
atbu
spfitflatto
faces, Kok et al. [4] assessed both, on- and off-line approaches fortheir application in chromatography with respect to the chromato-
2 J. Kuligowski et al. / Analytic
Miguel de la Guardia is a full professor at the Uni-versity of Valencia since 1991. His current researchis focused on the automation of analytical methodsemploying multicommutation, sample preparationprocedures for elemental analysis and speciation,the development of chromatographic methods andquantitative vibrational spectrometric determina-tions applying FTIR, NIR and Raman spectroscopy. Heis member of the editorial board of Spectroscopy Let-ters (USA), Ciencia (Venezuela), J. Braz. Chem. Soc.(Brazil) and he was member of the advisory board ofAnalytica Chimica Acta from 1995 to 2000. From 1979on he has published more than 440 papers in interna-
tional journals which have received more than 5000 citations (with a Hirschindex of 31) and he has supervised 33 PhD theses. In addition, he is a consultantof the government of Portugal, Italy, Argentina and China for the evaluation ofresearch proposals and grants.
. Introduction
Capillary electrophoresis (CE) and liquid chromatography (LC)re two of the most efficient separation techniques and are widelymployed in a great variety of fields from environmental analy-is to life science. Combining the high resolution provided by LCnd CE systems with the non-destructive and molecule-specificnformation of a wide range of analytes provided by infrared (IR)pectrometry, allows the development of qualitative as well asuantitative applications. In this respect, IR spectrometry used foretection in LC or CE can provide much more information than con-entional detectors such as ultraviolet (UV), refractive index (RI) orvaporative light scattering (ELS) detectors. Despite the frequentse of IR detection in liquid flow systems for routine analysis of aroad variety of samples [1,2], its hyphenated use with LC and CE
s still rarely exploited.Raman spectroscopy, often mentioned as complementary tech-
ique together with IR spectroscopy, also provides molecularpecific fingerprints and structural information. In contrast to IRpectroscopy, Raman spectroscopy is less affected by backgroundbsorption of typical solvents used in LC and CE systems. However,he application of Raman spectroscopy for on-line detection is noteasible due to the low concentration sensitivity of this technique.sing the off-line approach, this lack of sensitivity is compensated,s the number of accumulated scans can be augmented. Using thistrategy, Raman spectroscopy has found application [38,39]. Due tohe non-destructive character, Raman spectroscopic detection cane combined with other detection strategies. Although of interest
n some applications, Raman spectroscopic detection was not thecope of the present review article and is not discussed here inetail. The topic was however recently reviewed [3].
In principle, infrared detection can be applied to the detection ofvast amount of molecules. However, its broad detection capabili-
ies also represent an important drawback as a result of the intenseackground absorption arising from common eluents and solventssed in CE and LC.
Basically, two strategies for an effective coupling of FTIRpectrometry can be distinguished: (i) on-line and (ii) off-line,resenting specific features, advantages and drawbacks. In therst approach, a flow cell is used for continuous on-the-fly spec-ra acquisition of the eluting solution. The on-line coupling via aow-cell interface is based either on transmission, reflection or
ttenuated total reflection (ATR) measurements. The useful detec-ion window range is defined by the IR absorption characteristics ofhe cell window materials and by the absorbance of the componentsf the mobile phase or background electrolyte (BGE) in LC and CE,respectively. Therefore, in spite of the instrumental simplicity of theon-line coupling, its application requires an accurate backgroundsubtraction which is not straightforward when the composition ofthe solvent is not constant during the run [1,4]. Until some yearsago it was generally agreed on that on-line mid-IR detection is notcompatible with gradient techniques. This view point has, how-ever, become obsolete due to the recent advances in chemometricsas recently reviewed [5] and also summarized in this paper. Majoradvantages of the on-line approach are its user friendly operationand handling, low cost and suitability for quantitative applications.The fact that the mobile phase does absorb can, however, also beadvantageous as changes in its composition can be monitored. Thisis of interest when it comes to basic investigations concerning theworking principle of special electrophoretic techniques like stack-ing and sweeping among others.
Alternatively, the off-line approach involves the elimination ofthe solvent prior to IR detection using an interface which evapo-rates the solvent and deposits the analytes onto an IR-transparentsubstrate such as CaF2, BaF2, ZnSe or Ge, for a subsequent spectralanalysis of the dried spots. Solvent removal interfaces are devel-oped to minimize the spot area maintaining the chromatographicresolution. Major advantages of this approach are: (i) the reduc-tion or elimination of eluent or BGE spectral interferences and(ii) improved signal-to-noise ratios. The main drawbacks of theoff-line coupling procedures are band broadening, a limited sam-ple throughput due to the post separation measurement, the lossof volatile analytes, problems occurring due to the use of non-volatile buffers and the handling and maintenance of the interface.Detailed descriptions of the general features of the above men-tioned approaches have been reported in previous works. In 1989Fujimoto and Jinno [6] described the main drawbacks and thepotential of the LC–FTIR coupling and presented and described theadvantages of using microcolumns to overcome some of these lim-itations. In 1999 Somsen et al. [7] reviewed the state of the art ofthe on-line LC–FTIR coupling approach discussing its restrictionsand making a detailed description of five early solvent elimi-nation interfaces: thermospray, particle beam and electrosprayinterfaces as well as pneumatic and ultrasonic nebulizers. Lendland co-workers [8,9] reviewed the range of applications of LC–FTIRin aqueous systems. In 2003 using commercially available inter-
graphic features as well as to quantitative and qualitative aspects.In the last decade a series of developments have contributed to
expand the scope of mid IR detection in LC and CE systems using on-line and off-line approaches. The objective of the present review is

a Chimica Acta 679 (2010) 31–42 33
tfrwosr
2L
caimtchao
2
2
bnwteteedanbfiiatei2oarb
2
cnaoa
oeicpsg
J. Kuligowski et al. / Analytic
o highlight novel strategies and developments, covering the periodrom 1999 to 2010. Recently developed infrared sources, solventemoval interfaces, flow cell designs and chemometric approachesill be presented. Actual advantages, limitations and perspectives
f LC–IR and CE–IR coupling are discussed with the aim to show thetate-of-the-art and address relevant novel analytical applicationsecently reported in literature.
. Technical innovations and developments in CE–IR andC–IR
Recently published developments in the field of LC–IR and CE–IRan be clustered into off-line and on-line approaches. IR spectralcquisition in off-line hyphenated systems is normally carried outn transmission mode using an IR microscope. On-line measure-
ents can be carried out using both, transmission and attenuatedotal reflectance (ATR) approaches, combining the limitations andharacteristics specific for each detection approach. On the otherand, due to the significant instrumental differences between CEnd LC systems, specific interfaces must be designed for each typef coupling.
.1. Off-line measurements
.1.1. Off-line measurements in CE–FTIRCoupling between CE and FTIR can be performed as presented
y Jarman et al. [10]. The authors employed a glass microconcentricebulizer interface to deposit the CE effluent onto an IR transparentindow using an FTIR-microscope for off-line detection. By using
his interface, the characteristic plug flow of CE was maintainednabling the reproducible measurement of analyte spectra. Addi-ionally, in this work it was demonstrated that there is no loss oflectrical current during operation. However, the applicability ofluent evaporation interfaces is limited because they cannot han-le CE buffers of reduced volatility which are commonly used inqueous CE. An additional disadvantage of this procedure is thaton-volatile additives included in the background electrolyte cane co-deposited with the analytes, thus producing spectral inter-erences. In 2003 Todebush et al. proposed [11] an alternativenterface. It consisted of a stainless steel tube in which the cap-llary was placed. This interface produced an aerosol directed to
CaF2 surface. In this approach, the use of a volatile electrolyte,ogether with a helium flow, allowed the partial evaporation of thelectrolyte and the complete evaporation of the solvent produc-ng clean analyte deposits. The smallest deposited quantity was8 ng of caffeine. The analyte could be identified by comparisonf its spectrum to library data. No calibration line was establishednd the linearity of the method was not investigated, but from theecorded spectrum the limit of detection (LOD) was estimated toe below 10 ng for the determination of caffeine.
.1.2. Off-line LC–FTIRSome interfaces for solvent removal in LC–FTIR are commer-
ially available. Although several thermospray and pneumaticebulizer interfaces have been directly used or modified, carefulnd time-consuming optimization is still needed. Some examplesf applications of different types of solvent elimination interfacesre listed in Table 1 [4,12–37,64].
Lendl and co-workers [38,39] introduced a fully automaticn-line piezoactuated flow-through microdispenser as a solventlimination interface for capillary LC–FTIR, schematically shown
n Fig. 1. Recently this interface was applied in capillary liquidhromatography [40]. As described by Lendl and co-workers, theiezoceramic element of the dispenser was driven by a DC powerupply together with a computer controlled arbitrary waveformenerator providing electronic pulses with defined amplitude, rise,Fig. 1. Top: Flow-through microdispenser design. Bottom: Schematic view of theelectrically induced deformation of the piezo-element which causes droplet ejectionfrom the main flow stream.Figure from reference [37].
width, and decay time. To enable lateral location of the depositson a CaF2 window a computer controlled x, y-stage with controlledstep sizes was implemented in the set-up. The flow-through micro-dispenser was capable to provide droplets of picoliter size. Driedresidues of chlorinated pesticides from river water samples wereanalyzed by mid-IR and Raman microscopy and limits of identifi-cation of 2 ng analyte on-column with a precision of approximately10% RSD were achieved.
2.2. On-line measurements
2.2.1. On-line measurements in CE–FTIRThe design of an appropriate interface is one of the most critical
steps in the development of on-line CE–IR hyphenation. Whereasdifficulties related to the flow cell arrangement are also presentin LC–FTIR, the coupling of CE and FTIR presents four additionalobstacles: (i) the fused silica capillaries, commonly used in CE, arenot transparent to infrared radiation below 2500 cm−1; (ii) CE isnormally operated with aqueous buffers; (iii) the injected sampleamounts are normally in the nL range, and (iv) the flow rates aresignificantly lower than in the case of LC.
To circumvent these obstacles in 2002 Lendl and co-workers[41] developed the micromachined IR flow cell with virtually zerodead volume shown in Fig. 2. This interface consisted of two CaF2plates separated by a polymer coating and a titanium layer for the IRdetection cell. With dimensions of 150 �m width, 2 mm length anda pathlength of 15 �m, a beam condenser was employed to focusthe IR beam of a conventional globar source onto the measurementchannel. The titanium layer was deposited by evaporation and pat-
terned by a conventional liftoff technique, and it was isolated toavoid electrical contact with the CE buffer. This metal layer actedas an optical aperture to prevent IR absorption by the polymer lay-ers surrounding the flow channel. Aqueous solutions comprisingmixtures of adenosine, guanosine and adenosine monophosphate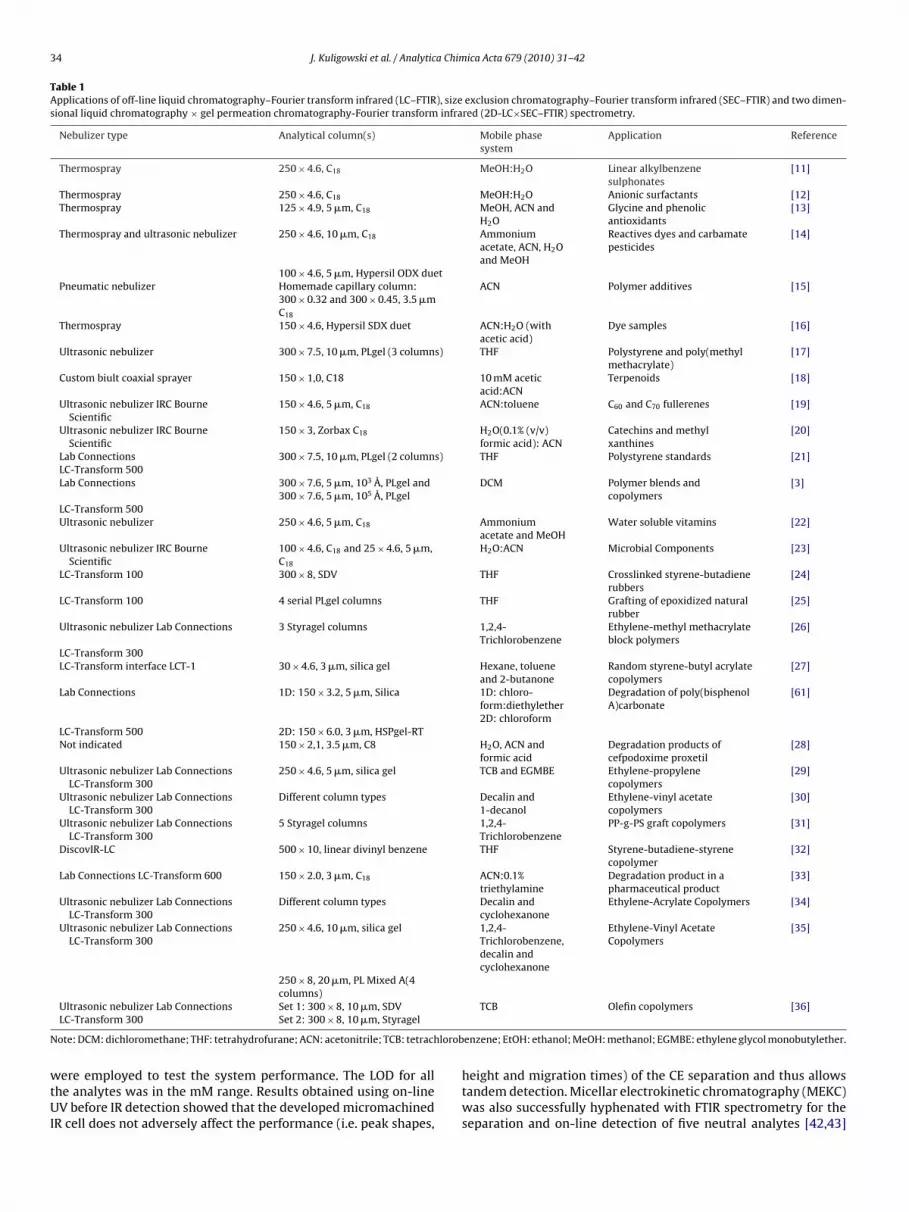
34 J. Kuligowski et al. / Analytica Chimica Acta 679 (2010) 31–42
Table 1Applications of off-line liquid chromatography–Fourier transform infrared (LC–FTIR), size exclusion chromatography–Fourier transform infrared (SEC–FTIR) and two dimen-sional liquid chromatography × gel permeation chromatography-Fourier transform infrared (2D-LC×SEC–FTIR) spectrometry.
Nebulizer type Analytical column(s) Mobile phasesystem
Application Reference
Thermospray 250 × 4.6, C18 MeOH:H2O Linear alkylbenzenesulphonates
[11]
Thermospray 250 × 4.6, C18 MeOH:H2O Anionic surfactants [12]Thermospray 125 × 4.9, 5 �m, C18 MeOH, ACN and
H2OGlycine and phenolicantioxidants
[13]
Thermospray and ultrasonic nebulizer 250 × 4.6, 10 �m, C18 Ammoniumacetate, ACN, H2Oand MeOH
Reactives dyes and carbamatepesticides
[14]
100 × 4.6, 5 �m, Hypersil ODX duetPneumatic nebulizer Homemade capillary column:
300 × 0.32 and 300 × 0.45, 3.5 �mC18
ACN Polymer additives [15]
Thermospray 150 × 4.6, Hypersil SDX duet ACN:H2O (withacetic acid)
Dye samples [16]
Ultrasonic nebulizer 300 × 7.5, 10 �m, PLgel (3 columns) THF Polystyrene and poly(methylmethacrylate)
[17]
Custom biult coaxial sprayer 150 × 1,0, C18 10 mM aceticacid:ACN
Terpenoids [18]
Ultrasonic nebulizer IRC BourneScientific
150 × 4.6, 5 �m, C18 ACN:toluene C60 and C70 fullerenes [19]
Ultrasonic nebulizer IRC BourneScientific
150 × 3, Zorbax C18 H2O(0.1% (v/v)formic acid): ACN
Catechins and methylxanthines
[20]
Lab Connections 300 × 7.5, 10 �m, PLgel (2 columns) THF Polystyrene standards [21]LC-Transform 500Lab Connections 300 × 7.6, 5 �m, 103 A, PLgel and
300 × 7.6, 5 �m, 105 A, PLgelDCM Polymer blends and
copolymers[3]
LC-Transform 500Ultrasonic nebulizer 250 × 4.6, 5 �m, C18 Ammonium
acetate and MeOHWater soluble vitamins [22]
Ultrasonic nebulizer IRC BourneScientific
100 × 4.6, C18 and 25 × 4.6, 5 �m,C18
H2O:ACN Microbial Components [23]
LC-Transform 100 300 × 8, SDV THF Crosslinked styrene-butadienerubbers
[24]
LC-Transform 100 4 serial PLgel columns THF Grafting of epoxidized naturalrubber
[25]
Ultrasonic nebulizer Lab Connections 3 Styragel columns 1,2,4-Trichlorobenzene
Ethylene-methyl methacrylateblock polymers
[26]
LC-Transform 300LC-Transform interface LCT-1 30 × 4.6, 3 �m, silica gel Hexane, toluene
and 2-butanoneRandom styrene-butyl acrylatecopolymers
[27]
Lab Connections 1D: 150 × 3.2, 5 �m, Silica 1D: chloro-form:diethylether2D: chloroform
Degradation of poly(bisphenolA)carbonate
[61]
LC-Transform 500 2D: 150 × 6.0, 3 �m, HSPgel-RTNot indicated 150 × 2,1, 3.5 �m, C8 H2O, ACN and
formic acidDegradation products ofcefpodoxime proxetil
[28]
Ultrasonic nebulizer Lab ConnectionsLC-Transform 300
250 × 4.6, 5 �m, silica gel TCB and EGMBE Ethylene-propylenecopolymers
[29]
Ultrasonic nebulizer Lab ConnectionsLC-Transform 300
Different column types Decalin and1-decanol
Ethylene-vinyl acetatecopolymers
[30]
Ultrasonic nebulizer Lab ConnectionsLC-Transform 300
5 Styragel columns 1,2,4-Trichlorobenzene
PP-g-PS graft copolymers [31]
DiscovIR-LC 500 × 10, linear divinyl benzene THF Styrene-butadiene-styrenecopolymer
[32]
Lab Connections LC-Transform 600 150 × 2.0, 3 �m, C18 ACN:0.1%triethylamine
Degradation product in apharmaceutical product
[33]
Ultrasonic nebulizer Lab ConnectionsLC-Transform 300
Different column types Decalin andcyclohexanone
Ethylene-Acrylate Copolymers [34]
Ultrasonic nebulizer Lab ConnectionsLC-Transform 300
250 × 4.6, 10 �m, silica gel 1,2,4-Trichlorobenzene,decalin andcyclohexanone
Ethylene-Vinyl AcetateCopolymers
[35]
250 × 8, 20 �m, PL Mixed A(4columns)
N lorob
wtUI
Ultrasonic nebulizer Lab Connections Set 1: 300 × 8, 10 �m, SDVLC-Transform 300 Set 2: 300 × 8, 10 �m, Styragel
ote: DCM: dichloromethane; THF: tetrahydrofurane; ACN: acetonitrile; TCB: tetrach
ere employed to test the system performance. The LOD for allhe analytes was in the mM range. Results obtained using on-lineV before IR detection showed that the developed micromachined
R cell does not adversely affect the performance (i.e. peak shapes,
TCB Olefin copolymers [36]
enzene; EtOH: ethanol; MeOH: methanol; EGMBE: ethylene glycol monobutylether.
height and migration times) of the CE separation and thus allowstandem detection. Micellar electrokinetic chromatography (MEKC)was also successfully hyphenated with FTIR spectrometry for theseparation and on-line detection of five neutral analytes [42,43]
J. Kuligowski et al. / Analytica Chimica Acta 679 (2010) 31–42 35
F ow decF
(p2du1
soAeHuiaatepsftstfwsgdr
FE
ig. 2. Left: General schematic view of a CE–FTIR flow cell (with scaling altered to shapillaries, housed in its supporting block.igure from reference [40].
paracetamol, caffeine, p-nitro benzyl alcohol, m-nitrophenol and-nitrophenol). The background electrolyte consisted of 15 and0 mM phosphate buffer at pH 7, respectively, and 40 mM sodiumodecyl sulfate (SDS). Linear calibration graphs of concentrationsp to 10 mM were obtained showing limits of detection between.1 and 1.5 mM.
In the initial configuration, the connections between the fusedilica capillaries and the flow cells were made by small O-ringsf UV-curing epoxy adhesive on the cut ends of the capillaries.lthough this approach is suitable for aqueous measurements, thepoxy adhesive does not withstand non-aqueous solutions. So,insmann et al. [44] modified the initial design of the interfacesing the self-levelling silicon rubber SK43 to connect the capillar-
es to the flow cell. In this work, the authors reported the separationnd identification of two enantiomers upon complexation withchiral selector to form diasteroisomers with different IR spec-
ra thus enabling indirect detection using non-aqueous capillarylectrophoresis (NACE). In spite of the good results obtained, therocess of connecting the capillaries to the flow-cell was trouble-ome. The manual assembling of the capillary–cell interface causedrequent blockage of the flow cell channel by silicon squeezed fromhe connections. So, the use of commercially available O-rings wasuccessfully proposed by Kölhed et al. [45] as a better option forhe connection of the capillaries. Using this approach a methodor the quantification of natural sugars in orange fruits by CE–FTIRas developed. The CE separation was accomplished using 50 mM
odium carbonate buffer adjusted to pH 12.3 with NaOH as back-round electrolyte and galactose as internal standard. The limits ofetection for sucrose, glucose and fructose were in the milimolarange (0.7–1.9 mM). Despite of the manual injection, the repeatabil-
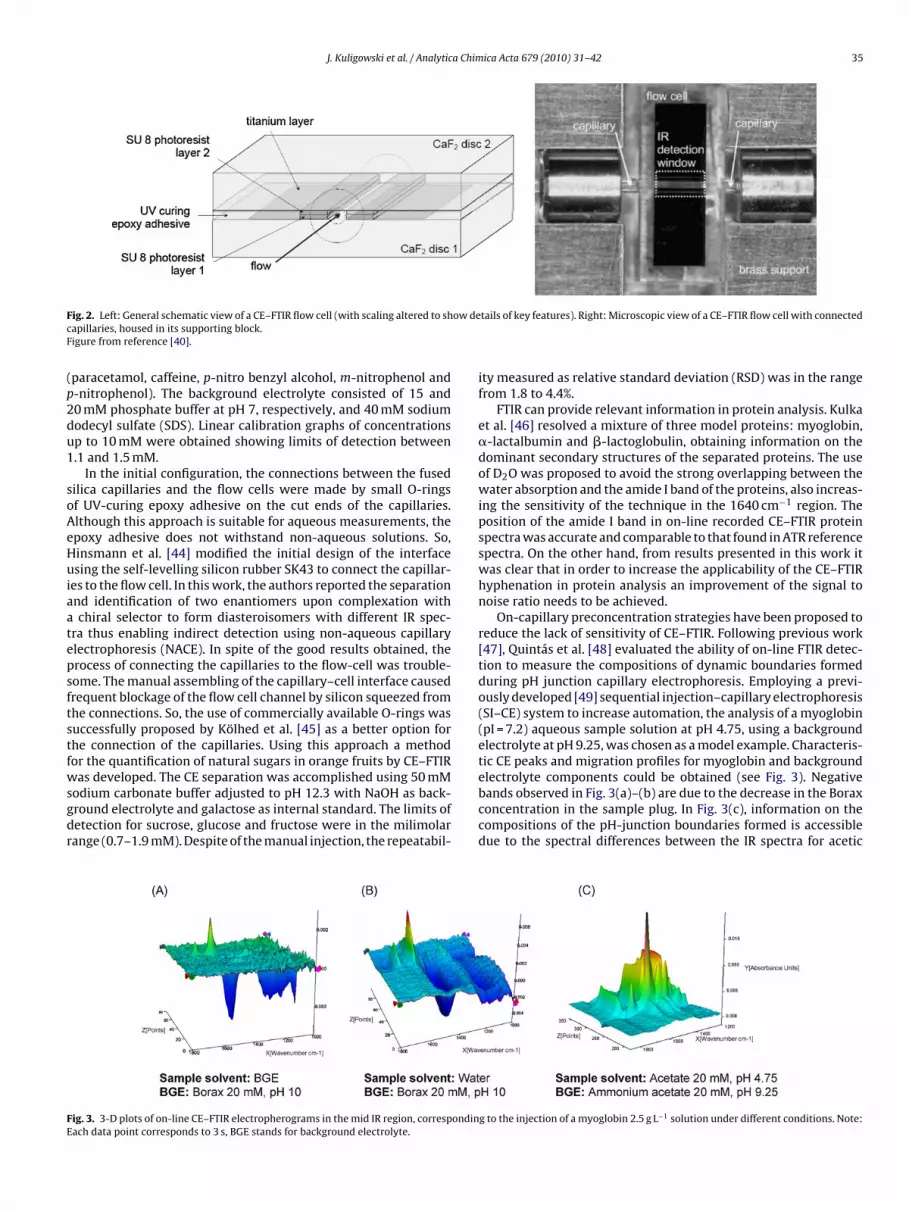
ig. 3. 3-D plots of on-line CE–FTIR electropherograms in the mid IR region, correspondinach data point corresponds to 3 s, BGE stands for background electrolyte.
tails of key features). Right: Microscopic view of a CE–FTIR flow cell with connected
ity measured as relative standard deviation (RSD) was in the rangefrom 1.8 to 4.4%.
FTIR can provide relevant information in protein analysis. Kulkaet al. [46] resolved a mixture of three model proteins: myoglobin,�-lactalbumin and �-lactoglobulin, obtaining information on thedominant secondary structures of the separated proteins. The useof D2O was proposed to avoid the strong overlapping between thewater absorption and the amide I band of the proteins, also increas-ing the sensitivity of the technique in the 1640 cm−1 region. Theposition of the amide I band in on-line recorded CE–FTIR proteinspectra was accurate and comparable to that found in ATR referencespectra. On the other hand, from results presented in this work itwas clear that in order to increase the applicability of the CE–FTIRhyphenation in protein analysis an improvement of the signal tonoise ratio needs to be achieved.
On-capillary preconcentration strategies have been proposed toreduce the lack of sensitivity of CE–FTIR. Following previous work[47], Quintás et al. [48] evaluated the ability of on-line FTIR detec-tion to measure the compositions of dynamic boundaries formedduring pH junction capillary electrophoresis. Employing a previ-ously developed [49] sequential injection–capillary electrophoresis(SI–CE) system to increase automation, the analysis of a myoglobin(pI = 7.2) aqueous sample solution at pH 4.75, using a backgroundelectrolyte at pH 9.25, was chosen as a model example. Characteris-tic CE peaks and migration profiles for myoglobin and backgroundelectrolyte components could be obtained (see Fig. 3). Negative
bands observed in Fig. 3(a)–(b) are due to the decrease in the Boraxconcentration in the sample plug. In Fig. 3(c), information on thecompositions of the pH-junction boundaries formed is accessibledue to the spectral differences between the IR spectra for aceticg to the injection of a myoglobin 2.5 g L−1 solution under different conditions. Note:

36 J. Kuligowski et al. / Analytica Chimica Acta 679 (2010) 31–42
Table 2Applications of isocratic on-line liquid chromatography–Fourier transform infrared (LC–FTIR), size exclusion chromatography–Fourier transform infrared (SEC–FTIR) andtwo dimensional liquid chromatography × gel permeation chromatography-Fourier transform infrared (2D-LC×SEC–FTIR) spectrometry.
Chromatografic mode Analytical column(s) Mobile phase system Application Reference
NP-LC 250 × 4.6, 5 �m, DuPont ZORBAX-Sil DCM:n-hexane, 35:65 (v/v), �-Cypermethrin diastereomers [51]THF:n-hexane, 2:98 (v/v)2-propanol:n-hexane, 0.1:99.9 (v/v)ACN–saturated n-hexane, 2.0 (v/v)
RP-LC 250 × 3.0, 5 �m, C18 ACN:H2O, 72:25 Peroxide-based explosives [52]RP-LC 250 × 2.0, 5 �m, C18 ACN:phosphate buffer (25 mM, pH
2,7), 3:97 (v/v)Glycolic acid in cosmetics [53]
SEC 300 × 7.6, 5 �m, 103 A, PLgel and300 × 7.6, 5 �m, 105 A, PLgel
DCM Polymer blends and copolymers [3]
SEC 250 × 7.5, 5 �m, PLgel (2 serialcolumns) and 150 × 6.0, HPS-gel
Chloroform Homopolymers and polymer blends [54]
SEC 300 × 7.5, 10 �m, PLgel (3 serialcolumns)
TCB Branched polyolefins [55]
SEC 150 × 19 and 300 × 19 DCM Lecithin and soybean oil [56,57]SEC 300 × 7.5 mm, 3 �m, 100 A, PLgel DCM Polymer triacylglycerides [58]SEC 300 × 7.5, 3 �m, PS-Gel CHCl3, CHCl3 mixed with 1.1, 2 and 3
(v/v) % EtOHPEG of different molar masses [59]
2D-LCxSEC 1D: 150 × 3.9, 4 �m, Silica 1D: from 90–10% n-heptane:DCM to93:7% DCM:MeOH
Styrene methylacrylate copolymers [60]
2D: 150 × 6.0, HPS-gel-RT 2D: chloroform2D-LCxSEC 1D: 150 × 3.2, 5 �m, Silica 1D: chloroform:diethylether, 98.5:1.5
(v/v)Degradation of [61]
orm
N chlor
aiptbio
ottPuTtmasrtws7nuttansTaincvtct
2D: 150 × 6.0, 3 �m, HSPgel-RT 2D: chlorof
otes: DCM:dichloromethane; THF: tetrahydrofurane; ACN: acetonitrile; TCB: tetra
cid and acetate as well as NH3 and the ammonium ion. Changesn the buffer composition could be monitored. Besides, the relativeosition of myoglobin within the sample plug and its migrationime could be discerned using characteristic protein absorptionands. Authors concluded that CE–FTIR can be considered a promis-
ng tool for gaining detailed insights into the working principles ofn-capillary preconcentration techniques.
The use of ATR–FTIR is another alternative configuration forn-line CE–FTIR. Publications appearing in literature focus onhe development of the technique and on the characteriza-ion of the performance of the presented interfaces. In 2004,atterson et al. proposed [50] the use of single-bounce atten-ated total internal reflectance (ATR) FTIR microspectroscopy.he end of the CE capillary was placed at 1 �m distance fromhe internal reflectance crystal at the focus of an ATR infrared
icroscope. By using this approach, the sensitivity was evalu-ted using pressure driven flow injection in 25 and 10 �m i.d.ilica capillaries. Upon injection of 820 pL of succinylcholine chlo-ide in a 10 �m i.d. capillary a limit of detection of 0.5 parts perhousand was found. Moreover, the usefulness of this approachas tested by performing sample separations using programmed
eries of pressure, voltage and again pressure on 25, 50 and5 �m i.d. capillaries. A series of CE separations of citrate anditrate, as well as succinylcholine chloride with sodium salicylatesing acetone as a neutral marker were presented. The advan-ages provided by this measurement technique highlighted byhe authors include: (i) minimization of post-column broadenings a result of a small detector volume; (ii) the ability to sig-al average spectra of the same aliquot, thereby improving theignal-to-noise ratio in stopped-flow; and (iii) simplicity of design.his approach was used more recently [51] for polymer medi-ted CE using poly(diallyldimethylammonium chloride) (PDDAC)n the BGE. Electrophoretic separations of benzenesulfonate, 1-aphthalenesulfonate and 1,5-naphthalenesulfonate using a BGE
ontaining NaCl and PDDAC were obtained with CE–ATR–FTIR pro-iding identification of the aforementioned compounds. Etching ofhe germanium internal reflectance element (IRE) by the appliedurrent is avoided by including a plastic mounting post for the IREo prevent current conduction through the IR instrument.Poly(bisphenol A)carbonate
obenzene; EtOH: ethanol; MeOH: methanol; NP: normal phase; RP: reverse phase.
2.2.2. On-line measurements in LC–FTIRThe most straightforward coupling approach for LC–FTIR is the
use of standard flow cells. In the last years a number of applicationshave been described focusing on on-line isocratic SEC (size exclu-sion chromatography) and LC–FTIR, without introducing significantinstrumental developments in this field. In general, the range ofapplications is limited to isocratic applications, summarized inTable 2 [4,52–62]. Comprehensive two-dimensional chromatogra-phy (LC × SEC)–FTIR was assessed by the functional-group analysisof a series of styrene-methylacrylate (SMA) copolymers with vary-ing styrene content [61] and by the study of chemical changes inpoly(bisphenol A)carbonate (PC) as a result of degradation [62].
The group of Lendl and co-workers [63] successfully inter-faced a capillary LC system with a FTIR spectrometer using amicromachined CaF2 transmission cell with an internal volumeof 7.5 nL and a dedicated beam condenser to focus the IR beamonto the measurement window of the flow cell. With this set-up,4-nitrophenol, 3-methyl-4-nitrophenol, 2,4-dinitro-phenol, and2-nitrophenol could be quantitatively analysed providing LODsbetween 35 and 94 ng on-column. Recovered spectra were of highquality (see Fig. 4) and could be successfully used for the identifica-tion of the analytes showing intense bands in the regions between1650 and 1450 cm−1 and between 1375 and 1200 cm−1 assigned tothe asymmetric and symmetric NO2 stretching vibrations, respec-tively, and in the region between 1177 and 865 cm−1 due to C–Nstretching frequencies of aromatic nitro-compounds and their cou-pling with other ring vibrational modes.
Also in on-line coupling of LC the use of ATR–FTIR is an alter-native detection approach that has been successfully employed.Louden et al. [64] applied a multiply-hyphenated detection sys-tem to the analysis of a mixture of nonsteroidal antiinflammatorydrugs separated by reversed-phase HPLC. In this set-up the ana-lytes were characterized by diode array UV, 1H nuclear magneticresonance, FTIR spectroscopy, and time-of-flight mass spectrom-
etry. Hyphenation was achieved using an ATR stainless steel flowcell with a ZnSe crystal and a volume of 400 �L. This combinationallowed an almost complete structural characterization. Louden etal. [65] applied the same set-up to the analysis of a partially purifiedplant extract in which 20-hydroxyecdysone and polypodine B were
J. Kuligowski et al. / Analytica Chimica Acta 679 (2010) 31–42 37
Fig. 4. Background corrected spectra of the analytes at their corresponding peak apex obtained from the injection of 1 �L of a standard solution containing 270 ng �L−1 of4-nitrophenol (A) and 230 ng �L−1 of 3-methyl-4-nitrophenol (B), 2,4-dinitro-phenol (C) and 2-nitrophenol (D). Reference spectra (blue lines) are included in the figure forcomparison. Note: The correlation coefficient between two spectra y1 and y2 is defined as the ratio from the covariance (Cov(y1, y2)) and the product of the two standardd ion coF
ip
oaeptrrt
pmiattatouo
3
tisas
eviations sy1 and sy2. According to this definition, a value of percentage of correlatigure from reference [62].
dentified despite incomplete chromatographic resolution and theresence of coeluting interferents.
Edelmann et al. [66] employed a diamond ATR flow cell forn-line FTIR detection in the analysis of organic acids, sugars andlcohols in red wines by HPLC. The chemical inertness of themployed diamond enabled the use of a strongly acidic mobilehase. Although the analyte peaks were not baseline resolved,he HPLC–FTIR data sets were analyzed using multivariate curveesolution–alternating least squares (MCR–ALS). Then a linearegression curve was calculated from peak areas measured fromhe MCR-resolved elution profiles.
The use of single reflection ATR infrared microspectroscopy wasresented by Patterson et al. [67]. They placed a hemispherical ger-anium internal reflection element, which only permits a single
nternal reflection, at the end of a capillary HPLC column focusingn FTIR microscope on this spot and achieving injection mass detec-ion limits in the low microgram range. Despite of the potential ofhis approach and in order to improve the analytical features, theuthors also proposed a series of modifications such as: (i) reducinghe diameter of the column to half the diffraction-limited diameterf the infrared beam at the IRE/solution interface; (ii) adapting these of a single bounce ATR to the LC system; (iii) reducing the sizef the IR detector and (iv) applying a selective film on the IRE.
. Instrumental improvements affecting the sensitivity
An important drawback of IR detection in liquid phase separa-
ion systems is the low sensitivity. Therefore different efforts for itsmprovement have been made in the last decade. On the one handide, sensitivity can be improved using more intense light sourcesugmenting the signal to noise ratio, whereas on the other handide miniaturization has shown to have a big impact in LC–IR.efficient of 100 indicates identical spectra.
3.1. Mid-IR quantum cascade lasers (QCLs) as light sources inliquid phase separation systems
There has been a big progress in the development of mid-infrared light sources in the last years since the initial developmentof a working quantum cascade laser by Faist et al. [68] in 1994. QCLswith high output power have become commercially available andfound application in analytical procedures and devices [69]. Minia-turized, broadly tuneable external cavity-QCLs (EC-QCLs) operatingas high power mid-IR sources at room temperature are availablewith center wavelengths spanning the mid-IR spectrum from 2500to 830 cm−1 and providing tuning of up to 275 cm−1 [70].
Although QCLs were initially used in analytical chemistry aspowerful light sources for trace gas analysis, their potential util-ity for the analysis in the condensed phase was soon demonstratedby Lendl et al. [71]. In this initial work using a Fabry–Perot (FP)QCL in an aqueous flow analysis system, the authors showed thatthis arrangement could yield signal to noise ratios up to 50-timeshigher than those provided by FTIR instruments equipped with aglobar IR source and a MCT detector. For this reason, the use of QCLsas tuneable mid-IR sources in liquid flow separation systems is alsoa promising tool.
Kölhed et al. [72] investigated the potential applicability of QCLsfor on-line detection in CE and reported in 2005 the first successfulhyphenation of a FP QCL to CE. The use of a QCL with an emissionmaximum at 1080 cm−1 permitted specific functional group detec-tion and the use of a transmission flow cell with a pathlength of60 �m.
−1
A QCL emitting at 1067 cm for specific detection in isocraticon-line LC–IR was reported for the first time by Edelmann et al.[73] using a custom-made flow cell. The flow cell design includedtwo diamond windows with adjustable spacing and two hollowwaveguides to direct the IR radiation. Using an ion exchange resin
38 J. Kuligowski et al. / Analytica Chim
0 2 4 6 8 10 12 14 16 18 20
0
5
10
15
20
x 10-3
Time [min]
Ab
so
rba
nc
e [
AU
]
QCL 1080 cm-1
QCL 1393 cm-1 5
4
3
2
1
6
7
8
Faa
caapt
Qttltam
3
iircptiaecItlit[
rccan2tc
composition that can be caused by instrumental modifications of
ig. 5. Chromatogram of a standard mixture containing 5 g l−1 of each analytecquired with the on-line dual QCL set-up; (1) citric acid, (2) glucose, (3) tartariccid, (4) malic acid, (5) fructose, (6) acetic acid, (7) glycerol, (8) ethanol.
olumn with Ca2+ as counter ion and a solution of 0.04% of formiccid as mobile phase, the detection of carbohydrates and organiccids present in wine samples was achieved. The use of the QCLermitted an increase of the optical pathlength from 25 to 125 �m,hus increasing the sensitivity of the IR detection.
Following this previous work, Kuligowski et al. [74] used twoCLs for on-line detection in LC. The optical set-up was based on
hree gold mirrors and a ZnSe beam splitter that were used to directhe emitted laser light through a liquid flow cell with an optical pathength of 52 �m onto a MCT detector. The system was employed forhe analysis of carbohydrates, alcohols and organic acids in winend grape juices. A chromatogram of the separation of a standardixture is shown in Fig. 5.
.2. Advantages of miniaturization in terms of sensitivity in LC–IR
Radial dispersion causes the distribution of the sample afterts injection over the entire cross-section of the column. Reduc-ng the internal diameter (ID) of the column, the dilution is loweresulting in an increased sensitivity of detection, because the con-entration of the sample at the end of the column is inverselyroportional to the square of the column diameter. Accordingo this down-scaling factor, theoretically a maximum 235-foldncrease in sensitivity can be achieved by replacing a 4.6 mm IDnalytical column with a 300 �m ID capillary column. It has to bemphasized, that this gain in sensitivity can only be achieved inase the same amount of sample is injected onto both columns.n practice this is not possible as the maximum allowable injec-ion volume decreases with the column ID. Hence, normallyower gains in concentration sensitivity are obtained because thencrease in the chromatographic peak concentration can be par-ially or fully compensated by the reduction of the injection volume75].
The low flow rates typically used in capillary LC (1–20 �L min−1)equire appropriate adaptations of the detection system. Con-erning on-line IR measurements, the use of low-volume flowells becomes necessary reducing post-column dead volumes tovoid peak broadening and thus decrease sensitivity. Adequate
L-volume flow cells for this purpose were already developed in002 by Köhled et al. [41] and used to hyphenate capillary elec-rophoresis with FTIR spectrometry. Using a micromachined flowell with a path length of 25 �m and a volume of 7.5 nL, four modelica Acta 679 (2010) 31–42
compounds could be separated and identified using an ACN:H2Ogradient with LODs in the concentration range of 35–94 ng �L−1
[63]. This corresponds to 35–94 ng of analyte on-column, consider-ing the injection volume of 1 �L. The method showed linear resultsin the whole tested concentration range up to values between 350and 890 ng �L−1 for the four analytes. Relative standard deviationsranged between 4.6 and 6.8% and were obtained from five indepen-dent injections of each analyte at the concentration established asthe LOD. As LODs differ from analyte to analyte, an exact compari-son of the obtained mass sensitivities to results found in literatureis impossible. Typically, limits of detection obtained using micro-machined nL-IR flow cells in capillary LC are in the range of 50 ng oncolumn, whereas using conventional flow cells and reversed phasechromatographic systems, LODs were found to be in the low �grange or higher [53,54].
A different approach for IR detection in capHPLC-IR was demon-strated recently using off-line detection [40]. Due to the low flowrates of the capHPLC system, with a microdispenser the effluentof the capHPLC was deposited onto a CaF2 window without priorsplitting of the flow, transferring the whole amount of analytesonto the window. IR spectra of the deposited traces were recordedusing an IR microscope leading to limits of identification (LOI) ofbelow 2 ng �L−1, corresponding to 2 ng on-column considering theinjection volume of 1 �L. The RSD was obtained from eight indepen-dent injections of the four considered analytes at a concentrationof 7.5 ng �L−1 and ranged between 8.7 and 11.9%. The method gavelinear results over the whole tested concentration range from 2 to70 ng �L−1. As the number of publications on quantitative deter-minations using off-line IR detection in reversed phase HPLC islow, a comparison to results achieved with standard HPLC sys-tems is difficult. However, Somsen et al. [76] determined a limitof identification for herbicides of 200 ng on-column using a pre-concentration step and a subsequent separation on a 2.1 mm IDC18 column.
In summary, using state-of-the-art off-line detection, limits ofdetection/identification can be improved of a factor of about 25in comparison to the on-line approach. In addition, the full ana-lyte spectrum is accessible and therefore spectral libraries canbe used for analyte identification. On the other hand, up to nowonly semi-quantitative results could be achieved. In contrast, usingthe on-line approach quantitative results can be achieved evenclose to the limit of detection. Other advantages of the on-lineapproach are its simplicity as the flow cells are easy to han-dle, the on-the-fly-acquisition of the IR trace, the compatibilitywith the use of non-volatile buffers and the possibility of a fur-ther hyphenation to other detectors. Both detection systems showlimitations and characteristics specific for each approach and there-fore for every application the most adequate technique has to bechosen.
4. Chemometric approaches in the analysis of on-lineobtained data
The two main challenges faced by the on-line CE and LC–FTIRare: (i) the increase of the resolution of coeluting or comigratinganalytes and (ii) an accurate background correction.
In the case of full-spectrum recording, post-run chemometrictreatment of chromatographic data sets presents a powerful solu-tion for resolving overlapping or co-eluting peaks mathematically,thus improving separation selectivity. On the other hand, accuratebackground correction is required due to changes in the eluent
the delivered mobile phase composition or by a reduction in theeluent spectral contribution during analyte elution. In the case ofon-line CE–FTIR changes in the composition of the backgroundelectrolyte during analyte migration might be due to a variety of

a Chimica Acta 679 (2010) 31–42 39
eb
4
hbas
pStarc(st
s‘pgpoodmtat
ritamad
0 5 10 15 20 25
-0.05
0
0.05
0.1
0.15
0.2
0.25
0.3
0.35
0.4
0.45
Time [min]
Inte
ns
ity
[a
.u.]
Situation A
Situation B
1
2
3
4
Fig. 6. 2,4-Dinitrophenol ‘analyte-specific’ chromatograms extracted using a set ofspectra measured during the re-equilibration of the LC system after a gradient injec-
Fu
J. Kuligowski et al. / Analytic
ffects such as stacking, sweeping or due to the presence of movingoundaries during pH junction, among others.
.1. Enhancing resolution efficiency
Edelmann et al. [66] analysed organic acids, sugars and alco-ols in red wines by on-line LC–ATR–FTIR. Despite of the fact thataseline separation was not achieved for all analytes, quantitativenalysis of all poorly separated target analytes could be carried outuccessfully using MCR–ALS in post-run data analysis.
Boelens et al. [77] developed a method to facilitate the com-arison of complex spectral data sets using simulated data andEC–IR data as an example. The proposed procedure characterizeshe spectra of the reference set by a component model in a first stepnd uses asymmetric least squares (ASLS) to find differences withespect to this component model in a second step. The new pro-edure was compared to the conventional ordinary least squaresOLS) approach. It could be concluded that band positions and bandhapes of new spectral features are better retrieved with the ASLShan with the OLS method.
Kuligowski et al. [78] employed a multivariate method, calledcience based calibration (SBC) [79–81], for the extraction ofanalyte-specific’ chromatograms in on-line gradient reversedhase HPLC–FTIR in the presence of a high spectral and chromato-raphic overlapping between the analytes of interest, the mobilehase components and co-eluting sample constituents. Data wasbtained during the injection of a series of standard solutionsf four nitrophenols (p-nitrophenol, 3-methyl-4-nitrophenol, 2,4-initrophenol and 4-nitrophenol) in a reversed phase system, usingobile phase gradients between (35:65) and (85:15) (v/v) acetoni-
rile:water. Applying SBC, specificity of response could be obtainednd the very intense contribution of the changing eluent composi-ion to the absorption could be compensated (see Fig. 6).
Kuligowski et al. [59] also proposed the use of the SBC algo-ithm to improve the sensitivity in GPC–FTIR applications. Resultsncluded in a preliminary study focusing on the determination of
he total polymer triacylglyceride content in deep-fried oils showedsignificant reduction in the noise levels of the extracted chro-atograms using the SBC approach in comparison to the ‘classical’pproach based on the measurement of spectral area values in aefined range over time (Fig. 7).
ig. 7. Spectra obtained during the injection of a standard mixture of fructose, glucose, sucsing the UBC–RSM method.
tion (A) and spectra measured during the injection of a ‘blank sample’ (B), for thecalculation of the covariance matrix of the spectral noise within the SBC approach.Note: (1) p-nitrophenol, (2) 3-methyl-4-nitrophenol, (3) 2,4-dinitrophenol and (4)4-nitrophenol.
4.2. Background correction
The development of procedures for an accurate backgroundcorrection is of importance for a further extension of the use ofon-line LC–IR using the flow-through approach. To overcome sol-vent interferences much work has already been done focusing onthe application of chemometrics.
In 2004, Boelens et al. [82,83] developed a new method tocorrect the background absorption, taking into account eluentspectral shape and intensity variations during analyte elution inon-line LC–FTIR. In this two-step method first, the baseline spectrawere modelled using a limited number of principal components
and subsequently, an asymmetric least squares (asLS) regressionmethod is applied using these principal components to correct thebackground contribution of the measured spectra during elution.Although the method is proposed for infrared detection, only LC-Raman and LC-DAD data have been analysed so far.rose and maltose in the wavenumber range between 1500 and 1000 cm−1 corrected

4 a Chim
avssmwg(
t(BrPh(eotbps(toscccmeb
Lrpetoatccatrps
sdt2g
Koim
mstci
0 J. Kuligowski et al. / Analytic
Kuligowski et al. [84] used spectra measured in the region beforend after chromatographic peak clusters as knots to model theariation of the eluent absorption intensity with time using cubicmoothing splines (CSS) functions. This approach was tested onimulated and real data sets obtained from injections of standardixtures of polyethylene glycols with four different moleculareights in methanol:water, 2-propanol:water and ethanol:water
radients ranging from 30 to 90, from 10 to 25 and from 10 to 40%v/v) of organic modifier, respectively.
The capabilities of some chemometric algorithms using itera-ively applied multi-way methods such as parallel factor analysisPARAFAC) and PARAFAC2 were evaluated by István et al. [85].ackground corrections carried out on simulated on-line LC–FTIRuns showed that although PARAFAC2 performs better thanARAFAC, it does not give correct decompositions. On the otherand, multivariate curve resolution with alternative least squaresMCR–ALS) did not provide accurate results. Despite that, consid-ring the number of strategies already published based on the usef MCR–ALS to perform background correction in hyphenated sys-ems, it seems that the observed inaccuracy was strongly influencedy the use of the closure constraint. In this work, István et al. pro-osed the use of a new method named objective subtraction ofolvent spectrum with iterative use of PARAFAC and PARAFAC2OSSS–IU–PARAFAC and OSSS–IU–PARAFAC2). The main assump-ions and restrictions that define the conditions of applicabilityf this method are: (i) the eluent composition should be con-tant during the experiments, limiting its applicability to isocraticonditions; (ii) interactions between the eluent and the sampleomponents should not modify the eluent spectrum; (iii) partialoelution of analytes resulting in a modification of their spectraay be manifested as a new component in the mixture and (iv) the
lution profiles of any given component should remain constantetween the different LC runs.
An alternative strategy for spectral eluent subtraction in on-lineC–FTIR was reported [86] in which data obtained from the LC–FTIRun is viewed as a ‘sample matrix’ (SM) formed by a series of inde-endent IR spectra of an unknown number of components (i.e.luting analytes) in an eluent with an unknown composition. Addi-ionally to the SM, a ‘reference spectra matrix’ (RSM) that consistsf a set of spectra of different mobile phase compositions withincertain range is acquired during a blank gradient run or during
he re-equilibration of the chromatographic system. An identifi-ation parameter (IP) that is characteristic of the mobile phaseomposition is calculated for each spectrum included in the SMnd the RSM. Then, for each spectrum included in the SM, the spec-rum with the closest IP value included in the RSM is selected aseference. In the following step background correction is accom-lished by subtracting the selected RSM spectrum from the SMpectrum.
The usefulness of the IP depends on its ability of the selectedtatistic to discriminate subtle differences in similar spectra and soifferent IPs have been investigated. Quintás et al. [85] employedhe quotient absorbance ratio (AR) between the absorbance at256 cm−1 and 2249 cm−1 as an IP to correct an acetonitrile:waterradient ranging between 40 and 99% (v/v) acetonitrile.
The same background correction approach was proposed byuligowski et al. [87] to improve the accuracy of the determinationf the critical chromatographic conditions of polyethylene glycoln a methanol:water gradient ranging between 5 and 100% (v/v)
ethanol using LC–FTIR.Four selected carbohydrates (fructose, glucose, sucrose and
altose) were successfully resolved and quantified in beverageamples using a linear gradient from 75 to 55% ((v/v)) acetoni-rile in water in 15 min [88]. The LC–FTIR system included a flowell with CaF2 and ZnSe windows and a pathlength of 10 �mnstalled on a FTIR spectrometer equipped with a MCT detector
ica Acta 679 (2010) 31–42
and provided an acquisition frequency of 15 spectra min−1. Limitsof detection in the order of 0.75 mg ml−1 with relative standarddeviation values ranging from 3.3 to 4.1% for glucose and fruc-tose, respectively, at a concentration level of 3.0 mg ml−1 wereachieved.
Quintás et al. [63] applied the relative absorbance value (RW)defined as the difference in absorbance at two selected wavenum-bers (2256 cm−1 and 2260 cm−1) as IP for measurements obtainedusing the capillary LC–FTIR set-up described before. Linear acetoni-trile:water (0.05% TFA) gradients were run from 50 to 65% (v/v)acetonitrile in 15 min for the separation of standard solutions offour nitrophenols. Highly characteristic analyte spectra could beobtained as indicated by correlation coefficients between 89 and95.8% between recovered LC–FTIR spectra and reference spectra ofstandard solutions.
Kuligowski et al. [89] evaluated the performance of the corre-lation coefficient on mean centered absorbances (COR) as IP. Usinga point-to-point matching method, this IP compares characteris-tic absorption bands of the eluent during the chromatographicrun with those of the RSM spectra. Similarity methods based onpoint-to-point matching are methods in which equal-length vec-tors describing two spectra are compared point by point, and asingle statistic is obtained [90]. The approach was tested on dataacquired during the separation of four nitrophenols running ace-tonitrile (0.08% (v/v) TFA):water (0.08% (v/v) TFA) gradients withcompositions ranging from 35 to 85% (v/v) acetonitrile.
The absorbance of the mobile phase at a wavenumber character-istic of its composition calculated using partial least squares (PLS)regression, was also proposed as IP [91]. The RSM was obtainedfrom the measurement of a linear acetonitrile:water gradient withacetonitrile concentrations between 40 and 100% (v/v). A PLS modelemploying the spectral interval between 2340 and 2140 cm−1 andthe absorbance at 1640 cm−1 as response was used. Results evi-denced that multivariate methods can be useful in situations wherethe selection of univariate IPs is challenging.
Background correction approaches based on the use of RSMspresents a series of conditions of applicability: (i) a high instru-ment stability is required; (ii) RSM and SM have to be measuredappropriately, and (iii) the mobile phase spectra have to presenta spectral region that is characteristic of its composition and freefrom spectral interferences from other eluting compounds.
The main limitation of the RSM approach is that the numberof spectra included in the RSM, as well as the gradient range andsteepness, have a direct impact on the accuracy of the backgroundcorrection, because the composition of each selected ‘referencespectrum’ must match the composition of the corresponding ‘sam-ple spectrum’ as accurately as possible. A bigger RSM implies moreaccurate results, but at the same time longer acquisition timesdiminishing the sample throughput and higher instrument sta-bility. For the purpose of reducing the importance of the size ofthe RSM, an alternative approach named Polyfit-RSM, was pro-posed [92]. It is assumed that during a chromatographic gradientthe absorbance of the eluent at each wavenumber is dependenton its composition, and therefore a polynomial regression curveof degree ni, can be established between the absorbance valuesyj and a series of reference values (i.e. IPs) (xi) which are equallydependent on the mobile phase composition. In this method, amodel composed of as many polynomial functions as consid-ered wavenumbers is established. This model can be subsequentlyused to predict and correct the eluent spectral contribution tothe observed spectra during a gradient elution, using their cor-
responding reference (xi) values. Polyfit-RSM was tested on realreversed-phase on-line LC–FTIR data sets employing a mobile phasesystem composed by acetonitrile and water obtaining backgroundcorrection accuracy comparable to that provided by PLS-RSM andAR-RSM.
a Chim
5
oowtldoaIm
ototmo
dfLp
cPbLshthlam
ttraitatdotmFchis
gd
A
rJV
[[[[[[[
[[[[[
[
[[
[[
[
[[
[[[
[
[
[
[
[
[
[
[
[
[
[
[
[[[[
[[[[
J. Kuligowski et al. / Analytic
. Conclusions
Throughout this review, significant progress in the hyphenationf CE and LC to IR spectrometry has been presented. In general,n-line coupling of LC–IR is achieved by using simple flow cellsith CaF2, KBr or BaF2 windows. Recently, micromachined CaF2
ransmission cells have been used for the CE–IR and LC–IR on-ine coupling. Alternatively, ATR elements or ATR-flow cells withiamond or germanium crystals are applied for the detection inn-line CE–IR and LC–IR. Off-line detection is, in both techniques,chieved by solvent elimination, depositing solid residues on anR transparent material and analyzing them, mostly with a FTIR
icroscope.Recent instrumental developments in CE–FTIR hyphenation
ffer the possibility for further on-line use of other types of detec-ors as well as new research opportunities in a variety of domainsf application from the analysis and characterization of polymers,o biochemical applications such as protein analysis. The afore-
entioned studies also offer many possibilities in the field ofn-capillary pre-concentration processes in CE.
The scope of FTIR detection in LC has been expanded with theevelopment of chemometric methods and solvent removal inter-aces that permit its hyphenated use in both isocratic and gradientC. Off-line LC–IR applications are centered mainly in the field ofolymer analysis.
In order to overcome background absorption in on-line LC–IRhemometric algorithms based on asymmetric least squares,ARAFAC, PARAFAC2, MCR–ALS and RSM-based approaches haveeen applied, expanding the field of applications of gradientC–IR. Although chemometric background correction demon-trated to have great potential, in the future user interactionas to be minimized to achieve a higher grade of automa-ion. Aside from background correction, chemometric algorithmsave also been applied to enhance the chromatographic reso-
ution and to compare complex data sets. Especially the SBClgorithm showed great potential to obtain analyte specific chro-atograms.Concerning technical improvements, the development of quan-
um cascade laser technology has provided valuable tools fittinghe current demands of on-line liquid flow systems. The incorpo-ation of these new infrared light sources to state-of-the-art CEnd LC–FTIR set-ups, together with highly sensitive detectors work-ng at room temperature, will play an important role in improvinghe sensitivity of IR detection in separation systems. Furthermore,
reduced system size, weight and power consumption of thisype of mid-IR sources provide a clear advantage for scaling downedicated on-line IR detection systems enabling the developmentf new applications, although QCLs are still expensive and areherefore applied infrequently. Technical advances have also been
ade regarding flow cell design for on-line LC–IR hyphenation.low cells with small volumes have demonstrated to improve thehromatographic resolution in LC–IR hyphenation. In the off-lineyphenation of LC–IR technical progress has been made concern-
ng the interface: using a microdispenser, LODs could be improvedubstantially.
It can be concluded that mathematical and technical advancesive rise to exciting new possibilities for the use of vibrationaletection systems in LC and CE.
cknowledgements
BL acknowledges financial support received from the Austrianesearch agency FFG, within the program Research Studios Austria.K acknowledges the “V Segles” grant provided by the University ofalencia to carry out this study.
[
[
[
ica Acta 679 (2010) 31–42 41
References
[1] S. Armenta, S. Garrigues, M. de la Guardia, Trends Anal. Chem. 26 (8) (2007)775.
[2] M. Gallignani, M.R. Brunetto, Talanta 64 (5) (2004) 1127.[3] A.J. Hobro, B. Lendl, in: S. Schluecker (Ed.), Surface Enhanced Raman Spec-
troscopy – Analytical, Biophysical and Life Science Applications, Wiley–VCH,2010, pp. 155–169.
[4] S.J. Kok, C.A. Wold, Th. Hankemeier, P.J. Schoenmakers, J. Chromatogr. A 1017(2003) 83.
[5] J. Kuligowski, G. Quintás, S. Garrigues, B. Lendl, M. de la Guardia, TrAC TrendsAnal. Chem. 29 (2010) 544–552.
[6] C. Fujimoto, K. Jinno, Trends Anal. Chem. 8 (3) (1989) 90.[7] G.W. Somsen, C. Gooijer, U.A.Th. Brinkman, J. Chromatogr. A 856 (1999) 213.[8] R. Schindler, B. Lendl, Anal. Commun. 36 (36) (1999) 123.[9] M. Kölhed, B. Karlberg, B. Lendl, Analyst 128 (2003) 2–6.10] J.L. Jarman, R.A. Todebush, J.A. de Haseth, J. Chromatogr. A 976 (2002) 19.11] R.A. Todebush, L.T. He, J.A. de Haseth, Anal. Chem. 75 (2003) 1393.12] M.A. Mottaleb, Microchim. Acta 132 (1999) 31.13] M.A. Mottaleb, Anal. Sci. 15 (1999) 1137.14] M.A. Mottaleb, Anal. Sci. 15 (1999) 57.15] J.C. Jones, D. Littlejohn, P.R. Griffiths, App. Spectrosc. 53 (7) (1999) 792.16] I. Bruheim, P. Molander, E. Lundanes, T. Greibrokk, E. Ommundsen, J. High Resol.
Chromatogr. 23 (9) (2000) 525.17] M.A. Mottaleb, D. Littlejohn, Anal. Sci. 17 (2001) 429.18] K. Torabi, A. Karami, S.T. Balke, T.C. Schunk, J. Chromatogr. A 910 (2001) 19.19] J. Geiger, E.-H. Korte, W. Schrader, J. Chromatogr. A 922 (2001) 99.20] J.M. Treubig Jr., P.R. Brown, J. Chromatogr. A 960 (2002) 135.21] C.S. Robb, S.E. Geldart, J.A. Seelenbinder, P.R. Brown, J. Spectrosc. Chromatogr.
Rel. Technol. 25 (5) (2002) 787.22] S.J. Kok, N.C. Arentsen, P.J.C.H. Cools, Th. Hankemeier, P.J. Schoenmakers, J.
Chromatogr. A 948 (2002) 257.23] Y. Li, P.R. Brown, J. Liq. Chromatogr. Rel. Technol. 26 (11) (2003) 1769.24] S.W. Huffman, K. Lukasiewicz, S. Geldart, S. Elliott, J.F. Sperry, Ch.W. Brown,
Anal. Chem. 75 (2003) 4606.25] H. Pasch, A. Siewing, L.-Ch. Heinz, Macromol. Mater. Eng. 288 (2003) 771.26] A.J.P. Van Zyl, S.M. Graef, R.D. Sanderson, B. Klumperman, H. Pasch, J. App.
Polym. Sci. 88 (2003) 2539.27] L.-Ch. Heinz, S. Graef, T. Macko, R. Brüll, S. Balk, H. Keul, H. Pasch, e-Polymers
54 (2005).28] I.G. Romero, H. Pasch, e-Polymers 42 (2005).29] N. Fukutsu, T. Kawasaki, K. Saito, H. Nakazawa, J. Chromatogr. A 1129 (2006)
153.30] A. Albrecht, L.-Ch. Heinz, D. Lilge, H. Pasch, Macromol. Symp. 257 (2007) 46.31] A. Albrecht, R. Brüll, T. Macko, H. Pasch, Macromolecules 40 (2007) 5545.32] T. Macko, U. Schulze, R. Brüll, A. Albrecht, H. Pasch, T. Fónagy, L. Häussler, B.
Iván, Macromol. Chem. Phys. 209 (2008) 404.33] W.W. Carson, J.L. Dwyer, B. Boumajny, Int. J. Polymer Anal. Charact. 13 (2008)
463.34] T. Murakami, H. Konno, N. Fukutsu, M. Onodera, T. Kawasaki, F. Kusu, J. Pharm.
L. Biomed. Anal. 47 (2008) 553.35] A. Albrecht, R. Brüll, T. Macko, P. Sinha, H. Pasch, Macromol. Chem. Phys. 209
(2008) 1909.36] A. Albrecht, R. Brüll, T. Macko, F. Malz, H. Pasch, Macromol. Chem. Phys. 210
(2009) 1319.37] H. Pasch, A. Albrecht, R. Bruell, T. Macko, W. Hiller, Macromol. Symp. 282 (2009)
71.38] M. Haberkorn, J. Frank, M. Harasek, J. Nilsson, T. Laurell, B. Lendl, Appl. Spec-
trosc. 56 (2002) 902.39] I. Surowiec, J.R. Baena, J. Frank, T. Laurell, J. Nilsson, M. Trojanowicz, B. Lendl, J.
Chromatogr. A. 1080 (2005) 132–139.40] S. Armenta, B. Lendl, Anal. Bioanal. Chem. (2010), doi:10.1007/s00216-010-
3590-2.41] M. Kölhed, P. Hinsmann, P. Svasek, J. Frank, B. Karlberg, B. Lendl, Anal. Chem.
74 (2002) 3843.42] M. Kölhed, P. Hinsmann, B. Lendl, B. Karlberg, Electrophoresis 24 (4) (2003)
687.43] P. Svasek, E. Svasek, B. Lendl, M. Vellekoop, Sens. Actuators A 115 (2004)
591–599.44] P. Hinsmann, L. Arce, P. Svasek, M. Laemmerhofer, B. Lendl, Appl. Spectrosc. 58
(6) (2004) 662.45] M. Köhled, B. Karlberg, Analyst 130 (5) (2005) 772.46] S. Kulka, G. Quintás, B. Lendl, Vib. Spectrosc. 42 (2) (2006) 392.47] C.A. Nesbitt, J.T.-M. Lo, K.K.C. Yeung, J. Chromatogr. A 1073 (2005) 175.48] G. Quintás, E. Núnez, M. Vellekoop, B. Lendl, Anal. Bioanal. Chem. 387 (2007)
287.49] S. Kulka, G. Quintás, B. Lendl, Analyst 131 (2006) 739.50] B.M. Patterson, N.D. Danielson, A.J. Sommer, Anal. Chem. 76 (2004) 3826.51] B.M. Patterson, N.D. Danielson, A.J. Sommer, Anal. Chim. Acta 583 (2007) 231.52] K. István, G. Keresztury, J. Fekete, J. Liquid Chromatogr. Rel. Technol. 28 (2005)
407.53] R. Schulte-Ladbeck, A. Edelmann, G. Quintás, B. Lendl, U. Karst, Anal. Chem. 78
(2006) 8150.54] J. Kuligowski, A. Breivogel, G. Quintás, S. Garrigues, M. de la Guardia, Anal.
Bioanal. Chem. 392 (2008) 1383.55] H.F.M. Boelens, P.H.C. Eilers, Th. Hankemeier, Anal. Chem. 77 (77) (2005) 7998.

4 a Chim
[[
[[
[
[[[[[
[
[[
[[[
[
[
[[
[
[[[[[[
[
[
[[
[
2 J. Kuligowski et al. / Analytic
56] K. Tribe, G. Saunders, R. Meissner, Macromol. Symp. 236 (2006) 228.57] J. Kuligowski, G. Quintás, F.A. Esteve Turillas, S. Garrigues, M. de la Guardia, J.
Chromatogr. A 1185 (2008) 71.58] J. Kuligowski, G. Quintás, S. Garrigues, M. de la Guardia, Talanta 77 (2008) 229.59] J. Kuligowski, G. Quintás, S. Garrigues, M. de la Guardia, Chromatographia 71
(3/4) (2010) 201.60] M. Malanin, K.-J. Eichhorn, A. Lederer, P. Treppe, G. Adam, D. Fischer, D. Voigt,
J. Chromatogr. A (2009) 8939.61] S.J. Kok, Th. Hankemeier, P.J. Schoenmakers, J. Chromatogr. A 1098 (2005) 104.62] L. Coulier, E. Kaal, T. Hankemeier, J. Chromatogr. A 1130 (2006) 34.63] G. Quintás, J. Kuligowski, B. Lendl, Anal. Chem. 81 (2009) 3746.64] D. Louden, A. Handley, Anal. Chem. 72 (2000) 3922.65] D. Louden, A. Handley, S. Taylor, E. Lenz, S. Miller, I.D. Wilson, A. Sage, R. Lafont,
J. Chromatogr. A 910 (2001) 237.66] A. Edelmann, J. Diewok, J. Rodríguez-Baena, B. Lendl, Anal. Bioanal. Chem. 376
(2003) 92.67] B.M. Patterson, N.D. Danielson, A.J. Sommer, Anal. Chem. 75 (6) (2003) 1418.68] J. Faist, F. Capasso, D.I. Sivco, C. Sirtori, A.L. Hutchinson, A.Y. Cho, Science 264
(1994) 553.69] QuantaRed Technologies (Vienna, Austria), http://www.quantared.com.70] Daylight Solutions, http://www.daylightsolutions.com/.
71] B. Lendl, J. Frank, R. Schindler, A. Muller, M. Beck, J. Faist. Anal. Chem. 72 (2000)1645.72] M. Kölhed, S. Schaden, B. Karlberg, B. Lendl, J. Chromatogr. A 1083 (1–2) (2005)
199.73] A. Edelmann, C. Ruzicka, J. Frank, B. Lendl, W. Schrenk, E. Gornik, G. Strasser, J.
Chromatogr. A 934 (2001) 123.
[[[[[
ica Acta 679 (2010) 31–42
74] J. Kuligowski, G. Quintás, B. Lendl, Appl. Phys. B-Lasers O. 99 (2010) 833–840.75] M. Kranendijk, J.C.M. Waterval, G.W. Somsen, G.J. Jong, J. Sep. Sci. 28 (2005)
1796–1802.76] G.W. Somsen, I. Jagt, C. Gooijer, N.H. Velthorst, U.A.Th. Brinkman, T. Visser, J.
Chromatogr. A 756 (1996) 145–157.77] H.F.M. Boelens, P.H.C. Eilers, Th. Hankemeier, Anal. Chem. 77 (2005) 7998.78] J. Kuligowski, G. Quintás, S. Garrigues, M. de la Guardia, J. Sep. Sci. 32 (2009) 1.79] R. Marbach, J. Biomed. Optics 7 (2002) 130.80] R. Marbach, J. Near Infrared Spectrosc. 13 (2005) 241.81] R. Marbach, U.S. Patent Num. 6,629,041 B1. (30 Sept. 2003).82] H.F.M. Boelens, R.J. Dijkstra, P.H.C. Eilers, F. Fitzpatrick, J.A. Westerhuis, J. Chro-
matogr. A 1057 (2004) 21.83] R.J. Dijkstra, H.F.M. Boelens, J.A. Westerhuis, F. Ariese, U.A.Th. Brinkman, C.
Gooijer, Anal. Chim. Acta 519 (2004) 129.84] J. Kuligowski, D. Carrión, G. Quintás, S. Garrigues, M. de la Guardia, J. Chro-
matogr. A (2010), doi:10.1016/j.chroma.2010.05.033.85] K. István, R. Rajkó, G. Keresztury, J. Chromatogr. A 1104 (2006) 154.86] G. Quintás, B. Lendl, S. Garrigues, M. de la Guardia, J. Chromatogr. A 1190 (2008)
102.87] J. Kuligowski, G. Quintás, S. Garrigues, M. de la Guardia, Anal. Chim. Acta 624
(2008) 278.
88] J. Kuligowski, G. Quintás, S. Garrigues, M. de la Guardia, Talanta 77 (2008) 779.89] J. Kuligowski, G. Quintás, S. Garrigues, M. de la Guardia, Talanta 80 (2010) 1771.90] K. Varmuza, M. Karlovits, W. Demuth, Anal. Chim. Acta 490 (2003) 313.91] G. Quintás, J. Kuligowski, B. Lendl, App. Spectrosc. 63 (2009) 1363.92] J. Kuligowski, G. Quintás, S. Garrigues, M. de la Guardia, J. Chromatogr. A 1216(2009) 3122.


