Embed Size (px)
Citation preview

J. Sep. Sci. 2008, 31, 195 – 200 I. Citov� et al. 195
Ivana Citov�1, 2
Markus Ganzera2
Hermann Stuppner2
Petr Solich1
1Charles University of Prague,Faculty of Pharmacy,Department of AnalyticalChemistry, Hradec Kr�lov�,Czech Republic
2University of Innsbruck,Institute of Pharmacy,Pharmacognosy, Innsbruck,Austria
Short Communication
Determination of gentisin, isogentisin, andamarogentin in Gentiana lutea L. by capillaryelectrophoresis
A novel, fast, and simple capillary electrophoresis method has been developed forthe analysis of gentisin, isogentisin, and amarogentin in roots of Gentiana lutea (yel-low gentian), an herb traditionally used as gastric stimulant. Gentisin and isogenti-sin are xanthones showing potent inhibition of monoamine oxidase type A and B,amarogentin represents one of the bitter principles of Gentiana, responsible for itsgastric-roborant effects. Optimal CE-separation conditions comprise a 100 mMsodium tetraborate buffer of pH 9.3, containing 10 mM b-cyclodextrin as additive;optimum temperature and applied voltage were found to be 308C and 25 kV, respec-tively. Direct diode array detection at 260 nm (gentisin, isogentisin) and 242 nm(amarogentin) was performed, and the required analysis time was only 11 min. Thedeveloped method was validated for linearity, sensitivity, precision, and accuracy,and utilized to assay several commercially available G. lutea samples. Quantitativedata obtained with the developed CE method are compared with HPLC results, andthe advantages of each approach are discussed.
Keywords: Amarogentin / Capillary electrophoresis / Gentiana lutea / Gentisin / Isogentisin /
Received: July 18, 2007; revised: September 3, 2007; accepted: September 4, 2007
DOI 10.1002/jssc.200700325
1 Introduction
Gentiana lutea (Gentianaceae) is a perennial herb com-monly growing in alpine areas of central and southernEurope and in western Asia [1]. The officinal drug Gentia-nae radix, listed in many pharmacopoeial monographs,consists of dried fermented rhizomes and roots of Genti-ana. It is traditionally used as a bitter tonic in gastro-intestinal ailments. The active principles of Gentianawere found to be secoiridoid bitter compounds, such asgentiopicroside, amarogentin, and swertiamarine, fol-lowed by xanthones, phenolic acids, phytosterols, andalkaloids [1, 2]. Whilst the bitter principles, particularlyamarogentin, act as appetite or digestive stimulants andgastroprotective agents [3], xanthones, including genti-sin, isogentisin, and genistein, show different biologicalactivities. Gentisin and isogentisin possess a potentialantidepressant effect by inhibition of monoamine oxi-dase type A and B [4–6], and isogentisin also demon-strated strong antitubercular activities [7]. Recently, sig-nificant cytoprotective properties of isogentisin (but notgentisin) were discovered [8]. Moreover, amarogentin
rich fractions of Swertia chirata showed an anticarcino-genic effect [9], and it has been known for a long timethat the methanol extract of Gentianae radix possess muta-genic activity [10].
With respect to the wide range of different pharmaco-logical actions of Gentiana and its medicinal use, an ana-lytical assessment of this plant is of great importance.According to the publications available on common sci-entific databases, HPLC, TLC, and MEKC have been usedfor the analysis of major Gentiana compounds [11–14].An original HPLC–MS assay enabling the determinationof all currently known bioactive compounds in gentianroots has not been published until recently [15]. Exceptfor the latter, all other methods did not allow the separa-tion of gentisin and isogentisin, two compounds that,owing to recent pharmacological studies, are of utmostinterest. Thus, in this study we developed and validated aCE method for this purpose and compared the obtainedquantitative results to the already established HPLCapproach.
2 Experimental
2.1 Instrumentation and CE analysis
Capillary electrophoresis was performed on a 3D-CEinstrument (Agilent Technologies, Waldbronn, Ger-
Correspondence: Priv. Doz. Dr. Markus Ganzera, University ofInnsbruck, Institute of Pharmacy, Innrain 52, 6020 Innsbruck,AustriaE-mail: [email protected]: +43 512 507 2939
i 2008 WILEY-VCH Verlag GmbH & Co. KGaA, Weinheim www.jss-journal.com
196 I. Citov� et al. J. Sep. Sci. 2008, 31, 195 – 200
many) equipped with diode array detector, thermostat-able capillary compartment and autosampler. Electro-phoretic separation was achieved using a fused silicacapillary of 50 lm id and effective length 60 cm (Polymi-cro Technologies, Phoenix, AZ, USA).
Optimal results were obtained with a 100 mM sodiumtetraborate solution of pH 9.3 containing 10 mM b-cyclo-dextrin as additive, at an applied voltage of 25 kV and atemperature of 308C. Analyzed samples were injectedusing the hydrodynamic mode (50 mbar for 5 s) anddetected at 260 nm (gentisin, isogentisin) and 242 nm(amarogentin). Prior to each injection, the capillary wasrinsed with water (2 min), 0.1 M phospohoric acid(2 min), water (2 min), and finally with running electro-lyte (3 min). All standard and sample solutions as well asbuffers were filtered through a 0.45-lm membrane filter(Minisart SRP15; Sartorius, G�ttingen, Germany) beforeanalysis.
2.2 Chemicals
All solvents and chemicals were of HPLC or p.a. grade(methanol, sodium tetraborate, b-cyclodextrin, sodiumhydroxide, phosphoric acid, water) and were purchasedfrom Merck (Darmstadt, Germany). Amarogentin stand-ard was bought from Chromadex (Santa Ana, CA, USA)and standards of gentisin and isogentisin were isolatedin our laboratory as described earlier [8]. Five G. lutea rootsamples (S1–S5) were obtained from three different Aus-trian and German suppliers, samples S1, S2, and S4 weredifferent batches supplied by one vendor.
2.3 Sample preparation
150 mg of powdered G. lutea root was extracted threetimes with 3 mL of 100% methanol in an ultrasonic bath(10 min, room temperature) and centrifuged. Theextracts were collected in a 10-mL volumetric flask andfilled up to the mark with 100% methanol.
2.4 Validation
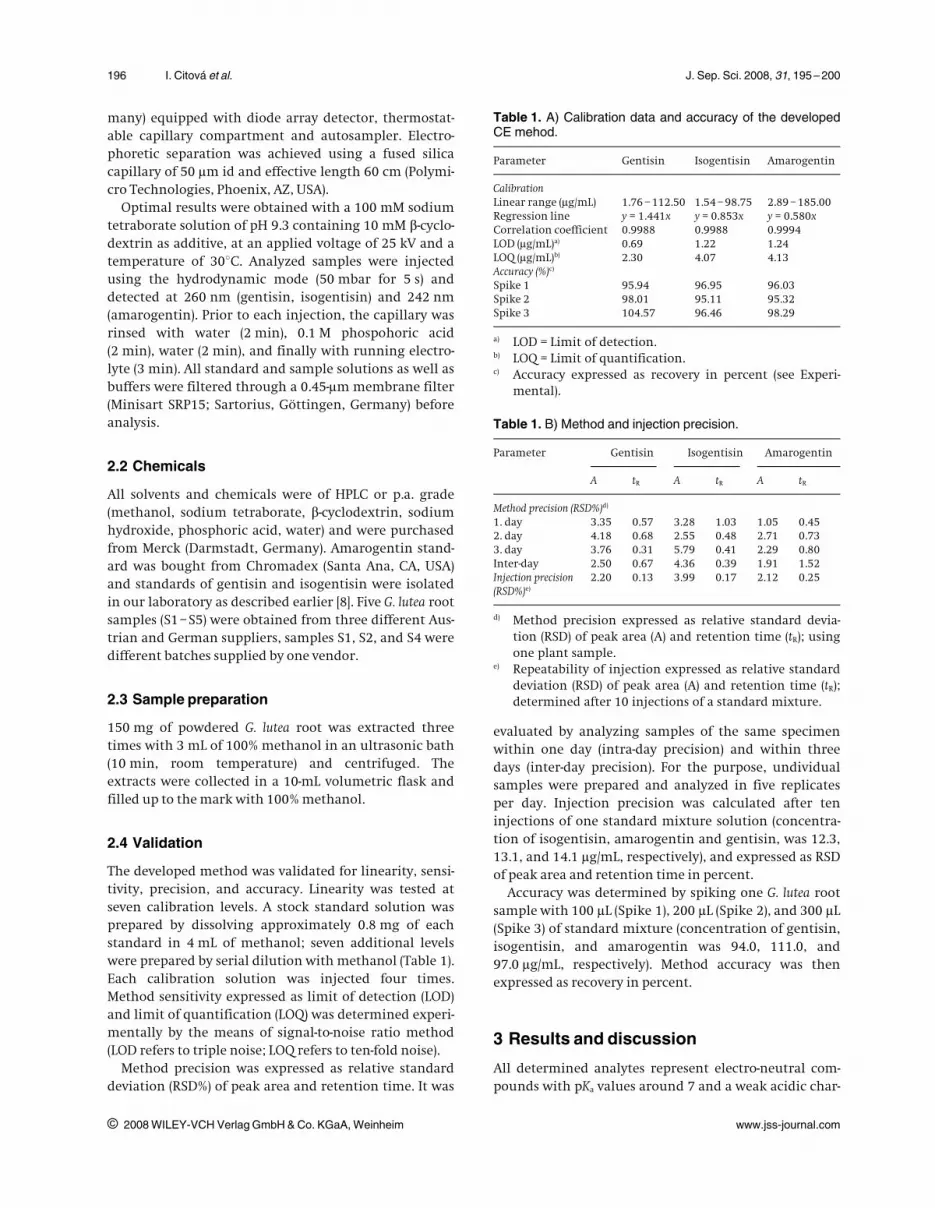
The developed method was validated for linearity, sensi-tivity, precision, and accuracy. Linearity was tested atseven calibration levels. A stock standard solution wasprepared by dissolving approximately 0.8 mg of eachstandard in 4 mL of methanol; seven additional levelswere prepared by serial dilution with methanol (Table 1).Each calibration solution was injected four times.Method sensitivity expressed as limit of detection (LOD)and limit of quantification (LOQ) was determined experi-mentally by the means of signal-to-noise ratio method(LOD refers to triple noise; LOQ refers to ten-fold noise).
Method precision was expressed as relative standarddeviation (RSD%) of peak area and retention time. It was
evaluated by analyzing samples of the same specimenwithin one day (intra-day precision) and within threedays (inter-day precision). For the purpose, undividualsamples were prepared and analyzed in five replicatesper day. Injection precision was calculated after teninjections of one standard mixture solution (concentra-tion of isogentisin, amarogentin and gentisin, was 12.3,13.1, and 14.1 lg/mL, respectively), and expressed as RSDof peak area and retention time in percent.
Accuracy was determined by spiking one G. lutea rootsample with 100 lL (Spike 1), 200 lL (Spike 2), and 300 lL(Spike 3) of standard mixture (concentration of gentisin,isogentisin, and amarogentin was 94.0, 111.0, and97.0 lg/mL, respectively). Method accuracy was thenexpressed as recovery in percent.
3 Results and discussion
All determined analytes represent electro-neutral com-pounds with pKa values around 7 and a weak acidic char-
i 2008 WILEY-VCH Verlag GmbH & Co. KGaA, Weinheim www.jss-journal.com
Table 1. A) Calibration data and accuracy of the developedCE mehod.
Parameter Gentisin Isogentisin Amarogentin
CalibrationLinear range (lg/mL) 1.76 – 112.50 1.54 – 98.75 2.89 – 185.00Regression line y = 1.441x y = 0.853x y = 0.580xCorrelation coefficient 0.9988 0.9988 0.9994LOD (lg/mL)a) 0.69 1.22 1.24LOQ (lg/mL)b) 2.30 4.07 4.13Accuracy (%)c)
Spike 1 95.94 96.95 96.03Spike 2 98.01 95.11 95.32Spike 3 104.57 96.46 98.29
a) LOD = Limit of detection.b) LOQ = Limit of quantification.c) Accuracy expressed as recovery in percent (see Experi-
mental).
Table 1. B) Method and injection precision.
Parameter Gentisin Isogentisin Amarogentin
A tR A tR A tR
Method precision (RSD%)d)
1. day 3.35 0.57 3.28 1.03 1.05 0.452. day 4.18 0.68 2.55 0.48 2.71 0.733. day 3.76 0.31 5.79 0.41 2.29 0.80Inter-day 2.50 0.67 4.36 0.39 1.91 1.52Injection precision(RSD%)e)
2.20 0.13 3.99 0.17 2.12 0.25
d) Method precision expressed as relative standard devia-tion (RSD) of peak area (A) and retention time (tR); usingone plant sample.
e) Repeatability of injection expressed as relative standarddeviation (RSD) of peak area (A) and retention time (tR);determined after 10 injections of a standard mixture.

J. Sep. Sci. 2008, 31, 195 – 200 Electrodriven Separation 197
acter due to the presence of hydroxyl groups on the aro-matic rings (see Fig. 1). Gentisin and isogentisin are posi-tional isomers with identical molecular weight and thesame number of ionizable groups, i. e. in the electrolytesystem they are identically charged. Therefore, CE sep-aration of these compounds might theoretically beachieved either by addition of a chiral selector (e. g. cyclo-dextrins), or by formation of micelles utilizing micellarelectrokinetic capillary chromatography (MEKC).
The most important features of method developmentas well as our results concerning method validation,quantification, and comparison of the proposed CEmethod with HPLC results are further briefly discussed.
3.1 CE method optimization
For initial screening, a methanol solution of G. luteacrude extract (c = 15 mg/mL) and a standard mixturewere utilized. Primarily, different buffer systems includ-ing sodium tetraborate, sodium phosphate, and Tris sol-utions were tested in the pH range between 7.5 and 11.5.These experiments showed that sodium tetraborate isthe optimum electrolyte for the intended purpose. Addi-tionally, two different micellar systems containing 25–100 mM sodium dodecylsulphate (SDS) or 75 mM sodiumcholate (SC) were tested, but a successful separation of allthree analytes was achieved only on using the standardmixture; in the case of extract the target peaks mergedwith other interfering compounds. An addition oforganic modifiers (methanol, ethanol, propanol, or ace-tonitrile) to the buffer did not show any improvedresults. As a second alternative, different concentrationsof cyclodextrins (a-, b-, c-, 2-hydroxypropyl-a- and 2-hydroxypropyl-b-cyclodextrin) were added to the run-ning electrolyte. The best results were obtained using b-cyclodextrin.
In order to separate the selected analytes with suffi-cient resolution and in the shortest possible time all rele-vant separation parameters were carefully optimized.Migration time, resolution, peak shape, and symmetry
were considered as relevant indicators. Concentrationand pH of tetraborate buffer showed a major influenceon analysis time and resolution of all compoundspresent in the extract. By increasing molarity stepwisefrom 25 to 125 mM tetraborate, analysis was prolonged;however, resolution of target analytes was improved(especially in case of separation of amarogentin fromother compounds). By increasing the buffer pH (testedfrom pH 8.0 to 10.0), the analysis time was prolongedtoo, but at a pH higher than 9.5 the separation as well aspeak shapes were insufficient. For the analysis of genti-sin, isogentisin, and amarogentin a 100 mM tetraboratebuffer at pH 9.3, containing 10 mM b-cyclodextrin asadditive proved to be ideal. The resulting current wasrather high (115 lA), but it did not cause perturbingJoule heating of the capillary nor unstable results. Theoptimal separation temperature was 308C; any higher orlower temperature was not advantageous.
Detection wavelengths were set according to theabsorption maxima of analyzed compounds. Althoughisogentisin shows a maximum at 230 nm (as determinedby the DAD spectrum), a wavelength of 260 nm was usedfor validation and quantification due to better selectivitywhen analyzing some of the extracts. An electrophero-gram showing the separation of a standard mixtureunder optimal conditions is represented in Fig. 2, anddisplays a short analysis time not exceeding 11 min.
3.2 CE method validation
Results of method validation in terms of calibration,accuracy and precision are presented in Table 1. Linear-ity of the developed CE assay was confirmed in a morethan 50-fold concentration range, with correlation coef-ficients between 0.9988 and 0.9994. Concerning sensitiv-ity, the LOQ ranged from 2.3 lg/mL (gentisin) to 4.1 lg/mL (amarogentin). Accuracy was evaluated as recoveryafter spiking one plant sample with standards at threeconcentration levels ranged between 95.11 and 104.57%.Method and injection precision calculated both for peakarea and retention time were within the limit of 5%,except for isogentisin measurements on the third daywhere the RSD reached 5.79%. Baseline separation of alltarget compounds and resolutions higher than 1.5 dem-onstrate the selectivity of the proposed method.
3.3 Assay of G. lutea samples
Five G. lutea samples were assayed using the developed CEmethod. The procedure of sample preparation wasadopted from a previous publication [15], assuring anexhaustive extraction of the target analytes. Peak identi-fication was performed by comparison of migrationtimes and UV spectra with those of the reference com-pounds, and confirmed by spiking of the samples with
i 2008 WILEY-VCH Verlag GmbH & Co. KGaA, Weinheim www.jss-journal.com
Figure 1. Chemical structures and pKa values of analyzedcompounds.

198 I. Citov� et al. J. Sep. Sci. 2008, 31, 195 – 200
the standards (if required). As shown in Table 2, in allsamples isogentisin (ranging from 8.97 to 12.30 lg/mL)was dominant compared to gentisin (4.27–9.72 lg/mL).Values of amarogentin were substantially lower, notexceeding 7.68 lg/mL (0.05%). In two analyzed samples
(S2 and S3) amarogentin level did not reach LOQ and forthat reason it was not quantified. The determined quan-titative values correspond well with data stated in litera-ture [2].
A typical electropherogram for a sample solution isdepicted in Fig. 3. The most abundant component in Gen-tiana, the secoiridoid glycoside gentiopicroside, elutes inthe first peak. Unfortunately, it was not possible toinclude this analyte in quantification, because it alwaysmerges with other structurally very similar compoundssuch as swertiamarine and xanthone glycosides. Thistrend was observed when injecting respective standards,which were available from a previous study [15].
3.4 Comparison with HPLC
For G. lutea analysis the analytical challenge lies in thediverse chemical character of constituents and/or intheir structural similarity. High performance liquid
i 2008 WILEY-VCH Verlag GmbH & Co. KGaA, Weinheim www.jss-journal.com
Figure 2. Electropherograms of astandard mixture obtained underoptimal CE conditions; gentisinand isogentisin detected at260 nm, amarogentin at 242 nm.Concentrations of gentisin, iso-gentisin, and amarogentin were31.33, 37.00, and 32.33 lg/mL,respectively.
Table 2. Quantification of five commercially available G.lutea samples by means of the developed CE method; stand-ard deviation in parenthesis (n = 4).
Concentration (lg/mL)
Sample Gentisin Isogentisin Amarogentin
S 1 7.84 (l 0.26) 9.56 (l 0.28) 4.22 (l 0.20)S 2 9.08 (l 0.11) 12.30 (l 0.35) n.d.a)
S 3 9.72 (l 0.42) 10.81 (l 0.09) n.d.a)
S 4 4.27 (l 0.21) 8.97 (l 0.23) 4.49 (l 0.25)S 5 8.46 (l 0.25) 11.98 (l 0.43) 7.68 (l 0.19)
a) n.d. = not defined (the value was below the limit of quan-tification).

J. Sep. Sci. 2008, 31, 195 – 200 Electrodriven Separation 199
chromatography is generally considered the method ofchoice in the field of phytoanalysis due to its universaluse, extensive range of available stationary phases andvarious detection possibilities. We recently reported anHPLC method for the analysis of biologically active com-pounds in Gentiana [15] and the current study shouldevaluate the applicability of CE for the same purpose.When comparing both approaches, their respective prosand cons are obvious. Although CE does not allow separa-tion of the same number of compounds, it offers manysignificant advantages compared to HPLC. Besides thegeneral benefits of low solvent and sample consumption,CE enables significantly improved separation of gentisinand isogentisin in less than half the time (HPLC runtimeis 30 min) in a very complex sample matrix. On the otherhand, because of very low quantification limits (0.04,0.05, and 0.11 lg/mL for gentisin, isogentisin, and amar-ogentin, respectively), the substantially higher sensitiv-ity of the HPLC method should be pointed out. Last butnot least, quantitative results of gentian root samplesassayed by CE and HPLC showed that both techniquesenable an accurate and precise determination of thecompounds of interest (Table 3).
4 Concluding remarks
G. lutea, a medicinal herb used worldwide for its variedhealth benefits, represents an interesting drug to be stud-ied from phytochemical, pharmacological, and analyti-cal points of view. In order to assess its biological activityas well as the chemical composition, precise, reliable,and simple analytical techniques are required. In addi-
i 2008 WILEY-VCH Verlag GmbH & Co. KGaA, Weinheim www.jss-journal.com
Figure 3. Electropherograms ofG. lutea root sample (S5)obtained under optimum CEconditions.
Table 3. Comparison of quantitative results obtained by CEand HPLC method; concentration expressed in percentage.
Concentration (%)
Sample Gentisin Isogentisin Amarogentin
CE HPLCa) CE HPLCa) CE HPLCa)
S 1 0.05 0.05 0.06 0.08 0.03 0.03S 2 0.06 0.07 0.08 0.11 n.d. 0.01S 3 0.06 0.07 0.07 0.08 n.d. 0.03S 4 0.03 0.05 0.06 0.11 0.03 0.04S 5 0.06 0.06 0.08 0.10 0.05 0.05
n.d.= not defineda) Result obtained according to [15].

200 I. Citov� et al. J. Sep. Sci. 2008, 31, 195 – 200
tion to an already established HPLC method, we havenow successfully developed, validated, and applied a CEmethod for the analysis of three pharmacologicallyhighly interesting compounds in Gentiana. AlthoughHPLC might offer more versatility in respect to the num-ber of analytes determined, the newly developed CEmethod enables a much faster, yet improved separationand quantitation of gentisin, isogentisin, and amarogen-tin. Therefore, it surely can be considered as an equiva-lent alternative to HPLC.
The authors would like to thank the Austrian Exchange Office(�AD) and the Ministry of Education of the Czech Republic (grantMSM 0021620822) for their financial support.
5 References
[1] Blumenthal, M., Goldberg, A., Brinckmann, J., Herbal Medicine:Expanded Commission E Monographs, American Botanical Council,Austin 2000.
[2] Newall, C. A., Anderson, L. A., Phillipson, J. D., Herbal Medicines –A Guide for Health-Care Professionals, The Pharmaceutical Press, Lon-don 1996.
[3] Niiho, Y., Yamazaki, T., Nakajima, Y., Yamamoto, T., Ando, H.,Hirai, Y., Toriizuka, K., Ida, Y., J. Nat. Med. 2006, 60, 82 – 88.
[4] Haraguchi, H., Tanaka, Y., Kabbash, A., Fujioka, T., Ishizu, T.,Yagi, A., Phytochemistry 2004, 65, 2255 – 2260.
[5] Harborne, J. B., Baxter, H., Phytochemical Dictionary – A Handbook ofBioactive Compounds from Plants, Taylor & Francis, London 1993.
[6] Suzuki, O., Katsumata, Y., Oya, M., Chari, V. M., Klapfenberger,R., Wagner, H., Hostettmann, K., Biochem. Pharm. 1978, 27, 2075 –2078.
[7] Menkovic, N., Savikin-Fodulovic, K., Cebedzic, R., Pharm. Pharma-col. Lett. 1999, 9, 74 – 75.
[8] Schmieder, A., Schwaiger, S., Csordas, A., Backovic, A., Messner,B., Wick, G., Stuppner, H., Bernhard, D., Atherosclerosis 2007, 194,317 – 325.
[9] Saha, P., Mandal, S., Das, A., Das, S., Cancer. Lett. 2006, 244, 252 –259.
[10] Morimoto, I., Nozaka, T., Watanabe, F., Ishino, M., Hirose, Y.,Okitsu, T., Mutat. Res. 1983, 2, 103 – 117.
[11] Pettei, M. J., Hostettmann, K., J. Chromatogr. A 1978, 154, 103 –105.
[12] Sz�cs, Z., D�nos, B., Nyiredy, S., Chromatographia Suppl. 2002, 56,S19 – S23.
[13] Vanhaelen, M., Vanhaelen-Fastre, R., J. Chromatogr. A 1983, 281,263 – 271.
[14] Glatz, Z., Posp�Ðilov�, J., Musil, P., J. Liq. Chromatogr. Rel. Techn.2000, 23, 1831 – 1839.
[15] Aberham, A., Schwaiger, S., Stuppner, H., Ganzera, M., J. Pharma-ceut. Biomed. Anal. 2007, 45, 437 – 442.
i 2008 WILEY-VCH Verlag GmbH & Co. KGaA, Weinheim www.jss-journal.com


