Embed Size (px)
Citation preview
General Development Plan
AnneArundelCounty
April 2009

Anne Arundel CountyGeneral
Development Plan
April 2009
Adopted October 19, 2009Bill No. 64-09
Acknowledgments
John R. LeopoldCounty Executive
County CouncilDaryl Jones, District 1
C. Edward Middlebrooks, District 2Ronald C. Dillon, District 3
James Benoit, District 4Cathleen M. Vitale, District 5
Joshua J. Cohen, District 6Edward R. Reilly, District 7
Planning Advisory BoardMichelle Corkadel, Chairman
Mary Alter, Ph.D.Wayne DixonSage MummaJohn Norville
Vernon ThomasJoan Turek
General Development Plan Special Advisory CommitteeErnest Bristow William NevelWendy Cozzone Peter NotariAnthony Frank George PerryMichael Galey Eliot PowellSally Hornor Timothy ReyburnAlbert Johnston Anthony SaviaHarold Kumer (Chairperson) Henry SchmidtSpear Lancaster Stuart SchoenburgMichael Littleton Dinsmoor WhiteErik Michelsen
Anne Arundel County
Larry R. TomPlanning and Zoning Officer
Carole SannerAssistant Planning and Zoning Officer
Lynn MillerLong Range Planning Administrator
Project Staff
Long Range Planning Transportation Planning Parag Agrawal George CardwellPat Barland Martha ArzuCindy Carrier Harvey GoldMichael Fox Jon MayerKevin GambrillTeresa Russin
Watershed and Ecosystems Services and RestorationGinger EllisHala FloresJanis Markusic
Other Project StaffKenneth Alban, Capital Projects and Planning, Dept. of Recreation and ParksGeorge Albright, Utilities Planning Division, Dept. of Public WorksNancy Choice, Anne Arundel County LibrariesJane Cox, Cultural Resources Division, Office of Planning and ZoningMiranda Darden, Arundel Community Development Services Inc.Ross Dinkel, Fire Marshal Division, Fire DepartmentRonna Gotthainer, Dept. of HealthRobin Harting, Dept. of Detention FacilitiesMargaret Kaii-Ziegler, Research and GIS Division, Office of Planning and ZoningDenise McGarvey, Police DepartmentChris Murphy, Utilities Planning Division, Dept. of Public WorksBillie Penley, Office of BudgetChris Phipps, Bureau of Engineering, Dept. of Public WorksJames Pittman, Solid Waste Management Division, Dept. of Public WorksBarbara Polito, Agricultural Preservation Program, Dept. of Recreation and Parks
Darian Schwab, Cultural Resources Division, Office of Planning and ZoningKurt Svendsen, Office of BudgetLisa Webb, Anne Arundel Economic Development CorporationCaptain Tom Wilson, Office of Emergency ManagementChuck Yocum, Anne Arundel County Public Schools
Administrative SupportSharon Faulkner, Office of Planning and ZoningSharon Greco, Office of Planning and Zoning
Technical Advisory PanelRon Bowen, Director, Dept. of Public WorksJames Chance, Assistant County Attorney, Office of LawBetty Dixon, Director, Dept. of Inspections and PermitsMark Garrity, Parks Administrator, Dept. of Recreation and ParksThomas Gruver, Environmental Sanitarian Supervisor, Dept. of HealthRobert Hannon, CEO, Anne Arundel Economic Development CorporationLieutenant Eric Hodge, Commander, Management and Planning Section, Police Dept.Kathy Koch, Executive Director, Arundel Community Development Services Inc.Robert Leib, Special Assistant for BRAC, County Executive’s OfficeErik Robey, Assistant to the Chief Administrative Officer, County Executive’s OfficeReinhold Strobel, Deputy Chief, Fire DepartmentKurt Svendsen, Assistant Budget Officer, Office of BudgetAlex Szachnowicz, Chief Facilities Officer, Anne Arundel County Public SchoolsLarry Tom, Planning and Zoning Officer, Office of Planning and Zoning
ConsultantsTischlerBise Fiscal, Economic, and Planning Consultants
Table of ContentsChapter 1: Introduction .................................................................1Purpose and Contents ........................................................................................................... 3State Planning Requirements ............................................................................................... 3The Planning Framework ...................................................................................................... 5GDP Planning Process ........................................................................................................... 6Structure of the GDP ............................................................................................................. 7
Chapter 2: Overview of Anne Arundel County .................................9Historical and Current Growth Trends .............................................................................. 11Significant Changes Since 1997 .......................................................................................... 13Key Land Use Planning Initiatives Since 1997 .................................................................. 14Major Trends for the Next 10 Years ................................................................................... 20Vision for 2009 and Beyond ................................................................................................ 21
Chapter 3: Balanced Growth and Sustainability ............................ 25Balancing Land Use, Growth and Fiscal Policies ................................................................ 27
Current Land Use Pattern ................................................................................................... 27Development Holding Capacity ........................................................................................... 30Fiscal Impact of Growth ...................................................................................................... 32
Balancing Economic Development Opportunities ............................................................ 37Balancing Housing Opportunities ...................................................................................... 40
Housing Overview .............................................................................................................. 40Residential Building Trends ................................................................................................ 41Housing Affordability .......................................................................................................... 41Addressing Workforce Housing Needs ................................................................................. 42Balancing Land Preservation .............................................................................................. 45
Chapter 4: Community Preservation and Enhancement ................ 47Commercial Revitalization .................................................................................................. 49Neighborhood Conservation ............................................................................................... 51Preserving Rural Areas ........................................................................................................ 53Protecting Historic Resources ............................................................................................. 54
Chapter 5: Environmental Stewardship ........................................ 59Watershed Protection .......................................................................................................... 61
Watershed Management Plans ........................................................................................... 63Sensitive Areas ..................................................................................................................... 65
Streams and Stream Buffers................................................................................................ 65100 – Year Floodplain ......................................................................................................... 65Habitats of Rare, Threatened and Endangered Species ....................................................... 66Steep Slopes ........................................................................................................................ 69Wetlands ............................................................................................................................. 69Jabez Branch....................................................................................................................... 70
Greenways, Open Space, and Forest Conservation ........................................................... 75
Air Quality ............................................................................................................................ 78Noise ..................................................................................................................................... 80Mineral Resources ............................................................................................................... 82Sustainable Development ................................................................................................... 83
Chapter 6: Quality Public Services ................................................ 85Public Education .................................................................................................................. 87Recreation and Parks Facilities ........................................................................................... 90Library Services ................................................................................................................... 92Health Care Services ............................................................................................................ 94Senior Citizens Services ...................................................................................................... 97Public Safety Services .......................................................................................................... 99
Fire Protection and Emergency Services ...........................................................................100Sea Level Rise Planning ....................................................................................................102Police Protection and Crime Prevention ............................................................................102
Public Water, Sewer and Solid Waste Services ................................................................. 107Water and Sewer Facilities ...............................................................................................107Solid Waste Facilities ........................................................................................................108
Chapter 7: The Land Use Plan ..................................................... 113Purpose and Description of the Land Use Plan ............................................................... 115Relationship of the Land Use Plan and Comprehensive Zoning .................................... 116The 2009 Land Use Plan .................................................................................................... 117
Key Land Use Plan Changes for 2009 ...............................................................................120Development Policy Areas ................................................................................................. 122
Targeted Growth Areas .....................................................................................................123Managed Growth Areas ....................................................................................................123Rural Areas .......................................................................................................................124
Chapter 8: Priority Preservation Areas....................................... 131Overview ............................................................................................................................ 133The Planning Framework for Agricultural Preservation ................................................. 134Implementation Programs for Agricultural Preservation ............................................... 135
Easement Acquisition Programs ........................................................................................135Existing Funding Mechanisms ..........................................................................................137Land Use Controls and Policies..........................................................................................139Marketing and Public Outreach ........................................................................................140Program Management and Interagency Coordination.......................................................141
Priority Preservation Areas ............................................................................................... 141Program Evaluation and Strategies to Meet Preservation Goals .................................... 144
Chapter 9: The Transportation Plan ........................................... 147Land Use and Transportation Interaction ....................................................................... 150The Highway Network ....................................................................................................... 150
Functional Classification ...................................................................................................151Design of Roadways ..........................................................................................................152Level of Service .................................................................................................................154Highway Improvement Projects ........................................................................................155
Transit Service ................................................................................................................... 160Fixed Guideway Transit ....................................................................................................161
Bus Transit .......................................................................................................................163Rideshare Car and Van Pooling ......................................................................................... 166
The Annapolis Regional Transportation Management Association (ARTMA) ...................167Baltimore/Washington International Business Partnership (BWIP) ................................167
Airports .............................................................................................................................. 167BWI Thurgood Marshall International Airport .................................................................167Tipton Airport ..................................................................................................................168
Pedestrian and Bicycle Network ....................................................................................... 168Mobile Source Air Quality ................................................................................................. 169Plan Recommendations..................................................................................................... 173
Transportation Functional Master Plan ............................................................................173Priority Highway Improvement Corridors ........................................................................175Transportation Demand Management Strategies .............................................................177
Other Goals, Policies, and Actions .................................................................................... 179
Chapter 10: The Water Resources Plan ........................................ 183Introduction ....................................................................................................................... 185Planning Framework for Watershed Protection .............................................................. 185
General Development Plan ................................................................................................186Water and Sewer Master Plan...........................................................................................186Stormwater Regulations ...................................................................................................187Septic System Strategic Plan .............................................................................................187Total Maximum Daily Loads .............................................................................................187State Antidegradation Policy and Tier II Waters ...............................................................189Watershed Management Plans .........................................................................................190Stream and Subwatershed Assessment and Ranking ........................................................191Targeted Nutrient Reduction Implementation Plans ........................................................195
Assessment of Water Supply Capacity.............................................................................. 195Groundwater Supply, Demand, and Capacity ...................................................................196Individual Wells ................................................................................................................198Public Water System .........................................................................................................198Other Water Supply Systems ............................................................................................202Wellhead Protection ..........................................................................................................202
Wastewater Demand and Capacity ................................................................................... 202Public Sewer ......................................................................................................................203Septic Systems ..................................................................................................................205
Current and Projected Pollutant Loads ............................................................................ 208Water Reclamation Facility Loads .....................................................................................208Onsite Sewage Disposal System (Septic) Loads .................................................................211Nonpoint Source Loads and the Assimilative Capacity ......................................................213
Mitigation Plans ................................................................................................................ 217Water Supply ....................................................................................................................217Water Reclamation Facilities ............................................................................................220Septic Systems ..................................................................................................................222Nonpoint Source Loads .....................................................................................................224
Chapter 11: Concurrency Management Plan ............................... 229Method of Analysis and Information Sources ................................................................. 231
Level of Service Standards and Analysis of Existing and Future Demand ..................... 232Public Roads .....................................................................................................................232Public Schools ....................................................................................................................234Fire and EMS Service ........................................................................................................237Stormwater Management .................................................................................................241
Long Range Capital Improvement Needs ......................................................................... 242Existing Funding Sources .................................................................................................. 244Potential Revenue Strategies ............................................................................................ 244
Income Taxes ....................................................................................................................244Transfer and/or Recordation Taxes ..................................................................................245Property Taxes .................................................................................................................246Special District Property Tax ............................................................................................246Local Sales and Service Taxes ...........................................................................................246Hotel/Motel Tax ...............................................................................................................247Bonds ................................................................................................................................247Impact Fees .......................................................................................................................248Excise Taxes ......................................................................................................................249Charges for Service and Other Fees ...................................................................................250Utilities (for Stormwater and Transportation) .................................................................251
Evaluation of Revenue Strategies .................................................................................... 251Results of Evaluation ........................................................................................................252
Recommendations for a Comprehensive Concurrency Management Program ............. 255
Chapter 12: Implementation Plan .............................................. 257The GDP and the Overall Planning Framework ............................................................... 259Methods of Implementation ............................................................................................. 260Plan Administration .......................................................................................................... 261Implementation Schedule ................................................................................................. 262Progress Management and Tracking ................................................................................ 263
Appendix A ................................................................................ 285
List of FiguresChapter 2: Overview of Anne Arundel County .................................9
Figure 2–1 1997 GDP Land Use Plan ............................................................................ 16Figure 2–2 Priority Funding Areas ................................................................................ 17Figure 2–3 Small Planning Areas ................................................................................... 19
Chapter 3: Balanced Growth and Sustainability ............................ 25Figure 3–1 2004 Land Use Plan Category by Acreage Share ........................................ 28Figure 3–2 2004 GDP Land Use Plan ............................................................................ 29Figure 3–3 Residential Building Trends in Anne Arundel County, 2001 - 2006 ......... 41
Chapter 4: Community Preservation and Enhancement ................ 47Figure 4–1 Community Revitalization and Neighborhood Areas ................................ 50
Chapter 5: Environmental Stewardship ........................................ 59Figure 5–1 Watersheds and MDE Tributary Areas ....................................................... 62Figure 5–2 100- Year Flood Plains ................................................................................. 67Figure 5–3 Natural Heritage Areas ................................................................................ 68Figure 5–4 Location of County Bogs ............................................................................. 71Figure 5–5 Nontidal Wetlands ....................................................................................... 72Figure 5–6 Greenways Network ..................................................................................... 76Figure 5–7 Woodlands .................................................................................................... 77Figure 5–8 Surface Mining Operations ......................................................................... 81
Chapter 6: Quality Public Services ................................................ 85Figure 6–1 High School Districts ................................................................................... 88Figure 6–2 Parks and Recreation Sites .......................................................................... 91Figure 6–3 Public Libraries ............................................................................................. 93Figure 6–4 Health Centers ............................................................................................. 96Figure 6–5 Senior Centers .............................................................................................. 98Figure 6–6 Fire Stations and Fire Company Areas ...................................................... 101Figure 6–7 Storm Surge Areas...................................................................................... 103Figure 6–8 Police Stations and Detention Centers ..................................................... 105Figure 6–9 Waste Collection Service Areas and Facilities ........................................... 109
Chapter 7: The Land Use Plan ..................................................... 113Figure 7–1 2009 Land Use Plan ................................................................................... 119Figure 7–2 2009 Land Use Plan Changes .................................................................... 121Figure 7–3 Development Policy Areas ......................................................................... 125
Chapter 8: Priority Preservation Areas....................................... 131Figure 8–1 Agriculture and Woodland Preservation Properties ................................ 138Figure 8–2 Priority Preservation Areas ....................................................................... 143
Chapter 9: The Transportation Plan ........................................... 147Figure 9–1 Functional Classifications of Roads .......................................................... 153Figure 9–2 2005 Transportation Level of Service ....................................................... 158Figure 9–3 2035 Transportation Level of Service Forecasts ...................................... 159Figure 9–4 Transit Investment Corridors ................................................................... 162
Figure 9–5 Transit Development Plan ......................................................................... 165Figure 9–6 County Pedestrian and Bicycle Master Plan ............................................. 170Figure 9–7 Priority Highway Investment Corridors ................................................... 176
Chapter 10: The Water Resources Plan ........................................ 183Figure 10–1 Water Resource Element Analytical Framework .................................... 186Figure 10–2 Category 5 303 (d) Listed Waters and TMDLs ....................................... 188Figure 10–3 Indicators Used in Ranking Subwatersheds for Restoration ................. 192Figure 10–4 Indicators Used in Ranking Subwatersheds for Preservation ............... 192Figure 10–5 Condition of Subwatersheds for Restoration ......................................... 193Figure 10–6 Condition of Subwatersheds for Preservation ....................................... 194Figure 10–7 2007 Water Service .................................................................................. 197Figure 10–8 Water Quality Problem Areas .................................................................. 200Figure 10–9 2007 Sewer Service .................................................................................. 204Figure 10–10 Septic System Density Areas ................................................................. 206Figure 10–11 Onsite Sewage Disposal System Management Areas .......................... 207Figure 10–12 Septic System Nitrogen Loads (lb/year) ............................................... 212Figure 10–13 Stormwater Total Nitrogen Loads (lb/yr) ............................................ 214Figure 10–14 Stormwater Total Phosphorus Loads (lb/year) .................................... 214
Chapter 11: Concurrency Management Plan ............................... 229Figure 11–1 Current 4 and 8 Minute Fire Service Coverage ...................................... 238Figure 11–2 Proposed 4 and 8 Minute Fire Service Coverage .................................... 239
Chapter 12: Implementation Plan .............................................. 257Figure 12–1 The Planning Framework......................................................................... 259
List of TablesChapter 2: Overview of Anne Arundel County .................................9
Table 2–1 Population of the County and Percent Growth over Time, 1990-2000 11Table 2–2 Population and Employment Forecasts, 2005 - 2035 .................................. 12Table 2–3 Major Planning Initiatives Since 1997 ......................................................... 15
Chapter 3: Balanced Growth and Sustainability ............................ 25Table 3–1 2004 Land Use Plan Categories by Acres ..................................................... 28Table 3–2 Residential Development Capacity (Units) .................................................. 31Table 3–3 Protected Land Summary .............................................................................. 45
Chapter 7: The Land Use Plan ..................................................... 113Table 7–1 Description of Land Use Plan Categories ................................................... 116Table 7–2 General Development Plan Policies ............................................................ 126
Chapter 8: Priority Preservation Areas....................................... 131Table 8–1 Preserved Agricultural Lands ...................................................................... 135Table 8–2 Rural Legacy Area Summary ....................................................................... 137
Chapter 9: The Transportation Plan ........................................... 147Table 9–1 Highway Improvement Projects ................................................................. 156
Chapter 10: The Water Resources Plan ........................................ 183Table 10–1 Current and Projected Water Use in Anne Arundel County, 2000-2030
(MGD).......................................................................................................................... 198Table 10–2 Water Demand and Supply By Pressure Zone .......................................... 199Table 10–3 Wastewater Treatment Plant Loads Nitrogen (TN) ................................ 209Table 10–4 Wastewater Treatment Plant Loads Phosphorus (TP) ............................ 210Table 10–5 Nitrogen Loads for Existing and Built Out Conditions for Septic
Systems........................................................................................................................ 211Table 10–6 Modeled Pollutant Load of Total Nitrogen for Existing and Future
Conditions (GDP 2004 and GDP 2009) for Stormwater .......................................... 215Table 10–7 Modeled Pollutant Load of Total Phosphorous for Existing and Future
Conditions (GDP 2004 and GDP 2009) for Stormwater .......................................... 216Table 10–8 Implementation Schedule for a Comprehensive Regional Assessment of
the Atlantic Coastal Plain Aquifer System in Maryland ........................................... 219Chapter 11: Concurrency Management Plan ............................... 229
Table 11–1 Centerline Miles of Roads Below LOS Standard ...................................... 233Table 11–2 Costs to Correct Road LOS Deficiencies (x $1,000) ................................ 234Table 11–3 New Schools or Additions Needed to Meet 100% Utilization or
Less .............................................................................................................................. 235Table 11–4 Capital Needs by School Impact Fee District to Meet 100% Utilization or
Less .............................................................................................................................. 236Table 11–5 New Schools or Additions Needed to Meet 120% Utilization or
Less .............................................................................................................................. 236Table 11–6 Costs to Meet School Capacity Standard of 100% Utilization or Less
(x $1,000) .................................................................................................................... 236
Table 11–7 Costs to Meet School Capacity Standard of 120% Utilization or Less (x $1,000) .................................................................................................................... 237
Table 11–8 NFPA 1710 Response Time Objectives .................................................... 237Table 11–9 Existing Stormwater Infrastructure Needs .............................................. 241Table 11–10 Capital Improvements to Meet Existing and Future Demand .............. 243Table 11–11 Potential Revenue Yield from Change to Income Tax Rate ................... 245Table 11–12 Potential Revenue Yield from Change to Transfer Tax Rate ................. 245Table 11–13 Potential Revenue Yield from Change to Recordation Tax Rate ........... 245Table 11–14 Other Potential Impact Fee Categories .................................................. 249Table 11–15 Evaluation of Potential Revenue Strategies ........................................... 253
Chapter 12: Implementation Plan .............................................. 257Table 12–1 Evaluation of Potential Revenue Strategies ............................................. 264
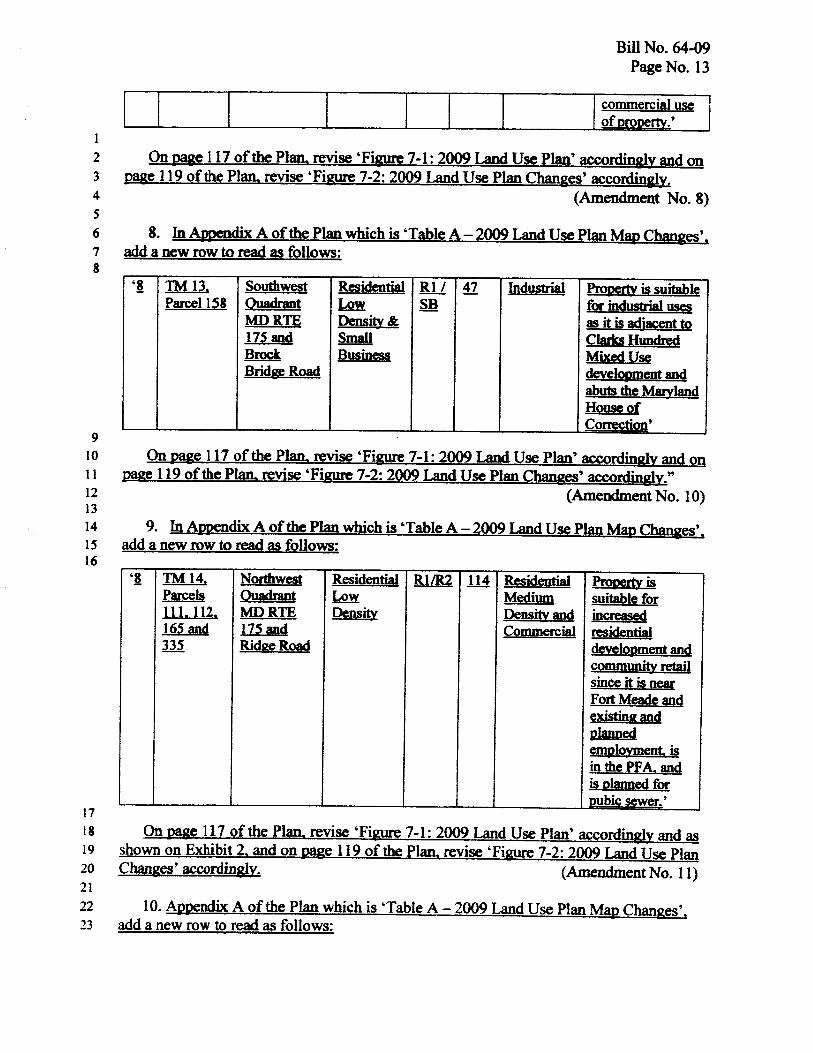
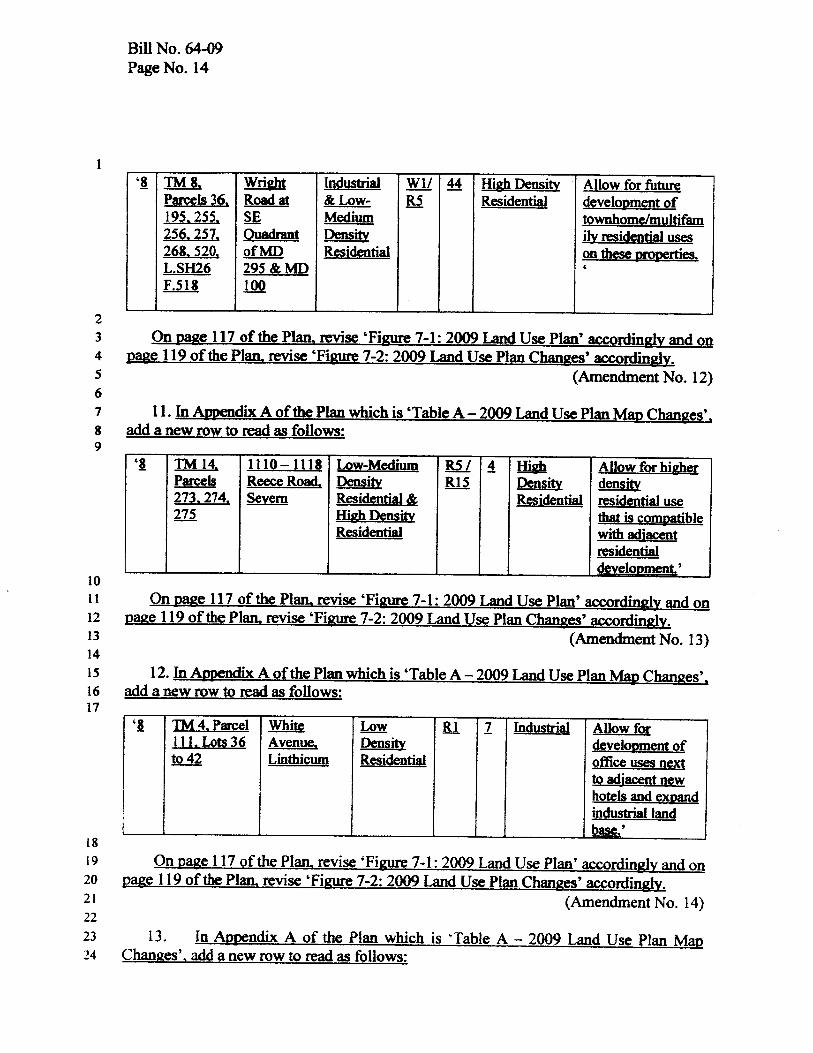
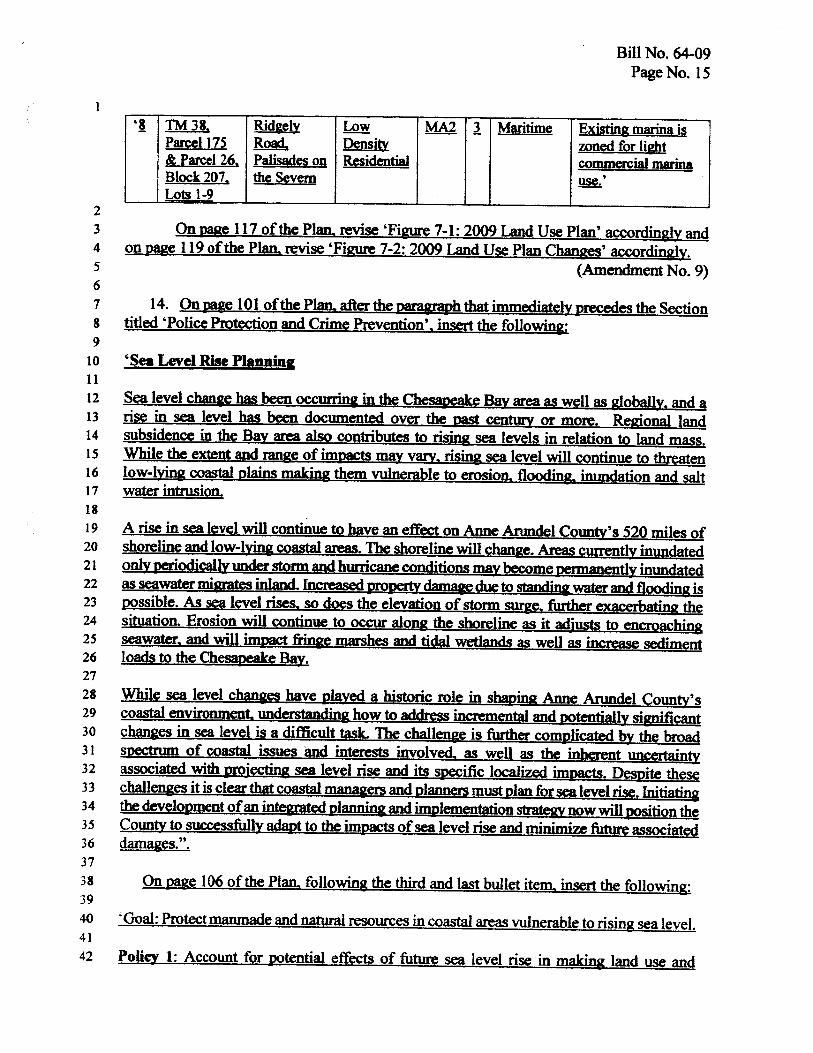
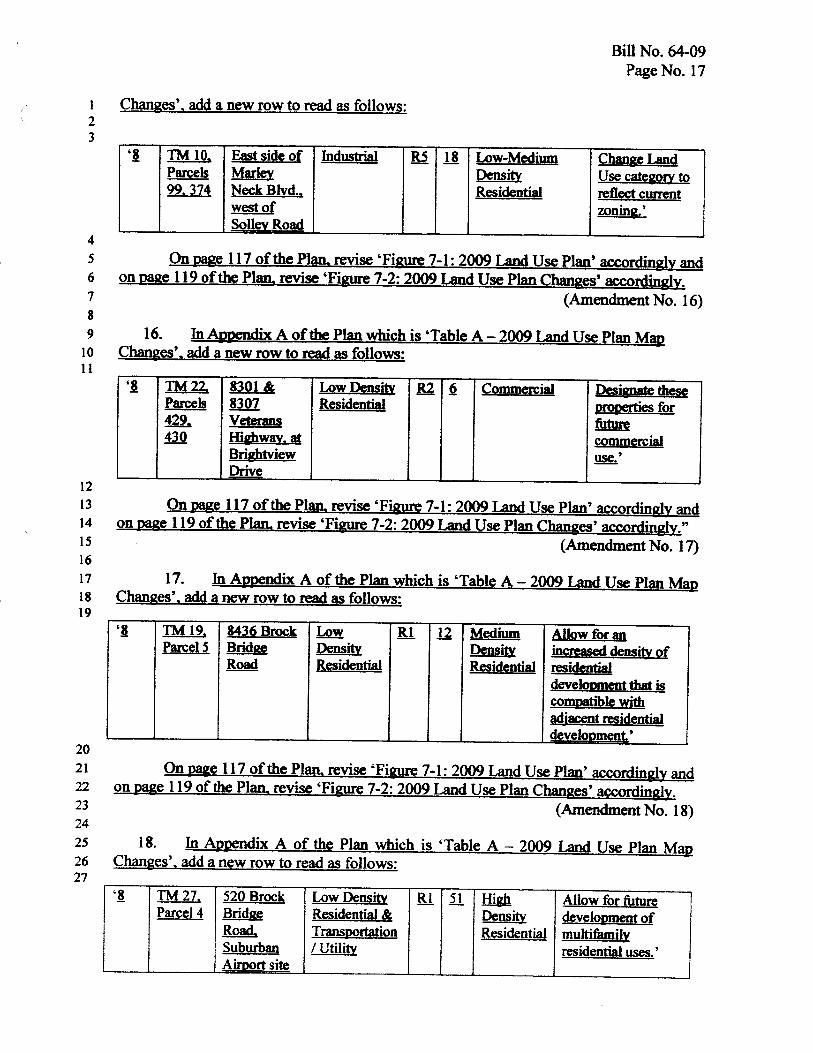
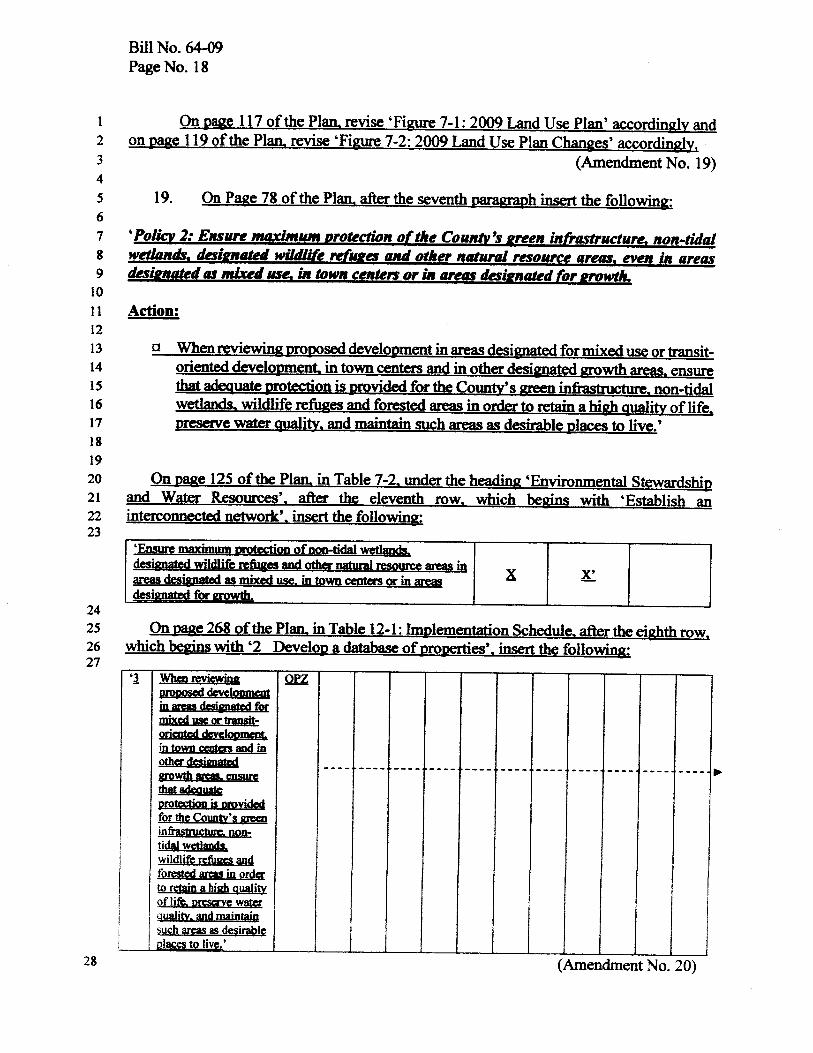
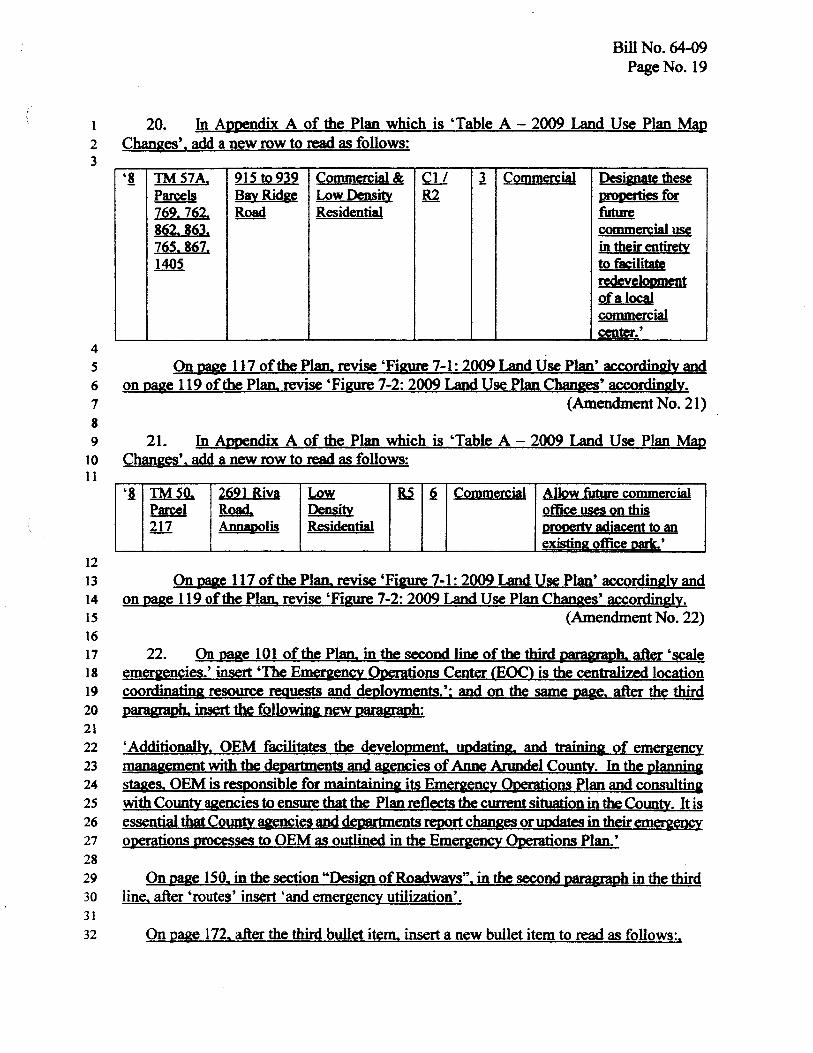
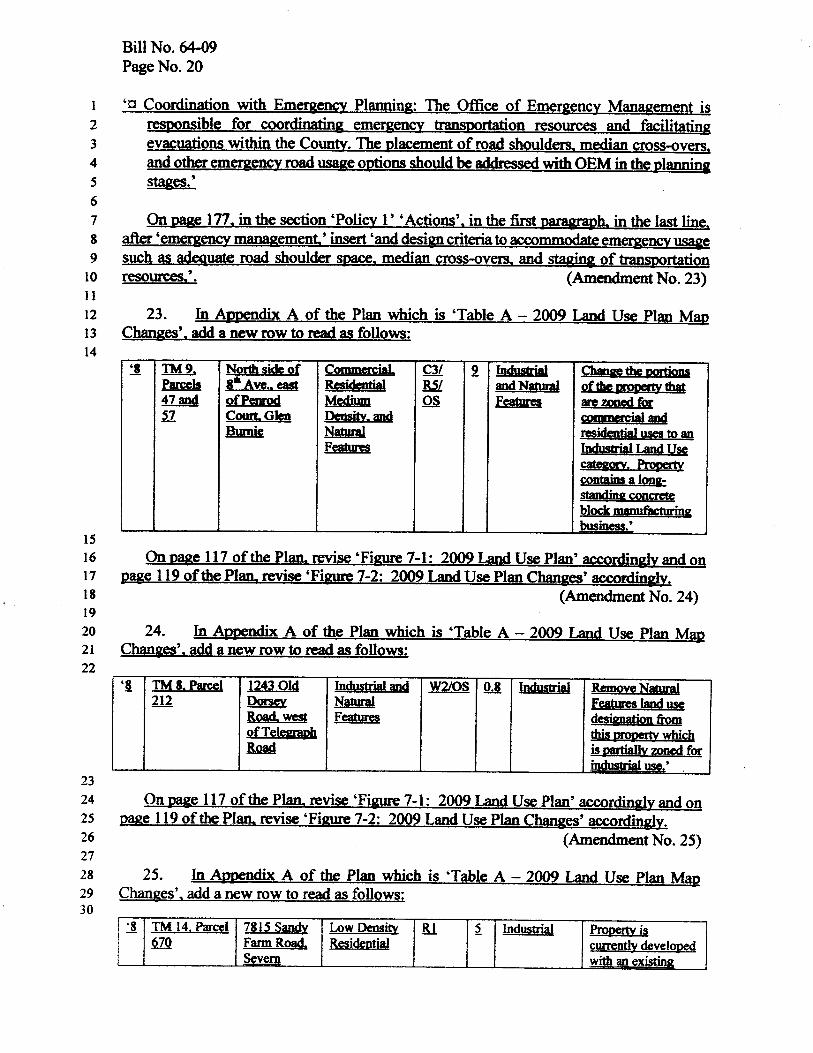
Appendix A ................................................................................ 285Table Appendix–A 2009 Land Use Plan Map Changes .............................................. 287

Chapter 1:Introduction

Introduction
Page 3
Chapter 1
Anne Arundel County’s General Development Plan, or GDP, is a comprehensive land use plan prepared in compliance with State requirements and guidelines. It is a policy docu-ment that is formally adopted by the County Council. The Plan establishes policies and recommendations to guide land use decisions over a 10 to 20 year planning horizon. The Plan is used by the County, State and federal agencies, citizens, developers, consultants, community associations, and others in making decisions about growth and development, land preservation, resource protection, and the provision of infrastructure and services.
As a charter county, Anne Arundel County is granted planning and zoning powers by Article 25A of the Annotated Code of Maryland. Article 66B (Land Use) of the Annotated Code also includes some requirements for comprehensive planning that apply to char-ter counties. Specifically, charter counties must address transportation plans, land use and development policies, sensitive environmental areas, water resources, and mineral resources in their comprehensive plans.
The Anne Arundel County Code designates the Office of Planning and Zoning to prepare and periodically update the comprehensive plan to guide growth and development. The County has had a General Development Plan since 1968, with updates in 1978, 1986, and 1997. Historically, the County has revised or amended the GDP to reflect demographic, economic, social and environmental changes that have occurred. The 1997 General Devel-opment Plan also incorporated policy recommendations that comply with Maryland’s Economic Growth, Resource Protection and Planning Act of 1992 (the Planning Act) and related “Smart Growth” legislation.
The State’s Economic Growth, Resource Protection and Planning Act was enacted in 1992 and amended in 2000 and 2009. This legislation established statewide growth manage-ment policies and mandates including several statutory Visions for growth, resource protection, and planning in the State of Maryland. Local jurisdictions are required to incorporate the following Visions into their comprehensive plans:
� a high quality of life is achieved through universal stewardship of the land, water, and air resulting in sustainable communities and protection of the environment;
� citizens are active partners in the planning and implementation of community initiatives and are sensitive to their responsibilities in achieving community goals;
� growth is concentrated in existing population and business centers, growth areas adjacent to these centers, or strategically selected new centers;
� compact, mixed-use, walkable design consistent with existing community charac-ter and located near available or planned transit options is encouraged to ensure efficient use of land and transportation resources and preservation and enhance-ment of natural systems, open spaces, recreational areas, and historical, cultural, and archaeological resources;
Purpose and Contents
State Planning Requirements
2009GeneralDevelopentPlan
Chapter 1
Page 4
Introduction
� growth areas have the water resources and infrastructure to accommodate population and business expansion in an orderly, efficient, and environmentally sustainable manner;
� a well-maintained, multimodal transportation system facilitates the safe, conve-nient, affordable, and efficient movement of people, goods, and services within and between population and business centers;
� a range of housing densities, types, and sizes provides residential options for citi-zens of all ages and incomes;
� economic development and natural resource-based businesses that promote employment opportunities for all income levels within the capacity of the State’s natural resources, public services, and public facilities are encouraged;
� land and water resources, including the Chesapeake and coastal bays, are carefully managed to restore and maintain healthy air and water, natural systems, and liv-ing resources;
� waterways, forests, agricultural areas, open space, natural systems, and scenic areas are conserved;
� government, business entities, and residents are responsible for the creation of sustainable communities by collaborating to balance efficient growth with resource protection;
� strategies, policies, programs, and funding for growth and development, resource conservation, infrastructure, and transportation are integrated across the local, regional, state, and interstate levels to achieve these visions.
In 1997, the State General Assembly enacted a series of legislation known collectively as the Smart Growth and Neighborhood Conservation Initiatives. These initiatives included the Smart Growth Areas Act as well as the creation of several State grant programs to promote growth management and neighborhood conservation. The 1997 Smart Growth Areas Act reflected the statewide growth management policy to support and revitalize existing communities and direct growth to areas where there has already been significant financial investment in existing infrastructure. This legislation directs State funding for infrastructure to Priority Funding Areas (PFAs). These areas are existing communities or other locally desig-nated areas where the State and local jurisdictions want to encourage and support economic development and new growth consistent with the 1992 Visions. Local jurisdictions were required to designate Priority Fund-ing Areas based on six criteria defined by the State. Anne Arundel County designated Priority Funding Areas in 1998 that are consistent with State policies and guidelines and with the County’s General Development Plan and Land Use Plan. Collectively these serve to define the County’s targeted growth areas.
In 2006, the General Assembly enacted several new legislative bills related to planning and zoning that placed new requirements on local comprehensive plans. House Bill 1141
Smart growth includes revitalizing existing
communities and directing growth to areas where
public infrastructure is in place.
2009GeneralDevelopentPlan
Introduction
Page 5
Chapter 1
The General Development Plan serves as the core of the County’s land use planning program. It establishes the overall policy framework for growth and development. Its recommendations are implemented using a variety of tools and mechanisms, including additional planning documents. The following is a summary of the County’s comprehen-sive planning framework:
� General Development Plan – the overall comprehensive plan that establishes policies and recommendations to guide decisions about growth and development, land preservation, resource protection, and the provision of infrastructure and services;
� Small Area Plans – sixteen community-based plans that were prepared to refine and help implement the goals and recommendations of the 1997 GDP and to increase public outreach at the community level;
� Sector Plans – plans that provide guidance for growth and development in specific areas with unique characteristics that require a specific set of policies, guidelines or standards targeted to that particular sector or area. These include the Parole Urban Design Plan and the Odenton Town Center Master Plan;
� Functional Master Plans – plans that focus on a specific function of the County government, such as the provision of public utilities or recreation opportunities, or on a specific goal such as the establishment of a greenways network. These include the County’s Water and Sewer Master Plan; Greenways Master Plan; Pedestrian and Bicycle Master Plan; Land Preservation, Parks, and Recreation Plan; Consolidated Plan; and Transit Development Plan;
� Facilities Plans and Strategic Plans – these plans are usually done by specific county agencies or service providers for strategic planning and capital budgeting purposes. They typically include more detailed projections of capital facility and/or operational needs, and are updated more frequently than the General Devel-opment Plan and functional plans. Examples include the Emergency Operations Plan and the Educational Facilities Master Plan, which is updated annually;
� Development Regulations – development regulations are one of the principal mechanisms used to implement the County’s land use and development policies, as adopted in the General Development Plan. Key sections of the County Code that regulate land use and development are Article 18, Zoning; Article 17, Sub-division and Development; and Article 16, Floodplain Management, Sediment Control, and Stormwater Management. These regulations can be supplemented by
requires all local governments to include a Water Resources Plan Element in their com-prehensive plans. The purpose of this element is to provide an assessment of the impacts of existing and future land use plans on area water resources, including water and waste-water supply capacities and local tributaries. The Agricultural Stewardship Act of 2006 (House Bill 2) requires counties with certified agricultural land preservation programs to designate Priority Preservation Areas for the purpose of streamlining State and local funds used for agricultural preservation. Both of these elements are incorporated in Anne Arundel County’s 2009 General Development Plan.
The Planning Framework
2009GeneralDevelopentPlan
Chapter 1
Page 6
Introduction
The planning process for the 2009 update to the General Development Plan began in the summer of 2007 and extended through the winter of 2009. The process was con-ducted under two phases. During Phase I, a series of Background Reports were prepared on specific topics, or subjects, relevant to the GDP. The Background Reports summarized existing conditions, programs, processes, and other data relevant to each topic. They also identified current and anticipated needs to be addressed in the General Development Plan.
These Background Reports were useful in two ways. First, they were posted on the County web site as an informational tool. Secondly, the information and conclusions in these reports were used by County staff in developing the policies and strategies in the GDP. Background Reports were prepared on the following topics:
These reports were completed and presented on the County web site between February and June of 2008. At the end of this phase, County staff conducted a public briefing before the Planning Advisory Board in June 2008 to present and discuss the major find-ings and conclusions from Phase I.
During Phase II of the process, planning analysis was completed as needed to develop the plan policies and recommendations and to compile a Public Review Draft Plan. This phase
design or procedures manuals that establish more specific criteria or guidelines. For example, Article 16 of the County Code requires that the County prepare and regularly update a Stormwater Management Practices and Procedures Manual;
� Capital Budget and Program – the Capital Budget is another principal tool used in implementing GDP land use policies, in that it enables the County to program available funds for capital facilities needed to serve new growth and develop-ment. The Capital Budget is prepared for a six-year timeframe and is updated and adopted by the County Council annually.
As seen, the overall process of land use planning and growth management in the County is built upon a hierarchy of plans, from the more general policy plan which is the GDP, to the more specific functional and facilities plans, and finally to the implementation tools. The GDP allows the entire planning framework to be linked to a core set of land use policies.
Agricultural Land Preservation Natural ResourcesCommunity Services Public SafetyCultural Resources Public UtilitiesEconomic Development Sea Level RiseHousing TransportationLand Use Water Resources
GDP Planning Process
2009GeneralDevelopentPlan
Introduction
Page 7
Chapter 1
took place between July 2008 and December 2008. The Public Review Draft was pre-sented on the County web site for public review in January 2009, and was also presented at a series of four Public Forums conducted at different locations throughout the County. Public comment on the Draft Plan was received at the forums as well as in writing during the public comment period. Comments received were evaluated by staff and incorporated in the plan as appropriate and feasible. Phase II ended with the preparation of a Final Draft Plan.
The GDP process also included two advisory groups. The Technical Advisory Panel con-sisted of 15 County department heads or their appointees. The panel’s role was to review and advise on the Background Reports, the draft policies and strategies, and the Draft Plan prepared by the staff prior to public release. This enabled the County to ensure consistency and oversight among the many County agencies that work collectively to implement the GDP.
The second advisory group was the Special Advisory Committee for the General Develop-ment Plan. This committee was established in March 2008 and was composed of County citizens selected through an application process and appointed by the County Executive. The role of this committee was to provide review and comment to the Planning Advisory Board on the Final Draft Plan. The Special Advisory Committee also worked with the planning staff during Phase II as draft policies and recommendations were being formu-lated in order to provide input and feedback.Prior to County Council introduction, the Final Draft GDP was presented at a public brief-ing before the Planning Advisory Board and made available on the website for public review. The Final Draft Plan was then introduced to the County Council for public hearing and adoption.
The 2009 General Development Plan is organized using a combination of major themes (e.g. Balanced Growth; Community Preservation) as well as major elements (e.g. Land Use; Transportation). The four themes were derived from the overall plan vision, as pre-sented in Chapter 2, and represent this Plan’s priorities for the future in a broad sense. The other major chapters address other required components of the comprehensive plan. The organizational structure is outlined below:
� Chapter 1 Introduction � Chapter 2 Overview of Anne Arundel County � Chapter 3 Balanced Growth and Sustainability � Chapter 4 Community Preservation and Enhancement � Chapter 5 Environmental Stewardship � Chapter 6 Quality Public Services � Chapter 7 The Land Use Plan � Chapter 8 Priority Preservation Area � Chapter 9 The Transportation Plan
Structure of the GDP
2009GeneralDevelopentPlan
Chapter 1
Page 8
Introduction
� Chapter 10 The Water Resources Plan � Chapter 11 Concurrency Management Plan � Chapter 12 Implementation Plan
As mentioned, each theme represents a broad priority for the future. Each thematic chap-ter (chapters 3 through 7) presents some background information and highlights the important needs in addressing that priority. The user is encouraged to refer to the series of GDP Background Reports for more in-depth background information. Each thematic chapter then presents a list of goals, policies, and actions that will help to achieve the overall Plan vision. Goals, policies, and actions are a fairly standard hierarchy used in comprehensive planning and can be defined as follows:
� Goal: a statement of a desired end; the objective toward which an action is directed.
� Policy: a statement of intent upon which future decisions are based. � Action: a specific task to be undertaken in order to achieve a goal.
Chapters 7 through 10 address the four major plan components required by State plan-ning law: land use and development policies, a priority preservation plan, a transportation plan, and a water resources plan. (Other State requirements regarding sensitive areas and mineral resources are addressed in Chapter 5). Chapter 11 addresses concurrency man-agement as required by Article 18 of the County Code with regard to available and future capacities of specified public facilities. Finally, Chapter 12 lays out a schedule and steps for implementing the various actions recommended in this Plan.
2009GeneralDevelopentPlan
Chapter 2:Overview of Anne Arundel County

Overview of Anne Arundel County
Page 11
Chapter 2
Anne Arundel County was established in the 17th century and adopted its own governing charter in 1964. Over the centuries it has evolved from an early Colonial settlement into a thriving suburban county. Located in Central Maryland, it lies within the Consolidated Baltimore-Washington Metropolitan Area and benefits from its proximity to both major cities as well as its location along the Mid-Atlantic corridor. Yet, in spite of the strong urban influences, the County has its own uniqueness and an impressive range of diver-sity. It is home to the historic City of Annapolis that has served as the State Capital since 1694. With over 400 miles of tidal shoreline along the Chesapeake Bay -- one of the largest natural estuaries in North America -- and it tributaries, the County has a long history of boating, sailing, and seafood harvesting. The County contains suburban neighborhoods such as those found in Pasadena and Crofton, as well as small waterfront communities such as Shady Side. It contains more densely developed hubs such as the Parole and Glen Burnie town centers, and also wide expanses of agricultural and scenic rural areas such as Davidsonville, Harwood, and Lothian. It is home to major Federal institutions including Fort Meade Military Base and NSA as well as the Baltimore Washington International Airport, one of the busiest international airports in the eastern U.S. Its economy is com-prised of major national corporations as well as small family businesses and farming operations. In short, the County continues to offer something for just about everyone.
The fact that Anne Arundel County has succeeded in retaining such diversity in spite of steadily increasing growth pressures over the past several decades is somewhat unique in itself. Ever since the depression era in the 1930s, the County’s population has continued to grow steadily, from 68,375 residents in 1940 to 489,656 residents in 2000 according to U.S. Census Bureau decennial data. The Baltimore Metropolitan Region1 as a whole has experienced strong growth in population over the last eighty years, and Anne Arundel County has been one of the fastest growing counties in the region.
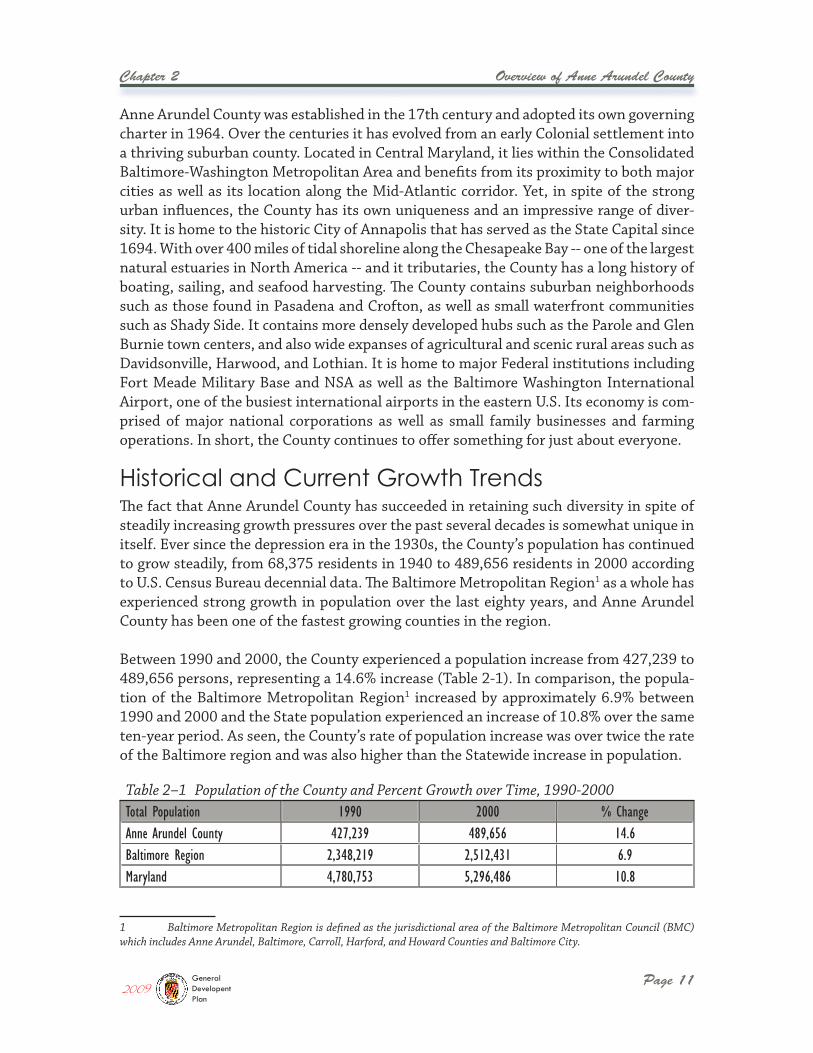
Between 1990 and 2000, the County experienced a population increase from 427,239 to 489,656 persons, representing a 14.6% increase (Table 2-1). In comparison, the popula-tion of the Baltimore Metropolitan Region1 increased by approximately 6.9% between 1990 and 2000 and the State population experienced an increase of 10.8% over the same ten-year period. As seen, the County’s rate of population increase was over twice the rate of the Baltimore region and was also higher than the Statewide increase in population.
1 Baltimore Metropolitan Region is defined as the jurisdictional area of the Baltimore Metropolitan Council (BMC) which includes Anne Arundel, Baltimore, Carroll, Harford, and Howard Counties and Baltimore City.
Table 2–1 Population of the County and Percent Growth over Time, 1990-2000Total Population 1990 2000 % ChangeAnne Arundel County 427,239 489,656 14.6Baltimore Region 2,348,219 2,512,431 6.9Maryland 4,780,753 5,296,486 10.8
Historical and Current Growth Trends
2009GeneralDevelopentPlan
Chapter 2
Page 12
Overview of Anne Arundel County
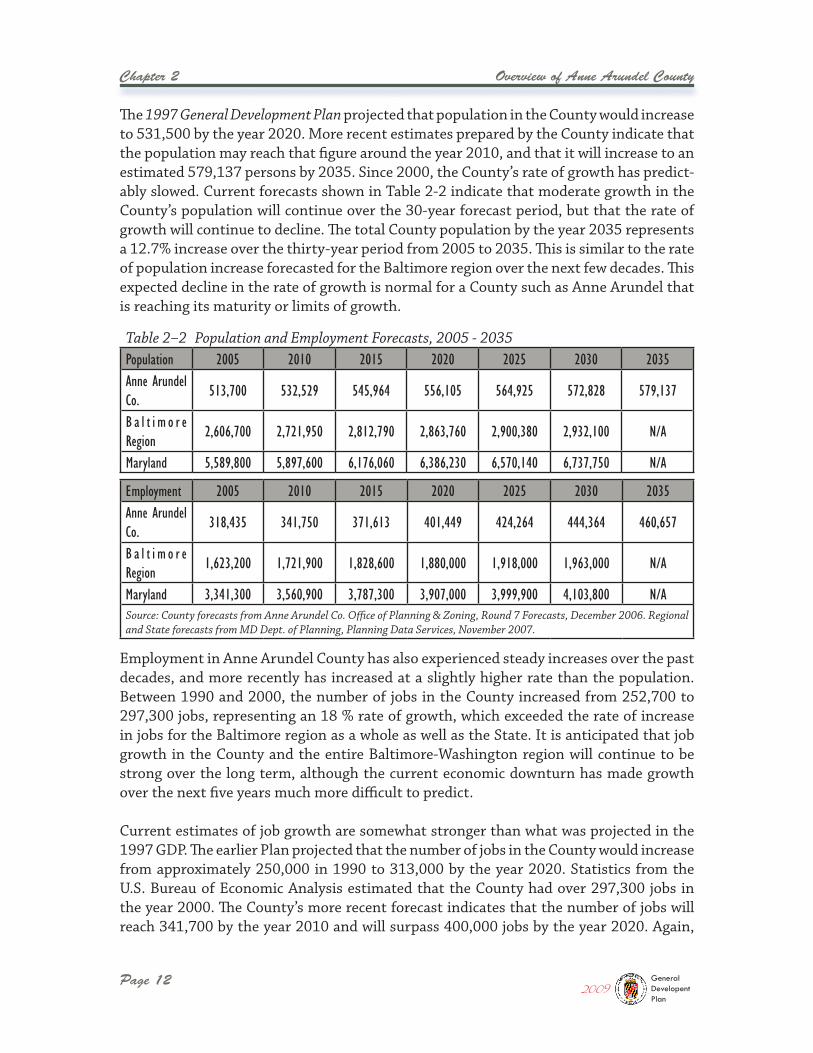
The 1997 General Development Plan projected that population in the County would increase to 531,500 by the year 2020. More recent estimates prepared by the County indicate that the population may reach that figure around the year 2010, and that it will increase to an estimated 579,137 persons by 2035. Since 2000, the County’s rate of growth has predict-ably slowed. Current forecasts shown in Table 2-2 indicate that moderate growth in the County’s population will continue over the 30-year forecast period, but that the rate of growth will continue to decline. The total County population by the year 2035 represents a 12.7% increase over the thirty-year period from 2005 to 2035. This is similar to the rate of population increase forecasted for the Baltimore region over the next few decades. This expected decline in the rate of growth is normal for a County such as Anne Arundel that is reaching its maturity or limits of growth.
Employment in Anne Arundel County has also experienced steady increases over the past decades, and more recently has increased at a slightly higher rate than the population. Between 1990 and 2000, the number of jobs in the County increased from 252,700 to 297,300 jobs, representing an 18 % rate of growth, which exceeded the rate of increase in jobs for the Baltimore region as a whole as well as the State. It is anticipated that job growth in the County and the entire Baltimore-Washington region will continue to be strong over the long term, although the current economic downturn has made growth over the next five years much more difficult to predict.
Current estimates of job growth are somewhat stronger than what was projected in the 1997 GDP. The earlier Plan projected that the number of jobs in the County would increase from approximately 250,000 in 1990 to 313,000 by the year 2020. Statistics from the U.S. Bureau of Economic Analysis estimated that the County had over 297,300 jobs in the year 2000. The County’s more recent forecast indicates that the number of jobs will reach 341,700 by the year 2010 and will surpass 400,000 jobs by the year 2020. Again,
Table 2–2 Population and Employment Forecasts, 2005 - 2035Population 2005 2010 2015 2020 2025 2030 2035Anne Arundel Co.
513,700 532,529 545,964 556,105 564,925 572,828 579,137
B a l t i m o r e Region
2,606,700 2,721,950 2,812,790 2,863,760 2,900,380 2,932,100 N/A
Maryland 5,589,800 5,897,600 6,176,060 6,386,230 6,570,140 6,737,750 N/A
Employment 2005 2010 2015 2020 2025 2030 2035Anne Arundel Co.
318,435 341,750 371,613 401,449 424,264 444,364 460,657
B a l t i m o r e Region
1,623,200 1,721,900 1,828,600 1,880,000 1,918,000 1,963,000 N/A
Maryland 3,341,300 3,560,900 3,787,300 3,907,000 3,999,900 4,103,800 N/ASource: County forecasts from Anne Arundel Co. Office of Planning & Zoning, Round 7 Forecasts, December 2006. Regional and State forecasts from MD Dept. of Planning, Planning Data Services, November 2007.
2009GeneralDevelopentPlan
Overview of Anne Arundel County
Page 13
Chapter 2
The continued growth in population and jobs has brought about several major develop-ments that have been initiated or completed since the County’s last GDP was adopted in 1997.
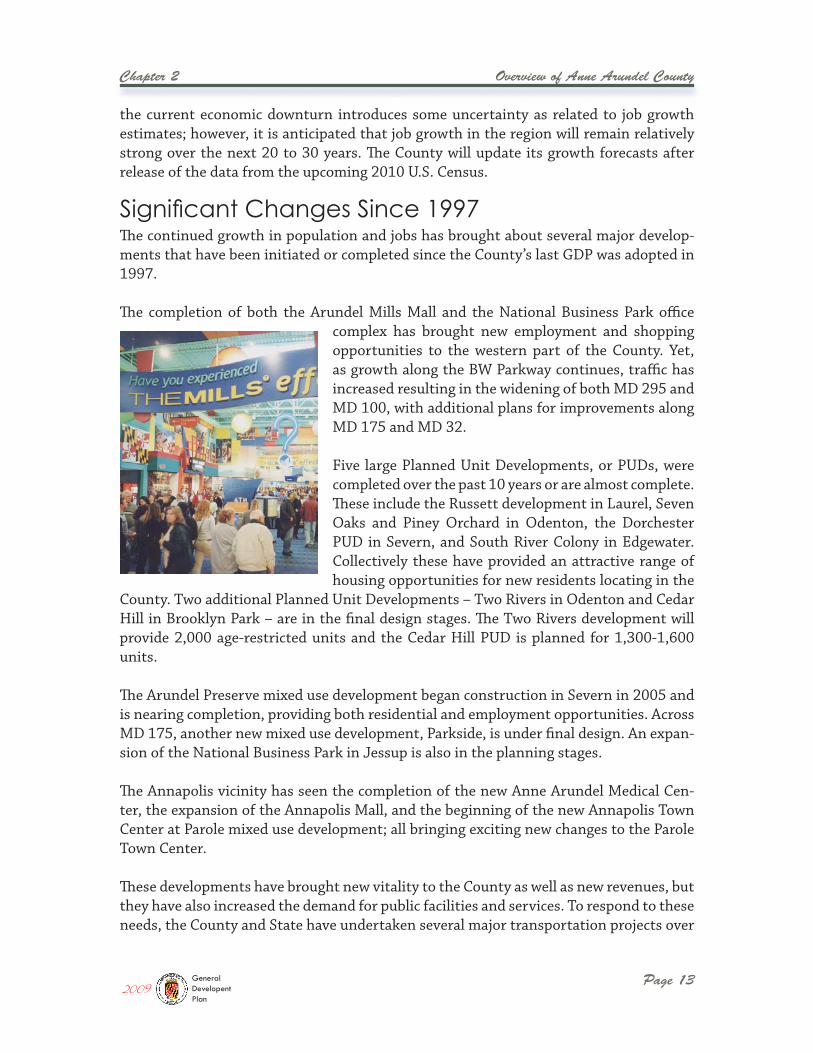
The completion of both the Arundel Mills Mall and the National Business Park office complex has brought new employment and shopping opportunities to the western part of the County. Yet, as growth along the BW Parkway continues, traffic has increased resulting in the widening of both MD 295 and MD 100, with additional plans for improvements along MD 175 and MD 32.
Five large Planned Unit Developments, or PUDs, were completed over the past 10 years or are almost complete. These include the Russett development in Laurel, Seven Oaks and Piney Orchard in Odenton, the Dorchester PUD in Severn, and South River Colony in Edgewater. Collectively these have provided an attractive range of housing opportunities for new residents locating in the
County. Two additional Planned Unit Developments – Two Rivers in Odenton and Cedar Hill in Brooklyn Park – are in the final design stages. The Two Rivers development will provide 2,000 age-restricted units and the Cedar Hill PUD is planned for 1,300-1,600 units.
The Arundel Preserve mixed use development began construction in Severn in 2005 and is nearing completion, providing both residential and employment opportunities. Across MD 175, another new mixed use development, Parkside, is under final design. An expan-sion of the National Business Park in Jessup is also in the planning stages.
The Annapolis vicinity has seen the completion of the new Anne Arundel Medical Cen-ter, the expansion of the Annapolis Mall, and the beginning of the new Annapolis Town Center at Parole mixed use development; all bringing exciting new changes to the Parole Town Center.
These developments have brought new vitality to the County as well as new revenues, but they have also increased the demand for public facilities and services. To respond to these needs, the County and State have undertaken several major transportation projects over
the current economic downturn introduces some uncertainty as related to job growth estimates; however, it is anticipated that job growth in the region will remain relatively strong over the next 20 to 30 years. The County will update its growth forecasts after release of the data from the upcoming 2010 U.S. Census.
Significant Changes Since 1997
2009GeneralDevelopentPlan
Chapter 2
Page 14
Overview of Anne Arundel County
the past ten years to help ease these development pressures and provide better access in and around the County. Projects include:
� Completion of double tracking of the Baltimore Central Light Rail system in Lin-thicum and Ferndale.
� Improvements to MD 100, completing a continuous 4-lane freeway between Columbia and Pasadena.
� Improvements to MD 32 at Fort Meade. � Completion of the MD 2/US 50-301 interchange improvements in Parole. � Construction of the Arundel Mills Boulevard interchange with MD 295. � Construction of East-West Boulevard, providing access between Veterans High-
way and Ritchie Highway. � Improvements to Mountain Road (MD 177) in Pasadena. � Improvements to accommodate new and anticipated development in the Oden-
ton Town Center including Odenton Road, Morgan Road, and the MD 175 roundabout.
Increased development has also increased the need for new public services. To address some of these demands, the County has constructed new fire stations in Severn and Annapolis Neck and made major improvements to the Brooklyn Park Fire Station. The Western District Police Station has been expanded, a new Southern District Police Sta-tion was constructed near South River Colony, and a new substation was established at Arundel Mills. Following the events of September 11th, 2001 and the impact of several major storms, the County established a new state of the art Emergency Operations Cen-ter in the Glen Burnie Town Center that has improved the County’s ability to respond to any future major emergencies that require coordination of all public safety providers.
New educational facilities include the Anne Arundel Community College expansions at both the Glen Burnie Town Center and Arundel Mills. Several new elementary schools serve communities such as Seven Oaks, Gambrills and Pasadena. In addition, library branches in Crofton and Odenton have been expanded.
To serve the County’s senior population, the Department of Aging and Disabilities opened new or expanded facilities in Pasadena, Brooklyn Park and Odenton. While these facilities address some of the increased needs of County citizens, meeting the demand for public facilities and services is an increasing challenge for the County as the cost of providing these facilities and services continues to rise. The County will need to place an increased focus on growth management and concurrency planning in the future. This will be further addressed in Chapter 11 of this Plan.
Since adoption of the 1997 GDP, the County has completed several major planning ini-tiatives, research projects, and legislative revisions in order to implement the various recommendations in the 1997 Plan. The key accomplishments are listed in Table 2-3.
Key Land Use Planning Initiatives Since 1997
2009GeneralDevelopentPlan
Overview of Anne Arundel County
Page 15
Chapter 2
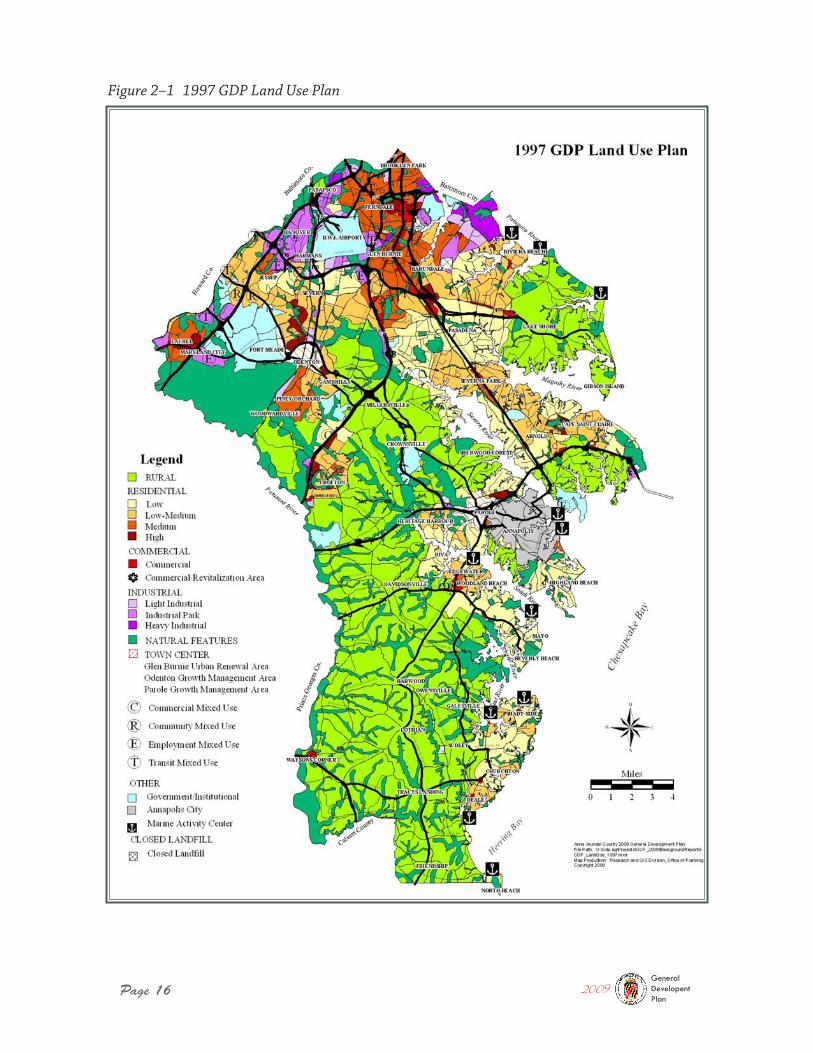
The 1997 Land Use Plan shown in Figure 2-1 complied with the “smart growth” visions of the 1992 Planning Act by locating planned growth in suitable areas, where public infrastructure and services are available, and by preserving the County’s rural areas for primarily low density development or agricultural uses.
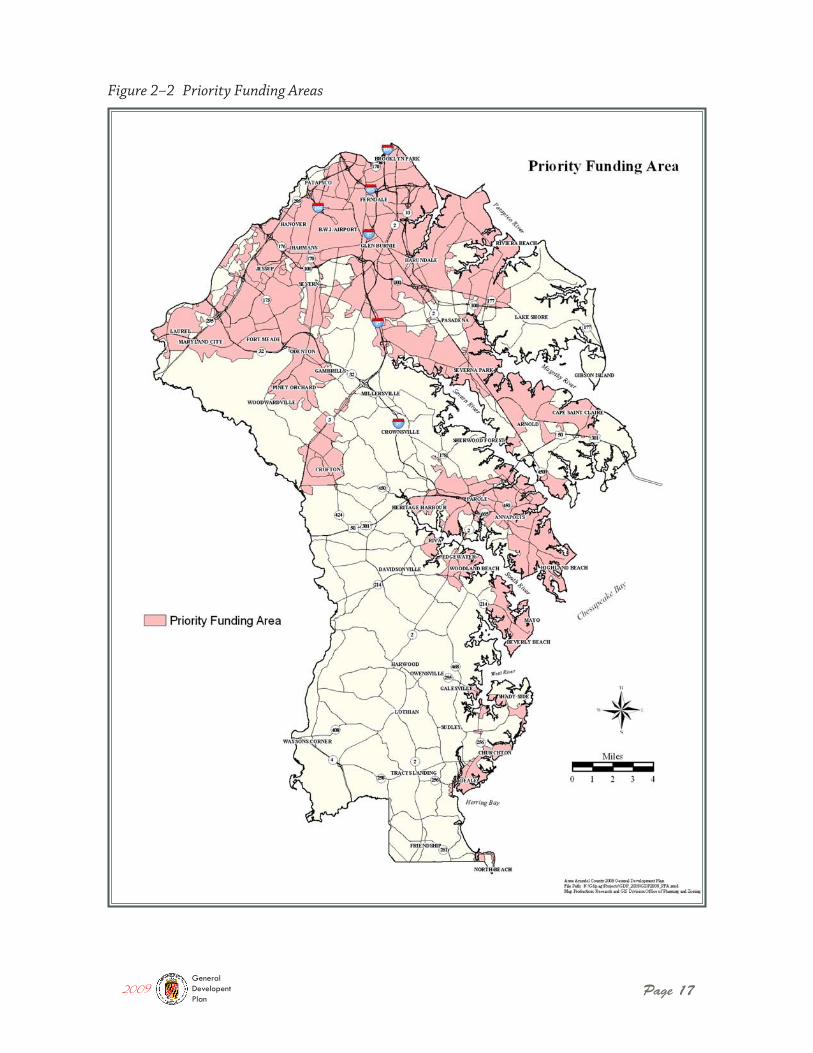
The County then followed up this effort by designating a Priority Funding Area (PFA) that is consistent with State guidelines and criteria and with the 1997 Land Use Plan. The “Smart Growth” Areas Act of 1997 required the State to target funding for “growth-related” projects (e.g. highways, sewer and water construction, economic development assistance, etc.) to Priority Funding Areas in each local jurisdiction. This furthers the goal of directing new growth to the most suitable areas, consistent with the County’s compre-hensive land use plan. The County’s current Priority Funding Area is shown in Figure 2-2. The PFA is generally concentrated in the northern and western parts of the county, along the MD 2 corridor, and around Annapolis.
At the same time, to further the goal of preserving the County’s rural areas, in 1998 the County designated a Rural Legacy Area in order to help focus land conservation efforts. This allowed the County to participate in the State’s Rural Legacy grant pro-gram through which development rights can be purchased from landowners in the area and properties can be protected under conservation easements. The County’s Rural Legacy Area (RLA)
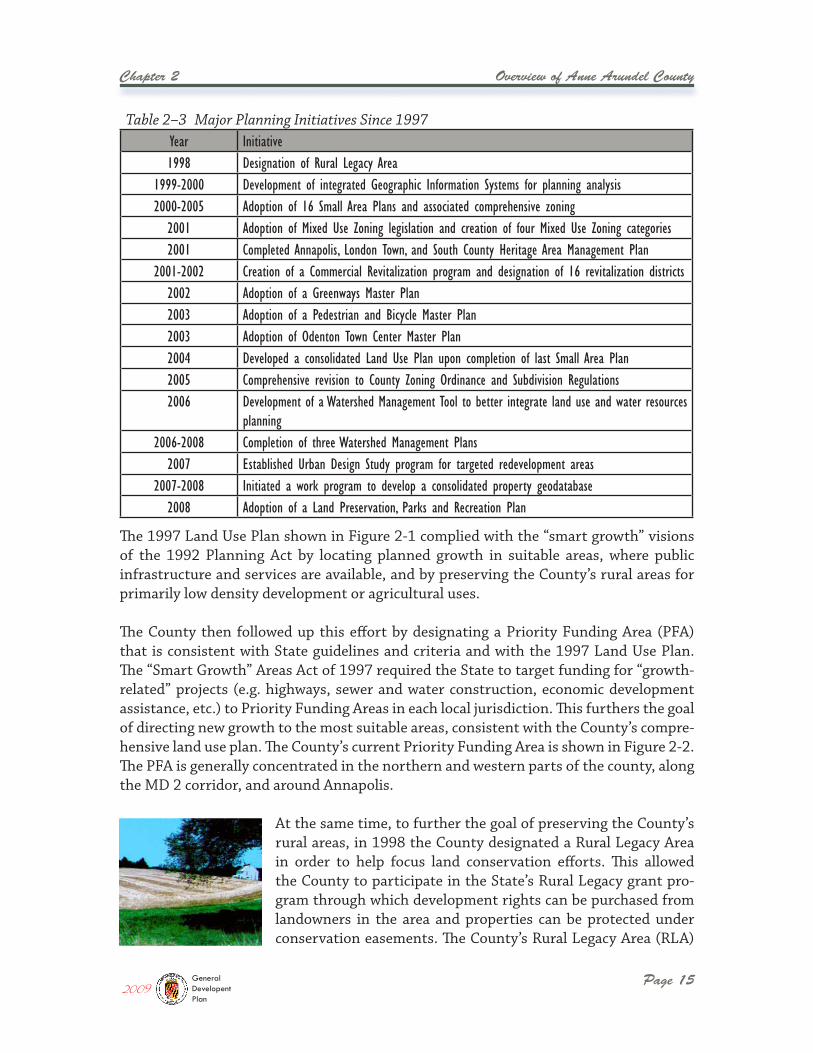
Table 2–3 Major Planning Initiatives Since 1997Year Initiative1998 Designation of Rural Legacy Area
1999-2000 Development of integrated Geographic Information Systems for planning analysis2000-2005 Adoption of 16 Small Area Plans and associated comprehensive zoning
2001 Adoption of Mixed Use Zoning legislation and creation of four Mixed Use Zoning categories2001 Completed Annapolis, London Town, and South County Heritage Area Management Plan
2001-2002 Creation of a Commercial Revitalization program and designation of 16 revitalization districts2002 Adoption of a Greenways Master Plan2003 Adoption of a Pedestrian and Bicycle Master Plan2003 Adoption of Odenton Town Center Master Plan2004 Developed a consolidated Land Use Plan upon completion of last Small Area Plan2005 Comprehensive revision to County Zoning Ordinance and Subdivision Regulations2006 Development of a Watershed Management Tool to better integrate land use and water resources
planning2006-2008 Completion of three Watershed Management Plans
2007 Established Urban Design Study program for targeted redevelopment areas2007-2008 Initiated a work program to develop a consolidated property geodatabase
2008 Adoption of a Land Preservation, Parks and Recreation Plan
2009GeneralDevelopentPlan
Page 16 2009GeneralDevelopentPlan
Figure 2–1 1997 GDP Land Use Plan
Page 172009GeneralDevelopentPlan
Figure 2–2 Priority Funding Areas
Chapter 2
Page 18
Overview of Anne Arundel County
is approximately 32,400 acres in size and is located in South County. The Rural Legacy Program works in conjunction with the County’s Agricultural and Woodland Preserva-tion Program as well as the State’ Agricultural Land Preservation program to preserve rural areas and promote agricultural uses.
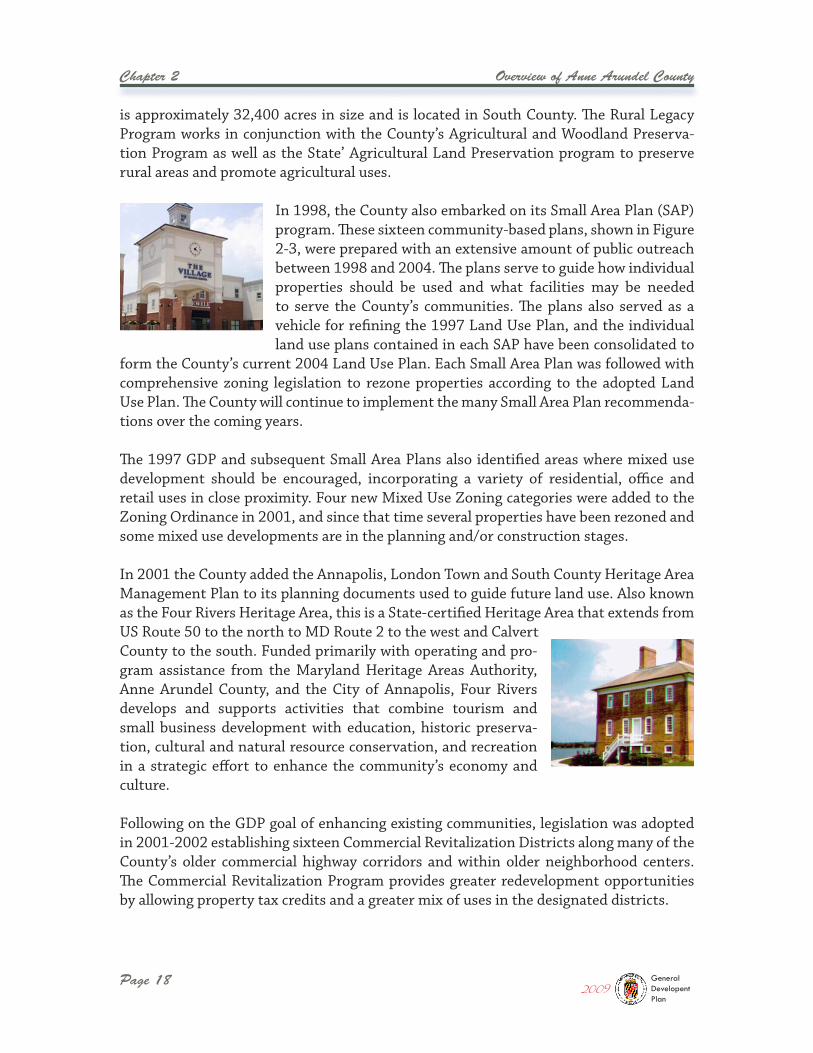
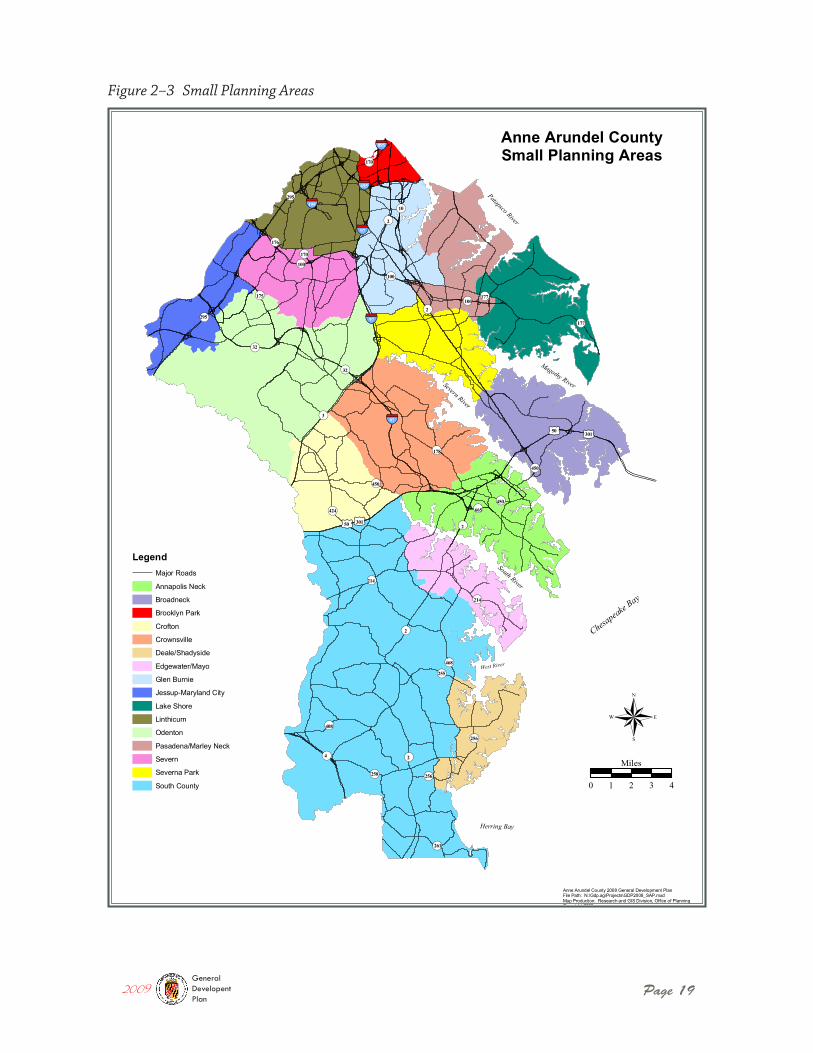
In 1998, the County also embarked on its Small Area Plan (SAP) program. These sixteen community-based plans, shown in Figure 2-3, were prepared with an extensive amount of public outreach between 1998 and 2004. The plans serve to guide how individual properties should be used and what facilities may be needed to serve the County’s communities. The plans also served as a vehicle for refining the 1997 Land Use Plan, and the individual land use plans contained in each SAP have been consolidated to
form the County’s current 2004 Land Use Plan. Each Small Area Plan was followed with comprehensive zoning legislation to rezone properties according to the adopted Land Use Plan. The County will continue to implement the many Small Area Plan recommenda-tions over the coming years.
The 1997 GDP and subsequent Small Area Plans also identified areas where mixed use development should be encouraged, incorporating a variety of residential, office and retail uses in close proximity. Four new Mixed Use Zoning categories were added to the Zoning Ordinance in 2001, and since that time several properties have been rezoned and some mixed use developments are in the planning and/or construction stages.
In 2001 the County added the Annapolis, London Town and South County Heritage Area Management Plan to its planning documents used to guide future land use. Also known as the Four Rivers Heritage Area, this is a State-certified Heritage Area that extends from US Route 50 to the north to MD Route 2 to the west and Calvert County to the south. Funded primarily with operating and pro-gram assistance from the Maryland Heritage Areas Authority, Anne Arundel County, and the City of Annapolis, Four Rivers develops and supports activities that combine tourism and small business development with education, historic preserva-tion, cultural and natural resource conservation, and recreation in a strategic effort to enhance the community’s economy and culture.
Following on the GDP goal of enhancing existing communities, legislation was adopted in 2001-2002 establishing sixteen Commercial Revitalization Districts along many of the County’s older commercial highway corridors and within older neighborhood centers. The Commercial Revitalization Program provides greater redevelopment opportunities by allowing property tax credits and a greater mix of uses in the designated districts.
2009GeneralDevelopentPlan
Page 192009GeneralDevelopentPlan
Figure 2–3 Small Planning Areas
!( !(
!(
!(!(
!(
!(
£¤ £¤
!(
!(
!(
!(
!(
!( !(
!(
!(
!(
§̈¦
§̈¦
!(
!(
!(
!(
£¤£¤
§̈¦
§̈¦
§̈¦
§̈¦!(
!(!(
!(
!(
!(
!(
!(
!(
!(
!(
!(
!(
!(
!(
895
695
195295
170
170
100
100177
295
214
100
97
176
32
97177
32
175
450
97
178
450665
450
214
468
258
408
256
256
50301
50 301
2
2
3
2
2
10
2
4
255
261
424
®
Anne Arundel CountySmall Planning Areas
Anne Arundel County 2008 General Development PlanFile Path: N:\Gdp.ag\Projects\GDP2008_SAP.mxdMap Production: Research and GIS Division, Office of PlanningCopyright 2008
Patapsco River
Magothy RiverSevern River
South River
West River
Herring Bay
Chesapeake
Bay
0 1 2 3 4
Miles
LegendMajor Roads
Annapolis Neck
Broadneck
Brooklyn Park
Crofton
Crownsville
Deale/Shadyside
Edgewater/Mayo
Glen Burnie
Jessup-Maryland City
Lake Shore
Linthicum
Odenton
Pasadena/Marley Neck
Severn
Severna Park
South County
Chapter 2
Page 20
Overview of Anne Arundel County
In response to another GDP recommendation and to help protect important natural resources, the County prepared a master plan to develop a countywide greenways network. The Greenways Master Plan was adopted in 2002 with the goal of establishing an inter-connected network of protected corridors of woodlands and open space that will protect ecologically valuable lands, provide open space and recreational benefits, and preserve wildlife habitats. The proposed greenways network covers nearly 72,000 acres of land and approximately 50 percent of the network is protected either under State, Federal, or local government ownership, under agricultural or environmental easements, as private conservation land, or under Open Space zoning regulations.
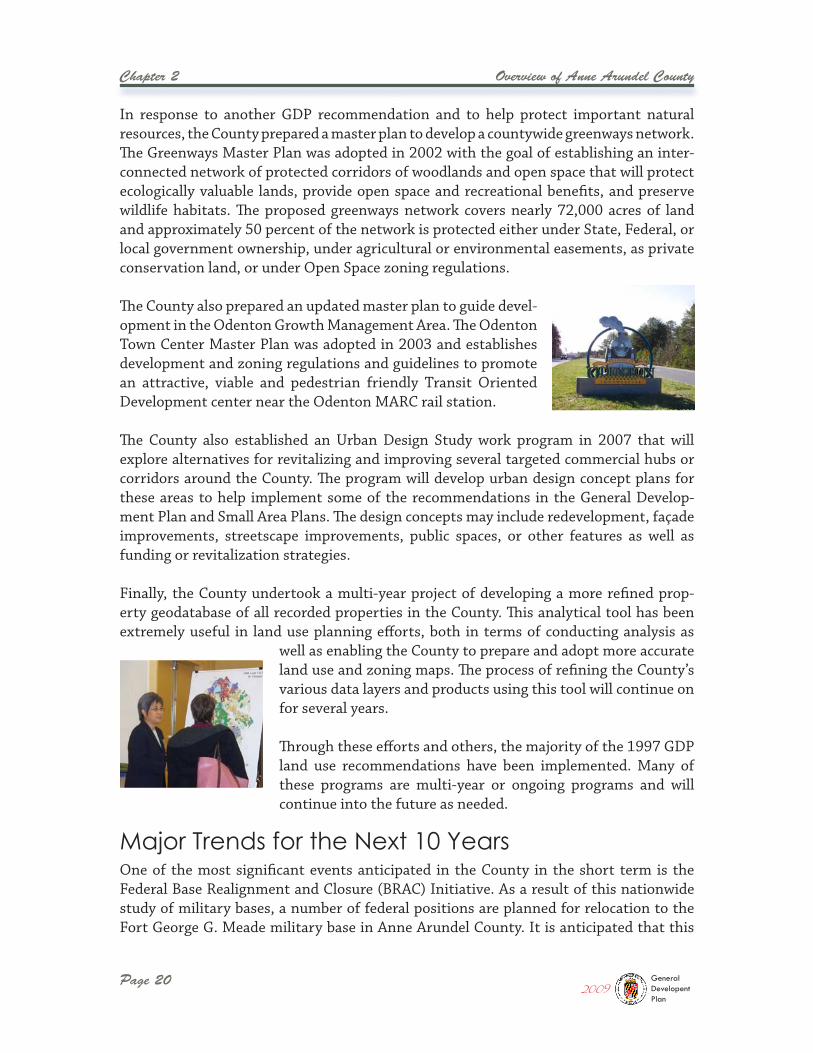
The County also prepared an updated master plan to guide devel-opment in the Odenton Growth Management Area. The Odenton Town Center Master Plan was adopted in 2003 and establishes development and zoning regulations and guidelines to promote an attractive, viable and pedestrian friendly Transit Oriented Development center near the Odenton MARC rail station.
The County also established an Urban Design Study work program in 2007 that will explore alternatives for revitalizing and improving several targeted commercial hubs or corridors around the County. The program will develop urban design concept plans for these areas to help implement some of the recommendations in the General Develop-ment Plan and Small Area Plans. The design concepts may include redevelopment, façade improvements, streetscape improvements, public spaces, or other features as well as funding or revitalization strategies.
Finally, the County undertook a multi-year project of developing a more refined prop-erty geodatabase of all recorded properties in the County. This analytical tool has been extremely useful in land use planning efforts, both in terms of conducting analysis as
well as enabling the County to prepare and adopt more accurate land use and zoning maps. The process of refining the County’s various data layers and products using this tool will continue on for several years.
Through these efforts and others, the majority of the 1997 GDP land use recommendations have been implemented. Many of these programs are multi-year or ongoing programs and will continue into the future as needed.
One of the most significant events anticipated in the County in the short term is the Federal Base Realignment and Closure (BRAC) Initiative. As a result of this nationwide study of military bases, a number of federal positions are planned for relocation to the Fort George G. Meade military base in Anne Arundel County. It is anticipated that this
Major Trends for the Next 10 Years
2009GeneralDevelopentPlan
Overview of Anne Arundel County
Page 21
Chapter 2
relocation effort will bring both additional jobs and households to the County as well as to the region in general.
It is estimated that 22,000 new jobs will locate in Anne Arundel County as a direct result of BRAC: 5,695 new defense positions; 4,000 new jobs due to expansion of the National Security Agency; 10,000 new jobs to be located at a planned secured office complex to be developed under an Enhanced Use Lease (EUL) on the Fort Meade base; and 2,000 additional jobs attributed to government contractors or other service providers who will locate in the County as a result of the base realignment. Most of this job relocation and expansion will occur within the next five years, or by the year 2012 to 2014 timeframe. Many of these jobs are expected to be highly paid positions in information technology and related fields.
In addition to the anticipated job growth, the State has estimated that over 28,000 new households will locate in Maryland as a result of BRAC. It is projected that approximately 4,500 of these households will locate in Anne Arundel County, with the remainder locat-ing in Harford, Baltimore, Montgomery, Cecil, Prince Georges, and Howard Counties and Baltimore City. It is anticipated that approved residential units in the development pipeline combined with development projects in the planning stages will provide suf-ficient housing capacity in the County to serve this BRAC-related growth. However, the County will continue to assess and plan for the potential impacts on public facilities and infrastructure such as State and local highways.
In the longer term, beyond the 20 year planning horizon, the land use planning priori-ties in the County are likely to gradually shift from a focus on new development to a focus on redevelopment and revitalization, as the County matures and as vacant land for development becomes scarcer. While the existing development capacity is expected to be adequate to serve new growth over the 20 year horizon, any significant increases in capacity in the future would likely require shifts in existing land use policies.
Along with these changes, a priority for both the short and long term is strategic plan-ning for water resource protection and a focus on mitigation to address the impacts of existing and planned land uses on water resources. In light of new State limits on pollu-tion loads that can be received by area tributaries, future land use plans and policies will have to account for and address watershed impacts. This topic will be covered in full in Chapter 10.
It is estimated that 22,000 new jobs will locate in Anne Arundel County as a direct result of BRAC.
As mentioned above, the County completed and adopted sixteen Small Area Plans between 2000 and 2004. Each of these plans contains a vision for that planning area, prepared with input from the public as well as advisory committees, and represents those future
Vision for 2009 and Beyond
2009GeneralDevelopentPlan
Chapter 2
Page 22
Overview of Anne Arundel County
conditions desired by the citizens. Since that planning program was completed fairly recently and with a significant amount of public outreach, it was decided that the visions adopted through that process should serve as the starting point for this GDP update.
As expected in a county as large as Anne Arundel, there is some variation among the different community visions. While residents of Brooklyn Park and Glen Burnie want to see revitalization of commercial corridors and improved community facilities and infra-structure, the residents of South County and Crownsville are more focused on retaining their rural communities and identity. In those areas that have experienced more growth recently, such as Odenton and Jessup, the citizens tend to rank balancing land uses, provision of adequate public facilities, and multimodal transportation connectivity as high priorities. Communities along the County’s peninsulas and waterfront areas often name watershed protection and preserving community character as key aspects of their visions.
However, throughout all of these community visions there are overarching priorities, or themes, that are heard throughout the County. These collectively can form a vision for the entire County that, if achieved, will serve the interests and hopes of all citizens in all communities. These themes are summarized as follows:
Balanced Growth and Sustainability: Citizens recognize the importance of economic vitality and a strong job market as well as that of preserving open spaces. They value the benefits of thriving town centers but also those of small and peace-ful rural communities. Some want to live in townhome developments with lots of services nearby; others prefer more suburban-style neighborhoods of single family bungalows and quiet backyards. They want the County to achieve the best balance of land uses possible, so that all citizens can experience and sustain a high quality of life.
Community Preservation and Enhancement: Community character and neighbor-hood conservation are terms that are heard frequently by county planners when working with local citizens. People choose to move to a neighborhood, or buy a home there, because they like the character of the community. They want to preserve the County’s unique and distinct communities, to retain and improve housing in older communities, to enhance older and underutilized commercial centers, to preserve the viability of long-standing agricultural areas, and to pro-tect the County’s cultural heritage.
Environmental Stewardship: Regardless of where one is in the County, local citizens will name environmental protection as one of their top priorities. They under-stand the importance of natural resource conservation and watershed protection on a local level, as it contributes to our quality of life; on a regional level, as the State and counties work collectively to protect the Chesapeake Bay; and also on a global level, as resource conservation increasingly becomes a priority for the
2009GeneralDevelopentPlan
Overview of Anne Arundel County
Page 23
Chapter 2
entire planet. They look to the County government to lead by example and to act as a true steward of the environment.
Quality Public Services: The public services that local citizens rely on every day – schools and libraries, senior centers and health centers, parks and recreational programs, water and sewer service, police and fire protection and emergency services, and a reliable transportation network – have a direct influence on their quality of life. Citizens in all parts of the County talk about the importance of these services, not only in terms of their individual well-being but also in making their communities attractive and desirable places to live. They want high quality public services that make them proud of their communities and of the County and that support the local and regional economy.
This is the County’s vision for 2009 and beyond. The following four chapters will address each of these themes in more detail and will lay out specific goals, policies, and actions that together will move the County toward realization of this vision.
2009GeneralDevelopentPlan
Community VisionC
om
munity Pres er vati o
n
and
Enhanc
emen
tEnviro nm
e n t a l S tew ard sh ip
Quality Public ServicesB
alan
ced
Gro
wt
h and
Sustainability


Chapter 3:Balanced Growthand Sustainability

Balanced Growth and Sustainability
Page 27
Chapter 3
A key objective of comprehensive planning is to promote the appropriate amount and type of growth that will result in attractive and vibrant communities, a strong local econ-omy, and stable fiscal conditions, as well as to achieve the best possible balance between growth and land preservation. The County has worked toward this objective since the adoption of its first comprehensive plan in 1968 and particularly since passage of the Smart Growth legislation in the 1990s.
Table 3-1 and Figure 3-1 below present the 2004 Land Use Plan (shown in Figure 3-2) by acreage and land use category with typical residential densities in dwelling units per acre (du/ac). Currently, over half of the County’s land area (52%) is planned for rural or low density residential uses. When combined with land designated as Natural Features (open space and environmental preservation areas), the percentage increases to nearly 70% of the total land area. Low-medium to high density residential uses account for 13% of the land area on the 2004 Plan, and areas planned for commercial and industrial uses combined account for only 6% of the land area. The mixed use and town center catego-ries combined account for less than 2%. Government and institutional areas account for another 6% of the land area, and the remaining 4% is used or planned for transportation and utility uses.
This 2004 Plan illustrates to some extent the challenges of implementing Smart Growth policies in a suburban jurisdiction. While the Land Use Plan allocates a large proportion of acreage for lower density residential land use (one half acre to five acre lots), which is often considered by planners to promote “sprawl” and not “smart growth”, it must be recognized that this land use pattern reflects to a large extent the community vision that has existed in the County over the past decades and that still exists today. In most of these established communities, residents feel strongly that they want to preserve their community’s character.
Therefore, the County has taken steps to concentrate new growth in defined areas since the 1980s. At that time, the allowable development densities in the County’s Rural areas were lowered to one lot per 20 acres with the intention of maintaining the rural character. During the same period, Parole, Odenton, and Glen Burnie were designated as town cen-ters to serve as major activity hubs. In the 1990s, the County designated Priority Funding Areas in which to concentrate new growth, and later designated mixed use areas where higher density land uses could be concentrated. The 2009 GDP follows in that trend by continuing to concentrate new growth in specific target areas, and maintaining the rural areas intact. Specific development policies for targeted growth areas, managed growth areas, and rural areas are presented in Chapter 7.
Current Land Use Pattern
Balancing Land Use, Growth and Fiscal Policies
2009GeneralDevelopentPlan
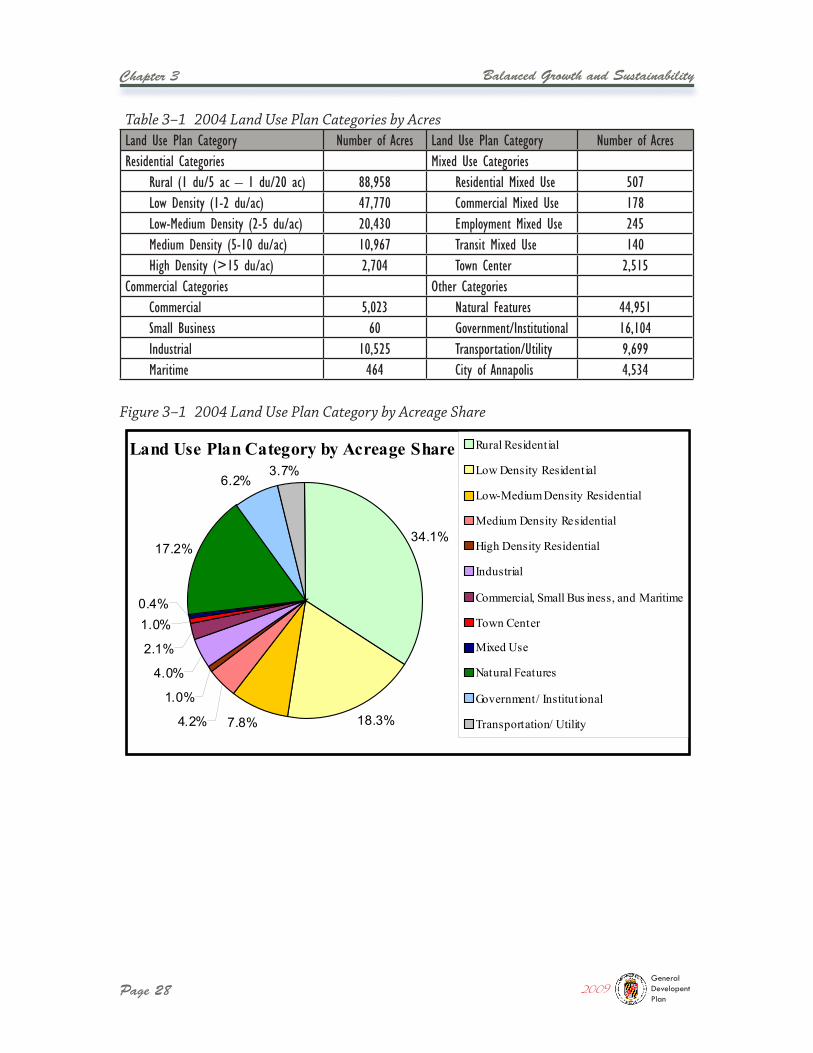
Chapter 3
Page 28
Balanced Growth and Sustainability
Table 3–1 2004 Land Use Plan Categories by AcresLand Use Plan Category Number of Acres Land Use Plan Category Number of AcresResidential Categories Mixed Use Categories
Rural (1 du/5 ac – 1 du/20 ac) 88,958 Residential Mixed Use 507Low Density (1-2 du/ac) 47,770 Commercial Mixed Use 178Low-Medium Density (2-5 du/ac) 20,430 Employment Mixed Use 245Medium Density (5-10 du/ac) 10,967 Transit Mixed Use 140High Density (>15 du/ac) 2,704 Town Center 2,515
Commercial Categories Other CategoriesCommercial 5,023 Natural Features 44,951Small Business 60 Government/Institutional 16,104Industrial 10,525 Transportation/Utility 9,699Maritime 464 City of Annapolis 4,534
2009GeneralDevelopentPlan
Figure 3–1 2004 Land Use Plan Category by Acreage Share
Land Use Plan Category by Acreage Share
34.1%
18.3%7.8%4.2%
1.0%
4.0%
2.1%
1.0%
17.2%
6.2%3.7%
0.4%
Rural Residential
Low Density Residential
Low-Medium Density Residential
Medium Density Residential
High Density Residential
Industrial
Commercial, Small Bus iness, and Maritime
Town Center
Mixed Use
Natural Features
Government/ Institutional
Transportation/ Utility
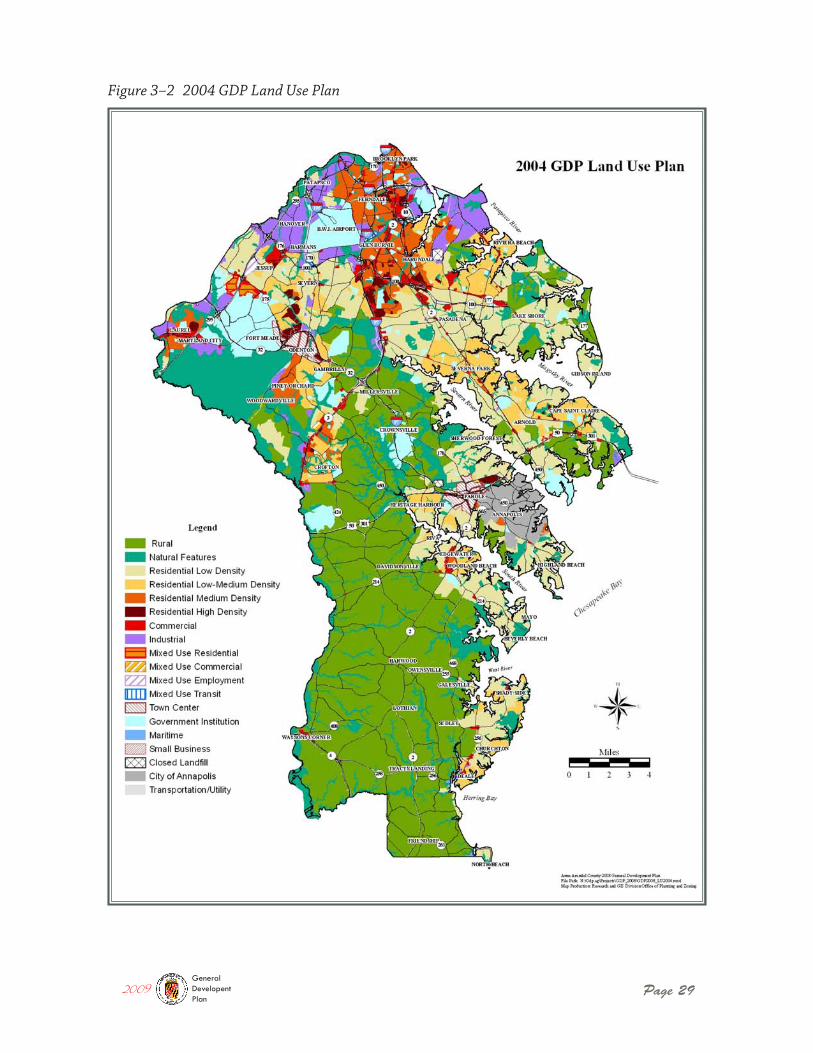
Page 292009GeneralDevelopentPlan
Figure 3–2 2004 GDP Land Use Plan
Chapter 3
Page 30
Balanced Growth and Sustainability
The land use policies that maintain the County’s rural land base and concentrate new growth in specific areas have consequences in terms of the long range ability to absorb new growth, and these policies place limits on future development capacity. This is not a negative consequence in itself, but is reflective of the fact that these land use policies incorporate local community visions and desires. However, decisions to hold to these land use policies and to allow development capacity to reach its limits also have implica-tions for the County’s long term fiscal stability and require the appropriate fiscal policies that will work in conjunction with established land use policies.
A land use analysis was recently completed estimating the remaining development capac-ity in the County as of April 2008. The methodology and assumptions used are discussed in the GDP Background Report on Land Use (June 2008). It should be noted that for the purposes of this analysis, active development projects (projects under review) and projects in the pipeline (approved and platted, but not yet constructed) were considered as developed land and did not count towards available development capacity. The results of the analysis should be considered conservative as assumptions were made based on previous development trends in the County. As land becomes more scarce, development becomes more efficient, utilizing available capacity to its limits. The results shown in Table 3-2 indicate the County has capacity for approximately 26,000 additional residen-tial units under the current zoning. Most of this additional capacity exists in the low to medium density residential zones (R2 and R5, and to a lesser extent R1). In addition, most of the available capacity can be attributed to vacant parcels or lots, although there is a significant amount of redevelopment capacity in the residential zones, particularly in the R5 zone. Much of the development capacity in the R5 zone is located in Brooklyn Park, Glen Burnie, Pasadena, and Arnold, while much of the capacity in the R2 zone is located in Severn and Pasadena.
Development Holding Capacity
2009GeneralDevelopentPlan
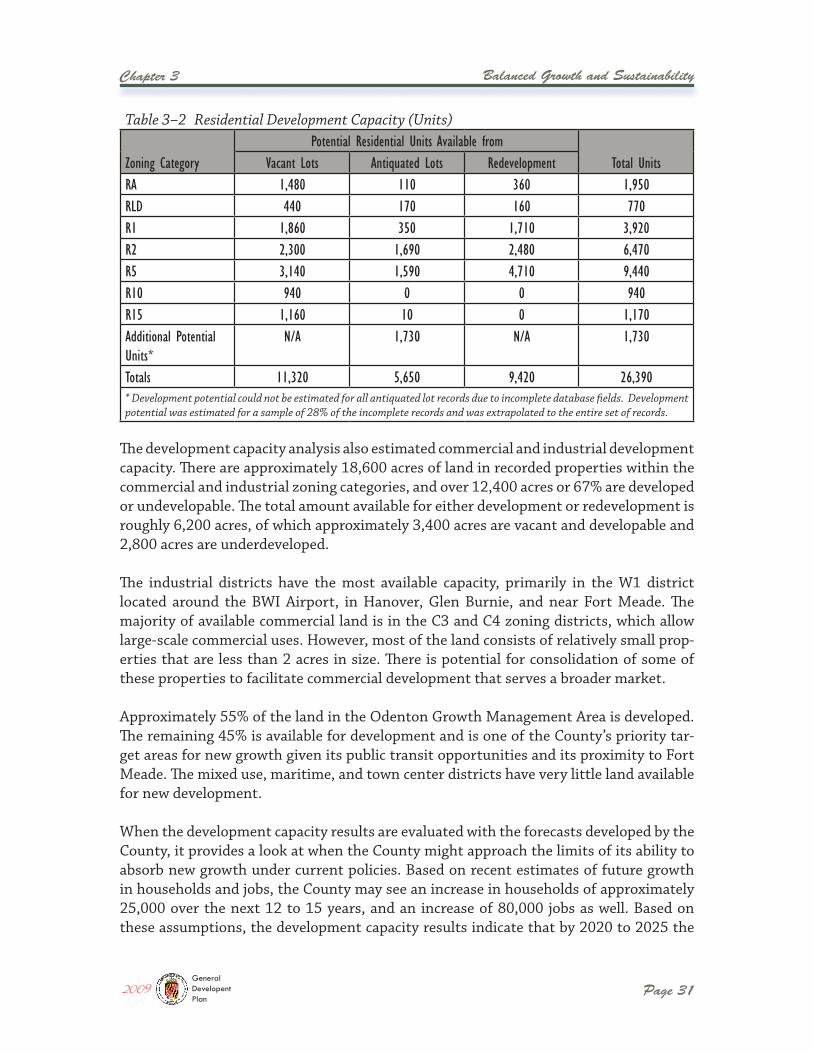
Balanced Growth and Sustainability
Page 31
Chapter 3
The development capacity analysis also estimated commercial and industrial development capacity. There are approximately 18,600 acres of land in recorded properties within the commercial and industrial zoning categories, and over 12,400 acres or 67% are developed or undevelopable. The total amount available for either development or redevelopment is roughly 6,200 acres, of which approximately 3,400 acres are vacant and developable and 2,800 acres are underdeveloped.
The industrial districts have the most available capacity, primarily in the W1 district located around the BWI Airport, in Hanover, Glen Burnie, and near Fort Meade. The majority of available commercial land is in the C3 and C4 zoning districts, which allow large-scale commercial uses. However, most of the land consists of relatively small prop-erties that are less than 2 acres in size. There is potential for consolidation of some of these properties to facilitate commercial development that serves a broader market. Approximately 55% of the land in the Odenton Growth Management Area is developed. The remaining 45% is available for development and is one of the County’s priority tar-get areas for new growth given its public transit opportunities and its proximity to Fort Meade. The mixed use, maritime, and town center districts have very little land available for new development.
When the development capacity results are evaluated with the forecasts developed by the County, it provides a look at when the County might approach the limits of its ability to absorb new growth under current policies. Based on recent estimates of future growth in households and jobs, the County may see an increase in households of approximately 25,000 over the next 12 to 15 years, and an increase of 80,000 jobs as well. Based on these assumptions, the development capacity results indicate that by 2020 to 2025 the
Table 3–2 Residential Development Capacity (Units)
Zoning CategoryPotential Residential Units Available from
Total UnitsVacant Lots Antiquated Lots RedevelopmentRA 1,480 110 360 1,950RLD 440 170 160 770R1 1,860 350 1,710 3,920R2 2,300 1,690 2,480 6,470R5 3,140 1,590 4,710 9,440R10 940 0 0 940R15 1,160 10 0 1,170Additional Potential Units*
N/A 1,730 N/A 1,730
Totals 11,320 5,650 9,420 26,390* Development potential could not be estimated for all antiquated lot records due to incomplete database fields. Development potential was estimated for a sample of 28% of the incomplete records and was extrapolated to the entire set of records.
2009GeneralDevelopentPlan
Chapter 3
Page 32
Balanced Growth and Sustainability
County could reach maturity in terms of new growth and may need to consider the need for additional capacity, as well as to prepare for this shift from a growing population to a relatively stable one.
Many important factors must be taken into consideration when making these decisions, including infrastructure constraints (e.g. wastewater treatment plants, school capaci-ties), environmental constraints (e.g. pollutant loads and impacts on natural resources), the ability to provide public services (e.g. fire protection, recreation), potential impacts on community character, fiscal impacts, and changes in development patterns. Due to the limiting nature of these constraints and the fact that some of them have State mandates for compliance, it is uncertain if the County will be able to upzone a significant amount of land area in the future to create more capacity. The implications physically and fis-cally to the County are complex and require detailed analysis and discussion by the policy makers.
To help answer some of these questions, the County undertook a comprehensive Fiscal Impact Analysis completed by an outside consultant in 2008. There were two key ques-tions to be answered by this study: 1) under the current revenue structure, is new growth generating net surpluses or deficits; and 2) how does the fiscal picture look when the demands of serving new growth are combined with those of serving the existing popula-tion and employment base? Therefore the study was conducted in two phases. The first phase analyzed both operating and capital costs and revenues generated by new growth only (growth projected to occur in the future based on current trends). The second phase combined the fiscal impacts of new growth with the costs to serve the existing population and employment base.
The results of Phase I indicate that, under the County’s current revenue structure, and using the new impact fee rate schedule adopted in 2008, new growth in population and
employment generates net surpluses to the County. In other words, the net revenues generated by new growth outweigh the costs that the County incurs in providing public services to serve it. This is due to the County’s very aggressive revenue structure. Like most counties in Maryland, Anne Arundel County receives property tax, income tax, franchise fees, transfer and recordation taxes, and
impact fees from new growth. By comparison, in most states local governments typically rely on property tax only.
Nevertheless, the analysis of new growth alone does not paint the entire picture. Under Phase II of the study, when the net surpluses from new growth were layered onto the impacts of serving the existing population and employment base, the annual net fiscal results fluctuate between deficits and surpluses over the study horizon (2007-2025), with net deficits generated over the first half of the projection period and net surpluses
Fiscal policies must be
consistent with land use policies.
Fiscal Impact of Growth
2009GeneralDevelopentPlan
Balanced Growth and Sustainability
Page 33
Chapter 3
generally toward the end. The conclusion reached is that under the current revenue struc-ture and assuming current levels of service, the County is in a sense treading water, with annual revenues insufficient to cover the estimated costs of providing public facilities and infrastructure on a consistent yearly basis.
It is noted that there are inherent limitations with this type of fiscal analysis, and the results must be interpreted accordingly. The fiscal model does not factor in externali-ties such as social or environmental costs related to additional growth, and it assumes existing levels of service for each category of public services, regardless of whether that level of service is considered to be adequate by the users. In addition, costs that are more indirectly related to new growth, such as costs to meet future water quality regulations through improvements to stormwater management facilities, cannot be easily quantified with this type of fiscal model and must be accounted for separately.
The Phase II study also looked at the extent to which surpluses from new growth can help to reduce existing backlogs in the County’s capital budget. Over the years, due to rising construction costs and other factors, the County has struggled to keep pace with the ongoing demand for maintenance, renovation and rehabilitation, and replacement of existing infrastructure and facilities that have been in place to serve the existing pop-ulation and employment base. Therefore, the County is experiencing some significant budgetary backlogs related to these public facility and infrastructure costs. This phenom-enon is not unique to Anne Arundel County and indeed has become a nationwide cause of concern. Futhermore, the current economic down-turn was not predicted in the Fiscal Impact Analysis. The ability of the County to generate new revenue sources to address the deficit and surplus imbalance identified in Phase II of the study will be dependent on the recovery from the current recession.
The study analyzed the estimated costs to correct the budget backlog in infrastructure needs (including schools, parks, roads, community college, libraries, senior centers, health centers, police and fire facilities, and detention centers) and com-bined this with the previous results. The backlog costs are significant, totaling over $2 billion for the 18-year study period. The net surplus generated by growth is projected at almost $500 million over the same period, which is only about 20% of the backlog costs. In other words, under current growth trends and existing fiscal policies, the County will continue to carry these backlogs in infrastructure needs well beyond the 2025 timeframe.
The solutions to these issues will not be simple ones. One conclusion that can be drawn is that long term fiscal stability cannot be created by relying on new growth and cannot be achieved by making changes to the adopted Land Use Plan. While the anticipated growth that can be accommodated within the remaining development capacity will help the fiscal
2009GeneralDevelopentPlan
Chapter 3
Page 34
Balanced Growth and Sustainability
situation to some extent by providing some revenue surplus, it will not address the exist-ing infrastructure backlogs. In addition, growth rates in the County are declining over the long term. Even if growth rates were to rise again, the County may not be able to accom-modate much new growth beyond the 2030 timeframe due to limits on infrastructure capacity as well as development holding capacity.
Likewise, slowing growth to a halt will not create long term fiscal stability either, without a shift in current fiscal policies. Long term stability can more realistically be addressed through improved concurrency management, which ensures that available capacity of public facilities and services will be in place over the planning horizon, and through new or revised revenue strategies. Both of these will be discussed further in Chapter 11.
The following goals, policies and actions will help the County to achieve balanced growth and sustainability.
Goal: Establish and maintain a Land Use Plan that achieves Smart Growth goals, balances growth and preservation, and provides a high quality of life.
Policy 1: Direct development and redevelopment to the County’s targeted growth areas: Town Centers, commercial revitalization districts, and Mixed Use Districts.
Actions:
� Use incentives, such as financing tools and / or an expedited development review process, to encourage new growth to locate in targeted growth areas.
� Strengthen marketing programs to attract developers and businesses to targeted areas by preparing a comprehensive inventory of available sites, incentives, and amenities.
� Prioritize the Capital Program to promote adequate public facilities and infra-structure necessary to support development in targeted growth areas.
� Add to the legal and financial tools that enable private-public partnerships that provide future development guarantees in return for substantial investments in necessary infrastructure where the County’s Capital Program is insufficient to support new development. Examples include tax increment financing, special tax districts, and developer agreements.
� Consider the use of Special Tax Districts for targeted growth areas, as applicable, so that infrastructure needs could be advanced through a special fund and a dedicated revenue source would be available for amenities such as transit improvements.
Policy 2: Encourage infill development inside the County’s Priority Funding Areas (PFAs) where appropriate, as opposed to expanding the PFA.
2009GeneralDevelopentPlan
Balanced Growth and Sustainability
Page 35
Chapter 3
Actions:
� Identify key infill opportunity sites and assess their feasibility for appropriate land uses.
� Use strategies such as tax incentives, financing tools, or revisions to development regulations to encourage the most compatible type of infill development in these areas.
Policy 3: Encourage mixed use development with jobs, housing, shopping, transpor-tation and other services within walking distance. Mixed use sites should be planned to meet the key objectives of improving “live near your work” opportunities, increas-ing use of public transit, and/or increasing the supply of workforce housing. Mixed use sites should not be planned for the sole purpose of increasing allowable develop-ment densities.
Actions:
� Identify additional mixed use opportunity areas and work with property owners and developers to develop mixed use concept plans that are consistent with over-all community visions.
� Assess the potential to shift some of the existing industrial land base west and north of BWI Airport to mixed use categories, to provide additional housing opportunities, commercial services, and transit-oriented development near major employment areas. Constraints due to the airport noise zone and approach zones must be considered.
Policy 4: Promote redevelopment of brownfields sites.
Actions:
� Maintain an inventory of brownfield sites and provide financial incentives through Maryland Department of the Environment to leverage private sector investment. Actively market sites as redevelopment opportunities.
� Monitor the status of the U.S. Army Depot site, the DC Children’s Center site, the David Taylor Naval Research Center site, and the Crownsville Hospital site, and work with State and/or Federal officials to identify suitable redevelopment opportunities if the sites become available.
Policy 5: Encourage the best use of unused or underutilized properties in the County’s surplus property inventory. When surplus properties designated as “Government” on the adopted Land Use Plan are sold for private development, no change in zoning of the property will be adopted without first amending the Land Use Plan to reflect the future planned land use.
2009GeneralDevelopentPlan
Chapter 3
Page 36
Balanced Growth and Sustainability
Actions:
� Continue to review all County and Board of Education surplus properties in accor-dance with the General Development Plan, Small Area Plans, and other adopted Plans, to determine whether there is a current or long range need to retain the property for public use.
� Convert surplus property to preserved open space or recreational space where appropriate.
� Keep local land trusts informed of surplus properties in environmentally sensi-tive areas.
Goal: Establish cohesive land use policies and fiscal policies that col-lectively will achieve sustainable communities, efficient use of public facilities, and fiscal stability.
Policy 1: Future increases in development capacity should be consistent with adopted land use policies.
Actions:
� Track development holding capacity regularly and update the holding capacity inventory at appropriate intervals.
� Plan for adjustments in fiscal policies and revenue strategies that will be needed as the County matures and approaches the limits of its development capacity.
Policy 2: Plan for the provision of public facilities, infrastructure, and services so that the County will be able to maintain a high level of service to serve the existing population as well as new growth.
� Develop an ongoing methodology to better integrate strategic and facilities planning done by each County agency or service provider with the County’s long range land use planning and capital programs.
� Develop a comprehensive concurrency management program in order to track the impact of new growth on public facilities and infrastructure and to ensure adequate facilities will be in place to serve new growth as well as the existing population base.
� Evaluate all potential new revenue strategies to address existing budget backlogs in public facility maintenance and improvements.
2009GeneralDevelopentPlan
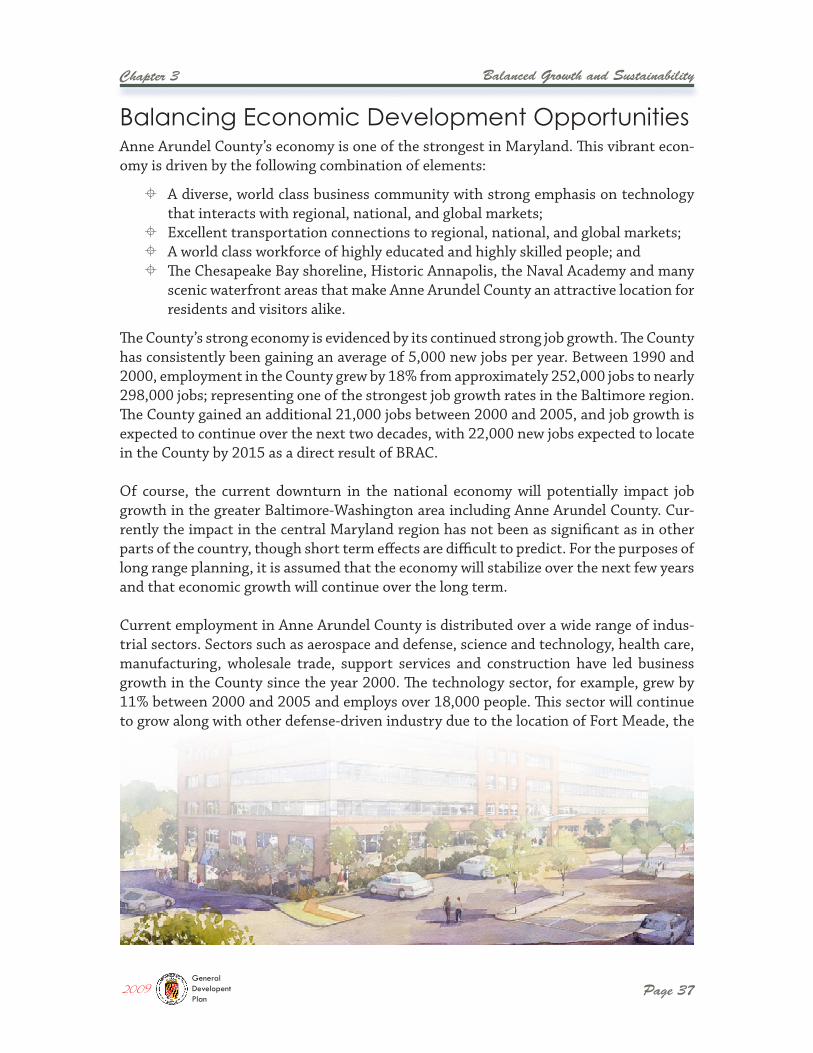
Balanced Growth and Sustainability
Page 37
Chapter 3
Anne Arundel County’s economy is one of the strongest in Maryland. This vibrant econ-omy is driven by the following combination of elements:
� A diverse, world class business community with strong emphasis on technology that interacts with regional, national, and global markets;
� Excellent transportation connections to regional, national, and global markets; � A world class workforce of highly educated and highly skilled people; and � The Chesapeake Bay shoreline, Historic Annapolis, the Naval Academy and many
scenic waterfront areas that make Anne Arundel County an attractive location for residents and visitors alike.
The County’s strong economy is evidenced by its continued strong job growth. The County has consistently been gaining an average of 5,000 new jobs per year. Between 1990 and 2000, employment in the County grew by 18% from approximately 252,000 jobs to nearly 298,000 jobs; representing one of the strongest job growth rates in the Baltimore region. The County gained an additional 21,000 jobs between 2000 and 2005, and job growth is expected to continue over the next two decades, with 22,000 new jobs expected to locate in the County by 2015 as a direct result of BRAC.
Of course, the current downturn in the national economy will potentially impact job growth in the greater Baltimore-Washington area including Anne Arundel County. Cur-rently the impact in the central Maryland region has not been as significant as in other parts of the country, though short term effects are difficult to predict. For the purposes of long range planning, it is assumed that the economy will stabilize over the next few years and that economic growth will continue over the long term.
Current employment in Anne Arundel County is distributed over a wide range of indus-trial sectors. Sectors such as aerospace and defense, science and technology, health care, manufacturing, wholesale trade, support services and construction have led business growth in the County since the year 2000. The technology sector, for example, grew by 11% between 2000 and 2005 and employs over 18,000 people. This sector will continue to grow along with other defense-driven industry due to the location of Fort Meade, the
Balancing Economic Development Opportunities
2009GeneralDevelopentPlan
Chapter 3
Page 38
Balanced Growth and Sustainability
National Security Agency (NSA), the U.S. Naval Academy, and the many defense contrac-tors located in the County. Recent and planned expansions of the Anne Arundel Medical Center in Parole and the Baltimore Washington Medical Center in Glen Burnie will pro-mote continued growth in the health care industry as well.
The County has targeted five primary growth areas for future economic development:
� The BWI Airport Business District and vicinity, � The Baltimore Washington Parkway corridor and Fort Meade, � Odenton Town Center, � Parole Town Center, and � Glen Burnie Town Center.
A variety of programs focus on attracting not only major industry targets such as defense and technology, but also the smaller economy sectors. These smaller sectors also con-tribute to the County’s vitality as well as its heritage, including tourism, agriculture, the maritime industry, and arts and entertainment. These programs include business financing assistance, workforce development, small business development, technology development, and other strategies.
Ensuring that Anne Arundel County’s strong business climate continues and that the County remains a leader in all respects is a priority. The following goals, policies and actions will serve this objective.
Goal: Maintain a favorable climate to attract and retain diverse business and industry to provide jobs, income and tax base, to achieve sustained and diversified growth, and to allow the County to meet the needs of its citizens.
Policy 1: Actively promote retention and expansion of existing businesses through financial assistance, employee training and other incentives.
Actions:
� Implement a proactive business development plan to encourage the location of new companies in the County.
� Partner with Anne Arundel Workforce Development Corporation and Anne Arundel Community College as well as State and regional partners to address the workforce development needs of the existing business community and to provide training programs in the field of science, technology, aerospace/defense and other areas to address global market needs.
2009GeneralDevelopentPlan
Balanced Growth and Sustainability
Page 39
Chapter 3
� Work with local employers to provide job training and readiness programs as well as support services such as child care and transportation to ensure local residents can take advantage of employment opportunities in the County.
� Continue to provide business financing assistance through the Anne Arundel Eco-nomic Development Corporation, State Department of Business and Economic Development, and Department of Housing and Community Development.
� Expand and support industrial and business growth by combining public and pri-vate resources.
Policy 2: Focus economic development and business attraction efforts in Town Cen-ters, Mixed Use Districts, and Commercial Revitalization Districts as well as in areas with existing or planned transit access.
Actions:
� Focus economic development efforts toward development of the Odenton Town Center as a premier transit-oriented center in accordance with the goals and vision of the OTC Master Plan.
� Assist private developers in attracting high quality businesses to new and devel-oping mixed use centers in the County.
Policy 3: Maintain an adequate supply of land for industrial and commercial office uses to meet current employment projections including new BRAC-related job growth, and to maintain a balanced tax base.
Actions:
� Identify opportunities for additional industrial sites, particularly for new defense industry and research facilities, located in proximity to major roadways and other multi-modal transportation assets.
Policy 4: Increase opportunities for business innovation entrepreneurship.
Actions:
� Provide services and support, such as assistance with preparing business plans, to the entrepreneurial, small, and minority business community.
� Continue to promote and support the business incubator concept.
Policy 5: Further develop the agricultural economic development and marketing program within the Anne Arundel Economic Development Corporation.
2009GeneralDevelopentPlan
Chapter 3
Page 40
Balanced Growth and Sustainability
The strong economic growth experienced during the 1990s translated into a strong hous-ing market in Anne Arundel County. While the recent economic downturn will have an effect on the housing market in the near term, it is expected that growth in households will continue, although at a slower rate, to 2025. This includes a projected 4,500 house-holds that will locate in the County over the next several years as a direct result of BRAC. A range of housing opportunities will be needed to meet these demands.
According to the 2006 American Community Survey (U.S. Census Bureau), there are approximately 201,000 housing units in the County. The mix of housing of types is shown below. The dominance of the single-family detached home is reflective of the suburban nature of Anne Arundel County.
� 62% are single family detaches homes, � 18% are townhomes or duplexes, � 17% are condominiums or apartments, � 3% are mobile homes, recreational vehicles or houseboats.
The popularity of “adult” developments has grown in recent years as well. The County defines “adult independent living” units as independent dwelling units for persons 55 years of age or older without minor children. Within the past five years, nearly 1,200 additional age-restricted units were either approved for construction or are waiting development plan approval. In addition to age-restricted units, there are approximately 86 State licensed assisted living facilities.
Actions:
� Expand the program to promote rural economy land uses such as horse breeding and training, vineyards, community gardens, agritourism, heritage tourism, and crafts in designated rural areas.
Goal: Protect the future growth potential of BWI Airport.
Policy 1: Promote development in the vicinity of BWI Airport that is compatible with an airport environs and that will not restrict the future growth potential of the airport.
Actions:
� Work cooperatively with Maryland Aviation Administration to study the feasibil-ity and applicability of an Airport Environs Overlay Zoning District to promote compatible land use development in proximity to BWI Airport.
Housing OverviewBalancing Housing Opportunities
2009GeneralDevelopentPlan
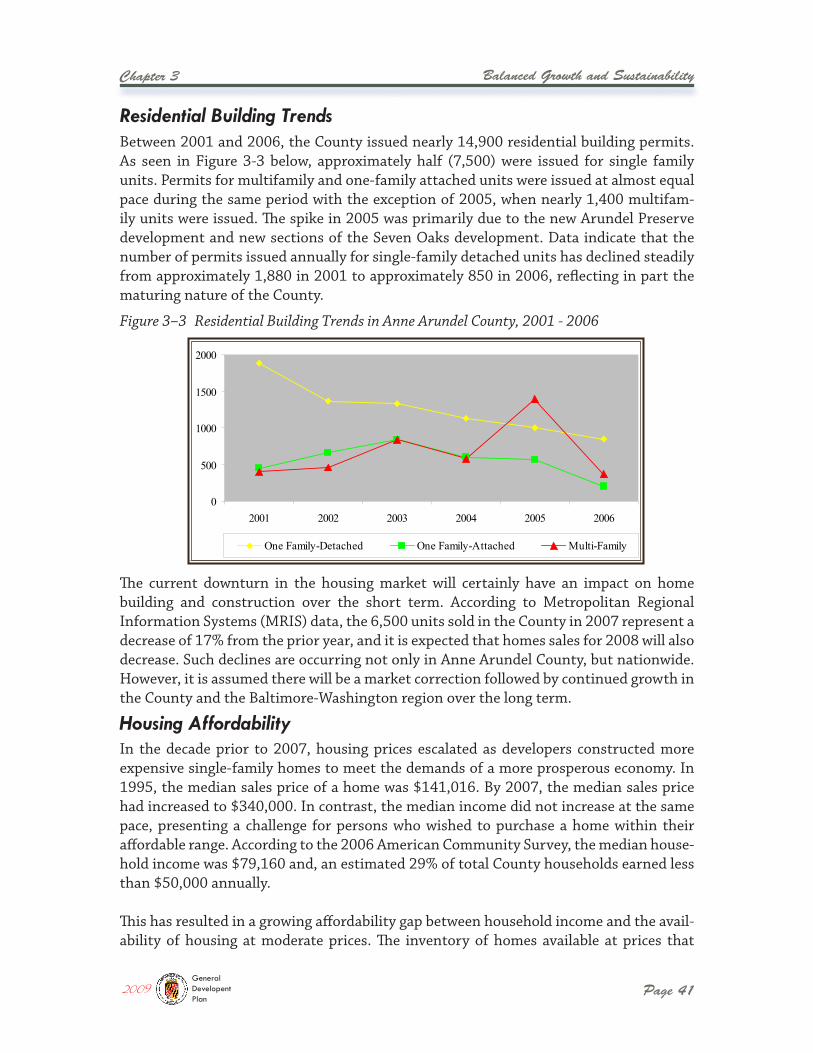
Balanced Growth and Sustainability
Page 41
Chapter 3
The current downturn in the housing market will certainly have an impact on home building and construction over the short term. According to Metropolitan Regional Information Systems (MRIS) data, the 6,500 units sold in the County in 2007 represent a decrease of 17% from the prior year, and it is expected that homes sales for 2008 will also decrease. Such declines are occurring not only in Anne Arundel County, but nationwide. However, it is assumed there will be a market correction followed by continued growth in the County and the Baltimore-Washington region over the long term.
Between 2001 and 2006, the County issued nearly 14,900 residential building permits. As seen in Figure 3-3 below, approximately half (7,500) were issued for single family units. Permits for multifamily and one-family attached units were issued at almost equal pace during the same period with the exception of 2005, when nearly 1,400 multifam-ily units were issued. The spike in 2005 was primarily due to the new Arundel Preserve development and new sections of the Seven Oaks development. Data indicate that the number of permits issued annually for single-family detached units has declined steadily from approximately 1,880 in 2001 to approximately 850 in 2006, reflecting in part the maturing nature of the County.
In the decade prior to 2007, housing prices escalated as developers constructed more expensive single-family homes to meet the demands of a more prosperous economy. In 1995, the median sales price of a home was $141,016. By 2007, the median sales price had increased to $340,000. In contrast, the median income did not increase at the same pace, presenting a challenge for persons who wished to purchase a home within their affordable range. According to the 2006 American Community Survey, the median house-hold income was $79,160 and, an estimated 29% of total County households earned less than $50,000 annually.
This has resulted in a growing affordability gap between household income and the avail-ability of housing at moderate prices. The inventory of homes available at prices that
Residential Building Trends
Housing Affordability
2009GeneralDevelopentPlan
Figure 3–3 Residential Building Trends in Anne Arundel County, 2001 - 2006
0
500
1000
1500
2000
2001 2002 2003 2004 2005 2006
One Family-Detached One Family-Attached Multi-Family
Chapter 3
Page 42
Balanced Growth and Sustainability
The State of Maryland has provided the following definitions for workforce housing:
“Affordable” means that housing costs do not exceed 30% of household income.
“Workforce housing” means:
Rental housing that is affordable for a household with an aggregate annual income between 50% and 100% of area median income.
Homeownership housing is affordable to a household with an aggregate annual income between 60% and 120% of area median income or in target areas recog-nized by the State. For the purposes of the MD Mortgage Program, it is affordable to a household with an aggregate annual income between 60% and 150% of the area median income.
In recognition of the statewide shortage of working housing opportunities, the State of Maryland enacted legislation in 2006 establishing a Workforce Housing Grant Program. Local jurisdictions may qualify for participation in the program if they have a five-year Consolidated Plan approved by the U.S. Department of Housing and Urban Development (HUD), or if they include a workforce housing element in their adopted comprehensive plan. The Anne Arundel County Consolidated Plan: FY 2006 –FY 2010 was adopted by the County Council in 2005 and serves as the County’s HUD-approved Consolidated Plan. The County will therefore be eligible to participate in the State’s Workforce Housing Grant Program as grant monies become available.
To address housing and community development needs and implement strategies of the Consolidated Plan, Anne Arundel County partners with Arundel Community Development Services, Inc. (ACDS), the Housing Commission of Anne Arundel County, and others to administer programs to address both workforce housing as well as low income housing needs. These include acquisition/rehabilitation programs, homeowner rehabilitation programs, innovative homeownership programs, rental housing produc-tion programs, and housing vouchers. ACDS is responsible for
would be considered affordable for workforce households has been on the decline over this period and is now recognized to be seriously inadequate to serve the workforce population.
The rental housing market has experienced many of the same trends as the homeowner housing market. The average rental rates shown in a 2007 Apartments Study for Anne Arundel County range from about $800 for a one bedroom to $1,300 for a three-bedroom apartment, but can be higher in specific locations. This likewise presents a challenge for workforce households.
Addressing Workforce Housing Needs
2009GeneralDevelopentPlan
Balanced Growth and Sustainability
Page 43
Chapter 3
planning, administration and implementation of the State, local and Federally funded housing and community development programs, and seeks to preserve and increase the supply of affordable housing, revitalize declining neighborhoods, promote homeowner-ship and ensure housing for those with special needs.
The State’s Department of Housing and Community Development, working with ACDS, also offers several programs to support homeownership in the County. These programs
provide low interest mortgage and down payment assistance for qualifying buyers.
There have also been several Task Force initiatives to address the issue of workforce housing. The Annapolis and Anne Arundel County Chamber of Commerce undertook the latest task force initiative in July 2006. The effort was guided by the vision that “in order to be a vibrant, attractive and economi-
cally prosperous community, Anne Arundel County must strive to create and maintain a diverse community of workers.” This necessitates the creation and preservation of a housing market with a broad range of housing options for all income levels.
To supplement these existing programs, several goals, policies and actions are listed below.
Goal: Provide a variety of housing opportunities to serve the full range of housing needs in the County.
Policy 1: Maintain a suitable range of housing densities and types including single family homes, townhomes, condominiums and apartments, to meets the needs of the local population.
Actions:
� Identify and evaluate areas that may be suitable to target for Mixed Use develop-ment in order to provide more workforce housing while allowing residents to live near employment opportunities. Any such shifts should be confined to Priority Funding Areas to the extent possible.
� After the 2010 Census data is available, prepare updated population and household forecasts by age cohorts. Use this information to assess the supply and demand of age-restricted and senior housing opportunities.
Policy 2: Increase the supply of workforce housing units in the County.
2009GeneralDevelopentPlan
Chapter 3
Page 44
Balanced Growth and Sustainability
Actions:
� Adopt the State’s definition of workforce housing for use in establishing local policies and for consistency with State and regional policies related to workforce housing.
� Evaluate alternative forms of inclusionary housing programs that can be adopted and incorporated into the County’s development codes.
� Develop additional financial incentives for the provision of workforce housing, such as streamlined regulatory processes, tax credits, density bonuses, or public/private partnerships.
� Create a Housing Trust Fund with a dedicated funding source to provide financing to improve the aging workforce housing stock and preserve and increase work-force housing.
� Promote greater use of Commercial Revitalization Tax Credits and flexible uses in Revitalization Districts to allow for inclusion of workforce housing where appro-priate in these districts.
� Continue to utilize existing programs and develop new incentives to encourage rehabilitation of existing housing.
� Extend existing transit service and provide multiple transit options to support workforce housing concentrations.
� Continue to develop opportunities to partner with the State and private lenders to create new financing tools to assist with first time homeownership.
Policy 3: Promote adaptive reuse of existing structures for workforce housing.
Actions:
� Determine the feasibility of adaptive reuse of commercial buildings, such as motels and former retail centers, for workforce housing.
� Explore opportunities for use of surplus BOE properties for adaptive reuse as workforce housing.
� Target County owned surplus properties, where appropriate, for workforce hous-ing development. Use developer agreements and/or incentives to encourage workforce housing. If deemed unsuitable for workforce housing, land could be sold and a portion of the proceeds donated to a Housing Trust Fund for workforce housing.
2009GeneralDevelopentPlan
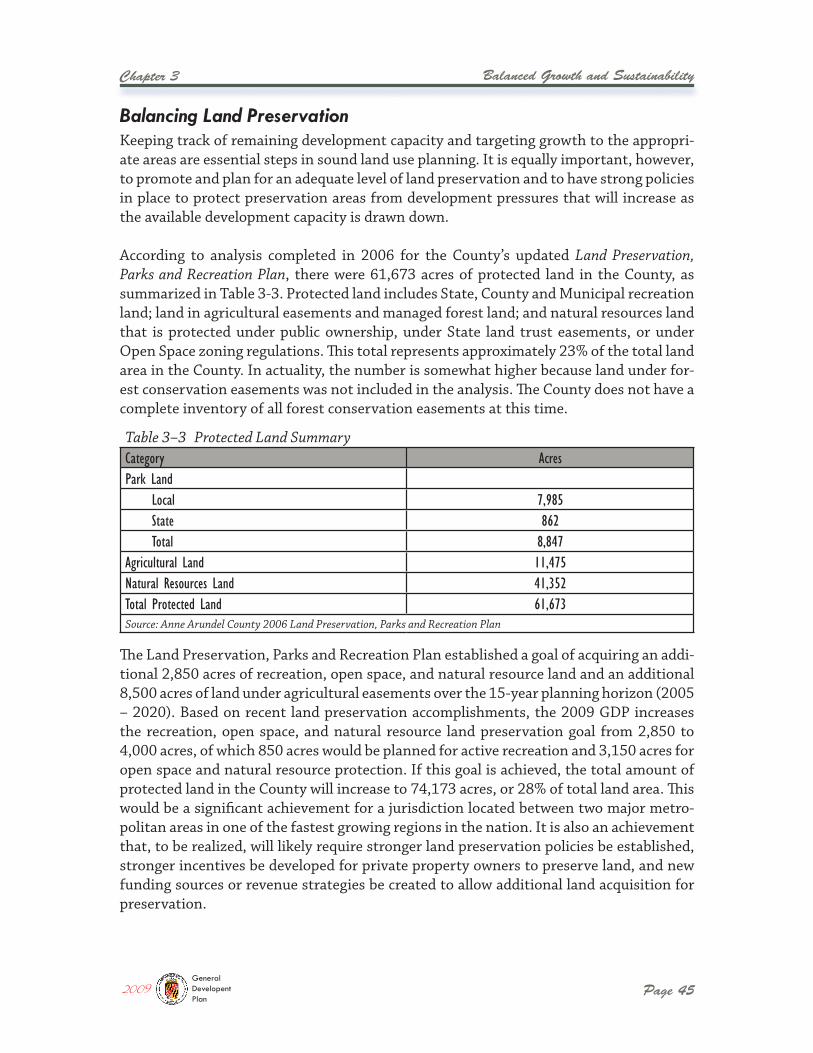
Balanced Growth and Sustainability
Page 45
Chapter 3
Keeping track of remaining development capacity and targeting growth to the appropri-ate areas are essential steps in sound land use planning. It is equally important, however, to promote and plan for an adequate level of land preservation and to have strong policies in place to protect preservation areas from development pressures that will increase as the available development capacity is drawn down.
According to analysis completed in 2006 for the County’s updated Land Preservation, Parks and Recreation Plan, there were 61,673 acres of protected land in the County, as summarized in Table 3-3. Protected land includes State, County and Municipal recreation land; land in agricultural easements and managed forest land; and natural resources land that is protected under public ownership, under State land trust easements, or under Open Space zoning regulations. This total represents approximately 23% of the total land area in the County. In actuality, the number is somewhat higher because land under for-est conservation easements was not included in the analysis. The County does not have a complete inventory of all forest conservation easements at this time.
The Land Preservation, Parks and Recreation Plan established a goal of acquiring an addi-tional 2,850 acres of recreation, open space, and natural resource land and an additional 8,500 acres of land under agricultural easements over the 15-year planning horizon (2005 – 2020). Based on recent land preservation accomplishments, the 2009 GDP increases the recreation, open space, and natural resource land preservation goal from 2,850 to 4,000 acres, of which 850 acres would be planned for active recreation and 3,150 acres for open space and natural resource protection. If this goal is achieved, the total amount of protected land in the County will increase to 74,173 acres, or 28% of total land area. This would be a significant achievement for a jurisdiction located between two major metro-politan areas in one of the fastest growing regions in the nation. It is also an achievement that, to be realized, will likely require stronger land preservation policies be established, stronger incentives be developed for private property owners to preserve land, and new funding sources or revenue strategies be created to allow additional land acquisition for preservation.
Table 3–3 Protected Land SummaryCategory AcresPark Land Local 7,985 State 862 Total 8,847Agricultural Land 11,475Natural Resources Land 41,352Total Protected Land 61,673Source: Anne Arundel County 2006 Land Preservation, Parks and Recreation Plan
Balancing Land Preservation
2009GeneralDevelopentPlan
Chapter 3
Page 46
Balanced Growth and Sustainability
The County currently has mechanisms in place to help prioritize where these preservation efforts should be targeted. The Greenways Master Plan proposes a network of protected corridors of woodland and open space, and to date approximately 49% of the proposed network is not yet permanently protected. In addition, the County’s Rural Legacy Area as well as the proposed Priority Preservation Area (see Chapter 8) are targeted areas for preservation.
This GDP includes strategies to increase and enhance preservation efforts in these areas in order to achieve the “28% protected land” goal. Goals, policies and actions to accom-plish this are listed below as well as in Chapter 5 (Environmental Stewardship).
Goal: Increase the amount of protected land in the County in order to preserve open space and rural areas and protect natural resources.
Policy 1: Acquire approximately 3,150 additional acres of land for open space and natural resource land protection by year 2020
Actions:
� In accordance with the 2006 Land Preservation, Parks and Recreation Plan, pursue the acquisition of additional land for preservation. Target properties in the Green-ways network, the Rural Legacy Area, in subwatersheds identified as high priority for preservation in a Watershed Management Plan, and in other areas suitable for passive recreation or natural resource protection.
� Offset future land use and zoning intensifications by acquiring or otherwise retaining additional land for preservation where feasible.
� Partner with local land trusts to increase promotion and marketing of preserva-tion mechanisms such as conservation easements.
2009GeneralDevelopentPlan
Chapter 4:Community Preservation andEnhancement

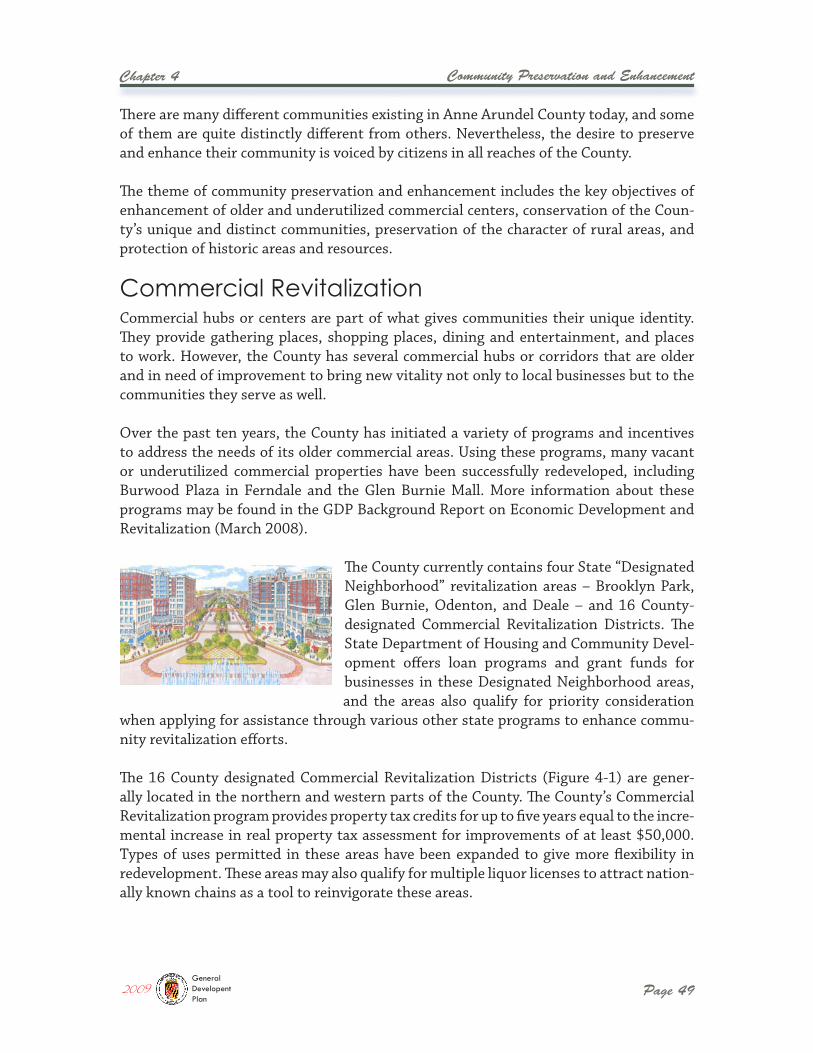
Community Preservation and Enhancement
Page 49
Chapter 4
There are many different communities existing in Anne Arundel County today, and some of them are quite distinctly different from others. Nevertheless, the desire to preserve and enhance their community is voiced by citizens in all reaches of the County.
The theme of community preservation and enhancement includes the key objectives of enhancement of older and underutilized commercial centers, conservation of the Coun-ty’s unique and distinct communities, preservation of the character of rural areas, and protection of historic areas and resources.
Commercial hubs or centers are part of what gives communities their unique identity. They provide gathering places, shopping places, dining and entertainment, and places to work. However, the County has several commercial hubs or corridors that are older and in need of improvement to bring new vitality not only to local businesses but to the communities they serve as well.
Over the past ten years, the County has initiated a variety of programs and incentives to address the needs of its older commercial areas. Using these programs, many vacant or underutilized commercial properties have been successfully redeveloped, including Burwood Plaza in Ferndale and the Glen Burnie Mall. More information about these programs may be found in the GDP Background Report on Economic Development and Revitalization (March 2008).
The County currently contains four State “Designated Neighborhood” revitalization areas – Brooklyn Park, Glen Burnie, Odenton, and Deale – and 16 County-designated Commercial Revitalization Districts. The State Department of Housing and Community Devel-opment offers loan programs and grant funds for businesses in these Designated Neighborhood areas, and the areas also qualify for priority consideration
when applying for assistance through various other state programs to enhance commu-nity revitalization efforts.
The 16 County designated Commercial Revitalization Districts (Figure 4-1) are gener-ally located in the northern and western parts of the County. The County’s Commercial Revitalization program provides property tax credits for up to five years equal to the incre-mental increase in real property tax assessment for improvements of at least $50,000. Types of uses permitted in these areas have been expanded to give more flexibility in redevelopment. These areas may also qualify for multiple liquor licenses to attract nation-ally known chains as a tool to reinvigorate these areas.
Commercial Revitalization
2009GeneralDevelopentPlan
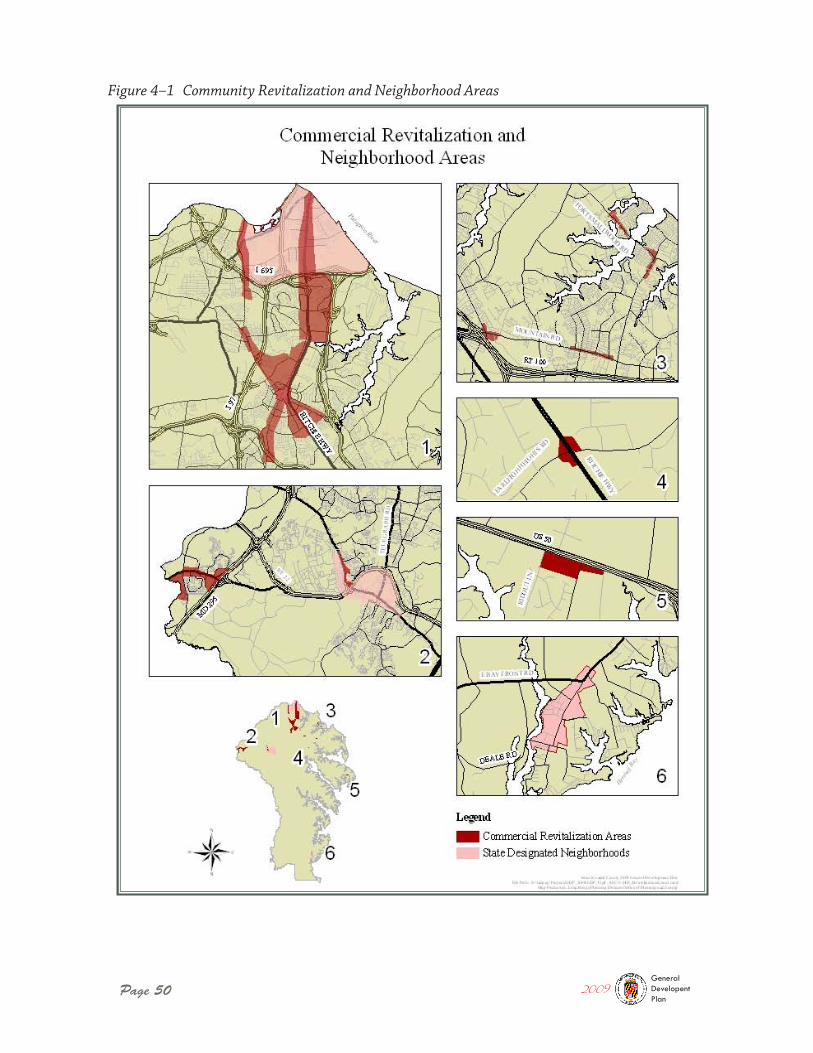
Page 50
Figure 4–1 Community Revitalization and Neighborhood Areas
2009GeneralDevelopentPlan
Community Preservation and Enhancement
Page 51
Chapter 4
While some successes have occurred in revitalizing these areas, these efforts are fre-quently in competition with plans for new development projects that are often more attractive to businesses and retailers. The following policies and actions will serve to focus more attention on these older commercial areas and the importance of enhancing them to realize their full potential.
Goal: Enhance commercial hubs and corridors to create thriving and attractive centers that serve both local communities and regional needs.
Policy 1: Actively promote redevelopment in the County’s Commercial Revitaliza-tion Areas.
Actions:
� Refine the boundaries of existing Commercial Revitalization districts. Identify other commercial areas that should be designated as revitalization districts and incorporate them into the Zoning Ordinance.
� Develop a stronger marketing program and devote more resources to increase participation in the Commercial Revitalization program and to encourage redevel-opment and reuse of vacant and underutilized buildings and sites in designated revitalization areas. Essential resources should include 1) community infrastruc-ture commitments such as streetscape improvements or parking; 2) program incentives to stimulate new investment in existing facilities; 3) real estate tools and incentives to assist in the consolidation of parcels for redevelopment projects; and 4) staff and budgetary resources to implement the initiative.
� Develop a work program between Planning and Zoning (OPZ) and AAEDC to mar-ket redevelopment concepts and opportunity sites to attract redevelopment. Use OPZ’s Urban Design Studies program and AAEDC’s Business Corridor Investment Loan Program to develop concepts and design guidelines for designated revitaliza-tion areas, and incorporate design guidelines into the Commercial Revitalization legislation as needed.
� Encourage the concept of ‘sense of place’ by promoting unique urban design fea-tures that reflect community character in revitalization areas.
� Promote the use of volunteer/community service projects to maintain cleanliness in commercial revitalization areas.
Two widely recognized principles of Smart Growth involve the redevelopment of improved but underutilized properties to maximize their potential, and the promotion of infill development in areas where public facilities and infrastructure are already in
Neighborhood Conservation
2009GeneralDevelopentPlan
Page 52
Chapter 4 Community Preservation and Enhancement
place. While these are sound policies from the planning perspective, in reality they are sometimes unwelcome in local communities that are concerned with maintaining the neighborhood character that they have grown used to. Local citizens often complain that infill development does not “fit in” or is not cohesive with the rest of their community, and that redevelopment is not in scale with the surrounding densities, building heights, or the overall “look” of the community.
There are several examples of neighborhood conservation programs around the Country that can be used as a model for Anne Arundel County. These types of programs work to permit infill development and redevelopment in existing communities that will enhance the neighborhood character rather than detract from it. Such a program can be established using design guidelines or overlay districts. Criteria should be established in designating qualifying neighborhoods so that those communities with truly unique characteristics that warrant preservation can be identified and targeted.
In addition, potential redevelopment or infill areas are often located in older, historic neighborhoods and communities. Therefore, a neighborhood conservation program should seek to incorporate existing historic preservation principles and programs so that it can serve to protect historic features of a community as well as other unique features.
Goal: Preserve the character of established communities that have unique qualities and distinctive character.
Policy 1: Develop a Neighborhood Conservation Program through appropriate leg-islation and/or regulations to identify distinctive or historic neighborhoods, and to conserve and enhance their unique character.
Actions:
� Establish criteria to be used in defining a neighborhood as unique, distinct or historic. Criteria may include such features as community character, architectural style, historic significance, etc.
� Based on established criteria, identify neighborhoods or communities that qualify as a Neighborhood Conservation district.
� Establish a community outreach process to be used in developing Neighborhood Conservation criteria, standards, and districts.
� Establish objectives and design standards applicable to each designated Neighbor-hood Conservation district.
� Develop legislation to create Neighborhood Conservation overlay districts and associated design standards and/or guidelines.
2009GeneralDevelopentPlan
Community Preservation and Enhancement
Page 53
Chapter 4
Much of the County’s rural areas have a distinctive character of their own, a character most often thought of as scenic. These areas are found in South County predominantly, but also in Crownsville, Millersville, Gambrills, Odenton, Broadneck, Lake Shore, and smaller scattered areas around the County. They are developed at low densities with pri-marily residential uses or farming operations, and the preservation of open areas and wooded areas is a common goal throughout. New development here is encouraged to be clustered in order to maximize retention of open space.
While the County’s adopted Land Use Plan and Rural Agricultural zoning district can limit development densities and prevent suburban-type development, there is still a sense among many local citizens that the unique and aesthetic rural character of these areas is being lost. With the increasing development pressures over the past few decades, many farms have been converted to ‘rural subdivisions’ and the vast expanses of rural land have become somewhat fragmented over time. The need now is for renewed efforts to retain the County’s remaining rural areas over the long term.
To some extent, the objective of preserving rural areas overlaps with the related topics of land preservation and environmental conservation in a broader sense. Hence, there are related policies and actions found in Chapter 3 on Balanced Growth and in Chapter 5 on Environmental Stewardship. The purpose here, as related to preserving communities, is to preserve rural communities for the sake of their unique and scenic character. The specific topic of agricultural preservation is discussed in more detail in Chapter 8 which addresses the designation of Priority Preservation Areas (PPAs).
Goal: Preserve the character of the County’s rural areas.
Policy 1: Maintain the Rural Land Use designation and Rural Agricultural (RA) zon-ing as the primary mechanism for preserving the rural character of South County and other rural areas.
Actions:
� Develop Rural Area design guidelines or standards to apply to new development in the Rural Agricultural district and incorporate them in the County’s develop-ment regulations. Consider the guidelines developed in the South County Small Area Plan.
� Determine the viability of a transferable development rights (TDR) program as an alternative approach to preserving rural areas.
Preserving Rural Areas
2009GeneralDevelopentPlan
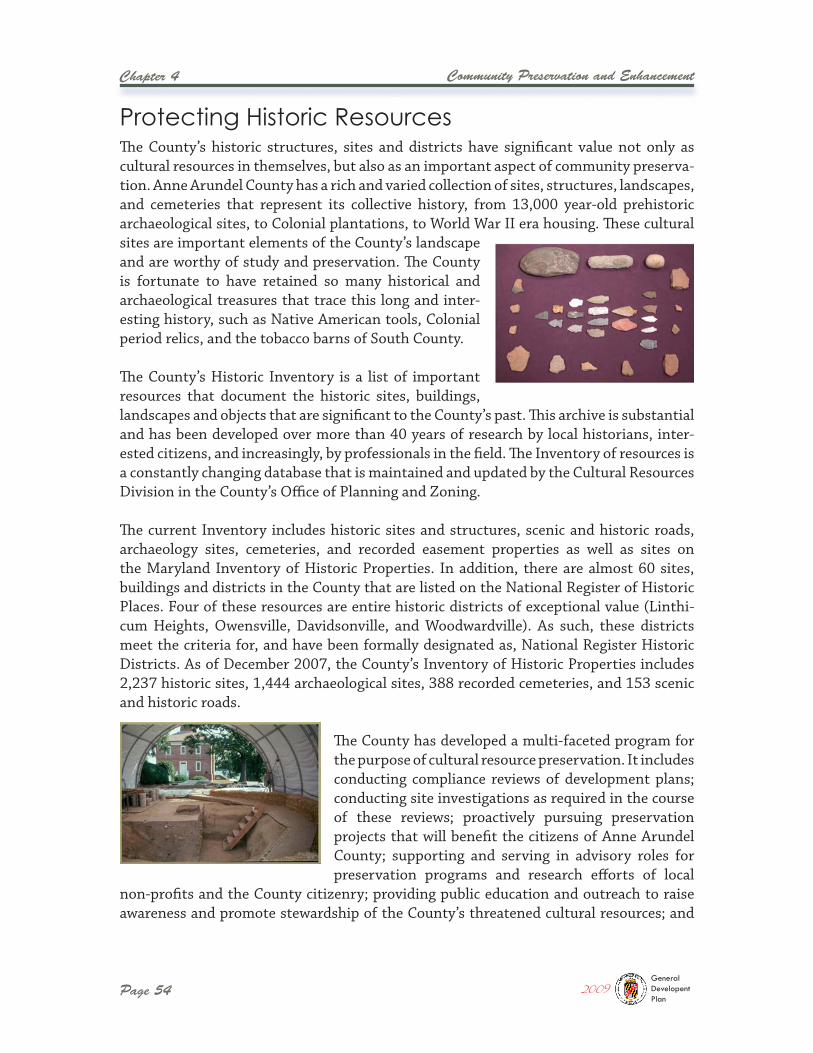
Page 54
Chapter 4 Community Preservation and Enhancement
The County’s historic structures, sites and districts have significant value not only as cultural resources in themselves, but also as an important aspect of community preserva-tion. Anne Arundel County has a rich and varied collection of sites, structures, landscapes, and cemeteries that represent its collective history, from 13,000 year-old prehistoric archaeological sites, to Colonial plantations, to World War II era housing. These cultural sites are important elements of the County’s landscape and are worthy of study and preservation. The County is fortunate to have retained so many historical and archaeological treasures that trace this long and inter-esting history, such as Native American tools, Colonial period relics, and the tobacco barns of South County.
The County’s Historic Inventory is a list of important resources that document the historic sites, buildings, landscapes and objects that are significant to the County’s past. This archive is substantial and has been developed over more than 40 years of research by local historians, inter-ested citizens, and increasingly, by professionals in the field. The Inventory of resources is a constantly changing database that is maintained and updated by the Cultural Resources Division in the County’s Office of Planning and Zoning.
The current Inventory includes historic sites and structures, scenic and historic roads, archaeology sites, cemeteries, and recorded easement properties as well as sites on the Maryland Inventory of Historic Properties. In addition, there are almost 60 sites, buildings and districts in the County that are listed on the National Register of Historic Places. Four of these resources are entire historic districts of exceptional value (Linthi-cum Heights, Owensville, Davidsonville, and Woodwardville). As such, these districts meet the criteria for, and have been formally designated as, National Register Historic Districts. As of December 2007, the County’s Inventory of Historic Properties includes 2,237 historic sites, 1,444 archaeological sites, 388 recorded cemeteries, and 153 scenic and historic roads.
The County has developed a multi-faceted program for the purpose of cultural resource preservation. It includes conducting compliance reviews of development plans; conducting site investigations as required in the course of these reviews; proactively pursuing preservation projects that will benefit the citizens of Anne Arundel County; supporting and serving in advisory roles for preservation programs and research efforts of local
non-profits and the County citizenry; providing public education and outreach to raise awareness and promote stewardship of the County’s threatened cultural resources; and
Protecting Historic Resources
2009GeneralDevelopentPlan
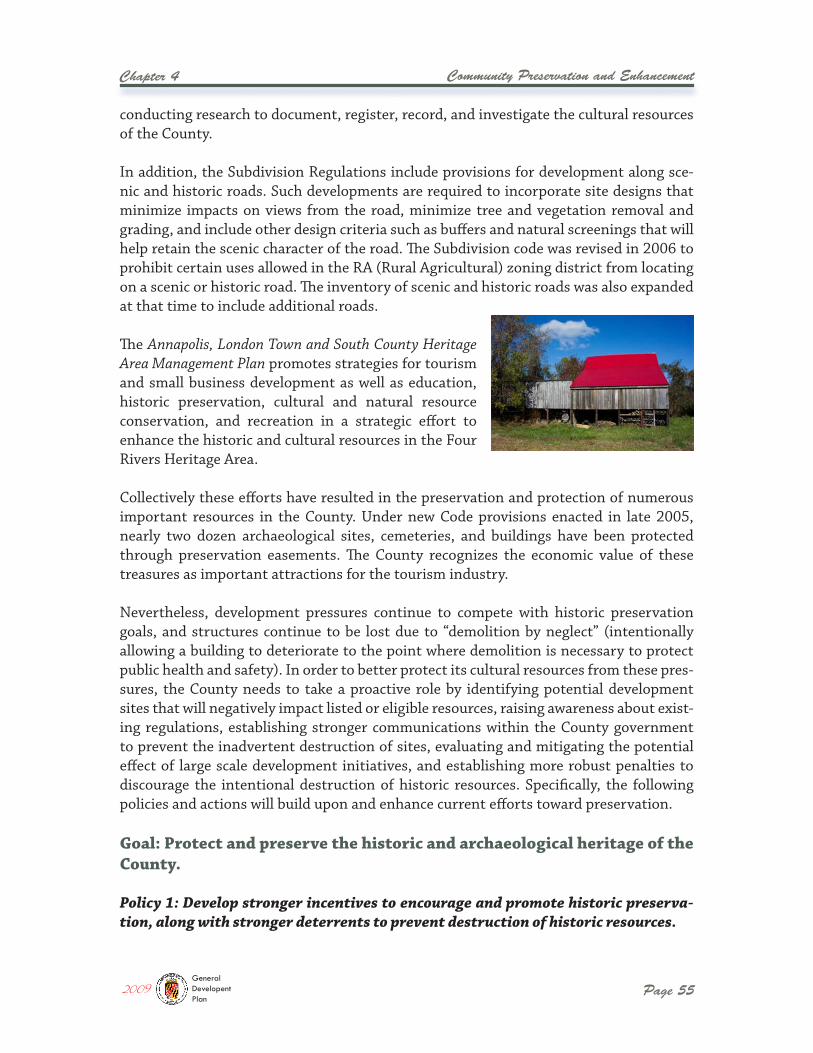
Community Preservation and Enhancement
Page 55
Chapter 4
conducting research to document, register, record, and investigate the cultural resources of the County.
In addition, the Subdivision Regulations include provisions for development along sce-nic and historic roads. Such developments are required to incorporate site designs that minimize impacts on views from the road, minimize tree and vegetation removal and grading, and include other design criteria such as buffers and natural screenings that will help retain the scenic character of the road. The Subdivision code was revised in 2006 to prohibit certain uses allowed in the RA (Rural Agricultural) zoning district from locating on a scenic or historic road. The inventory of scenic and historic roads was also expanded at that time to include additional roads.
The Annapolis, London Town and South County Heritage Area Management Plan promotes strategies for tourism and small business development as well as education, historic preservation, cultural and natural resource conservation, and recreation in a strategic effort to enhance the historic and cultural resources in the Four Rivers Heritage Area.
Collectively these efforts have resulted in the preservation and protection of numerous important resources in the County. Under new Code provisions enacted in late 2005, nearly two dozen archaeological sites, cemeteries, and buildings have been protected through preservation easements. The County recognizes the economic value of these treasures as important attractions for the tourism industry.
Nevertheless, development pressures continue to compete with historic preservation goals, and structures continue to be lost due to “demolition by neglect” (intentionally allowing a building to deteriorate to the point where demolition is necessary to protect public health and safety). In order to better protect its cultural resources from these pres-sures, the County needs to take a proactive role by identifying potential development sites that will negatively impact listed or eligible resources, raising awareness about exist-ing regulations, establishing stronger communications within the County government to prevent the inadvertent destruction of sites, evaluating and mitigating the potential effect of large scale development initiatives, and establishing more robust penalties to discourage the intentional destruction of historic resources. Specifically, the following policies and actions will build upon and enhance current efforts toward preservation.
Goal: Protect and preserve the historic and archaeological heritage of the County.
Policy 1: Develop stronger incentives to encourage and promote historic preserva-tion, along with stronger deterrents to prevent destruction of historic resources.
2009GeneralDevelopentPlan
Page 56
Chapter 4 Community Preservation and Enhancement
Actions:
� Assess the feasibility of adopting a local historic preservation tax credit and/or property tax abatement program to encourage the retention and adaptive reuse of historic buildings.
� Revise subdivision regulations to allow historic property lots to be created without counting towards the allowable density of a subdivision, given that the historic property is retained and protected by easement.
� Develop and adopt stronger penalties for intentional destruction of historic resources. Raise the class of fines for “demolition without a permit” when an his-toric property is involved.
Policy 2: Strengthen land use policies and regulations for cultural resource protection.
Actions:
� Conduct an assessment of current levels of protection for cultural resources pro-vided through land use regulations, and determine whether there are additional policies or Code provisions needed for greater levels of protection.
� Evaluate the Scenic and Historic Roads regulations to more clearly establish the criteria used to evaluate the treatment of each road in a development context.
� Develop local incentives to encourage property owners to pursue National Regis-ter of Historic Properties nominations and listing with the County’s assistance.
� Partner with the Agricultural Preservation Program to incorporate historic and archaeological resource protection into those efforts.
Policy 3: Improve interagency coordination within the County system in order to enhance historic preservation efforts.
Actions:
� Work with State and County agencies to improve recordation and tracking proce-dures for maintaining an up-to-date and accurate inventory of historic properties and easements in the county.
� Continue to support and participate in the Maryland Heritage Areas Program to provide additional funding sources and tax incentives and promote heritage tourism.
� Develop preservation plans for historic and cultural resources located on County-owned properties.
2009GeneralDevelopentPlan

Community Preservation and Enhancement
Page 57
Chapter 4
Policy 4: Enhance public education and community outreach efforts to promote his-toric preservation and stewardship.
Actions:
� Provide adequate funding and resources to support the educational outreach programs, address community outreach needs, and to maintain the County Archaeological Lab facility.
� Develop educational programs and tours of historic sites in the County by part-nering with State agencies and other non-profit organizations.
� Maximize use of volunteers to assist with cultural resources research and site documentation.
2009GeneralDevelopentPlan

Chapter 5:Environmental Stewardship

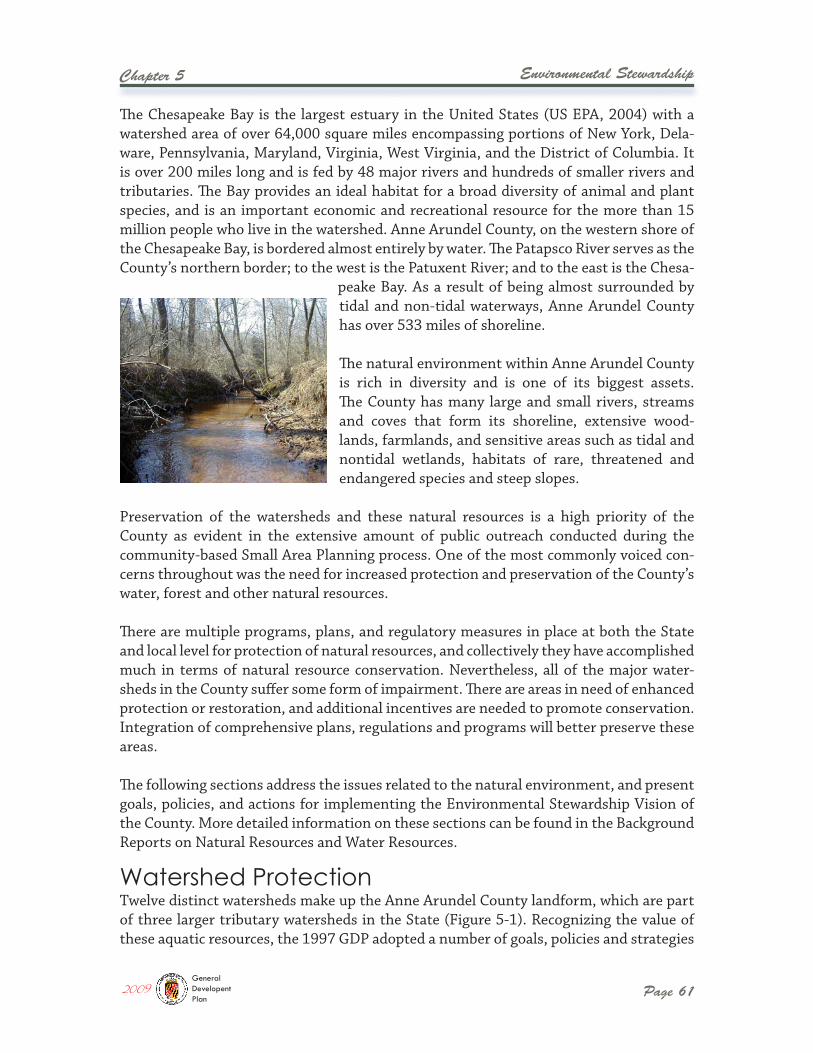
Environmental Stewardship
Page 61
Chapter 5
The Chesapeake Bay is the largest estuary in the United States (US EPA, 2004) with a watershed area of over 64,000 square miles encompassing portions of New York, Dela-ware, Pennsylvania, Maryland, Virginia, West Virginia, and the District of Columbia. It is over 200 miles long and is fed by 48 major rivers and hundreds of smaller rivers and tributaries. The Bay provides an ideal habitat for a broad diversity of animal and plant species, and is an important economic and recreational resource for the more than 15 million people who live in the watershed. Anne Arundel County, on the western shore of the Chesapeake Bay, is bordered almost entirely by water. The Patapsco River serves as the County’s northern border; to the west is the Patuxent River; and to the east is the Chesa-
peake Bay. As a result of being almost surrounded by tidal and non-tidal waterways, Anne Arundel County has over 533 miles of shoreline.
The natural environment within Anne Arundel County is rich in diversity and is one of its biggest assets. The County has many large and small rivers, streams and coves that form its shoreline, extensive wood-lands, farmlands, and sensitive areas such as tidal and nontidal wetlands, habitats of rare, threatened and endangered species and steep slopes.
Preservation of the watersheds and these natural resources is a high priority of the County as evident in the extensive amount of public outreach conducted during the community-based Small Area Planning process. One of the most commonly voiced con-cerns throughout was the need for increased protection and preservation of the County’s water, forest and other natural resources.
There are multiple programs, plans, and regulatory measures in place at both the State and local level for protection of natural resources, and collectively they have accomplished much in terms of natural resource conservation. Nevertheless, all of the major water-sheds in the County suffer some form of impairment. There are areas in need of enhanced protection or restoration, and additional incentives are needed to promote conservation. Integration of comprehensive plans, regulations and programs will better preserve these areas.
The following sections address the issues related to the natural environment, and present goals, policies, and actions for implementing the Environmental Stewardship Vision of the County. More detailed information on these sections can be found in the Background Reports on Natural Resources and Water Resources.
Twelve distinct watersheds make up the Anne Arundel County landform, which are part of three larger tributary watersheds in the State (Figure 5-1). Recognizing the value of these aquatic resources, the 1997 GDP adopted a number of goals, policies and strategies
Watershed Protection
2009GeneralDevelopentPlan
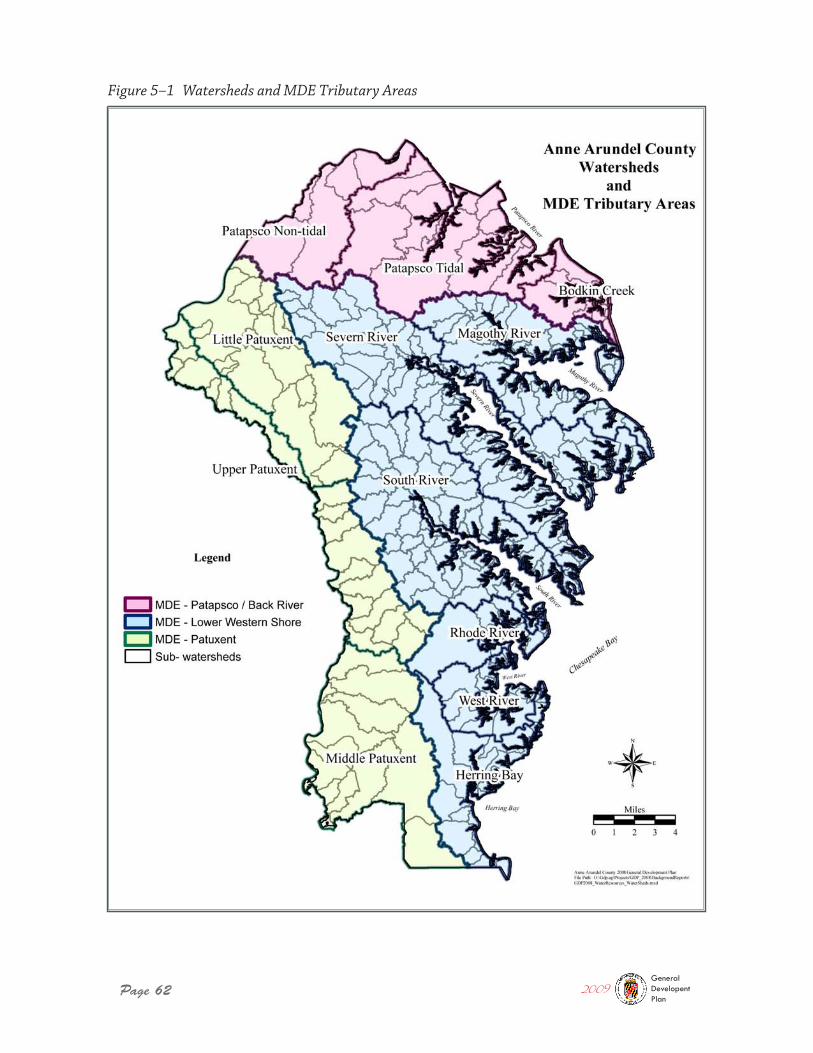
Page 62
Figure 5–1 Watersheds and MDE Tributary Areas
2009GeneralDevelopentPlan
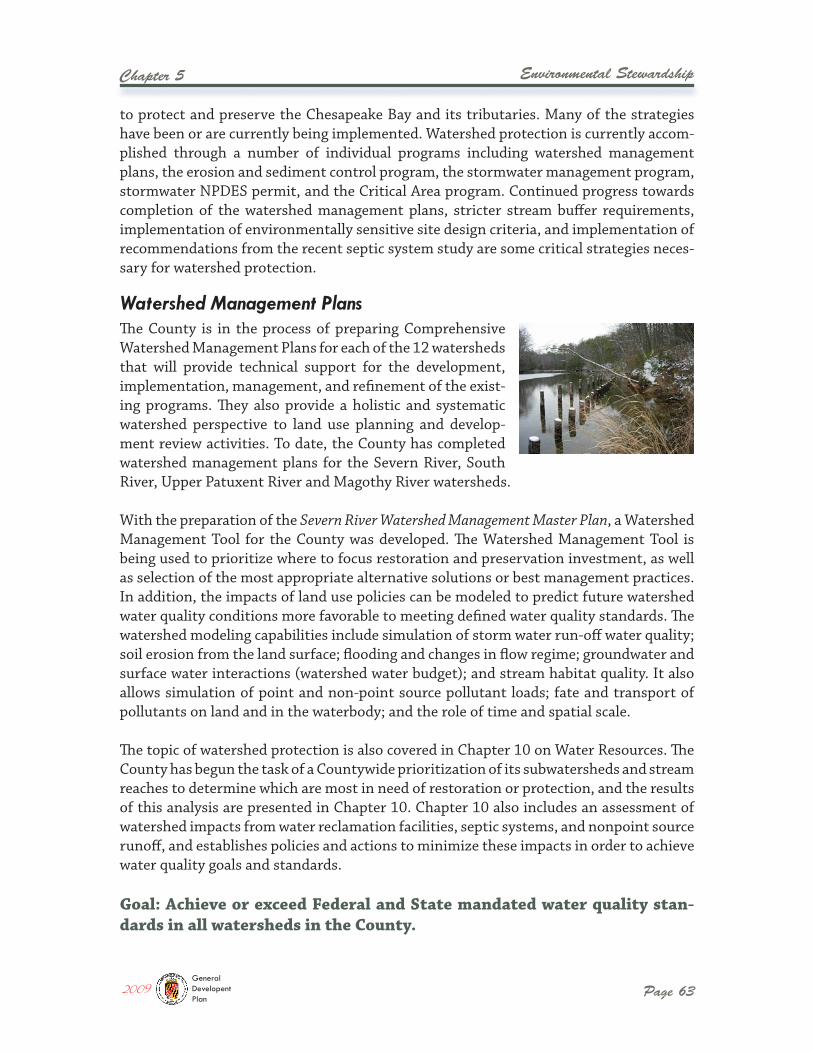
Environmental Stewardship
Page 63
Chapter 5
The County is in the process of preparing Comprehensive Watershed Management Plans for each of the 12 watersheds that will provide technical support for the development, implementation, management, and refinement of the exist-ing programs. They also provide a holistic and systematic watershed perspective to land use planning and develop-ment review activities. To date, the County has completed watershed management plans for the Severn River, South River, Upper Patuxent River and Magothy River watersheds.
With the preparation of the Severn River Watershed Management Master Plan, a Watershed Management Tool for the County was developed. The Watershed Management Tool is being used to prioritize where to focus restoration and preservation investment, as well as selection of the most appropriate alternative solutions or best management practices. In addition, the impacts of land use policies can be modeled to predict future watershed water quality conditions more favorable to meeting defined water quality standards. The watershed modeling capabilities include simulation of storm water run-off water quality; soil erosion from the land surface; flooding and changes in flow regime; groundwater and surface water interactions (watershed water budget); and stream habitat quality. It also allows simulation of point and non-point source pollutant loads; fate and transport of pollutants on land and in the waterbody; and the role of time and spatial scale.
The topic of watershed protection is also covered in Chapter 10 on Water Resources. The County has begun the task of a Countywide prioritization of its subwatersheds and stream reaches to determine which are most in need of restoration or protection, and the results of this analysis are presented in Chapter 10. Chapter 10 also includes an assessment of watershed impacts from water reclamation facilities, septic systems, and nonpoint source runoff, and establishes policies and actions to minimize these impacts in order to achieve water quality goals and standards.
Goal: Achieve or exceed Federal and State mandated water quality stan-dards in all watersheds in the County.
to protect and preserve the Chesapeake Bay and its tributaries. Many of the strategies have been or are currently being implemented. Watershed protection is currently accom-plished through a number of individual programs including watershed management plans, the erosion and sediment control program, the stormwater management program, stormwater NPDES permit, and the Critical Area program. Continued progress towards completion of the watershed management plans, stricter stream buffer requirements, implementation of environmentally sensitive site design criteria, and implementation of recommendations from the recent septic system study are some critical strategies neces-sary for watershed protection.
Watershed Management Plans
2009GeneralDevelopentPlan
Page 64
Chapter 5 Environmental Stewardship
Policy 1: Maintain a proactive watershed planning program that integrates land use planning and water resource protection. In addition, maintain a proactive environmental monitoring program that will assess the effectiveness of stormwa-ter management practices and watershed restoration actions and track progress toward meeting water quality standards.
Actions:
� Complete Round 1 physical, chemical, and biological assessments for all streams within the County. Remaining: Patapsco Non-Tidal, Patapsco Tidal, Bodkin, Little Patuxent, Middle Patuxent, West River, Rhode River, and Herring Bay.
� Re-evaluate water quality monitoring as needed for affected streams that were previously evaluated as part of required monitoring for County restoration proj-ects (e.g. Towsers Branch).
� Continue to maintain and update the County’s impervious and Landcover GIS coverage. Improve the scale of the coverage to support a more refined parcel level pollutant loading model and a fair basis for assessing stormwater fees in the event such fees are assessed in the future.
� Assess all stream reaches and subwatersheds within the County and prioritize them for restoration and preservation.
� Develop and update the current and ultimate development stormwater and septic pollutant loadings at the subwatershed scale for all watersheds in the County.
� Identify potential restoration/preservation opportunities and conduct cost/benefit studies to assess the effectiveness of implementation in meeting Total Maximum Daily Load (TMDL) regulatory requirements. Conduct implementation feasibility studies and develop concept restoration plans for select projects. Rec-ommend implementation through CIP and grant funding.
� Use the County’s Watershed Management Tool and watershed assessment data to review stormwater management plans and flood studies associated with develop-ment projects and zoning applications.
� Utilize information and results from watershed assessment work to recommend revisions or enhancement to the County’s stormwater management standards, codes, and regulations.
� Use the Watershed Management Tool to track forest cover in each watershed with a goal of preventing the loss of forest cover. Use the State’s recent Stormwa-ter Management Act and its focus on reducing impervious areas to create more opportunities for forest conservation.
2009GeneralDevelopentPlan
Environmental Stewardship
Page 65
Chapter 5
The County’s sensitive areas include streams and their buffers, the 100-year floodplain, habitats of rare, threatened and endangered species, steep slopes, and tidal and nontidal wetlands. These areas are currently protected through various existing regulations such as the Subdivision Code and the Floodplain Ordinance. New strategies such as environmen-tal protection overlay zones for high priority areas are also being explored as methods of protecting sensitive areas and preserving the environment. In addition, continued moni-toring and necessary modification of regulations and policies will improve upon their effectiveness.
There are over 1,750 miles of non-tidal streams in the County. Most of these streams are short, first- or second-order headwater streams that are slow moving with a very low gradient. As these streams flow toward the Chesapeake Bay, they slow down and begin cutting more deeply into the landscape. Stream buffers are important in controlling nutrient and sediment runoff, maintaining stream temperatures, and providing aquatic and wildlife habitat.
Streams and stream buffers are currently protected through the County’s Floodplain and Subdivision ordinances and the County’s Stormwater Design Manual.
Anne Arundel County is prone to three types of flooding: nontidal flooding from riv-ers and streams; tidal flooding from storm surges and tides; and coastal flooding caused by intense winds and heavy rains from tropical storms, hurricanes and steady on-shore winds and elevated tide levels.
Floodplains in the County are protected through the Floodplain, Subdivision, and Zoning ordinances. The Floodplain Ordinance defines the floodplain districts, requires delinea-tion of the floodplain on development plans submitted to the County, prohibits new structures or substantial modifications to structures in the 100-year nontidal floodplain,
� Continue correspondence with the Maryland Department of the Environment (MDE) to reach agreement on the assessment methods, goal setting protocols, and development and effectiveness of watershed implementation plans.
� Work with MDE to address the ongoing problem of high bacteria levels in local waterways including Furnace Creek, Marley Creek, and Rock Creek. Future water-shed studies and Watershed Management Plans should coordinate with MDE and the County Health Department to further determine the source of bacterial load-ing to these waterways and identify ways to reduce and eliminate these sources.
� Continue participation in the Tributary Strategies teams.
Sensitive Areas
Streams and Stream Buffers
100 – Year Floodplain
2009GeneralDevelopentPlan
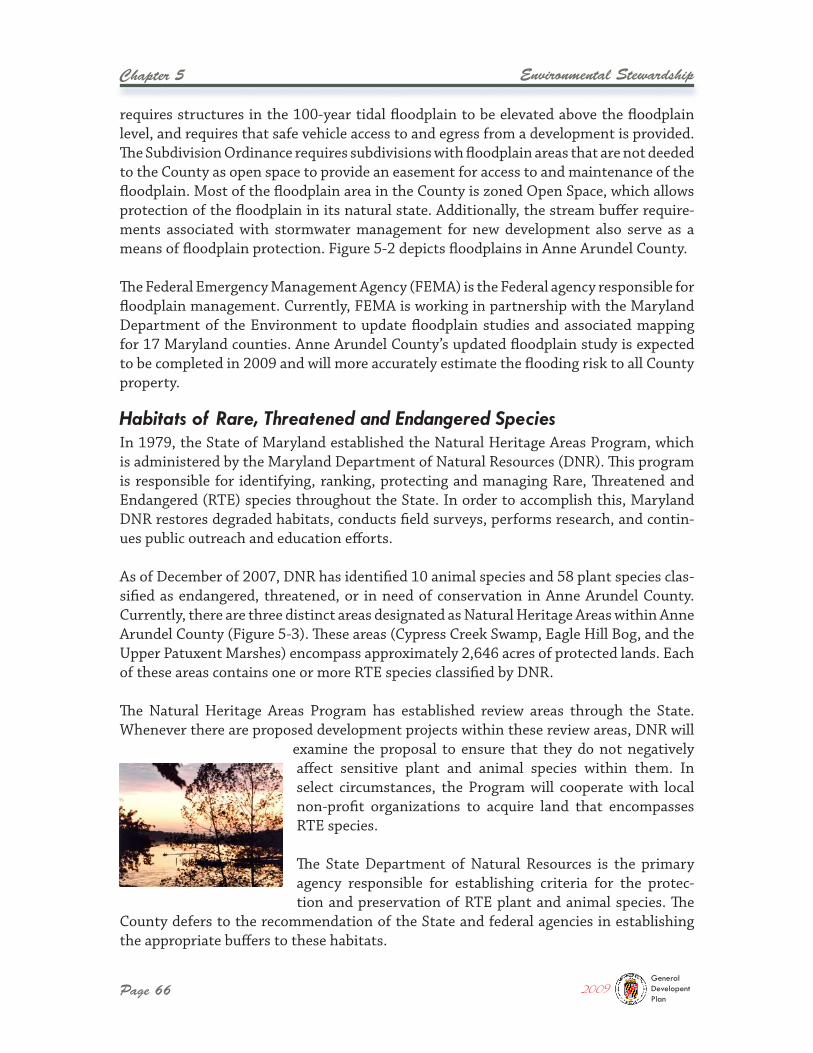
Page 66
Chapter 5 Environmental Stewardship
requires structures in the 100-year tidal floodplain to be elevated above the floodplain level, and requires that safe vehicle access to and egress from a development is provided. The Subdivision Ordinance requires subdivisions with floodplain areas that are not deeded to the County as open space to provide an easement for access to and maintenance of the floodplain. Most of the floodplain area in the County is zoned Open Space, which allows protection of the floodplain in its natural state. Additionally, the stream buffer require-ments associated with stormwater management for new development also serve as a means of floodplain protection. Figure 5-2 depicts floodplains in Anne Arundel County.
The Federal Emergency Management Agency (FEMA) is the Federal agency responsible for floodplain management. Currently, FEMA is working in partnership with the Maryland Department of the Environment to update floodplain studies and associated mapping for 17 Maryland counties. Anne Arundel County’s updated floodplain study is expected to be completed in 2009 and will more accurately estimate the flooding risk to all County property.
In 1979, the State of Maryland established the Natural Heritage Areas Program, which is administered by the Maryland Department of Natural Resources (DNR). This program is responsible for identifying, ranking, protecting and managing Rare, Threatened and Endangered (RTE) species throughout the State. In order to accomplish this, Maryland DNR restores degraded habitats, conducts field surveys, performs research, and contin-ues public outreach and education efforts.
As of December of 2007, DNR has identified 10 animal species and 58 plant species clas-sified as endangered, threatened, or in need of conservation in Anne Arundel County. Currently, there are three distinct areas designated as Natural Heritage Areas within Anne Arundel County (Figure 5-3). These areas (Cypress Creek Swamp, Eagle Hill Bog, and the Upper Patuxent Marshes) encompass approximately 2,646 acres of protected lands. Each of these areas contains one or more RTE species classified by DNR.
The Natural Heritage Areas Program has established review areas through the State. Whenever there are proposed development projects within these review areas, DNR will
examine the proposal to ensure that they do not negatively affect sensitive plant and animal species within them. In select circumstances, the Program will cooperate with local non-profit organizations to acquire land that encompasses RTE species.
The State Department of Natural Resources is the primary agency responsible for establishing criteria for the protec-tion and preservation of RTE plant and animal species. The
County defers to the recommendation of the State and federal agencies in establishing the appropriate buffers to these habitats.
Habitats of Rare, Threatened and Endangered Species
2009GeneralDevelopentPlan
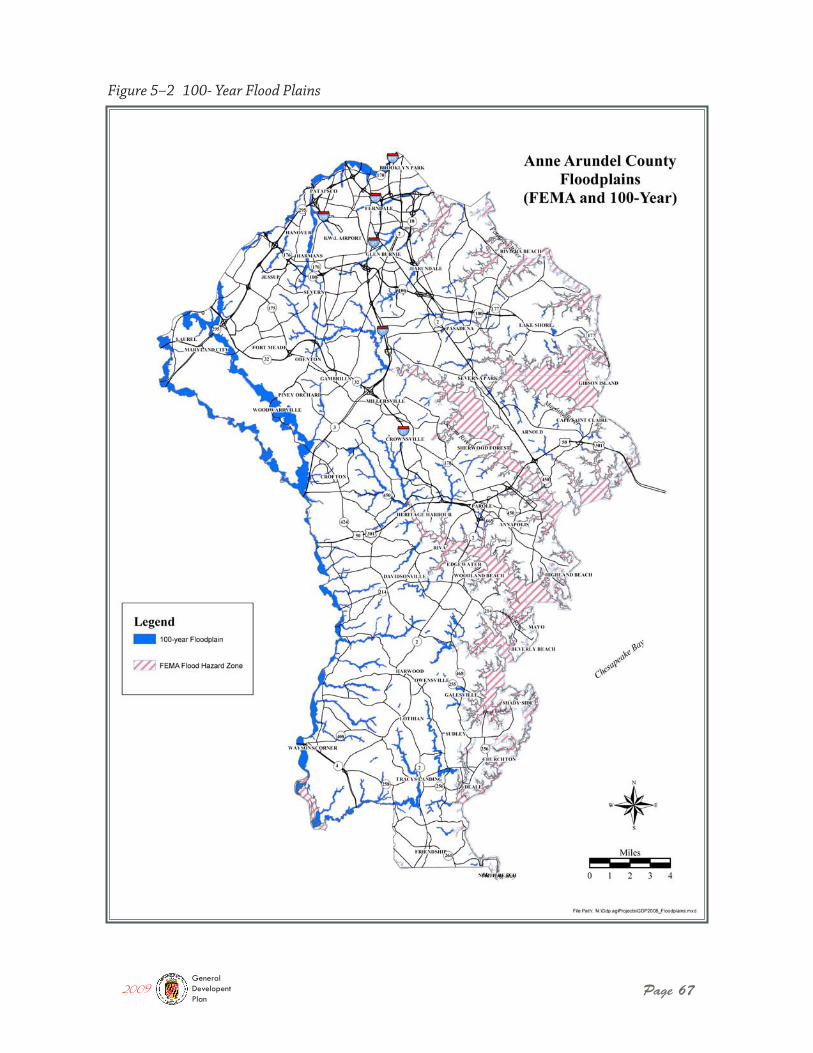
Page 67
Figure 5–2 100- Year Flood Plains
2009GeneralDevelopentPlan
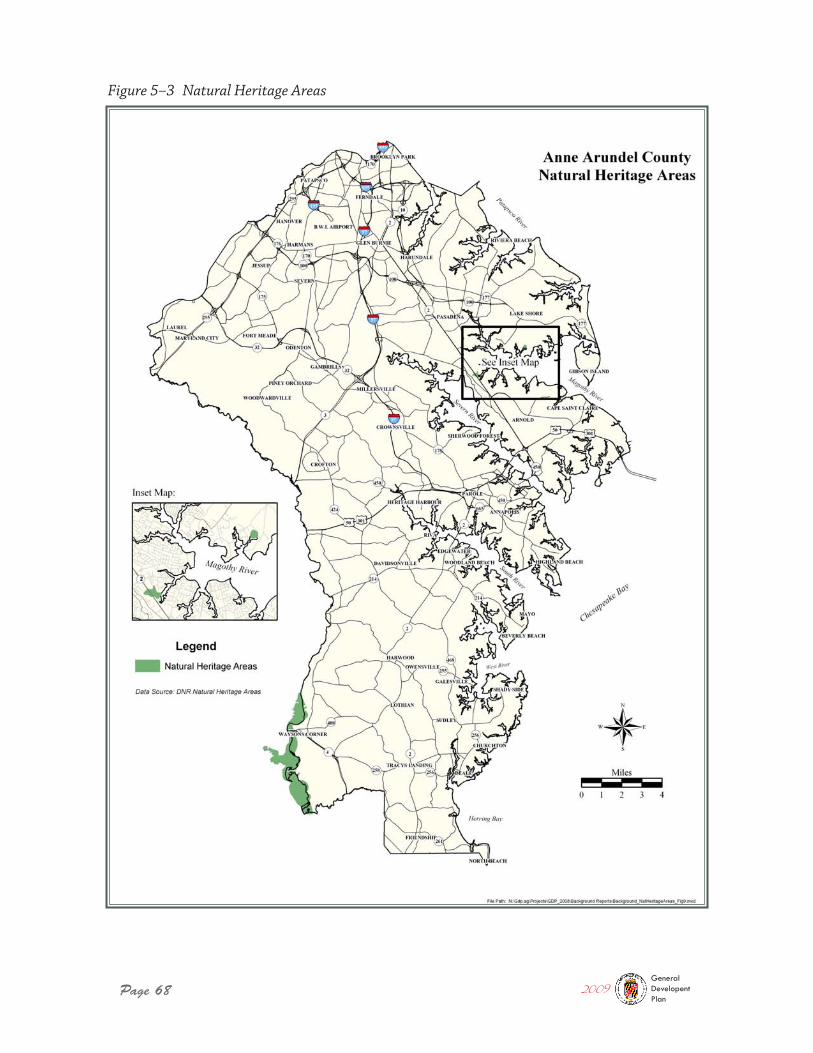
Page 68
Figure 5–3 Natural Heritage Areas
2009GeneralDevelopentPlan
Environmental Stewardship
Page 69
Chapter 5
Steep slopes are defined in the County Code as those that have a 25% or greater slope, and that have an onsite and offsite contiguous area that is greater than 5,000 square feet over 10 feet vertical as measured before development. In the Critical Area and designated sensitive areas, steep slopes are defined as those having a 15% or greater slope. Most of the steep slopes occur along the rivers and streams. A nearly continuous stretch occurs between the headwaters of the Severn River to the County’s southern boundary near Herring Bay. The most severe slopes are along the Severn and South rivers. It is impera-tive to protect these slopes from erosion, which can lead to poor water quality from the sediment loading into streams.
Anne Arundel County protects erosion of steep slopes through the Subdivision Ordi-nance. Development in the County may not occur within steep slopes or within 25 feet of the top of the steep slopes where the onsite and offsite contiguous area of the steep slopes is greater than 20,000 square feet unless development will facilitate stabilization of the slope or the disturbance is necessary to allow connection to a public utility. In the RCA and LDA overlay zones of the Chesapeake Bay Critical Area, development may not occur within slopes of 15% or greater.
Anne Arundel County is fortunate to have over 500 miles of tidal shoreline and large areas of tidal wetlands. Tidal wetlands have long been recognized as an important component in the health of the Bay. They provide numerous environmental benefits such as filtering sediment and nutrients from upland runoff, controlling flooding and shoreline erosion, providing nurseries for shellfish and finfish, absorbing nutrients from the water column, and providing valuable habitat for many aquatic and terrestrial species of flora and fauna. Tidal wetlands are critically important to commercial and recreational fisheries. Many of the Bay’s commercial fin and shellfish spend a crucial part of their early life cycle in tidal wetlands, and use these areas as refuge from predators.
The County protects tidal wetlands through implementation and enforcement of the Critical Area Program. Through the permitting process, any proposed impacts to tidal wetlands are assessed to determine compliance with Critical Area requirements, includ-ing the requirement for a 100-foot buffer to tidal wetlands. Additionally, the County coordinates with the U.S. Army Corps of Engineers and MDE to prevent adverse impacts to tidal wetlands from development projects and shoreline stabilization projects.
Over half of all wetlands within Anne Arundel County are considered upland or nontidal wetlands. These are areas where water is the primary factor controlling the hydrology and associated plant life. There are many types of nontidal wetlands such as forested wetlands, scrub-shrub wetlands, and wet meadows. Nontidal wetlands provide many of the same environmental functions as tidal wetlands, including providing habitat for fish
Steep Slopes
Wetlands
2009GeneralDevelopentPlan
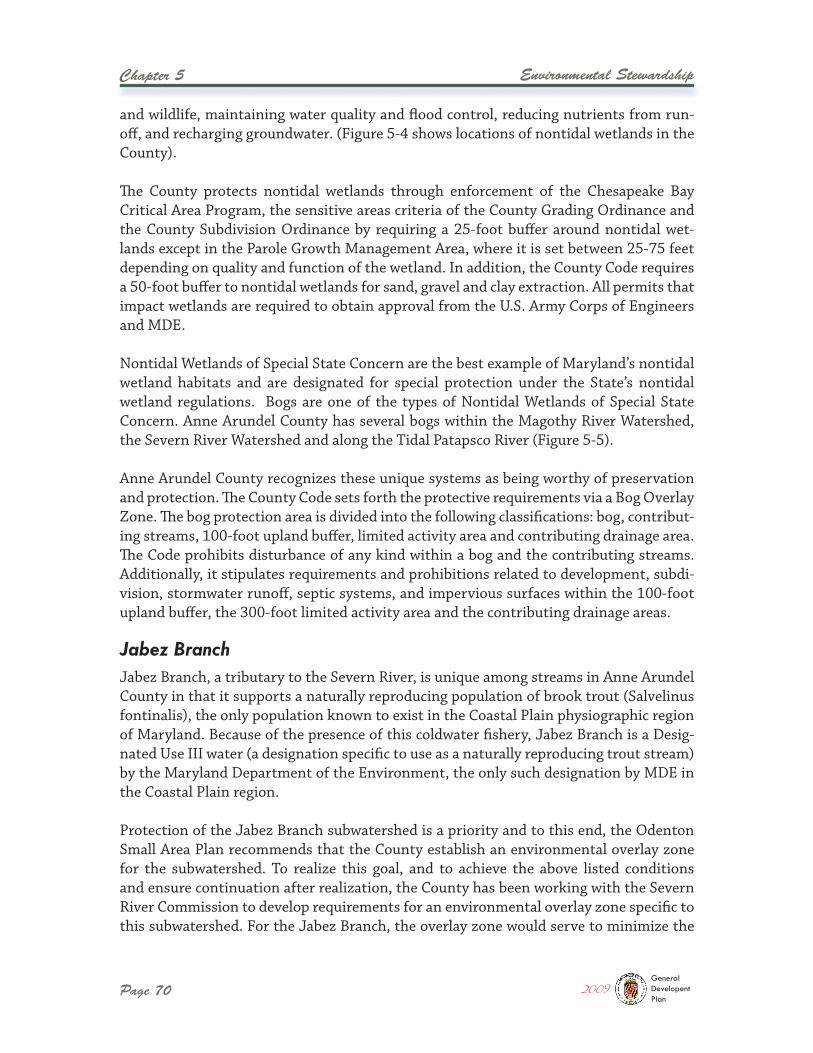
Page 70
Chapter 5 Environmental Stewardship
Jabez Branch, a tributary to the Severn River, is unique among streams in Anne Arundel County in that it supports a naturally reproducing population of brook trout (Salvelinus fontinalis), the only population known to exist in the Coastal Plain physiographic region of Maryland. Because of the presence of this coldwater fishery, Jabez Branch is a Desig-nated Use III water (a designation specific to use as a naturally reproducing trout stream) by the Maryland Department of the Environment, the only such designation by MDE in the Coastal Plain region.
Protection of the Jabez Branch subwatershed is a priority and to this end, the Odenton Small Area Plan recommends that the County establish an environmental overlay zone for the subwatershed. To realize this goal, and to achieve the above listed conditions and ensure continuation after realization, the County has been working with the Severn River Commission to develop requirements for an environmental overlay zone specific to this subwatershed. For the Jabez Branch, the overlay zone would serve to minimize the
and wildlife, maintaining water quality and flood control, reducing nutrients from run-off, and recharging groundwater. (Figure 5-4 shows locations of nontidal wetlands in the County).
The County protects nontidal wetlands through enforcement of the Chesapeake Bay Critical Area Program, the sensitive areas criteria of the County Grading Ordinance and the County Subdivision Ordinance by requiring a 25-foot buffer around nontidal wet-lands except in the Parole Growth Management Area, where it is set between 25-75 feet depending on quality and function of the wetland. In addition, the County Code requires a 50-foot buffer to nontidal wetlands for sand, gravel and clay extraction. All permits that impact wetlands are required to obtain approval from the U.S. Army Corps of Engineers and MDE.
Nontidal Wetlands of Special State Concern are the best example of Maryland’s nontidal wetland habitats and are designated for special protection under the State’s nontidal wetland regulations. Bogs are one of the types of Nontidal Wetlands of Special State Concern. Anne Arundel County has several bogs within the Magothy River Watershed, the Severn River Watershed and along the Tidal Patapsco River (Figure 5-5).
Anne Arundel County recognizes these unique systems as being worthy of preservation and protection. The County Code sets forth the protective requirements via a Bog Overlay Zone. The bog protection area is divided into the following classifications: bog, contribut-ing streams, 100-foot upland buffer, limited activity area and contributing drainage area. The Code prohibits disturbance of any kind within a bog and the contributing streams. Additionally, it stipulates requirements and prohibitions related to development, subdi-vision, stormwater runoff, septic systems, and impervious surfaces within the 100-foot upland buffer, the 300-foot limited activity area and the contributing drainage areas.
Jabez Branch
2009GeneralDevelopentPlan
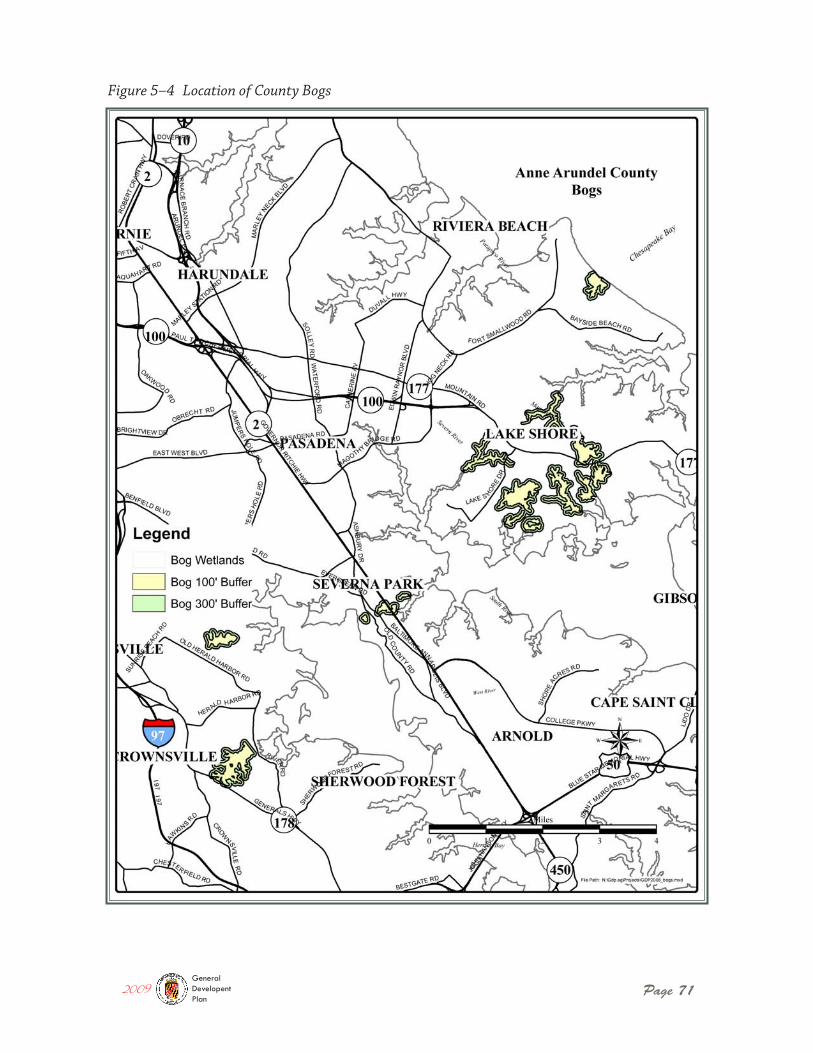
Page 71
Figure 5–4 Location of County Bogs
2009GeneralDevelopentPlan
Page 72
Figure 5–5 Nontidal Wetlands
2009GeneralDevelopentPlan
Environmental Stewardship
Page 73
Chapter 5
impacts from stormwater runoff and sediment loading to the stream, maintain or reduce existing impervious surfaces levels, maintain adequate stream flow and temperature to protect the coldwater temperature and flow regime, and establish and maintain wider forested riparian buffers than currently required under County stormwater management regulations to protect the overall ecosystem quality.
The final language of the overlay zone has not yet been determined. County staff and a subcommittee of the Severn River Commission are now finalizing the desired require-ments of the zone and will continue to work with the Office of Planning and Zoning to develop appropriate regulatory language. Once adopted, regulations would then be incorporated into the County’s Zoning Ordinance.
The following policies and actions are proposed to increase protection of all of the Coun-ty’s sensitive areas.
Goal: Preserve and protect sensitive areas including streams and their buf-fers, floodplains, Natural Heritage Areas, steep slopes, tidal and nontidal wetlands, and unique watersheds.
Policy 1: Protect stream buffers as a means of reducing stormwater runoff impacts and improving water quality in local tributaries.
Actions:
� Evaluate current stream buffer requirements in the Stormwater Design Manual and expand buffer requirements either Countywide or in select subwatersheds as needed to achieve watershed planning goals.
� Where modifications to development are approved in sensitive areas, evaluate the possibility of requiring a fee to be paid and placed in a natural resource restoration fund.
� Consider revisions to development regulations that would disallow modifications to forest conservation requirements or stream buffer requirements in high priority subwatersheds.
� Consider use of County reforestation funds to purchase environmentally sensitive properties for protection.
Policy 2: Minimize disturbance to floodplains.
Actions:
� Use FEMA’s updated Digital Flood Insurance Rate Maps, when available, to review and refine the OS (Open Space) zoning district Countywide.
� Explore participation in FEMA’s Community Rating System.
2009GeneralDevelopentPlan
Page 74
Chapter 5 Environmental Stewardship
Policy 3: Reduce the amount of disturbance to steep slopes adjacent to and within sensitive areas.
Actions:
� Review and update if necessary, the steep slopes criteria in the County. Consider a definition of steep slopes as 15% or greater if slopes occur within 100 feet of a stream.
Policy 4: Continue established policy of no net loss and strive for overall gain of tidal and nontidal wetlands.
Actions:
� Develop additional programs for wetland creation and enhancement.
� Provide for more rigorous enforcement of wetland protection in development areas.
� Identify wetland sites for mitigation banking and establish a County wetland bank. Wetland mitigation should correspond in form and function to that which was destroyed or lost.
Policy 5: Protect the Jabez Branch and other unique watersheds from adverse impacts.
Actions:
� Develop a Jabez Branch Overlay Zone and incorporate regulations into the County Code as needed.
� Evaluate whether environmental overlay zones should be established for other subwatersheds in the County in addition to the Jabez Branch.
Policy 6: Minimize the allowance of modifications to the County’s subdivision and development regulations where sensitive areas are impacted.
Actions:
� Develop a set of criteria or standards to be used in evaluating modification requests that impact sensitive areas such as stream buffers, wetlands, and floodplains, and incorporate them into the subdivision and development code as appropriate.
2009GeneralDevelopentPlan
Environmental Stewardship
Page 75
Chapter 5
Land preservation is an important component of natural resources conservation. Natural areas such as wooded areas, greenways and open spaces provide many environmental benefits such as homes for wildlife habitat, flood control, soil erosion, filtration and absorption of pollutants. Anne Arundel County participates in State-sponsored programs such as Program Open Space, the Rural Legacy Program, the Forest Legacy Program and the Forest Land Incentive Program. The County has met the State requirements to participate and receive funding through the Program Open Space and Rural Legacy programs. The County Department of Recreation and Parks manages these programs and funds have been used to acquire lands for conservation purposes as well as for active recreation or agricultural preservation purposes.
The Patuxent River Policy Plan is a land management plan to protect the river and its watershed. The goals in the plan provide a broad vision to restore and maintain water quality, habitat, groundwater and surface water supplies and a high quality of life along the Patuxent River and its tributaries. The County’s Watershed and Ecosystem Services Division within the Department of Public Works actively participates with the Patuxent River Commission to implement the Patuxent River Policy Plan.
The County also has a Forest Conservation Program which is incorporated into the County Code and administered by the Department of Inspections and Permits and the Office of Planning and Zoning. In addition, the County has adopted master plans that provide tools for conserving natural resources and implementing a greenways network. See Figure 5-6 for a map of the greenways network and Figure 5-7 for existing woodlands.
Continued participation in the State programs, and implementation and better linkage between the strategies adopted in the Land Preservation, Parks and Recreation Plan and the Greenways Master Plan will better facilitate these land preservation efforts.
Goal: Preserve, protect and enhance the designated Greenways network as well as forest cover countywide.
Policy 1: Establish an interconnected network of protected corridors of woodlands and open space in accordance with the goals of the Greenways Master Plan.
Actions:
� Establish an ongoing system for tracking the status of properties in the greenways network, and prepare periodic status reports on additional land acquisitions or conservation easements within the Greenway network.
Greenways, Open Space, and Forest Conservation
2009GeneralDevelopentPlan
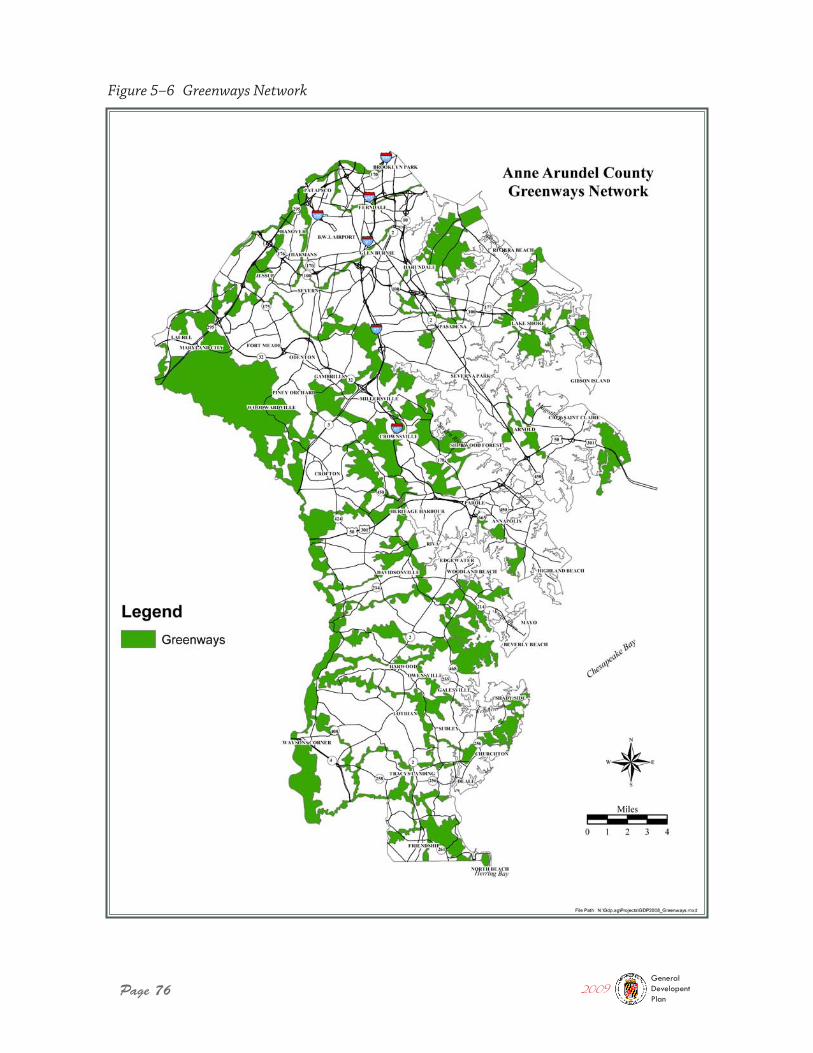
Page 76
Figure 5–6 Greenways Network
2009GeneralDevelopentPlan
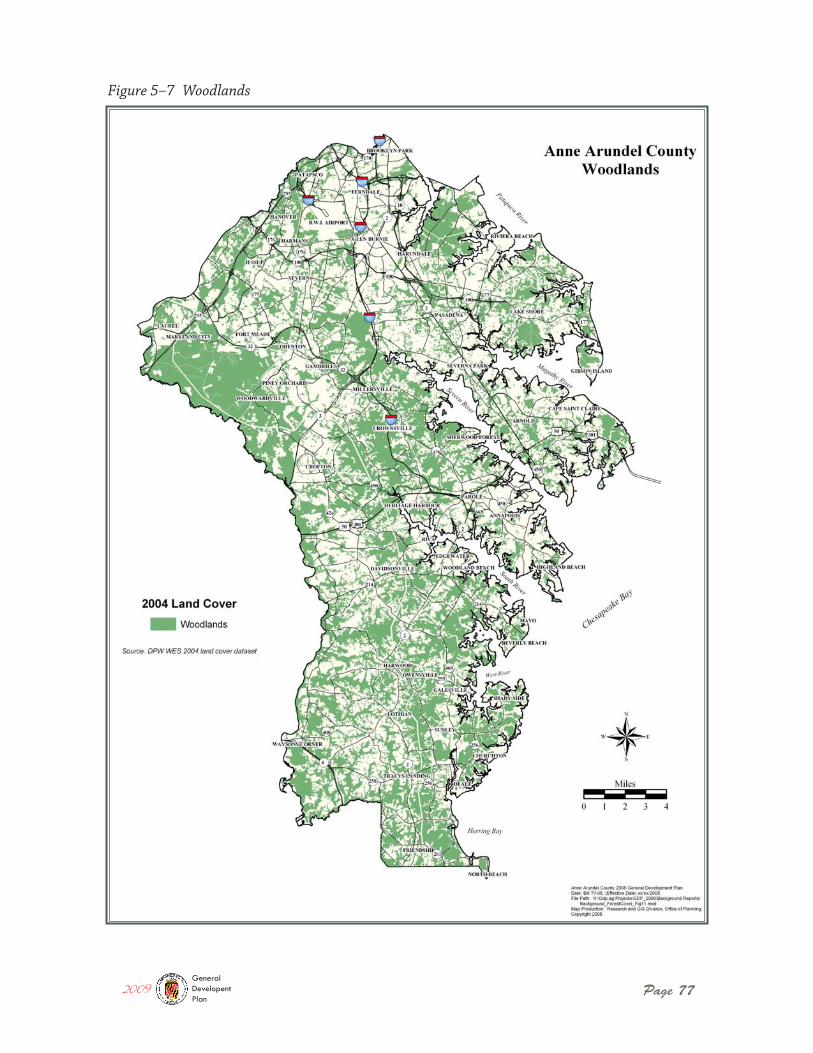
Page 77
Figure 5–7 Woodlands
2009GeneralDevelopentPlan
Page 78
Chapter 5 Environmental Stewardship
The majority of air pollution in the region comes from mobile sources such as vehicles, area sources such as drycleaners and consumer products, and from stationary sources such as power plants. Approximately two-thirds of Maryland’s air pollution originates
� Prioritize properties for the purpose of targeting funds for greenways acquisi-tions, building on the priorities established in the 2002 Greenways Master Plan and the 2006 Land Preservation, Parks, and Recreation Plan.
� Prioritize the use of funds for acquisition of conservation land to give highest priority to properties within the greenway network. Encourage the placement of greenways into permanent conservation easements.
� Establish a proactive outreach program to “market” the Greenways Plan. Work with local land trusts, Riverkeepers, and other environmental groups to promote the benefits of conservation easements and other preservation tools.
� For private properties located in the Greenways network that choose to develop, encourage cluster development and placement of the remaining open space under conservation easements. Assess potential revisions to the Subdivision code to require clustering on these properties.
� Use forest mitigation banks to promote reforestation, greenways protection, and good forest management practices.
� Modify the forest conservation regulations as needed to improve the effective-ness of mitigation, in order to better achieve preservation of continuous and connected hubs and corridors of forested areas. Potential revisions to evaluate include a requirement that, in those subwatersheds ranked highest priority for preservation, forest mitigation must occur in the same subwatershed.
� Create a database of property protected under Forest Conservation easements, and evaluate alternatives for a more comprehensive approach to forest conservation.
Policy 2: Ensure maximum protection of the County’s green infrastructure, non-tidal wetlands, designated wildlife refuges and other natural resource areas, even in areas designated as mixed use, in town centers or in areas designated for growth.
Action:
� When reviewing proposed development in areas designated for mixed use or tran-sit-oriented development, in town centers and in other designated growth areas, ensure that adequate protection is provided for the County’s green infrastructure, non-tidal wetlands, wildlife refuges and forested areas in order to retain a high quality of life, preserve water quality, and maintain such areas as desirable places to live.
Air Quality
2009GeneralDevelopentPlan
Environmental Stewardship
Page 79
Chapter 5
outside of the State and is primarily associated with power plants in the Ohio River Valley coupled with existing meteorological conditions. To have input on regional strategies, plans, and programs that have a goal of improving air quality, the County is a member of the Baltimore Metropolitan Council, the Metropolitan Planning Organization for the Baltimore region. In addition, Arundel County has adopted land use and transpor-tation plans and zoning regulations that have a more positive influence on air quality. Mixed-use, transit-oriented and town center developments encourage more pedestrian and transit travel. The County’s Pedestrian and Bicycle Master Plan promotes biking and walking and the Transit Development Plan identifies local bus transit needs and makes recommendations for services to meet those needs. To continue the progress of improv-ing air quality, new policies and actions, some of which originated with the Small Area Plans, are recommended.
Goal: Improve air quality.
Policy 1: Promote and support Transportation Demand Management (TDM) pro-grams and techniques to encourage less driving.
Actions:
� Provide transit access information on County meeting notices and in notices for County-permitted events. Encourage merchants to provide transit information in their advertisements and in their places of business.
� Develop and distribute transit information through printed materials, kiosks, web sites, radio and television broadcasts, etc. Provide transit information on the County’s website and all County buildings open to the public including libraries.
� Identify cost-effective Anne Arundel County TDM programs for County employees and all private companies with over 100 full-time employees. Serve as a resource to employers wishing to implement TDM by providing information through printed materials, workshops and other means. Encourage smaller employers to “pool” resources to create effective TDM programs. Support regional efforts to work with employers to provide TDM programs.
� Conduct a comprehensive study of potential park and ride locations to expand ridesharing and transit use.
Policy 2: Market transit-oriented development.
Action:
� Use both monetary and non-monetary incentives (reduced parking requirements, accelerated permit processing, etc.) to transit-oriented developments in order to reduce vehicle trips and automobile emissions.
2009GeneralDevelopentPlan
Page 80
Chapter 5 Environmental Stewardship
Noise at excessive levels affects our quality of life and the environment. It impacts the lives of many County residents, particularly noise generated from highway traffic, rail-ways, and aircraft. There are many regulations and programs that currently assist in minimizing noise impacts. In 2005, the Maryland Department of the Environment Noise Control Program was de-funded and noise issues are being referred to the local govern-ments for action. Due to this legislative action, the County needs to address policies and actions that will improve the compatibility between land uses.
Goal: Reduce noise pollution
Policy 1: Limit future residential and other noise-sensitive land uses in areas exposed to higher levels of noise. When this is not feasible, make sure that innovative tech-niques are utilized to reduce noise impact to acceptable standards.
Actions:
� Amend the County’s noise ordinance to incorporate the authority given to the County by the State of enforcing noise standards and regulations.
� Assess current noise regulations, evaluate existing highway noise buffers and con-sider buffers on additional roads, airports, and railways.
� Amend the County Code to include the State’s noise standards and regulations.
Policy 3: Discourage incompatible land uses that would have localized affects on pol-lution. Also discourage cumulative impacts of concentrating multiple sources in an area.
Action:
� Locate incompatible uses at an appropriate distance from specific sources of pollution.
Policy 4: Promote public education of air pollution.Actions:
� Provide air quality data and methods to improve air quality on Anne Arundel County’s website. In addition, provide educational materials on the value of for-ested land in improving air quality.
� Encourage all public schools in the County to integrate air quality improvement into the curriculum.
Noise
2009GeneralDevelopentPlan
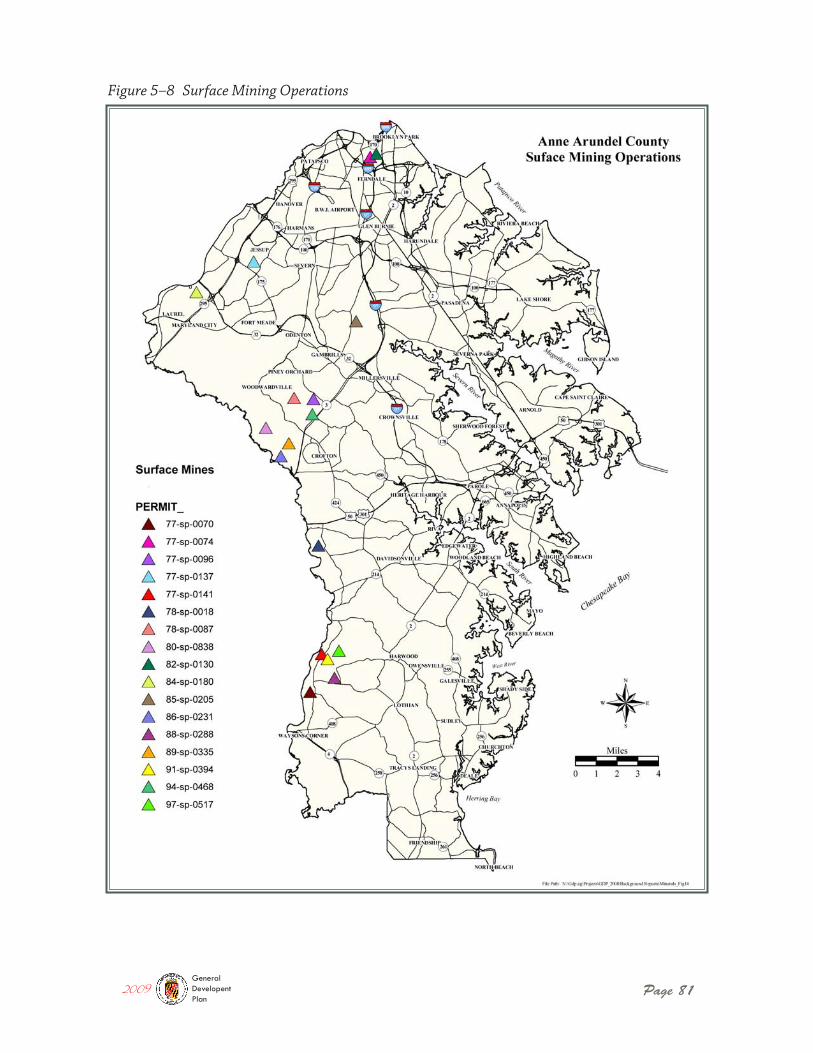
Page 81
Figure 5–8 Surface Mining Operations
2009GeneralDevelopentPlan
Page 82
Chapter 5 Environmental Stewardship
Surface mining of sand, gravel, and clay within Anne Arundel County support the local and regional economy in various ways. Sand and gravel extractions are used for highway construction and concrete manufacturing while clay is used to manufacture bricks and other structural clay products. Soil and other loose material are extracted without further processing and are used for fill for activities such as landscaping, building construction, and highway construction and maintenance. Figure 5-8 shows the active mining opera-tions located in the County. Since the adoption of the 1997 GDP, the number of mining operations has decreased from 27 to 17. Several mining operations have been reclaimed and more are in the reclamation process.
All of the existing mining sites that have been reclaimed are located in South County. Some of the planning goals and objectives of the South County Small Area Plan and the Patuxent River Policy plan have been implemented in part via the successful reclamation of these sites to recreational or passive open space. Active mines located in the Critical Area will need to be considered.
While not common, some active mining sites are located in areas of the County planned for residential or industrial use. These sites serve as important redevelopment opportu-nities for the County once the reclamation process has been completed. Coordination between State and County agencies will be important in ensuring that future reclamation complies with long-term land use planning.
Goal: Promote prudent use of mineral resources and responsible reclama-tion of mining sites.
Policy 1: Protect natural resources prior to, during, and after mining of sand and gravel deposits.
Actions:
� Update and evaluate existing mining operations and current reclamation plans
� Use reclamation to increase recreational and open space uses in the County.
� Coordinate with the State to ensure that site reclamation plans for active sites comply with the Land Use Plan.
Policy 2: Conserve mineral resources for future extraction.
Action:
� Inventory and map potential areas for future mineral extractions.
Mineral Resources
2009GeneralDevelopentPlan

Environmental Stewardship
Page 83
Chapter 5
In summary, the County should promote sustainable development as a broad policy for improving environmental stewardship in protecting water and air resources, preserving land and natural resources, and reducing energy consumption.
Policy 1: Promote sustainable site and building design that will result in more envi-ronmentally-friendly buildings, conserve energy and water, improve air quality and reduce solid waste.
Action:
� Evaluate developing a Green Building Program that would require all new con-struction to be LEED certified, and provide incentives such as density bonuses, tax incentives, fee reductions or waivers, and expedited permitting for those developments that achieve a higher level of LEED standard. In addition, evaluate the provision of tax incentives for existing buildings that achieve a higher level of LEED standard.
� Promote education and provide incentives for existing home and business owners to use green building practices such as replacing lawns with native plants, install-ing rain barrels to reduce runoff, and retrofitting buildings to be more energy efficient.
Sustainable Development
2009GeneralDevelopentPlan

Chapter 6:Quality Public Services

Quality Public Services
Page 87
Chapter 6
Anne Arundel County provides, operates, and maintains a wide variety of public services and facilities to serve local needs. The ability to provide a high level of services is impor-tant to the County and citizens alike. Public education, parks and recreation, health, library, and senior services have a direct impact on quality of life for local residents, and high quality public safety services and public water and sewer service are also critical to the health, safety and welfare of County citizens.
The provision of these services is an important component of the comprehensive plan-ning process, as land use and development decisions will have a direct impact on the demand for these services as well as the County’s ability to provide them. The follow-ing sections will provide goals, policies and actions that will address the public services needs of the citizens and strategies for achieving them at the highest level possible. More detailed information on these services can be found in the GDP Background Reports on Community Services, Public Safety, and Public Utilities. Transportation facilities and ser-vices, also important public services, are covered in Chapter 9.
The Anne Arundel County Public School System (AACPS) has a current student population of over 73,000 students, and is dedicated to providing a challenging and rewarding educa-tional experience for every child. The public school system includes a staff of over 5,000 teachers working in 118 public schools and has an annual operating budget of nearly $870 million for the current fiscal year. Programs and policies of the public schools are estab-lished by an eight-member Board of Education that includes seven members appointed by the Governor and one high school senior who serves as the student representative. The AACPS system includes twelve Maryland Blue Ribbon Schools of Excellence, of which eight are also National Blue Ribbon Schools.
The AACPS system is organized in 12 feeder districts (Figure 6-1) with each district cen-tered on a corresponding high school. Within this array of high school feeder districts are 19 middle schools and 78 elementary schools. The feeder system is a commonly used model for structuring the public education system, and tends to be preferred because it builds upon a consistent stream of pupil enrollment from elementary school, through middle school, and eventually into the corresponding high school. This system helps ensure that the same social networks continually support pupils and enhances commu-nity building. AACPS also operates several special schools and centers, including three alternate education centers, three special education centers, and one charter school.
The Anne Arundel Community College (AACC) offers post-secondary educational oppor-tunities for County residents. The community college serves over 54,000 students annually, and 70% of County public high school students who attend college in Maryland do so at AACC. This two-year college has a main campus located in Arnold, with off-site campus locations in the Glen Burnie Town Center (GBTC) and a new campus location at the Arundel Mills Mall.
Public Education
2009GeneralDevelopentPlan
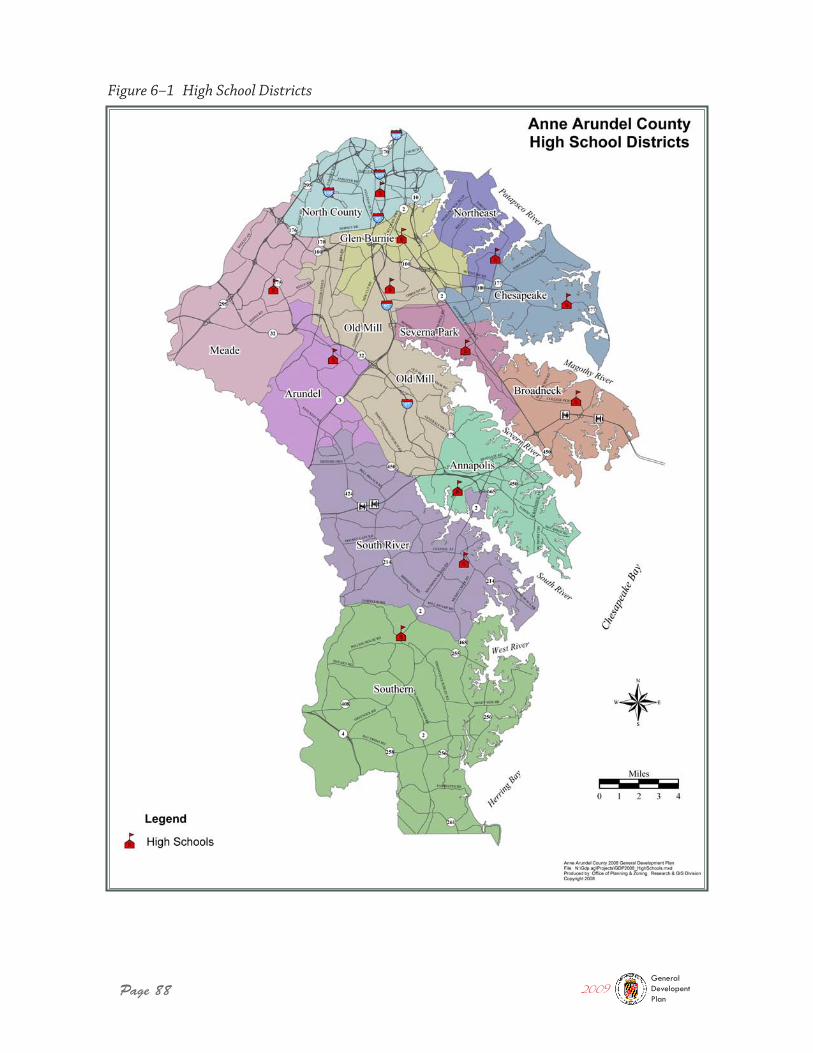
Page 88
Figure 6–1 High School Districts
2009GeneralDevelopentPlan
Quality Public Services
Page 89
Chapter 6
Two important tools used to plan for school facilities are the Educational Facilities Mas-ter Plan (EFMP) and the Adequate Public Facilities Ordinance (APFO). The Anne Arundel County Board of Education (BOE) is required by State law to prepare and annually update an EFMP. The 2007 EFMP lists three planning goals. They are essentially to provide for the most effective and efficient use of all school facilities; to provide the ability to conduct an effective instructional program that addresses community needs; and to determine the need for renovation of and/or addition to current facilities to meet changing needs for students, communities, and programs. The County’s Adequate Public Facilities Ordinance (APFO) is used as a growth management tool by connecting the approval of development projects to the availability of public facilities including schools. However, utilization rates at several of the County’s public schools, particularly with respect to some of the elementary schools, continue to be an ongoing issue both in terms of the impact on a child’s quality of education as well as on developers who cannot move forward with their projects.
The goals, policies and actions within the 2009 General Development Plan provide a com-prehensive framework for prioritizing current needs and planning for where future needs will be greatest.
Goal: Provide high quality education and public school infrastructure for all County residents.
Policy 1: Achieve and maintain the most efficient, effective, and equitable use of public school infrastructure.
Actions:
� Prioritize the BOE capital budget and program to utilize school space as efficiently as possible.
� Encourage the BOE to use both funding and redistricting options to maintain the most efficient and equitable use of school capacity.
� Revise the mitigation section of the Adequate Public Facilities code to allow pri-vate funding of school facilities through the development approval process.
� Consider requiring all new school construction and school renovations to incor-porate green building features and/or meet LEED standards.
Policy 2: Establish cooperative agreements between AACPS, AACC, the County and the private sector to provide greater vocational education opportunities.
Action:
� Identify areas with increasing demand for trade and/or industry-specific voca-tional education, and develop programs through partnerships
2009GeneralDevelopentPlan
Page 90
Chapter 6 Quality Public Services
The Department of Recreation and Parks oversees the acquisition, development, and management of the County’s park system, which includes over 260 parks, sports com-plexes, special use areas, and other sites (Figure 6-2). Major facilities include two indoor swim/aquatic centers, two public golf courses, a baseball stadium, two softball complexes, and three indoor recreation centers. In addition to the above County recreational sites, there are over 18,600 acres of State and Federal land in the County that serve as either recreation or resource land. The vast majority of this is resource land such as the Patapsco Valley State Park, Franklin Point Park, and the Patuxent Natural Resource Management Area, all State-owned, and the Federally-owned Patuxent Research Refuge. A complete inventory of all County, State, and Federal park lands and facilities in the County can be found in the 2006 Land Preservation, Parks and Recreation Plan (LPPRP).
The detailed framework for recreation and parks planning is established through the LPPRP, which includes an inventory of the County’s recreation sites, facilities, and resource lands ,and an assessment of supply and demand based on current and projected population. The most recent assessment was conducted in 2006 and found primary rec-reational deficits in indoor basketball courts, multipurpose fields for team sports, trails, water access for boating and other water based recreation. Secondary deficits existed in baseball/softball diamonds, picnic pavilions, indoor swimming pools, dog parks, fishing from piers, and ice skating. In addition, the need for a West County Regional Park was identified. This need has recently been met through a long term lease of the U.S. Naval Academy Dairy Farm property as well as additional land acquisition..
Goal: Provide a diverse range of accessible recreational facilities and pro-grams to serve the needs of all County residents.
Policy 1: Public facilities should be utilized across multiple agencies to provide increased recreational opportunities.
Actions:
� Formulate additional joint use schedules at school sites to enhance the commu-nity’s use of public facilities, especially where there are current deficiencies in recreational space.
� Formalize an agreement between the Department of Recreation and Parks and the Department of Aging and Disabilities to utilize Senior Centers for community recreation purposes when space is available.
Policy 2: Improve and expand recreational opportunities so that all communities have sufficient access to facilities and programs.
Recreation and Parks Facilities
2009GeneralDevelopentPlan
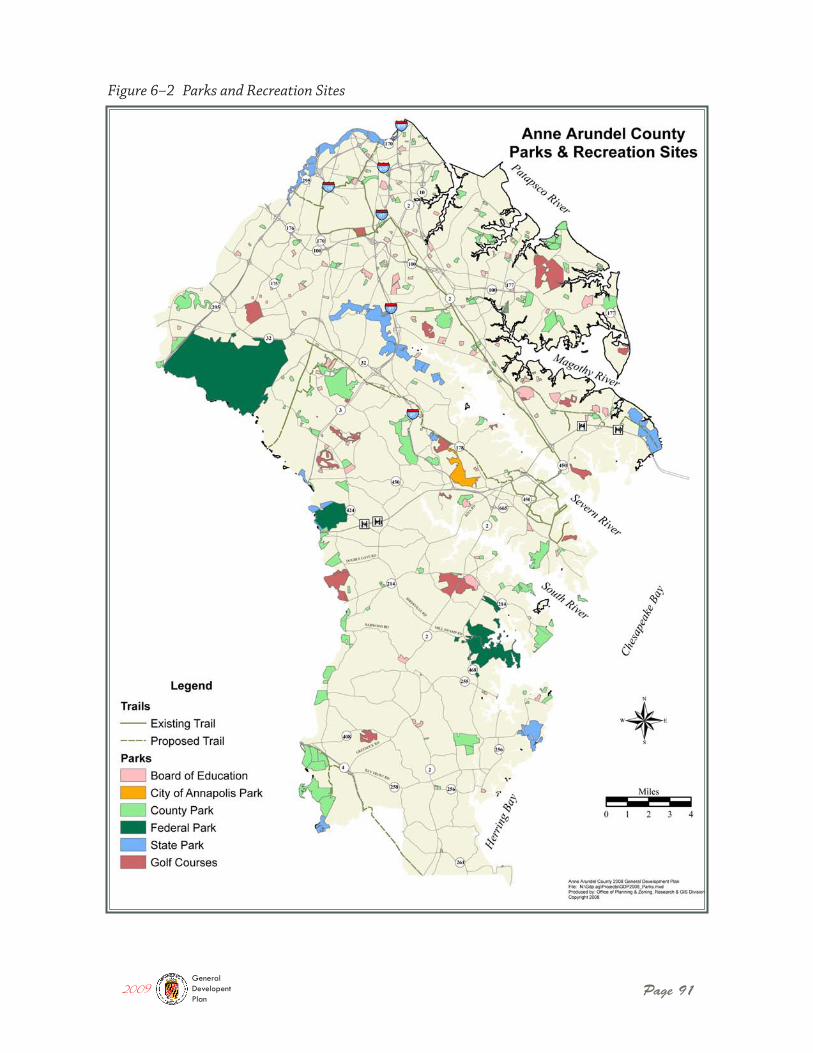
Page 91
Figure 6–2 Parks and Recreation Sites
2009GeneralDevelopentPlan
Page 92
Chapter 6 Quality Public Services
Headquartered in Annapolis, the library system is a quasi-independent agency governed by a 24-member Board of Trustees who serve on a volunteer basis. Today, the library system has three regional libraries and 12 branch libraries, which are geographically dis-persed throughout the County to serve as many local communities as possible (Figure 6-3). These facilities provide a wide range of services and programs that serve a diverse population.
The three regional libraries serving the County are the Annapolis Area Library, the North County Area Library, and the West County Area Library. The oldest, the Annapolis Area Library, was established in 1965 and underwent major renovations in 1989. The North County Area Library, located in Glen Burnie, opened in 1969. The library system’s new-est addition is the West County Area Library. Located in the Odenton Town Center, this regional library opened in 2004 and replaced the former Odenton Branch Library. With 40,000 SF of space, it is the largest of the County’s library facilities. By locating the new facility in the Town Center, the County hopes to ensure maximum utilization of the resource for years to come.
The Anne Arundel County Public Library (AACPL) and its Board of Trustees maintain and periodically update a Facilities Master Plan to guide the provision of library services
Actions:
� Promote connectivity to existing and/or planned recreational spaces through the subdivision and site development process.
� Assess current and future needs for local community centers. Include an evalua-tion of needs identified in the Small Area Plans, as well as other areas that may be underserved with regard to multipurpose community space.
� Acquire approximately 850 additional acres of land for active recreation projects, targeting the land acquisition recommendations in the 2006 Land Preservation, Parks and Recreation Plan.
� Upgrade existing parks and develop new parks in accordance with the Land Preservation, Parks, and Recreation Plan and with new initiatives identified in the Department of Recreation and Parks Capital Improvement Program. Continue to use Program Open Space and other State and Federal programs and grants as available to implement these projects.
� Prepare a master plan for use of the Naval Academy Dairy Farm property in Gam-brills to serve as a passive use regional park for the West County area.
� Complete an inventory of sites in the County that provide public waterfront access, make it available on the internet, and identify future sites as needed to increase public access.
Library Services
2009GeneralDevelopentPlan
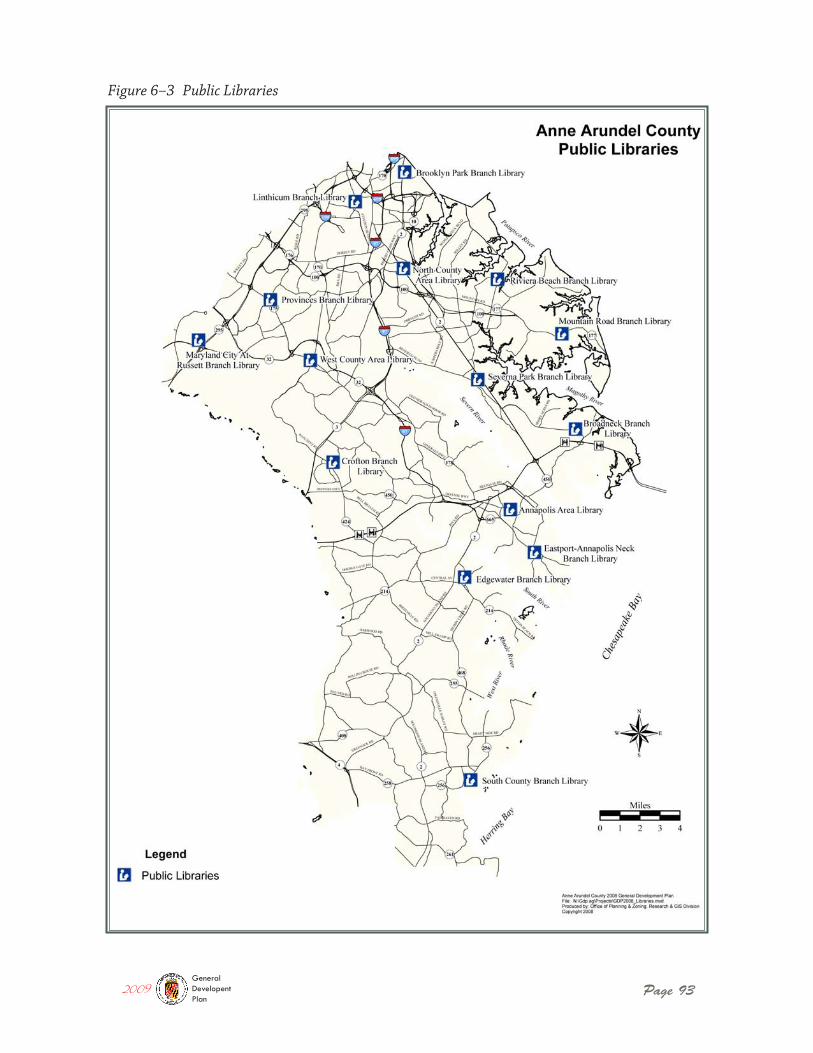
Page 93
Figure 6–3 Public Libraries
2009GeneralDevelopentPlan
Page 94
Chapter 6 Quality Public Services
in the County. The Facilities Plan includes a needs analysis which projects space needs, analyzes hours of service and other service factors, and identifies repair and renovation projects needed at the various branches in the system. Projects are then prioritized by need and funding is requested through the County’s capital budget process each year.
The most recent Facilities Plan Update was completed in 2004. The assessment of space needs concluded that the Annapolis Area Library and the North County Area Library are currently inadequate in size to meet the needs of their existing service populations. The Facilities Plan provided several options for updating the Annapolis and North County Area Libraries. The 2004 Facilities Plan also included a performance comparison between the AACPL library branches and other “peer library” systems. Performance indicators analyzed included facility space per capita, staffing, circulation of materials, customer visits, hours of service, and revenues and expenditures. Results from the peer library comparison indicated several items for consideration by the AACPL during its planning review process. These recommendations include reviewing hours of operations; reducing personnel costs; and reviewing the approach for allocating operating funds for materials. Each of these recommendations was meant as a way to make the AACPL more efficient in its operations.
Goal: Provide a library system that continues to evolve to meet the chang-ing public information needs.
Policy 1: Library space should be planned and used based on the needs and/or demands of specific communities or user populations.
Actions:
� Complete expansions of the North County and Annapolis Area Libraries to meet current and projected needs.
� Increase the efficiency of library services by reviewing operations including hours of service and allocation of funds for materials.
Public health services are another important component in the wide array of community services provided to residents of Anne Arundel County. Public health includes both com-munity and environmental health, and the promotion of public health is accomplished through nearly 30 individual programs and services provided by the County, primarily through the County Department of Health and its partner agencies.
Public health services are provided at eight health centers located throughout the County as shown in Figure 6-4. At these facilities and other locations, the County Health Depart-ment provides a wide variety of health services to County citizens. The services generally
Health Care Services
2009GeneralDevelopentPlan
Quality Public Services
Page 95
Chapter 6
fall under the five broad categories of behavioral health, clinic and school health, com-munity health, environmental health, and health information and promotion.
The public health programs offered by the County rely on State and local funds as well as grants to cover their operating costs. Approximately 42% of the Health Department’s current fiscal year budget comes from grants. The majority of these are State grants, some of which use Federal dollars. Since a variety of factors can affect the availability of State and Federal grants on an annual basis, funding for various County health programs is periodically at risk. As a result, the Health Department has at times been forced to reduce or eliminate valuable services due to lack of funding, including some grants to community agencies for prevention programming. Therefore, in order to allocate funding most effi-ciently, the Health Department has established five major priorities: eliminating health disparities, being prepared for emergencies, preventing and managing chronic illness, keeping children healthy, and maintaining a safe and healthy environment.
In terms of health facilities planning, the long term planning goals are to locate these facilities in areas that are convenient for those with greatest demand. Supplementing public health facilities by way of encouraging the development of private health care facilities is vital to sustaining quality care for all citizens in need. In addition, the Health Department maintains a multitude of studies and consulting documentation that enables the accurate assessment of community health conditions.
Goal: Provide quality health care opportunities convenient to all County residents.
Policy 1: Locate public health facilities and services in areas convenient to those with greatest demand.
Action:
� Allocate funds to expand environmental health and school health programs as needed.
Policy 2: Supplement public health facilities by encouraging development of private health care facilities.
Action:
� Expand public health programs serving low income residents.
Policy 3: Increase community awareness of health and wellness issues.
2009GeneralDevelopentPlan
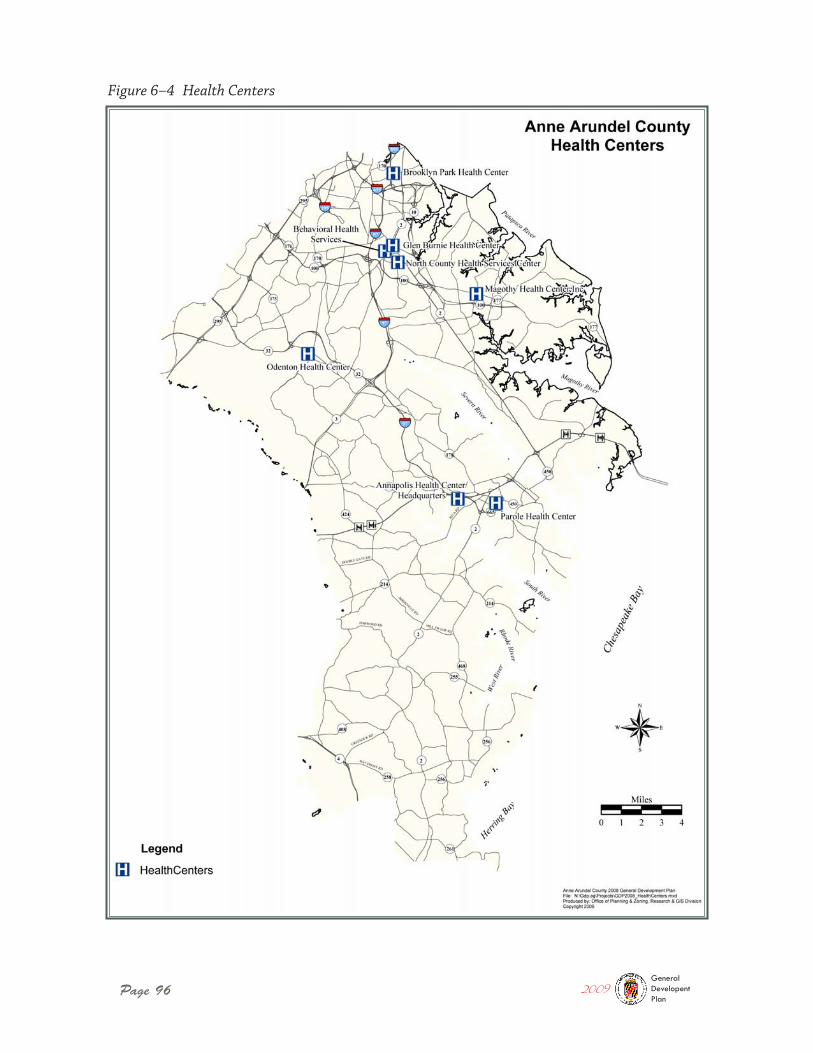
Page 96
Figure 6–4 Health Centers
2009GeneralDevelopentPlan
Quality Public Services
Page 97
Chapter 6
The County Department of Aging and Disabilities administers over 20 individual pro-grams and operates seven senior centers throughout the County, as shown in Figure 6-5. These programs and facilities offer many services and activities for County residents 55 years of age and older and are well used by local area residents. All seven are multi-purpose centers focused on serving active seniors 55 years of age and older.
The Department of Aging and Disabilities also operates specialized paratransit services to meet the mobility demands of its client population. This service is provided using 39 small, cut-away type buses or vans. The department’s bus fleet is one of the largest for this type of agency in the State and serves approximately 160,000 one-way trips annually. Additionally, the Department has an emergency management team that works hand in hand with the Office of Emergency Management by providing transportation and shelter for emergency situations. This is the first such partnership in the State. Under a planned shift of responsibilities, the department will be assuming the role of operating the overall transit services (fixed and paratransit) for the County in the future. The current Transit Development Plan identifies 16 new routes to be added to the transit system. Expansion of routes is generally based upon availability of Federal and State funds and local match-ing funds.
In addition to the above services, the Department also operates a nutrition program through which it provides nutrition services at 20 locations throughout the County, including the seven senior activity centers, several senior housing facilities managed by the County Housing Authority, some community centers, and some freestanding sites. The nutrition service is a federally funded program that is operated by the County.
While Anne Arundel County provides services to seniors through its public facilities including senior centers and health centers, privately owned facilities provide a valuable addition to this much-needed component of the community infrastructure. Assisted living facilities are one way to provide seniors with a more cost-effective option to meet-ing their daily living needs. The County has over 80 assisted living facilities licensed by the State of Maryland. In addition, there are nearly 25 privately owned nursing homes in the County. Privately run apartment and housing complexes are another option for seniors. According to the Department of Aging’s current senior housing inventory, there are approximately 10 retirement apartment communities, 15 apartment communities with senior discounts, 3 retirement communities and 6 continuing care retirement com-munities located in the County. The County will work with private developers to continue to provide housing that meets the needs of senior citizens, as well as meet the increasing demand for assisted living and nursing facilities.
Action:
� Partner with Anne Arundel Medical Center and Baltimore Washington Medical Center to present programs on health and wellness issues.
Senior Citizens Services
2009GeneralDevelopentPlan
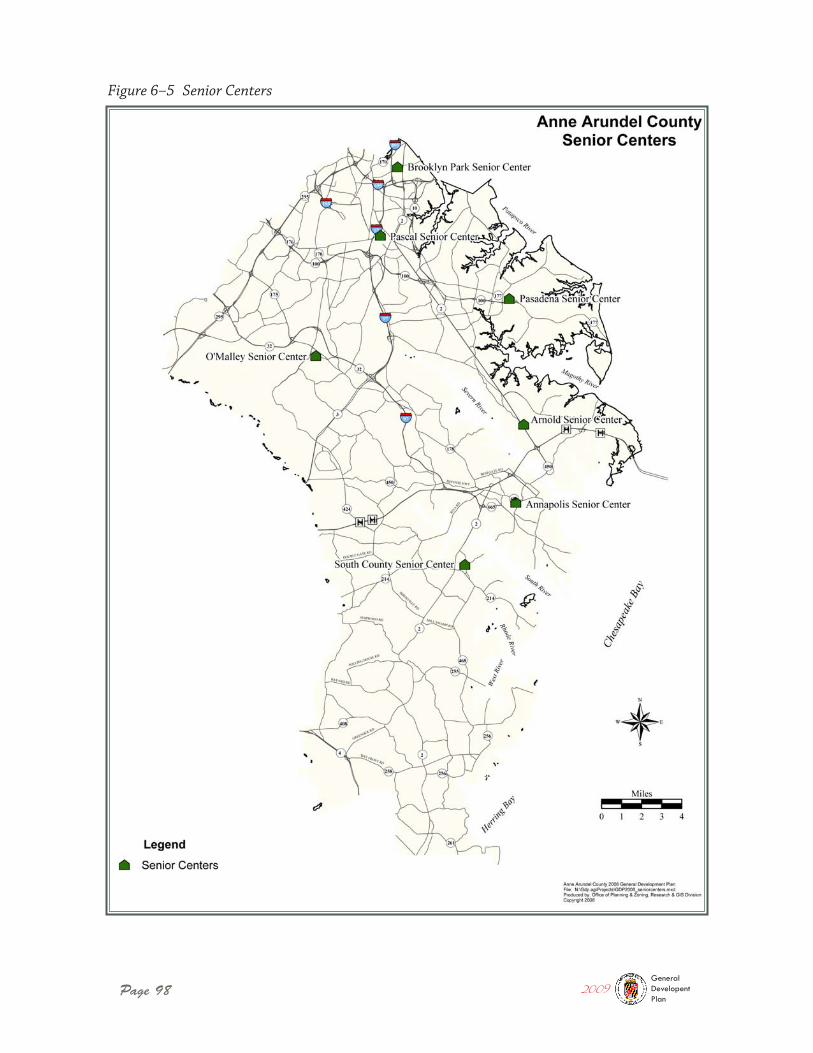
Page 98
Figure 6–5 Senior Centers
2009GeneralDevelopentPlan
Quality Public Services
Page 99
Chapter 6
Goal: Provide services and opportunities for senior citizens and persons with disabilities to lead healthy, independent, and fulfilling lifestyles.
Policy 1: Locate senior housing options near health, EMS, transportation, and retail services.
Actions:
� Identify sites with development or redevelopment potential for senior housing that are located near needed amenities.
� Work with private developers to provide a range of housing options for senior citizens including assisted living facilities, retirement communities, affordable independent living communities, and continuing care communities.
� Address additional space needs at the Brooklyn Park Senior Center.
� Complete planned expansion of the Pasadena Senior Center.
Policy 2: Provide for the needs of persons with disabilities in housing, transporta-tion, and public services planning.
Actions:
� Ensure that new development and redevelopment conforms to current ADA and FHA Fair Housing regulations.
� Provide public transit services that accommodate the needs of persons with disabilities.
� Promote affordable accessible housing units for persons with disabilities.
� Provide administrative relief through the regulatory process for unique issues related to accommodating accessibility to structures and pedestrian systems for seniors and persons with disabilities.
Public safety services are some of the most important services a local jurisdiction pro-vides to its citizens. Fire protection, emergency response, and police protection are services that all local residents rely on, and citizens place a high value in knowing that these services will be adequate and timely when needed. The County therefore considers the provision of a high level of public safety services to be a priority.
The provision of these services is also an important component of the comprehensive planning process, as land use and development decisions will have a direct impact on the demand for these services as well as the County’s ability to provide them.
Public Safety Services
2009GeneralDevelopentPlan
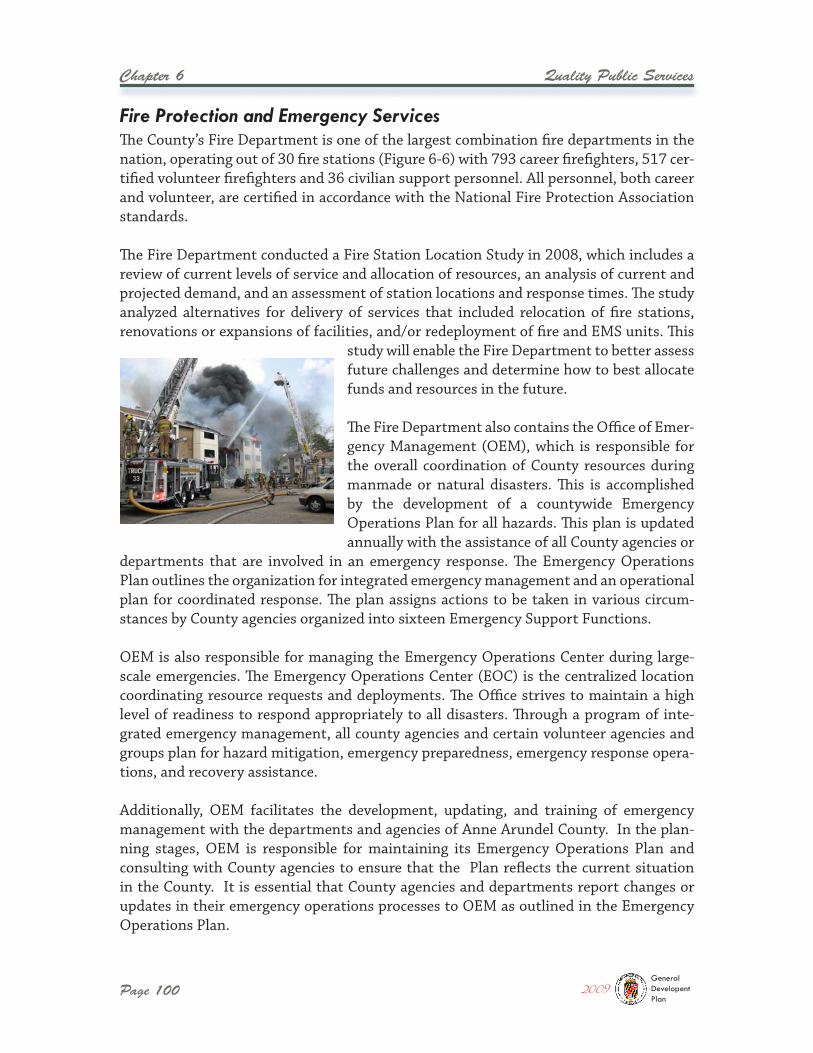
Page 100
Chapter 6 Quality Public Services
The County’s Fire Department is one of the largest combination fire departments in the nation, operating out of 30 fire stations (Figure 6-6) with 793 career firefighters, 517 cer-tified volunteer firefighters and 36 civilian support personnel. All personnel, both career and volunteer, are certified in accordance with the National Fire Protection Association standards.
The Fire Department conducted a Fire Station Location Study in 2008, which includes a review of current levels of service and allocation of resources, an analysis of current and projected demand, and an assessment of station locations and response times. The study analyzed alternatives for delivery of services that included relocation of fire stations, renovations or expansions of facilities, and/or redeployment of fire and EMS units. This
study will enable the Fire Department to better assess future challenges and determine how to best allocate funds and resources in the future.
The Fire Department also contains the Office of Emer-gency Management (OEM), which is responsible for the overall coordination of County resources during manmade or natural disasters. This is accomplished by the development of a countywide Emergency Operations Plan for all hazards. This plan is updated annually with the assistance of all County agencies or
departments that are involved in an emergency response. The Emergency Operations Plan outlines the organization for integrated emergency management and an operational plan for coordinated response. The plan assigns actions to be taken in various circum-stances by County agencies organized into sixteen Emergency Support Functions.
OEM is also responsible for managing the Emergency Operations Center during large-scale emergencies. The Emergency Operations Center (EOC) is the centralized location coordinating resource requests and deployments. The Office strives to maintain a high level of readiness to respond appropriately to all disasters. Through a program of inte-grated emergency management, all county agencies and certain volunteer agencies and groups plan for hazard mitigation, emergency preparedness, emergency response opera-tions, and recovery assistance.
Additionally, OEM facilitates the development, updating, and training of emergency management with the departments and agencies of Anne Arundel County. In the plan-ning stages, OEM is responsible for maintaining its Emergency Operations Plan and consulting with County agencies to ensure that the Plan reflects the current situation in the County. It is essential that County agencies and departments report changes or updates in their emergency operations processes to OEM as outlined in the Emergency Operations Plan.
Fire Protection and Emergency Services
2009GeneralDevelopentPlan
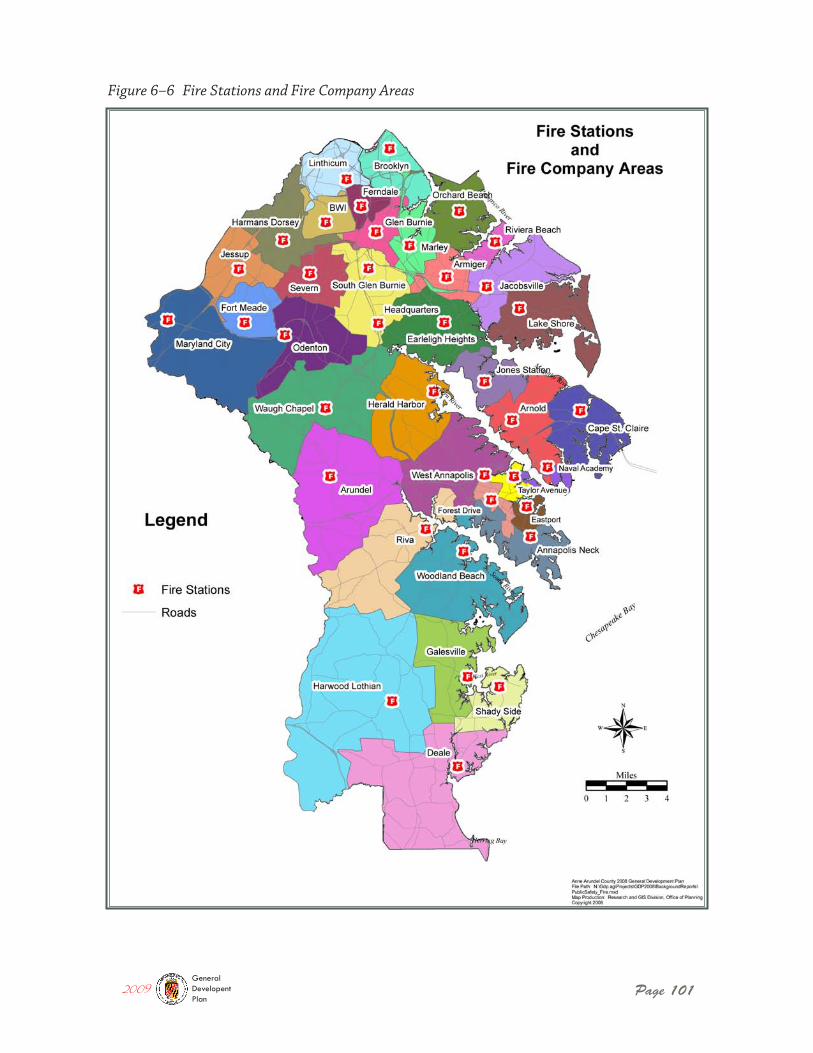
Page 101
Figure 6–6 Fire Stations and Fire Company Areas
2009GeneralDevelopentPlan
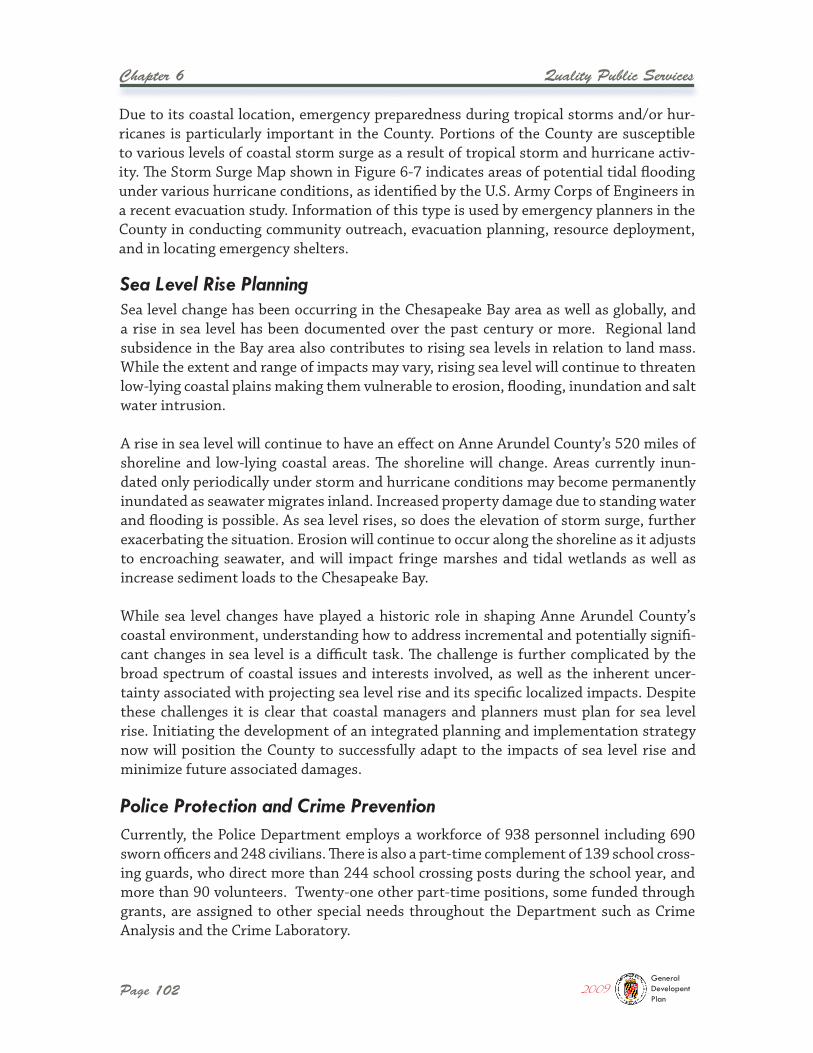
Page 102
Chapter 6 Quality Public Services
Due to its coastal location, emergency preparedness during tropical storms and/or hur-ricanes is particularly important in the County. Portions of the County are susceptible to various levels of coastal storm surge as a result of tropical storm and hurricane activ-ity. The Storm Surge Map shown in Figure 6-7 indicates areas of potential tidal flooding under various hurricane conditions, as identified by the U.S. Army Corps of Engineers in a recent evacuation study. Information of this type is used by emergency planners in the County in conducting community outreach, evacuation planning, resource deployment, and in locating emergency shelters.
Sea level change has been occurring in the Chesapeake Bay area as well as globally, and a rise in sea level has been documented over the past century or more. Regional land subsidence in the Bay area also contributes to rising sea levels in relation to land mass. While the extent and range of impacts may vary, rising sea level will continue to threaten low-lying coastal plains making them vulnerable to erosion, flooding, inundation and salt water intrusion.
A rise in sea level will continue to have an effect on Anne Arundel County’s 520 miles of shoreline and low-lying coastal areas. The shoreline will change. Areas currently inun-dated only periodically under storm and hurricane conditions may become permanently inundated as seawater migrates inland. Increased property damage due to standing water and flooding is possible. As sea level rises, so does the elevation of storm surge, further exacerbating the situation. Erosion will continue to occur along the shoreline as it adjusts to encroaching seawater, and will impact fringe marshes and tidal wetlands as well as increase sediment loads to the Chesapeake Bay.
While sea level changes have played a historic role in shaping Anne Arundel County’s coastal environment, understanding how to address incremental and potentially signifi-cant changes in sea level is a difficult task. The challenge is further complicated by the broad spectrum of coastal issues and interests involved, as well as the inherent uncer-tainty associated with projecting sea level rise and its specific localized impacts. Despite these challenges it is clear that coastal managers and planners must plan for sea level rise. Initiating the development of an integrated planning and implementation strategy now will position the County to successfully adapt to the impacts of sea level rise and minimize future associated damages.
Currently, the Police Department employs a workforce of 938 personnel including 690 sworn officers and 248 civilians. There is also a part-time complement of 139 school cross-ing guards, who direct more than 244 school crossing posts during the school year, and more than 90 volunteers. Twenty-one other part-time positions, some funded through grants, are assigned to other special needs throughout the Department such as Crime Analysis and the Crime Laboratory.
Sea Level Rise Planning
Police Protection and Crime Prevention
2009GeneralDevelopentPlan
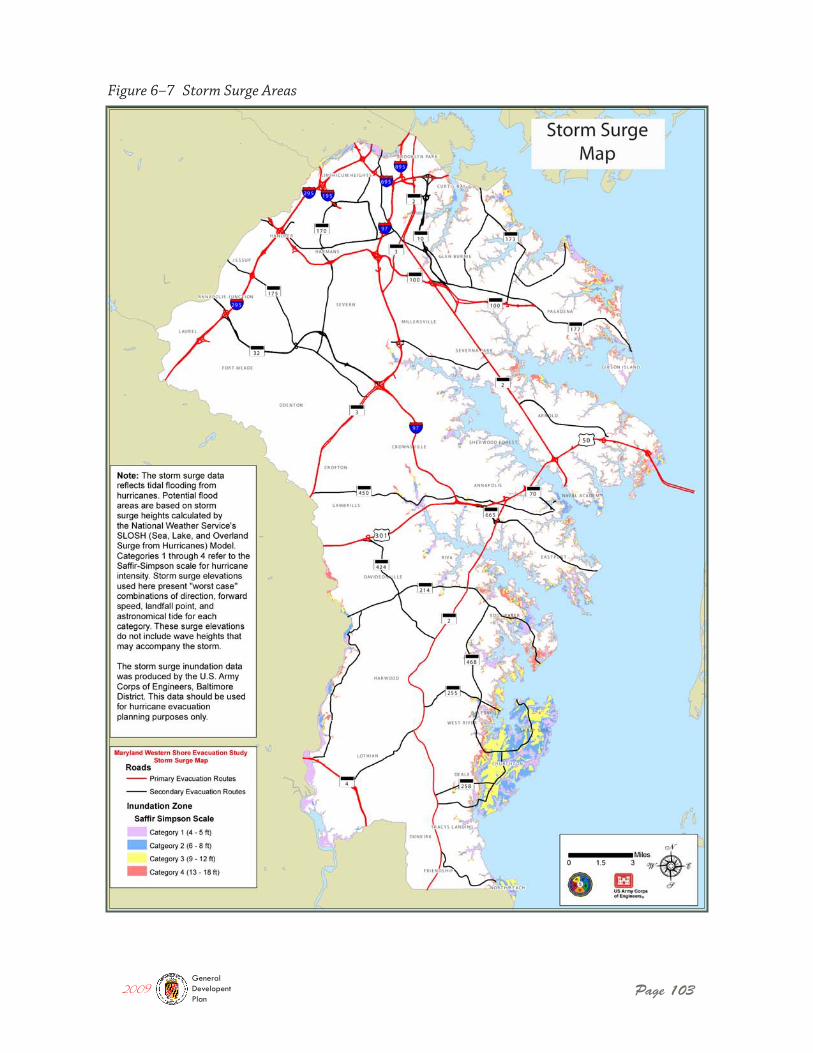
Page 103
Figure 6–7 Storm Surge Areas
2009GeneralDevelopentPlan
Page 104
Chapter 6 Quality Public Services
The County has four police district stations that are strategically located to provide the greatest access to serve the area (Figure 6-8). These district stations provide administra-tive support to patrol beats within the district and are used to process and hold arrested persons. They are also often used by the communities for public meetings. The Police Department’s facilities are located to serve its community-oriented policing philosophy as well. Facilities are decentralized in order to provide the most accessible service and response to the citizens of the County.
The Police Department anticipates the need to establish at least three additional police beats in the future in order to accommodate the increase in calls for service that is anticipated along with new population growth. The Department also foresees the need to establish a fifth (central) police district in the future in order to manage increases in service demand.
In addition, there are several facility improvements that will likely be needed. The Criminal Investigations Division is currently housed at the Crownsville Hos-pital site, and several deficiencies have been identified that indicate a likely need for a new facility. Also, a new Training Academy facility will be needed in the future since the current facility is out-dated and does not meet current needs of the Department. Lastly, an expansion of the Crime Lab located at Police Headquarters is needed.
The County Department of Detention Facilities operates two detention centers and pro-vides public safety services through the detention and confinement of pre-trial detainees and adjudicated offenders in safe and secure institutions, and by offering alternatives to incarceration as well as services to prepare inmates for re-entry to society. The Depart-ment’s primary functions are organized under two bureaus. The Bureau of Security and Support Services provides security operations, maintenance, supplies, and other support services to the County’s detention facilities. The Bureau of Inmate Services provides clas-sification and records services, intake and pretrial investigations, supervised release, and volunteer and program services.
Detention facilities have also been impacted by future growth both in terms of additional facility space needs as well as support services and case managers. Both the Ordnance Road facility and the Jennifer Road facility are in need of expansions in the near term.
Anne Arundel County’s relatively low crime rate and the Police Department’s commit-ment to continual assessment and planning have served to maintain a safe environment for County residents. However, growth experienced in the greater Baltimore-Washington area and in the County over the past decade has created significant challenges for the Department. The County will continue to monitor future growth patterns in order to help assess future demand for all of the public safety services it provides.
2009GeneralDevelopentPlan
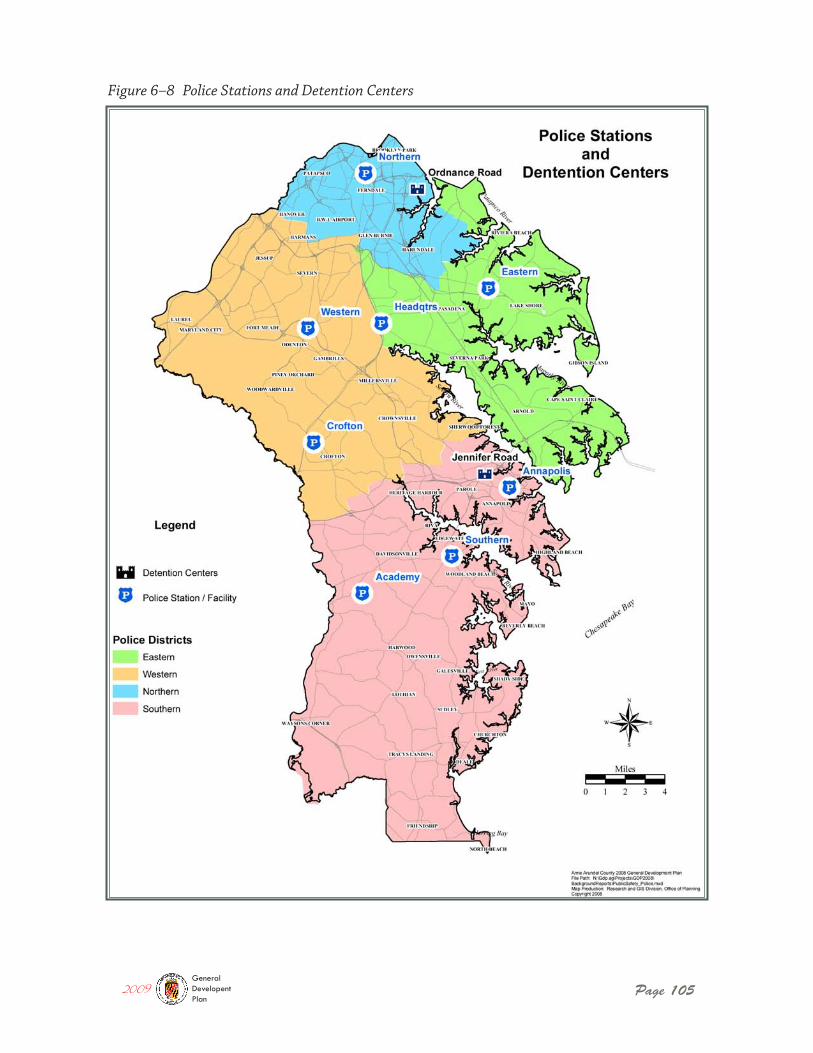
Page 105
Figure 6–8 Police Stations and Detention Centers
2009GeneralDevelopentPlan
Page 106
Chapter 6 Quality Public Services
Goal: Provide a high level of police protection, fire protection, emergency response, and disaster relief services to all citizens.
Policy 1: Continue to develop innovative and proactive enforcement programs to improve upon current programs and operations and to enhance the effectiveness of public safety services.
Action:
� With projected growth in the County equating to over 15,000 additional calls for service, make necessary plans to establish at least 3 additional police posts, or patrol beats.
Policy 2: Remain dynamic in the education and training of public safety department personnel to skillfully and efficiently prevent, react, and respond to emergencies or man-made or natural disasters.
Action:
� Recruit and retain highly qualified professionals for public safety positions, and hire more civilian employees for certain jobs to free up uniformed personnel for reassignment.
� Continue to promote integrated emergency management among all County agencies through the Emergency Operations Plan, and ensure that all agencies coordinate their infrastructure and facility planning programs with OEM so that emergency management needs and practices are addressed.
� Promote education and training of local citizens to serve as volunteers during emergencies and disaster relief efforts.
Policy 3: Consolidate services where feasible in order to increase efficiency and address budget limitations.
Actions:
� Make plans as needed to establish a fifth police district in the County which is projected to be needed within the next 10 years, and identify a future site for a fifth District Station.
� Identify a future site for a new Criminal Investigation Division police facility, which is currently housed in a deficient building on the Crownsville Hospital site.
� Identify a future site for a new Police Training Academy facility to meet the Police Department’s need for a more state-of-the-art facility.
� Complete capital projects to replace the Marley Fire Station and expand the Jes-sup Fire Station.
2009GeneralDevelopentPlan
Quality Public Services
Page 107
Chapter 6
� Allocate funds as needed to implement the recommendations of the Fire Station Location Study completed in 2008.
� Plan and fund needed expansions at the Ordnance Road and Jennifer Road Deten-tion Centers.
Goal: Protect manmade and natural resources in coastal areas vulnerable to rising sea level.
Policy 1: Account for potential effects of future sea level rise in making land use and planning decisions relative to planned development, provision of public infrastruc-ture, emergency preparedness, and environmental protection.
Actions:
� Partner with the MD Department of Natural Resources to develop an integrated planning strategy that addresses potential threats in areas vulnerable to sea level rise impacts.
� Develop a strategic plan for a phased implementation response to achieve either avoidance or reduction of impacts to property, infrastructure, cultural and natural resources.
� Establish policies to guide the relocation, extension or expansion of public infra-structure in at-risk areas.
Anne Arundel County provides public water, sewer, and solid waste collection services to its residents. Planning for these public utility services is closely coordinated with compre-hensive planning efforts. The County’s General Development Plan determines the type and density of land uses in the County and directs growth and development to appropriate areas. The provision of public utilities is then planned in accordance with the General Development Plan. The goals, policies and actions of the GDP will guide County planners in determining where extensions of public utilities will be needed in the future, where capacity expansions will be required, and where deficiencies are likely to occur so that preventive steps can be taken.
The County currently has over 111,000 public sewer connections and treats approximately 34.1 million gallons per day of wastewater. There are approximately 107,700 public water connections that have an annual average day demand of 31.1 millions gallons per day. Public water and sewer service in the County is provided through use of an enterprise fund. To adequately address specifics of the extent, adequacy, sizing, staging, and other characteristics of the public water and sewer facilities, the County prepares a Water and
Water and Sewer Facilities
Public Water, Sewer and Solid Waste Services
2009GeneralDevelopentPlan
Page 108
Chapter 6 Quality Public Services
Municipal solid waste (MSW) is generated by County residents, businesses, industries, and institutions. Waste types include residential, commercial, industrial, construction and demolition debris, controlled hazardous substances, dead animals, bulky or special wastes, vehicle tire, wastewater treatment plant biosolids, and septage. Wastes gener-ated by over 150,000 households are collected by the County through the use of private contractors. All other household solid waste is self-hauled to the County’s landfill and convenience centers. The majority of commercial and industrial solid waste is transported to non-County facilities. The County is divided into fifteen collection service areas (Figure 6-9) for curbside collections. The service provided includes twice per week trash collec-tion, once per week recyclables collection, and once per week yard waste collections. The County operates three convenience centers (Millersville, Glen Burnie and Sudley) and the
Sewer Master Plan that is updated every three years to ensure a sufficient supply of water will be collected, treated and delivered to the points of use where it is programmed for service, and that wastewater will be collected from and extended to areas programmed for growth and delivered to points best suited for waste treatment and disposal or reuse. The most recent update to the Water and Sewer Master Plan was completed in 2007. In addition, Chapter 10 in this GDP provides a comprehensive analysis of capacity needs and impacts to the water and wastewater supply systems as well as mitigation plans to secure a safe and adequate system.
Goal: Provide and maintain a safe and adequate capacity for wastewater treatment services and water supply to meet current and future needs.
Policy 1: Encourage water conservation and protection of the County’s groundwater resources.
Actions:
� Continue to participate in regional planning efforts to monitor and protect groundwater resources that serve the County.
� Continue assessment of water quality problem areas.
� Improve educational efforts for water conservation.
Policy 2: Ensure adequate capacity at the County’s Water Reclamation Facilities.
Action:
� Continue to evaluate alternatives at Water Reclamation Facilities that will redi-rect existing and future flows to service areas where facility sites can best support future upgrades and meet capacity demands and permit requirements.
Solid Waste Facilities
2009GeneralDevelopentPlan
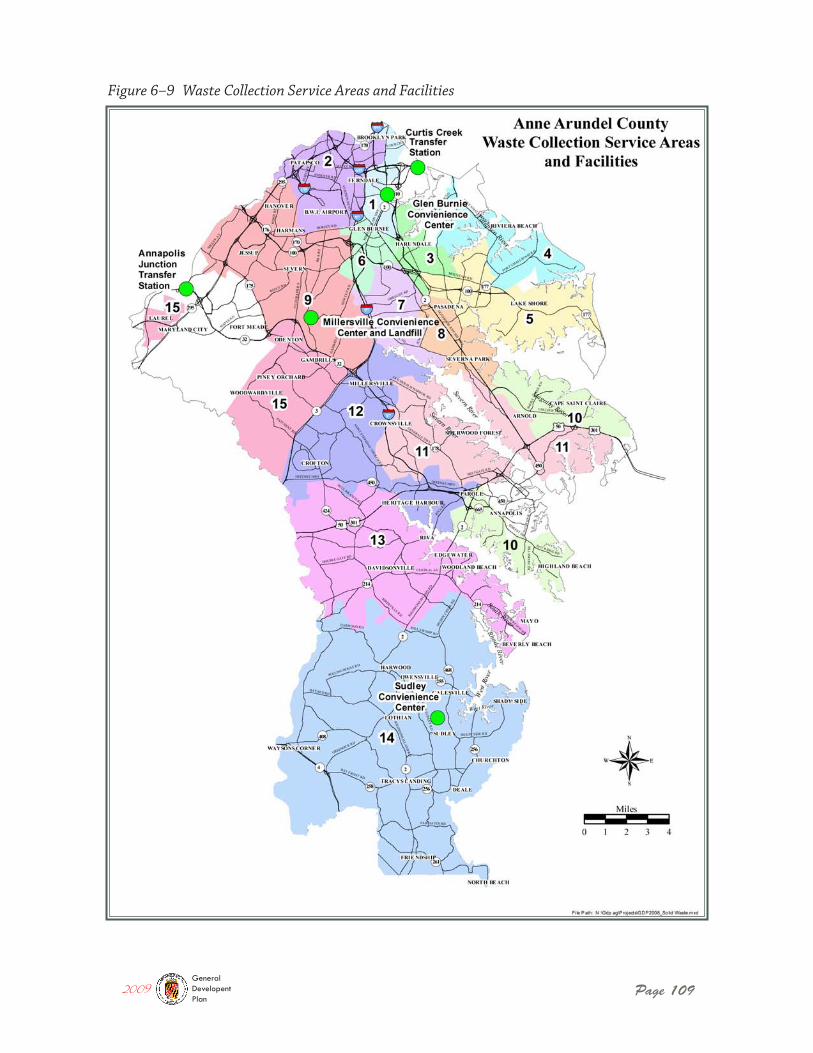
Page 109
Figure 6–9 Waste Collection Service Areas and Facilities
2009GeneralDevelopentPlan
Page 110
Chapter 6 Quality Public Services
Millersville Landfill Resource Recovery Facility (MLFRRF) for disposal and recycling. Com-munity cleanup events and household hazardous waste collection events are scheduled throughout the year. Other privately owned and operated facilities include the Annapolis Junction Transfer Station and the Curtis Creek Transfer Station that service the pri-vate sector. Rubble waste that is not recycled is disposed at facilities outside of the County with the exception of a small amount that is disposed at the MLFRRF.
The County has prepared a comprehensive solid waste management plan which covers at least a 10-year planning horizon and is updated at a three-year interval if necessary. The Plan provides a frame-work for implementing future solid waste disposal needs through an integrated system of reduction, reuse, recycling, resource recovery, and disposal. To meet the plan’s objectives, Anne Arundel County developed a new Recycling Outreach Initiative in 2008 that focuses on increasing the residential recycling rate from 31% to 50 %, decreasing waste genera-tion, and reducing the loading rate at the County’s only sanitary landfill. The County has implemented a comprehensive marketing campaign to inform the public of expanded recycling services, has established a recycling website to promote recycling and waste minimization, and has made several enhancements to the recycling service provided to citizens. In addition, the 4R’s Project provides an optional recycling curriculum for teach-ers in the public school system, and Recycling Specialists regularly conduct numerous educational events in elementary, middle and high schools. The 2003 Solid Waste Plan has identified that the establishment of recyclables recovery facilities or waste process-ing facilities in the County would conserve landfill space, increase recovery of recyclable materials, increase recycling rates, be cost-beneficial to the County and lessen the depen-dence on the Millersville facility. There continues to be concern regarding the availability of sufficient outlets for the processing and recycling of grass and leaves generated by County residents.
Goal: Efficiently manage, reduce, and recycle solid waste.
Policy 1: Optimize recycling programs, systems, and outreach with a clear priority toward recycling over land disposal.
Action:
� Develop and implement a multi-faceted approach to education and promotion of recycling within the County to convey the importance as it relates to the preserva-tion of natural resources and the County’s landfill.
Policy 2: Capitalize on options to maximize the life expectancy of the Millersville Landfill and delay replacement long into the future.
Anne Arundel County developed a new
Recycling Outreach Initiative in 2008 with
a goal of increasing the residential recycling rate
to 50%.
2009GeneralDevelopentPlan
Quality Public Services
Page 111
Chapter 6
Action:
� Increased recycling translates to conservation of landfill capacity and extended landfill life. To that end, continue to promote and expand recovery of recyclables at the landfill and convenience centers to the maximum extent practicable.
� Maximize existing landfill capacity through efficient operation (maximize com-paction and minimize cover material usage).
� For future undeveloped disposal areas, evaluate new engineering technologies and operational techniques that could lead to expanded capacity and site life.
� In addition, explore opportunities to address solid waste disposal and recycling needs on a regional basis thereby realizing the benefit of the economies of scale and reducing net costs.
Policy 3: Recycle at least 50% of the residential solid waste collected at households within the County.
Action:
� Continue to implement a County wide marketing campaign challenging all resi-dents to recycle 50% of their waste. The campaign needs to demonstrate how easy it is to recycle and to provide assistance and information on how to achieve the 50% goal in the shortest amount of time possible. Evaluate the service delivery system on a regular basis to ensure that recycling is more convenient and a higher priority than disposal.
Policy 4: Former landfill sites and adjacent properties should not be redeveloped with incompatible land uses. Residential uses and other land uses relying on well water should not be located on or near former landfill sites without appropriate clearance from governmental agencies.
Actions:
� Conduct a study of former landfill sites to confirm their current status and assess their current and future suitability for development and to identify suitable land uses. Develop a Closed Landfills Map that identifies these sites.
� When development or permit applications are submitted for properties located on or adjacent to former landfills, as identified on the Closed Landfills Map, it should be noted as such in development review comments and on plans accom-panying permit applications, and must also be sent to Maryland Department of the Environment, the Health Department, and the Department of Public Works Waste Management Services for review and comment.
2009GeneralDevelopentPlan
Page 112
Chapter 6 Quality Public Services
Policy 5: Prohibit new solid waste landfills in locations near residential areas that rely on water supply wells and near environmentally sensitive areas.
Action:
� Evaluate the County’s long-term landfill needs to assess the impacts of restrict-ing future landfill locations. If feasible, revise the County’s Zoning Ordinance to remove rubble and land-clearing debris landfills as an allowable use in the RA zoning district.
2009GeneralDevelopentPlan

Chapter 7:The Land Use Plan

The Land Use Plan
Page 115
Chapter 7
Decisions and policies regarding land use are one of the most important components of a local comprehensive plan. The location, amount, and type of development to be permit-ted will impact everything from public services and infrastructure to water resources and sensitive areas, from community character to fiscal stability, and ultimately the quality of life for local citizens.
Recognizing the importance of land use planning, the State of Maryland delegated basic planning and land use regulatory powers to its municipalities and non-charter counties in Article 66B of the Code of Maryland, and granted planning and zoning powers to its charter counties including Anne Arundel County in Article 25A. Several but not all of the provisions in Article 66B apply to charter counties; nevertheless, Anne Arundel County has prepared its comprehensive plan in consistency with the provisions of that Article and with the State Planning Act of 1992 that guides comprehensive planning in Maryland.
Among the provisions contained in Article 66B, the Code states that a comprehensive plan shall contain a “Land Use Plan element, which: 1) shall propose the most appropriate and desirable patterns for the general location, character, extent, and interrelationship of the uses of public and private land, on a schedule that extends as far into the future as is reasonable, and 2) may include public and private, residential, commercial, industrial, agricultural, and recreational land uses.”
The General Development Plan addresses these requirements with the inclusion of a Land Use Plan as well as related policies and recommendations to guide growth and develop-ment. The following sections describe the Land Use Plan and how it is used and also present some proposed changes to the 2004 Land Use Plan. Additionally, a 3-tiered hier-archy of development policy areas is established with policies to guide future land use and development in each.
The Land Use Plan is used to guide development patterns in the County in accordance with the policies established in the General Development Plan. The Land Use Plan is a map that uses a range of land use categories (e.g. commercial, low density residential, etc.) to describe the different types of land uses and to identify, on a broad scale, where those uses are most appropriate.
Table 7-1 lists the land use categories that are used on the County’s Land Use Plan. It describes the types of uses typically found in each of the Land Use Plan categories and also lists the zoning districts that are generally applied in each land use category.
Purpose and Description of the Land Use Plan
2009GeneralDevelopentPlan
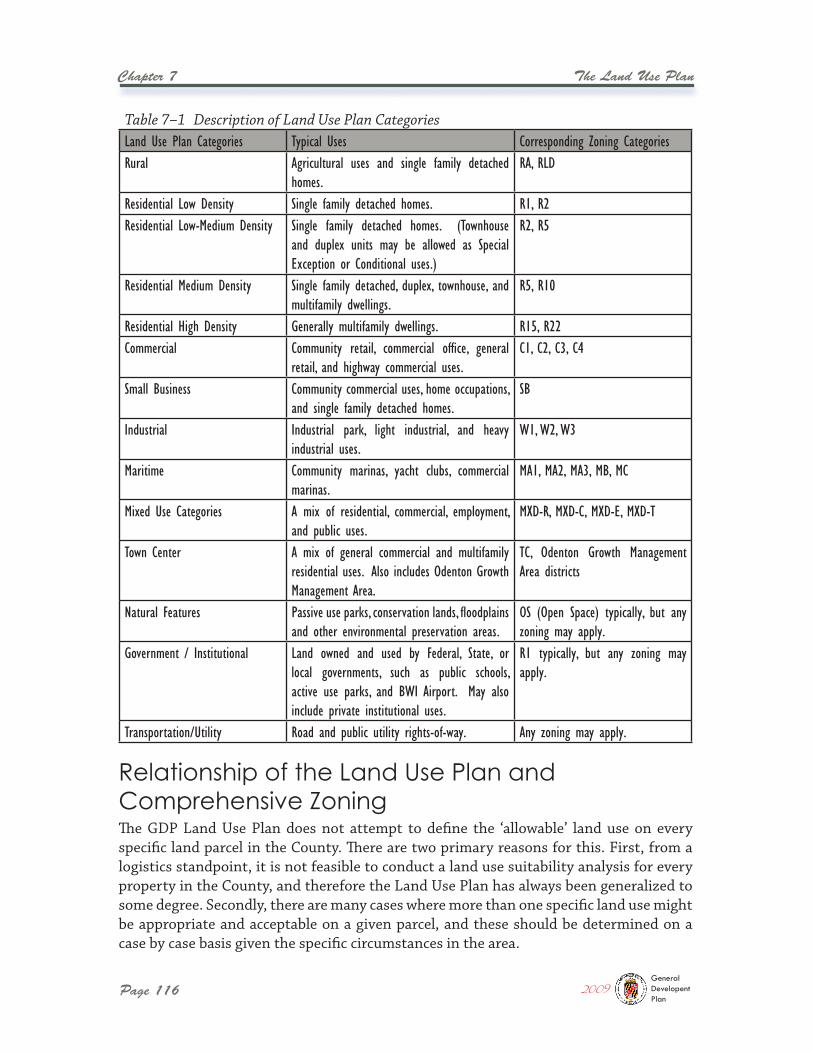
Page 116
Chapter 7 The Land Use Plan
The GDP Land Use Plan does not attempt to define the ‘allowable’ land use on every specific land parcel in the County. There are two primary reasons for this. First, from a logistics standpoint, it is not feasible to conduct a land use suitability analysis for every property in the County, and therefore the Land Use Plan has always been generalized to some degree. Secondly, there are many cases where more than one specific land use might be appropriate and acceptable on a given parcel, and these should be determined on a case by case basis given the specific circumstances in the area.
Table 7–1 Description of Land Use Plan CategoriesLand Use Plan Categories Typical Uses Corresponding Zoning CategoriesRural Agricultural uses and single family detached
homes.RA, RLD
Residential Low Density Single family detached homes. R1, R2Residential Low-Medium Density Single family detached homes. (Townhouse
and duplex units may be allowed as Special Exception or Conditional uses.)
R2, R5
Residential Medium Density Single family detached, duplex, townhouse, and multifamily dwellings.
R5, R10
Residential High Density Generally multifamily dwellings. R15, R22Commercial Community retail, commercial office, general
retail, and highway commercial uses.C1, C2, C3, C4
Small Business Community commercial uses, home occupations, and single family detached homes.
SB
Industrial Industrial park, light industrial, and heavy industrial uses.
W1, W2, W3
Maritime Community marinas, yacht clubs, commercial marinas.
MA1, MA2, MA3, MB, MC
Mixed Use Categories A mix of residential, commercial, employment, and public uses.
MXD-R, MXD-C, MXD-E, MXD-T
Town Center A mix of general commercial and multifamily residential uses. Also includes Odenton Growth Management Area.
TC, Odenton Growth Management Area districts
Natural Features Passive use parks, conservation lands, floodplains and other environmental preservation areas.
OS (Open Space) typically, but any zoning may apply.
Government / Institutional Land owned and used by Federal, State, or local governments, such as public schools, active use parks, and BWI Airport. May also include private institutional uses.
R1 typically, but any zoning may apply.
Transportation/Utility Road and public utility rights-of-way. Any zoning may apply.
Relationship of the Land Use Plan and Comprehensive Zoning
2009GeneralDevelopentPlan
The Land Use Plan
Page 117
Chapter 7
Therefore, while the Land Use Plan is used as a guide when the County prepares compre-hensive zoning legislation, the County does not mandate that all comprehensive zoning changes must be determined by the Land Use Plan map or must specifically ‘match’ the Land Use Plan category. Based on past experience, the majority of comprehensive zoning changes have matched the Land Use Plan. However, the comprehensive zoning process is not done concurrently with the GDP update, but is conducted after adoption of the GDP as needed to implement the Plan recommendations. In addition, the County typically allows individual property owners to apply for a zoning change during the comprehensive zoning process. For these reasons, there have been cases where a requested change in zoning was found to be consistent with the goals and objectives of the comprehensive plan, and was therefore supported, even though it did not match the Land Use Plan on a parcel-specific basis. To address this issue, the County may periodically amend the GDP Land Use Plan to reflect any such changes and to maintain consistency between the Land Use Plan and adopted zoning as needed.
A comprehensive plan such as the GDP is by nature a broad policy document that covers a wide range of subjects and their associated goals, objectives and policies. With this in mind, the following criteria are established with regard to comprehensive zoning and will be used in evaluating individual zoning applications submitted during a comprehensive zoning process. In addition, a comprehensive zoning change may be proposed where it will correct a mistake made on the County’s official zoning maps.
Policy: Comprehensive zoning changes must demonstrate the following criteria:
1) The change in zoning will further one or more of the established goals and policies in the adopted GDP or Small Area Plan;
2) The change in zoning will not be contrary to an established goal or policy in the adopted GDP or Small Area Plan;
3) The change in zoning will allow a land use that is compatible with the surrounding land uses, so as to promote the health, safety and welfare of present and future residents.
Of course, comprehensive zoning is not the only mechanism used to implement the Gen-eral Development Plan. As discussed in some earlier chapters, the County uses a range of tools in conjunction with the GDP policies and Land Use Plan to guide development. These include sector plans, functional plans, revitalization programs, agricultural preser-vation programs, overlay zones, economic development strategic plans, and development regulations.
As discussed in Chapter 2, sixteen individual Land Use Plans were adopted as part of the County’s Small Area Plan program between 2000 and 2004. These plans were then
The 2009 Land Use Plan
2009GeneralDevelopentPlan
Page 118
Chapter 7 The Land Use Plan
combined to form the 2004 Land Use Plan which represents collectively the 16 individual land use plans. The 2004 Plan was then used as the starting point for this GDP update. Therefore, the new Land Use Plan adopted in this GDP will supersede all previously adopted Land Use Plans.
The overall land use pattern did not change significantly between the 1997 and 2004 Land Use Plans. Instead, changes were mostly site-specific and focused on targeted areas such as mixed use sites. Other changes were made to better reflect development types and densities that are currently in place and are encouraged to remain over the long term.
The 2009 Land Use Plan is shown in Figure 7-1. Once again, the overall pattern of land use has not changed significantly. This will likely be the case for future GDP updates as well, since development patterns are well established in most parts of the County. Higher density residential uses and most of the County’s industrial and commercial land base are still concentrated in the northern parts of the County and in Odenton, Severn, Maryland City, Crofton, and Parole. The rural land base still covers much of the Crownsville area and virtually all of South County with the exception of the Deale, Churchton, Shady Side, and Galesville communities. Low to medium density residential uses are spread throughout but are most predominant on the peninsulas (Lake Shore, Broadneck, Annapolis Neck, Edgewater and Mayo) and in Severna Park, Pasadena, Severn and Jessup.
The 2009 Land Use Plan incorporates some changes from the previous 2004 Plan. These can be grouped into two general categories. The first category is referred to as “consis-tency changes”. Consistency changes were made in areas where the Land Use Plan did not accurately reflect development types and densities that are existing and are planned to remain over the long term. Consistency changes were also made in some areas where the zoning currently in place and planned to remain over the long term was not consistent with the land use category.
An additional consistency change was made in relation to public park properties. Addi-tional work has been completed since 2004 in updating the County’s database of public park properties, which had been previously indicated on the Land Use Plan in a range of categories. These properties are now designated in one of two categories. Public park properties that are primarily active-use parks, including recreation centers and ballfields, are designated as Government / Institutional properties. Public park properties that are primarily passive-use parks, or that were acquired for preservation purposes, are des-ignated as Natural Features properties. This will facilitate use of the Land Use Plan in future planning efforts.
The second category of Land Use Plan changes are site-specific and represent sites or areas where a new type of development is being encouraged. These are described in the following section.
2009GeneralDevelopentPlan
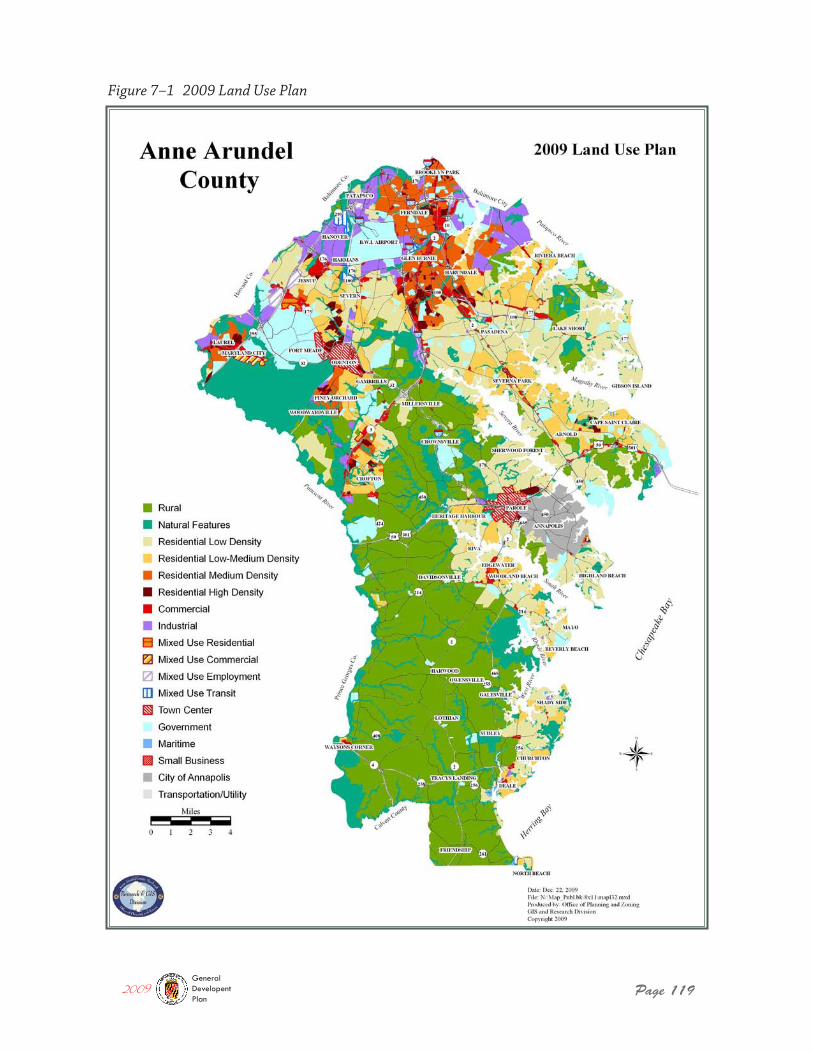
Page 119
Figure 7–1 2009 Land Use Plan
2009GeneralDevelopentPlan
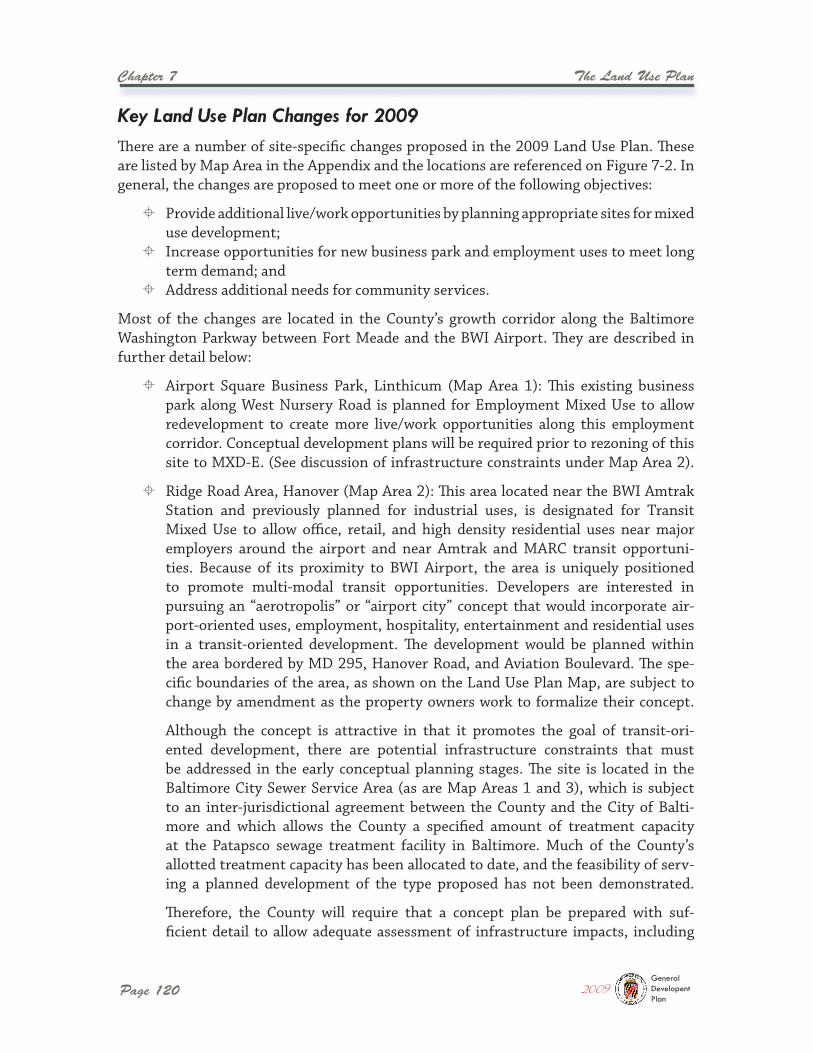
Page 120
Chapter 7 The Land Use Plan
There are a number of site-specific changes proposed in the 2009 Land Use Plan. These are listed by Map Area in the Appendix and the locations are referenced on Figure 7-2. In general, the changes are proposed to meet one or more of the following objectives:
� Provide additional live/work opportunities by planning appropriate sites for mixed use development;
� Increase opportunities for new business park and employment uses to meet long term demand; and
� Address additional needs for community services.
Most of the changes are located in the County’s growth corridor along the Baltimore Washington Parkway between Fort Meade and the BWI Airport. They are described in further detail below:
� Airport Square Business Park, Linthicum (Map Area 1): This existing business park along West Nursery Road is planned for Employment Mixed Use to allow redevelopment to create more live/work opportunities along this employment corridor. Conceptual development plans will be required prior to rezoning of this site to MXD-E. (See discussion of infrastructure constraints under Map Area 2).
� Ridge Road Area, Hanover (Map Area 2): This area located near the BWI Amtrak Station and previously planned for industrial uses, is designated for Transit Mixed Use to allow office, retail, and high density residential uses near major employers around the airport and near Amtrak and MARC transit opportuni-ties. Because of its proximity to BWI Airport, the area is uniquely positioned to promote multi-modal transit opportunities. Developers are interested in pursuing an “aerotropolis” or “airport city” concept that would incorporate air-port-oriented uses, employment, hospitality, entertainment and residential uses in a transit-oriented development. The development would be planned within the area bordered by MD 295, Hanover Road, and Aviation Boulevard. The spe-cific boundaries of the area, as shown on the Land Use Plan Map, are subject to change by amendment as the property owners work to formalize their concept.
Although the concept is attractive in that it promotes the goal of transit-ori-ented development, there are potential infrastructure constraints that must be addressed in the early conceptual planning stages. The site is located in the Baltimore City Sewer Service Area (as are Map Areas 1 and 3), which is subject to an inter-jurisdictional agreement between the County and the City of Balti-more and which allows the County a specified amount of treatment capacity at the Patapsco sewage treatment facility in Baltimore. Much of the County’s allotted treatment capacity has been allocated to date, and the feasibility of serv-ing a planned development of the type proposed has not been demonstrated.
Therefore, the County will require that a concept plan be prepared with suf-ficient detail to allow adequate assessment of infrastructure impacts, including
Key Land Use Plan Changes for 2009
2009GeneralDevelopentPlan
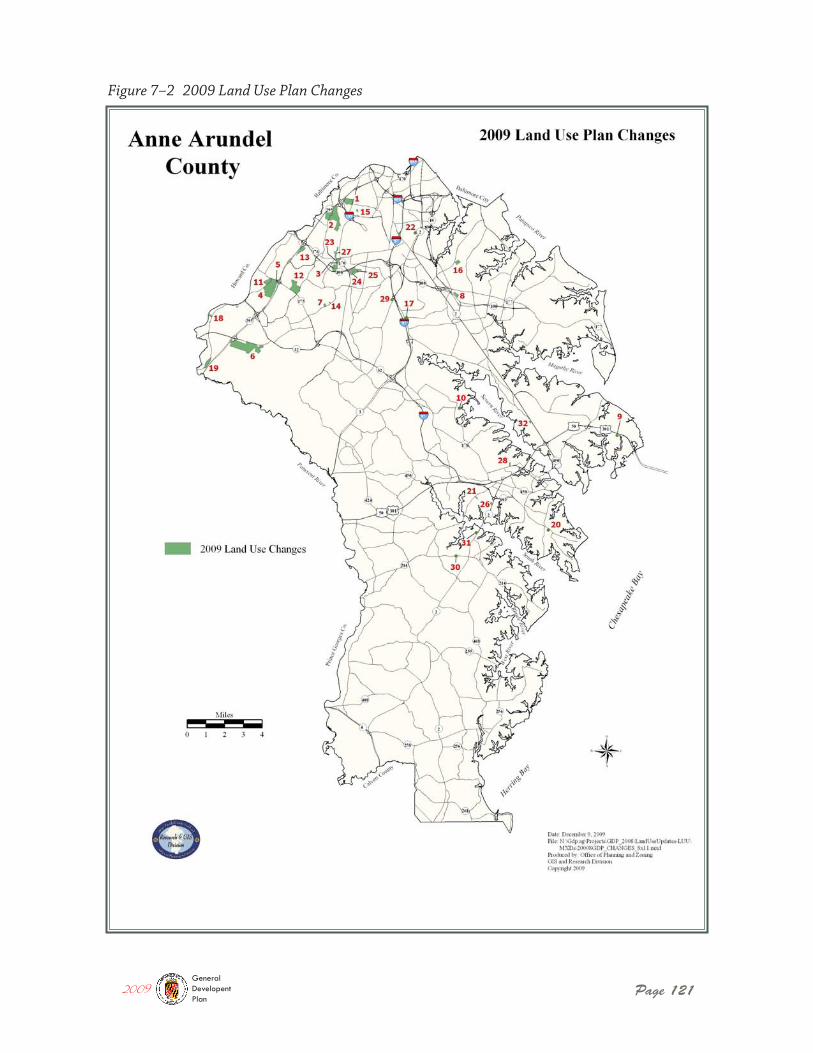
Page 121
Figure 7–2 2009 Land Use Plan Changes
2009GeneralDevelopentPlan
Page 122
Chapter 7 The Land Use Plan
wastewater treatment, roads, and public safety services, prior to rezoning any properties within this area to MXD-T during either a comprehensive zoning or an administrative zoning process. Additionally, the County will require preservation of the Stoney Run and Piney Run tributaries, stream buffers, and any associ-ated sensitive areas. Both tributaries are partially unprotected segments of the County’s proposed Greenways network, and such protection is encouraged in the Greenways Master Plan.
� MARC Rail Line at MD 100 (Map Area 3): This industrial site is under study by the Maryland Transit Authority for future location of a MARC station along the Penn Line. It is proposed for Transit Mixed Use to promote future densities that would support a transit station and offer transit-oriented development opportunities. Conceptual development plans will be required prior to rezoning of properties in this site to MXD-T. (See discussion of infrastructure constraints under Map Area 2).
� Clarks 100 site, Jessup (Map Area 4 & 5): This site is located at MD 175 and the BW Parkway and was previously planned for Residential Mixed Use. The Land Use Plan proposes Employment Mixed Use which will allow for a larger percentage of office employment use on the site in keep-ing with current plans for expansion of National Business Park.
� Arundel Gateway site, Maryland City (Map Area 6): This site, located at MD 198 and the BW Parkway and previously planned for industrial use, is proposed for Commercial Mixed Use to promote live-work opportunities near two major employment centers – Fort Meade and National Business Park. Rather than primarily industrial uses, development plans would include office, retail and residential uses. Preservation of all sensitive areas on the site will be required and retention of open space will be encouraged to the maximum extent pos-sible in order to minimize impacts to the adjacent Patuxent Research Refuge.
� Van Bokkelen Elementary School site (Map Area 7): A portion of this Board of Education property is planned for the future location of a community and health center. Arundel Community Development Services Inc. has been working with a non-profit organization to facilitate development of the center. The Land Use Plan indicates a Low Residential category which will support a future rezoning from OS to a Residential zoning district that will permit the community center.
These changes to the Land Use Plan are also listed with parcel information in the Appen-dix. Collectively, these changes represent a relatively small amount of acreage but will nevertheless provide additional live/work and employment opportunities as well as meet additional objectives stated.
In order to better focus growth in areas which utilize existing and planned infrastruc-ture, and preserve existing neighborhoods and the environment, this Plan defines three
Development Policy Areas
2009GeneralDevelopentPlan
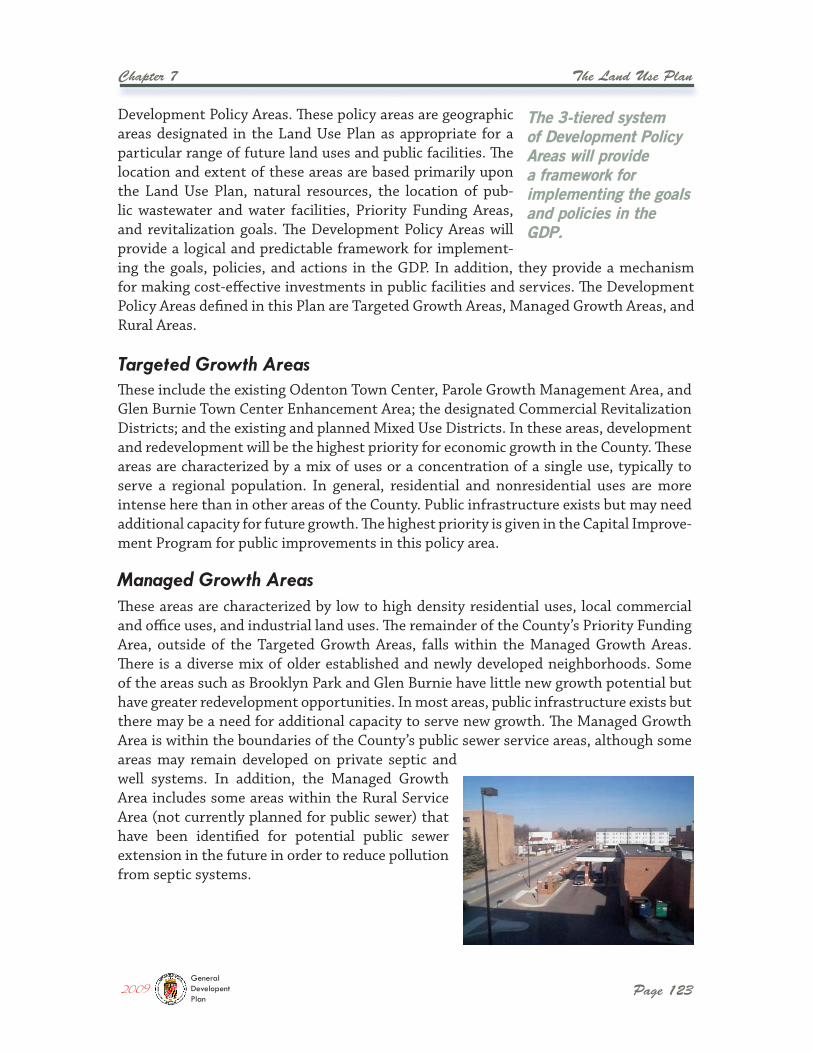
The Land Use Plan
Page 123
Chapter 7
These areas are characterized by low to high density residential uses, local commercial and office uses, and industrial land uses. The remainder of the County’s Priority Funding Area, outside of the Targeted Growth Areas, falls within the Managed Growth Areas. There is a diverse mix of older established and newly developed neighborhoods. Some of the areas such as Brooklyn Park and Glen Burnie have little new growth potential but have greater redevelopment opportunities. In most areas, public infrastructure exists but there may be a need for additional capacity to serve new growth. The Managed Growth Area is within the boundaries of the County’s public sewer service areas, although some areas may remain developed on private septic and well systems. In addition, the Managed Growth Area includes some areas within the Rural Service Area (not currently planned for public sewer) that have been identified for potential public sewer extension in the future in order to reduce pollution from septic systems.
Development Policy Areas. These policy areas are geographic areas designated in the Land Use Plan as appropriate for a particular range of future land uses and public facilities. The location and extent of these areas are based primarily upon the Land Use Plan, natural resources, the location of pub-lic wastewater and water facilities, Priority Funding Areas, and revitalization goals. The Development Policy Areas will provide a logical and predictable framework for implement-ing the goals, policies, and actions in the GDP. In addition, they provide a mechanism for making cost-effective investments in public facilities and services. The Development Policy Areas defined in this Plan are Targeted Growth Areas, Managed Growth Areas, and Rural Areas.
These include the existing Odenton Town Center, Parole Growth Management Area, and Glen Burnie Town Center Enhancement Area; the designated Commercial Revitalization Districts; and the existing and planned Mixed Use Districts. In these areas, development and redevelopment will be the highest priority for economic growth in the County. These areas are characterized by a mix of uses or a concentration of a single use, typically to serve a regional population. In general, residential and nonresidential uses are more intense here than in other areas of the County. Public infrastructure exists but may need additional capacity for future growth. The highest priority is given in the Capital Improve-ment Program for public improvements in this policy area.
The 3-tiered system of Development Policy Areas will provide a framework for implementing the goals and policies in the GDP.
Managed Growth Areas
Targeted Growth Areas
2009GeneralDevelopentPlan
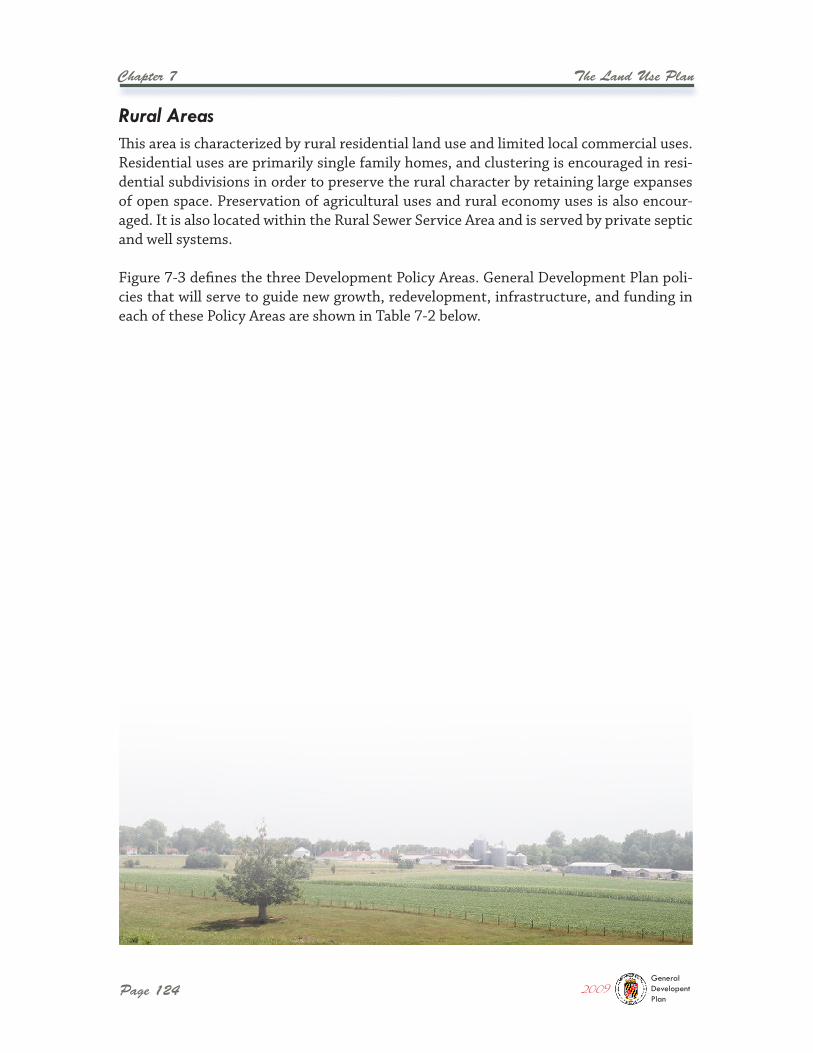
Page 124
Chapter 7 The Land Use Plan
This area is characterized by rural residential land use and limited local commercial uses. Residential uses are primarily single family homes, and clustering is encouraged in resi-dential subdivisions in order to preserve the rural character by retaining large expanses of open space. Preservation of agricultural uses and rural economy uses is also encour-aged. It is also located within the Rural Sewer Service Area and is served by private septic and well systems.
Figure 7-3 defines the three Development Policy Areas. General Development Plan poli-cies that will serve to guide new growth, redevelopment, infrastructure, and funding in each of these Policy Areas are shown in Table 7-2 below.
Rural Areas
2009GeneralDevelopentPlan
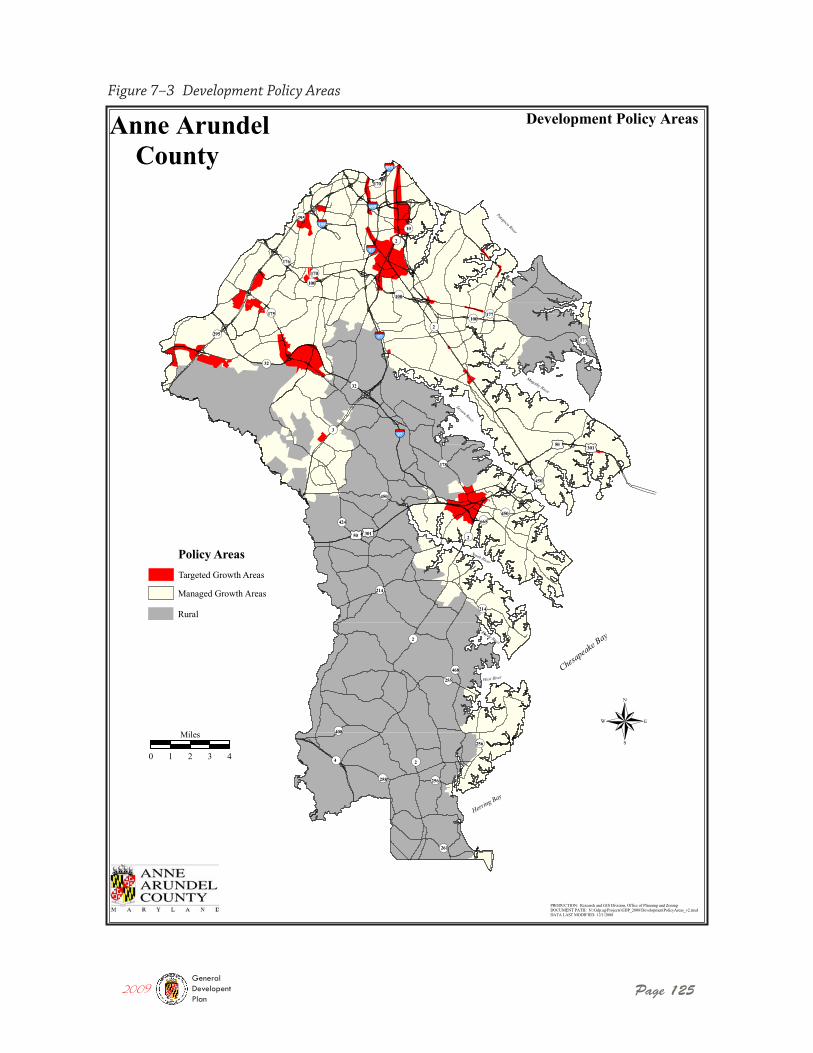
Page 125
Figure 7–3 Development Policy Areas
2009GeneralDevelopentPlan
!( !(
!(
!(!(
!(
!(
£¤ £¤
!(
!(
!(
!(
!(
!( !(
!(
!(
!(
§̈¦
§̈¦
!(
!(
!(
!(
£¤£¤
§̈¦
§̈¦
§̈¦
§̈¦!(
!(!(
!(
!(
!(
!(
!(
!(
!(
!(
!(
!(
!(
!(
895
695
195295
170
170
100
100177
295
214
100
97
176
32
97177
32
175
450
97
178
450665
450
214
468
258
408
256
256
50301
50 301
2
2
3
2
2
10
2
4
424
255
261
®
Anne Arundel County
Development Policy Areas
PRODUCTION: Research and GIS Division, Office of Planning and ZoningDOCUMENT PATH: N:\Gdp.ag\Projects\GDP_2008\DevelopmentPolicyAreas_v2.mxdDATA LAST MODIFIED: 12/1/2008
Patapsco River
Magothy River
Severn River
South River
Rhode River
West River
Herring Bay
Chesapeake
Bay
0 1 2 3 4
Miles
Policy AreasTargeted Growth Areas
Rural
Managed Growth Areas
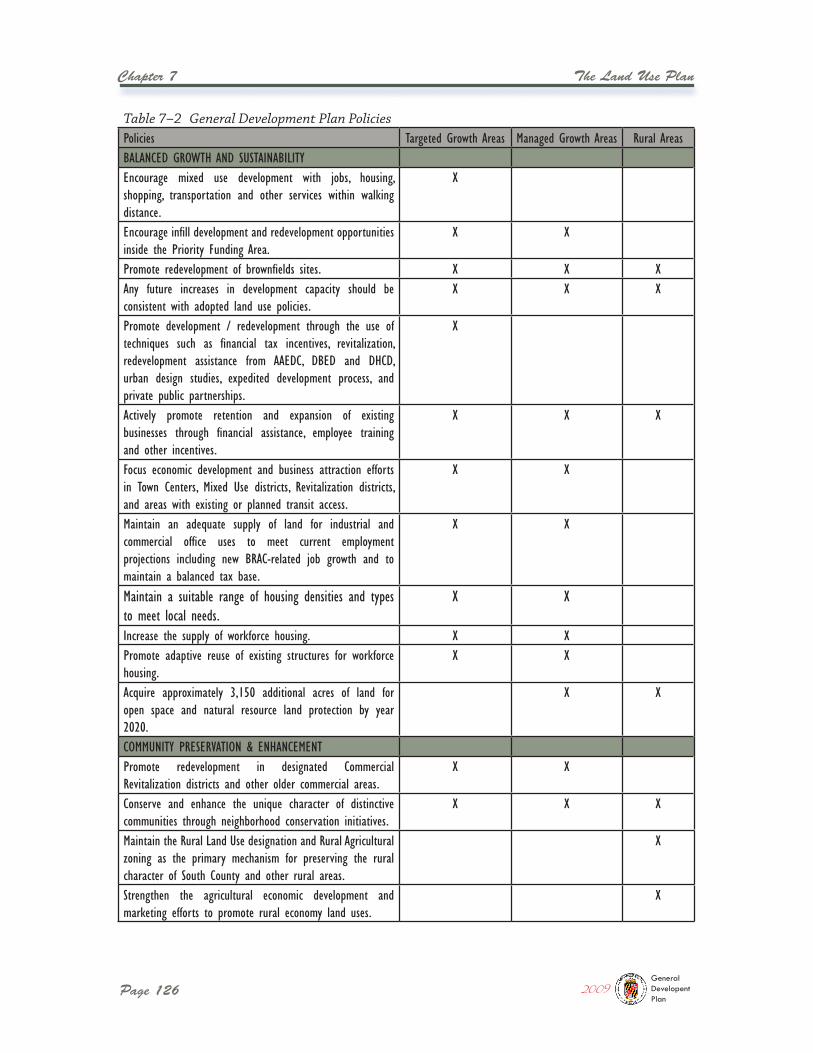
Page 126
Chapter 7 The Land Use Plan
Table 7–2 General Development Plan PoliciesPolicies Targeted Growth Areas Managed Growth Areas Rural AreasBALANCED GROWTH AND SUSTAINABILITYEncourage mixed use development with jobs, housing, shopping, transportation and other services within walking distance.
X
Encourage infill development and redevelopment opportunities inside the Priority Funding Area.
X X
Promote redevelopment of brownfields sites. X X XAny future increases in development capacity should be consistent with adopted land use policies.
X X X
Promote development / redevelopment through the use of techniques such as financial tax incentives, revitalization, redevelopment assistance from AAEDC, DBED and DHCD, urban design studies, expedited development process, and private public partnerships.
X
Actively promote retention and expansion of existing businesses through financial assistance, employee training and other incentives.
X X X
Focus economic development and business attraction efforts in Town Centers, Mixed Use districts, Revitalization districts, and areas with existing or planned transit access.
X X
Maintain an adequate supply of land for industrial and commercial office uses to meet current employment projections including new BRAC-related job growth and to maintain a balanced tax base.
X X
Maintain a suitable range of housing densities and types to meet local needs.
X X
Increase the supply of workforce housing. X XPromote adaptive reuse of existing structures for workforce housing.
X X
Acquire approximately 3,150 additional acres of land for open space and natural resource land protection by year 2020.
X X
COMMUNITY PRESERVATION & ENHANCEMENTPromote redevelopment in designated Commercial Revitalization districts and other older commercial areas.
X X
Conserve and enhance the unique character of distinctive communities through neighborhood conservation initiatives.
X X X
Maintain the Rural Land Use designation and Rural Agricultural zoning as the primary mechanism for preserving the rural character of South County and other rural areas.
X
Strengthen the agricultural economic development and marketing efforts to promote rural economy land uses.
X
2009GeneralDevelopentPlan
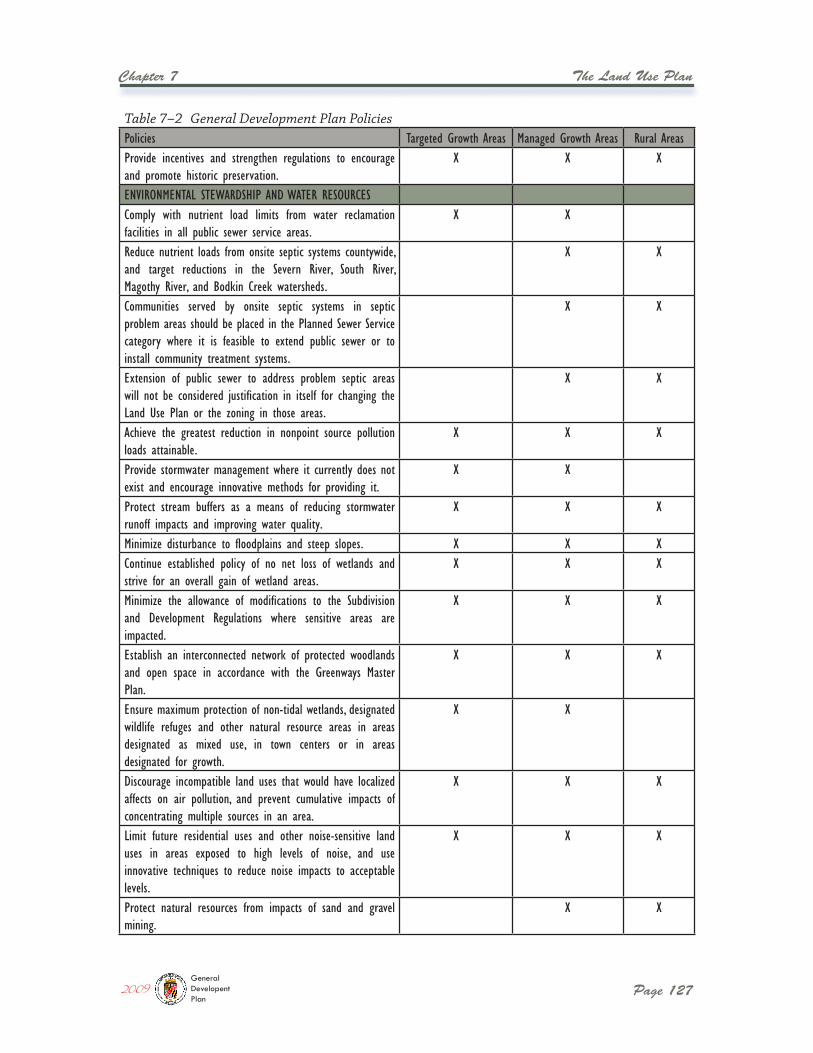
The Land Use Plan
Page 127
Chapter 7
Table 7–2 General Development Plan PoliciesPolicies Targeted Growth Areas Managed Growth Areas Rural AreasProvide incentives and strengthen regulations to encourage and promote historic preservation.
X X X
ENVIRONMENTAL STEWARDSHIP AND WATER RESOURCESComply with nutrient load limits from water reclamation facilities in all public sewer service areas.
X X
Reduce nutrient loads from onsite septic systems countywide, and target reductions in the Severn River, South River, Magothy River, and Bodkin Creek watersheds.
X X
Communities served by onsite septic systems in septic problem areas should be placed in the Planned Sewer Service category where it is feasible to extend public sewer or to install community treatment systems.
X X
Extension of public sewer to address problem septic areas will not be considered justification in itself for changing the Land Use Plan or the zoning in those areas.
X X
Achieve the greatest reduction in nonpoint source pollution loads attainable.
X X X
Provide stormwater management where it currently does not exist and encourage innovative methods for providing it.
X X
Protect stream buffers as a means of reducing stormwater runoff impacts and improving water quality.
X X X
Minimize disturbance to floodplains and steep slopes. X X XContinue established policy of no net loss of wetlands and strive for an overall gain of wetland areas.
X X X
Minimize the allowance of modifications to the Subdivision and Development Regulations where sensitive areas are impacted.
X X X
Establish an interconnected network of protected woodlands and open space in accordance with the Greenways Master Plan.
X X X
Ensure maximum protection of non-tidal wetlands, designated wildlife refuges and other natural resource areas in areas designated as mixed use, in town centers or in areas designated for growth.
X X
Discourage incompatible land uses that would have localized affects on air pollution, and prevent cumulative impacts of concentrating multiple sources in an area.
X X X
Limit future residential uses and other noise-sensitive land uses in areas exposed to high levels of noise, and use innovative techniques to reduce noise impacts to acceptable levels.
X X X
Protect natural resources from impacts of sand and gravel mining.
X X
2009GeneralDevelopentPlan
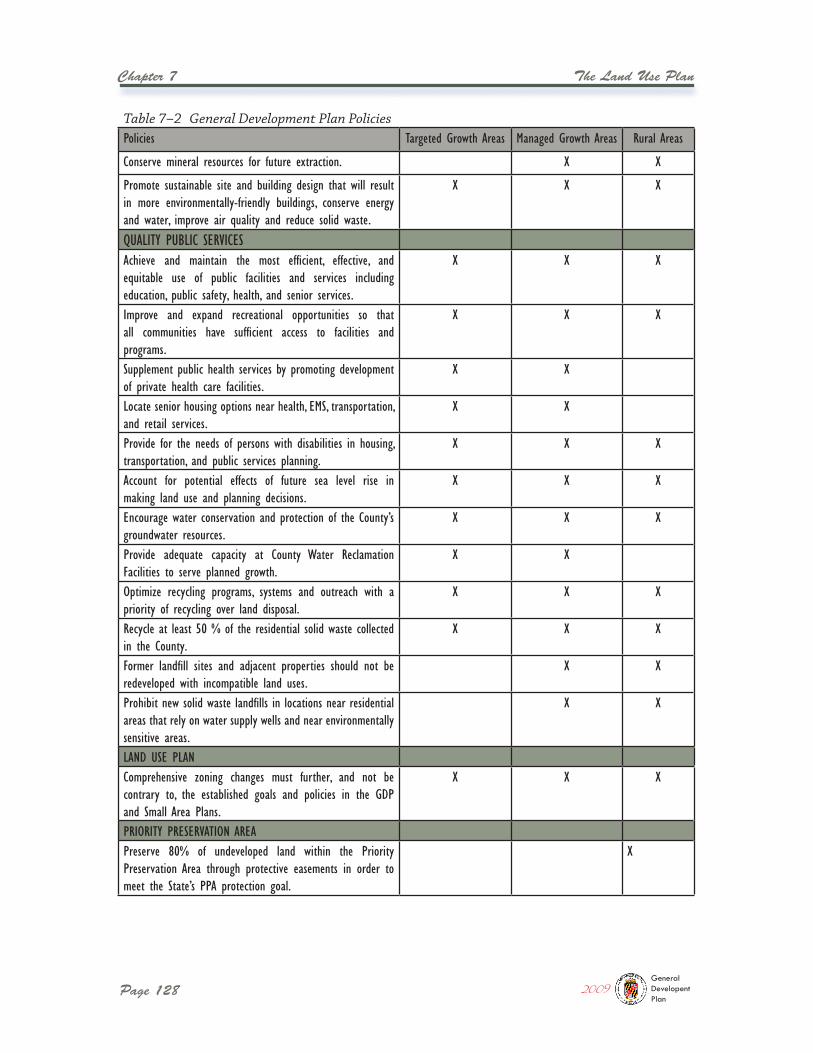
Page 128
Chapter 7 The Land Use Plan
Table 7–2 General Development Plan PoliciesPolicies Targeted Growth Areas Managed Growth Areas Rural Areas
Conserve mineral resources for future extraction. X X
Promote sustainable site and building design that will result in more environmentally-friendly buildings, conserve energy and water, improve air quality and reduce solid waste.
X X X
QUALITY PUBLIC SERVICESAchieve and maintain the most efficient, effective, and equitable use of public facilities and services including education, public safety, health, and senior services.
X X X
Improve and expand recreational opportunities so that all communities have sufficient access to facilities and programs.
X X X
Supplement public health services by promoting development of private health care facilities.
X X
Locate senior housing options near health, EMS, transportation, and retail services.
X X
Provide for the needs of persons with disabilities in housing, transportation, and public services planning.
X X X
Account for potential effects of future sea level rise in making land use and planning decisions.
X X X
Encourage water conservation and protection of the County’s groundwater resources.
X X X
Provide adequate capacity at County Water Reclamation Facilities to serve planned growth.
X X
Optimize recycling programs, systems and outreach with a priority of recycling over land disposal.
X X X
Recycle at least 50 % of the residential solid waste collected in the County.
X X X
Former landfill sites and adjacent properties should not be redeveloped with incompatible land uses.
X X
Prohibit new solid waste landfills in locations near residential areas that rely on water supply wells and near environmentally sensitive areas.
X X
LAND USE PLANComprehensive zoning changes must further, and not be contrary to, the established goals and policies in the GDP and Small Area Plans.
X X X
PRIORITY PRESERVATION AREA Preserve 80% of undeveloped land within the Priority Preservation Area through protective easements in order to meet the State’s PPA protection goal.
X
2009GeneralDevelopentPlan
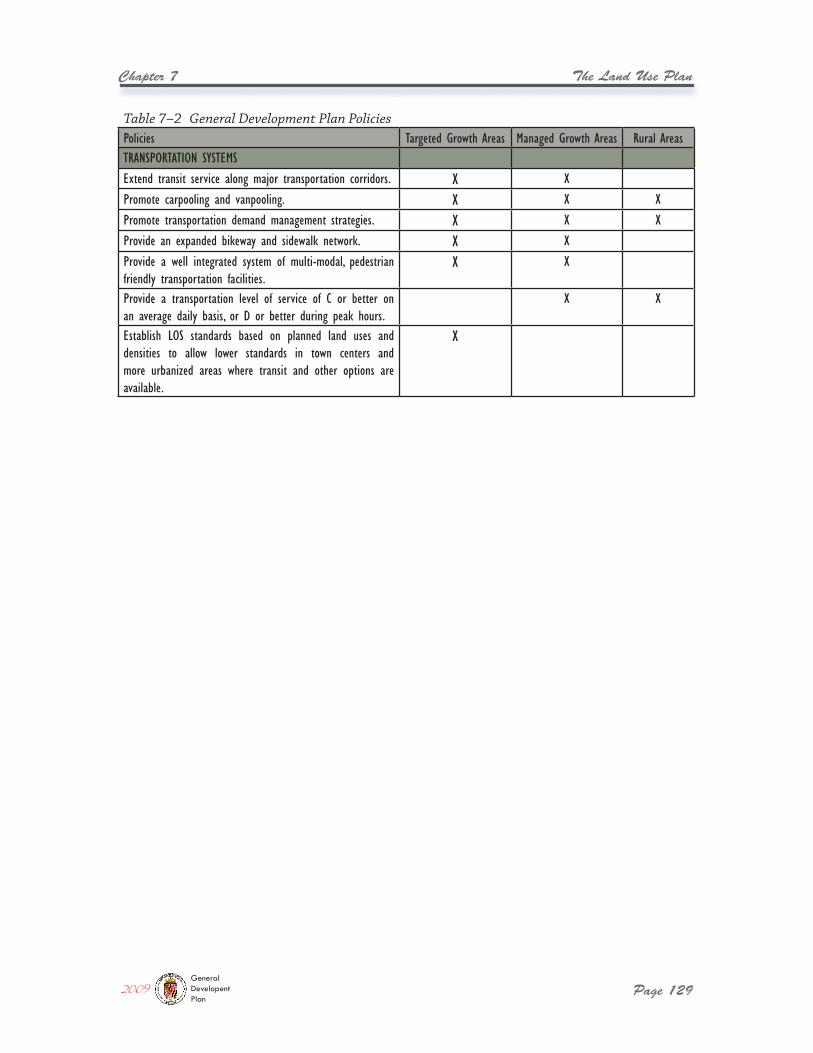
The Land Use Plan
Page 129
Chapter 7
Table 7–2 General Development Plan PoliciesPolicies Targeted Growth Areas Managed Growth Areas Rural AreasTRANSPORTATION SYSTEMSExtend transit service along major transportation corridors. X XPromote carpooling and vanpooling. X X XPromote transportation demand management strategies. X X XProvide an expanded bikeway and sidewalk network. X XProvide a well integrated system of multi-modal, pedestrian friendly transportation facilities.
X X
Provide a transportation level of service of C or better on an average daily basis, or D or better during peak hours.
X X
Establish LOS standards based on planned land uses and densities to allow lower standards in town centers and more urbanized areas where transit and other options are available.
X
2009GeneralDevelopentPlan

Chapter 8:Priority PresevationAreas

Priority Preservation Areas
Page 133
Chapter 8
Anne Arundel County has been an agricultural community for over 350 years, beginning with its role as a major tobacco-producing region in the 17th and 18th centuries. Today agricultural production is more diversified but is still an important component of the local economy. While the northern part of the County has become much more urbanized over the past century, South County has remained a strong agricultural producing region.
Traditionally, Anne Arundel County has had smaller farms than some other Maryland counties, particularly on the Eastern Shore, due to topography and development pres-sures generated by its central location between Baltimore and Washington. County farms range from crops and livestock to timber production and horse breeding. Many farms remain family operations. With the transition from tobacco as a major cash crop, County farms now primarily grow corn, soybeans, wheat, hay, and vegetables. Many farmers have found that boarding and breeding horses is more profitable than raising crops.
The most recent USDA Census of Agriculture, completed in 2007, indicates over 29,200 acres of land in farm use in the County, representing 11% of the County’s total land area. There are an estimated 377 farms in the County with an average farm size of 78 acres. This represents a decline from approximately 35,000 acres of farm land and 432 farms according to the 2002 Census. Over half of the land in farms is used for cropland with the remainder used for woodland, pastureland, or for house lots. The leading crops in terms of number of acres farmed are soybeans, corn and hay, which collectively account for three quarters of the cropland acreage.
The 2007 USDA Census estimated the total market value of agricultural production in the County to be $19 million, of which crops made up 85% and livestock 15%. In terms of market value of production, the leading product was nursery, greenhouse products, flow-ers, and sod that accounted for $10.9 million of production value, followed by livestock, poultry and their products ($2.9 million), grains ($2.8 million), and vegetables and hay.
The County’s horse industry is also an important part of its agriculture base. A Mary-land Equine Census conducted in 2002 reported 4,590 horses and ponies in the County with a value of $27 million. There were over 2,300 County residents directly involved in the equine industry sector, not including hired labor. The horse industry in the County includes the racing breeds of thoroughbreds and standard-breds, as well as other breeds involved in recreational activities, such as Arabians, quarter horses, sport horses and smaller pony breeds.
The farms and open spaces of southern Anne Arundel County are important to the County and the region. Agriculture serves a dual role of providing a direct economic benefit as well as preserving the quality of life that is reflected in a rural environment.
Anne Arundel County has over 29,000 acres of land in farm use, representing 11% of the County’s total land area.
Overview
2009GeneralDevelopentPlan
Page 134
Chapter 8 Priority Preservation Areas
The County has three primary planning documents that establish goals and strategies relating to agricultural land preservation. These include the General Development Plan, the South County Small Area Plan, and the 2006 Land Preservation, Parks and Recreation Plan.
The 1997 GDP included several policies related to the goal of preserving agricultural, forested, and rural areas of the County. These policies and strategies related primarily to promoting agriculture as a viable sector of the local economy; encouraging the use of Best Management Practices to reduce nutrient and sediment runoff and promote healthy streams; discouraging the loss of prime agricultural land to development; and working cooperatively with State agencies and property owners to increase the amount of land protected through easement acquisitions.
The South County Small Area Plan, adopted in 2001, also included several recommenda-tions for maintaining the rural economy. These included incorporating a rural economy function within the County’s overall economic development program. Progress on many of these recommendations is ongoing and is discussed in the following section on implementation.
Finally, the 2006 Land Preservation, Parks and Recreation Plan also addresses the subject of agricultural preservation. This State-mandated plan focuses on three major compo-nents which collectively make up the County’s overall preservation program: 1) recreation, parks and open space; 2) agricultural land preservation; and 3) natural resource conserva-tion. The Plan evaluated the County’s current implementation program for agricultural preservation, which is described below, and proposed four major program development strategies to help further the County’s progress in reaching its preservation goals:
� Adopt revised program regulations for the Agricultural and Woodland Preserva-tion Program;
� Increase the rate of agricultural easement acquisitions and land preservation; � Strengthen agricultural economic development and marketing within the Anne
Arundel Economic Development Corporation (AAEDC); and � Nurture and support growing enterprises such as horse farming.
Since the adoption of these plans, several steps have been taken to address these goals and strategies as discussed below. Based on these, the County has made significant strides toward meeting its preservation goals. Although to date the County has not reached the overall program goal established in 1993 of preserving 20,000 acres of agricultural land through the purchase of easements, over 11,000 acres have been preserved, and nearly 8,500 acres of that total have been preserved since 1992.
The Planning Framework for Agricultural Preservation
2009GeneralDevelopentPlan
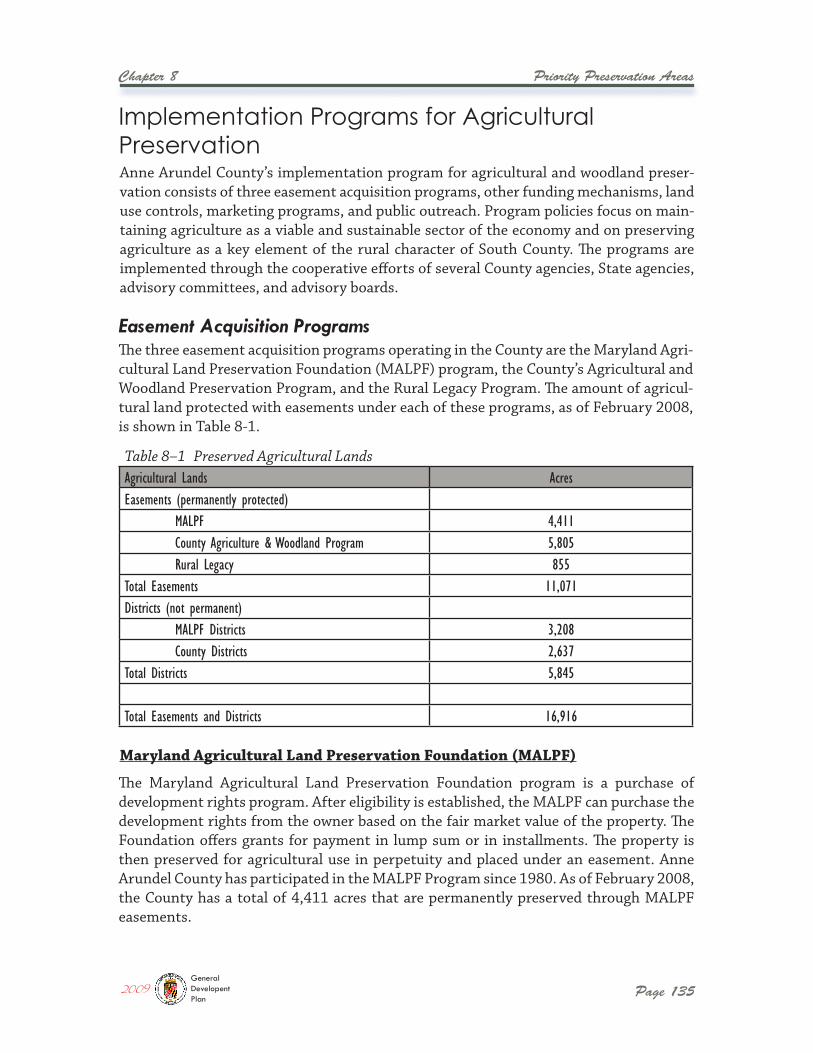
Priority Preservation Areas
Page 135
Chapter 8
Anne Arundel County’s implementation program for agricultural and woodland preser-vation consists of three easement acquisition programs, other funding mechanisms, land use controls, marketing programs, and public outreach. Program policies focus on main-taining agriculture as a viable and sustainable sector of the economy and on preserving agriculture as a key element of the rural character of South County. The programs are implemented through the cooperative efforts of several County agencies, State agencies, advisory committees, and advisory boards.
The three easement acquisition programs operating in the County are the Maryland Agri-cultural Land Preservation Foundation (MALPF) program, the County’s Agricultural and Woodland Preservation Program, and the Rural Legacy Program. The amount of agricul-tural land protected with easements under each of these programs, as of February 2008, is shown in Table 8-1.
The Maryland Agricultural Land Preservation Foundation program is a purchase of development rights program. After eligibility is established, the MALPF can purchase the development rights from the owner based on the fair market value of the property. The Foundation offers grants for payment in lump sum or in installments. The property is then preserved for agricultural use in perpetuity and placed under an easement. Anne Arundel County has participated in the MALPF Program since 1980. As of February 2008, the County has a total of 4,411 acres that are permanently preserved through MALPF easements.
Table 8–1 Preserved Agricultural LandsAgricultural Lands AcresEasements (permanently protected)
MALPF 4,411 County Agriculture & Woodland Program 5,805 Rural Legacy 855
Total Easements 11,071Districts (not permanent)
MALPF Districts 3,208 County Districts 2,637
Total Districts 5,845
Total Easements and Districts 16,916
Implementation Programs for Agricultural Preservation
Easement Acquisition Programs
Maryland Agricultural Land Preservation Foundation (MALPF)
2009GeneralDevelopentPlan
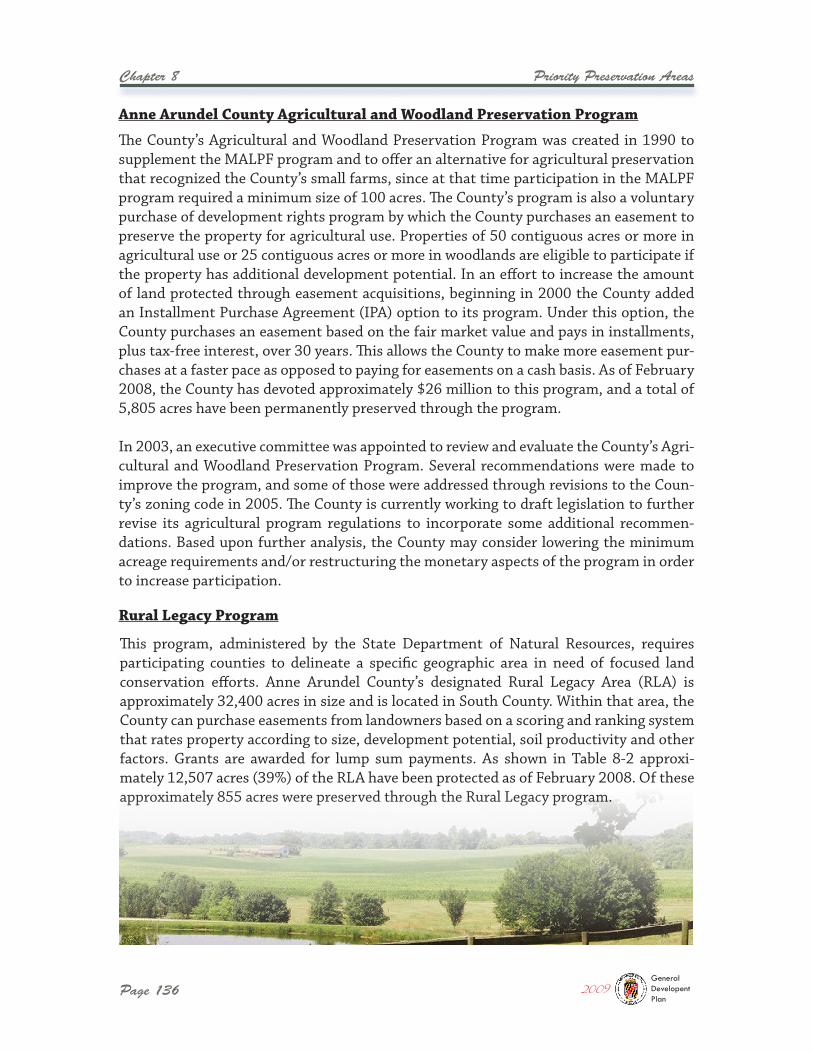
Page 136
Chapter 8 Priority Preservation Areas
The County’s Agricultural and Woodland Preservation Program was created in 1990 to supplement the MALPF program and to offer an alternative for agricultural preservation that recognized the County’s small farms, since at that time participation in the MALPF program required a minimum size of 100 acres. The County’s program is also a voluntary purchase of development rights program by which the County purchases an easement to preserve the property for agricultural use. Properties of 50 contiguous acres or more in agricultural use or 25 contiguous acres or more in woodlands are eligible to participate if the property has additional development potential. In an effort to increase the amount of land protected through easement acquisitions, beginning in 2000 the County added an Installment Purchase Agreement (IPA) option to its program. Under this option, the County purchases an easement based on the fair market value and pays in installments, plus tax-free interest, over 30 years. This allows the County to make more easement pur-chases at a faster pace as opposed to paying for easements on a cash basis. As of February 2008, the County has devoted approximately $26 million to this program, and a total of 5,805 acres have been permanently preserved through the program.
In 2003, an executive committee was appointed to review and evaluate the County’s Agri-cultural and Woodland Preservation Program. Several recommendations were made to improve the program, and some of those were addressed through revisions to the Coun-ty’s zoning code in 2005. The County is currently working to draft legislation to further revise its agricultural program regulations to incorporate some additional recommen-dations. Based upon further analysis, the County may consider lowering the minimum acreage requirements and/or restructuring the monetary aspects of the program in order to increase participation.
This program, administered by the State Department of Natural Resources, requires participating counties to delineate a specific geographic area in need of focused land conservation efforts. Anne Arundel County’s designated Rural Legacy Area (RLA) is approximately 32,400 acres in size and is located in South County. Within that area, the County can purchase easements from landowners based on a scoring and ranking system that rates property according to size, development potential, soil productivity and other factors. Grants are awarded for lump sum payments. As shown in Table 8-2 approxi-mately 12,507 acres (39%) of the RLA have been protected as of February 2008. Of these approximately 855 acres were preserved through the Rural Legacy program.
Rural Legacy Program
Anne Arundel County Agricultural and Woodland Preservation Program
2009GeneralDevelopentPlan
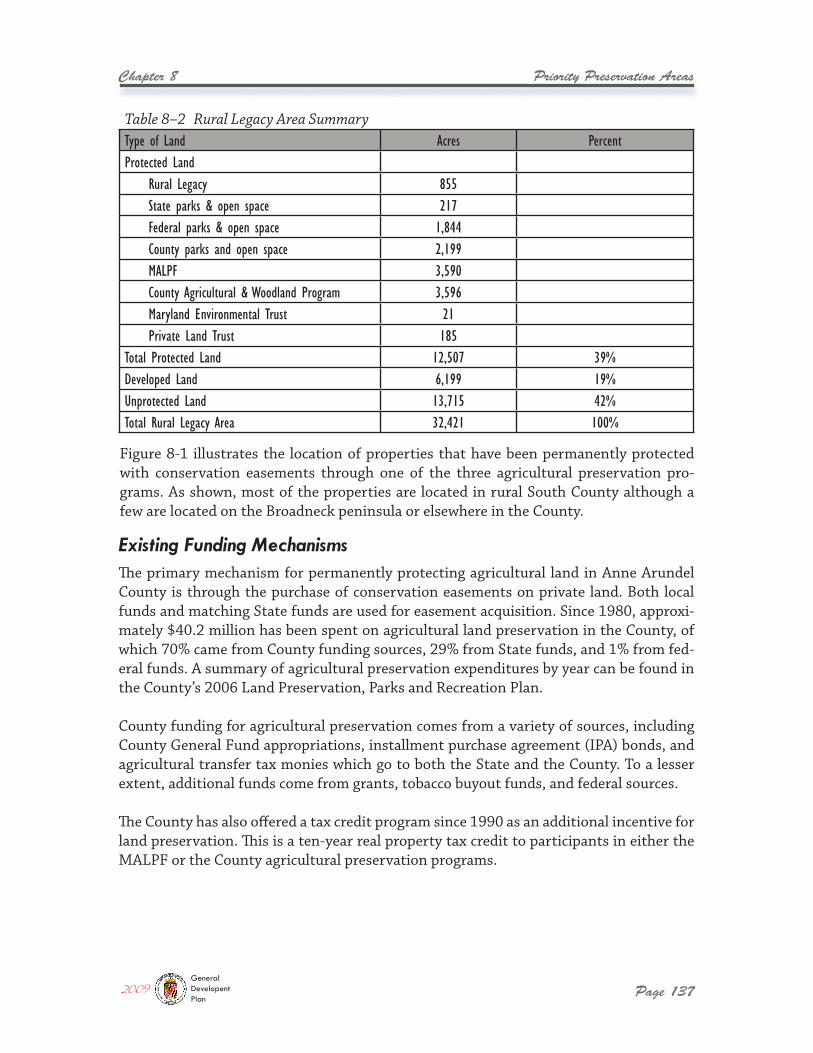
Priority Preservation Areas
Page 137
Chapter 8
Figure 8-1 illustrates the location of properties that have been permanently protected with conservation easements through one of the three agricultural preservation pro-grams. As shown, most of the properties are located in rural South County although a few are located on the Broadneck peninsula or elsewhere in the County.
The primary mechanism for permanently protecting agricultural land in Anne Arundel County is through the purchase of conservation easements on private land. Both local funds and matching State funds are used for easement acquisition. Since 1980, approxi-mately $40.2 million has been spent on agricultural land preservation in the County, of which 70% came from County funding sources, 29% from State funds, and 1% from fed-eral funds. A summary of agricultural preservation expenditures by year can be found in the County’s 2006 Land Preservation, Parks and Recreation Plan.
County funding for agricultural preservation comes from a variety of sources, including County General Fund appropriations, installment purchase agreement (IPA) bonds, and agricultural transfer tax monies which go to both the State and the County. To a lesser extent, additional funds come from grants, tobacco buyout funds, and federal sources.
The County has also offered a tax credit program since 1990 as an additional incentive for land preservation. This is a ten-year real property tax credit to participants in either the MALPF or the County agricultural preservation programs.
Table 8–2 Rural Legacy Area SummaryType of Land Acres PercentProtected Land
Rural Legacy 855State parks & open space 217Federal parks & open space 1,844County parks and open space 2,199MALPF 3,590County Agricultural & Woodland Program 3,596Maryland Environmental Trust 21Private Land Trust 185
Total Protected Land 12,507 39%Developed Land 6,199 19%Unprotected Land 13,715 42%Total Rural Legacy Area 32,421 100%
Existing Funding Mechanisms
2009GeneralDevelopentPlan
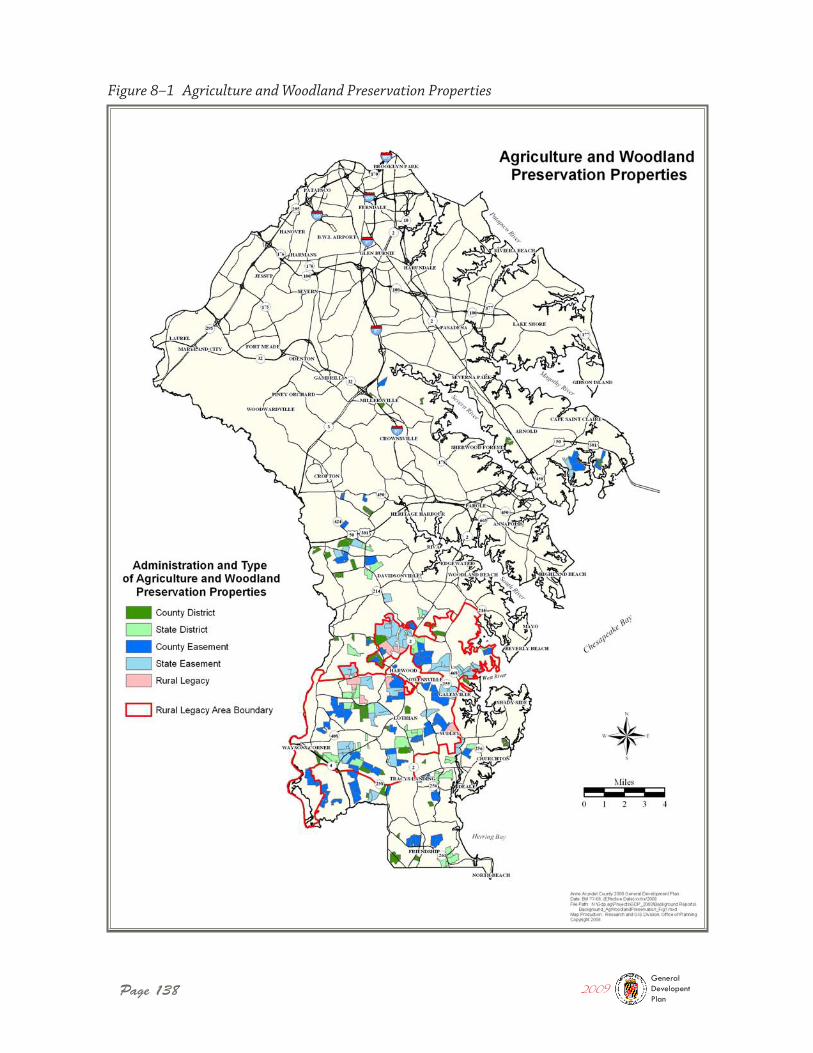
Page 138
Figure 8–1 Agriculture and Woodland Preservation Properties
2009GeneralDevelopentPlan
Priority Preservation Areas
Page 139
Chapter 8
The County’s General Development Plan, Zoning Ordinance, and Subdivision Regulations are the principal planning and regulatory tools used to establish land use policies and to guide and manage growth, development, and land preservation. The 2009 Land Use Plan designates approximately 89,000 acres of land, including most of South County, for “Rural” land use. In general, a Rural designation indicates that land use in the area should continue as rural or agricultural, that public utilities are not planned for the area, that agriculture and forestry should be primary uses in the area, that new residential uses are encouraged to develop in villages or clusters to preserve as much open space as possible, and that commercial uses be limited to neighborhood and community level services.
Areas with a Rural land use designation are generally assigned to the Rural Agricultural (RA) zoning district, particularly in South County. The RA zoning district comprises approximately 30% of the land area in the County and includes most of the County’s prime agricultural land. The RA district allows residential subdivisions at a density of one dwelling unit per 20 acres, with one additional dwelling unit permitted for residue acreage over 10 acres, and for parcels over 50 acres, one additional dwelling unit for every 50 acres. Although properties less than 50 acres in size cannot currently qualify for the MALPF program or the County’s Agricultural and Woodland Preservation Program (because there would be limited if any development rights to sell), quite a few of these properties nonetheless are used for vegetable growing, flowers, grapes, horses and other agricultural uses.
Since the adoption of the 1997 GDP and the South County Small Area Plan, the County has adopted several code changes that will help to reduce the loss of agricultural land to development. For example, a Right to Farm bill was adopted in 2004 with the intention of preventing nuisance lawsuits that can often arise from residential growth in agricul-tural areas. This legislation will help to protect the economic viability of farming in the County.
Additional changes were made to the code in 2005 that will have an impact on develop-ment densities in rural areas. Prior to 2005, maximum development densities in the RA zone were one dwelling unit per 20 acres in general, but additional lots could be subdi-vided for the purpose of family conveyances. This provision was in some cases allowing overall development densities much higher than what was desirable in the RA district. As part of a comprehensive change to the County’s zoning ordinance in 2005, the fam-ily conveyance provision was eliminated from the regulations. The County believes this will help to preserve larger contiguous areas of farmland and reduce fragmentation of agricultural areas.
Other changes to the County Code have been made to provide increased incentives for agricultural preservation. The County’s Subdivision Regulations now allow that agricul-tural preservation subdivisions, i.e. a subdivision for which an agricultural preservation
Land Use Controls and Policies
2009GeneralDevelopentPlan
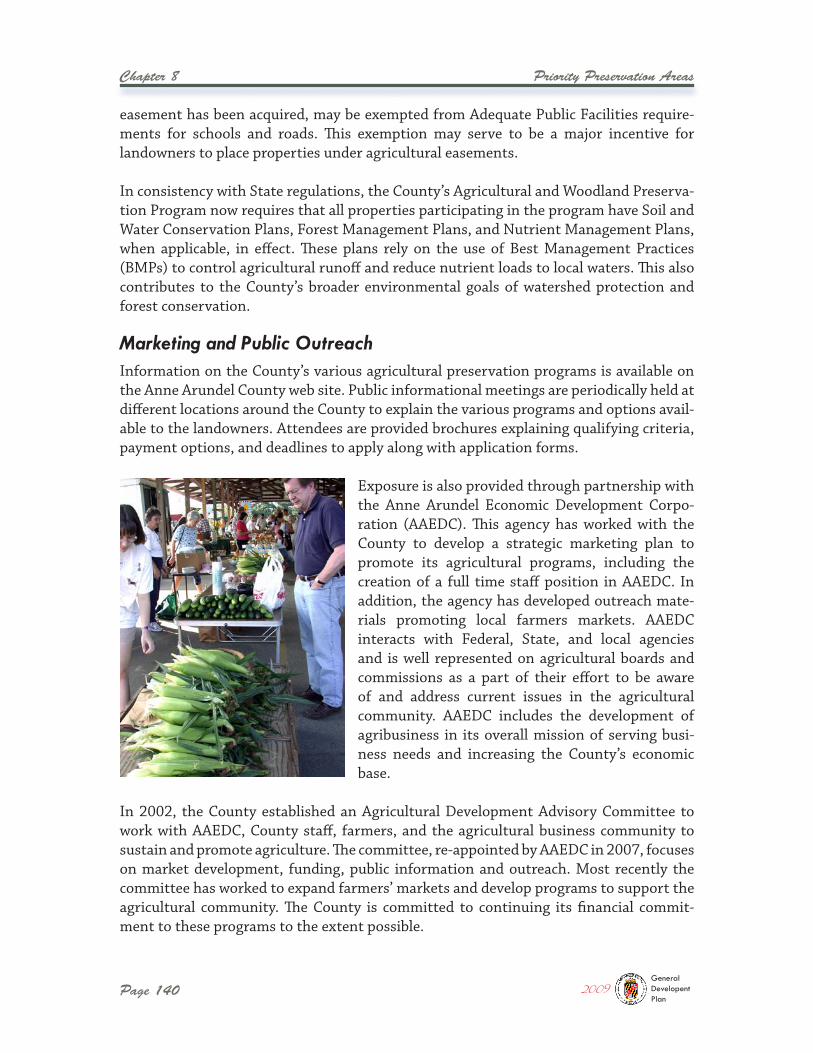
Page 140
Chapter 8 Priority Preservation Areas
easement has been acquired, may be exempted from Adequate Public Facilities require-ments for schools and roads. This exemption may serve to be a major incentive for landowners to place properties under agricultural easements.
In consistency with State regulations, the County’s Agricultural and Woodland Preserva-tion Program now requires that all properties participating in the program have Soil and Water Conservation Plans, Forest Management Plans, and Nutrient Management Plans, when applicable, in effect. These plans rely on the use of Best Management Practices (BMPs) to control agricultural runoff and reduce nutrient loads to local waters. This also contributes to the County’s broader environmental goals of watershed protection and forest conservation.
Information on the County’s various agricultural preservation programs is available on the Anne Arundel County web site. Public informational meetings are periodically held at different locations around the County to explain the various programs and options avail-able to the landowners. Attendees are provided brochures explaining qualifying criteria, payment options, and deadlines to apply along with application forms.
Exposure is also provided through partnership with the Anne Arundel Economic Development Corpo-ration (AAEDC). This agency has worked with the County to develop a strategic marketing plan to promote its agricultural programs, including the creation of a full time staff position in AAEDC. In addition, the agency has developed outreach mate-rials promoting local farmers markets. AAEDC interacts with Federal, State, and local agencies and is well represented on agricultural boards and commissions as a part of their effort to be aware of and address current issues in the agricultural community. AAEDC includes the development of agribusiness in its overall mission of serving busi-ness needs and increasing the County’s economic base.
In 2002, the County established an Agricultural Development Advisory Committee to work with AAEDC, County staff, farmers, and the agricultural business community to sustain and promote agriculture. The committee, re-appointed by AAEDC in 2007, focuses on market development, funding, public information and outreach. Most recently the committee has worked to expand farmers’ markets and develop programs to support the agricultural community. The County is committed to continuing its financial commit-ment to these programs to the extent possible.
Marketing and Public Outreach
2009GeneralDevelopentPlan
Priority Preservation Areas
Page 141
Chapter 8
A number of County agencies, committees, and boards have key roles in implementing the various components of the County’s agricultural preservation program. Cooperation among the various local agencies as well as coordination with the Maryland Department of Agriculture and MALPF are important to the success of the program.
The Department of Recreation and Parks has primary responsibility for program guide-lines, implementation, and strategies. The Department guides the administration of the three easement acquisition programs described previously, including the Anne Arundel County Agricultural Preservation Program, Maryland Agricultural Land Preservation Foundation Program, and Rural Legacy Program. Property descriptions and maps relat-ing to all easement properties are maintained within the Department.
The Anne Arundel County Agricultural Preservation Program operates under a Capital Project managed by the Department of Public Works (DPW). DPW provides budget man-agement and compliance with County procedures including but not limited to property appraisals and preliminary title review of potential easement properties.
Currently, Article 18 of the Anne Arundel County Code cites the Office of Planning and Zoning with responsibility for approvals and recommendations regarding the creation of Agricultural Districts, purchase of Agricultural Easements, and program guidelines relat-ing to land use and zoning.
The Agricultural Preservation Advisory Board is established in accordance with the Agri-culture Article, § 2-505.1 to promote preservation of agriculture within the County. This five-member board is appointed by the County Executive and is comprised of citizens and members of the agricultural community. The Board meets at least four times a year and advises the County Executive and the County Council on the establishment of agricul-tural districts and the purchase of easements. The Board also makes recommendations concerning budget and appropriation requests, promotes the preservation of agriculture, and prepares and reviews recommendations related to County policies and programs.
The Anne Arundel County Forestry Board directly provides expertise and knowledge as a review agency for forest management plans on potential district and easement proper-ties. As volunteer advocates for forestry, Board members focus on preserving the County’s forest resources. The Board provides education and outreach to increase public awareness of environmental concerns and good forestry practices.
The Agricultural Stewardship Act of 2006 authorizes counties to include a Priority Preser-vation Area (PPA) element in their comprehensive plan, and the requirement is mandatory for counties such as Anne Arundel that have State-certified programs. A specific preserva-tion goal will be established based on the PPA. By establishing a priority area that meets
Program Management and Interagency Coordination
Priority Preservation Areas
2009GeneralDevelopentPlan
Page 142
Chapter 8 Priority Preservation Areas
specified criteria, the State and counties will be able to better target preservation funds to those areas that will provide the most benefit toward meeting a county’s preservation goals. The County will still be able to purchase easements outside of the PPA using the three existing easement acquisition programs, but additional State funding, when avail-able, will be targeted toward preservation within the PPA. The State requires that a PPA meet the following criteria:
� The area must contain productive agricultural or forest soils or be capable of sup-porting profitable agricultural and forestry enterprises;
� The area must be governed by local policies that stabilize the agricultural or forest land base so that development does not convert or compromise agricultural and forestry resources;
� The area must be large enough to support the kind of agricultural operations that the County seeks to preserve; and
� The area must include an acreage goal for land to be preserved through easements and zoning in the PPA equal to at least 80% of the remaining undeveloped areas of land in the area.
Based on these criteria, the County has defined a PPA boundary by identifying properties that contain productive soils (Class I, II or III soil types), that lie within the Rural Agricul-tural (RA) zoning district, and that are 50 acres or more in size. The County also took into consideration proximity to land parcels already protected by an agricultural preservation easement as well as the potential to form larger contiguous areas of preserved land.
The results of this analysis are shown in Figure 8-2. The PPA consists of approximately 39,430 acres of land in two separate areas and includes approximately 450 individual land parcels that are at least 50 acres in size and are zoned RA. The PPA contains the entire Rural Legacy Area which comprises approximately 83% of the total PPA acreage. Within the PPA, 14,262 acres are currently protected under agricultural districts and easements, of which 3,050 acres are in agricultural districts. An additional 5,964 acres are County or State-owned parkland. The remaining 19,204 acres are not protected by an easement or as parkland. Using the State’s criteria, the County can establish a goal of protecting 80% of the remaining undeveloped land within the PPA.
Other factors to be considered include the size of properties and the potential for further development. Although currently only properties of 50 acres or more in size are eligible to participate in the MALPF or County Agricultural and Woodland Preservation programs, it should be noted that there are existing properties of 15 to 30 acres in size that can and in some cases are being used for vegetable growing, flowers, grapes, horses and other agricultural uses. In addition, the County’s RA zoning district includes many properties of less than 30 acres that are developed with a single residence, and while many of these properties are not protected under an easement, they are essentially “protected” from further development based on the allowable densities in the RA district. Further research will be needed to determine how much of this acreage is actually developed to its full
2009GeneralDevelopentPlan
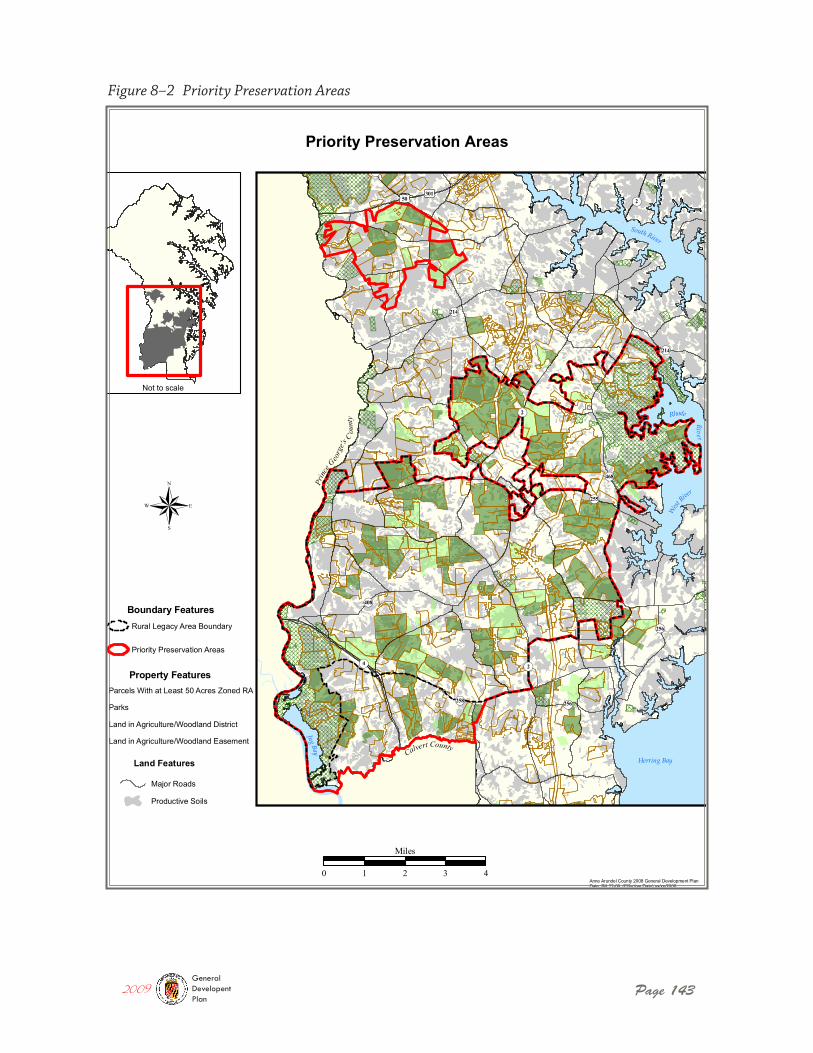
Page 143
Figure 8–2 Priority Preservation Areas
2009GeneralDevelopentPlan
!(
!(
!(
!(
!(
!(
!(
!(
!( !(
!(
!(
£¤ £¤
!(
!(
!(
!(
2
214
468
2
214
2
258
408
4
256
50301
256
255®
Priority Preservation Areas
Anne Arundel County 2008 General Development PlanDate: Bill ??-08, (Effective Date) xx/xx/2008File Path: N:\Gdp.ag\Projects\GDP_2008\Background Reports\ Background_PriorityPresAreas_Fig2.mxdMap Production: Research and GIS Division, Office of PlanningCopyright 2008
0 1 2 3 4
Miles
Boundary FeaturesRural Legacy Area Boundary
Priority Preservation Areas
Not to scale
South River
Rhode
Rive r
West
River
Herring Bay
Jug Bay Calvert County
Prin
ce
G
eorg
e's C
ount
y
Land Features
Major Roads
Productive Soils
Property FeaturesParcels With at Least 50 Acres Zoned RA
Parks
Land in Agriculture/Woodland District
Land in Agriculture/Woodland Easement
Page 144
Chapter 8 Priority Preservation Areas
Anne Arundel County has made some significant achievements toward preserving its agricultural heritage over the past 25 years. The County has worked closely with the State Departments of Agriculture and Planning to certify and maintain its preservation pro-grams, and continues to use a variety of approaches including legislation, outreach, land use controls and voluntary acquisitions to accomplish its mission.
An overall goal of preserving 20,000 acres of agricultural land in the County was estab-lished in 1993, and the County has been able to preserve significant amounts of acreage each year since that time. Approximately 50% of the total acreage preserved under agricultural easements to date was acquired between 2000 and 2006, in part due to the Installment Purchase Agreement option that was added to the County’s preservation pro-gram in 1999 to stimulate interest.
In spite of these accomplishments, there is some concern that it will become increasingly difficult for the County’s voluntary preservation programs to compete with market forces and development pressures in its planned rural and
agricultural areas. Currently, landowners are offered a percentage of fair market value for a development rights easement plus a County property tax credit on up to the first $250,000 of assessed value of structures including dwellings. While this represents an attractive financial incentive for participation in the programs, the programs must remain competitive with market forces if the County is to meet its preservation goals. Additional incentives or revisions to the programs to increase their value may be required in order to attract new interest in the programs and sustain the rate of participation experienced over the past several years.
In addition, established goals for preservation must be realistic and attainable. A more complete land parcel inventory and holding capacity analysis is needed in order to ascertain whether the 20,000-acre goal remains attainable. This research will provide information necessary to assess the remaining available acreage that meets the qualify-ing criteria under the current purchase of development rights programs. It will also help to determine whether there are feasible revisions to those programs that would allow additional acreage to qualify for the programs and thus enhance the County’s ability to meet its goals.
The following strategies are proposed to aid in attaining the goal of preserving additional acreage within the PPA.
Over 11,000 acres have been preserved under protective easements.
potential. However, some of the 19,204 unprotected acres in the PPA most likely do not have additional development potential and are therefore in a sense protected.
Program Evaluation and Strategies to Meet Preservation Goals
2009GeneralDevelopentPlan
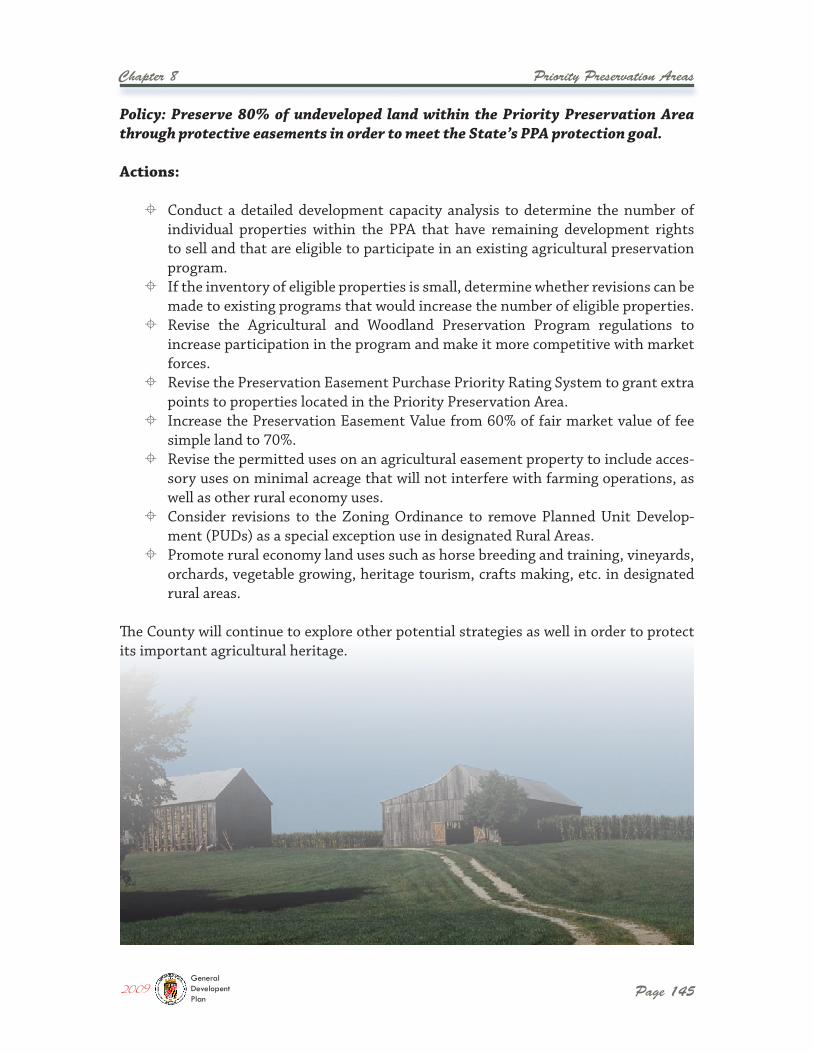
Priority Preservation Areas
Page 145
Chapter 8
Policy: Preserve 80% of undeveloped land within the Priority Preservation Area through protective easements in order to meet the State’s PPA protection goal.
Actions:
� Conduct a detailed development capacity analysis to determine the number of individual properties within the PPA that have remaining development rights to sell and that are eligible to participate in an existing agricultural preservation program.
� If the inventory of eligible properties is small, determine whether revisions can be made to existing programs that would increase the number of eligible properties.
� Revise the Agricultural and Woodland Preservation Program regulations to increase participation in the program and make it more competitive with market forces.
� Revise the Preservation Easement Purchase Priority Rating System to grant extra points to properties located in the Priority Preservation Area.
� Increase the Preservation Easement Value from 60% of fair market value of fee simple land to 70%.
� Revise the permitted uses on an agricultural easement property to include acces-sory uses on minimal acreage that will not interfere with farming operations, as well as other rural economy uses.
� Consider revisions to the Zoning Ordinance to remove Planned Unit Develop-ment (PUDs) as a special exception use in designated Rural Areas.
� Promote rural economy land uses such as horse breeding and training, vineyards, orchards, vegetable growing, heritage tourism, crafts making, etc. in designated rural areas.
The County will continue to explore other potential strategies as well in order to protect its important agricultural heritage.
2009GeneralDevelopentPlan

Chapter 9:The Transportation Plan

The Transportation Plan
Page 149
Chapter 9
The Transportation Plan is another important component of the General Development Plan, along with the Land Use Plan. These two components are interdependent and should be prepared collaboratively so that transportation services and infrastructure will support and promote the land use and development patterns desired.
The County’s transportation planning approach focuses on seven key elements:
� Maintenance of the existing transportation facilities inventory to protect public investment in facilities and to support redevelopment and revitalization of the County’s neighborhoods and commercial areas;
� Expansion of the transportation facilities inventory to meet the increasing travel demand;
� Emphasis on improving safety for motorists, pedestrians, and bicyclists; � Provision of alternative means of mobility through increased transit service; � Implementation of travel demand management strategies; � Inclusion of emergency management principles in transportation plans; and � Expansion of pedestrian and bicycle facilities.
The County’s key transportation objective is to create a safe and well-managed transpor-tation network that provides greater choice for the traveler and limits or even reduces congestion on the road system. Various roadway improvements, improved regional and local transit, expanded bicycle and pedestrian networks, and improved connections between the different modes will help to lessen reliance on the single-occupancy vehicle and reduce vehicle emissions. Additionally, land use and housing policies supporting mixed-use development, higher densities around transit hubs, and retention of neigh-borhood retail and services will further promote transit use and help reduce new trips.
Proposals in this Plan that will help accomplish the above include the following:
� A greater County leadership role in the pursuit of regional transportation fund-ing, planning, and improvement strategies, with strong advocacy for sufficient funding to implement local transit and roadway and highway projects.
� Continued monitoring and management of roadway congestion in the County through level of service standards, signal timing, access management, and other means.
� Local roadway and regional highway interchange improvements to increase safety, improve flow and reduce congestion.
� Improved and expanded local bus service, and more accessibility to commuter bus service.
� More accessibility to commuter rail service. � Continued support of transportation demand management programs and tech-
niques to encourage less driving. � Continued implementation of the Bicycle and Pedestrian Master Plan to provide
an expanded bikeway and sidewalk network and greater overall support for biking and walking.
2009GeneralDevelopentPlan
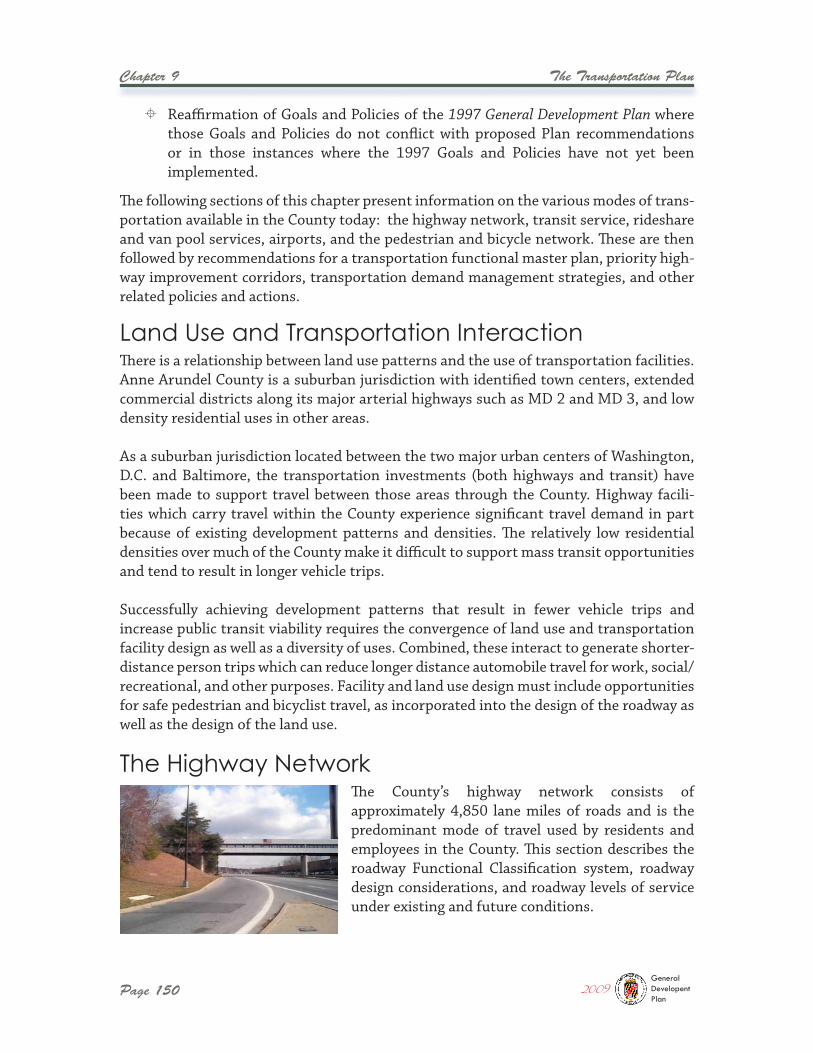
Page 150
Chapter 9 The Transportation Plan
� Reaffirmation of Goals and Policies of the 1997 General Development Plan where those Goals and Policies do not conflict with proposed Plan recommendations or in those instances where the 1997 Goals and Policies have not yet been implemented.
The following sections of this chapter present information on the various modes of trans-portation available in the County today: the highway network, transit service, rideshare and van pool services, airports, and the pedestrian and bicycle network. These are then followed by recommendations for a transportation functional master plan, priority high-way improvement corridors, transportation demand management strategies, and other related policies and actions.
The County’s highway network consists of approximately 4,850 lane miles of roads and is the predominant mode of travel used by residents and employees in the County. This section describes the roadway Functional Classification system, roadway design considerations, and roadway levels of service under existing and future conditions.
There is a relationship between land use patterns and the use of transportation facilities. Anne Arundel County is a suburban jurisdiction with identified town centers, extended commercial districts along its major arterial highways such as MD 2 and MD 3, and low density residential uses in other areas.
As a suburban jurisdiction located between the two major urban centers of Washington, D.C. and Baltimore, the transportation investments (both highways and transit) have been made to support travel between those areas through the County. Highway facili-ties which carry travel within the County experience significant travel demand in part because of existing development patterns and densities. The relatively low residential densities over much of the County make it difficult to support mass transit opportunities and tend to result in longer vehicle trips.
Successfully achieving development patterns that result in fewer vehicle trips and increase public transit viability requires the convergence of land use and transportation facility design as well as a diversity of uses. Combined, these interact to generate shorter-distance person trips which can reduce longer distance automobile travel for work, social/recreational, and other purposes. Facility and land use design must include opportunities for safe pedestrian and bicyclist travel, as incorporated into the design of the roadway as well as the design of the land use.
Land Use and Transportation Interaction
The Highway Network
2009GeneralDevelopentPlan
The Transportation Plan
Page 151
Chapter 9
Transportation planning for highway facilities must consider the relationship between the function of the roadway, the land use pattern served by that facility, and the design of that facility to make it compatible with both the adjacent land use and the type and volume of travel generated by that land use.
The GDP Background Report on Transportation (May 2008) presents a detailed discussion of the functional classification system of highways and roads in the County. Functional classification is the process by which streets and highways are grouped into classes, or systems, according to the character of traffic service that they are intended to provide. Typically, travelers will use a combination of various classes of roadways over the course of their trips.Each type of road has a specific purpose or function. Some provide land access to serve each end of the trip. Others provide travel mobility at varying levels, which is needed en route.
There is a basic relationship between functionally classified highway systems in serving traffic mobility and land access. Anne Arundel County identifies five levels of functional classification:
Freeways are high speed, multi-lane facilities with a high degree of access control. These facilities provide for efficient and uninterrupted travel over long distances serving inter-state and commuter needs. They should provide a high level of traffic service for travelers making longer distance trips at high speeds. Freeways provide no direct access to abut-ting properties.
Principal Arterials serve the needs of through traffic for moderately long trips. They serve the major activity centers in the County and major portions of the trips entering or leaving urban areas. Principal Arterials are the primary travel route for commercial, commuter and recreational travel in rural areas. They also provide secondary linkages between large urban centers and suburban population / employment centers. Access may be controlled through medians or by the limitation of curb cuts through the orienta-tion of access for new developments. Typically, they intersect minor arterials, collector or major activity locations.
Minor Arterials connect higher functional class facilities, activity centers, regions of the area, and major county roads. Traffic is composed predominantly of trips across and within regions of the city. They provide service to traffic at a somewhat lower level of travel mobility than principal arterials with minimal control of access to abutting com-mercial, industrial and residential properties. Direct access to individual properties and neighborhoods is discouraged.
Collectors provide traffic circulation within neighborhoods, commercial and industrial areas. These roads collect traffic from local streets in neighborhoods and channel it into
Functional Classification
2009GeneralDevelopentPlan
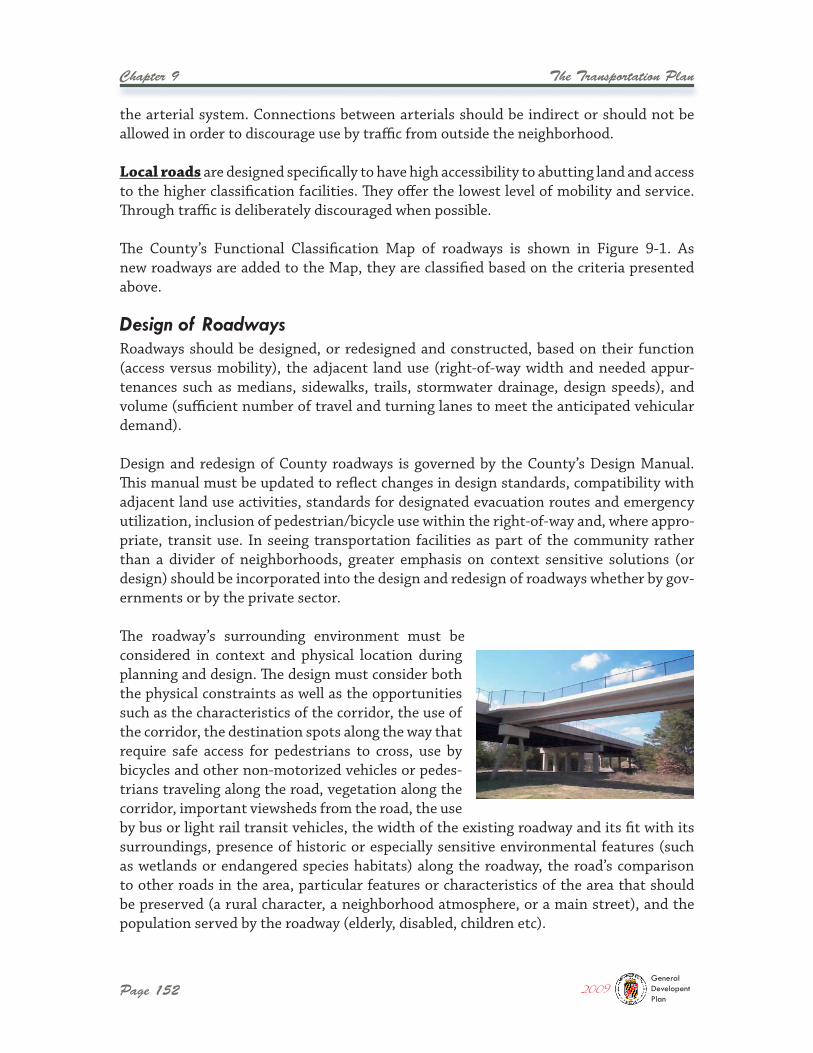
Page 152
Chapter 9 The Transportation Plan
Roadways should be designed, or redesigned and constructed, based on their function (access versus mobility), the adjacent land use (right-of-way width and needed appur-tenances such as medians, sidewalks, trails, stormwater drainage, design speeds), and volume (sufficient number of travel and turning lanes to meet the anticipated vehicular demand).
Design and redesign of County roadways is governed by the County’s Design Manual. This manual must be updated to reflect changes in design standards, compatibility with adjacent land use activities, standards for designated evacuation routes and emergency utilization, inclusion of pedestrian/bicycle use within the right-of-way and, where appro-priate, transit use. In seeing transportation facilities as part of the community rather than a divider of neighborhoods, greater emphasis on context sensitive solutions (or design) should be incorporated into the design and redesign of roadways whether by gov-ernments or by the private sector.
The roadway’s surrounding environment must be considered in context and physical location during planning and design. The design must consider both the physical constraints as well as the opportunities such as the characteristics of the corridor, the use of the corridor, the destination spots along the way that require safe access for pedestrians to cross, use by bicycles and other non-motorized vehicles or pedes-trians traveling along the road, vegetation along the corridor, important viewsheds from the road, the use by bus or light rail transit vehicles, the width of the existing roadway and its fit with its surroundings, presence of historic or especially sensitive environmental features (such as wetlands or endangered species habitats) along the roadway, the road’s comparison to other roads in the area, particular features or characteristics of the area that should be preserved (a rural character, a neighborhood atmosphere, or a main street), and the population served by the roadway (elderly, disabled, children etc).
the arterial system. Connections between arterials should be indirect or should not be allowed in order to discourage use by traffic from outside the neighborhood.
Local roads are designed specifically to have high accessibility to abutting land and access to the higher classification facilities. They offer the lowest level of mobility and service. Through traffic is deliberately discouraged when possible.
The County’s Functional Classification Map of roadways is shown in Figure 9-1. As new roadways are added to the Map, they are classified based on the criteria presented above.
Design of Roadways
2009GeneralDevelopentPlan
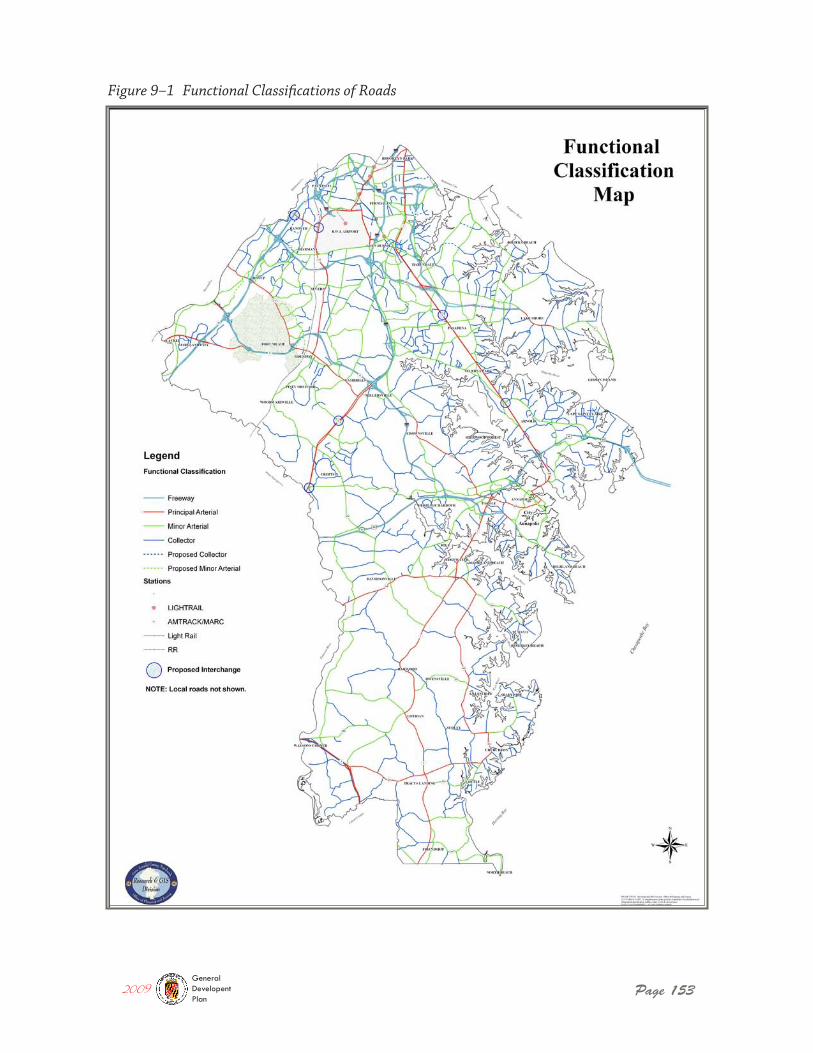
Page 153
Figure 9–1 Functional Classifications of Roads
2009GeneralDevelopentPlan
Page 154
Chapter 9 The Transportation Plan
Level of service (LOS) is a grading and evaluation system for the amount of congestion on a roadway, using the letter LOS A to represent the least amount of congestion and LOS F to refer to the greatest amount. The appropriate degree of congestion (that is, the level of service) to be used in planning and designing highway improvements is determined by considering a variety of factors. These factors include the desires of the motorists, adjacent land use type and development intensity, environmental factors, and aesthetic and historic values.
To determine future (anticipated) level of service, the County’s travel demand model generates vehicle trips on an average daily basis. There is a relationship between daily travel and peak hour travel demand where daily travel demand generated by the model is compared to the maximum service flow of the roadway based on the road’s operating characteristics (numbers of lanes, width of lanes, and number of signals per mile). When that relationship exceeds 80% (generated traffic is 80% of daily service flow), vehicles using the roadway segment could be operating at a lower than acceptable level of service in the peak hour.
Peak-Hour Level of Service
Once an appropriate design speed has been selected, the other basic defining elements of the highway (i.e., the number of lanes and the basic configuration of junctions with other highway facilities) can be determined through application of the concept of accept-able peak hour level of service. For a comprehensive treatment of this topic, refer to the Highway Capacity Manual. The graphic shown below offers a visual understanding of the concept.
As mentioned above, a variety of factors are weighed in determining the policy level of congestion for planning and design. The factors must be weighed against the financial resources available to satisfy the motorists’ desires. Where possible, the County and the Maryland State Highway Administration (SHA) recommend LOS D as a standard
Therefore, this Plan makes the following roadway design recommendations:
Actions:
� Update and revise the County’s Design Manual and appropriate sections of the Subdivision Regulations to incorporate context sensitive design requirements to promote design and redesign of the County’s roadways to be more compatible with the surrounding land uses and the GDP Land Use Plan.
� Establish street design criteria to the extent permitted by State law to support alternative transportation modes to better meet user needs and minimize con-flicts between competing modes.
Level of Service
2009GeneralDevelopentPlan
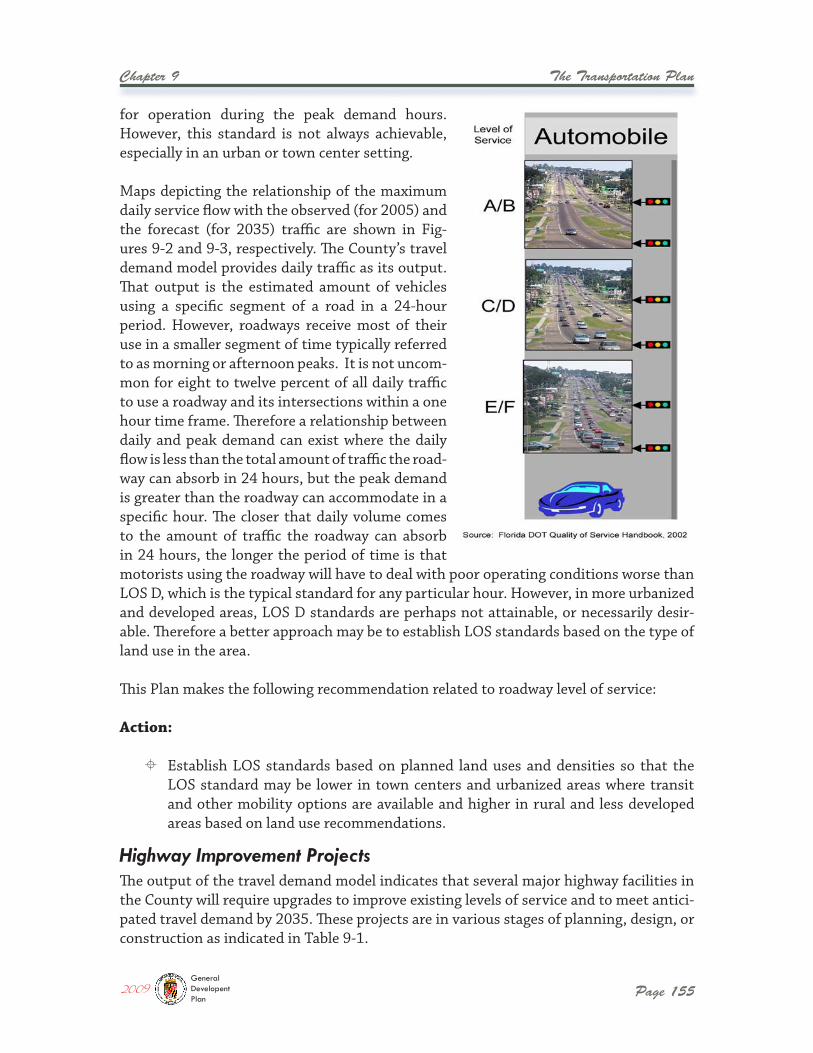
The Transportation Plan
Page 155
Chapter 9
for operation during the peak demand hours. However, this standard is not always achievable, especially in an urban or town center setting.
Maps depicting the relationship of the maximum daily service flow with the observed (for 2005) and the forecast (for 2035) traffic are shown in Fig-ures 9-2 and 9-3, respectively. The County’s travel demand model provides daily traffic as its output. That output is the estimated amount of vehicles using a specific segment of a road in a 24-hour period. However, roadways receive most of their use in a smaller segment of time typically referred to as morning or afternoon peaks. It is not uncom-mon for eight to twelve percent of all daily traffic to use a roadway and its intersections within a one hour time frame. Therefore a relationship between daily and peak demand can exist where the daily flow is less than the total amount of traffic the road-way can absorb in 24 hours, but the peak demand is greater than the roadway can accommodate in a specific hour. The closer that daily volume comes to the amount of traffic the roadway can absorb in 24 hours, the longer the period of time is that motorists using the roadway will have to deal with poor operating conditions worse than LOS D, which is the typical standard for any particular hour. However, in more urbanized and developed areas, LOS D standards are perhaps not attainable, or necessarily desir-able. Therefore a better approach may be to establish LOS standards based on the type of land use in the area.
This Plan makes the following recommendation related to roadway level of service:
Action:
� Establish LOS standards based on planned land uses and densities so that the LOS standard may be lower in town centers and urbanized areas where transit and other mobility options are available and higher in rural and less developed areas based on land use recommendations.
The output of the travel demand model indicates that several major highway facilities in the County will require upgrades to improve existing levels of service and to meet antici-pated travel demand by 2035. These projects are in various stages of planning, design, or construction as indicated in Table 9-1.
Highway Improvement Projects
2009GeneralDevelopentPlan
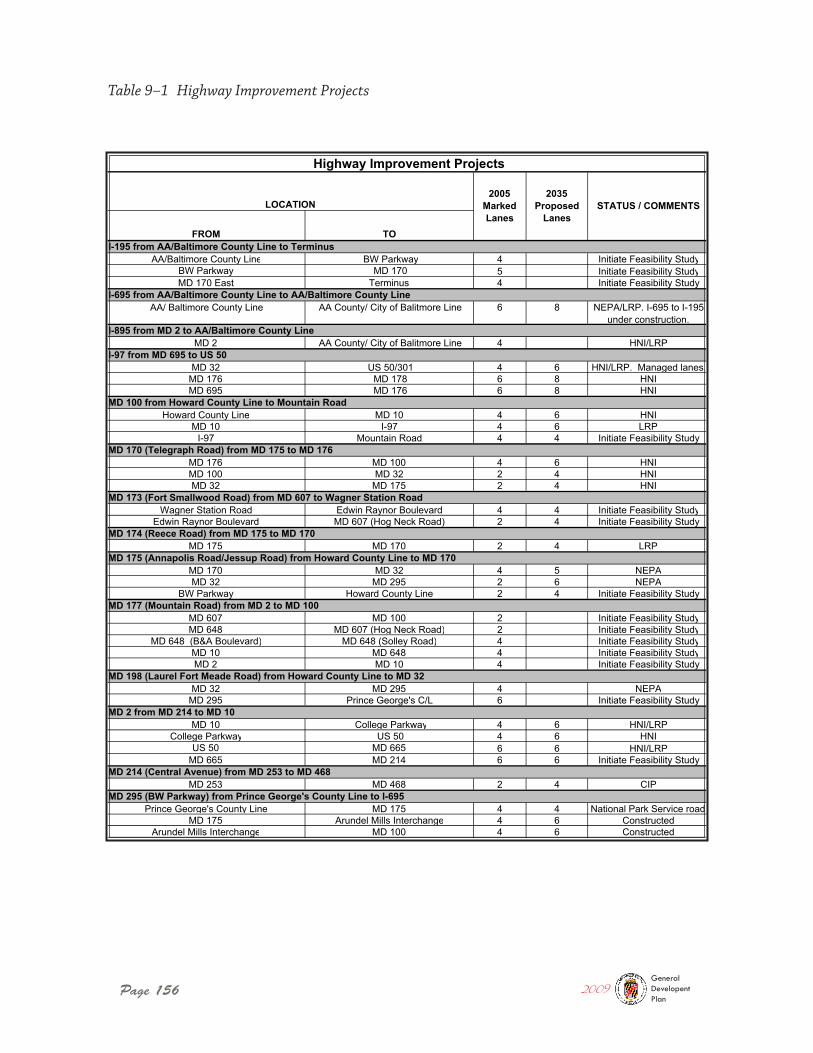
Page 156
FROM TO
AA/Baltimore County Line BW Parkway 4 Initiate Feasibility StudyBW Parkway MD 170 5 Initiate Feasibility StudyMD 170 East Terminus 4 Initiate Feasibility Study
AA/ Baltimore County Line AA County/ City of Balitmore Line 6 8 NEPA/LRP. I-695 to I-195 under construction.
MD 2 AA County/ City of Balitmore Line 4 HNI/LRP
MD 32 US 50/301 4 6 HNI/LRP. Managed lanes.MD 176 MD 178 6 8 HNIMD 695 MD 176 6 8 HNI
Howard County Line MD 10 4 6 HNIMD 10 I-97 4 6 LRP
I-97 Mountain Road 4 4 Initiate Feasibility Study
MD 176 MD 100 4 6 HNIMD 100 MD 32 2 4 HNIMD 32 MD 175 2 4 HNI
Wagner Station Road Edwin Raynor Boulevard 4 4 Initiate Feasibility StudyEdwin Raynor Boulevard MD 607 (Hog Neck Road) 2 4 Initiate Feasibility Study
MD 175 MD 170 2 4 LRP
MD 170 MD 32 4 5 NEPAMD 32 MD 295 2 6 NEPA
BW Parkway Howard County Line 2 4 Initiate Feasibility Study
MD 607 MD 100 2 Initiate Feasibility StudyMD 648 MD 607 (Hog Neck Road) 2 Initiate Feasibility Study
MD 648 (B&A Boulevard) MD 648 (Solley Road) 4 Initiate Feasibility StudyMD 10 MD 648 4 Initiate Feasibility StudyMD 2 MD 10 4 Initiate Feasibility Study
MD 32 MD 295 4 NEPAMD 295 Prince George's C/L 6 Initiate Feasibility Study
MD 10 College Parkway 4 6 HNI/LRPCollege Parkway US 50 4 6 HNI
US 50 MD 665 6 6 HNI/LRPMD 665 MD 214 6 6 Initiate Feasibility Study
MD 253 MD 468 2 4 CIP
Prince George's County Line MD 175 4 4 National Park Service road.MD 175 Arundel Mills Interchange 4 6 Constructed
Arundel Mills Interchange MD 100 4 6 Constructed
STATUS / COMMENTS2035
ProposedLanes
Highway Improvement ProjectsTable 9-1
LOCATION2005
MarkedLanes
MD 100 from Howard County Line to Mountain Road
MD 170 (Telegraph Road) from MD 175 to MD 176
MD 173 (Fort Smallwood Road) from MD 607 to Wagner Station Road
MD 174 (Reece Road) from MD 175 to MD 170
I-195 from AA/Baltimore County Line to Terminus
I-695 from AA/Baltimore County Line to AA/Baltimore County Line
I-895 from MD 2 to AA/Baltimore County Line
I-97 from MD 695 to US 50
MD 175 (Annapolis Road/Jessup Road) from Howard County Line to MD 170
MD 177 (Mountain Road) from MD 2 to MD 100
MD 198 (Laurel Fort Meade Road) from Howard County Line to MD 32
MD 2 from MD 214 to MD 10
MD 214 (Central Avenue) from MD 253 to MD 468
MD 295 (BW Parkway) from Prince George's County Line to I-695
Table 9-1 Highway Improvement ProjectsPHIC Table Page 1 of 2
Table 9–1 Highway Improvement Projects
2009GeneralDevelopentPlan
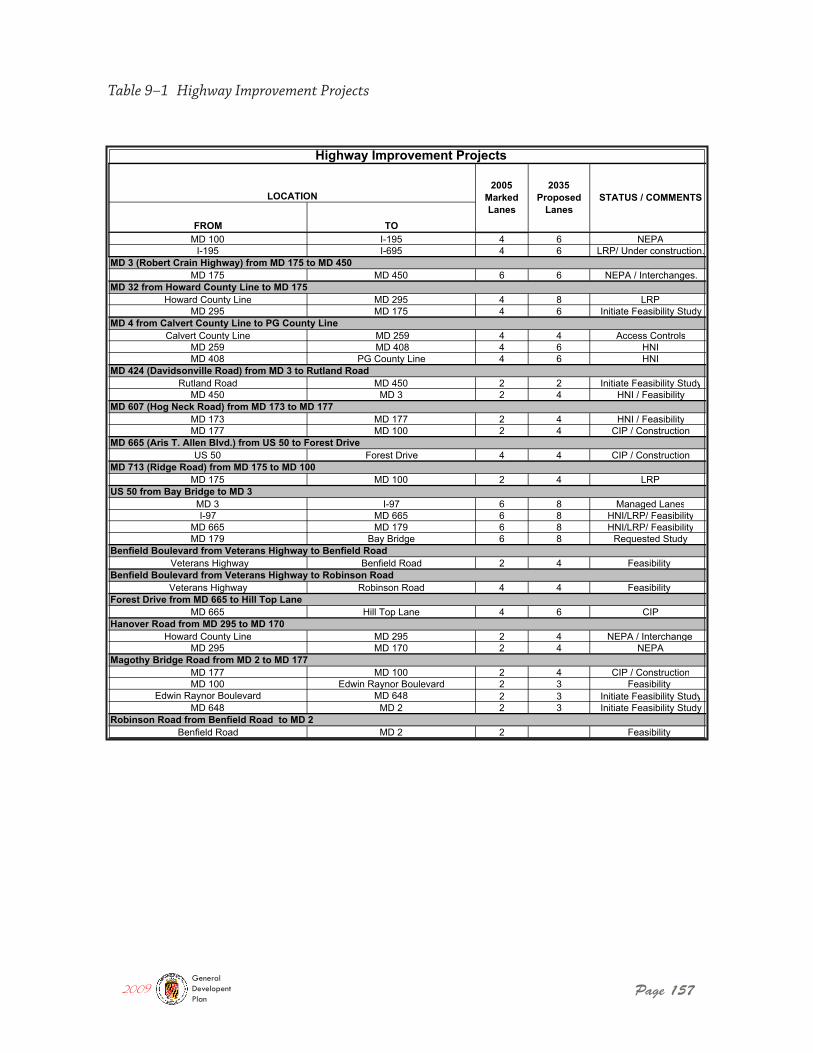
Page 157
FROM TO
STATUS / COMMENTS2035
ProposedLanes
Highway Improvement ProjectsTable 9-1
LOCATION2005
MarkedLanes
MD 100 I-195 4 6 NEPAI-195 I-695 4 6 LRP/ Under construction.
MD 175 MD 450 6 6 NEPA / Interchanges.
Howard County Line MD 295 4 8 LRPMD 295 MD 175 4 6 Initiate Feasibility Study
Calvert County Line MD 259 4 4 Access ControlsMD 259 MD 408 4 6 HNIMD 408 PG County Line 4 6 HNI
Rutland Road MD 450 2 2 Initiate Feasibility StudyMD 450 MD 3 2 4 HNI / Feasibility
MD 173 MD 177 2 4 HNI / FeasibilityMD 177 MD 100 2 4 CIP / Construction
US 50 Forest Drive 4 4 CIP / Construction
MD 175 MD 100 2 4 LRP
MD 3 I-97 6 8 Managed LanesI-97 MD 665 6 8 HNI/LRP/ Feasibility
MD 665 MD 179 6 8 HNI/LRP/ FeasibilityMD 179 Bay Bridge 6 8 Requested Study
Veterans Highway Benfield Road 2 4 Feasibility
Veterans Highway Robinson Road 4 4 Feasibility
MD 665 Hill Top Lane 4 6 CIP
Howard County Line MD 295 2 4 NEPA / InterchangeMD 295 MD 170 2 4 NEPA
MD 177 MD 100 2 4 CIP / ConstructionMD 100 Edwin Raynor Boulevard 2 3 Feasibility
Edwin Raynor Boulevard MD 648 2 3 Initiate Feasibility StudyMD 648 MD 2 2 3 Initiate Feasibility Study
Benfield Road MD 2 2 Feasibility
MD 713 (Ridge Road) from MD 175 to MD 100
US 50 from Bay Bridge to MD 3
MD 3 (Robert Crain Highway) from MD 175 to MD 450
MD 32 from Howard County Line to MD 175
MD 4 from Calvert County Line to PG County Line
MD 424 (Davidsonville Road) from MD 3 to Rutland Road
MD 607 (Hog Neck Road) from MD 173 to MD 177
MD 665 (Aris T. Allen Blvd.) from US 50 to Forest Drive
Magothy Bridge Road from MD 2 to MD 177
Robinson Road from Benfield Road to MD 2
Benfield Boulevard from Veterans Highway to Benfield Road
Benfield Boulevard from Veterans Highway to Robinson Road
Forest Drive from MD 665 to Hill Top Lane
Hanover Road from MD 295 to MD 170
Table 9-1 Highway Improvement ProjectsPHIC Table Page 2 of 2
Table 9–1 Highway Improvement Projects
2009GeneralDevelopentPlan
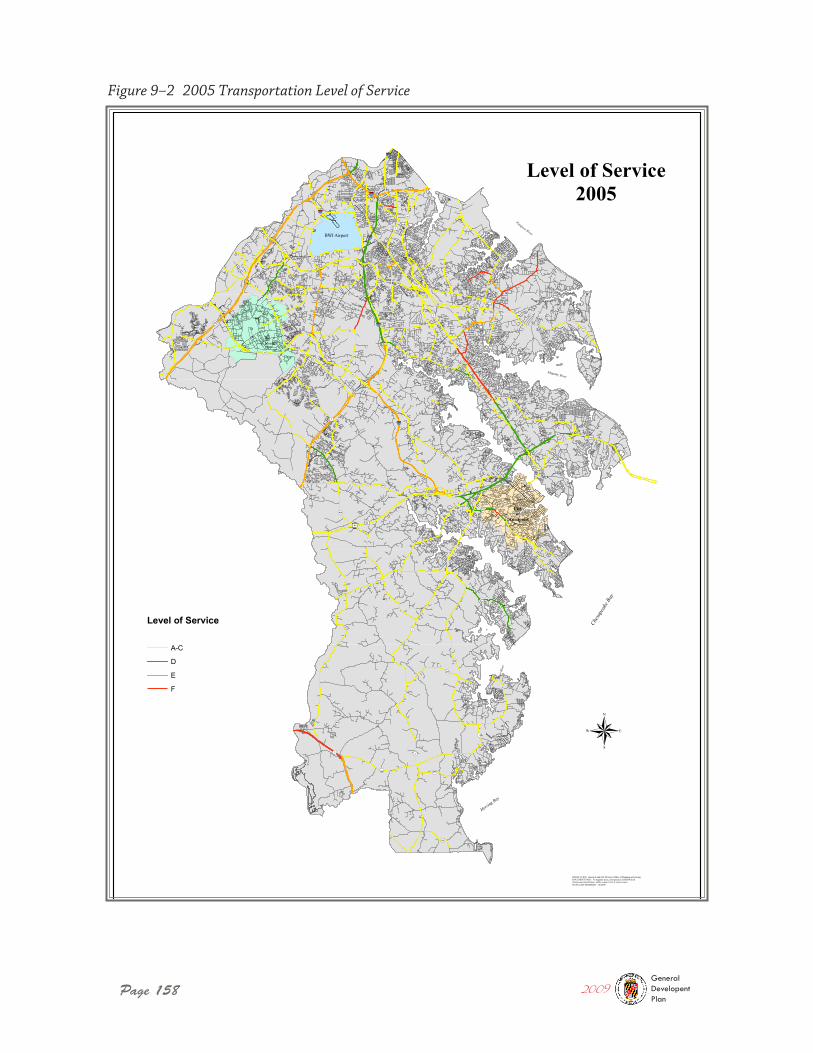
Page 158
Figure 9–2 2005 Transportation Level of Service
2009GeneralDevelopentPlan
!(!(
!(
!(
!(
!(
!(
£¤£¤
!(
!(
!(
!(
!(
!( !(
!(
!(
!(
§̈¦
§̈¦
!(
!(
!(
!(
£¤£¤
§̈¦
§̈¦
§̈¦
§̈¦
!(
!(
!(
!(
!(
!(
!(
!(
!(
!(
!(
!(
!(
!(
!(
BWI Airport
City of
Annapolis
256
258
4
2
10
2
2
3
2
2
255
256
424
30150
30150
261
408
468
214
450
665
450
178
97
450
175
32
177
97
32
176
97
100
214
295
177
100
100
170
170
295
195
695
895
®
PRODUCTION: Research and GIS Division, Office of Planning and ZoningDOCUMENT PATH: N:\mapdata\mass_trans\projects\LOS2005.mxd(Functional classification, traffic counts, level of service base)DATA LAST MODIFIED: 02/2008
Magothy River
Severn River
South River
Rhode River
Wes
t Riv
er
Herring Bay
Ches
apea
ke B
ay
Patapsco River
Level of Service
A-C
D
E
F
Figure 3Level of Service
2005
Ft. Meade
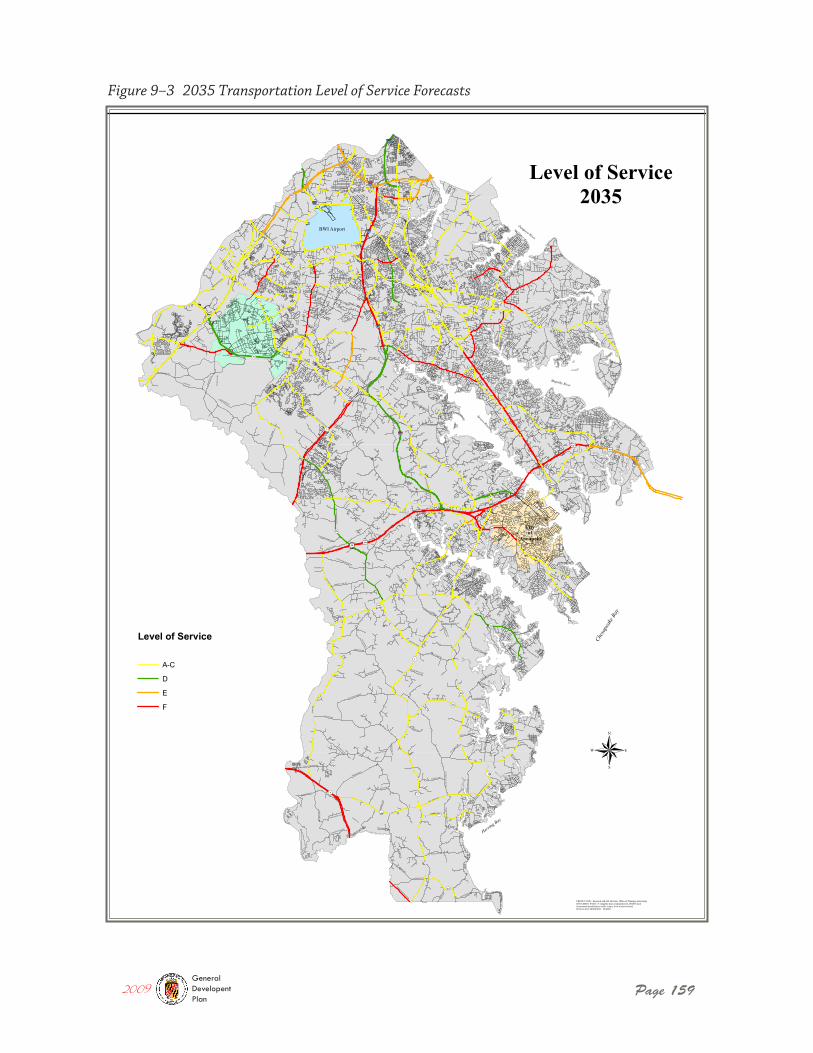
Page 159
Figure 9–3 2035 Transportation Level of Service Forecasts
2009GeneralDevelopentPlan
!(!(
!(
!(
!(
!(
!(
£¤£¤
!(
!(
!(
!(
!(
!( !(
!(
!(
!(
§̈¦
§̈¦
!(
!(
!(
!(
£¤£¤
§̈¦
§̈¦
§̈¦
§̈¦
!(
!(
!(
!(
!(
!(
!(
!(
!(
!(
!(
!(
!(
!(
!(
AM
TRA
K
SOLO
MONS I
SLAND R
D
SAN
DS
RD
GENERALS HWY
BAY FRONT RD
MUD
DY C
REEK
RD
BAYARD RD
RIV
A R
D
SOUTH RD
ZION MARLBORO RD
PATUXENT RIVER RD
GOVERNOR BRIDGE RD
WIL
DLI
FE L
P
DA
VID
SON
VILLE R
D
COLLEGE PKWY
HARWOOD RD
DICUS MILL RD
BIRDSVILLE RD
GA
MBR
ILLS
RD
GREENOCK RD
PIND
ELL RD
ROSSBACK RD
OWENSVILLE RD
DEALE RD
CRO
WN
SVIL
LE R
D
FRIENDSHIP RD
FAIRHAVEN RD
ED PROUT RD
NEW CUT RD
WILSON RD
ANDOVER RD
WRIGHTON RD
LAKE
SHORE
DR
BRA
GER
S RD
FRA
NK
LIN G
IBSON
RD
LITTLE RD
WAUGH CHAPEL RD
JOYCE L
N
SANSBURY RD
CHESTERFIELD RD
QUAR
TERF
IELD
RD
PATUXENT RD
CUMBERSTONE RD
DEALE
CHURCHTON R
D
BESTGATE RD
RIDG
E RD
BYW
ATE
R R
D
MILL SWAMP RD
SHADY L
N
PASCAL BLVD
BROCK BRIDGE RD
LAKE DR
WAYSO
N RD
DOUBLE GATE RD
SUNRISE BEACH RD
TELE
GR
APH
RD
NUTWELL RD
SWA
MP
CIR
CLE
RD
CECI
L A
V
POLLING HOUSE RD
BAY
HEA
D R
D
HAWKINS RD
TALBOT LN
NU
TWELL SU
DLEY
RD
BRICK CHURCH RD
EAG
LE H
ILL
RD
JENNIFER RD
OLD HERALD HARBOR RD
LOG
INN
RD
CONTEES WHARF RD
HOG FARM RD
FISHERS STATION RD
BAYFIELD RD
GRAYS RD
LANKFORD RD
PROU
T RD
THOMPSON AV
DENT RD
LOWER PINDELL RD
OCEANIC RD
CHA
LK P
OIN
T R
D
MILLERSVILLE RD
EVER
GRE
EN R
D
HERALD HARBOR RD
HANOVER RD
RIVER CLUBHOUSE RD
LYNCH DR
STEP LN
CHESAPEAKE BEACH RD
BEARDS POINT RD
GREENBRIAR L
N
SWEETGUM LN
UPPER PINDELL RD
OLD SUDLEY RD
MCKENDREE RD
COLB
ERT
RD
SWITCHBOARD RD
F ST
WEST RIVER RD
BROADWATER RD
GALESVILLE RD
HA
RD
ESTY RDDODEN RD
CARRS WHARF RD
GLEN OBAN DR
ARUNDEL DR
JOH
NS LN
TRANSMITTER BASE RD
RID
OU
T LN
EAST
AV
CRA
ND
ELL
RD
LAKE AV
BOULTERS WY
FARMHOUSE LN
MARYS MOUNT RD
DERBY FARMS DR
MELBOURNE AV
OLD OAK RD
POPLAR RD
MO
RELA
ND
LN
PARK L
N
HIGHVIEW RD
HOLLY LANDING RD
MURRAY RD
STO
NIN
GTO
N D
R
SUNSHINE AV
OLD
DEA
LE RD
NIEMAN RD
LOST CREEK BLVD
CHICKAMAUGA DR
ELM RD
PATUXENT RD
BRO
CK B
RIDG
E RD
MA
RLE
Y N
ECK
BLV
D
BWI Airport
City of
Annapolis
256
258
4
2
10
2
2
3
2
2
255
256
424
30150
301
50
261
408
468
214
450
665
450
178
97
450
175
32
177
97
32
176
97
100
214
295
177
100
100
170
170
295
195
695
895
®
PRODUCTION: Research and GIS Division, Office of Planning and ZoningDOCUMENT PATH: N:\mapdata\mass_trans\projects\LOS2035.mxd(Functional classification, traffic counts, level of service base)DATA LAST MODIFIED: 02/2008
Magothy River
Severn River
South River
Rhode River
Wes
t Riv
er
Herring Bay
Ches
apea
ke B
ay
Patapsco River
Level of Service
A-C
D
E
F
Figure 4Level of Service
2035
Page 160
Chapter 9 The Transportation Plan
Transit in the County is provided by both fixed guideway (rail) and by bus transit. Bus transit is provided both in terms of State operated commuter and fixed route transit by the Maryland Transit Administration (MTA) and locally operated transit systems provided by the City of Annapolis Transit (AT) and by the Corridor Transportation Corporation (CTC). Both AT and CTC receive operating subsidies from the County to offset the cost of providing routes within County areas. The County is preparing a Transit Development Plan (TDP) which is required by MTA for transit funding purposes. The TDP will identify areas underserved in the County and recommend priorities to deliver transit service.
The long term intent is to combine management of the fixed route County-operated ser-vices with the demand-response and specialized transit operated by the Department of Aging and Disabilities. This action will improve the coordination of services and reduce duplication of effort.
Equally important in providing transit services are the landside support elements of transit. Among those are transit-oriented development opportunity areas, intermodal centers, sidewalks, lighting, bus passenger shelters, and park and ride lots.
In general, projects on major highway facilities are identified through analysis and pro-grammed for construction through three stages in State methods:
� Consolidated Transportation Program (CTP) which is the State of Maryland’s capital budget document identifying all funds to be expended (Federal, State, local and other) on State-owned facilities. The document has a six-year horizon.
� The Long Range Plan (LRP) which identifies projects arrayed over a longer span of time, and although funds are not presently identified for all phases of project development (planning, design, right-of-way acquisition and construction) there is a reasonable assumption that these activities will occur over the 30-year span.
� The Highway Needs Inventory (HNI) which is limited to highway facilities for which there is an assumed need to plan, design and construct improvements over a longer span of time beyond known funding
Projects are typically noted in the Highway Needs Inventory, moved into the Long Range Plan as funding becomes reasonable to assume, and finally identified in the Consolidated Transportation Program when funding becomes available. Once a project has been funded, an environmental impact study is typically required during the preliminary design stages in accordance with the National Environmental Policy Act (NEPA).
In addition to the State process, the County has funded State facilities either in total or in part using impact fees, general obligation bonds, taxing districts and other forms of revenue generation. Those projects appear in the County’s Capital Improvement Program (CIP).
Transit Service
2009GeneralDevelopentPlan
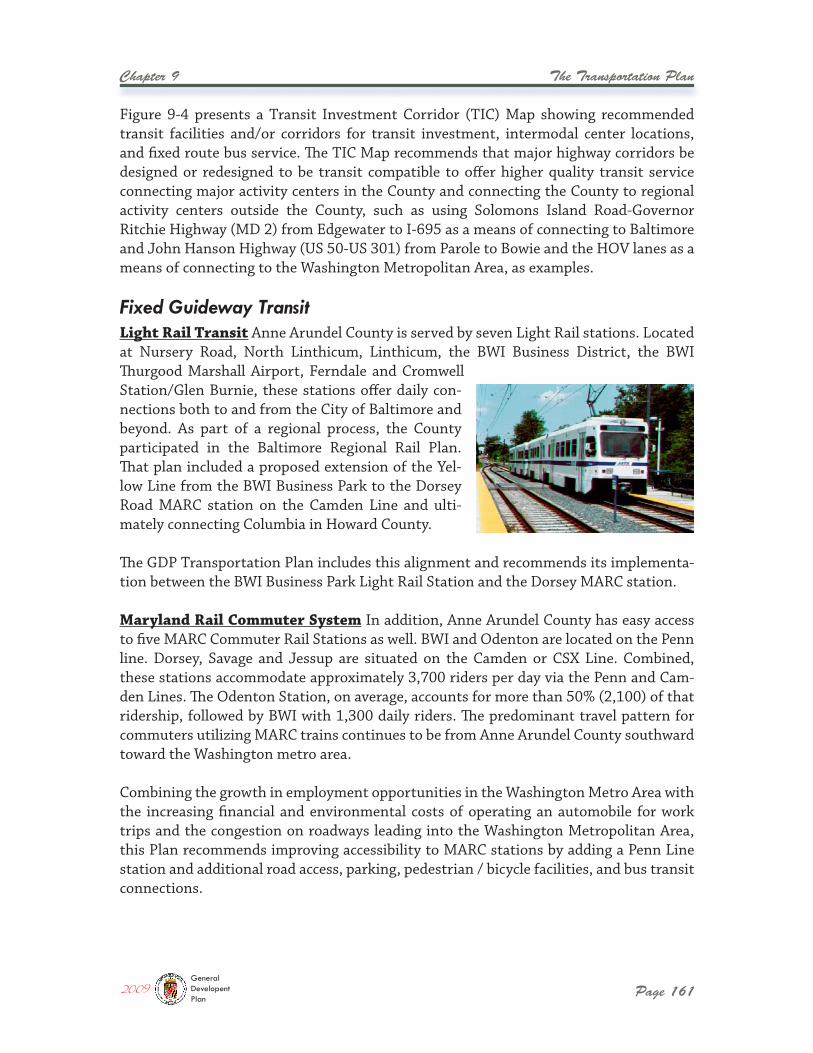
The Transportation Plan
Page 161
Chapter 9
Light Rail Transit Anne Arundel County is served by seven Light Rail stations. Located at Nursery Road, North Linthicum, Linthicum, the BWI Business District, the BWI Thurgood Marshall Airport, Ferndale and Cromwell Station/Glen Burnie, these stations offer daily con-nections both to and from the City of Baltimore and beyond. As part of a regional process, the County participated in the Baltimore Regional Rail Plan. That plan included a proposed extension of the Yel-low Line from the BWI Business Park to the Dorsey Road MARC station on the Camden Line and ulti-mately connecting Columbia in Howard County.
The GDP Transportation Plan includes this alignment and recommends its implementa-tion between the BWI Business Park Light Rail Station and the Dorsey MARC station.
Maryland Rail Commuter System In addition, Anne Arundel County has easy access to five MARC Commuter Rail Stations as well. BWI and Odenton are located on the Penn line. Dorsey, Savage and Jessup are situated on the Camden or CSX Line. Combined, these stations accommodate approximately 3,700 riders per day via the Penn and Cam-den Lines. The Odenton Station, on average, accounts for more than 50% (2,100) of that ridership, followed by BWI with 1,300 daily riders. The predominant travel pattern for commuters utilizing MARC trains continues to be from Anne Arundel County southward toward the Washington metro area.
Combining the growth in employment opportunities in the Washington Metro Area with the increasing financial and environmental costs of operating an automobile for work trips and the congestion on roadways leading into the Washington Metropolitan Area, this Plan recommends improving accessibility to MARC stations by adding a Penn Line station and additional road access, parking, pedestrian / bicycle facilities, and bus transit connections.
Figure 9-4 presents a Transit Investment Corridor (TIC) Map showing recommended transit facilities and/or corridors for transit investment, intermodal center locations, and fixed route bus service. The TIC Map recommends that major highway corridors be designed or redesigned to be transit compatible to offer higher quality transit service connecting major activity centers in the County and connecting the County to regional activity centers outside the County, such as using Solomons Island Road-Governor Ritchie Highway (MD 2) from Edgewater to I-695 as a means of connecting to Baltimore and John Hanson Highway (US 50-US 301) from Parole to Bowie and the HOV lanes as a means of connecting to the Washington Metropolitan Area, as examples.
Fixed Guideway Transit
2009GeneralDevelopentPlan
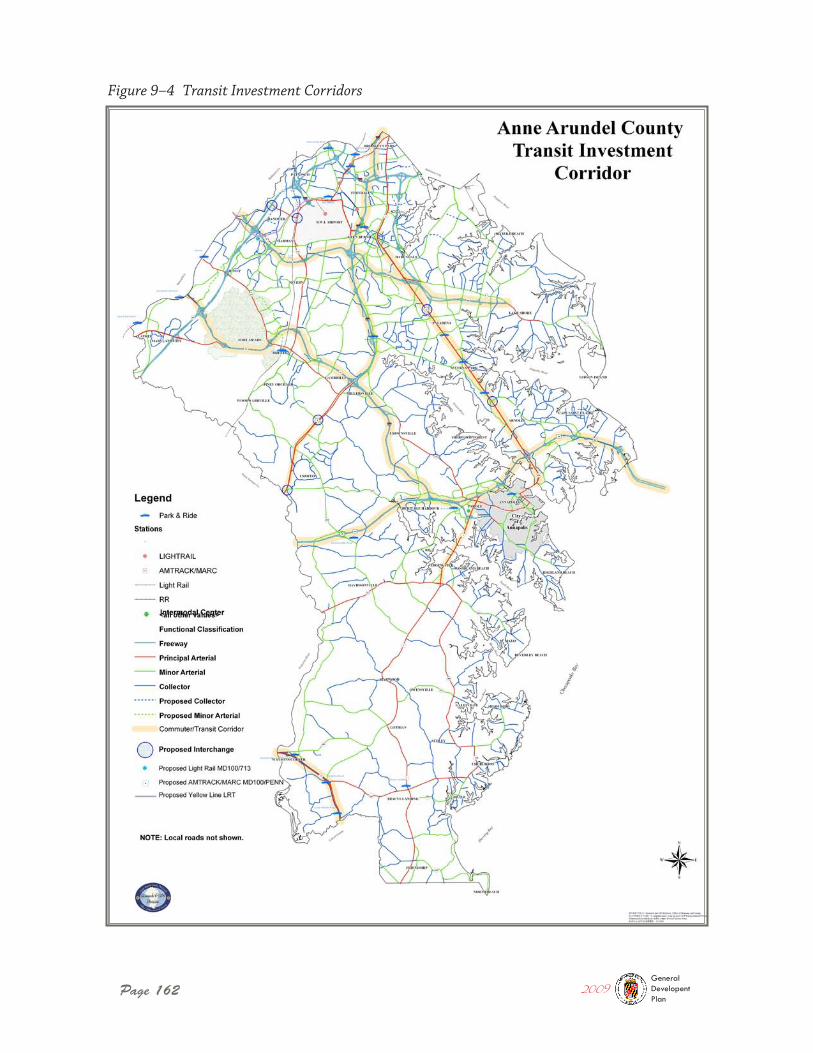
Page 162
Figure 9–4 Transit Investment Corridors
2009GeneralDevelopentPlan
The Transportation Plan
Page 163
Chapter 9
Anne Arundel County is served by various operators and different styles of bus transit service. Among these are traditional fixed route service to Baltimore, commuter bus ser-vices connecting to Washington, D.C. and the WMATA Metrorail System, and community based smaller fixed route services provided by Annapolis Transit and by Corridor Trans-portation Corporation’s Connect-A-Ride (CAR) service offering neighborhoods access to transit via smaller buses.
The County’s vision is to tailor transit services to the areas they serve and to augment the services provided by MTA with circular routes connecting neighborhoods with desired employment, transit, and activity centers. The vision in South County is to offer demand-response style services to provide mobility to those persons residing in areas where traditional transit would be cost prohibitive.
Maryland Transit Administration Presently, MTA operates three commuter weekday only bus routes (921, 922 and 950) between Anne Arundel County and the Washington metro area. Originating on Kent Island and in Annapolis, these three routes alone cur-rently accommodate nearly 2,400 passengers per day, the majority of which board at the Harry S. Truman Park & Ride. The MTA 14 bus route offers service extending from the Patapsco Light Rail Station to the City of Annapolis, concentrating mainly on the MD 2 corridor. Likewise, the MTA 17 bus route serves as a connection between the BWI Busi-ness District and the Arundel Mills Complex. Both the 14 and 17 routes offer service seven days a week.
Corridor Transportation Corporation (CTC) Connect-A-Ride CTC provides transit service to Laurel, Jessup, Maryland City, Arundel Mills, Odenton, Glen Burnie, Pioneer City, and Seven Oaks in the western portion of the county, as well as Edgewater, South River Colony, Shadyside and Deale to the south. CTC operations costs are covered through a combination of Federal, State and County grants, plus revenue generated from passenger ticket sales. Routes operated by CTC under its Connect-A-Ride services link the County with Prince George’s, Montgomery and Howard Counties. Since capital assets of transit (such as garages and vehicles) are not owned by the County, the cost of operating these routes is increasing in direct correlation with the depreciation costs of assets owned by CTC’s operator. Those cost increases do not reflect the increased cost of fuel, insurance or labor costs, which account for nearly 80% of the hourly cost to provide transit service.
Annapolis Transit Annapolis Transit (AT) services the greater Annapolis area (includ-ing Arnold and Edgewater) as well as the BWI Thurgood Marshall International Airport. The system consists of three (3) shuttle routes and one fixed route system comprised of eleven (11) individual routes. Ridership equates to over 1.3 million passengers annually. AT funding comes from a combination of Federal, State and local sources, as well as an operating subsidy grant provided by the County. Census statistics and definitions used by the U.S. Department of Transportation have recently changed, resulting in the City
Bus Transit
2009GeneralDevelopentPlan
Page 164
Chapter 9 The Transportation Plan
of Annapolis losing a significant percentage of operating subsidy funds previously made available because of its status as a small, urbanized area. The loss of this funding will most likely impact the extent of service AT is able to provide in the future.
Since the County remains a mostly suburban area with established residential and commercial activity centers, bus transit will remain the major opportunity to improve mobility choices for residents and workers because of its cost to initiate and operate ,and its flexibility.
This Plan recommends implementing the recommendations for bus transit found in the Transit Development Plan and providing the landside infrastructure (such as sidewalks, street lighting, bicycle racks, park and ride lots, and pedes-trian safety improvements) which are necessary to promote transit use. The Transit Development Plan Map is shown in Figure 9-5.
This Plan recommends consolidating transit activities under a single agency to promote coordination of services and reduce confusion among existing and potential users of the mode. It is also recommended that the County obtain the capital assets necessary to operate fixed route and demand-response bus transit. These assets would consist of bus vehicles, radio equipment, computer aided dispatch equipment, automatic vehicle location devices, and a maintenance facility combined with Howard Transit so that the County can eliminate hourly depreciation expenses currently being paid to its contrac-tors. Eliminating these hourly costs will increase the dollars available to provide transit service as recommended by the Transit Development Plan.
The Plan also recommends facilitating development in the vicinity of existing and planned transit nodes through improved access; focusing growth in areas served by existing or planned transit including rail stations and intermodal locations; encouraging improved access, increasing parking availability, and feeder bus service between rail stations and employment areas; and promoting development and revitalization areas that are in scale with the transit provided.
In addition, the Plan recommends the completion of a MARC station feasibility study in the vicinity of MD 100 along the Penn Line to promote the location of a new station where additional access to the line would be possible through park and ride, connecting bus transit, trails, and transit oriented land use activities.
In summary, this Plan makes the following recommendations related to transit service:
Bus transit provides a major opportunity to improve mobility
choices for residents and workers.
2009GeneralDevelopentPlan
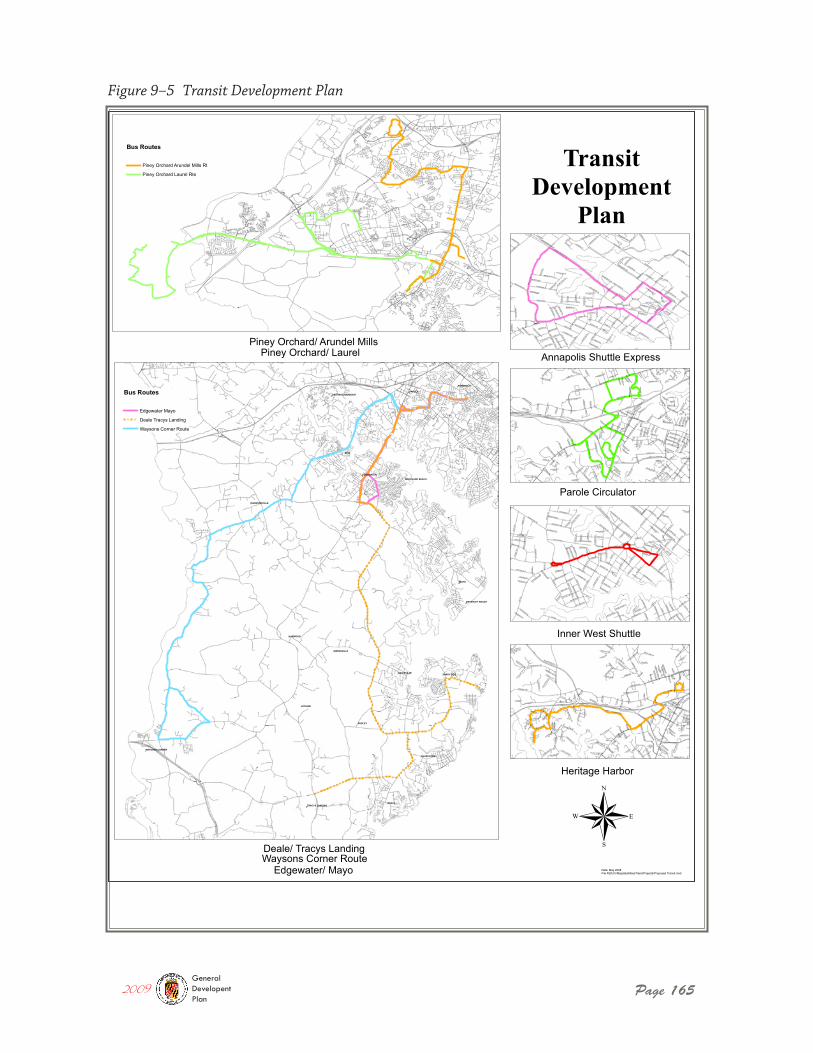
Page 165
Figure 9–5 Transit Development Plan
2009GeneralDevelopentPlan
!(
!(
!(
!(
!(
!(
!(
!(
!(
!(
!(
!(
!(
!(!(
!(
!(
!(
MAYO
RIVA
DEALE
PAROLE
SUDLEY
HARWOOD
LOTHIAN
ANNAPOLIS
CHURCHTON
EDGEWATER
SHADY SIDEGALESVILLE
OWENSVILLE
DAVIDSONVILLE
WAYSONS CORNER
TRACYS LANDING
BEVERLEY BEACH
WOODLAND BEACH
HERITAGE HARBOUR
4
2
2
2
255
256
424
301
50
256
408
258
468
214
665
450
450
214
Piney Orchard/ Arundel Mills
Deale/ Tracys Landing ®
Figure 5Transit
DevelopmentPlan
Date: May 2008File Path:N:\Mapdata\MassTrans\Projects\Proposed Transit.mxd
WEST ST
KING GEORGE ST
TAY
LOR
AV
E
CLAY ST
ROSCOE ROWE BLVD
MAIN ST
POPLAR AVEEAST ST
BOWYER RD
FRAN
KLIN
ST
SOUTHGATE AVE
COLLEGE AVE MARYLAND AVE
SHAW ST
LA F
AYETT
E AVE
DECATUR RD
MCNAIR RD
PRINCE GEORGE ST
SOUTH
ST
NORTHWEST ST
CONDUIT ST
GENESSEE ST
CALVERT S
T
CATHEDRAL ST
ANNAPOLIS ST
STEELE AVE
MELROSE ST
DUKE OF GLOUCESTER ST
CHASE ST
CO
MP
RO
MIS
E S
T
UPSHUR RD
MURRAY AVE
HANOVER ST
FARRAGUT R
D
MO
NTICELLO AVE
RAMSEY RD
GLENWOOD ST
PORTER RD
MARKET ST
FORBES ST
SANTEE RD
CHARLES S
T
BLADEN ST
BLAKE RD
BOUNDARY RD
SHIPWRIGHT ST
DORSEY RD
SAINT JOHNS ST
SIMS RD
JUNIPER ST
DEAN S
T
FLEET ST
AMO
S GAR
RETT BLVD
NEWMAN ST
SMITH AVE
GREEN ST
STEWART AVE
CEDAR PARK RD
PINKNEY ST
CORNHILL ST
COLONIA
L AVE
COOPER RD
BR
EW
ER
AV
E
TULIP ST
CROMWELL WAY
MAD
ISON
PL
JEFFER
SON
PL
WAINW
RIGHT R
D
RANDALL ST
HILL ST
BAT
ES
ST
MUNROE CT
THO
MPSO
N ST
STATE CIR
ADAMS PARK RD
MORRIS ST
YEW STSCHLEY RD
ROSEDALE ST
TANEY AVE
STEHLE ST
CIT
Y G
ATE
LN
WOOD R
D
CRAIG S
T
ARC
HW
OO
D AVE
BUCHANAN RD
GRANVILLE AVE
LARKIN ST
ROGERS RD
PARKER RD
GERMAN ST
FRANCIS ST
ELLING
TON
AVE
RID
OU
T S
T
GORMAN ST
PLE
AS
AN
T S
T
CHESTON AVE
MIL
LER
RD
DOCK ST
WAGNER ST
ARCADE RD
WAT
ER
ST
OB
ER
Y S
T
GREENFIELD ST
BR
OW
N S
T
NO NAME
BLOOMSBURY SQ
BROOKE AVE
MAR
TIN ST
CHURCH CIR
ACTON PL
HARWOOD PL
SCHOOL ST
CONSTITUTION SQ
CARROLL S
T
SPA RDJOH
NS
ON
PL
MONUMENT ST
SHELTON AVE
CUMBERLAND CT
SOUTH
GAT
E CT
MARKET QUAY
OVERLOOK DR
ROSCOE ROWE BLVD
POPLAR AVE
BOUNDARY RD
SPA
RD
WEST ST
6TH ST
TAY
LOR
AV
E
CLAY ST
KING GEORGE ST
SPA DR
MAIN ST
GLE
N A
VE
FRAN
KLIN
ST
POPLAR AVE
CH
ASE ST
EAST ST
SOUTHGATE AVE
COLLEGE AV
E
SEVERN AVE
LA F
AYET
TE A
VE
MO
NTIC
ELLO AVE
MARYLAND A
VE
SOU
TH S
T
CEDAR PARK RD
5TH ST
SHAW ST
CALVERT
ST
STATE ST
CONDUIT S
T
PRINCE GEORGE ST
NORTHWEST ST
SPA VIEW AVE
POPLAR ST
CO
MP
RO
MIS
E S
T
CATHEDRAL ST
BOUCHER AVE
AMO
S GAR
RETT BLVD
GENESSEE ST
STEELE AVE
DUKE OF GLOUCESTER ST
MELROSE ST
HANOVER ST
MURRAY AVE
MARKET ST
CREEK DR
PORTER RD
SMITHVILLE ST
LIN
DE
N A
VE
SMITH AVE
CHARLES S
T
GLENWOOD ST
ARC
HW
OO
D AVE
BUR
NSID
E ST
BLADEN ST
ACADEMY ST
GRANADA AVE
BLAKE RD
MAPLE ST
ROSCOE ROWE BLVD
WO
OD
LAW
N A
VE
DEAN S
T
SHIPWRIGHT ST
BEECH ST
SAINT JOHNS ST
NO NAME
COOPER RD
FLEET ST
BR
EW
ER
AV
E
NEWMAN S
T
GREEN ST
SILOPANNA RD
CO
LON
IAL
AVE
WAS
HIN
GTO
N ST
BAT
ES
ST
MAD
ISON
PL
JEFFER
SON
PL
PINKNEY ST
STEWART AVE
RANDALL S
T
THO
MP
SON
ST
LOC
KWO
OD
CT
CORNHILL ST
ADAMS P
ARK RD
CIT
Y G
ATE
LN
HILL ST
PRESID
ENT S
T
STATE CIR
MUNROE CT
ADAM
S ST BAY RIDGE AVE
CENTRAL ST
BOUNDARY RD
MITCHELL ST
CRAIG S
T
MORRIS ST
TANEY AVE
BUCHANAN RD
ROSEDALE ST
RID
OU
T S
T
STEHLE ST
PLE
AS
AN
T S
T
ELLING
TON
AVE
MOSS HAVEN CT
LARKIN ST
FRANCIS ST
GERMAN ST
WAT
ER
ST
CONSTITUTION AVE
OB
ER
Y S
T
CHESTON AVE
GORMAN ST
BR
OW
N S
T
WAGNER S
T
DOCK ST
ARCADE RD
GREENFIELD ST
MAR
TIN ST
SANDS RDBLOOMSBURY SQ
ROSEMARY ST CARROLLTON AVE
SPA VIEW CIR
HARWOOD P
LACTON PL
CARROLL S
T
SCHOOL ST
JOH
NS
ON
PL
SPINDRIFT WAY
CHURCH CIR
MONUMENT ST
WALTON LN
SOU
THG
ATE
CT
CUMBERLAND CT
MARKET QUAY
POPLAR AVE
NO NAME
NO
NAM
E
LIN
DEN
AVE
BOUNDARY RD
NO
NAM
E
NO NAM
E
NO NAM
E
POPLAR AVE
US 50
WEST ST
I 97
RIVA RD
FOREST DR
ADMIRAL DR
JENNIFER RD
BESTGATE RD
HARRY S TRUMAN PKW
Y
ARIS T ALLEN BLVD
FAIRFAX RD
GENERALS HWY
CAR
DAM
ON
DR
HUDSON ST
TARRAGON LN
VIRGINIA ST
WO
MA
CK
DR
RIDGE RD
EAST END RD
BYWAT
ER RD
HOUSLEY RD
DREW ST
HIC
KS
AV
E
FENNEL RD
ME
DIC
AL
PK
WY
SAIL PL
MCGUCKIAN ST
CEDAR PARK RD
PAR
OLE
ST
LEG
ION
AVE
BELLE DR
DEFENSE HWY
OLD S
OLO
MO
NS IS
LAND R
D
NO
NAM
E
VALLEY RD
LURY
LN
WILELINOR DR
WILLOW
ST
COPELAND ST
OLD DUFF RD
DOMINOE RD
HALSEY RD
BRIS
TOL
DR
MARGARET AVE
LEE
ST
AD
MIR
AL C
OC
HR
AN
E D
R
GEORGE AVE
CINNAMO
N LN
NIMITZ DR
THYM
E DR
WIN
DE
LL A
VE
VINE
YARD
RD
HAR
KER
PL
POPLAR AVE
RIVA WAY
OLD ADMIRAL CT
CA
RV
ER
ST
GR
OSS
AVE
CROLL DR
LOUIS DR
DORSEY DR
WAYW
ARD DR
OA
K C
T
UNITY LN
DEFENSE ST
BU
NC
HE
ST
YAWL RD
SOLOMONS IS
LAND R
D
BOWMAN DR
PYTHIAN DR
MORELAND PKWY
CH
INQ
UAP
IN R
OU
ND
RD
LUB
RA
NO
DR
LINCOLN DR RIT
CH
IE L
N
GLENFIELD RD
FRED STAUFFER LN
SKIPPERS LN
ALTO
N L
N
GATE DR
CARVEL CIR
PAVILIO
N P
KW
Y
BAUSU
M R
D
S CHER
RY G
ROVE
AVE
CE
NTE
R S
T
KIR
BY
LN
FORE
ST P
LZ
HO
MEL
AND
AV
E
SOU
THW
OO
D A
VE
CATLYN PL
ASHLEY D
R
GIBRALT
ER ST
JUDSON P
L
BROAD CREEK DR
HE
AR
NE
CT
HOLIDAY CT
COYBAY DR
SP
RU
CE
LN
NEAL ST
NIC
HO
LS R
D
KING CT
TYDINGS DR
FISK CIR
LIN
K S
T
PARKER
DR
RENARD CT
TOW
ER P
L
HERNDON DR
VINCENT ST
BO
LLA
RD
RD
A A
ND
EA
GLE
BLV
D
COMMERCE RD
PETERS WAY
FOW
LER
S D
R
HEARNE RD
PINEWOOD ST
FOREMAST ALLEY
CAPTAIN CIR
SPUR
ALFRED CIR
GATEWAY VILLAGE DR
CORNELL AVE
CARAWAY CT
LINCOLN CT
WORDEN CT
N P
IND
ELL
AVE
NO NAME
NO
NAM
E
NO
NA
ME
US
50
I 97 US 50
VIN
EYA
RD
RD
NO
NAM
E
US 50
SOLO
MO
NS
ISLA
ND
RD
SO
UTH
WO
OD
AV
E
US 50
I 97
DEFENSE HWY
WEST ST
RIVA RD
GE
NER
ALS HW
Y
BESTGATE RD
PINEDALE DR
JENNIFER RD
CR
OW
NS
VIL
LE R
D
2ND ST
CHESTERFIELD RD
VALLEY RD
HARRY S TRUMAN PKWY
FOREST DR
CAR
DAM
ON
DR
WAYWARD DR
CO
OVE
R R
D
PINEWOOD DR
TARRAGON LN
SEVERN GROVE R
D
MASTLINE DR
WOM
ACK DR
AD
MIR
AL C
OC
HR
AN
E D
R
SEAN DR
RIDGE RD
1ST ST
EAST END RD
HOUSLEY RD
ARIS T ALLEN BLVD
FENNEL
RD
HUDSON ST
BON HAVEN DR
ME
DIC
AL
PK
WY
SA
IL P
L
POST OAK RD
KANSALA DR
COXSWAIN WAY
CORBIN PKWY WOODLORE RD
OLD S
OLO
MO
NS IS
LAND R
D
WILELINOR DR
NO
NAM
E
LUR
Y LN
WILLOW
ST
SONNE DR
FAIRFAX RD
OLD DUFF RD
EPPING FOREST R
D
SO
UTH
HAV
EN
RD
HALL BROWN RD
MARENGO ST
BOATSW
AIN W
AY
WOO
D LOT T
RAIL R
D
VIN
EYAR
D R
DSH
IPM
AS
TER
WAY
RU
DD
ER
WAY
MAC
KIEBE
TH C
T
RIVA WAY
EAMO
NS
WAY
CA
RV
ER
ST
B S
TG
OLFER
S R
IDG
E RD
DORSEY DR
BRAMLEIGH LN MO
NTIC
ELLO D
R
OA
K C
T
UNITY LN
CORBIN CT
DEFENSE ST
SCHOONER CIR
BU
NC
HE
ST
HIC
KS
AV
E
IND
US
TRIAL D
R
PYTHIAN DR
CO
MM
ER
CE PAR
K DR
MO
RA
N D
R
GLENFIELD RD
SOMERVILLE RD
FRED STAUFFER LN
1ST PL
ALTO
N L
N
GATE DR
PAVILIO
N P
KW
Y
ELM RD
BAUSU
M R
D
SHIVELY CT
JIGGER W
AY
GLENCREST LN
CH
APA
RR
ALL C
T
ASHLEY D
R
HARBERTS CT
JUDSON P
L
BROAD CREEK DR
HE
AR
NE
CT
HOLIDAY CT
SP
RU
CE
LN
RIG
GIN
G D
R
NIC
HO
LS R
D
TYDINGS DR
TROUT RD
LIN
K S
T
LAB
RO
TT LN
TOW
ER P
L
TUD
O C
T
BO
LLA
RD
RD
BERMUDA CT
ASTERN WAY
RESEAR
CH
DR
CLOVE LN
FOW
LER
S D
R
MA
RC
ON
I AV
E
MORAN CT
HEARNE RD
PINEWOOD STBEACO
N W
AY
SPUR
GATEWAY VILLAGE DR
SILKWOOD CT
WOODS DR
CO
MPA
SS
DR
NO
NAM
E
US 50
NO NAME
NO NAM
E
NO NAME
NO
NAM
ENO N
AME
NO
NA
ME
Parole Circulator
Inner West Shuttle
Heritage Harbor
Annapolis Shuttle Express
Waysons Corner RouteEdgewater/ Mayo
Piney Orchard/ Laurel
Bus Routes
Piney Orchard Arundel Mills Rt
Piney Orchard Laurel Rte
Bus Routes
Edgewater Mayo
Deale Tracys Landing
Waysons Corner Route
Page 166
Chapter 9 The Transportation Plan
Actions:
� Combine management of fixed route County-operated services with the fixed route, demand-response and specialized transit operated by the Department of Aging and Disabilities.
� Extend the Baltimore Light Rail Yellow Line from the BWI Business Park Station to the Dorsey MARC Station.
� Improve accessibility to MARC stations by adding a Penn Line station, road access, parking, pedestrian/bicycle facilities, and bus transit connections.
� Implement the recommendations for bus transit found in the Transit Development Plan and provide the landside infrastructure (sidewalks, street lighting, bicycle racks, park and ride lots, and pedestrian safety improvements) necessary to promote tran-sit use.
� Consolidate transit activities under a single agency to promote coordination of ser-vices and reduce confusion among existing and potential users.
� Obtain the capital assets necessary to operate fixed route and demand-response bus transit. Sources could be impact fees, utility fees, and bonds.
� Evaluate possible revisions to the impact fee regulations to allow the fees to be used for transit-related projects.
� Facilitate development in the vicinity of existing and planned transit nodes through improved access; focusing growth in areas served by existing or planned transit; encouraging improved access, increasing parking availability, and providing feeder bus service between rail stations and employment areas; and promoting development and revitalization areas that are in scale with the transit provided.
� Identify and, to the extent feasible by law, protect the alignment of the Yellow Line of the Baltimore Central Light Rail Line from BWI Airport to the Dorsey MARC Station.
� Complete a MARC station feasibility study in the vicinity of MD 100 along the Penn Line to promote the location of a new station where additional access to the line would be possible.
With more than 500,000 citizens and over 12,800 employers, Anne Arundel County has one of the state’s largest work forces. Subsequently, the County is constantly experienc-ing an increase in travel demand, leading to congestion of both the highway and transit network if the demand is not effectively managed. An estimated 112,000 county residents commuting outside of the County for work, combined with 144,000 in-county commuters and an influx of 82,000 commuters from neighboring jurisdictions put a constant strain on county infrastructure. To relieve this strain, the County uses two private concerns
Rideshare Car and Van Pooling
2009GeneralDevelopentPlan
The Transportation Plan
Page 167
Chapter 9
There are two publicly –owned airports located in the County providing regional, national, and international air service.
Accommodating over 21 million passengers annually, this is the largest airport in the State. Owned by the State of Maryland and operated by the Maryland Aviation Admin-istration (MAA) the airport is located in Linthicum, approximately 10 miles south of
In cooperation with both the Maryland Transit Administration (MTA) and the County, ARTMA manages a comprehensive ridesharing program for residents of Anne Arundel County. The mission is to promote transportation options and transit expansion through-out the County while increasing mobility, reducing traffic congestion, and improving air quality as well. The service areas include Annapolis, Parole, Severna Park, Crofton, Crownsville and the entire South County area.
Similar to ARTMA, BWIP promotes ridesharing, carpooling and point-to-point van service via Congestion Mitigation/ Air Quality (CMAQ) funding both in and around BWI- Thurgood Marshall International Airport, as well as the Odenton and Glen Burnie Town Centers.
In order to meet the demands for commuter transportation programs and services brought on by increasing residential and commercial development, this Plan recommends the following actions:
Actions:
� Continue to promote rideshare, carpooling, and van pooling strategies to support transit use and offer options beyond the use of single occupant automobiles for mobility.
� Increase employer and resident awareness of rideshare programs, strategies, and opportunities.
� Require use of TDM strategies to reduce vehicle trips generated by new develop-ment as a condition of mitigation.
to both administer and promote rideshare, car and van pool opportunities within the County.
Airports
BWI Thurgood Marshall International Airport
Baltimore/Washington International Business Partnership (BWIP)
The Annapolis Regional Transportation Management Association (ARTMA)
2009GeneralDevelopentPlan
Page 168
Chapter 9 The Transportation Plan
Transferred to the County in 1999 as the result of an earlier BRAC recommendation, Tip-ton Airport is located south of Fort Meade and operated by the Tipton Airport Authority, a facility management entity that is appointed by the County Executive. Over one hun-dred aircraft are based at the facility that handles approximately 150 aircraft arrival/departures daily. Current parameters include the utilization of a 3,000-foot runway with approved permits to extend the length of that runway to 4,000 feet and increase the amount of hangar space to accommodate larger turboprop aircraft.
The following recommendations are made in relation to air service:
Actions:
� Accessibility to airports provided by surface transportation facilities should be maintained, and as necessary, improved to protect the competitiveness of these facilities that support the County’s economic development. Accessibility improve-ments should include transit and pedestrian/bicycle facilities as well as highway capacity increases.
� Land uses near the airports should be monitored to prevent the compromise of the operations of these necessary facilities.
In 2003, the County Council adopted the Anne Arundel County Pedestrian and Bicycle Master Plan. Meant to encourage the integration of bicycle and pedestrian facilities into the roadway design and development review process, the ultimate goal of the Plan is to provide a safe, alternate means of mobility which offers economic, environmental, rec-reation/health and quality of life benefits. The Plan also promotes bicycle safety through education of both adults and children and creates an organized structure to implement bicycle and pedestrian programs and projects. The Plan strives for cohesion with other planning tools such as the Greenways Master Plan, the adopted Small Area Plans, the City of Annapolis Take-A-Step Map, the Maryland Statewide Greenway Atlas, and the Mary-land Statewide Bicycle and Pedestrian Plan.
The Plan identifies corridors for pedestrian/bicycle facility location and areas where pedes-trian activity should be supported through the construction of appropriate amenities such as sidewalks, street lighting, pedestrian ramps, and crosswalks. The Transportation Facilities Planning program funds design studies for pedestrian and bicycle facilities.
Baltimore and 30 miles north of Washington D.C. Close proximity to the Baltimore/Washington Parkway, Fort Meade and NSA have helped make the airport one of the biggest economic engines in Maryland, serving the federal government, technical, and hospitality and tourism industries.
Pedestrian and Bicycle Network
Tipton Airport
2009GeneralDevelopentPlan
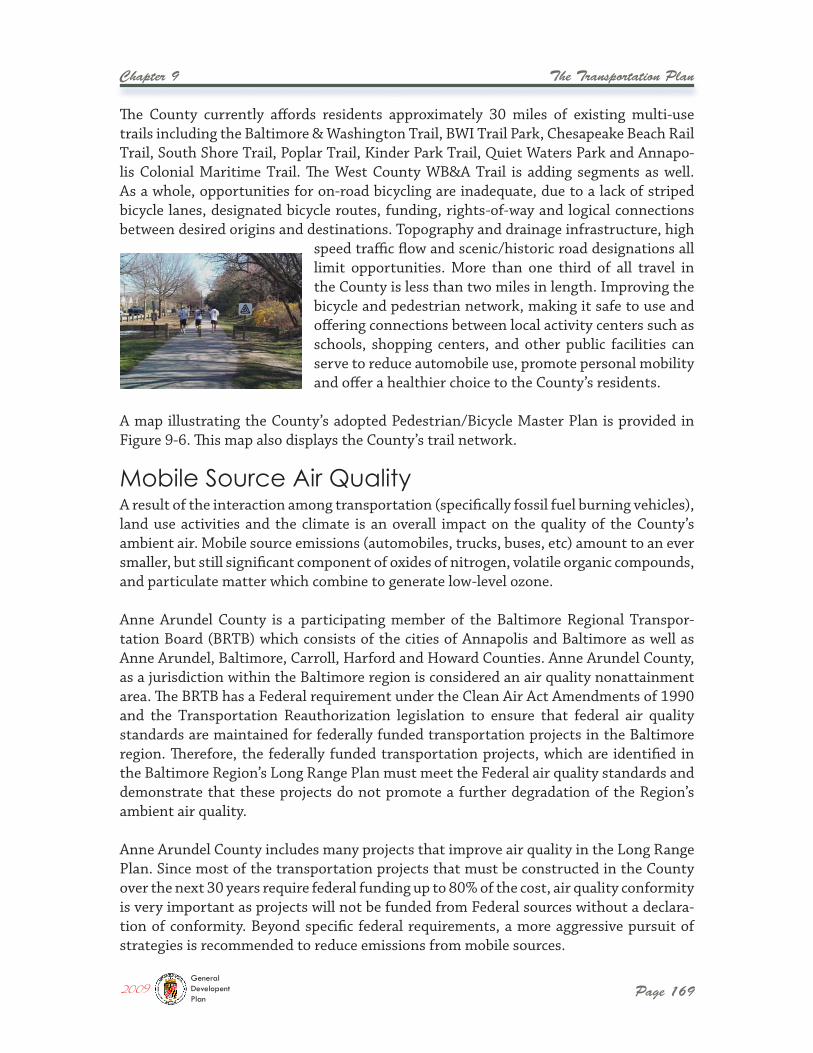
The Transportation Plan
Page 169
Chapter 9
The County currently affords residents approximately 30 miles of existing multi-use trails including the Baltimore & Washington Trail, BWI Trail Park, Chesapeake Beach Rail Trail, South Shore Trail, Poplar Trail, Kinder Park Trail, Quiet Waters Park and Annapo-lis Colonial Maritime Trail. The West County WB&A Trail is adding segments as well. As a whole, opportunities for on-road bicycling are inadequate, due to a lack of striped bicycle lanes, designated bicycle routes, funding, rights-of-way and logical connections between desired origins and destinations. Topography and drainage infrastructure, high
speed traffic flow and scenic/historic road designations all limit opportunities. More than one third of all travel in the County is less than two miles in length. Improving the bicycle and pedestrian network, making it safe to use and offering connections between local activity centers such as schools, shopping centers, and other public facilities can serve to reduce automobile use, promote personal mobility and offer a healthier choice to the County’s residents.
A map illustrating the County’s adopted Pedestrian/Bicycle Master Plan is provided in Figure 9-6. This map also displays the County’s trail network.
A result of the interaction among transportation (specifically fossil fuel burning vehicles), land use activities and the climate is an overall impact on the quality of the County’s ambient air. Mobile source emissions (automobiles, trucks, buses, etc) amount to an ever smaller, but still significant component of oxides of nitrogen, volatile organic compounds, and particulate matter which combine to generate low-level ozone.
Anne Arundel County is a participating member of the Baltimore Regional Transpor-tation Board (BRTB) which consists of the cities of Annapolis and Baltimore as well as Anne Arundel, Baltimore, Carroll, Harford and Howard Counties. Anne Arundel County, as a jurisdiction within the Baltimore region is considered an air quality nonattainment area. The BRTB has a Federal requirement under the Clean Air Act Amendments of 1990 and the Transportation Reauthorization legislation to ensure that federal air quality standards are maintained for federally funded transportation projects in the Baltimore region. Therefore, the federally funded transportation projects, which are identified in the Baltimore Region’s Long Range Plan must meet the Federal air quality standards and demonstrate that these projects do not promote a further degradation of the Region’s ambient air quality.
Anne Arundel County includes many projects that improve air quality in the Long Range Plan. Since most of the transportation projects that must be constructed in the County over the next 30 years require federal funding up to 80% of the cost, air quality conformity is very important as projects will not be funded from Federal sources without a declara-tion of conformity. Beyond specific federal requirements, a more aggressive pursuit of strategies is recommended to reduce emissions from mobile sources.
Mobile Source Air Quality
2009GeneralDevelopentPlan
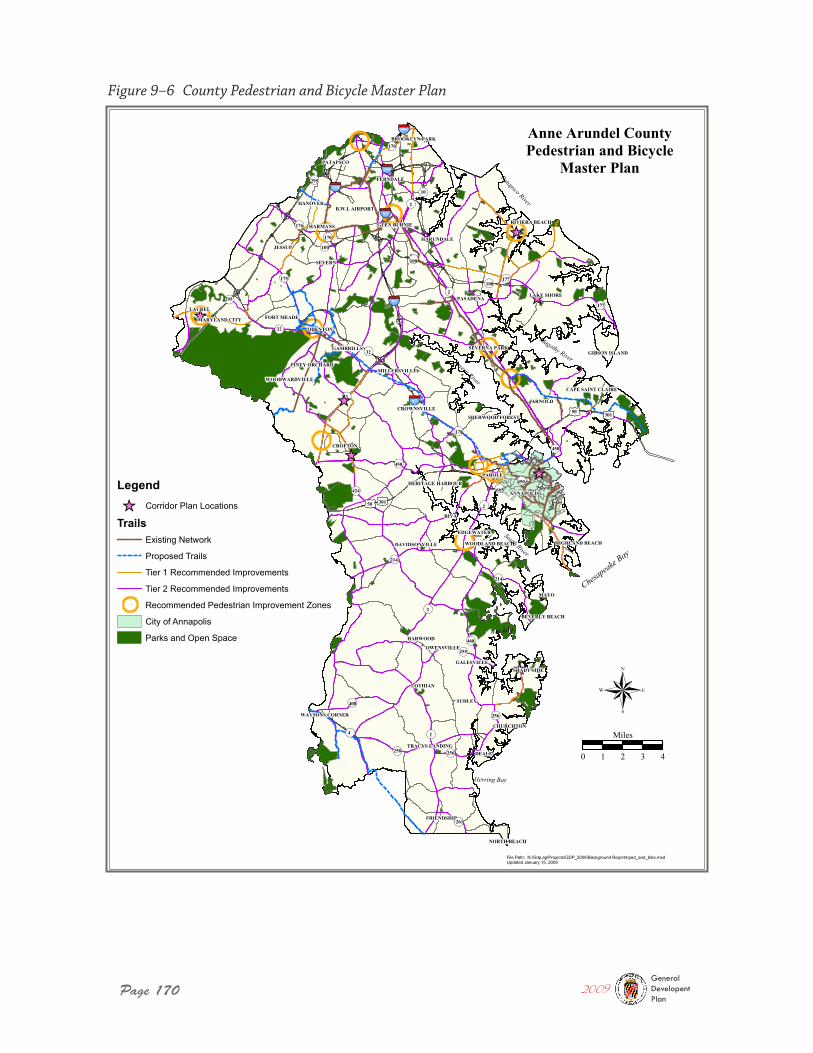
Page 170
Figure 9–6 County Pedestrian and Bicycle Master Plan
2009GeneralDevelopentPlan
!( !(
!(
!(!(
!(
!(
tu tu
!(
!(
!(
!(
!(
!( !(
!(
!(
!(
§̈¦
§̈¦
!(
!(
!(
!(
tutu
§̈¦
§̈¦
§̈¦
§̈¦!(
!(!(
!(
!(
!(
!(
!(
!(
!(
!(
!(
!(
!(
!(
[_[_
[_
[_
[_
[_
[_
895
695
195295
170
170
100
100177
295
214
100
97
176
32
97177
32
175
450
97
178
450665
450
214
468
258
408
256
256
50301
50 301
2
2
3
2
2
10
2
4
255
261
424
CAPE SAINT CLAIRE
HERITAGE HARBOUR
SHERWOOD FOREST
WOODLAND BEACH HIGHLAND BEACH
TRACYS LANDING
B.W.I. AIRPORT
WAYSONS CORNER
RIVIERA BEACH
MARYLAND CITY
PINEY ORCHARD
WOODWARDVILLE
GIBSON ISLAND
DAVIDSONVILLE
BEVERLY BEACH
BROOKLYN PARK
MILLERSVILLE
SEVERNA PARK
GLEN BURNIE
CROWNSVILLE
NORTH BEACH
LAKE SHORE
FORT MEADE
OWENSVILLE
GALESVILLESHADY SIDE
FRIENDSHIP
HARUNDALE
GAMBRILLS
EDGEWATER
CHURCHTON
ANNAPOLIS
PATAPSCO
FERNDALE
PASADENA
HANOVER
HARMANS
ODENTON
CROFTON
LOTHIAN
HARWOOD
JESSUP
SEVERN
LAUREL
ARNOLD
SUDLEY
PAROLE
DEALE
RIVA
MAYO
®
Anne Arundel CountyPedestrian and Bicycle
Master Plan
File Path: N:\Gdp.ag\Projects\GDP_2008\Background Reports\ped_and_bike.mxdUpdated January 15, 2009
Patapsco River
Magothy RiverSevern River
South River
West River
Herring Bay
Chesapeake
Bay
0 1 2 3 4
Miles
Legend
[_ Corridor Plan Locations
TrailsExisting Network
Proposed Trails
Tier 1 Recommended Improvements
Tier 2 Recommended Improvements
Recommended Pedestrian Improvement Zones
City of Annapolis
Parks and Open Space
The Transportation Plan
Page 171
Chapter 9
This Plan recommends the initiation of an “awareness” program to make the employ-ers, residents and County employees aware of Transportation Demand Management (TDM) services. Transit and ridesharing informational literature can be made available to potential, active and retired County employees as part of information they are currently receiving from the County such as paychecks. Active employees could receive information about air quality (Code Red and Code Orange Days as “popups”) on their computers as well. The information could be made available to the general public at County buildings including libraries, the County’s website and information that is already sent out by the county such as water bills. Public broadcasting such as the County Council meetings could also be utilized to disseminate information as appropriate.
Specific cost effective programs for County employees should be considered and imple-mented where they are appropriate. These could include providing priority parking spaces for carpoolers and subsidizing transit passes. Departments could implement flexible work schedules, where appropriate, similar to those that are being implemented by the private sector and County and State governments. Telecommuting (providing the option to work one or more days a week from a location other than a person’s primary office) could also be implemented.
This Plan also recommends a review of the County’s existing practices regarding genera-tion of emissions. Among these practices are County equipment purchasing procedures. Priority should be given to purchasing vehicles that are fuel efficient and produce lower rates of emissions of hydrocarbons, oxides of nitrogen and particulate matter (soot). This would include all trucks, buses, utility vehicles, and generators, or any other equipment that uses fossil fuel to produce energy. It would also include information to employees about fuel conservation which also leads to reduction in emissions. These could include fueling vehicles early in the morning and not mowing grass on Code Red or Orange days.
Since mobile source emissions are related to land use patterns, this Plan also recommends reviewing existing land use codes and regulations, providing incentives for develop-ment of in-fill lots, promotion of areas designated for Transit Oriented Development, establishment of maximum number of parking spaces in areas served by transit, and implementation of transit service and pedestrian connection improvements to help miti-gate development-generated vehicle trips, where feasible.
The County should also identify larger private sector employers (over 100 full time employees) and work with them to implement TDM programs through ARTMA and BWI Business Partnership. They should include transit information for their employees, guid-ance to find ride sharing information and incentives that the company could provide to encourage the use of transit (subsidized bus passes or preferential parking near the build-ing for carpoolers).
2009GeneralDevelopentPlan
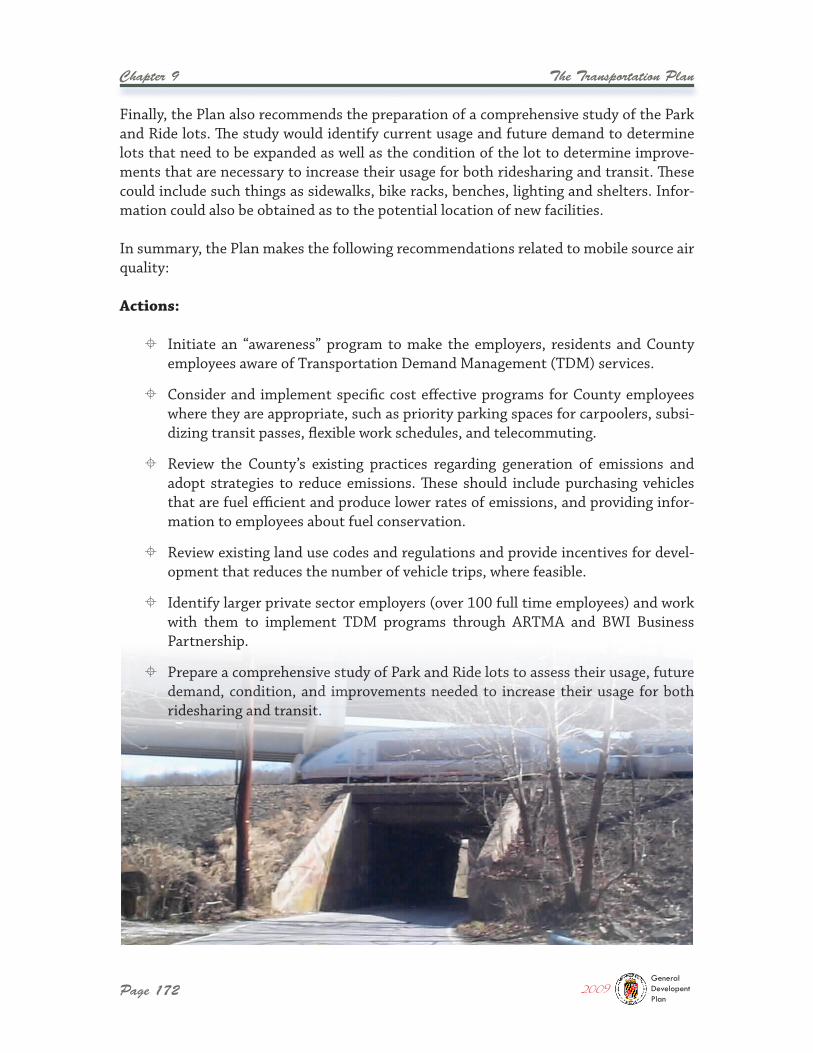
Page 172
Chapter 9 The Transportation Plan
Finally, the Plan also recommends the preparation of a comprehensive study of the Park and Ride lots. The study would identify current usage and future demand to determine lots that need to be expanded as well as the condition of the lot to determine improve-ments that are necessary to increase their usage for both ridesharing and transit. These could include such things as sidewalks, bike racks, benches, lighting and shelters. Infor-mation could also be obtained as to the potential location of new facilities.
In summary, the Plan makes the following recommendations related to mobile source air quality:
Actions:
� Initiate an “awareness” program to make the employers, residents and County employees aware of Transportation Demand Management (TDM) services.
� Consider and implement specific cost effective programs for County employees where they are appropriate, such as priority parking spaces for carpoolers, subsi-dizing transit passes, flexible work schedules, and telecommuting.
� Review the County’s existing practices regarding generation of emissions and adopt strategies to reduce emissions. These should include purchasing vehicles that are fuel efficient and produce lower rates of emissions, and providing infor-mation to employees about fuel conservation.
� Review existing land use codes and regulations and provide incentives for devel-opment that reduces the number of vehicle trips, where feasible.
� Identify larger private sector employers (over 100 full time employees) and work with them to implement TDM programs through ARTMA and BWI Business Partnership.
� Prepare a comprehensive study of Park and Ride lots to assess their usage, future demand, condition, and improvements needed to increase their usage for both ridesharing and transit.
2009GeneralDevelopentPlan
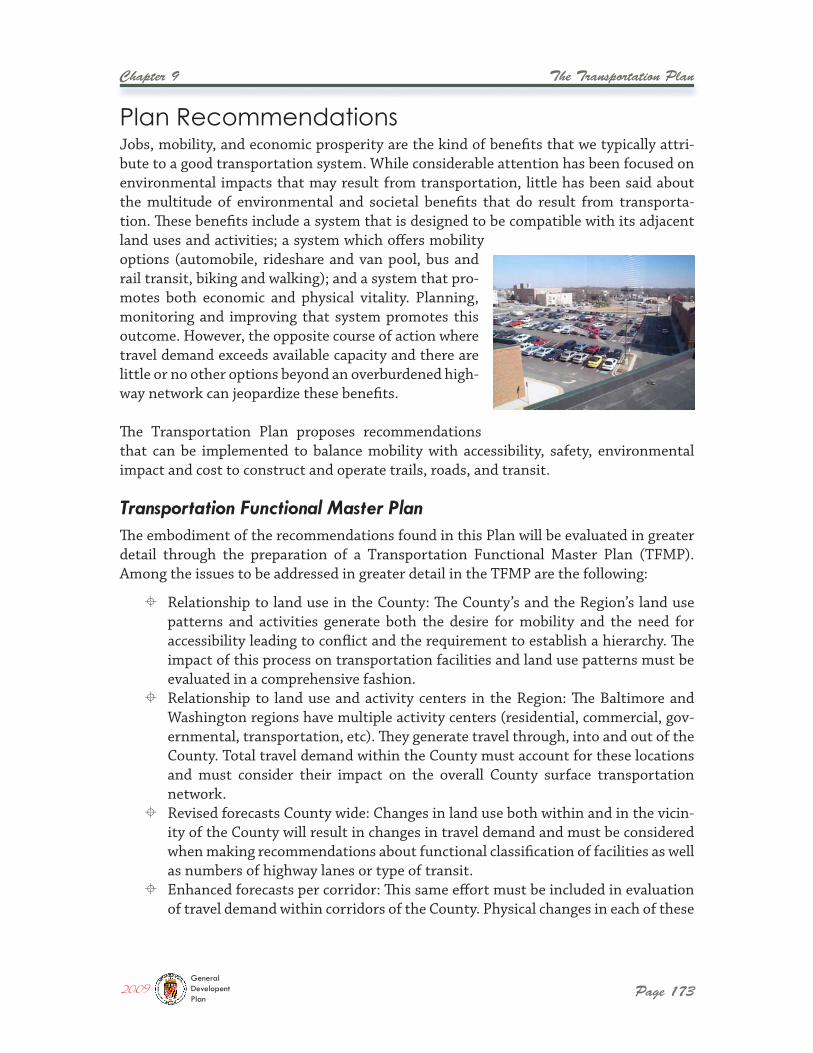
The Transportation Plan
Page 173
Chapter 9
The embodiment of the recommendations found in this Plan will be evaluated in greater detail through the preparation of a Transportation Functional Master Plan (TFMP). Among the issues to be addressed in greater detail in the TFMP are the following:
� Relationship to land use in the County: The County’s and the Region’s land use patterns and activities generate both the desire for mobility and the need for accessibility leading to conflict and the requirement to establish a hierarchy. The impact of this process on transportation facilities and land use patterns must be evaluated in a comprehensive fashion.
� Relationship to land use and activity centers in the Region: The Baltimore and Washington regions have multiple activity centers (residential, commercial, gov-ernmental, transportation, etc). They generate travel through, into and out of the County. Total travel demand within the County must account for these locations and must consider their impact on the overall County surface transportation network.
� Revised forecasts County wide: Changes in land use both within and in the vicin-ity of the County will result in changes in travel demand and must be considered when making recommendations about functional classification of facilities as well as numbers of highway lanes or type of transit.
� Enhanced forecasts per corridor: This same effort must be included in evaluation of travel demand within corridors of the County. Physical changes in each of these
Jobs, mobility, and economic prosperity are the kind of benefits that we typically attri-bute to a good transportation system. While considerable attention has been focused on environmental impacts that may result from transportation, little has been said about the multitude of environmental and societal benefits that do result from transporta-tion. These benefits include a system that is designed to be compatible with its adjacent land uses and activities; a system which offers mobility options (automobile, rideshare and van pool, bus and rail transit, biking and walking); and a system that pro-motes both economic and physical vitality. Planning, monitoring and improving that system promotes this outcome. However, the opposite course of action where travel demand exceeds available capacity and there are little or no other options beyond an overburdened high-way network can jeopardize these benefits.
The Transportation Plan proposes recommendations that can be implemented to balance mobility with accessibility, safety, environmental impact and cost to construct and operate trails, roads, and transit.
Transportation Functional Master Plan
Plan Recommendations
2009GeneralDevelopentPlan
Page 174
Chapter 9 The Transportation Plan
corridors can result in changes in travel demand along parallel or perpendicular corridors and should be not studied separately.
� Priority Highway Improvement Corridors Program (PHIC): The TFMP will initi-ate studies by highway corridor preparing detailed recommendations using the known tool box of potential improvements ranging from additional travel lanes, access control and/or management, system signalization, transit, pedestrian/bicycle connections, and potentially zoning and land use design overlays.
� Transit Investment Corridors (TIC): Provision of improved or initial transit needs to be part of any overall transportation plan. Adjacent land uses both in terms of density and activities, right-of-way availability, connectivity to other transit facili-ties, and land side supporting infrastructure must all be considered and evaluated in a larger Countywide context and in far greater detail than would be possible in a policy-level plan.
� Coordination and Promotion of Improved Transit Services: As noted earlier in this Plan, transit services in the County are provided by State, County, municipal and private sector sources. Better coordination of these services, coupled with improvements along the Transit Investment Corridors, will be necessary to imple-ment improved services throughout the County and provide better connections to regional activity enters in both the Washington and Baltimore areas.
� Coordination with Emergency Planning: The Office of Emergency Management is responsible for coordinating emergency transportation resources and facilitating evacuations within the County. The placement of road shoulders, median cross-overs, and other emergency road usage options should be addressed with OEM in the planning stages.
� Changes to Facility Design (sidewalks, on-road biking, multipurpose trails): While a policy plan can offer recommendations about the need to change facility design to meet current needs, that plan cannot examine the impact of these changes comprehensively and in a fashion needed to alter current Design Manual stan-dards. Changes to facility design for roadways including a documented need for sidewalks, on-road bicycle space, and multipurpose trails are necessary to meet assumed land uses, activities and densities as recommended in the Plan.
� Changes in timing of dedication / reservation: Combined public costs associated with right-of-way acquisition for all transportation facilities (highways, fixed guideway transit, dedicated bus transit lanes, sidewalks, multipurpose trails, etc) continue to mount as the County’s current policy of reservation requirements are only extended to projects with identified construction funding. By linking travel demand, facility type, number of lanes and added appurtenances to the Design Manual, the TFMP will help to identify longer term right-of-way needs and make informed recommendations about land requirements.
� Context Sensitive Design: Construction and reconstruction of transportation facilities must occur to support adjacent land use activities. Town Centers and revitalization areas should not be divided by suburban style roadways, but should be drawn together by facilities that support those land uses. Roadways must be
2009GeneralDevelopentPlan
The Transportation Plan
Page 175
Chapter 9
designed to accommodate all parties using that right-of-way including motorists, bicyclists, pedestrians, and transit riders, regardless of their age and skill.
� Motorist, Bicyclist, and Pedestrian Safety: Currently the County ranks between third and fifth among Maryland’s counties for various categories of fatalities and severe accidents caused by various actions. While this is fairly consistent with total annual vehicle miles traveled, it is far too high based on the County’s population. Comprehensive evaluation of crash locations, and examination of the motorist and pedestrian policies which could lead to reductions in crashes and incidents will be included in the TFMP.
� Parking structures and Park & Ride Facilities: Car pooling and transit usage are identified at the policy level as strategies to reduce congestion, conserve fossil fuels, and promote a cleaner environment. The extent of land used to support parking needs to be evaluated on a Countywide basis. As the County’s Transit Oriented Development Program advances and areas of the County experience economic revitalization, provision of parking must be evaluated as well. Areas where parking facilities are necessary to promote these goals must be identified and preserved in a rational fashion based on informed recommendations.
� Input to Capital Improvement Program: The GDP Background Report on Trans-portation demonstrated a need to improve facilities to meet future travel demand. The PHIC and TIC elements of the TFMP will provide detailed recommendations for improvements to both State and County facilities. The TFMP will provide an informed process to identify projects to be included in the County’s Capital Improvement Program as well as the MDOT Construction Priority Letter.
� Sources of Funding: Cost to plan, design, acquire right-of-way and construct projects will require a fundamental change in how projects are presently funded. Among the obvious sources to consider are impact fees, fees in lieu of construc-tion, special funding districts, developer exactions, increment financing and other innovative sources of capital financing.
� Intergovernmental Coordination: The County relies on State funding, as virtually all of the major transportation facilities in the County are maintained by the State of Maryland. It must coordinate with the City of Annapolis with regard to transit service in the Parole, Arnold and Edgewater areas, as well as interjurisdictional issues with ownership of the highway network. Further, the County must also work with adjacent counties and with Federal agencies to achieve common goals. The TFMP will identify methods to improve intergovernmental coordination both within the County and with adjacent jurisdictions.
The Background Report on Transportation provided tables and graphics identifying fore-cast future travel demand along the major facilities that comprise the County’s highway network. On average, the network can accommodate much of the anticipated growth in travel demand. However, there are several segments where travel demand will exceed the hourly capacity of the facilities. In those cases, congestion (lack of mobility) is expected
Priority Highway Improvement Corridors
2009GeneralDevelopentPlan
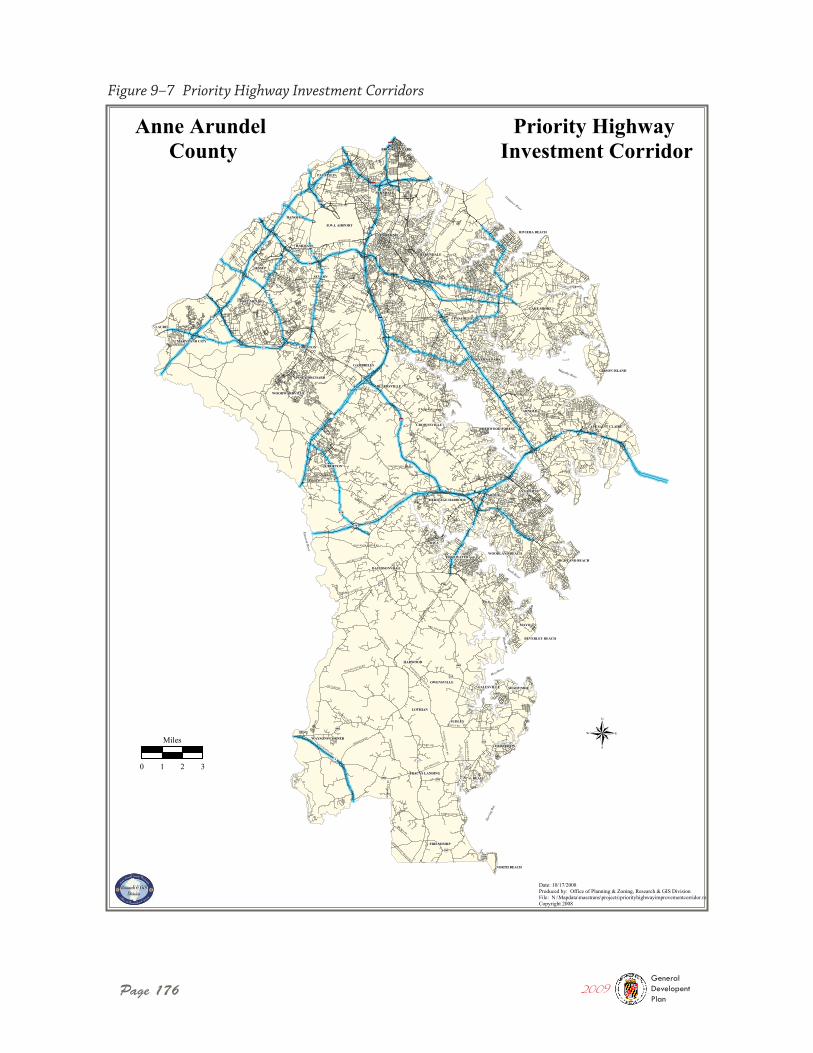
Page 176
Figure 9–7 Priority Highway Investment Corridors
2009GeneralDevelopentPlan
!(!(
!(
!(
!(
!(
!(
tutu
!(
!(
!(
!(
!(
!( !(
!(
!(
!(
§̈¦
§̈¦
!(
!(
!(
!(
tutu
§̈¦
§̈¦
§̈¦
§̈¦
!(
!(
!(
!(
!(
!(
!(
!(
!(
!(
!(
!(
!(
!(
!(
MAYO
RIVA
DEALE
PAROLE
SUDLEY
ARNOLD
LAUREL
SEVERN
JESSUP
HARWOOD
LOTHIAN
CROFTON
ODENTON
HARMANS
HANOVER
PASADENA
FERNDALE
PATAPSCO
ANNAPOLIS
CHURCHTON
EDGEWATER
GAMBRILLS
HARUNDALE
FRIENDSHIP
SHADY SIDEGALESVILLEOWENSVILLE
FORT MEADE
LAKE SHORE
NORTH BEACH
CROWNSVILLE
GLEN BURNIE
SEVERNA PARK
MILLERSVILLE
BROOKLYN PARK
DAVIDSONVILLE
GIBSON ISLAND
WOODWARDVILLE
PINEY ORCHARD
MARYLAND CITY
RIVIERA BEACH
WAYSONS CORNER
B.W.I. AIRPORT
TRACYS LANDING
BEVERLEY BEACH
HIGHLAND BEACH
WOODLAND BEACH
SHERWOOD FOREST
HERITAGE HARBOUR
CAPE SAINT CLAIRE
4
2
10
2
2
3
2
2
255
424
30150
30150
261
256
408
258
468
214
450
665
450
178
97
450
175
32
17797
176
97
100
214
295
177
100
100
170
170
295
195
695
895
256
32
SOLO
MONS
ISLA
NDRD
MOUNTAIN RD
GOVERNORRITCHIE
HWY
RIVA RD
SAN
DS
RD
DEFENSE HWY
CENTRAL AV
GENERALS HWY
DORSEY RD
BAY FRONT RD
WB&
ARD
REECE RD
MUDDY
CREE
KRD
BAYARD RD
RID
GE
RD
SOLL
EYRD
WEST ST
TELE
GR
APH
RD
SPA
RD
PATUXENTRIVER
RD
GOVERNOR BRIDGE RD
COLLEGE PKWY
MAPES RD
HARWOOD
RD
NURSERY RD
RIV
ERR
D
RUTLAND RD
FOREST DR
WIG
GLEY
AVE
BIRD
SVILLE
RD
GAM
BRIL
LSRD
GREENOCK RD
MARLEY
NECKBLVD
PATU
XENT
RD
AVIATION BLVD
OLD MARYLAND
CR
OW
NSV
ILLER
D
JEWELL RD
SHADY SIDE RD
SEVERN RD
OA
KW
OO
DR
D
OLDCOUNTY
RDEAST WEST BLVD
FAIRHAVEN RD
OWENSVILLE
SUDLEYRD
JESSUP RD
EDPROUT RD
BESTGATE RD
BALTIMORE ANNAPOLIS BLVD
MAGOTHY BRIDGE RD
FORT SMALLWOOD RD
NEW CUT RD
WILSONRD
ANDOVER RD
UN
DER
WO
OD
RD
POLLING HOUSE RD
BR
OO
KS
WO
OD
SR
D
ROCKENBACH RD
HARM
AN
SRD
WAUGH CHAPEL RD
BELL BRANCH RD
ORDNANCE RD
CHESTERFIELD RD
MC
KEN
DR
E ER
D
BAYSIDE BEACH RD
QUAR
TERF
IELD
RD
PASADENA RD
SUDLEY RD
HA
MM
ON
DS
FERR
YRD
DEA
LECH
URC
HTO
NRD
HI L
L SM
E RE
DR
EDW
INR
AY
NO
RB
LVD
BAY RIDGE RD
MILL SWAMP RD
HAMMONDS LN
LAKESH
OREDR
REIDEL R
D
JUM
PER
SH
OLE
RD
DOUBLE GATE RD
NUTWELL RD
WELLHAM AV
SWA
MP
CIR
CLE
RD
DUVALL HWY
CONWAY RD
BAY
RID
GE
AV
HAWKINS RD
DONALDSON AV
HILLTOP LN
SHORE ACRES RD
CHURCH ST
MILLERSVILLE RD
NU
TWELL
SUD
LEYRD
BRICKCHU
RCHRD
HA
VEN
RD
CLA
RK
STA
TIO
NR
D
SEVERN
CHAPEL
RD
COO
PERA
V
OLD HERALD HARBOR RD
QUEEN
ANNEBRID
GERD
ARUNDELON
THEBAY
RD
ODENTON RD
JOHNS HOPKINS RD
CROFTON PKWY
PINEY ORCHARD PKWY
HERALD HARBOR RD
OLD MILL RD
CH
ALK
POIN
TR
D
BRIGHTVIEW DR
FERRY POINT RD
HANOVER RD
CHESAPEAKE BEACHRD
ARUNDEL MILLS BLVD
LOCH HAVEN RD
BENFIELD BLVD
MAIN ST
OLDA
NN
APO
LISBLV
D
CRAI
NH
WY
LID
OD
R
VETERANS
HW
Y
ROBERT CRAINHW
Y
BROCK BRIDGE RD
I 97
RIVER RD
JOHN HANSON HWY
Patuxent River
Patapsco River
Herr
ing
Bay
Magothy River
South River
Severn River
RhodeRiver
West River
Anne Arundel County
Priority Highway Investment Corridor
Date: 10/17/2008Produced by: Office of Planning & Zoning, Research & GIS DivisionFile: N:\Mapdata\masstrans\projects\priorityhighwayimprovementcorridor.mxdCopyright 2008
®0 1 2 3
Miles
The Transportation Plan
Page 177
Chapter 9
Congested streets and roadways result when too many people use the same routes at the same time, particularly during peak commuter hours or special events. The term “demand” refers to the amount of street or road use during a given time period. Trans-
portation Demand Management (TDM) programs focus on changing or reducing travel demand, particularly at peak commute hours, instead of increasing roadway supply. Thus, TDM makes more efficient use of the current roadway sys-tem. With the right incentives (or disincentives) travelers can be influenced to use transportation systems in a way that contributes less to congestion. In fact, Federal Highway Administration research around the country indicates that well-designed TDM programs can reduce vehicle trips by as much as 30 or 40%. Travelers base their travel choices on a number of important motivators including the desire to
save time and money, to reduce stress or to improve convenience. At least some of these motivations must be addressed to encourage a change in habits. Some of the most prom-ising TDM programs emphasize coordination with local employers on measures such as car or van pooling programs, bus pass subsidies, alternative work schedules, telecommut-ing options and parking management. Studies also indicate that congestion pricing is an especially effective approach, which should gain favor as congestion worsens and new variations on the concept are developed. The GDP identifies some strategies below.
Public Information about Transportation Through public workshops, neighborhood meetings, staff reports and other means, provide public information and education on local transportation conditions, behavior, issues and improvement options. Hold at least
to occur. Where the demand far exceeds the hourly capacity, the duration of this conges-tion will be much longer.
This Plan recommends the creation of Priority Highway Improvement Corridors (PHIC), as identified in Figure 9-7. The concept of PHIC is to apply the entire tool box of demand management, access management, transit, pedestrian safety, and geometric improve-ment strategies to accommodate the anticipated travel demand. It is doubtful that a single set of strategies can be applied across the entire table of PHIC, so it is recommended that the Transportation Functional Master Plan (TFMP) address each of these corridors in a specific fashion.
In addition to preparing corridor specific recommendations in the TFMP, this Plan recom-mends configuring or re-configuring street patterns to improve traffic flow and turning movements in balance with safety considerations and to widen roadways only when nec-essary to accommodate travel demand where no other option is available.
Transportation Demand Management (TDM) programs focus on changing or reducing travel demand, particularly at peak commute hours, instead of increasing roadway supply.
Transportation Demand Management Strategies
2009GeneralDevelopentPlan
Page 178
Chapter 9 The Transportation Plan
one traffic and transportation workshop annually to update the public on conditions and proposed improvements.
Transit Information Dissemination Encourage development and distribution of transit information through printed materials, kiosks, web sites, radio and television broadcasts, and other means. Provide transit information on the County’s website, at County offices open to the public and through other dissemination means. Include tran-sit access information on County meeting notices and in notices for County-permitted events, and encourage merchants to provide transit information in their advertisements and in their places of business.
Utilizing Transportation Technology Use the most effective technologies in manag-ing the County’s roadways and congestion. For example, support timed connections at transit hubs and promote the use of transportation information systems.
Identify Transit Needs Work with transit providers to identify underserved neigh-borhoods and population groups and advocate for expanded service in those areas and populations.
County and Regional Support for Transportation Demand Management (TDM) Programs Identify cost-effective Anne Arundel County TDM programs for County employees. Serve as a resource to employers wishing to implement TDM by providing information through printed materials, workshops and other means. Encourage smaller employers to “pool” resources to create effective TDM programs. Support regional efforts to work with employers to provide TDM programs.
County Survey of Transit Needs In County-sponsored surveys of residents, seek tran-sit satisfaction levels when appropriate and feasible.
Intelligent Transportation Systems (ITS) Intelligent Transportation Systems are part of the national strategy for improving the operational safety, efficiency, and security of our nation’s highways. Since the early 1990s, ITS has been the umbrella under which significant efforts have been conducted in research, development, testing, deployment, and integration of advanced technologies to improve the measures of effectiveness of our national highway network. Deployment of these technologies requires coordination with both State and municipal transportation agencies, both in terms of highway and transit operations. These measures include level of congestion, the number of accidents and fatalities, delay, throughput, access to transportation, and fuel efficiency. A transpor-tation future that includes ITS will involve a significant improvement in these measures while remaining environmentally friendly and assuring the safety and security of the traveling public. The GDP recommends consideration of ITS application wherever pos-sible to reduce congestion and improve information and system operation.
2009GeneralDevelopentPlan
The Transportation Plan
Page 179
Chapter 9
The following goals, policies, and actions are Countywide and integrate transportation with the other elements in this Plan such as land use and environmental stewardship.
Goal: Provide a safe, efficient and affordable multimodal transportation system in Anne Arundel County.
Policy 1: Promote and encourage a transportation system that adequately and safely serves the public, minimizes negative environmental impacts, and supports the county’s land use goals.
Actions:
� Prepare and adopt a Transportation Functional Master Plan (TFMP) that addresses roadway, bicycle, pedestrian, and public transportation modes, and that includes a financial plan to implement proposed improvements over the next ten years. The TFMP should include the following components: relationship to land use and activity centers in the county and the region, linkages between transportation modes, a priority highways investment corridors program, transit investment corridors, transit services, facility design, timing of highway dedication/reserva-tion, context sensitive design, transit and highway corridor overlays, motorist and pedestrian safety, parking structures and park and ride facilities, capital improve-ment program, funding sources, consolidation of transit operations, connections to public facilities, emergency management and design criteria to accommodate emergency usage such as adequate road shoulder space, median cross-overs, and staging of transportation resources, and intergovernmental coordination.
� Identify the purpose and need to conduct a highway corridor study of US 50 / 301 between Prince Georges County and Queen Anne’s County in cooperation with State, Federal and local transportation agencies.
Policy 2: Explore extension of transit along major transportation corridors.
Actions:
� Study feasibility of transit, including bus transit and rail transit, along corridors as identified in the GDP and TFMP.
� Identify locations for intermodal centers.
� Conduct feasibility study for the extension of light rail to other areas of the County.
Other Goals, Policies, and Actions
2009GeneralDevelopentPlan
Page 180
Chapter 9 The Transportation Plan
� Study the feasibility of adding stations on the commuter rail line.
� Revise the Impact Fee Program to allow a portion of transportation impact fees to be dedicated for expansion or improvements to public transit.
Policy 3: Promote carpooling, vanpooling, transit programs, and improvements to park-and-ride lots. Action:
� Conduct periodic public workshops, neighborhood meetings, staff reports, and other means to disseminate information about available programs.
Policy 4: Provide public information and education on local transportation condi-tions, safety behavior, issues, and improvement options.
Actions:
� Work with transit providers to identify underserved neighborhoods and popula-tion groups and evaluate them for the potential inclusion in the transit system.
� Conduct a traffic and transportation workshop annually to update the public on conditions and proposed improvements.
Policy 5: Improve the efficiency of personal travel by providing more options to reduce current dependency on automobile use.
Action:
� Encourage high occupancy vehicle (HOV) lanes, carpooling, flexible work sched-ules, telecommuting, subsidized transit passes, and stricter parking controls as means to reduce traffic congestion.
Policy 6: Improve transportation and utility infrastructure in the vicinity of BWI and Tipton airports.
Action:
� Improve vehicular and transit access to BWI and Tipton airports.
Policy 7: Improve coordination of transportation services in the County
Action:
� Consolidate transportation activities (highway, bridge, transit, sidewalks, demand management) into one department providing a single agency to deliver transpor-tation services in the County.
2009GeneralDevelopentPlan
The Transportation Plan
Page 181
Chapter 9
The following goals, policies and actions will serve to encourage the integration of bicycle/pedestrian facilities into the roadway design and development review process.
Goal: Create and maintain a pedestrian and bicycle-friendly community with a convenient and efficient multi-modal system.
Policy 1: Continue implementation of the Bicycle and Pedestrian Master Plan to provide an expanded bikeway and sidewalk network and greater overall support for biking and walking.
Actions:
� Develop a program for prioritizing the maintenance of existing pedestrian facili-ties based on pedestrian use and connectivity as well as maintenance need, and secure funding sources for its implementation.
� Monitor progress in implementing the pedestrian-related goals and objectives of the Bicycle and Pedestrian Master Plan on an annual basis.
Policy 2: Ensure an interconnected community that provides multi-modal access to all neighborhoods.
Actions:
� Establish and/or maintain sidewalks, trails, context-sensitive street design, and community-oriented transit services.
� All new streets should connect, wherever possible, to existing streets as well as future potential developments.
� Provide safe corridors for pedestrians and bicycles throughout communities.
� Include transit shelters in neighborhoods and business developments along des-ignated routes.
� Identify publicly owned properties in the vicinity of transit stations that could be used for joint public / private development.
The following goal, policy, and actions encourages flexibility in design to promote compat-ibility with the character of the area but does not recommend any design that sacrifices pedestrian, bicyclist, or motorist safety.
Goal: Design and improve the road network to further land use, community preservation, environmental (both the natural and built environment) protection, public safety, and neighborhood compatibility goals.
2009GeneralDevelopentPlan
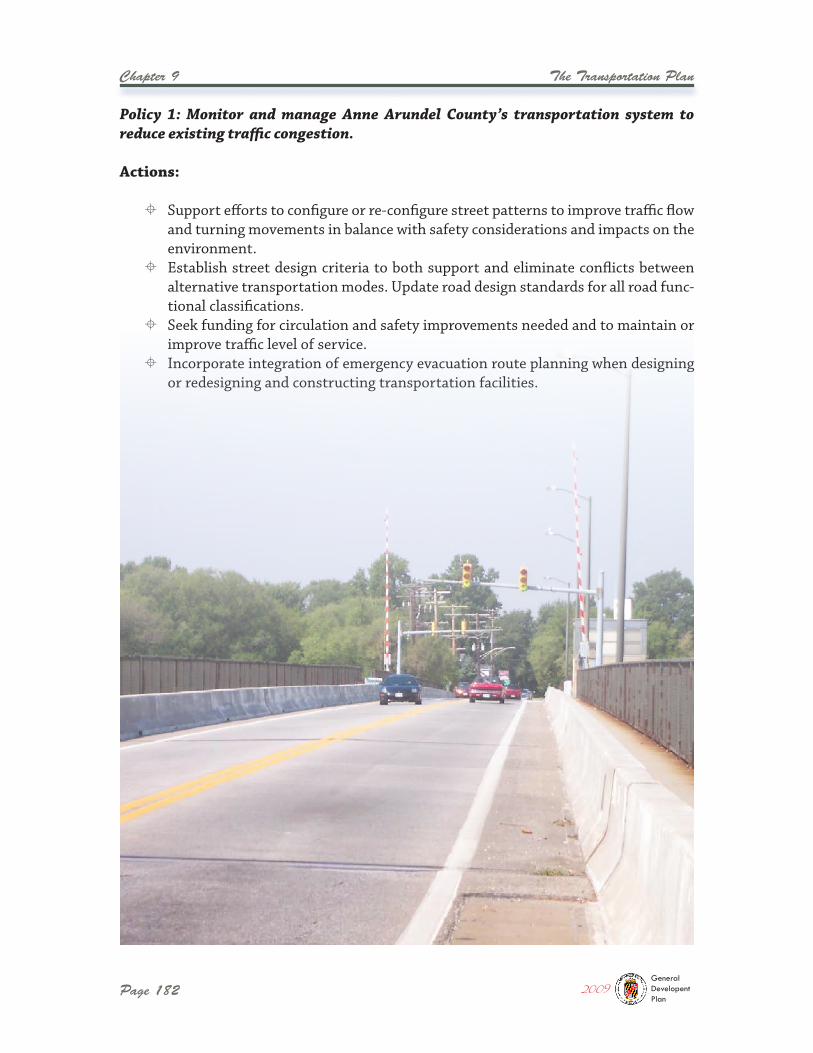
Page 182
Chapter 9 The Transportation Plan
Policy 1: Monitor and manage Anne Arundel County’s transportation system to reduce existing traffic congestion.
Actions:
� Support efforts to configure or re-configure street patterns to improve traffic flow and turning movements in balance with safety considerations and impacts on the environment.
� Establish street design criteria to both support and eliminate conflicts between alternative transportation modes. Update road design standards for all road func-tional classifications.
� Seek funding for circulation and safety improvements needed and to maintain or improve traffic level of service.
� Incorporate integration of emergency evacuation route planning when designing or redesigning and constructing transportation facilities.
2009GeneralDevelopentPlan

Chapter 10:The Water Resources Plan

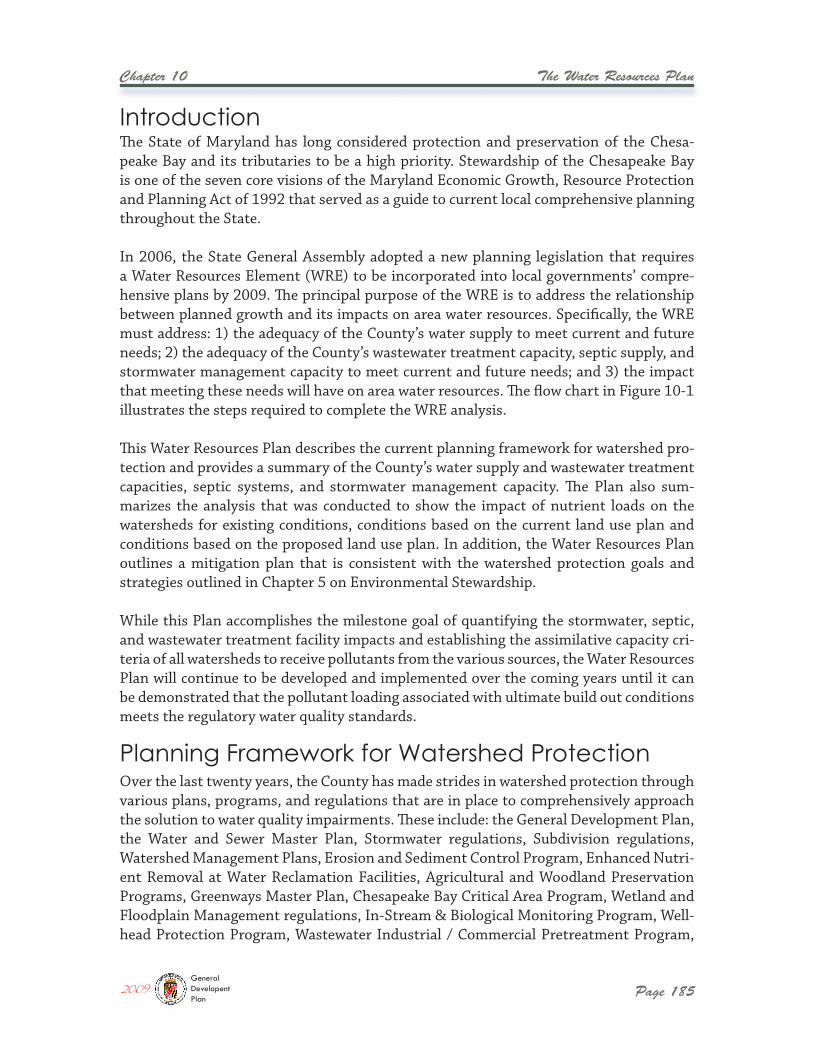
The Water Resources Plan
Page 185
Chapter 10
The State of Maryland has long considered protection and preservation of the Chesa-peake Bay and its tributaries to be a high priority. Stewardship of the Chesapeake Bay is one of the seven core visions of the Maryland Economic Growth, Resource Protection and Planning Act of 1992 that served as a guide to current local comprehensive planning throughout the State.
In 2006, the State General Assembly adopted a new planning legislation that requires a Water Resources Element (WRE) to be incorporated into local governments’ compre-hensive plans by 2009. The principal purpose of the WRE is to address the relationship between planned growth and its impacts on area water resources. Specifically, the WRE must address: 1) the adequacy of the County’s water supply to meet current and future needs; 2) the adequacy of the County’s wastewater treatment capacity, septic supply, and stormwater management capacity to meet current and future needs; and 3) the impact that meeting these needs will have on area water resources. The flow chart in Figure 10-1 illustrates the steps required to complete the WRE analysis.
This Water Resources Plan describes the current planning framework for watershed pro-tection and provides a summary of the County’s water supply and wastewater treatment capacities, septic systems, and stormwater management capacity. The Plan also sum-marizes the analysis that was conducted to show the impact of nutrient loads on the watersheds for existing conditions, conditions based on the current land use plan and conditions based on the proposed land use plan. In addition, the Water Resources Plan outlines a mitigation plan that is consistent with the watershed protection goals and strategies outlined in Chapter 5 on Environmental Stewardship.
While this Plan accomplishes the milestone goal of quantifying the stormwater, septic, and wastewater treatment facility impacts and establishing the assimilative capacity cri-teria of all watersheds to receive pollutants from the various sources, the Water Resources Plan will continue to be developed and implemented over the coming years until it can be demonstrated that the pollutant loading associated with ultimate build out conditions meets the regulatory water quality standards.
Over the last twenty years, the County has made strides in watershed protection through various plans, programs, and regulations that are in place to comprehensively approach the solution to water quality impairments. These include: the General Development Plan, the Water and Sewer Master Plan, Stormwater regulations, Subdivision regulations, Watershed Management Plans, Erosion and Sediment Control Program, Enhanced Nutri-ent Removal at Water Reclamation Facilities, Agricultural and Woodland Preservation Programs, Greenways Master Plan, Chesapeake Bay Critical Area Program, Wetland and Floodplain Management regulations, In-Stream & Biological Monitoring Program, Well-head Protection Program, Wastewater Industrial / Commercial Pretreatment Program,
Introduction
Planning Framework for Watershed Protection
2009GeneralDevelopentPlan
Page 186
Chapter 10 The Water Resources Plan
Figure 10–1 Water Resource Element Analytical Framework
The 1997 General Development Plan recognized the threat to water quality from overflow of pumping stations, failing septic systems, untreated thermal runoff from roads and other impervious surfaces, and other contaminates into creeks and rivers. Several key goals and recommendations were adopted to lessen the threat of pollution and improve water quality conditions. The County’s 2009 General Development Plan carries these goals forward and formulates sound policies for watershed protection. Additional strategies for enhanced protection or restoration, as well as incentives to promote conservation are also provided.
The Anne Arundel County Water and Sewer Master Plan includes goals, objectives, policies, and procedures as well as background information, descriptions of facilities and service areas, population and flow projections, strategies for facility optimization, and policies
the Capital Improvement Program, Onsite Sewage Disposal Systems study and imple-mentation plan, and participation on Maryland’s Tributary Strategy Teams.
Water and Sewer Master Plan
General Development Plan
2009GeneralDevelopentPlan
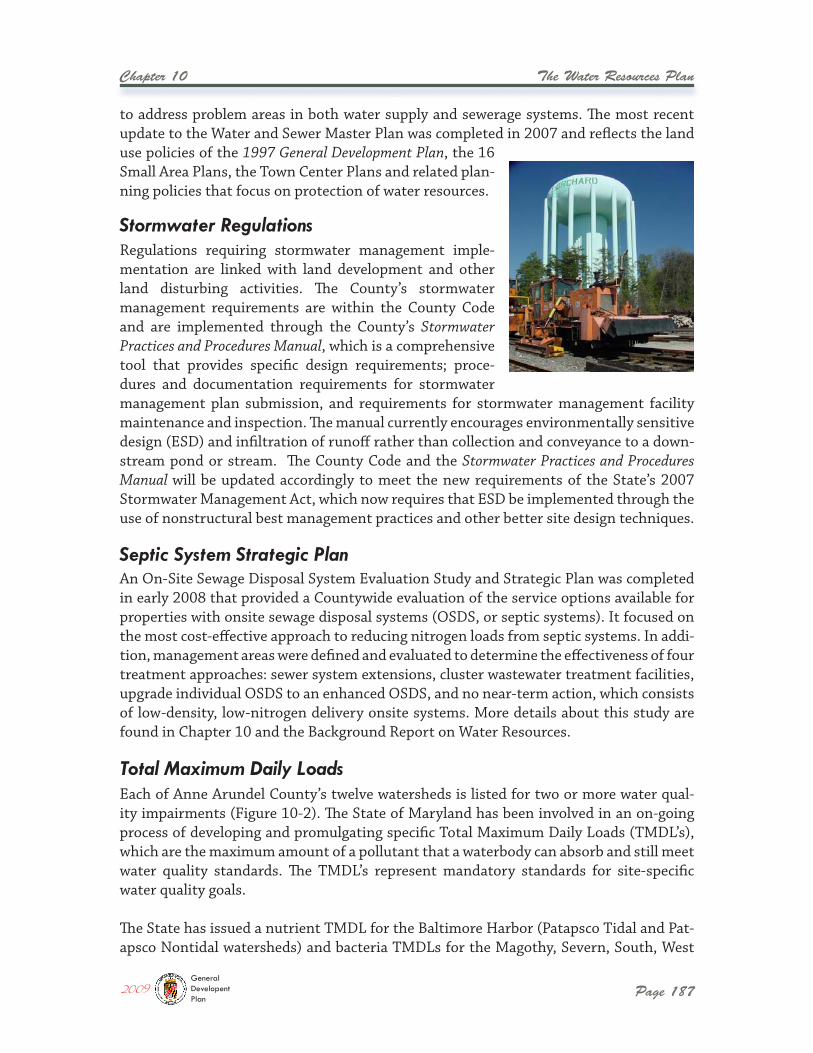
The Water Resources Plan
Page 187
Chapter 10
Regulations requiring stormwater management imple-mentation are linked with land development and other land disturbing activities. The County’s stormwater management requirements are within the County Code and are implemented through the County’s Stormwater Practices and Procedures Manual, which is a comprehensive tool that provides specific design requirements; proce-dures and documentation requirements for stormwater management plan submission, and requirements for stormwater management facility maintenance and inspection. The manual currently encourages environmentally sensitive design (ESD) and infiltration of runoff rather than collection and conveyance to a down-stream pond or stream. The County Code and the Stormwater Practices and Procedures Manual will be updated accordingly to meet the new requirements of the State’s 2007 Stormwater Management Act, which now requires that ESD be implemented through the use of nonstructural best management practices and other better site design techniques.
to address problem areas in both water supply and sewerage systems. The most recent update to the Water and Sewer Master Plan was completed in 2007 and reflects the land use policies of the 1997 General Development Plan, the 16 Small Area Plans, the Town Center Plans and related plan-ning policies that focus on protection of water resources.
Each of Anne Arundel County’s twelve watersheds is listed for two or more water qual-ity impairments (Figure 10-2). The State of Maryland has been involved in an on-going process of developing and promulgating specific Total Maximum Daily Loads (TMDL’s), which are the maximum amount of a pollutant that a waterbody can absorb and still meet water quality standards. The TMDL’s represent mandatory standards for site-specific water quality goals.
The State has issued a nutrient TMDL for the Baltimore Harbor (Patapsco Tidal and Pat-apsco Nontidal watersheds) and bacteria TMDLs for the Magothy, Severn, South, West
An On-Site Sewage Disposal System Evaluation Study and Strategic Plan was completed in early 2008 that provided a Countywide evaluation of the service options available for properties with onsite sewage disposal systems (OSDS, or septic systems). It focused on the most cost-effective approach to reducing nitrogen loads from septic systems. In addi-tion, management areas were defined and evaluated to determine the effectiveness of four treatment approaches: sewer system extensions, cluster wastewater treatment facilities, upgrade individual OSDS to an enhanced OSDS, and no near-term action, which consists of low-density, low-nitrogen delivery onsite systems. More details about this study are found in Chapter 10 and the Background Report on Water Resources.
Stormwater Regulations
Septic System Strategic Plan
Total Maximum Daily Loads
2009GeneralDevelopentPlan
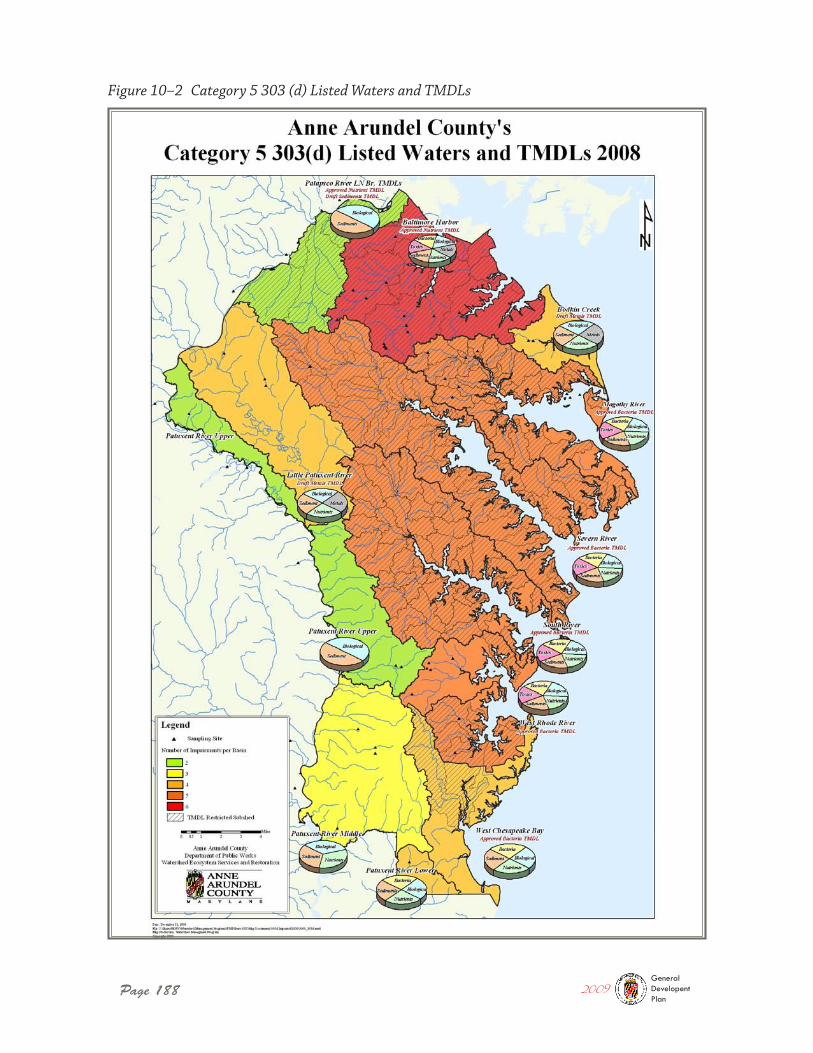
Page 188
Figure 10–2 Category 5 303 (d) Listed Waters and TMDLs
2009GeneralDevelopentPlan
The Water Resources Plan
Page 189
Chapter 10
and West Chesapeake Bay (Herring Bay) Watersheds. Anne Arundel County was allocated 159,318 lbs/year of total Nitrogen and 17,244 lbs/year of total Phosphorous from urban stormwater sources within the Patapsco Tidal and Non Tidal watersheds. These levels are exceeded by the current and future land use projected pollutant loading levels by more than 70%. In addition, the State has issued notice of development of a sediment TMDL for the Patapsco Non Tidal watershed. The Water Resource Element planning framework requires the County to develop implementation plans to mitigate for impacts created by implementation of the Land Use Plan. The County’s Watershed Management Plans, discussed below, will provide the background information and technical support needed to prepare these implementation plans.
Maryland’s water quality standards consist of three components that, together, set goals to protect the State’s water quality. The components are:
1) Designated Uses for each water body (e.g., recreational use, potable water supply);
2) Criteria that set minimum conditions to support the designated use (e.g., dissolved oxygen concentration not less than 5 mg/l at any time); and
3) Antidegradation Policy that recognizes three tiers of water quality and establishes a way to maintain high quality waters such that they are not allowed to degrade to meet only the minimum criteria for their designated use.
The regulatory intent of Maryland’s Antidegradation Policy is to protect the existing designated uses, and the water quality necessary to support those uses, by providing a means for assessing activities that may lower the quality of the State’s high quality waters. For purposes of implementing this policy, waters of the State are categorized into one of three tiers based on their assessed water quality and biological conditions. Tier I waters are those that meet the minimum criteria to support their designated uses. Tier II “high quality” waters are those water bodies where existing conditions are better than the minimum required for their designated use. Tier III Outstanding National Resource Waters (ONRWs) are those water bodies of exceptional quality, where the most stringent protection is both necessary and appropriate to protect and maintain the resource.
Anne Arundel County contains three Tier II stream segments. Two are located on Lyons Creek in the southern portion of the County, along the Calvert County line. A third stream segment was designated as Tier II in 2009 and is located on the Patuxent River west of Crofton, along the Prince George’s County line. These stream segments are designated High Quality Tier II waters due to exceptional aquatic biological community conditions (fish and aquatic benthic macroinvertebrates) in the stream.
State Antidegradation Policy and Tier II Waters
2009GeneralDevelopentPlan
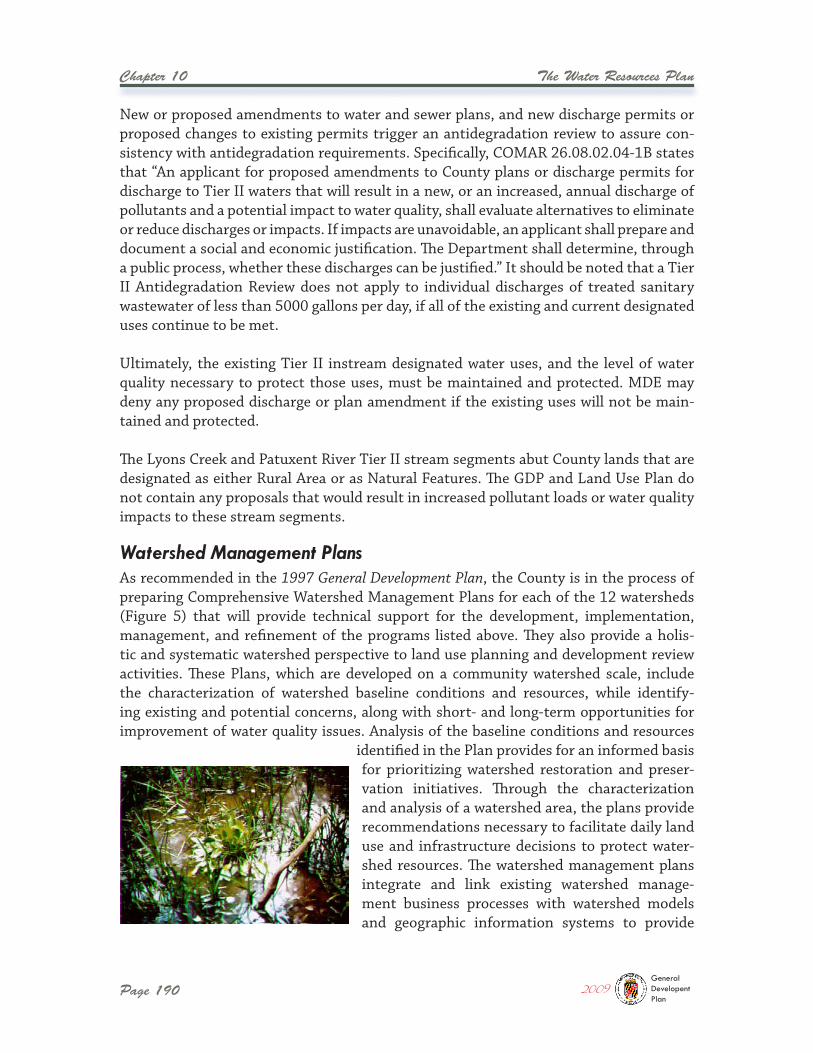
Page 190
Chapter 10 The Water Resources Plan
As recommended in the 1997 General Development Plan, the County is in the process of preparing Comprehensive Watershed Management Plans for each of the 12 watersheds (Figure 5) that will provide technical support for the development, implementation, management, and refinement of the programs listed above. They also provide a holis-tic and systematic watershed perspective to land use planning and development review activities. These Plans, which are developed on a community watershed scale, include the characterization of watershed baseline conditions and resources, while identify-ing existing and potential concerns, along with short- and long-term opportunities for improvement of water quality issues. Analysis of the baseline conditions and resources
identified in the Plan provides for an informed basis for prioritizing watershed restoration and preser-vation initiatives. Through the characterization and analysis of a watershed area, the plans provide recommendations necessary to facilitate daily land use and infrastructure decisions to protect water-shed resources. The watershed management plans integrate and link existing watershed manage-ment business processes with watershed models and geographic information systems to provide
New or proposed amendments to water and sewer plans, and new discharge permits or proposed changes to existing permits trigger an antidegradation review to assure con-sistency with antidegradation requirements. Specifically, COMAR 26.08.02.04-1B states that “An applicant for proposed amendments to County plans or discharge permits for discharge to Tier II waters that will result in a new, or an increased, annual discharge of pollutants and a potential impact to water quality, shall evaluate alternatives to eliminate or reduce discharges or impacts. If impacts are unavoidable, an applicant shall prepare and document a social and economic justification. The Department shall determine, through a public process, whether these discharges can be justified.” It should be noted that a Tier II Antidegradation Review does not apply to individual discharges of treated sanitary wastewater of less than 5000 gallons per day, if all of the existing and current designated uses continue to be met.
Ultimately, the existing Tier II instream designated water uses, and the level of water quality necessary to protect those uses, must be maintained and protected. MDE may deny any proposed discharge or plan amendment if the existing uses will not be main-tained and protected.
The Lyons Creek and Patuxent River Tier II stream segments abut County lands that are designated as either Rural Area or as Natural Features. The GDP and Land Use Plan do not contain any proposals that would result in increased pollutant loads or water quality impacts to these stream segments.
Watershed Management Plans
2009GeneralDevelopentPlan
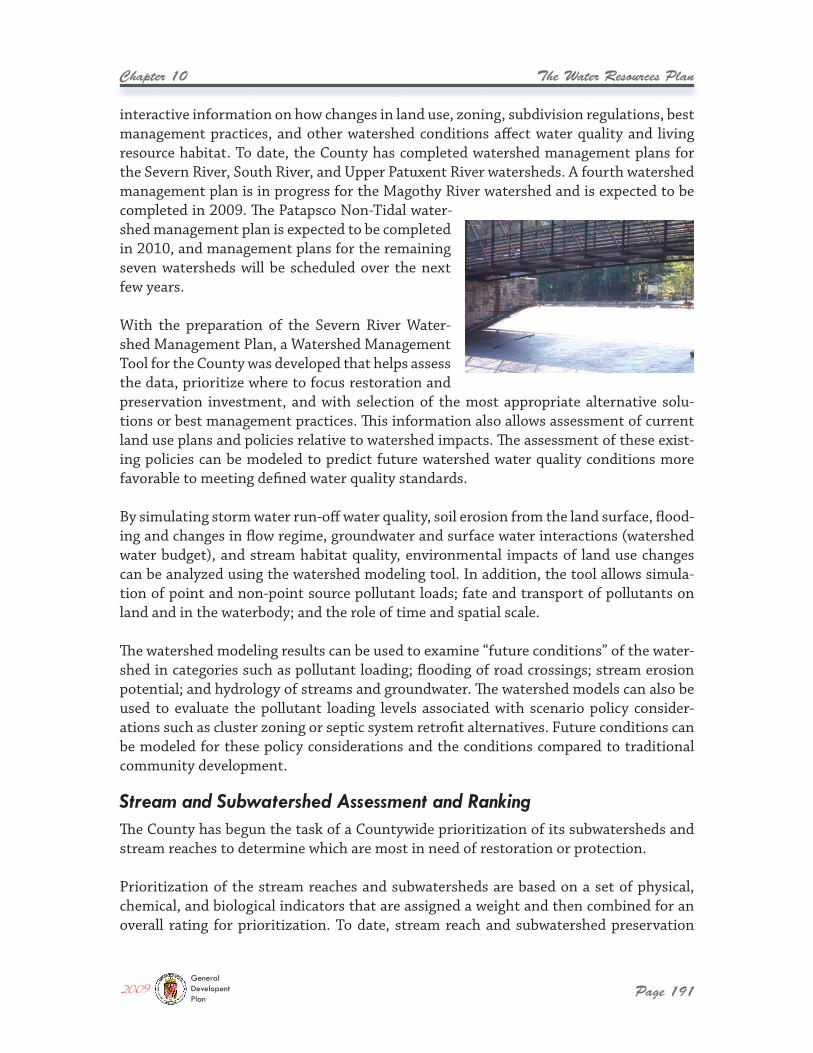
The Water Resources Plan
Page 191
Chapter 10
interactive information on how changes in land use, zoning, subdivision regulations, best management practices, and other watershed conditions affect water quality and living resource habitat. To date, the County has completed watershed management plans for the Severn River, South River, and Upper Patuxent River watersheds. A fourth watershed management plan is in progress for the Magothy River watershed and is expected to be completed in 2009. The Patapsco Non-Tidal water-shed management plan is expected to be completed in 2010, and management plans for the remaining seven watersheds will be scheduled over the next few years.
With the preparation of the Severn River Water-shed Management Plan, a Watershed Management Tool for the County was developed that helps assess the data, prioritize where to focus restoration and preservation investment, and with selection of the most appropriate alternative solu-tions or best management practices. This information also allows assessment of current land use plans and policies relative to watershed impacts. The assessment of these exist-ing policies can be modeled to predict future watershed water quality conditions more favorable to meeting defined water quality standards.
By simulating storm water run-off water quality, soil erosion from the land surface, flood-ing and changes in flow regime, groundwater and surface water interactions (watershed water budget), and stream habitat quality, environmental impacts of land use changes can be analyzed using the watershed modeling tool. In addition, the tool allows simula-tion of point and non-point source pollutant loads; fate and transport of pollutants on land and in the waterbody; and the role of time and spatial scale.
The watershed modeling results can be used to examine “future conditions” of the water-shed in categories such as pollutant loading; flooding of road crossings; stream erosion potential; and hydrology of streams and groundwater. The watershed models can also be used to evaluate the pollutant loading levels associated with scenario policy consider-ations such as cluster zoning or septic system retrofit alternatives. Future conditions can be modeled for these policy considerations and the conditions compared to traditional community development.
The County has begun the task of a Countywide prioritization of its subwatersheds and stream reaches to determine which are most in need of restoration or protection.
Prioritization of the stream reaches and subwatersheds are based on a set of physical, chemical, and biological indicators that are assigned a weight and then combined for an overall rating for prioritization. To date, stream reach and subwatershed preservation
Stream and Subwatershed Assessment and Ranking
2009GeneralDevelopentPlan
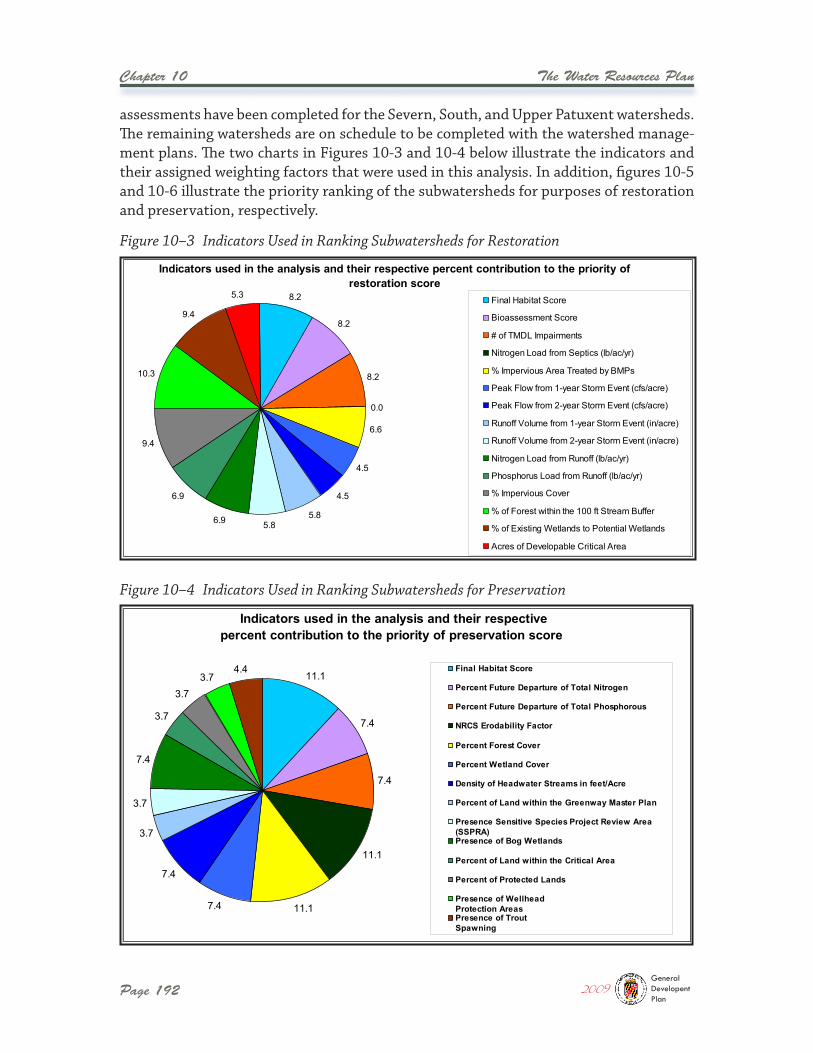
Page 192
Chapter 10 The Water Resources Plan
assessments have been completed for the Severn, South, and Upper Patuxent watersheds. The remaining watersheds are on schedule to be completed with the watershed manage-ment plans. The two charts in Figures 10-3 and 10-4 below illustrate the indicators and their assigned weighting factors that were used in this analysis. In addition, figures 10-5 and 10-6 illustrate the priority ranking of the subwatersheds for purposes of restoration and preservation, respectively.
Figure 10–3 Indicators Used in Ranking Subwatersheds for Restoration
Figure 10–4 Indicators Used in Ranking Subwatersheds for Preservation
2009GeneralDevelopentPlan
Indicators used in the analysis and their respective percent contribution to the priority of restoration score
8.2
8.2
8.2
0.0
6.6
4.5
4.5
5.85.86.9
6.9
9.4
10.3
9.4
5.3 Final Habitat Score
Bioassessment Score
# of TMDL Impairments
Nitrogen Load from Septics (lb/ac/yr)
% Impervious Area Treated by BMPs
Peak Flow from 1-year Storm Event (cfs/acre)
Peak Flow from 2-year Storm Event (cfs/acre)
Runoff Volume from 1-year Storm Event (in/acre)
Runoff Volume from 2-year Storm Event (in/acre)
Nitrogen Load from Runoff (lb/ac/yr)
Phosphorus Load from Runoff (lb/ac/yr)
% Impervious Cover
% of Forest within the 100 ft Stream Buffer
% of Existing Wetlands to Potential Wetlands
Acres of Developable Critical Area
Indicators used in the analysis and their respective percent contribution to the priority of preservation score
11.1
7.4
7.4
11.1
11.17.4
7.4
3.7
3.7
7.4
3.7
3.73.7
4.4 Final Habitat Score
Percent Future Departure of Total Nitrogen
Percent Future Departure of Total Phosphorous
NRCS Erodability Factor
Percent Forest Cover
Percent Wetland Cover
Density of Headwater Streams in feet/Acre
Percent of Land within the Greenway Master Plan
Presence Sensitive Species Project Review Area(SSPRA)Presence of Bog Wetlands
Percent of Land within the Critical Area
Percent of Protected Lands
Presence of WellheadProtection AreasPresence of TroutSpawning
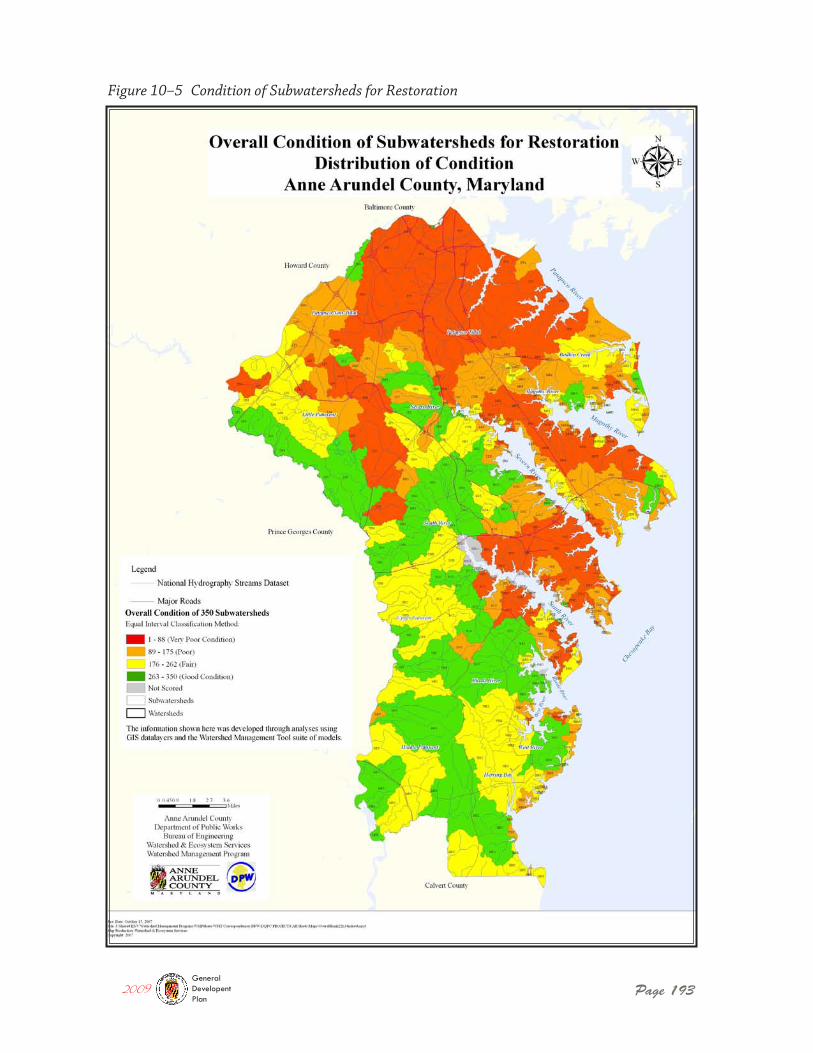
Page 193
Figure 10–5 Condition of Subwatersheds for Restoration
2009GeneralDevelopentPlan
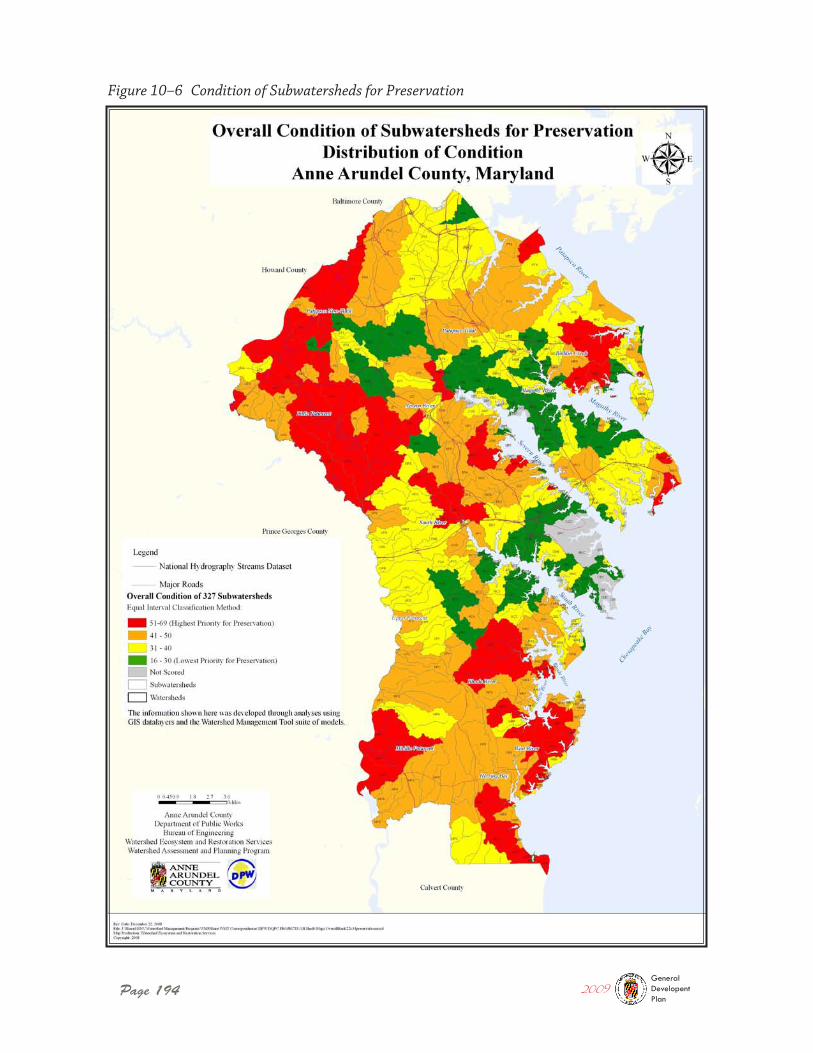
Page 194
Figure 10–6 Condition of Subwatersheds for Preservation
2009GeneralDevelopentPlan
The Water Resources Plan
Page 195
Chapter 10
The County utilized the data repository and modeling components within the Watershed Management Tool to evaluate the current, future, and restoration/preservation land use plan scenarios. The degree of impact that proposed development will have on watershed conditions such as pollutant loads and stream flows were modeled and evaluation criteria were set to allow restoration and preservation scenarios to be compared economically on the basis of cost/benefit ratio. This analysis can be used to help guide expenditure decisions out of the County’s limited environmental Capital Improvement Program (CIP) fund.
This targeted nutrient reduction strategy has been included in the overall watershed management program. Evaluations have been conducted for the Severn River, South River, Upper Patuxent River, and the Patapsco Non Tidal and Tidal Watersheds. Efforts are underway to develop implementation plans for the remaining watersheds within the County in accordance with the Comprehensive Watershed Study Master Planning schedule.
Most of the existing water supply for Anne Arundel County comes from groundwater supplied by the confined Patuxent, Patapsco, Magothy and Aquia aquifers; however, some of the water that serves residents in the North County area is purchased from Baltimore City and comes from surface water sources.
The City of Annapolis owns and operates its own water supply system and uses ground-water from the Magothy and Patapsco aquifers. In addition, Fort Meade has its own private water system that includes six groundwater wells. The Fort Meade system’s pri-mary source of water is the surface water from the Little Patuxent River, which provides approximately 80% of the water used. The remaining 20% is provided by groundwater pumped from the six wells.
The Rural service area utilizes individual private wells and receives water primarily from the Aquia aquifer. Figure 10-7 is a map that shows water service within the County. The areas that are depicted as ‘Existing’, ‘Existing – City of Annapolis’, ‘Capital Facilities’, ‘Planned’ and ‘Future’ comprise the ultimate area planned to be served by public water. The area of the County shown as ‘No Public Service’ is to be served by private wells. There are some facilities that are privately operated, such as Fort Meade. These facilities are shown as ‘Other’.
Targeted Nutrient Reduction Implementation Plans
Assessment of Water Supply Capacity
2009GeneralDevelopentPlan
Page 196
Chapter 10 The Water Resources Plan
Although the groundwater supply is not as vulnerable to decline due to drought, water levels in all of the confined aquifers supplying the County have been declining for sev-eral decades due to population growth and thus increases in use. Continued water level declines could affect the long-term sustainability of ground-water resources, particularly in areas projected for heavy growth. There have been several studies conducted to deter-mine the availability and quality of water supply from the County’s aquifers. The most recent include: Optimization of Groundwater Withdrawals in Anne Arundel County, Mary-land, From the Upper Patapsco, Lower Patapsco and Patuxent Aquifers Projected through 2044 and Future of Water Supply From the Aquia and Magothy Aquifers in Southern Anne Arundel County, Maryland, both conducted by the Maryland Geological Survey (MGS).
In 2007, Optimization of Groundwater Withdrawals in Anne Arundel County, Maryland, From the Upper Patapsco, Lower Patapsco and Patuxent Aquifers Projected though 2044 was prepared by the MGS in cooperation with the County. This report found that in response to pumping, water levels in the County have declined. However, the study found that sufficient groundwater is available to supply the projected demand through the year 2040 at 73 MGD while supplying water to other users in Anne Arundel County and the surrounding counties at permitted levels. An increase in demand could result in water levels falling below the regulatory management levels in some areas, groundwater well operational problems, increased pumping costs and reduced stream baseflow. Meeting projected demand and minimizing impacts will require construction of new wells and well fields, redistributing withdrawals to other wells, and careful well design.
The Future of Water Supply From the Aquia and Magothy Aquifers in Southern Anne Arun-del County, Maryland, conducted in 2002 by the MGS concluded that in some areas of southern Anne Arundel County, water levels are approaching or have exceeded the 80% management level due to the combination of increase in localized domestic use and large users in neighboring Calvert County. The model determined that an additional 0.8 MGD withdrawn from the Aquia and Magothy aquifers to serve a projected population of 32,750 in southern Anne Arundel County combined with regional withdrawals from other counties would cause water levels in the Aquia aquifer to decline. The Aquia could supply the projected water demand in most of the area; however, portions of southern Anne Arundel County would exceed the 80% management level. The Magothy aquifer can supply the projected increase in water demand without a significant reduction in avail-able drawdown.
The study also concluded that if withdrawals in the Aquia and Magothy aquifers were held constant in the County and surrounding areas at the 2000 amount, water levels in the Aquia would stabilize in less than a year and in the Magothy, would stabilize in approximately 3 months. Even though there is sufficient available drawdown in a portion of the Aquia, the study stated that an increase in withdrawals will cause water levels to further exceed the management level, and therefore concluded that the Aquia aquifer
Groundwater Supply, Demand, and Capacity
2009GeneralDevelopentPlan
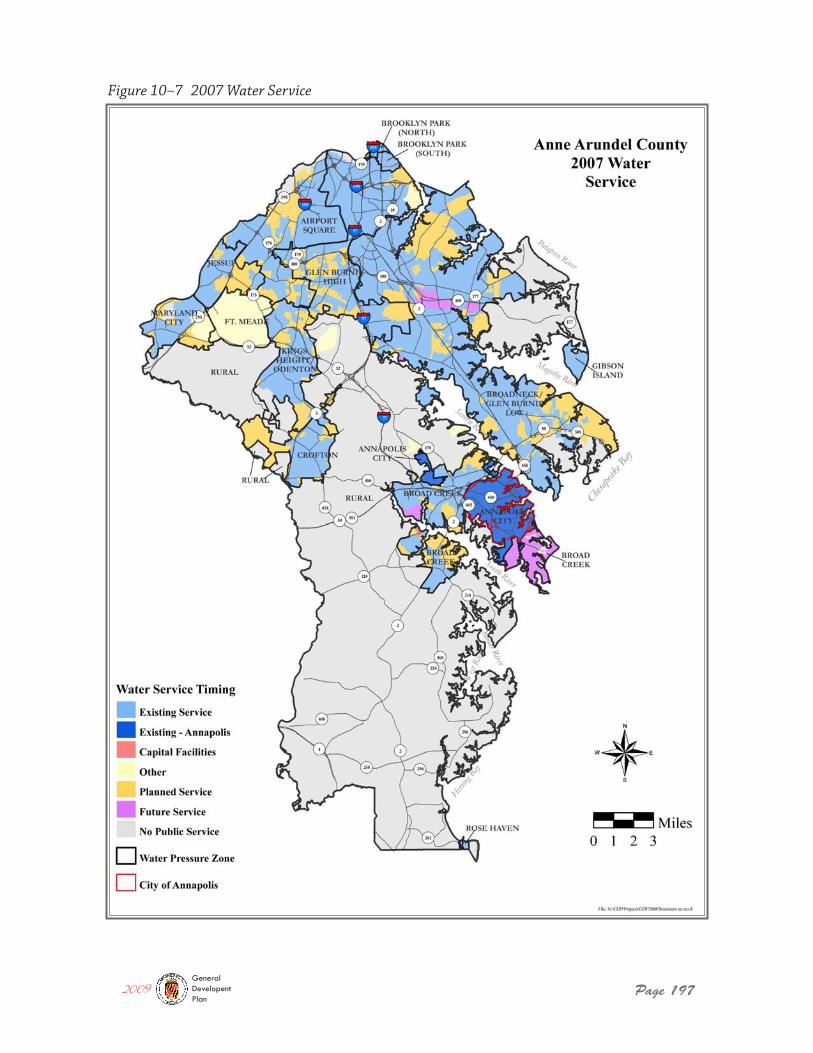
Page 197
Figure 10–7 2007 Water Service
2009GeneralDevelopentPlan
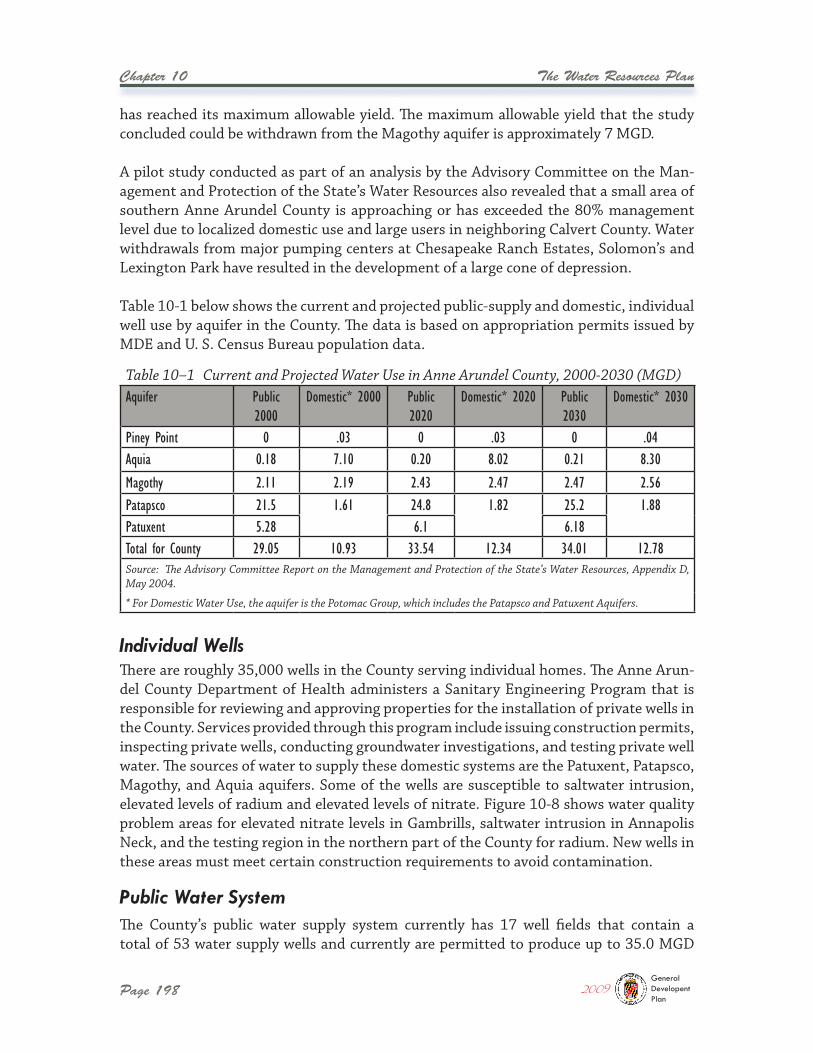
Page 198
Chapter 10 The Water Resources Plan
has reached its maximum allowable yield. The maximum allowable yield that the study concluded could be withdrawn from the Magothy aquifer is approximately 7 MGD.
A pilot study conducted as part of an analysis by the Advisory Committee on the Man-agement and Protection of the State’s Water Resources also revealed that a small area of southern Anne Arundel County is approaching or has exceeded the 80% management level due to localized domestic use and large users in neighboring Calvert County. Water withdrawals from major pumping centers at Chesapeake Ranch Estates, Solomon’s and Lexington Park have resulted in the development of a large cone of depression.
Table 10-1 below shows the current and projected public-supply and domestic, individual well use by aquifer in the County. The data is based on appropriation permits issued by MDE and U. S. Census Bureau population data.
There are roughly 35,000 wells in the County serving individual homes. The Anne Arun-del County Department of Health administers a Sanitary Engineering Program that is responsible for reviewing and approving properties for the installation of private wells in the County. Services provided through this program include issuing construction permits, inspecting private wells, conducting groundwater investigations, and testing private well water. The sources of water to supply these domestic systems are the Patuxent, Patapsco, Magothy, and Aquia aquifers. Some of the wells are susceptible to saltwater intrusion, elevated levels of radium and elevated levels of nitrate. Figure 10-8 shows water quality problem areas for elevated nitrate levels in Gambrills, saltwater intrusion in Annapolis Neck, and the testing region in the northern part of the County for radium. New wells in these areas must meet certain construction requirements to avoid contamination.
The County’s public water supply system currently has 17 well fields that contain a total of 53 water supply wells and currently are permitted to produce up to 35.0 MGD
Table 10–1 Current and Projected Water Use in Anne Arundel County, 2000-2030 (MGD)Aquifer Public
2000Domestic* 2000 Public
2020Domestic* 2020 Public
2030Domestic* 2030
Piney Point 0 .03 0 .03 0 .04Aquia 0.18 7.10 0.20 8.02 0.21 8.30Magothy 2.11 2.19 2.43 2.47 2.47 2.56Patapsco 21.5 1.61 24.8 1.82 25.2 1.88Patuxent 5.28 6.1 6.18Total for County 29.05 10.93 33.54 12.34 34.01 12.78Source: The Advisory Committee Report on the Management and Protection of the State’s Water Resources, Appendix D, May 2004.
* For Domestic Water Use, the aquifer is the Potomac Group, which includes the Patapsco and Patuxent Aquifers.
Individual Wells
Public Water System
2009GeneralDevelopentPlan
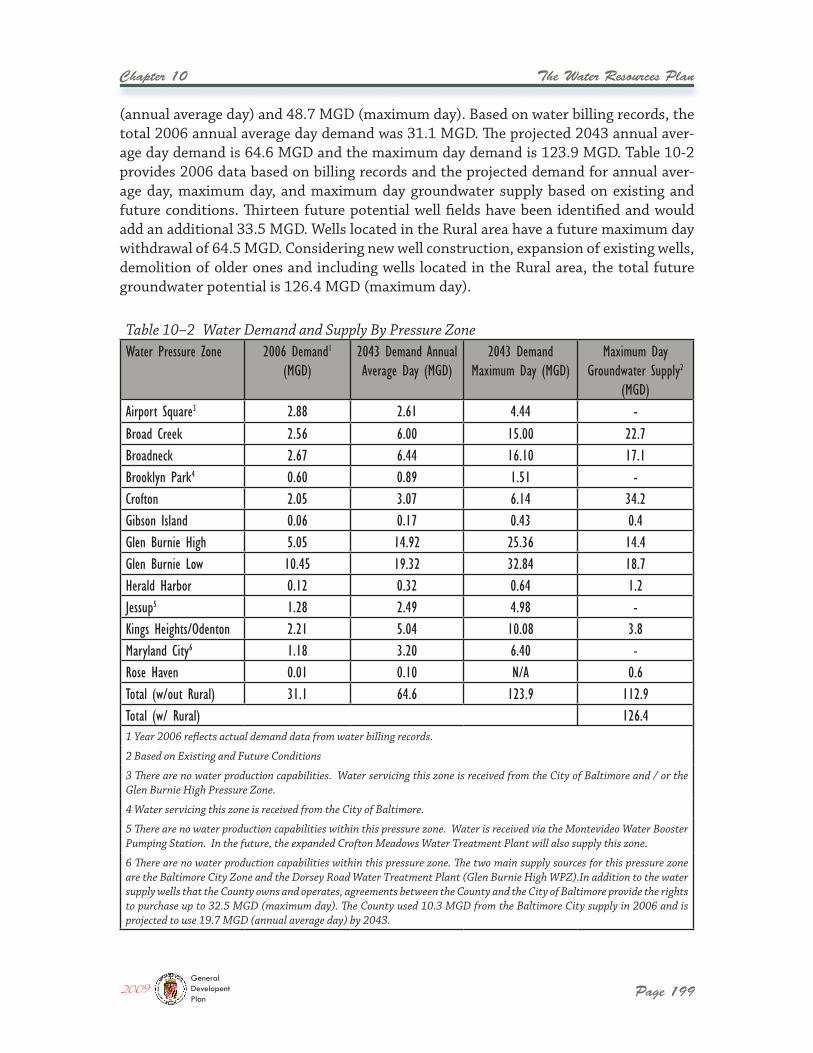
The Water Resources Plan
Page 199
Chapter 10
(annual average day) and 48.7 MGD (maximum day). Based on water billing records, the total 2006 annual average day demand was 31.1 MGD. The projected 2043 annual aver-age day demand is 64.6 MGD and the maximum day demand is 123.9 MGD. Table 10-2 provides 2006 data based on billing records and the projected demand for annual aver-age day, maximum day, and maximum day groundwater supply based on existing and future conditions. Thirteen future potential well fields have been identified and would add an additional 33.5 MGD. Wells located in the Rural area have a future maximum day withdrawal of 64.5 MGD. Considering new well construction, expansion of existing wells, demolition of older ones and including wells located in the Rural area, the total future groundwater potential is 126.4 MGD (maximum day).
Table 10–2 Water Demand and Supply By Pressure ZoneWater Pressure Zone 2006 Demand1
(MGD)2043 Demand Annual Average Day (MGD)
2043 Demand Maximum Day (MGD)
Maximum Day Groundwater Supply2
(MGD)Airport Square3 2.88 2.61 4.44 -Broad Creek 2.56 6.00 15.00 22.7Broadneck 2.67 6.44 16.10 17.1Brooklyn Park4 0.60 0.89 1.51 -Crofton 2.05 3.07 6.14 34.2Gibson Island 0.06 0.17 0.43 0.4Glen Burnie High 5.05 14.92 25.36 14.4Glen Burnie Low 10.45 19.32 32.84 18.7Herald Harbor 0.12 0.32 0.64 1.2Jessup5 1.28 2.49 4.98 -Kings Heights/Odenton 2.21 5.04 10.08 3.8Maryland City6 1.18 3.20 6.40 -Rose Haven 0.01 0.10 N/A 0.6Total (w/out Rural) 31.1 64.6 123.9 112.9Total (w/ Rural) 126.41 Year 2006 reflects actual demand data from water billing records.
2 Based on Existing and Future Conditions
3 There are no water production capabilities. Water servicing this zone is received from the City of Baltimore and / or the Glen Burnie High Pressure Zone.
4 Water servicing this zone is received from the City of Baltimore.
5 There are no water production capabilities within this pressure zone. Water is received via the Montevideo Water Booster Pumping Station. In the future, the expanded Crofton Meadows Water Treatment Plant will also supply this zone.
6 There are no water production capabilities within this pressure zone. The two main supply sources for this pressure zone are the Baltimore City Zone and the Dorsey Road Water Treatment Plant (Glen Burnie High WPZ).In addition to the water supply wells that the County owns and operates, agreements between the County and the City of Baltimore provide the rights to purchase up to 32.5 MGD (maximum day). The County used 10.3 MGD from the Baltimore City supply in 2006 and is projected to use 19.7 MGD (annual average day) by 2043.
2009GeneralDevelopentPlan
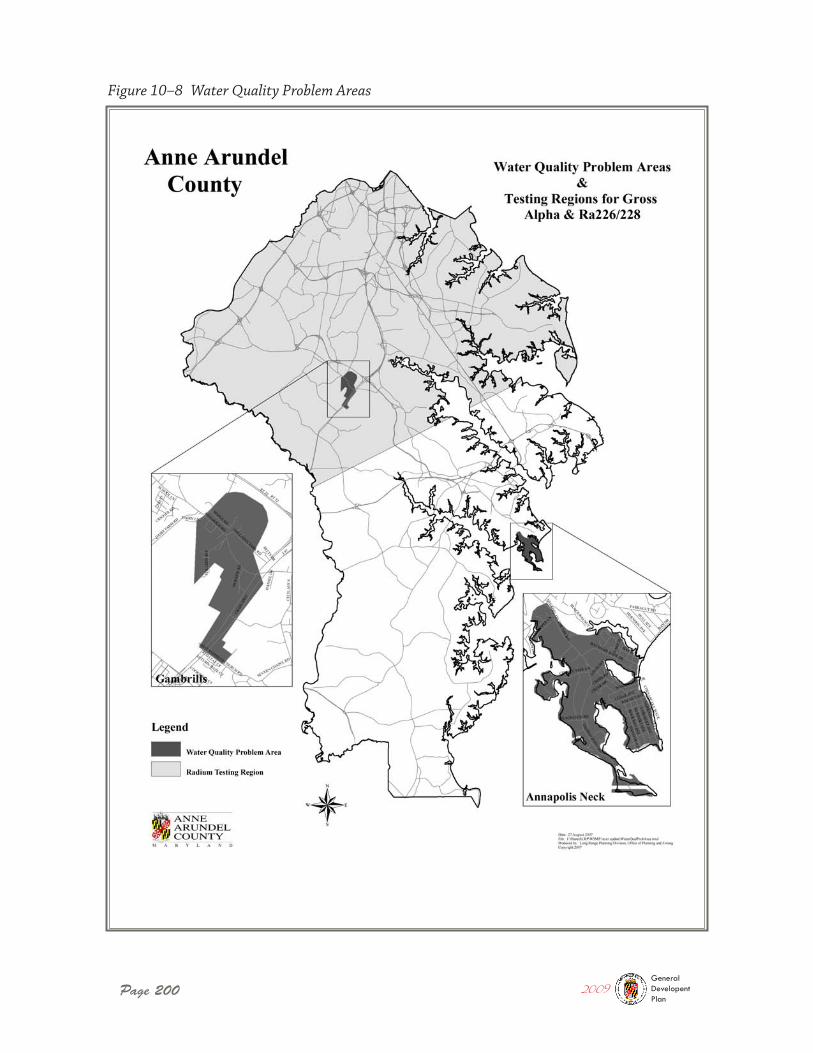
Page 200
Figure 10–8 Water Quality Problem Areas
2009GeneralDevelopentPlan
The Water Resources Plan
Page 201
Chapter 10
The 2003 Comprehensive Water Strategic Plan identified three objectives to have the produc-tion facility infrastructure necessary for meeting the expected growth while optimizing the use of potential County groundwater resources. To meet those objectives, expan-sion of existing facilities and development of new facilities are proposed. The objectives include:
� Centralize facilities when possible, � Create flexibility whereby water could be transmitted across pressure zones, and � Reduce reliance on the City of Baltimore.
The County 2003 Comprehensive Water Strategic Plan developed water demand projections for the planning period 2000 to 2025 and for build-out conditions, estimated to be in 2043. These demand projections were calculated using zoning, flow factors, and water and sewer timing categories.
The projected maximum day demand for the entire public water system including all pres-sure zones is estimated at 97.9 MGD for the projection year of 2025 (see Table 3-2 in the 2007 Master Plan for Water Supply and Sewerage Systems). The estimated maximum day groundwater supply of 112.9 MGD for the entire system will be adequate to meet projected demand. While the projected year 2043 maximum day demand of 123.9 MGD exceeds the estimated supply, the 2043 projection represents a hypothetical ‘build out’ or worst case scenario. As the water demand approaches the supply limits in the future, the County will continue to make needed adjustments in the public system which may include expansion of existing facilities and increasing flexibility between water pressure zones. More detailed information including demand projections in five-year intervals through 2025 may be found in the 2007 Master Plan for Water Supply and Sewerage Systems.
The City of Annapolis has proposed a Municipal Growth Boundary in its 2009 Compre-hensive Plan [Draft] that provides for the modest expansion of City limits in two areas of approximately 90 acres and 16 acres respectively. The areas are currently developed but are considered opportunity areas for redevelopment if annexed into the City. In terms of public water and sewer, impacts on system capacities resulting from these future annexations would be minimal. Both areas are currently served or planned for service by public sewer within the County’s Annapolis Sewer Service Area, which includes the City of Annapolis. Capacity in the sewer service area is projected to be adequate to serve any increased flow anticipated from future redevelopment plans, as presented in the City’s Comprehensive Plan. Likewise, public water is currently provided to these two areas within the City’s water system and the County’s Broad Creek water pressure zone. Public water supply will be adequate to serve redevelopment of these two areas.
2009GeneralDevelopentPlan
Page 202
Chapter 10 The Water Resources Plan
Eleven separate and distinct sewer service areas have been established for the purpose of providing sewerage facilities to serve Anne Arundel County. Figure 10-9 is a map that shows sewer service within the County. The areas that are depicted as ‘Existing’, ‘Capital
In addition to private wells serving individual homes, there are over 530 community water systems in the County that are operated privately or by a non-County entity. The source of water for these wells is the Patuxent, Patapsco, Magothy and Aquia aquifers. These facilities typically maintain their own water treatment facilities. They are regulated by the Environmental Protection Agency who categorizes the wells into three types:
� Community Water Systems (CWS) – those systems that serve the same people year-round such as mobile home parks, businesses, or smaller communities,
� Non-Transient Non Community Water Systems (NTNC) – those systems that serve the same people but not year-round such as schools, and
� Transient Non-Community Water Systems (TNCWS) – those systems that do not consistently serve the same people such as parks, restaurants and gas stations.
Source Water Assessments have been completed for all of the County’s water supply facilities and include identification of potential sources of contamination and the suscep-tibility of each water supply source to contamination. Potential contamination threats identified include unused or improperly constructed wells. The Water and Sewer Master Plan recommends that these wells be abandoned per State well construction regulations in order to protect the drinking water sources.
The County also contracted to have a broader analysis on wellhead protection initiatives conducted for the Glen Burnie and Annapolis areas. The study, completed in 2003, found some susceptibility to contaminants in the Glen Burnie area. Recommendations include development of a Wellhead Protection Fund and education on best management prac-tices to existing homeowners and businesses located within areas identified as having the highest susceptibility for point source contamination.
The County has also done significant work in collaboration with the State to identify potential contaminant sources and perform a hydro-geological study of the County. This effort has established the groundwork for the County to pursue a wellhead protection program using the State’s model ordinance as a guideline. In addition, the County Health Department currently maintains a Groundwater Protection Plan for private water sup-plies which documents and summarizes policies and programs regarding onsite sewage disposal systems and the protection of groundwater where public sewer is not available. More detailed information on the topic of wellhead protection is found in the County’s Water and Sewer Master Plan.
Wastewater Demand and Capacity
Other Water Supply Systems
Wellhead Protection
2009GeneralDevelopentPlan
The Water Resources Plan
Page 203
Chapter 10
According to the 2007 WSMP, the area currently served by public sewer is approximately 27% of the County and the ultimate area to be served is 44%. Of the eleven sewer service areas, eight are served by facilities owned and operated by the County. Two of the service areas have conveyance systems that are operated and maintained by the County but the treatment facilities are located in neighboring jurisdictions. Intra-jurisdictional agree-ments permit the transport of wastewater from the Baltimore City Sewer Service Area to the Patapsco Sewage Treatment Plant in Baltimore City and from the Rose Haven / Holland Point Sewer Service Area to the Chesapeake Beach Wastewater Treatment Plant in Calvert County. Piney Orchard Sewer Service Area is a privately owned and operated treatment facility; however, the collection system is owned and maintained by the County. There are over 111,000 public sewer connections and approximately 34.1 MGD (2005 total flow) are treated. The projected total flow at build-out is 74.16 MGD assuming full development of all property in the sewer service area at current zoning.
Between 2003 and 2007, the County conducted and completed a Comprehensive Sewer Strategic Plan (CSSP) for the Annapolis, Baltimore City, Broadneck, Broadwater, Cox Creek, Maryland City and Patuxent Sewer Service Areas. The CSSP was a 2-phase approach for planning the future modifications and expansion of the existing wastewater collection and treatment system. In Phase I of the study, the County’s wastewater treatment plants were evaluated on a number of criteria including the State’s anticipated effluent total nitrogen discharge goals and other future discharge permit requirements. Phase 2 evalu-ated ways to expand or modify the existing wastewater conveyance system to route flow toward treatment plants with the most available capacity to accommodate future growth in a cost effective manner. The major recommendations and findings of this study were incorporated into the 2007 WSMP.
Facilities’, ‘Planned’ and ‘Future’ comprise the ultimate area to be served by public sewer. There are some facilities that are privately operated, such as B.W.I. Airport, the US Naval Academy and Fort Meade. These facilities are shown as ‘Other’. The remaining land is shown as ‘No Public Service’. It is designated as Rural, is not planned for service by public sewer facilities and is or will be served by septic systems.
Public Sewer
2009GeneralDevelopentPlan
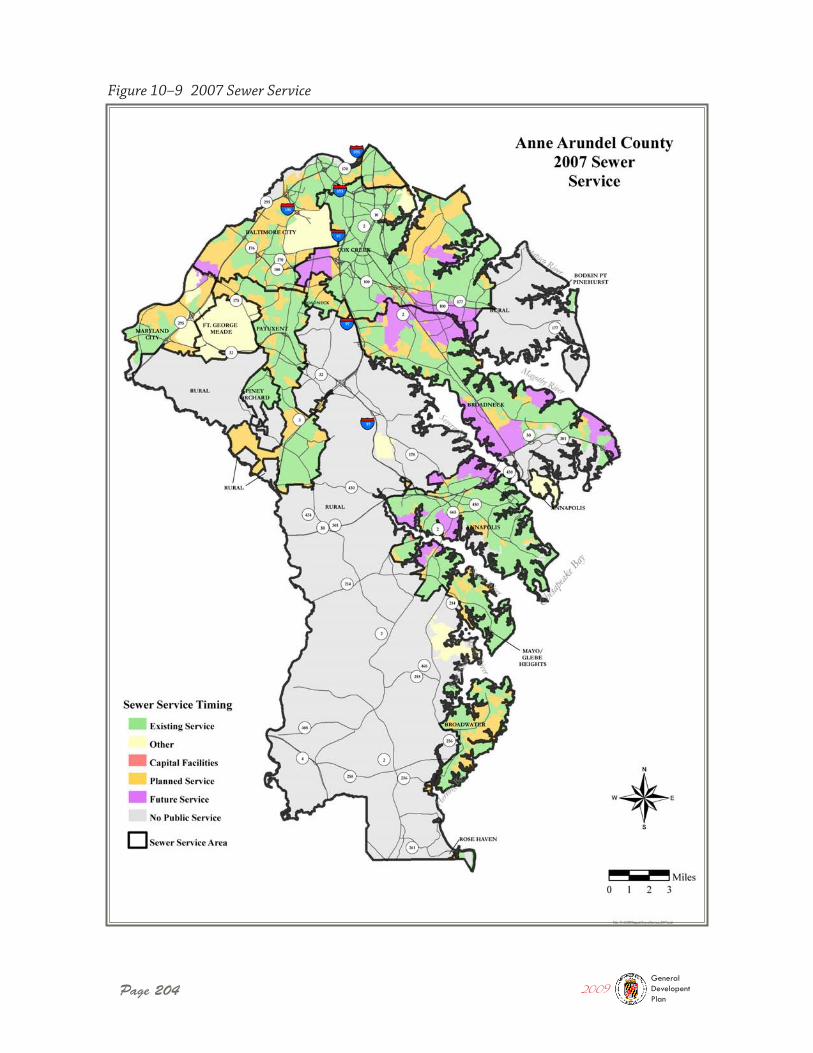
Page 204
Figure 10–9 2007 Sewer Service
2009GeneralDevelopentPlan
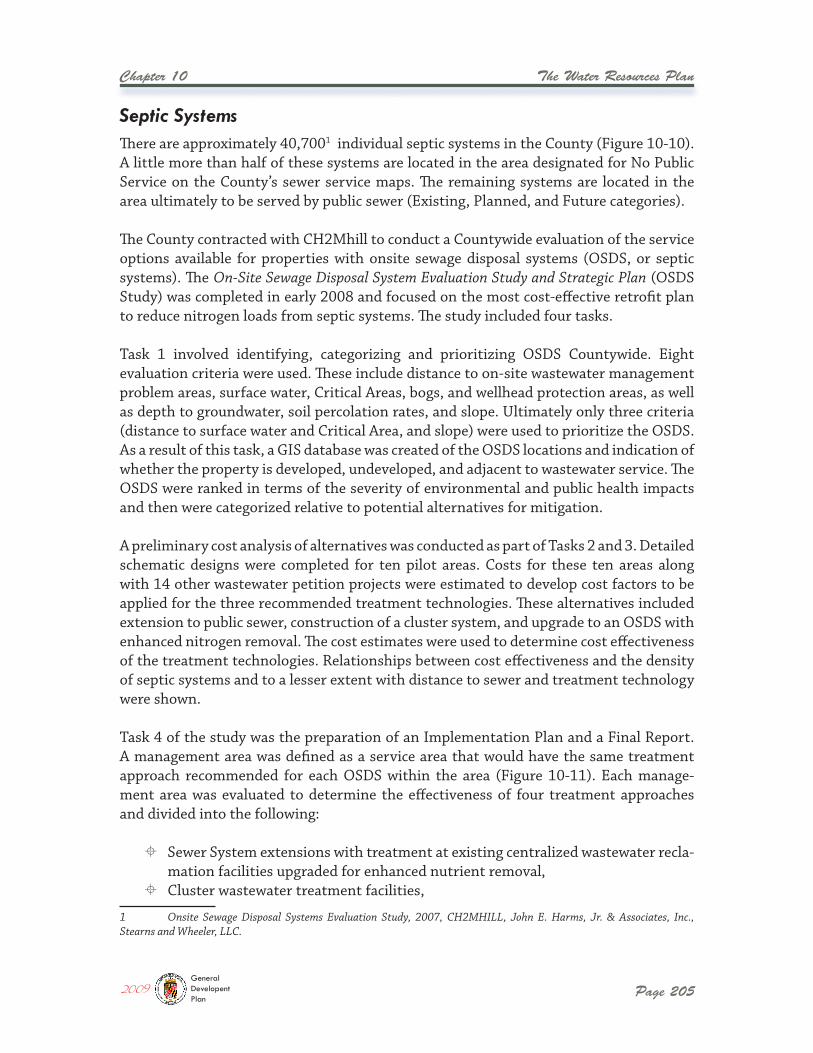
The Water Resources Plan
Page 205
Chapter 10
There are approximately 40,7001 individual septic systems in the County (Figure 10-10). A little more than half of these systems are located in the area designated for No Public Service on the County’s sewer service maps. The remaining systems are located in the area ultimately to be served by public sewer (Existing, Planned, and Future categories).
The County contracted with CH2Mhill to conduct a Countywide evaluation of the service options available for properties with onsite sewage disposal systems (OSDS, or septic systems). The On-Site Sewage Disposal System Evaluation Study and Strategic Plan (OSDS Study) was completed in early 2008 and focused on the most cost-effective retrofit plan to reduce nitrogen loads from septic systems. The study included four tasks.
Task 1 involved identifying, categorizing and prioritizing OSDS Countywide. Eight evaluation criteria were used. These include distance to on-site wastewater management problem areas, surface water, Critical Areas, bogs, and wellhead protection areas, as well as depth to groundwater, soil percolation rates, and slope. Ultimately only three criteria (distance to surface water and Critical Area, and slope) were used to prioritize the OSDS. As a result of this task, a GIS database was created of the OSDS locations and indication of whether the property is developed, undeveloped, and adjacent to wastewater service. The OSDS were ranked in terms of the severity of environmental and public health impacts and then were categorized relative to potential alternatives for mitigation.
A preliminary cost analysis of alternatives was conducted as part of Tasks 2 and 3. Detailed schematic designs were completed for ten pilot areas. Costs for these ten areas along with 14 other wastewater petition projects were estimated to develop cost factors to be applied for the three recommended treatment technologies. These alternatives included extension to public sewer, construction of a cluster system, and upgrade to an OSDS with enhanced nitrogen removal. The cost estimates were used to determine cost effectiveness of the treatment technologies. Relationships between cost effectiveness and the density of septic systems and to a lesser extent with distance to sewer and treatment technology were shown.
Task 4 of the study was the preparation of an Implementation Plan and a Final Report. A management area was defined as a service area that would have the same treatment approach recommended for each OSDS within the area (Figure 10-11). Each manage-ment area was evaluated to determine the effectiveness of four treatment approaches and divided into the following:
� Sewer System extensions with treatment at existing centralized wastewater recla-mation facilities upgraded for enhanced nutrient removal,
� Cluster wastewater treatment facilities,
1 Onsite Sewage Disposal Systems Evaluation Study, 2007, CH2MHILL, John E. Harms, Jr. & Associates, Inc., Stearns and Wheeler, LLC.
Septic Systems
2009GeneralDevelopentPlan
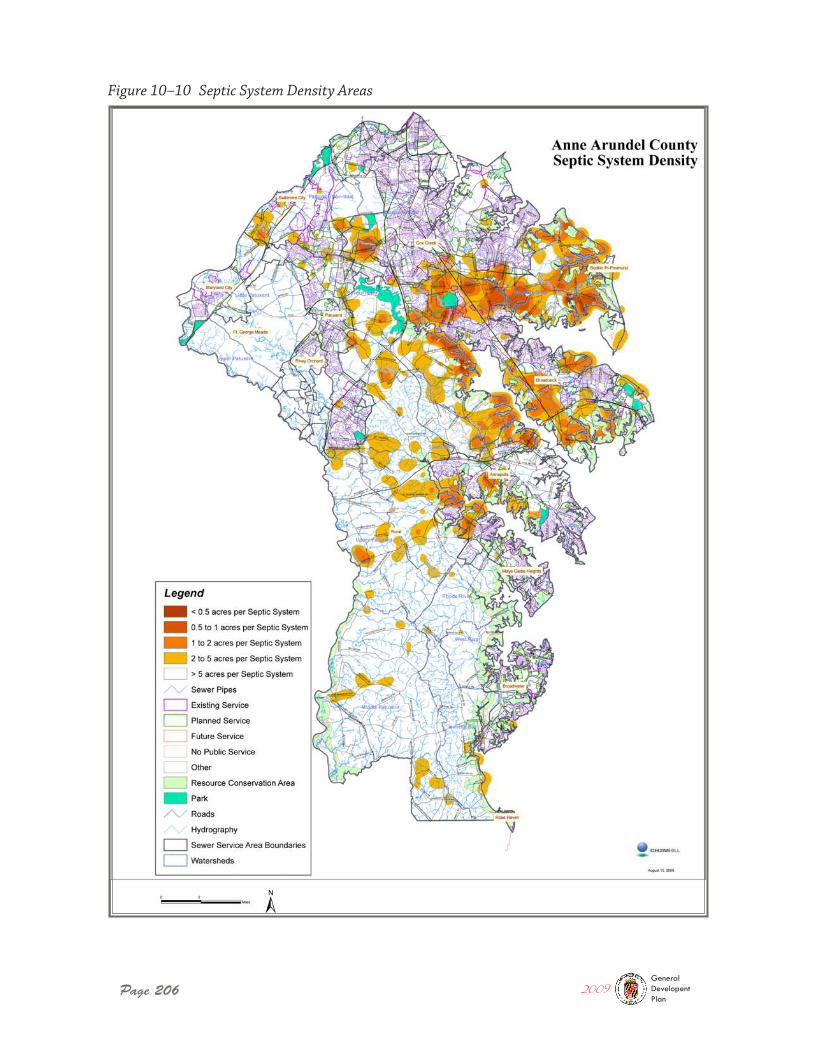
Page 206
Figure 10–10 Septic System Density Areas
2009GeneralDevelopentPlan
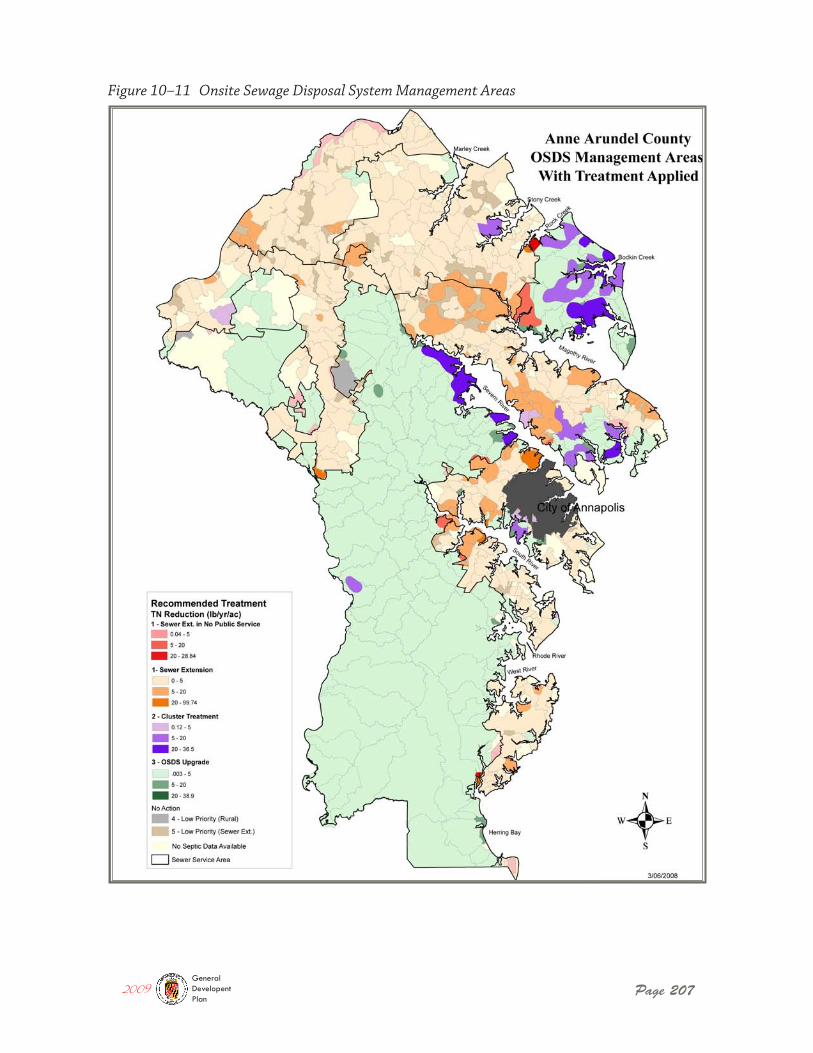
Page 207
Figure 10–11 Onsite Sewage Disposal System Management Areas
2009GeneralDevelopentPlan
Page 208
Chapter 10 The Water Resources Plan
� Upgrade each individual OSDS to an OSDS with enhanced nitrogen removal, and � No near-term action, which consists of low-density, low-nitrogen delivery onsite
systems.
Cost factors developed in Tasks 2 and 3 were applied to the recommended treatment approach for each management area. The management areas were then ranked based on the aggregate cost effectiveness of all OSDS within each area (pounds of nitrogen reduc-tion per OSDS). In addition, several policy issues were identified for consideration in the selection of future treatment approaches and implementation policies for the County’s onsite systems. These included permitting issues, Chesapeake Bay Restoration Fund eli-gibility, and compatibility with County comprehensive plans.
The current total design capacity of the County’s wastewater treatment plants with BNR upgrades is 46.64 MGD. The maximum total capacity based on the nutrient caps with the ENR upgrades is 62.2 MGD.
Tables 10-3 and 10-4 provide nitrogen and phosphorus pollutant loads for each of the water reclamation facilities based on existing conditions, build-out conditions based on the 2004 Land Use Plan and build-out conditions based on the 2009 Land Use Plan. The projected build-out wastewater flows assume full development of all property in the sewer service area at current zoning, consistent with the Land Use Plan.
In the Broadneck, Broadwater, Patuxent, Baltimore City, Cox Creek and Bodkin Point sewer service areas, build-out flows exceed the WRF’s permitted capacity under the 2004 or the 2009 Land Use Plan. Additionally, in the Maryland City Sewer Service Area, build-out flows will exceed the WRF’s permitted capacity. The County anticipates that during the planned expansions of these facilities, TMDL requirements will result in more strin-gent NPDES Permit limits thereby requiring costly facility upgrades. These upgrades will decrease available acreage at each WRF plant site. In order to support planned growth and accommodation of the TDML regulations, the County is investigating alternatives at those WRF sites with restricted acreage to redirect existing and future flows to service areas where facility sites can best support future upgrades and meet loading require-ments. In the event that feasible alternatives cannot be identified or the advancement of treatment technologies lags, the TMDL regulations could restrict future land use and could conflict with Smart Growth initiatives.
Current and Projected Pollutant LoadsWater Reclamation Facility Loads
2009GeneralDevelopentPlan
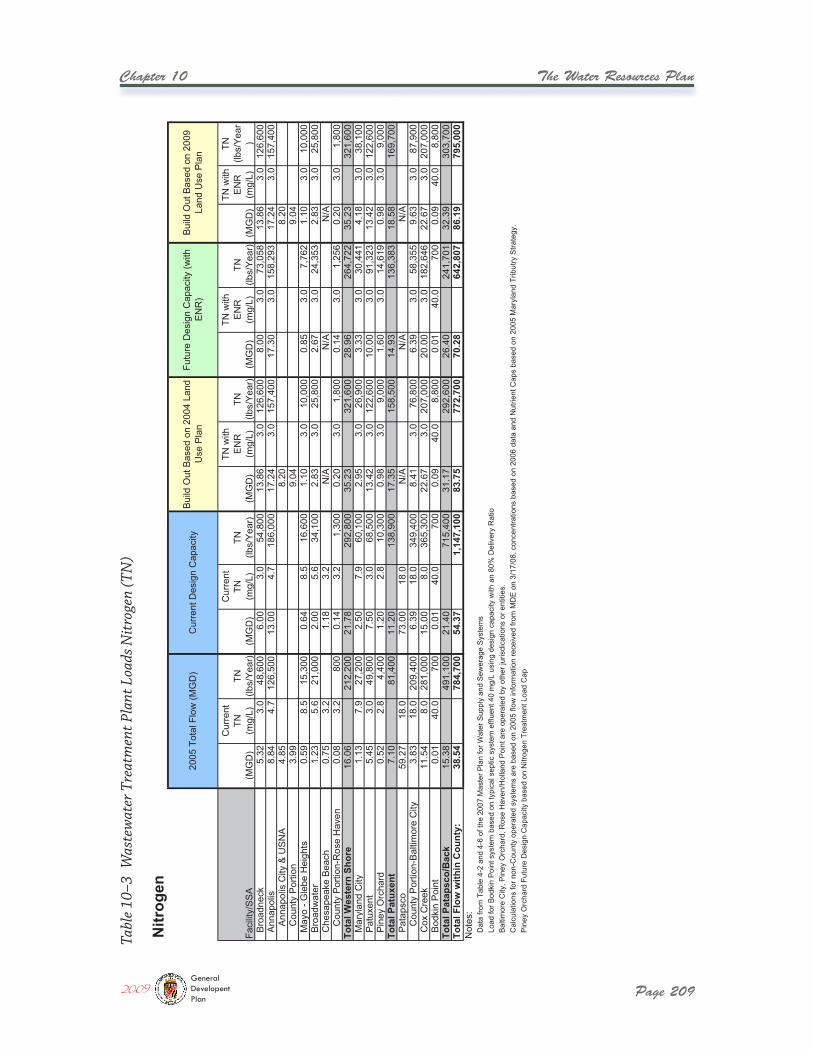
The Water Resources Plan
Page 209
Chapter 10
Tabl
e 10
–3 W
aste
wat
er T
reat
men
t Pla
nt L
oads
Nit
roge
n (T
N)
2009GeneralDevelopentPlan
Nitr
ogen
Faci
lity/
SS
A(M
GD
)
Cur
rent
TN(m
g/L)
TN(lb
s/Y
ear)
(MG
D)
Cur
rent
TN(m
g/L)
TN(lb
s/Y
ear)
(MG
D)
TN w
ith
EN
R(m
g/L)
TN(lb
s/Y
ear)
(MG
D)
TN w
ith
EN
R(m
g/L)
TN(lb
s/Y
ear)
(MG
D)
TN w
ith
EN
R(m
g/L)
TN(lb
s/Y
ear
)B
road
neck
5.32
3.0
48,6
006.
003.
054
,800
13.8
63.
012
6,60
08.
003.
073
,058
13.8
63.
012
6,60
0A
nnap
olis
8.84
4.7
126,
500
13.0
04.
718
6,00
017
.24
3.0
157,
400
17.3
03.
015
8,29
317
.24
3.0
157,
400
Ann
apol
is C
ity &
US
NA
4.85
8.20
8.20
Cou
nty
Por
tion
3.99
9.04
9.04
Ma y
o - G
lebe
Hei
ghts
0.59
8.5
15,3
000.
648.
516
,600
1.10
3.0
10,0
000.
853.
07,
762
1.10
3.0
10,0
00B
road
wat
er1.
235.
621
,000
2.00
5.6
34,1
002.
833.
025
,800
2.67
3.0
24,3
532.
833.
025
,800
Che
sape
ake
Bea
ch0.
753.
21.
183.
2N
/AN
/AN
/AC
ount
y P
ortio
n-R
ose
Hav
en0.
083.
280
00.
143.
21,
300
0.20
3.0
1,80
00.
143.
01,
256
0.20
3.0
1,80
0To
tal W
este
rn S
hore
16.0
621
2,20
021
.78
292,
800
35.2
332
1,60
028
.96
264,
722
35.2
332
1,60
0M
aryl
and
City
1.13
7.9
27,2
002.
507.
960
,100
2.95
3.0
26,9
003.
333.
030
,441
4.18
3.0
38,1
00P
atux
ent
5.45
3.0
49,8
007.
503.
068
,500
13.4
23.
012
2,60
010
.00
3.0
91,3
2313
.42
3.0
122,
600
Pin
e y O
rcha
rd0.
522.
84,
400
1.20
2.8
10,3
000.
983.
09,
000
1.60
3.0
14,6
190.
983.
09,
000
Tota
l Pat
uxen
t7.
1081
,400
11.2
013
8,90
017
.35
158,
500
14.9
313
6,38
318
.58
169,
700
Pat
apsc
o59
.27
18.0
73.0
018
.0N
/AN
/AN
/AC
ount
y P
ortio
n-B
altim
ore
City
3.83
18.0
209,
400
6.39
18.0
349,
400
8.41
3.0
76,8
006.
393.
058
,355
9.63
3.0
87,9
00C
ox C
reek
11.5
48.
028
1,00
015
.00
8.0
365,
300
22.6
73.
020
7,00
020
.00
3.0
182,
646
22.6
73.
020
7,00
0B
odki
n P
oint
0.01
40.0
700
0.01
40.0
700
0.09
40.0
8,80
00.
0140
.070
00.
0940
.08,
800
Tota
l Pat
apsc
o/B
ack
15.3
849
1,10
021
.40
715,
400
31.1
729
2,60
026
.40
241,
701
32.3
930
3,70
0To
tal F
low
with
in C
ount
y:38
.54
784,
700
54.3
71,
147,
100
83.7
577
2,70
070
.28
642,
807
86.1
979
5,00
0N
otes
:D
ata
from
Tab
le 4
-2 a
nd 4
-6 o
f the
200
7 M
aste
r Pla
n fo
r Wat
er S
uppl
y an
d S
ewer
age
Sys
tem
s Lo
ad fo
r Bod
kin
Poi
nt s
yste
m b
ased
on
typi
cal s
eptic
sys
tem
effl
uent
40
mg/
L us
ing
desi
gn c
apac
ity w
ith a
n 80
% D
eliv
ery
Rat
ioB
altim
ore
City
, Pin
ey O
rcha
rd, R
ose
Hav
en/H
olla
nd P
oint
are
ope
rate
d by
oth
er ju
risdi
catio
ns o
r ent
ities
. C
alcu
latio
ns fo
r non
-Cou
nty
oper
ated
sys
tem
s ar
e ba
sed
on 2
005
flow
info
rmat
ion
rece
ived
from
MD
E o
n 3/
17/0
8, c
once
ntra
tions
bas
ed o
n 20
06 d
ata
and
Nut
rient
Cap
s ba
sed
on 2
005
Mar
ylan
d Tr
ibut
ry S
trate
gy.
Pin
ey O
rcha
rd F
utur
e D
esig
n C
apac
ity b
ased
on
Nitr
ogen
Tre
atm
ent L
oad
Cap
Bui
ld O
ut B
ased
on
2009
La
nd U
se P
lan
2005
Tot
al F
low
(MG
D)
Cur
rent
Des
ign
Cap
acity
Bui
ld O
ut B
ased
on
2004
Lan
d U
se P
lan
Futu
re D
esig
n C
apac
ity (w
ith
EN
R)
4/22
/200
9J:
\Sha
red\
LRP
\GD
P U
pdat
e 20
08\P
ublic
Rev
iew
Dra
ft P
lan\
Pub
lic R
evie
w D
raft
Map
s &
Fig
ures
\Cha
pter
10
Wat
er R
esou
rces
Pla
n\C
h 10
Tab
les
& P
ie C
harts
\WR
F TN
and
TP
Loa
d Ta
bles
for P
ublic
Rev
iew
Dra
ft
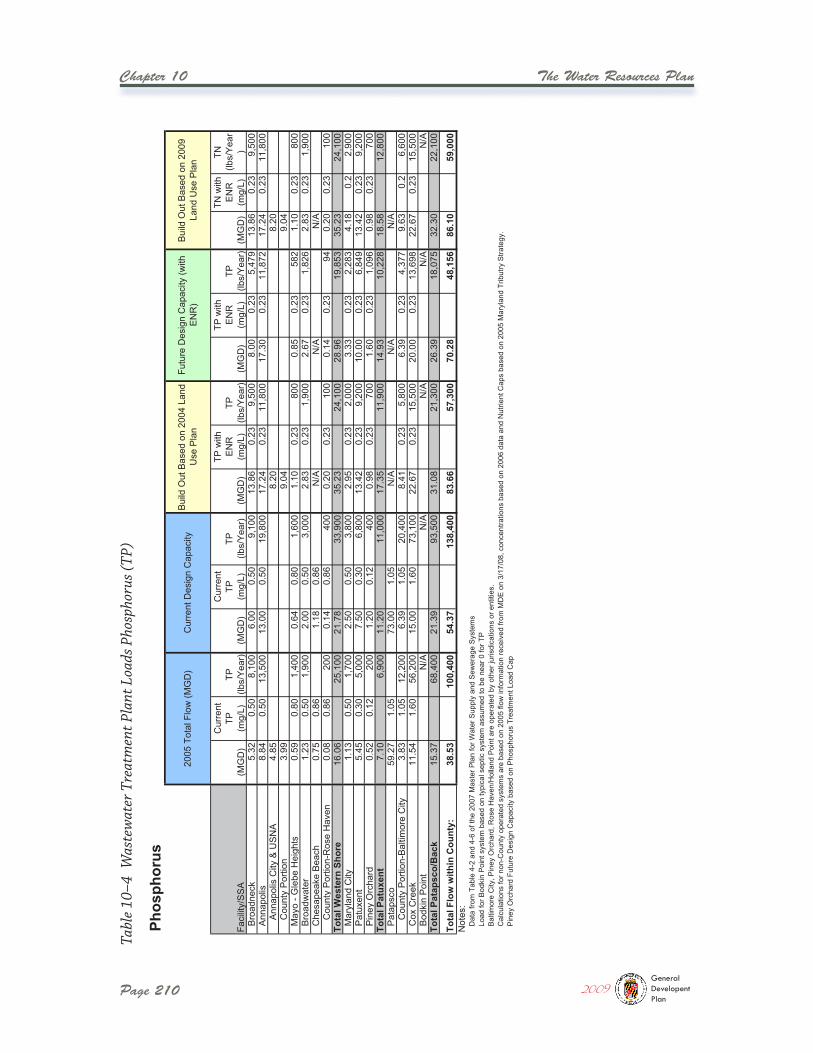
Page 210
Chapter 10 The Water Resources Plan
Tabl
e 10
–4 W
aste
wat
er T
reat
men
t Pla
nt L
oads
Pho
spho
rus (
TP)
2009GeneralDevelopentPlan
Phos
phor
us
Faci
lity/
SS
A(M
GD
)
Cur
rent
TP(m
g/L)
TP(lb
s/Y
ear)
(MG
D)
Cur
rent
TP(m
g/L)
TP(lb
s/Y
ear)
(MG
D)
TP w
ith
EN
R(m
g/L)
TP(lb
s/Y
ear)
(MG
D)
TP w
ith
EN
R(m
g/L)
TP(lb
s/Y
ear)
(MG
D)
TN w
ith
EN
R(m
g/L)
TN(lb
s/Y
ear
)B
road
neck
5.32
0.50
8,10
06.
000.
509,
100
13.8
60.
239,
500
8.00
0.23
5,47
913
.86
0.23
9,50
0A
nnap
olis
8.84
0.50
13,5
0013
.00
0.50
19,8
0017
.24
0.23
11,8
0017
.30
0.23
11,8
7217
.24
0.23
11,8
00A
nnap
olis
City
& U
SN
A4.
858.
208.
20C
ount
y P
ortio
n3.
999.
049.
04M
a yo
- Gle
be H
eigh
ts0.
590.
801,
400
0.64
0.80
1,60
01.
100.
2380
00.
850.
2358
21.
100.
2380
0B
road
wat
er1.
230.
501,
900
2.00
0.50
3,00
02.
830.
231,
900
2.67
0.23
1,82
62.
830.
231,
900
Che
sape
ake
Bea
ch0.
750.
861.
180.
86N
/AN
/AN
/AC
ount
y P
ortio
n-R
ose
Hav
en0.
080.
8620
00.
140.
8640
00.
200.
2310
00.
140.
2394
0.20
0.23
100
Tota
l Wes
tern
Sho
re16
.06
25,1
0021
.78
33,9
0035
.23
24,1
0028
.96
19,8
5335
.23
24,1
00M
aryl
and
City
1.13
0.50
1,70
02.
500.
503,
800
2.95
0.23
2,00
03.
330.
232,
283
4.18
0.2
2,90
0P
atux
ent
5.45
0.30
5,00
07.
500.
306,
800
13.4
20.
239,
200
10.0
00.
236,
849
13.4
20.
239,
200
Pin
e y O
rcha
rd0.
520.
1220
01.
200.
1240
00.
980.
2370
01.
600.
231,
096
0.98
0.23
700
Tota
l Pat
uxen
t7.
106,
900
11.2
011
,000
17.3
511
,900
14.9
310
,228
18.5
812
,800
Pat
apsc
o59
.27
1.05
73.0
01.
05N
/AN
/AN
/AC
ount
y P
ortio
n-B
altim
ore
City
3.83
1.05
12,2
006.
391.
0520
,400
8.41
0.23
5,80
06.
390.
234,
377
9.63
0.2
6,60
0C
ox C
reek
11.5
41.
6056
,200
15.0
01.
6073
,100
22.6
70.
2315
,500
20.0
00.
2313
,698
22.6
70.
2315
,500
Bod
kin
Poi
ntN
/AN
/AN
/AN
/AN
/ATo
tal P
atap
sco/
Bac
k15
.37
68,4
0021
.39
93,5
0031
.08
21,3
0026
.39
18,0
7532
.30
22,1
00
Tota
l Flo
w w
ithin
Cou
nty:
38.5
310
0,40
054
.37
138,
400
83.6
657
,300
70.2
848
,156
86.1
059
,000
Not
es:
Dat
a fro
m T
able
4-2
and
4-6
of t
he 2
007
Mas
ter P
lan
for W
ater
Sup
ply
and
Sew
erag
e S
yste
ms
Load
for B
odki
n P
oint
sys
tem
bas
ed o
n ty
pica
l sep
tic s
yste
m a
ssum
ed to
be
near
0 fo
r TP
Bal
timor
e C
ity, P
iney
Orc
hard
, Ros
e H
aven
/Hol
land
Poi
nt a
re o
pera
ted
by o
ther
juris
dica
tions
or e
ntiti
es.
Cal
cula
tions
for n
on-C
ount
y op
erat
ed s
yste
ms
are
base
d on
200
5 flo
w in
form
atio
n re
ceiv
ed fr
om M
DE
on
3/17
/08,
con
cent
ratio
ns b
ased
on
2006
dat
a an
d N
utrie
nt C
aps
base
d on
200
5 M
aryl
and
Trib
utry
Stra
tegy
.P
iney
Orc
hard
Fut
ure
Des
ign
Cap
acity
bas
ed o
n P
hosp
horu
s Tr
eatm
ent L
oad
Cap
Bui
ld O
ut B
ased
on
2009
La
nd U
se P
lan
Futu
re D
esig
n C
apac
ity (w
ith
EN
R)
2005
Tot
al F
low
(MG
D)
Cur
rent
Des
ign
Cap
acity
Bui
ld O
ut B
ased
on
2004
Lan
d U
se P
lan
4/22
/200
9J:
\Sha
red\
LRP
\GD
P U
pdat
e 20
08\P
ublic
Rev
iew
Dra
ft P
lan\
Pub
lic R
evie
w D
raft
Map
s &
Fig
ures
\Cha
pter
10
Wat
er R
esou
rces
Pla
n\C
h 10
Tab
les
& P
ie C
harts
\WR
F TN
and
TP
Loa
d Ta
bles
for P
ublic
Rev
iew
Dra
ft
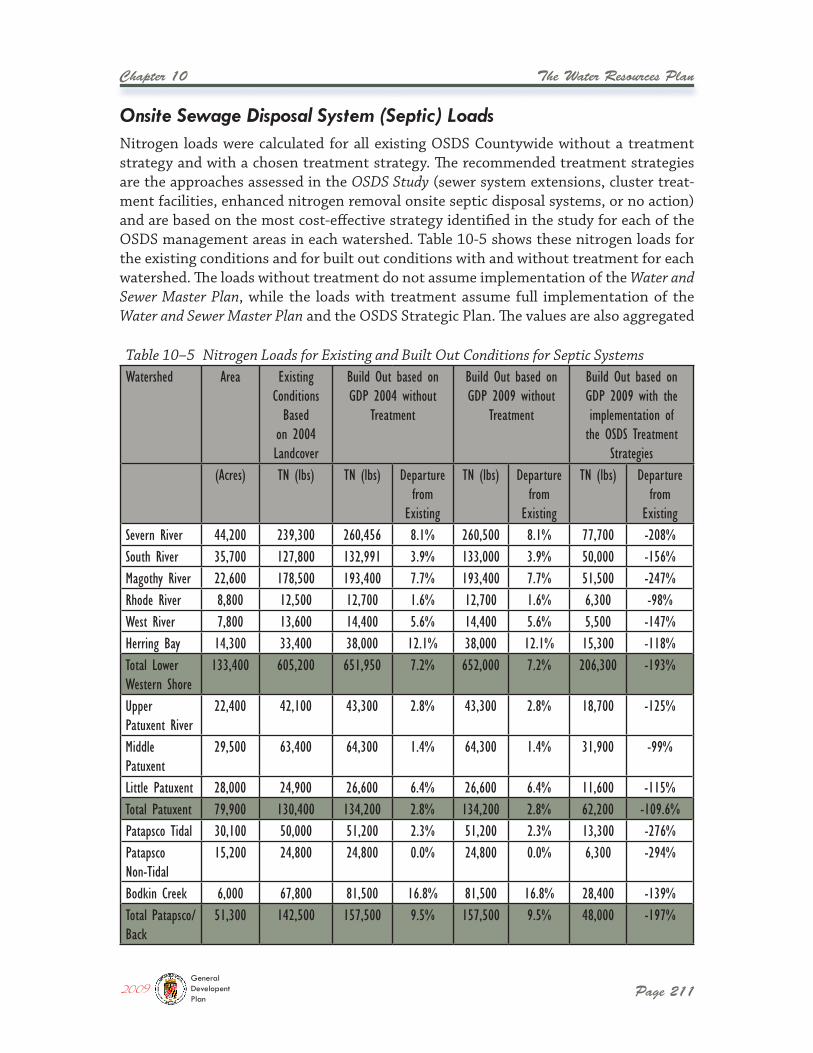
The Water Resources Plan
Page 211
Chapter 10
Nitrogen loads were calculated for all existing OSDS Countywide without a treatment strategy and with a chosen treatment strategy. The recommended treatment strategies are the approaches assessed in the OSDS Study (sewer system extensions, cluster treat-ment facilities, enhanced nitrogen removal onsite septic disposal systems, or no action) and are based on the most cost-effective strategy identified in the study for each of the OSDS management areas in each watershed. Table 10-5 shows these nitrogen loads for the existing conditions and for built out conditions with and without treatment for each watershed. The loads without treatment do not assume implementation of the Water and Sewer Master Plan, while the loads with treatment assume full implementation of the Water and Sewer Master Plan and the OSDS Strategic Plan. The values are also aggregated
Table 10–5 Nitrogen Loads for Existing and Built Out Conditions for Septic SystemsWatershed Area Existing
Conditions Based
on 2004 Landcover
Build Out based on GDP 2004 without
Treatment
Build Out based on GDP 2009 without
Treatment
Build Out based on GDP 2009 with the implementation of the OSDS Treatment
Strategies(Acres) TN (lbs) TN (lbs) Departure
from Existing
TN (lbs) Departure from
Existing
TN (lbs) Departure from
ExistingSevern River 44,200 239,300 260,456 8.1% 260,500 8.1% 77,700 -208%South River 35,700 127,800 132,991 3.9% 133,000 3.9% 50,000 -156%Magothy River 22,600 178,500 193,400 7.7% 193,400 7.7% 51,500 -247%Rhode River 8,800 12,500 12,700 1.6% 12,700 1.6% 6,300 -98%West River 7,800 13,600 14,400 5.6% 14,400 5.6% 5,500 -147%Herring Bay 14,300 33,400 38,000 12.1% 38,000 12.1% 15,300 -118%Total Lower Western Shore
133,400 605,200 651,950 7.2% 652,000 7.2% 206,300 -193%
Upper Patuxent River
22,400 42,100 43,300 2.8% 43,300 2.8% 18,700 -125%
Middle Patuxent
29,500 63,400 64,300 1.4% 64,300 1.4% 31,900 -99%
Little Patuxent 28,000 24,900 26,600 6.4% 26,600 6.4% 11,600 -115%Total Patuxent 79,900 130,400 134,200 2.8% 134,200 2.8% 62,200 -109.6%Patapsco Tidal 30,100 50,000 51,200 2.3% 51,200 2.3% 13,300 -276%Patapsco Non-Tidal
15,200 24,800 24,800 0.0% 24,800 0.0% 6,300 -294%
Bodkin Creek 6,000 67,800 81,500 16.8% 81,500 16.8% 28,400 -139%Total Patapsco/Back
51,300 142,500 157,500 9.5% 157,500 9.5% 48,000 -197%
Onsite Sewage Disposal System (Septic) Loads
2009GeneralDevelopentPlan
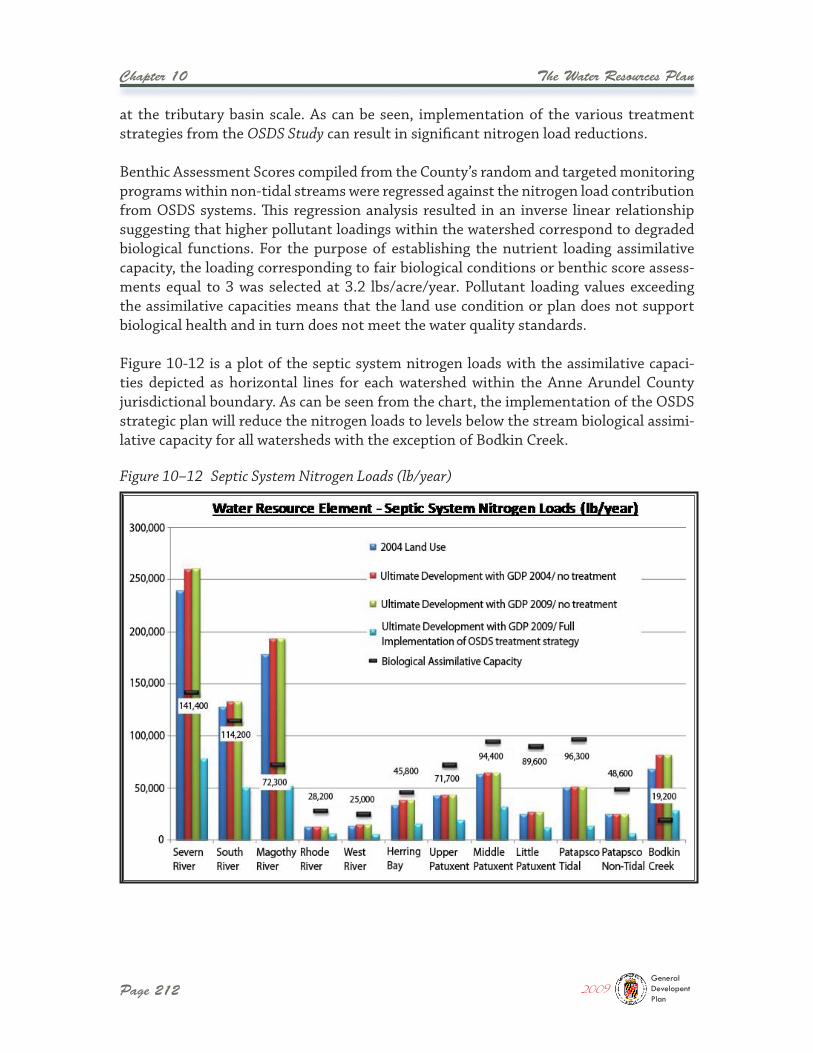
Page 212
Chapter 10 The Water Resources Plan
at the tributary basin scale. As can be seen, implementation of the various treatment strategies from the OSDS Study can result in significant nitrogen load reductions.
Benthic Assessment Scores compiled from the County’s random and targeted monitoring programs within non-tidal streams were regressed against the nitrogen load contribution from OSDS systems. This regression analysis resulted in an inverse linear relationship suggesting that higher pollutant loadings within the watershed correspond to degraded biological functions. For the purpose of establishing the nutrient loading assimilative capacity, the loading corresponding to fair biological conditions or benthic score assess-ments equal to 3 was selected at 3.2 lbs/acre/year. Pollutant loading values exceeding the assimilative capacities means that the land use condition or plan does not support biological health and in turn does not meet the water quality standards.
Figure 10-12 is a plot of the septic system nitrogen loads with the assimilative capaci-ties depicted as horizontal lines for each watershed within the Anne Arundel County jurisdictional boundary. As can be seen from the chart, the implementation of the OSDS strategic plan will reduce the nitrogen loads to levels below the stream biological assimi-lative capacity for all watersheds with the exception of Bodkin Creek.
Figure 10–12 Septic System Nitrogen Loads (lb/year)
2009GeneralDevelopentPlan
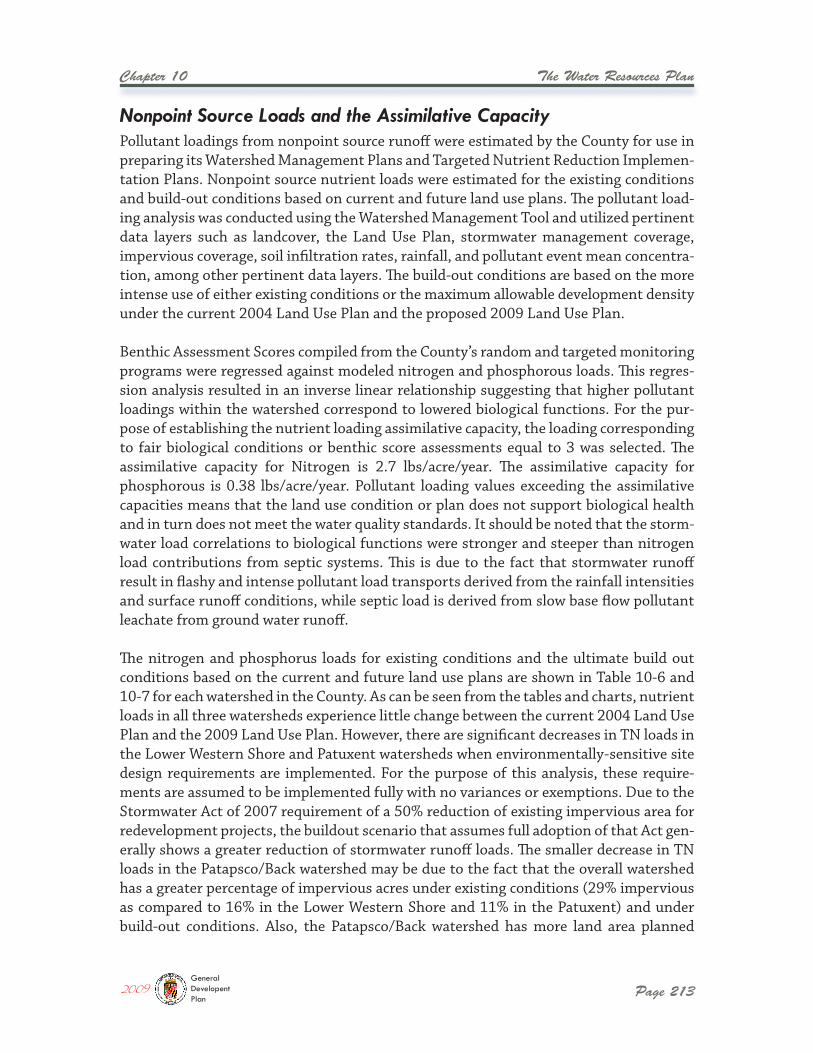
The Water Resources Plan
Page 213
Chapter 10
Pollutant loadings from nonpoint source runoff were estimated by the County for use in preparing its Watershed Management Plans and Targeted Nutrient Reduction Implemen-tation Plans. Nonpoint source nutrient loads were estimated for the existing conditions and build-out conditions based on current and future land use plans. The pollutant load-ing analysis was conducted using the Watershed Management Tool and utilized pertinent data layers such as landcover, the Land Use Plan, stormwater management coverage, impervious coverage, soil infiltration rates, rainfall, and pollutant event mean concentra-tion, among other pertinent data layers. The build-out conditions are based on the more intense use of either existing conditions or the maximum allowable development density under the current 2004 Land Use Plan and the proposed 2009 Land Use Plan.
Benthic Assessment Scores compiled from the County’s random and targeted monitoring programs were regressed against modeled nitrogen and phosphorous loads. This regres-sion analysis resulted in an inverse linear relationship suggesting that higher pollutant loadings within the watershed correspond to lowered biological functions. For the pur-pose of establishing the nutrient loading assimilative capacity, the loading corresponding to fair biological conditions or benthic score assessments equal to 3 was selected. The assimilative capacity for Nitrogen is 2.7 lbs/acre/year. The assimilative capacity for phosphorous is 0.38 lbs/acre/year. Pollutant loading values exceeding the assimilative capacities means that the land use condition or plan does not support biological health and in turn does not meet the water quality standards. It should be noted that the storm-water load correlations to biological functions were stronger and steeper than nitrogen load contributions from septic systems. This is due to the fact that stormwater runoff result in flashy and intense pollutant load transports derived from the rainfall intensities and surface runoff conditions, while septic load is derived from slow base flow pollutant leachate from ground water runoff.
The nitrogen and phosphorus loads for existing conditions and the ultimate build out conditions based on the current and future land use plans are shown in Table 10-6 and 10-7 for each watershed in the County. As can be seen from the tables and charts, nutrient loads in all three watersheds experience little change between the current 2004 Land Use Plan and the 2009 Land Use Plan. However, there are significant decreases in TN loads in the Lower Western Shore and Patuxent watersheds when environmentally-sensitive site design requirements are implemented. For the purpose of this analysis, these require-ments are assumed to be implemented fully with no variances or exemptions. Due to the Stormwater Act of 2007 requirement of a 50% reduction of existing impervious area for redevelopment projects, the buildout scenario that assumes full adoption of that Act gen-erally shows a greater reduction of stormwater runoff loads. The smaller decrease in TN loads in the Patapsco/Back watershed may be due to the fact that the overall watershed has a greater percentage of impervious acres under existing conditions (29% impervious as compared to 16% in the Lower Western Shore and 11% in the Patuxent) and under build-out conditions. Also, the Patapsco/Back watershed has more land area planned
Nonpoint Source Loads and the Assimilative Capacity
2009GeneralDevelopentPlan
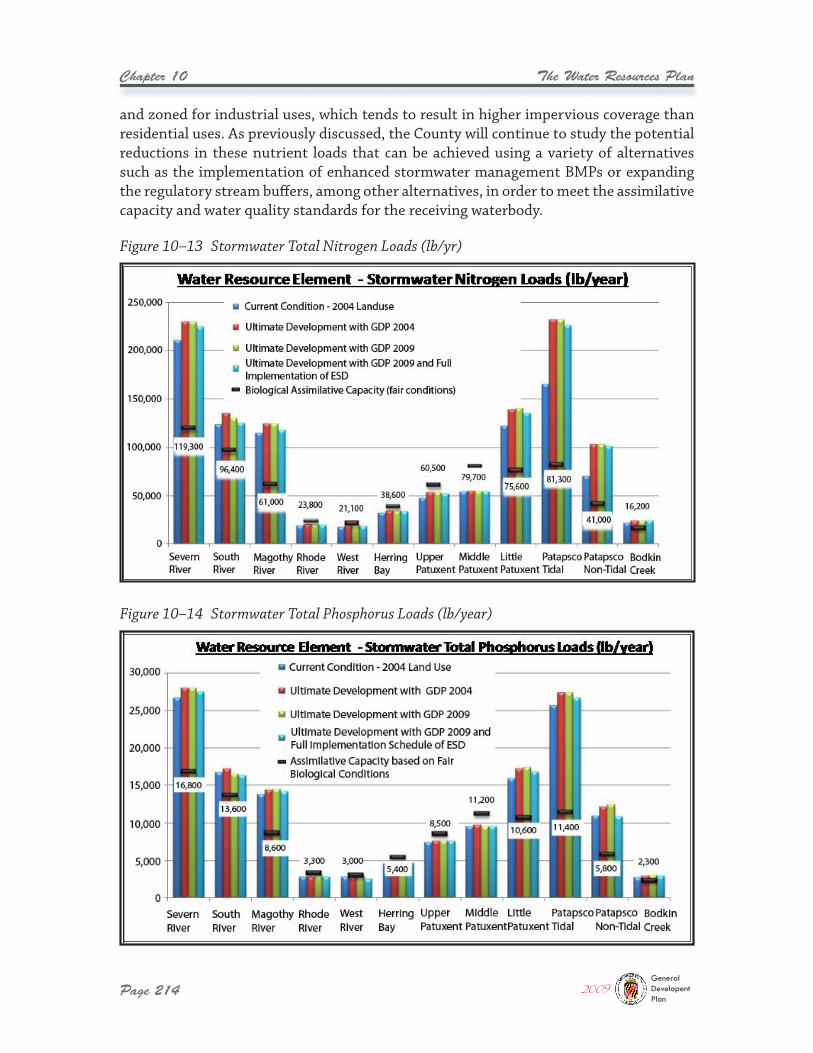
Page 214
Chapter 10 The Water Resources Plan
and zoned for industrial uses, which tends to result in higher impervious coverage than residential uses. As previously discussed, the County will continue to study the potential reductions in these nutrient loads that can be achieved using a variety of alternatives such as the implementation of enhanced stormwater management BMPs or expanding the regulatory stream buffers, among other alternatives, in order to meet the assimilative capacity and water quality standards for the receiving waterbody.
Figure 10–14 Stormwater Total Phosphorus Loads (lb/year)
Figure 10–13 Stormwater Total Nitrogen Loads (lb/yr)
2009GeneralDevelopentPlan
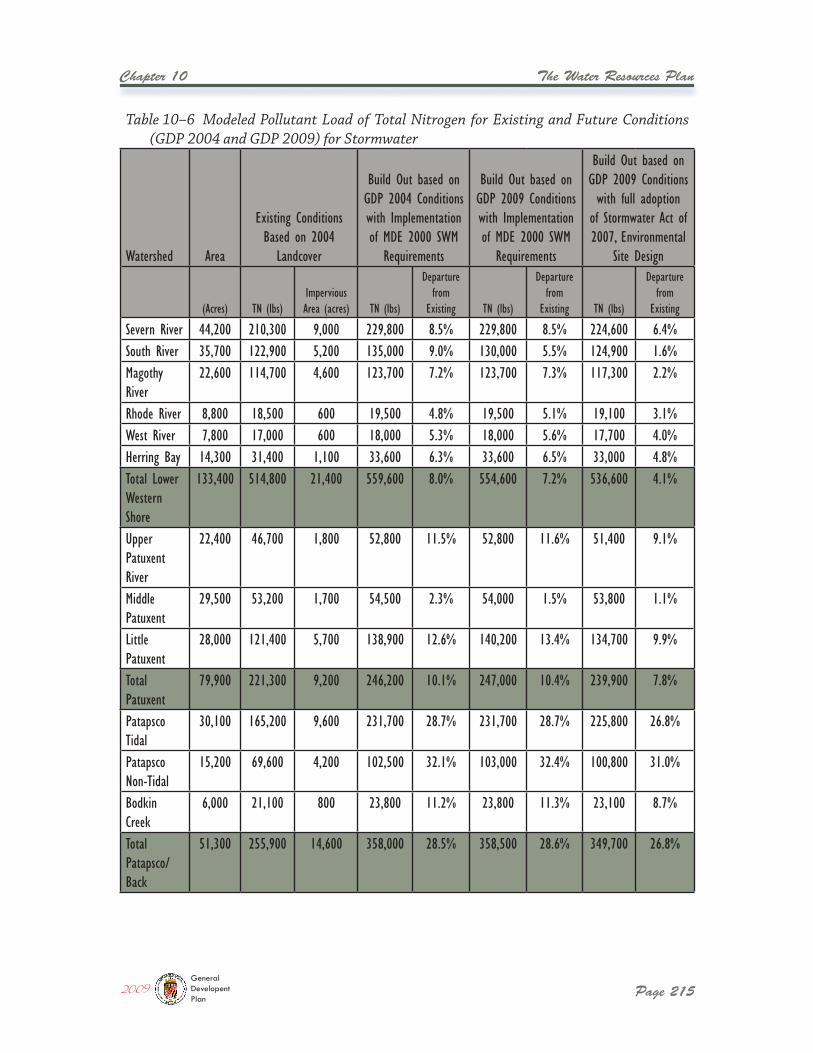
The Water Resources Plan
Page 215
Chapter 10
Table 10–6 Modeled Pollutant Load of Total Nitrogen for Existing and Future Conditions (GDP 2004 and GDP 2009) for Stormwater
Watershed Area
Existing Conditions Based on 2004
Landcover
Build Out based on GDP 2004 Conditions with Implementation of MDE 2000 SWM
Requirements
Build Out based on GDP 2009 Conditions with Implementation of MDE 2000 SWM
Requirements
Build Out based on GDP 2009 Conditions with full adoption
of Stormwater Act of 2007, Environmental
Site Design
(Acres) TN (lbs)Impervious Area (acres) TN (lbs)
Departure from
Existing TN (lbs)
Departure from
Existing TN (lbs)
Departure from
Existing
Severn River 44,200 210,300 9,000 229,800 8.5% 229,800 8.5% 224,600 6.4%South River 35,700 122,900 5,200 135,000 9.0% 130,000 5.5% 124,900 1.6%Magothy River
22,600 114,700 4,600 123,700 7.2% 123,700 7.3% 117,300 2.2%
Rhode River 8,800 18,500 600 19,500 4.8% 19,500 5.1% 19,100 3.1%West River 7,800 17,000 600 18,000 5.3% 18,000 5.6% 17,700 4.0%Herring Bay 14,300 31,400 1,100 33,600 6.3% 33,600 6.5% 33,000 4.8%Total Lower Western Shore
133,400 514,800 21,400 559,600 8.0% 554,600 7.2% 536,600 4.1%
Upper Patuxent River
22,400 46,700 1,800 52,800 11.5% 52,800 11.6% 51,400 9.1%
Middle Patuxent
29,500 53,200 1,700 54,500 2.3% 54,000 1.5% 53,800 1.1%
Little Patuxent
28,000 121,400 5,700 138,900 12.6% 140,200 13.4% 134,700 9.9%
Total Patuxent
79,900 221,300 9,200 246,200 10.1% 247,000 10.4% 239,900 7.8%
Patapsco Tidal
30,100 165,200 9,600 231,700 28.7% 231,700 28.7% 225,800 26.8%
Patapsco Non-Tidal
15,200 69,600 4,200 102,500 32.1% 103,000 32.4% 100,800 31.0%
Bodkin Creek
6,000 21,100 800 23,800 11.2% 23,800 11.3% 23,100 8.7%
Total Patapsco/Back
51,300 255,900 14,600 358,000 28.5% 358,500 28.6% 349,700 26.8%
2009GeneralDevelopentPlan
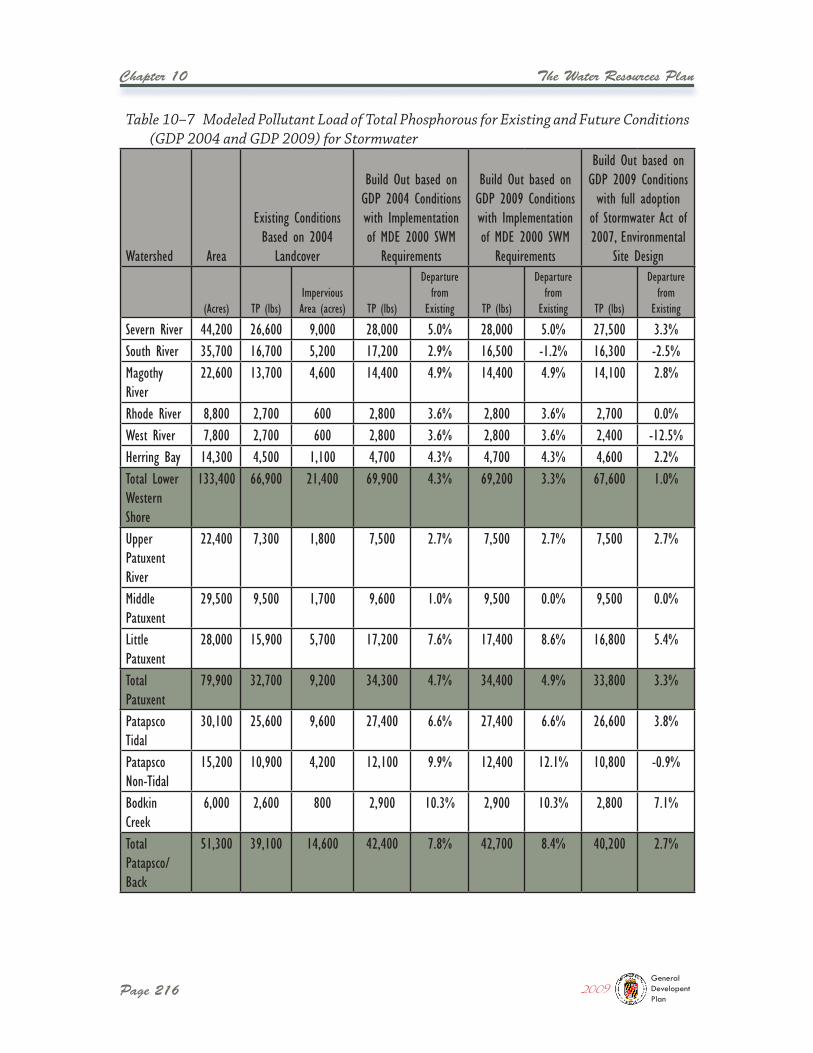
Page 216
Chapter 10 The Water Resources Plan
Table 10–7 Modeled Pollutant Load of Total Phosphorous for Existing and Future Conditions (GDP 2004 and GDP 2009) for Stormwater
Watershed Area
Existing Conditions Based on 2004
Landcover
Build Out based on GDP 2004 Conditions with Implementation of MDE 2000 SWM
Requirements
Build Out based on GDP 2009 Conditions with Implementation of MDE 2000 SWM
Requirements
Build Out based on GDP 2009 Conditions with full adoption
of Stormwater Act of 2007, Environmental
Site Design
(Acres) TP (lbs)Impervious Area (acres) TP (lbs)
Departure from
Existing TP (lbs)
Departure from
Existing TP (lbs)
Departure from
Existing
Severn River 44,200 26,600 9,000 28,000 5.0% 28,000 5.0% 27,500 3.3%South River 35,700 16,700 5,200 17,200 2.9% 16,500 -1.2% 16,300 -2.5%Magothy River
22,600 13,700 4,600 14,400 4.9% 14,400 4.9% 14,100 2.8%
Rhode River 8,800 2,700 600 2,800 3.6% 2,800 3.6% 2,700 0.0%West River 7,800 2,700 600 2,800 3.6% 2,800 3.6% 2,400 -12.5%Herring Bay 14,300 4,500 1,100 4,700 4.3% 4,700 4.3% 4,600 2.2%Total Lower Western Shore
133,400 66,900 21,400 69,900 4.3% 69,200 3.3% 67,600 1.0%
Upper Patuxent River
22,400 7,300 1,800 7,500 2.7% 7,500 2.7% 7,500 2.7%
Middle Patuxent
29,500 9,500 1,700 9,600 1.0% 9,500 0.0% 9,500 0.0%
Little Patuxent
28,000 15,900 5,700 17,200 7.6% 17,400 8.6% 16,800 5.4%
Total Patuxent
79,900 32,700 9,200 34,300 4.7% 34,400 4.9% 33,800 3.3%
Patapsco Tidal
30,100 25,600 9,600 27,400 6.6% 27,400 6.6% 26,600 3.8%
Patapsco Non-Tidal
15,200 10,900 4,200 12,100 9.9% 12,400 12.1% 10,800 -0.9%
Bodkin Creek
6,000 2,600 800 2,900 10.3% 2,900 10.3% 2,800 7.1%
Total Patapsco/Back
51,300 39,100 14,600 42,400 7.8% 42,700 8.4% 40,200 2.7%
2009GeneralDevelopentPlan
The Water Resources Plan
Page 217
Chapter 10
Although the County experienced a steady, rapid increase in its population and housing over the last twenty years, the projected rate of growth will slowly begin to decline as the County reaches its maturity. The comprehensive 2009 Land Use Plan for the County focuses the remaining growth into targeted growth areas where infrastructure and capacity are available, encourages infill and redevelopment opportunities in the managed growth areas, and expands land preservation in the rural areas. Utilizing these types of “smart growth” techniques are the best that a mature, suburban County can achieve from a land use perspective in reducing nutrient loads in its watersheds. The goals, policies, and strategies outlined in the Environmental Stewardship and Quality Public Services chapters will also improve upon the ability for the County to provide a safe and adequate water supply, provide adequate wastewater capacity, and improve upon the impacts to the watershed from pollution. In addition to those actions, the strategies recommended in this section will further enhance the ability to improve the health of the watersheds.
In terms of planning for future growth, the potential constraints with regard to water supply are the ability to continue to purchase water from the City of Baltimore over the long term, and the adequacy of groundwater resources to serve additional growth in southern Anne Arundel County.
The County has optimized the use of its public water supply wells effectively, and has identified potential locations for new well fields so that future deficiencies in the public water supply are not likely to occur on a long-term basis, although short-term situations related to drought conditions can periodically occur. Due to concerns over the reliabil-ity and future quality of the Baltimore City water supply, the 2003 Comprehensive Water Strategic Plan promotes a self-reliance strategy by expanding County infrastructure. By optimizing the use of existing and potential supply wells, reliance on the Baltimore City system will be minimized. Any future deficiencies between supply and demand can be met by purchasing water from the City.
Southern Anne Arundel County is part of the County’s designated Rural Area, and large-scale or high-density development projects are not planned there. Still, there is additional development potential for low-density residential development that would be served by private individual wells. The long-term adequacy of groundwater resources is a regional issue that, as described below, is being comprehensively assessed by the State, U. S. Geological Survey, and the Maryland Geological Survey. The County will continue to par-ticipate in regional planning efforts to monitor and protect groundwater resources.
Since 2003, two separate Advisory Committees on the Management and Protection of the State’s Water Resources were formed and charged with assessing the adequacy of existing resources to manage and protect the State’s ground and surface water resources and with recommending the actions necessary to ensure that the management of the State’s water
Mitigation Plans
Water Supply
2009GeneralDevelopentPlan
Page 218
Chapter 10 The Water Resources Plan
resources will provide for their long-term and sustainable use and protection. In addition, a pilot study of Southern Maryland area was conducted and a Water Quality Subcommit-tee was formed. The first committee found that a combination of factors such as drought, pollution of water sources, inadequate planning and infrastructure, incomplete informa-tion about water sources, and population growth could adversely affect the availability of water supply. The pilot study conducted for the Southern Maryland area recommended:
� A regional, multi-aquifer groundwater flow model to assess water supply and impacts of future applications for withdrawals,
� Additional monitoring of wells near large pumping centers to verify model predictability,
� Developing standard methods of data collection, storage and transfer on domes-tic wells, and
� Evaluating the appropriateness of the 80% management level in aquifers in close proximity to their recharge areas.
The second committee’s final report recommends that:
� Maryland must develop a more robust water resources program based on sound, comprehensive data. A statewide water supply plan should be developed that includes a strong outreach program.
� Staffing, programmatic, and information needs of the water supply management program must be adequately and reliably funded. A permit fee to fund the cost of administering the permitting system should be established. Hydrologic studies should be funded with a separate appropriation. In addition, funding should be provided to local governments for water resources planning and to expand the network of stream and ground-water monitoring for both water quantity and quality.
� Specific legislative, regulatory, and programmatic changes should be implemented including codifying the State’s water allocation policies, requiring local jurisdic-tions to protect source waters, promoting collaborative local planning, facilitating regional planning, and strengthening State and local programs for water conser-vation, water reuse, demand management, and individual wells. In addition, the use of individual wells in areas at high risk for well contamination should be dis-couraged, greater use should be made of the Water Management Strategy Areas, and administrative penalties for violations of water appropriation permits should be authorized..
In order to adequately address water quality issues, a Water Quality Subcommittee of the Advisory Committee on the Management and Protection of the State’s Water Resources was formed to comprehensively address existing laws, regulations, policies, and programs. Their recommendations include:
� MDE and DNR initiate a comprehensive water quality monitoring program to assess the condition of Maryland’s drinking water sources and track the progress of other programs designed to protect and improve water quality.
2009GeneralDevelopentPlan
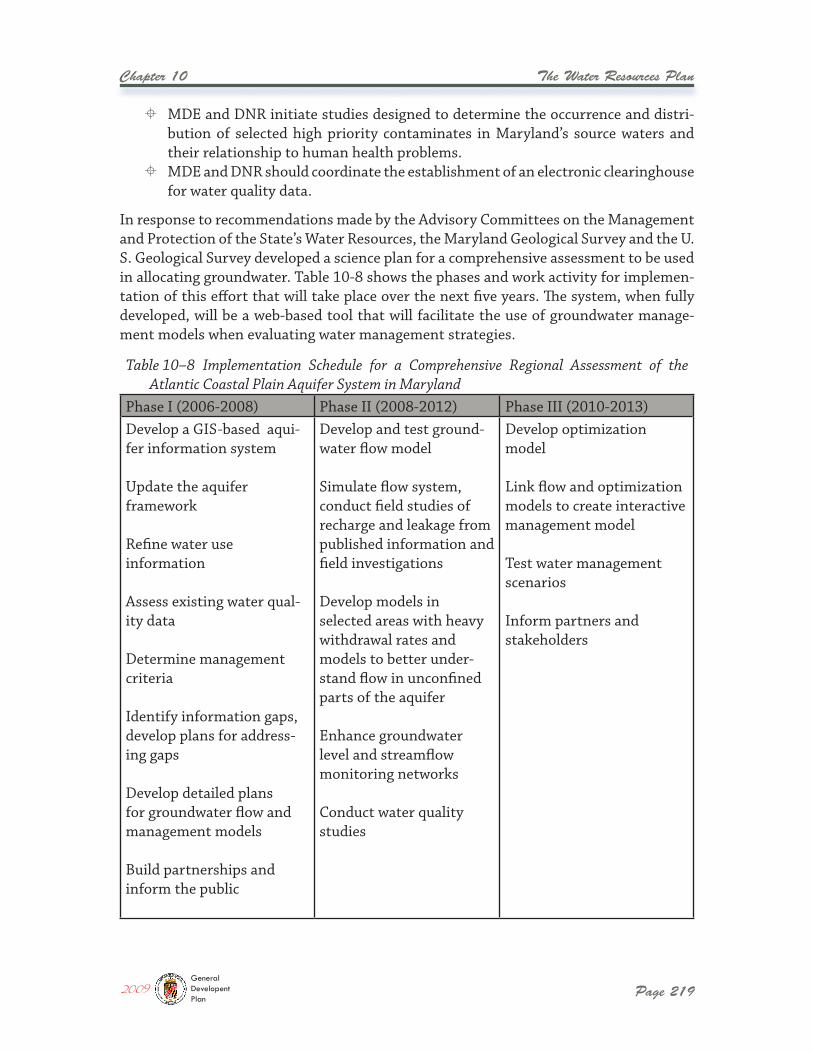
The Water Resources Plan
Page 219
Chapter 10
� MDE and DNR initiate studies designed to determine the occurrence and distri-bution of selected high priority contaminates in Maryland’s source waters and their relationship to human health problems.
� MDE and DNR should coordinate the establishment of an electronic clearinghouse for water quality data.
In response to recommendations made by the Advisory Committees on the Management and Protection of the State’s Water Resources, the Maryland Geological Survey and the U. S. Geological Survey developed a science plan for a comprehensive assessment to be used in allocating groundwater. Table 10-8 shows the phases and work activity for implemen-tation of this effort that will take place over the next five years. The system, when fully developed, will be a web-based tool that will facilitate the use of groundwater manage-ment models when evaluating water management strategies.
Table 10–8 Implementation Schedule for a Comprehensive Regional Assessment of the Atlantic Coastal Plain Aquifer System in Maryland
Phase I (2006-2008) Phase II (2008-2012) Phase III (2010-2013)Develop a GIS-based aqui-fer information system
Update the aquifer framework
Refine water use information
Assess existing water qual-ity data
Determine management criteria
Identify information gaps, develop plans for address-ing gaps
Develop detailed plans for groundwater flow and management models
Build partnerships and inform the public
Develop and test ground-water flow model
Simulate flow system, conduct field studies of recharge and leakage from published information and field investigations
Develop models in selected areas with heavy withdrawal rates and models to better under-stand flow in unconfined parts of the aquifer
Enhance groundwater level and streamflow monitoring networks
Conduct water quality studies
Develop optimization model
Link flow and optimization models to create interactive management model
Test water management scenarios
Inform partners and stakeholders
2009GeneralDevelopentPlan
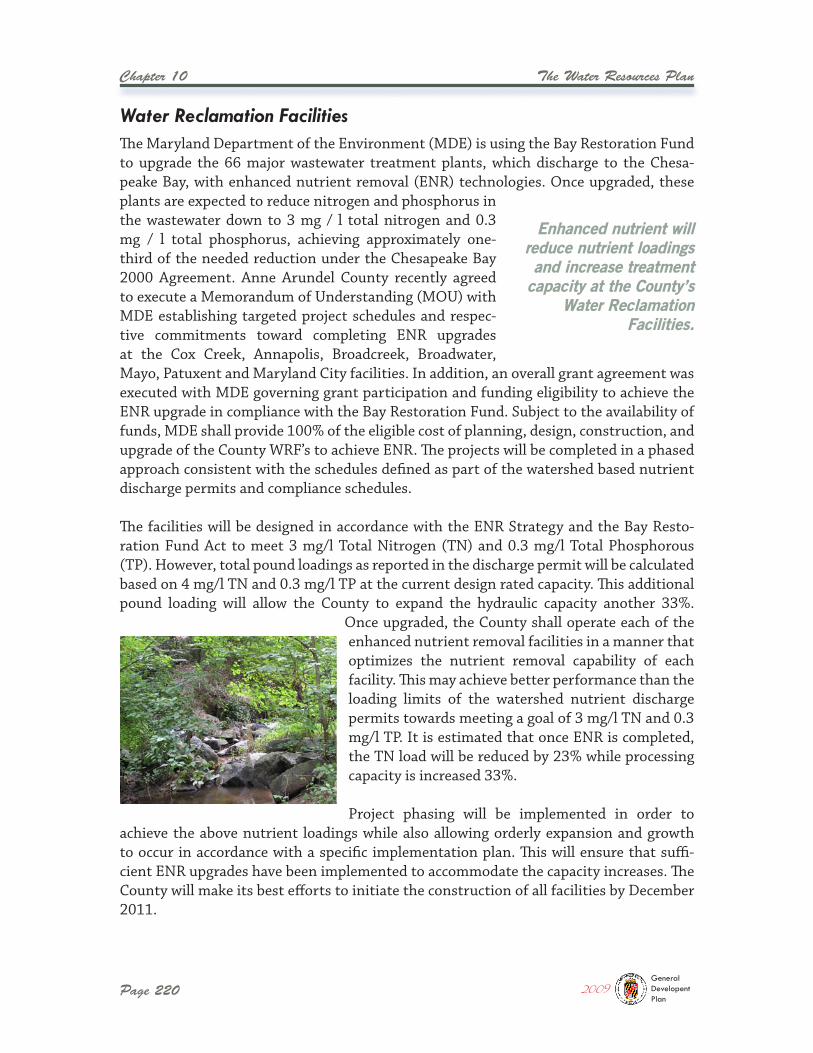
Page 220
Chapter 10 The Water Resources Plan
The Maryland Department of the Environment (MDE) is using the Bay Restoration Fund to upgrade the 66 major wastewater treatment plants, which discharge to the Chesa-peake Bay, with enhanced nutrient removal (ENR) technologies. Once upgraded, these plants are expected to reduce nitrogen and phosphorus in the wastewater down to 3 mg / l total nitrogen and 0.3 mg / l total phosphorus, achieving approximately one-third of the needed reduction under the Chesapeake Bay 2000 Agreement. Anne Arundel County recently agreed to execute a Memorandum of Understanding (MOU) with MDE establishing targeted project schedules and respec-tive commitments toward completing ENR upgrades at the Cox Creek, Annapolis, Broadcreek, Broadwater, Mayo, Patuxent and Maryland City facilities. In addition, an overall grant agreement was executed with MDE governing grant participation and funding eligibility to achieve the ENR upgrade in compliance with the Bay Restoration Fund. Subject to the availability of funds, MDE shall provide 100% of the eligible cost of planning, design, construction, and upgrade of the County WRF’s to achieve ENR. The projects will be completed in a phased approach consistent with the schedules defined as part of the watershed based nutrient discharge permits and compliance schedules.
The facilities will be designed in accordance with the ENR Strategy and the Bay Resto-ration Fund Act to meet 3 mg/l Total Nitrogen (TN) and 0.3 mg/l Total Phosphorous (TP). However, total pound loadings as reported in the discharge permit will be calculated based on 4 mg/l TN and 0.3 mg/l TP at the current design rated capacity. This additional pound loading will allow the County to expand the hydraulic capacity another 33%.
Once upgraded, the County shall operate each of the enhanced nutrient removal facilities in a manner that optimizes the nutrient removal capability of each facility. This may achieve better performance than the loading limits of the watershed nutrient discharge permits towards meeting a goal of 3 mg/l TN and 0.3 mg/l TP. It is estimated that once ENR is completed, the TN load will be reduced by 23% while processing capacity is increased 33%.
Project phasing will be implemented in order to achieve the above nutrient loadings while also allowing orderly expansion and growth to occur in accordance with a specific implementation plan. This will ensure that suffi-cient ENR upgrades have been implemented to accommodate the capacity increases. The County will make its best efforts to initiate the construction of all facilities by December 2011.
Enhanced nutrient will reduce nutrient loadings and increase treatment
capacity at the County’s Water Reclamation
Facilities.
Water Reclamation Facilities
2009GeneralDevelopentPlan
The Water Resources Plan
Page 221
Chapter 10
Under applicable federal and state law, the County may expand the capacity of the WRF in the future as long as the expanded capacities are in accordance with the County’s most recent Water and Sewer Master Plan and the watershed-based nutrient discharge lim-its, or any more stringent local water quality based limitations are not exceeded by the expansion.
The MOU also established two watersheds for internal allocation of pollutant loads during ENR implementation. New capacity ratings and associated nutrient limits will be imple-mented through these watershed discharge permits. Two watershed nutrient discharge permits (one for Patuxent/Maryland City and another to cover Broadneck, Broadwater, Mayo, Annapolis, and Cox Creek) will be developed and issued which will govern the nutrient removal requirements, capacity ratings, and schedules for each of the County WRF. Each nutrient discharge permit will contain a permitted annual pollutant loading of TN and TP (in lbs/yr) permitted to be discharged in accordance with the previously described computation.
Nutrient-based capacity limits will be determined from the total nutrient loading alloca-tion for the individual watershed, not specific discharges from any one individual County WRF, unless a local TMDL or water quality requirement is more restrictive. This provides the County with flexibility to phase its ENR improvements and maintain pollutant total loadings within the permitted levels for each watershed.
Nutrient loads for each watershed can be increased through trading consistent with a statewide policy recently developed by MDE. The concept of nutrient trading allows a discharger of nutrients, faced with expensive nutrient reductions to meet water qual-ity standards, to purchase “credits” (e.g., pounds of nitrogen) from a second nutrient discharger that has reduced its discharge below its legal requirement. This process allows dischargers with higher nutrient reduction costs to pay another discharger for equivalent reductions. Trading also enables entities with low clean up costs to reduce discharges below legal requirements and generate revenue.
MDE will consider this signed agreement as compliance by the County with the first phase of the implementation to meet the requirements of the TMDL program for both local water quality and Chesapeake Bay nutrients. By completing ENR upgrades at these plants the County will substantially reduce the contribution of nitrogen and phosphorous to the Chesapeake Bay while allowing for future expansion to accommodate planned growth and development.
Goal: Provide the highest level of wastewater treatment capabili-ties economically achievable in order to reduce pollutant loads to area tributaries.
Policy 1: Comply with the nutrient loads limits of all County Water Reclamation Facilities.
2009GeneralDevelopentPlan
Page 222
Chapter 10 The Water Resources Plan
The following actions were recommended in the OSDS Evaluation Study for implementa-tion of the treatment approaches:
� Meet with MDE and DNR to articulate the County’s OSDS Strategy, � Work with MDE, DNR and State legislators to revise the Chesapeake Bay Restora-
tion Fund Act (CBRFA) language, � Partner with MDE, DNR and others to update the science of OSDS load estimates,
(concentrations, delivery ratios) and the Chesapeake Bay model, � Partner with MDE and DNR to evaluate alternatives for new OSDS cluster treat-
ment systems (new land application / reuse options, new outfall options in shellfish areas),
� Partner with MDE and DNR to develop a OSDS load credit mechanism for water reclamation (WRF) load caps,
� Develop OSDS Environmental Fee Study and Ordinance, � Develop OSDS Maintenance Ordinance, � Make revisions to the General Development Plan: identify changes in areas of
planned sewer service (additions and deletions); identify priorities; identify areas designated for limited sewer service for managing areas of existing OSDS targeted either for sewer extension or cluster systems, and
� Summarize how this study can be used to address septic system component of Water Resources Element.
In addition, technical, policy, regulatory, and statutory issues were identified for consid-eration. These include:
� Need to improve the understanding of existing OSDS effluent nitrogen loads and delivery ratios
� Coordination with the General Development Plan, � Environmental Fee for new onsite sewage disposal systems, � OSDS reliability and sustainability of individual upgrades, � Translating and applying tributary strategy goals, � Chesapeake Bay Restoration Fund Act eligibility, � Wasteload allocation for new cluster treatment facilities,
Actions:
� Complete ENR upgrades at Water Reclamation Facilities per Memorandum of Understanding with MDE.
� Determine the ability to increase treatment capacities at Water Reclamation Facilities using the “bubble permit” concept.
� Identify weaknesses in pipe infrastructure and explore the development of a more reliable power back-up solution for pumping stations.
Septic Systems
2009GeneralDevelopentPlan
The Water Resources Plan
Page 223
Chapter 10
� Management of cluster system effluent, and � OSDS hookup credits and the bubble permit.
Recent State legislation was passed that will help fund community sewerage systems. Specified fee revenue collected for the Bay Restoration Fund can be used to award grants or loans up to 100% of:
� The costs attributable to upgrading an onsite sewage disposal system and a system that utilizes the best available technology for the removal of nitrogen,
� The cost difference between a conventional onsite sewage disposal system and a system that utilizes the best available technology for nitrogen removal,
� The cost of repairing or replacing a failing onsite sewage disposal system that uses the best available technology for nitrogen removal,
� The cost, up to the sum of the costs authorized under number 2 for each indi-vidual system, or replacing multiple on-site sewage disposal systems located in the same community with a new community sewerage system that is owned by a local government and that meets enhanced nutrient removal standards.
Goal: Achieve significant reductions in nutrient loads from onsite septic systems.
Policy 1: Reduce total nutrient loads from onsite septic systems within the County with particular emphasis on reduction in the Severn River, South River, Magothy River and Bodkin Creek watersheds where nutrient loads are the most significant.
Actions:
� Develop a short and long-term strategic plan for implementing the recommenda-tions from the OSDS Study to address problem septic areas, based on the priorities identified in that study for addressing first those areas that are potentially generat-ing the most significant pollutant loads. This strategic plan will require feasibility and engineering studies, public outreach, and potentially other planning studies for the various OSDS management areas, and funding strategies to implement the projects.
� In conjunction with the above, apply for funding through the State’s Chesapeake Bay Restoration Fund program to implement the OSDS strategies.
� Update the map of Onsite Wastewater Management Problem Areas in the Water and Sewer Master Plan to reflect the most current information.
� Explore additional funding techniques that can be used for community connec-tions to public sewer or installation of private community systems in known problem septic areas.
2009GeneralDevelopentPlan
Page 224
Chapter 10 The Water Resources Plan
Policy 2: For the benefit of reducing nutrient loads to local tributaries, communities served by onsite septic systems that are identified as problem septic areas, and areas with a high potential to generate significant pollutant loads from septic systems, should be placed in the Planned Sewer Service timing category if it is feasible to extend public sewer or install community treatment systems in those areas, regard-less of the Land Use Plan and zoning. Extension of public sewer in such cases will not be considered justification in itself for changing the Land Use Plan or zoning in these areas, and should not be considered as inconsistent with the General Development Plan.
Actions:
� Identify communities served by onsite septic systems that are currently problem septic areas, and areas with a high potential to generate significant pollutant loads from septic systems, and amend the Water and Sewer Master Plan to include these areas in the Planned Sewer Service category if not already.
� In those cases where extension of public sewer is the most feasible alternative to address a problem septic area, determine whether the use of denied access sewer lines would be warranted, and incorporate policies and provisions into the Water and Sewer Master Plan as needed to indicate where denied access sewer lines are proposed.
� In addition, add these communities to the Priority Funding Area where possible so they will be eligible for Bay Restoration Fund grants for public sewer extension.
� Provide information to homeowners and business owners regarding the impor-tance of regular maintenance to septic systems.
� Develop a more streamlined petition process for community connections to pub-lic sewer in order to better accomplish some of the OSDS strategies.
� Evaluate the feasibility of code revisions to require all new or replacement private septic systems to utilize the latest standards for denitrification. Currently this requirement applies only within the Critical Area. Determine whether it is feasible in other areas.
The Anne Arundel County Watershed Ecosystem and Restoration Services (WERS) Divi-sion has developed comprehensive and preliminary mitigation implementation plans with varying degrees of detail for the Severn, South, Upper Patuxent, Magothy, and the Patapsco Tidal and Non Tidal Watersheds. The Environmental Capital Improvement Project fund has been the primary vehicle for implementing restoration projects as rec-ommended by the available mitigation plans. These restoration projects are reported annually to the Maryland Department of the Environment to fulfill the County’s NPDES
Nonpoint Source Loads
2009GeneralDevelopentPlan
The Water Resources Plan
Page 225
Chapter 10
permit requirement for assessment, planning, and restoration. WERS has engaged in publishing the watershed assessments, problem area ranking, and mitigation recom-mendation in Geographic Information System (GIS) enterprise mapping applications. This information should be consulted by future new development and redevelopment projects to ensure that stormwater mitigation plans include stretch goal requirements for correcting downstream water capacity, quality, and infrastructure deficiency issues within the proximity of the project and to the greatest extent feasible as a contingency to development.
In addition, the County is currently revising Articles 16 and 17 of the County Code to implement the State’s Stormwater Management Act of 2007. The Act requires new devel-opment to use environmental site design (ESD) and to control stormwater runoff using nonstructural best management practices and other low impact site design techniques to the maximum extent practicable. MDE is currently addressing the requirements of the Act including changes to State regulations as well as the State’s 2000 Stormwater Design Manual. Prior to this Act, ESD was encouraged through a series of credits found in the 2000 Stormwater Design Manual.
Implementation of the Stormwater Management Act of 2007 will have an important role in addressing water resource restoration and mitigation requirements. The Stormwater Management Act of 2007 features the following core principles:
� Increase Onsite Runoff Reduction Volumes (predevelopment hydrology) � Require a Unified Early Environmental Site Design (ESD) Map � Establish Nutrient-Based Stormwater Loading Criteria (nutrient discharge lim-
its), where: � development > 40% Impervious TN< 2.68 lbs/acre/year � development < 40% Impervious TN < 0.28 lbs/acre/year
� ESD Applies to Redevelopment – 50% reduction in existing impervious � Fast track implementation
By adopting the Environmental Sensitive Design criteria for new developments and stretch goal redevelopment criteria for existing developments as promulgated by the Stormwater Management Act of 2007, the County expects to see fewer impacts from future development and even an improvement to the current conditions through site redevelopment under stricter stormwater management regulations.
As is the case with mitigating pollutant loads from septic systems, the financial challenge in dealing with stormwater runoff is significant. Existing stormwater infrastructure needs identified by the County are discussed in Chapter 11 along with their associated capital improvement costs. However, the additional costs related to reducing nonpoint source pollutant loads to meet TMDL requirements are more difficult to quantify. Some of this cost will certainly be incurred by private developers, but the County will need to explore other potential funding alternatives, such as establishing a stormwater utility, in order to accomplish its nonpoint source pollution reduction goals.
2009GeneralDevelopentPlan
Page 226
Chapter 10 The Water Resources Plan
The County is actively engaging in coordination efforts with the Maryland Department of Environment aimed at formulating guidelines and developing implementation plans to address these mitigation requirements. Some of the important technical and policy questions currently under discussion pertain to defining the assimilative capacity for all watersheds, load allocation issues, implementation schedule, local government versus state/federal/private responsibilities, available restoration technologies, and financial strategies, among many other issues.
Goal: Improve stormwater management practices throughout the County to reduce nonpoint source pollutant loads and achieve water quality standards.
Policy 1: Be proactive in achieving the greatest reduction in nonpoint source loads attainable.
Actions:
� Develop additional data layers and input needed to model and assess the effec-tiveness of existing and future stormwater management practices in reducing nonpoint source pollutant loads.
� Complete and maintain an accurate database of all privately and publicly owned and maintained stormwater management facilities in the County.
� Conduct field monitoring to assess the effectiveness of current stormwater man-agement practices in reducing nonpoint source pollutants. Report inspection and maintenance findings to the facility owner and the watershed assessment and planning program for retrofit action recommendations, prioritization, and implementation.
� Evaluate alternatives for improving, enforcing, and funding long-term inspection and maintenance programs of both private and public stormwater management facilities.
� Work with the Departments of Inspections and Permits and Public Works to secure condition assessment data and maintenance schedules for all privately and publicly owned stormwater practices. Incorporate the data within the Water-shed Management Tool to assess the effectiveness, prioritize retrofit actions, and develop retrofit implementation plans.
� Update standards and specifications for innovative stormwater management prac-tices based on lessons learned from inspection, maintenance, and monitoring.
� Revise the County’s Stormwater Practices and Procedures Manual to address new requirements of the State’s 2007 Stormwater Management Act and to incorpo-rate specific criteria for environmentally sensitive site design.
2009GeneralDevelopentPlan
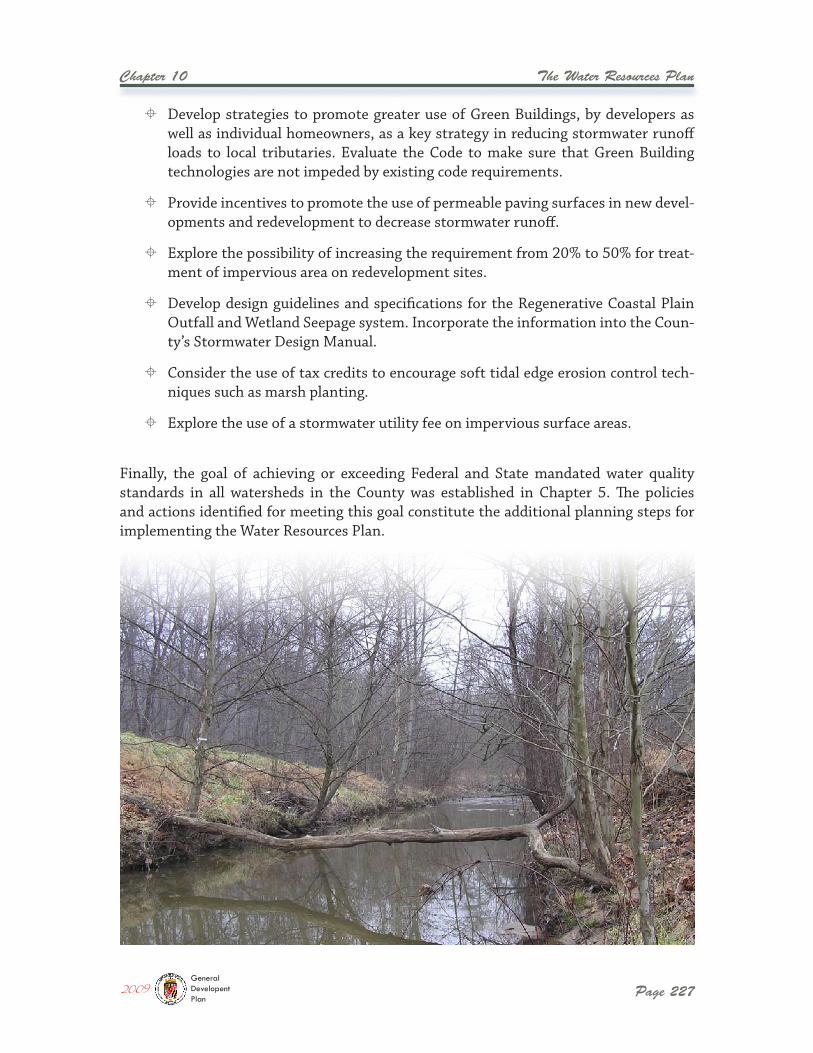
The Water Resources Plan
Page 227
Chapter 10
� Develop strategies to promote greater use of Green Buildings, by developers as well as individual homeowners, as a key strategy in reducing stormwater runoff loads to local tributaries. Evaluate the Code to make sure that Green Building technologies are not impeded by existing code requirements.
� Provide incentives to promote the use of permeable paving surfaces in new devel-opments and redevelopment to decrease stormwater runoff.
� Explore the possibility of increasing the requirement from 20% to 50% for treat-ment of impervious area on redevelopment sites.
� Develop design guidelines and specifications for the Regenerative Coastal Plain Outfall and Wetland Seepage system. Incorporate the information into the Coun-ty’s Stormwater Design Manual.
� Consider the use of tax credits to encourage soft tidal edge erosion control tech-niques such as marsh planting.
� Explore the use of a stormwater utility fee on impervious surface areas.
Finally, the goal of achieving or exceeding Federal and State mandated water quality standards in all watersheds in the County was established in Chapter 5. The policies and actions identified for meeting this goal constitute the additional planning steps for implementing the Water Resources Plan.
2009GeneralDevelopentPlan


Chapter 11:Concurrency Management Plan

The Concurrency Management Plan
Page 231
Chapter 11
Concurrency management involves the process of measuring and tracking the opera-tional capacities and levels of service of public facilities in order to ensure that adequate capacities and service levels can be maintained as needed to serve the existing population base as well as future growth. Concurrency management also enables a local government to ensure that the appropriate funding mechanisms are in place and sufficient funding is allocated to meet service demands and to maintain the desired service levels.
The Anne Arundel County Code (Article 18) requires the County’s General Development Plan to address the issue of growth management in order to minimize potential adverse impacts of new development by ensuring that public facilities adequate to support future development are in place at the time the future development occurs. The Code requires that this adequacy be demonstrated for the specific public facilities of County and State roads, public schools, fire protection and EMS services, and stormwater management facilities. Specifically, the GDP must define level of service standards, evaluate existing and future demand, identify improvements needed and associated costs to serve that demand over a ten year timeframe, and describe funding sources available or needed to provide the needed improvements. In the GDP, the term concurrency management is used in addressing this code requirement.
Existing mechanisms in place that address these requirements in part include the Ade-quate Public Facilities (APF) regulations in Article 17 of the County Code, and the Capital Budget and Program. Current APF regulations require that development plan applications pass specific APF tests as a condition of subdivision plan or site plan approval. While this enables the County to track available capacities of public facilities on a project-by-project basis, it does not provide for the more comprehensive and long range assessment of infrastructure capacities needed to ensure adequate levels of service over the long term. Likewise, the Capital Budget and Program is updated and adopted annually and allows funding for capital facility needs to be allocated over a six-year program, but does not guarantee that adequate funding will be programmed to meet future facility demands over the long term. Therefore, a more holistic approach that assesses projected growth and future demand for capital improvements over a longer planning horizon is warranted.
For the purposes of this analysis of existing and future demand on public facilities, defined levels of service are based on operational capacity of the public facility, in other words, the physical requirements of the facility in terms of space, equipment, miles, etc. For example, strategic planning for public schools may identify needs not only for addi-tional space as related to the number of students that can be accommodated, but also for expanded curriculums or programs. However, this analysis will focus only on the capital facility needs to maintain the desired operational capacities, since these are the costs most directly related to new growth in the County.
Method of Analysis and Information Sources
2009GeneralDevelopentPlan
Page 232
Chapter 11 The Concurrency Management Plan
Several individual sources and studies were used to derive information for this analysis. These are listed and described below:
� Information from the County’s Office of Budget on capital project requests was used to assess existing and future capital needs.
� “Phase I Report: Fiscal Impact Analysis of Four Growth Scenarios” (June 2008) was prepared in consultation with the consulting firm Tischler Bise to estimate direct revenues and costs to the County of providing public facilities and services to serve new development assuming current growth trends as identified in the Baltimore Metropolitan Council’s (BMC) Round 7a Forecasts and also assuming alternative growth scenarios.
� “Phase II Report: Fiscal Evaluation and Revenue Strategies” (December 2008), also prepared by Tischler Bise, assessed ongoing capital costs to serve existing development as well as future projected costs to serve new development and to correct existing infrastructure backlogs.
� The Countywide Traffic Model (AATRavM 1.1) was used to estimate average daily travel demand and to estimate operational levels of service during peak vol-ume hours for base year 2005 and future year 2035 based on BMC’s Round 7a forecasts.
� “Fire Services Deployment Study” (November 2008) was prepared in consultation with System Planning Corporation’s TriData Division to assess the Fire Depart-ment’s ability to meet service demands at appropriate levels over a five year study horizon.
More specific details on methodologies and assumptions used are described below or can be found in the studies or reports cited above.
This section defines level of service standards for the specified public facilities and presents findings related to existing and future demand on the facilities and capital improvements needed.
In traffic analysis, Level of Service (LOS) represents the amount of congestion on a road-way, with LOS A representing free flowing conditions with minimal congestion and LOS F representing the most congested conditions. Where possible, the County and the State Highway Administration recommend LOS D or higher as a standard for operation during peak volume hours. However, this standard is not always achievable or even desirable in certain settings such as a town center where more intense development is promoted.
Level of Service Standards and Analysis of Existing and Future Demand
Level of Service Standard
Public Roads
2009GeneralDevelopentPlan
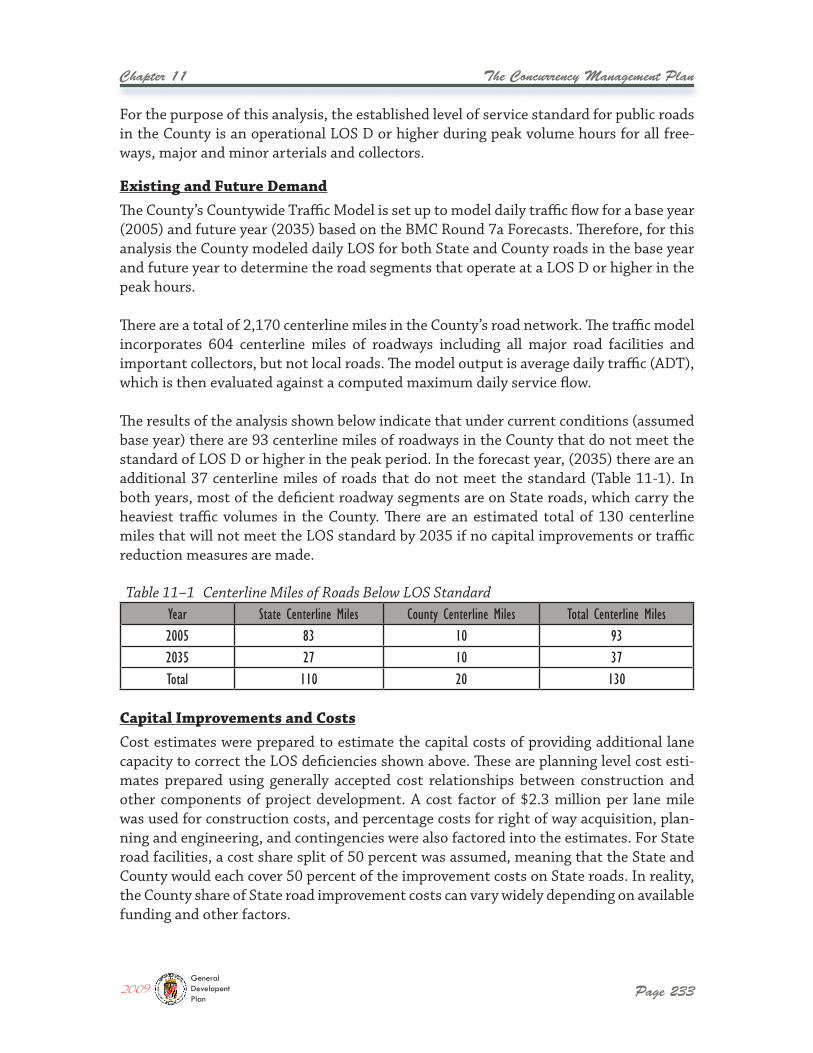
The Concurrency Management Plan
Page 233
Chapter 11
The County’s Countywide Traffic Model is set up to model daily traffic flow for a base year (2005) and future year (2035) based on the BMC Round 7a Forecasts. Therefore, for this analysis the County modeled daily LOS for both State and County roads in the base year and future year to determine the road segments that operate at a LOS D or higher in the peak hours.
There are a total of 2,170 centerline miles in the County’s road network. The traffic model incorporates 604 centerline miles of roadways including all major road facilities and important collectors, but not local roads. The model output is average daily traffic (ADT), which is then evaluated against a computed maximum daily service flow.
The results of the analysis shown below indicate that under current conditions (assumed base year) there are 93 centerline miles of roadways in the County that do not meet the standard of LOS D or higher in the peak period. In the forecast year, (2035) there are an additional 37 centerline miles of roads that do not meet the standard (Table 11-1). In both years, most of the deficient roadway segments are on State roads, which carry the heaviest traffic volumes in the County. There are an estimated total of 130 centerline miles that will not meet the LOS standard by 2035 if no capital improvements or traffic reduction measures are made.
For the purpose of this analysis, the established level of service standard for public roads in the County is an operational LOS D or higher during peak volume hours for all free-ways, major and minor arterials and collectors.
Cost estimates were prepared to estimate the capital costs of providing additional lane capacity to correct the LOS deficiencies shown above. These are planning level cost esti-mates prepared using generally accepted cost relationships between construction and other components of project development. A cost factor of $2.3 million per lane mile was used for construction costs, and percentage costs for right of way acquisition, plan-ning and engineering, and contingencies were also factored into the estimates. For State road facilities, a cost share split of 50 percent was assumed, meaning that the State and County would each cover 50 percent of the improvement costs on State roads. In reality, the County share of State road improvement costs can vary widely depending on available funding and other factors.
Table 11–1 Centerline Miles of Roads Below LOS StandardYear State Centerline Miles County Centerline Miles Total Centerline Miles2005 83 10 932035 27 10 37Total 110 20 130
Existing and Future Demand
Capital Improvements and Costs
2009GeneralDevelopentPlan
Page 234
Chapter 11 The Concurrency Management Plan
Of course, there are alternatives other than capital improvements that can serve to reduce traffic congestion and improve levels of service on area roads. These include increased use of carpooling and vanpooling, telecommuting, and other strategies discussed in Chapter 9. The County should make concentrated efforts to promote other travel demand man-agement strategies to reduce the capital cost burden on both the State and the County.
The Anne Arundel County Public School (AACPS) system currently serves over 73,000 students with a staff of over 5,000 teachers working in 118 public schools. The system is organized in 12 high school feeder districts and includes 19 middle schools and 78 elementary schools. AACPS also operates several special schools including alternative education centers, special education centers, and charter schools.
The Educational Facilities Master Plan determines a utilization rate annually for each County public school. The rate represents a comparison of the State Rated Capacity versus the full time enrollment at each school, with 100% representing a fully utilized school. The County’s APF test for public schools is based on the utilization rate, and schools that are above 100% utilization are considered over capacity and are closed to new develop-ment projects for a period of time.
For the purpose of this analysis, the established level of service standard for public schools in the County is a school utilization rate of 100% or less for all elementary, middle, and high schools. It is noted that school utilization will fluctuate annually as well as during the school year, as residents move into or out of a school district. Also, because funds are limited, State funding for school expansions or construction is rarely available unless a school has reached 120% capac-ity or more. Therefore, the County must evaluate whether it is realistic, from a fiscal standpoint, to maintain all public schools at 100% capacity or lower at all times.
Using these assumptions, the results below indicate that capital funding of $544 million would be needed to bring all County and State roadways up to the defined LOS standard under current (base year) conditions (Table 11-2). By year 2035, an additional $180 mil-lion would be needed to maintain the road network at the defined LOS standard.
Table 11–2 Costs to Correct Road LOS Deficiencies (x $1,000)Year State Roads County Roads Total2005 $439,000 $105,000 $544,0002035 $75,000 $105,000 $180,000Total $514,000 $210,000 $724,000
Level of Service Standard
Public Schools
2009GeneralDevelopentPlan
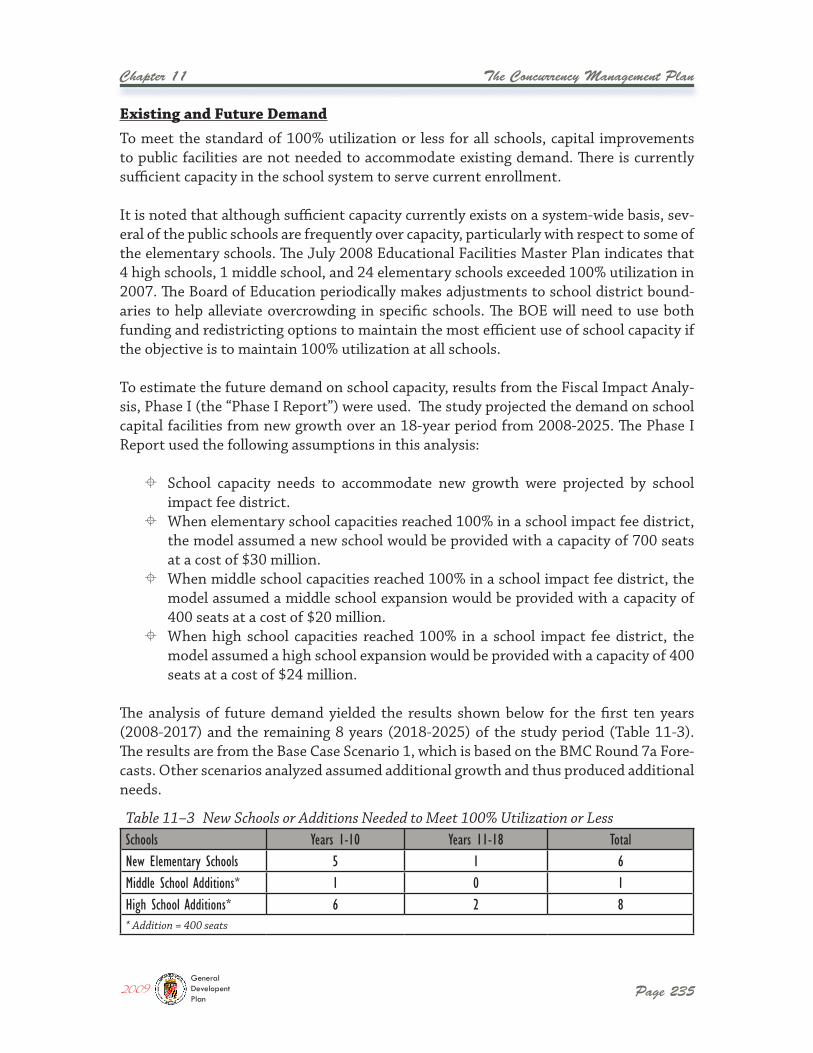
The Concurrency Management Plan
Page 235
Chapter 11
To meet the standard of 100% utilization or less for all schools, capital improvements to public facilities are not needed to accommodate existing demand. There is currently sufficient capacity in the school system to serve current enrollment.
It is noted that although sufficient capacity currently exists on a system-wide basis, sev-eral of the public schools are frequently over capacity, particularly with respect to some of the elementary schools. The July 2008 Educational Facilities Master Plan indicates that 4 high schools, 1 middle school, and 24 elementary schools exceeded 100% utilization in 2007. The Board of Education periodically makes adjustments to school district bound-aries to help alleviate overcrowding in specific schools. The BOE will need to use both funding and redistricting options to maintain the most efficient use of school capacity if the objective is to maintain 100% utilization at all schools.
To estimate the future demand on school capacity, results from the Fiscal Impact Analy-sis, Phase I (the “Phase I Report”) were used. The study projected the demand on school capital facilities from new growth over an 18-year period from 2008-2025. The Phase I Report used the following assumptions in this analysis:
� School capacity needs to accommodate new growth were projected by school impact fee district.
� When elementary school capacities reached 100% in a school impact fee district, the model assumed a new school would be provided with a capacity of 700 seats at a cost of $30 million.
� When middle school capacities reached 100% in a school impact fee district, the model assumed a middle school expansion would be provided with a capacity of 400 seats at a cost of $20 million.
� When high school capacities reached 100% in a school impact fee district, the model assumed a high school expansion would be provided with a capacity of 400 seats at a cost of $24 million.
The analysis of future demand yielded the results shown below for the first ten years (2008-2017) and the remaining 8 years (2018-2025) of the study period (Table 11-3). The results are from the Base Case Scenario 1, which is based on the BMC Round 7a Fore-casts. Other scenarios analyzed assumed additional growth and thus produced additional needs.
Table 11–3 New Schools or Additions Needed to Meet 100% Utilization or LessSchools Years 1-10 Years 11-18 TotalNew Elementary Schools 5 1 6Middle School Additions* 1 0 1High School Additions* 6 2 8* Addition = 400 seats
Existing and Future Demand
2009GeneralDevelopentPlan
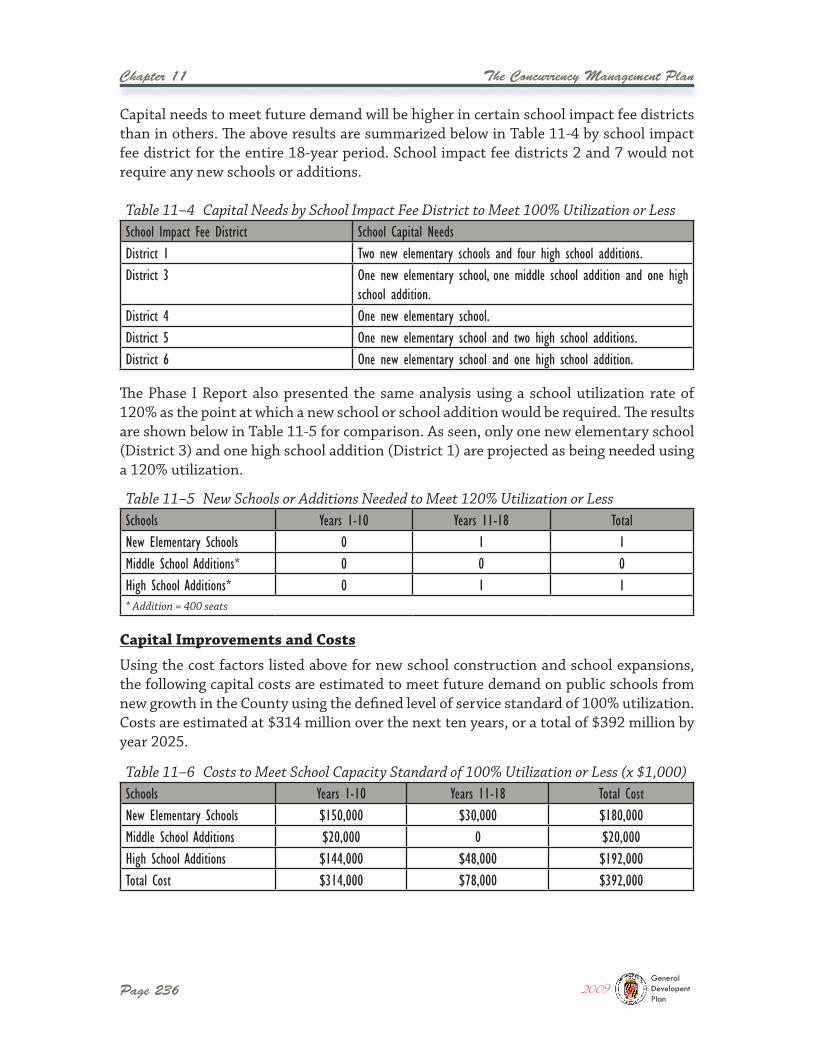
Page 236
Chapter 11 The Concurrency Management Plan
Capital needs to meet future demand will be higher in certain school impact fee districts than in others. The above results are summarized below in Table 11-4 by school impact fee district for the entire 18-year period. School impact fee districts 2 and 7 would not require any new schools or additions.
The Phase I Report also presented the same analysis using a school utilization rate of 120% as the point at which a new school or school addition would be required. The results are shown below in Table 11-5 for comparison. As seen, only one new elementary school (District 3) and one high school addition (District 1) are projected as being needed using a 120% utilization.
Using the cost factors listed above for new school construction and school expansions, the following capital costs are estimated to meet future demand on public schools from new growth in the County using the defined level of service standard of 100% utilization. Costs are estimated at $314 million over the next ten years, or a total of $392 million by year 2025.
Table 11–4 Capital Needs by School Impact Fee District to Meet 100% Utilization or LessSchool Impact Fee District School Capital NeedsDistrict 1 Two new elementary schools and four high school additions.District 3 One new elementary school, one middle school addition and one high
school addition.District 4 One new elementary school.District 5 One new elementary school and two high school additions.District 6 One new elementary school and one high school addition.
Table 11–5 New Schools or Additions Needed to Meet 120% Utilization or LessSchools Years 1-10 Years 11-18 TotalNew Elementary Schools 0 1 1Middle School Additions* 0 0 0High School Additions* 0 1 1* Addition = 400 seats
Table 11–6 Costs to Meet School Capacity Standard of 100% Utilization or Less (x $1,000)Schools Years 1-10 Years 11-18 Total CostNew Elementary Schools $150,000 $30,000 $180,000Middle School Additions $20,000 0 $20,000High School Additions $144,000 $48,000 $192,000Total Cost $314,000 $78,000 $392,000
Capital Improvements and Costs
2009GeneralDevelopentPlan
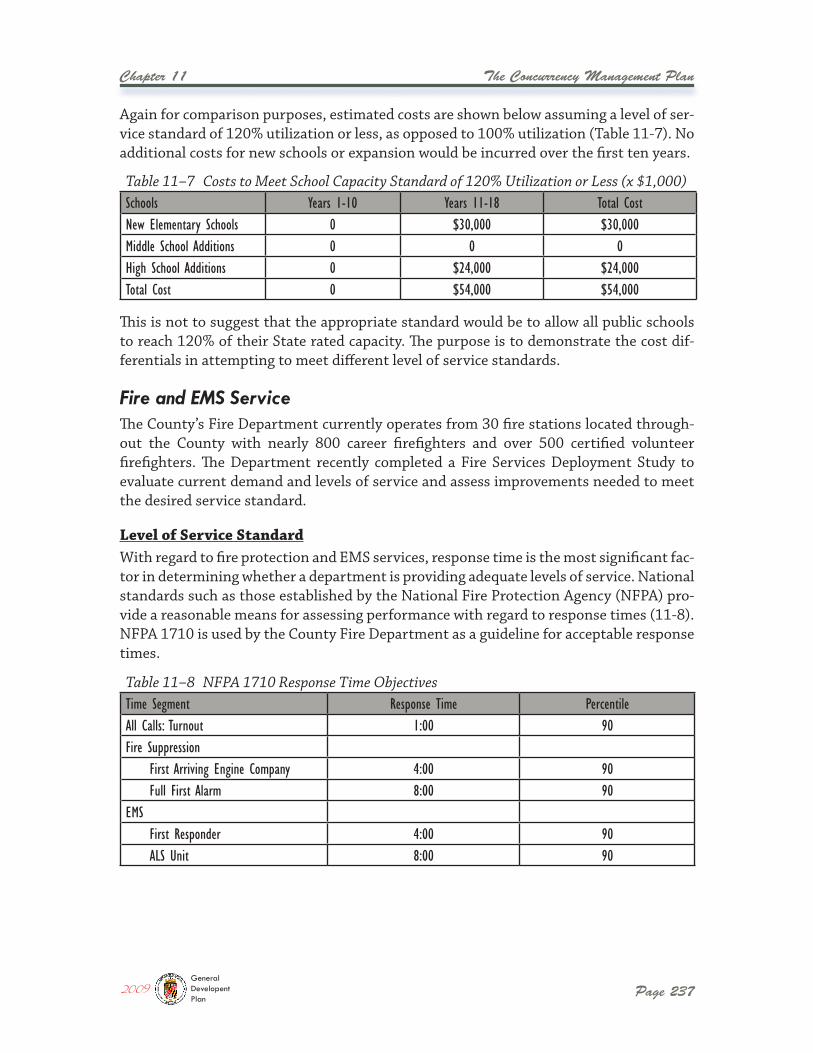
The Concurrency Management Plan
Page 237
Chapter 11
Again for comparison purposes, estimated costs are shown below assuming a level of ser-vice standard of 120% utilization or less, as opposed to 100% utilization (Table 11-7). No additional costs for new schools or expansion would be incurred over the first ten years.
This is not to suggest that the appropriate standard would be to allow all public schools to reach 120% of their State rated capacity. The purpose is to demonstrate the cost dif-ferentials in attempting to meet different level of service standards.
The County’s Fire Department currently operates from 30 fire stations located through-out the County with nearly 800 career firefighters and over 500 certified volunteer firefighters. The Department recently completed a Fire Services Deployment Study to evaluate current demand and levels of service and assess improvements needed to meet the desired service standard.
With regard to fire protection and EMS services, response time is the most significant fac-tor in determining whether a department is providing adequate levels of service. National standards such as those established by the National Fire Protection Agency (NFPA) pro-vide a reasonable means for assessing performance with regard to response times (11-8). NFPA 1710 is used by the County Fire Department as a guideline for acceptable response times.
Table 11–7 Costs to Meet School Capacity Standard of 120% Utilization or Less (x $1,000)Schools Years 1-10 Years 11-18 Total CostNew Elementary Schools 0 $30,000 $30,000Middle School Additions 0 0 0High School Additions 0 $24,000 $24,000Total Cost 0 $54,000 $54,000
Table 11–8 NFPA 1710 Response Time ObjectivesTime Segment Response Time PercentileAll Calls: Turnout 1:00 90Fire Suppression
First Arriving Engine Company 4:00 90Full First Alarm 8:00 90
EMSFirst Responder 4:00 90ALS Unit 8:00 90
Fire and EMS Service
Level of Service Standard
2009GeneralDevelopentPlan
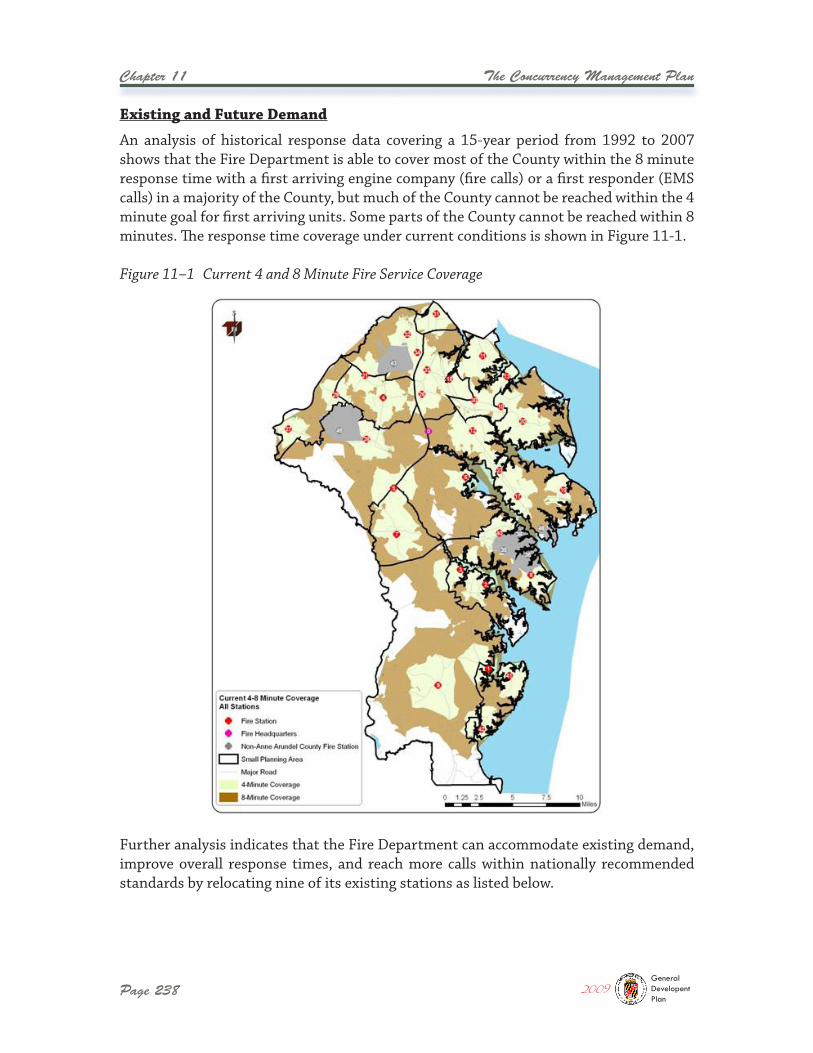
Page 238
Chapter 11 The Concurrency Management Plan
Further analysis indicates that the Fire Department can accommodate existing demand, improve overall response times, and reach more calls within nationally recommended standards by relocating nine of its existing stations as listed below.
Figure 11–1 Current 4 and 8 Minute Fire Service Coverage
An analysis of historical response data covering a 15-year period from 1992 to 2007 shows that the Fire Department is able to cover most of the County within the 8 minute response time with a first arriving engine company (fire calls) or a first responder (EMS calls) in a majority of the County, but much of the County cannot be reached within the 4 minute goal for first arriving units. Some parts of the County cannot be reached within 8 minutes. The response time coverage under current conditions is shown in Figure 11-1.
Existing and Future Demand
2009GeneralDevelopentPlan
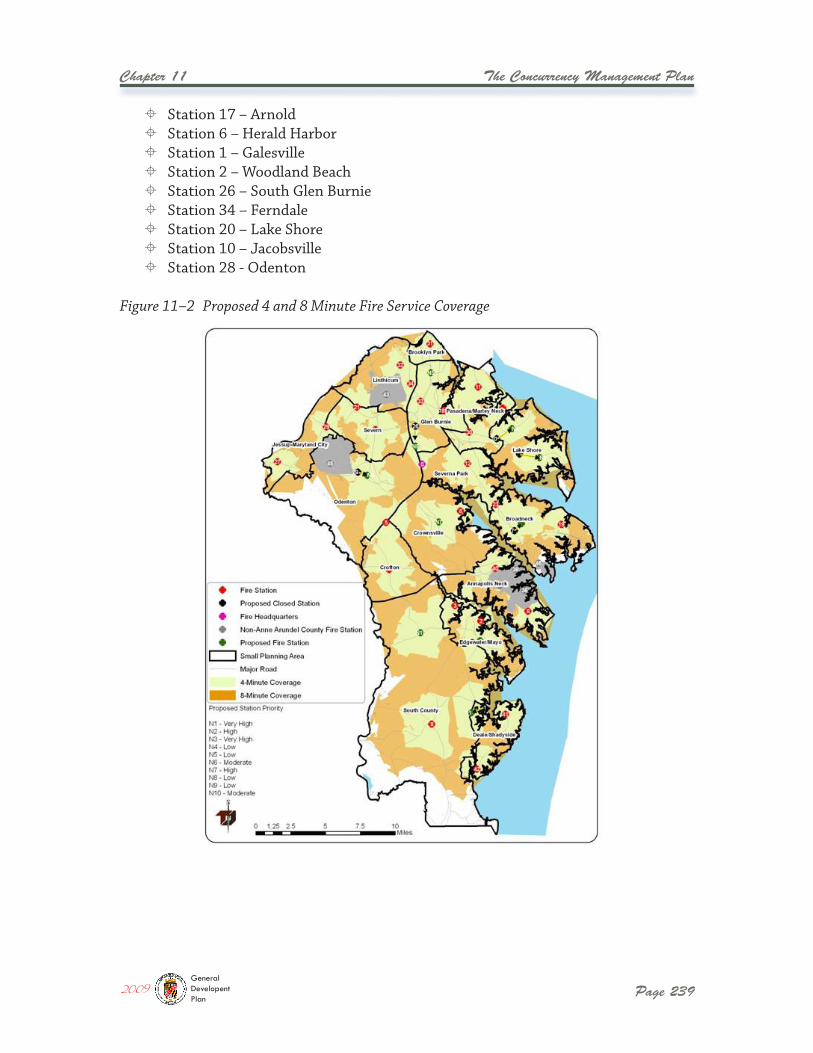
The Concurrency Management Plan
Page 239
Chapter 11
� Station 17 – Arnold � Station 6 – Herald Harbor � Station 1 – Galesville � Station 2 – Woodland Beach � Station 26 – South Glen Burnie � Station 34 – Ferndale � Station 20 – Lake Shore � Station 10 – Jacobsville � Station 28 - Odenton
Figure 11–2 Proposed 4 and 8 Minute Fire Service Coverage
2009GeneralDevelopentPlan

Page 240
Chapter 11 The Concurrency Management Plan
The Fire Department’s study looked at service needs over a five-year horizon. To help assess the impact of future development on fire and EMS service, the Fiscal Impact Anal-ysis, Phase I also estimated capital needs to provide fire/EMS service to serve additional growth for years 2008-2025. However, the Fiscal Impact Model does not have the capa-bility to estimate response times, so a different level of service standard must be used with a model of this type. Therefore the Phase I study defined the service standard as the current level of service based on calls for service per square foot of fire station facility, and then used calls for service per capita factor to determine capacity needs related to new growth. The Base Case scenario indicated a need for 4 new fire stations, with two new stations needed in the first ten years, and two additional stations needed in the following eight years.
The Fire Services Deployment Study estimated an average cost of $3.8 million for relo-cation of a fire station. Therefore, capital costs would total $34.2 million to relocate 9 existing stations.
The Phase I Report estimated fire service capital costs needed to serve future growth assuming an 11,000 square foot prototype fire station at a cost of $4.5 million. The cost estimates include apparatus to support each station including a pumper/tanker and para-medic unit. Total capital costs of $20,975,000 including apparatus were estimated for the entire 18-year period to 2025. During the first ten years, capital costs of $10,190,000 were estimated.
As the County continues to grow and demand for service continues to rise, the Fire Department will need to continually evaluate population density and call volume as it relates to the 4 and 8 minute response times, with the goal of covering the vast majority of the County within a 4 minute response time. Regardless of the projected increased demand for service, without additional stations the level of service standards of 4 min-utes and 8 minutes cannot be extended to a larger portion of the County. Along with an increased demand for service comes the likelihood that units may be unavailable due to being on a prior call, so that without additional units and staffing to provide coverage, response times will increase.
Capital Improvements and Costs
2009GeneralDevelopentPlan
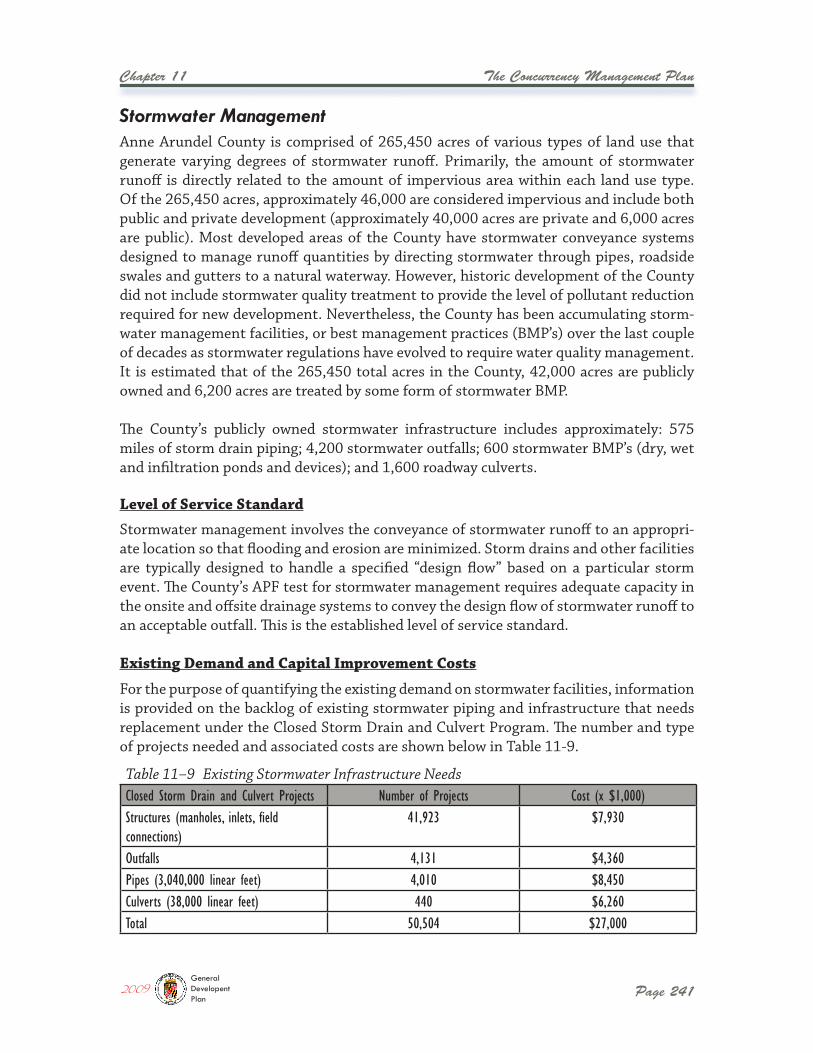
The Concurrency Management Plan
Page 241
Chapter 11
Anne Arundel County is comprised of 265,450 acres of various types of land use that generate varying degrees of stormwater runoff. Primarily, the amount of stormwater runoff is directly related to the amount of impervious area within each land use type. Of the 265,450 acres, approximately 46,000 are considered impervious and include both public and private development (approximately 40,000 acres are private and 6,000 acres are public). Most developed areas of the County have stormwater conveyance systems designed to manage runoff quantities by directing stormwater through pipes, roadside swales and gutters to a natural waterway. However, historic development of the County did not include stormwater quality treatment to provide the level of pollutant reduction required for new development. Nevertheless, the County has been accumulating storm-water management facilities, or best management practices (BMP’s) over the last couple of decades as stormwater regulations have evolved to require water quality management. It is estimated that of the 265,450 total acres in the County, 42,000 acres are publicly owned and 6,200 acres are treated by some form of stormwater BMP.
The County’s publicly owned stormwater infrastructure includes approximately: 575 miles of storm drain piping; 4,200 stormwater outfalls; 600 stormwater BMP’s (dry, wet and infiltration ponds and devices); and 1,600 roadway culverts.
Stormwater management involves the conveyance of stormwater runoff to an appropri-ate location so that flooding and erosion are minimized. Storm drains and other facilities are typically designed to handle a specified “design flow” based on a particular storm event. The County’s APF test for stormwater management requires adequate capacity in the onsite and offsite drainage systems to convey the design flow of stormwater runoff to an acceptable outfall. This is the established level of service standard.
For the purpose of quantifying the existing demand on stormwater facilities, information is provided on the backlog of existing stormwater piping and infrastructure that needs replacement under the Closed Storm Drain and Culvert Program. The number and type of projects needed and associated costs are shown below in Table 11-9.
Table 11–9 Existing Stormwater Infrastructure NeedsClosed Storm Drain and Culvert Projects Number of Projects Cost (x $1,000)Structures (manholes, inlets, field connections)
41,923 $7,930
Outfalls 4,131 $4,360Pipes (3,040,000 linear feet) 4,010 $8,450Culverts (38,000 linear feet) 440 $6,260Total 50,504 $27,000
Stormwater Management
Level of Service Standard
Existing Demand and Capital Improvement Costs
2009GeneralDevelopentPlan
Page 242
Chapter 11 The Concurrency Management Plan
The backlog total includes only those hard infrastructure items associated with extend-ing the useful life of existing storm drain infrastructure that has been deteriorating over time. There is an additional backlog of storm drain projects that are necessary to provide flood relief or drainage improvements to address areas where runoff generated from public property impacts private property. In addition, there are projects associated with road systems that were originally privately developed and owned, and have since been conveyed to the County for maintenance, that do not have adequate or sufficient drainage systems. Identifying all such instances throughout the County is not possible, requiring that the Department of Public Works track these issues on a complaint basis. At this time, it is estimated that providing storm drainage systems to only those known complaint areas would require over $18 million.
It is difficult to estimate the impact of future development and growth on stormwater management facilities. The demand for some types of public facilities, such as schools or fire protection services, can be closely related to population size, and therefore future demand and capacity needs can be estimated using per capita factors. However, storm-water runoff is a function of the type of development, the amount of impervious coverage, and the stormwater man-agement techniques used to control runoff. New techniques that are being widely promoted such as green roofs, environ-mental site design, and gray water recycling can significantly reduce stormwater runoff impacts from new as well as exist-ing development. In addition, most of the cost for installing new storm drain systems to serve new development is cov-ered by private developers, not by the County. Therefore, the County does not have the ability to estimate growth-related costs for storm drainage over specific time periods.
There are related costs associated with capital improvements required to meet State and/or federal water quality regulations, including NPDES Permit requirements and the new TMDL standards for pollutant loads to tributaries. While this goes beyond the level of service standard defined above, it is nevertheless a real cost that is significant. Through the County’s watershed planning efforts, a variety of stream restoration and stormwater management projects have been identified that would serve to improve water quality and reduce pollutant loads, and estimates have indicated that the costs to implement these projects could range from $600 million to over $1 billion. This will almost certainly require the County to consider additional revenue strategies, such as a stormwater utility, that will provide funding for these capital improvements in the future.
The County’s Capital Budget and Program, adopted annually, contains an itemized list of capital projects which the various agencies of the County government propose to undertake in the ensuing fiscal year and the next succeeding five fiscal years thereafter.
Long Range Capital Improvement Needs
2009GeneralDevelopentPlan
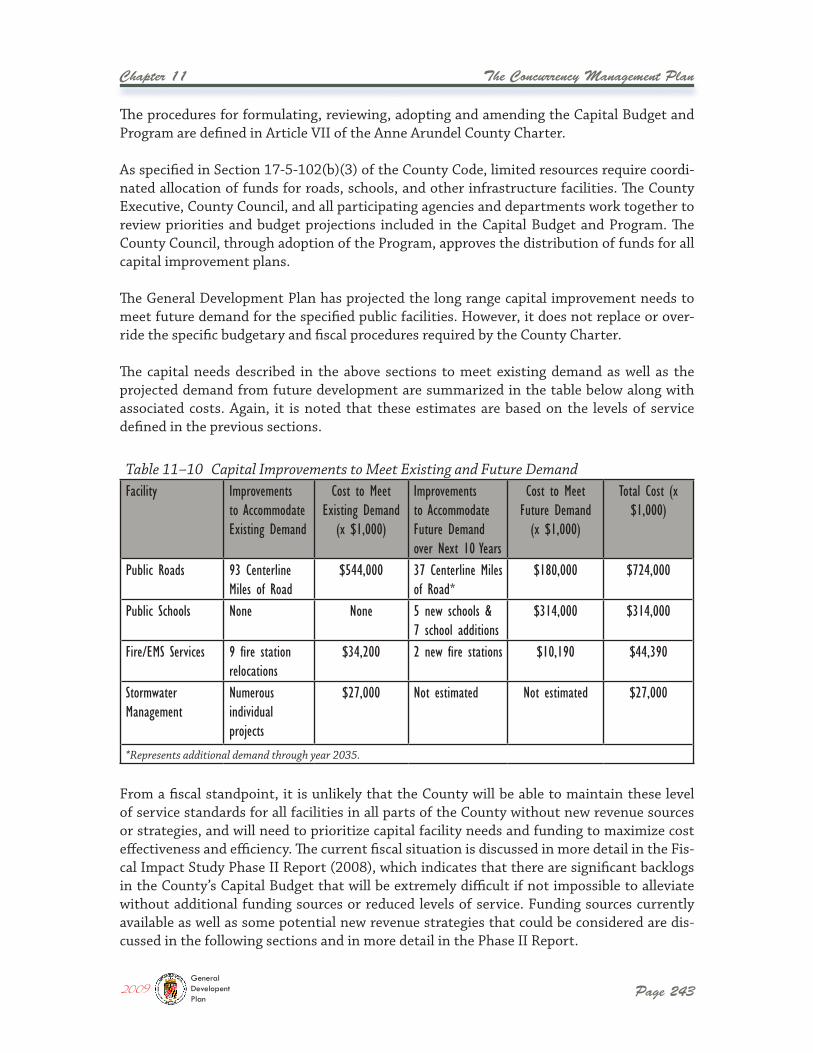
The Concurrency Management Plan
Page 243
Chapter 11
The procedures for formulating, reviewing, adopting and amending the Capital Budget and Program are defined in Article VII of the Anne Arundel County Charter.
As specified in Section 17-5-102(b)(3) of the County Code, limited resources require coordi-nated allocation of funds for roads, schools, and other infrastructure facilities. The County Executive, County Council, and all participating agencies and departments work together to review priorities and budget projections included in the Capital Budget and Program. The County Council, through adoption of the Program, approves the distribution of funds for all capital improvement plans.
The General Development Plan has projected the long range capital improvement needs to meet future demand for the specified public facilities. However, it does not replace or over-ride the specific budgetary and fiscal procedures required by the County Charter.
The capital needs described in the above sections to meet existing demand as well as the projected demand from future development are summarized in the table below along with associated costs. Again, it is noted that these estimates are based on the levels of service defined in the previous sections.
From a fiscal standpoint, it is unlikely that the County will be able to maintain these level of service standards for all facilities in all parts of the County without new revenue sources or strategies, and will need to prioritize capital facility needs and funding to maximize cost effectiveness and efficiency. The current fiscal situation is discussed in more detail in the Fis-cal Impact Study Phase II Report (2008), which indicates that there are significant backlogs in the County’s Capital Budget that will be extremely difficult if not impossible to alleviate without additional funding sources or reduced levels of service. Funding sources currently available as well as some potential new revenue strategies that could be considered are dis-cussed in the following sections and in more detail in the Phase II Report.
Table 11–10 Capital Improvements to Meet Existing and Future DemandFacility Improvements
to Accommodate Existing Demand
Cost to Meet Existing Demand
(x $1,000)
Improvements to Accommodate Future Demand over Next 10 Years
Cost to Meet Future Demand
(x $1,000)
Total Cost (x $1,000)
Public Roads 93 Centerline Miles of Road
$544,000 37 Centerline Miles of Road*
$180,000 $724,000
Public Schools None None 5 new schools & 7 school additions
$314,000 $314,000
Fire/EMS Services 9 fire station relocations
$34,200 2 new fire stations $10,190 $44,390
Stormwater Management
Numerous individual projects
$27,000 Not estimated Not estimated $27,000
*Represents additional demand through year 2035.
2009GeneralDevelopentPlan
Page 244
Chapter 11 The Concurrency Management Plan
The County’s current income tax rate is 2.56 percent of net taxable income with FY08 budgeted revenues of $369 million. The State maximum allowable rate is 3.2 percent. According to the latest (FY08) survey by the Maryland Association of Counties, only two counties have a rate that is lower than Anne Arundel’s (Talbot and Worcester) and two are at the maximum rate of 3.2 percent (Howard and Montgomery). Of the 20 remaining counties, eight are above 3 percent.
In Anne Arundel County, it is estimated that an increase of 0.25 percent would yield an estimated $36 million; an increase of 0.5 percent would yield an estimated $72 million; and at the maximum allowable rate of 3.2 percent (an increase of 0.62 percent), the increase in revenue is estimated at $92 million. This revenue is significant not only because of the potential to use it for PayGo capital expenditures, but because of the additional debt this revenue could support. Based on level annual principal and interest payments assuming a 6 percent interest rate and a 20-year term, an additional $36 million annually could support approximately $400 million in additional debt. However, as discussed under the Bonds section below, the County’s existing debt guidelines would need to be modified to support this endeavor. Order of magnitude revenue estimates are provided below in Table 11-11.
To address the capital needs identified in the previous sections, new and enhanced rev-enue sources will need to be considered. Several potential revenue mechanisms were analyzed in the Phase II Report and are discussed in this section:
� Income Taxes � Transfer and/or Recordation Taxes � Property Taxes � Special District Property Tax � Local Sales and Service Taxes � Hotel/Motel Tax � Bonds � Impact Fees � Excise Taxes � Charges for Service and Other Fees � Utilities (for Stormwater and Transportation)
Capital funding for the public facilities discussed in this chapter are generally from three major revenue sources: the County’s General Fund; impact fees for roads, schools and public safety services; and State and federal grants. The County’s General Fund support for these public facilities includes both direct cash contribution (pay-as-you-go financing) and payment of debt service on County bonds (bond financing).
Income Taxes
Existing Funding Sources
Potential Revenue Strategies
2009GeneralDevelopentPlan
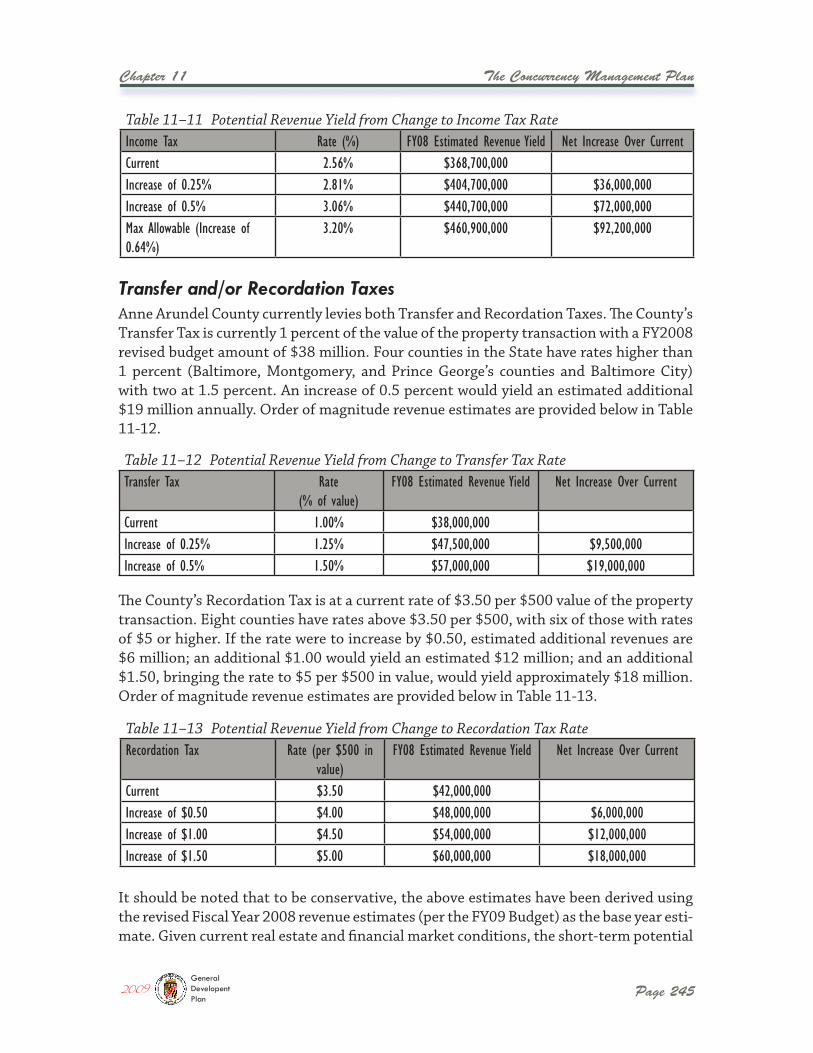
The Concurrency Management Plan
Page 245
Chapter 11
Anne Arundel County currently levies both Transfer and Recordation Taxes. The County’s Transfer Tax is currently 1 percent of the value of the property transaction with a FY2008 revised budget amount of $38 million. Four counties in the State have rates higher than 1 percent (Baltimore, Montgomery, and Prince George’s counties and Baltimore City) with two at 1.5 percent. An increase of 0.5 percent would yield an estimated additional $19 million annually. Order of magnitude revenue estimates are provided below in Table 11-12.
The County’s Recordation Tax is at a current rate of $3.50 per $500 value of the property transaction. Eight counties have rates above $3.50 per $500, with six of those with rates of $5 or higher. If the rate were to increase by $0.50, estimated additional revenues are $6 million; an additional $1.00 would yield an estimated $12 million; and an additional $1.50, bringing the rate to $5 per $500 in value, would yield approximately $18 million. Order of magnitude revenue estimates are provided below in Table 11-13.
It should be noted that to be conservative, the above estimates have been derived using the revised Fiscal Year 2008 revenue estimates (per the FY09 Budget) as the base year esti-mate. Given current real estate and financial market conditions, the short-term potential
Table 11–12 Potential Revenue Yield from Change to Transfer Tax RateTransfer Tax Rate
(% of value)FY08 Estimated Revenue Yield Net Increase Over Current
Current 1.00% $38,000,000Increase of 0.25% 1.25% $47,500,000 $9,500,000Increase of 0.5% 1.50% $57,000,000 $19,000,000
Table 11–13 Potential Revenue Yield from Change to Recordation Tax RateRecordation Tax Rate (per $500 in
value)FY08 Estimated Revenue Yield Net Increase Over Current
Current $3.50 $42,000,000Increase of $0.50 $4.00 $48,000,000 $6,000,000Increase of $1.00 $4.50 $54,000,000 $12,000,000Increase of $1.50 $5.00 $60,000,000 $18,000,000
Table 11–11 Potential Revenue Yield from Change to Income Tax RateIncome Tax Rate (%) FY08 Estimated Revenue Yield Net Increase Over CurrentCurrent 2.56% $368,700,000Increase of 0.25% 2.81% $404,700,000 $36,000,000Increase of 0.5% 3.06% $440,700,000 $72,000,000Max Allowable (Increase of 0.64%)
3.20% $460,900,000 $92,200,000
Transfer and/or Recordation Taxes
2009GeneralDevelopentPlan
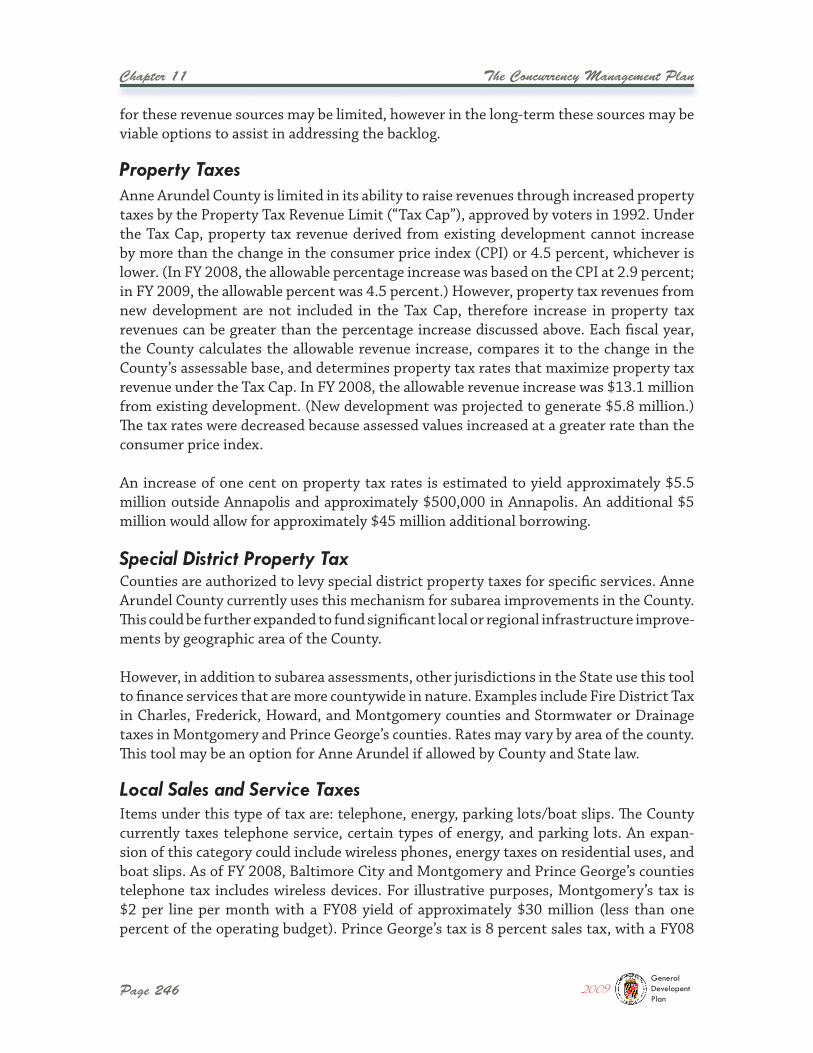
Page 246
Chapter 11 The Concurrency Management Plan
Counties are authorized to levy special district property taxes for specific services. Anne Arundel County currently uses this mechanism for subarea improvements in the County. This could be further expanded to fund significant local or regional infrastructure improve-ments by geographic area of the County.
However, in addition to subarea assessments, other jurisdictions in the State use this tool to finance services that are more countywide in nature. Examples include Fire District Tax in Charles, Frederick, Howard, and Montgomery counties and Stormwater or Drainage taxes in Montgomery and Prince George’s counties. Rates may vary by area of the county. This tool may be an option for Anne Arundel if allowed by County and State law.
Anne Arundel County is limited in its ability to raise revenues through increased property taxes by the Property Tax Revenue Limit (“Tax Cap”), approved by voters in 1992. Under the Tax Cap, property tax revenue derived from existing development cannot increase by more than the change in the consumer price index (CPI) or 4.5 percent, whichever is lower. (In FY 2008, the allowable percentage increase was based on the CPI at 2.9 percent; in FY 2009, the allowable percent was 4.5 percent.) However, property tax revenues from new development are not included in the Tax Cap, therefore increase in property tax revenues can be greater than the percentage increase discussed above. Each fiscal year, the County calculates the allowable revenue increase, compares it to the change in the County’s assessable base, and determines property tax rates that maximize property tax revenue under the Tax Cap. In FY 2008, the allowable revenue increase was $13.1 million from existing development. (New development was projected to generate $5.8 million.) The tax rates were decreased because assessed values increased at a greater rate than the consumer price index.
An increase of one cent on property tax rates is estimated to yield approximately $5.5 million outside Annapolis and approximately $500,000 in Annapolis. An additional $5 million would allow for approximately $45 million additional borrowing.
Items under this type of tax are: telephone, energy, parking lots/boat slips. The County currently taxes telephone service, certain types of energy, and parking lots. An expan-sion of this category could include wireless phones, energy taxes on residential uses, and boat slips. As of FY 2008, Baltimore City and Montgomery and Prince George’s counties telephone tax includes wireless devices. For illustrative purposes, Montgomery’s tax is $2 per line per month with a FY08 yield of approximately $30 million (less than one percent of the operating budget). Prince George’s tax is 8 percent sales tax, with a FY08
for these revenue sources may be limited, however in the long-term these sources may be viable options to assist in addressing the backlog.
Special District Property Tax
Local Sales and Service Taxes
Property Taxes
2009GeneralDevelopentPlan
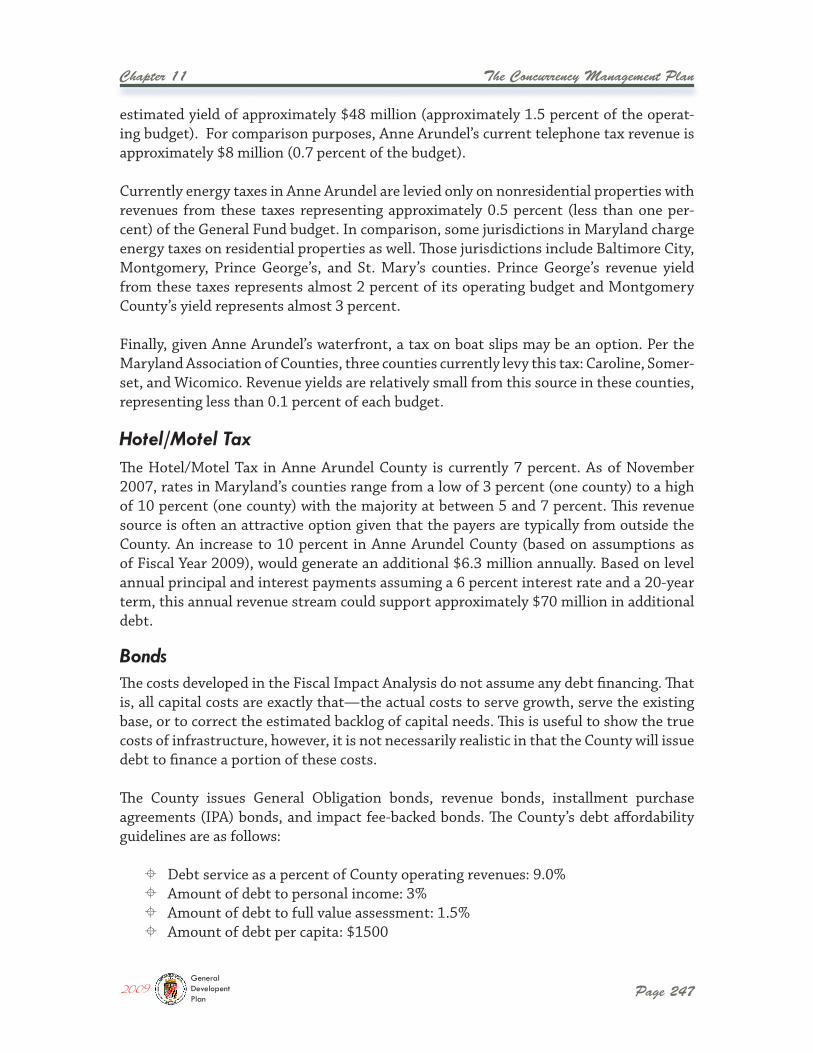
The Concurrency Management Plan
Page 247
Chapter 11
The Hotel/Motel Tax in Anne Arundel County is currently 7 percent. As of November 2007, rates in Maryland’s counties range from a low of 3 percent (one county) to a high of 10 percent (one county) with the majority at between 5 and 7 percent. This revenue source is often an attractive option given that the payers are typically from outside the County. An increase to 10 percent in Anne Arundel County (based on assumptions as of Fiscal Year 2009), would generate an additional $6.3 million annually. Based on level annual principal and interest payments assuming a 6 percent interest rate and a 20-year term, this annual revenue stream could support approximately $70 million in additional debt.
The costs developed in the Fiscal Impact Analysis do not assume any debt financing. That is, all capital costs are exactly that—the actual costs to serve growth, serve the existing base, or to correct the estimated backlog of capital needs. This is useful to show the true costs of infrastructure, however, it is not necessarily realistic in that the County will issue debt to finance a portion of these costs.
The County issues General Obligation bonds, revenue bonds, installment purchase agreements (IPA) bonds, and impact fee-backed bonds. The County’s debt affordability guidelines are as follows:
� Debt service as a percent of County operating revenues: 9.0% � Amount of debt to personal income: 3% � Amount of debt to full value assessment: 1.5% � Amount of debt per capita: $1500
estimated yield of approximately $48 million (approximately 1.5 percent of the operat-ing budget). For comparison purposes, Anne Arundel’s current telephone tax revenue is approximately $8 million (0.7 percent of the budget).
Currently energy taxes in Anne Arundel are levied only on nonresidential properties with revenues from these taxes representing approximately 0.5 percent (less than one per-cent) of the General Fund budget. In comparison, some jurisdictions in Maryland charge energy taxes on residential properties as well. Those jurisdictions include Baltimore City, Montgomery, Prince George’s, and St. Mary’s counties. Prince George’s revenue yield from these taxes represents almost 2 percent of its operating budget and Montgomery County’s yield represents almost 3 percent.
Finally, given Anne Arundel’s waterfront, a tax on boat slips may be an option. Per the Maryland Association of Counties, three counties currently levy this tax: Caroline, Somer-set, and Wicomico. Revenue yields are relatively small from this source in these counties, representing less than 0.1 percent of each budget.
Hotel/Motel Tax
Bonds
2009GeneralDevelopentPlan
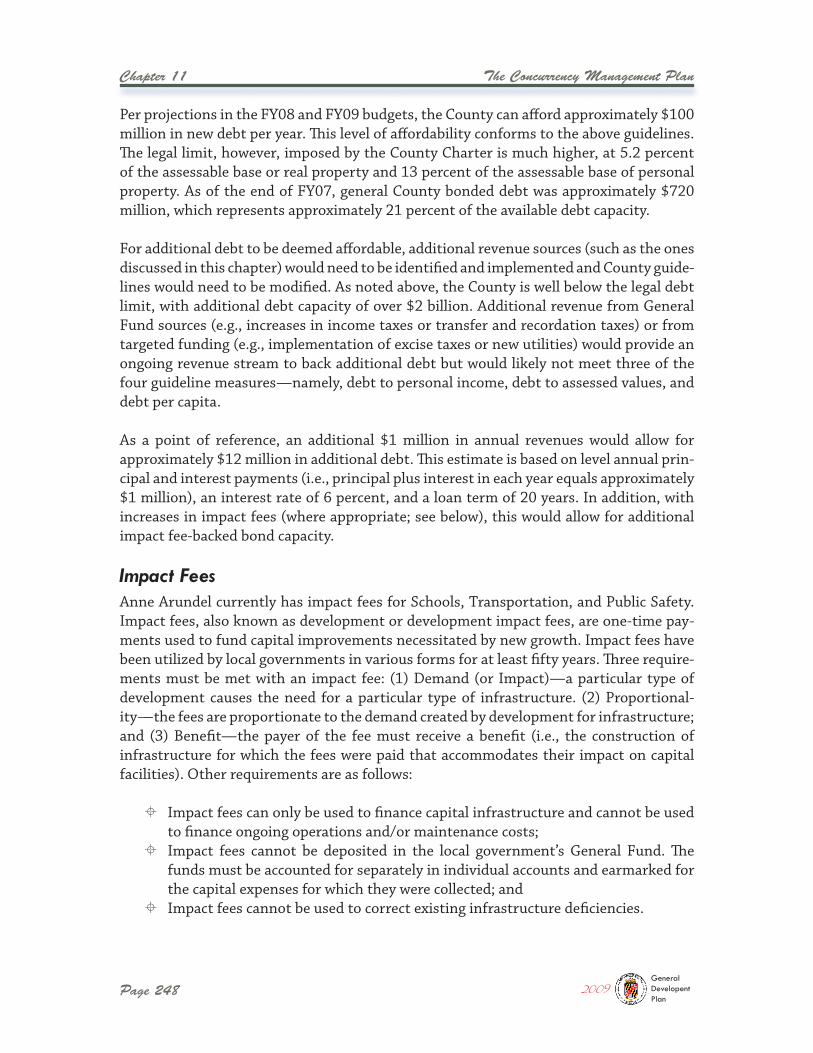
Page 248
Chapter 11 The Concurrency Management Plan
Per projections in the FY08 and FY09 budgets, the County can afford approximately $100 million in new debt per year. This level of affordability conforms to the above guidelines. The legal limit, however, imposed by the County Charter is much higher, at 5.2 percent of the assessable base or real property and 13 percent of the assessable base of personal property. As of the end of FY07, general County bonded debt was approximately $720 million, which represents approximately 21 percent of the available debt capacity.
For additional debt to be deemed affordable, additional revenue sources (such as the ones discussed in this chapter) would need to be identified and implemented and County guide-lines would need to be modified. As noted above, the County is well below the legal debt limit, with additional debt capacity of over $2 billion. Additional revenue from General Fund sources (e.g., increases in income taxes or transfer and recordation taxes) or from targeted funding (e.g., implementation of excise taxes or new utilities) would provide an ongoing revenue stream to back additional debt but would likely not meet three of the four guideline measures—namely, debt to personal income, debt to assessed values, and debt per capita.
As a point of reference, an additional $1 million in annual revenues would allow for approximately $12 million in additional debt. This estimate is based on level annual prin-cipal and interest payments (i.e., principal plus interest in each year equals approximately $1 million), an interest rate of 6 percent, and a loan term of 20 years. In addition, with increases in impact fees (where appropriate; see below), this would allow for additional impact fee-backed bond capacity.
Anne Arundel currently has impact fees for Schools, Transportation, and Public Safety. Impact fees, also known as development or development impact fees, are one-time pay-ments used to fund capital improvements necessitated by new growth. Impact fees have been utilized by local governments in various forms for at least fifty years. Three require-ments must be met with an impact fee: (1) Demand (or Impact)—a particular type of development causes the need for a particular type of infrastructure. (2) Proportional-ity—the fees are proportionate to the demand created by development for infrastructure; and (3) Benefit—the payer of the fee must receive a benefit (i.e., the construction of infrastructure for which the fees were paid that accommodates their impact on capital facilities). Other requirements are as follows:
� Impact fees can only be used to finance capital infrastructure and cannot be used to finance ongoing operations and/or maintenance costs;
� Impact fees cannot be deposited in the local government’s General Fund. The funds must be accounted for separately in individual accounts and earmarked for the capital expenses for which they were collected; and
� Impact fees cannot be used to correct existing infrastructure deficiencies.
Impact Fees
2009GeneralDevelopentPlan
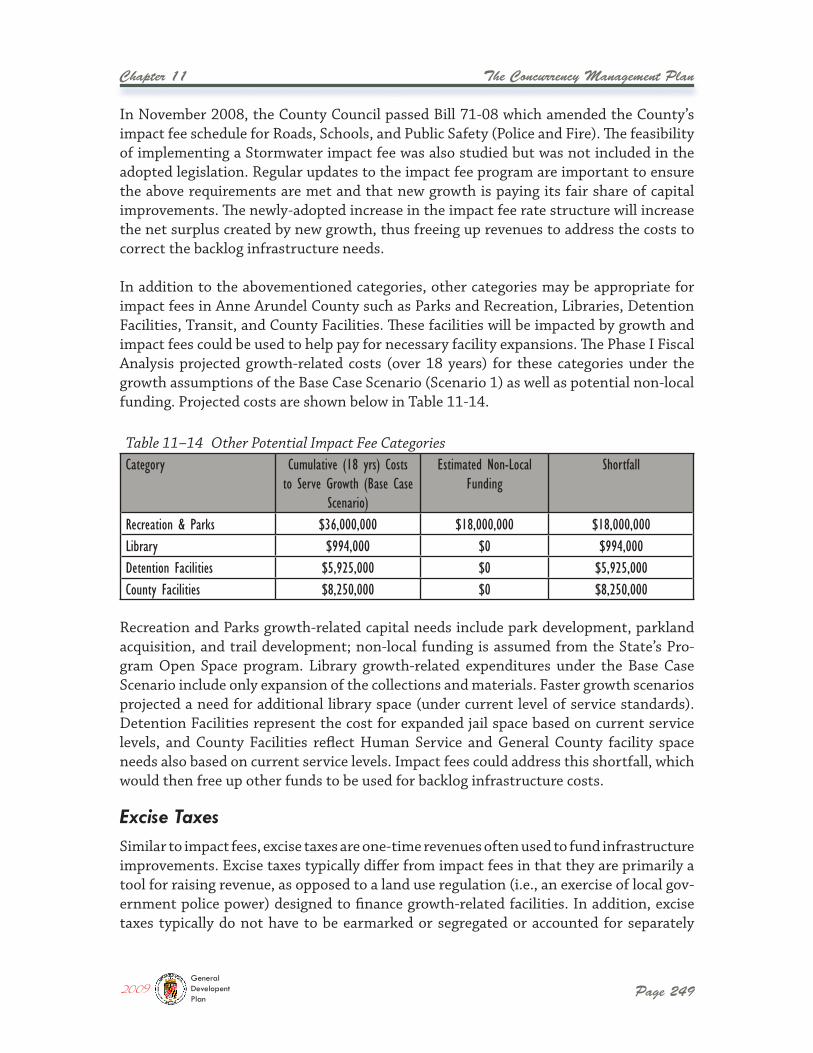
The Concurrency Management Plan
Page 249
Chapter 11
Recreation and Parks growth-related capital needs include park development, parkland acquisition, and trail development; non-local funding is assumed from the State’s Pro-gram Open Space program. Library growth-related expenditures under the Base Case Scenario include only expansion of the collections and materials. Faster growth scenarios projected a need for additional library space (under current level of service standards). Detention Facilities represent the cost for expanded jail space based on current service levels, and County Facilities reflect Human Service and General County facility space needs also based on current service levels. Impact fees could address this shortfall, which would then free up other funds to be used for backlog infrastructure costs.
Similar to impact fees, excise taxes are one-time revenues often used to fund infrastructure improvements. Excise taxes typically differ from impact fees in that they are primarily a tool for raising revenue, as opposed to a land use regulation (i.e., an exercise of local gov-ernment police power) designed to finance growth-related facilities. In addition, excise taxes typically do not have to be earmarked or segregated or accounted for separately
In November 2008, the County Council passed Bill 71-08 which amended the County’s impact fee schedule for Roads, Schools, and Public Safety (Police and Fire). The feasibility of implementing a Stormwater impact fee was also studied but was not included in the adopted legislation. Regular updates to the impact fee program are important to ensure the above requirements are met and that new growth is paying its fair share of capital improvements. The newly-adopted increase in the impact fee rate structure will increase the net surplus created by new growth, thus freeing up revenues to address the costs to correct the backlog infrastructure needs.
In addition to the abovementioned categories, other categories may be appropriate for impact fees in Anne Arundel County such as Parks and Recreation, Libraries, Detention Facilities, Transit, and County Facilities. These facilities will be impacted by growth and impact fees could be used to help pay for necessary facility expansions. The Phase I Fiscal Analysis projected growth-related costs (over 18 years) for these categories under the growth assumptions of the Base Case Scenario (Scenario 1) as well as potential non-local funding. Projected costs are shown below in Table 11-14.
Table 11–14 Other Potential Impact Fee CategoriesCategory Cumulative (18 yrs) Costs
to Serve Growth (Base Case Scenario)
Estimated Non-Local Funding
Shortfall
Recreation & Parks $36,000,000 $18,000,000 $18,000,000Library $994,000 $0 $994,000Detention Facilities $5,925,000 $0 $5,925,000County Facilities $8,250,000 $0 $8,250,000
Excise Taxes
2009GeneralDevelopentPlan
Page 250
Chapter 11 The Concurrency Management Plan
from a locality’s general revenue, do not have to specifically benefit new growth, and can be used and calculated in a more flexible manner than impact fees. Excise taxes can be applied in several ways. Some communities apply a rate to the construction value of the land use; others use a flat fee per acre of development, while other communities apply a straight fee by type of housing unit or per square-foot.
In Maryland, a number of counties have Excise Taxes instead of Impact Fees and one, Frederick County, has both impact fees and excise taxes.1 In Frederick County, impact fees are assessed for Schools and Libraries, and an Excise Tax is collected for Roads. Fred-erick County’s “Building Excise Tax” was passed in 2001 and is used for PayGo and Debt Service for roads, bridges, and highway capital projects. The rates are assessed per gross square foot of development. The County has collected approximately $2 million per year on average from its Building Excise Tax.
The use of excise taxes for capital improvements such as transportation is an attractive option because of the flexibility and fewer requirements relative to impact fees. Anne Arundel County would need to obtain authority from the Maryland General Assembly to enact an excise tax and would have to alter its impact fee program. This may not be an attractive option for transportation given the recent efforts to update the County’s fees. However, other non-impact fee infrastructure categories may be feasible (e.g., stormwa-ter, parks).
1 Excise taxes and impact fees in Maryland tend to be somewhat interchangeable with some excise tax enabling legisla-tion requiring impact fee-type standards. Since authority is granted by the Maryland General Assembly, requirements differ from county to county. As of FY 2006, Maryland counties with Excise Taxes are: Calvert, Caroline, Carroll, Charles, Dorchester, Frederick, Howard, Montgomery, Prince George’s, and Washington (Maryland Local Government: Legislative Handbook Series Volume VI, 2006; Maryland General Assembly Department of Legislative Services).
The County should continue to ensure that charges for service, fees, and other user-gener-ated revenues are current and updated regularly. As of Fiscal Year 2009, a new Ambulance Transport Fee has been enacted and other fees have been increased to recoup costs of service provision (updated fees are: Health, Permit and Review, and Recreation and Parks). In addition, charges to Enterprise Funds have been increased to adequately cover applicable retiree health costs, and applicable Solid Waste transfer station host fees have been transferred back to the General Fund. These changes have resulted in an estimated increase of $14.8 million to the General Fund.
Charges for service and fees that are intended to cover all or a portion of the costs to provide services should be updated annually using a cost index to account for inflation. This approach is beneficial to keep pace with rising personnel and operating costs as well as to prevent “sticker shock” when fees are updated after several years.
Charges for Service and Other Fees
2009GeneralDevelopentPlan
The Concurrency Management Plan
Page 251
Chapter 11
Another potential candidate for a utility is transportation. While utility charges for water and sewer facilities have been widely used since the beginning of the 20th century, on-going charges for transportation represent a relatively new application of the utility concept. The establishment of a utility to address transportation needs allows funding of capital improvements but also could include operations and maintenance. Utility charges may address all cost aspects, including debt service, operation, maintenance, repair and replacement of facilities. Unlike impact fees that are imposed on new development, util-ity revenue would be generated from all development, existing and new. Unlike impact fees, which have a relatively unstable revenue stream based solely on the amount and timing of new development, utility charges have a stable and secure revenue stream that enables the issuance of bonds backed by the anticipated utility revenue.
The potential revenue strategies discussed above have been evaluated according to a defined set of evaluation criteria. The evaluation criteria include:
As discussed above, backlog improvement costs for stormwater management are signifi-cant, with $45 million estimated for backlog needs in culverts and storm drains. In order to continue to achieve NPDES permit compliance in the County’s twelve watersheds as well as address new TMDL limits discussed in Chapter 10, stormwater management costs are likely to increase in the future. The County is currently conducting analysis with its Watershed Management Tool in order to help project future costs related to stormwater management.
One potential funding option is a Stormwater Utility. Stormwater utilities are becoming more common nationally as most stormwater problems are due to existing development rather than new development, as is the case in Anne Arundel County. Therefore capital funding tools like impact fees become less desirable to deal with the significant costs that have accrued over time. A Stormwater Utility could operate like a sewer or water system with annual charges levied to customers that would then be used to fund neces-sary improvements to the stormwater management system. The rates could be assessed based on the amount of impervious surface area on the payer’s property or per equivalent dwelling unit. Incentives could be developed as part of the system that would encourage property owners to better manage stormwater runoff. Jurisdictions in Maryland that have a stormwater utility are the Cities of Takoma Park and Rockville, and Montgomery County.
Evaluation of Revenue Strategies
Transportation
Stormwater ManagementUtilities (for Stormwater and Transportation)
2009GeneralDevelopentPlan
Page 252
Chapter 11 The Concurrency Management Plan
A general evaluation is presented below in Table 11-15 of the potential revenue strategies using the four main criteria discussed above.
� Revenue Potential � Proportionality � Technical Ease � Public Acceptability
All criteria listed above are evaluated for each potential financing source and provide a framework for discussion of alternative approaches. It should be noted that this discus-sion does not include a legal review, which should be conducted before implementation to determine whether appropriate authority exists as well as limitations and requirements. The evaluation criteria listed above are described in more detail as follows:
Revenue Potential: This evaluation criterion addresses the relative magnitude of fund-ing from each financing mechanism.
Proportionality: This evaluation criterion relates to striking a balance between the tax or fee burden being considered relative to the demand generated. For example, communi-ties sometimes choose to require developer contributions or exactions for growth-related facilities because the public perception is that existing residents are unfairly paying the costs of new growth. In another example, in order to a make a school impact fee “roughly proportionate and reasonably related to service demands,” the fee should vary by type of housing unit as each housing unit generates a different number of school age children.
Technical Ease: Each of the potential revenue strategies requires some technical expertise and administrative effort to implement. They may require, for example, that additional accounting and reporting requirements are necessary. Furthermore, a funding mechanism may require that a technical study be prepared to justify the fee or charge.
Public Acceptability: This evaluation criterion often varies by jurisdiction and the type of facility to be funded. It reflects how the majority of existing residents are expected to accept each financing or planning mechanism.
Results of Evaluation
2009GeneralDevelopentPlan
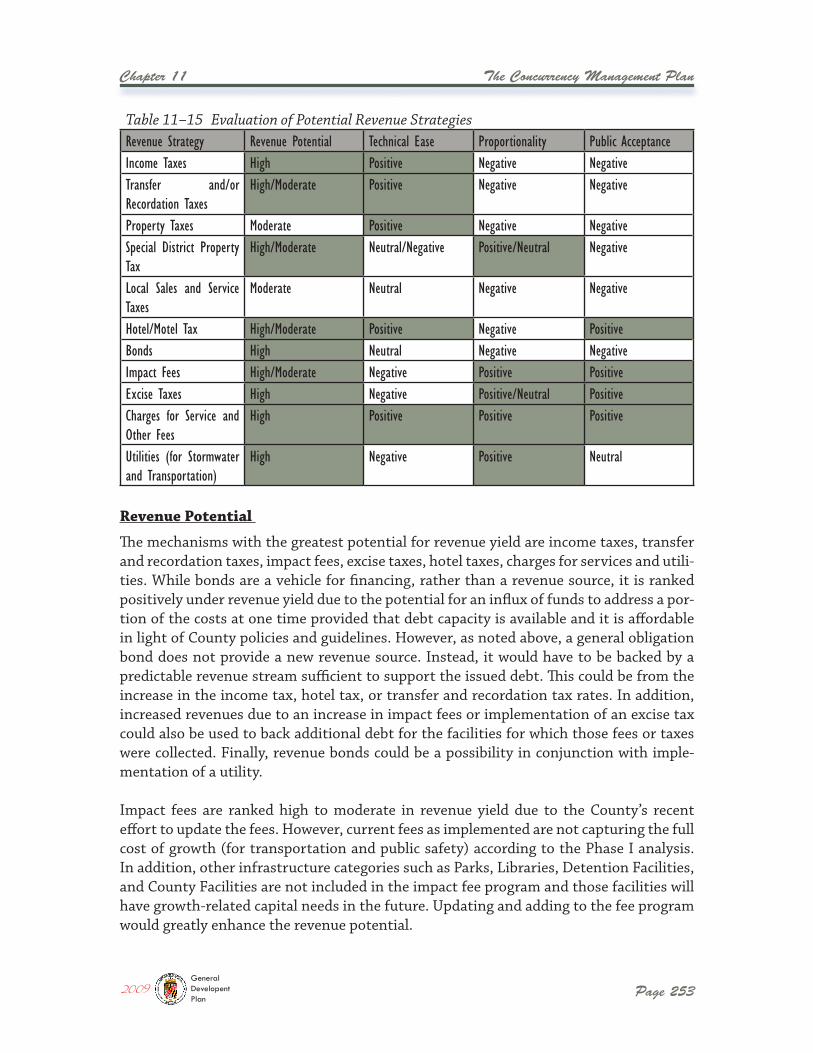
The Concurrency Management Plan
Page 253
Chapter 11
The mechanisms with the greatest potential for revenue yield are income taxes, transfer and recordation taxes, impact fees, excise taxes, hotel taxes, charges for services and utili-ties. While bonds are a vehicle for financing, rather than a revenue source, it is ranked positively under revenue yield due to the potential for an influx of funds to address a por-tion of the costs at one time provided that debt capacity is available and it is affordable in light of County policies and guidelines. However, as noted above, a general obligation bond does not provide a new revenue source. Instead, it would have to be backed by a predictable revenue stream sufficient to support the issued debt. This could be from the increase in the income tax, hotel tax, or transfer and recordation tax rates. In addition, increased revenues due to an increase in impact fees or implementation of an excise tax could also be used to back additional debt for the facilities for which those fees or taxes were collected. Finally, revenue bonds could be a possibility in conjunction with imple-mentation of a utility.
Impact fees are ranked high to moderate in revenue yield due to the County’s recent effort to update the fees. However, current fees as implemented are not capturing the full cost of growth (for transportation and public safety) according to the Phase I analysis. In addition, other infrastructure categories such as Parks, Libraries, Detention Facilities, and County Facilities are not included in the impact fee program and those facilities will have growth-related capital needs in the future. Updating and adding to the fee program would greatly enhance the revenue potential.
Table 11–15 Evaluation of Potential Revenue StrategiesRevenue Strategy Revenue Potential Technical Ease Proportionality Public AcceptanceIncome Taxes High Positive Negative NegativeTransfer and/or Recordation Taxes
High/Moderate Positive Negative Negative
Property Taxes Moderate Positive Negative NegativeSpecial District Property Tax
High/Moderate Neutral/Negative Positive/Neutral Negative
Local Sales and Service Taxes
Moderate Neutral Negative Negative
Hotel/Motel Tax High/Moderate Positive Negative PositiveBonds High Neutral Negative NegativeImpact Fees High/Moderate Negative Positive PositiveExcise Taxes High Negative Positive/Neutral PositiveCharges for Service and Other Fees
High Positive Positive Positive
Utilities (for Stormwater and Transportation)
High Negative Positive Neutral
Revenue Potential
2009GeneralDevelopentPlan
Page 254
Chapter 11 The Concurrency Management Plan
In terms of proportionality, impact fees, excise taxes, charges for service, special district taxes, and utilities generally relate the amount paid to the direct impact on facilities. The proportionality decreases for special district taxes with larger geographic areas (e.g., countywide), however the tax rate would be based on costs to provide services or facili-ties, thus maintaining some proportionality. Excise taxes are ranked positive to neutral because the calculation and use of funds is dependent on enabling authority and program design. In some cases, the excise tax functions like a tax with the amount not necessarily derived from a rigorous analysis and revenues deposited in the General Fund. In other cases, an excise tax may function more like an impact fee, with similar requirements with regard to proportionality. The remaining mechanisms are ranked as negative. Income taxes, transfer and recordation taxes, property taxes, local sales and service taxes, hotel tax, and bonds are based on applicable values—income, property, goods, or services—and not necessarily reflective of benefit received or demand placed on the facility.
Typically, revenue sources that rank high on proportionality also tend to rank high on public acceptance (and even more so when those sources are directed toward new resi-dents and businesses). Therefore, impact fees, excise taxes, and charges for service tend to be ranked high on public acceptance. Impact fees and excise taxes place costs of growth on new development and therefore are often supported by existing residents. Further-more, impact fees and excise taxes should be met with high public acceptance to ensure that new growth pays its way and existing revenue sources can be spent on addressing infrastructure backlog. Charges for service may also garner support because those paying are receiving a direct benefit and the payment assessed is
Impact fees, excise taxes, and charges
for service tend to be ranked high on public
acceptance.
Most of the mechanisms shown are currently used in the County, therefore continuation should not present technical or implementation issues (identified as “positive” impact above). Implementation of new sources such as excise taxes, new utilities, and special property tax districts would likely present initial technical and administrative issues and are therefore ranked negative in this category. However, ongoing administration would be similar to existing programs and should not present additional burdens.
A Special District Property Tax is ranked high to moderate with several caveats. If used for local or sub-County purposes, the revenue potential is likely low. However, if a County-wide tax is allowed under current County and State law, this could be a significant source for a specific purpose thus freeing up other General Fund monies.
A Hotel/Motel tax is also ranked high to moderate in revenue yield. An increase in the rate from 7 to 10 percent would yield an estimated $6.3 million to the General Fund.
Proportionality
Public Acceptance
Technical Ease
2009GeneralDevelopentPlan
The Concurrency Management Plan
Page 255
Chapter 11
As evidenced in this chapter, a significant amount of time, data and analysis is required to project public facility needs, future demand and capacities, capital costs and available funding, particularly for a jurisdiction as large as Anne Arundel County. While this type of analysis is not new to the County and many of the necessary tools are available, it has often been done in a somewhat piecemeal fashion in the past, with strategic planning or facilities planning studies being conducted by individual agencies as opposed to using a more comprehensive approach.
A comprehensive framework for concurrency management will facilitate the process of evaluating and prioritizing public facility needs and will aid decision makers in allocating funds in the most efficient way possible during each annual budget process. The County is currently taking several steps to develop tools and/or methodologies that will assist in this effort. These include the following:
� The County currently tracks building permits (PIPS) and development activity (STS) in separate databases, which are not linked spatially to the property geoda-tabase (cadastral layer). Once the property geodatabase is brought up to current conditions and can then be maintained, the databases can be linked and tracking of development activity will be made easier, and can be used by all County agen-cies to track and measure impacts. The property geodatabase will allow a more comprehensive method of analysis and a means to track cumulative effects of development.
proportionate to the benefits received. Hotel taxes typically receive local support because payers are usually from outside the County.
The other mechanisms are rated either negative or neutral. While utilities and special districts are derived for specific purposes and targeted to those receiving the benefits, the magnitude of the infrastructure needs in Anne Arundel County is likely to require implementation on existing development Countywide. However, with these mechanisms, rates and fees would likely vary by area of the County or service to reflect needs, thereby reinforcing the proportionality and perhaps increasing public acceptance. The other revenue sources (income, transfer and recordation, property, and local sales and service taxes) are all ranked negative due to their impact on existing residents and in particular residential development. There is likely to be very little, if any, public support for these options especially in the short-term due to the current economic and hous-ing downturn. However, long-term solutions are needed to solve current problems. One option to garner public support may be to adopt a policy that uses the revenues generated through tax increases to pay for the infrastructure backlog improvements. While this decreases flexibility in use of funds, it may be a trade-off to realize additional revenues.
Recommendations for a Comprehensive Concurrency Management Program
2009GeneralDevelopentPlan
Page 256
Chapter 11 The Concurrency Management Plan
� The Reasarch & GIS Division in the Office of Planning and Zoning will produce an Annual Growth Report (to be released at the end of the fiscal year) along with the Annual Development Activity Impact on School Facilities Report that is currently released in January of each year.
� The Fiscal Impact Model developed for the Phase I and Phase II Fiscal Impact Analysis will be obtained by the County and staff will be trained in its use. It will then become an in-house tool that can be used to project capital needs under vari-ous growth scenarios as forecasts are updated periodically.
� The Fire Department has obtained the software developed for the Fire Services Deployment Study along with training in its use. This tool will enable the Depart-ment to input population information, service call data, and County infrastructure such as roads in order to project future service demand and allocate resources to meet acceptable response parameters.
Along with these tools and methods, the County currently has modeling capabilities with its Countywide Traffic Model and its Watershed Management Tool that can be used to estimate future demand on public roads and stormwater management facilities as well as impacts from mitigation measures and related costs.
The “pieces” of this framework have been used to the extent possible and allowable, within the GDP timeframe, in presenting the information in this chapter. However, it is recog-nized that additional efforts are needed to develop a more comprehensive approach.
It is recommended that the County set up a framework that consolidates the different methodologies outlined in this chapter into a comprehensive analytical approach for tracking development impacts on public facilities and planning for adequate future capac-ity and the funding to maintain it. It is important that the demand analysis be linked with the specified level of service standard that is to be maintained for each public facility. It is equally important that the level of service standards be fiscally feasible so that service providers, as well as the public, are not given unrealistic expectations.
Once this comprehensive framework has been established, the analysis should be con-ducted at appropriate intervals to account for changes in growth projections, land use policies, infrastructure capacities, and other changes that will impact public facilities and levels of service. The County could then issue a Concurrency Management Report on a biennial basis, or some other appropriate timeframe, for use in long range facilities plan-ning as well as annual budget decisions. A report published at regular intervals would be a more useful tool than a requirement to incorporate such analysis as a component of the GDP. Because the GDP is a broader based policy plan, it should not require the level of analytical detail that is needed for a full concurrency analysis, but should instead use the Concurrency Management Reports to formulate new GDP policies as needed during updates.
2009GeneralDevelopentPlan
Chapter 12:Implementation Plan

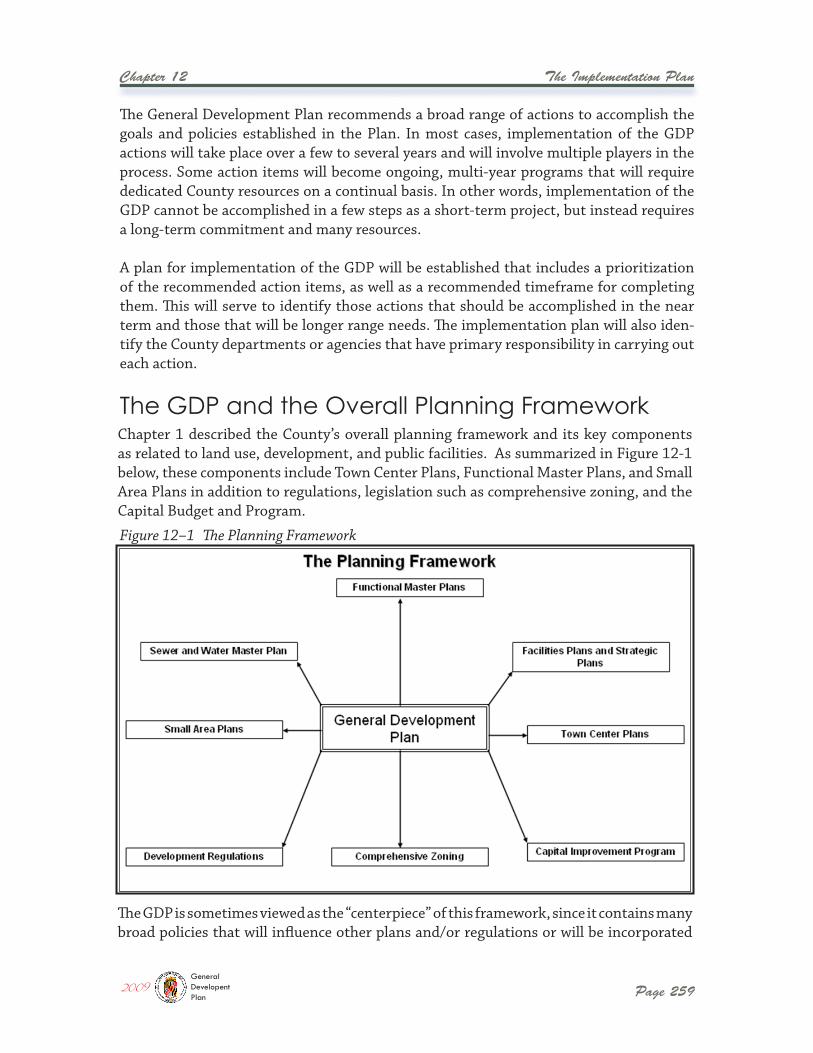
The Implementation Plan
Page 259
Chapter 12
The General Development Plan recommends a broad range of actions to accomplish the goals and policies established in the Plan. In most cases, implementation of the GDP actions will take place over a few to several years and will involve multiple players in the process. Some action items will become ongoing, multi-year programs that will require dedicated County resources on a continual basis. In other words, implementation of the GDP cannot be accomplished in a few steps as a short-term project, but instead requires a long-term commitment and many resources.
A plan for implementation of the GDP will be established that includes a prioritization of the recommended action items, as well as a recommended timeframe for completing them. This will serve to identify those actions that should be accomplished in the near term and those that will be longer range needs. The implementation plan will also iden-tify the County departments or agencies that have primary responsibility in carrying out each action.
Figure 12–1 The Planning Framework
Chapter 1 described the County’s overall planning framework and its key components as related to land use, development, and public facilities. As summarized in Figure 12-1 below, these components include Town Center Plans, Functional Master Plans, and Small Area Plans in addition to regulations, legislation such as comprehensive zoning, and the Capital Budget and Program.
The GDP is sometimes viewed as the “centerpiece” of this framework, since it contains many broad policies that will influence other plans and/or regulations or will be incorporated
The GDP and the Overall Planning Framework
2009GeneralDevelopentPlan
Page 260
Chapter 12 The Implementation Plan
The action items recommended in the GDP will be implemented through a variety of methods or mechanisms. These implementation methods have been grouped into six major categories, as described below. The County will assign each action item to an imple-mentation category to aid in tracking progress in the future.
Resource Inventory and Management: This category includes actions such as devel-oping a database of properties under Forest Conservation easements or updating the County’s floodplain layer. It can also include the identification of land or other resources for specific purposes, such as preservation, acquisition, or mixed use development.
Planning Initiatives or Studies: This category includes the development of new pro-grams such as a Neighborhood Conservation Program, the development of new planning documents such as a Transportation Functional Master Plan, as well as the feasibility stud-ies or other background research required to develop these new programs or initiatives.
Financial Strategies: Actions in this category include the pursuit of funding mecha-nisms and financial strategies to carry out Plan recommendations, such as developing new financial incentives for commercial revitalization or agricultural preservation.
Legislation and Regulations: Revisions to existing subdivision and development regu-lations, creation of new overlay districts, adoption of development design standards, and adoption of new mixed use zoning districts would all fall into this category.
into other plans and regulations. Although the GDP serves in this centerpiece role, it does not “amend” the various other plans adopted by the County unless specifically stated in the GDP or the adopting legislation. Each plan within this framework serves as a standing planning document that will continue to be used until it is either amended or updated, or removed from the County Code as a component of the framework. In cases of conflict, the most recently adopted plan, or plan component, would govern. As an example, the Land Use Plan Map in the GDP will supersede any previously adopted Land Use Plan Maps in other documents, such as the Small Area Plans, but the individual recommendations in the Small Area Plans and other adopted plans will continue to be implemented.
As other components of the planning framework are updated in the future (e.g. Sewer and Water Master Plan, development regulations) and new components are created and/or adopted (e.g. Transportation Functional Master Plan), they will need to be consistent with and support the goals and policies of the GDP. This is often one of the most chal-lenging aspects of plan implementation in a large jurisdiction that has multiple plans and regulations that are frequently being revised or updated. In other words, the planning process is often considered a moving target, and frequent monitoring of the various plan-ning components for consistency is required.
Methods of Implementation
2009GeneralDevelopentPlan
The Implementation Plan
Page 261
Chapter 12
Administration of the General Development Plan involves a collaborative effort among the County Administration and staff, the County Council, and various advisory boards or commissions. The roles and responsibilities of each are described below.
County Council and County ExecutiveThe County Executive and County Council are responsible for determining the priori-ties among the recommended actions in the GDP and for establishing timeframes for accomplishing them. They are also responsible for ensuring that the resources needed for implementation are available, including capital and/or operating funds, staffing resources, and other programmatic needs. As the County’s legislative body, the County Council adopts the GDP as well as the Capital Budget and Program and other legislation as needed to implement Plan recommendations.
Planning Advisory BoardThe Planning Advisory Board (PAB) is responsible for reviewing all amendments and updates to the General Development Plan and forming recommendations for consider-ation by the Planning and Zoning Officer, the County Executive, and the County Council. The PAB is also tasked with the annual review of the proposed Capital Budget and Pro-gram prior to County Council adoption.
County DepartmentsMany County departments and offices will be involved in administering the GDP and implementation plan. A number of GDP action items will require new or revised work tasks or programs be incorporated into the overall operating program of various County agencies. The Offices of Planning and Zoning, Law, and Budget as well as the Depart-ments of Public Works, Inspections and Permits, Recreation and Parks, and Health will have major involvement in plan administration, but many other local agencies will con-tribute to implementation of the Plan. Coordination among the various departments is required in order to achieve the goals and objectives established in the Plan.
Interagency CoordinationIntergovernmental coordination is another important requirement for successful implementation of the GDP. Water resources protection, emergency preparedness, and
Public Information Initiatives: This category includes public outreach and education to inform the public of current or new programs and/or tools that further the goals of the GDP, such as the promotion of business opportunities, preservation programs, grant programs, and conservation easements.
Capital Improvements: This includes specific projects or public facilities such as trans-portation infrastructure, school renovations, or park facilities that will require capital funding through the Capital Budget and Program or through partnerships with State agencies or private entities.
Plan Administration
2009GeneralDevelopentPlan
Page 262
Chapter 12 The Implementation Plan
transportation needs are regional issues, and local planning efforts and programs must be coordinated with regional and Statewide efforts. In some cases, the availability of State or Federal funding for programs or infrastructure is contingent upon this inter-governmental coordination among the State and local jurisdictions. In addition, the City of Annapolis and the County are required to coordinate plans and programs related to growth management, annexations, transportation services, public safety services, public utilities, and other public services.
Table 12-1 presents an Implementation Schedule for accomplishing the recommended actions in the 2009 General Development Plan. The schedule will serve as a tool for tracking progress as well as a guide in establishing priorities for the County’s capital and operating budgets. The Implementation Schedule contains the information described below.
Column 1: Priority1 – Very High Priority – use all available resources and obtain necessary resources to accomplish this within the indicated timeline.
2 – High Priority – use available resources to accomplish within the indicated timeline.
3 – Priority – accomplish within the indicated timeline or extend timeline as resources become available.
Column 2: Action ItemsRecommended actions are listed by Chapter in the approximate order that they appear in the GDP. Some related actions have been combined into one line item.
Column 3: AgenciesThis identifies the principal agencies to implement the action item. Many action items will require interagency coordination and work efforts among several agencies, so every agency that may be involved may not be listed. In many cases, elevated assistance will be required from support agencies such as Finance or Information Technology in order for the operating departments to meet the established schedule.
Agencies are abbreviated as follows:
AACC – Anne Arundel Community CollegeACDS – Arundel Community Development Services Inc.AAFD – Anne Arundel County Fire DepartmentAAPD – Anne Arundel County Police DepartmentAEDC – Anne Arundel Economic Development CorporationBOE – Anne Arundel County Board of Education
Implementation Schedule
2009GeneralDevelopentPlan
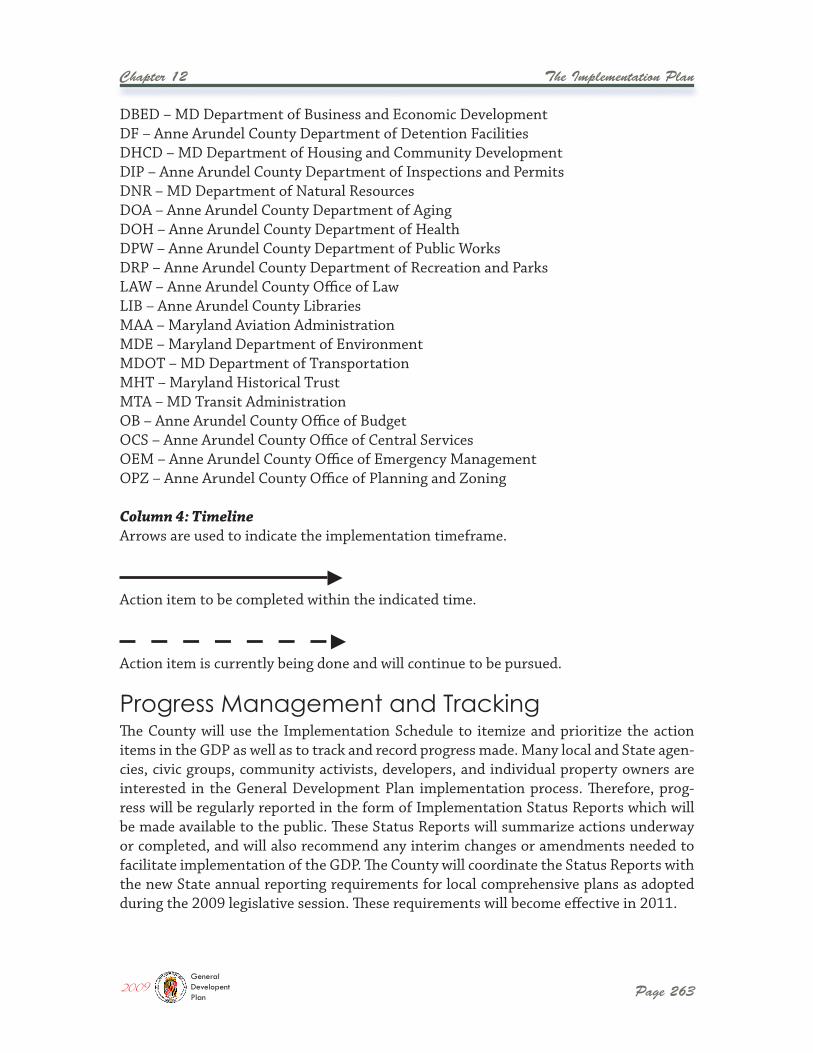
The Implementation Plan
Page 263
Chapter 12
The County will use the Implementation Schedule to itemize and prioritize the action items in the GDP as well as to track and record progress made. Many local and State agen-cies, civic groups, community activists, developers, and individual property owners are interested in the General Development Plan implementation process. Therefore, prog-ress will be regularly reported in the form of Implementation Status Reports which will be made available to the public. These Status Reports will summarize actions underway or completed, and will also recommend any interim changes or amendments needed to facilitate implementation of the GDP. The County will coordinate the Status Reports with the new State annual reporting requirements for local comprehensive plans as adopted during the 2009 legislative session. These requirements will become effective in 2011.
DBED – MD Department of Business and Economic DevelopmentDF – Anne Arundel County Department of Detention FacilitiesDHCD – MD Department of Housing and Community DevelopmentDIP – Anne Arundel County Department of Inspections and Permits DNR – MD Department of Natural ResourcesDOA – Anne Arundel County Department of AgingDOH – Anne Arundel County Department of HealthDPW – Anne Arundel County Department of Public WorksDRP – Anne Arundel County Department of Recreation and ParksLAW – Anne Arundel County Office of LawLIB – Anne Arundel County LibrariesMAA – Maryland Aviation AdministrationMDE – Maryland Department of EnvironmentMDOT – MD Department of TransportationMHT – Maryland Historical TrustMTA – MD Transit AdministrationOB – Anne Arundel County Office of BudgetOCS – Anne Arundel County Office of Central Services OEM – Anne Arundel County Office of Emergency ManagementOPZ – Anne Arundel County Office of Planning and Zoning
Column 4: TimelineArrows are used to indicate the implementation timeframe.
►Action item to be completed within the indicated time.
►Action item is currently being done and will continue to be pursued.
Progress Management and Tracking
2009GeneralDevelopentPlan
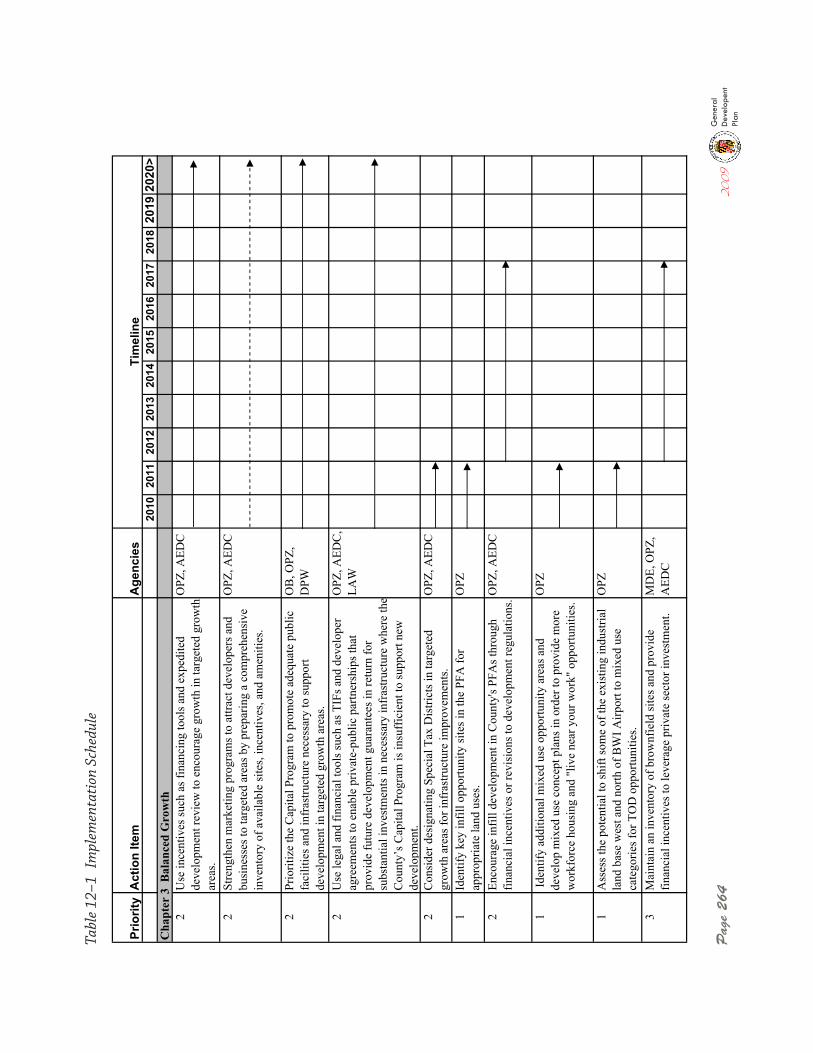
Pag
e 26
4
Prio
rity
Act
ion
Item
Age
ncie
s 20
1020
1120
1220
1320
1420
1520
1620
1720
1820
1920
20>
Cha
pter
3 B
alan
ced
Gro
wth
2U
se in
cent
ives
such
as f
inan
cing
tool
s and
exp
edite
d de
velo
pmen
t rev
iew
to e
ncou
rage
gro
wth
in ta
rget
ed g
row
th
area
s.
OPZ
, AED
C
2St
reng
then
mar
ketin
g pr
ogra
ms t
o at
tract
dev
elop
ers a
nd
busi
ness
es to
targ
eted
are
as b
y pr
epar
ing
a co
mpr
ehen
sive
in
vent
ory
of a
vaila
ble
site
s, in
cent
ives
, and
am
eniti
es.
OPZ
, AED
C
2Pr
iorit
ize
the
Cap
ital P
rogr
am to
pro
mot
e ad
equa
te p
ublic
fa
cilit
ies a
nd in
fras
truct
ure
nece
ssar
y to
supp
ort
deve
lopm
ent i
n ta
rget
ed g
row
th a
reas
.
OB
, OPZ
, D
PW
2U
se le
gal a
nd fi
nanc
ial t
ools
such
as T
IFs a
nd d
evel
oper
ag
reem
ents
to e
nabl
e pr
ivat
e-pu
blic
par
tner
ship
s tha
t pr
ovid
e fu
ture
dev
elop
men
t gua
rant
ees i
n re
turn
for
subs
tant
ial i
nves
tmen
ts in
nec
essa
ry in
fras
truct
ure
whe
re th
eC
ount
y’s C
apita
l Pro
gram
is in
suff
icie
nt to
supp
ort n
ew
deve
lopm
ent.
OPZ
, AED
C,
LAW
2C
onsi
der d
esig
natin
g Sp
ecia
l Tax
Dis
trict
s in
targ
eted
gr
owth
are
as fo
r inf
rast
ruct
ure
impr
ovem
ents
. O
PZ, A
EDC
1Id
entif
y ke
y in
fill o
ppor
tuni
ty si
tes i
n th
e PF
A fo
r ap
prop
riate
land
use
s.O
PZ
2En
cour
age
infil
l dev
elop
men
t in
Cou
nty'
s PFA
s thr
ough
fin
anci
al in
cent
ives
or r
evis
ions
to d
evel
opm
ent r
egul
atio
ns. O
PZ, A
EDC
1 Id
entif
y ad
ditio
nal m
ixed
use
opp
ortu
nity
are
as a
nd
deve
lop
mix
ed u
se c
once
pt p
lans
in o
rder
to p
rovi
de m
ore
wor
kfor
ce h
ousi
ng a
nd "
live
near
you
r wor
k" o
ppor
tuni
ties.
OPZ
1A
sses
s the
pot
entia
l to
shift
som
e of
the
exis
ting
indu
stria
l la
nd b
ase
wes
t and
nor
th o
f BW
I Airp
ort t
o m
ixed
use
ca
tego
ries f
or T
OD
opp
ortu
nitie
s.
OPZ
3M
aint
ain
an in
vent
ory
of b
row
nfie
ld si
tes a
nd p
rovi
de
finan
cial
ince
ntiv
es to
leve
rage
priv
ate
sect
or in
vest
men
t.M
DE,
OPZ
, A
EDC
Tim
elin
e
Tabl
e 12
–1 I
mpl
emen
tati
on S
ched
ule
2009
General
Developent
Plan
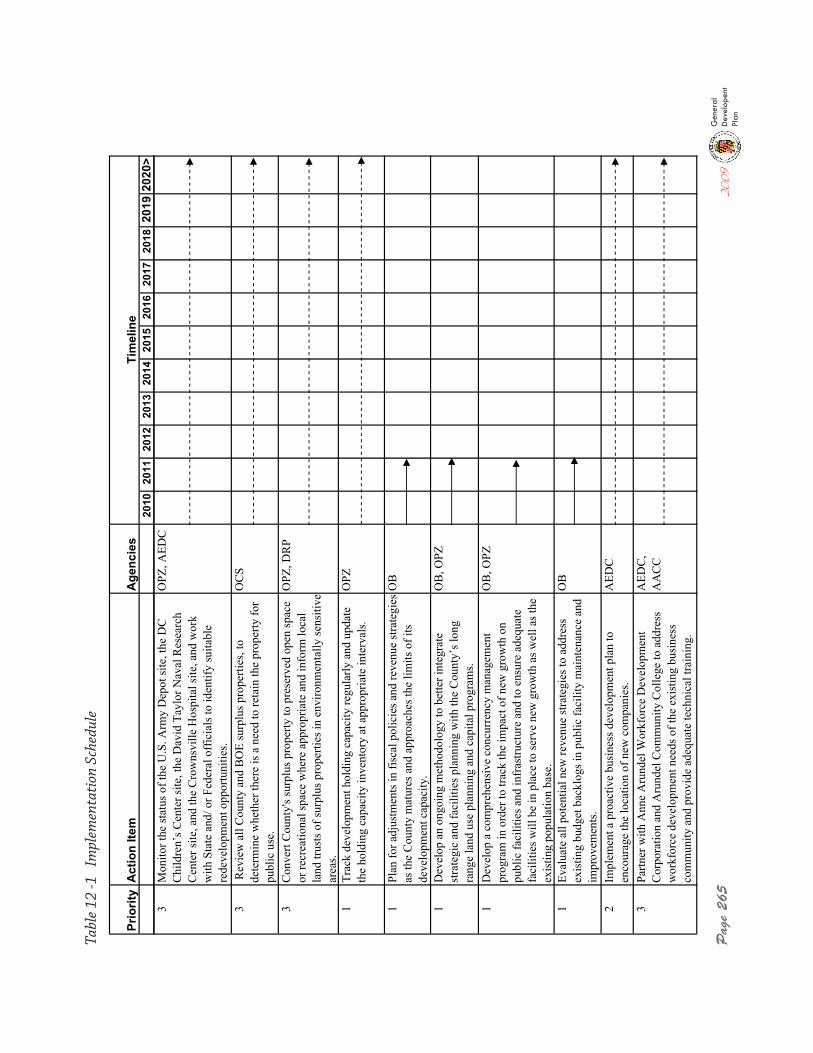
Pag
e 26
520
09General
Developent
Plan
Prio
rity
Act
ion
Item
Age
ncie
s 20
1020
1120
1220
1320
1420
1520
1620
1720
1820
1920
20>
Tim
elin
e
3M
onito
r the
stat
us o
f the
U.S
. Arm
y D
epot
site
, the
DC
C
hild
ren’
s Cen
ter s
ite, t
he D
avid
Tay
lor N
aval
Res
earc
h C
ente
r site
, and
the
Cro
wns
ville
Hos
pita
l site
, and
wor
k w
ith S
tate
and
/ or F
eder
al o
ffic
ials
to id
entif
y su
itabl
e re
deve
lopm
ent o
ppor
tuni
ties.
OPZ
, AED
C
3 R
evie
w a
ll C
ount
y an
d B
OE
surp
lus p
rope
rties
, to
dete
rmin
e w
heth
er th
ere
is a
nee
d to
reta
in th
e pr
oper
ty fo
r pu
blic
use
.
OC
S
3C
onve
rt C
ount
y's s
urpl
us p
rope
rty to
pre
serv
ed o
pen
spac
e or
recr
eatio
nal s
pace
whe
re a
ppro
pria
te a
nd in
form
loca
l la
nd tr
usts
of s
urpl
us p
rope
rties
in e
nviro
nmen
tally
sens
itive
ar
eas.
OPZ
, DR
P
1Tr
ack
deve
lopm
ent h
oldi
ng c
apac
ity re
gula
rly a
nd u
pdat
e th
e ho
ldin
g ca
paci
ty in
vent
ory
at a
ppro
pria
te in
terv
als.
OPZ
1Pl
an fo
r adj
ustm
ents
in fi
scal
pol
icie
s and
reve
nue
stra
tegi
es
as th
e C
ount
y m
atur
es a
nd a
ppro
ache
s the
lim
its o
f its
de
velo
pmen
t cap
acity
.
OB
1D
evel
op a
n on
goin
g m
etho
dolo
gy to
bet
ter i
nteg
rate
st
rate
gic
and
faci
litie
s pla
nnin
g w
ith th
e C
ount
y’s l
ong
rang
e la
nd u
se p
lann
ing
and
capi
tal p
rogr
ams.
OB
, OPZ
1D
evel
op a
com
preh
ensi
ve c
oncu
rren
cy m
anag
emen
t pr
ogra
m in
ord
er to
trac
k th
e im
pact
of n
ew g
row
th o
n pu
blic
faci
litie
s and
infr
astru
ctur
e an
d to
ens
ure
adeq
uate
fa
cilit
ies w
ill b
e in
pla
ce to
serv
e ne
w g
row
th a
s wel
l as t
he
exis
ting
popu
latio
n ba
se.
OB
, OPZ
1Ev
alua
te a
ll po
tent
ial n
ew re
venu
e st
rate
gies
to a
ddre
ss
exis
ting
budg
et b
ackl
ogs i
n pu
blic
faci
lity
mai
nten
ance
and
im
prov
emen
ts.
OB
2Im
plem
ent a
pro
activ
e bu
sine
ss d
evel
opm
ent p
lan
to
enco
urag
e th
e lo
catio
n of
new
com
pani
es.
AED
C
3Pa
rtner
with
Ann
e A
rund
el W
orkf
orce
Dev
elop
men
t C
orpo
ratio
n an
d A
rund
el C
omm
unity
Col
lege
to a
ddre
ss
wor
kfor
ce d
evel
opm
ent n
eeds
of t
he e
xist
ing
busi
ness
co
mm
unity
and
pro
vide
ade
quat
e te
chni
cal t
rain
ing.
AED
C,
AA
CC
Tabl
e 12
-1
Impl
emen
tati
on S
ched
ule
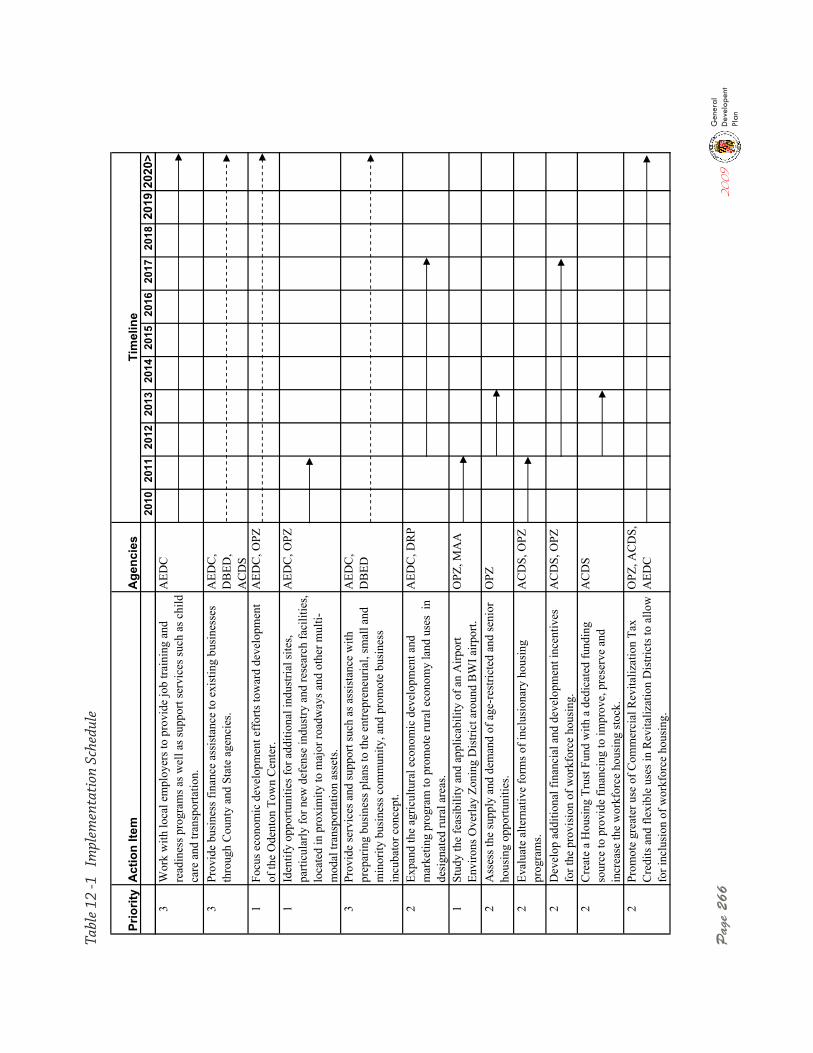
Pag
e 26
6
Prio
rity
Act
ion
Item
Age
ncie
s 20
1020
1120
1220
1320
1420
1520
1620
1720
1820
1920
20>
Tim
elin
e
3W
ork
with
loca
l em
ploy
ers t
o pr
ovid
e jo
b tra
inin
g an
d re
adin
ess p
rogr
ams a
s wel
l as s
uppo
rt se
rvic
es su
ch a
s chi
ld
care
and
tran
spor
tatio
n.
AED
C
3Pr
ovid
e bu
sine
ss fi
nanc
e as
sist
ance
to e
xist
ing
busi
ness
es
thro
ugh
Cou
nty
and
Stat
e ag
enci
es.
AED
C,
DB
ED,
AC
DS
1Fo
cus e
cono
mic
dev
elop
men
t eff
orts
tow
ard
deve
lopm
ent
of th
e O
dent
on T
own
Cen
ter.
AED
C, O
PZ
1Id
entif
y op
portu
nitie
s for
add
ition
al in
dust
rial s
ites,
parti
cula
rly fo
r new
def
ense
indu
stry
and
rese
arch
faci
litie
s, lo
cate
d in
pro
xim
ity to
maj
or ro
adw
ays a
nd o
ther
mul
ti-m
odal
tran
spor
tatio
n as
sets
.
AED
C, O
PZ
3Pr
ovid
e se
rvic
es a
nd su
ppor
t suc
h as
ass
ista
nce
with
pr
epar
ing
busi
ness
pla
ns to
the
entre
pren
euria
l, sm
all a
nd
min
ority
bus
ines
s com
mun
ity, a
nd p
rom
ote
busi
ness
in
cuba
tor c
once
pt.
AED
C,
DB
ED
2Ex
pand
the
agric
ultu
ral e
cono
mic
dev
elop
men
t and
m
arke
ting
prog
ram
to p
rom
ote
rura
l eco
nom
y la
nd u
ses
in
desi
gnat
ed ru
ral a
reas
.
AED
C, D
RP
1St
udy
the
feas
ibili
ty a
nd a
pplic
abili
ty o
f an
Airp
ort
Envi
rons
Ove
rlay
Zoni
ng D
istri
ct a
roun
d B
WI a
irpor
t.O
PZ, M
AA
2A
sses
s the
supp
ly a
nd d
eman
d of
age
-res
trict
ed a
nd se
nior
ho
usin
g op
portu
nitie
s.O
PZ
2Ev
alua
te a
ltern
ativ
e fo
rms o
f inc
lusi
onar
y ho
usin
g pr
ogra
ms.
AC
DS,
OPZ
2D
evel
op a
dditi
onal
fina
ncia
l and
dev
elop
men
t inc
entiv
es
for t
he p
rovi
sion
of w
orkf
orce
hou
sing
.A
CD
S, O
PZ
2C
reat
e a
Hou
sing
Tru
st F
und
with
a d
edic
ated
fund
ing
sour
ce to
pro
vide
fina
ncin
g to
impr
ove,
pre
serv
e an
d in
crea
se th
e w
orkf
orce
hou
sing
stoc
k.
AC
DS
2Pr
omot
e gr
eate
r use
of C
omm
erci
al R
evita
lizat
ion
Tax
Cre
dits
and
flex
ible
use
s in
Rev
italiz
atio
n D
istri
cts t
o al
low
fo
r inc
lusi
on o
f wor
kfor
ce h
ousi
ng.
OPZ
, AC
DS,
A
EDC
Tabl
e 12
-1
Impl
emen
tati
on S
ched
ule
2009
General
Developent
Plan
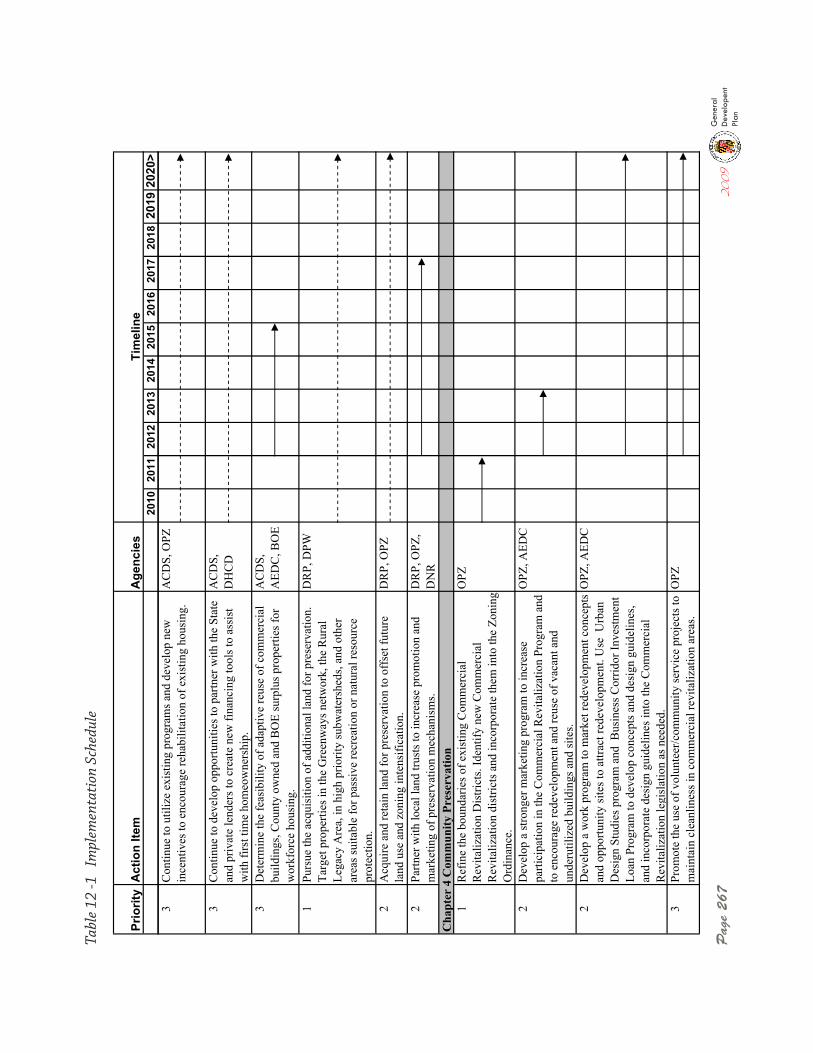
Pag
e 26
720
09General
Developent
Plan
Prio
rity
Act
ion
Item
Age
ncie
s 20
1020
1120
1220
1320
1420
1520
1620
1720
1820
1920
20>
Tim
elin
e
3C
ontin
ue to
util
ize
exis
ting
prog
ram
s and
dev
elop
new
in
cent
ives
to e
ncou
rage
reha
bilit
atio
n of
exi
stin
g ho
usin
g.A
CD
S, O
PZ
3C
ontin
ue to
dev
elop
opp
ortu
nitie
s to
partn
er w
ith th
e St
ate
and
priv
ate
lend
ers t
o cr
eate
new
fina
ncin
g to
ols t
o as
sist
w
ith fi
rst t
ime
hom
eow
ners
hip.
AC
DS,
DH
CD
3D
eter
min
e th
e fe
asib
ility
of a
dapt
ive
reus
e of
com
mer
cial
bu
ildin
gs, C
ount
y ow
ned
and
BO
E su
rplu
s pro
perti
es fo
r w
orkf
orce
hou
sing
.
AC
DS,
AED
C, B
OE
1Pu
rsue
the
acqu
isiti
on o
f add
ition
al la
nd fo
r pre
serv
atio
n.
Targ
et p
rope
rties
in th
e G
reen
way
s net
wor
k, th
e R
ural
Le
gacy
Are
a, in
hig
h pr
iorit
y su
bwat
ersh
eds,
and
othe
r ar
eas s
uita
ble
for p
assi
ve re
crea
tion
or n
atur
al re
sour
ce
prot
ectio
n.
DR
P, D
PW
2A
cqui
re a
nd re
tain
land
for p
rese
rvat
ion
to o
ffse
t fut
ure
land
use
and
zon
ing
inte
nsifi
catio
n.
DR
P, O
PZ
2Pa
rtner
with
loca
l lan
d tru
sts t
o in
crea
se p
rom
otio
n an
d m
arke
ting
of p
rese
rvat
ion
mec
hani
sms.
DR
P, O
PZ,
DN
RC
hapt
er 4
Com
mun
ity P
rese
rvat
ion
1R
efin
e th
e bo
unda
ries o
f exi
stin
g C
omm
erci
al
Rev
italiz
atio
n D
istri
cts.
Iden
tify
new
Com
mer
cial
R
evita
lizat
ion
dist
ricts
and
inco
rpor
ate
them
into
the
Zoni
ng
Ord
inan
ce.
OPZ
2D
evel
op a
stro
nger
mar
ketin
g pr
ogra
m to
incr
ease
pa
rtici
patio
n in
the
Com
mer
cial
Rev
italiz
atio
n Pr
ogra
m a
nd
to e
ncou
rage
rede
velo
pmen
t and
reus
e of
vac
ant a
nd
unde
rutil
ized
bui
ldin
gs a
nd si
tes.
OPZ
, AED
C
2D
evel
op a
wor
k pr
ogra
m to
mar
ket r
edev
elop
men
t con
cept
s an
d op
portu
nity
site
s to
attra
ct re
deve
lopm
ent.
Use
Urb
an
Des
ign
Stud
ies p
rogr
am a
nd B
usin
ess C
orrid
or In
vest
men
t Lo
an P
rogr
am to
dev
elop
con
cept
s and
des
ign
guid
elin
es,
and
inco
rpor
ate
desi
gn g
uide
lines
into
the
Com
mer
cial
R
evita
lizat
ion
legi
slat
ion
as n
eede
d.
OPZ
, AED
C
3Pr
omot
e th
e us
e of
vol
unte
er/c
omm
unity
serv
ice
proj
ects
to
mai
ntai
n cl
eanl
ines
s in
com
mer
cial
revi
taliz
atio
n ar
eas.
OPZ
Tabl
e 12
-1
Impl
emen
tati
on S
ched
ule
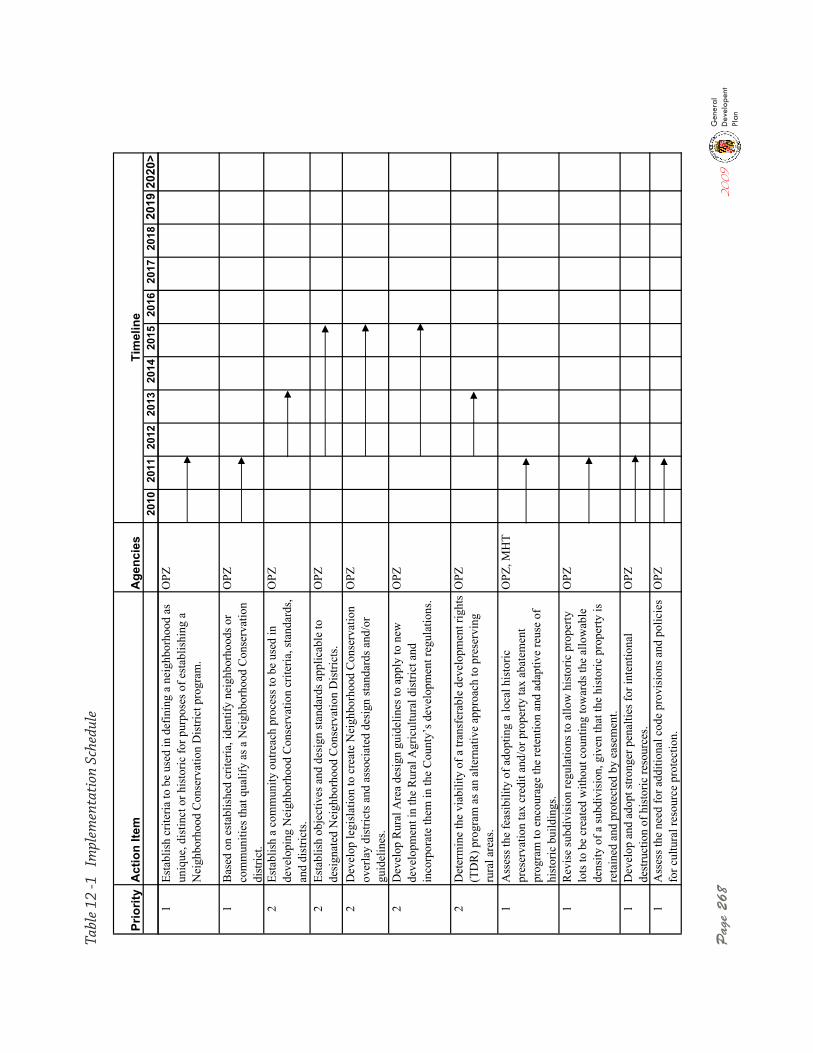
Pag
e 26
8
Prio
rity
Act
ion
Item
Age
ncie
s 20
1020
1120
1220
1320
1420
1520
1620
1720
1820
1920
20>
Tim
elin
e
1Es
tabl
ish
crite
ria to
be
used
in d
efin
ing
a ne
ighb
orho
od a
s un
ique
, dis
tinct
or h
isto
ric fo
r pur
pose
s of e
stab
lishi
ng a
N
eigh
borh
ood
Con
serv
atio
n D
istri
ct p
rogr
am.
OPZ
1B
ased
on
esta
blis
hed
crite
ria, i
dent
ify n
eigh
borh
oods
or
com
mun
ities
that
qua
lify
as a
Nei
ghbo
rhoo
d C
onse
rvat
ion
dist
rict.
OPZ
2Es
tabl
ish
a co
mm
unity
out
reac
h pr
oces
s to
be u
sed
in
deve
lopi
ng N
eigh
borh
ood
Con
serv
atio
n cr
iteria
, sta
ndar
ds,
and
dist
ricts
.
OPZ
2Es
tabl
ish
obje
ctiv
es a
nd d
esig
n st
anda
rds a
pplic
able
to
desi
gnat
ed N
eigh
borh
ood
Con
serv
atio
n D
istri
cts.
OPZ
2D
evel
op le
gisl
atio
n to
cre
ate
Nei
ghbo
rhoo
d C
onse
rvat
ion
over
lay
dist
ricts
and
ass
ocia
ted
desi
gn st
anda
rds a
nd/o
r gu
idel
ines
.
OPZ
2D
evel
op R
ural
Are
a de
sign
gui
delin
es to
app
ly to
new
de
velo
pmen
t in
the
Rur
al A
gric
ultu
ral d
istri
ct a
nd
inco
rpor
ate
them
in th
e C
ount
y’s d
evel
opm
ent r
egul
atio
ns.
OPZ
2D
eter
min
e th
e vi
abili
ty o
f a tr
ansf
erab
le d
evel
opm
ent r
ight
s (T
DR
) pro
gram
as a
n al
tern
ativ
e ap
proa
ch to
pre
serv
ing
rura
l are
as.
OPZ
1A
sses
s the
feas
ibili
ty o
f ado
ptin
g a
loca
l his
toric
pr
eser
vatio
n ta
x cr
edit
and/
or p
rope
rty ta
x ab
atem
ent
prog
ram
to e
ncou
rage
the
rete
ntio
n an
d ad
aptiv
e re
use
of
hist
oric
bui
ldin
gs.
OPZ
, MH
T
1R
evis
e su
bdiv
isio
n re
gula
tions
to a
llow
his
toric
pro
perty
lo
ts to
be
crea
ted
with
out c
ount
ing
tow
ards
the
allo
wab
le
dens
ity o
f a su
bdiv
isio
n, g
iven
that
the
hist
oric
pro
perty
is
reta
ined
and
pro
tect
ed b
y ea
sem
ent.
OPZ
1D
evel
op a
nd a
dopt
stro
nger
pen
altie
s for
inte
ntio
nal
dest
ruct
ion
of h
isto
ric re
sour
ces.
OPZ
1A
sses
s the
nee
d fo
r add
ition
al c
ode
prov
isio
ns a
nd p
olic
ies
for c
ultu
ral r
esou
rce
prot
ectio
n.O
PZ
Tabl
e 12
-1
Impl
emen
tati
on S
ched
ule
2009
General
Developent
Plan
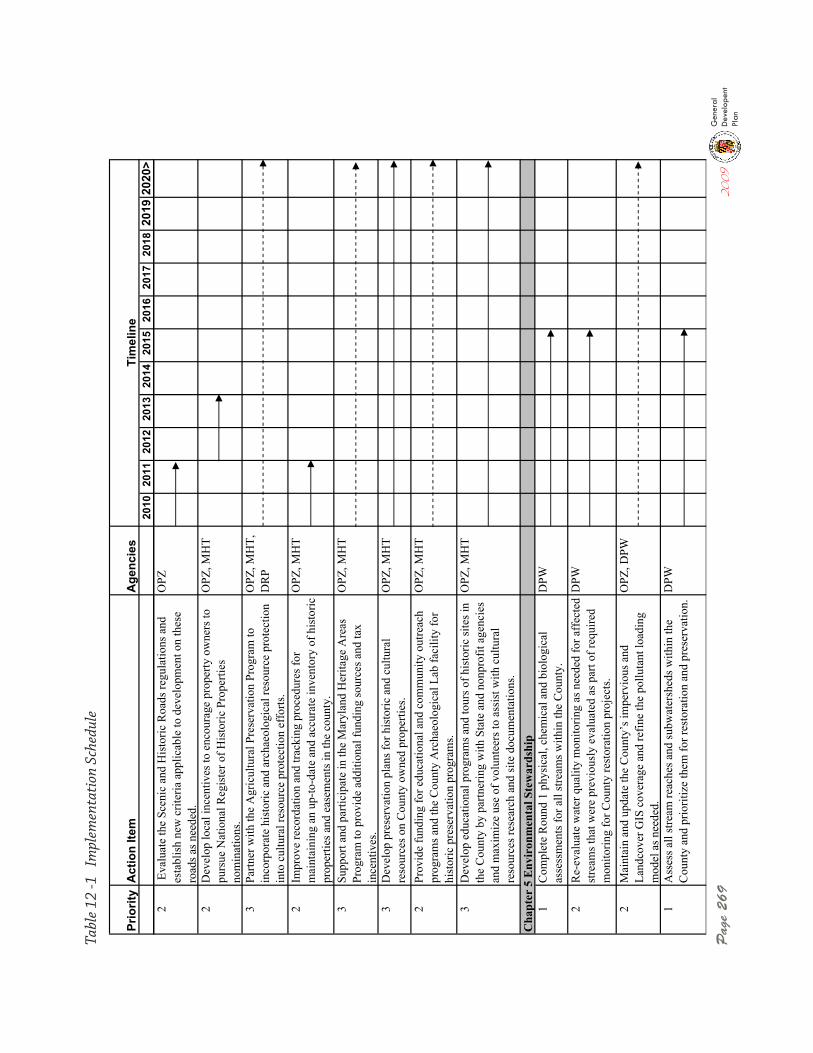
Pag
e 26
920
09General
Developent
Plan
Prio
rity
Act
ion
Item
Age
ncie
s 20
1020
1120
1220
1320
1420
1520
1620
1720
1820
1920
20>
Tim
elin
e
2 E
valu
ate
the
Scen
ic a
nd H
isto
ric R
oads
regu
latio
ns a
nd
esta
blis
h ne
w c
riter
ia a
pplic
able
to d
evel
opm
ent o
n th
ese
road
s as n
eede
d.
OPZ
2D
evel
op lo
cal i
ncen
tives
to e
ncou
rage
pro
perty
ow
ners
to
purs
ue N
atio
nal R
egis
ter o
f His
toric
Pro
perti
es
nom
inat
ions
.
OPZ
, MH
T
3Pa
rtner
with
the
Agr
icul
tura
l Pre
serv
atio
n Pr
ogra
m to
in
corp
orat
e hi
stor
ic a
nd a
rcha
eolo
gica
l res
ourc
e pr
otec
tion
into
cul
tura
l res
ourc
e pr
otec
tion
effo
rts.
OPZ
, MH
T,
DR
P
2Im
prov
e re
cord
atio
n an
d tra
ckin
g pr
oced
ures
for
mai
ntai
ning
an
up-to
-dat
e an
d ac
cura
te in
vent
ory
of h
isto
ric
prop
ertie
s and
eas
emen
ts in
the
coun
ty.
OPZ
, MH
T
3Su
ppor
t and
par
ticip
ate
in th
e M
aryl
and
Her
itage
Are
as
Prog
ram
to p
rovi
de a
dditi
onal
fund
ing
sour
ces a
nd ta
x in
cent
ives
.
OPZ
, MH
T
3D
evel
op p
rese
rvat
ion
plan
s for
his
toric
and
cul
tura
l re
sour
ces o
n C
ount
y ow
ned
prop
ertie
s. O
PZ, M
HT
2Pr
ovid
e fu
ndin
g fo
r edu
catio
nal a
nd c
omm
unity
out
reac
h pr
ogra
ms a
nd th
e C
ount
y A
rcha
eolo
gica
l Lab
faci
lity
for
hist
oric
pre
serv
atio
n pr
ogra
ms.
OPZ
, MH
T
3D
evel
op e
duca
tiona
l pro
gram
s and
tour
s of h
isto
ric si
tes i
n th
e C
ount
y by
par
tner
ing
with
Sta
te a
nd n
onpr
ofit
agen
cies
an
d m
axim
ize
use
of v
olun
teer
s to
assi
st w
ith c
ultu
ral
reso
urce
s res
earc
h an
d si
te d
ocum
enta
tions
.
OPZ
, MH
T
Cha
pter
5 E
nvir
onm
enta
l Ste
war
dshi
p1
Com
plet
e R
ound
1 p
hysi
cal,
chem
ical
and
bio
logi
cal
asse
ssm
ents
for a
ll st
ream
s with
in th
e C
ount
y.D
PW
2R
e-ev
alua
te w
ater
qua
lity
mon
itorin
g as
nee
ded
for a
ffec
ted
stre
ams t
hat w
ere
prev
ious
ly e
valu
ated
as p
art o
f req
uire
d m
onito
ring
for C
ount
y re
stor
atio
n pr
ojec
ts.
DPW
2M
aint
ain
and
upda
te th
e C
ount
y’s i
mpe
rvio
us a
nd
Land
cove
r GIS
cov
erag
e an
d re
fine
the
pollu
tant
load
ing
mod
el a
s nee
ded.
OPZ
, DPW
1A
sses
s all
stre
am re
ache
s and
subw
ater
shed
s with
in th
e C
ount
y an
d pr
iorit
ize
them
for r
esto
ratio
n an
d pr
eser
vatio
n.D
PW
Tabl
e 12
-1
Impl
emen
tati
on S
ched
ule
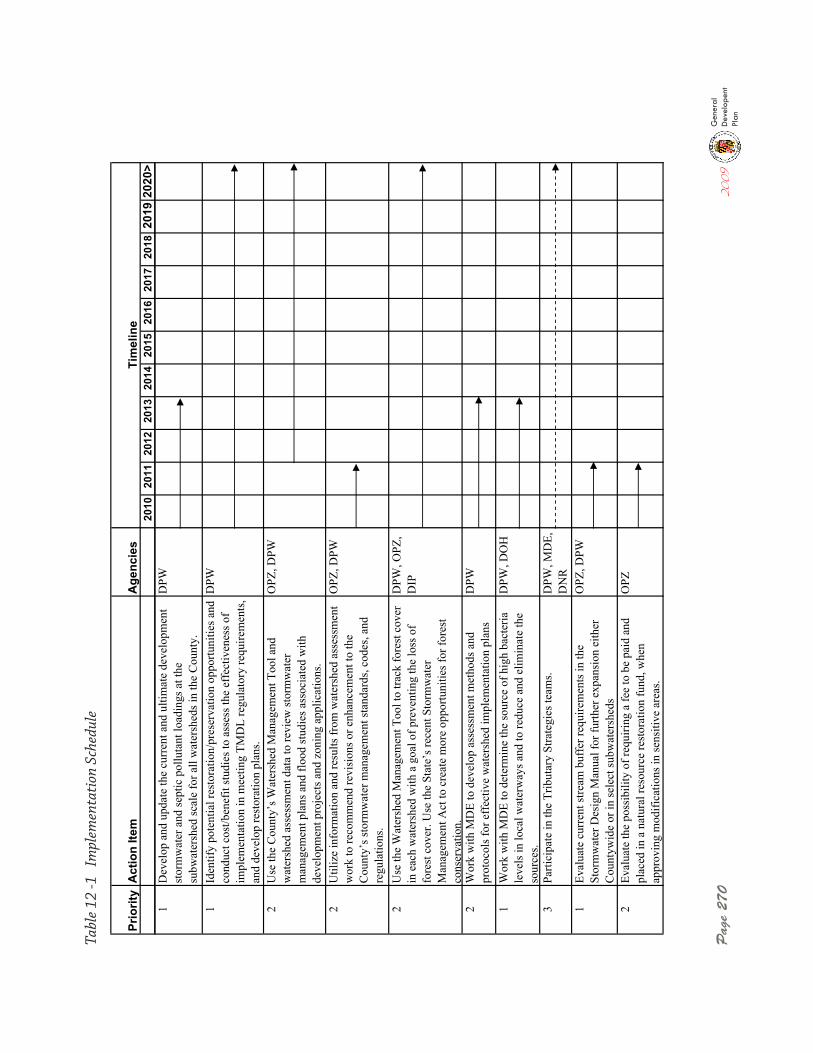
Pag
e 27
0
Prio
rity
Act
ion
Item
Age
ncie
s 20
1020
1120
1220
1320
1420
1520
1620
1720
1820
1920
20>
Tim
elin
e
1D
evel
op a
nd u
pdat
e th
e cu
rren
t and
ulti
mat
e de
velo
pmen
t st
orm
wat
er a
nd se
ptic
pol
luta
nt lo
adin
gs a
t the
su
bwat
ersh
ed sc
ale
for a
ll w
ater
shed
s in
the
Cou
nty.
DPW
1Id
entif
y po
tent
ial r
esto
ratio
n/pr
eser
vatio
n op
portu
nitie
s and
co
nduc
t cos
t/ben
efit
stud
ies t
o as
sess
the
effe
ctiv
enes
s of
impl
emen
tatio
n in
mee
ting
TMD
L re
gula
tory
requ
irem
ents
, an
d de
velo
p re
stor
atio
n pl
ans.
DPW
2U
se th
e C
ount
y’s W
ater
shed
Man
agem
ent T
ool a
nd
wat
ersh
ed a
sses
smen
t dat
a to
revi
ew st
orm
wat
er
man
agem
ent p
lans
and
floo
d st
udie
s ass
ocia
ted
with
de
velo
pmen
t pro
ject
s and
zon
ing
appl
icat
ions
.
OPZ
, DPW
2U
tiliz
e in
form
atio
n an
d re
sults
from
wat
ersh
ed a
sses
smen
t w
ork
to re
com
men
d re
visi
ons o
r enh
ance
men
t to
the
Cou
nty’
s sto
rmw
ater
man
agem
ent s
tand
ards
, cod
es, a
nd
regu
latio
ns.
OPZ
, DPW
2U
se th
e W
ater
shed
Man
agem
ent T
ool t
o tra
ck fo
rest
cov
er
in e
ach
wat
ersh
ed w
ith a
goa
l of p
reve
ntin
g th
e lo
ss o
f fo
rest
cov
er. U
se th
e St
ate’
s rec
ent S
torm
wat
er
Man
agem
ent A
ct to
cre
ate
mor
e op
portu
nitie
s for
fore
st
cons
erva
tion.
DPW
, OPZ
, D
IP
2W
ork
with
MD
E to
dev
elop
ass
essm
ent m
etho
ds a
nd
prot
ocol
s for
eff
ectiv
e w
ater
shed
impl
emen
tatio
n pl
ans
DPW
1W
ork
with
MD
E to
det
erm
ine
the
sour
ce o
f hig
h ba
cter
ia
leve
ls in
loca
l wat
erw
ays a
nd to
redu
ce a
nd e
limin
ate
the
sour
ces.
DPW
, DO
H
3Pa
rtici
pate
in th
e Tr
ibut
ary
Stra
tegi
es te
ams.
DPW
, MD
E,
DN
R1
Eval
uate
cur
rent
stre
am b
uffe
r req
uire
men
ts in
the
Stor
mw
ater
Des
ign
Man
ual f
or fu
rther
exp
ansi
on e
ither
C
ount
ywid
e or
in se
lect
subw
ater
shed
s
OPZ
, DPW
2Ev
alua
te th
e po
ssib
ility
of r
equi
ring
a fe
e to
be
paid
and
pl
aced
in a
nat
ural
reso
urce
rest
orat
ion
fund
, whe
n ap
prov
ing
mod
ifica
tions
in se
nsiti
ve a
reas
.
OPZ
Tabl
e 12
-1
Impl
emen
tati
on S
ched
ule
2009
General
Developent
Plan
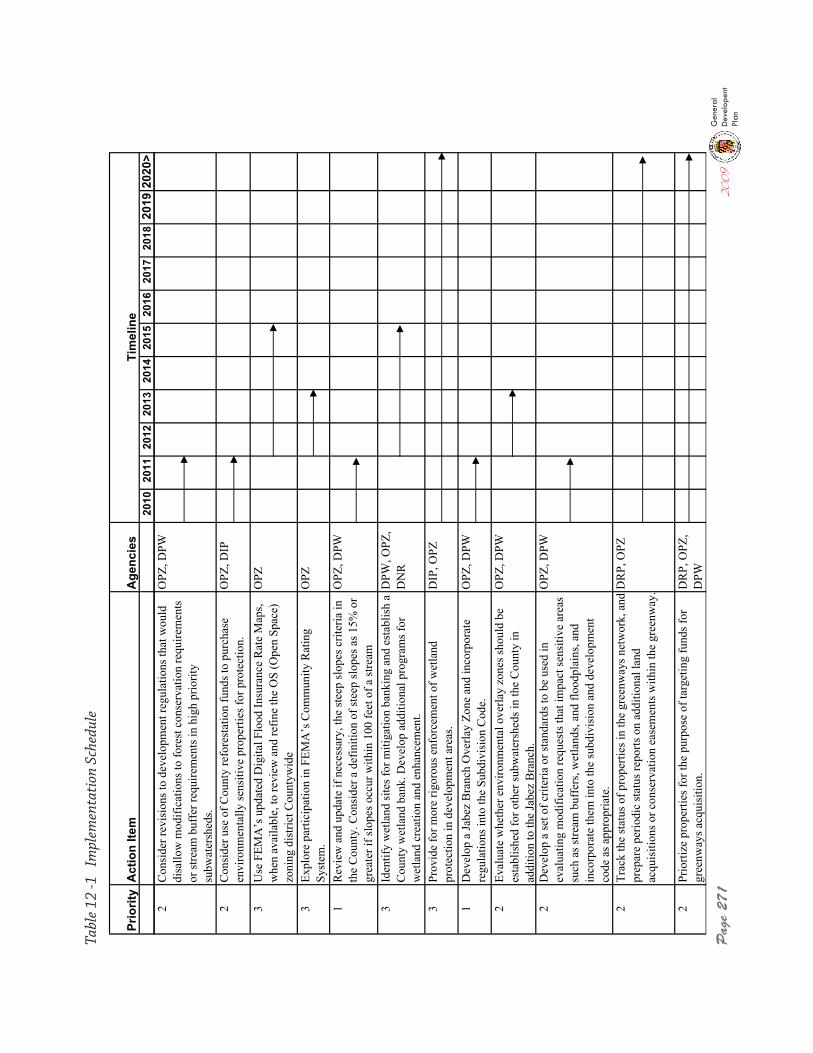
Pag
e 27
120
09General
Developent
Plan
Prio
rity
Act
ion
Item
Age
ncie
s 20
1020
1120
1220
1320
1420
1520
1620
1720
1820
1920
20>
Tim
elin
e
2C
onsi
der r
evis
ions
to d
evel
opm
ent r
egul
atio
ns th
at w
ould
di
sallo
w m
odifi
catio
ns to
fore
st c
onse
rvat
ion
requ
irem
ents
or
stre
am b
uffe
r req
uire
men
ts in
hig
h pr
iorit
y su
bwat
ersh
eds.
OPZ
, DPW
2C
onsi
der u
se o
f Cou
nty
refo
rest
atio
n fu
nds t
o pu
rcha
se
envi
ronm
enta
lly se
nsiti
ve p
rope
rties
for p
rote
ctio
n.O
PZ, D
IP
3U
se F
EMA
’s u
pdat
ed D
igita
l Flo
od In
sura
nce
Rat
e M
aps,
whe
n av
aila
ble,
to re
view
and
refin
e th
e O
S (O
pen
Spac
e)
zoni
ng d
istri
ct C
ount
ywid
e
OPZ
3Ex
plor
e pa
rtici
patio
n in
FEM
A’s
Com
mun
ity R
atin
g Sy
stem
.O
PZ
1R
evie
w a
nd u
pdat
e if
nece
ssar
y, th
e st
eep
slop
es c
riter
ia in
th
e C
ount
y. C
onsi
der a
def
initi
on o
f ste
ep sl
opes
as 1
5% o
r gr
eate
r if s
lope
s occ
ur w
ithin
100
feet
of a
stre
am
OPZ
, DPW
3Id
entif
y w
etla
nd si
tes f
or m
itiga
tion
bank
ing
and
esta
blis
h a
Cou
nty
wet
land
ban
k. D
evel
op a
dditi
onal
pro
gram
s for
w
etla
nd c
reat
ion
and
enha
ncem
ent.
DPW
, OPZ
, D
NR
3Pr
ovid
e fo
r mor
e rig
orou
s enf
orce
men
t of w
etla
nd
prot
ectio
n in
dev
elop
men
t are
as.
DIP
, OPZ
1D
evel
op a
Jabe
z B
ranc
h O
verla
y Zo
ne a
nd in
corp
orat
e re
gula
tions
into
the
Subd
ivis
ion
Cod
e.
OPZ
, DPW
2Ev
alua
te w
heth
er e
nviro
nmen
tal o
verla
y zo
nes s
houl
d be
es
tabl
ishe
d fo
r oth
er su
bwat
ersh
eds i
n th
e C
ount
y in
ad
ditio
n to
the
Jabe
z B
ranc
h.
OPZ
, DPW
2D
evel
op a
set o
f crit
eria
or s
tand
ards
to b
e us
ed in
ev
alua
ting
mod
ifica
tion
requ
ests
that
impa
ct se
nsiti
ve a
reas
su
ch a
s stre
am b
uffe
rs, w
etla
nds,
and
flood
plai
ns, a
nd
inco
rpor
ate
them
into
the
subd
ivis
ion
and
deve
lopm
ent
code
as a
ppro
pria
te.
OPZ
, DPW
2Tr
ack
the
stat
us o
f pro
perti
es in
the
gree
nway
s net
wor
k, a
nd
prep
are
perio
dic
stat
us re
ports
on
addi
tiona
l lan
d ac
quis
ition
s or c
onse
rvat
ion
ease
men
ts w
ithin
the
gree
nway
.DR
P, O
PZ
2Pr
iorti
ze p
rope
rties
for t
he p
urpo
se o
f tar
getin
g fu
nds f
or
gree
nway
s acq
uisi
tion.
DR
P, O
PZ,
DPW
Tabl
e 12
-1
Impl
emen
tati
on S
ched
ule
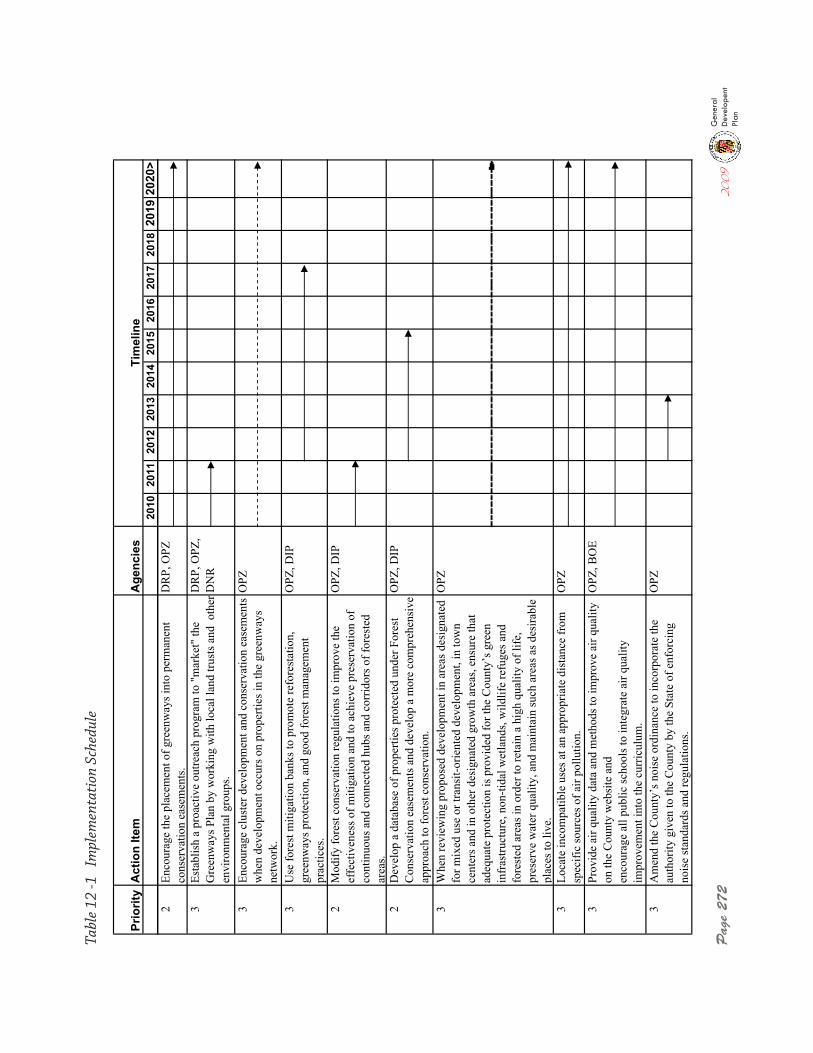
Pag
e 27
2
Prio
rity
Act
ion
Item
Age
ncie
s 20
1020
1120
1220
1320
1420
1520
1620
1720
1820
1920
20>
Tim
elin
e
2En
cour
age
the
plac
emen
t of g
reen
way
s int
o pe
rman
ent
cons
erva
tion
ease
men
ts.
DR
P, O
PZ
3Es
tabl
ish
a pr
oact
ive
outre
ach
prog
ram
to "
mar
ket"
the
Gre
enw
ays P
lan
by w
orki
ng w
ith lo
cal l
and
trust
s and
oth
er
envi
ronm
enta
l gro
ups.
DR
P, O
PZ,
DN
R
3En
cour
age
clus
ter d
evel
opm
ent a
nd c
onse
rvat
ion
ease
men
ts
whe
n de
velo
pmen
t occ
urs o
n pr
oper
ties i
n th
e gr
eenw
ays
netw
ork.
OPZ
3U
se fo
rest
miti
gatio
n ba
nks t
o pr
omot
e re
fore
stat
ion,
gr
eenw
ays p
rote
ctio
n, a
nd g
ood
fore
st m
anag
emen
t pr
actic
es.
OPZ
, DIP
2M
odify
fore
st c
onse
rvat
ion
regu
latio
ns to
impr
ove
the
effe
ctiv
enes
s of m
itiga
tion
and
to a
chie
ve p
rese
rvat
ion
of
cont
inuo
us a
nd c
onne
cted
hub
s and
cor
ridor
s of f
ores
ted
area
s.
OPZ
, DIP
2D
evel
op a
dat
abas
e of
pro
perti
es p
rote
cted
und
er F
ores
t C
onse
rvat
ion
ease
men
ts a
nd d
evel
op a
mor
e co
mpr
ehen
sive
ap
proa
ch to
fore
st c
onse
rvat
ion.
OPZ
, DIP
3W
hen
revi
ewin
g pr
opos
ed d
evel
opm
ent i
n ar
eas d
esig
nate
d fo
r mix
ed u
se o
r tra
nsit-
orie
nted
dev
elop
men
t, in
tow
n ce
nter
s and
in o
ther
des
igna
ted
grow
th a
reas
, ens
ure
that
ad
equa
te p
rote
ctio
n is
pro
vide
d fo
r the
Cou
nty’
s gre
en
infr
astru
ctur
e, n
on-ti
dal w
etla
nds,
wild
life
refu
ges a
nd
fore
sted
are
as in
ord
er to
reta
in a
hig
h qu
ality
of l
ife,
pres
erve
wat
er q
ualit
y, a
nd m
aint
ain
such
are
as a
s des
irabl
e pl
aces
to li
ve.
OPZ
3Lo
cate
inco
mpa
tible
use
s at a
n ap
prop
riate
dis
tanc
e fr
om
spec
ific
sour
ces o
f air
pollu
tion.
OPZ
3Pr
ovid
e ai
r qua
lity
data
and
met
hods
to im
prov
e ai
r qua
lity
on th
e C
ount
y w
ebsi
te a
nden
cour
age
all p
ublic
scho
ols t
o in
tegr
ate
air q
ualit
y im
prov
emen
t int
o th
e cu
rric
ulum
.
OPZ
, BO
E
3A
men
d th
e C
ount
y’s n
oise
ord
inan
ce to
inco
rpor
ate
the
auth
ority
giv
en to
the
Cou
nty
by th
e St
ate
of e
nfor
cing
no
ise
stan
dard
s and
regu
latio
ns.
OPZ
Tabl
e 12
-1
Impl
emen
tati
on S
ched
ule
2009
General
Developent
Plan
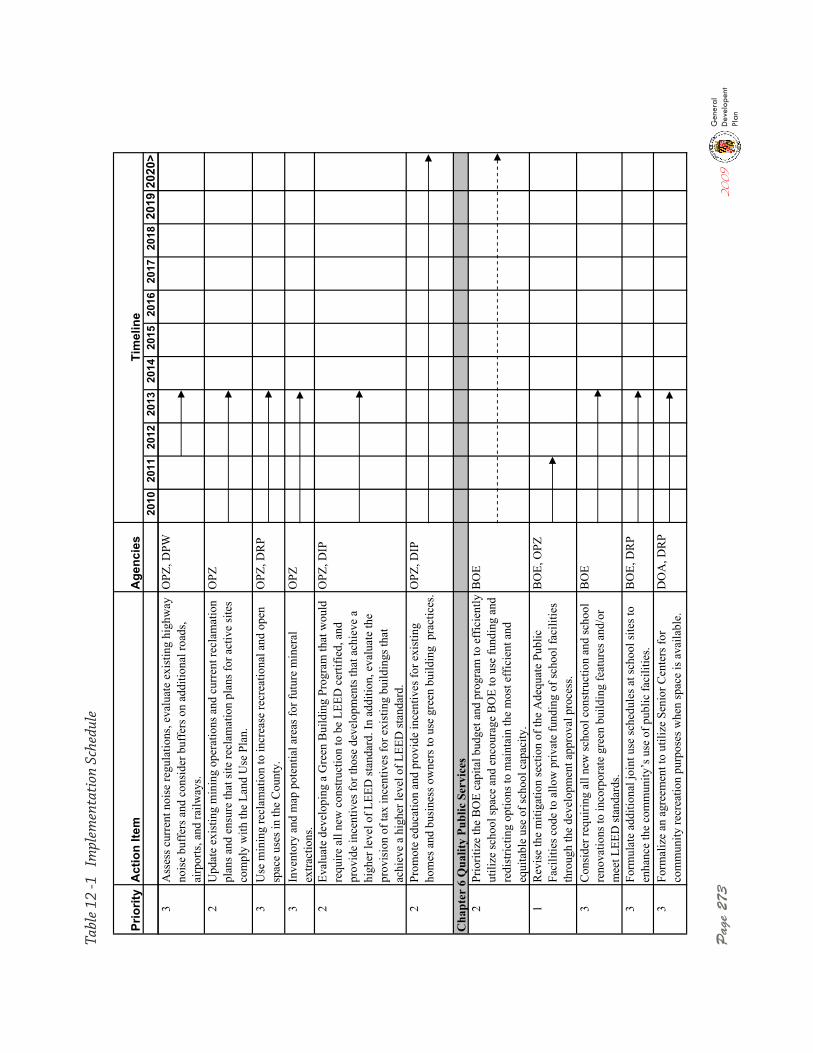
Pag
e 27
320
09General
Developent
Plan
Prio
rity
Act
ion
Item
Age
ncie
s 20
1020
1120
1220
1320
1420
1520
1620
1720
1820
1920
20>
Tim
elin
e
3A
sses
s cur
rent
noi
se re
gula
tions
, eva
luat
e ex
istin
g hi
ghw
ay
nois
e bu
ffer
s and
con
side
r buf
fers
on
addi
tiona
l roa
ds,
airp
orts
, and
railw
ays.
OPZ
, DPW
2U
pdat
e ex
istin
g m
inin
g op
erat
ions
and
cur
rent
recl
amat
ion
plan
s and
ens
ure
that
site
recl
amat
ion
plan
s for
act
ive
site
s co
mpl
y w
ith th
e La
nd U
se P
lan.
OPZ
3U
se m
inin
g re
clam
atio
n to
incr
ease
recr
eatio
nal a
nd o
pen
spac
e us
es in
the
Cou
nty.
OPZ
, DR
P
3In
vent
ory
and
map
pot
entia
l are
as fo
r fut
ure
min
eral
ex
tract
ions
.O
PZ
2Ev
alua
te d
evel
opin
g a
Gre
en B
uild
ing
Prog
ram
that
wou
ld
requ
ire a
ll ne
w c
onst
ruct
ion
to b
e LE
ED c
ertif
ied,
and
pr
ovid
e in
cent
ives
for t
hose
dev
elop
men
ts th
at a
chie
ve a
hi
gher
leve
l of L
EED
stan
dard
. In
addi
tion,
eva
luat
e th
e pr
ovis
ion
of ta
x in
cent
ives
for e
xist
ing
build
ings
that
ac
hiev
e a
high
er le
vel o
f LEE
D st
anda
rd.
OPZ
, DIP
2Pr
omot
e ed
ucat
ion
and
prov
ide
ince
ntiv
es fo
r exi
stin
g ho
mes
and
bus
ines
s ow
ners
to u
se g
reen
bui
ldin
g p
ract
ices
.O
PZ, D
IP
Cha
pter
6 Q
ualit
y Pu
blic
Ser
vice
s2
Prio
ritiz
e th
e B
OE
capi
tal b
udge
t and
pro
gram
to e
ffic
ient
ly
utili
ze sc
hool
spac
e an
d en
cour
age
BO
E to
use
fund
ing
and
redi
stric
ting
optio
ns to
mai
ntai
n th
e m
ost e
ffic
ient
and
eq
uita
ble
use
of sc
hool
cap
acity
.
BO
E
1R
evis
e th
e m
itiga
tion
sect
ion
of th
e A
dequ
ate
Publ
ic
Faci
litie
s cod
e to
allo
w p
rivat
e fu
ndin
g of
scho
ol fa
cilit
ies
thro
ugh
the
deve
lopm
ent a
ppro
val p
roce
ss.
BO
E, O
PZ
3C
onsi
der r
equi
ring
all n
ew sc
hool
con
stru
ctio
n an
d sc
hool
re
nova
tions
to in
corp
orat
e gr
een
build
ing
feat
ures
and
/or
mee
t LEE
D st
anda
rds.
BO
E
3Fo
rmul
ate
addi
tiona
l joi
nt u
se sc
hedu
les a
t sch
ool s
ites t
o en
hanc
e th
e co
mm
unity
’s u
se o
f pub
lic fa
cilit
ies.
BO
E, D
RP
3Fo
rmal
ize
an a
gree
men
t to
utili
ze S
enio
r Cen
ters
for
com
mun
ity re
crea
tion
purp
oses
whe
n sp
ace
is a
vaila
ble.
DO
A, D
RP
Tabl
e 12
-1
Impl
emen
tati
on S
ched
ule
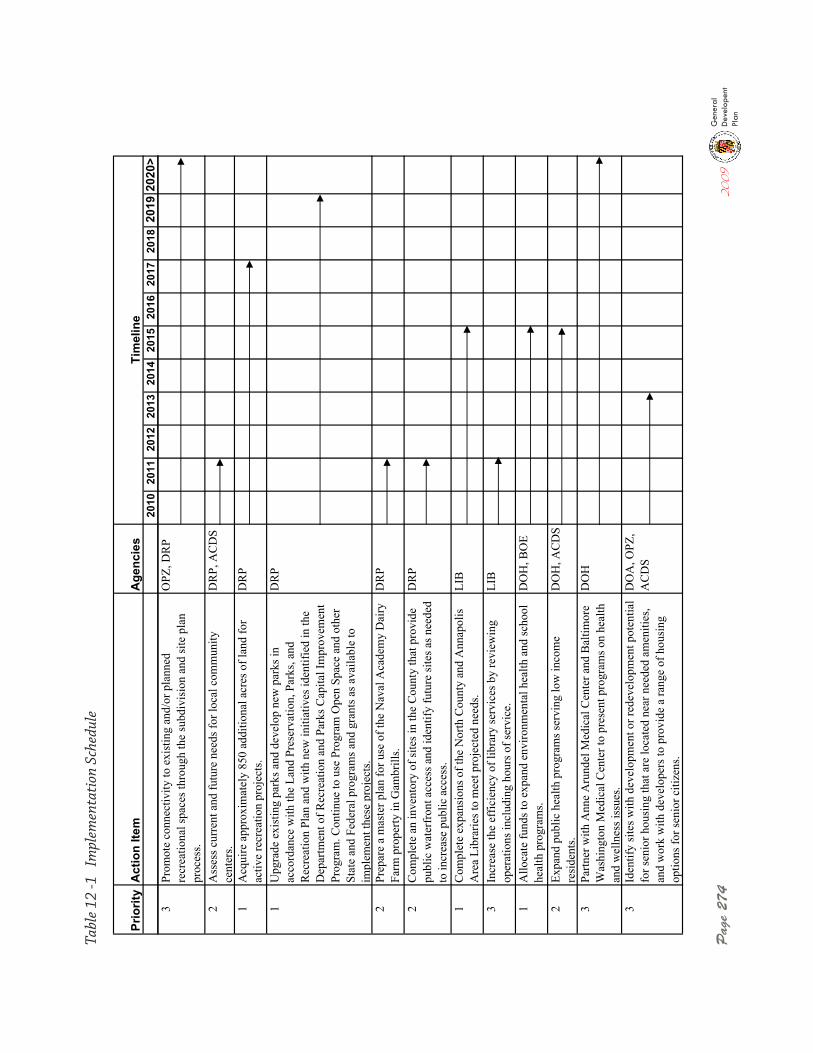
Pag
e 27
4
Prio
rity
Act
ion
Item
Age
ncie
s 20
1020
1120
1220
1320
1420
1520
1620
1720
1820
1920
20>
Tim
elin
e
3Pr
omot
e co
nnec
tivity
to e
xist
ing
and/
or p
lann
ed
recr
eatio
nal s
pace
s thr
ough
the
subd
ivis
ion
and
site
pla
n pr
oces
s.
OPZ
, DR
P
2A
sses
s cur
rent
and
futu
re n
eeds
for l
ocal
com
mun
ity
cent
ers.
DR
P, A
CD
S
1A
cqui
re a
ppro
xim
atel
y 85
0 ad
ditio
nal a
cres
of l
and
for
activ
e re
crea
tion
proj
ects
.D
RP
1U
pgra
de e
xist
ing
park
s and
dev
elop
new
par
ks in
ac
cord
ance
with
the
Land
Pre
serv
atio
n, P
arks
, and
R
ecre
atio
n Pl
an a
nd w
ith n
ew in
itiat
ives
iden
tifie
d in
the
Dep
artm
ent o
f Rec
reat
ion
and
Park
s Cap
ital I
mpr
ovem
ent
Prog
ram
. Con
tinue
to u
se P
rogr
am O
pen
Spac
e an
d ot
her
Stat
e an
d Fe
dera
l pro
gram
s and
gra
nts a
s ava
ilabl
e to
im
plem
ent t
hese
pro
ject
s.
DR
P
2Pr
epar
e a
mas
ter p
lan
for u
se o
f the
Nav
al A
cade
my
Dai
ry
Farm
pro
perty
in G
ambr
ills.
DR
P
2C
ompl
ete
an in
vent
ory
of si
tes i
n th
e C
ount
y th
at p
rovi
de
publ
ic w
ater
fron
t acc
ess a
nd id
entif
y fu
ture
site
s as n
eede
d to
incr
ease
pub
lic a
cces
s.
DR
P
1C
ompl
ete
expa
nsio
ns o
f the
Nor
th C
ount
y an
d A
nnap
olis
A
rea
Libr
arie
s to
mee
t pro
ject
ed n
eeds
. LI
B
3In
crea
se th
e ef
ficie
ncy
of li
brar
y se
rvic
es b
y re
view
ing
oper
atio
ns in
clud
ing
hour
s of s
ervi
ce.
LIB
1A
lloca
te fu
nds t
o ex
pand
env
ironm
enta
l hea
lth a
nd sc
hool
he
alth
pro
gram
s.D
OH
, BO
E
2Ex
pand
pub
lic h
ealth
pro
gram
s ser
ving
low
inco
me
resi
dent
s.D
OH
, AC
DS
3Pa
rtner
with
Ann
e A
rund
el M
edic
al C
ente
r and
Bal
timor
e W
ashi
ngto
n M
edic
al C
ente
r to
pres
ent p
rogr
ams o
n he
alth
an
d w
elln
ess i
ssue
s.
DO
H
3Id
entif
y si
tes w
ith d
evel
opm
ent o
r red
evel
opm
ent p
oten
tial
for s
enio
r hou
sing
that
are
loca
ted
near
nee
ded
amen
ities
, an
d w
ork
with
dev
elop
ers t
o pr
ovid
e a
rang
e of
hou
sing
op
tions
for s
enio
r citi
zens
.
DO
A, O
PZ,
AC
DS
Tabl
e 12
-1
Impl
emen
tati
on S
ched
ule
2009
General
Developent
Plan
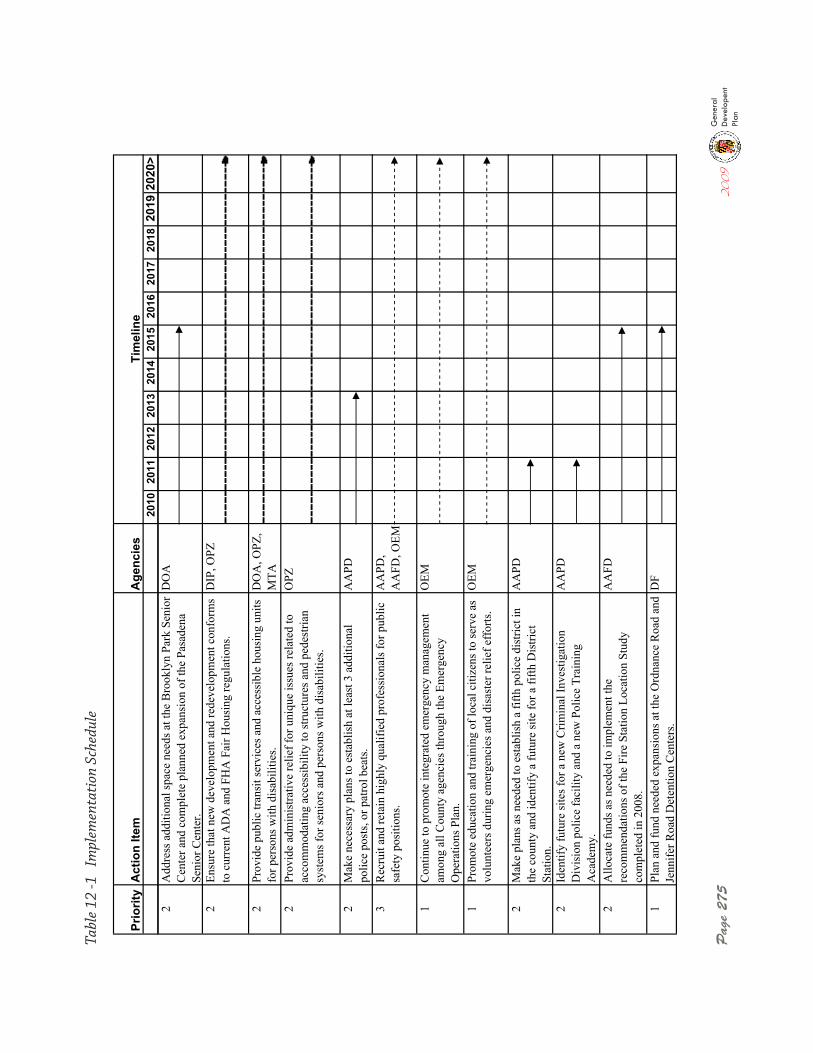
Pag
e 27
520
09General
Developent
Plan
Prio
rity
Act
ion
Item
Age
ncie
s 20
1020
1120
1220
1320
1420
1520
1620
1720
1820
1920
20>
Tim
elin
e
2A
ddre
ss a
dditi
onal
spac
e ne
eds a
t the
Bro
okly
n Pa
rk S
enio
r C
ente
r and
com
plet
e pl
anne
d ex
pans
ion
of th
e Pa
sade
na
Seni
or C
ente
r.
DO
A
2En
sure
that
new
dev
elop
men
t and
rede
velo
pmen
t con
form
s to
cur
rent
AD
A a
nd F
HA
Fai
r Hou
sing
regu
latio
ns.
DIP
, OPZ
2Pr
ovid
e pu
blic
tran
sit s
ervi
ces a
nd a
cces
sibl
e ho
usin
g un
its
for p
erso
ns w
ith d
isab
ilitie
s.D
OA
, OPZ
, M
TA2
Prov
ide
adm
inis
trativ
e re
lief f
or u
niqu
e is
sues
rela
ted
to
acco
mm
odat
ing
acce
ssib
ility
to st
ruct
ures
and
ped
estri
an
syst
ems f
or se
nior
s and
per
sons
with
dis
abili
ties.
OPZ
2M
ake
nece
ssar
y pl
ans t
o es
tabl
ish
at le
ast 3
add
ition
al
polic
e po
sts,
or p
atro
l bea
ts.
AA
PD
3R
ecru
it an
d re
tain
hig
hly
qual
ified
pro
fess
iona
ls fo
r pub
lic
safe
ty p
ositi
ons.
AA
PD,
AA
FD, O
EM
1C
ontin
ue to
pro
mot
e in
tegr
ated
em
erge
ncy
man
agem
ent
amon
g al
l Cou
nty
agen
cies
thro
ugh
the
Emer
genc
y O
pera
tions
Pla
n.
OEM
1Pr
omot
e ed
ucat
ion
and
train
ing
of lo
cal c
itize
ns to
serv
e as
vo
lunt
eers
dur
ing
emer
genc
ies a
nd d
isas
ter r
elie
f eff
orts
.O
EM
2M
ake
plan
s as n
eede
d to
est
ablis
h a
fifth
pol
ice
dist
rict i
n th
e co
unty
and
iden
tify
a fu
ture
site
for a
fifth
Dis
trict
St
atio
n.
AA
PD
2Id
entif
y fu
ture
site
s for
a n
ew C
rimin
al In
vest
igat
ion
Div
isio
n po
lice
faci
lity
and
a ne
w P
olic
e Tr
aini
ng
Aca
dem
y.
AA
PD
2A
lloca
te fu
nds a
s nee
ded
to im
plem
ent t
he
reco
mm
enda
tions
of t
he F
ire S
tatio
n Lo
catio
n St
udy
com
plet
ed in
200
8.
AA
FD
1Pl
an a
nd fu
nd n
eede
d ex
pans
ions
at t
he O
rdna
nce
Roa
d an
d Je
nnife
r Roa
d D
eten
tion
Cen
ters
.D
F
Tabl
e 12
-1
Impl
emen
tati
on S
ched
ule
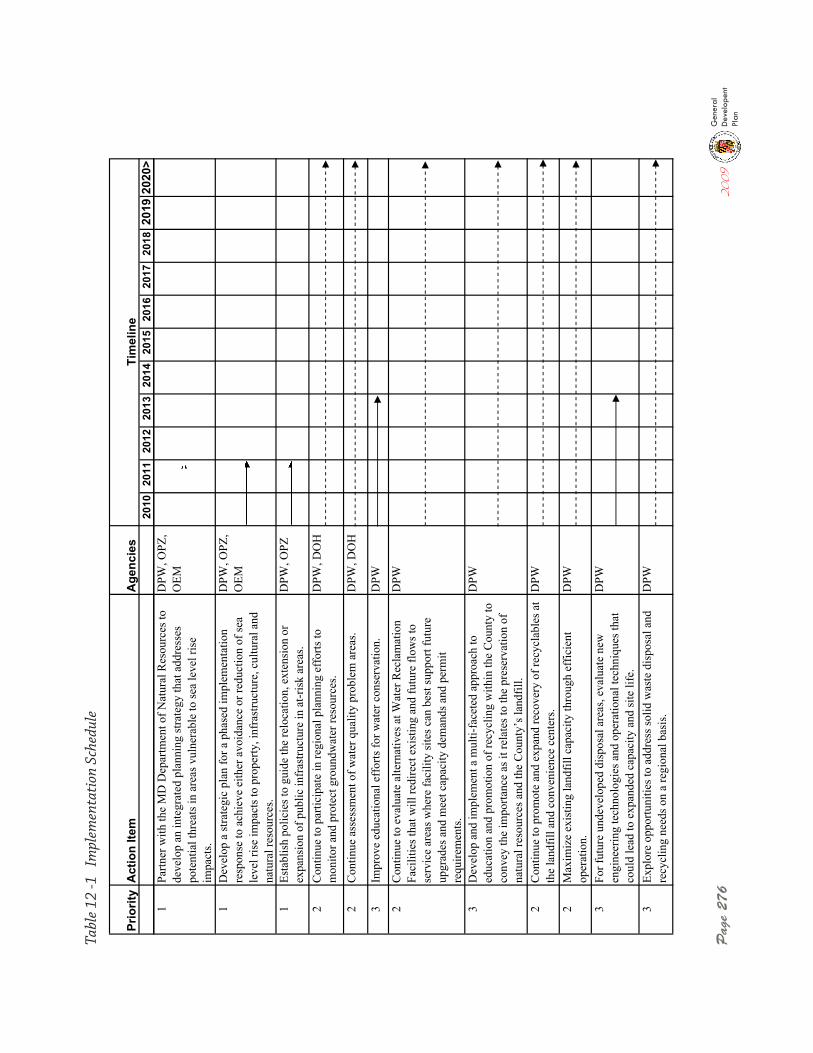
Pag
e 27
6
Prio
rity
Act
ion
Item
Age
ncie
s 20
1020
1120
1220
1320
1420
1520
1620
1720
1820
1920
20>
Tim
elin
e
1Pa
rtner
with
the
MD
Dep
artm
ent o
f Nat
ural
Res
ourc
es to
de
velo
p an
inte
grat
ed p
lann
ing
stra
tegy
that
add
ress
es
pote
ntia
l thr
eats
in a
reas
vul
nera
ble
to se
a le
vel r
ise
impa
cts.
DPW
, OPZ
, O
EM
1D
evel
op a
stra
tegi
c pl
an fo
r a p
hase
d im
plem
enta
tion
resp
onse
to a
chie
ve e
ither
avo
idan
ce o
r red
uctio
n of
sea
leve
l ris
e im
pact
s to
prop
erty
, inf
rast
ruct
ure,
cul
tura
l and
na
tura
l res
ourc
es.
DPW
, OPZ
, O
EM
1Es
tabl
ish
polic
ies t
o gu
ide
the
relo
catio
n, e
xten
sion
or
expa
nsio
n of
pub
lic in
fras
truct
ure
in a
t-ris
k ar
eas.
DPW
, OPZ
2C
ontin
ue to
par
ticip
ate
in re
gion
al p
lann
ing
effo
rts to
m
onito
r and
pro
tect
gro
undw
ater
reso
urce
s. D
PW, D
OH
2C
ontin
ue a
sses
smen
t of w
ater
qua
lity
prob
lem
are
as.
DPW
, DO
H
3Im
prov
e ed
ucat
iona
l eff
orts
for w
ater
con
serv
atio
n.D
PW
2C
ontin
ue to
eva
luat
e al
tern
ativ
es a
t Wat
er R
ecla
mat
ion
Faci
litie
s tha
t will
redi
rect
exi
stin
g an
d fu
ture
flow
s to
serv
ice
area
s whe
re fa
cilit
y si
tes c
an b
est s
uppo
rt fu
ture
up
grad
es a
nd m
eet c
apac
ity d
eman
ds a
nd p
erm
it re
quire
men
ts.
DPW
3D
evel
op a
nd im
plem
ent a
mul
ti-fa
cete
d ap
proa
ch to
ed
ucat
ion
and
prom
otio
n of
recy
clin
g w
ithin
the
Cou
nty
to
conv
ey th
e im
porta
nce
as it
rela
tes t
o th
e pr
eser
vatio
n of
na
tura
l res
ourc
es a
nd th
e C
ount
y’s l
andf
ill.
DPW
2C
ontin
ue to
pro
mot
e an
d ex
pand
reco
very
of r
ecyc
labl
es a
t th
e la
ndfil
l and
con
veni
ence
cen
ters
.D
PW
2M
axim
ize
exis
ting
land
fill c
apac
ity th
roug
h ef
ficie
nt
oper
atio
n.D
PW
3Fo
r fut
ure
unde
velo
ped
disp
osal
are
as, e
valu
ate
new
en
gine
erin
g te
chno
logi
es a
nd o
pera
tiona
l tec
hniq
ues t
hat
coul
d le
ad to
exp
ande
d ca
paci
ty a
nd si
te li
fe.
DPW
3Ex
plor
e op
portu
nitie
s to
addr
ess s
olid
was
te d
ispo
sal a
nd
recy
clin
g ne
eds o
n a
regi
onal
bas
is.
DPW
Tabl
e 12
-1
Impl
emen
tati
on S
ched
ule
2009
General
Developent
Plan
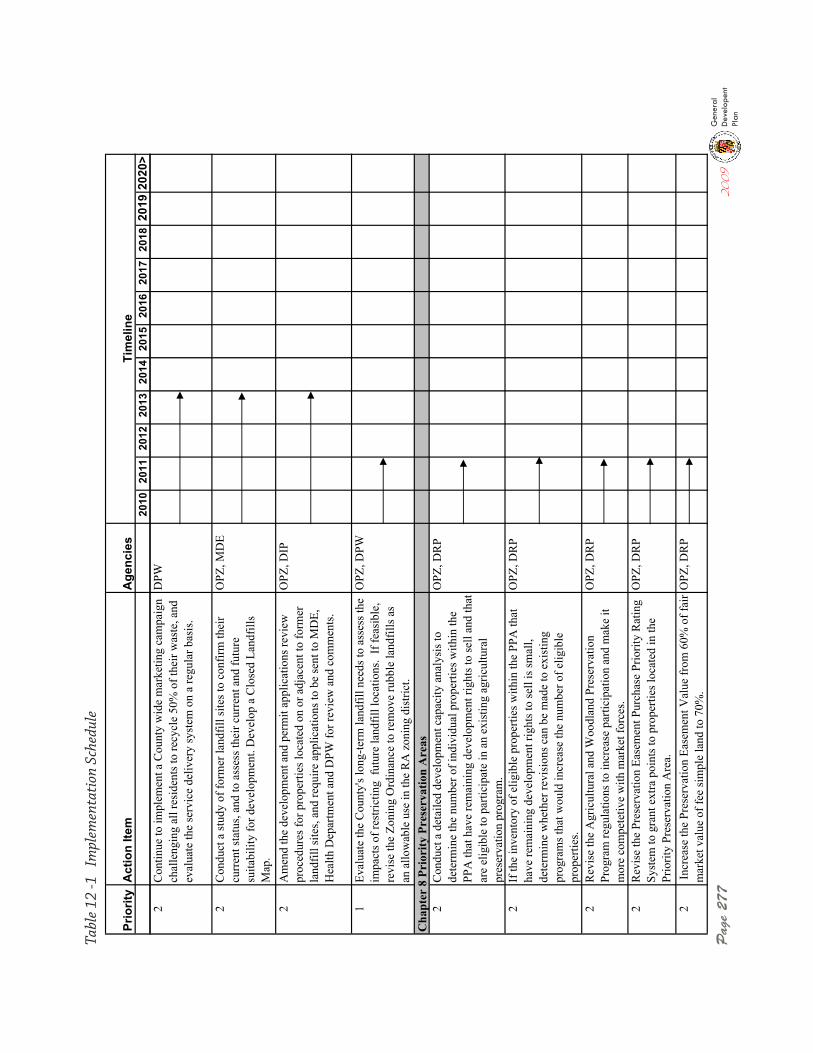
Pag
e 27
720
09General
Developent
Plan
Prio
rity
Act
ion
Item
Age
ncie
s 20
1020
1120
1220
1320
1420
1520
1620
1720
1820
1920
20>
Tim
elin
e
2C
ontin
ue to
impl
emen
t a C
ount
y w
ide
mar
ketin
g ca
mpa
ign
chal
leng
ing
all r
esid
ents
to re
cycl
e 50
% o
f the
ir w
aste
, and
ev
alua
te th
e se
rvic
e de
liver
y sy
stem
on
a re
gula
r bas
is.
DPW
2C
ondu
ct a
stud
y of
form
er la
ndfil
l site
s to
conf
irm th
eir
curr
ent s
tatu
s, an
d to
ass
ess t
heir
curr
ent a
nd fu
ture
su
itabi
lity
for d
evel
opm
ent.
Dev
elop
a C
lose
d La
ndfil
ls
Map
.
OPZ
, MD
E
2A
men
d th
e de
velo
pmen
t and
per
mit
appl
icat
ions
revi
ew
proc
edur
es fo
r pro
perti
es lo
cate
d on
or a
djac
ent t
o fo
rmer
la
ndfil
l site
s, an
d re
quire
app
licat
ions
to b
e se
nt to
MD
E,
Hea
lth D
epar
tmen
t and
DPW
for r
evie
w a
nd c
omm
ents
.
OPZ
, DIP
1Ev
alua
te th
e C
ount
y's l
ong-
term
land
fill n
eeds
to a
sses
s the
im
pact
s of r
estri
ctin
g fu
ture
land
fill l
ocat
ions
. If
feas
ible
, re
vise
the
Zoni
ng O
rdin
ance
to re
mov
e ru
bble
land
fills
as
an a
llow
able
use
in th
e R
A z
onin
g di
stric
t.
OPZ
, DPW
Cha
pter
8 P
rior
ity P
rese
rvat
ion
Are
as2
Con
duct
a d
etai
led
deve
lopm
ent c
apac
ity a
naly
sis t
o de
term
ine
the
num
ber o
f ind
ivid
ual p
rope
rties
with
in th
e PP
A th
at h
ave
rem
aini
ng d
evel
opm
ent r
ight
s to
sell
and
that
ar
e el
igib
le to
par
ticip
ate
in a
n ex
istin
g ag
ricul
tura
l pr
eser
vatio
npr
ogra
m.
OPZ
, DR
P
2If
the
inve
ntor
y of
elig
ible
pro
perti
es w
ithin
the
PPA
that
ha
ve re
mai
ning
dev
elop
men
t rig
hts t
o se
ll is
smal
l, de
term
ine
whe
ther
revi
sion
s can
be
mad
e to
exi
stin
g pr
ogra
ms t
hat w
ould
incr
ease
the
num
ber o
f elig
ible
pr
oper
ties.
OPZ
, DR
P
2R
evis
e th
e A
gric
ultu
ral a
nd W
oodl
and
Pres
erva
tion
Prog
ram
regu
latio
ns to
incr
ease
par
ticip
atio
n an
d m
ake
it m
ore
com
pete
tive
with
mar
ket f
orce
s.
OPZ
, DR
P
2R
evis
e th
e Pr
eser
vatio
n Ea
sem
ent P
urch
ase
Prio
rity
Rat
ing
Syst
em to
gra
nt e
xtra
poi
nts t
o pr
oper
ties l
ocat
ed in
the
Prio
rity
Pres
erva
tion
Are
a.
OPZ
, DR
P
2 In
crea
se th
e Pr
eser
vatio
n Ea
sem
ent V
alue
from
60%
of f
air
mar
ket v
alue
of f
ee si
mpl
e la
nd to
70%
. O
PZ, D
RP
Tabl
e 12
-1
Impl
emen
tati
on S
ched
ule
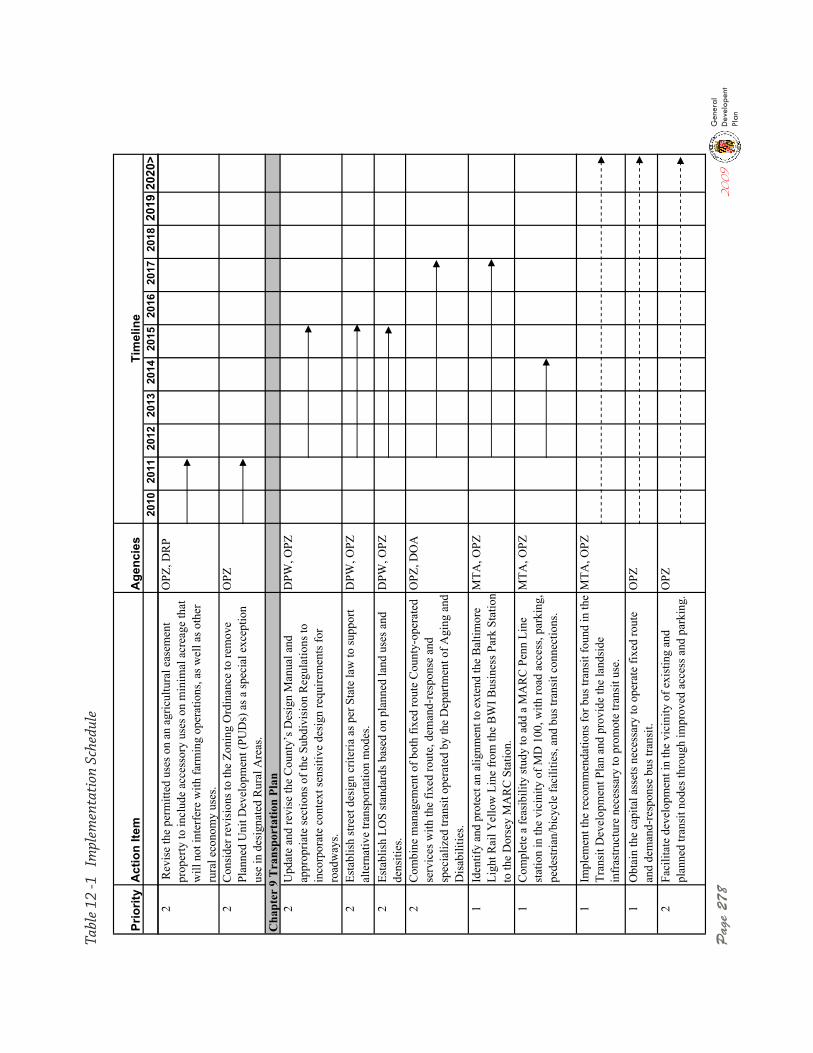
Pag
e 27
8
Prio
rity
Act
ion
Item
Age
ncie
s 20
1020
1120
1220
1320
1420
1520
1620
1720
1820
1920
20>
Tim
elin
e
2 R
evis
e th
e pe
rmitt
ed u
ses o
n an
agr
icul
tura
l eas
emen
t pr
oper
ty to
incl
ude
acce
ssor
y us
es o
n m
inim
al a
crea
ge th
at
will
not
inte
rfer
e w
ith fa
rmin
g op
erat
ions
, as w
ell a
s oth
er
rura
l eco
nom
y us
es.
OPZ
, DR
P
2C
onsi
der r
evis
ions
to th
e Zo
ning
Ord
inan
ce to
rem
ove
Plan
ned
Uni
t Dev
elop
men
t (PU
Ds)
as a
spec
ial e
xcep
tion
use
in d
esig
nate
d R
ural
Are
as.
OPZ
Cha
pter
9 T
rans
port
atio
n Pl
an2
Upd
ate
and
revi
se th
e C
ount
y’s D
esig
n M
anua
l and
ap
prop
riate
sect
ions
of t
he S
ubdi
visi
on R
egul
atio
ns to
in
corp
orat
e co
ntex
t sen
sitiv
e de
sign
requ
irem
ents
for
road
way
s.
DPW
, OPZ
2Es
tabl
ish
stre
et d
esig
n cr
iteria
as p
er S
tate
law
to su
ppor
t al
tern
ativ
e tra
nspo
rtatio
n m
odes
.D
PW, O
PZ
2Es
tabl
ish
LOS
stan
dard
s bas
ed o
n pl
anne
d la
nd u
ses a
nd
dens
ities
.D
PW, O
PZ
2C
ombi
ne m
anag
emen
t of b
oth
fixed
rout
e C
ount
y-op
erat
ed
serv
ices
with
the
fixed
rout
e, d
eman
d-re
spon
se a
nd
spec
ializ
ed tr
ansi
t ope
rate
d by
the
Dep
artm
ent o
f Agi
ng a
nd
Dis
abili
ties.
OPZ
, DO
A
1Id
entif
y an
d pr
otec
t an
alig
nmen
t to
exte
nd th
e B
altim
ore
Ligh
t Rai
l Yel
low
Lin
e fr
om th
e B
WI B
usin
ess P
ark
Stat
ion
to th
e D
orse
y M
AR
C S
tatio
n.
MTA
, OPZ
1C
ompl
ete
a fe
asib
ility
stud
y to
add
a M
AR
C P
enn
Line
st
atio
n in
the
vici
nity
of M
D 1
00, w
ith ro
ad a
cces
s, pa
rkin
g,
pede
stria
n/bi
cycl
e fa
cilit
ies,
and
bus t
rans
it co
nnec
tions
.
MTA
, OPZ
1Im
plem
ent t
he re
com
men
datio
ns fo
r bus
tran
sit f
ound
in th
e Tr
ansi
t Dev
elop
men
t Pla
n an
d pr
ovid
e th
e la
ndsi
de
infr
astru
ctur
e ne
cess
ary
to p
rom
ote
trans
it us
e.
MTA
, OPZ
1O
btai
n th
e ca
pita
l ass
ets n
eces
sary
to o
pera
te fi
xed
rout
e an
d de
man
d-re
spon
se b
us tr
ansi
t.O
PZ
2Fa
cilit
ate
deve
lopm
ent i
n th
e vi
cini
ty o
f exi
stin
g an
d pl
anne
d tra
nsit
node
s thr
ough
impr
oved
acc
ess a
nd p
arki
ng.
OPZ
Tabl
e 12
-1
Impl
emen
tati
on S
ched
ule
2009
General
Developent
Plan
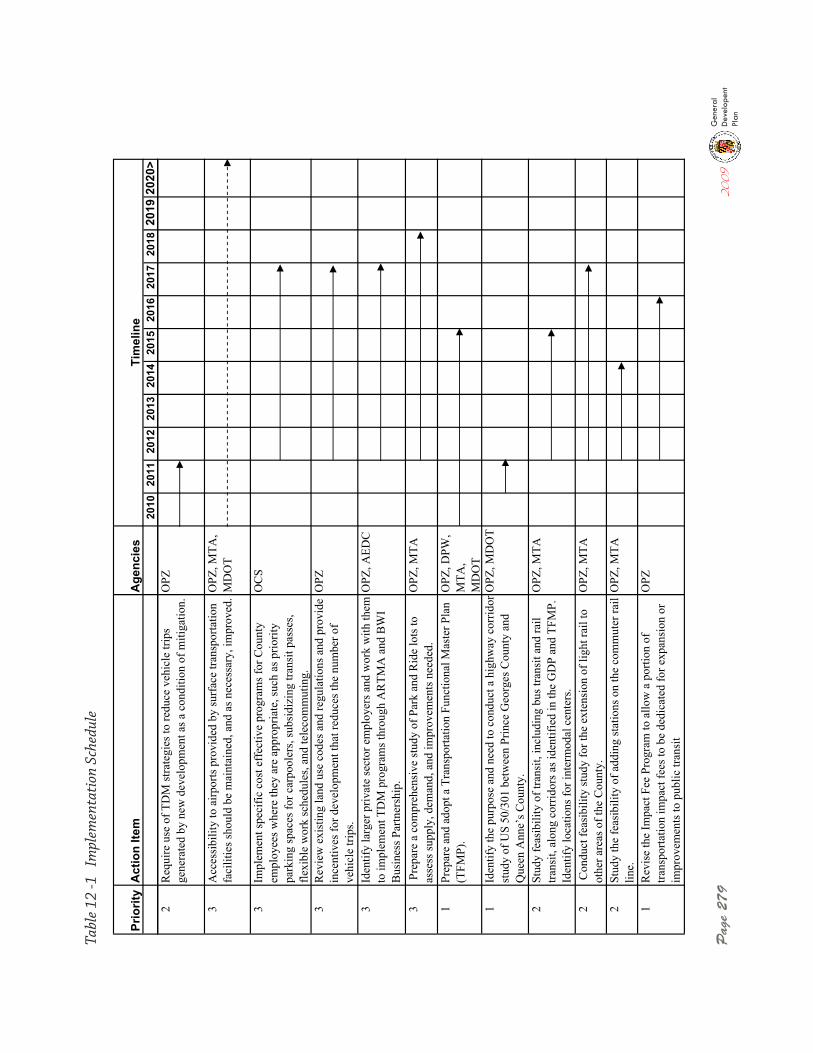
Pag
e 27
920
09General
Developent
Plan
Prio
rity
Act
ion
Item
Age
ncie
s 20
1020
1120
1220
1320
1420
1520
1620
1720
1820
1920
20>
Tim
elin
e
2R
equi
re u
se o
f TD
M st
rate
gies
to re
duce
veh
icle
trip
s ge
nera
ted
by n
ew d
evel
opm
ent a
s a c
ondi
tion
of m
itiga
tion.
OPZ
3A
cces
sibi
lity
to a
irpor
ts p
rovi
ded
by su
rfac
e tra
nspo
rtatio
n fa
cilit
ies s
houl
d be
mai
ntai
ned,
and
as n
eces
sary
, im
prov
ed.
OPZ
, MTA
, M
DO
T
3Im
plem
ent s
peci
fic c
ost e
ffec
tive
prog
ram
s for
Cou
nty
empl
oyee
s whe
re th
ey a
re a
ppro
pria
te, s
uch
as p
riorit
y pa
rkin
g sp
aces
for c
arpo
oler
s, su
bsid
izin
g tra
nsit
pass
es,
flexi
ble
wor
k sc
hedu
les,
and
tele
com
mut
ing.
OC
S
3R
evie
w e
xist
ing
land
use
cod
es a
nd re
gula
tions
and
pro
vide
in
cent
ives
for d
evel
opm
ent t
hat r
educ
es th
e nu
mbe
r of
vehi
cle
trips
.
OPZ
3Id
entif
y la
rger
priv
ate
sect
or e
mpl
oyer
s and
wor
k w
ith th
em
to im
plem
ent T
DM
pro
gram
s thr
ough
AR
TMA
and
BW
I B
usin
ess P
artn
ersh
ip.
OPZ
, AED
C
3 P
repa
re a
com
preh
ensi
ve st
udy
of P
ark
and
Rid
e lo
ts to
as
sess
supp
ly, d
eman
d, a
nd im
prov
emen
ts n
eede
d.O
PZ, M
TA
1Pr
epar
e an
d ad
opt a
Tra
nspo
rtatio
n Fu
nctio
nal M
aste
r Pla
n (T
FMP)
.O
PZ, D
PW,
MTA
,M
DO
T1
Iden
tify
the
purp
ose
and
need
to c
ondu
ct a
hig
hway
cor
ridor
st
udy
of U
S 50
/301
bet
wee
n Pr
ince
Geo
rges
Cou
nty
and
Que
en A
nne’
s Cou
nty.
OPZ
, MD
OT
2St
udy
feas
ibili
ty o
f tra
nsit,
incl
udin
g bu
s tra
nsit
and
rail
trans
it, a
long
cor
ridor
s as i
dent
ified
in th
e G
DP
and
TFM
P.Id
entif
y lo
catio
ns fo
r int
erm
odal
cen
ters
.
OPZ
, MTA
2 C
ondu
ct fe
asib
ility
stud
y fo
r the
ext
ensi
on o
f lig
ht ra
il to
ot
her a
reas
of t
he C
ount
y.O
PZ, M
TA
2St
udy
the
feas
ibili
ty o
f add
ing
stat
ions
on
the
com
mut
er ra
il lin
e.O
PZ, M
TA
1R
evis
e th
e Im
pact
Fee
Pro
gram
to a
llow
a p
ortio
n of
tra
nspo
rtatio
n im
pact
fees
to b
e de
dica
ted
for e
xpan
sion
or
impr
ovem
ents
to p
ublic
tran
sit
OPZ
Tabl
e 12
-1
Impl
emen
tati
on S
ched
ule
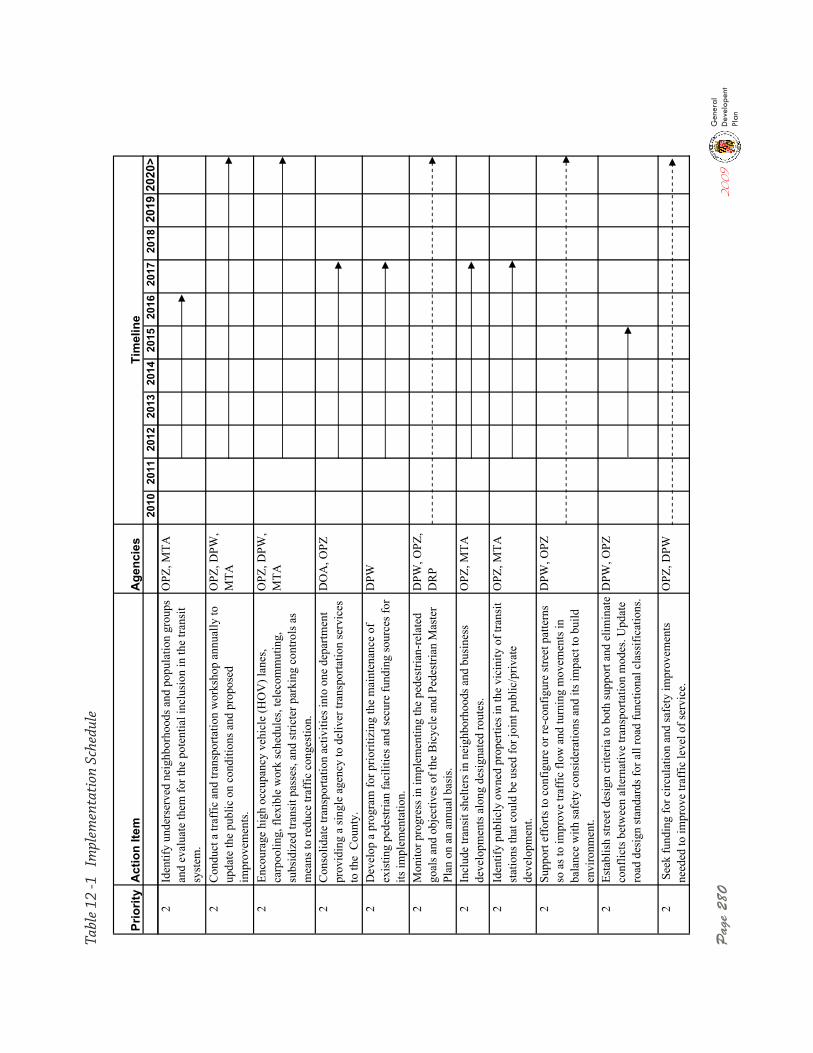
Pag
e 28
0
Prio
rity
Act
ion
Item
Age
ncie
s 20
1020
1120
1220
1320
1420
1520
1620
1720
1820
1920
20>
Tim
elin
e
2Id
entif
y un
ders
erve
d ne
ighb
orho
ods a
nd p
opul
atio
n gr
oups
an
d ev
alua
te th
em fo
r the
pot
entia
l inc
lusi
on in
the
trans
it sy
stem
.
OPZ
, MTA
2C
ondu
ct a
traf
fic a
nd tr
ansp
orta
tion
wor
ksho
p an
nual
ly to
up
date
the
publ
ic o
n co
nditi
ons a
nd p
ropo
sed
impr
ovem
ents
.
OPZ
, DPW
, M
TA
2En
cour
age
high
occ
upan
cy v
ehic
le (H
OV
) lan
es,
carp
oolin
g, fl
exib
le w
ork
sche
dule
s, te
leco
mm
utin
g,
subs
idiz
ed tr
ansi
t pas
ses,
and
stric
ter p
arki
ng c
ontro
ls a
s m
eans
to re
duce
traf
fic c
onge
stio
n.
OPZ
, DPW
, M
TA
2C
onso
lidat
e tra
nspo
rtatio
n ac
tiviti
es in
to o
ne d
epar
tmen
t pr
ovid
ing
a si
ngle
age
ncy
to d
eliv
er tr
ansp
orta
tion
serv
ices
to
the
Cou
nty.
DO
A, O
PZ
2D
evel
op a
pro
gram
for p
riorit
izin
g th
e m
aint
enan
ce o
f ex
istin
g pe
dest
rian
faci
litie
s and
secu
re fu
ndin
g so
urce
s for
its
impl
emen
tatio
n.
DPW
2M
onito
r pro
gres
s in
impl
emen
ting
the
pede
stria
n-re
late
d go
als a
nd o
bjec
tives
of t
he B
icyc
le a
nd P
edes
trian
Mas
ter
Plan
on
an a
nnua
l bas
is.
DPW
, OPZ
, D
RP
2In
clud
e tra
nsit
shel
ters
in n
eigh
borh
oods
and
bus
ines
s de
velo
pmen
ts a
long
des
igna
ted
rout
es.
OPZ
, MTA
2Id
entif
y pu
blic
ly o
wne
d pr
oper
ties i
n th
e vi
cini
ty o
f tra
nsit
stat
ions
that
cou
ld b
e us
ed fo
r joi
nt p
ublic
/priv
ate
deve
lopm
ent.
OPZ
, MTA
2Su
ppor
t eff
orts
to c
onfig
ure
or re
-con
figur
e st
reet
pat
tern
s so
as t
o im
prov
e tra
ffic
flow
and
turn
ing
mov
emen
ts in
ba
lanc
e w
ith sa
fety
con
side
ratio
ns a
nd it
s im
pact
to b
uild
en
viro
nmen
t.
DPW
, OPZ
2Es
tabl
ish
stre
et d
esig
n cr
iteria
to b
oth
supp
ort a
nd e
limin
ate
conf
licts
bet
wee
n al
tern
ativ
e tra
nspo
rtatio
n m
odes
. Upd
ate
road
des
ign
stan
dard
s for
all
road
func
tiona
l cla
ssifi
catio
ns.
DPW
, OPZ
2 S
eek
fund
ing
for c
ircul
atio
n an
d sa
fety
impr
ovem
ents
ne
eded
to im
prov
e tra
ffic
leve
l of s
ervi
ce.
OPZ
, DPW
Tabl
e 12
-1
Impl
emen
tati
on S
ched
ule
2009
General
Developent
Plan
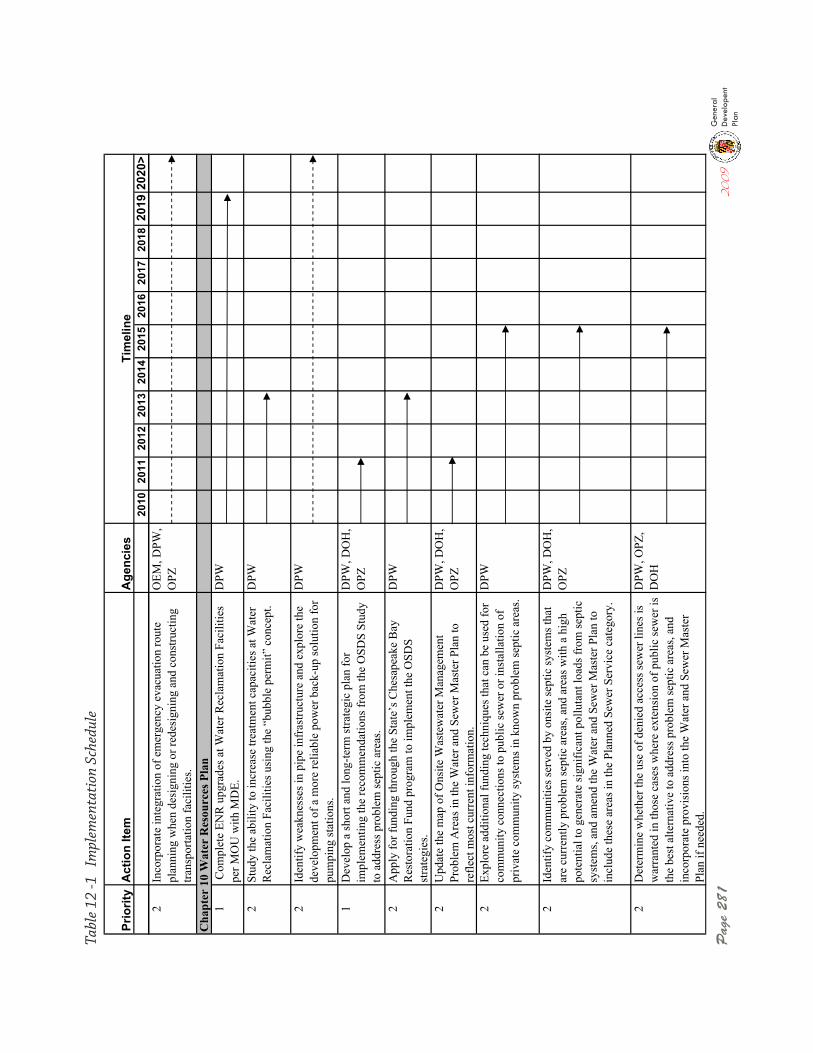
Pag
e 28
120
09General
Developent
Plan
Prio
rity
Act
ion
Item
Age
ncie
s 20
1020
1120
1220
1320
1420
1520
1620
1720
1820
1920
20>
Tim
elin
e
2In
corp
orat
e in
tegr
atio
n of
em
erge
ncy
evac
uatio
n ro
ute
plan
ning
whe
n de
sign
ing
or re
desi
gnin
g an
d co
nstru
ctin
g tra
nspo
rtatio
n fa
cilit
ies.
OEM
, DPW
, O
PZ
Cha
pter
10
Wat
er R
esou
rces
Pla
n1
Com
plet
e EN
R u
pgra
des a
t Wat
er R
ecla
mat
ion
Faci
litie
s pe
r MO
U w
ith M
DE.
DPW
2St
udy
the
abili
ty to
incr
ease
trea
tmen
t cap
aciti
es a
t Wat
er
Rec
lam
atio
n Fa
cilit
ies u
sing
the
“bub
ble
perm
it” c
once
pt.
DPW
2Id
entif
y w
eakn
esse
s in
pipe
infr
astru
ctur
e an
d ex
plor
e th
e de
velo
pmen
t of a
mor
e re
liabl
e po
wer
bac
k-up
solu
tion
for
pum
ping
stat
ions
.
DPW
1D
evel
op a
shor
t and
long
-term
stra
tegi
c pl
an fo
r im
plem
entin
g th
e re
com
men
datio
ns fr
om th
e O
SDS
Stud
y to
add
ress
pro
blem
sept
ic a
reas
.
DPW
, DO
H,
OPZ
2A
pply
for f
undi
ng th
roug
h th
e St
ate’
s Che
sape
ake
Bay
R
esto
ratio
n Fu
nd p
rogr
am to
impl
emen
t the
OSD
S st
rate
gies
.
DPW
2U
pdat
e th
e m
ap o
f Ons
ite W
aste
wat
er M
anag
emen
t Pr
oble
m A
reas
in th
e W
ater
and
Sew
er M
aste
r Pla
n to
re
flect
mos
t cur
rent
info
rmat
ion.
DPW
, DO
H,
OPZ
2Ex
plor
e ad
ditio
nal f
undi
ng te
chni
ques
that
can
be
used
for
com
mun
ity c
onne
ctio
ns to
pub
lic se
wer
or i
nsta
llatio
n of
pr
ivat
e co
mm
unity
syst
ems i
n kn
own
prob
lem
sept
ic a
reas
.
DPW
2Id
entif
y co
mm
uniti
es se
rved
by
onsi
te se
ptic
syst
ems t
hat
are
curr
ently
pro
blem
sept
ic a
reas
, and
are
as w
ith a
hig
h po
tent
ial t
o ge
nera
te si
gnifi
cant
pol
luta
nt lo
ads f
rom
sept
ic
syst
ems,
and
amen
d th
e W
ater
and
Sew
er M
aste
r Pla
n to
in
clud
e th
ese
area
s in
the
Plan
ned
Sew
er S
ervi
ce c
ateg
ory.
DPW
, DO
H,
OPZ
2D
eter
min
e w
heth
er th
e us
e of
den
ied
acce
ss se
wer
line
s is
war
rant
ed in
thos
e ca
ses w
here
ext
ensi
on o
f pub
lic se
wer
is
the
best
alte
rnat
ive
to a
ddre
ss p
robl
em se
ptic
are
as, a
nd
inco
rpor
ate
prov
isio
ns in
to th
e W
ater
and
Sew
er M
aste
r Pl
an if
nee
ded.
DPW
, OPZ
, D
OH
Tabl
e 12
-1
Impl
emen
tati
on S
ched
ule
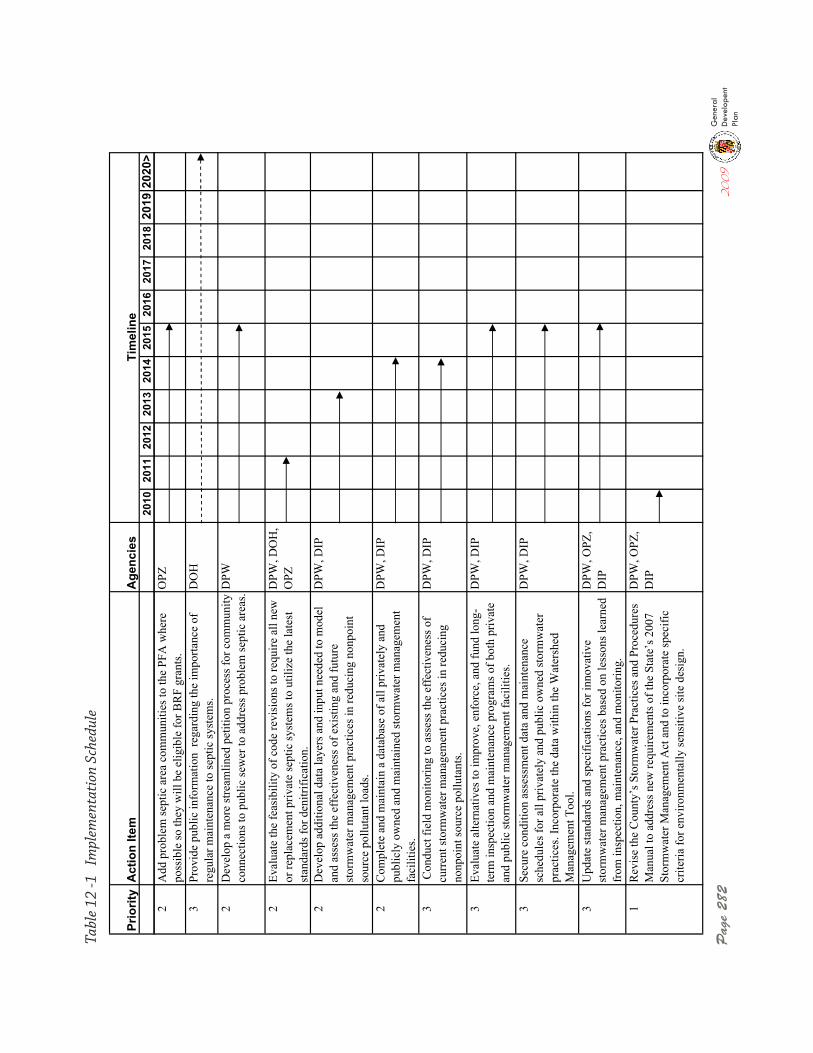
Pag
e 28
2
Prio
rity
Act
ion
Item
Age
ncie
s 20
1020
1120
1220
1320
1420
1520
1620
1720
1820
1920
20>
Tim
elin
e
2A
dd p
robl
em se
ptic
are
a co
mm
uniti
es to
the
PFA
whe
re
poss
ible
so th
ey w
ill b
e el
igib
le fo
r BR
F gr
ants
.O
PZ
3Pr
ovid
e pu
blic
info
rmat
ion
rega
rdin
g th
e im
porta
nce
of
regu
lar m
aint
enan
ce to
sept
ic sy
stem
s.D
OH
2D
evel
op a
mor
e st
ream
lined
pet
ition
pro
cess
for c
omm
unity
co
nnec
tions
to p
ublic
sew
er to
add
ress
pro
blem
sept
ic a
reas
.DPW
2Ev
alua
te th
e fe
asib
ility
of c
ode
revi
sion
s to
requ
ire a
ll ne
w
or re
plac
emen
t priv
ate
sept
ic sy
stem
s to
utili
ze th
e la
test
st
anda
rds f
or d
enitr
ifica
tion.
DPW
, DO
H,
OPZ
2D
evel
op a
dditi
onal
dat
a la
yers
and
inpu
t nee
ded
to m
odel
an
d as
sess
the
effe
ctiv
enes
s of e
xist
ing
and
futu
re
stor
mw
ater
man
agem
ent p
ract
ices
in re
duci
ng n
onpo
int
sour
ce p
ollu
tant
load
s.
DPW
, DIP
2C
ompl
ete
and
mai
ntai
n a
data
base
of a
ll pr
ivat
ely
and
publ
icly
ow
ned
and
mai
ntai
ned
stor
mw
ater
man
agem
ent
faci
litie
s.
DPW
, DIP
3 C
ondu
ct fi
eld
mon
itorin
g to
ass
ess t
he e
ffec
tiven
ess o
f cu
rren
t sto
rmw
ater
man
agem
ent p
ract
ices
in re
duci
ng
nonp
oint
sour
ce p
ollu
tant
s.
DPW
, DIP
3Ev
alua
te a
ltern
ativ
es to
impr
ove,
enf
orce
, and
fund
long
-te
rm in
spec
tion
and
mai
nten
ance
pro
gram
s of b
oth
priv
ate
and
publ
ic st
orm
wat
er m
anag
emen
t fac
ilitie
s.
DPW
, DIP
3Se
cure
con
ditio
n as
sess
men
t dat
a an
d m
aint
enan
ce
sche
dule
s for
all
priv
atel
y an
d pu
blic
ow
ned
stor
mw
ater
pr
actic
es. I
ncor
pora
te th
e da
ta w
ithin
the
Wat
ersh
ed
Man
agem
ent T
ool.
DPW
, DIP
3U
pdat
e st
anda
rds a
nd sp
ecifi
catio
ns fo
r inn
ovat
ive
stor
mw
ater
man
agem
ent p
ract
ices
bas
ed o
n le
sson
s lea
rned
fr
om in
spec
tion,
mai
nten
ance
, and
mon
itorin
g.
DPW
, OPZ
, D
IP
1R
evis
e th
e C
ount
y’s S
torm
wat
er P
ract
ices
and
Pro
cedu
res
Man
ual t
o ad
dres
s new
requ
irem
ents
of t
he S
tate
’s 2
007
Stor
mw
ater
Man
agem
ent A
ct a
nd to
inco
rpor
ate
spec
ific
crite
ria fo
r env
ironm
enta
lly se
nsiti
ve si
te d
esig
n.
DPW
, OPZ
, D
IP
Tabl
e 12
-1
Impl
emen
tati
on S
ched
ule
2009
General
Developent
Plan
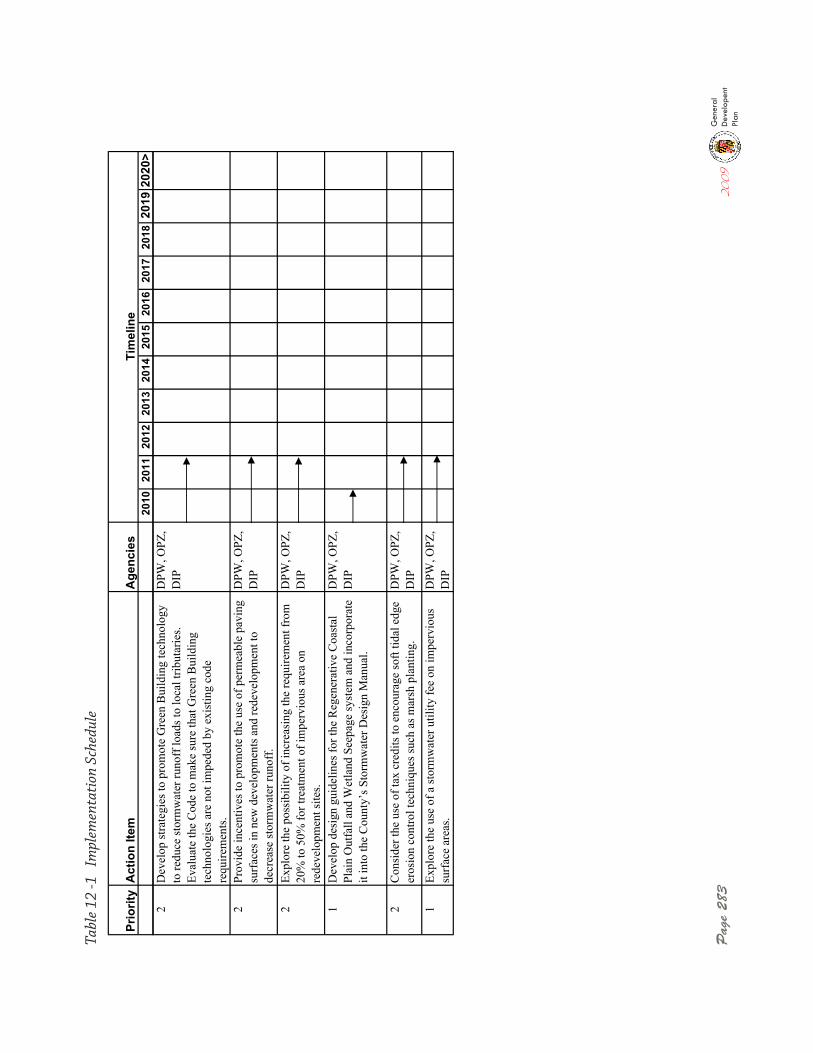
Pag
e 28
320
09General
Developent
Plan
Prio
rity
Act
ion
Item
Age
ncie
s 20
1020
1120
1220
1320
1420
1520
1620
1720
1820
1920
20>
Tim
elin
e
2D
evel
op st
rate
gies
to p
rom
ote
Gre
en B
uild
ing
tech
nolo
gy
to re
duce
stor
mw
ater
runo
ff lo
ads t
o lo
cal t
ribut
arie
s. Ev
alua
te th
e C
ode
to m
ake
sure
that
Gre
en B
uild
ing
tech
nolo
gies
are
not
impe
ded
by e
xist
ing
code
re
quire
men
ts.
DPW
, OPZ
, D
IP
2Pr
ovid
e in
cent
ives
to p
rom
ote
the
use
of p
erm
eabl
e pa
ving
su
rfac
es in
new
dev
elop
men
ts a
nd re
deve
lopm
ent t
o de
crea
se st
orm
wat
er ru
noff
.
DPW
, OPZ
, D
IP
2Ex
plor
e th
e po
ssib
ility
of i
ncre
asin
g th
e re
quire
men
t fro
m
20%
to 5
0% fo
r tre
atm
ent o
f im
perv
ious
are
a on
re
deve
lopm
ent s
ites.
DPW
, OPZ
, D
IP
1D
evel
op d
esig
n gu
idel
ines
for t
he R
egen
erat
ive
Coa
stal
Pl
ain
Out
fall
and
Wet
land
See
page
syst
em a
nd in
corp
orat
e it
into
the
Cou
nty’
s Sto
rmw
ater
Des
ign
Man
ual.
DPW
, OPZ
, D
IP
2C
onsi
der t
he u
se o
f tax
cre
dits
to e
ncou
rage
soft
tidal
edg
e er
osio
n co
ntro
l tec
hniq
ues s
uch
as m
arsh
pla
ntin
g.D
PW, O
PZ,
DIP
1Ex
plor
e th
e us
e of
a st
orm
wat
er u
tility
fee
on im
perv
ious
su
rfac
e ar
eas.
DPW
, OPZ
, D
IP
Tabl
e 12
-1
Impl
emen
tati
on S
ched
ule


Appendix A

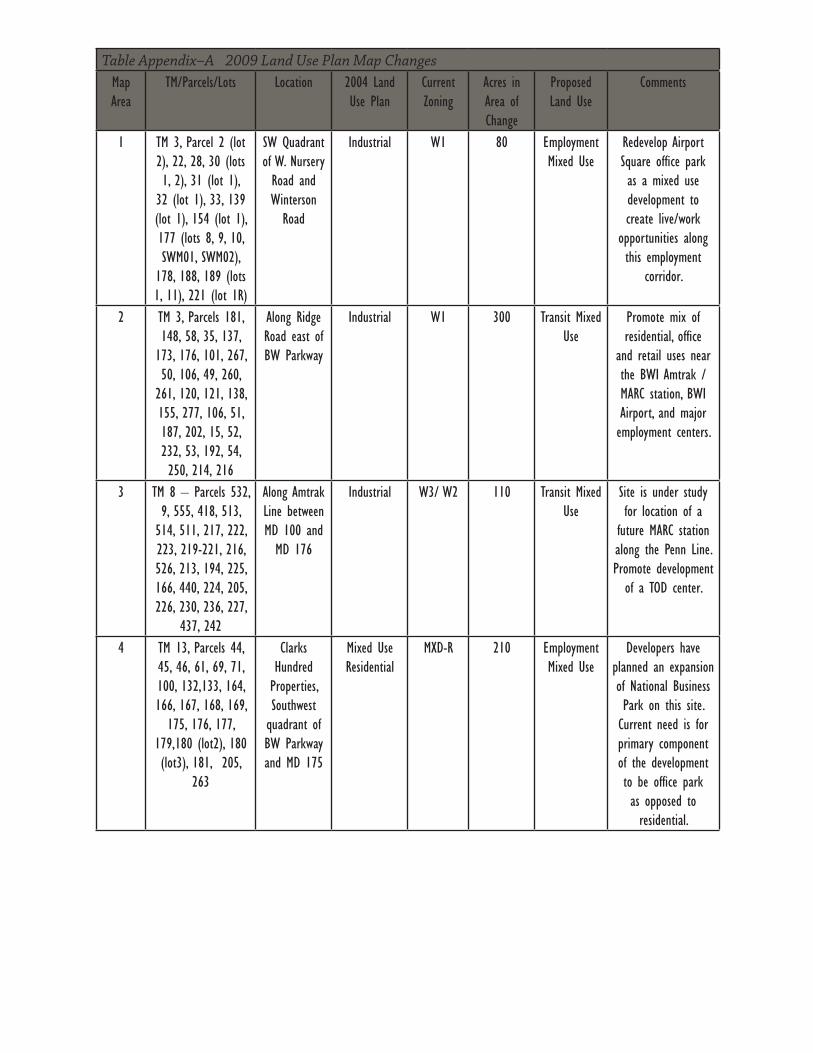
Table Appendix–A 2009 Land Use Plan Map ChangesMap Area
TM/Parcels/Lots Location 2004 Land Use Plan
Current Zoning
Acres in Area of Change
Proposed Land Use
Comments
1 TM 3, Parcel 2 (lot 2), 22, 28, 30 (lots 1, 2), 31 (lot 1),
32 (lot 1), 33, 139 (lot 1), 154 (lot 1), 177 (lots 8, 9, 10, SWM01, SWM02),
178, 188, 189 (lots 1, 11), 221 (lot 1R)
SW Quadrant of W. Nursery Road and Winterson
Road
Industrial W1 80 Employment Mixed Use
Redevelop Airport Square office park as a mixed use development to create live/work
opportunities along this employment
corridor.
2 TM 3, Parcels 181, 148, 58, 35, 137,
173, 176, 101, 267, 50, 106, 49, 260,
261, 120, 121, 138, 155, 277, 106, 51, 187, 202, 15, 52, 232, 53, 192, 54, 250, 214, 216
Along Ridge Road east of BW Parkway
Industrial W1 300 Transit Mixed Use
Promote mix of residential, office
and retail uses near the BWI Amtrak / MARC station, BWI Airport, and major employment centers.
3 TM 8 – Parcels 532, 9, 555, 418, 513,
514, 511, 217, 222, 223, 219-221, 216, 526, 213, 194, 225, 166, 440, 224, 205, 226, 230, 236, 227,
437, 242
Along Amtrak Line between MD 100 and
MD 176
Industrial W3/ W2 110 Transit Mixed Use
Site is under study for location of a
future MARC station along the Penn Line. Promote development
of a TOD center.
4 TM 13, Parcels 44, 45, 46, 61, 69, 71, 100, 132,133, 164, 166, 167, 168, 169,
175, 176, 177, 179,180 (lot2), 180 (lot3), 181, 205,
263
Clarks Hundred Properties, Southwest quadrant of BW Parkway and MD 175
Mixed Use Residential
MXD-R 210 Employment Mixed Use
Developers have planned an expansion of National Business Park on this site. Current need is for primary component of the development to be office park as opposed to residential.
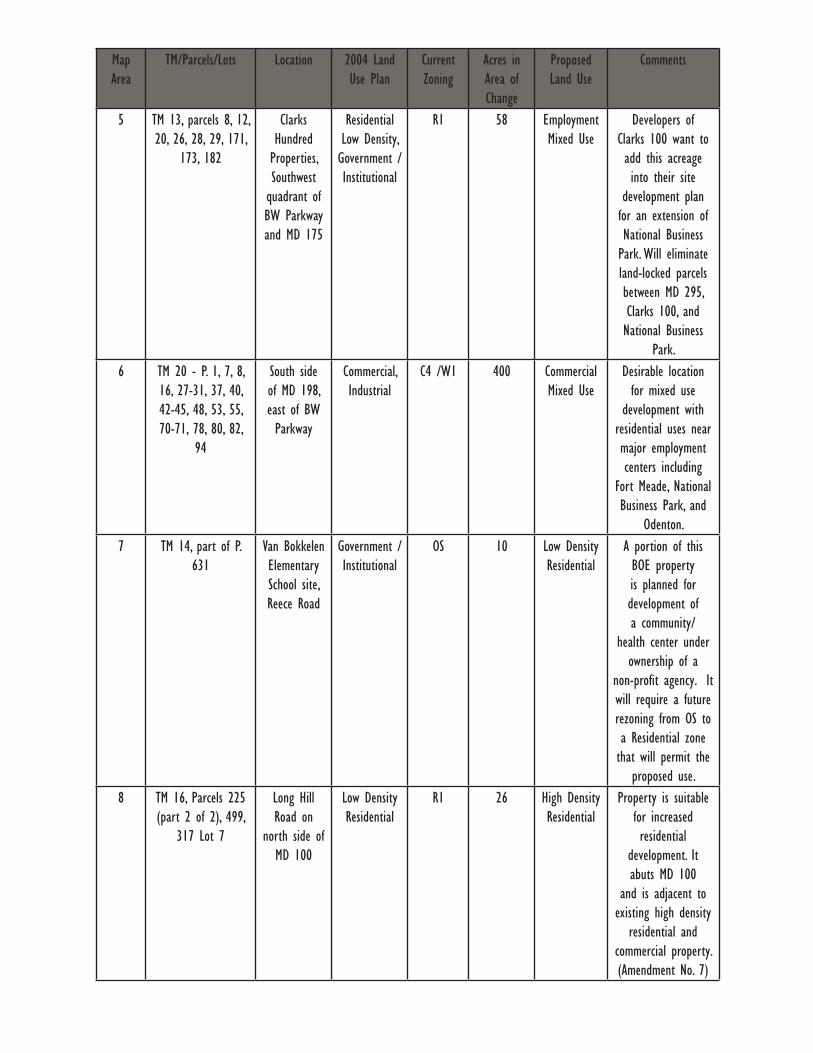
Map Area
TM/Parcels/Lots Location 2004 Land Use Plan
Current Zoning
Acres in Area of Change
Proposed Land Use
Comments
5 TM 13, parcels 8, 12, 20, 26, 28, 29, 171,
173, 182
Clarks Hundred Properties, Southwest quadrant of BW Parkway and MD 175
Residential Low Density, Government / Institutional
R1 58 Employment Mixed Use
Developers of Clarks 100 want to add this acreage into their site
development plan for an extension of National Business Park. Will eliminate land-locked parcels between MD 295, Clarks 100, and National Business
Park.6 TM 20 - P. 1, 7, 8,
16, 27-31, 37, 40, 42-45, 48, 53, 55, 70-71, 78, 80, 82,
94
South side of MD 198, east of BW Parkway
Commercial, Industrial
C4 /W1 400 Commercial Mixed Use
Desirable location for mixed use
development with residential uses near major employment centers including
Fort Meade, National Business Park, and
Odenton.7 TM 14, part of P.
631Van Bokkelen Elementary School site, Reece Road
Government / Institutional
OS 10 Low Density Residential
A portion of this BOE property is planned for development of a community/
health center under ownership of a
non-profit agency. It will require a future rezoning from OS to a Residential zone that will permit the
proposed use.8 TM 16, Parcels 225
(part 2 of 2), 499, 317 Lot 7
Long Hill Road on
north side of MD 100
Low Density Residential
R1 26 High Density Residential
Property is suitable for increased residential
development. It abuts MD 100
and is adjacent to existing high density
residential and commercial property.(Amendment No. 7)
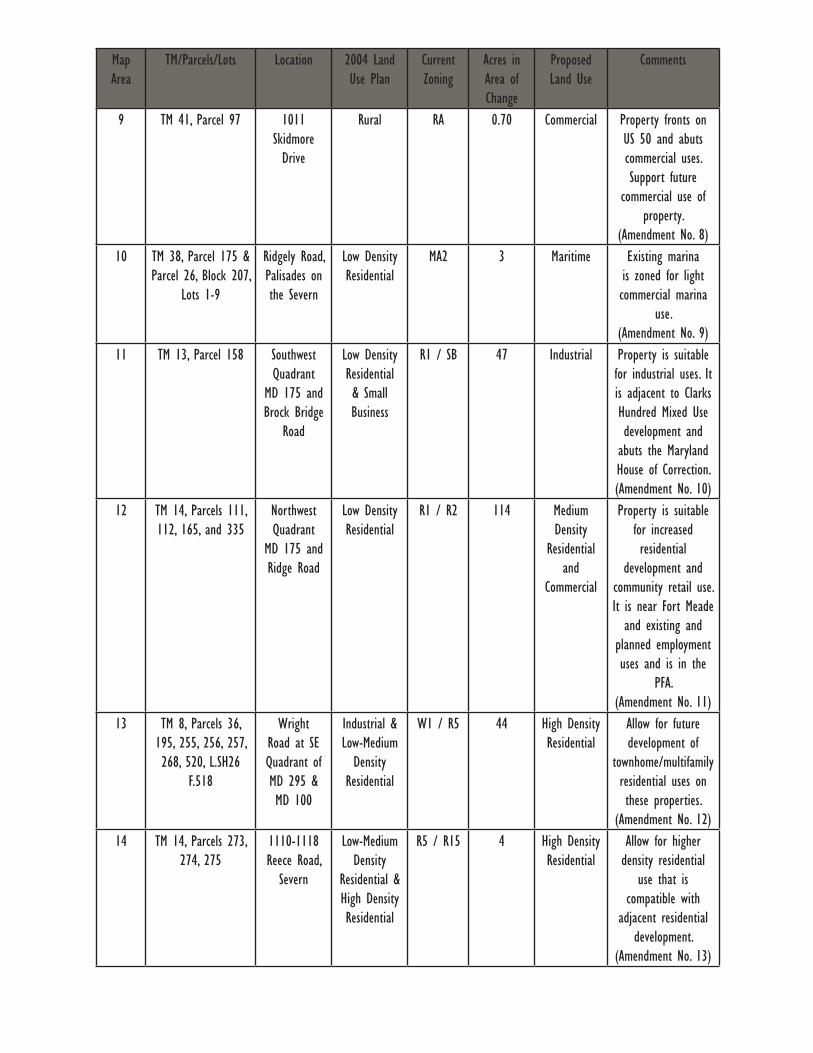
Map Area
TM/Parcels/Lots Location 2004 Land Use Plan
Current Zoning
Acres in Area of Change
Proposed Land Use
Comments
9 TM 41, Parcel 97 1011 Skidmore Drive
Rural RA 0.70 Commercial Property fronts on US 50 and abuts commercial uses. Support future
commercial use of property.
(Amendment No. 8)10 TM 38, Parcel 175 &
Parcel 26, Block 207, Lots 1-9
Ridgely Road, Palisades on the Severn
Low Density Residential
MA2 3 Maritime Existing marina is zoned for light commercial marina
use.(Amendment No. 9)
11 TM 13, Parcel 158 Southwest Quadrant
MD 175 and Brock Bridge
Road
Low Density Residential & Small Business
R1 / SB 47 Industrial Property is suitable for industrial uses. It is adjacent to Clarks Hundred Mixed Use development and
abuts the Maryland House of Correction. (Amendment No. 10)
12 TM 14, Parcels 111, 112, 165, and 335
Northwest Quadrant
MD 175 and Ridge Road
Low Density Residential
R1 / R2 114 Medium Density
Residential and
Commercial
Property is suitable for increased residential
development and community retail use. It is near Fort Meade
and existing and planned employment uses and is in the
PFA.(Amendment No. 11)
13 TM 8, Parcels 36, 195, 255, 256, 257, 268, 520, L.SH26
F.518
Wright Road at SE Quadrant of MD 295 & MD 100
Industrial & Low-Medium
Density Residential
W1 / R5 44 High Density Residential
Allow for future development of
townhome/multifamily residential uses on these properties.
(Amendment No. 12)14 TM 14, Parcels 273,
274, 2751110-1118 Reece Road,
Severn
Low-Medium Density
Residential & High Density Residential
R5 / R15 4 High Density Residential
Allow for higher density residential
use that is compatible with
adjacent residential development.
(Amendment No. 13)
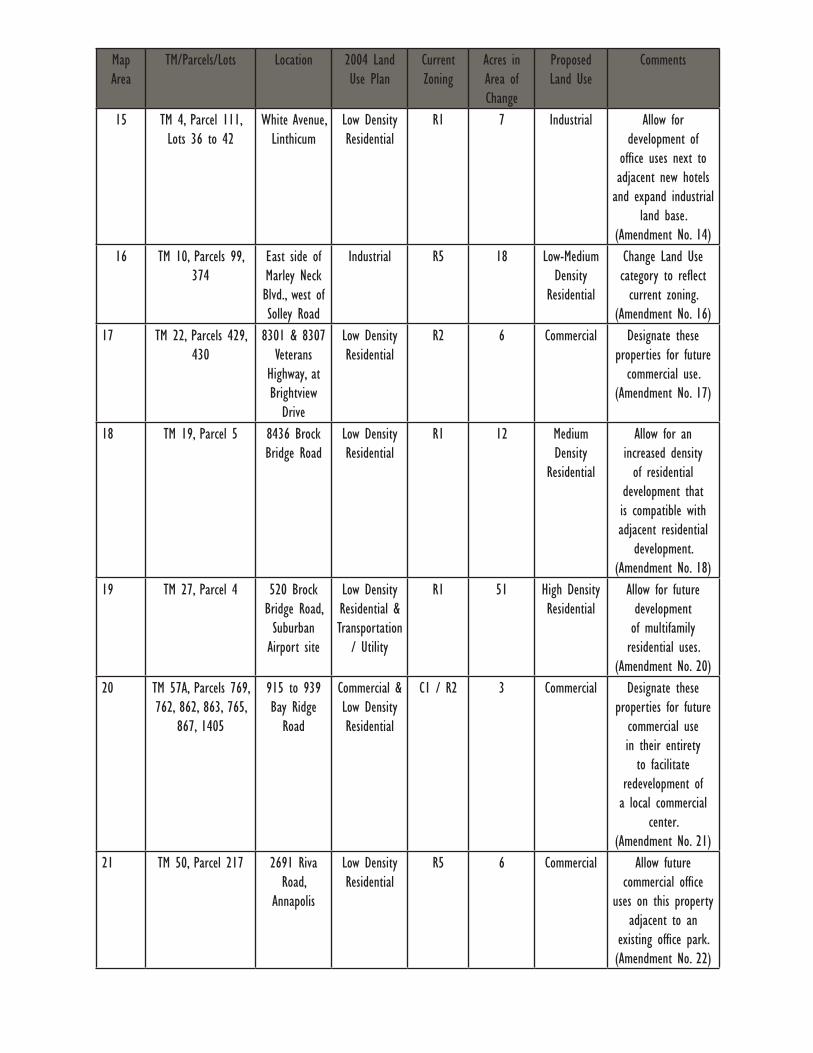
Map Area
TM/Parcels/Lots Location 2004 Land Use Plan
Current Zoning
Acres in Area of Change
Proposed Land Use
Comments
15 TM 4, Parcel 111, Lots 36 to 42
White Avenue, Linthicum
Low Density Residential
R1 7 Industrial Allow for development of
office uses next to adjacent new hotels and expand industrial
land base.(Amendment No. 14)
16 TM 10, Parcels 99, 374
East side of Marley Neck Blvd., west of Solley Road
Industrial R5 18 Low-Medium Density
Residential
Change Land Use category to reflect current zoning.
(Amendment No. 16)17 TM 22, Parcels 429,
4308301 & 8307
Veterans Highway, at Brightview
Drive
Low Density Residential
R2 6 Commercial Designate these properties for future
commercial use.(Amendment No. 17)
18 TM 19, Parcel 5 8436 Brock Bridge Road
Low Density Residential
R1 12 Medium Density
Residential
Allow for an increased density of residential
development that is compatible with adjacent residential
development.(Amendment No. 18)
19 TM 27, Parcel 4 520 Brock Bridge Road, Suburban Airport site
Low Density Residential & Transportation
/ Utility
R1 51 High Density Residential
Allow for future development of multifamily residential uses.
(Amendment No. 20)20 TM 57A, Parcels 769,
762, 862, 863, 765, 867, 1405
915 to 939 Bay Ridge
Road
Commercial & Low Density Residential
C1 / R2 3 Commercial Designate these properties for future
commercial use in their entirety
to facilitate redevelopment of a local commercial
center.(Amendment No. 21)
21 TM 50, Parcel 217 2691 Riva Road,
Annapolis
Low Density Residential
R5 6 Commercial Allow future commercial office
uses on this property adjacent to an
existing office park.(Amendment No. 22)
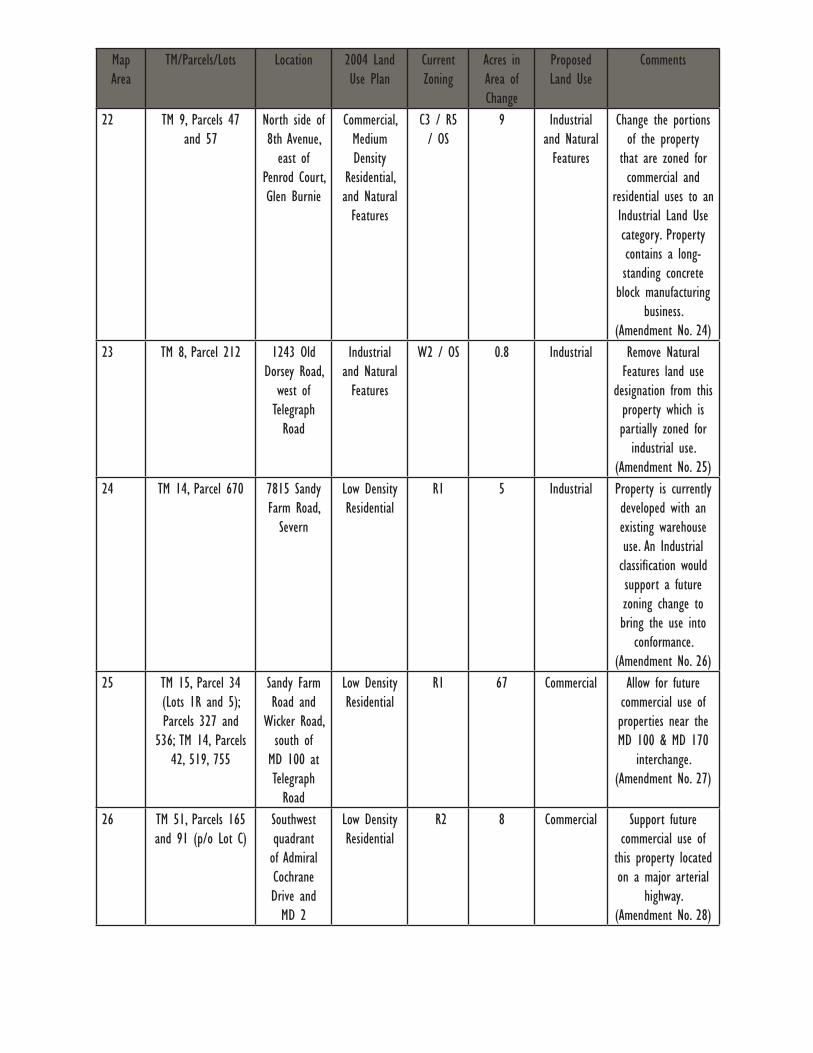
Map Area
TM/Parcels/Lots Location 2004 Land Use Plan
Current Zoning
Acres in Area of Change
Proposed Land Use
Comments
22 TM 9, Parcels 47 and 57
North side of 8th Avenue,
east of Penrod Court, Glen Burnie
Commercial, Medium Density
Residential, and Natural Features
C3 / R5 / OS
9 Industrial and Natural Features
Change the portions of the property
that are zoned for commercial and
residential uses to an Industrial Land Use category. Property contains a long-standing concrete
block manufacturing business.
(Amendment No. 24)23 TM 8, Parcel 212 1243 Old
Dorsey Road, west of Telegraph Road
Industrial and Natural Features
W2 / OS 0.8 Industrial Remove Natural Features land use
designation from this property which is partially zoned for
industrial use.(Amendment No. 25)
24 TM 14, Parcel 670 7815 Sandy Farm Road,
Severn
Low Density Residential
R1 5 Industrial Property is currently developed with an existing warehouse use. An Industrial classification would support a future zoning change to bring the use into
conformance.(Amendment No. 26)
25 TM 15, Parcel 34 (Lots 1R and 5); Parcels 327 and
536; TM 14, Parcels 42, 519, 755
Sandy Farm Road and
Wicker Road, south of
MD 100 at Telegraph Road
Low Density Residential
R1 67 Commercial Allow for future commercial use of properties near the MD 100 & MD 170
interchange.(Amendment No. 27)
26 TM 51, Parcels 165 and 91 (p/o Lot C)
Southwest quadrant of Admiral Cochrane Drive and MD 2
Low Density Residential
R2 8 Commercial Support future commercial use of
this property located on a major arterial
highway.(Amendment No. 28)
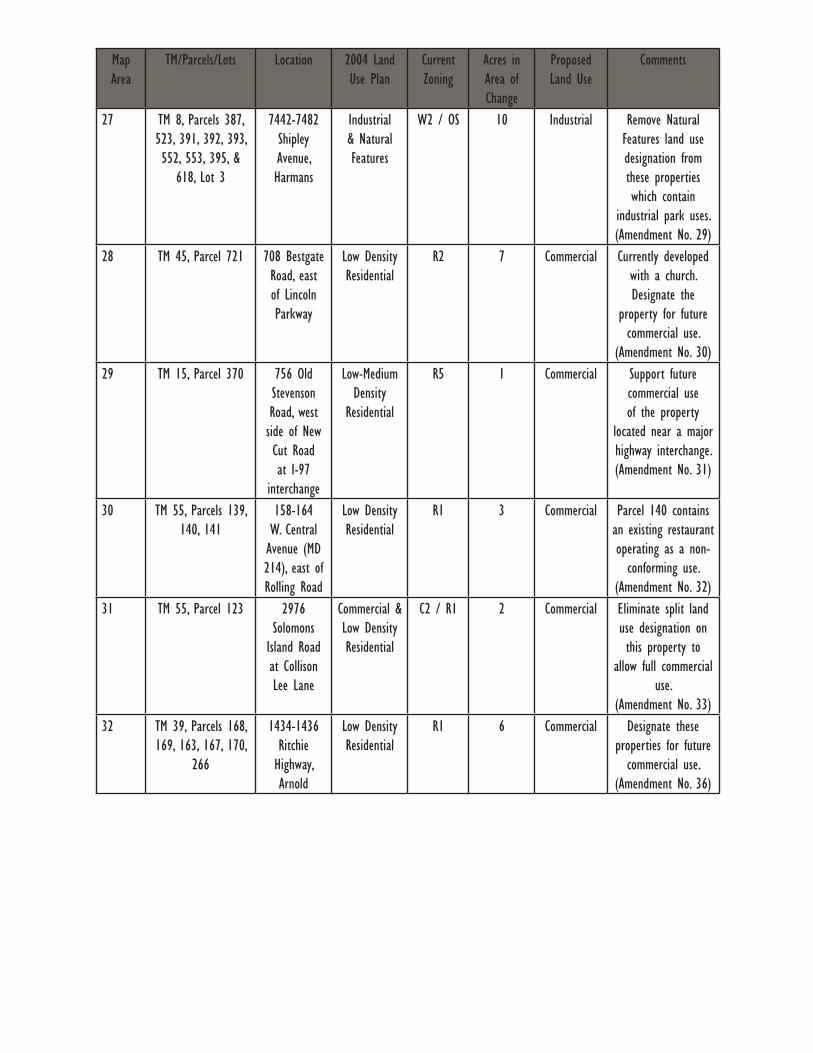
Map Area
TM/Parcels/Lots Location 2004 Land Use Plan
Current Zoning
Acres in Area of Change
Proposed Land Use
Comments
27 TM 8, Parcels 387, 523, 391, 392, 393, 552, 553, 395, &
618, Lot 3
7442-7482 Shipley Avenue, Harmans
Industrial & Natural Features
W2 / OS 10 Industrial Remove Natural Features land use designation from these properties which contain
industrial park uses.(Amendment No. 29)
28 TM 45, Parcel 721 708 Bestgate Road, east of Lincoln Parkway
Low Density Residential
R2 7 Commercial Currently developed with a church. Designate the
property for future commercial use.
(Amendment No. 30)29 TM 15, Parcel 370 756 Old
Stevenson Road, west side of New Cut Road at I-97
interchange
Low-Medium Density
Residential
R5 1 Commercial Support future commercial use of the property
located near a major highway interchange.(Amendment No. 31)
30 TM 55, Parcels 139, 140, 141
158-164 W. Central Avenue (MD 214), east of Rolling Road
Low Density Residential
R1 3 Commercial Parcel 140 contains an existing restaurant operating as a non-
conforming use.(Amendment No. 32)
31 TM 55, Parcel 123 2976 Solomons
Island Road at Collison Lee Lane
Commercial & Low Density Residential
C2 / R1 2 Commercial Eliminate split land use designation on this property to
allow full commercial use.
(Amendment No. 33)32 TM 39, Parcels 168,
169, 163, 167, 170, 266
1434-1436 Ritchie Highway, Arnold
Low Density Residential
R1 6 Commercial Designate these properties for future
commercial use.(Amendment No. 36)