Embed Size (px)
Citation preview
NEW ISSUES Moody’s Investors Service: Aa1
S&P Global Ratings: AAA
$263,655,000 ANNE ARUNDEL COUNTY, MARYLAND
General Obligation Bonds $195,850,000 Consolidated General Improvements Series, 2018
$67,805,000 Consolidated Water and Sewer Series, 2018
Dated: Date of Delivery Due: As shown on the inside front cover The Consolidated General Improvements Series, 2018 and the Consolidated Water and Sewer Series, 2018 (collectively, the “Bonds”) are general obligations of Anne Arundel County, Maryland (the “County”) for the payment of which the County’s full faith and credit and taxing power are irrevocably pledged; however, the Bonds are subject to the limitation on the taxing power set forth in Section 710(d) of the County Charter (See “THE BONDS - Security for and Sources of Payment of the Bonds”). The Bonds will be issued in book-entry form. Purchases of the Bonds will be in the denomination of $5,000 each or any integral multiple thereof. The Bonds will bear interest from the date of delivery, and interest on the Bonds will be payable on October 1 and April 1, commencing October 1, 2018. The Bonds will mature on October 1 in the years and in the amounts set forth on the inside cover of this Official Statement. The Bonds are subject to optional and mandatory sinking fund redemption prior to maturity as set forth in “THE BONDS - Redemption” herein.
_____________________
In the opinion of McKennon Shelton & Henn LLP, Bond Counsel, (i) under existing statutes, regulations
and decisions, the Bonds, their transfer, the interest payable on them, and any income derived from them, including
any profit realized in their sale and exchange, shall be exempt from taxation of any kind by the State of Maryland,
any of its political subdivisions, or any other public entity; no opinion is expressed as to estate or inheritance taxes,
or any other taxes not levied or assessed directly on the Bonds or the interest thereon; and (ii) assuming compliance
with certain covenants described herein, interest on the Bonds will be excludable from gross income for federal
income tax purposes under existing statutes, regulations and decisions. As described herein under “THE BONDS -
Tax Matters,” interest earned on the Bonds, for federal income tax purposes is not included in the alternative
minimum taxable income of individuals as an enumerated item of tax preference or other specific adjustment and
interest earned on the Bonds will be includable in the applicable tax base for the purpose of determining the branch
profits tax imposed on certain foreign corporations.
The Bonds are offered when, as and if issued, subject to the delivery of the Bonds and the approving opinions of McKennon Shelton & Henn LLP, Bond Counsel, and other conditions specified in the Official Notice of Sale. The Bonds in definitive form will be available for delivery in New York, New York through the facilities of the Depository Trust Company and certain closing documents will be available for delivery in Baltimore, Maryland on or about March 29, 2018, or at such time or place as shall be mutually agreed upon by the County and the successful bidder for the Bonds.
The date of this Official Statement is March 20, 2018.
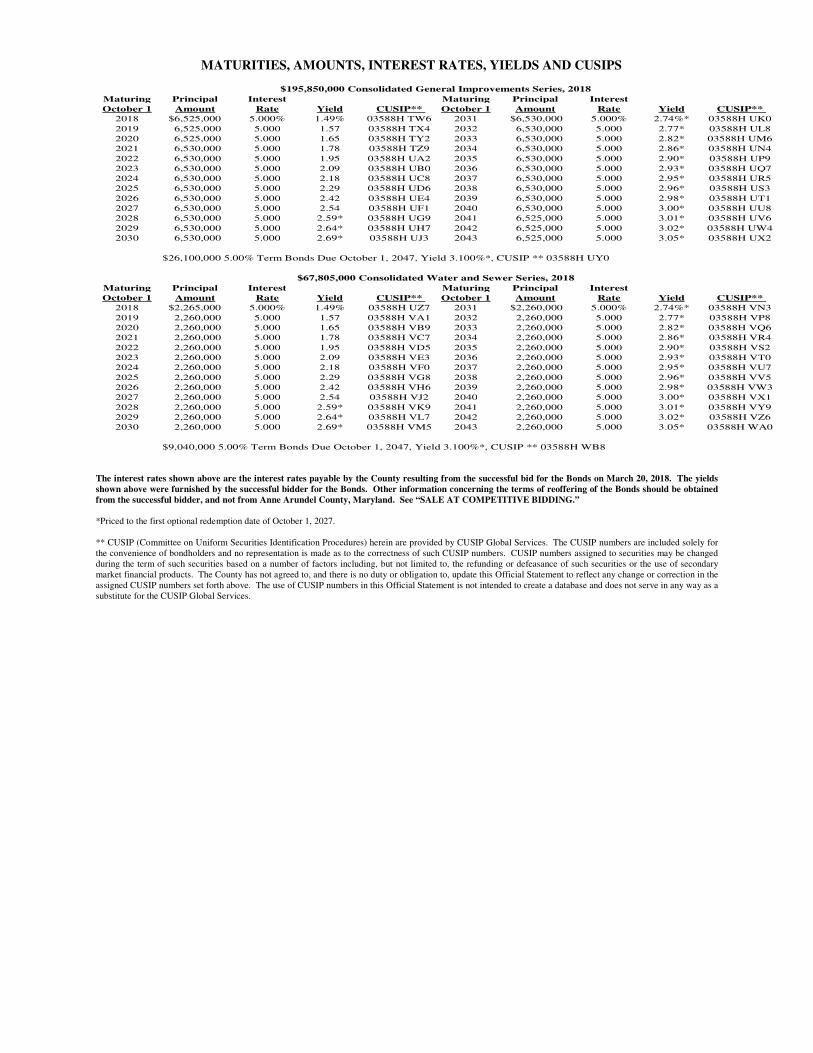
MATURITIES, AMOUNTS, INTEREST RATES, YIELDS AND CUSIPS
Maturing Principal Interest Maturing Principal Interest
October 1 Amount Rate Yield CUSIP** October 1 Amount Rate Yield CUSIP**
2018 $6,525,000 5.000% 1.49% 03588H TW6 2031 $6,530,000 5.000% 2.74%* 03588H UK0
2019 6,525,000 5.000 1.57 03588H TX4 2032 6,530,000 5.000 2.77* 03588H UL8
2020 6,525,000 5.000 1.65 03588H TY2 2033 6,530,000 5.000 2.82* 03588H UM6
2021 6,530,000 5.000 1.78 03588H TZ9 2034 6,530,000 5.000 2.86* 03588H UN4
2022 6,530,000 5.000 1.95 03588H UA2 2035 6,530,000 5.000 2.90* 03588H UP9
2023 6,530,000 5.000 2.09 03588H UB0 2036 6,530,000 5.000 2.93* 03588H UQ7
2024 6,530,000 5.000 2.18 03588H UC8 2037 6,530,000 5.000 2.95* 03588H UR5
2025 6,530,000 5.000 2.29 03588H UD6 2038 6,530,000 5.000 2.96* 03588H US3
2026 6,530,000 5.000 2.42 03588H UE4 2039 6,530,000 5.000 2.98* 03588H UT1
2027 6,530,000 5.000 2.54 03588H UF1 2040 6,530,000 5.000 3.00* 03588H UU8
2028 6,530,000 5.000 2.59* 03588H UG9 2041 6,525,000 5.000 3.01* 03588H UV6
2029 6,530,000 5.000 2.64* 03588H UH7 2042 6,525,000 5.000 3.02* 03588H UW4
2030 6,530,000 5.000 2.69* 03588H UJ3 2043 6,525,000 5.000 3.05* 03588H UX2
Maturing Principal Interest Maturing Principal Interest
October 1 Amount Rate Yield CUSIP** October 1 Amount Rate Yield CUSIP**
2018 $2,265,000 5.000% 1.49% 03588H UZ7 2031 $2,260,000 5.000% 2.74%* 03588H VN3
2019 2,260,000 5.000 1.57 03588H VA1 2032 2,260,000 5.000 2.77* 03588H VP8
2020 2,260,000 5.000 1.65 03588H VB9 2033 2,260,000 5.000 2.82* 03588H VQ6
2021 2,260,000 5.000 1.78 03588H VC7 2034 2,260,000 5.000 2.86* 03588H VR4
2022 2,260,000 5.000 1.95 03588H VD5 2035 2,260,000 5.000 2.90* 03588H VS2
2023 2,260,000 5.000 2.09 03588H VE3 2036 2,260,000 5.000 2.93* 03588H VT0
2024 2,260,000 5.000 2.18 03588H VF0 2037 2,260,000 5.000 2.95* 03588H VU7
2025 2,260,000 5.000 2.29 03588H VG8 2038 2,260,000 5.000 2.96* 03588H VV5
2026 2,260,000 5.000 2.42 03588H VH6 2039 2,260,000 5.000 2.98* 03588H VW3
2027 2,260,000 5.000 2.54 03588H VJ2 2040 2,260,000 5.000 3.00* 03588H VX1
2028 2,260,000 5.000 2.59* 03588H VK9 2041 2,260,000 5.000 3.01* 03588H VY9
2029 2,260,000 5.000 2.64* 03588H VL7 2042 2,260,000 5.000 3.02* 03588H VZ6
2030 2,260,000 5.000 2.69* 03588H VM5 2043 2,260,000 5.000 3.05* 03588H WA0
$195,850,000 Consolidated General Improvements Series, 2018
$67,805,000 Consolidated Water and Sewer Series, 2018
$26,100,000 5.00% Term Bonds Due October 1, 2047, Yield 3.100%*, CUSIP ** 03588H UY0
$9,040,000 5.00% Term Bonds Due October 1, 2047, Yield 3.100%*, CUSIP ** 03588H WB8
The interest rates shown above are the interest rates payable by the County resulting from the successful bid for the Bonds on March 20, 2018. The yields shown above were furnished by the successful bidder for the Bonds. Other information concerning the terms of reoffering of the Bonds should be obtained from the successful bidder, and not from Anne Arundel County, Maryland. See “SALE AT COMPETITIVE BIDDING.” *Priced to the first optional redemption date of October 1, 2027. ** CUSIP (Committee on Uniform Securities Identification Procedures) herein are provided by CUSIP Global Services. The CUSIP numbers are included solely for the convenience of bondholders and no representation is made as to the correctness of such CUSIP numbers. CUSIP numbers assigned to securities may be changed during the term of such securities based on a number of factors including, but not limited to, the refunding or defeasance of such securities or the use of secondary market financial products. The County has not agreed to, and there is no duty or obligation to, update this Official Statement to reflect any change or correction in the assigned CUSIP numbers set forth above. The use of CUSIP numbers in this Official Statement is not intended to create a database and does not serve in any way as a substitute for the CUSIP Global Services.
- iii -
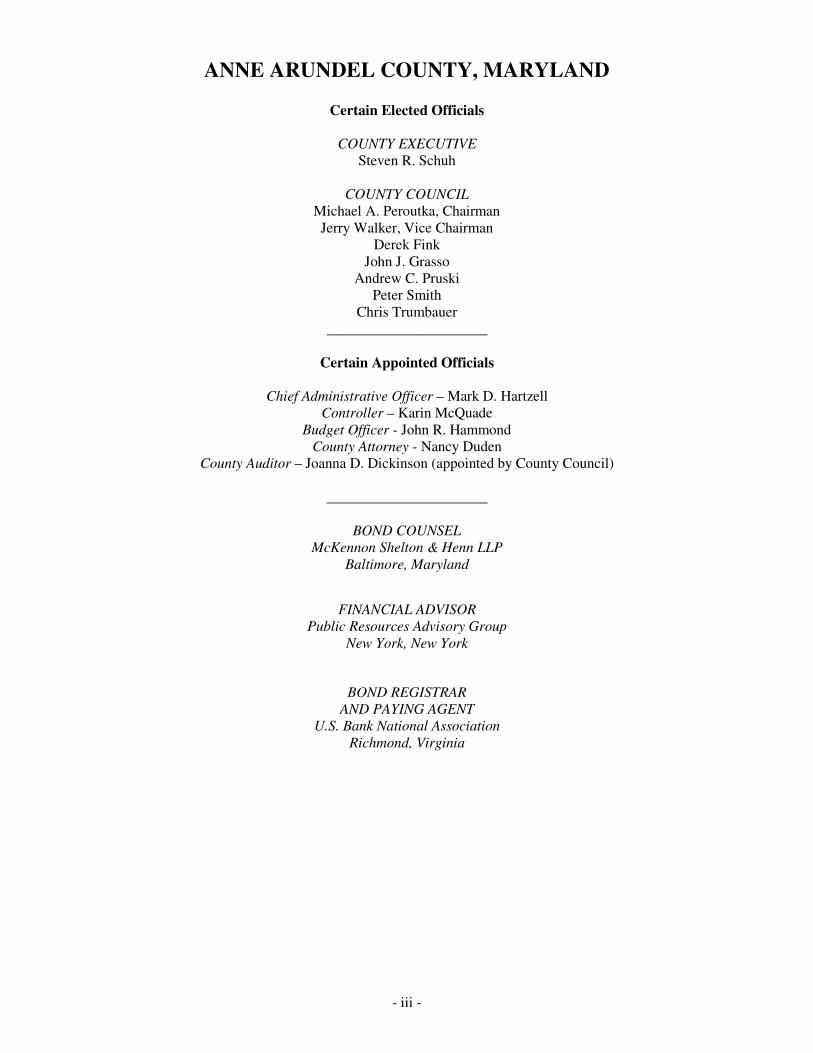
ANNE ARUNDEL COUNTY, MARYLAND
Certain Elected Officials
COUNTY EXECUTIVE
Steven R. Schuh
COUNTY COUNCIL
Michael A. Peroutka, Chairman Jerry Walker, Vice Chairman
Derek Fink John J. Grasso
Andrew C. Pruski Peter Smith
Chris Trumbauer ______________________
Certain Appointed Officials
Chief Administrative Officer – Mark D. Hartzell
Controller – Karin McQuade
Budget Officer - John R. Hammond County Attorney - Nancy Duden
County Auditor – Joanna D. Dickinson (appointed by County Council)
______________________
BOND COUNSEL
McKennon Shelton & Henn LLP
Baltimore, Maryland
FINANCIAL ADVISOR
Public Resources Advisory Group
New York, New York
BOND REGISTRAR
AND PAYING AGENT
U.S. Bank National Association
Richmond, Virginia

- iv -
(This page has been left blank intentionally.)
- v -
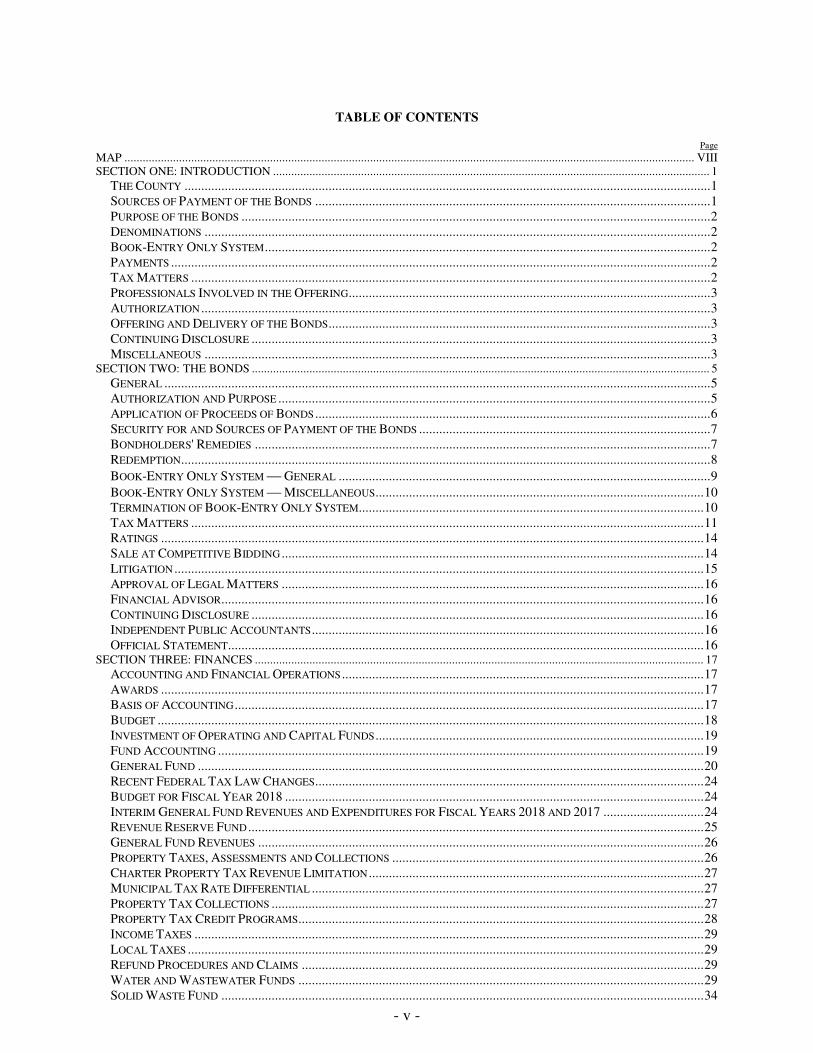
TABLE OF CONTENTS
Page
MAP ............................................................................................................................................................................................ VIII SECTION ONE: INTRODUCTION ................................................................................................................................................ 1
THE COUNTY ............................................................................................................................................................. 1
SOURCES OF PAYMENT OF THE BONDS ...................................................................................................................... 1
PURPOSE OF THE BONDS ............................................................................................................................................ 2
DENOMINATIONS ....................................................................................................................................................... 2
BOOK-ENTRY ONLY SYSTEM ..................................................................................................................................... 2
PAYMENTS ................................................................................................................................................................. 2
TAX MATTERS ........................................................................................................................................................... 2
PROFESSIONALS INVOLVED IN THE OFFERING ............................................................................................................ 3
AUTHORIZATION ........................................................................................................................................................ 3
OFFERING AND DELIVERY OF THE BONDS .................................................................................................................. 3
CONTINUING DISCLOSURE ......................................................................................................................................... 3
MISCELLANEOUS ....................................................................................................................................................... 3
SECTION TWO: THE BONDS ....................................................................................................................................................... 5
GENERAL ................................................................................................................................................................... 5
AUTHORIZATION AND PURPOSE ................................................................................................................................. 5
APPLICATION OF PROCEEDS OF BONDS ...................................................................................................................... 6
SECURITY FOR AND SOURCES OF PAYMENT OF THE BONDS ....................................................................................... 7
BONDHOLDERS' REMEDIES ........................................................................................................................................ 7
REDEMPTION .............................................................................................................................................................. 8
BOOK-ENTRY ONLY SYSTEM GENERAL ............................................................................................................... 9
BOOK-ENTRY ONLY SYSTEM MISCELLANEOUS .................................................................................................. 10
TERMINATION OF BOOK-ENTRY ONLY SYSTEM....................................................................................................... 10
TAX MATTERS ......................................................................................................................................................... 11
RATINGS .................................................................................................................................................................. 14
SALE AT COMPETITIVE BIDDING .............................................................................................................................. 14
LITIGATION .............................................................................................................................................................. 15
APPROVAL OF LEGAL MATTERS .............................................................................................................................. 16
FINANCIAL ADVISOR................................................................................................................................................ 16
CONTINUING DISCLOSURE ....................................................................................................................................... 16
INDEPENDENT PUBLIC ACCOUNTANTS ..................................................................................................................... 16
OFFICIAL STATEMENT .............................................................................................................................................. 16
SECTION THREE: FINANCES .................................................................................................................................................... 17
ACCOUNTING AND FINANCIAL OPERATIONS ............................................................................................................ 17
AWARDS .................................................................................................................................................................. 17
BASIS OF ACCOUNTING ............................................................................................................................................ 17
BUDGET ................................................................................................................................................................... 18
INVESTMENT OF OPERATING AND CAPITAL FUNDS .................................................................................................. 19
FUND ACCOUNTING ................................................................................................................................................. 19
GENERAL FUND ....................................................................................................................................................... 20
RECENT FEDERAL TAX LAW CHANGES .................................................................................................................... 24
BUDGET FOR FISCAL YEAR 2018 ............................................................................................................................. 24
INTERIM GENERAL FUND REVENUES AND EXPENDITURES FOR FISCAL YEARS 2018 AND 2017 .............................. 24
REVENUE RESERVE FUND ........................................................................................................................................ 25
GENERAL FUND REVENUES ..................................................................................................................................... 26
PROPERTY TAXES, ASSESSMENTS AND COLLECTIONS ............................................................................................. 26
CHARTER PROPERTY TAX REVENUE LIMITATION .................................................................................................... 27
MUNICIPAL TAX RATE DIFFERENTIAL ..................................................................................................................... 27
PROPERTY TAX COLLECTIONS ................................................................................................................................. 27
PROPERTY TAX CREDIT PROGRAMS ......................................................................................................................... 28
INCOME TAXES ........................................................................................................................................................ 29
LOCAL TAXES .......................................................................................................................................................... 29
REFUND PROCEDURES AND CLAIMS ........................................................................................................................ 29
WATER AND WASTEWATER FUNDS ......................................................................................................................... 29
SOLID WASTE FUND ................................................................................................................................................ 34
- vi -
PENSION PLANS ....................................................................................................................................................... 36
OTHER POST-EMPLOYMENT BENEFITS .................................................................................................................... 38
RECENT DEVELOPMENTS ......................................................................................................................................... 39
SECTION FOUR: INDEBTEDNESS ............................................................................................................................................ 41
GENERAL ................................................................................................................................................................. 41
NO SHORT-TERM OPERATING DEBT ........................................................................................................................ 41
TAX SUPPORTED DEBT ............................................................................................................................................ 41
CHARTER PROPERTY TAX REVENUE LIMITATION .................................................................................................... 42
BONDS AUTHORIZED AND UNISSUED ....................................................................................................................... 42
OVERLAPPING DEBT ................................................................................................................................................ 43
MARYLAND WATER QUALITY DEBT ........................................................................................................................ 43
SPECIAL TAX DISTRICT FINANCING ......................................................................................................................... 43
TAX INCREMENT FINANCING ................................................................................................................................... 43
SPECIAL COMMUNITY BENEFIT DISTRICT DEBT ...................................................................................................... 43
REVENUE AUTHORITY ............................................................................................................................................. 44
PUBLIC SCHOOL FINANCING .................................................................................................................................... 44
ECONOMIC DEVELOPMENT REVENUE BONDS .......................................................................................................... 44
STATEMENT OF LEGAL DEBT MARGIN ..................................................................................................................... 45
CERTAIN DEBT RATIOS ............................................................................................................................................ 45
ENTERPRISE FUNDS DEBT ........................................................................................................................................ 46
SCHEDULE OF DEBT SERVICE REQUIREMENTS FOR LONG-TERM OBLIGATIONS ...................................................... 48
COUNTY DEBT POLICIES .......................................................................................................................................... 51
FINANCING PLANS ................................................................................................................................................... 53
CAPITAL APPROPRIATIONS AND FUNDING SOURCES ................................................................................................ 53
SECTION FIVE: ECONOMIC AND DEMOGRAPHIC INFORMATION .................................................................................. 55
DESCRIPTION AND GOVERNMENT ............................................................................................................................ 55
POPULATION ............................................................................................................................................................ 55
INCOME .................................................................................................................................................................... 56
EMPLOYMENT BASE ................................................................................................................................................. 58
LARGEST EMPLOYERS .............................................................................................................................................. 59
EMPLOYMENT .......................................................................................................................................................... 59
NEW BUSINESS ADDITION AND EXPANSION HIGHLIGHTS FISCAL YEAR 2017 ......................................................... 60
ECONOMIC DEVELOPMENT PROJECTS ...................................................................................................................... 60
ECONOMIC DEVELOPMENT INITIATIVES ................................................................................................................... 62
TRANSPORTATION .................................................................................................................................................... 62
TOURISM .................................................................................................................................................................. 65
HOUSING .................................................................................................................................................................. 65
CONSTRUCTION ACTIVITY ....................................................................................................................................... 67
SECTION SIX: COUNTY ADMINISTRATION .......................................................................................................................... 69
GENERAL ................................................................................................................................................................. 69
GOVERNMENTAL ORGANIZATION OF ANNE ARUNDEL COUNTY .............................................................................. 70
COUNTY EXECUTIVE, CERTAIN APPOINTED AND LEGISLATIVE OFFICIALS .............................................................. 71
LABOR RELATIONS .................................................................................................................................................. 74
SECTION SEVEN: SERVICES AND FACILITIES ..................................................................................................................... 77
EDUCATION .............................................................................................................................................................. 77
HIGHER EDUCATION ................................................................................................................................................ 77
PUBLIC SAFETY ........................................................................................................................................................ 77
UTILITIES ................................................................................................................................................................. 78
TELECOMMUNICATIONS ........................................................................................................................................... 78
MEDICAL AND HEALTH SERVICES ........................................................................................................................... 78
PLANNING AND ZONING ........................................................................................................................................... 79
PUBLIC WORKS ........................................................................................................................................................ 80
WATER AND WASTEWATER ..................................................................................................................................... 80
SOLID WASTE MANAGEMENT .................................................................................................................................. 81
RECREATION AND PARKS ......................................................................................................................................... 82
INSURANCE .............................................................................................................................................................. 82
SECTION EIGHT: APPROVAL OF OFFICIAL STATEMENT .................................................................................................. 85
Appendix A Basic Financial Statements ............................................................................................................................................... A-1 Appendix B
- vii -
Official Notice of Sale for Bonds ..................................................................................................................................... B-1 Appendix C Forms of Opinions of Bond Counsel................................................................................................................................. C-1 Appendix D Form of Continuing Disclosure Agreement ...................................................................................................................... D-1 Appendix E Form of Issue Price Certificate for Qualified Competitive Bid .......................................................................................... E-1 Appendix F Form of Issue Price Certificate for Nonqualified Competitive Bid .................................................................................... F-1
No dealer, broker, salesman or other person has been authorized by the County or the successful bidder for the Bonds to give any information or to make any representation other than those contained in this Official Statement, and, if given or made, such other information or representation must not be relied upon as having been authorized by any of the foregoing. This Official Statement does not constitute an offer to sell or the solicitation of an offer to buy, nor shall there be any sale of the Bonds by any person in any jurisdiction in which it is unlawful for such person to make such an offer, solicitation or sale. This Official Statement is not to be construed as a contract or agreement between the County and the purchasers or holders of any of the Bonds. All quotations from and summaries and explanations of provisions of law and documents herein do not purport to be complete and reference is made to such laws and documents for full and complete statements of these provisions. Any statements made in this Official Statement involving estimates or matters of opinion, whether or not expressly so stated, are intended merely as estimates or opinion and not as representations of fact. The information and expressions of opinion herein are subject to change without notice and neither the delivery of this Official Statement nor any sale made hereunder shall, under any circumstances, create any implications that there has been no change in the affairs of the County since the respective dates as of which information is given herein. The information set forth herein has been obtained from the County and other sources that are deemed to be reliable but is not guaranteed as to accuracy or completeness by, and is not to be construed as a representation of, the successful bidder for the Bonds.
The Official Statement contains statements which, to the extent they are not recitations of historical fact,
constitute "forward-looking statements." In this respect, the words "estimate," "project," "anticipate," "expect," "intend," "believe" and similar expressions are intended to identify forward-looking statements. A number of important factors affecting the County and financial results could cause actual results to differ materially from those stated in the forward-looking statements. The County does not plan to issue any updates or revisions to the forward-looking statements.
The order and placement of materials in this Official Statement, including the appendices hereto and the information incorporated herein by reference, are not to be deemed to be a determination of relevance, materiality or importance, and this Official Statement, including the appendices and the information incorporated herein by reference, must be considered in its entirety. The offering of Bonds is made only by means of this entire Official Statement.

- 1 -
ANNE ARUNDEL COUNTY, MARYLAND OFFICIAL STATEMENT
_____________________
$263,655,000
GENERAL OBLIGATION BONDS
$195,850,000 Consolidated General Improvements Series, 2018 $67,805,000 Consolidated Water and Sewer Series, 2018
_____________________
SECTION ONE: INTRODUCTION The purpose of this Official Statement, which includes the cover page and appendices hereto, is to provide certain information with respect to the issuance by Anne Arundel County, Maryland (the “County” or “Anne Arundel County”) of its $263,655,000 aggregate principal amount of General Obligation Bonds, consisting of $195,850,000 Consolidated General Improvements Series, 2018 (the “Consolidated General Improvements Bonds”) and $67,805,000 Consolidated Water and Sewer Series, 2018, (the “Consolidated Water and Sewer Bonds”). The Consolidated General Improvements Bonds and the Consolidated Water and Sewer Bonds are together referred to herein as the “Bonds”. This introduction is not a summary of this Official Statement. It is only a brief description of and guide to,
the Official Statement, and is qualified by, more complete and detailed information contained in the entire Official
Statement, including the cover page and appendices hereto, and the documents summarized or described herein. A
full review should be made of the entire Official Statement. The offering of Bonds to potential investors is made only
by means of the entire Official Statement.
The County The County is a political subdivision of the State of Maryland (also referred to herein as the “State”), located thirteen miles east of Washington, D.C. with Baltimore City and Baltimore County as its northern boundary and the Chesapeake Bay as its entire eastern boundary. The County has been under home rule charter since 1965. For more complete information, see “ECONOMIC AND DEMOGRAPHIC INFORMATION - Description and Government” herein. Sources of Payment of the Bonds The Bonds are general obligations of the County for the payment of which the County’s full faith and credit and taxing power are irrevocably pledged, subject to the limitation on the taxing power set forth in Section 710(d) of the County Charter (the “Charter” or the “County Charter”). See “THE BONDS - Security for and Sources of Payment of the Bonds” herein. The maturing principal of and interest on the Consolidated General Improvements Bonds will be paid from time to time, as and when due, from the funds in the hands of the County realized from the collection of ad valorem taxes on real estate, tangible personal property and intangible personal property subject to taxation by the County. The County has covenanted that, to the extent that the required appropriation for debt service on the Consolidated General Improvements Bonds is not offset by funds from other sources, it will, subject to the limitation on the taxing power set forth in Section 710(d) of the County Charter, fund any such appropriation by the levy of ad valorem taxes on real estate, tangible personal property and intangible personal property subject to taxation by the County, and in addition, upon such other intangible property as may be subject to taxation by the County within the limitations prescribed by law. The maturing principal of and interest on the Consolidated Water and Sewer Bonds will be paid from time to time, as and when due, from the funds in the hands of the County realized from the net revenues of the projects for which such bonds are issued, or the utilities for which these improvements are a part. The County has covenanted to fix and collect rates, charges and assessments sufficient to pay the cost of operations, maintenance,
- 2 -
and debt service. In the event of a deficiency of such funds, the County has further covenanted that it will, subject to the limitation on the tax levy set out in Section 710(d) of the County Charter, fund any required appropriation by the levy of ad valorem taxes on real estate, tangible personal property and intangible personal property subject to taxation by the County, and in addition, upon such other intangible property as may be subject to taxation by the County within limitations prescribed by law. Such taxing power is subject, however, to the limitation set forth in Section 710(d) of the County Charter which provides, in part that “[f]rom and after July 1, 1993, revenues derived from taxes on properties existing on the County property tax rolls at the commencement of the County fiscal year shall not increase, compared with the previous year, more than the Consumer Price Index percentage of change, or 4.5 percent, whichever is the lesser.” Purpose of the Bonds
The proceeds of the Bonds, together with the original issue premium, will be used to provide new funding
for general improvements in the amount of $226,607,000 and water and sewer improvements in the amount of
$78,452,000. The proceeds of the new funding will be used to pay for general county, storm drains, education,
police and fire, roads and bridges, community college, library, recreation and parks, waterway improvements, waste
management and wastewater improvements. For more complete information, see “THE BONDS - Application of
Proceeds of Bonds” herein.
Denominations
The Bonds will be issued in denominations of $5,000 each or any integral multiple thereof. Book-Entry Only System The Depository Trust Company (“DTC”) will act as the securities depository for the Bonds. The Bonds will be issued on a book-entry only basis (See “THE BONDS - Book-Entry Only System - General”). Beneficial
Owners (defined herein) will not receive certificates representing their ownership interest in the Bonds except in the event of termination of the book-entry only system (See “THE BONDS - Termination of Book-Entry Only System”).
Payments Principal and interest payments on the Bonds will be made to DTC or its nominee, Cede & Co., as registered owner of the Bonds. Payments by Direct Participants and Indirect Participants (each as defined herein) to Beneficial Owners will be governed by standing instructions and customary practices, as is now the case with municipal securities held for the accounts of customers in bearer form or registered in “street name.”
For a more complete description of the Bonds, see “THE BONDS,” herein.
Tax Matters
In the opinion of McKennon Shelton & Henn LLP, Bond Counsel, (i) under existing statutes, regulations
and decisions, the Bonds, their transfer, the interest payable on them, and any income derived from them, including any profit realized in their sale or exchange, shall be exempt from taxation of any kind by the State of Maryland, any of its political subdivisions, or any other public entity; no opinion is expressed as to estate or inheritance taxes, or any other taxes not levied or assessed directly on the Bonds or interest thereon; and (ii) assuming compliance with certain covenants described herein, interest on the Bonds will be excludable from gross income for federal income tax purposes under existing statutes, regulations and decisions. As described herein under “THE BONDS - Tax Matters” interest earned on the Bonds, for federal income tax purposes, is not included in the alternative minimum taxable income of individuals as an enumerated item of tax preference or other specific adjustment and interest earned on the Bonds will be includable in the applicable tax base for the purpose of determining the branch profits tax imposed on certain foreign corporations.
- 3 -
Professionals Involved in the Offering
U.S. Bank National Association, Richmond, Virginia, will act as Paying Agent and Bond Registrar, and Public Resources Advisory Group, New York, New York, will act as the County's Financial Advisor with respect to the Bonds. All proceedings in connection with the issuance of the Bonds are subject to the approval of McKennon Shelton & Henn LLP, Bond Counsel. The County's financial statements, included in Appendix A attached hereto, have been audited by CliftonLarsonAllen, LLP, independent public accountants, Baltimore, Maryland. For more information concerning the above mentioned professionals, see “THE BONDS - Approval of Legal Matters,” “THE BONDS - Financial Advisor,” and “THE BONDS - Independent Public Accountants” herein. Authorization
The Bonds are issued pursuant to the authority of Section 10-203 of the Local Government Article of the Annotated Code of Maryland (2013 Replacement Volume and 2017 Supplement). The Bonds are also issued pursuant to the County Charter and in accordance with the Authorizing Ordinance (defined herein). For more complete information, see “THE BONDS - Authorization and Purpose” herein. Offering and Delivery of the Bonds
The Bonds are offered when, as and if issued, subject to approval as to their legality by Bond Counsel and the satisfaction of certain other conditions. It is anticipated that the Bonds in definitive form will be available for delivery to DTC on or about March 29, 2018. Continuing Disclosure In order to assist bidder in complying with SEC Rule 15c2-12(b)(5), the County will execute and deliver a continuing disclosure agreement on or before the date of issuance of the Bonds pursuant to which it will undertake to provide certain information annually and notices of certain events. See “THE BONDS - Continuing Disclosure” herein. Miscellaneous This Official Statement speaks only as of its date, and the information contained herein is subject to change. Except where otherwise indicated, all information contained in this Official Statement has been provided by the County. No dealer, broker, salesperson or other person has been authorized by the County or the successful bidder for the Bonds to give any information or to make any representations, other than those contained herein, and, if given or made, such other information or representations must not be relied upon as having been authorized by any of the foregoing. This Official Statement does not constitute an offer to sell or the solicitation of any offer to buy, nor shall there be any sale of the Bonds by any person in any jurisdiction in which it is unlawful for such person to make such an offer, solicitation or sale. The information set forth herein has been obtained from sources which are believed to be reliable, but it is not guaranteed as to accuracy or completeness. Neither the delivery of this Official Statement nor any sale made hereunder shall, under any circumstances, create any implication that there has been no change in the affairs of any party described herein subsequent to the date as of which such information is presented. Questions related to this Official Statement, requests for the County's Comprehensive Annual Financial Report or any written notice described in the section entitled “Continuing Disclosure” should be directed to the Office of Finance, Arundel Center, P.O. Box 2700, Annapolis, Maryland 21404. The telephone number of the Office of Finance is (410) 222-1781.

- 4 -
(This page has been left blank intentionally.)
- 5 -
SECTION TWO: THE BONDS General The Bonds will be issued by the County in book-entry form as fully registered bonds without coupons in the denominations of $5,000 each or any integral multiple thereof. The Bonds will be dated the date of delivery, and will bear interest, as hereinafter set forth, payable on October 1 and April 1 of each year, commencing October 1, 2018, at the rates set forth on the inside front cover page of this Official Statement. Each Bond shall bear interest from the most recent date to which interest has been paid or, if no interest has been paid, from the date of delivery. U.S. Bank National Association has been appointed paying agent for the Bonds. Authorization and Purpose The Bonds are issued pursuant to the authority of Section 10-203 of the Local Government Article of the Annotated Code of Maryland (2013 Replacement Volume and 2017 Supplement). The Bonds are also issued pursuant to the County Charter and in accordance with Bill No. 60-17, passed by the County Council of Anne Arundel County (the “County Council”) on July 17, 2017, approved by the County Executive of the County (the “County Executive”) on July 24, 2017, and effective on September 7, 2017, as amended (the “Authorizing Ordinance”). The proceeds from the sale of the $263,655,000 aggregate principal amount of the Bonds, together with the original issue premium, will be used to provide additional new funding of approximately $226,607,000 for general improvements and $78,452,000 for water and sewer improvements.
- 6 -
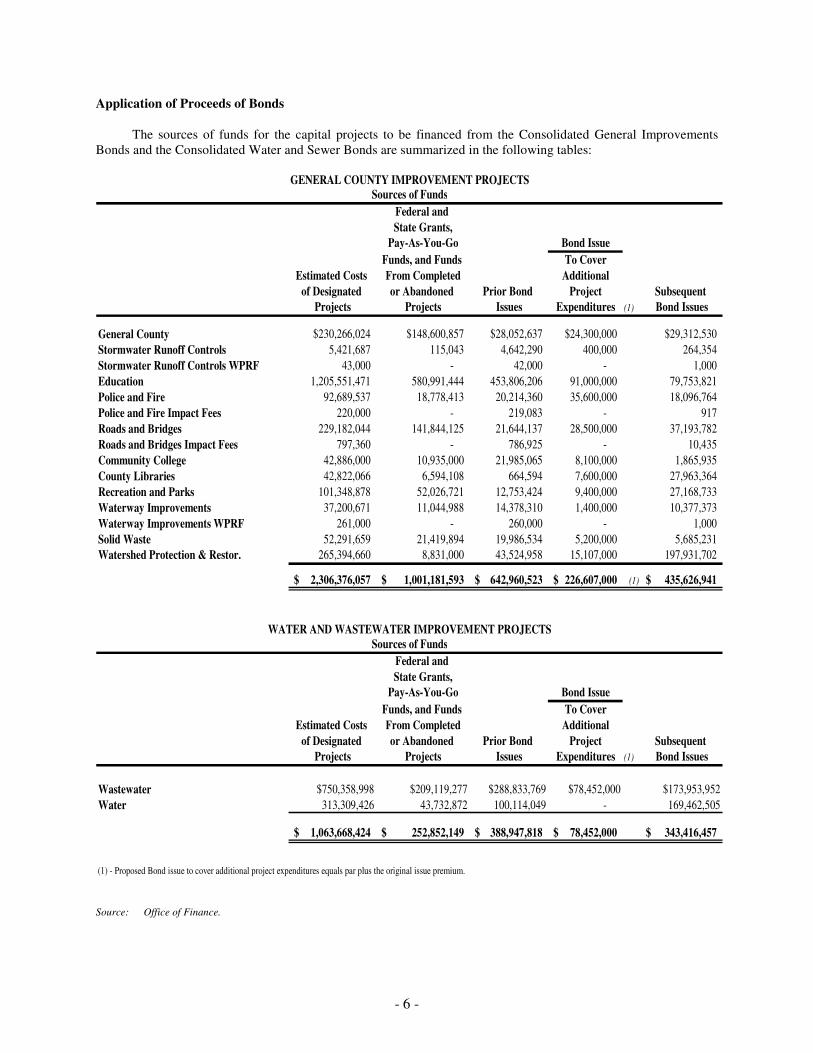
Application of Proceeds of Bonds The sources of funds for the capital projects to be financed from the Consolidated General Improvements Bonds and the Consolidated Water and Sewer Bonds are summarized in the following tables:
Federal and
State Grants,
Pay-As-You-Go Bond Issue
Funds, and Funds To Cover
Estimated Costs From Completed Additional
of Designated or Abandoned Prior Bond Project Subsequent
Projects Projects Issues Expenditures (1) Bond Issues
General County $230,266,024 $148,600,857 $28,052,637 $24,300,000 $29,312,530
Stormwater Runoff Controls 5,421,687 115,043 4,642,290 400,000 264,354
Stormwater Runoff Controls WPRF 43,000 - 42,000 - 1,000
Education 1,205,551,471 580,991,444 453,806,206 91,000,000 79,753,821
Police and Fire 92,689,537 18,778,413 20,214,360 35,600,000 18,096,764
Police and Fire Impact Fees 220,000 - 219,083 - 917
Roads and Bridges 229,182,044 141,844,125 21,644,137 28,500,000 37,193,782
Roads and Bridges Impact Fees 797,360 - 786,925 - 10,435
Community College 42,886,000 10,935,000 21,985,065 8,100,000 1,865,935
County Libraries 42,822,066 6,594,108 664,594 7,600,000 27,963,364
Recreation and Parks 101,348,878 52,026,721 12,753,424 9,400,000 27,168,733
Waterway Improvements 37,200,671 11,044,988 14,378,310 1,400,000 10,377,373
Waterway Improvements WPRF 261,000 - 260,000 - 1,000
Solid Waste 52,291,659 21,419,894 19,986,534 5,200,000 5,685,231
Watershed Protection & Restor. 265,394,660 8,831,000 43,524,958 15,107,000 197,931,702
2,306,376,057$ 1,001,181,593$ 642,960,523$ 226,607,000$ (1) 435,626,941$
Federal and
State Grants,
Pay-As-You-Go Bond Issue
Funds, and Funds To Cover
Estimated Costs From Completed Additional
of Designated or Abandoned Prior Bond Project Subsequent
Projects Projects Issues Expenditures (1) Bond Issues
Wastewater $750,358,998 $209,119,277 $288,833,769 $78,452,000 $173,953,952
Water 313,309,426 43,732,872 100,114,049 - 169,462,505
1,063,668,424$ 252,852,149$ 388,947,818$ 78,452,000$ 343,416,457$
(1) - Proposed Bond issue to cover additional project expenditures equals par plus the original issue premium.
GENERAL COUNTY IMPROVEMENT PROJECTSSources of Funds
WATER AND WASTEWATER IMPROVEMENT PROJECTSSources of Funds
Source: Office of Finance.
- 7 -
Security for and Sources of Payment of the Bonds The Bonds are general obligations of the County for the payment of which the County's full faith and credit and taxing power are irrevocably pledged, subject to the limitation on the taxing power set forth in Section 710(d) of the County Charter.
Section 710(d) of the County Charter provides that from and after July 1, 1993, revenues derived from taxes on properties existing on the County property tax rolls at the commencement of the County fiscal year shall not increase, compared with the previous year, more than the Consumer Price Index percentage of change, or 4.5 percent, whichever is the lesser (See "FINANCES - Charter Property Tax Revenue Limitation" and "INDEBTEDNESS - Charter Property Tax Revenue Limitation").
The maturing principal of and interest on the Consolidated General Improvements Bonds will be paid from
time to time, as and when due, from the funds in the hands of the County realized from the collection of ad valorem taxes on real estate, tangible personal property and intangible personal property subject to taxation by the County. The County has covenanted that, to the extent that the required appropriation for debt service on the Consolidated General Improvements Bonds is not offset by funds from other sources, it will, subject to the limitation on the tax levy set out in Section 710(d) of the County Charter, fund any such appropriation by the levy of ad valorem taxes on real estate, tangible personal property and intangible personal property subject to taxation by the County, and in addition, upon such other intangible property as may be subject to taxation by the County within limitations prescribed by law. In each and every fiscal year that any of the Consolidated Water and Sewer Bonds are outstanding, the County shall impose and levy, or cause to be imposed and levied, charges, levies and assessments against all real property in the County that is or will be connected with, or that is benefited by, the water and wastewater facilities of the County, in accordance with the authority and in the manner prescribed by the Anne Arundel County Code (the “County Code”). The maturing principal of and interest on the Consolidated Water and Sewer Bonds will be paid from time to time, as and when due, from the funds in the hands of the County realized from the net revenues of the projects for which such bonds are issued, or the utilities of which these improvements are a part, for the use and benefit of which the County has covenanted to fix and collect rates, charges and assessments sufficient to pay the cost of operation, maintenance and debt service. In the event of a deficiency of such funds from the net revenues and receipts from such revenue producing projects, for the purpose of meeting the principal maturities and interest of the Bonds, the County has further covenanted that it will, subject to the limitation on the tax levy set out in Section 710(d) of the County Charter, fund any such deficiency by the levy of ad valorem taxes on real estate, tangible personal property and intangible personal property subject to taxation by the County and in addition, upon such other intangible property as may be subject to taxation by the County within limitations prescribed by law. Bondholders' Remedies In the event that it fails to perform its obligations under the Bonds to the registered owners thereof, the County may be sued, and any judgments resulting from such suits would be enforceable against the County. Nevertheless, a registered owner of a Bond who has obtained any such judgment may be required to seek additional relief to compel the County to levy and collect such taxes as may be necessary to provide the funds from which such judgment may be paid. Although there is no Maryland law on this point, the appropriate courts of Maryland have jurisdiction to entertain proceedings and power to grant additional relief, such as a mandatory injunction, if necessary, to enforce the levy and collection of such taxes within the limitation on the tax levy set out in Section 710(d) of the County Charter and payment of the proceeds thereof to the holders of general obligation bonds, subject to the inherent constitutional limitations referred to below. While remedies would be available to bondholders and while the general obligation bonds of the County are entitled to constitutional protection against the impairment of the obligation of contracts, such constitutional protection and the enforcement of such remedies would not be absolute. Enforcement of a claim for payment of the principal of or the interest on the Bonds could be made subject to the provisions of Chapter 9 of the Federal Bankruptcy Code or of any statutes that may hereafter be constitutionally enacted by the United States Congress or the Maryland General Assembly extending the time of payment or imposing other constraints upon enforcement.
- 8 -
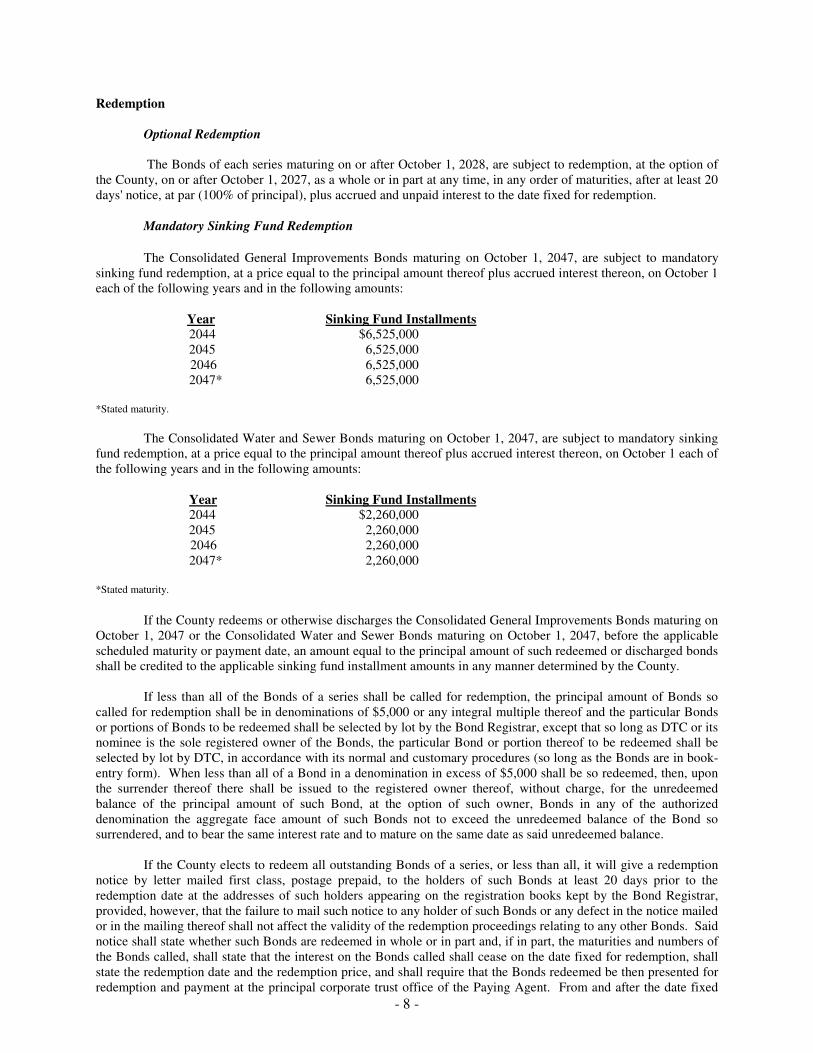
Redemption Optional Redemption
The Bonds of each series maturing on or after October 1, 2028, are subject to redemption, at the option of the County, on or after October 1, 2027, as a whole or in part at any time, in any order of maturities, after at least 20 days' notice, at par (100% of principal), plus accrued and unpaid interest to the date fixed for redemption. Mandatory Sinking Fund Redemption
The Consolidated General Improvements Bonds maturing on October 1, 2047, are subject to mandatory sinking fund redemption, at a price equal to the principal amount thereof plus accrued interest thereon, on October 1 each of the following years and in the following amounts: Year Sinking Fund Installments 2044 $6,525,000 2045 6,525,000 2046 6,525,000 2047* 6,525,000 *Stated maturity.
The Consolidated Water and Sewer Bonds maturing on October 1, 2047, are subject to mandatory sinking fund redemption, at a price equal to the principal amount thereof plus accrued interest thereon, on October 1 each of the following years and in the following amounts: Year Sinking Fund Installments 2044 $2,260,000 2045 2,260,000 2046 2,260,000 2047* 2,260,000 *Stated maturity.
If the County redeems or otherwise discharges the Consolidated General Improvements Bonds maturing on October 1, 2047 or the Consolidated Water and Sewer Bonds maturing on October 1, 2047, before the applicable scheduled maturity or payment date, an amount equal to the principal amount of such redeemed or discharged bonds shall be credited to the applicable sinking fund installment amounts in any manner determined by the County. If less than all of the Bonds of a series shall be called for redemption, the principal amount of Bonds so called for redemption shall be in denominations of $5,000 or any integral multiple thereof and the particular Bonds or portions of Bonds to be redeemed shall be selected by lot by the Bond Registrar, except that so long as DTC or its nominee is the sole registered owner of the Bonds, the particular Bond or portion thereof to be redeemed shall be selected by lot by DTC, in accordance with its normal and customary procedures (so long as the Bonds are in book-entry form). When less than all of a Bond in a denomination in excess of $5,000 shall be so redeemed, then, upon the surrender thereof there shall be issued to the registered owner thereof, without charge, for the unredeemed balance of the principal amount of such Bond, at the option of such owner, Bonds in any of the authorized denomination the aggregate face amount of such Bonds not to exceed the unredeemed balance of the Bond so surrendered, and to bear the same interest rate and to mature on the same date as said unredeemed balance. If the County elects to redeem all outstanding Bonds of a series, or less than all, it will give a redemption notice by letter mailed first class, postage prepaid, to the holders of such Bonds at least 20 days prior to the redemption date at the addresses of such holders appearing on the registration books kept by the Bond Registrar, provided, however, that the failure to mail such notice to any holder of such Bonds or any defect in the notice mailed or in the mailing thereof shall not affect the validity of the redemption proceedings relating to any other Bonds. Said notice shall state whether such Bonds are redeemed in whole or in part and, if in part, the maturities and numbers of the Bonds called, shall state that the interest on the Bonds called shall cease on the date fixed for redemption, shall state the redemption date and the redemption price, and shall require that the Bonds redeemed be then presented for redemption and payment at the principal corporate trust office of the Paying Agent. From and after the date fixed
- 9 -
for redemption, if notice has been given as herein provided, and the funds sufficient for payment of the redemption price and accrued interest shall be available therefore on such date, the Bonds designated for redemption shall cease to bear interest. Upon presentation and surrender in compliance with such notices, the Bonds called for redemption shall be paid by the Paying Agent at the redemption price. If not paid on presentation thereof, said Bonds called
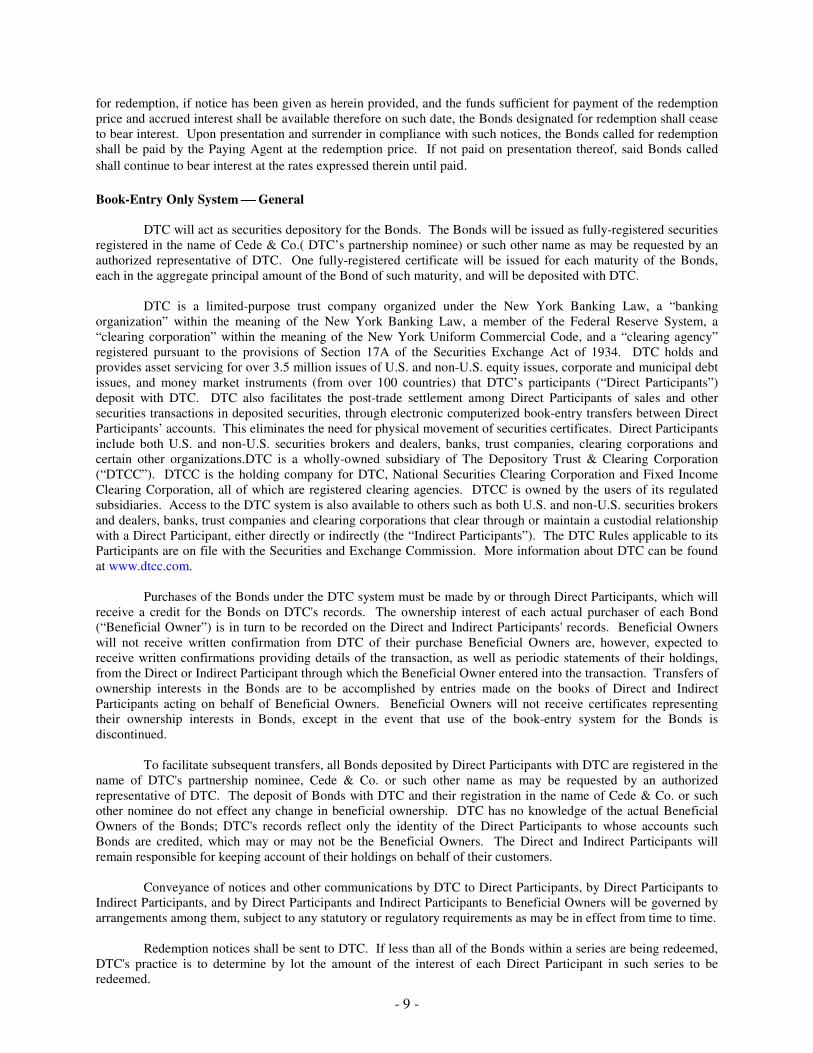
shall continue to bear interest at the rates expressed therein until paid. Book-Entry Only System General DTC will act as securities depository for the Bonds. The Bonds will be issued as fully-registered securities registered in the name of Cede & Co.( DTC’s partnership nominee) or such other name as may be requested by an authorized representative of DTC. One fully-registered certificate will be issued for each maturity of the Bonds, each in the aggregate principal amount of the Bond of such maturity, and will be deposited with DTC. DTC is a limited-purpose trust company organized under the New York Banking Law, a “banking organization” within the meaning of the New York Banking Law, a member of the Federal Reserve System, a “clearing corporation” within the meaning of the New York Uniform Commercial Code, and a “clearing agency” registered pursuant to the provisions of Section 17A of the Securities Exchange Act of 1934. DTC holds and provides asset servicing for over 3.5 million issues of U.S. and non-U.S. equity issues, corporate and municipal debt issues, and money market instruments (from over 100 countries) that DTC’s participants (“Direct Participants”) deposit with DTC. DTC also facilitates the post-trade settlement among Direct Participants of sales and other securities transactions in deposited securities, through electronic computerized book-entry transfers between Direct Participants’ accounts. This eliminates the need for physical movement of securities certificates. Direct Participants include both U.S. and non-U.S. securities brokers and dealers, banks, trust companies, clearing corporations and certain other organizations.DTC is a wholly-owned subsidiary of The Depository Trust & Clearing Corporation (“DTCC”). DTCC is the holding company for DTC, National Securities Clearing Corporation and Fixed Income Clearing Corporation, all of which are registered clearing agencies. DTCC is owned by the users of its regulated subsidiaries. Access to the DTC system is also available to others such as both U.S. and non-U.S. securities brokers and dealers, banks, trust companies and clearing corporations that clear through or maintain a custodial relationship with a Direct Participant, either directly or indirectly (the “Indirect Participants”). The DTC Rules applicable to its Participants are on file with the Securities and Exchange Commission. More information about DTC can be found at www.dtcc.com. Purchases of the Bonds under the DTC system must be made by or through Direct Participants, which will receive a credit for the Bonds on DTC's records. The ownership interest of each actual purchaser of each Bond (“Beneficial Owner”) is in turn to be recorded on the Direct and Indirect Participants' records. Beneficial Owners will not receive written confirmation from DTC of their purchase Beneficial Owners are, however, expected to receive written confirmations providing details of the transaction, as well as periodic statements of their holdings, from the Direct or Indirect Participant through which the Beneficial Owner entered into the transaction. Transfers of ownership interests in the Bonds are to be accomplished by entries made on the books of Direct and Indirect Participants acting on behalf of Beneficial Owners. Beneficial Owners will not receive certificates representing their ownership interests in Bonds, except in the event that use of the book-entry system for the Bonds is discontinued. To facilitate subsequent transfers, all Bonds deposited by Direct Participants with DTC are registered in the name of DTC's partnership nominee, Cede & Co. or such other name as may be requested by an authorized representative of DTC. The deposit of Bonds with DTC and their registration in the name of Cede & Co. or such other nominee do not effect any change in beneficial ownership. DTC has no knowledge of the actual Beneficial Owners of the Bonds; DTC's records reflect only the identity of the Direct Participants to whose accounts such Bonds are credited, which may or may not be the Beneficial Owners. The Direct and Indirect Participants will remain responsible for keeping account of their holdings on behalf of their customers. Conveyance of notices and other communications by DTC to Direct Participants, by Direct Participants to Indirect Participants, and by Direct Participants and Indirect Participants to Beneficial Owners will be governed by arrangements among them, subject to any statutory or regulatory requirements as may be in effect from time to time. Redemption notices shall be sent to DTC. If less than all of the Bonds within a series are being redeemed, DTC's practice is to determine by lot the amount of the interest of each Direct Participant in such series to be redeemed.
- 10 -
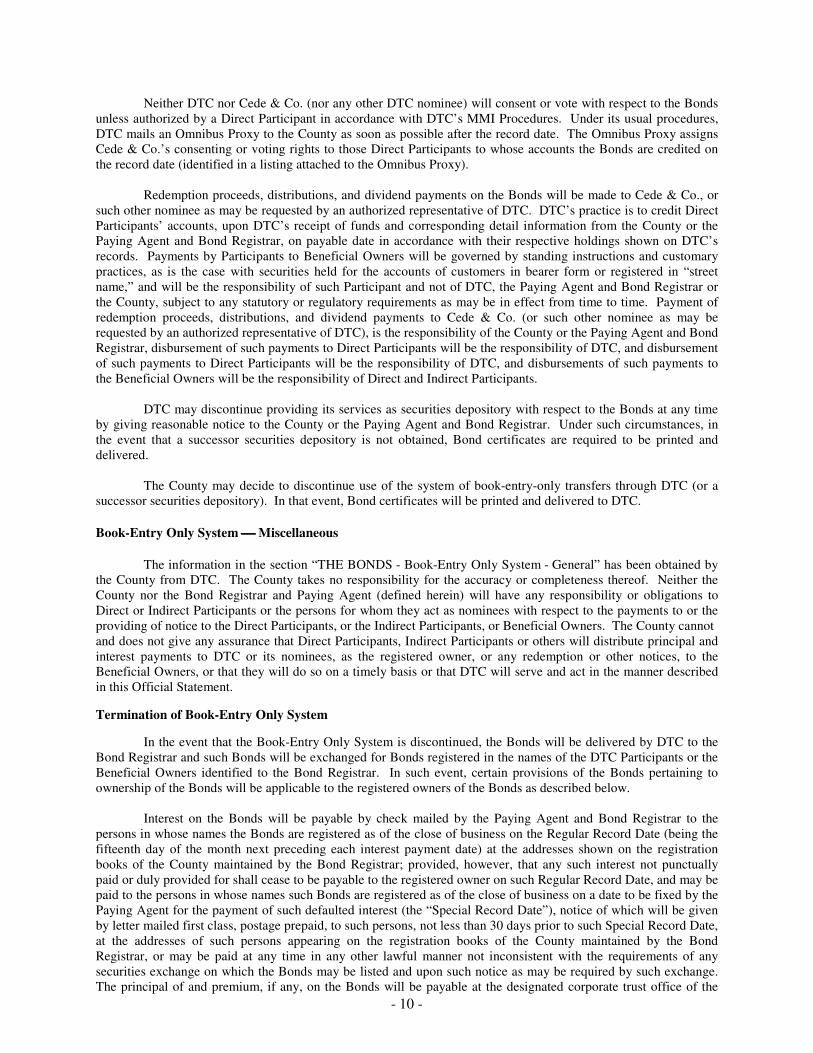
Neither DTC nor Cede & Co. (nor any other DTC nominee) will consent or vote with respect to the Bonds unless authorized by a Direct Participant in accordance with DTC’s MMI Procedures. Under its usual procedures, DTC mails an Omnibus Proxy to the County as soon as possible after the record date. The Omnibus Proxy assigns Cede & Co.’s consenting or voting rights to those Direct Participants to whose accounts the Bonds are credited on the record date (identified in a listing attached to the Omnibus Proxy). Redemption proceeds, distributions, and dividend payments on the Bonds will be made to Cede & Co., or such other nominee as may be requested by an authorized representative of DTC. DTC’s practice is to credit Direct Participants’ accounts, upon DTC’s receipt of funds and corresponding detail information from the County or the Paying Agent and Bond Registrar, on payable date in accordance with their respective holdings shown on DTC’s records. Payments by Participants to Beneficial Owners will be governed by standing instructions and customary practices, as is the case with securities held for the accounts of customers in bearer form or registered in “street name,” and will be the responsibility of such Participant and not of DTC, the Paying Agent and Bond Registrar or the County, subject to any statutory or regulatory requirements as may be in effect from time to time. Payment of redemption proceeds, distributions, and dividend payments to Cede & Co. (or such other nominee as may be requested by an authorized representative of DTC), is the responsibility of the County or the Paying Agent and Bond Registrar, disbursement of such payments to Direct Participants will be the responsibility of DTC, and disbursement of such payments to Direct Participants will be the responsibility of DTC, and disbursements of such payments to the Beneficial Owners will be the responsibility of Direct and Indirect Participants. DTC may discontinue providing its services as securities depository with respect to the Bonds at any time by giving reasonable notice to the County or the Paying Agent and Bond Registrar. Under such circumstances, in the event that a successor securities depository is not obtained, Bond certificates are required to be printed and delivered. The County may decide to discontinue use of the system of book-entry-only transfers through DTC (or a successor securities depository). In that event, Bond certificates will be printed and delivered to DTC.
Book-Entry Only System Miscellaneous
The information in the section “THE BONDS - Book-Entry Only System - General” has been obtained by the County from DTC. The County takes no responsibility for the accuracy or completeness thereof. Neither the County nor the Bond Registrar and Paying Agent (defined herein) will have any responsibility or obligations to Direct or Indirect Participants or the persons for whom they act as nominees with respect to the payments to or the providing of notice to the Direct Participants, or the Indirect Participants, or Beneficial Owners. The County cannot and does not give any assurance that Direct Participants, Indirect Participants or others will distribute principal and interest payments to DTC or its nominees, as the registered owner, or any redemption or other notices, to the Beneficial Owners, or that they will do so on a timely basis or that DTC will serve and act in the manner described in this Official Statement.
Termination of Book-Entry Only System
In the event that the Book-Entry Only System is discontinued, the Bonds will be delivered by DTC to the Bond Registrar and such Bonds will be exchanged for Bonds registered in the names of the DTC Participants or the Beneficial Owners identified to the Bond Registrar. In such event, certain provisions of the Bonds pertaining to ownership of the Bonds will be applicable to the registered owners of the Bonds as described below. Interest on the Bonds will be payable by check mailed by the Paying Agent and Bond Registrar to the persons in whose names the Bonds are registered as of the close of business on the Regular Record Date (being the fifteenth day of the month next preceding each interest payment date) at the addresses shown on the registration books of the County maintained by the Bond Registrar; provided, however, that any such interest not punctually paid or duly provided for shall cease to be payable to the registered owner on such Regular Record Date, and may be paid to the persons in whose names such Bonds are registered as of the close of business on a date to be fixed by the Paying Agent for the payment of such defaulted interest (the “Special Record Date”), notice of which will be given by letter mailed first class, postage prepaid, to such persons, not less than 30 days prior to such Special Record Date, at the addresses of such persons appearing on the registration books of the County maintained by the Bond Registrar, or may be paid at any time in any other lawful manner not inconsistent with the requirements of any securities exchange on which the Bonds may be listed and upon such notice as may be required by such exchange. The principal of and premium, if any, on the Bonds will be payable at the designated corporate trust office of the
- 11 -
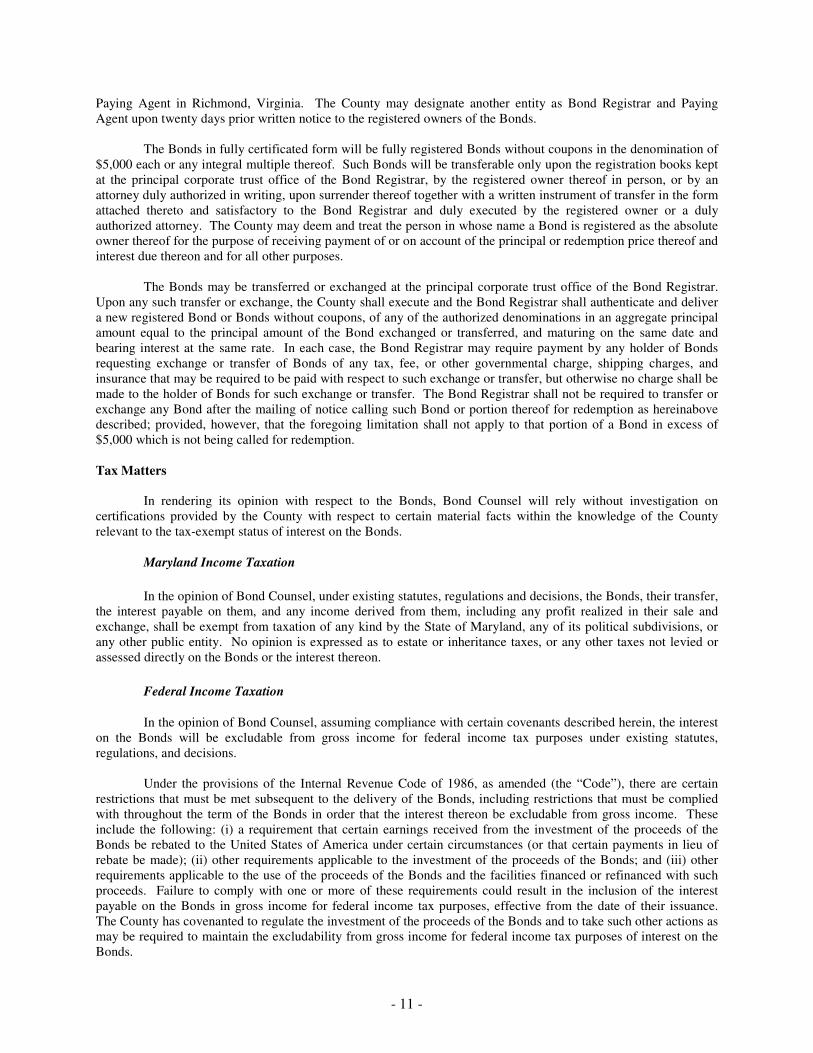
Paying Agent in Richmond, Virginia. The County may designate another entity as Bond Registrar and Paying Agent upon twenty days prior written notice to the registered owners of the Bonds. The Bonds in fully certificated form will be fully registered Bonds without coupons in the denomination of $5,000 each or any integral multiple thereof. Such Bonds will be transferable only upon the registration books kept at the principal corporate trust office of the Bond Registrar, by the registered owner thereof in person, or by an attorney duly authorized in writing, upon surrender thereof together with a written instrument of transfer in the form attached thereto and satisfactory to the Bond Registrar and duly executed by the registered owner or a duly authorized attorney. The County may deem and treat the person in whose name a Bond is registered as the absolute owner thereof for the purpose of receiving payment of or on account of the principal or redemption price thereof and interest due thereon and for all other purposes. The Bonds may be transferred or exchanged at the principal corporate trust office of the Bond Registrar. Upon any such transfer or exchange, the County shall execute and the Bond Registrar shall authenticate and deliver a new registered Bond or Bonds without coupons, of any of the authorized denominations in an aggregate principal amount equal to the principal amount of the Bond exchanged or transferred, and maturing on the same date and bearing interest at the same rate. In each case, the Bond Registrar may require payment by any holder of Bonds requesting exchange or transfer of Bonds of any tax, fee, or other governmental charge, shipping charges, and insurance that may be required to be paid with respect to such exchange or transfer, but otherwise no charge shall be made to the holder of Bonds for such exchange or transfer. The Bond Registrar shall not be required to transfer or exchange any Bond after the mailing of notice calling such Bond or portion thereof for redemption as hereinabove described; provided, however, that the foregoing limitation shall not apply to that portion of a Bond in excess of $5,000 which is not being called for redemption. Tax Matters
In rendering its opinion with respect to the Bonds, Bond Counsel will rely without investigation on certifications provided by the County with respect to certain material facts within the knowledge of the County relevant to the tax-exempt status of interest on the Bonds.
Maryland Income Taxation
In the opinion of Bond Counsel, under existing statutes, regulations and decisions, the Bonds, their transfer, the interest payable on them, and any income derived from them, including any profit realized in their sale and exchange, shall be exempt from taxation of any kind by the State of Maryland, any of its political subdivisions, or any other public entity. No opinion is expressed as to estate or inheritance taxes, or any other taxes not levied or assessed directly on the Bonds or the interest thereon.
Federal Income Taxation
In the opinion of Bond Counsel, assuming compliance with certain covenants described herein, the interest on the Bonds will be excludable from gross income for federal income tax purposes under existing statutes, regulations, and decisions.
Under the provisions of the Internal Revenue Code of 1986, as amended (the “Code”), there are certain restrictions that must be met subsequent to the delivery of the Bonds, including restrictions that must be complied with throughout the term of the Bonds in order that the interest thereon be excludable from gross income. These include the following: (i) a requirement that certain earnings received from the investment of the proceeds of the Bonds be rebated to the United States of America under certain circumstances (or that certain payments in lieu of rebate be made); (ii) other requirements applicable to the investment of the proceeds of the Bonds; and (iii) other requirements applicable to the use of the proceeds of the Bonds and the facilities financed or refinanced with such proceeds. Failure to comply with one or more of these requirements could result in the inclusion of the interest payable on the Bonds in gross income for federal income tax purposes, effective from the date of their issuance. The County has covenanted to regulate the investment of the proceeds of the Bonds and to take such other actions as may be required to maintain the excludability from gross income for federal income tax purposes of interest on the Bonds.
- 12 -
Further, under existing statutes, regulations and decisions, Bond Counsel is of the opinion that interest on the Bonds is not included in the alternative minimum taxable income of individuals as an enumerated item of tax preference or other specific adjustment. For taxable years that began before January 1, 2018, for purposes of calculating the corporate alternative minimum tax, a corporation subject to such tax will be required to increase its alternative minimum taxable income by 75% of the amount by which its “adjusted current earnings” exceed its alternative minimum taxable income (computed without regard to this current earnings adjustment and the alternative tax net operating loss deduction). For such purposes, “adjusted current earnings” may include, among other items, interest income from the Bonds. The alternative minimum tax on corporations has been repealed for taxable years beginning on or after January 1, 2018. In addition, interest income on the Bonds will be includable in the applicable taxable base for the purpose of determining the branch profits tax imposed by the Code on certain
foreign corporations engaged in a trade or business in the United States.
Certain Other Federal Tax Consequences
There are other federal tax consequences of ownership of obligations such as the Bonds under certain circumstances, including the following: (i) deductions are disallowed for certain expenses of taxpayers allocable to interest on tax-exempt obligations, as well as interest on indebtedness incurred or continued to purchase or carry tax-exempt obligations and interest expense of financial institutions allocable to tax-exempt interest; (ii) for property and casualty insurance companies, the amount of the deduction for losses incurred must be reduced by 25% of the sum of tax-exempt interest income and the deductible portion of dividends received by such companies; (iii) interest income that is exempt from tax must be taken into account for the purpose of determining whether, and what amount of, social security or railroad retirement benefits are includable in gross income for federal income tax purposes; (iv) for S corporations having Subchapter C earnings and profits, the receipt of certain levels of passive investment income, which includes interest on tax-exempt obligations such as the Bonds, can result in the imposition of tax on such passive investment income and, in some cases, loss of S corporation status; (v) net gain realized upon the sale or the other disposition of the Bonds must be taken into account when computing the 3.8% Medicare tax with respect to the investment income imposed on certain higher income individuals and specified trusts and estates; and (vi) receipt of certain investment income, including interest on the Bonds, is considered when determining qualification limits for obtaining the earned income credit provided by Section 32(a) of the Code.
Purchase, Sale and Retirement of Bonds
Except as noted below in the case of market discount, the sale or other disposition of a Bond will normally result in capital gain or loss to its holder. A holder's initial tax basis in a Bond will be its cost. Upon the sale or retirement of a Bond, for federal income tax purposes, a holder will recognize capital gain or loss upon the disposition of such security (including sale, early redemption or payment at maturity) in an amount equal to the difference between (a) the amount received upon such disposition and (b) the tax basis in such Bond, determined by adding to the original cost basis in such Bond the amount of original issue discount that is treated as having accrued as described below under “THE BONDS - Tax Accounting Treatment of Discount Bonds.” Such gain or loss will be a long-term capital gain or loss if at the time of the sale or retirement the Bond has been held for more than one year. Present law taxes both long and short-term capital gains of corporations at the rates applicable to ordinary income. For non-corporate taxpayers, however, short-term capital gains are taxed at the rates applicable to ordinary income, while net capital gains are taxed at lower rates. Net capital gains are the excess of net long-term capital gains (gains on capital assets held for more than one year) over net short-term capital losses. Market Discount
If a holder acquires a Bond after its original issuance at a discount below its principal amount (or in the case of a Bond issued at an original issue discount, at a price that produces a yield to maturity higher than the yield to maturity at which such bond was first issued), the holder will be deemed to have acquired the Bond at “market discount,” unless the amount of market discount is de minimis, as described in the following paragraph. If a holder that acquires a Bond with market discount subsequently realizes a gain upon the disposition of the Bond, such gain shall be treated as taxable interest income to the extent such gain does not exceed the accrued market discount attributable to the period during which the holder held such Bond, and any gain realized in excess of such market discount will be treated as capital gain. Potential purchasers should consult their tax advisors as to the proper method of accruing market discount.
- 13 -
In the case of a Bond not issued at an original issue discount, market discount will be de minimis if the excess of the Bond's stated redemption price at maturity over the holder's cost of acquiring the Bond is less than 0.25% of the stated redemption price at maturity multiplied by the number of complete years between the date the holder acquires the Bond and its stated maturity date. In the case of a Bond issued with original issue discount, market discount will be de minimis if the excess of the Bond's revised issue price over the holder's cost of acquiring the Bond is less than 0.25% of the revised issue price multiplied by the number of complete years between the date the holder acquires the Bond and its stated maturity date. For this purpose, a Bond's “revised issue price” is the sum of (i) its original issue price and (ii) the aggregate amount of original issue discount that is treated as having accrued with respect to the Bond during the period between its original issue date and the date of acquisition by the holder. Amortizable Bond Premium
A Bond will be considered to have been purchased at a premium if, and to the extent that, the holder's tax basis in the Bond exceeds the amount payable at maturity (or, in the case of a Bond callable prior to maturity, the amount payable on the earlier call date). Under tax regulations applicable to the Bonds, the amount of the premium would be determined with reference to the amount payable on that call date (including for this purpose the maturity date) that produces the lowest yield to maturity on the Bonds. The holder will be required to reduce his tax basis in the Bond for purposes of determining gain or loss upon disposition of the Bond by the amount of amortizable bond premium that accrues, determined in the manner prescribed in the regulations. Generally, no deduction (or other tax
benefit) is allocable in respect of any amount of amortizable bond premium on the Bonds.
Tax Accounting Treatment of Discount Bonds
Certain maturities of the Bonds may be issued at an initial public offering price which is less than the amount payable on such Bonds at maturity (the “Discount Bonds”). The difference between the initial offering price (including accrued interest, if any), at which a substantial amount of the Discount Bonds of each maturity was first sold, and the principal amount of such Discount Bonds payable at maturity constitutes original issue discount. The amount of such original issue discount, which is treated as having accrued with respect to such Discount Bonds, is added to the original cost basis of the holder in determining, for federal income tax purposes, gain or loss upon disposition (including sale, early redemption or repayment at maturity). For federal income tax purposes (a) any holder of a Discount Bond will recognize gain or loss upon the disposition of such Discount Bond (including sale, early redemption or payment at maturity) in an amount equal to the difference between (i) the amount received upon such disposition and (ii) the sum of (1) the holder's original cost basis in such Discount Bond, and (2) the amount of original issue discount attributable to the period during which the holder held such Discount Bond, and (b) the amount of the basis adjustment described in clause (a)(ii)(2) will not be included in the gross income of the holder. Original issue discount on Discount Bonds will be attributed to permissible compounding periods during the life of any Discount Bonds in accordance with a constant rate of interest accrual method. The yield to maturity of the Discount Bonds of each maturity is determined using permissible compounding periods. In general, the length of a permissible compounding period cannot exceed the length of the interval between debt service payments on the Discount Bonds and must begin or end on the date of such payments. Such yield then is used to determine an amount of accrued interest for each permissible compounding period. For this purpose, interest is treated as compounding periodically at the end of each applicable compounding period. The amount of original issue discount which is treated as having accrued in respect of a Discount Bond for any particular compounding period is equal to the excess of (a) the product of (i) the yield for such Discount Bond (adjusted as necessary for an initial short period) divided by the number of compounding periods in a year multiplied by (ii) the amount that would be the tax basis of such Discount Bond at the beginning of such period if held by an original purchaser who purchased at the initial public offering price, over (b) the amount actually payable as interest on such Discount Bond during such period. For purposes of the preceding sentence the tax basis of a Discount Bond, if held by an original purchaser, can be determined by adding to the initial public offering price of such Discount Bond, the original issue discount that is treated as having accrued during all prior compounding periods. If a Discount Bond is sold or otherwise disposed of between compounding dates, then interest which would have accrued for that compounding period for federal income tax purposes is to be apportioned in equal amounts among the days in such compounding period. Holders of Discount Bonds should note that, under the tax regulations, the yield and maturity of a Discount Bond is determined without regard to commercially reasonable sinking fund payments, and any original issue discount remaining unaccrued at the time that a Discount Bond is redeemed in advance of stated maturity will be treated as taxable gain. Moreover, tax regulations prescribe special conventions for determining the yield and
- 14 -
maturity of certain debt instruments that provide for alternative payment schedules applicable upon the occurrence
of certain contingencies. The yields (and related prices) furnished by the successful bidder for the Bonds as shown on the inside cover of this Official Statement may not reflect the initial issue prices for the purpose of determining the original issues discount for federal income tax purposes.
The foregoing summarizes certain federal income tax consequences of original issue discount with respect to the Discount Bonds, but does not purport to deal with all aspects of federal income taxation that may be relevant to particular investors or circumstances, including those set out above. Prospective purchasers of Discount Bonds should consider possible state and local income, excise or franchise tax consequences arising from original issue discount on Discount Bonds. In addition, prospective corporate purchasers should consider possible federal tax consequences arising from original issue discount on such Discount Bonds under the alternative minimum tax or the branch profits tax. The amount of original issue discount considered to have accrued may be reportable in the year of accrual for state and local tax purposes or for purposes of the alternative minimum tax or the branch profits tax without a corresponding receipt of cash with which to pay any tax liability attributable to such discount. Purchasers with questions concerning the detailed tax consequences of transactions in the Discount Bonds should consult their tax advisors.
The foregoing is only a general summary of certain provisions of the Code as enacted and in effect on the date hereof and does not purport to be complete; holders of the Bonds should consult their own tax advisors as to the effects, if any, of the Code (and any proposed or subsequently enacted amendments to the Code) in their particular circumstances.
Legislative Developments
Legislative proposals currently under consideration or proposed after issuance and delivery of the Bonds could adversely affect the market value of the Bonds. Further, if enacted into law, any such proposal could cause the interest on the Bonds to be subject, directly or indirectly, to federal income taxation and could otherwise alter or amend one or more of the provisions of federal tax law described above or their consequences. Prospective purchasers of the Bonds should consult with their tax advisors as to the status and potential effect of proposed legislative proposals, as to which Bond Counsel expresses no opinion.
Ratings The Bonds have been assigned the following ratings by the agencies indicated: Moody’s Investors Service, Inc. Aa1 and S&P Global Ratings AAA. An explanation of the significance of such ratings may be obtained from the rating agencies. The County furnished to the rating agencies the information contained in a preliminary form of this Official Statement and other materials and information. Generally, rating agencies base ratings on such materials and information, as well as their own investigations, studies and assumptions. It should be noted that such ratings may be changed at any time and that no assurance can be given that the ratings will not be revised downward or withdrawn by the rating agencies, if in their judgment, circumstances should warrant such actions. Such circumstances may include, without limitation, changes in or unavailability of information relating to the County. Any such downward revision or withdrawal of such ratings could have an adverse effect on the market price of the Bonds.
Sale at Competitive Bidding The Bonds were offered for sale by the County at competitive bidding on March 20, 2018, in accordance with the Official Notice of Sale (the forms of which are attached hereto as Appendix B). The rates shown on the inside cover page of this Official Statement are the rates to the County resulting from the awards of the Bonds at the competitive bidding therefore. The yields shown on the inside cover page of this Official Statement are based on information supplied to the County by the successful bidder respecting the resale price (not including concessions) of the Bonds established on the date hereof. Any other information concerning the terms of reoffering of the Bonds, if any, including yields or prices, should be obtained from the successful bidder therefore and not from the County.
- 15 -
Litigation
The County is a party in various legal proceedings that normally occur in governmental operations, including various tort and contract suits, suits alleging violations of individual rights, and matters involving claims relating to land development, property damage, employee liability and workers compensation. With respect to such claims or matters for which reserves have not yet been funded, in the judgment of the County Attorney, the aggregate expected liability of the County will not exceed $1,000,000, not including workers’ compensation claims and the cases set forth below.
The County is a defendant in the following significant cases worthy of note: 1) A class-action lawsuit on behalf of property owners challenged the County's impact fee legislation and
requested refunds for impact fees paid from 1988 to 1996. The amount of those claims involves complex accounting procedures. On July 24, 2012, the Circuit Court for Anne Arundel County issued a judgment finding that impact fee refunds, subject to an additional 5% interest per annum, were due to the current owners of certain specified impact-fee-paying properties. The amount of refunds and interest ordered to be paid by the County totaled $2,839,317. On November 7, 2016, the County mailed checks to individual property owners in payment of impact fee refunds and related interest. The County withheld tax payable to the Internal Revenue Service from the payments to the individual property owners. It is possible that the County will be assessed a penalty by the Internal Revenue Service for payments made pursuant to Court order to property owners who failed to provide their social security number or tax identification number to the County despite request for the same. In the event of such a penalty, the County will request that it be abated. The property owners noted an appeal to the Court of Special Appeals on September 6, 2017 claiming that they are due an additional $2.7 million in impact fee refunds and interest. The appeal is pending.
2) In the case of Comptroller v. Wynne, 135 S.Ct. 1787 (2015), the United States Supreme Court ruled in May 2015 that Maryland residents who paid income taxes to another state on income earned in the other state are entitled to a credit against the county portion of the Maryland income tax owed. The ruling means that each county in Maryland will experience a reduction in income tax revenue, including Anne Arundel County. Based on data as of September 2017, the State of Maryland Comptroller’s Office estimates that the fiscal impact of the ruling on the County will be $17,418,303 to be paid as refunds for prior years’ taxes, and an estimated reduction of $4 million each year going forward. The estimated amount of refunds to be paid has been recorded as a noncurrent liability on the Statement of Net Position and as an assignment of fund balance in the General Fund. The refunds are initially paid to the taxpayer by the State of Maryland with the County scheduled to begin reimbursing the State in May 2019 in the amount of $870,915 every quarter for the following five years. In November 2015, a class-action complaint was filed in the Circuit Court for Baltimore City against the State of Maryland challenging the portion of legislation passed by the Maryland General Assembly that lowered the interest rate to be applied to refunds associated with the Wynne decision for periods prior to June 1, 2014. On January 16, 2018, the Circuit Court dismissed the complaint having determined that the Circuit Court lacked jurisdiction over the matter based upon the plaintiffs’ failure to exhaust administrative remedies. If such claims or appeals are successful, the County’s interest expense for Wynne refunds for periods prior to June 1, 2014 will increase.
3) In a case litigated in the Maryland Tax Court, a taxpayer sought refunds of real property taxes for FY 2012 to FY 2016 due to claimed fair market values below the assessed values upon which taxes were paid. Trial concluded in the Maryland Tax Court on May 17, 2017. The taxpayer claimed it is entitled to tax refunds totaling approximately $3.6 million in addition to 6% interest from the dates of the various years’ payments. The County disputed the taxpayer’s claimed valuations. On December 26, 2017 the Maryland Tax Court reduced the assessments, mostly accepting the taxpayer’s claimed valuations. The County noted an appeal to the Circuit Court for Anne Arundel County on December 29, 2017. The appeal is pending.
4) Plaintiff property owners brought a class-action lawsuit in the Circuit Court for Anne Arundel County against the County seeking refunds of impact fees paid from 1997 to 2003 under § 17-11-210 of the County Code prior to its repeal in 2001 by Bill No. 71-08, in addition to alleging violations of various State and Federal Constitutional provisions. Plaintiffs asserted that the fees were not spent lawfully or within six fiscal years following the fiscal year of collection. On April 25, 2013 the Circuit Court entered an Order certifying a plaintiff class of all persons who are the current owners of properties on which impact fees were paid between 1997 and 2003 who may be entitled to a refund of impact fees pursuant to § 17-11-210 of the County Code. On November 17 through 20, 2014, the Circuit Court held a trial on Plaintiffs' claims seeking approximately $25 million in refunds.
- 16 -
On January 14, 2016, the Circuit Court entered a judgment in favor of the County on all claims. Plaintiffs appealed to the Court of Special Appeals. On March 30, 2017 the Court of Special Appeals affirmed the Circuit Court’s decision in favor of the County. The Court of Appeals issued a writ of certiorari to review the case. All briefs have been filed and oral argument was held on November 3, 2017. The Court of Appeals’ decision is expected in 2018. Approval of Legal Matters McKennon Shelton & Henn LLP, is acting as Bond Counsel in connection with the issuance of the Bonds. Delivery of the Bonds is conditioned upon delivery by Bond Counsel of opinions substantially in the forms set forth in Appendix C of this Official Statement. Financial Advisor Public Resources Advisory Group, 39 Broadway, 12th Floor, New York, New York, 10006, serves as financial advisor to the County on debt management and capital financing matters.
Continuing Disclosure In order to enable participating underwriters (as defined in SEC Rule 15c2-12) to comply with the
requirements of paragraph (b)(5) of SEC Rule 15c2-12, the County will execute and deliver a continuing disclosure
agreement (the “Continuing Disclosure Agreement”) on or before the date of issuance and delivery of the Bonds.
The form of the Continuing Disclosure Agreement is attached hereto as Appendix D. The County has timely filed complete information required by its continuing disclosure obligations for each of the past five years. When filing information with the Municipal Securities Rulemaking Board through Electronic Municipal Market Access (“EMMA”) system, the County submits the filings in a manner intended to display such information with each relevant outstanding debt issue. To the extent a filing is made by the County without all of the associated CUSIP numbers, the filing can be found on EMMA associated with another County debt issue or on the County’s issuer homepage on EMMA. Independent Public Accountants The basic financial statements of Anne Arundel County, Maryland included in Appendix A of this Official Statement have been audited by CliftonLarsonAllen, LLP, Independent Public Accountants, for the period indicated in their report thereon. Official Statement Any statements made in this Official Statement involving matters of opinion or estimates, whether or not expressly so stated, are set forth as such and not as representations of fact, and no representation is made that any estimates will be realized. Neither this Official Statement nor any statement which may have been made verbally or in writing is to be construed as a contract with the holders of any of the Bonds.
- 17 -
SECTION THREE: FINANCES
This section summarizes the finances of the various departments, agencies and other organizations governed directly by the County Executive and the County Council of Anne Arundel County, Maryland. No information is included related to the component units included in the County’s basic financial statements. For more information, see “NOTES TO THE BASIC FINANCIAL STATEMENTS - Summary of Significant Accounting Policies,” in Appendix A. Accounting and Financial Operations The County financial system is an integrated, centralized, and comprehensive base for all budgetary and accounting information. The system begins with the budget and progresses into the incurrence of all obligations and disbursement of all funds. An accounting is provided for all revenues, expenditures and expenses, regardless of source or charge. Awards Certificate of Achievement
The Government Finance Officers Association of the United States and Canada (“GFOA”) awarded a Certificate of Achievement for Excellence in Financial Reporting to Anne Arundel County for its comprehensive annual financial report (“CAFR”) for the fiscal year ended June 30, 2016. This was the 36th consecutive year that the County has received this prestigious award. The Certificate of Achievement is the highest form of recognition for excellence in state and local government financial reporting. In order to be awarded a Certificate of Achievement, a governmental unit must publish an easily readable and efficiently organized comprehensive annual financial report, whose contents conform to program standards. Such reports must satisfy both generally accepted accounting principles and applicable legal requirements. A Certificate of Achievement is valid for a period of one year only. The County believes its CAFR continues to conform to the Certificate of Achievement program requirements and it has submitted its CAFR to GFOA for year ended June 30, 2017. Basis of Accounting Modified Accrual Basis of Accounting
The modified accrual basis of accounting and current financial resources measurement focus is followed in the Governmental funds for the fund level statements. Under the modified accrual basis of accounting:
1. Expenditures are recorded when goods and services are received and the actual liabilities are incurred, except for principal and interest on general long-term debt obligations and compensated absences and other long term obligations. 2. Revenues are recorded when collected by the County or its collecting agencies, except for general property taxes, local income taxes, state shared tax revenues, intergovernmental revenues and investment income which are susceptible to accrual because these revenues are both measurable and available. Available means expected to be collected within 90 days after year-end in order to pay liabilities of the current period, except property taxes, which are deferred if not collected within 60 days. 3. Revenues not considered measurable or available are recorded as deferred revenues. 4. In applying the susceptible to accrual concept to intergovernmental revenues, the eligibility requirements of the programs are used as guidance. Revenues can be recognized as soon as all such requirements are met.
- 18 -
Accrual Basis of Accounting
A set of government-wide financial statements are included that use the full accrual basis of accounting. These statements consolidate the operations of all County activities into two categories, governmental and business-type and eliminate all interfund activity. All non-current assets and liabilities are also included on the Statement of Net Position. The accrual basis of accounting and flow of economic resources measurement focus is followed in the Proprietary and Pension Trust Funds in the fund-level statements and in the government-wide financial statements. Under the accrual basis, revenues are recognized when earned, and expenses are recognized when liabilities are incurred. Earned but unbilled Water and Wastewater Fund utility service charges are recorded as revenue at year-end. Budget The County Budget consists of the Current Expense Budget, the Capital Budget and Program, and the Budget Message. It represents a complete financial plan for the County including all revenues, all expenditures, encumbrances, and the fund balances of the General Fund and all other funds of the County government. Current Expense Budget
The Current Expense Budget, developed by the Chief Administrative Officer and the Budget Officer, is based on annual work programs setting forth the nature, volume, and cost of work to be performed as submitted by the head of each office, department, institution, board, commission, and other agency of the County government. The estimates of the revenues and expenditures of operations for the ensuing fiscal year are also included; estimated revenues are detailed as to source, and estimated expenditures are detailed as to program or project. After the data so submitted is reviewed by the Chief Administrative Officer and the Budget Officer, the Current Expense Budget is compiled for presentation to the County Executive. No later than sixty days prior to the end of the fiscal year, the County Executive submits to the County Council the proposed Current Expense Budget for the ensuing fiscal year, which by the County Charter, must be balanced. Capital Budget and Program
The Capital Budget is the County’s plan to receive and expend funds during the ensuing fiscal year for physical public betterment or improvement and any related preliminary studies and surveys, the acquisition of property of a permanent nature for public use, and the purchase of equipment for any public betterment or improvement accompanying initial construction. The Capital Budget includes a statement of the receipts anticipated during the ensuing fiscal year from all borrowing and from other sources for capital projects. The Capital Program is the County’s plan to receive and expend funds for capital projects during the fiscal year covered by the Capital Budget and the succeeding five fiscal years. Budget Message
The Budget Message contains supporting summary tables and explains the proposed Current Expense Budget and Capital Program both in fiscal terms and in terms of work to be performed. It outlines the proposed financial policies of the County for the ensuing fiscal year and describes the important features of the Current Expense Budget. It indicates any major changes in financial policies and in expenditures, appropriations and revenues as compared with the fiscal year currently ending, and sets forth the reasons for such changes. The Budget Message includes an explanation of changes in the Capital Program made by the County Executive insofar as the Program differs from that presented by the Office of Planning and Zoning. The Budget Message may also include such other material as the County Executive deems desirable.
Budget Adoption
The County Council may decrease or delete any items in the budget except for those required by the public general laws of Maryland and except for any provision for debt service on obligations then outstanding or for estimated cash deficits. The County Council has no power to change the form of the budget as submitted by the County Executive, to alter the revenue estimates except to correct mathematical errors, or to increase total
- 19 -
expenditures recommended by the County Executive for current or capital purposes, except as permitted by the public general laws of Maryland. The adoption of the Budget is by the affirmative vote of not less than four members of the County Council in an ordinance to be known as the Annual Budget and Appropriation Ordinance of Anne Arundel County. The County Council may, at the same time or thereafter from time to time during the ensuing fiscal year, adopt bond issue authorization ordinances providing the means of financing such capital projects as are to be financed from borrowing in the ensuing fiscal year. All of such ordinances are exempt from the County Executive veto. The Annual Budget and Appropriation Ordinance is to be adopted by the County Council on or before the fifteenth day of the last month of the fiscal year currently ending, and if the County Council fails to do so, the proposed budget submitted by the County Executive stands adopted, and funds for the expenditures proposed in the current expense budget stand appropriated as fully and to the same extent as if favorable action thereon had been taken by the County Council. Budget Control
Unless the Controller first certifies that the funds for the designated purposes are available, no office, department, institution, board, commission or other agency of the County government may during any fiscal year expend, or contract to expend, any money or incur any liability, or enter into any contract, which by its terms involves the expenditure of money, for any purpose in excess of the amounts appropriated or allotted for the same general classification of expenditure in the budget or in any supplemental appropriation for such fiscal year, and no such payment may be made nor any obligation or liability incurred, except for small purchases in an amount less than twenty five hundred dollars ($2,500). The County Charter requires that this “general classification of expenditure” be classified by “agency, character and object,” and leaves the specifics of this classification to the discretion of the County Executive. For appropriation control purposes, the current budget classifies department (i.e., agency) expenditures by sub-departments (i.e., character) and seven expense objects including personal services, contractual services, supplies & materials, business & travel, capital outlay, debt service, and grants, contributions & other. Nothing prevents the making of contracts of lease or for service providing for the payment of funds at a time beyond the fiscal year in which such contracts are made, provided the nature of such transactions reasonably requires the making of such contracts. But any contract, lease, or other obligation requiring the payment of funds from the appropriations of a later fiscal year must be made or approved by ordinance. No contract for the purchase of real or leasehold property may be made unless the funds therefore are included in the Capital Budget. No obligations of the County may be authorized in any fiscal year for or on account of any capital project not included in the County Budget as finally adopted for such year; provided, however, that upon receipt of a recommendation in writing from the County Executive and the Planning Advisory Board, the County Council may, by the affirmative vote of five members, amend the County Budget in accordance with such recommendation. Source: Office of the Budget.
Investment of Operating and Capital Funds County funds held for operation and capital purposes are managed by the Office of Finance with strict guidelines as to investment vehicles. Investments are restricted by State of Maryland law, with which the County complies. The County does not invest in derivatives or in reverse repurchase agreements. It invests primarily in obligations of the United States Government, its agencies or instrumentalities, and the Maryland Local Government Investment Pool. For more detailed information, see “NOTES TO THE BASIC FINANCIAL STATEMENTS - Cash and Investments” in Appendix A. Fund Accounting In accordance with generally accepted accounting principles in the United States (“GAAP”), the accounts of the County are organized on the basis of funds. A fund is defined as a fiscal and accounting entity with a self-balancing set of accounts in which cash and other financial resources, all related liabilities and residual equities or balances and changes thereon are recorded and segregated to carry on specific activities or obtain certain objectives. The various funds are summarized by type in the financial statements.

- 20 -
For more detailed information, see “NOTES TO THE BASIC FINANCIAL STATEMENTS - Summary of Significant Accounting Policies,” in Appendix A. General Fund The County’s principal source of General Fund revenues is taxes, which comprised approximately 92.9% of total General Fund revenues (on a GAAP basis) in fiscal year 2017. Property tax revenues comprised approximately 46.8% of total General Fund revenues, and income tax revenues comprised approximately 35.1% of total General Fund revenues. The schedules on the following pages reflect the results of operations for the last five fiscal years.
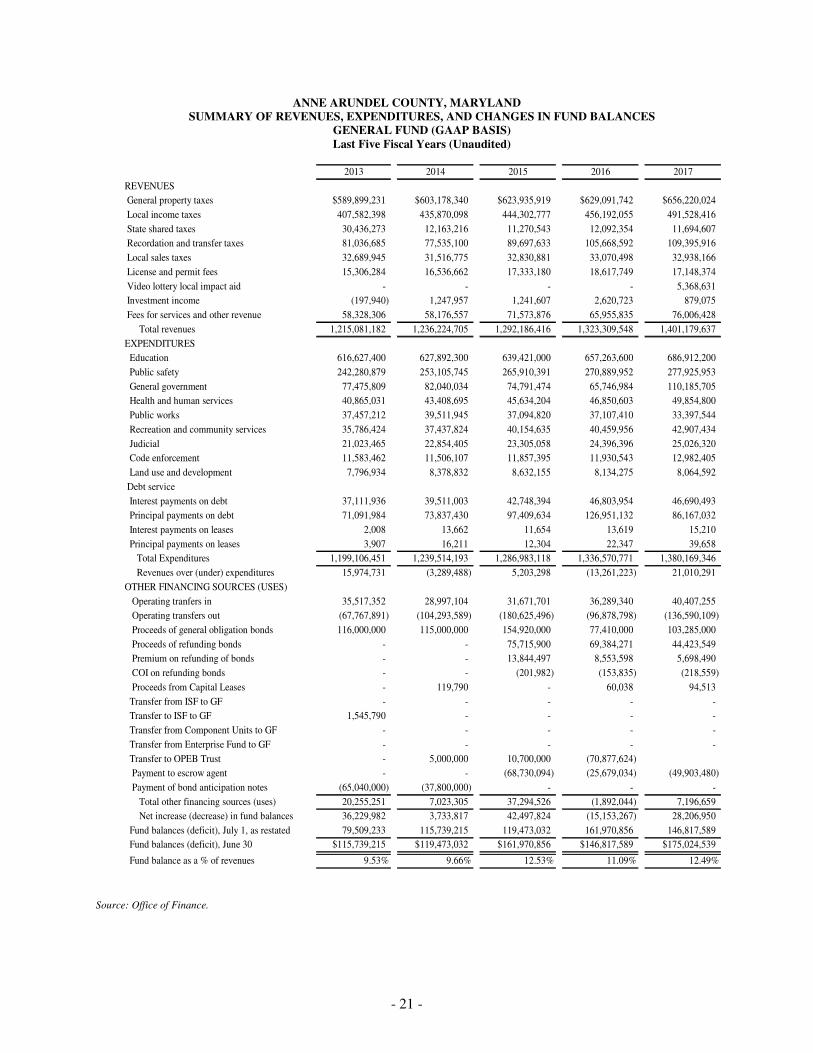
- 21 -
ANNE ARUNDEL COUNTY, MARYLAND SUMMARY OF REVENUES, EXPENDITURES, AND CHANGES IN FUND BALANCES
GENERAL FUND (GAAP BASIS) Last Five Fiscal Years (Unaudited)
2013 2014 2015 2016 2017
REVENUES
General property taxes $589,899,231 $603,178,340 $623,935,919 $629,091,742 $656,220,024
Local income taxes 407,582,398 435,870,098 444,302,777 456,192,055 491,528,416
State shared taxes 30,436,273 12,163,216 11,270,543 12,092,354 11,694,607
Recordation and transfer taxes 81,036,685 77,535,100 89,697,633 105,668,592 109,395,916
Local sales taxes 32,689,945 31,516,775 32,830,881 33,070,498 32,938,166
License and permit fees 15,306,284 16,536,662 17,333,180 18,617,749 17,148,374
Video lottery local impact aid - - - - 5,368,631
Investment income (197,940) 1,247,957 1,241,607 2,620,723 879,075
Fees for services and other revenue 58,328,306 58,176,557 71,573,876 65,955,835 76,006,428
Total revenues 1,215,081,182 1,236,224,705 1,292,186,416 1,323,309,548 1,401,179,637
EXPENDITURES
Education 616,627,400 627,892,300 639,421,000 657,263,600 686,912,200
Public safety 242,280,879 253,105,745 265,910,391 270,889,952 277,925,953
General government 77,475,809 82,040,034 74,791,474 65,746,984 110,185,705
Health and human services 40,865,031 43,408,695 45,634,204 46,850,603 49,854,800
Public works 37,457,212 39,511,945 37,094,820 37,107,410 33,397,544
Recreation and community services 35,786,424 37,437,824 40,154,635 40,459,956 42,907,434
Judicial 21,023,465 22,854,405 23,305,058 24,396,396 25,026,320
Code enforcement 11,583,462 11,506,107 11,857,395 11,930,543 12,982,405
Land use and development 7,796,934 8,378,832 8,632,155 8,134,275 8,064,592
Debt service
Interest payments on debt 37,111,936 39,511,003 42,748,394 46,803,954 46,690,493
Principal payments on debt 71,091,984 73,837,430 97,409,634 126,951,132 86,167,032
Interest payments on leases 2,008 13,662 11,654 13,619 15,210
Principal payments on leases 3,907 16,211 12,304 22,347 39,658
Total Expenditures 1,199,106,451 1,239,514,193 1,286,983,118 1,336,570,771 1,380,169,346
Revenues over (under) expenditures 15,974,731 (3,289,488) 5,203,298 (13,261,223) 21,010,291
OTHER FINANCING SOURCES (USES)
Operating tranfers in 35,517,352 28,997,104 31,671,701 36,289,340 40,407,255
Operating transfers out (67,767,891) (104,293,589) (180,625,496) (96,878,798) (136,590,109)
Proceeds of general obligation bonds 116,000,000 115,000,000 154,920,000 77,410,000 103,285,000
Proceeds of refunding bonds - - 75,715,900 69,384,271 44,423,549
Premium on refunding of bonds - - 13,844,497 8,553,598 5,698,490
COI on refunding bonds - - (201,982) (153,835) (218,559)
Proceeds from Capital Leases - 119,790 - 60,038 94,513
Transfer from ISF to GF - - - - -
Transfer to ISF to GF 1,545,790 - - - -
Transfer from Component Units to GF - - - - -
Transfer from Enterprise Fund to GF - - - - -
Transfer to OPEB Trust - 5,000,000 10,700,000 (70,877,624)
Payment to escrow agent - - (68,730,094) (25,679,034) (49,903,480)
Payment of bond anticipation notes (65,040,000) (37,800,000) - - -
Total other financing sources (uses) 20,255,251 7,023,305 37,294,526 (1,892,044) 7,196,659
Net increase (decrease) in fund balances 36,229,982 3,733,817 42,497,824 (15,153,267) 28,206,950
Fund balances (deficit), July 1, as restated 79,509,233 115,739,215 119,473,032 161,970,856 146,817,589
Fund balances (deficit), June 30 $115,739,215 $119,473,032 $161,970,856 $146,817,589 $175,024,539
Fund balance as a % of revenues 9.53% 9.66% 12.53% 11.09% 12.49%
Source: Office of Finance.
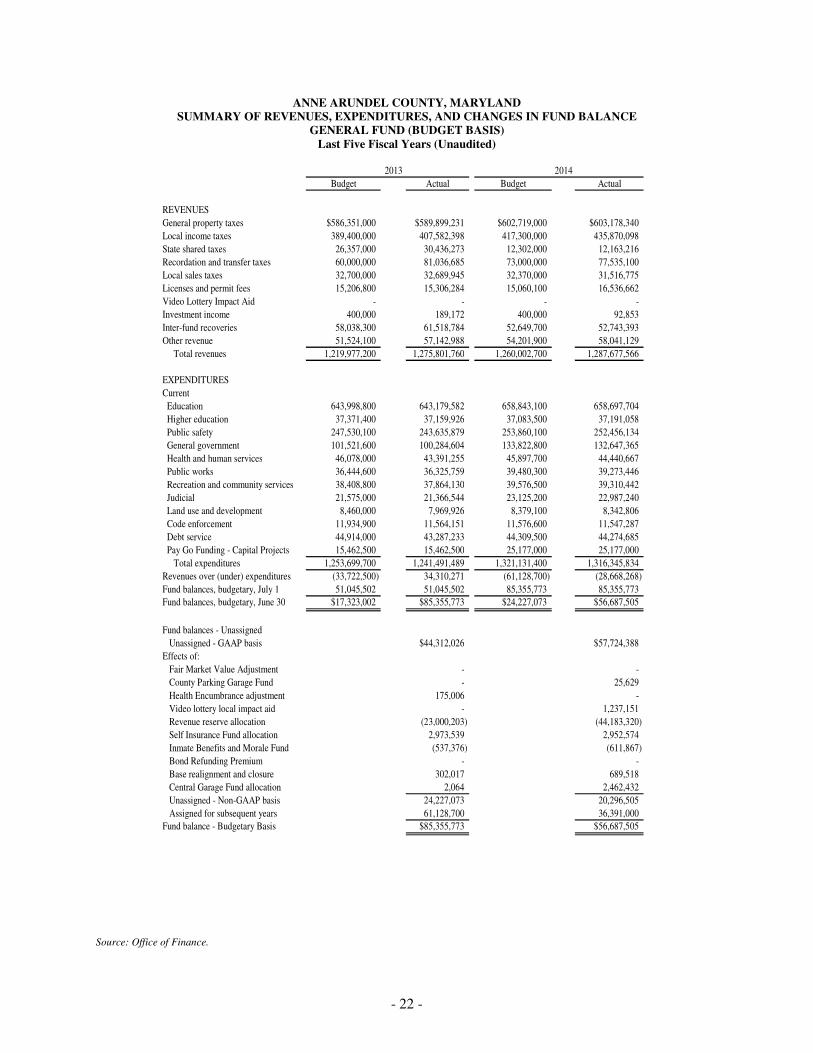
- 22 -
ANNE ARUNDEL COUNTY, MARYLAND SUMMARY OF REVENUES, EXPENDITURES, AND CHANGES IN FUND BALANCE
GENERAL FUND (BUDGET BASIS) Last Five Fiscal Years (Unaudited)
2013 2014
Budget Actual Budget Actual
REVENUES
General property taxes $586,351,000 $589,899,231 $602,719,000 $603,178,340
Local income taxes 389,400,000 407,582,398 417,300,000 435,870,098
State shared taxes 26,357,000 30,436,273 12,302,000 12,163,216
Recordation and transfer taxes 60,000,000 81,036,685 73,000,000 77,535,100
Local sales taxes 32,700,000 32,689,945 32,370,000 31,516,775
Licenses and permit fees 15,206,800 15,306,284 15,060,100 16,536,662
Video Lottery Impact Aid - - - -
Investment income 400,000 189,172 400,000 92,853
Inter-fund recoveries 58,038,300 61,518,784 52,649,700 52,743,393
Other revenue 51,524,100 57,142,988 54,201,900 58,041,129
Total revenues 1,219,977,200 1,275,801,760 1,260,002,700 1,287,677,566
EXPENDITURES
Current
Education 643,998,800 643,179,582 658,843,100 658,697,704
Higher education 37,371,400 37,159,926 37,083,500 37,191,058
Public safety 247,530,100 243,635,879 253,860,100 252,456,134
General government 101,521,600 100,284,604 133,822,800 132,647,365
Health and human services 46,078,000 43,391,255 45,897,700 44,440,667
Public works 36,444,600 36,325,759 39,480,300 39,273,446
Recreation and community services 38,408,800 37,864,130 39,576,500 39,310,442
Judicial 21,575,000 21,366,544 23,125,200 22,987,240
Land use and development 8,460,000 7,969,926 8,379,100 8,342,806
Code enforcement 11,934,900 11,564,151 11,576,600 11,547,287
Debt service 44,914,000 43,287,233 44,309,500 44,274,685
Pay Go Funding - Capital Projects 15,462,500 15,462,500 25,177,000 25,177,000
Total expenditures 1,253,699,700 1,241,491,489 1,321,131,400 1,316,345,834
Revenues over (under) expenditures (33,722,500) 34,310,271 (61,128,700) (28,668,268)
Fund balances, budgetary, July 1 51,045,502 51,045,502 85,355,773 85,355,773
Fund balances, budgetary, June 30 $17,323,002 $85,355,773 $24,227,073 $56,687,505
Fund balances - Unassigned
Unassigned - GAAP basis $44,312,026 $57,724,388
Effects of:
Fair Market Value Adjustment - -
County Parking Garage Fund - 25,629
Health Encumbrance adjustment 175,006 -
Video lottery local impact aid - 1,237,151
Revenue reserve allocation (23,000,203) (44,183,320)
Self Insurance Fund allocation 2,973,539 2,952,574
Inmate Benefits and Morale Fund (537,376) (611,867)
Bond Refunding Premium - -
Base realignment and closure 302,017 689,518
Central Garage Fund allocation 2,064 2,462,432
Unassigned - Non-GAAP basis 24,227,073 20,296,505
Assigned for subsequent years 61,128,700 36,391,000
Fund balance - Budgetary Basis $85,355,773 $56,687,505
Source: Office of Finance.
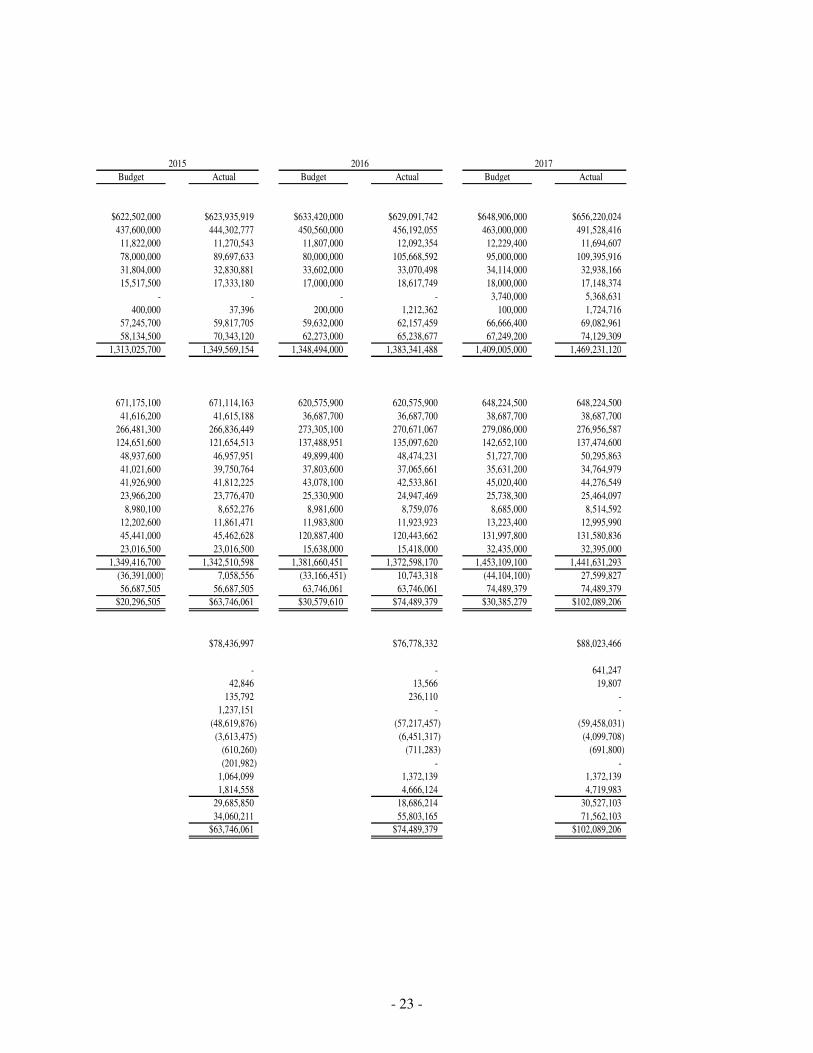
- 23 -
2015 2016 2017
Budget Actual Budget Actual Budget Actual
$622,502,000 $623,935,919 $633,420,000 $629,091,742 $648,906,000 $656,220,024
437,600,000 444,302,777 450,560,000 456,192,055 463,000,000 491,528,416
11,822,000 11,270,543 11,807,000 12,092,354 12,229,400 11,694,607
78,000,000 89,697,633 80,000,000 105,668,592 95,000,000 109,395,916
31,804,000 32,830,881 33,602,000 33,070,498 34,114,000 32,938,166
15,517,500 17,333,180 17,000,000 18,617,749 18,000,000 17,148,374
- - - - 3,740,000 5,368,631
400,000 37,396 200,000 1,212,362 100,000 1,724,716
57,245,700 59,817,705 59,632,000 62,157,459 66,666,400 69,082,961
58,134,500 70,343,120 62,273,000 65,238,677 67,249,200 74,129,309
1,313,025,700 1,349,569,154 1,348,494,000 1,383,341,488 1,409,005,000 1,469,231,120
671,175,100 671,114,163 620,575,900 620,575,900 648,224,500 648,224,500
41,616,200 41,615,188 36,687,700 36,687,700 38,687,700 38,687,700
266,481,300 266,836,449 273,305,100 270,671,067 279,086,000 276,956,587
124,651,600 121,654,513 137,488,951 135,097,620 142,652,100 137,474,600
48,937,600 46,957,951 49,899,400 48,474,231 51,727,700 50,295,863
41,021,600 39,750,764 37,803,600 37,065,661 35,631,200 34,764,979
41,926,900 41,812,225 43,078,100 42,533,861 45,020,400 44,276,549
23,966,200 23,776,470 25,330,900 24,947,469 25,738,300 25,464,097
8,980,100 8,652,276 8,981,600 8,759,076 8,685,000 8,514,592
12,202,600 11,861,471 11,983,800 11,923,923 13,223,400 12,995,990
45,441,000 45,462,628 120,887,400 120,443,662 131,997,800 131,580,836
23,016,500 23,016,500 15,638,000 15,418,000 32,435,000 32,395,000
1,349,416,700 1,342,510,598 1,381,660,451 1,372,598,170 1,453,109,100 1,441,631,293
(36,391,000) 7,058,556 (33,166,451) 10,743,318 (44,104,100) 27,599,827
56,687,505 56,687,505 63,746,061 63,746,061 74,489,379 74,489,379
$20,296,505 $63,746,061 $30,579,610 $74,489,379 $30,385,279 $102,089,206
$78,436,997 $76,778,332 $88,023,466
- - 641,247
42,846 13,566 19,807
135,792 236,110 -
1,237,151 - -
(48,619,876) (57,217,457) (59,458,031)
(3,613,475) (6,451,317) (4,099,708)
(610,260) (711,283) (691,800)
(201,982) - -
1,064,099 1,372,139 1,372,139
1,814,558 4,666,124 4,719,983
29,685,850 18,686,214 30,527,103
34,060,211 55,803,165 71,562,103
$63,746,061 $74,489,379 $102,089,206
- 24 -
The County has historically used a planned approach in which the anticipated available fund balance in the current fiscal year is programmed for spending in the subsequent year’s budget. Due to fiscal restraint and higher revenues in fiscal years 2013, 2014, 2015 and 2016, with revenues exceeding budgeted expectations, the GAAP fund balance increased from $115,739,215 at June 30, 2013 to $175,024,539 at June 30, 2017. Recent Federal Tax Law Changes
On December 22, 2017, the United States Congress passed the Tax Cuts and Jobs Act of 2017 which, among other things, modified the allowance of certain federal income tax deductions for individuals. The Maryland income tax is based, in part, on measures of income determined for federal income tax purposes. Due to these federal tax law changes, the Maryland Bureau of Revenue Estimates has projected in its 60-Day Report – A Review of Tax Cuts and Jobs Act of 2017 that the income tax revenue received by the State of Maryland will increase, assuming Maryland income tax law remains unchanged. This increase in income tax revenue to the State of Maryland, in turn, will impact the income tax revenue received by the County. There are several legislative proposals in the General Assembly of the State of Maryland that would modify the impact of recent federal tax law changes on the income tax revenues ultimately received by the State of Maryland. These proposals would also impact the income tax revenues received by the County. It cannot be determined whether any future legislative changes will be enacted or, if enacted, the impact that any such legislative changes would have on income tax revenues received by the County. Budget for Fiscal Year 2018 To date, the County’s fiscal year 2018 General Fund Current Expense Budget, which includes the County’s funding for the Board of Education, Libraries, Social Services and the Community College, amounts to $1,518,854,800 with a County property tax rate of $0.907 per $100 of assessed value outside of Annapolis and $0.544 per $100 of assessed value inside of Annapolis. (See “FINANCES - Property Taxes, Assessments and Collections”). To date, the 2018 Capital Budget and Five-Year Program total approximately $1,601,505,000 including $1,240,306,000 for general county improvements and $361,199,000 for water and wastewater projects. Support for the Capital Budget and Program primarily consists of Federal and State grants, County bonds, certain fees, and Pay-As-You-Go financing. (See “INDEBTEDNESS - Capital Appropriations and Funding Sources”). Interim General Fund Revenues and Expenditures for Fiscal Years 2018 and 2017 The Controller has prepared summary unaudited data with respect to revenues and expenditures of the General Fund for the six months ended December 31, 2017 and December 31, 2016. The presentation of this data does not purport to be an interim statement of General Fund revenues, expenditures and fund balance as estimates for year-end accruals are not included. However, these statements have been prepared on a comparable basis and reflect the actual collection of revenues and actual expenditures and encumbrances for the two periods. The General Fund’s Statement of Revenue, Expenditures, and Changes in Fund Balance in the annual basic financial statements (See “Appendix A”) are prepared on the modified accrual basis. Operating results through December 2017 show an increase in revenues and an increase in expenditures compared to December 2016. Total revenues as of December 31, 2017 are approximately $33,180,400 higher than December 31, 2016, an increase of 3.6%. Revenues from property taxes are approximately $29,243,800 ahead of the prior year. State shared taxes and recordation and transfer taxes have increased by approximately $4,070,900 and $4,937,600, respectively. Income tax to date has decreased by approximately $7,978,000. Total expenditures as of December 2017 are approximately $30,816,000 higher than December 2016, an increase of 4.1%, which is the result of an increase in appropriations for the Board of Education as well as an increase in the retiree health insurance contribution and the restructuring of the due date for debt service principal payments. The following presents a summary of General Fund revenues, expenditures and encumbrances for the six months ended December 31, 2017 and December 31, 2016, as compared with the related total annual budgets as revised through these dates:
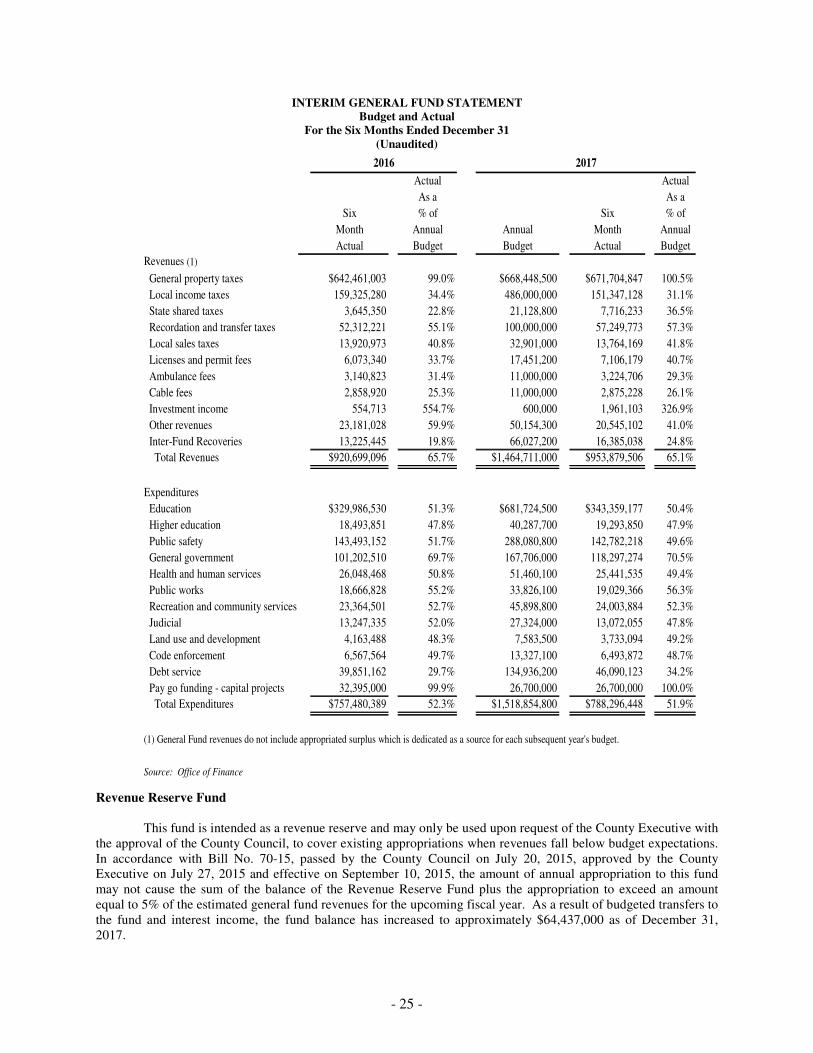
- 25 -
INTERIM GENERAL FUND STATEMENT Budget and Actual
For the Six Months Ended December 31 (Unaudited)
Actual Actual
As a As a
Six % of Six % of
Month Annual Annual Month Annual
Actual Budget Budget Actual Budget
Revenues (1)
General property taxes $642,461,003 99.0% $668,448,500 $671,704,847 100.5%
Local income taxes 159,325,280 34.4% 486,000,000 151,347,128 31.1%
State shared taxes 3,645,350 22.8% 21,128,800 7,716,233 36.5%
Recordation and transfer taxes 52,312,221 55.1% 100,000,000 57,249,773 57.3%
Local sales taxes 13,920,973 40.8% 32,901,000 13,764,169 41.8%
Licenses and permit fees 6,073,340 33.7% 17,451,200 7,106,179 40.7%
Ambulance fees 3,140,823 31.4% 11,000,000 3,224,706 29.3%
Cable fees 2,858,920 25.3% 11,000,000 2,875,228 26.1%
Investment income 554,713 554.7% 600,000 1,961,103 326.9%
Other revenues 23,181,028 59.9% 50,154,300 20,545,102 41.0%
Inter-Fund Recoveries 13,225,445 19.8% 66,027,200 16,385,038 24.8%
Total Revenues $920,699,096 65.7% $1,464,711,000 $953,879,506 65.1%
Expenditures
Education $329,986,530 51.3% $681,724,500 $343,359,177 50.4%
Higher education 18,493,851 47.8% 40,287,700 19,293,850 47.9%
Public safety 143,493,152 51.7% 288,080,800 142,782,218 49.6%
General government 101,202,510 69.7% 167,706,000 118,297,274 70.5%
Health and human services 26,048,468 50.8% 51,460,100 25,441,535 49.4%
Public works 18,666,828 55.2% 33,826,100 19,029,366 56.3%
Recreation and community services 23,364,501 52.7% 45,898,800 24,003,884 52.3%
Judicial 13,247,335 52.0% 27,324,000 13,072,055 47.8%
Land use and development 4,163,488 48.3% 7,583,500 3,733,094 49.2%
Code enforcement 6,567,564 49.7% 13,327,100 6,493,872 48.7%
Debt service 39,851,162 29.7% 134,936,200 46,090,123 34.2%
Pay go funding - capital projects 32,395,000 99.9% 26,700,000 26,700,000 100.0%
Total Expenditures $757,480,389 52.3% $1,518,854,800 $788,296,448 51.9%
(1) General Fund revenues do not include appropriated surplus which is dedicated as a source for each subsequent year's budget.
Source: Office of Finance
2016 2017
Revenue Reserve Fund
This fund is intended as a revenue reserve and may only be used upon request of the County Executive with the approval of the County Council, to cover existing appropriations when revenues fall below budget expectations. In accordance with Bill No. 70-15, passed by the County Council on July 20, 2015, approved by the County Executive on July 27, 2015 and effective on September 10, 2015, the amount of annual appropriation to this fund may not cause the sum of the balance of the Revenue Reserve Fund plus the appropriation to exceed an amount equal to 5% of the estimated general fund revenues for the upcoming fiscal year. As a result of budgeted transfers to the fund and interest income, the fund balance has increased to approximately $64,437,000 as of December 31, 2017.
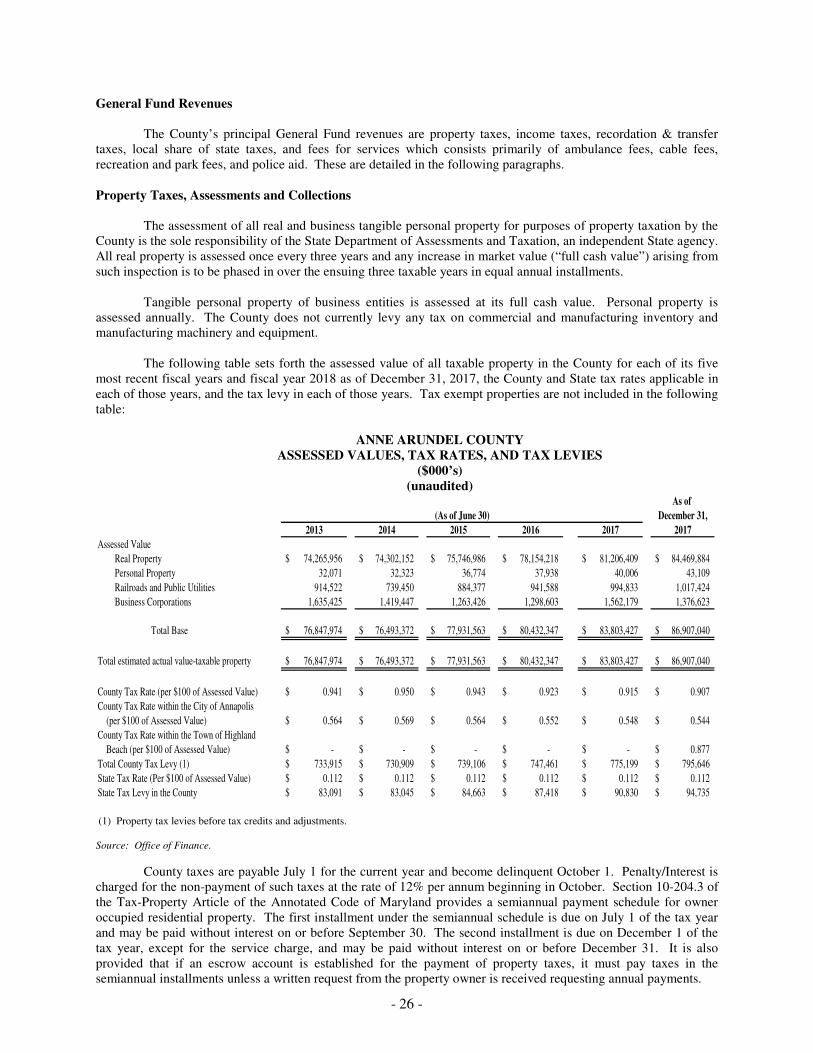
- 26 -
General Fund Revenues The County’s principal General Fund revenues are property taxes, income taxes, recordation & transfer taxes, local share of state taxes, and fees for services which consists primarily of ambulance fees, cable fees, recreation and park fees, and police aid. These are detailed in the following paragraphs. Property Taxes, Assessments and Collections The assessment of all real and business tangible personal property for purposes of property taxation by the County is the sole responsibility of the State Department of Assessments and Taxation, an independent State agency. All real property is assessed once every three years and any increase in market value (“full cash value”) arising from such inspection is to be phased in over the ensuing three taxable years in equal annual installments. Tangible personal property of business entities is assessed at its full cash value. Personal property is assessed annually. The County does not currently levy any tax on commercial and manufacturing inventory and manufacturing machinery and equipment. The following table sets forth the assessed value of all taxable property in the County for each of its five most recent fiscal years and fiscal year 2018 as of December 31, 2017, the County and State tax rates applicable in each of those years, and the tax levy in each of those years. Tax exempt properties are not included in the following table:
ANNE ARUNDEL COUNTY
ASSESSED VALUES, TAX RATES, AND TAX LEVIES ($000’s)
(unaudited)
As of
December 31,
2013 2014 2015 2016 2017 2017
Assessed Value
Real Property 74,265,956$ 74,302,152$ 75,746,986$ 78,154,218$ 81,206,409$ 84,469,884$
Personal Property 32,071 32,323 36,774 37,938 40,006 43,109
Railroads and Public Utilities 914,522 739,450 884,377 941,588 994,833 1,017,424
Business Corporations 1,635,425 1,419,447 1,263,426 1,298,603 1,562,179 1,376,623
Total Base 76,847,974$ 76,493,372$ 77,931,563$ 80,432,347$ 83,803,427$ 86,907,040$
Total estimated actual value-taxable property 76,847,974$ 76,493,372$ 77,931,563$ 80,432,347$ 83,803,427$ 86,907,040$
County Tax Rate (per $100 of Assessed Value) 0.941$ 0.950$ 0.943$ 0.923$ 0.915$ 0.907$
County Tax Rate within the City of Annapolis
(per $100 of Assessed Value) 0.564$ 0.569$ 0.564$ 0.552$ 0.548$ 0.544$
County Tax Rate within the Town of Highland
Beach (per $100 of Assessed Value) -$ -$ -$ -$ -$ 0.877$
Total County Tax Levy (1) 733,915$ 730,909$ 739,106$ 747,461$ 775,199$ 795,646$
State Tax Rate (Per $100 of Assessed Value) 0.112$ 0.112$ 0.112$ 0.112$ 0.112$ 0.112$
State Tax Levy in the County 83,091$ 83,045$ 84,663$ 87,418$ 90,830$ 94,735$
(As of June 30)
(1) Property tax levies before tax credits and adjustments. Source: Office of Finance.
County taxes are payable July 1 for the current year and become delinquent October 1. Penalty/Interest is charged for the non-payment of such taxes at the rate of 12% per annum beginning in October. Section 10-204.3 of the Tax-Property Article of the Annotated Code of Maryland provides a semiannual payment schedule for owner occupied residential property. The first installment under the semiannual schedule is due on July 1 of the tax year and may be paid without interest on or before September 30. The second installment is due on December 1 of the tax year, except for the service charge, and may be paid without interest on or before December 31. It is also provided that if an escrow account is established for the payment of property taxes, it must pay taxes in the semiannual installments unless a written request from the property owner is received requesting annual payments.
- 27 -
The County does not levy taxes in excess of actual requirements to provide a margin against delinquencies. Uncollectible taxes are charged against allowances established therefore, by an annual reduction of revenues. Charter Property Tax Revenue Limitation In connection with a voter petition initiative, County voters approved an amendment to the County Charter at the November 1992 general election. The amendment, which became effective in December 1992, added Section 710(d) to the County Charter (“Section 710(d)”). Section 710(d) provides that from and after July 1, 1993, revenues derived from taxes on properties existing on the County property tax rolls at the commencement of the County fiscal year shall not increase, compared with the previous year, more than the Consumer Price Index percentage of change or 4.5 percent, whichever is the lesser (See “INDEBTEDNESS - Charter Property Tax Revenue Limitation”). The County Attorney has advised, among other things, that Section 710(d) applies to revenues from County taxes on both real property and personal property and that only revenues from property on the tax rolls at the close of business on June 30th of a fiscal year are capped for the purposes of determining the maximum amount of capped revenue for the next fiscal year. Revenues from new construction and other property which come onto the tax rolls on or after July 1 are “new” and are not subject to the cap, but only for the year that the properties come onto the tax rolls. Municipal Tax Rate Differential
In establishing the County tax rate applicable to assessed property within the City of Annapolis, the costs of certain services provided by the County are allocated in order to implement provisions of current law, which preclude the owners of property located in Annapolis from being taxed for services already provided by this municipality. Hence, owners of property located outside the City of Annapolis are taxed by the County for all services that the County provides, while owners of property located inside the City of Annapolis are taxed by the County only for those services that the County, and not the City of Annapolis, directly provides. The tax differential for fiscal year 2018 is $0.363 per $100 of assessed value for real property and $0.907 per $100 of assessed value for personal property. In establishing the County tax rate applicable to assessed property within the Town of Highland Beach, the costs of certain services provided by the County are allocated in order to implement provisions of current law, which preclude the owners of property located in Highland Beach from being taxed for services already provided by this municipality. Hence, owners of property located outside the Town of Highland Beach are taxed by the County for all services that the County provides, while owners of property located inside the Town of Highland Beach are taxed by the County only for those services that the County, and not the Town of Highland Beach, directly provides. The tax differential for fiscal year 2018 is $0.030 per $100 of assessed value for real property and $0.075 per $100 of assessed value for personal property. Property Tax Collections
The following table sets forth certain information with respect to the County’s tax levies and tax collections:
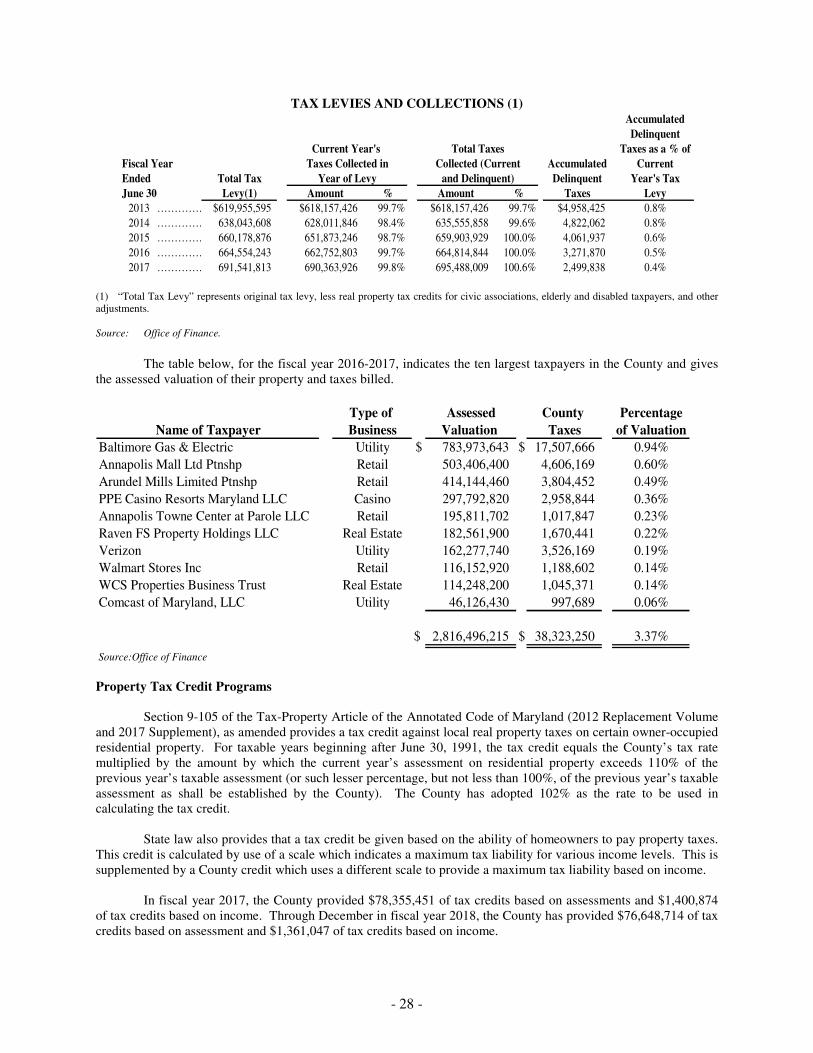
- 28 -
TAX LEVIES AND COLLECTIONS (1) Accumulated
Delinquent
Taxes as a % of
Taxes Collected in Collected (Current Accumulated Current
Total Tax Year of Levy and Delinquent) Delinquent Year's Tax
Levy(1) Amount % Amount % Taxes Levy
2013 …………… $619,955,595 $618,157,426 99.7% $618,157,426 99.7% $4,958,425 0.8%
2014 …………… 638,043,608 628,011,846 98.4% 635,555,858 99.6% 4,822,062 0.8%
2015 …………… 660,178,876 651,873,246 98.7% 659,903,929 100.0% 4,061,937 0.6%
2016 …………… 664,554,243 662,752,803 99.7% 664,814,844 100.0% 3,271,870 0.5%
2017 …………… 691,541,813 690,363,926 99.8% 695,488,009 100.6% 2,499,838 0.4%
Total TaxesCurrent Year's
Fiscal Year
Ended
June 30
(1) “Total Tax Levy” represents original tax levy, less real property tax credits for civic associations, elderly and disabled taxpayers, and other adjustments. Source: Office of Finance.
The table below, for the fiscal year 2016-2017, indicates the ten largest taxpayers in the County and gives the assessed valuation of their property and taxes billed.
Type of Assessed County Percentage
Name of Taxpayer Business Valuation Taxes of Valuation
Baltimore Gas & Electric Utility $ 783,973,643 $ 17,507,666 0.94%
Annapolis Mall Ltd Ptnshp Retail 503,406,400 4,606,169 0.60%
Arundel Mills Limited Ptnshp Retail 414,144,460 3,804,452 0.49%
PPE Casino Resorts Maryland LLC Casino 297,792,820 2,958,844 0.36%
Annapolis Towne Center at Parole LLC Retail 195,811,702 1,017,847 0.23%
Raven FS Property Holdings LLC Real Estate 182,561,900 1,670,441 0.22%
Verizon Utility 162,277,740 3,526,169 0.19%
Walmart Stores Inc Retail 116,152,920 1,188,602 0.14%
WCS Properties Business Trust Real Estate 114,248,200 1,045,371 0.14%
Comcast of Maryland, LLC Utility 46,126,430 997,689 0.06%
$ 2,816,496,215 $ 38,323,250 3.37%
Source:Office of Finance
Property Tax Credit Programs
Section 9-105 of the Tax-Property Article of the Annotated Code of Maryland (2012 Replacement Volume and 2017 Supplement), as amended provides a tax credit against local real property taxes on certain owner-occupied residential property. For taxable years beginning after June 30, 1991, the tax credit equals the County’s tax rate multiplied by the amount by which the current year’s assessment on residential property exceeds 110% of the previous year’s taxable assessment (or such lesser percentage, but not less than 100%, of the previous year’s taxable assessment as shall be established by the County). The County has adopted 102% as the rate to be used in calculating the tax credit. State law also provides that a tax credit be given based on the ability of homeowners to pay property taxes. This credit is calculated by use of a scale which indicates a maximum tax liability for various income levels. This is supplemented by a County credit which uses a different scale to provide a maximum tax liability based on income. In fiscal year 2017, the County provided $78,355,451 of tax credits based on assessments and $1,400,874 of tax credits based on income. Through December in fiscal year 2018, the County has provided $76,648,714 of tax credits based on assessment and $1,361,047 of tax credits based on income.
- 29 -
Income Taxes The State imposes an income tax on the adjusted gross income of individuals as determined for federal income tax purposes, subject to certain adjustments. Pursuant to Chapter 493 of the 1999 Maryland Laws (“Chapter 493”), each county and Baltimore City is authorized to levy a local income tax at the rate of at least 1%, but not more than 3.2% of a taxpayer’s taxable income as calculated for State income tax purposes. Chapter 493 also made the personal exemption amounts for calculating both State and local income taxes equal. Under Chapter 493’s provisions, the local income tax rate on an Anne Arundel County taxpayer’s total taxable income was adjusted to 2.56% for calendar year 2002 and thereafter, which is below the maximum rate of 3.2% authorized under State law. The County Council approved a one-time reduction in the income tax rate from 2.56% to 2.49% effective January 1, 2012. Effective January 1, 2013, the rate reverted to 2.56%. The County Council reduced the income tax rate to 2.50% effective January 1, 2016. The County is not permitted to levy a local income tax on corporations. Local Taxes In addition to general property taxes and income taxes, the County is authorized to levy and collect other miscellaneous taxes, the largest of which are the recordation and transfer taxes on instruments conveying title to property. Refund Procedures and Claims The County is in receipt of various claims for refund of taxes, which are evaluated under administrative procedures mandated by applicable law. The resolution of such claims will not have a material adverse effect on the financial statements of the County. Water and Wastewater Funds
For financial reporting purposes, the County consolidates all funds related to water and wastewater activities into a single enterprise fund. However, underlying financial accounting records continue to be maintained on a non-GAAP basis for components for legal compliance purposes. Water and wastewater user charges and assessment charges are recorded as revenues on the accrual basis. Unpaid water and wastewater user charges and assessments are a lien on the real property and are collectible in the same manner as real property taxes at tax sale.
The following tables set forth revenues, expenses and changes in net position of the Water and Wastewater Operating Fund and the Debt Service Fund for the County’s most recent fiscal years:
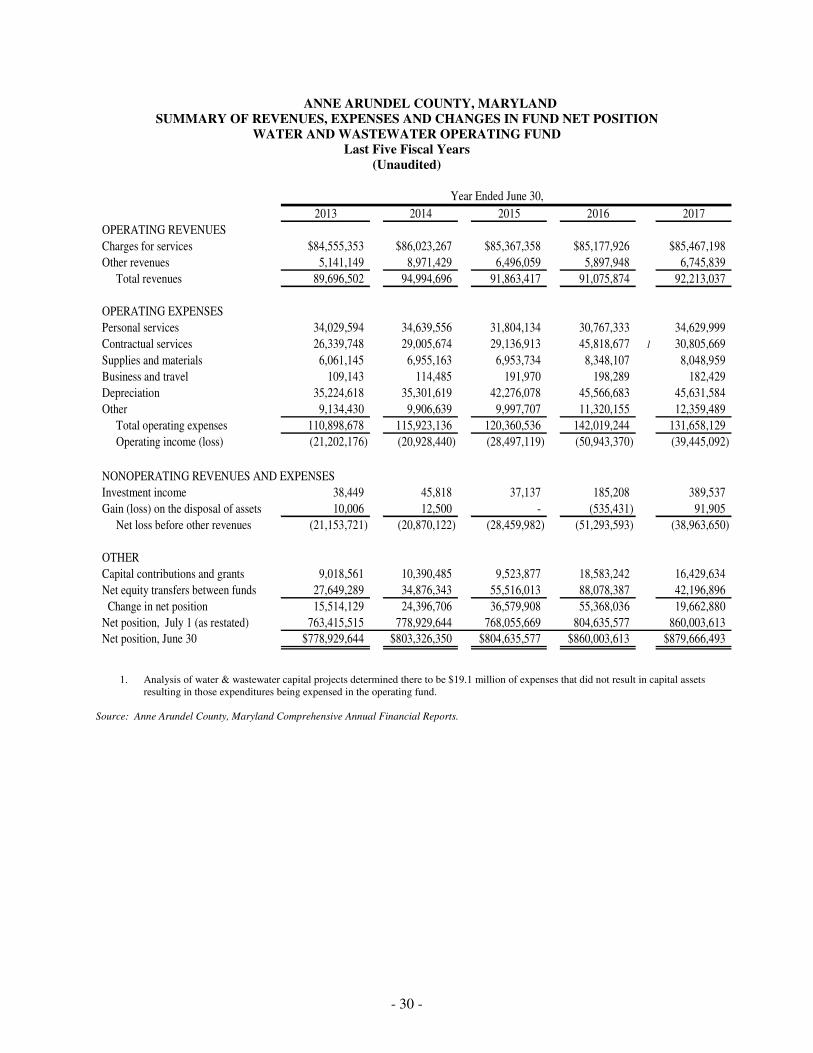
- 30 -
ANNE ARUNDEL COUNTY, MARYLAND SUMMARY OF REVENUES, EXPENSES AND CHANGES IN FUND NET POSITION
WATER AND WASTEWATER OPERATING FUND Last Five Fiscal Years
(Unaudited)
Year Ended June 30,
2013 2014 2015 2016 2017
OPERATING REVENUES
Charges for services $84,555,353 $86,023,267 $85,367,358 $85,177,926 $85,467,198
Other revenues 5,141,149 8,971,429 6,496,059 5,897,948 6,745,839
Total revenues 89,696,502 94,994,696 91,863,417 91,075,874 92,213,037
OPERATING EXPENSES
Personal services 34,029,594 34,639,556 31,804,134 30,767,333 34,629,999
Contractual services 26,339,748 29,005,674 29,136,913 45,818,677 1 30,805,669
Supplies and materials 6,061,145 6,955,163 6,953,734 8,348,107 8,048,959
Business and travel 109,143 114,485 191,970 198,289 182,429
Depreciation 35,224,618 35,301,619 42,276,078 45,566,683 45,631,584
Other 9,134,430 9,906,639 9,997,707 11,320,155 12,359,489
Total operating expenses 110,898,678 115,923,136 120,360,536 142,019,244 131,658,129
Operating income (loss) (21,202,176) (20,928,440) (28,497,119) (50,943,370) (39,445,092)
NONOPERATING REVENUES AND EXPENSES
Investment income 38,449 45,818 37,137 185,208 389,537
Gain (loss) on the disposal of assets 10,006 12,500 - (535,431) 91,905
Net loss before other revenues (21,153,721) (20,870,122) (28,459,982) (51,293,593) (38,963,650)
OTHER
Capital contributions and grants 9,018,561 10,390,485 9,523,877 18,583,242 16,429,634
Net equity transfers between funds 27,649,289 34,876,343 55,516,013 88,078,387 42,196,896
Change in net position 15,514,129 24,396,706 36,579,908 55,368,036 19,662,880
Net position, July 1 (as restated) 763,415,515 778,929,644 768,055,669 804,635,577 860,003,613
Net position, June 30 $778,929,644 $803,326,350 $804,635,577 $860,003,613 $879,666,493
1. Analysis of water & wastewater capital projects determined there to be $19.1 million of expenses that did not result in capital assets
resulting in those expenditures being expensed in the operating fund.
Source: Anne Arundel County, Maryland Comprehensive Annual Financial Reports.
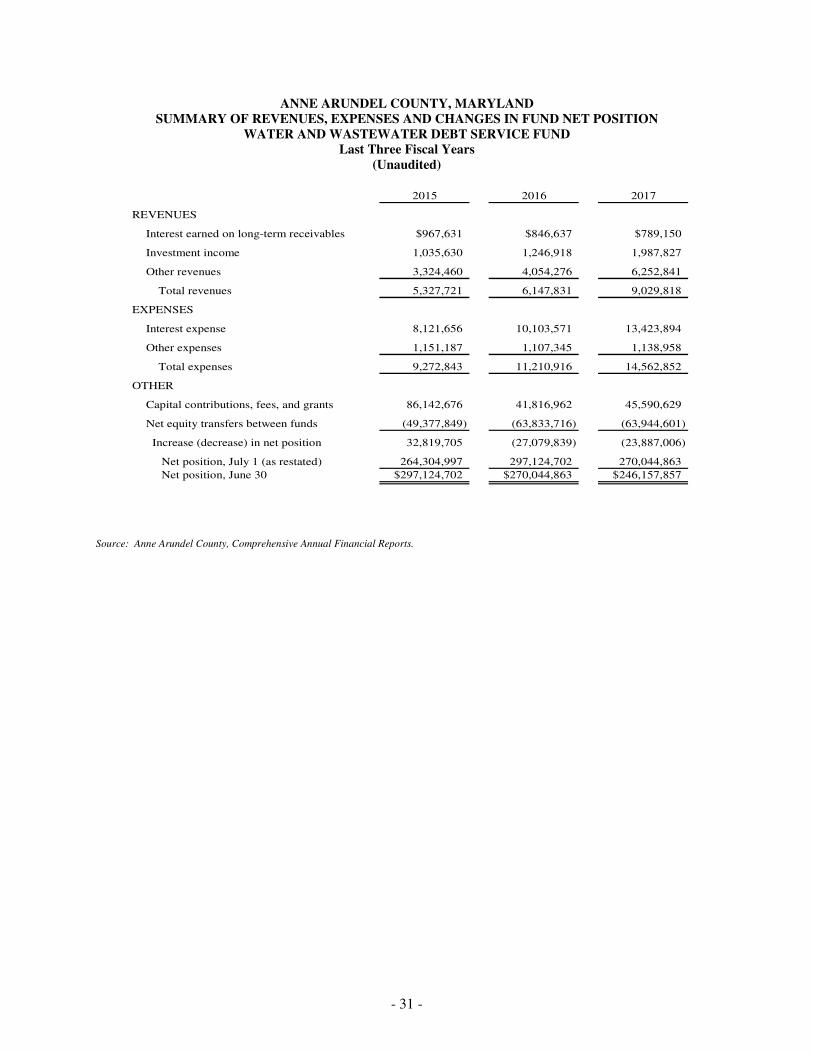
- 31 -
ANNE ARUNDEL COUNTY, MARYLAND
SUMMARY OF REVENUES, EXPENSES AND CHANGES IN FUND NET POSITION WATER AND WASTEWATER DEBT SERVICE FUND
Last Three Fiscal Years (Unaudited)
2015 2016 2017
REVENUES
Interest earned on long-term receivables $967,631 $846,637 $789,150
Investment income 1,035,630 1,246,918 1,987,827
Other revenues 3,324,460 4,054,276 6,252,841
Total revenues 5,327,721 6,147,831 9,029,818
EXPENSES
Interest expense 8,121,656 10,103,571 13,423,894
Other expenses 1,151,187 1,107,345 1,138,958
Total expenses 9,272,843 11,210,916 14,562,852
OTHER
Capital contributions, fees, and grants 86,142,676 41,816,962 45,590,629
Net equity transfers between funds (49,377,849) (63,833,716) (63,944,601)
Increase (decrease) in net position 32,819,705 (27,079,839) (23,887,006)
Net position, July 1 (as restated) 264,304,997 297,124,702 270,044,863
Net position, June 30 $297,124,702 $270,044,863 $246,157,857
Source: Anne Arundel County, Comprehensive Annual Financial Reports.
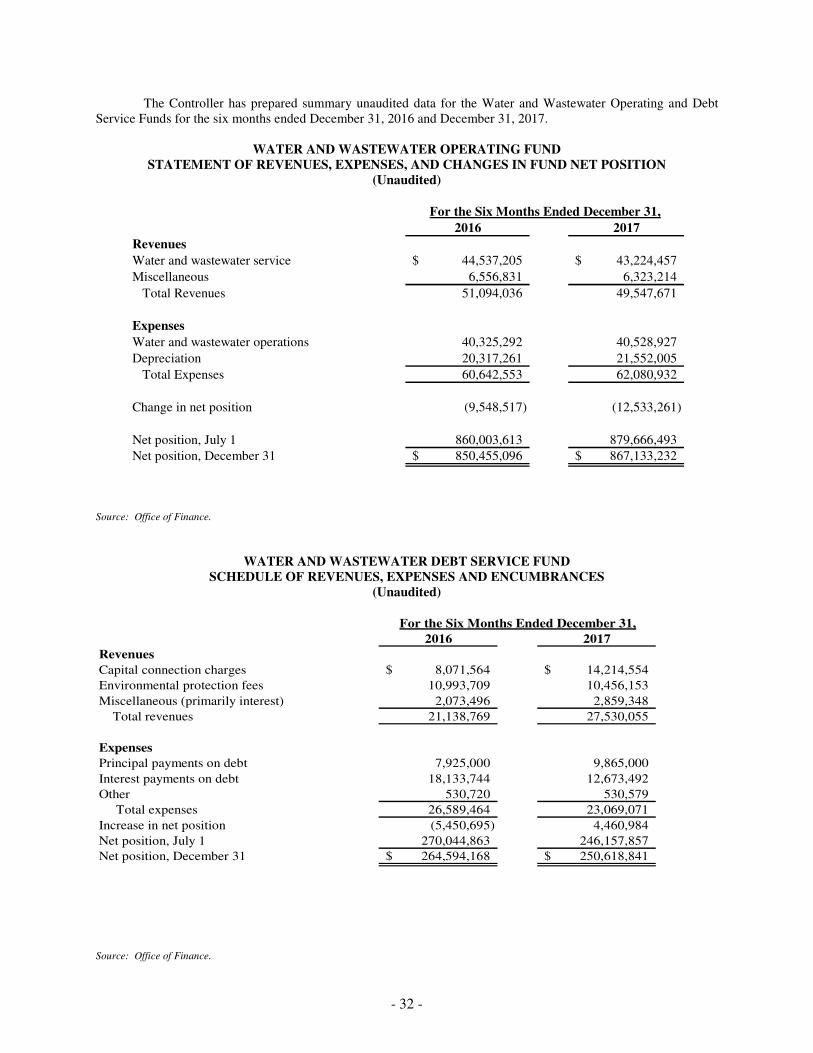
- 32 -
The Controller has prepared summary unaudited data for the Water and Wastewater Operating and Debt Service Funds for the six months ended December 31, 2016 and December 31, 2017.
WATER AND WASTEWATER OPERATING FUND STATEMENT OF REVENUES, EXPENSES, AND CHANGES IN FUND NET POSITION
(Unaudited)
2016 2017
Revenues
Water and wastewater service 44,537,205$ 43,224,457$
Miscellaneous 6,556,831 6,323,214
Total Revenues 51,094,036 49,547,671
Expenses
Water and wastewater operations 40,325,292 40,528,927
Depreciation 20,317,261 21,552,005
Total Expenses 60,642,553 62,080,932
Change in net position (9,548,517) (12,533,261)
Net position, July 1 860,003,613 879,666,493
Net position, December 31 850,455,096$ 867,133,232$
For the Six Months Ended December 31,
Source: Office of Finance.
WATER AND WASTEWATER DEBT SERVICE FUND SCHEDULE OF REVENUES, EXPENSES AND ENCUMBRANCES
(Unaudited)
2016 2017
Revenues
Capital connection charges 8,071,564$ 14,214,554$
Environmental protection fees 10,993,709 10,456,153
Miscellaneous (primarily interest) 2,073,496 2,859,348
Total revenues 21,138,769 27,530,055
Expenses
Principal payments on debt 7,925,000 9,865,000
Interest payments on debt 18,133,744 12,673,492
Other 530,720 530,579
Total expenses 26,589,464 23,069,071
Increase in net position (5,450,695) 4,460,984
Net position, July 1 270,044,863 246,157,857
Net position, December 31 264,594,168$ 250,618,841$
For the Six Months Ended December 31,
Source: Office of Finance.
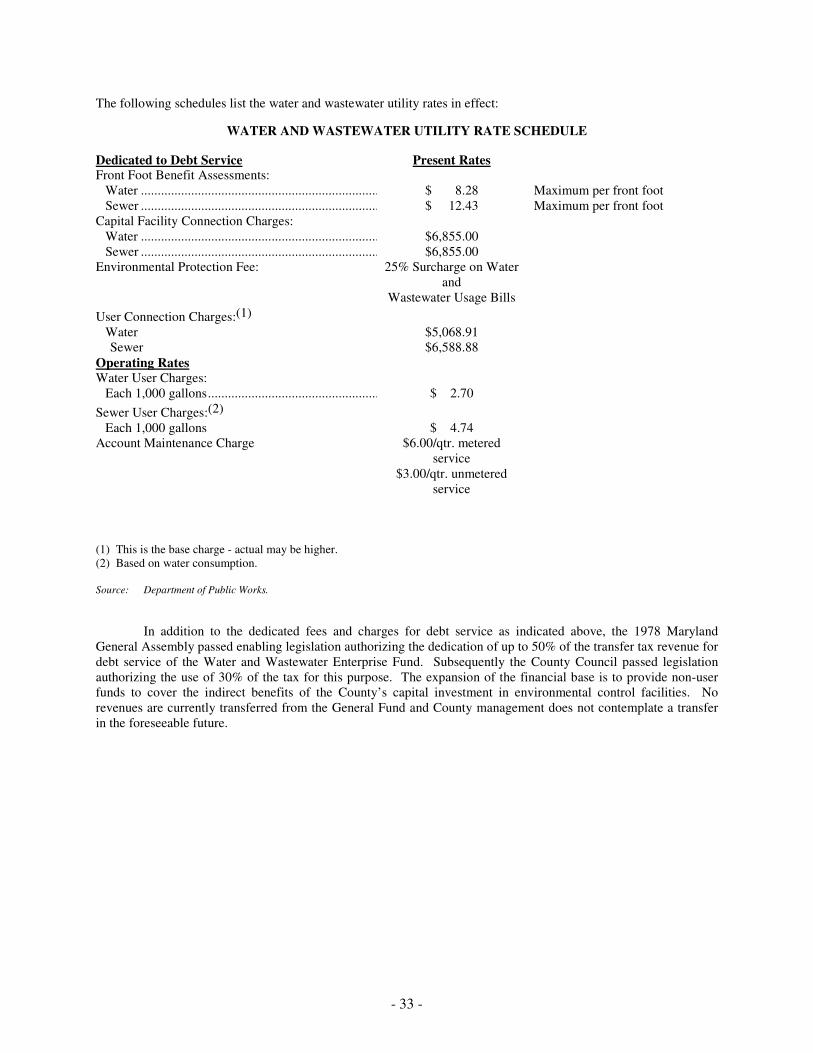
- 33 -
The following schedules list the water and wastewater utility rates in effect:
WATER AND WASTEWATER UTILITY RATE SCHEDULE
Dedicated to Debt Service Present Rates Front Foot Benefit Assessments: Water .......................................................................... $ 8.28 Maximum per front foot Sewer ......................................................................... $ 12.43 Maximum per front foot Capital Facility Connection Charges: Water .......................................................................... $6,855.00 Sewer ......................................................................... $6,855.00 Environmental Protection Fee: 25% Surcharge on Water
and Wastewater Usage Bills
User Connection Charges:(1)
Water $5,068.91 Sewer $6,588.88 Operating Rates Water User Charges: Each 1,000 gallons ..................................................... $ 2.70
Sewer User Charges:(2)
Each 1,000 gallons $ 4.74 Account Maintenance Charge $6.00/qtr. metered
service $3.00/qtr. unmetered
service
(1) This is the base charge - actual may be higher. (2) Based on water consumption. Source: Department of Public Works.
In addition to the dedicated fees and charges for debt service as indicated above, the 1978 Maryland General Assembly passed enabling legislation authorizing the dedication of up to 50% of the transfer tax revenue for debt service of the Water and Wastewater Enterprise Fund. Subsequently the County Council passed legislation authorizing the use of 30% of the tax for this purpose. The expansion of the financial base is to provide non-user funds to cover the indirect benefits of the County’s capital investment in environmental control facilities. No revenues are currently transferred from the General Fund and County management does not contemplate a transfer in the foreseeable future.
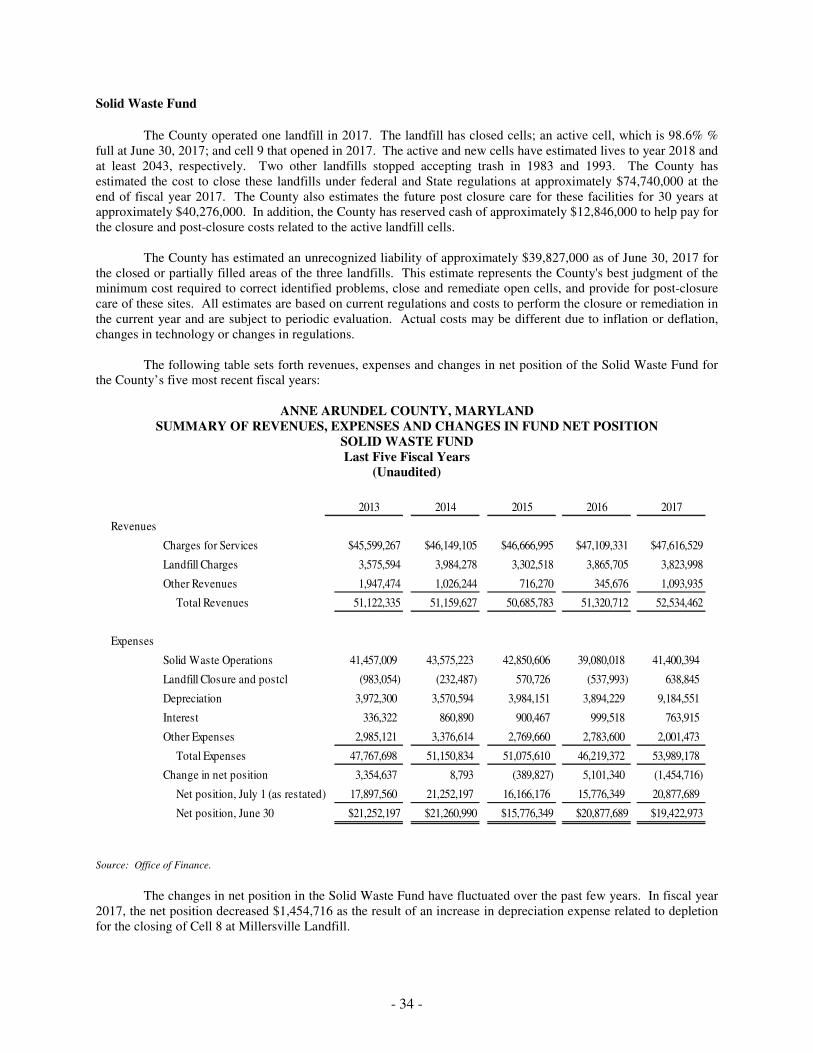
- 34 -
Solid Waste Fund
The County operated one landfill in 2017. The landfill has closed cells; an active cell, which is 98.6% % full at June 30, 2017; and cell 9 that opened in 2017. The active and new cells have estimated lives to year 2018 and at least 2043, respectively. Two other landfills stopped accepting trash in 1983 and 1993. The County has estimated the cost to close these landfills under federal and State regulations at approximately $74,740,000 at the end of fiscal year 2017. The County also estimates the future post closure care for these facilities for 30 years at approximately $40,276,000. In addition, the County has reserved cash of approximately $12,846,000 to help pay for the closure and post-closure costs related to the active landfill cells. The County has estimated an unrecognized liability of approximately $39,827,000 as of June 30, 2017 for the closed or partially filled areas of the three landfills. This estimate represents the County's best judgment of the minimum cost required to correct identified problems, close and remediate open cells, and provide for post-closure care of these sites. All estimates are based on current regulations and costs to perform the closure or remediation in the current year and are subject to periodic evaluation. Actual costs may be different due to inflation or deflation, changes in technology or changes in regulations. The following table sets forth revenues, expenses and changes in net position of the Solid Waste Fund for the County’s five most recent fiscal years:
ANNE ARUNDEL COUNTY, MARYLAND SUMMARY OF REVENUES, EXPENSES AND CHANGES IN FUND NET POSITION
SOLID WASTE FUND Last Five Fiscal Years
(Unaudited)
2013 2014 2015 2016 2017
Revenues
Charges for Services $45,599,267 $46,149,105 $46,666,995 $47,109,331 $47,616,529
Landfill Charges 3,575,594 3,984,278 3,302,518 3,865,705 3,823,998
Other Revenues 1,947,474 1,026,244 716,270 345,676 1,093,935
Total Revenues 51,122,335 51,159,627 50,685,783 51,320,712 52,534,462
Expenses
Solid Waste Operations 41,457,009 43,575,223 42,850,606 39,080,018 41,400,394
Landfill Closure and postcl (983,054) (232,487) 570,726 (537,993) 638,845
Depreciation 3,972,300 3,570,594 3,984,151 3,894,229 9,184,551
Interest 336,322 860,890 900,467 999,518 763,915
Other Expenses 2,985,121 3,376,614 2,769,660 2,783,600 2,001,473
Total Expenses 47,767,698 51,150,834 51,075,610 46,219,372 53,989,178
Change in net position 3,354,637 8,793 (389,827) 5,101,340 (1,454,716)
Net position, July 1 (as restated) 17,897,560 21,252,197 16,166,176 15,776,349 20,877,689
Net position, June 30 $21,252,197 $21,260,990 $15,776,349 $20,877,689 $19,422,973
Source: Office of Finance.
The changes in net position in the Solid Waste Fund have fluctuated over the past few years. In fiscal year
2017, the net position decreased $1,454,716 as the result of an increase in depreciation expense related to depletion for the closing of Cell 8 at Millersville Landfill.
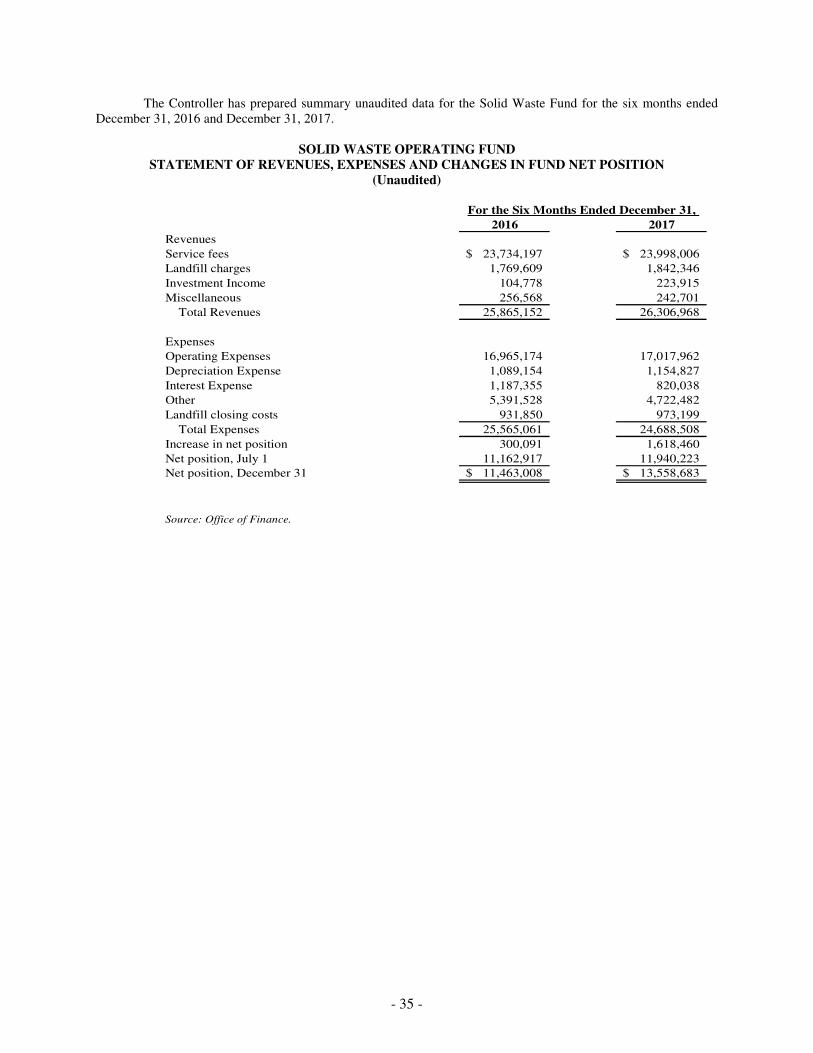
- 35 -
The Controller has prepared summary unaudited data for the Solid Waste Fund for the six months ended December 31, 2016 and December 31, 2017.
SOLID WASTE OPERATING FUND STATEMENT OF REVENUES, EXPENSES AND CHANGES IN FUND NET POSITION
(Unaudited)
2016 2017
Revenues
Service fees 23,734,197$ 23,998,006$
Landfill charges 1,769,609 1,842,346
Investment Income 104,778 223,915
Miscellaneous 256,568 242,701
Total Revenues 25,865,152 26,306,968
Expenses
Operating Expenses 16,965,174 17,017,962
Depreciation Expense 1,089,154 1,154,827
Interest Expense 1,187,355 820,038
Other 5,391,528 4,722,482
Landfill closing costs 931,850 973,199
Total Expenses 25,565,061 24,688,508
Increase in net position 300,091 1,618,460
Net position, July 1 11,162,917 11,940,223
Net position, December 31 11,463,008$ 13,558,683$
Source: Office of Finance.
For the Six Months Ended December 31,
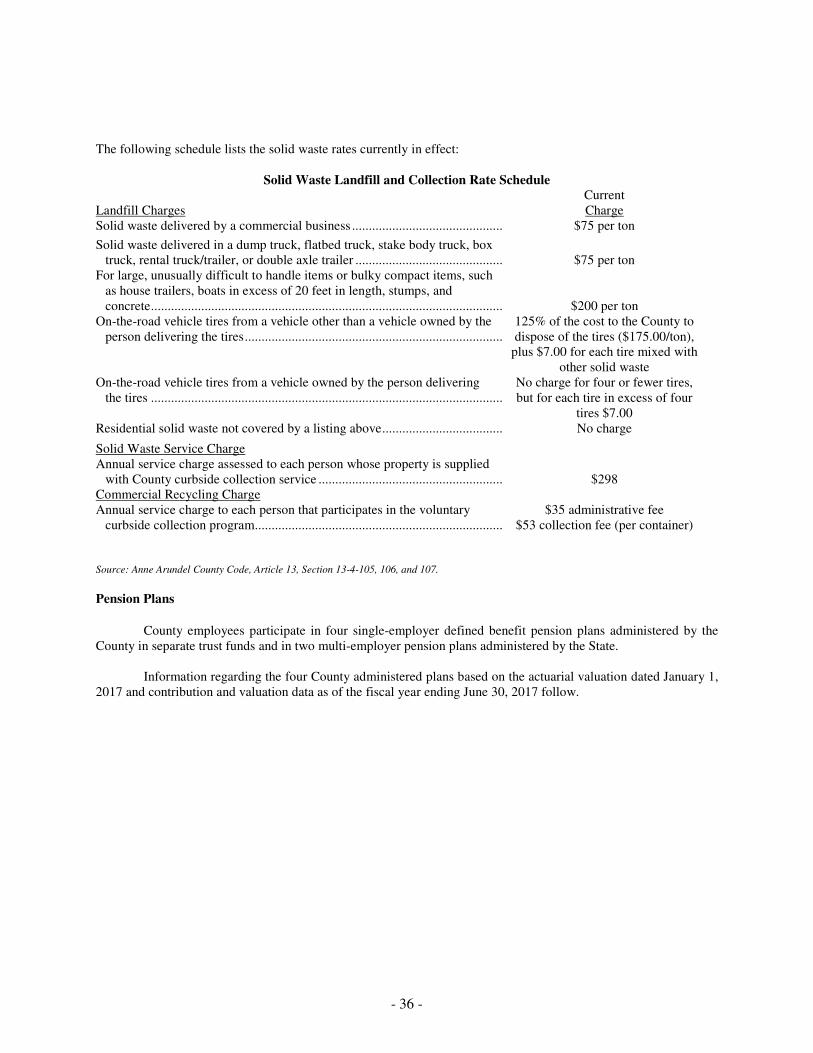
- 36 -
The following schedule lists the solid waste rates currently in effect:
Solid Waste Landfill and Collection Rate Schedule Landfill Charges
Current Charge
Solid waste delivered by a commercial business ................................................................ $75 per ton
Solid waste delivered in a dump truck, flatbed truck, stake body truck, box truck, rental truck/trailer, or double axle trailer ................................................................
$75 per ton
For large, unusually difficult to handle items or bulky compact items, such as house trailers, boats in excess of 20 feet in length, stumps, and concrete ................................................................................................................................
$200 per ton On-the-road vehicle tires from a vehicle other than a vehicle owned by the
person delivering the tires ................................................................................................125% of the cost to the County to dispose of the tires ($175.00/ton),
plus $7.00 for each tire mixed with other solid waste
On-the-road vehicle tires from a vehicle owned by the person delivering the tires ................................................................................................................................
No charge for four or fewer tires, but for each tire in excess of four
tires $7.00 Residential solid waste not covered by a listing above ................................................................No charge
Solid Waste Service Charge Annual service charge assessed to each person whose property is supplied
with County curbside collection service ................................................................
$298 Commercial Recycling Charge Annual service charge to each person that participates in the voluntary
curbside collection program ................................................................................................
$35 administrative fee
$53 collection fee (per container) Source: Anne Arundel County Code, Article 13, Section 13-4-105, 106, and 107.
Pension Plans
County employees participate in four single-employer defined benefit pension plans administered by the County in separate trust funds and in two multi-employer pension plans administered by the State. Information regarding the four County administered plans based on the actuarial valuation dated January 1, 2017 and contribution and valuation data as of the fiscal year ending June 30, 2017 follow.
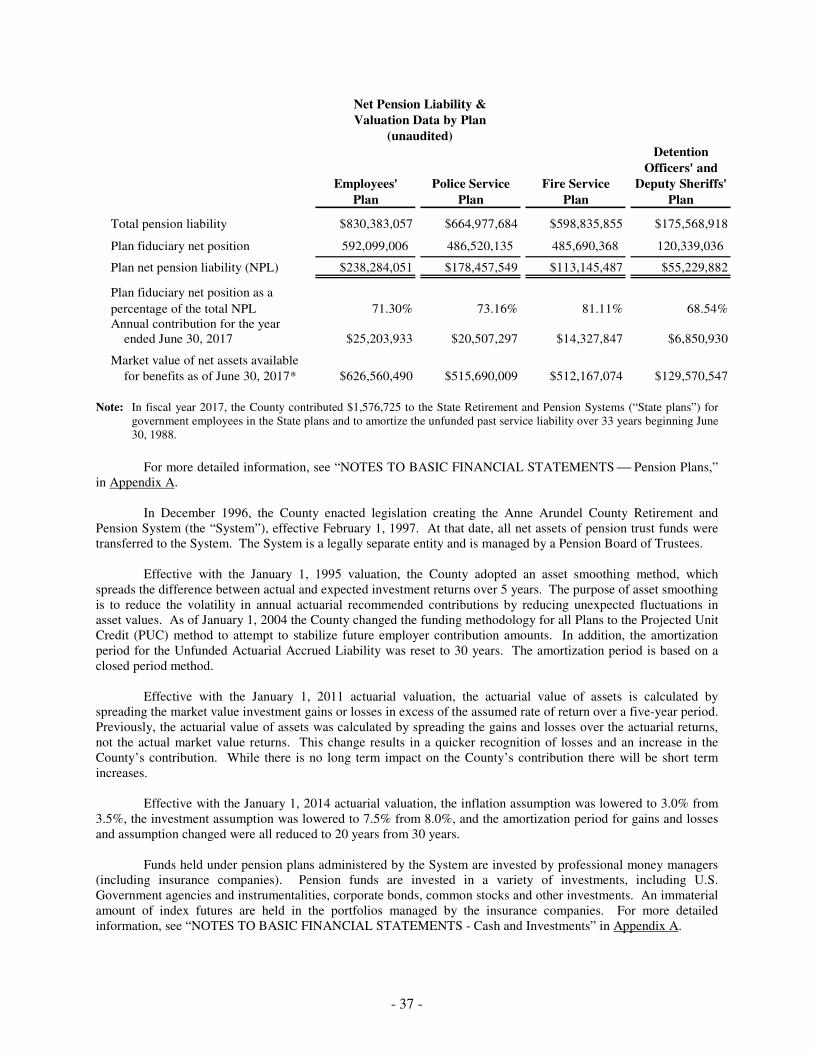
- 37 -
Detention
Officers' and
Employees' Police Service Fire Service Deputy Sheriffs'
Plan Plan Plan Plan
Total pension liability $830,383,057 $664,977,684 $598,835,855 $175,568,918
Plan fiduciary net position 592,099,006 486,520,135 485,690,368 120,339,036
Plan net pension liability (NPL) $238,284,051 $178,457,549 $113,145,487 $55,229,882
Plan fiduciary net position as a
percentage of the total NPL 71.30% 73.16% 81.11% 68.54%Annual contribution for the year ended June 30, 2017 $25,203,933 $20,507,297 $14,327,847 $6,850,930
Market value of net assets available
for benefits as of June 30, 2017* $626,560,490 $515,690,009 $512,167,074 $129,570,547
Net Pension Liability &
Valuation Data by Plan
(unaudited)
Note: In fiscal year 2017, the County contributed $1,576,725 to the State Retirement and Pension Systems (“State plans”) for
government employees in the State plans and to amortize the unfunded past service liability over 33 years beginning June 30, 1988.
For more detailed information, see “NOTES TO BASIC FINANCIAL STATEMENTS Pension Plans,” in Appendix A.
In December 1996, the County enacted legislation creating the Anne Arundel County Retirement and Pension System (the “System”), effective February 1, 1997. At that date, all net assets of pension trust funds were transferred to the System. The System is a legally separate entity and is managed by a Pension Board of Trustees. Effective with the January 1, 1995 valuation, the County adopted an asset smoothing method, which spreads the difference between actual and expected investment returns over 5 years. The purpose of asset smoothing is to reduce the volatility in annual actuarial recommended contributions by reducing unexpected fluctuations in asset values. As of January 1, 2004 the County changed the funding methodology for all Plans to the Projected Unit Credit (PUC) method to attempt to stabilize future employer contribution amounts. In addition, the amortization period for the Unfunded Actuarial Accrued Liability was reset to 30 years. The amortization period is based on a closed period method. Effective with the January 1, 2011 actuarial valuation, the actuarial value of assets is calculated by spreading the market value investment gains or losses in excess of the assumed rate of return over a five-year period. Previously, the actuarial value of assets was calculated by spreading the gains and losses over the actuarial returns, not the actual market value returns. This change results in a quicker recognition of losses and an increase in the County’s contribution. While there is no long term impact on the County’s contribution there will be short term increases. Effective with the January 1, 2014 actuarial valuation, the inflation assumption was lowered to 3.0% from 3.5%, the investment assumption was lowered to 7.5% from 8.0%, and the amortization period for gains and losses and assumption changed were all reduced to 20 years from 30 years. Funds held under pension plans administered by the System are invested by professional money managers (including insurance companies). Pension funds are invested in a variety of investments, including U.S. Government agencies and instrumentalities, corporate bonds, common stocks and other investments. An immaterial amount of index futures are held in the portfolios managed by the insurance companies. For more detailed information, see “NOTES TO BASIC FINANCIAL STATEMENTS - Cash and Investments” in Appendix A.
- 38 -
Other Post-Employment Benefits
The primary government provides a group health plan for employees and retirees under the authority of §
6-1-308 of the County Code. This health plan may be extended to other component units under § 6-1-309 of the County Code. The Community College and the Library provide retiree health insurance through participation in the County’s health plans. The County collects premiums from these entities to offset the related costs. The County Code requires the County to pay 80.0% of the health coverage cost for current County retirees and terminated vested employees that retired before July 1, 2014. Employees not eligible for normal or early retirement by January 1, 2017 will receive a subsidy based on years of service. The Library currently pays 80.0% for Library retirees. The primary government plan provides the same health plans to active employees and pre-age sixty-five retirees. The County offers a Medicare Advantage Plan to post age sixty-five retirees. The County offers the same prescription benefit for active employees and pre-age sixty-five retirees. Post age sixty-five retirees are eligible to participate in an Employer Group Waiver Plan plus WRAP for prescription benefits. County and Library retirees have the option of retaining dental and vision coverage, but must pay the full premium for these benefits.
Anne Arundel County Public Schools (“AACPS”) employees eligible to retire and receive Maryland State Retirement Agency benefits may be eligible for retiree healthcare benefits based on date of hire and service criteria. Employees hired prior to September 15, 2002 receive Board funding of 75.0% for Medical/Rx and dental benefits. For employees hired after September 15, 2002, ten years of AACPS service is required to be eligible for retiree health benefits. The Board funds a portion of the medical premium ranging from 25.0% with ten years of service to 75.0% with twenty or more years of service. No Board funding is provided for dental benefits. No Board funding is provided for vision coverage regardless of service date. Active employees and retirees have the same medical, dental, and vision plans while retirees over sixty-five have three Medicare Supplemental Plans available. The retiree and active prescription plan co-payments differ. The retiree plan is evaluated separately based on claims experience; however, a blended percentage increase has been applied to the retiree rates.
The Community College (the “College”) provides medical, dental, and vision benefits to eligible retirees who are enrolled in medical coverage at the time of retirement. The benefit levels, employee contributions, and employer contributions are governed by and may be amended by the College Board of Trustees. Retirees are eligible for these benefits if they have a minimum of ten years of service and meet the eligibility requirement of their retirement plan, (Maryland State Retirement System or Optional plan). The College contributes to the cost of retirees’ benefits at a rate of 2.5% for each year of service, and employees must have at least ten years of service to qualify. The maximum paid by the College is 75.0%. Retirees have no vested rights to these benefits. The County utilized the actuarial services of Bolton Partners and Aon Consulting to formulate its findings. According to this report, the combined actuarial estimates of the County’s and its component units’ total actuarial accrued liability (“AAL”) is $3,126,979,000. The annual required contribution (“ARC”) is estimated at $239,175,000. The actuarial results noted herein are based on a 6.38% investment rate of return.
An amendment to the Charter of Anne Arundel County was passed by the citizens of the County in November 2012. This amendment requires the County to establish a fund for the purpose of reserving funds to pay for health insurance benefits provided to retired County employees and their spouses, dependents and survivors. It also allows the County to establish an irrevocable trust fund for the purpose of paying for health insurance benefits provided to this group. The County has established an irrevocable trust fund effective in fiscal year 2016.
The entities currently fund the retirees’ healthcare costs on a Pay-As-You-Go basis. The County established a Collaborative Benefits Committee through resolution to review existing benefits, assess the impact of continued increases in the costs of these benefits on current and projected revenues and expenditures, determine the fair and equitable priorities in the reduction of the benefit costs and report to the County Executive and the County Council on these recommendations. A final report was issued by the Committee on February 14, 2012. The County Council passed legislation in January 2014 to address some of the recommendations from the study. The legislation restructures benefits for current retirees, current employees and new employees resulting in approximately a 25% reduction in AAL and ARC.
- 39 -
The County’s health plan operates on a calendar year basis. As of January 1, 2014, employees received an additional increase in co-pays and deductibles. The cost savings from these plan changes will be used to fund the annual required contribution.
The Health Benefits Trust was established as of July 1, 2015. The creation of the trust will allow the County to use a higher actuarial rate of return which will enable the County to fund the Other Post-Employment Benefits annual required contribution by 2021.
Recent Developments Recent developments concerning the County include:
• On June 14, 2017, the County Council passed the County Executive’s $1.5 billion operating budget and $380.6 million capital budget for the fiscal year ending June 30, 2018. The County’s local income tax rate remains at 2.50% and the property tax rate decreases from .915 cents to .907 cents per hundred of assessed value, consistent with the County’s property tax revenue cap. The budget included, among other items, (i) funding the Board of Education above maintenance of effort at $681.7 million, (ii) a two to three percent MERIT increase and two percent Cost of Living Adjustment (COLA) for County employees, and (iii) a contribution of $4.0 million to the Revenue Reserve Fund.
• Other significant funds included in the County’s fiscal year 2018 budget include the Water and Wastewater Fund, where water and sewer rates were unchanged and projected fund balance will be in excess of the two month operating expense specified in the County’s financial policies. The Waste Collection Fund, which collects and disposes of solid waste, maintains a rate of $298 per household receiving County waste removal services.
• The Watershed Protection and Restoration Fund (WPRF) was funded in fiscal year 2014 in order to implement a State mandated program of capital projects, operating maintenance, and other required efforts to reduce the County’s contribution of harmful pollutants associated with stormwater and poor water quality affecting local rivers and the Chesapeake Bay. This WPRF is a dedicated fund financed through a fee based upon a property’s impervious surface and was fully phased in for fiscal year 2016. The County debt policy specifies the debt will not exceed the fees generated to support the program.
• On July 20, 2015, the County Council passed legislation which increases the annual appropriation amount to the Revenue Reserve Fund by allowing the balance of the fund to not exceed 5% of the estimated general fund revenues for the upcoming fiscal year.

- 40 -
(This page has been left blank intentionally.)
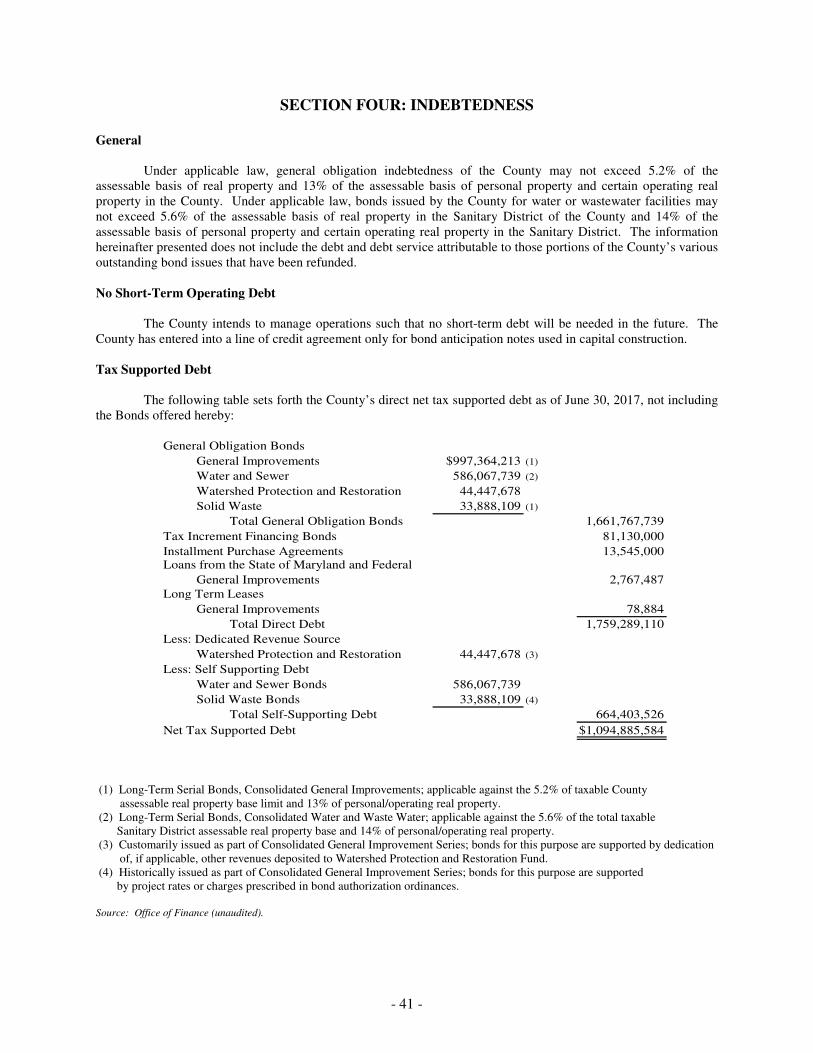
- 41 -
SECTION FOUR: INDEBTEDNESS
General Under applicable law, general obligation indebtedness of the County may not exceed 5.2% of the assessable basis of real property and 13% of the assessable basis of personal property and certain operating real property in the County. Under applicable law, bonds issued by the County for water or wastewater facilities may not exceed 5.6% of the assessable basis of real property in the Sanitary District of the County and 14% of the assessable basis of personal property and certain operating real property in the Sanitary District. The information hereinafter presented does not include the debt and debt service attributable to those portions of the County’s various outstanding bond issues that have been refunded. No Short-Term Operating Debt The County intends to manage operations such that no short-term debt will be needed in the future. The County has entered into a line of credit agreement only for bond anticipation notes used in capital construction. Tax Supported Debt The following table sets forth the County’s direct net tax supported debt as of June 30, 2017, not including the Bonds offered hereby:
General Obligation Bonds
General Improvements $997,364,213 (1)
Water and Sewer 586,067,739 (2)
Watershed Protection and Restoration 44,447,678
Solid Waste 33,888,109 (1)
Total General Obligation Bonds 1,661,767,739
Tax Increment Financing Bonds 81,130,000
Installment Purchase Agreements 13,545,000Loans from the State of Maryland and Federal
General Improvements 2,767,487Long Term Leases
General Improvements 78,884
Total Direct Debt 1,759,289,110
Less: Dedicated Revenue Source
Watershed Protection and Restoration 44,447,678 (3)
Less: Self Supporting Debt
Water and Sewer Bonds 586,067,739
Solid Waste Bonds 33,888,109 (4)
Total Self-Supporting Debt 664,403,526
Net Tax Supported Debt $1,094,885,584
(1) Long-Term Serial Bonds, Consolidated General Improvements; applicable against the 5.2% of taxable County assessable real property base limit and 13% of personal/operating real property. (2) Long-Term Serial Bonds, Consolidated Water and Waste Water; applicable against the 5.6% of the total taxable Sanitary District assessable real property base and 14% of personal/operating real property. (3) Customarily issued as part of Consolidated General Improvement Series; bonds for this purpose are supported by dedication
of, if applicable, other revenues deposited to Watershed Protection and Restoration Fund. (4) Historically issued as part of Consolidated General Improvement Series; bonds for this purpose are supported by project rates or charges prescribed in bond authorization ordinances. Source: Office of Finance (unaudited).
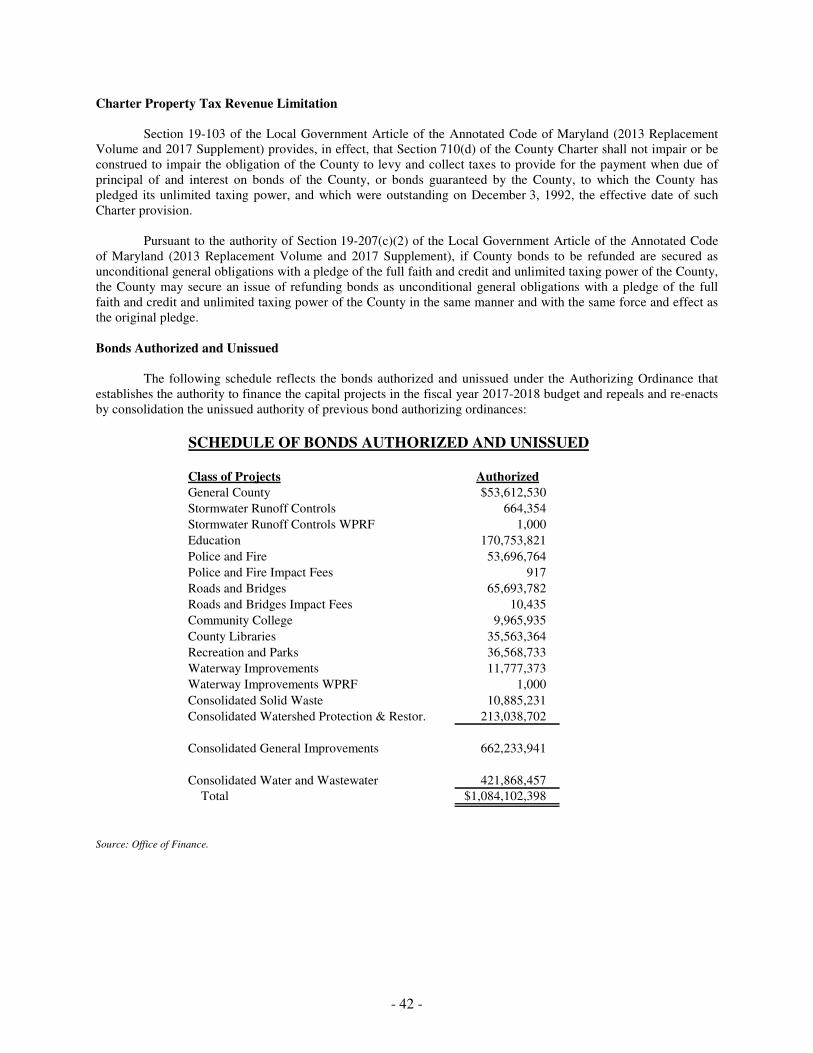
- 42 -
Charter Property Tax Revenue Limitation Section 19-103 of the Local Government Article of the Annotated Code of Maryland (2013 Replacement Volume and 2017 Supplement) provides, in effect, that Section 710(d) of the County Charter shall not impair or be construed to impair the obligation of the County to levy and collect taxes to provide for the payment when due of principal of and interest on bonds of the County, or bonds guaranteed by the County, to which the County has pledged its unlimited taxing power, and which were outstanding on December 3, 1992, the effective date of such Charter provision. Pursuant to the authority of Section 19-207(c)(2) of the Local Government Article of the Annotated Code of Maryland (2013 Replacement Volume and 2017 Supplement), if County bonds to be refunded are secured as unconditional general obligations with a pledge of the full faith and credit and unlimited taxing power of the County, the County may secure an issue of refunding bonds as unconditional general obligations with a pledge of the full faith and credit and unlimited taxing power of the County in the same manner and with the same force and effect as the original pledge. Bonds Authorized and Unissued The following schedule reflects the bonds authorized and unissued under the Authorizing Ordinance that establishes the authority to finance the capital projects in the fiscal year 2017-2018 budget and repeals and re-enacts by consolidation the unissued authority of previous bond authorizing ordinances:
SCHEDULE OF BONDS AUTHORIZED AND UNISSUED
Class of Projects Authorized
General County $53,612,530
Stormwater Runoff Controls 664,354
Stormwater Runoff Controls WPRF 1,000
Education 170,753,821
Police and Fire 53,696,764
Police and Fire Impact Fees 917
Roads and Bridges 65,693,782
Roads and Bridges Impact Fees 10,435
Community College 9,965,935
County Libraries 35,563,364
Recreation and Parks 36,568,733
Waterway Improvements 11,777,373
Waterway Improvements WPRF 1,000
Consolidated Solid Waste 10,885,231
Consolidated Watershed Protection & Restor. 213,038,702
Consolidated General Improvements 662,233,941
Consolidated Water and Wastewater 421,868,457
Total $1,084,102,398
Source: Office of Finance.
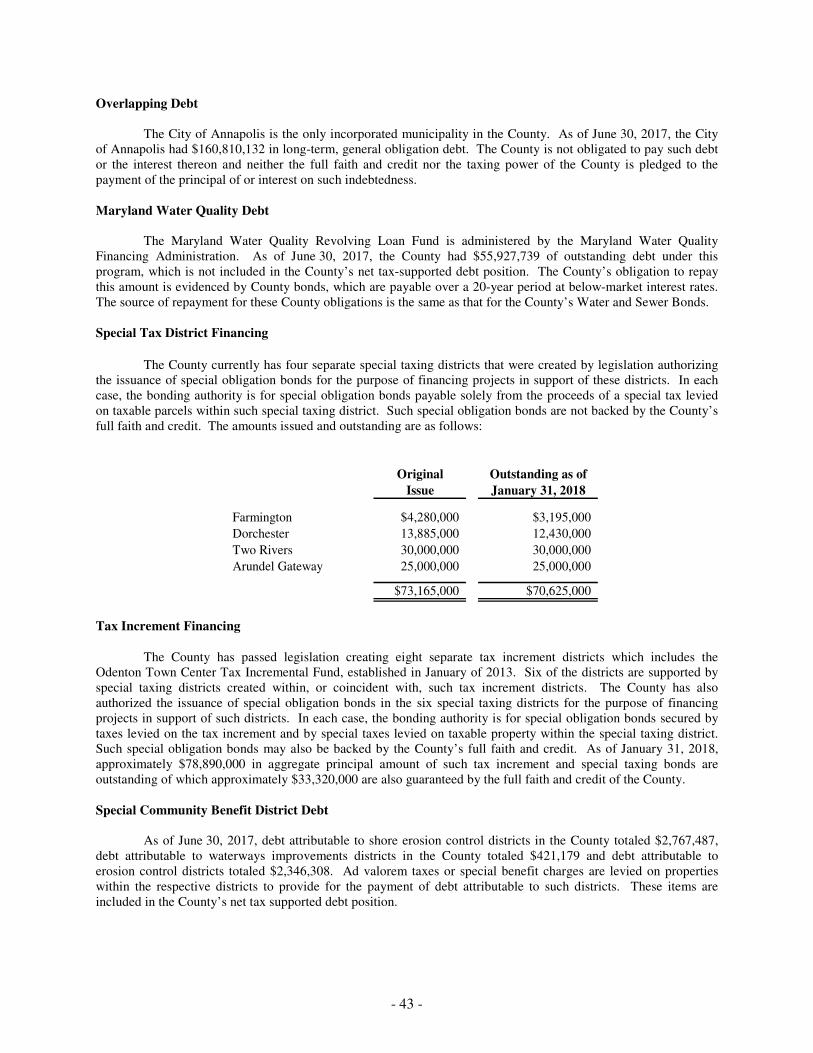
- 43 -
Overlapping Debt The City of Annapolis is the only incorporated municipality in the County. As of June 30, 2017, the City of Annapolis had $160,810,132 in long-term, general obligation debt. The County is not obligated to pay such debt or the interest thereon and neither the full faith and credit nor the taxing power of the County is pledged to the payment of the principal of or interest on such indebtedness. Maryland Water Quality Debt The Maryland Water Quality Revolving Loan Fund is administered by the Maryland Water Quality Financing Administration. As of June 30, 2017, the County had $55,927,739 of outstanding debt under this program, which is not included in the County’s net tax-supported debt position. The County’s obligation to repay this amount is evidenced by County bonds, which are payable over a 20-year period at below-market interest rates. The source of repayment for these County obligations is the same as that for the County’s Water and Sewer Bonds. Special Tax District Financing
The County currently has four separate special taxing districts that were created by legislation authorizing
the issuance of special obligation bonds for the purpose of financing projects in support of these districts. In each case, the bonding authority is for special obligation bonds payable solely from the proceeds of a special tax levied on taxable parcels within such special taxing district. Such special obligation bonds are not backed by the County’s full faith and credit. The amounts issued and outstanding are as follows:
Original Outstanding as of
Issue January 31, 2018
Farmington $4,280,000 $3,195,000
Dorchester 13,885,000 12,430,000
Two Rivers 30,000,000 30,000,000
Arundel Gateway 25,000,000 25,000,000
$73,165,000 $70,625,000
Tax Increment Financing
The County has passed legislation creating eight separate tax increment districts which includes the Odenton Town Center Tax Incremental Fund, established in January of 2013. Six of the districts are supported by special taxing districts created within, or coincident with, such tax increment districts. The County has also authorized the issuance of special obligation bonds in the six special taxing districts for the purpose of financing projects in support of such districts. In each case, the bonding authority is for special obligation bonds secured by taxes levied on the tax increment and by special taxes levied on taxable property within the special taxing district. Such special obligation bonds may also be backed by the County’s full faith and credit. As of January 31, 2018, approximately $78,890,000 in aggregate principal amount of such tax increment and special taxing bonds are outstanding of which approximately $33,320,000 are also guaranteed by the full faith and credit of the County. Special Community Benefit District Debt As of June 30, 2017, debt attributable to shore erosion control districts in the County totaled $2,767,487, debt attributable to waterways improvements districts in the County totaled $421,179 and debt attributable to erosion control districts totaled $2,346,308. Ad valorem taxes or special benefit charges are levied on properties within the respective districts to provide for the payment of debt attributable to such districts. These items are included in the County’s net tax supported debt position.
- 44 -
Revenue Authority
There is one active revenue authority within the County, which is presented as a component unit in the
County’s financial statements. This authority was created in February 1998 to acquire, construct, improve, equip,
furnish, maintain and operate Tipton Airport. The United States Army, as part of the Fort Meade operation, had
previously operated this airport. During fiscal year 2002, title to the land and improvements transferred to Anne
Arundel County. The County provides some support to this authority for operating costs and capital improvements.
A second authority was created to construct and manage recreational facilities within the County. This recreational
authority is currently inactive. Public School Financing State Assumption of Public School Capital Construction Costs
Legislation enacted by the Maryland General Assembly in 1971 provides for the assumption by the State, under certain conditions, of the costs of public school construction projects and public school capital improvements on a State-wide basis. This law provides that the State of Maryland will pay the costs in excess of available Federal funds of all public school construction projects and public school capital improvements in the counties and Baltimore City, which have been approved by the Board of Public Works and empowers the Board of Public Works to define by regulation what shall constitute an approved construction or capital improvement cost. On December 30, 1987, the Board of Public Works adopted revised “Rules, Regulations and Procedures for the Administration of the School Construction Program” (the “Revised Rules”). Under these rules, the Board shall establish a maximum State construction allocation which is the maximum State participation for each project when it is being considered for inclusion in an annual capital improvement program for construction funding as follows: (a) The maximum State construction allocation shall be based on the product of the latest adjusted average statewide per square foot cost of construction for schools in the State and the approved area allowances for the project as limited by the Public School Construction Program capacity and space formula and these rules and regulations. (b) The average per square foot cost of school construction based on the best cost experience of schools constructed in the prior year(s) shall be published at least annually. The per square foot construction cost shall include site work, and the per square foot building cost shall exclude site work. (c) The maximum State construction allocation shall also include adjustments for inflation to time of bid, regional cost differences, and a percentage for contingency as determined by the Committee. (d) The maximum State construction allocation shall be adjusted to reflect the State and local sharing of this expenditure for all projects approved for local planning on or after February 11, 1987. The State share, which represents the maximum State construction allocation for the eligible portion of a construction contract is computed by applying a factor of 50% for the County to the factors cited in sections (a), (b) and (c) above.
Economic Development Revenue Bonds
The County has encouraged industry to locate and remain in the County by, among other things, the issuance of industrial development revenue bonds and pollution control revenue bonds pursuant to the Maryland Economic Development Revenue Bond Act and earlier statutory authority and the Maryland Industrial Development Financing Authority Act. Economic development revenue bonds do not constitute indebtedness nor a charge against the general credit or taxing powers of the County. For more detailed information, see “NOTES TO THE BASIC FINANCIAL STATEMENTS - Conduit Debt” in Appendix A.
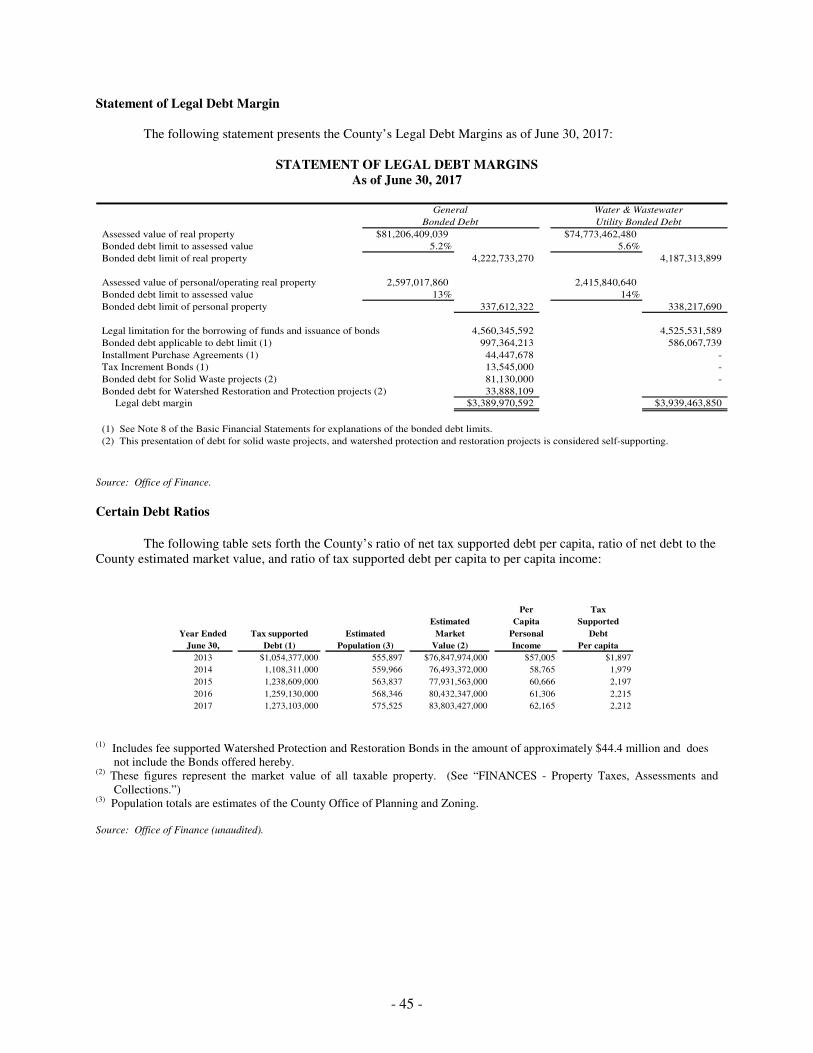
- 45 -
Statement of Legal Debt Margin The following statement presents the County’s Legal Debt Margins as of June 30, 2017:
STATEMENT OF LEGAL DEBT MARGINS As of June 30, 2017
Assessed value of real property $81,206,409,039 $74,773,462,480
Bonded debt limit to assessed value 5.2% 5.6%
Bonded debt limit of real property 4,222,733,270 4,187,313,899
Assessed value of personal/operating real property 2,597,017,860 2,415,840,640
Bonded debt limit to assessed value 13% 14%
Bonded debt limit of personal property 337,612,322 338,217,690
Legal limitation for the borrowing of funds and issuance of bonds 4,560,345,592 4,525,531,589
Bonded debt applicable to debt limit (1) 997,364,213 586,067,739
Installment Purchase Agreements (1) 44,447,678 -
Tax Increment Bonds (1) 13,545,000 -
Bonded debt for Solid Waste projects (2) 81,130,000 -
Bonded debt for Watershed Restoration and Protection projects (2) 33,888,109
Legal debt margin $3,389,970,592 $3,939,463,850
(1) See Note 8 of the Basic Financial Statements for explanations of the bonded debt limits.
(2) This presentation of debt for solid waste projects, and watershed protection and restoration projects is considered self-supporting.
General
Bonded Debt
Water & Wastewater
Utility Bonded Debt
Source: Office of Finance.
Certain Debt Ratios
The following table sets forth the County’s ratio of net tax supported debt per capita, ratio of net debt to the County estimated market value, and ratio of tax supported debt per capita to per capita income:
Per Tax
Estimated Capita Supported
Year Ended Tax supported Estimated Market Personal Debt
June 30, Debt (1) Population (3) Value (2) Income Per capita
2013 $1,054,377,000 555,897 $76,847,974,000 $57,005 $1,897
2014 1,108,311,000 559,966 76,493,372,000 58,765 1,979
2015 1,238,609,000 563,837 77,931,563,000 60,666 2,197
2016 1,259,130,000 568,346 80,432,347,000 61,306 2,215
2017 1,273,103,000 575,525 83,803,427,000 62,165 2,212
(1) Includes fee supported Watershed Protection and Restoration Bonds in the amount of approximately $44.4 million and does
not include the Bonds offered hereby. (2) These figures represent the market value of all taxable property. (See “FINANCES - Property Taxes, Assessments and
Collections.”) (3) Population totals are estimates of the County Office of Planning and Zoning. Source: Office of Finance (unaudited).
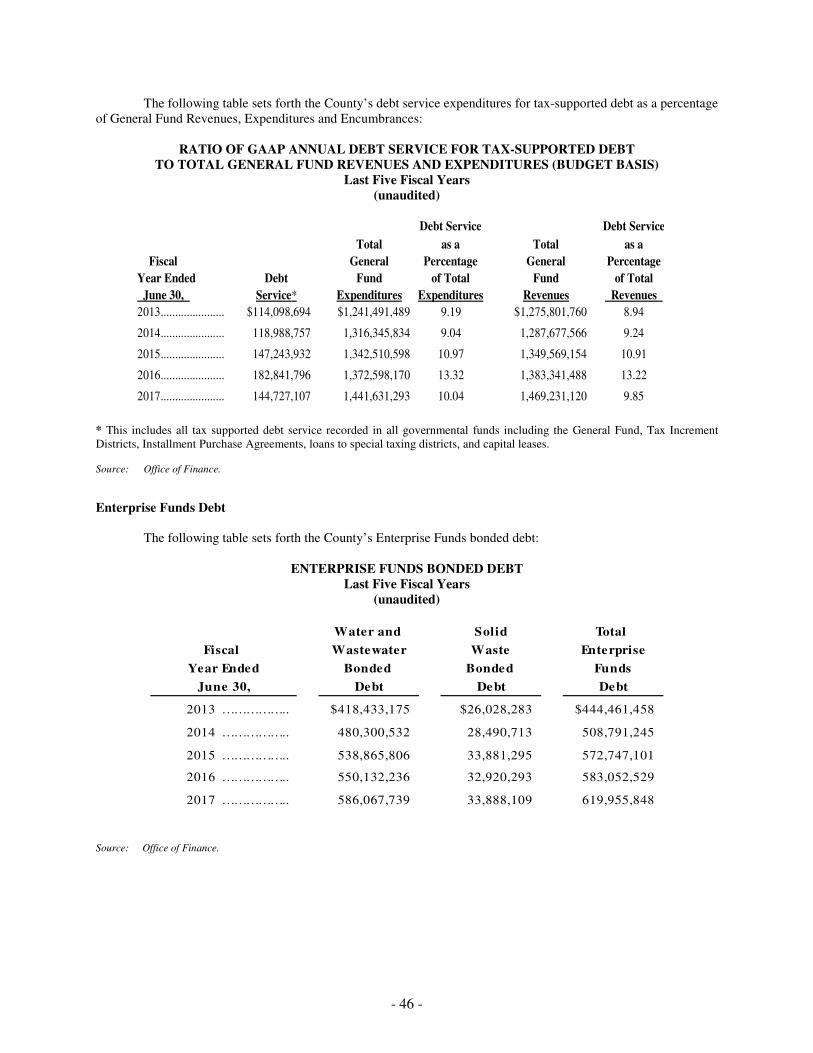
- 46 -
The following table sets forth the County’s debt service expenditures for tax-supported debt as a percentage of General Fund Revenues, Expenditures and Encumbrances:
RATIO OF GAAP ANNUAL DEBT SERVICE FOR TAX-SUPPORTED DEBT TO TOTAL GENERAL FUND REVENUES AND EXPENDITURES (BUDGET BASIS)
Last Five Fiscal Years (unaudited)
Debt Service Debt Service
Total as a Total as a
Fiscal General Percentage General Percentage
Year Ended Debt Fund of Total Fund of Total
June 30, Service* Expenditures Expenditures Revenues Revenues
2013...................... $114,098,694 $1,241,491,489 9.19 $1,275,801,760 8.94
2014...................... 118,988,757 1,316,345,834 9.04 1,287,677,566 9.24
2015...................... 147,243,932 1,342,510,598 10.97 1,349,569,154 10.91
2016...................... 182,841,796 1,372,598,170 13.32 1,383,341,488 13.22
2017...................... 144,727,107 1,441,631,293 10.04 1,469,231,120 9.85
* This includes all tax supported debt service recorded in all governmental funds including the General Fund, Tax Increment Districts, Installment Purchase Agreements, loans to special taxing districts, and capital leases.
Source: Office of Finance.
Enterprise Funds Debt The following table sets forth the County’s Enterprise Funds bonded debt:
ENTERPRISE FUNDS BONDED DEBT Last Five Fiscal Years
(unaudited)
Water and Solid Total
Fiscal Wastewater Waste Enterprise
Year Ended Bonded Bonded Funds
June 30, Debt Debt Debt
2013 …………….. $418,433,175 $26,028,283 $444,461,458
2014 …………….. 480,300,532 28,490,713 508,791,245
2015 …………….. 538,865,806 33,881,295 572,747,101
2016 …………….. 550,132,236 32,920,293 583,052,529
2017 …………….. 586,067,739 33,888,109 619,955,848
Source: Office of Finance.

- 47 -
(This page has been left blank intentionally.)
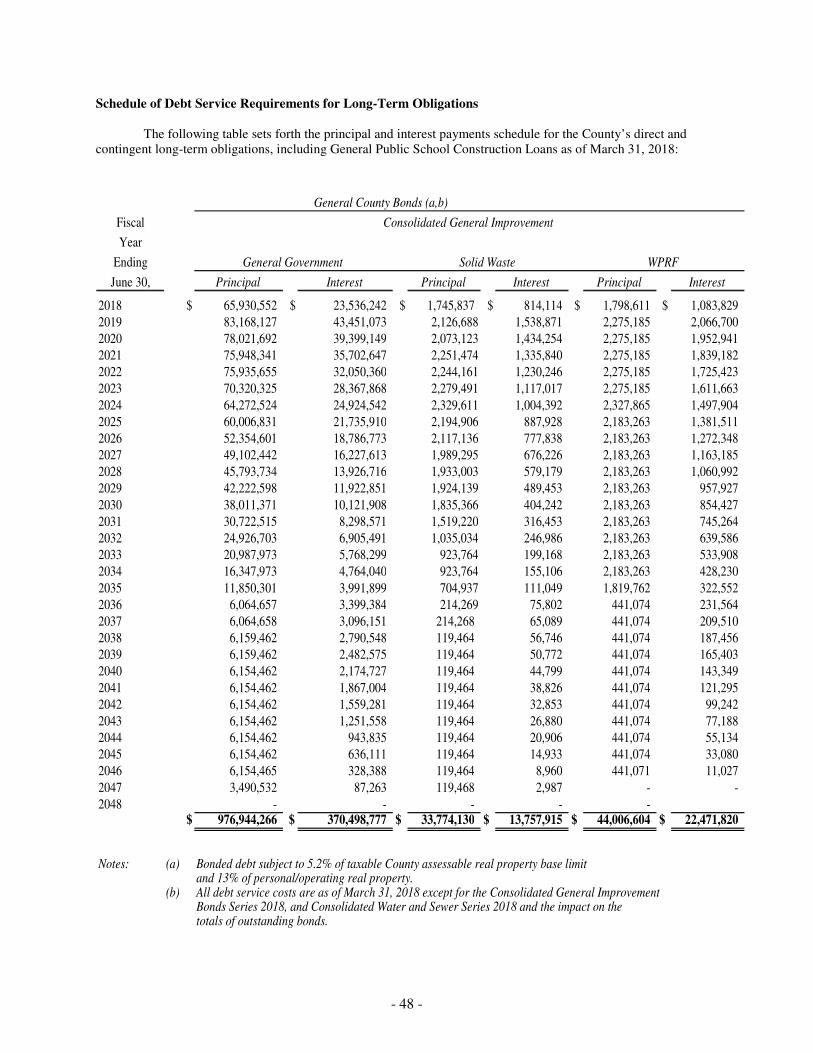
- 48 -
Schedule of Debt Service Requirements for Long-Term Obligations
The following table sets forth the principal and interest payments schedule for the County’s direct and contingent long-term obligations, including General Public School Construction Loans as of March 31, 2018:
Fiscal
Year
Ending
June 30, Principal Interest Principal Interest Principal Interest
2018 $ 65,930,552 $ 23,536,242 $ 1,745,837 $ 814,114 $ 1,798,611 $ 1,083,829
2019 83,168,127 43,451,073 2,126,688 1,538,871 2,275,185 2,066,700
2020 78,021,692 39,399,149 2,073,123 1,434,254 2,275,185 1,952,941
2021 75,948,341 35,702,647 2,251,474 1,335,840 2,275,185 1,839,182
2022 75,935,655 32,050,360 2,244,161 1,230,246 2,275,185 1,725,423
2023 70,320,325 28,367,868 2,279,491 1,117,017 2,275,185 1,611,663
2024 64,272,524 24,924,542 2,329,611 1,004,392 2,327,865 1,497,904
2025 60,006,831 21,735,910 2,194,906 887,928 2,183,263 1,381,511
2026 52,354,601 18,786,773 2,117,136 777,838 2,183,263 1,272,348
2027 49,102,442 16,227,613 1,989,295 676,226 2,183,263 1,163,185
2028 45,793,734 13,926,716 1,933,003 579,179 2,183,263 1,060,992
2029 42,222,598 11,922,851 1,924,139 489,453 2,183,263 957,927
2030 38,011,371 10,121,908 1,835,366 404,242 2,183,263 854,427
2031 30,722,515 8,298,571 1,519,220 316,453 2,183,263 745,264
2032 24,926,703 6,905,491 1,035,034 246,986 2,183,263 639,586
2033 20,987,973 5,768,299 923,764 199,168 2,183,263 533,908
2034 16,347,973 4,764,040 923,764 155,106 2,183,263 428,230
2035 11,850,301 3,991,899 704,937 111,049 1,819,762 322,552
2036 6,064,657 3,399,384 214,269 75,802 441,074 231,564
2037 6,064,658 3,096,151 214,268 65,089 441,074 209,510
2038 6,159,462 2,790,548 119,464 56,746 441,074 187,456
2039 6,159,462 2,482,575 119,464 50,772 441,074 165,403
2040 6,154,462 2,174,727 119,464 44,799 441,074 143,349
2041 6,154,462 1,867,004 119,464 38,826 441,074 121,295
2042 6,154,462 1,559,281 119,464 32,853 441,074 99,242
2043 6,154,462 1,251,558 119,464 26,880 441,074 77,188
2044 6,154,462 943,835 119,464 20,906 441,074 55,134
2045 6,154,462 636,111 119,464 14,933 441,074 33,080
2046 6,154,465 328,388 119,464 8,960 441,071 11,027
2047 3,490,532 87,263 119,468 2,987 - -
2048 - - - - - $ 976,944,266 $ 370,498,777 $ 33,774,130 $ 13,757,915 $ 44,006,604 $ 22,471,820
Notes: (a) Bonded debt subject to 5.2% of taxable County assessable real property base limit and 13% of personal/operating real property.
(b) All debt service costs are as of March 31, 2018 except for the Consolidated General ImprovementBonds Series 2018, and Consolidated Water and Sewer Series 2018 and the impact on the totals of outstanding bonds.
General Government Solid Waste WPRF
General County Bonds (a,b)
Consolidated General Improvement
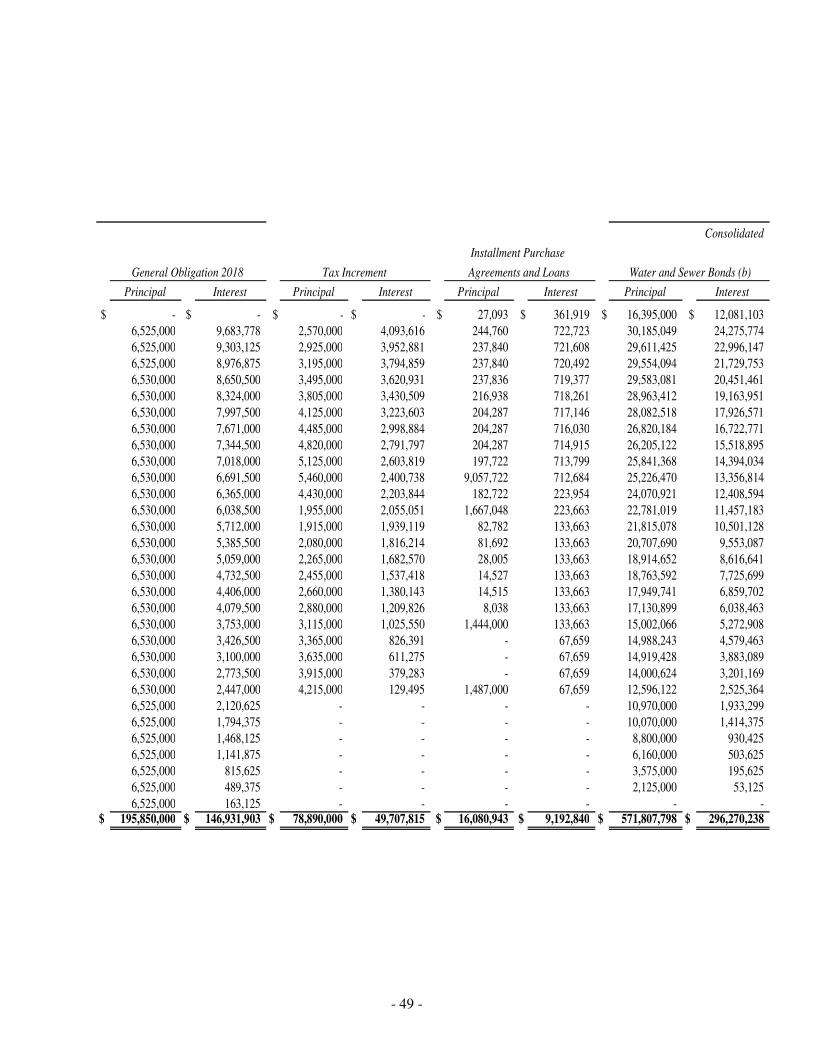
- 49 -
Principal Interest Principal Interest Principal Interest Principal Interest
$ - $ - $ - $ - $ 27,093 $ 361,919 $ 16,395,000 $ 12,081,103
6,525,000 9,683,778 2,570,000 4,093,616 244,760 722,723 30,185,049 24,275,774
6,525,000 9,303,125 2,925,000 3,952,881 237,840 721,608 29,611,425 22,996,147
6,525,000 8,976,875 3,195,000 3,794,859 237,840 720,492 29,554,094 21,729,753
6,530,000 8,650,500 3,495,000 3,620,931 237,836 719,377 29,583,081 20,451,461
6,530,000 8,324,000 3,805,000 3,430,509 216,938 718,261 28,963,412 19,163,951
6,530,000 7,997,500 4,125,000 3,223,603 204,287 717,146 28,082,518 17,926,571
6,530,000 7,671,000 4,485,000 2,998,884 204,287 716,030 26,820,184 16,722,771
6,530,000 7,344,500 4,820,000 2,791,797 204,287 714,915 26,205,122 15,518,895
6,530,000 7,018,000 5,125,000 2,603,819 197,722 713,799 25,841,368 14,394,034
6,530,000 6,691,500 5,460,000 2,400,738 9,057,722 712,684 25,226,470 13,356,814
6,530,000 6,365,000 4,430,000 2,203,844 182,722 223,954 24,070,921 12,408,594
6,530,000 6,038,500 1,955,000 2,055,051 1,667,048 223,663 22,781,019 11,457,183
6,530,000 5,712,000 1,915,000 1,939,119 82,782 133,663 21,815,078 10,501,128
6,530,000 5,385,500 2,080,000 1,816,214 81,692 133,663 20,707,690 9,553,087
6,530,000 5,059,000 2,265,000 1,682,570 28,005 133,663 18,914,652 8,616,641
6,530,000 4,732,500 2,455,000 1,537,418 14,527 133,663 18,763,592 7,725,699
6,530,000 4,406,000 2,660,000 1,380,143 14,515 133,663 17,949,741 6,859,702
6,530,000 4,079,500 2,880,000 1,209,826 8,038 133,663 17,130,899 6,038,463
6,530,000 3,753,000 3,115,000 1,025,550 1,444,000 133,663 15,002,066 5,272,908
6,530,000 3,426,500 3,365,000 826,391 - 67,659 14,988,243 4,579,463
6,530,000 3,100,000 3,635,000 611,275 - 67,659 14,919,428 3,883,089
6,530,000 2,773,500 3,915,000 379,283 - 67,659 14,000,624 3,201,169
6,530,000 2,447,000 4,215,000 129,495 1,487,000 67,659 12,596,122 2,525,364
6,525,000 2,120,625 - - - - 10,970,000 1,933,299
6,525,000 1,794,375 - - - - 10,070,000 1,414,375
6,525,000 1,468,125 - - - - 8,800,000 930,425
6,525,000 1,141,875 - - - - 6,160,000 503,625
6,525,000 815,625 - - - - 3,575,000 195,625
6,525,000 489,375 - - - - 2,125,000 53,125
6,525,000 163,125 - - - - - -
$ 195,850,000 $ 146,931,903 $ 78,890,000 $ 49,707,815 $ 16,080,943 $ 9,192,840 $ 571,807,798 $ 296,270,238
Agreements and Loans Water and Sewer Bonds (b)Tax IncrementGeneral Obligation 2018
Consolidated Water and Sewer
Installment Purchase
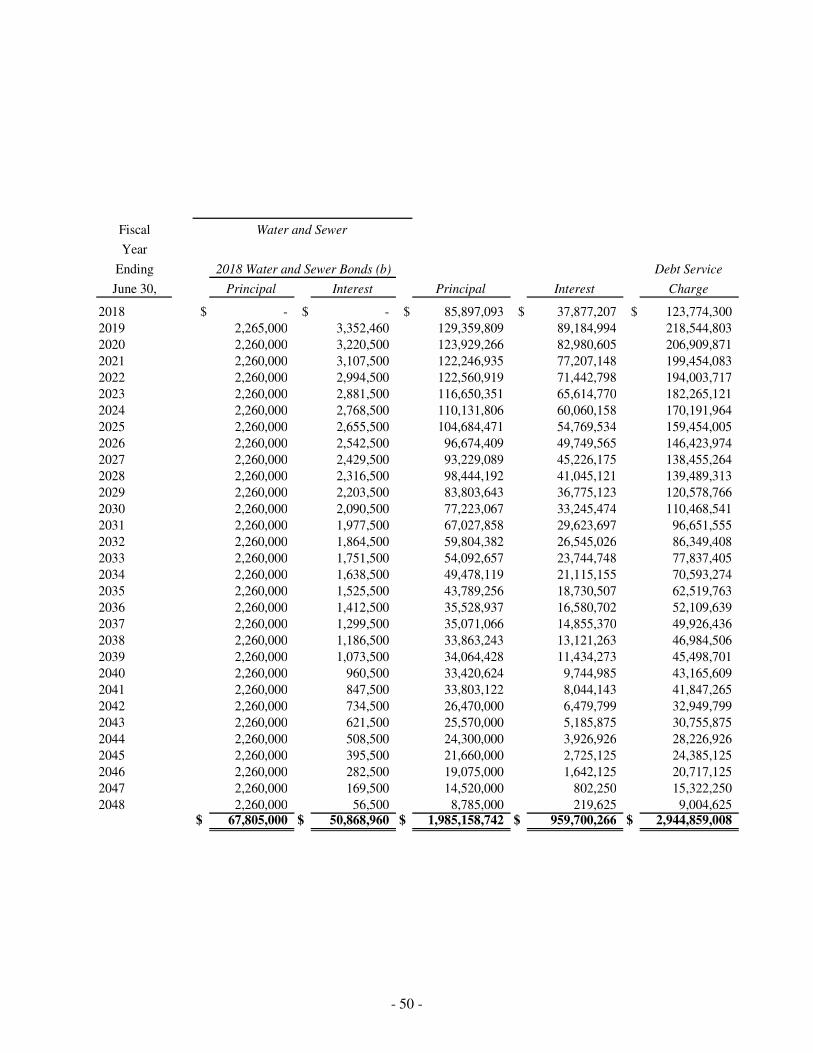
- 50 -
Fiscal
Year
Ending Debt Service
June 30, Principal Interest Principal Interest Charge
2018 $ - $ - $ 85,897,093 $ 37,877,207 $ 123,774,300
2019 2,265,000 3,352,460 129,359,809 89,184,994 218,544,803
2020 2,260,000 3,220,500 123,929,266 82,980,605 206,909,871
2021 2,260,000 3,107,500 122,246,935 77,207,148 199,454,083
2022 2,260,000 2,994,500 122,560,919 71,442,798 194,003,717
2023 2,260,000 2,881,500 116,650,351 65,614,770 182,265,121
2024 2,260,000 2,768,500 110,131,806 60,060,158 170,191,964
2025 2,260,000 2,655,500 104,684,471 54,769,534 159,454,005
2026 2,260,000 2,542,500 96,674,409 49,749,565 146,423,974
2027 2,260,000 2,429,500 93,229,089 45,226,175 138,455,264
2028 2,260,000 2,316,500 98,444,192 41,045,121 139,489,313
2029 2,260,000 2,203,500 83,803,643 36,775,123 120,578,766
2030 2,260,000 2,090,500 77,223,067 33,245,474 110,468,541
2031 2,260,000 1,977,500 67,027,858 29,623,697 96,651,555
2032 2,260,000 1,864,500 59,804,382 26,545,026 86,349,408
2033 2,260,000 1,751,500 54,092,657 23,744,748 77,837,405
2034 2,260,000 1,638,500 49,478,119 21,115,155 70,593,274
2035 2,260,000 1,525,500 43,789,256 18,730,507 62,519,763
2036 2,260,000 1,412,500 35,528,937 16,580,702 52,109,639
2037 2,260,000 1,299,500 35,071,066 14,855,370 49,926,436
2038 2,260,000 1,186,500 33,863,243 13,121,263 46,984,506
2039 2,260,000 1,073,500 34,064,428 11,434,273 45,498,701
2040 2,260,000 960,500 33,420,624 9,744,985 43,165,609
2041 2,260,000 847,500 33,803,122 8,044,143 41,847,265
2042 2,260,000 734,500 26,470,000 6,479,799 32,949,799
2043 2,260,000 621,500 25,570,000 5,185,875 30,755,875
2044 2,260,000 508,500 24,300,000 3,926,926 28,226,926
2045 2,260,000 395,500 21,660,000 2,725,125 24,385,125
2046 2,260,000 282,500 19,075,000 1,642,125 20,717,125
2047 2,260,000 169,500 14,520,000 802,250 15,322,250
2048 2,260,000 56,500 8,785,000 219,625 9,004,625 $ 67,805,000 $ 50,868,960 $ 1,985,158,742 $ 959,700,266 $ 2,944,859,008
2018 Water and Sewer Bonds (b)
Water and Sewer
- 51 -
County Debt Policies Legal Debt Policy Statement
In passing the Authorizing Ordinance, the County Council adopted the policy statement given below for the purpose of indicating the County’s intention with respect to the issuance of bonds authorized thereunder and to guide the County Executive or Chief Administrative Officer, as the case may be, in the exercise of the authority conferred by the Authorizing Ordinance. (1) It is essential that the County continue to provide, in timely fashion, the public facilities necessary to serve its population, which has increased significantly in recent years, while at the same time retaining and supporting substantial rural and agricultural elements of the County’s economy which enable the County to enjoy the benefits of a balanced and diverse economy. All or a portion of the cost of such facilities will have to be financed through the borrowing of money by the County on a reasonably long term basis in order that the burden of such cost may be equitably apportioned among present and future taxpayers. However, it is equally essential that the credit standing of Anne Arundel County, Maryland, be preserved and, if possible, improved to the end that the cost of borrowing money by the County will not be unduly burdensome. To aid in achieving these basic objectives, the County Executive or the Chief Administrative Officer, as the case may be, shall, to the maximum extent possible, exercise the authority conferred by the Authorizing Ordinance upon him within the following guidelines as well as within the fixed limitations prescribed in the Authorizing Ordinance and County Charter. (2) Sale of bonds under the Authorizing Ordinance shall be spaced at least six (6) months apart when practicable; provided, however, that bonds may be sold under the Authorizing Ordinance at such other intervals as the County Executive, or the Chief Administrative Officer, as the case may be, may deem advisable due to financial or market conditions prevailing at the time. (3) To provide an adequate flow of funds for capital projects, to limit amounts borrowed to the costs incurred for such projects, and to facilitate the selection of the most advantageous times for the sale of bonds, bond anticipation notes may be sold for such projects from time to time, repayable from the proceeds of the appropriate series of such bonds, when issued. (4) The authority conferred by the Authorizing Ordinance shall be so exercised that the estimated maximum annual debt service obligation resulting therefrom plus current debt service payable by the County on outstanding obligations does not exceed an amount equal to twenty percent (20%) of the estimated net amount of all direct and indirect revenues of the County for the current fiscal year, including utility revenues, calculated by subtracting from gross revenues all debt service withheld or to be withheld by the State or any agency thereof during such fiscal year. (5) All bonds issued and sold by the County under the Authorizing Ordinance shall be unconditional general obligation bonds of the County within the limitations of indebtedness set forth by the Authorizing Ordinance as prescribed by the County Charter and the ordinances enacted pursuant thereto. Before any such bonds are issued for revenue producing projects of water or wastewater utilities, the County Executive, or the Chief Administrative Officer if authorized by the County Executive, shall determine that the estimated revenues of such projects, or the actual and estimated revenues of such projects and the utilities of which they are a part, are, or will be, sufficient to pay the cost of operation and maintenance of such projects and the maturing principal of and interest on all indebtedness incurred with respect thereto, including such bonds. The authorization by the Authorizing Ordinance of general obligation bonds of the County for revenue producing projects shall not be construed to preclude the County Council from authorizing in the future the issuance of bonds payable solely from the revenues of similar projects or utilities. The County has adopted a debt management policy (the “Debt Management Policy”) which sets forth the borrowing limits pursuant to Resolution No. 44-16 adopted by the County Council on July 18, 2016, which may be amended and supplemented. The County’s debt management policy constitutes the local debt policy of the County required by Section 17-207 of the Local Government Article of the Annotated Code of Maryland (2013 Replacement Volume and 2017 Supplement).
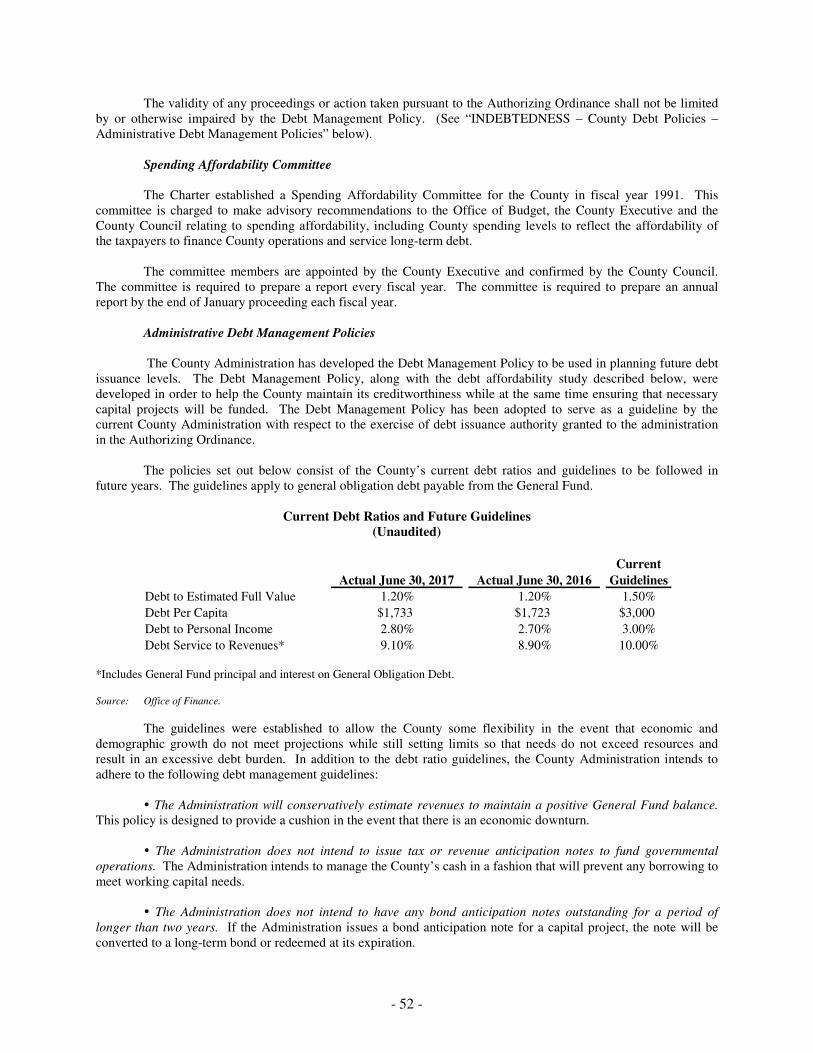
- 52 -
The validity of any proceedings or action taken pursuant to the Authorizing Ordinance shall not be limited by or otherwise impaired by the Debt Management Policy. (See “INDEBTEDNESS – County Debt Policies – Administrative Debt Management Policies” below).
Spending Affordability Committee
The Charter established a Spending Affordability Committee for the County in fiscal year 1991. This committee is charged to make advisory recommendations to the Office of Budget, the County Executive and the County Council relating to spending affordability, including County spending levels to reflect the affordability of the taxpayers to finance County operations and service long-term debt. The committee members are appointed by the County Executive and confirmed by the County Council. The committee is required to prepare a report every fiscal year. The committee is required to prepare an annual report by the end of January proceeding each fiscal year. Administrative Debt Management Policies
The County Administration has developed the Debt Management Policy to be used in planning future debt issuance levels. The Debt Management Policy, along with the debt affordability study described below, were developed in order to help the County maintain its creditworthiness while at the same time ensuring that necessary capital projects will be funded. The Debt Management Policy has been adopted to serve as a guideline by the current County Administration with respect to the exercise of debt issuance authority granted to the administration in the Authorizing Ordinance. The policies set out below consist of the County’s current debt ratios and guidelines to be followed in future years. The guidelines apply to general obligation debt payable from the General Fund.
Current Debt Ratios and Future Guidelines (Unaudited)
Current
Actual June 30, 2017 Actual June 30, 2016 Guidelines
Debt to Estimated Full Value 1.20% 1.20% 1.50%
Debt Per Capita $1,733 $1,723 $3,000
Debt to Personal Income 2.80% 2.70% 3.00%
Debt Service to Revenues* 9.10% 8.90% 10.00% *Includes General Fund principal and interest on General Obligation Debt. Source: Office of Finance.
The guidelines were established to allow the County some flexibility in the event that economic and demographic growth do not meet projections while still setting limits so that needs do not exceed resources and result in an excessive debt burden. In addition to the debt ratio guidelines, the County Administration intends to adhere to the following debt management guidelines: � The Administration will conservatively estimate revenues to maintain a positive General Fund balance.
This policy is designed to provide a cushion in the event that there is an economic downturn. � The Administration does not intend to issue tax or revenue anticipation notes to fund governmental
operations. The Administration intends to manage the County’s cash in a fashion that will prevent any borrowing to meet working capital needs. � The Administration does not intend to have any bond anticipation notes outstanding for a period of
longer than two years. If the Administration issues a bond anticipation note for a capital project, the note will be converted to a long-term bond or redeemed at its expiration.

- 53 -
� The Administration will recommend budget contributions to Pay-As-You-Go financing in each fiscal year.
In order to reduce the future debt service burden, each budget will include a recommended contribution to Pay-As-You-Go financing. � The Administration will update the County’s debt affordability study each year in conjunction with the
capital budget process. This study will help the Administration monitor the County’s debt position and ensure that the debt ratio policies are met. � The Administration will continue to examine alternative funding sources in order to provide long-term
tax relief. Funding sources used in the past have included tax increment districts, private sector partnerships, Pay-As-You-Go funding and developer impact fees. � In budget recommendations, the Administration will designate impact fees to be collected from
developers to fund a portion of the costs associated with school and transportation facilities necessary as a result of
new development. In addition, the Administration will endeavor to assess other appropriate impact fees, where possible. Financing Plans The 2018 to 2022 Capital Program includes $1,103,234,000 in projected bond authorizations of which $789,812,000 are projected for tax supported projects. During the course of the five-year period these projected bond authorizations are estimates and may or may not result in bond sales over this period. The County assesses its five-year Capital Program on an annual basis and appropriates funds for projects based on affordability. Capital Appropriations and Funding Sources The following Schedule presents the County’s current and projected capital appropriations and funding sources approved for fiscal year 2018. Any activity related to the Bonds is not reflected in the schedule:
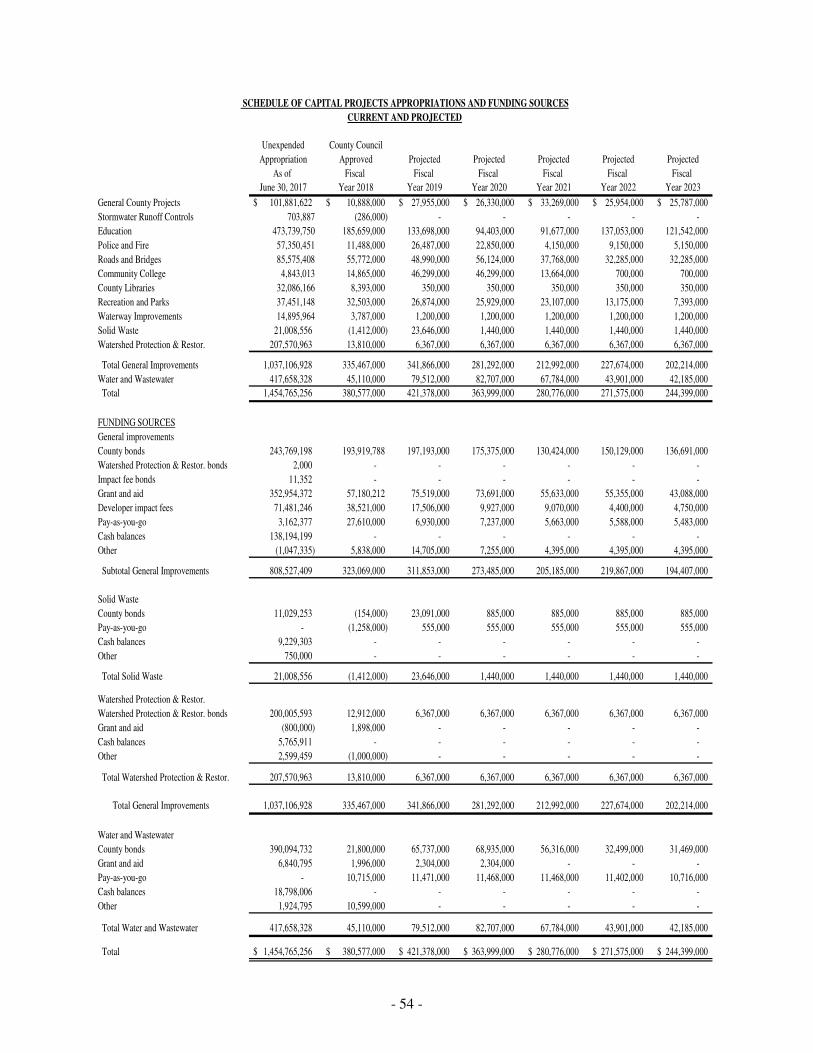
- 54 -
SCHEDULE OF CAPITAL PROJECTS APPROPRIATIONS AND FUNDING SOURCES
CURRENT AND PROJECTED
Unexpended County Council
Appropriation Approved Projected Projected Projected Projected Projected
As of Fiscal Fiscal Fiscal Fiscal Fiscal Fiscal
June 30, 2017 Year 2018 Year 2019 Year 2020 Year 2021 Year 2022 Year 2023
General County Projects 101,881,622$ 10,888,000$ 27,955,000$ 26,330,000$ 33,269,000$ 25,954,000$ 25,787,000$
Stormwater Runoff Controls 703,887 (286,000) - - - - -
Education 473,739,750 185,659,000 133,698,000 94,403,000 91,677,000 137,053,000 121,542,000
Police and Fire 57,350,451 11,488,000 26,487,000 22,850,000 4,150,000 9,150,000 5,150,000
Roads and Bridges 85,575,408 55,772,000 48,990,000 56,124,000 37,768,000 32,285,000 32,285,000
Community College 4,843,013 14,865,000 46,299,000 46,299,000 13,664,000 700,000 700,000
County Libraries 32,086,166 8,393,000 350,000 350,000 350,000 350,000 350,000
Recreation and Parks 37,451,148 32,503,000 26,874,000 25,929,000 23,107,000 13,175,000 7,393,000
Waterway Improvements 14,895,964 3,787,000 1,200,000 1,200,000 1,200,000 1,200,000 1,200,000
Solid Waste 21,008,556 (1,412,000) 23,646,000 1,440,000 1,440,000 1,440,000 1,440,000
Watershed Protection & Restor. 207,570,963 13,810,000 6,367,000 6,367,000 6,367,000 6,367,000 6,367,000
Total General Improvements 1,037,106,928 335,467,000 341,866,000 281,292,000 212,992,000 227,674,000 202,214,000
Water and Wastewater 417,658,328 45,110,000 79,512,000 82,707,000 67,784,000 43,901,000 42,185,000
Total 1,454,765,256 380,577,000 421,378,000 363,999,000 280,776,000 271,575,000 244,399,000
FUNDING SOURCES
General improvements
County bonds 243,769,198 193,919,788 197,193,000 175,375,000 130,424,000 150,129,000 136,691,000
Watershed Protection & Restor. bonds 2,000 - - - - - -
Impact fee bonds 11,352 - - - - - -
Grant and aid 352,954,372 57,180,212 75,519,000 73,691,000 55,633,000 55,355,000 43,088,000
Developer impact fees 71,481,246 38,521,000 17,506,000 9,927,000 9,070,000 4,400,000 4,750,000
Pay-as-you-go 3,162,377 27,610,000 6,930,000 7,237,000 5,663,000 5,588,000 5,483,000
Cash balances 138,194,199 - - - - - -
Other (1,047,335) 5,838,000 14,705,000 7,255,000 4,395,000 4,395,000 4,395,000
Subtotal General Improvements 808,527,409 323,069,000 311,853,000 273,485,000 205,185,000 219,867,000 194,407,000
Solid Waste
County bonds 11,029,253 (154,000) 23,091,000 885,000 885,000 885,000 885,000
Pay-as-you-go - (1,258,000) 555,000 555,000 555,000 555,000 555,000
Cash balances 9,229,303 - - - - - -
Other 750,000 - - - - - -
Total Solid Waste 21,008,556 (1,412,000) 23,646,000 1,440,000 1,440,000 1,440,000 1,440,000
Watershed Protection & Restor.
Watershed Protection & Restor. bonds 200,005,593 12,912,000 6,367,000 6,367,000 6,367,000 6,367,000 6,367,000
Grant and aid (800,000) 1,898,000 - - - - -
Cash balances 5,765,911 - - - - - -
Other 2,599,459 (1,000,000) - - - - -
Total Watershed Protection & Restor. 207,570,963 13,810,000 6,367,000 6,367,000 6,367,000 6,367,000 6,367,000
Total General Improvements 1,037,106,928 335,467,000 341,866,000 281,292,000 212,992,000 227,674,000 202,214,000
Water and Wastewater
County bonds 390,094,732 21,800,000 65,737,000 68,935,000 56,316,000 32,499,000 31,469,000
Grant and aid 6,840,795 1,996,000 2,304,000 2,304,000 - - -
Pay-as-you-go - 10,715,000 11,471,000 11,468,000 11,468,000 11,402,000 10,716,000
Cash balances 18,798,006 - - - - - -
Other 1,924,795 10,599,000 - - - - -
Total Water and Wastewater 417,658,328 45,110,000 79,512,000 82,707,000 67,784,000 43,901,000 42,185,000
Total 1,454,765,256$ 380,577,000$ 421,378,000$ 363,999,000$ 280,776,000$ 271,575,000$ 244,399,000$
- 55 -
SECTION FIVE: ECONOMIC AND DEMOGRAPHIC INFORMATION Description and Government Anne Arundel County is located approximately thirteen miles east of Washington, D.C. with Baltimore City and Baltimore County as its northern boundary and the Chesapeake Bay as its entire eastern boundary. The County is also bordered by Howard County to the west, Prince George’s County to the southwest and Calvert County at its southern tip. The County is situated within the Atlantic Coastal Plain and its terrain varies from flat plains to rolling hills. There is approximately 533 miles of shoreline along the Chesapeake Bay. Over the past decade, the nature of land use in Anne Arundel County has changed and the County’s population has significantly increased. During this period, the County’s economy has diversified and continued to grow as a part of the Baltimore-Washington metropolitan region, although it retained much of its rural and agricultural character. Under the home rule charter since 1965, Anne Arundel County is governed by an elected County Executive and a seven-member County Council. (See “County Administration”). The government seat of Anne Arundel County is located within the corporate limits of the City of Annapolis. The County is authorized to issue debt, subject to certain indebtedness limitations, for the purpose of financing its capital projects and to incur other indebtedness having maturity not in excess of twelve months. (See “Indebtedness”). Population With a current population of approximately 568,346, Anne Arundel County is the fifth largest jurisdiction in the State of Maryland. Approximately 9 percent of the State’s total population resides in Anne Arundel County. According to the U.S. Census Bureau, the County grew by approximately 30,690 people (or 5.4 percent) between 2010 and 2016. In actual numbers this population growth ranked seventh in Maryland behind Howard, Prince Georges, Charles, Montgomery, St. Mary’s and Frederick Counties. The majority of the population growth occurred in Odenton, Crofton, Severn, and Jessup/Maryland City, which is located in the western part of the County. According to the U.S. Census Bureau’s 2011-2016 American Community Survey (ACS) 5-Year Estimates, 39.3% of the County’s population has obtained a bachelor’s degree or higher. Approximately 23.5% of the working population is employed by government agencies, whereas 76.5% is employed in the private sector or self-employed. The median age of persons in the County is 38.3 years old. The following data table shows the total population and the rate of growth for Anne Arundel County, the State of Maryland, and United States from 1994 through 2016:
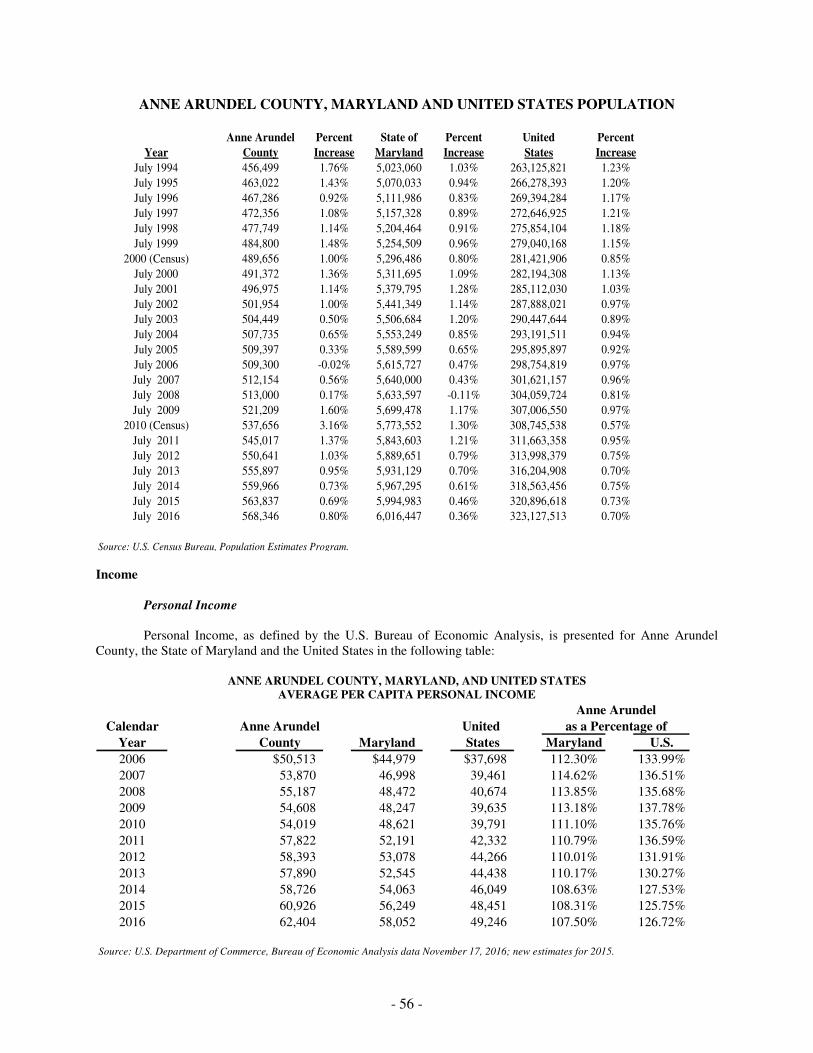
- 56 -
ANNE ARUNDEL COUNTY, MARYLAND AND UNITED STATES POPULATION
Anne Arundel Percent State of Percent United Percent
Year County Increase Maryland Increase States Increase
July 1994 456,499 1.76% 5,023,060 1.03% 263,125,821 1.23%
July 1995 463,022 1.43% 5,070,033 0.94% 266,278,393 1.20%
July 1996 467,286 0.92% 5,111,986 0.83% 269,394,284 1.17%
July 1997 472,356 1.08% 5,157,328 0.89% 272,646,925 1.21%
July 1998 477,749 1.14% 5,204,464 0.91% 275,854,104 1.18%
July 1999 484,800 1.48% 5,254,509 0.96% 279,040,168 1.15%
2000 (Census) 489,656 1.00% 5,296,486 0.80% 281,421,906 0.85%
July 2000 491,372 1.36% 5,311,695 1.09% 282,194,308 1.13%
July 2001 496,975 1.14% 5,379,795 1.28% 285,112,030 1.03%
July 2002 501,954 1.00% 5,441,349 1.14% 287,888,021 0.97%
July 2003 504,449 0.50% 5,506,684 1.20% 290,447,644 0.89%
July 2004 507,735 0.65% 5,553,249 0.85% 293,191,511 0.94%
July 2005 509,397 0.33% 5,589,599 0.65% 295,895,897 0.92%
July 2006 509,300 -0.02% 5,615,727 0.47% 298,754,819 0.97%
July 2007 512,154 0.56% 5,640,000 0.43% 301,621,157 0.96%
July 2008 513,000 0.17% 5,633,597 -0.11% 304,059,724 0.81%
July 2009 521,209 1.60% 5,699,478 1.17% 307,006,550 0.97%
2010 (Census) 537,656 3.16% 5,773,552 1.30% 308,745,538 0.57%
July 2011 545,017 1.37% 5,843,603 1.21% 311,663,358 0.95%
July 2012 550,641 1.03% 5,889,651 0.79% 313,998,379 0.75%
July 2013 555,897 0.95% 5,931,129 0.70% 316,204,908 0.70%
July 2014 559,966 0.73% 5,967,295 0.61% 318,563,456 0.75%
July 2015 563,837 0.69% 5,994,983 0.46% 320,896,618 0.73%
July 2016 568,346 0.80% 6,016,447 0.36% 323,127,513 0.70%
Source: U.S. Census Bureau, Population Estimates Program. Income
Personal Income
Personal Income, as defined by the U.S. Bureau of Economic Analysis, is presented for Anne Arundel County, the State of Maryland and the United States in the following table:
ANNE ARUNDEL COUNTY, MARYLAND, AND UNITED STATES AVERAGE PER CAPITA PERSONAL INCOME
Calendar Anne Arundel United
Year County Maryland States Maryland U.S.
2006 $50,513 $44,979 $37,698 112.30% 133.99%
2007 53,870 46,998 39,461 114.62% 136.51%
2008 55,187 48,472 40,674 113.85% 135.68%
2009 54,608 48,247 39,635 113.18% 137.78%
2010 54,019 48,621 39,791 111.10% 135.76%
2011 57,822 52,191 42,332 110.79% 136.59%
2012 58,393 53,078 44,266 110.01% 131.91%
2013 57,890 52,545 44,438 110.17% 130.27%
2014 58,726 54,063 46,049 108.63% 127.53%
2015 60,926 56,249 48,451 108.31% 125.75%
2016 62,404 58,052 49,246 107.50% 126.72%
Source: U.S. Department of Commerce, Bureau of Economic Analysis data November 17, 2016; new estimates for 2015.
as a Percentage of
Anne Arundel
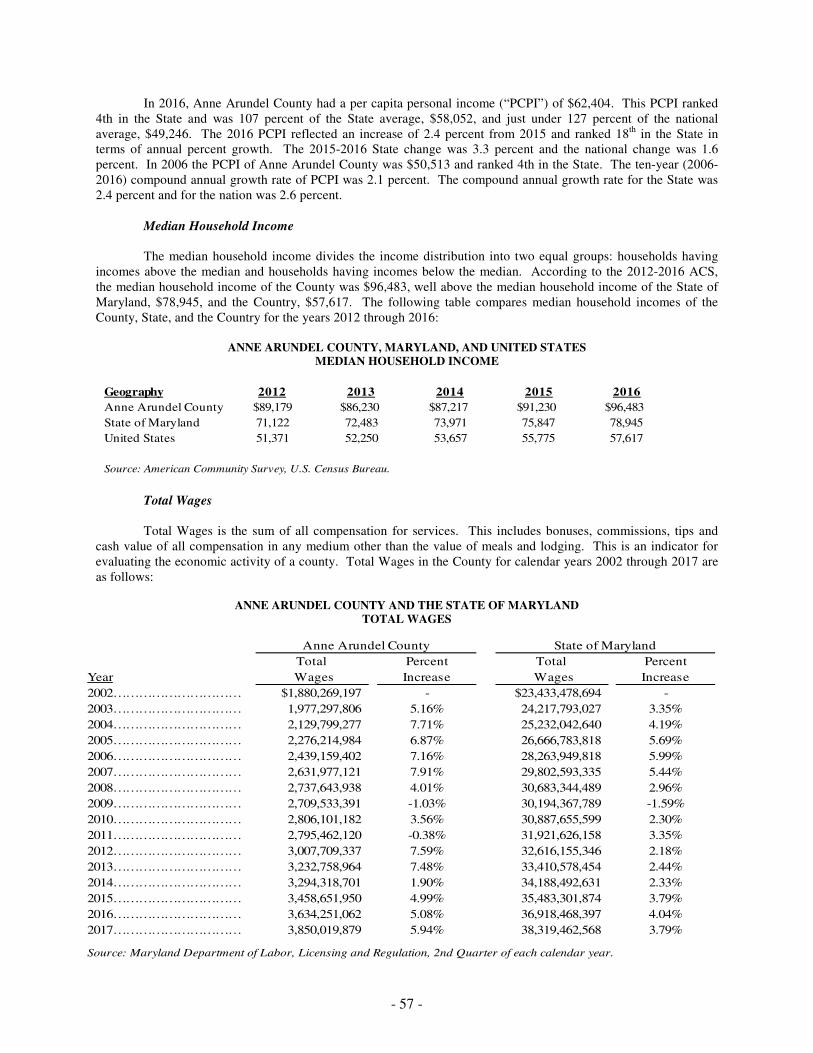
- 57 -
In 2016, Anne Arundel County had a per capita personal income (“PCPI”) of $62,404. This PCPI ranked 4th in the State and was 107 percent of the State average, $58,052, and just under 127 percent of the national average, $49,246. The 2016 PCPI reflected an increase of 2.4 percent from 2015 and ranked 18th in the State in terms of annual percent growth. The 2015-2016 State change was 3.3 percent and the national change was 1.6 percent. In 2006 the PCPI of Anne Arundel County was $50,513 and ranked 4th in the State. The ten-year (2006-2016) compound annual growth rate of PCPI was 2.1 percent. The compound annual growth rate for the State was 2.4 percent and for the nation was 2.6 percent.
Median Household Income The median household income divides the income distribution into two equal groups: households having incomes above the median and households having incomes below the median. According to the 2012-2016 ACS, the median household income of the County was $96,483, well above the median household income of the State of Maryland, $78,945, and the Country, $57,617. The following table compares median household incomes of the County, State, and the Country for the years 2012 through 2016:
ANNE ARUNDEL COUNTY, MARYLAND, AND UNITED STATES MEDIAN HOUSEHOLD INCOME
Total Wages
Total Wages is the sum of all compensation for services. This includes bonuses, commissions, tips and cash value of all compensation in any medium other than the value of meals and lodging. This is an indicator for evaluating the economic activity of a county. Total Wages in the County for calendar years 2002 through 2017 are as follows:
ANNE ARUNDEL COUNTY AND THE STATE OF MARYLAND
TOTAL WAGES
Total Percent Total Percent
Year Wages Increase Wages Increase
2002………………………… $1,880,269,197 - $23,433,478,694 -
2003………………………… 1,977,297,806 5.16% 24,217,793,027 3.35%
2004………………………… 2,129,799,277 7.71% 25,232,042,640 4.19%
2005………………………… 2,276,214,984 6.87% 26,666,783,818 5.69%
2006………………………… 2,439,159,402 7.16% 28,263,949,818 5.99%
2007………………………… 2,631,977,121 7.91% 29,802,593,335 5.44%
2008………………………… 2,737,643,938 4.01% 30,683,344,489 2.96%
2009………………………… 2,709,533,391 -1.03% 30,194,367,789 -1.59%
2010………………………… 2,806,101,182 3.56% 30,887,655,599 2.30%
2011………………………… 2,795,462,120 -0.38% 31,921,626,158 3.35%
2012………………………… 3,007,709,337 7.59% 32,616,155,346 2.18%
2013………………………… 3,232,758,964 7.48% 33,410,578,454 2.44%
2014………………………… 3,294,318,701 1.90% 34,188,492,631 2.33%
2015………………………… 3,458,651,950 4.99% 35,483,301,874 3.79%
2016………………………… 3,634,251,062 5.08% 36,918,468,397 4.04%
2017………………………… 3,850,019,879 5.94% 38,319,462,568 3.79%
Source: Maryland Department of Labor, Licensing and Regulation, 2nd Quarter of each calendar year.
Anne Arundel County State of Maryland
Geography 2012 2013 2014 2015 2016
Anne Arundel County $89,179 $86,230 $87,217 $91,230 $96,483
State of Maryland 71,122 72,483 73,971 75,847 78,945
United States 51,371 52,250 53,657 55,775 57,617
Source: American Community Survey, U.S. Census Bureau.
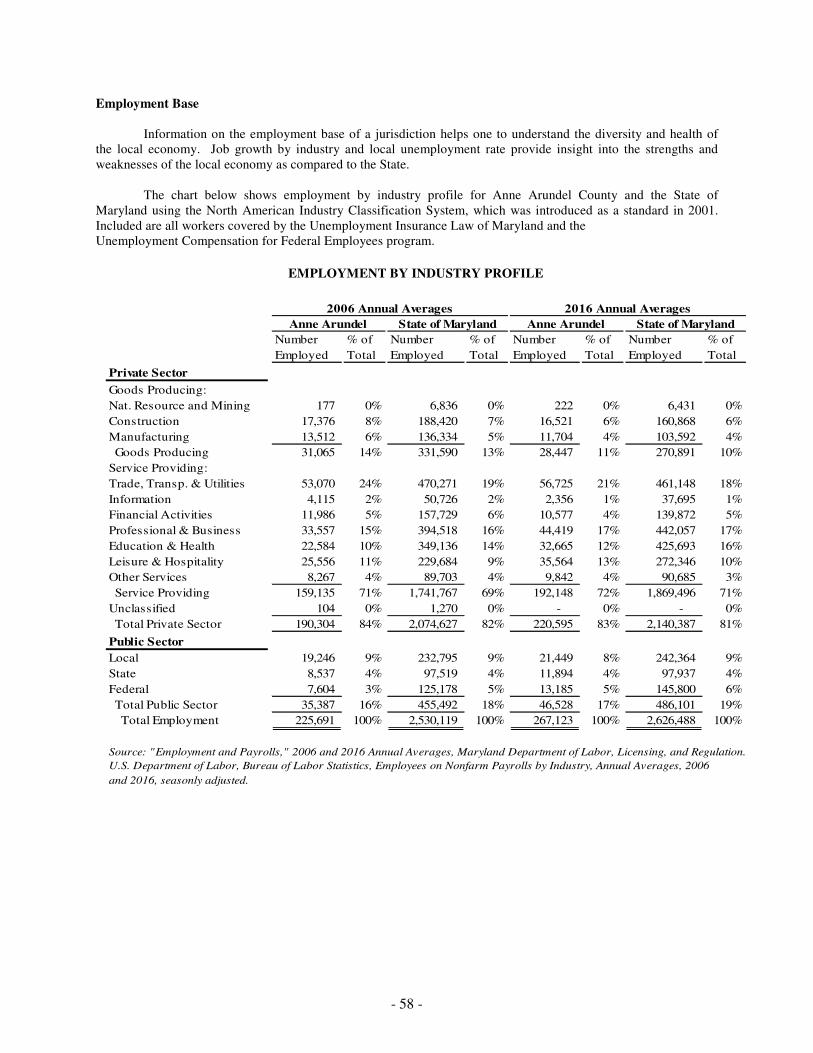
- 58 -
Employment Base Information on the employment base of a jurisdiction helps one to understand the diversity and health of the local economy. Job growth by industry and local unemployment rate provide insight into the strengths and weaknesses of the local economy as compared to the State. The chart below shows employment by industry profile for Anne Arundel County and the State of Maryland using the North American Industry Classification System, which was introduced as a standard in 2001. Included are all workers covered by the Unemployment Insurance Law of Maryland and the Unemployment Compensation for Federal Employees program.
EMPLOYMENT BY INDUSTRY PROFILE
Number
Employed
% of
Total
Number
Employed
% of
Total
Number
Employed
% of
Total
Number
Employed
% of
Total
Private Sector
Goods Producing:
Nat. Resource and Mining 177 0% 6,836 0% 222 0% 6,431 0%
Construction 17,376 8% 188,420 7% 16,521 6% 160,868 6%
Manufacturing 13,512 6% 136,334 5% 11,704 4% 103,592 4%
Goods Producing 31,065 14% 331,590 13% 28,447 11% 270,891 10%
Service Providing:
Trade, Transp. & Utilities 53,070 24% 470,271 19% 56,725 21% 461,148 18%
Information 4,115 2% 50,726 2% 2,356 1% 37,695 1%
Financial Activities 11,986 5% 157,729 6% 10,577 4% 139,872 5%
Professional & Business 33,557 15% 394,518 16% 44,419 17% 442,057 17%
Education & Health 22,584 10% 349,136 14% 32,665 12% 425,693 16%
Leisure & Hospitality 25,556 11% 229,684 9% 35,564 13% 272,346 10%
Other Services 8,267 4% 89,703 4% 9,842 4% 90,685 3%
Service Providing 159,135 71% 1,741,767 69% 192,148 72% 1,869,496 71%
Unclassified 104 0% 1,270 0% - 0% - 0%
Total Private Sector 190,304 84% 2,074,627 82% 220,595 83% 2,140,387 81%
Public Sector
Local 19,246 9% 232,795 9% 21,449 8% 242,364 9%
State 8,537 4% 97,519 4% 11,894 4% 97,937 4%
Federal 7,604 3% 125,178 5% 13,185 5% 145,800 6%
Total Public Sector 35,387 16% 455,492 18% 46,528 17% 486,101 19%
Total Employment 225,691 100% 2,530,119 100% 267,123 100% 2,626,488 100%
Source: "Employment and Payrolls," 2006 and 2016 Annual Averages, Maryland Department of Labor, Licensing, and Regulation.
and 2016, seasonly adjusted.
U.S. Department of Labor, Bureau of Labor Statistics, Employees on Nonfarm Payrolls by Industry, Annual Averages, 2006
2006 Annual Averages 2016 Annual Averages
Anne Arundel State of Maryland Anne Arundel State of Maryland
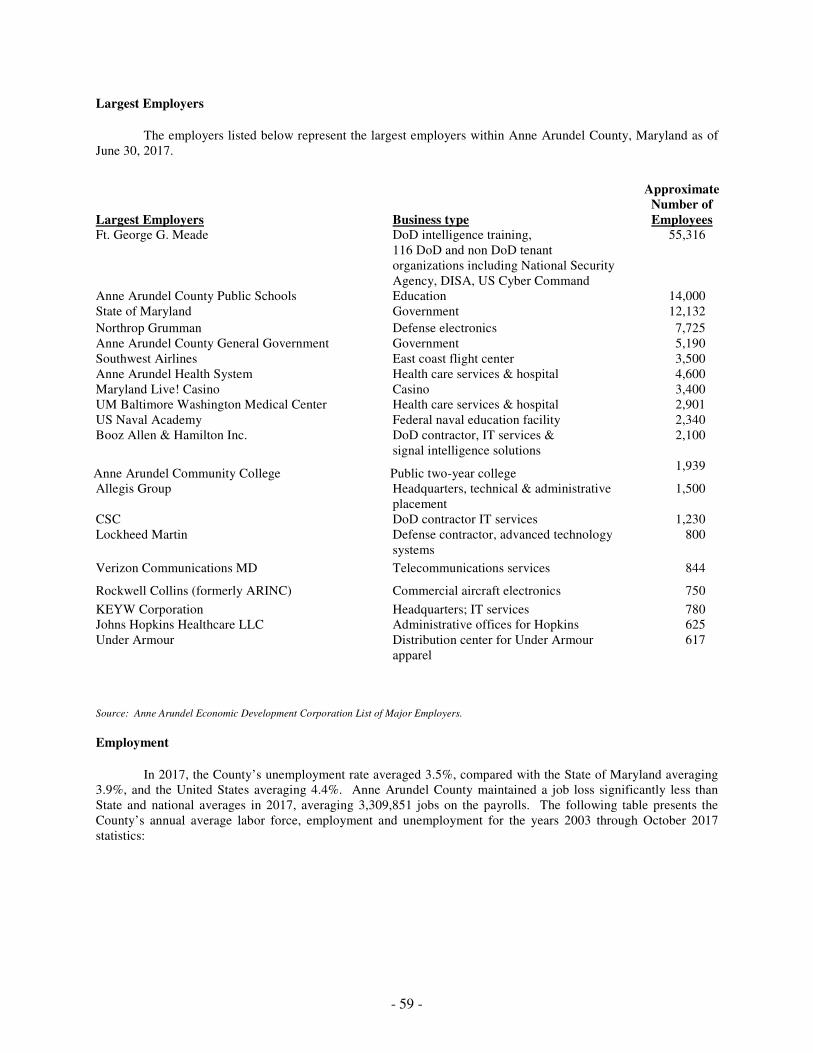
- 59 -
Largest Employers
The employers listed below represent the largest employers within Anne Arundel County, Maryland as of June 30, 2017.
Source: Anne Arundel Economic Development Corporation List of Major Employers.
Employment
In 2017, the County’s unemployment rate averaged 3.5%, compared with the State of Maryland averaging
3.9%, and the United States averaging 4.4%. Anne Arundel County maintained a job loss significantly less than State and national averages in 2017, averaging 3,309,851 jobs on the payrolls. The following table presents the County’s annual average labor force, employment and unemployment for the years 2003 through October 2017 statistics:
Largest Employers Business type
Approximate Number of Employees
Ft. George G. Meade DoD intelligence training, 116 DoD and non DoD tenant organizations including National Security Agency, DISA, US Cyber Command
55,316
Anne Arundel County Public Schools Education 14,000 State of Maryland Government 12,132
Northrop Grumman Defense electronics 7,725 Anne Arundel County General Government Government 5,190 Southwest Airlines East coast flight center 3,500 Anne Arundel Health System Health care services & hospital 4,600 Maryland Live! Casino Casino 3,400 UM Baltimore Washington Medical Center Health care services & hospital 2,901 US Naval Academy Federal naval education facility 2,340 Booz Allen & Hamilton Inc. DoD contractor, IT services &
signal intelligence solutions 2,100
Anne Arundel Community College
Public two-year college
1,939
Allegis Group
Headquarters, technical & administrative placement
1,500
CSC DoD contractor IT services 1,230 Lockheed Martin Defense contractor, advanced technology
systems 800
Verizon Communications MD Telecommunications services 844
Rockwell Collins (formerly ARINC) Commercial aircraft electronics 750
KEYW Corporation Headquarters; IT services 780 Johns Hopkins Healthcare LLC Administrative offices for Hopkins 625 Under Armour Distribution center for Under Armour
apparel 617
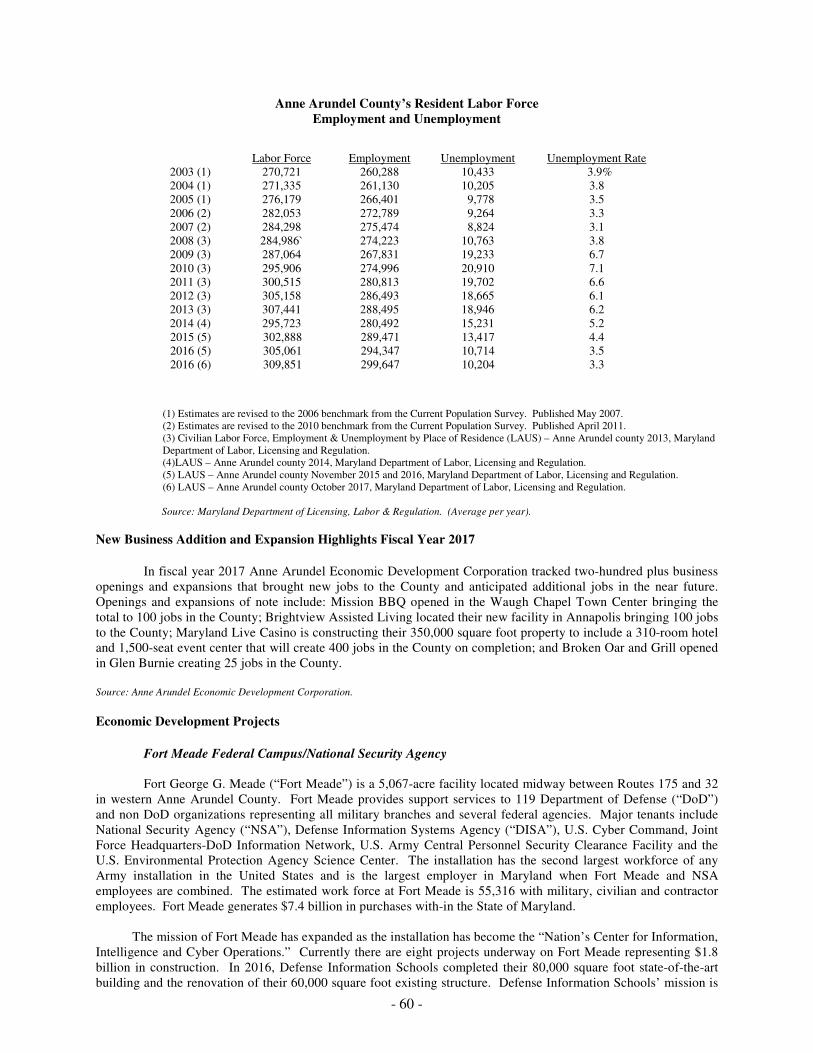
- 60 -
Anne Arundel County’s Resident Labor Force Employment and Unemployment
(1) Estimates are revised to the 2006 benchmark from the Current Population Survey. Published May 2007. (2) Estimates are revised to the 2010 benchmark from the Current Population Survey. Published April 2011. (3) Civilian Labor Force, Employment & Unemployment by Place of Residence (LAUS) – Anne Arundel county 2013, Maryland Department of Labor, Licensing and Regulation. (4)LAUS – Anne Arundel county 2014, Maryland Department of Labor, Licensing and Regulation. (5) LAUS – Anne Arundel county November 2015 and 2016, Maryland Department of Labor, Licensing and Regulation. (6) LAUS – Anne Arundel county October 2017, Maryland Department of Labor, Licensing and Regulation. Source: Maryland Department of Licensing, Labor & Regulation. (Average per year).
New Business Addition and Expansion Highlights Fiscal Year 2017
In fiscal year 2017 Anne Arundel Economic Development Corporation tracked two-hundred plus business
openings and expansions that brought new jobs to the County and anticipated additional jobs in the near future. Openings and expansions of note include: Mission BBQ opened in the Waugh Chapel Town Center bringing the total to 100 jobs in the County; Brightview Assisted Living located their new facility in Annapolis bringing 100 jobs to the County; Maryland Live Casino is constructing their 350,000 square foot property to include a 310-room hotel and 1,500-seat event center that will create 400 jobs in the County on completion; and Broken Oar and Grill opened in Glen Burnie creating 25 jobs in the County.
Source: Anne Arundel Economic Development Corporation.
Economic Development Projects
Fort Meade Federal Campus/National Security Agency
Fort George G. Meade (“Fort Meade”) is a 5,067-acre facility located midway between Routes 175 and 32 in western Anne Arundel County. Fort Meade provides support services to 119 Department of Defense (“DoD”) and non DoD organizations representing all military branches and several federal agencies. Major tenants include National Security Agency (“NSA”), Defense Information Systems Agency (“DISA”), U.S. Cyber Command, Joint Force Headquarters-DoD Information Network, U.S. Army Central Personnel Security Clearance Facility and the U.S. Environmental Protection Agency Science Center. The installation has the second largest workforce of any Army installation in the United States and is the largest employer in Maryland when Fort Meade and NSA employees are combined. The estimated work force at Fort Meade is 55,316 with military, civilian and contractor employees. Fort Meade generates $7.4 billion in purchases with-in the State of Maryland.
The mission of Fort Meade has expanded as the installation has become the “Nation’s Center for Information, Intelligence and Cyber Operations.” Currently there are eight projects underway on Fort Meade representing $1.8 billion in construction. In 2016, Defense Information Schools completed their 80,000 square foot state-of-the-art building and the renovation of their 60,000 square foot existing structure. Defense Information Schools’ mission is
Labor Force Employment Unemployment Unemployment Rate 2003 (1) 270,721 260,288 10,433 3.9% 2004 (1) 271,335 261,130 10,205 3.8 2005 (1) 276,179 266,401 9,778 3.5 2006 (2) 282,053 272,789 9,264 3.3 2007 (2) 284,298 275,474 8,824 3.1 2008 (3) 284,986` 274,223 10,763 3.8 2009 (3) 287,064 267,831 19,233 6.7 2010 (3) 295,906 274,996 20,910 7.1 2011 (3) 300,515 280,813 19,702 6.6 2012 (3) 305,158 286,493 18,665 6.1 2013 (3) 307,441 288,495 18,946 6.2 2014 (4) 295,723 280,492 15,231 5.2 2015 (5) 302,888 289,471 13,417 4.4 2016 (5) 2016 (6)
305,061 309,851
294,347 299,647
10,714 10,204
3.5 3.3
- 61 -
to train military communicators across all military branches. The expansion allows the school to train of up to 3,000 students a year.
Source: Fort Meade 101 August 2016; Maryland Economic Impact Study of Military Facilities FY 2012 update.
Arundel Preserve
Arundel Preserve is a 263-acre mixed-use project being developed by Somerset Construction Company,
Corporate Office Properties Trust, Chesapeake Real Estate Services, Bozzuto and Toll Brothers. The project is
located in western Anne Arundel County in Hanover near the Arundel Mills Mall. The project is composed of three
developments which comprise 1,300,000 square feet of office space, a residential component, 300,000 square feet of
retail space and a hotel. Corporate Office Properties Trust is building the office component which will include
eleven office buildings across 63 acres.
The Arundel Preserve project has completed 1,078 apartments in three apartment complexes and 227,000 square feet of commercial space, including the Shops at Arundel Preserve and Phase I of the Town Center. The Corporate Center has completed two office buildings totaling 276,000 square feet of space. Both buildings are occupied by cyber security company KeyW.
Currently, The Arundel, a 233-unit apartment complex is under construction at Arundel Preserve. Other projects in planning are a Cambria hotel, a Wawa and CVS drug store.
Source: Anne Arundel Economic Development Corporation.
National Business Park
National Business Park is located in western Anne Arundel County on Routes 32 and 295 in Annapolis
Junction. The park is being developed by Corporate Office Properties Trust and is home to larger defense contractors such as Northrop Grumman, Lockheed Martin, CSC, General Dynamics and other Department of Defense tenants. Currently, the 225-acre National Business Park North is under construction adding an additional 2.0 million square feet to the park. The expansion will accommodate defense contractor growth resulting from the location of U.S. Cyber Command and the National Security Agency at Fort George G. Meade. At completion, National Business Park will have over 5,400,000 square feet of office space on 519 acres.
Source: Anne Arundel Economic Development Corporation.
Odenton Town Center
The Odenton Town Center (“OTC”) incorporates an area of 1,233 acres located in the western part of Anne
Arundel County in close proximity to Fort Meade. The OTC is located in the center of an area that has experienced tremendous residential and business growth in recent decades and is expected to experience even more growth in the decades to come. There are eleven completed projects in the OTC and another six in the planning stage.
The construction of Town Center Boulevard, which serves as a main connector for the development to
begin in the Town Center, is complete. Construction has begun on 198 townhomes by D.R. Horton and 270 multifamily units by Halle Companies. Construction is also expected to commence in 2018 on phase 2 of the Meade Center site located at Route 175 and Berger Street. Phase 2 consists of the development of office and retail space. Other projects anticipating to start construction soon include phase 2 of the Flats 170 at Academy Yard, which consists of retail and restaurants, and the Winmark Center, a 64,000 square feet, 4-story, Class-A office building on Route 175.
Source: Anne Arundel Economic Development Corporation.
- 62 -
Economic Development Initiatives
Arundel Business Loan Fund (ABL)
The Arundel Business Loan Fund offers a non-bank alternative for small business loans from $50,000 to $300,000 to new and expanding companies located in Anne Arundel County. The program is supported by seventeen participating lenders that have extended a line of credit totaling more than $4.3 million for the Arundel Business Loan Fund. Most loans are guaranteed by the US Small Business Administration. Currently there are six outstanding loans totaling $397,872 in funds. Source: Anne Arundel Economic Development Corporation.
Arundel Community Reinvestment Program (ACR)
The Arundel Community Reinvestment (“ACR”) loan program encourages economic activity in the
County’s sixteen commercial revitalization districts. The ACR loan fund offers qualified business owners zero interest loans of up to $50,000 for improvements to the exterior and interior of their business. Currently Anne Arundel Economic Development Corporation has twenty-six outstanding loans totaling $402,407 in funds.
Source: Anne Arundel Economic Development Corporation.
VOLT Loan Program
Anne Arundel Economic Development Corporation is a fund manager for a $5.36 million loan fund for the
Small, Minority, Veteran and Women-Owned businesses in Maryland. The loan program is funded by 1.5% of the video lottery terminal (“VLT”) revenue from Maryland casinos. Under State guidelines, 50% of loan funds available must be placed within 10 miles of three existing VLT sites at Arundel Mills (Anne Arundel County), Perryville (Cecil County), and Ocean City (Worcester County), with the remainder to be placed statewide. Currently Anne Arundel Economic Development Corporation has fifty outstanding loans totaling $5,908,146.
Source: Anne Arundel Economic Development Corporation.
Next Stage Loan Fund
To assist growing technology companies working in the national security space, Anne Arundel Economic
Development Corporation created the Arundel Defense Tech Toolbox in July of 2017. The toolbox offers a menu of financing, a workforce development grant and business development consultations specifically aimed at assisting technology companies with gross revenue of less than $5 million and fewer than 100 employees. The signature component of the Toolbox is the Next Stage Tech Fund, a financing program offering zero percent loans from $50,000 to $250,000. Loans can be structured with flexible payment terms between one to five years to accommodate a company’s cash flow. Source: Anne Arundel Economic Development Corporation.
Transportation
Light Rail
The light rail service is a 30-mile system linking Hunt Valley in Baltimore County to the Cromwell Station in Glen Burnie via downtown Baltimore. It operates seven days a week with runs every 17 minutes, carrying an average of 23,000 riders per day in FY 2016. The light rail system in Anne Arundel County connects Baltimore/Washington International Thurgood Marshall Airport (the “Airport”) with Baltimore City and business and retail centers in Northern Anne Arundel County. Opportunities exist throughout the line to transfer to other means of public transportation. More than 90% of the 30-mile system consists of double tracking allowing
- 63 -
for more frequent service, accommodating more passengers and improving the reliability and safety of the light rail program.
Source: Maryland Department of Transportation, MD.gov Open Portal Stats/data.maryland.gov.
Rail Service
Maryland Rail Commuter service (“MARC”) is a State-owned, 187-mile, 3-line system operating between
Washington, D.C., Baltimore, MD, Martinsburg, WV, and Perryville, MD. There are forty MARC system stations with parking available at most rail stops. The MARC Camden Line originates in downtown Baltimore and runs through the Anne Arundel County section of Laurel to Union Station in Washington, D.C. The MARC Penn Line runs through BWI Thurgood Marshall Airport and Odenton to Union Station. An Odenton/MARC Shuttle Bus Service, operated the by Regional Transit Agency of Central Maryland, offers a shuttle service from the Odenton station to Arundel Mills Mall and Waugh Chapel in West County with various stops. Other rail service offered includes the Amtrak Metroliner service from BWI Thurgood Marshall Airport to New York City and weekend service to the Wilmington, Philadelphia, and Washington, DC areas.
Maryland offers businesses two class-one rail carriers, CSX Transportation and Norfolk Southern freight carriage service to the Port of Baltimore. Maryland’s freight rail service offers shippers an efficient rail service to all U.S. interior points, Canada and Mexico.
Source: MD Department of Transportation, www.mdot.state.md.us; Central Maryland Regional Transit.
Roadways
The County has a well-maintained and easily accessible highway system, facilitating the movement of goods and people throughout the region. There are three major north/south arteries (I-97, Rt. 2, and the Baltimore-Washington Parkway Rt. 295) and three major east/west highways (Rt. 50/301, Rt. 100, and Rt. 32). Trucks leaving the Port of Baltimore or BWI Thurgood Marshall Airport have access to a superior State and interstate highway system, including I-95, I-695, and I-70 that allows goods to reach one-third of U.S. consumer markets in an overnight drive. The fiscal years 2017-2022 Maryland Department of Transportation Consolidated Transportation Program is $14.4 billion with half of that being allotted to the State Highway Administration for road projects. The Maryland Department of Transportation continues to be committed to projects that invest in Maryland’s transportation system resulting in job creation and the support of Maryland industries and businesses. Efforts continue to address traffic congestion on MD 175. Construction continues on the intersection improvements along MD 175 at Mapes Road and Reece Road, improving turn lanes, adding bike lanes and a security fence and tree buffer along Fort Meade’s property.
Sources: Multiple sources gathered by Anne Arundel Economic Development Corporation; Maryland Consolidated Transportation Program FY
2017 to FY 2022.
Trucking Services
Maryland’s strategic location midway along the East Coast allows trucks to reach more than one-third of the U.S. markets within an overnight drive, transporting eighty-eight percent of the total manufactured tonnage in Maryland. Over 5,000 private haulers and independent, common, and contact carriers operate within and from Maryland. These companies represent a collective fleet of more than 16,000 vehicles. The Port of Baltimore (the “Port”) and the Airport are thriving hubs for freight forwarders, trucking companies, warehousing and distribution facilities. Both conventional and specialized trucking services are available at the Port and Airport.
Source: Maryland Distribution Council; Maryland Motor Truck Association.
- 64 -
Bus Service
Anne Arundel County has a variety of public and private bus systems that service the City of Annapolis and many residential, shopping, and employment centers of not only Anne Arundel County but regionally. Services are provided by Maryland Transit Administration (“MTA”), Annapolis Transit, Regional Transportation Agency, MTA Commuter Bus Service, Young Transportation Service and Washington Metropolitan Area Transit Authority. These bus services coordinate with Anne Arundel County to develop new bus service to business parks and other workplace centers as the need arises.
Source: Anne Arundel County Transportation.
Air Services
Baltimore/Washington International Thurgood Marshall Airport is a 3,596-acre State operated facility that is part of the Maryland Aviation Administration under the authority of the State Department of Transportation. The Airport offers a 2 billion square feet passenger terminal with five concourses, 68 jet gates and five gates dedicated to commuter aircraft. Thirty-six airlines (including commuter, charter, and cargo airlines) serve the Airport with an average of 734 daily operations. Light Rail, Amtrak, and MARC train service are available connecting the airport with many destinations in Washington and the Baltimore area.
The Airport’s annual economic impact includes $7 billion in business revenue for Maryland, employing an estimated 9,717 people directly and generating employment for some 97,737 people in the Baltimore-Washington region with direct, indirect, and induced jobs combined. The Airport served 25,686,293 passengers in fiscal year 2017, an 4.1% increase over fiscal year 2016. In fiscal year 2016, the Airport continued to enhance its services with the announcement that Alaska Airlines is growing by adding more destinations and flights. Spirit Airlines now offers international service from the Airport. Source: Baltimore/Washington International Thurgood Marshall Airport, www.bwiairport.com.
Tipton Airport
As a result of the BRAC Act of 1988, Tipton Army Airfield at Fort Meade was privatized for civilian use. The 366-acre airport reopened as a public facility in November 1999. Bordered by Fort Meade, the National Security Agency, and the Patuxent National Wildlife Refuge, Tipton is almost equal distance from Baltimore, Washington, Annapolis, and Columbia. Tipton Airport is located on MD Rt. 32 and minutes from the Baltimore-Washington Parkway, BWI Thurgood Marshall, I-95 and I-97. The airport accommodates sport, recreational, private, and business aircraft. Available facilities include a 3,000’ x 75’ runway; acres of concrete apron; 4 large hangers with more than 78,000 square feet of aircraft storage space and more than 34,000 square feet of aircraft maintenance and office space. Source: Tipton Airport Authority, www.tiptonairport.org.
Port of Baltimore
The Port is located in Baltimore in the center of the Washington-Baltimore Common Market, the fourth largest consumer market in the nation. This location makes it the closest Atlantic seaport to major mid-western populations and manufacturing centers and within a day’s reach to one-third of U.S. households. The Port of Baltimore is one of only two Eastern U.S. Ports with a 50 foot shipping channel, allowing it to accommodate some of the largest container ships in the world. The Port of Baltimore is one of the top ten major employment centers in the State of Maryland supporting 33,920 jobs, 13,650 of those are direct jobs generated by cargo and vessel activities at the Port. The Port generates approximately $2.2 billion in business revenues in the State of Maryland. Activities at the Port generate another $310 million in State, county and municipal tax revenues.
- 65 -
Cruise activity at the Port supports 500 direct, induced and indirect jobs and generates $90 million in economic activity for Maryland. More than 200,000 passengers launch from the Port of Baltimore on Carnival and Royal Caribbean Cruise Lines sailing to Bermuda and the Caribbean Islands. Sources: Port of Baltimore, www.mpa.state.md.us 2015 Economic Impact of the Port of Baltimore/Martin Associates.
Tourism
Anne Arundel County leads all other Maryland counties in generating economic impact through travel. In 2015, 7.0 million travelers visited Anne Arundel County to enjoy the many attractions and amenities including but not limited to, the 533 miles of shoreline, the historic Annapolis area, the U.S. Naval Academy, the annual boat shows and festivals and Arundel Mills Mall. During their stay travelers spent an estimated $3.7 billion which is 22% of all travel expenditures in Maryland. The tourism industry in Anne Arundel County supports 21,561 direct jobs and another 9,379 indirect jobs. These tourism jobs generate $1.1 billion in direct payroll income and another $698.4 million in income from jobs indirectly impacted by tourism. Tourism expenditures in the County account for $449.6 million in State and local taxes. These revenues provide needed infrastructure monies for general fund projects and services.
Anne Arundel County generated $16.9 million in gross hotel tax in fiscal year 2017. New additions are
coming online with Maryland Live breaking ground on their 310-room hotel projected to be open in the first quarter of 2018 and a planned Cambria Suites at Arundel Preserve in Hanover.
Maryland Live! Casino, a 330,000 square foot gaming facility, opened in June 2012 at Arundel Mills Mall
in northern Anne Arundel County. The facility is one of the largest gaming facility in Maryland with 4,000 slot machines and electronic table games, 150 live table games and 52 poker tables, plus restaurants and entertainment venues. The Casino is estimated to generate $400 million in annual revenue for the State of Maryland with $20 million of that revenue going directly to Anne Arundel County. The casino operates on a 24-hour basis and employs 3,000 people. Maryland Live broke ground on their $200 million expansion which includes a 310-room hotel, convention center and additional restaurants. The expansion will create 400 new permanent jobs and opened in January 2018.
Source: The Annapolis & Anne Arundel County Conference & Visitors Bureau/The Economic Impact of Tourism in Maryland-Tourism Satellite
Account Calendar Year 2015; Anne Arundel Economic Development Corp.
Housing
According to the 2010 census, the County had 212,559 housing units. The 2015 US Census Annual Estimates of Housing Units estimates the County now has approximately 220,989 units; a growth of 8,430 units since the 2010 census. Single-family (detached and attached) units account for approximately 79 percent of total units. According to the Maryland State Department of Planning Data Center, from 2000 to 2017 Anne Arundel County has ranked first in new construction in the Baltimore metropolitan region (defined as Anne Arundel County, Baltimore County, Carroll County, Harford County, Howard County, and Baltimore City). In 2012, Anne Arundel County was ranked second to Montgomery County in the State, in 2013 was ranked third and in 2015 and 2016 was ranked first in the State for new housing units. In 2017, Anne Arundel County ranked second to Prince George’s County for new housing units.
- 66 -
The following table compares new housing units authorized for construction between 2003 and 2017 with the State:
ANNE ARUNDEL COUNTY AND MARYLAND NEW HOUSING UNITS AUTHORIZED FOR CONSTRUCTION, 2002-2017
Total Single % of Total Multi- % of Total
Year New Units Family New Units Family New Units
2003 2,804 2,015 71.86% 789 28.14%
2004 2,089 1,671 79.99% 418 20.01%
2005 2,191 1,480 67.55% 711 32.45%
2006 275 205 74.55% 70 25.45%
2007 1,378 699 50.73% 679 49.27%
2008 958 805 84.03% 153 15.97%
2009 1,146 807 70.42% 339 29.58%
2010 1,711 864 50.50% 847 49.50%
2011 2,360 829 35.13% 1,531 64.87%
2012 1,595 943 59.12% 652 40.88%
2013 1,881 1,414 75.17% 467 24.83%
2014 683 661 96.78% 22 3.22%
2015 1,116 1,058 94.80% 58 5.20%
2016 2,246 1,526 67.94% 658 29.30%
2017 2,087 1,508 72.26% 571 27.36%
Total 24,520 16,485 7,965
Total Single % of Total Multi- % of Total
Year New Units Family New Units Family New Units
2003 29,914 23,398 78.22% 6,516 21.78%
2004 29,515 23,258 78.80% 6,257 21.20%
2005 30,060 22,710 75.55% 7,350 24.45%
2006 23,262 17,858 76.77% 5,404 23.23%
2007 18,805 13,306 70.76% 5,499 29.24%
2008 13,309 8,235 61.88% 5,074 38.12%
2009 9,396 7,218 76.82% 2,178 23.18%
2010 11,931 8,489 71.15% 3,442 28.85%
2011 13,481 8,362 62.03% 5,119 37.97%
2012 15,217 9,232 60.67% 5,985 39.33%
2013 18,138 11,043 60.88% 7,095 39.12%
2014 5,209 2,986 57.32% 2,223 42.68%
2015 4,470 3,383 75.68% 1,087 24.32%
2016 15,421 9,853 63.89% 5,385 34.92%
2017 14,137 10,430 73.78% 3,586 25.37%
Total 252,265 179,761 72,200
Source: Maryland Department of Planning, State Data Center 2016 New Housing Units Authorized for Construction.
Anne Arundel County
State of Maryland
According to the Census Bureau’s 2016 American Community Survey 1-year estimate, the median home value in Anne Arundel County was $338,500 (margin of error +/-$3,108), which is $48,100 higher than the median value in the State of Maryland ($290,400 with a margin of error +/-$755). Gross median rent was $1,520 (margin of error +/-$23) per month in Anne Arundel County and $1,264 (margin of error +/-$5) per month in Maryland.
- 67 -
Construction Activity
In fiscal year 2017, commercial development led by new construction showed a substantial increase. The new casino hotel, two assisted living facilities and school construction were major projects leading the commercial sector. Residential construction slowed as apartment starts decreased in fiscal year 2017 following a high volume in fiscal year 2016. The outlook for fiscal year 2018 shows similar trends for both commercial and residential. Building permit data for the last five fiscal years is shown below:
BUILDING PERMITS
($ in 000’s)
Year Issued Value Issued Value Issued Value Issued Value Issued Value
2013 1,792 $257,218 5,240 $74,245 54 $97,880 1,790 $168,466 8,876 $597,809
2014 1,800 248,167 5,973 113,376 78 175,406 1,847 210,164 9,698 747,113
2015 2,353 315,267 7,850 141,230 67 79,480 2,178 205,127 12,448 741,104
2016 3,045 424,187 8,687 148,703 95 69,854 2,309 200,154 14,136 842,898
2017 2,103 320,241 8,308 127,271 120 164,459 2,019 204,962 12,550 816,933
New Construction Total All Permits
Residential Commercial Combined
New Construction Other Other
Source: Data compiled by BOCS Building Evaluation Data. All values are exclusive of land.

- 68 -
(This page has been left blank intentionally.)
- 69 -
SECTION SIX: COUNTY ADMINISTRATION General Under its Charter, the County’s executive functions are vested in the elected County Executive and the Chief Administrative Officer. The County Council is the County legislative body and its seven members each represent one of the seven relatively equally populated councilmanic districts in which the elected Council member must reside. Each current County Council member was elected by the district that he or she represents. Council members and the Executive (who is elected county-wide) serve four-year terms, with a two-term limit. Each member of the County Council has one vote, and a simple majority of the County Council is sufficient to pass legislation in the absence of higher voting requirements. Emergency bills require the vote of five County Council members, as do County Council actions to override a veto by the County Executive. The County Council elects its own chairman annually. A chart of the County government organization may be found on the following page. The County’s financial matters are administered through the Office of Finance by the Controller of the County. The Controller is appointed by the County Executive on the basis of experience in financial administration and skill in public administration and governmental budgeting, and serves under the supervision of the Chief Administrative Officer. The Controller is charged with the administration of the financial affairs of the County, which generally include: the collection of State and County taxes, special assessments, water and wastewater utility charges, fees and other revenues and funds of every kind due to the County; the enforcement of the collection of taxes in the manner provided by law; the custody and safe-keeping of all funds and securities belonging to or by law deposited with, distributed to, or handled by the County; managing the level of County debt and making required payments thereon; the disbursement of County funds; the keeping and supervision of all accounts; and such other functions as may be prescribed by the Chief Administrative Officer or by legislative act of the County Council not inconsistent with the Charter of the County. With respect to budget matters, the Office of the Budget, headed by the Budget Officer, appointed by the County Executive and under the supervision of the Chief Administrative Officer, is responsible for formulating the budget; studying the organization, methods, and procedures of each office, department, and agency of the County government; the submission to the Chief Administrative Officer of periodic reports on efficiency and economy; and such other duties and functions as may be assigned by the Chief Administrative Officer or by legislative act of the County Council not inconsistent with the County Charter. Under the Charter, the County Executive has the power to appoint, without confirmation of the County Council, the Chief Administrative Officer, Budget Officer, County Attorney, County Controller, Personnel Officer, Planning and Zoning Officer, Director of Inspection and Permits, Administrative Hearing Officer, Director of Public Works, Chief of Police, Fire Chief, Director of Aging and Disabilities, Superintendent of Detention Facilities, Central Services Officer, Director of Information Technology, and Director of Recreation and Parks. The current County Charter allows for flexibility in reorganizing the executive branch. On the recommendation of the County Executive, the County Council, by an ordinance known as a reorganization ordinance, may create new offices, departments, bureaus, divisions or other units of the executive branch; may reorganize, reassign or abolish existing officers, departments, bureaus, divisions or other units of the executive branch of the County government; and may provide for the unit of the executive branch to report directly to the County Executive.
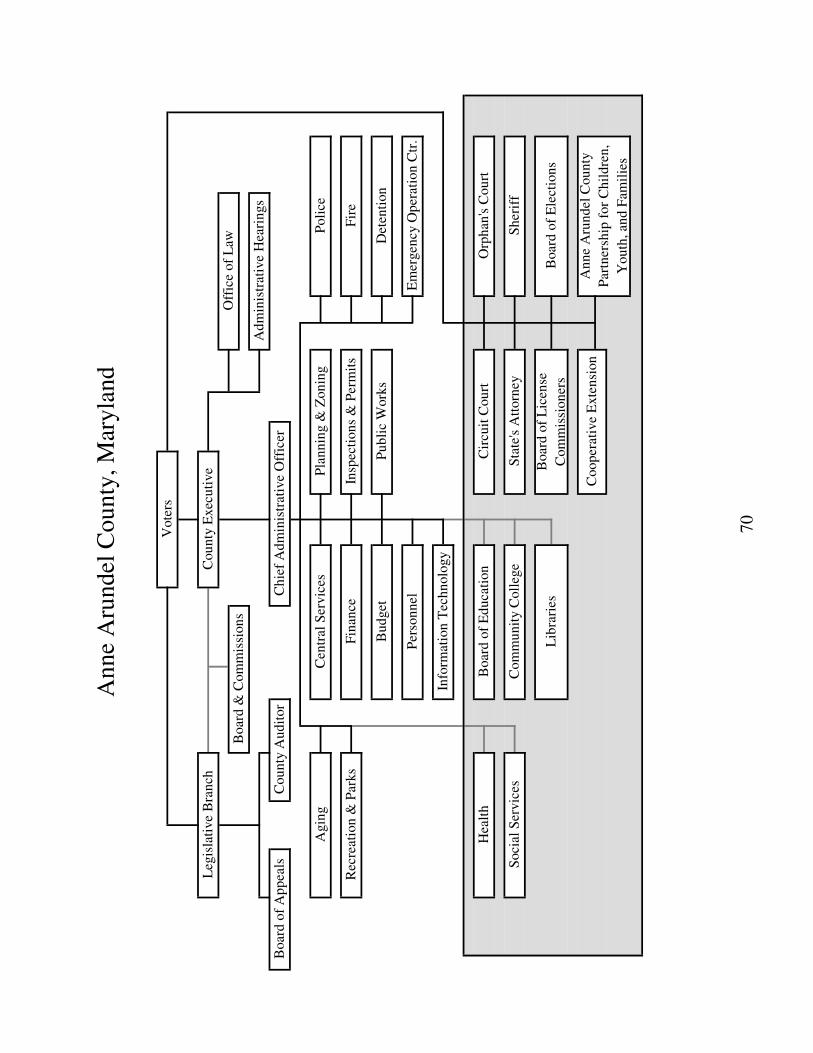
Coop
erat
ive
Exte
nsi
on
An
ne
Aru
nd
el C
ou
nty
Par
tner
ship
for
Ch
ild
ren
,
You
th, an
d F
amil
ies
Com
mu
nit
y C
oll
ege
Sta
te's
Att
orn
eyS
her
iff
Lib
rari
esB
oar
d o
f L
icen
se
Com
mis
sion
ers
Boar
d o
f E
lect
ion
s
Orp
han
's C
ou
rt
Cen
tral
Ser
vic
esP
lan
nin
g &
Zon
ing
Poli
ce
Fin
ance
Insp
ecti
on
s &
Per
mit
sF
ire
Bu
dget
Pu
bli
c W
ork
sD
eten
tion
Per
son
nel
Info
rmat
ion
Tec
hn
olo
gy
Em
ergen
cy O
per
atio
n C
tr.
An
ne
Aru
nd
el C
ou
nty
, M
ary
lan
d
Boar
d &
Com
mis
sion
s
Agin
g
Boar
d o
f A
pp
eals
Cou
nty
Exec
uti
ve
Cou
nty
Au
dit
or
Off
ice
of
Law
Ad
min
istr
ativ
e H
eari
ngs
Rec
reat
ion
& P
arks
Leg
isla
tive
Bra
nch
Hea
lth
Soci
al S
ervic
es
Vote
rs
Ch
ief
Ad
min
istr
ativ
e O
ffic
er
Boar
d o
f E
du
cati
on
Cir
cuit
Cou
rt
70
- 71 -
County Executive, Certain Appointed and Legislative Officials Executive
STEVEN R. SCHUH, County Executive, was elected in November 2014. Prior to being elected County Executive, Mr. Schuh served two terms in the Maryland General Assembly representing District 31, which included Pasadena and parts of Glen Burnie and Brooklyn Park. He was a member of the Economic Matters Committee and was chosen by his colleagues to serve as Chairman of the Anne Arundel County Delegation to the House of Delegates.
Mr. Schuh has been in business for nearly 30 years. As president of the private equity firm Schuh Advisory, he started businesses that now employ more than 400 people in the region. He was previously a Managing Director of Maryland-based Alex. Brown & Sons, the oldest investment banking firm in the United States, and of Credit Suisse, an international financial services firm.
Mr. Schuh earned a Bachelor’s degree in economics and government from Dartmouth College and Master’s
degrees in business and in education from Harvard University and Johns Hopkins University, respectively.
Appointed
MARK D. HARTZELL, is Chief Administrative Officer of Anne Arundel County. Mr. Hartzell previously served as Executive Vice President with Computershare, Inc. since 2010 and served as a member of the U.S. Executive Committee. Computershare is a global provider of financial services. As Executive Vice President, he led the sales and marketing division of the company. As a member of the U.S. Executive Committee, he helped manage approximately 4,000 employees in multiple locations. Prior to his time at Computershare, Mr. Hartzell was a managing director at J.P Morgan Chase, where he led the Global Sales and Client Management organization. J.P Morgan Chase is an American multinational banking and financial services company. It is the largest bank in the United States, with total assets of US$ 2.6 trillion. It is a major provider of financial services, and currently is the world's third largest public company based on a composite ranking. Prior to his position at J.P. Morgan Chase, Hartzell held senior management positions at Citibank and U.S. Bancorp. He is a graduate of Beloit College.
JOHN R. HAMMOND, Budget Officer, was appointed effective December 30, 1993. Prior to his
appointment he served as an institutional money manager, capital manager, and a governmental affairs officer in the property/casualty insurance field. Also, prior to his appointment, he served four terms as an elected alderman for the City of Annapolis and chaired the City Council’s Finance Committee for all 16 years of his service. Mr. Hammond holds a Bachelor’s degree in business and industrial management from The Johns Hopkins University and a Master’s degree in business administration from the Wharton Graduate Division of the University of Pennsylvania.
KARIN McQUADE, Controller, was appointed effective January 30, 2017. Prior to working at the
County, she has held senior level finance and accounting positions in the private sector and has worked for more than 30 years at various finance and accounting roles.
Ms. McQuade holds a Master’s Degree in Financial Management and a Bachelor of Science in Business
and Management from the University of Maryland, University College. She also received her Bachelor of Science in Elementary Education from the University of Pittsburgh and is a Certified Public Accountant (CPA).
NANCY McCUTCHAN DUDEN, County Attorney, was appointed effective December 1, 2014. Ms.
Duden has been with the Office of Law since 2004, serving as an Assistant County Attorney, Supervising County Attorney, and most recently, Deputy County Attorney. Prior to the Office of Law, Ms. Duden was, for 14 years, both a trial attorney for a major property casualty insurer and that company’s National Litigation Auditing Attorney.
- 72 -
Ms. Duden began her legal career as an associate with the private firm, Blumenthal, Wayson, Downs and Offutt, in 1987. Ms. Duden holds a Bachelor’s degree in Economics from Randolph-Macon Woman’s College and a Juris Doctor from the University of Maryland School of Law. Ms. Duden is a member of the bars of the State of Maryland, the District of Columbia and the United States District Court for the District of Maryland. JULIE A. MUSSOG, President and CEO of Anne Arundel County Economic Development Corporation, was appointed on November 1, 2016. Prior to her appointment, she served as Controller of Anne Arundel County and as Special Assistant to the County Executive for Anne Arundel County. Prior to working at the County, she worked at the State of Maryland as a Legislative Aide. Prior to her time at the State of Maryland she worked at various finance and accounting roles in the private sector including PricewaterhouseCoopers, Pulte Homes and Dell, Inc. She has 20 years of experience in the private and public sector. Ms. Mussog holds a Bachelor of Business Administration degree in Accounting from the University of Michigan’s Ross School of Business, Ann Arbor and a Masters of Business Administration degree from the University of Michigan’s Ross School of Business, Ann Arbor. She is a Certified Public Accountant (CPA) and a member of the Maryland Association of Certified Public Accountants and the Government Finance Officers Association.
Legislative
PETER I. SMITH, Councilman, First District, is serving his first term on the Council. Peter recently served as a Resource Manager for the Department of Defense. He has served in the United States Marine Corps for 20 years with 12 years of active duty service and is an Intelligence Officer in the Marine Corps Reserves. He has a Bachelor of Science Degree in Information Technology and an Associates of Art Degree in General Studies. He is also a Certified Defense Financial Manager, Contracting Officer Representative, and has attended the National Cryptologic School for Satellite and Network Fundamentals. He is a member of the Military Order of World Wars, the American Society of Military Comptrollers and Toastmaster International and the Marine Corps Association. Peter serves as the Toys for Tots Anne Arundel County coordinator. Peter resides in Severn and is married to Rebecca Smith. They have two children Isabella and Tristan.
* * *
JOHN J. GRASSO, Councilman, Second District is serving his second term on the Council. He was born in Baltimore, Maryland on October 29. Mr. Grasso attended Glen Burnie High School and Anne Arundel Community College. He also attended the Teterboro School of Aeronautics and Frederick Community College, graduating with a Federal Aviation Administration Air Frame and Power Plant License. He is a small business owner who lives in Glen Burnie with his wife, Natalie. Mr. Grasso has one brother and one son.
* * *
DEREK FINK, Councilman, Third District, is serving his second term on the Council. He is a graduate of North Carolina State University with a Bachelor of Arts Degree in Political Science. After graduating from college, Mr. Fink worked for Governor Robert L. Ehrlich, Jr. and then on Capitol Hill for Congressman Ed Whitfield. In the past, he has also served on the Board of Directors of the Maryland Association of Counties (MACo), the Robert A. Pascal Youth & Family Services Center, was a member of the Cox Creek Citizens Oversight Committee and the 100 Club of Anne Arundel County. He is currently a member of the Pasadena Business Association. Mr. Fink is a small business owner who lives in Pasadena with his wife, Kristin and their sons Owen and Kyle.
* * *
ANDREW C. PRUSKI, Councilman, Fourth District, is serving his first term on the Council. He graduated from Niagara University with a Bachelor of Arts in History and Masters of Education. He has business experience in the fields of real estate, construction sales and management, but has spent most of his professional career in the field of education. His educational work experience ranges from his work at the United State Department of Education to serving as a high school Social Studies teacher. Mr. Pruski has served on several national panels regarding educational issues including the National Council for Accreditation of Teacher Education’s blue-ribbon
- 73 -
panel studying teacher preparation. He currently serves as the Supervisor of Internal Assessment for the Prince George's County Public Schools System. In this capacity, he manages and supports internal assessment programs administered within the school system. Prior to being elected to the Anne Arundel County Council, Mr. Pruski has been active in numerous professional, civic, and community organizations. He served as a member of the Anne Arundel County Board Appeals, an At-Large member and Past President of the Anne Arundel County Board of Education, and as the past President of the Four Seasons Community Association. In addition, Mr. Pruski is also a coach and volunteer for the Gambrills Odenton Recreation Council (GORC) and active member of the West Anne Arundel County Chamber of Commerce. Mr. Pruski resides in the Four Seasons Community in Gambrills, with his wife Roxanne and their children, Jacob, Clara, and Walter.
* * *
MICHAEL A. PEROUTKA, Councilman, Fifth District, is serving his first term on the Council, and is
currently the Chairman. Michael Anthony Peroutka graduated from Loyola College (now University) in Maryland in 1974 with a Bachelor of Arts in Business Administration. In 1981, he graduated from the University of Baltimore, School of Law. Following his admission to the bar, he served in a legal capacity for the Department of Health and Human Services for a few years before partnering with his brother, Stephen in the law firm of Peroutka & Peroutka, P.A. of Pasadena, Maryland. After nearly 27 years as a principal in the firm, Mr. Peroutka has recently retired from private practice. In 2004, Michael Peroutka was the Constitution Party’s candidate for President of the United States of America. He ran on a platform that sought to Honor God, Protect the Family, and Restore the Republic. As co-founder of The Institute on the Constitution, a nation-wide program teaching the principles incorporated in the Declaration of Independence and the U. S. Constitution and the Maryland Constitution, Michael has taught and lectured in Maryland and across the country about law, liberty and government related topics. In 2014, Michael was elected to the Anne Arundel County Republican Central Committee. Michael is a member of Cornerstone Evangelical Free Church in Pasadena. He has three grown children and lives with his wife, Natalie, in Millersville.
* * *
CHRIS TRUMBAUER, Councilman, Sixth District, is serving his second term on the Council. Mr.
Trumbauer, born and raised in Chestertown on Maryland’s Eastern Shore, attended the University of Maryland – College Park where he received a Bachelor of Science degree in Chemistry in 1996. After graduation he was employed as a scientist at the Industrial Chemical Corporation in Baltimore until 1999 when he was hired by the Department of Natural Resources (DNR). At DNR he was responsible for running a water quality monitoring program which assessed the Chesapeake Bay and its numerous rivers and streams. In 2008 became the West/Rhode Riverkeeper where he was a leading advocate for the health of Anne Arundel County Rivers until November 2013. Currently, Mr. Trumbauer is Director of State and Environmental Initiatives with the Hatcher Group of Annapolis. Since moving to Anne Arundel County in 1997, Chris has been civically engaged in issues that matter to the citizens in Anne Arundel County by volunteering, and being involved with numerous civic organizations to include serving as a member of the Annapolis Environmental Commission, 2005 – 2007, Board of Directors, South River Federation, 2003-2009 (Vice President, 2005 – 2008), Chair, Mayor’s Environmental Transition Team, 2009, and Graduate of Leadership Anne Arundel’s Flagship Program, 2009. Mr. Trumbauer currently serves as a Member of the Board of Health, Member of the Commission on Disabilities, Member of the State Critical Area Commission for the Chesapeake and Atlantic Costal Bays and Chair of the Maryland Local Leaders advisory board for Smart Growth America. Mr. Trumbauer lives in Annapolis with his wife and their two children.
* * *
JERRY WALKER, Councilman, Seventh District, is serving his second term on the Council and is currently the Vice-Chairman. Previously on the Council, he served as Vice Chairman in 2012 and as Chairman in 2013 and 2015. He was born on the 4th of July and raised in New York City. He graduated summa cum laude from Liberty University with a Bachelor of Science Degree in Business, concentrating in Economics. He graduated from the University of Maryland, School of Public Policy's Academy for Excellence in Local Government. Since then he has taken additional graduate level courses in Leadership and Public Finance from the same program. In December of 2016, he graduated from American University with a Master’s Degree in Public Administration and Policy. Mr. Walker is a Vice President at DCA Imaging Systems, a local office technology company headquartered in Lanham, Maryland. He has worked for this family owned business for over 20 years and participated in its growth from five employees to over 50. In 2006, he won his first election to the Central Committee of his political party (Legislative
- 74 -
District 33) and served in leadership roles including Chairman. He was an alternate Delegate representing his Congressional District at both the 2008 and 2012 Presidential Conventions. Mr. Walker’s civic and community memberships have included the Greater Crofton, West County, Severna Park, and South County Chambers of Commerce. He is a member of the Maryland Farm Bureau, and formerly the Davidsonville Area Civic Association (DACA) where he served as the representative to the Greater Crofton Council. Mr. Walker serves on the board of the Maryland Association of Counties as the organization’s President and in that role, has been active in legislative lobbying on behalf of county governments at the Maryland General Assembly. In his spare time, he enjoys working out, reading and working on home improvement projects.
* * *
JOANNA D. DICKINSON was appointed County Auditor on September 19, 2016. She has worked in
local government accounting and auditing for more than 29 years, including 10 years in the Anne Arundel County Auditor’s Office and 8 years in the Anne Arundel County Office of Finance. She earned a Bachelor’s Degree in Business Administration from the University of Texas Pan American and a Master of Science in General Administration – Applied Management from the University of Maryland University College. She is a Certified Public Accountant and a Certified Fraud Examiner. She is a member of the American Institute of Certified Public Accountants, the Maryland Association of Certified Public Accountants, the Government Finance Officers Association, the Maryland Government Finance Officers Association, and the American Certified Fraud Examiners.
Labor Relations
For fiscal year 2018, the County Council authorized and approved 4,377 classified and non-classified employee positions for the County’s operating budget and 756 authorized temporary full and part-time employees, exclusive of the Board of Education, library, and community college. As of November 1, 2017 there are 4,837 positions filled.
Currently, there are twelve recognized “exclusive representatives” (unions or bargaining units) that engage in collective bargaining with the County.
Local 582 of the American Federation of State, County and Municipal Employees – represents laborers, operators, technicians and crew leaders throughout the County, as well as certain communications employees in the public safety departments, with a total of 804 authorized positions. New contract will expire June 30, 2018;
Local 2563 of the American Federation of State, County and Municipal Employees – represents administrative, support and clerical employees throughout the County, as well as certain civilian employees in the Police Department, with a total of 321 authorized positions. New contract will expire June 30, 2018;
Lodge #70 of the Fraternal Order of Police – represents Police Officers below the rank of Sergeant in the Police Department, with a total of 622 authorized positions. New contract will expire June 30, 2018;
Local #355 of the Teamsters Union – represents Deputy Sheriffs below the rank of Deputy Sheriff II in the Sheriff’s Office, with a total of 66 authorized positions. New contract will expire June 30, 2018;
Fraternal Order of Anne Arundel Detention Center Officers and Personnel, Inc. – represents Detention Officers below the rank of Sergeant in the Detention Center, with a total of 242 authorized positions. New contract will expire June 30, 2019;
Local #1563 of the International Association of Fire Fighters – represents Fire Fighters, Emergency Medical Technicians, Paramedics, Fire Lieutenants and Fire Captains in the Fire Department, with a total of 843 authorized positions. New contract will expire June 30, 2018;
Anne Arundel County Police Supervisors Association – represents Police Lieutenants and Police Sergeants in the Police Department, with a total of 107 authorized positions. New contract will expire June 30, 2019;
- 75 -
Local #141 of the International Union of Police Associations – represents Detention Sergeants, with a total of 24 authorized positions. New contract will expire June 30, 2019; Local #355 of the Teamsters Union – represents the Correctional Program Specialists at the Detention Center Facilities, with a total of 34 authorized positions. New contract will expire June 30, 2018; Lodge #106 of the Fraternal Order of Police – represents the Sheriff’s Sergeants, with a total of 8 authorized positions. New contract will expire June 30, 2019; Local #355 of the Teamsters Union – represents the Fire Battalion Chiefs, with a total of 17 authorized positions. New contract will expire June 30, 2018; and Local #355 of the Teamsters Union – represents the Park Rangers, with a total of 16 authorized positions. New contract will expire June 30, 2018.
As “exclusive representatives,” these twelve unions function as collective bargaining agents for all of the employees in the classifications the unions represent and negotiate with the County to determine the terms and conditions of employment (wages and premiums, hours of work, benefits, leave, promotions, discipline, etc.). Eight contracts will expire on June 30, 2018 and the County is currently involved in contract negotiations with those units for fiscal year 2019. The County has not experienced a work stoppage due to labor relations and considers its relationship with represented employees to be satisfactory. Source: Office of Personnel.

- 76 -
(This page has been left blank intentionally.)
- 77 -
SECTION SEVEN: SERVICES AND FACILITIES Education The Board of Education of Anne Arundel County (the “Board”) is responsible for the overall operation and policy decisions of the County’s public school system. The Board is composed of eight appointed members and one student member. With the beginning of the 2017-2018 school year, the Board exercised responsibility for 77 elementary schools, 19 middle schools, and 12 high schools, as well as 13 other education facilities, including two applied technology centers, three special education centers, two alternative centers, two early education centers, two charter schools, and two contract schools. The school system also operates six evening high school programs. With a student population of approximately 82,000 students, the goal for teacher-for-student ratio ranges from 1-for-20 in grades 6-8 to 1-for-28 in grades 4-5. With a fiscal year 2018 operating budget of $1,150,692,200, the average annual per pupil expenditure is approximately $13,736. The Class of 2017 boasted 5,167 graduates, 83% of whom went on to pursue postsecondary education at a two-year or four-year institution while earning $156.4 million in scholarships.
Higher Education The County is home to a wide range of higher education institutions. Among these are the following: Anne Arundel Community College – With learning as its central mission, Anne Arundel Community College (“AACC”) has responded to the needs of a diverse community for more than 50 years by offering high quality, affordable and accessible learning opportunities. The college’s nationally recognized and award-winning programs have helped its approximately 47,000 students annually achieve their academic, professional and personal goals. AACC is a fully accredited, public, two-year institution offering credit programs leading to an associate degree, certificate or a letter of recognition. Students may prepare to transfer to a four-year institution or prepare for an immediate career. AACC also offers extensive lifelong learning opportunities and noncredit, continuing education to those seeking career training or retraining, working to boost basic skills or pursuing new areas of interest. In addition to its main campus in Arnold, Md., the college has degree centers at Arundel Mills, in Glen Burnie and at centers and schools around the county. The Arundel Mills location also offers county residents the ability to obtain a bachelor’s degree in certain disciplines without having to leave the county. Designated a Regional Higher Education Center by the State, the Arundel Mills location houses the AACC University Consortium, which includes a select group of four-year colleges and universities that partner with AACC. These University Consortium partners include Frostburg State University, McDaniel College, Notre Dame of Maryland University, Stevenson University and University of Maryland University College. In 2012, the college opened the Center for Cyber and Professional Training in Hanover near Arundel Mills, which houses a 30,000-square-foot center with 13 specialized labs, a testing center and faculty support space.
St. John’s College in Annapolis – Offers Bachelor of Arts and Master of Arts in liberal arts programs based on the Great Books. St. John’s College seeks to maintain a population of 450-475 students and a faculty-student ratio of 1 to 8. Strayer University in Millersville – Offers undergraduate and graduate degree programs in accounting, business, education, health services administration, information technology, and public administration. Classes are held day and evening, seven days a week. U.S. Naval Academy in Annapolis – Offers Bachelors of Science in engineering and technical education for careers in U.S. Navy. The Naval Academy has a student enrollment of 4,450 and employs 560 full-time faculty. Other educational institutions offering classes in the County are Loyola College, Central Michigan University, Troy State University of Alabama – Atlantic Region, University of Baltimore, McDaniel College, and the College of Notre Dame. Public Safety The County Police Department is charged with the responsibility for the safety of the citizens of the County. The Department is divided into four police districts, with headquarters located in Millersville. The Department maintains a firearms training center, a recruit training center, enhanced 911 Emergency Response
- 78 -
Center, as well as a fleet of 498 radio-equipped vehicles for use throughout the Police Department. The Department consists of 678 officers, 241 civilian employees, and 140 school crossing guards. The County Fire Department is a combination career and volunteer force of 871 professional officers and firefighters, and approximately 500 response certified volunteers. There are 31 stations located in the County, with emergency calls handled through a modern central 911 dispatch center. In addition to firefighting equipment, there are 15 ambulances, 28 paramedic units and 2 paramedic engines serving the County. The Emergency Medical Services Division has one of the most efficient and progressive advanced life support programs of any jurisdiction. In addition to Suppression and Emergency Medical Services, the County Fire Department operates the Fire Marshal's office, which provides fire investigation and prevention services, a Training Division for both professional and volunteer firefighters, a Maintenance Division, and a Communications Division, which provides fire, rescue and EMS dispatch services for Anne Arundel County and the City of Annapolis.
Utilities
Electricity and Gas
Baltimore Gas and Electric Company (“BGE”) is the major utility company for the Baltimore region. BGE’s service area covers 2,300 square-miles for electric and 800 square-miles for gas. The service area includes Baltimore City and Central Maryland counties. BGE serves over 1,250,000 million businesses and residential electric customers and 650,000 gas customers within this service area. BGE is a major employer in the State of Maryland employing approximately 3,200 people. Since 2000, Maryland has offered a competitive utility supplier market. All electric customers of investor-owned utilities and major cooperatives in Maryland have the opportunity to choose their own electric supplier, while keeping BGE to deliver power and respond to power related emergencies.
Source: BGE, www.bge.com; MDelectricity.org.
Telecommunications Anne Arundel County has benefited as a result of the State of Maryland being a focal point for telecommunications technology development and application for several decades. Much of the activity is attributable to the presence in the County of federal agencies such as the National Security Agency, which collectively have been an excellent source of systems integration and networking opportunities for the private sector.
Verizon Maryland is the largest provider of communications in the State. Verizon Maryland’s fiber
network infrastructure is very robust with nearly 18,000 miles of all-fiber network and is valued at $5,500,000,000. More than 95 percent of access lines are served by digital technology and switching offices and are diversely linked by fiber-optic facilities
Among the services Verizon provides its residential and commercial telephone lines, long distance,
Internet access, DSL, advanced calling services, telephones and accessories, video service and more. Additional providers of communication services in Maryland are Comcast, Level 3 Communications and XO Communications.
Source: Verizon Communications, www.verizon.com; Maryland Department of Commerce, www.commerce.maryland.gov.
Medical and Health Services
The County is fortunate to have the services of premier health care systems that offer the latest in patient care and preventive medicine. In addition, the County’s proximity to Baltimore, Maryland and Washington, D.C. provides residents with access to prestigious health care and medical research institutions. County residents are within driving distance to such facilities as Johns Hopkins Hospital, the National Institute of Health, the University of Maryland Medical Center and Shock Trauma Center, the Kennedy Krieger Institute and the Children’s National Medical Center.
- 79 -
Anne Arundel Health System
Anne Arundel Health System, Inc. (“AAHS”), is a not-for-profit corporation based in Annapolis, delivering medical services in Anne Arundel County and portions of Calvert, Prince George’s, Queen Anne and Talbot Counties. AAHS affiliates include the Anne Arundel Medical Center (“AAMC”), Pathways Drug and Alcohol Treatment Center, Anne Arundel Diagnostics, the ask AAMC 24-hour health line, and five satellite locations in Bowie, Gambrills, Kent Island, Pasadena, Odenton and Waugh Chapel. AAHS employs more than 4,600 employees and has a medical staff of 1,000 plus in Anne Arundel County. AAHS acute care facility is located on 57 acres in the Carl A. Brunetto Medical Park on Jennifer Road in Annapolis. The medical center has 415 licensed beds including an 18-bed critical care unit, 12 surgical suites, and a state-of-the-art emergency department that services 95,995 patients per year. AAMC is adjacent to the Clatanoff Pavilion, which services women and children; an outpatient surgery center, the Edwards Pavilion; an Oncology Center, the Donner Pavilion; a medical office building, the Wayson Pavilion; and the Sajak Pavilion which houses the AAMC Breast Center, Anne Arundel Diagnostics, a diabetes center, the Geaton and JoAnn DeCesaris Cancer Institute; and the Maryland Neurological Institute. Source: Anne Arundel Medical Center, www.aa-healthsystem.org.
University of Maryland Baltimore Washington Medical Center
University of Maryland Baltimore Washington Medical Center (“UM BWMC”), in partnership with the University of Maryland Medical System, serves the health care needs of county residents in the northern and central parts of Anne Arundel County. This 321-bed hospital facility located in Glen Burnie employs 2,800 employees and 600 physicians. It houses one of the two busiest emergency rooms in the State, treating over 104,000 patients per year and features a 43,000 square foot, state-of-the-art facility. UM BWMC offers comprehensive in-house services including the Tate Cancer Center, the Center for Advanced Orthopedics, the Joslin Diabetes Center, the Aiello Breast Center, the Wound Healing Center, the Maryland Vascular Center, the Neurology/Sleep Center, Women’s’ and Children’s Services and Geriatric Care. In addition, UM BWMC annually reaches an estimated 25,000 community residents through lectures, health fairs, walking programs and screenings. Source: University of Maryland Baltimore Washington Medical Center; www.mybwmc.org.
Planning and Zoning The County Office of Planning and Zoning (the “Office”) is responsible for planning the physical growth of the County. The Office oversees the preparation and revision of the General Development Plan and various other master plans including the Water and Sewer Master Plan, Town Center master plans, Small Area Plans, and other functional plans. The Office is also responsible for administering the Subdivision and Development Regulations, reviewing all development applications for compliance with the Code, and updating the development regulations as needed. The Office also administers the Zoning Ordinance and periodic updates to the Code, and makes recommendations on zoning applications, variances, special exceptions, and nonconforming uses. The Office’s Research and GIS section maintains a large array of digital mapping coverages which are used by a variety of County agencies and customers, and is also responsible for various data reporting requirements and database maintenance and for assigning street address numbers. The Office’s Cultural Resources section maintains the County’s Historic Resources inventory, participates in a variety of historic preservation initiatives, and also administers a robust Archaeology Program that includes field investigations, research, and education. In 2016-17 some organizational changes were made to the Office. The Zoning Enforcement section, formerly housed within the Department of Inspections and Permits, was moved into Planning and Zoning. The section is responsible for investigating all reported zoning code violations, issuing citations when warranted, and managing all zoning enforcement cases through resolution. Finally, the Transportation Planning section in the Office was relocated into the new Office of Transportation formed by the County Executive and Council. The Planning Advisory Board, composed of seven qualified voters appointed by the County Executive, makes advisory recommendations to the Planning and Zoning Officer and the County Council relating to the
- 80 -
General Development Plan and other master plans, comprehensive zoning maps, certain development applications, and other duties as defined in the County Charter. The Planning Advisory Board also reviews the Capital Budget and Program each year and provides recommendations to the Budget Officer through the Planning and Zoning Officer. The County Executive uses these recommendations to develop a Capital Budget and Program for adoption by the County Council.
Public Works Anne Arundel County’s Department of Public Works performs all public improvement functions, except for schools, in the County. Effective July 1, 1993, the Department of Utilities consolidated into Public Works which became the County’s largest service department. Besides Water and Wastewater, Public Works is responsible for administering all aspects of road maintenance including the engineering, design, repair and maintenance of all County roads as well as snow removal, stream restoration, maintenance of bridges and viaducts, storm drain maintenance, sidewalk construction and repair and mosquito control. Additional duties include inspection services and watershed and stormwater management.
Water and Wastewater Under the County Charter, the Water and Wastewater Utility Fund was created as a separate and financially self-supporting public enterprise under the jurisdiction of the County for the purpose of supplying water and providing sewerage service to residents of the County. By ordinance, the County Council established the whole County, except for those portions of the County which are within the corporate limits of the City of Annapolis, as the Sanitary District of the County. Described below are the existing water and wastewater facilities in the County, as well as the planned expansions, and the related capacities of each.
Water Supply System
The County owns and operates water facilities that supply water to approximately 115,200 accounts. The County water system is groundwater oriented, producing drinking water at 12 treatment facilities and 4 independent wells. These facilities derive supplies from 55 production wells. The water system includes 17 booster stations and 27 elevated storage tanks with an effective storage capacity of 32.78 million gallons, and 7 ground storage tanks with a capacity of 13.67 million gallons. The average daily demand in 2017 was 33.46 MGD. The combined design capacity of County production facilities is 66.47 MGD. The County produced 12.21 billion gallons of water in 2017. Approximately 0.088 MGD was supplied by Baltimore City through 5 connections at the north end of the County. A supplemental source agreement between the County and Baltimore City allows up to 32.5 MGD.
Sewage Disposal System
The County is divided into eleven sewerage service areas. The County owns and operates sewerage treatment facilities and/or sewerage collection systems in eight of the service areas. The remaining three service areas all have conveyance systems that are operated and maintained by the County. One is a private treatment facility operated by Maryland Enviromental Service, the Piney Orchard Wastewater Treatment Plant, and the other two have treatment facilities located in neighboring municipalities. These service areas include: Baltimore City (served by Patapsco Sewage Treatment Plant in Baltimore City) and Rose Haven/Holland Point (served by the Chesapeake Beach Wastewater Treatment Plant in Calvert County). The sewerage treatment facilities and/or sewerage collection systems in the County’s eleven sewerage service areas provide treatment capacity of 53.18 MGD for approximately 123,500 accounts served by the County’s wastewater facilities. The treatment facilities and capacities are as follows:
- 81 -
Daily Flow as of Design to YearTreatment Facilities September, 2017 Capacity 2025 Cox Creek 11.97 15.00 15.00Patuxent 5.65 7.50 10.50Maryland City 1.19 2.50 3.30Broadneck 5.31 6.00 8.00Broadwater 1.23 2.00 2.00Annapolis (Joint Facility) 8.72 13.00 13.00Patapsco (Baltimore City) 4.49 6.39 6.39Mayo Wastewater Management System 0.57 0.65 -Rosehaven 0.10 0.14 0.14
Total 39.23 53.18 58.33
Source: Department of Public Works.
There is presently under various stages of design and construction the upgrading and/or expansion of several existing wastewater treatment facilities.
Solid Waste Management The Anne Arundel County Solid Waste Enterprise (the “Enterprise”) was created in 1969. It operates as a self-supporting utility with responsibilities including solid waste collection, recycling, and disposal. The Enterprise owns and operates the only sanitary landfill in the County, three residential solid waste drop-off facilities referred to as recycling centers, a paper recovery center for processing corrugated cardboard products from the commercial and residential sectors, a yard waste composting area on its landfill campus for recycling leaves and grass, and a landfill gas-to-electricity facility which uses captured methane gas as fuel in the production of electricity.
Waste Management Operations
Collection The Enterprise contracts with private haulers for the collection of residential trash, recyclables and yard waste generated in all of the urban and suburban areas of the County and many of the rural areas. The County retains control of these residentially collected materials and presently directs all trash to its own facilities as well as private facilities. Recyclables are directed to private facilities. The Enterprise itself owns and operates a small fleet of solid waste collection vehicles which provide residential services such as bulky item collections for appliances or large scrap metal items and a community-based neighborhood cleanup program.
Disposal The Enterprise owns three municipal solid waste landfill facilities. The Millersville Landfill and Resource Recovery Facility hosts the only fully operational landfill. Recycling centers, which accept recyclables, yard waste and trash from County residents, are located at the Glen Burnie landfill, the Sudley landfill, and the Millersville landfill. Post-closure care is provided at all three landfills. The Enterprise has completed the redesign of the Millersville landfill to maximize its disposal capacity and to incorporate state-of-the-art environmental controls such as multiple liners and cover systems, leachate collection systems including a pretreatment plant, and a gas management system, including a landfill gas-to-electricity facility. Landfill design elements exceed all present regulations and were selected to provide the necessary and required environmental safeguards. Disposal capacity development, in conjunction with waste reduction and recycling initiatives, is expected to provide the County with a solid waste disposal system that is projected to last at least until the year 2043. Future new disposal options will be studied as outlined in the 10-Year Solid Waste Management Plan.
Recycling The County achieved the original Maryland Recycling Act goal of 20% by January 1, 1994, and has exceeded the revised goal of 35% before December 31, 2015. Recycling in the residential sector (which began with the start-up program for 6,300 homes in 1989) has the Enterprise providing curbside recyclables and yard waste collection to all single-family dwellings, select multi-family residences, County offices and some small businesses served by government contractual private haulers since October 1993. Materials recovered include paper, plastic, metal and glass and yard waste. The current County curbside recycling rate is 43%.
- 82 -
The Enterprise has operated a commercial corrugated cardboard and paper processing operation since 1986. The facility receives, bales, and ships cardboard to market. The Enterprise also provides six household hazardous waste collection days per year.
Regional Involvement The County continues to explore and evaluate regional opportunities that deal with a variety of solid waste management activities. Cooperation with Baltimore City, Baltimore County, Carroll County, Harford County, Howard County, Montgomery County, and Prince George’s County is ongoing with work conducted through the Northeast Maryland Waste Disposal Authority, the Baltimore Metropolitan Council, and other organizations.
Financial Operation
The Enterprise operates as a utility, recovering its costs through service user fees. The main user charges are landfill tipping fees charged to commercial customers and customers with large loads, and waste collection customer fees charged to residential customers whose solid waste is collected by the Enterprise. User fee charges by the Enterprise are solely within the discretion of the County and are not subject to control by any State or federal agency. User fee ordinances must be approved by a majority of the County Council. Historically, the County has adopted rates sufficient for the Enterprise to meet or exceed its expenditure obligations for operation, maintenance, and debt service costs. The County has ensured the financial stability of the Enterprise through periodic review and revision of rate levels and structures over time. The Enterprise has never required the supplement of its revenues from other sources to meet its obligations. Significant landfill closure cost accruals have been recorded, using engineering estimates of the closure costs in light of U.S. Environmental Protection Agency regulations concerning solid waste disposal sites, and the period of estimated use of current cells. Rate increases have been implemented which management believes will ensure the long-term financial self-sufficiency of the Enterprise in view of the regulatory requirements. (See “FINANCES - Solid Waste Fund”).
Recreation and Parks
The Department of Recreation and Parks is primarily responsible for the administration of a comprehensive system of recreational programs for County residents and the preservation of valuable land in the form of more than 168 parks and sanctuaries. Specialized recreational facilities, including two swim centers, two ice rinks, three golf courses, baseball stadium, softball complexes, and approximately 110 miles of multi-use trails; programs such as school-age childcare and therapeutic recreation. More than 12,000 acres of parkland fall under the Department's jurisdiction. The Department's open space includes small neighborhood parks, greenways, archaeological, environmental and historical preserves, and large regional facilities occupying several hundred acres of land. A professional staff of park rangers, environmental specialists and athletic and recreational supervisors and planners provide leisure activities for citizens of all ages including the senior and physically challenged populations. Extensive volunteer networks supply more than 1,000,000 staff hours per year to Department programs. Source: Recreation & Parks.
Insurance It is the policy of the County to retain risks of losses in those areas where it believes it is more economical to manage its risks internally and set aside assets for claims settlement in its internal service fund. The County purchases insurance for cyber liability, real and personal property, boiler and machinery, and faithful performance bonds, as well as school bus insurance for the bus contractors of the Board of Education and vehicle liability insurance for the contract operation of the Department of Aging and Disability Transportation Program. The County maintains the self-insurance fund to provide workers’ compensation and directors’ and officers’ coverage for the County Government, the Board of Education and the Community College and general liability and vehicle liability coverage for the County Government and the Board of Education as well as to supplement the high deductible commercial first party property coverage.

- 83 -
The internal service fund, maintained to account for self-insurance activity, has no equity balance. (See “Appendix A, Basic Financial Statements,” Note 14). Source: Risk Management.

- 84 -
(This page has been left blank intentionally.)
- 85 -
SECTION EIGHT: APPROVAL OF OFFICIAL STATEMENT The execution and delivery of this Official Statement have been approved by Anne Arundel County, Maryland.
ANNE ARUNDEL COUNTY, MARYLAND By: /s/ Steven R. Schuh STEVEN R. SCHUH County Executive and By: /s/ Mark D. Hartzell MARK D. HARTZELL Chief Administrative Officer

- 86 -
(This page has been left blank intentionally.)
APPENDIX A
Anne Arundel County, Maryland
Basic
Financial
Statements
For the Fiscal Year Ended June 30, 2017

(This page left blank intentionally)
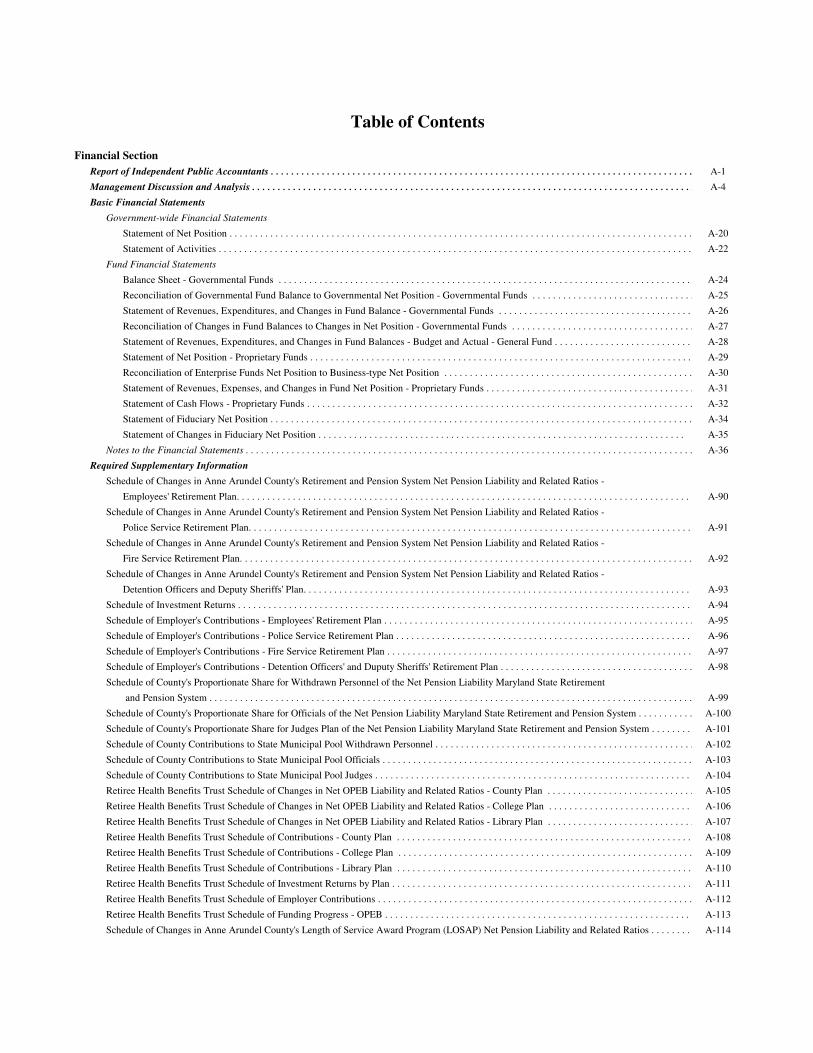
Table of Contents
Financial Section
Report of Independent Public Accountants . . . . . . . . . . . . . . . . . . . . . . . . . . . . . . . . . . . . . . . . . . . . . . . . . . . . . . . . . . . . . . . . . . . . . . . . . . . . . . . . . . . . . . . . . . . . . . . . . . . . . . A-1
Management Discussion and Analysis . . . . . . . . . . . . . . . . . . . . . . . . . . . . . . . . . . . . . . . . . . . . . . . . . . . . . . . . . . . . . . . . . . . . . . . . . . . . . . . . . . . . . . . . . . . . . . . . . . . . . . . . . . . . . . .A-4
Basic Financial Statements
Government-wide Financial Statements
Statement of Net Position . . . . . . . . . . . . . . . . . . . . . . . . . . . . . . . . . . . . . . . . . . . . . . . . . . . . . . . . . . . . . . . . . . . . . . . . . . . . . . . . . . . . . . . . . . . . . . . . . . . . . . . . . A-20
Statement of Activities . . . . . . . . . . . . . . . . . . . . . . . . . . . . . . . . . . . . . . . . . . . . . . . . . . . . . . . . . . . . . . . . . . . . . . . . . . . . . . . . . . . . . . . . . . . . . . . . . . . . . . . . . . . . .A-22
Fund Financial Statements
Balance Sheet - Governmental Funds . . . . . . . . . . . . . . . . . . . . . . . . . . . . . . . . . . . . . . . . . . . . . . . . . . . . . . . . . . . . . . . . . . . . . . . . . . . . . . . . . . . . . . . . . . . . . . A-24
Reconciliation of Governmental Fund Balance to Governmental Net Position - Governmental Funds . . . . . . . . . . . . . . . . . . . . . . . . . . . . . . . . . . . . . . . . . . . . . . . . . . . . . . . . . . . . . . . .A-25
Statement of Revenues, Expenditures, and Changes in Fund Balance - Governmental Funds . . . . . . . . . . . . . . . . . . . . . . . . . . . . . . . . . . . . . . . . . . . . . . . . . . . . . . . . . . . . . . A-26
Reconciliation of Changes in Fund Balances to Changes in Net Position - Governmental Funds . . . . . . . . . . . . . . . . . . . . . . . . . . . . . . . . . . . . . . . . . . . . . . . . . . . . . A-27
Statement of Revenues, Expenditures, and Changes in Fund Balances - Budget and Actual - General Fund . . . . . . . . . . . . . . . . . . . . . . . . . . . . . . . . . . . . . . . . . . . . . A-28
Statement of Net Position - Proprietary Funds . . . . . . . . . . . . . . . . . . . . . . . . . . . . . . . . . . . . . . . . . . . . . . . . . . . . . . . . . . . . . . . . . . . . . . . . . . . . . . . . . . . . . . . . . . .A-29
Reconciliation of Enterprise Funds Net Position to Business-type Net Position . . . . . . . . . . . . . . . . . . . . . . . . . . . . . . . . . . . . . . . . . . . . . . . . . . . . . . . . . . . . . . . . . . . . . . A-30
Statement of Revenues, Expenses, and Changes in Fund Net Position - Proprietary Funds . . . . . . . . . . . . . . . . . . . . . . . . . . . . . . . . . . . . . . . . . . . . . . . . . . . . . . . . . . . A-31
Statement of Cash Flows - Proprietary Funds . . . . . . . . . . . . . . . . . . . . . . . . . . . . . . . . . . . . . . . . . . . . . . . . . . . . . . . . . . . . . . . . . . . . . . . . . . . . . . . . . . . . . . . . . . . A-32
Statement of Fiduciary Net Position . . . . . . . . . . . . . . . . . . . . . . . . . . . . . . . . . . . . . . . . . . . . . . . . . . . . . . . . . . . . . . . . . . . . . . . . . . . . . . . . . . . . . A-34
Statement of Changes in Fiduciary Net Position . . . . . . . . . . . . . . . . . . . . . . . . . . . . . . . . . . . . . . . . . . . . . . . . . . . . . . . . . . . . . . . . . . . . . . . . A-35
Notes to the Financial Statements . . . . . . . . . . . . . . . . . . . . . . . . . . . . . . . . . . . . . . . . . . . . . . . . . . . . . . . . . . . . . . . . . . . . . . . . . . . . . . . . . . . . . . . . . . . . . . . . . A-36
Required Supplementary Information
Schedule of Changes in Anne Arundel County's Retirement and Pension System Net Pension Liability and Related Ratios -
Employees' Retirement Plan. . . . . . . . . . . . . . . . . . . . . . . . . . . . . . . . . . . . . . . . . . . . . . . . . . . . . . . . . . . . . . . . . . . . . . . . . . . . . . . . . . . . . . . . . . . . . . . . . . . . . . . . . .A-90
Schedule of Changes in Anne Arundel County's Retirement and Pension System Net Pension Liability and Related Ratios -
Police Service Retirement Plan. . . . . . . . . . . . . . . . . . . . . . . . . . . . . . . . . . . . . . . . . . . . . . . . . . . . . . . . . . . . . . . . . . . . . . . . . . . . . . . . . . . . . . . . . . . .A-91
Schedule of Changes in Anne Arundel County's Retirement and Pension System Net Pension Liability and Related Ratios -
Fire Service Retirement Plan. . . . . . . . . . . . . . . . . . . . . . . . . . . . . . . . . . . . . . . . . . . . . . . . . . . . . . . . . . . . . . . . . . . . . . . . . . . . . . . . . . . . . . . . . . . . . . . . A-92
Schedule of Changes in Anne Arundel County's Retirement and Pension System Net Pension Liability and Related Ratios -
Detention Officers and Deputy Sheriffs' Plan. . . . . . . . . . . . . . . . . . . . . . . . . . . . . . . . . . . . . . . . . . . . . . . . . . . . . . . . . . . . . . . . . . . . . . . . . . . . . . . . . . . . .A-93
Schedule of Investment Returns . . . . . . . . . . . . . . . . . . . . . . . . . . . . . . . . . . . . . . . . . . . . . . . . . . . . . . . . . . . . . . . . . . . . . . . . . . . . . . . . . . . . . . . . . . . . . . . . . . . . . . . . . . . .A-94
Schedule of Employer's Contributions - Employees' Retirement Plan . . . . . . . . . . . . . . . . . . . . . . . . . . . . . . . . . . . . . . . . . . . . . . . . . . . . . . . . . . . . . . . . . . . . .A-95
Schedule of Employer's Contributions - Police Service Retirement Plan . . . . . . . . . . . . . . . . . . . . . . . . . . . . . . . . . . . . . . . . . . . . . . . . . . . . . . . . . . . . . . . . . . . . .A-96
Schedule of Employer's Contributions - Fire Service Retirement Plan . . . . . . . . . . . . . . . . . . . . . . . . . . . . . . . . . . . . . . . . . . . . . . . . . . . . . . . . . . . . . . . . . . . . .A-97
Schedule of Employer's Contributions - Detention Officers' and Duputy Sheriffs' Retirement Plan . . . . . . . . . . . . . . . . . . . . . . . . . . . . . . . . . . . . . . . . . . . . . . . . . . . . . . . . . . . . . . . . . . . . .A-98
Schedule of County's Proportionate Share for Withdrawn Personnel of the Net Pension Liability Maryland State Retirement
and Pension System . . . . . . . . . . . . . . . . . . . . . . . . . . . . . . . . . . . . . . . . . . . . . . . . . . . . . . . . . . . . . . . . . . . . . . . . . . . . . . . . . . . . . . . . . . . . . . . . . . . . . . . . . . . . . . . . . . . . . . A-99
Schedule of County's Proportionate Share for Officials of the Net Pension Liability Maryland State Retirement and Pension System . . . . . . . . . . . . . . . . . . . . . . . . . . . . . . . . . . . . . . . . . . . . . . . . . . . . . . . . . . . . . . . .A-100
Schedule of County's Proportionate Share for Judges Plan of the Net Pension Liability Maryland State Retirement and Pension System . . . . . . . . . . . . . . . . . . . . . . . . . . . . . . . . . . . . . . . . . . . . . . . . . . . . . . . . . . . . . . .A-101
Schedule of County Contributions to State Municipal Pool Withdrawn Personnel . . . . . . . . . . . . . . . . . . . . . . . . . . . . . . . . . . . . . . . . . . . . . . . . . . . . . . . . . . . . . . . . . . . . .A-102
Schedule of County Contributions to State Municipal Pool Officials . . . . . . . . . . . . . . . . . . . . . . . . . . . . . . . . . . . . . . . . . . . . . . . . . . . . . . . . . . . . . . . . . . . . .A-103
Schedule of County Contributions to State Municipal Pool Judges . . . . . . . . . . . . . . . . . . . . . . . . . . . . . . . . . . . . . . . . . . . . . . . . . . . . . . . . . . . . . . . . . . . . .A-104
Retiree Health Benefits Trust Schedule of Changes in Net OPEB Liability and Related Ratios - County Plan . . . . . . . . . . . . . . . . . . . . . . . . . . . . . . . . . . . . . . . . . . . . . . . . . . . . . . . . . . . . . . . . . . . . . . . . . . . A-105
Retiree Health Benefits Trust Schedule of Changes in Net OPEB Liability and Related Ratios - College Plan . . . . . . . . . . . . . . . . . . . . . . . . . . . . . . . . . . . . . . . . . . . . . . . . . . . . . . . . . . . . . . . . . . . . . . . . . . .A-106
Retiree Health Benefits Trust Schedule of Changes in Net OPEB Liability and Related Ratios - Library Plan . . . . . . . . . . . . . . . . . . . . . . . . . . . . . . . . . . . . . . . . . . . . . . . . . . . . . . . . . . . . . . . . . . . . . . . . . . .A-107
Retiree Health Benefits Trust Schedule of Contributions - County Plan . . . . . . . . . . . . . . . . . . . . . . . . . . . . . . . . . . . . . . . . . . . . . . . . . . . . . . . . . . . . . . . . . . . . . . . . . . . . . . . . A-108
Retiree Health Benefits Trust Schedule of Contributions - College Plan . . . . . . . . . . . . . . . . . . . . . . . . . . . . . . . . . . . . . . . . . . . . . . . . . . . . . . . . . . . . . . . . . . . . . . . . . . . . . . . . A-109
Retiree Health Benefits Trust Schedule of Contributions - Library Plan . . . . . . . . . . . . . . . . . . . . . . . . . . . . . . . . . . . . . . . . . . . . . . . . . . . . . . . . . . . . . . . . . . . . . . . . . . . . . . . . A-110
Retiree Health Benefits Trust Schedule of Investment Returns by Plan . . . . . . . . . . . . . . . . . . . . . . . . . . . . . . . . . . . . . . . . . . . . . . . . . . . . . . . . . . . . . . . . . . . . . . . . . . . . . . . . A-111
Retiree Health Benefits Trust Schedule of Employer Contributions . . . . . . . . . . . . . . . . . . . . . . . . . . . . . . . . . . . . . . . . . . . . . . . . . . . . . . . . . . . . . . . . . . . . . . . . . . . . . . . . A-112
Retiree Health Benefits Trust Schedule of Funding Progress - OPEB . . . . . . . . . . . . . . . . . . . . . . . . . . . . . . . . . . . . . . . . . . . . . . . . . . . . . . . . . . . . . . . . . . . . . . . . . . . . . . . . A-113
Schedule of Changes in Anne Arundel County's Length of Service Award Program (LOSAP) Net Pension Liability and Related Ratios . . . . . . . . . . . . . . . . . . .A-114
Table of Contents (continued)
Combining Fund Statements,, and Other Supporting Schedules
Combining Fund Statements
Combining Statement of Net Position - Water and Wastewater Fund . . . . . . . . . . . . . . . . . . . . . . . . . . . . . . . . . . . . . . . . . . . . . . . . . . . . . . . . . . . . . . . . . . . . . . . . . A-116
Combining Statement of Revenues, Expenses, and Changes in Fund Net Position - Water and Wastewater Fund . . . . . . . . . . . . . . . . . . . . . . . . . . . . . . . . . . . . . . . . . .A-117
Combining Statement of Cash Flows - Water and Wastewater Fund . . . . . . . . . . . . . . . . . . . . . . . . . . . . . . . . . . . . . . . . . . . . . . . . . . . . . . . . . . . . . . . . . . . . . . . . . A-118
Combining Statement of Plan Net Position - Pension Trust Funds . . . . . . . . . . . . . . . . . . . . . . . . . . . . . . . . . . . . . . . . . . . . . . . . . . . . . . . . . . . . . . . . . . . . . .A-120
Combining Statement of Changes in Net Position - Pension Trust Funds . . . . . . . . . . . . . . . . . . . . . . . . . . . . . . . . . . . . . . . . . . . . . . . . . . . . . . . . . . . . . . . . . . . . . .A-121
Combining Statement of Fiduciary Net Position - Retiree Health Benefits Trust . . . . . . . . . . . . . . . . . . . . . . . . . . . . . . . . . . . . . . . . . . . . . . . . . . . . . . . . . . . . . . . . . . . . . .A-122
Combining Statement of Changes in Fiduciary Net Position - Retiree Health Benefits Trust . . . . . . . . . . . . . . . . . . . . . . . . . . . . . . . . . . . . . . . . . . . . . . . . . . . . . . . . . . . . . . . . . . . . . .A-123
Other Schedules
Details of Long-term Debt and Interest . . . . . . . . . . . . . . . . . . . . . . . . . . . . . . . . . . . . . . . . . . . . . . . . . . . . . . . . . . . . . . . . . . . . . . . . . . . . . . . . . . . . . . . . . . . . . . . . . . . . . . . . . . . . .A-124
CliftonLarsonAllen LLPCLAconnect.com
INDEPENDENT AUDITORS' REPORT
The Honorable County Executive and The Honorable Members of the County Council Anne Arundel County, Maryland
Report on the Financial Statements
We have audited the accompanying financial statements of the governmental activities, the business-type activities, the aggregate discretely presented component units, each major fund, the budgetary comparison for the General Fund and the aggregate remaining fund information of Anne Arundel County, Maryland (the County), as of and for the year ended June 30, 2017, and the related notes to the financial statements, which collectively comprise the County’s basic financial statements as listed in the table of contents.
Management’s Responsibility for the Financial Statements
Management is responsible for the preparation and fair presentation of these financial statements in accordance with accounting principles generally accepted in the United States of America; this includes the design, implementation, and maintenance of internal control relevant to the preparation and fair presentation of financial statements that are free from material misstatement, whether due to fraud or error.
Auditors’ Responsibility
Our responsibility is to express opinions on these financial statements based on our audit. We did not audit the financial statements of the Tipton Airport Authority and the Anne Arundel Workforce Development Corporation, which represents 1 percent of each of the assets and deferred outflows of resources, net position and revenues of the discretely presented component units. Those financial statements were audited by other auditors, whose reports thereon have been furnished to us, and our opinion, insofar as it relates to the amount included for the Tipton Airport Authority, and the Anne Arundel Workforce Development Corporation, is based solely on the reports of the other auditors. We conducted our audit in accordance with auditing standards generally accepted in the United States of America and the standards applicable to financial audits contained in Government Auditing Standards, issued by the Comptroller General of the United States. Those standards require that we plan and perform the audit to obtain reasonable assurance about whether the financial statements are free from material misstatement. The financial statements of the Anne Arundel Community College Foundation, which is included in the financial statements of the Anne Arundel County Community College, was not audited in accordance with Government Auditing Standards.
A-1
The Honorable County Executive and The Honorable Members of the County Council Anne Arundel County, Maryland
An audit involves performing procedures to obtain audit evidence about the amounts and disclosures in the financial statements. The procedures selected depend on the auditors’ judgment, including the assessment of the risks of material misstatement of the financial statements, whether due to fraud or error. In making those risk assessments, the auditor considers internal control relevant to the County’s preparation and fair presentation of the financial statements in order to design audit procedures that are appropriate in the circumstances, but not for the purpose of expressing an opinion on the effectiveness of the County’s internal control. Accordingly, we express no such opinion. An audit also includes evaluating the appropriateness of accounting policies used and the reasonableness of significant accounting estimates made by management, as well as evaluating the overall presentation of the financial statements.
We believe that the audit evidence we have obtained is sufficient and appropriate to provide a basis for our audit opinions.
Opinions
In our opinion, based on our audit and the report of other auditors, the financial statements referred to above present fairly, in all material respects, the respective financial position of the governmental activities, the business-type activities, the aggregate discretely presented component units, each major fund, the budgetary comparison for the General Fund and the aggregate remaining fund information of the County as of June 30, 2017, and the respective changes in financial position and, where applicable, cash flows thereof for the year then ended in accordance with accounting principles generally accepted in the United States of America.
Other Matters
Required Supplementary Information
Accounting principles generally accepted in the United States of America require that the management’s discussion and analysis, schedules of changes in net pension liability and related ratios, schedules of investment returns, schedules of employer’s contributions, schedules of proportionate shares of pension plans, schedules of County’s contributions, schedules of changes in net OPEB liability, schedules of contributions and schedule of funding progress – OPEB, as identified in the accompanying table of contents be presented to supplement the basic financial statements. Such information, although not a part of the basic financial statements, is required by the Governmental Accounting Standards Board who considers it to be an essential part of financial reporting for placing the basic financial statements in an appropriate operational, economic, or historical context. We have applied certain limited procedures to the required supplementary information in accordance with auditing standards generally accepted in the United States of America, which consisted of inquiries of management about the methods of preparing the information and comparing the information for consistency with management’s responses to our inquiries, the basic financial statements, and other knowledge we obtained during our audit of the basic financial statements. We do not express an opinion or provide any assurance on the information because the limited procedures do not provide us with sufficient evidence to express an opinion or provide any assurance.
Other Information
Our audit was conducted for the purpose of forming opinions on the financial statements that collectively comprise the County’s basic financial statements. The combining fund statements and other schedules, as referenced in the accompanying table of contents are presented for purposes of additional analysis and are not a required part of the basic financial statements.
A-2
The Honorable County Executive and The Honorable Members of the County Council Anne Arundel County, Maryland
The combining fund statements and other schedules are the responsibility of management and were derived from and relates directly to the underlying accounting and other records used to prepare the basic financial statements. Such information has been subjected to the auditing procedures applied in the audit of the basic financial statements and certain additional procedures, including comparing and reconciling such information directly to the underlying accounting and other records used to prepare the basic financial statements or to the basic financial statements themselves, and other additional procedures in accordance with auditing standards generally accepted in the United States of America. In our opinion, based on our audit, the procedures performed as described above, and the reports of the other auditors, the combining fund statements and other schedules are fairly stated, in all material respects, in relation to the basic financial statements as a whole.
Other Reporting Required by Government Auditing Standards
In accordance with Government Auditing Standards, we have also issued our report dated December 20, 2017, on our consideration of the County’s internal control over financial reporting and on our tests of its compliance with certain provisions of laws, regulations, contracts, and grant agreements and other matters. The purpose of that report is solely to describe the scope of our testing of internal control over financial reporting and compliance and the result of that testing, and not to provide an opinion on the effectiveness of the County’s internal control over financial reporting or on compliance. That report is an integral part of an audit performed in accordance with Government Auditing Standards in considering the County’s internal control over financial reporting and compliance.
a CliftonLarsonAllen LLP
Baltimore, Maryland December 20, 2017
A-3

Anne Arundel County, Maryland Management Discussion and Analysis Year Ended June 30, 2017
A-4
As Management of Anne Arundel County, Maryland (the County), we have prepared the following discussion and analysis to inform readers of the County’s annual financial report about the financial information that the enclosed statements present. We encourage readers to consider the discussion and analysis along with the other information in this report, including the transmittal letter and notes to the basic financial statements. In this section we have provided an overview of the basic financial statements, selected condensed financial data and highlights, and analysis of the County’s financial position and changes in financial position. Comparable amounts from the fiscal year ended June 30, 2016 have been provided.
Financial Highlights
Government-wide:
• The County’s assets and deferred outflow of resources exceeded its liabilities and deferred inflow of resources at the close of the fiscal year by $822.4 million. The unrestricted portion is a negative $1.2 billion which is composed of a deficit in the governmental activities of $1.2 billion and a surplus of $10.0 million in the business-type activities. The unrestricted deficit occurred in the governmental activities due to Board of Education and Anne Arundel Community College debt being recorded on the County’s balance sheet, but not the corresponding capital assets. Debt outstanding for education projects is $632.8 million and for college projects is $44.4 million. The current net value of the Board of Education capital assets is $1.13 billion and the community college net capital assets total $91.7 million. In the current fiscal year, the governmental activities unrestricted deficit increased by $18.6 million and the business-type activities unrestricted surplus increased by $4.6 million.
• Total net position of the County has increased by $34.9 million or 4.4% over the prior fiscal year. o In the governmental activities, total revenues increased $41.2 million or 2.6% while expenses decreased
$60.1 or 2.7% from the prior fiscal year, resulting in a $11.8 million increase in net position, which is $87.7 million more than the prior fiscal year change. Increases in general property tax, charges for services, and recordation and transfer tax revenues of $31.0 million, $10.2 million and $3.7 million, respectively, offset by a decrease in capital grants and contributions of $4.7 million were the primary drivers of the change in revenue. Lower expenses of $60.1 million were primarily due to a decrease in capital project funding for education, a decrease in the OPEB Trust transfer and a decrease in fixed assets expensed in the current fiscal year compared to the prior fiscal year. Further details are presented in the Management’s Analysis section of the MD&A.
o In the business-type activities, total revenues decreased by $6.6 million or 2.8% and total expenses increased by $2.2 million or 1.1%, from the prior fiscal year, resulting in a $23.1 million increase in net position which is $10.4 million less than the prior fiscal year change. The lower revenues were driven by a decrease in capital grants & developer contributions in the amount of $11.7 million. This was primarily from a decrease in capital grants of $13.1 million which resulted in part from a $14.2 million decrease in State grant funding for the Cox Creek Water Reclamation Facility enhanced Nutrient Removal.
Fund Level:
• The County’s governmental funds reported combined fund balances of $465.6 million, an increase of $40.8 million from the prior fiscal year. The greatest net change in fund balance was a $66.9 million increase from the prior fiscal year, in the General County Capital Projects Fund mainly due to a decrease in capital spending of $31.3 million and an increase in transfer in from bond proceeds, pay-go and impact fee funding of $10.0 million, $17.0 million and $10.9 million, respectively. For fiscal year 2017, the Impact Fees Capital Projects Fund balance decreased $3.2 million in part due to a decrease of $9.1 million in impact fees collected and an increase in transfers out of $16.1 million from the prior fiscal year. The General Fund balance increased $28.2 million as a result of the increase in operating revenue of $77.9 million, offset by an increase in operating expense of $43.6 million compared to the prior fiscal year. Nonmajor governmental funds balance decreased $15.4 million primarily due to a decrease in net operating income of $5.7 million, a decrease in transfers out of $10.9 million, an increase in transfers in of $1.6 million, and a decrease in general obligation bond revenue for the Watershed Protection and Reforestation Fund of $15.9 million in fiscal year 2017 compared to the prior fiscal year.
• Approximately 64.8% of the total governmental fund balance, $301.7 million, is available to meet the County’s current and future needs as mandated by the appropriate level of authority within the County and are properly designated as committed, assigned and unassigned.
Anne Arundel County, Maryland Management Discussion and Analysis Year Ended June 30, 2017
A-5
• Available fund balance for the General Fund was $170.6 million or 97.5% of the total fund balance, which is 12.4% of the current year expenditures. Non spendable fund balance of the General Fund was $3.1 million or 1.8% of the total fund balance. The restricted fund balance in the General Fund of $1.4 million or .8% has been restricted for the Base Realignment and Closure (BRAC) zone capital improvements.
• The business-type activities charges for service increased by $1.4 million or 1.0%, and capital contributions decreased $13.1 million or 16.0%. As discussed previously, this was primarily due to a decrease in capital grants & developer contributions. Non-operating revenues increased by $5.1 million or 38.9%, in part due to an increase in the amortization of bond premium, interest income and Bay Restoration grants of $1.6 million, $1.0 million and $1.0 million, respectively, from prior year. Operating expenditures increased by $2.2 million or 1.1%, and non-operating expenses decreased by $1.5 million, from the prior fiscal year.
Changes to debt:
• The County’s general obligation bonded debt increased by $10.7 million for governmental activities and $36.9 million for business-type activity in fiscal year 2017. The County issued additional general obligation debt, excluding refunding, in the amount of $104.0 million for governmental activities which will be used for education, public safety, infrastructure improvements, community college, watershed protection and restoration, and general government improvements. The County issued new bonds for business-type activity in the amount of $67.6 million for utility improvements. The County also drew down $3.0 million in Maryland Water Quality loans for water and waste water improvements.
Overview of Basic Financial Statements
The basic financial statements consist of the government-wide financial statements, fund financial statements, budgetary statements, and notes to the basic financial statements. Each component intends to provide a different perspective of the County’s financial results. These components are discussed below. Government-wide Financial Statements – These statements are designed to provide a broad, entity-wide perspective of the County’s financial position and changes in financial position. These statements are prepared using a full-accrual accounting method that measures changes when the underlying economic activity occurs regardless of the timing of the related cash flows. This method is consistent with that used in the private sector.
The government-wide statements have consolidated the Primary government’s operations into two columns, governmental activities and business-type activities. In addition, the component units’ entity-wide statements are presented. The governmental activities are those functions of the Primary government principally supported by taxes and other general revenue sources. Such activities include education, public safety, general government, health and human services, public works, recreation and community services, judicial, code enforcement, and land use and development. The business-type activities include the Primary government’s functions which are primarily supported by user-fees and charges, such as utility services, waste collection, and child care services.
Statement of Net Position – The Statement of Net Position presents the components of the County’s assets and deferred outflows of resources, liabilities and deferred inflow of resources, and the net position at end of the fiscal year. This statement includes long-term capital assets and long-term liabilities. In addition, capital assets are shown at their depreciated value. Over time, increases or decreases in net position may indicate an improvement in, or deterioration of, the County’s financial condition. Statement of Activities – The Statement of Activities presents information showing how the government’s net position changed during this fiscal year. All changes in net position are reported as soon as the underlying event giving rise to the change occurs, regardless of the timing of related cash flows. Thus, revenues and expenses are reported in this statement for some items that will only result in cash flow in future fiscal periods (e.g., uncollected taxes, revenues and earned but unused vacation leave).
Both statements include the Primary government’s component units, including the Board of Education, Community College, Library, Economic Development Corporation, Tipton Airport, and Workforce Development. These entities are included because the County provides a substantial amount of their funding or the County Executive appoints a
Anne Arundel County, Maryland Management Discussion and Analysis Year Ended June 30, 2017
A-6
majority of the Board members, implying a substantial degree of control over their management. In addition, the County approves the budgets of these entities.
Fund Financial Statements – The Primary government segregates its financial operations into several funds to account separately for funding sources and activities that the government undertakes. This provides better control over resources designated for specific activities or objectives. These funds are grouped into three different types: governmental funds, proprietary funds, and fiduciary funds.
Governmental Funds – The governmental funds of the Primary government include the General Fund; Capital Project Funds, which are used to accumulate and spend resources to construct capital assets; the special revenue funds, which segregate revenue sources to ensure these funds are spent on the intended purpose; and the debt service funds, which accumulate resources to pay certain long-term debt issued by the County or separate districts.
The perspective of these statements is narrower than the government-wide statements discussed previously. These statements present the financial position and changes in financial position resulting from currently available resources and currently due liabilities. Therefore, revenues are not recorded until available, and expenses are recorded primarily when the underlying economic activity occurs. In addition, because these statements focus on current resources, long-term assets and liabilities are not included.
The statements focus on the Primary government’s major funds. Major governmental funds include the General Fund, the Impact Fees Capital Projects Fund and the General County Capital Projects Fund. Separate columns are presented for those funds considered major either by size or by importance. The other funds are aggregated into one column called “other nonmajor funds.”
Proprietary Funds – The County maintains two types of proprietary funds. Enterprise funds are used to report the same functions presented as business-type activities in the government wide financial statements. Internal service funds are used to accumulate and allocate costs internally among the County’s various functions. Because these services predominately benefit governmental rather than business-type functions, they have been included within governmental activities in the government-wide financial statements. Transactions for these funds are recorded using the full-accrual basis of accounting whereby transactions are recorded when the underlying economic event takes place, regardless of the timing of cash flows. Moreover, long-term assets and liabilities are recorded on the statements. The enterprise funds include the Water and Wastewater Fund, the Solid Waste Fund, and the Child Care Fund. Internal service funds include the Self Insurance, Health Insurance, Central Garage and Transportation, and Garage Replacement Funds. These statements also focus on major funds so the County includes separate columns for the Water and Wastewater and Solid Waste Funds.
Fiduciary Funds – The fiduciary funds accumulate assets that are managed, but not owned, by the Primary government. The County’s four defined benefit pension plans that form the Retirement System Pension Trust Funds are included in this category. The Retiree Health Benefits Trust Fund (OPEB Trust Fund) administers multi-employer defined benefit plans for the purpose of providing retiree health benefits. In addition, this category includes agency funds used to accumulate temporary deposits and other funds collected from outside parties in order to be returned to the payer or passed on to a third party. The Pension and OPEB Trust Funds follow the full-accrual method of accounting. The agency funds are presented as balances only and do not record revenues or expenses. Fiduciary funds are not reflected in the government-wide financial statement because the resources of those funds are not available to support the County’s own programs.
Budgetary Statements – A budgetary statement of revenue and expenditures for the General Fund has been presented in the basic financial statements. This statement provides the results of the County’s General Fund operations compared to the legally adopted budget. The statement uses the budgetary method when accounting for transactions. Revenues are generally recognized when available, and expenditures are recognized when a commitment, in the form of a purchase order or contract, has been issued to a vendor.
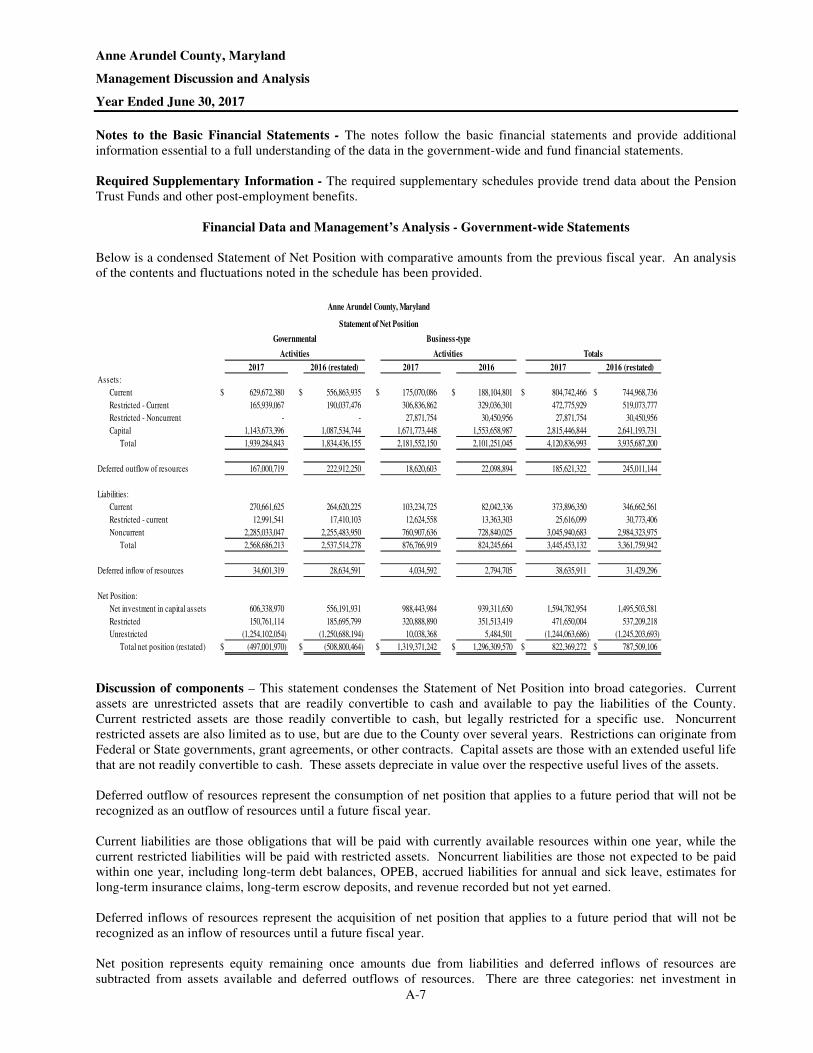
Anne Arundel County, Maryland Management Discussion and Analysis Year Ended June 30, 2017
A-7
Notes to the Basic Financial Statements - The notes follow the basic financial statements and provide additional information essential to a full understanding of the data in the government-wide and fund financial statements.
Required Supplementary Information - The required supplementary schedules provide trend data about the Pension Trust Funds and other post-employment benefits.
Financial Data and Management’s Analysis - Government-wide Statements
Below is a condensed Statement of Net Position with comparative amounts from the previous fiscal year. An analysis of the contents and fluctuations noted in the schedule has been provided.
2017 2016 (restated) 2017 2016 2017 2016 (restated)
Assets:
Current $ 629,672,380 $ 556,863,935 $ 175,070,086 $ 188,104,801 $ 804,742,466 $ 744,968,736
Restricted - Current 165,939,067 190,037,476 306,836,862 329,036,301 472,775,929 519,073,777
Restricted - Noncurrent - - 27,871,754 30,450,956 27,871,754 30,450,956
Capital 1,143,673,396 1,087,534,744 1,671,773,448 1,553,658,987 2,815,446,844 2,641,193,731
Total 1,939,284,843 1,834,436,155 2,181,552,150 2,101,251,045 4,120,836,993 3,935,687,200
Deferred outflow of resources 167,000,719 222,912,250 18,620,603 22,098,894 185,621,322 245,011,144
Liabilities:
Current 270,661,625 264,620,225 103,234,725 82,042,336 373,896,350 346,662,561
Restricted - current 12,991,541 17,410,103 12,624,558 13,363,303 25,616,099 30,773,406
Noncurrent 2,285,033,047 2,255,483,950 760,907,636 728,840,025 3,045,940,683 2,984,323,975
Total 2,568,686,213 2,537,514,278 876,766,919 824,245,664 3,445,453,132 3,361,759,942
Deferred inflow of resources 34,601,319 28,634,591 4,034,592 2,794,705 38,635,911 31,429,296
Net Position:
Net investment in capital assets 606,338,970 556,191,931 988,443,984 939,311,650 1,594,782,954 1,495,503,581
Restricted 150,761,114 185,695,799 320,888,890 351,513,419 471,650,004 537,209,218
Unrestricted (1,254,102,054) (1,250,688,194) 10,038,368 5,484,501 (1,244,063,686) (1,245,203,693)
Total net position (restated) $ (497,001,970) $ (508,800,464) $ 1,319,371,242 $ 1,296,309,570 $ 822,369,272 $ 787,509,106
Anne Arundel County, Maryland
Statement of Net Position
Activities
Business-typeGovernmental
Activities Totals
Discussion of components – This statement condenses the Statement of Net Position into broad categories. Current assets are unrestricted assets that are readily convertible to cash and available to pay the liabilities of the County. Current restricted assets are those readily convertible to cash, but legally restricted for a specific use. Noncurrent restricted assets are also limited as to use, but are due to the County over several years. Restrictions can originate from Federal or State governments, grant agreements, or other contracts. Capital assets are those with an extended useful life that are not readily convertible to cash. These assets depreciate in value over the respective useful lives of the assets. Deferred outflow of resources represent the consumption of net position that applies to a future period that will not be recognized as an outflow of resources until a future fiscal year. Current liabilities are those obligations that will be paid with currently available resources within one year, while the current restricted liabilities will be paid with restricted assets. Noncurrent liabilities are those not expected to be paid within one year, including long-term debt balances, OPEB, accrued liabilities for annual and sick leave, estimates for long-term insurance claims, long-term escrow deposits, and revenue recorded but not yet earned. Deferred inflows of resources represent the acquisition of net position that applies to a future period that will not be recognized as an inflow of resources until a future fiscal year. Net position represents equity remaining once amounts due from liabilities and deferred inflows of resources are subtracted from assets available and deferred outflows of resources. There are three categories: net investment in
Anne Arundel County, Maryland Management Discussion and Analysis Year Ended June 30, 2017
A-8
capital assets are amounts related to assets purchased or constructed net of the related debt; restricted funds are the amounts remaining after restricted liabilities are covered by restricted assets; and unrestricted funds. Management’s Analysis – Unrestricted current assets of governmental activities are $72.8 million more in fiscal year 2017. This is due primarily to an increase in cash and temporary investments, prepaid expenses, and due to other funds of $61.7 million, $6.3 million and $4.3 million, respectively. The business-type activities current assets decreased by $13.0 million, primarily due to an decrease in cash and temporary investments of $14.1 million offset by an increase in service billing receivables and inventories of $0.5 million and $0.6 million, respectively, from the prior fiscal year.
Restricted current assets in governmental activities decreased by $24.1 million or 12.7%. This was mainly from a decrease in restricted cash and investments of $24.1 million. The restricted cash in the Impact Fee Capital Projects Fund decreased by $6.3 million due to a decrease in fees recognized and an increase in transfers to other funds which resulted in a decrease in fund balance of $3.2 million. The General County Capital project fund had an increase in cash and investments of $28.0 million. This increase is the result of lower expenditures related to education projects. The Nonmajor Governmental Funds had a decrease in cash and investments of $13.4 million. This decrease was mainly due to a decrease in cash in the Bond Premium Fund of $18.7 million which was offset by an increase in the Watershed Protection and Restoration Fund of $6.0 million. The Bond Premium decrease was as a result of the transfer of the bond premium being sent to the General County Capital Project Fund in the same year that the premium was received. The decrease in current restricted assets in business-type activities of $22.2 million or 6.8% was primarily due to a decrease in cash and investments of $13.7 million and a decrease in receivables of $8.3 million. The decrease in cash was due mainly to the annual reallocation of cash in the Water and Wastewater Debt Service Fund and a decrease in due from other governmental agencies in the Water and Wastewater Capital Projects Fund. Restricted noncurrent assets in business-type activities decreased by $2.6 million from the prior fiscal year or 8.5%. This decrease resulted from a reduction in deferred income related to water and waste water allocation fees.
The governmental capital assets balance increased by $56.1 million from the prior fiscal year or 5.2%. Capital assets in the business-type activities increased by $118.1 million or 7.6%. These increases are the result of the completion of certain capital projects.
Current unrestricted liabilities for governmental activities increased by $6.0 million or 2.3%, from the previous fiscal year. This occurred primarily due to increases in accounts payable and accrued liabilities of $6.3 million. The accounts payable and accrued liabilities increase was mainly from the General Fund and the General County Capital Projects Fund in the amount of $3.1 and $3.2 million, respectively. The current unrestricted liabilities in business-type activities increased by $21.2 million or 25.8%, from the prior fiscal. This change was in part caused by an increase in accounts payables and accrued liabilities of $7.9 million and an increase in the current portion of long-term debt and obligations of $13.4 million. The increase in current long-term debt in part relates to landfill cell 8 which is scheduled to close in fiscal year 2018, therefore, the liability has moved from a long-term to a current liability.
Restricted current liabilities for governmental activities decreased by $4.4 million or 25.4%, from the prior fiscal year mainly as a result of a decrease in accrued liabilities of $4.6 million. Restricted current liabilities for business-type activities decreased by $0.7 million or 5.5%, from the previous fiscal year.
Noncurrent liabilities consist of bonded debt, pension benefits, OPEB obligation, unpaid insurance claims, loans, capital leases, and other liabilities. These liabilities increased $31.2 million or 2.0%, in governmental activities, and increased by $32.1 million or 4.4%, in business-type activities. The increase in governmental activities was mainly due to the recording of the annual OPEB obligation of $26.2, additional long-term debt of $13.6, an increase in the LOSAP pension obligation of $2.2 million and an increase of $2.3 million in unpaid insurance claims. This was offset by a decrease in the annual Pension obligation of $14.8 million. The increase in the noncurrent liabilities in business-type activities of $32.1 million for the current fiscal year was caused primarily by an increase in the net bonded debt of $44.4 million, offset by a decrease in estimated landfill closure and postclosure costs of $13.2 million. Landfill Cell 8 is in the process of closing so estimated costs have moved from long-term to current liabilities as stated above.
The components of governmental and business-type net position were discussed in the financial highlights above. It is important to note that although counties in the State of Maryland issue debt for the construction of schools, the schools are owned by the local Board of Education. Ownership reverts to the County if the building is no longer needed. The
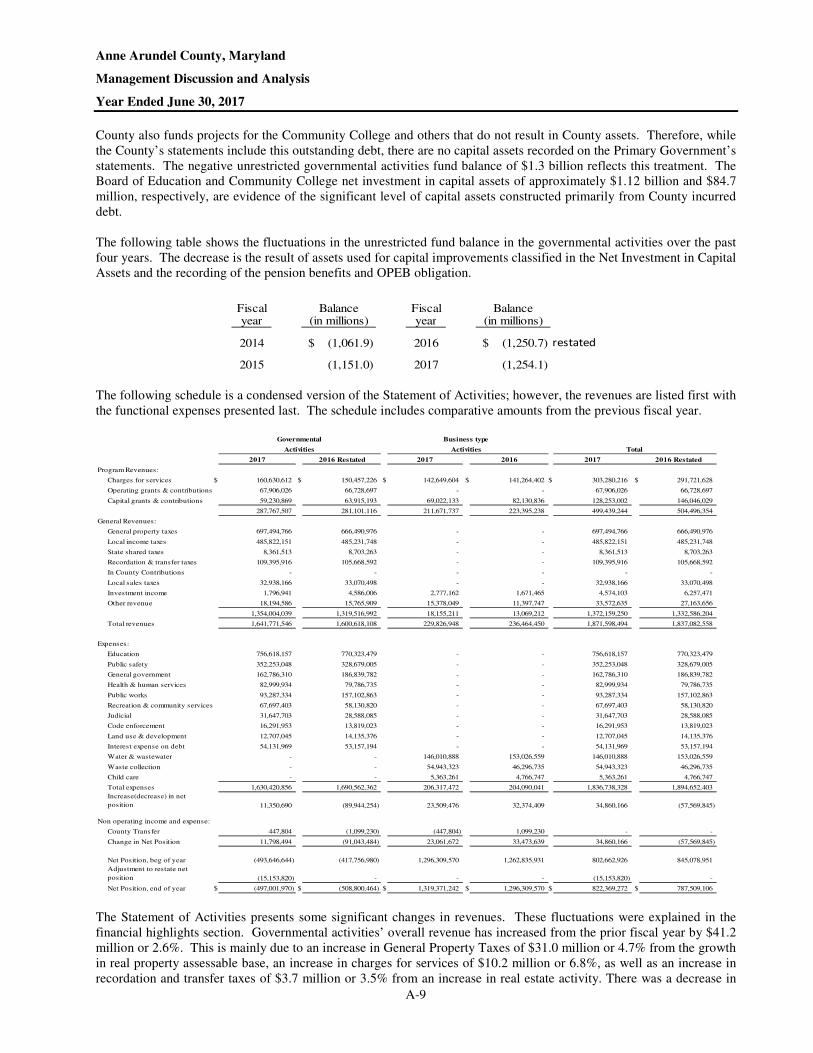
Anne Arundel County, Maryland Management Discussion and Analysis Year Ended June 30, 2017
A-9
County also funds projects for the Community College and others that do not result in County assets. Therefore, while the County’s statements include this outstanding debt, there are no capital assets recorded on the Primary Government’s statements. The negative unrestricted governmental activities fund balance of $1.3 billion reflects this treatment. The Board of Education and Community College net investment in capital assets of approximately $1.12 billion and $84.7 million, respectively, are evidence of the significant level of capital assets constructed primarily from County incurred debt.
The following table shows the fluctuations in the unrestricted fund balance in the governmental activities over the past four years. The decrease is the result of assets used for capital improvements classified in the Net Investment in Capital Assets and the recording of the pension benefits and OPEB obligation. The following schedule is a condensed version of the Statement of Activities; however, the revenues are listed first with the functional expenses presented last. The schedule includes comparative amounts from the previous fiscal year.
Governmental Business type
Activities Activities Total
2017 2016 Restated 2017 2016 2017 2016 Restated
Program Revenues:
Charges for services $ 160,630,612 $ 150,457,226 $ 142,649,604 $ 141,264,402 $ 303,280,216 $ 291,721,628
Operating grants & contributions 67,906,026 66,728,697 - - 67,906,026 66,728,697
Capital grants & contributions 59,230,869 63,915,193 69,022,133 82,130,836 128,253,002 146,046,029
287,767,507 281,101,116 211,671,737 223,395,238 499,439,244 504,496,354
General Revenues:
General property taxes 697,494,766 666,490,976 - - 697,494,766 666,490,976
Local income taxes 485,822,151 485,231,748 - - 485,822,151 485,231,748
State shared taxes 8,361,513 8,703,263 - - 8,361,513 8,703,263
Recordation & transfer taxes 109,395,916 105,668,592 - - 109,395,916 105,668,592
In County Contributions - - - - - -
Local sales taxes 32,938,166 33,070,498 - - 32,938,166 33,070,498
Investment income 1,796,941 4,586,006 2,777,162 1,671,465 4,574,103 6,257,471
Other revenue 18,194,586 15,765,909 15,378,049 11,397,747 33,572,635 27,163,656
1,354,004,039 1,319,516,992 18,155,211 13,069,212 1,372,159,250 1,332,586,204
Total revenues 1,641,771,546 1,600,618,108 229,826,948 236,464,450 1,871,598,494 1,837,082,558
Expenses:
Education 756,618,157 770,323,479 - - 756,618,157 770,323,479
Public safety 352,253,048 328,679,005 - - 352,253,048 328,679,005
General government 162,786,310 186,839,782 - - 162,786,310 186,839,782
Health & human services 82,999,934 79,786,735 - - 82,999,934 79,786,735
Public works 93,287,334 157,102,863 - - 93,287,334 157,102,863
Recreation & community services 67,697,403 58,130,820 - - 67,697,403 58,130,820
Judicial 31,647,703 28,588,085 - - 31,647,703 28,588,085
Code enforcement 16,291,953 13,819,023 - - 16,291,953 13,819,023
Land use & development 12,707,045 14,135,376 - - 12,707,045 14,135,376
Interest expense on debt 54,131,969 53,157,194 - - 54,131,969 53,157,194
Water & wastewater - - 146,010,888 153,026,559 146,010,888 153,026,559
Waste collection - - 54,943,323 46,296,735 54,943,323 46,296,735
Child care - - 5,363,261 4,766,747 5,363,261 4,766,747
Total expenses 1,630,420,856 1,690,562,362 206,317,472 204,090,041 1,836,738,328 1,894,652,403
Increase(decrease) in net
position 11,350,690 (89,944,254) 23,509,476 32,374,409 34,860,166 (57,569,845)
Non operating income and expense:
County Transfer 447,804 (1,099,230) (447,804) 1,099,230 - -
Change in Net Position 11,798,494 (91,043,484) 23,061,672 33,473,639 34,860,166 (57,569,845)
Net Position, beg of year (493,646,644) (417,756,980) 1,296,309,570 1,262,835,931 802,662,926 845,078,951
Adjustment to restate net
position (15,153,820) - - - (15,153,820) -
Net Position, end of year $ (497,001,970) $ (508,800,464) $ 1,319,371,242 $ 1,296,309,570 $ 822,369,272 $ 787,509,106 The Statement of Activities presents some significant changes in revenues. These fluctuations were explained in the financial highlights section. Governmental activities’ overall revenue has increased from the prior fiscal year by $41.2 million or 2.6%. This is mainly due to an increase in General Property Taxes of $31.0 million or 4.7% from the growth in real property assessable base, an increase in charges for services of $10.2 million or 6.8%, as well as an increase in recordation and transfer taxes of $3.7 million or 3.5% from an increase in real estate activity. There was a decrease in
Fiscal Balance Fiscal Balanceyear (in millions) year (in millions)
2014 (1,061.9)$ 2016 (1,250.7)$ restated
2015 (1,151.0) 2017 (1,254.1)
Anne Arundel County, Maryland Management Discussion and Analysis Year Ended June 30, 2017
A-10
capital grants and contributions of $4.7 million, and no new special taxing districts were created in the current fiscal year.
The governmental activities’ expenses had a decrease of $45.0 million or 2.7% from fiscal year 2016. Certain functional categories of expenditures had significant fluctuations during fiscal year 2017. The most notable fluctuations were in public works, general government and education which decreased by $63.8 million or 40.6%, $24.1million or 12.9%, and $13.7 million or 1.8%, respectively. These decreases were partially offset by increases in public safety and recreation and community services which increased by $38.7 million or 12.4%, and $9.6 million or 16.5%, respectively. The spending decrease in public works was driven by a reduction in the amount of fixed assets expensed in the amount of $61.0 million compared to prior year. The spending decrease in general government was in part the result of a decrease in the transfer to the OPEB Trust Fund in the amount of $28.9 million compared to the prior fiscal year. The spending decrease in education was as a result of the Board of Education spending less of the County’s funds for capital improvements. The increase in public safety spending was mainly driven by increases in other post-employment benefits which were reduced in the prior fiscal year as a result of changes in benefits and increases in the budgeted pay package. The increase in recreation and community service spending was due to an increase in capital outlay of $8.3 million compared to the prior fiscal year. In fiscal year 2016, the County reduced capital outlay by $5.7 million as a result of closing six recreation and parks projects valued at $1.0 million or more.
Business-type activities overall revenues decreased by $6.6 million or 2.8% from fiscal year 2016. The decrease in revenue is mainly due to a decrease in capital grants and contributions of $13.1 million or 16.0% from the previous fiscal year. This was mainly from a $14.2 million decrease in grant funding for the Cox Creek Water Reclamation Facility enhanced Nutrient Removal. General revenues increased by $5.1 million or 38.9% which was mainly from an increase in other revenues of $4.0 million from the prior fiscal year.
Business-type expenses had an overall increase of $2.2 million or 1.1% from the previous fiscal year which was primarily caused by an increase waste collection of $8.6 million. This increase was in part due to additional depletion expense related to landfill cell 8 that is 98% complete in the current fiscal year. The increase was offset by a decrease in water and wastewater of $7.0 million related to a reduction in capital projects expensed in the current fiscal year for items that did not result in depreciable assets. Distribution of Revenues and Expenses
The next two charts show the percentage distribution of revenues from governmental activities and the percentage expended on each function, respectively. Discussion of the 2017 distribution and significant changes since 2016 follows.
General revenue sources continue to provide the vast majority of the County’s revenue. Tax revenues from property assessments, income, State shared sources, recordation and transfer, and sales provided 81% of the revenue base, a decrease of 1% from fiscal year 2016 which was 82%. Charges for services paid to the County by users were 10% for fiscal year 2017, an increase of 1% from fiscal year 2016 which was 9%.
An analysis of the percentage distribution of revenues revealed that there was a slight decrease in income taxes from 30% to 29%. There were no changes in any other of the functions as a percent of the total from fiscal year 2016. An analysis of the percentage distribution of expenses by function revealed that public safety and recreation and community services increased from 19% to 22% and 3% to 4%, respectively, while public works and general government decreased from 9% to 6% and 11% to 10%, respectively.
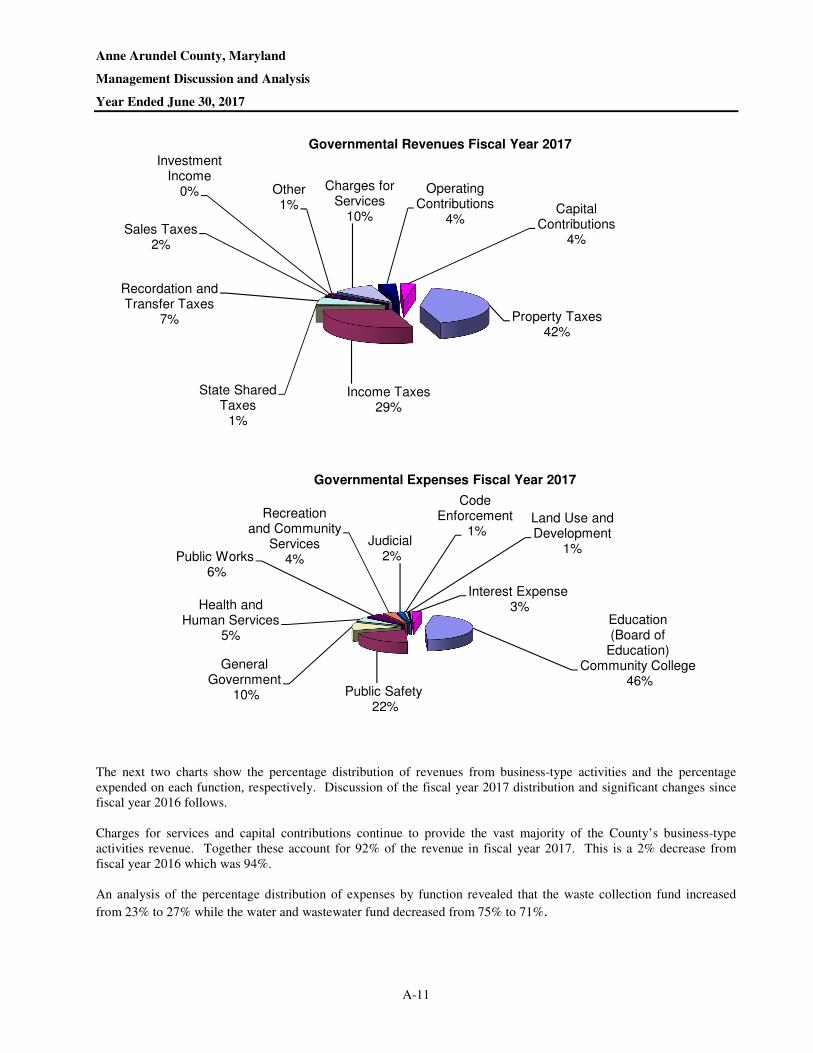
Anne Arundel County, Maryland Management Discussion and Analysis Year Ended June 30, 2017
A-11
The next two charts show the percentage distribution of revenues from business-type activities and the percentage expended on each function, respectively. Discussion of the fiscal year 2017 distribution and significant changes since fiscal year 2016 follows. Charges for services and capital contributions continue to provide the vast majority of the County’s business-type activities revenue. Together these account for 92% of the revenue in fiscal year 2017. This is a 2% decrease from fiscal year 2016 which was 94%.
An analysis of the percentage distribution of expenses by function revealed that the waste collection fund increased
from 23% to 27% while the water and wastewater fund decreased from 75% to 71%.
Property Taxes42%
Income Taxes29%
State SharedTaxes
1%
Recordation and Transfer Taxes
7%
Sales Taxes2%
InvestmentIncome
0% Other1%
Charges forServices
10%
OperatingContributions
4%Capital
Contributions4%
Governmental Revenues Fiscal Year 2017
Education(Board of
Education)Community College
46%Public Safety
22%
GeneralGovernment
10%
Health and Human Services
5%
Public Works6%
Recreationand Community
Services4%
Judicial2%
CodeEnforcement
1%Land Use andDevelopment
1%
Interest Expense3%
Governmental Expenses Fiscal Year 2017
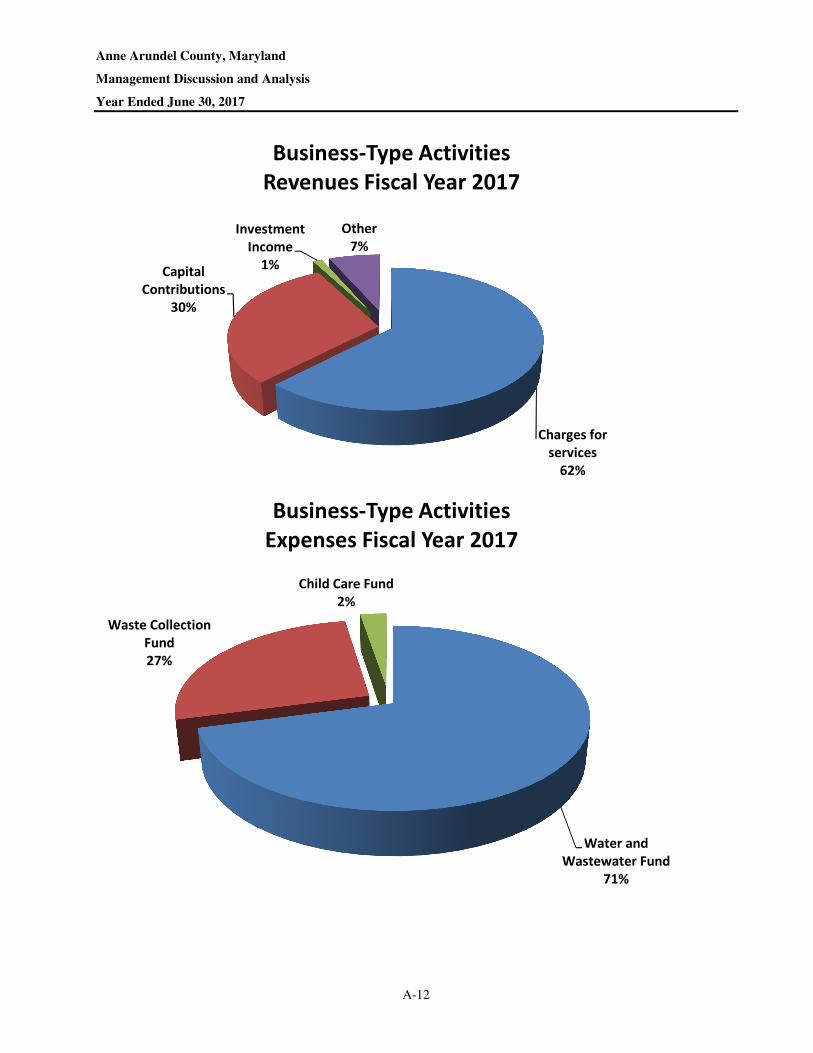
Anne Arundel County, Maryland Management Discussion and Analysis Year Ended June 30, 2017
A-12
Charges for
services
62%
Capital
Contributions
30%
Investment
Income
1%
Other
7%
Business-Type Activities
Revenues Fiscal Year 2017
Water and
Wastewater Fund
71%
Waste Collection
Fund
27%
Child Care Fund
2%
Business-Type Activities
Expenses Fiscal Year 2017
Anne Arundel County, Maryland Management Discussion and Analysis Year Ended June 30, 2017
A-13
Fund Statements
As noted earlier, the County uses fund accounting to ensure and demonstrate compliance with finance-related legal requirements. Although tables have not been included herein, certain elements of the major fund statements presented in the basic financial statements are discussed below. Governmental Funds:
The focus of the County’s governmental funds is to provide information on near–term inflows, outflows, and balances of spendable resources. Such information is useful in assessing the County’s financing requirements. In particular, committed, assigned, and unassigned fund balances can serve as a useful measure of a government’s net resources available for spending at the end of the fiscal year. Total assets in the General Fund increased from $288.0 million to $313.5 million or $25.5 million, from the prior fiscal year. The increase primarily occurred in cash and investments of $20.3 million and other receivables of $5.7 million. The increase in other receivables was the result of an increase in accruals of $3.7 million and also the recording of a receivable from the OPEB Trust due to the County in the amount of $1.9 million. Total fund balance increased from $146.8 million to $175.0 million or $28.2 million. This increase in fund balance resulted in part from revenues exceeding expenditures in the amount of $21.0 million in the current fiscal year. General Fund expenditures increased from $1,336.6 million to $1,380.2 million or $43.6 million and revenues increased from $1,323.3 million to $1,401.2 million or $77.9 million over the prior fiscal year. The main increases in revenue were in general property tax, local income tax, video lottery local impact aid, and fees for service and other revenues of $27.1 million, $35.3 million, $5.4 million, and $9.2 million, respectively. The video lottery local impact aid increase was as a result of table game revenues received from the State of Maryland which began in the current fiscal year. The increase in other revenues was in part from increases in health and human service reimbursements, police state aid and federal storm reimbursements of $3.2 million, $2.0 million and $1.5 million, respectively. The County has a Revenue Reserve Fund which is included in the unassigned category of General Fund balance. At the end of the current fiscal year, a balance of $59.5 million was in the reserve fund. This increase from the prior fiscal year is from the current year contribution of $2.0 million and investment earnings of $0.2 million. This reserve may only be used when revenues fall below budget expectations and would require legislative action. This fund has been in existence since fiscal year 1994 and has been drawn on by Management in fiscal year 2009 and fiscal year 2010 in the amounts of $16.8 million and $16.0 million, respectively, as a result of underperforming revenues during the recession of 2008 and 2009. The Impact Fees Capital Project Fund retains developer impact fees until needed for the construction of capital assets. The total fund balance decreased $3.1 million, from $93.3 million in fiscal year 2016 to $90.1 million in fiscal year 2017. This was a result of a decrease in impact fees recognized of $24.6 million in fiscal year 2017 versus $33.7 million in prior fiscal year and an increase in transfers to other funds of $16.0 million ($25.7 million transferred out in fiscal year 2017 compared to $9.7 million in prior fiscal year). The amounts transferred are used for the construction of capital assets and to pay off debt, both of which are related to impact fee eligible projects. There was a slight decrease in expenses as $2.7 million was recorded in fiscal year 2017 versus $3.5 million in fiscal year 2016. The General County Capital Projects Fund’s total assets increased from $154.9 million in fiscal year 2016 to $189.8 million in fiscal year 2017, or $34.9 million. This is primarily due to an increase in cash and investments of $28.0 million at the end of current fiscal year which is in part due to an increase in unspent funds of $26.7 million that includes $18.0 million in unspent bond premium. Liabilities increased by $0.3 million compared to the prior fiscal year, primarily due to an increase in accounts payable and accrued liabilities of $3.2 million, offset by a decrease in due to the Board of Education of $3.3 million. The increase of $3.3 million was mainly due to a year-end accrual for the purchase of Eisenhower Golf Course. Deferred inflow of resources increased $3.5 million due to an increase in unavailable grant revenue. The net change in fund balance from the prior fiscal year increased from $107.4 million to $138.6 million in fiscal year 2017. Total fund balance increased $31.2 million from the prior fiscal year.
Anne Arundel County, Maryland Management Discussion and Analysis Year Ended June 30, 2017
A-14
Revenues in the General County Capital Projects Fund decreased from $18.5 million in fiscal year 2016 to $12.5 million in fiscal year 2017, or by $6.0 million. This decrease is attributable to a reduction in contributed capital of $4.6 million and a decrease in grant and aid revenue of $2.1 million. Expenditures in this fund decreased by $31.3 million which is attributed to a decrease of $43.5 million for amounts paid to the Board of Education and Community College for capital projects and a $12.2 million increase in capital outlay expense. The decrease in Board of Education and Community College is primarily attributable to the decrease in cost for school construction. Although, school construction costs fluctuated based on various projects, Severna Park High School’s construction costs decreased by $28.4 million compared to the prior fiscal year. Proprietary Funds:
The County’s proprietary fund’s statements provide the same information found in the government-wide financial statements, but in more detail. The Water and Wastewater Fund’s assets totaled $2.07 billion at the end of fiscal year 2017 which was an increase of $78.7 million over fiscal year 2016. The increase mainly occurred as a result of an increase in capital assets of $110.4
million and a decrease in cash and investments, and amounts due from other government agencies of $21.5 million and $8.3 million, respectively. Capital assets increase each year as capital projects are completed and developer donated water and sewer facilities are added. The decrease in cash and investments was in part due to the annual reallocation of restricted cash in the Utility Debt Service Fund which decreased by $6.0 million compared to the prior fiscal year. Liabilities have increased by $51.2 million. The increase resulted primarily from additional long-term bonded debt of $42.1 million and an increase in accounts payable and accrued liabilities of $8.2 million. As a result of the changes in assets and liabilities, the Water and Wastewater Fund’s net position increased $23.8 million or 1.8%.
The Statement of Revenues, Expenses, and Changes in Fund Net Position for Water and Wastewater Fund had an increase in operating revenues of $1.1 million. Operating expenses decreased by $10.4 million or 7.3%. Non-operating revenue increased from the previous year by $0.4 million. Capital contributions, fees and grants decreased by $13.2 million. These contributions represent the capital assets built by developers and fees collected from properties connecting to the County’s water and wastewater systems.
The Solid Waste Fund’s assets increased by $0.9 million, primarily due to an increase in capital assets of $7.8 million offset by a decrease in cash and investments of $8.4 million. Liabilities increased by $1.4 million from the prior fiscal year. An increase in long-term debt and estimated landfill closure and postclosure of $1.6 million, including the current portion contributed to this change.
The Statement of Revenues, Expenses, and Changes in Fund Net Position for Solid Waste had an increase in operating revenue of $1.2 million and an increase in operating expenses of $8.9 million. This contributed to a decrease in net position of $1.5 million at the end of the current fiscal year. The decrease was in part from an increase in depreciation expense of $5.3 million which increased as a result of an increase in depletion for cell 8 as discussed previously.
Fiduciary Funds:
Fiduciary funds include the Pension Trust Funds, the OPEB Trust Fund, and the Agency Funds. The Pension Trust Funds are presented for the calendar year ended December 31, 2016. Investments increased by $79.5 million in calendar year 2016. Net position increased from $1.61 billion to $1.68 billion or 4.8%. Contributions increased from $79.0 million in 2015 to $80.4 million during 2016 and investment activity increased by $141.4 million from prior year. The net positon of the OPEB Trust at the end of the current fiscal year was $101.8 million, an increase of $36.5 million from the prior fiscal year. Agency funds increased from $29.7 million in fiscal year 2016 to $32.0 million in fiscal year 2017. This increase was in part due to a $2.3 million increase in tax sale escrow deposits.
Budgetary Variations: The budgetary statements of the General Fund show actual revenues of $1.47 billion compared to budgeted amounts of $1.41 billion, resulting in $60.2 million more revenue than anticipated. The most significant budgetary variations within components of revenue were the increase of general property tax, local income tax, and recordation and transfer taxes which exceeded budgetary expectation by, $7.3 million or 1.1%, $28.5 million or 6.2%, and $14.4 million or
Anne Arundel County, Maryland Management Discussion and Analysis Year Ended June 30, 2017
A-15
15.2%, respectively. The remaining positive variances were mainly due to increases in ambulance fees, video lottery impact aid, investment income, interfund recoveries, and fees for service and other revenues of $2.0 million, $1.6 million, $1.6 million, $2.4 million, and $4.6 million, respectively. Local sales taxes were less than expected by $1.2 million.
Total expenditures on a budgetary basis were $1.44 billion compared to appropriation authority of $1.45 billion, resulting in $11.5 million or 0.8%, less than planned. Only modest variances were noted in the various expenditure categories which were attributed to a continued focus on cost avoidance and containment during fiscal year 2017.
In reviewing the changes from the original budget to the final budget, budgeted revenues increased by $0.3 million. Budgeted expenses increased by $5.3 million. These expense increases were primarily in education, public safety, and public works in the amount of $5.0 million, $1.4 million, and $1.8 million, respectively. There was a decrease in the general government original expense budget compared the final budget in the amount of $4.5 million to cover most of the shortfalls stated. Management is not aware of any reasons why these and other budgetary variations would have a significant effect on future liquidity or services.
Capital Assets
The next table presents the asset values of the capital asset categories in governmental and business-type activities, net of accumulated depreciation. A discussion of the fluctuations follows. Governmental capital assets – The governmental activities capital assets increased by $56.1 million or 5.2%, from fiscal year 2016. The following table shows an increase in land and easements, roads and bridges, storm drains and culverts, automobiles and rolling stock, and construction in progress of $6.1 million, $4.2 million, $11.1 million, $6.3 million, and $45.6 million, respectively. These increases were partially offset by a decrease in land improvements, buildings, sidewalks curbs and gutters, and furniture and fixtures of $4.4 million, $6.5 million, $1.7 million and $4.7 million, respectively. Some major capital asset events during the current fiscal year included the following:
o $8.7 million for a new Eastern District Police Station o $3.7 million in road reconstruction and resurfacing o $3.4 million for park and trail improvements throughout the County o $3.1 million for the purchase of Eisenhower Golf Course
o 80 new vehicles were purchased including fire trucks, ambulances, and various autos
Business-type capital assets – The business-type activities capital assets increased by $118.1 million or 7.6%, from fiscal year 2016. The following table shows an increase in landfills, water and sewer plants and lines, automobiles and rolling stock, and construction in progress of $6.2 million, $49.8 million, $1.7 million, and $61.8 million, respectively. These increases were offset by a decrease in buildings of $1.0 million. The remaining categories of assets show modest variations because new additions are negated by the continued depreciation of existing assets. Major capital asset events during the current fiscal year included the following:
o $18.2 million for Patuxent water reclamation facility o $16.5 million for Mayo water reclamation facility expansion o $15.1 million for Maryland City water reclamation facility expansion o $15.1 million for general water and sewer main replacement and reconstruction o $10.0 million for cell 9 construction and cell 8 closure at landfill o $9.2 million for general upgrades and retrofit of sewer pumping station o $8.0 million for Cox Creek water reclamation facility enhanced nutrient removal o $7.8 million for Cox Creek water reclamation facility non-enhanced nutrient removal o $7.7 million for elevated water storage tanks
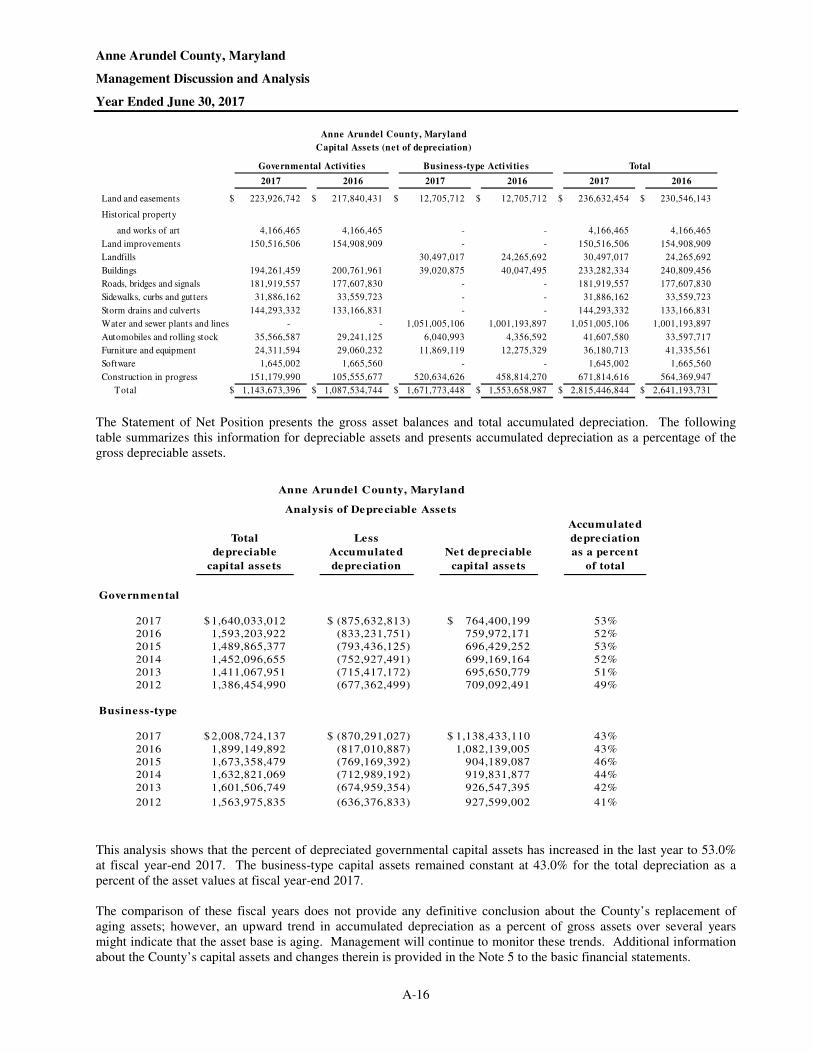
Anne Arundel County, Maryland Management Discussion and Analysis Year Ended June 30, 2017
A-16
Anne Arundel County, Maryland
Capital Assets (net of depreciation)
Governmental Activities Business-type Activities Total
2017 2016 2017 2016 2017 2016
Land and easements $ 223,926,742 $ 217,840,431 $ 12,705,712 $ 12,705,712 $ 236,632,454 $ 230,546,143
Historical property
and works of art 4,166,465 4,166,465 - - 4,166,465 4,166,465
Land improvements 150,516,506 154,908,909 - - 150,516,506 154,908,909
Landfills 30,497,017 24,265,692 30,497,017 24,265,692
Buildings 194,261,459 200,761,961 39,020,875 40,047,495 233,282,334 240,809,456
Roads, bridges and signals 181,919,557 177,607,830 - - 181,919,557 177,607,830
Sidewalks, curbs and gutters 31,886,162 33,559,723 - - 31,886,162 33,559,723
Storm drains and culverts 144,293,332 133,166,831 - - 144,293,332 133,166,831
Water and sewer plants and lines - - 1,051,005,106 1,001,193,897 1,051,005,106 1,001,193,897
Automobiles and rolling stock 35,566,587 29,241,125 6,040,993 4,356,592 41,607,580 33,597,717
Furniture and equipment 24,311,594 29,060,232 11,869,119 12,275,329 36,180,713 41,335,561
Software 1,645,002 1,665,560 - - 1,645,002 1,665,560
Construction in progress 151,179,990 105,555,677 520,634,626 458,814,270 671,814,616 564,369,947
Total $ 1,143,673,396 $ 1,087,534,744 $ 1,671,773,448 $ 1,553,658,987 $ 2,815,446,844 $ 2,641,193,731
The Statement of Net Position presents the gross asset balances and total accumulated depreciation. The following table summarizes this information for depreciable assets and presents accumulated depreciation as a percentage of the gross depreciable assets.
Total
depreciable
capital assets
Less
Accumulated
depreciation
Net depreciable
capital assets
Accumulated
depreciation
as a percent
of total
Governmental
2017 1,640,033,012$ (875,632,813)$ 764,400,199$ 53%2016 1,593,203,922 (833,231,751) 759,972,171 52%2015 1,489,865,377 (793,436,125) 696,429,252 53%
2014 1,452,096,655 (752,927,491) 699,169,164 52%2013 1,411,067,951 (715,417,172) 695,650,779 51%2012 1,386,454,990 (677,362,499) 709,092,491 49%
Business-type
2017 2,008,724,137$ (870,291,027)$ 1,138,433,110$ 43%
2016 1,899,149,892 (817,010,887) 1,082,139,005 43%2015 1,673,358,479 (769,169,392) 904,189,087 46%2014 1,632,821,069 (712,989,192) 919,831,877 44%
2013 1,601,506,749 (674,959,354) 926,547,395 42%
2012 1,563,975,835 (636,376,833) 927,599,002 41%
Anne Arundel County, Maryland
Analysis of Depreciable Assets
This analysis shows that the percent of depreciated governmental capital assets has increased in the last year to 53.0% at fiscal year-end 2017. The business-type capital assets remained constant at 43.0% for the total depreciation as a percent of the asset values at fiscal year-end 2017.
The comparison of these fiscal years does not provide any definitive conclusion about the County’s replacement of aging assets; however, an upward trend in accumulated depreciation as a percent of gross assets over several years might indicate that the asset base is aging. Management will continue to monitor these trends. Additional information about the County’s capital assets and changes therein is provided in the Note 5 to the basic financial statements.
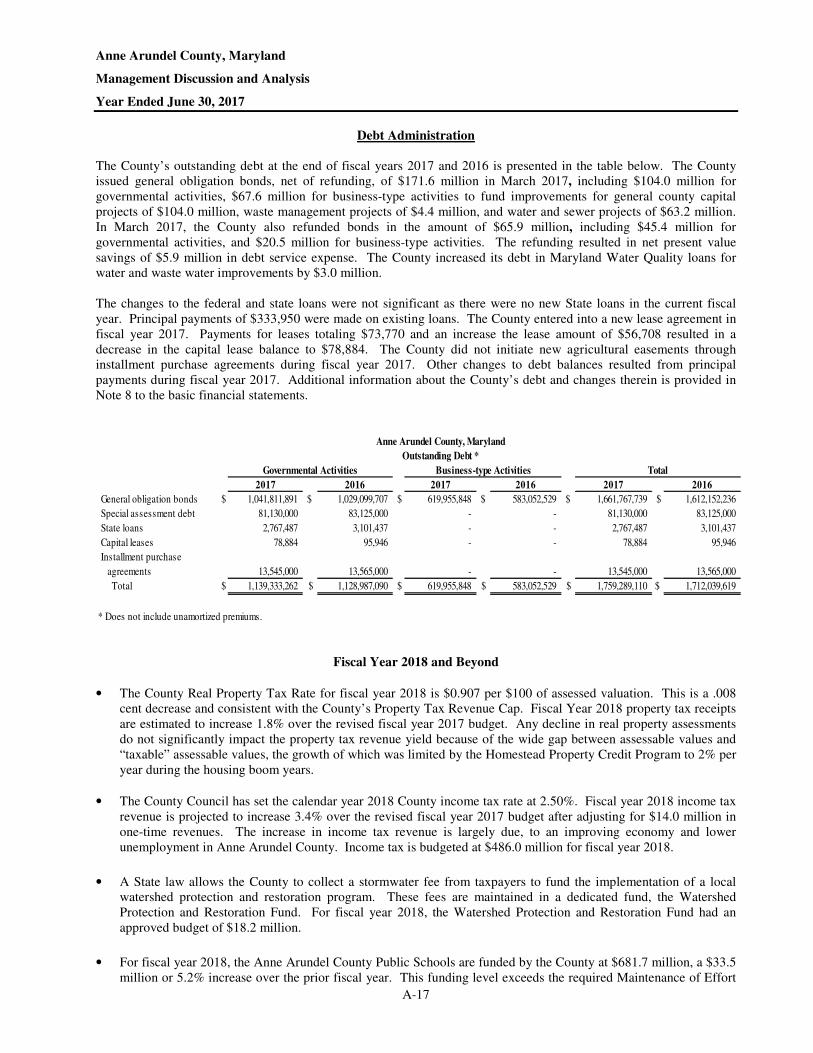
Anne Arundel County, Maryland Management Discussion and Analysis Year Ended June 30, 2017
A-17
Debt Administration
The County’s outstanding debt at the end of fiscal years 2017 and 2016 is presented in the table below. The County issued general obligation bonds, net of refunding, of $171.6 million in March 2017, including $104.0 million for governmental activities, $67.6 million for business-type activities to fund improvements for general county capital projects of $104.0 million, waste management projects of $4.4 million, and water and sewer projects of $63.2 million. In March 2017, the County also refunded bonds in the amount of $65.9 million, including $45.4 million for governmental activities, and $20.5 million for business-type activities. The refunding resulted in net present value savings of $5.9 million in debt service expense. The County increased its debt in Maryland Water Quality loans for water and waste water improvements by $3.0 million. The changes to the federal and state loans were not significant as there were no new State loans in the current fiscal year. Principal payments of $333,950 were made on existing loans. The County entered into a new lease agreement in fiscal year 2017. Payments for leases totaling $73,770 and an increase the lease amount of $56,708 resulted in a decrease in the capital lease balance to $78,884. The County did not initiate new agricultural easements through installment purchase agreements during fiscal year 2017. Other changes to debt balances resulted from principal payments during fiscal year 2017. Additional information about the County’s debt and changes therein is provided in Note 8 to the basic financial statements.
Anne Arundel County, Maryland
Outstanding Debt *
Governmental Activities Business-type Activities Total
2017 2016 2017 2016 2017 2016
General obligation bonds $ 1,041,811,891 $ 1,029,099,707 $ 619,955,848 $ 583,052,529 $ 1,661,767,739 $ 1,612,152,236
Special assessment debt 81,130,000 83,125,000 - - 81,130,000 83,125,000
State loans 2,767,487 3,101,437 - - 2,767,487 3,101,437
Capital leases 78,884 95,946 - - 78,884 95,946
Installment purchase
agreements 13,545,000 13,565,000 - - 13,545,000 13,565,000
Total $ 1,139,333,262 $ 1,128,987,090 $ 619,955,848 $ 583,052,529 $ 1,759,289,110 $ 1,712,039,619
* Does not include unamortized premiums.
Fiscal Year 2018 and Beyond
• The County Real Property Tax Rate for fiscal year 2018 is $0.907 per $100 of assessed valuation. This is a .008 cent decrease and consistent with the County’s Property Tax Revenue Cap. Fiscal Year 2018 property tax receipts are estimated to increase 1.8% over the revised fiscal year 2017 budget. Any decline in real property assessments do not significantly impact the property tax revenue yield because of the wide gap between assessable values and “taxable” assessable values, the growth of which was limited by the Homestead Property Credit Program to 2% per year during the housing boom years.
• The County Council has set the calendar year 2018 County income tax rate at 2.50%. Fiscal year 2018 income tax revenue is projected to increase 3.4% over the revised fiscal year 2017 budget after adjusting for $14.0 million in one-time revenues. The increase in income tax revenue is largely due, to an improving economy and lower unemployment in Anne Arundel County. Income tax is budgeted at $486.0 million for fiscal year 2018.
• A State law allows the County to collect a stormwater fee from taxpayers to fund the implementation of a local
watershed protection and restoration program. These fees are maintained in a dedicated fund, the Watershed Protection and Restoration Fund. For fiscal year 2018, the Watershed Protection and Restoration Fund had an approved budget of $18.2 million.
• For fiscal year 2018, the Anne Arundel County Public Schools are funded by the County at $681.7 million, a $33.5
million or 5.2% increase over the prior fiscal year. This funding level exceeds the required Maintenance of Effort
Anne Arundel County, Maryland Management Discussion and Analysis Year Ended June 30, 2017
A-18
for fiscal 2018. Anne Arundel County Public Schools fiscal year 2018 capital budget contains forty-eight planned projects totaling $185.7 million or 57% of the capital budget. Of the total General Fund debt service budget, 58.3% is allocated for school debt.
• The County’s support of the Anne Arundel Community College increased $1.6 million in fiscal year 2018 over fiscal year 2017 to a total of $42.0 million, $40.3 million from General Fund and $1.7 million from Video Lottery Local Impact Aid Special Revenue Fund. The County has appropriated $14.9 million for Anne Arundel County Community College’s fiscal year 2018 capital projects, which will be financed by issuing general obligation bonds. The Community College’s annual debt service of $7.1 million is paid by the County.
These and other economic factors were considered when preparing the fiscal year 2018 General Fund budget, which estimates total revenues at $1.5 billion; an increase of $56.0 million or 4.0% over fiscal year 2017 original budgeted amounts. Mindful of the economic struggles the County has faced for the past several years as a result of national economic uncertainties, cuts in revenue funding streams and the status of the State of Maryland’s budget, the County will continue to carefully monitor expenditures and apply cost containment efforts. Expenditures for fiscal year 2018 will continue to be tightened and trimmed where possible with some strategic investments, particularly in technology. The County also anticipates issuing bonds during fiscal year 2018. There are no new taxes to fund the fiscal year 2018 budget. The income tax rate of 2.50% was effective January 1, 2016 and was a reduction from the 2.56% rate for the prior calendar year. It continues to be the third lowest in the State. The Homestead Tax Credit rate for County real property tax is at 2.0% which remains unchanged from the past fiscal year. Legislation was passed to provide three new exemptions to the admissions and amusement tax for Anne Arundel County. Effective November 13, 2017, there is an exemption to the admissions and amusement tax for the gross receipts derived from any admissions and amusement charge for agritourisism and if the principal use on the property is farming, the gross receipts derived from any admissions and amusement charge for a farm brewery; stables or riding clubs; or winery. Effective January 1, 2018, there are exemptions to the admissions and amusement tax for the gross receipts derived from any admissions and amusement charge for admission to any moving picture theater and for the use of athletic facilities. Additionally, as of January 1, 2018, the Mobile Home Space Tax has been repealed. The Water and Wastewater Fund meter usage rates for fiscal year 2018 are $2.70/1,000gal and $4.74/1,000gal, respectively. This is unchanged from the prior fiscal year. No changes were made to the annual refuse and recycling fees or the water and sewer ad valorem.
Requests for Information
This financial report is designed to provide a general overview of the County’s finances for all those interested. Questions concerning any information provided in this report or requests for additional finance information should be addressed to the Office of Finance, 44 Calvert Street, Annapolis, Maryland 21401. Complete financial reports are also available on our website www.aacounty.org. The County’s component units issue their own separately audited financial statements. These statements may be obtained by directly contacting the component unit, contact information can be found on Note 1A of this report.

A-19
(This page left blank intentionally)
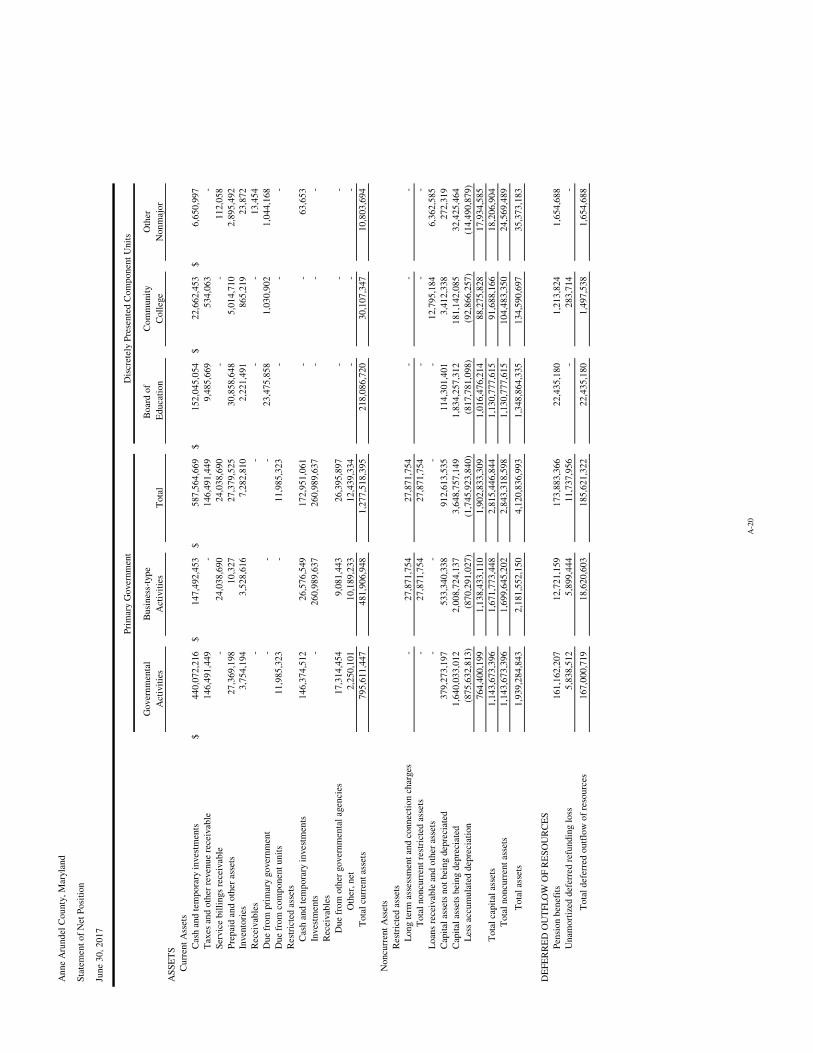
An
ne
Aru
nd
el C
ou
nty
, M
aryl
and
Sta
tem
ent
of
Net
Po
siti
on
Jun
e 3
0,
20
17
Pri
mar
y G
over
nm
ent
Dis
cret
ely
Pre
sen
ted
Co
mp
on
ent
Un
its
Go
ver
nm
enta
lB
usi
nes
s-ty
pe
Bo
ard
of
Co
mm
un
ity
Oth
er
Act
ivit
ies
Act
ivit
ies
To
tal
Ed
uca
tio
nC
oll
ege
No
nm
ajo
r
AS
SE
TS
Cu
rren
t A
sset
s
Cas
h a
nd
tem
po
rary
in
ves
tmen
ts$
44
0,0
72
,21
6
$
14
7,4
92
,45
3
$
58
7,5
64
,66
9
$1
52
,04
5,0
54
$2
2,6
62
,45
3
$6
,65
0,9
97
Tax
es a
nd
oth
er r
even
ue
rece
ivab
le1
46
,49
1,4
49
-
14
6,4
91
,44
9
9,4
85
,66
9
5
34
,06
3
-
Ser
vic
e b
illi
ngs
rece
ivab
le-
24
,03
8,6
90
2
4,0
38
,69
0
-
-
11
2,0
58
Pre
pai
d a
nd
oth
er a
sset
s2
7,3
69
,19
8
10
,32
7
2
7,3
79
,52
5
3
0,8
58
,64
8
5,0
14
,71
0
2,8
95
,49
2
Inven
tori
es3
,75
4,1
94
3,5
28
,61
6
7
,28
2,8
10
2
,22
1,4
91
86
5,2
19
2
3,8
72
Rec
eivab
les
-
-
-
-
13
,45
4
Du
e fr
om
pri
mar
y go
ver
nm
ent
-
-
-
23
,47
5,8
58
1
,03
0,9
02
1,0
44
,16
8
Du
e fr
om
co
mp
on
ent
un
its
11
,98
5,3
23
-
1
1,9
85
,32
3
-
-
-
Res
tric
ted
ass
ets
Cas
h a
nd
tem
po
rary
in
ves
tmen
ts1
46
,37
4,5
12
26
,57
6,5
49
1
72
,95
1,0
61
-
-
63
,65
3
Inves
tmen
ts-
26
0,9
89
,63
7
2
60
,98
9,6
37
-
-
-
Rec
eivab
les
Du
e fr
om
oth
er g
over
nm
enta
l ag
enci
es1
7,3
14
,45
4
9,0
81
,44
3
2
6,3
95
,89
7
-
-
-
Oth
er,
net
2,2
50
,10
1
1
0,1
89
,23
3
12
,43
9,3
34
-
-
-
To
tal
curr
ent
asse
ts7
95
,61
1,4
47
48
1,9
06
,94
8
1
,27
7,5
18
,39
5
21
8,0
86
,72
0
3
0,1
07
,34
7
10
,80
3,6
94
No
ncu
rren
t A
sset
s
Res
tric
ted
ass
ets
Lo
ng t
erm
ass
essm
ent
and
co
nn
ecti
on
ch
arges
-
2
7,8
71
,75
4
27
,87
1,7
54
-
-
-
To
tal
no
ncu
rren
t re
stri
cted
ass
ets
-
2
7,8
71
,75
4
27
,87
1,7
54
-
-
-
Lo
ans
rece
ivab
le a
nd
oth
er a
sset
s-
-
-
-
1
2,7
95
,18
4
6,3
62
,58
5
Cap
ital
ass
ets
no
t b
ein
g d
epre
ciat
ed3
79
,27
3,1
97
53
3,3
40
,33
8
9
12
,61
3,5
35
1
14
,30
1,4
01
3,4
12
,33
8
27
2,3
19
Cap
ital
ass
ets
bei
ng d
epre
ciat
ed1
,64
0,0
33
,01
2
2,0
08
,72
4,1
37
3,6
48
,75
7,1
49
1
,83
4,2
57
,31
2
18
1,1
42
,08
5
32
,42
5,4
64
Les
s ac
cum
ula
ted
dep
reci
atio
n(8
75
,63
2,8
13
)
(8
70
,29
1,0
27
)
(1,7
45
,92
3,8
40
)
(81
7,7
81
,09
8)
(92
,86
6,2
57
)
(14
,49
0,8
79
)
76
4,4
00
,19
9
1
,13
8,4
33
,11
0
1
,90
2,8
33
,30
9
1,0
16
,47
6,2
14
8
8,2
75
,82
8
17
,93
4,5
85
To
tal
cap
ital
ass
ets
1,1
43
,67
3,3
96
1
,67
1,7
73
,44
8
2
,81
5,4
46
,84
4
1,1
30
,77
7,6
15
9
1,6
88
,16
6
18
,20
6,9
04
To
tal
no
ncu
rren
t as
sets
1,1
43
,67
3,3
96
1
,69
9,6
45
,20
2
2
,84
3,3
18
,59
8
1,1
30
,77
7,6
15
1
04
,48
3,3
50
24
,56
9,4
89
To
tal
asse
ts1
,93
9,2
84
,84
3
2,1
81
,55
2,1
50
4,1
20
,83
6,9
93
1
,34
8,8
64
,33
5
13
4,5
90
,69
7
35
,37
3,1
83
DE
FE
RR
ED
OU
TF
LO
W O
F R
ES
OU
RC
ES
Pen
sio
n b
enef
its
16
1,1
62
,20
7
1
2,7
21
,15
9
17
3,8
83
,36
6
22
,43
5,1
80
1
,21
3,8
24
1,6
54
,68
8
Un
amo
rtiz
ed d
efer
red
ref
un
din
g l
oss
5,8
38
,51
2
5
,89
9,4
44
11
,73
7,9
56
-
2
83
,71
4
-
To
tal
def
erre
d o
utf
low
of
reso
urc
es1
67
,00
0,7
19
18
,62
0,6
03
1
85
,62
1,3
22
2
2,4
35
,18
0
1,4
97
,53
8
1,6
54
,68
8
A-2
0
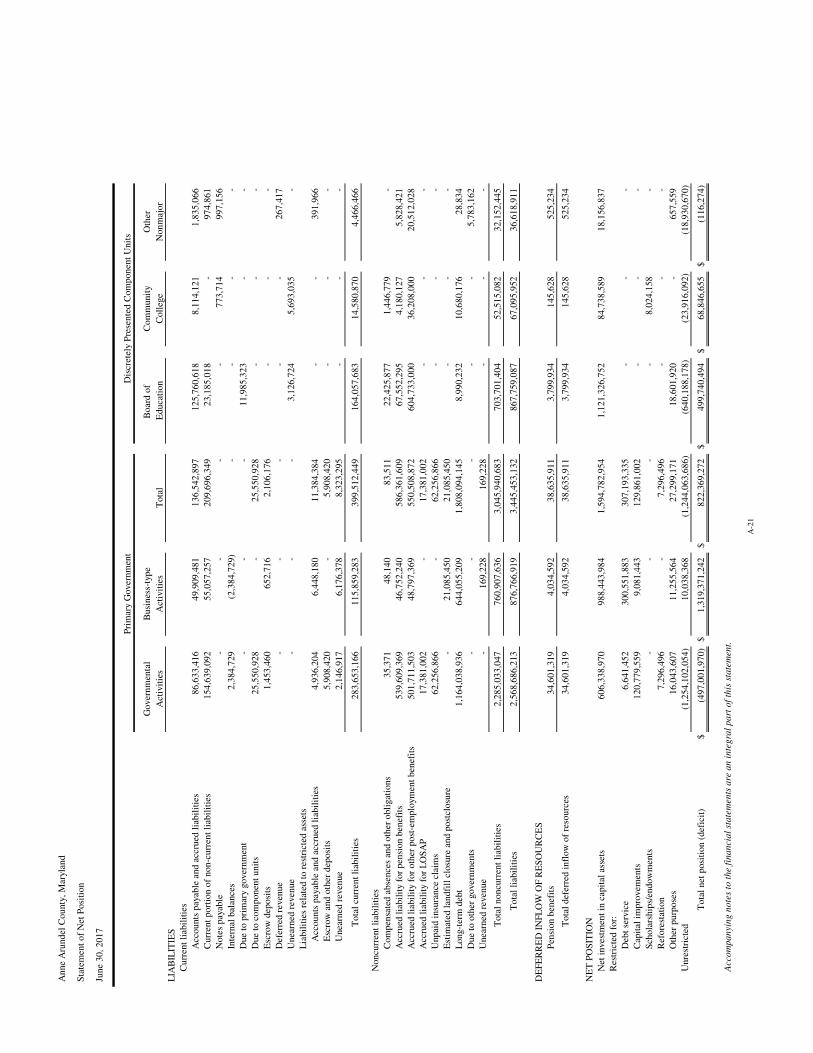
An
ne
Aru
nd
el C
ou
nty
, M
aryl
and
Sta
tem
ent
of
Net
Po
siti
on
Jun
e 3
0,
20
17
Pri
mar
y G
over
nm
ent
Dis
cret
ely
Pre
sen
ted
Co
mp
on
ent
Un
its
Go
ver
nm
enta
lB
usi
nes
s-ty
pe
Bo
ard
of
Co
mm
un
ity
Oth
er
Act
ivit
ies
Act
ivit
ies
To
tal
Ed
uca
tio
nC
oll
ege
No
nm
ajo
r
LIA
BIL
ITIE
S
Cu
rren
t li
abil
itie
s
Acc
ou
nts
pay
able
an
d a
ccru
ed l
iab
ilit
ies
86
,63
3,4
16
4
9,9
09
,48
1
13
6,5
42
,89
7
12
5,7
60
,61
8
8
,11
4,1
21
1,8
35
,06
6
Cu
rren
t p
ort
ion
of
no
n-c
urr
ent
liab
ilit
ies
15
4,6
39
,09
2
5
5,0
57
,25
7
20
9,6
96
,34
9
23
,18
5,0
18
-
97
4,8
61
No
tes
pay
able
-
-
-
-
7
73
,71
4
9
97
,15
6
Inte
rnal
bal
ance
s2
,38
4,7
29
(2,3
84
,72
9)
-
-
-
-
Du
e to
pri
mar
y go
ver
nm
ent
-
-
-
11
,98
5,3
23
-
-
Du
e to
co
mp
on
ent
un
its
25
,55
0,9
28
-
2
5,5
50
,92
8
-
-
-
Esc
row
dep
osi
ts1
,45
3,4
60
65
2,7
16
2
,10
6,1
76
-
-
-
Def
erre
d r
even
ue
-
-
-
-
-
26
7,4
17
Un
earn
ed r
even
ue
-
-
-
3,1
26
,72
4
5
,69
3,0
35
-
Lia
bil
itie
s re
late
d t
o r
estr
icte
d a
sset
s
Acc
ou
nts
pay
able
an
d a
ccru
ed l
iab
ilit
ies
4,9
36
,20
4
6
,44
8,1
80
11
,38
4,3
84
-
-
39
1,9
66
Esc
row
an
d o
ther
dep
osi
ts5
,90
8,4
20
-
5,9
08
,42
0
-
-
-
Un
earn
ed r
even
ue
2,1
46
,91
7
6
,17
6,3
78
8,3
23
,29
5
-
-
-
To
tal
curr
ent
liab
ilit
ies
28
3,6
53
,16
6
1
15
,85
9,2
83
39
9,5
12
,44
9
16
4,0
57
,68
3
1
4,5
80
,87
0
4,4
66
,46
6
No
ncu
rren
t li
abil
itie
s
Co
mp
ensa
ted
ab
sen
ces
and
oth
er o
bli
gat
ion
s3
5,3
71
4
8,1
40
83
,51
1
22
,42
5,8
77
1
,44
6,7
79
-
Acc
rued
lia
bil
ity
for
pen
sio
n b
enef
its
53
9,6
09
,36
9
4
6,7
52
,24
0
58
6,3
61
,60
9
67
,55
2,2
95
4
,18
0,1
27
5,8
28
,42
1
Acc
rued
lia
bil
ity
for
oth
er p
ost
-em
plo
ymen
t b
enef
its
50
1,7
11
,50
3
4
8,7
97
,36
9
55
0,5
08
,87
2
60
4,7
33
,00
0
3
6,2
08
,00
0
20
,51
2,0
28
Acc
rued
lia
bil
ity
for
LO
SA
P1
7,3
81
,00
2
-
17
,38
1,0
02
-
-
-
Un
pai
d i
nsu
ran
ce c
laim
s6
2,2
56
,86
6
-
62
,25
6,8
66
-
-
-
Est
imat
ed l
and
fill
clo
sure
an
d p
ost
clo
sure
-
2
1,0
85
,45
0
21
,08
5,4
50
-
-
-
Lo
ng-t
erm
deb
t1
,16
4,0
38
,93
6
64
4,0
55
,20
9
1
,80
8,0
94
,14
5
8,9
90
,23
2
1
0,6
80
,17
6
28
,83
4
Du
e to
oth
er g
over
nm
ents
-
-
-
-
-
5,7
83
,16
2
Un
earn
ed r
even
ue
-
1
69
,22
8
16
9,2
28
-
-
-
To
tal
no
ncu
rren
t li
abil
itie
s2
,28
5,0
33
,04
7
76
0,9
07
,63
6
3
,04
5,9
40
,68
3
70
3,7
01
,40
4
5
2,5
15
,08
2
32
,15
2,4
45
To
tal
liab
ilit
ies
2,5
68
,68
6,2
13
8
76
,76
6,9
19
3,4
45
,45
3,1
32
8
67
,75
9,0
87
67
,09
5,9
52
36
,61
8,9
11
DE
FE
RR
ED
IN
FL
OW
OF
RE
SO
UR
CE
S
Pen
sio
n b
enef
its
34
,60
1,3
19
4
,03
4,5
92
38
,63
5,9
11
3,7
99
,93
4
1
45
,62
8
5
25
,23
4
To
tal
def
erre
d i
nfl
ow
of
reso
urc
es3
4,6
01
,31
9
4,0
34
,59
2
3
8,6
35
,91
1
3
,79
9,9
34
14
5,6
28
5
25
,23
4
NE
T P
OS
ITIO
N
Net
in
ves
tmen
t in
cap
ital
ass
ets
60
6,3
38
,97
0
9
88
,44
3,9
84
1,5
94
,78
2,9
54
1
,12
1,3
26
,75
2
84
,73
8,5
89
18
,15
6,8
37
Res
tric
ted
fo
r:
Deb
t se
rvic
e6
,64
1,4
52
30
0,5
51
,88
3
3
07
,19
3,3
35
-
-
-
Cap
ital
im
pro
vem
ents
1
20
,77
9,5
59
9,0
81
,44
3
1
29
,86
1,0
02
-
-
-
Sch
ola
rsh
ips/
end
ow
men
ts-
-
-
-
8
,02
4,1
58
-
Ref
ore
stat
ion
7,2
96
,49
6
-
7
,29
6,4
96
-
-
-
Oth
er p
urp
ose
s1
6,0
43
,60
7
11
,25
5,5
64
2
7,2
99
,17
1
1
8,6
01
,92
0
-
65
7,5
59
Un
rest
rict
ed(1
,25
4,1
02
,05
4)
10
,03
8,3
68
(1
,24
4,0
63
,68
6)
(6
40
,18
8,1
78
)
(2
3,9
16
,09
2)
(18
,93
0,6
70
)
To
tal
net
po
siti
on
(d
efic
it)
$
(49
7,0
01
,97
0)
$1
,31
9,3
71
,24
2
$
82
2,3
69
,27
2
$4
99
,74
0,4
94
$6
8,8
46
,65
5
$(1
16
,27
4)
Acco
mp
an
yin
g n
ote
s to
th
e f
ina
ncia
l st
ate
men
ts a
re a
n i
nte
gra
l p
art
of
this
sta
tem
en
t.
A-2
1
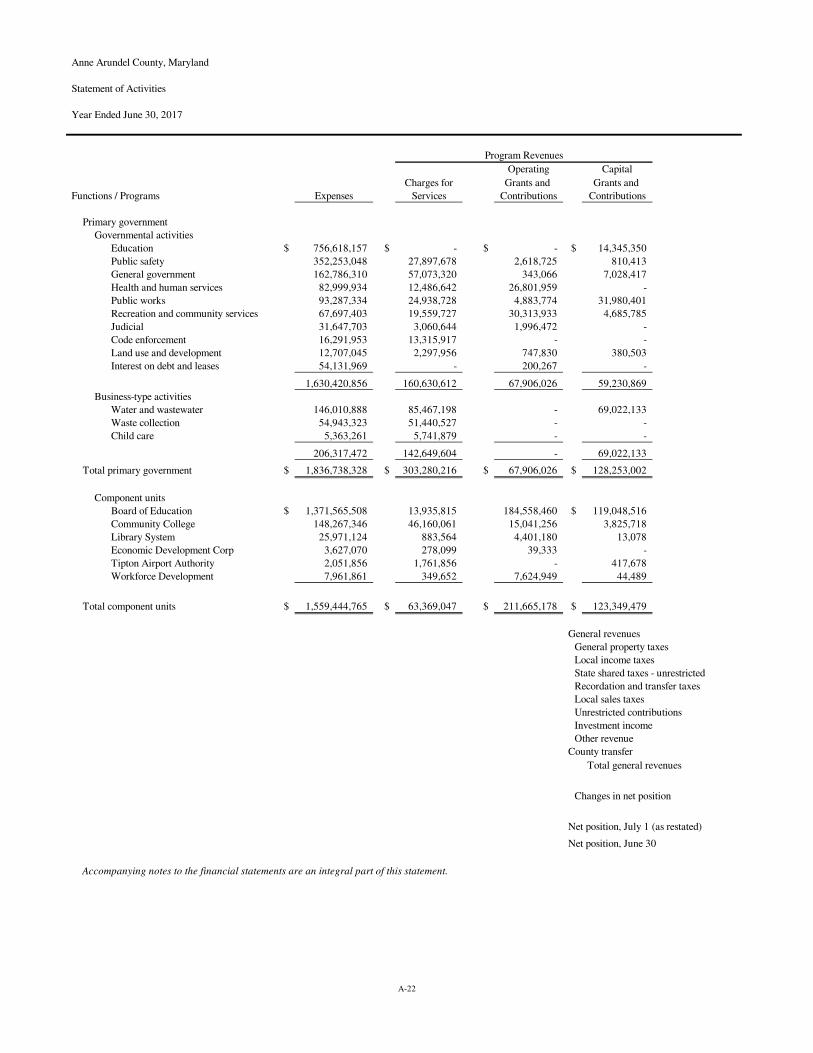
Anne Arundel County, Maryland
Statement of Activities
Year Ended June 30, 2017
Operating Capital
Charges for Grants and Grants and
Functions / Programs Expenses Services Contributions Contributions
Primary government
Governmental activities
Education $ 756,618,157 $ - $ - $ 14,345,350
Public safety 352,253,048 27,897,678 2,618,725 810,413
General government 162,786,310 57,073,320 343,066 7,028,417
Health and human services 82,999,934 12,486,642 26,801,959 -
Public works 93,287,334 24,938,728 4,883,774 31,980,401
Recreation and community services 67,697,403 19,559,727 30,313,933 4,685,785
Judicial 31,647,703 3,060,644 1,996,472 -
Code enforcement 16,291,953 13,315,917 - -
Land use and development 12,707,045 2,297,956 747,830 380,503
Interest on debt and leases 54,131,969 - 200,267 -
1,630,420,856 160,630,612 67,906,026 59,230,869
Business-type activities
Water and wastewater 146,010,888 85,467,198 - 69,022,133
Waste collection 54,943,323 51,440,527 - -
Child care 5,363,261 5,741,879 - -
206,317,472 142,649,604 - 69,022,133
Total primary government $ 1,836,738,328 $ 303,280,216 $ 67,906,026 $ 128,253,002
Component units
Board of Education $ 1,371,565,508 13,935,815 184,558,460 $ 119,048,516
Community College 148,267,346 46,160,061 15,041,256 3,825,718
Library System 25,971,124 883,564 4,401,180 13,078
Economic Development Corp 3,627,070 278,099 39,333 -
Tipton Airport Authority 2,051,856 1,761,856 - 417,678
Workforce Development 7,961,861 349,652 7,624,949 44,489
Total component units $ 1,559,444,765 $ 63,369,047 $ 211,665,178 $ 123,349,479
General revenues
General property taxes
Local income taxes
State shared taxes - unrestricted
Recordation and transfer taxes
Local sales taxes
Unrestricted contributions
Investment income
Other revenue
County transfer
Total general revenues
Changes in net position
Net position, July 1 (as restated)
Net position, June 30
Accompanying notes to the financial statements are an integral part of this statement.
Program Revenues
A-22
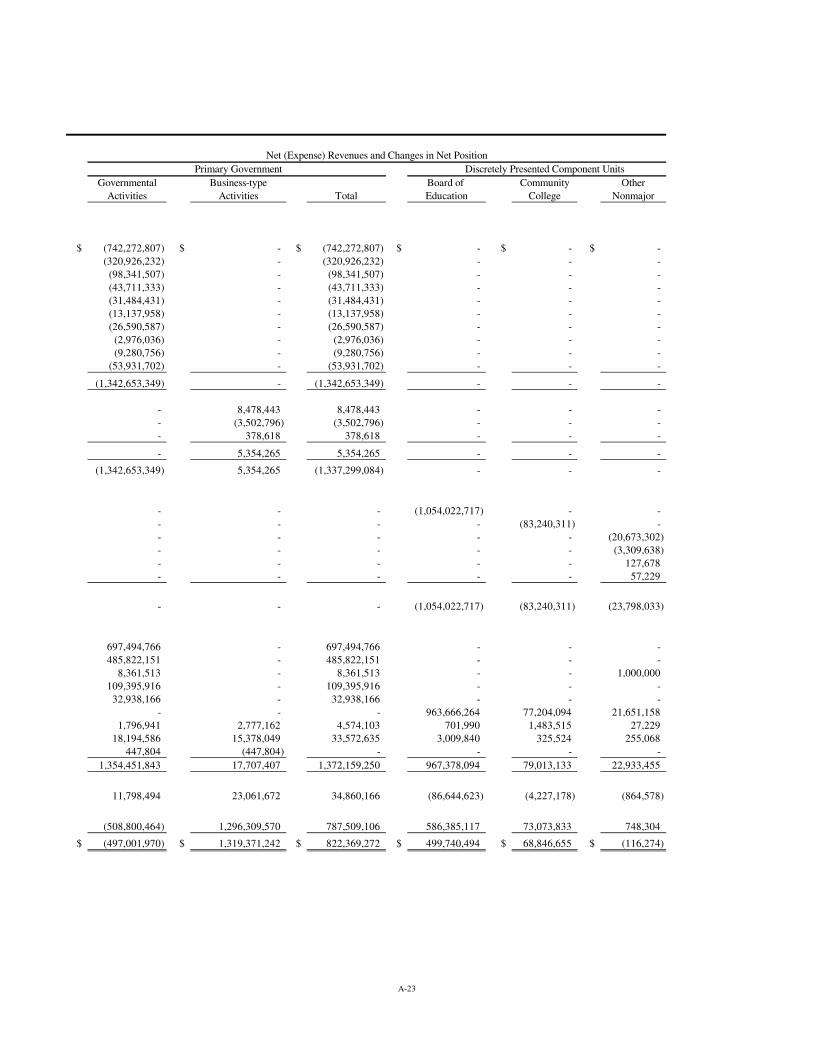
Primary Government Discretely Presented Component Units
Governmental Business-type Board of Community Other
Activities Activities Total Education College Nonmajor
$ (742,272,807) $ - $ (742,272,807) $ - $ - $ -
(320,926,232) - (320,926,232) - - -
(98,341,507) - (98,341,507) - - -
(43,711,333) - (43,711,333) - - -
(31,484,431) - (31,484,431) - - -
(13,137,958) - (13,137,958) - - -
(26,590,587) - (26,590,587) - - -
(2,976,036) - (2,976,036) - - -
(9,280,756) - (9,280,756) - - -
(53,931,702) - (53,931,702) - - -
(1,342,653,349) - (1,342,653,349) - - -
- 8,478,443 8,478,443 - - -
- (3,502,796) (3,502,796) - - -
- 378,618 378,618 - - -
- 5,354,265 5,354,265 - - -
(1,342,653,349) 5,354,265 (1,337,299,084) - - -
- - - (1,054,022,717) - -
- - - - (83,240,311) -
- - - - - (20,673,302)
- - - - - (3,309,638)
- - - - - 127,678
- - - - - 57,229
- - - (1,054,022,717) (83,240,311) (23,798,033)
697,494,766 - 697,494,766 - - -
485,822,151 - 485,822,151 - - -
8,361,513 - 8,361,513 - - 1,000,000
109,395,916 - 109,395,916 - - -
32,938,166 - 32,938,166 - - -
- - - 963,666,264 77,204,094 21,651,158
1,796,941 2,777,162 4,574,103 701,990 1,483,515 27,229
18,194,586 15,378,049 33,572,635 3,009,840 325,524 255,068
447,804 (447,804) - - - -
1,354,451,843 17,707,407 1,372,159,250 967,378,094 79,013,133 22,933,455
11,798,494 23,061,672 34,860,166 (86,644,623) (4,227,178) (864,578)
(508,800,464) 1,296,309,570 787,509,106 586,385,117 73,073,833 748,304
$ (497,001,970) $ 1,319,371,242 $ 822,369,272 $ 499,740,494 $ 68,846,655 $ (116,274)
Net (Expense) Revenues and Changes in Net Position
A-23
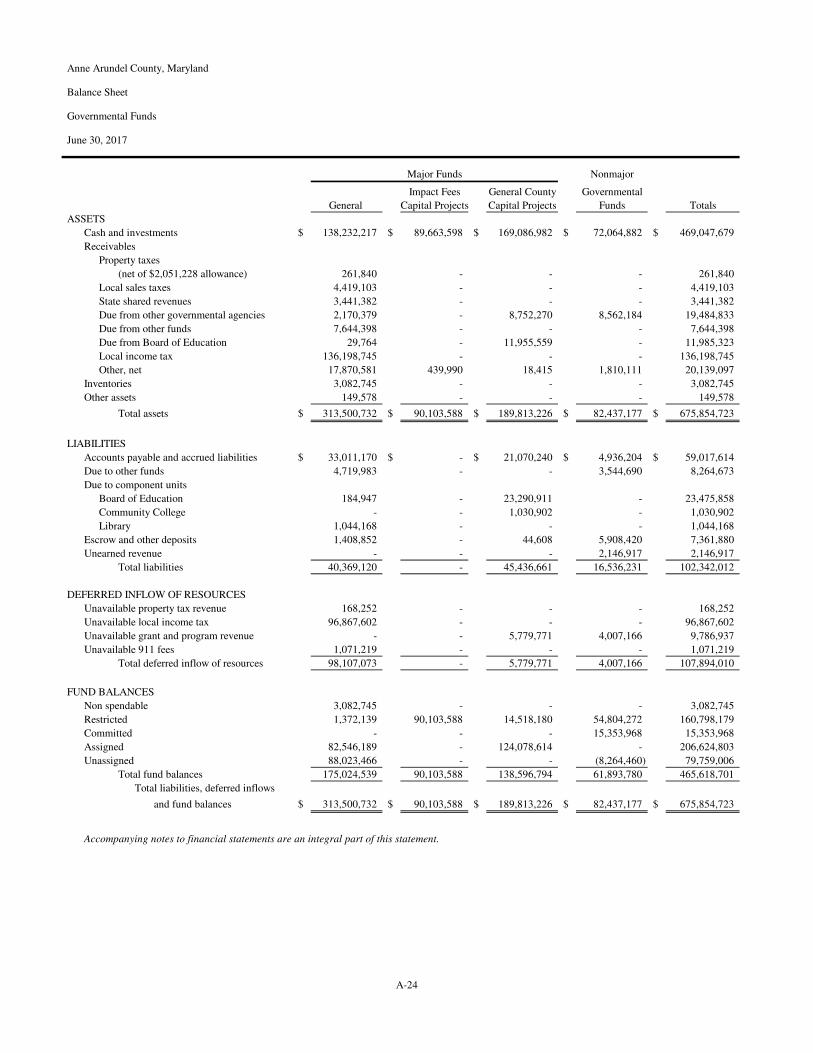
Anne Arundel County, Maryland
Balance Sheet
Governmental Funds
June 30, 2017
Major Funds Nonmajor
Impact Fees General County Governmental
General Capital Projects Capital Projects Funds Totals
ASSETS
Cash and investments $ 138,232,217 $ 89,663,598 $ 169,086,982 $ 72,064,882 $ 469,047,679
Receivables
Property taxes
(net of $2,051,228 allowance) 261,840 - - - 261,840
Local sales taxes 4,419,103 - - - 4,419,103
State shared revenues 3,441,382 - - - 3,441,382
Due from other governmental agencies 2,170,379 - 8,752,270 8,562,184 19,484,833
Due from other funds 7,644,398 - - - 7,644,398
Due from Board of Education 29,764 - 11,955,559 - 11,985,323
Local income tax 136,198,745 - - - 136,198,745
Other, net 17,870,581 439,990 18,415 1,810,111 20,139,097
Inventories 3,082,745 - - - 3,082,745
Other assets 149,578 - - - 149,578
Total assets $ 313,500,732 $ 90,103,588 $ 189,813,226 $ 82,437,177 $ 675,854,723
LIABILITIES
Accounts payable and accrued liabilities $ 33,011,170 $ - $ 21,070,240 $ 4,936,204 $ 59,017,614
Due to other funds 4,719,983 - - 3,544,690 8,264,673
Due to component units
Board of Education 184,947 - 23,290,911 - 23,475,858
Community College - - 1,030,902 - 1,030,902
Library 1,044,168 - - - 1,044,168
Escrow and other deposits 1,408,852 - 44,608 5,908,420 7,361,880
Unearned revenue - - - 2,146,917 2,146,917
Total liabilities 40,369,120 - 45,436,661 16,536,231 102,342,012
DEFERRED INFLOW OF RESOURCES
Unavailable property tax revenue 168,252 - - - 168,252
Unavailable local income tax 96,867,602 - - - 96,867,602
Unavailable grant and program revenue - - 5,779,771 4,007,166 9,786,937
Unavailable 911 fees 1,071,219 - - - 1,071,219
Total deferred inflow of resources 98,107,073 - 5,779,771 4,007,166 107,894,010
FUND BALANCES
Non spendable 3,082,745 - - - 3,082,745
Restricted 1,372,139 90,103,588 14,518,180 54,804,272 160,798,179
Committed - - - 15,353,968 15,353,968
Assigned 82,546,189 - 124,078,614 - 206,624,803
Unassigned 88,023,466 - - (8,264,460) 79,759,006
Total fund balances 175,024,539 90,103,588 138,596,794 61,893,780 465,618,701
Total liabilities, deferred inflows
and fund balances $ 313,500,732 $ 90,103,588 $ 189,813,226 $ 82,437,177 $ 675,854,723
Accompanying notes to financial statements are an integral part of this statement.
A-24
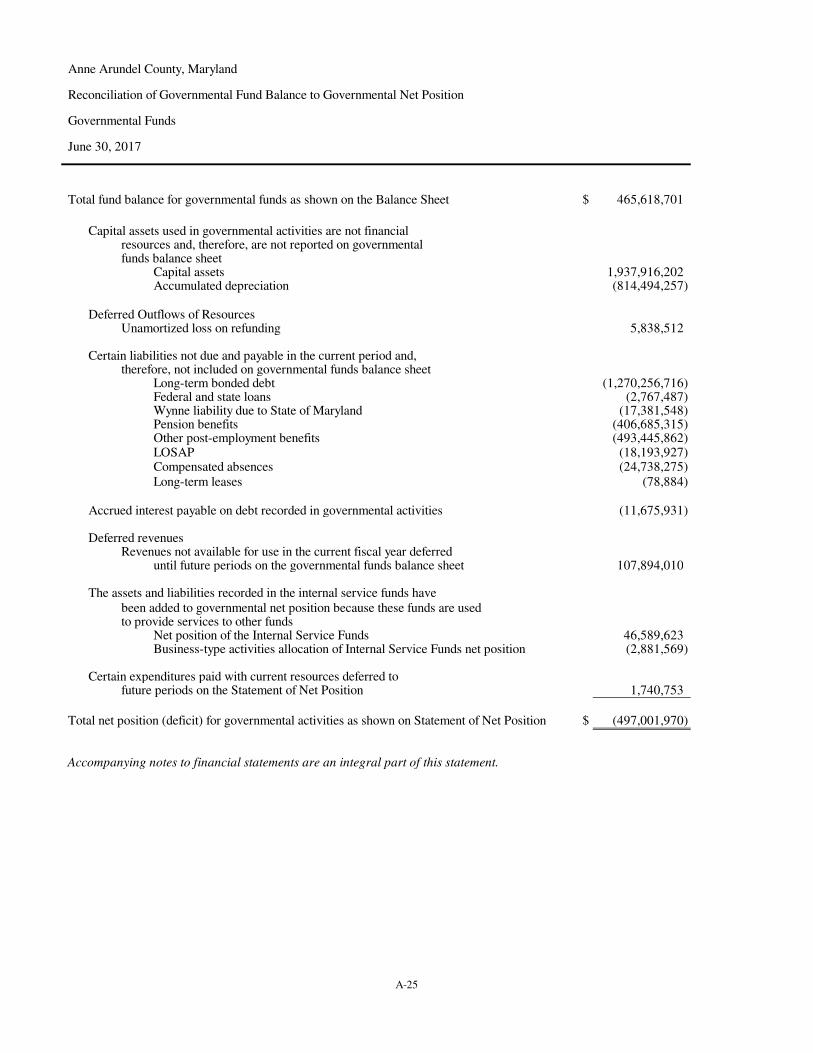
Anne Arundel County, Maryland
Reconciliation of Governmental Fund Balance to Governmental Net Position
Governmental Funds
June 30, 2017
Total fund balance for governmental funds as shown on the Balance Sheet $ 465,618,701
Capital assets used in governmental activities are not financial resources and, therefore, are not reported on governmental funds balance sheet
Capital assets 1,937,916,202 Accumulated depreciation (814,494,257)
Deferred Outflows of ResourcesUnamortized loss on refunding 5,838,512
Certain liabilities not due and payable in the current period and, therefore, not included on governmental funds balance sheet
Long-term bonded debt (1,270,256,716) Federal and state loans (2,767,487) Wynne liability due to State of Maryland (17,381,548) Pension benefits (406,685,315) Other post-employment benefits (493,445,862) LOSAP (18,193,927) Compensated absences (24,738,275) Long-term leases (78,884)
Accrued interest payable on debt recorded in governmental activities (11,675,931)
Deferred revenuesRevenues not available for use in the current fiscal year deferred
until future periods on the governmental funds balance sheet 107,894,010
The assets and liabilities recorded in the internal service funds have been added to governmental net position because these funds are used to provide services to other funds
Net position of the Internal Service Funds 46,589,623 Business-type activities allocation of Internal Service Funds net position (2,881,569)
Certain expenditures paid with current resources deferred to future periods on the Statement of Net Position 1,740,753
Total net position (deficit) for governmental activities as shown on Statement of Net Position $ (497,001,970)
Accompanying notes to financial statements are an integral part of this statement.
A-25
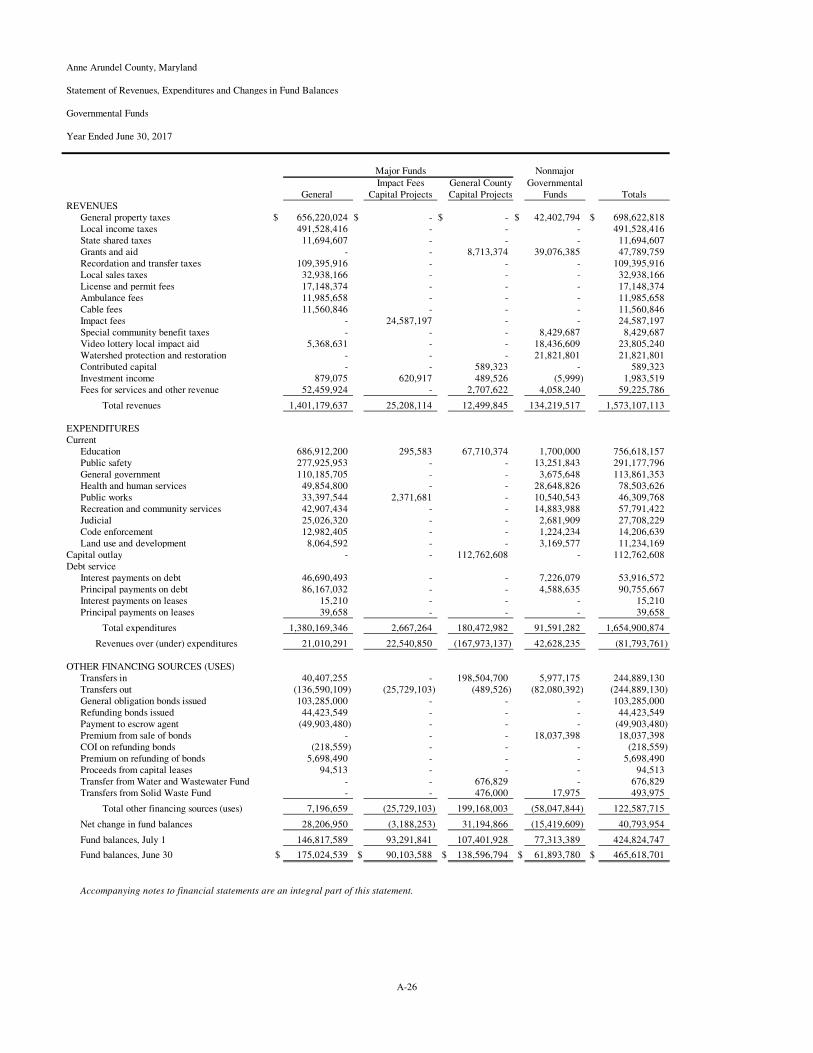
Anne Arundel County, Maryland
Statement of Revenues, Expenditures and Changes in Fund Balances
Governmental Funds
Year Ended June 30, 2017
Major Funds Nonmajor
Impact Fees General County GovernmentalGeneral Capital Projects Capital Projects Funds Totals
REVENUESGeneral property taxes $ 656,220,024 $ - $ - $ 42,402,794 $ 698,622,818 Local income taxes 491,528,416 - - - 491,528,416 State shared taxes 11,694,607 - - - 11,694,607 Grants and aid - - 8,713,374 39,076,385 47,789,759 Recordation and transfer taxes 109,395,916 - - - 109,395,916 Local sales taxes 32,938,166 - - - 32,938,166 License and permit fees 17,148,374 - - - 17,148,374 Ambulance fees 11,985,658 - - - 11,985,658 Cable fees 11,560,846 - - - 11,560,846 Impact fees - 24,587,197 - - 24,587,197 Special community benefit taxes - - - 8,429,687 8,429,687 Video lottery local impact aid 5,368,631 - - 18,436,609 23,805,240 Watershed protection and restoration - - - 21,821,801 21,821,801 Contributed capital - - 589,323 - 589,323 Investment income 879,075 620,917 489,526 (5,999) 1,983,519 Fees for services and other revenue 52,459,924 - 2,707,622 4,058,240 59,225,786
Total revenues 1,401,179,637 25,208,114 12,499,845 134,219,517 1,573,107,113
EXPENDITURESCurrent
Education 686,912,200 295,583 67,710,374 1,700,000 756,618,157 Public safety 277,925,953 - - 13,251,843 291,177,796 General government 110,185,705 - - 3,675,648 113,861,353 Health and human services 49,854,800 - - 28,648,826 78,503,626 Public works 33,397,544 2,371,681 - 10,540,543 46,309,768 Recreation and community services 42,907,434 - - 14,883,988 57,791,422 Judicial 25,026,320 - - 2,681,909 27,708,229 Code enforcement 12,982,405 - - 1,224,234 14,206,639 Land use and development 8,064,592 - - 3,169,577 11,234,169
Capital outlay - - 112,762,608 - 112,762,608 Debt service
Interest payments on debt 46,690,493 - - 7,226,079 53,916,572 Principal payments on debt 86,167,032 - - 4,588,635 90,755,667 Interest payments on leases 15,210 - - - 15,210 Principal payments on leases 39,658 - - - 39,658
Total expenditures 1,380,169,346 2,667,264 180,472,982 91,591,282 1,654,900,874
Revenues over (under) expenditures 21,010,291 22,540,850 (167,973,137) 42,628,235 (81,793,761)
OTHER FINANCING SOURCES (USES)Transfers in 40,407,255 - 198,504,700 5,977,175 244,889,130 Transfers out (136,590,109) (25,729,103) (489,526) (82,080,392) (244,889,130) General obligation bonds issued 103,285,000 - - - 103,285,000 Refunding bonds issued 44,423,549 - - - 44,423,549 Payment to escrow agent (49,903,480) - - - (49,903,480) Premium from sale of bonds - - - 18,037,398 18,037,398 COI on refunding bonds (218,559) - - - (218,559) Premium on refunding of bonds 5,698,490 - - - 5,698,490 Proceeds from capital leases 94,513 - - - 94,513 Transfer from Water and Wastewater Fund - - 676,829 - 676,829 Transfers from Solid Waste Fund - - 476,000 17,975 493,975
Total other financing sources (uses) 7,196,659 (25,729,103) 199,168,003 (58,047,844) 122,587,715
Net change in fund balances 28,206,950 (3,188,253) 31,194,866 (15,419,609) 40,793,954
Fund balances, July 1 146,817,589 93,291,841 107,401,928 77,313,389 424,824,747
Fund balances, June 30 $ 175,024,539 $ 90,103,588 $ 138,596,794 $ 61,893,780 $ 465,618,701
Accompanying notes to financial statements are an integral part of this statement.
A-26
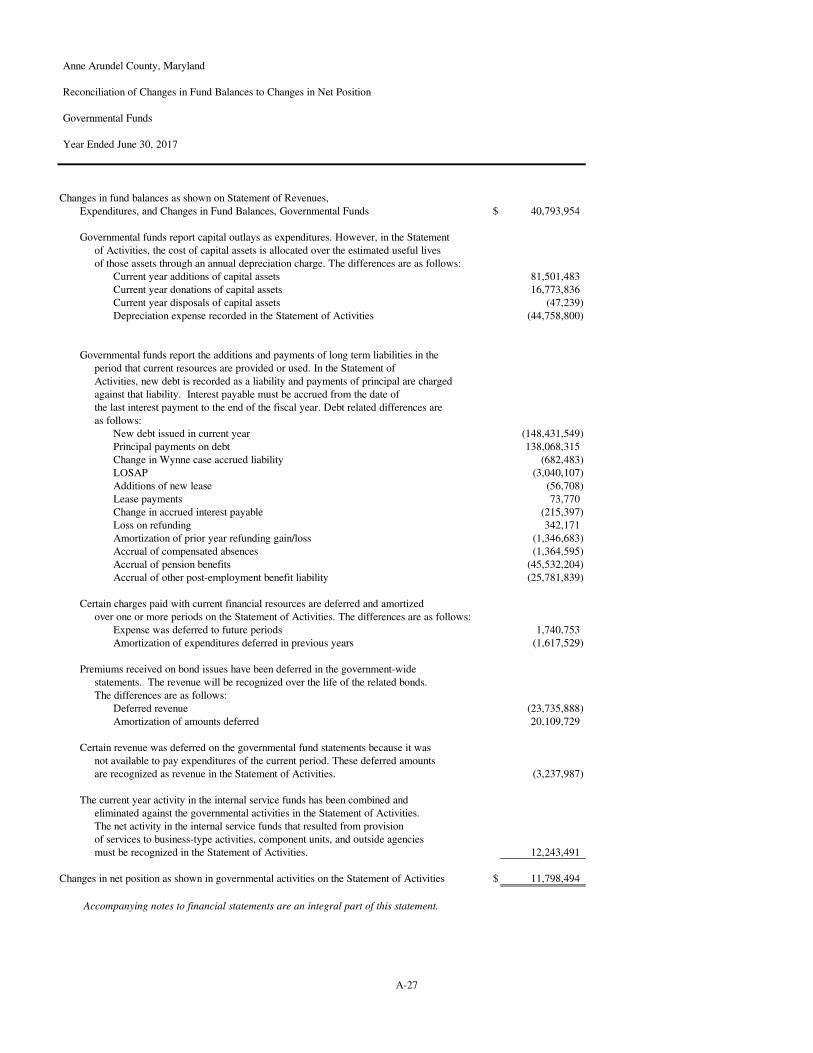
Anne Arundel County, Maryland
Reconciliation of Changes in Fund Balances to Changes in Net Position
Governmental Funds
Year Ended June 30, 2017
Changes in fund balances as shown on Statement of Revenues,
Expenditures, and Changes in Fund Balances, Governmental Funds $ 40,793,954
Governmental funds report capital outlays as expenditures. However, in the Statement
of Activities, the cost of capital assets is allocated over the estimated useful lives
of those assets through an annual depreciation charge. The differences are as follows:
Current year additions of capital assets 81,501,483
Current year donations of capital assets 16,773,836
Current year disposals of capital assets (47,239)
Depreciation expense recorded in the Statement of Activities (44,758,800)
Governmental funds report the additions and payments of long term liabilities in the
period that current resources are provided or used. In the Statement of
Activities, new debt is recorded as a liability and payments of principal are charged
against that liability. Interest payable must be accrued from the date of
the last interest payment to the end of the fiscal year. Debt related differences are
as follows:
New debt issued in current year (148,431,549)
Principal payments on debt 138,068,315
Change in Wynne case accrued liability (682,483)
LOSAP (3,040,107)
Additions of new lease (56,708)
Lease payments 73,770
Change in accrued interest payable (215,397)
Loss on refunding 342,171
Amortization of prior year refunding gain/loss (1,346,683)
Accrual of compensated absences (1,364,595)
Accrual of pension benefits (45,532,204)
Accrual of other post-employment benefit liability (25,781,839)
Certain charges paid with current financial resources are deferred and amortized
over one or more periods on the Statement of Activities. The differences are as follows:
Expense was unearned to future periodsExpense was deferred to future periods 1,740,753
Amortization of expenditures unearned in previous yearsAmortization of expenditures deferred in previous years (1,617,529)
Premiums received on bond issues have been deferred in the government-wide
statements. The revenue will be recognized over the life of the related bonds.
The differences are as follows:
Deferred revenue (23,735,888)
Amortization of amounts deferred 20,109,729
Certain revenue was deferred on the governmental fund statements because it was
not available to pay expenditures of the current period. These deferred amounts
are recognized as revenue in the Statement of Activities. (3,237,987)
The current year activity in the internal service funds has been combined and
eliminated against the governmental activities in the Statement of Activities.
The net activity in the internal service funds that resulted from provision
of services to business-type activities, component units, and outside agencies
must be recognized in the Statement of Activities. 12,243,491
Changes in net position as shown in governmental activities on the Statement of Activities $ 11,798,494
Accompanying notes to financial statements are an integral part of this statement.
A-27
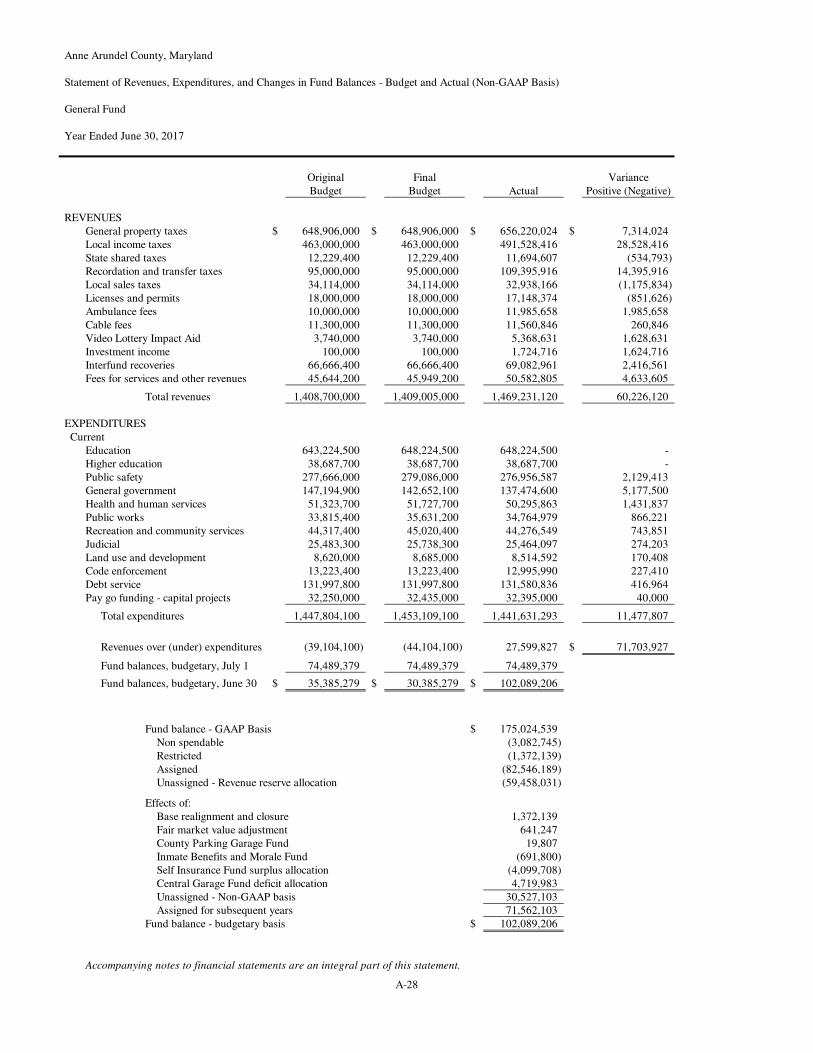
Anne Arundel County, Maryland
Statement of Revenues, Expenditures, and Changes in Fund Balances - Budget and Actual (Non-GAAP Basis)
General Fund
Year Ended June 30, 2017
Original Final Variance
Budget Budget Actual Positive (Negative)
REVENUES
General property taxes $ 648,906,000 $ 648,906,000 $ 656,220,024 $ 7,314,024
Local income taxes 463,000,000 463,000,000 491,528,416 28,528,416
State shared taxes 12,229,400 12,229,400 11,694,607 (534,793)
Recordation and transfer taxes 95,000,000 95,000,000 109,395,916 14,395,916
Local sales taxes 34,114,000 34,114,000 32,938,166 (1,175,834)
Licenses and permits 18,000,000 18,000,000 17,148,374 (851,626)
Ambulance fees 10,000,000 10,000,000 11,985,658 1,985,658
Cable fees 11,300,000 11,300,000 11,560,846 260,846
Video Lottery Impact Aid 3,740,000 3,740,000 5,368,631 1,628,631
Investment income 100,000 100,000 1,724,716 1,624,716
Interfund recoveries 66,666,400 66,666,400 69,082,961 2,416,561
Fees for services and other revenues 45,644,200 45,949,200 50,582,805 4,633,605
Total revenues 1,408,700,000 1,409,005,000 1,469,231,120 60,226,120
EXPENDITURES
Current
Education 643,224,500 648,224,500 648,224,500 -
Higher education 38,687,700 38,687,700 38,687,700 -
Public safety 277,666,000 279,086,000 276,956,587 2,129,413
General government 147,194,900 142,652,100 137,474,600 5,177,500
Health and human services 51,323,700 51,727,700 50,295,863 1,431,837
Public works 33,815,400 35,631,200 34,764,979 866,221
Recreation and community services 44,317,400 45,020,400 44,276,549 743,851
Judicial 25,483,300 25,738,300 25,464,097 274,203
Land use and development 8,620,000 8,685,000 8,514,592 170,408
Code enforcement 13,223,400 13,223,400 12,995,990 227,410
Debt service 131,997,800 131,997,800 131,580,836 416,964
Pay go funding - capital projects 32,250,000 32,435,000 32,395,000 40,000
Total expenditures 1,447,804,100 1,453,109,100 1,441,631,293 11,477,807
Revenues over (under) expenditures (39,104,100) (44,104,100) 27,599,827 $ 71,703,927
Fund balances, budgetary, July 1 74,489,379 74,489,379 74,489,379
Fund balances, budgetary, June 30 $ 35,385,279 $ 30,385,279 $ 102,089,206
Fund balance - GAAP Basis $ 175,024,539
Non spendable (3,082,745)
Restricted (1,372,139)
Assigned (82,546,189)
Unassigned - Revenue reserve allocation (59,458,031)
Effects of:
Base realignment and closure 1,372,139
Fair market value adjustment 641,247
County Parking Garage Fund 19,807
Inmate Benefits and Morale Fund (691,800)
Self Insurance Fund surplus allocation (4,099,708)
Central Garage Fund deficit allocation 4,719,983
Unassigned - Non-GAAP basis 30,527,103
Assigned for subsequent years 71,562,103
Fund balance - budgetary basis $ 102,089,206
Accompanying notes to financial statements are an integral part of this statement.
A-28
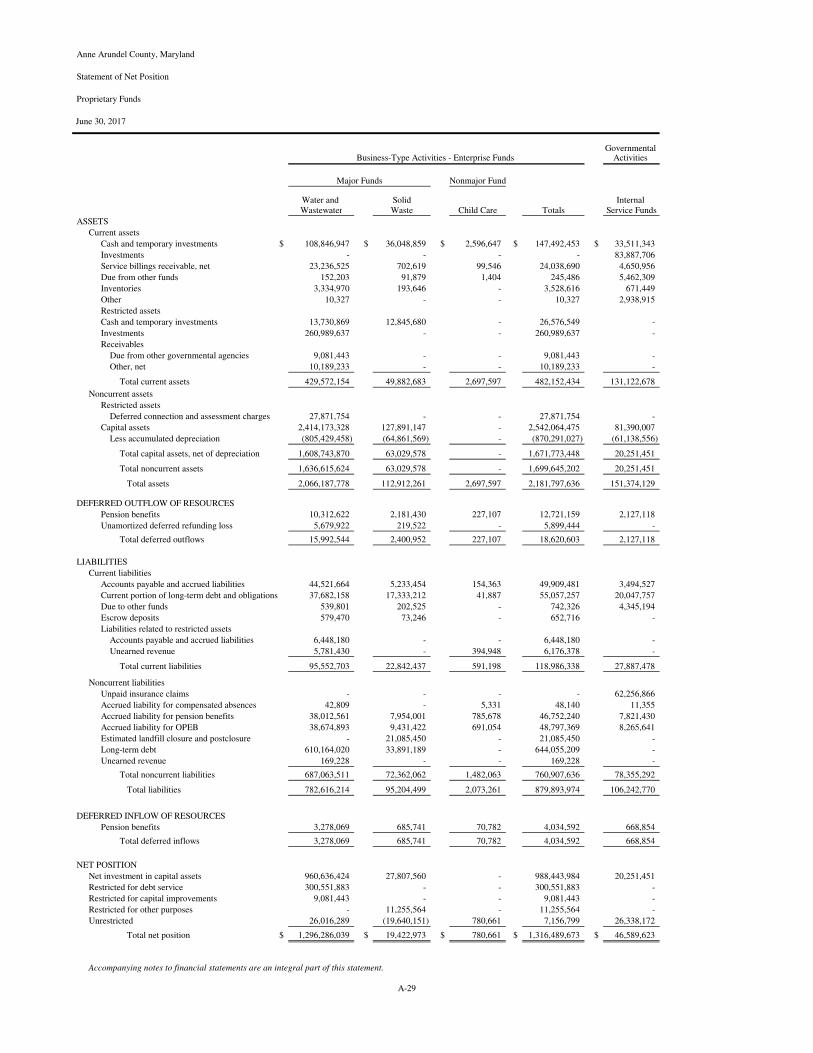
Anne Arundel County, Maryland
Statement of Net Position
Proprietary Funds
June 30, 2017
Governmental Activities
Nonmajor Fund
Water and Solid Internal Wastewater Waste Child Care Totals Service Funds
ASSETS
Current assets
Cash and temporary investments $ 108,846,947 $ 36,048,859 $ 2,596,647 $ 147,492,453 $ 33,511,343
Investments - - - - 83,887,706
Service billings receivable, net 23,236,525 702,619 99,546 24,038,690 4,650,956
Due from other funds 152,203 91,879 1,404 245,486 5,462,309
Inventories 3,334,970 193,646 - 3,528,616 671,449
Other 10,327 - - 10,327 2,938,915
Restricted assets
Cash and temporary investments 13,730,869 12,845,680 - 26,576,549 -
Investments 260,989,637 - - 260,989,637 -
Receivables
Due from other governmental agencies 9,081,443 - - 9,081,443 -
Other, net 10,189,233 - - 10,189,233 -
Total current assets 429,572,154 49,882,683 2,697,597 482,152,434 131,122,678
Noncurrent assets
Restricted assets
Deferred connection and assessment charges 27,871,754 - - 27,871,754 -
Capital assets 2,414,173,328 127,891,147 - 2,542,064,475 81,390,007
Less accumulated depreciation (805,429,458) (64,861,569) - (870,291,027) (61,138,556)
Total capital assets, net of depreciation 1,608,743,870 63,029,578 - 1,671,773,448 20,251,451
Total noncurrent assets 1,636,615,624 63,029,578 - 1,699,645,202 20,251,451
Total assets 2,066,187,778 112,912,261 2,697,597 2,181,797,636 151,374,129
DEFERRED OUTFLOW OF RESOURCES
Pension benefits 10,312,622 2,181,430 227,107 12,721,159 2,127,118
Unamortized deferred refunding loss 5,679,922 219,522 - 5,899,444 -
Total deferred outflows 15,992,544 2,400,952 227,107 18,620,603 2,127,118
LIABILITIES
Current liabilities
Accounts payable and accrued liabilities 44,521,664 5,233,454 154,363 49,909,481 3,494,527
Current portion of long-term debt and obligations 37,682,158 17,333,212 41,887 55,057,257 20,047,757
Due to other funds 539,801 202,525 - 742,326 4,345,194
Escrow deposits 579,470 73,246 - 652,716 -
Liabilities related to restricted assets
Accounts payable and accrued liabilities 6,448,180 - - 6,448,180 -
Unearned revenue 5,781,430 - 394,948 6,176,378 -
Total current liabilities 95,552,703 22,842,437 591,198 118,986,338 27,887,478
Noncurrent liabilities
Unpaid insurance claims - - - - 62,256,866
Accrued liability for compensated absences 42,809 - 5,331 48,140 11,355
Accrued liability for pension benefits 38,012,561 7,954,001 785,678 46,752,240 7,821,430
Accrued liability for OPEB 38,674,893 9,431,422 691,054 48,797,369 8,265,641
Estimated landfill closure and postclosure - 21,085,450 - 21,085,450 -
Long-term debt 610,164,020 33,891,189 - 644,055,209 -
Unearned revenue 169,228 - - 169,228 -
Total noncurrent liabilities 687,063,511 72,362,062 1,482,063 760,907,636 78,355,292
Total liabilities 782,616,214 95,204,499 2,073,261 879,893,974 106,242,770
DEFERRED INFLOW OF RESOURCES
Pension benefits 3,278,069 685,741 70,782 4,034,592 668,854
Total deferred inflows 3,278,069 685,741 70,782 4,034,592 668,854
NET POSITION
Net investment in capital assets 960,636,424 27,807,560 - 988,443,984 20,251,451
Restricted for debt service 300,551,883 - - 300,551,883 -
Restricted for capital improvements 9,081,443 - - 9,081,443 -
Restricted for other purposes - 11,255,564 - 11,255,564 -
Unrestricted 26,016,289 (19,640,151) 780,661 7,156,799 26,338,172
Total net position $ 1,296,286,039 $ 19,422,973 $ 780,661 $ 1,316,489,673 $ 46,589,623
Accompanying notes to financial statements are an integral part of this statement.
Business-Type Activities - Enterprise Funds
Major Funds
A-29
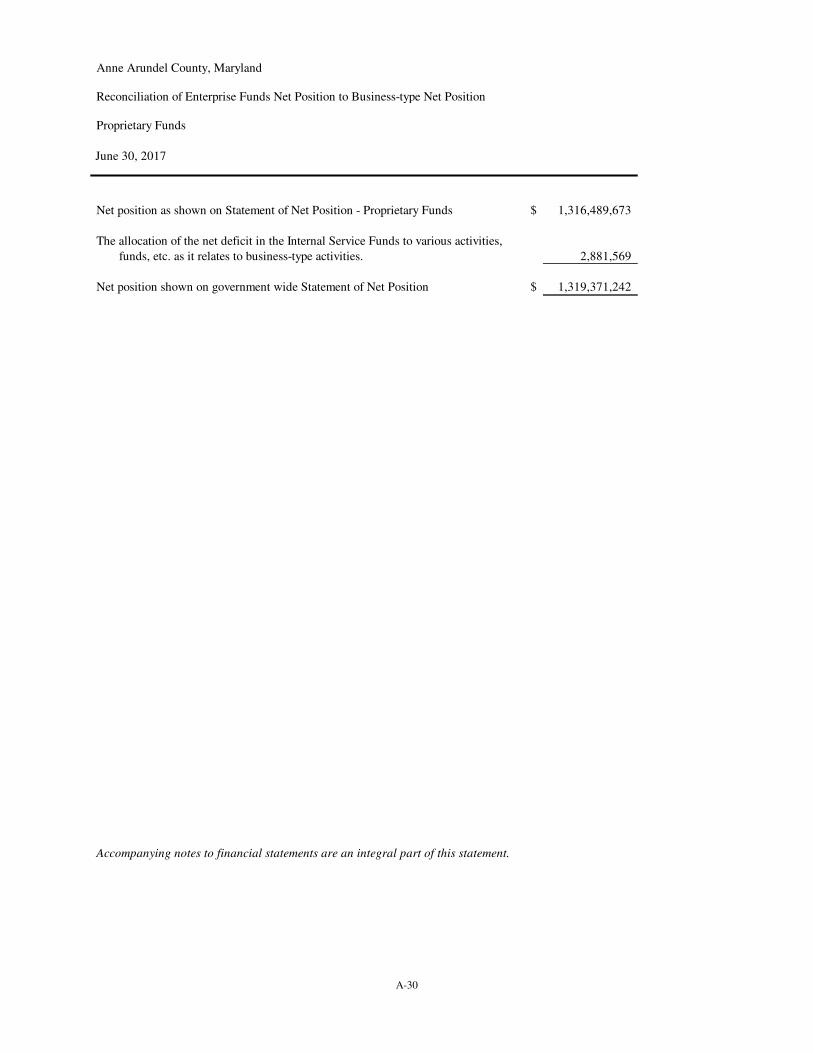
Anne Arundel County, Maryland
Reconciliation of Enterprise Funds Net Position to Business-type Net Position
Proprietary Funds
June 30, 2017
Net position as shown on Statement of Net Position - Proprietary Funds $ 1,316,489,673
The allocation of the net deficit in the Internal Service Funds to various activities,
funds, etc. as it relates to business-type activities. 2,881,569
Net position shown on government wide Statement of Net Position $ 1,319,371,242
Accompanying notes to financial statements are an integral part of this statement.
A-30
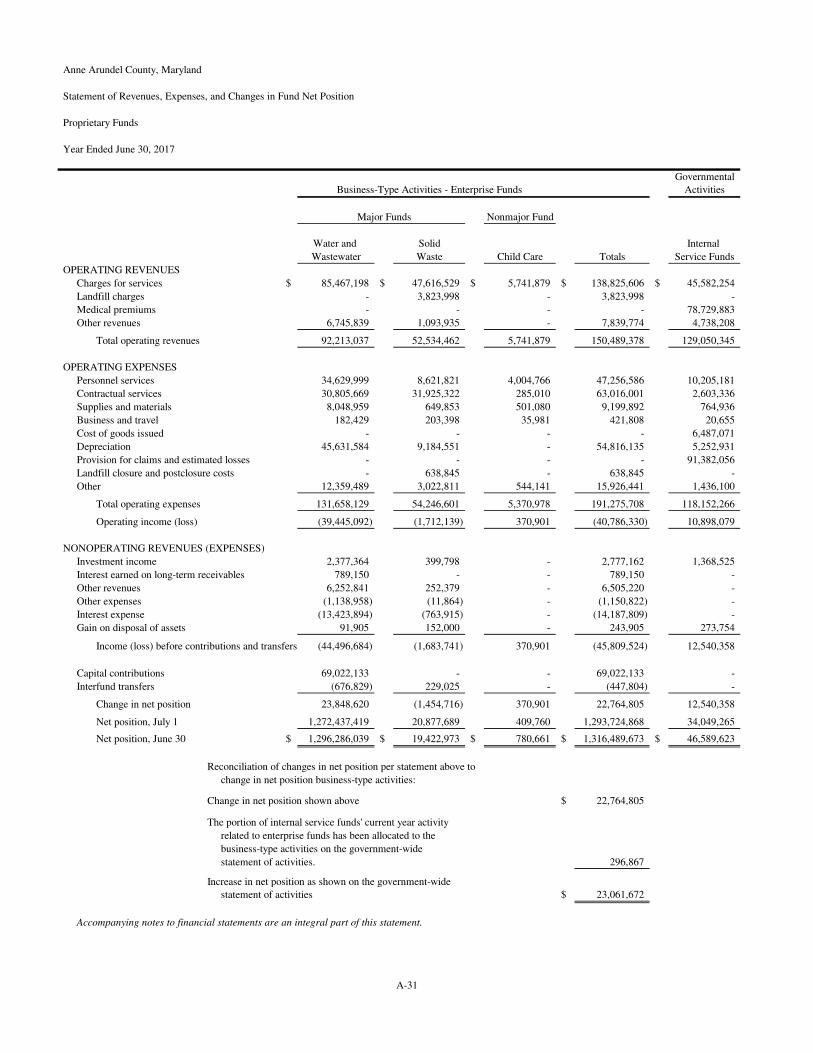
Anne Arundel County, Maryland
Statement of Revenues, Expenses, and Changes in Fund Net Position
Proprietary Funds
Year Ended June 30, 2017
Governmental
Business-Type Activities - Enterprise Funds Activities
Major Funds Nonmajor Fund
Water and Solid Internal
Wastewater Waste Child Care Totals Service Funds
OPERATING REVENUES
Charges for services $ 85,467,198 $ 47,616,529 $ 5,741,879 $ 138,825,606 $ 45,582,254
Landfill charges - 3,823,998 - 3,823,998 -
Medical premiums - - - - 78,729,883
Other revenues 6,745,839 1,093,935 - 7,839,774 4,738,208
Total operating revenues 92,213,037 52,534,462 5,741,879 150,489,378 129,050,345
OPERATING EXPENSES
Personnel services 34,629,999 8,621,821 4,004,766 47,256,586 10,205,181
Contractual services 30,805,669 31,925,322 285,010 63,016,001 2,603,336
Supplies and materials 8,048,959 649,853 501,080 9,199,892 764,936
Business and travel 182,429 203,398 35,981 421,808 20,655
Cost of goods issued - - - - 6,487,071
Depreciation 45,631,584 9,184,551 - 54,816,135 5,252,931
Provision for claims and estimated losses - - - - 91,382,056
Landfill closure and postclosure costs - 638,845 - 638,845 -
Other 12,359,489 3,022,811 544,141 15,926,441 1,436,100
Total operating expenses 131,658,129 54,246,601 5,370,978 191,275,708 118,152,266
Operating income (loss) (39,445,092) (1,712,139) 370,901 (40,786,330) 10,898,079
NONOPERATING REVENUES (EXPENSES)
Investment income 2,377,364 399,798 - 2,777,162 1,368,525
Interest earned on long-term receivables 789,150 - - 789,150 -
Other revenues 6,252,841 252,379 - 6,505,220 -
Other expenses (1,138,958) (11,864) - (1,150,822) -
Interest expense (13,423,894) (763,915) - (14,187,809) -
Gain on disposal of assets 91,905 152,000 - 243,905 273,754
(44,496,684) (1,683,741) 370,901 (45,809,524) 12,540,358
Capital contributions 69,022,133 - - 69,022,133 -
Interfund transfers (676,829) 229,025 - (447,804) -
Change in net position 23,848,620 (1,454,716) 370,901 22,764,805 12,540,358
Net position, July 1 1,272,437,419 20,877,689 409,760 1,293,724,868 34,049,265
Net position, June 30 $ 1,296,286,039 $ 19,422,973 $ 780,661 $ 1,316,489,673 $ 46,589,623
$ 22,764,805
296,867
$ 23,061,672
Accompanying notes to financial statements are an integral part of this statement.
Income (loss) before contributions and transfers
Reconciliation of changes in net position per statement above to
change in net position business-type activities:
Change in net position shown above
The portion of internal service funds' current year activity
related to enterprise funds has been allocated to the
business-type activities on the government-wide
statement of activities.
Increase in net position as shown on the government-wide
statement of activities
A-31
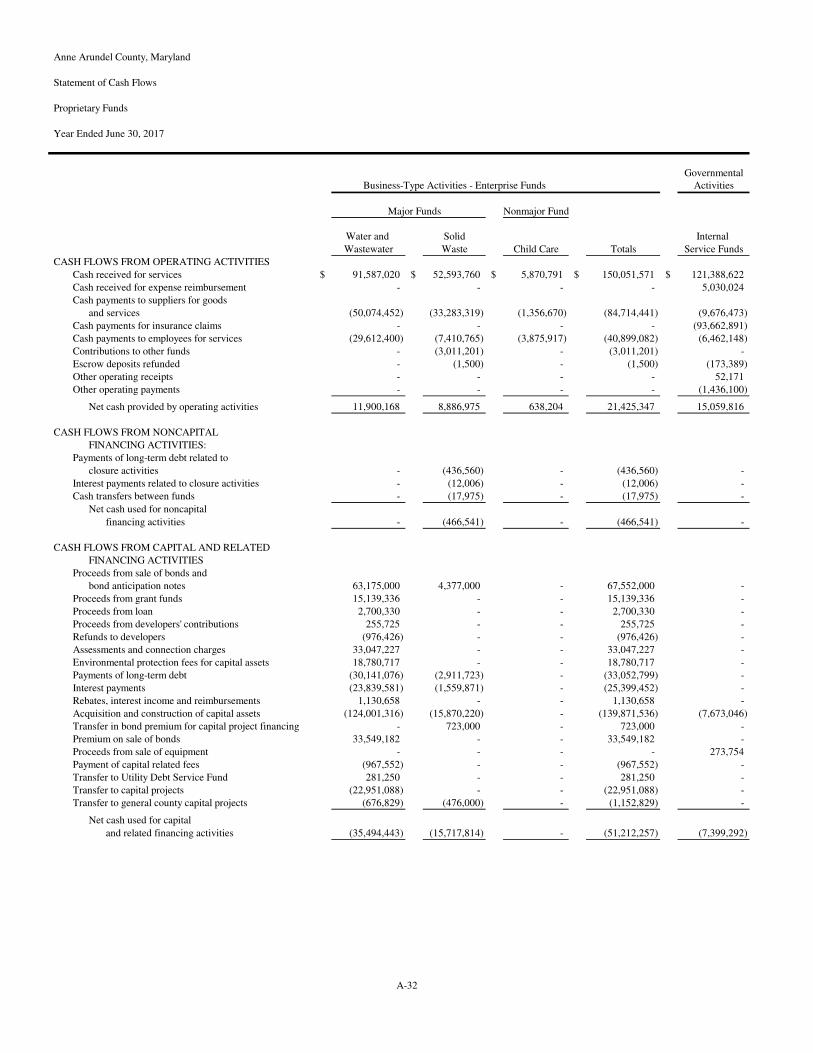
Anne Arundel County, Maryland
Statement of Cash Flows
Proprietary Funds
Year Ended June 30, 2017
Governmental
Business-Type Activities - Enterprise Funds Activities
Major Funds Nonmajor Fund
Water and Solid Internal
Wastewater Waste Child Care Totals Service Funds
CASH FLOWS FROM OPERATING ACTIVITIES
Cash received for services $ 91,587,020 $ 52,593,760 $ 5,870,791 $ 150,051,571 $ 121,388,622
Cash received for expense reimbursement - - - - 5,030,024
Cash payments to suppliers for goods
and services (50,074,452) (33,283,319) (1,356,670) (84,714,441) (9,676,473)
Cash payments for insurance claims - - - - (93,662,891)
Cash payments to employees for services (29,612,400) (7,410,765) (3,875,917) (40,899,082) (6,462,148)
Contributions to other funds - (3,011,201) - (3,011,201) -
Escrow deposits refunded - (1,500) - (1,500) (173,389)
Other operating receipts - - - - 52,171
Other operating payments - - - - (1,436,100)
Net cash provided by operating activities 11,900,168 8,886,975 638,204 21,425,347 15,059,816
CASH FLOWS FROM NONCAPITAL
FINANCING ACTIVITIES:
Payments of long-term debt related to
closure activities - (436,560) - (436,560) -
Interest payments related to closure activities - (12,006) - (12,006) -
Cash transfers between funds - (17,975) - (17,975) -
Net cash used for noncapital
financing activities - (466,541) - (466,541) -
CASH FLOWS FROM CAPITAL AND RELATED
FINANCING ACTIVITIES
Proceeds from sale of bonds and
bond anticipation notes 63,175,000 4,377,000 - 67,552,000 -
Proceeds from grant funds 15,139,336 - - 15,139,336 -
Proceeds from loan 2,700,330 - - 2,700,330 -
Proceeds from developers' contributions 255,725 - - 255,725 -
Refunds to developers (976,426) - - (976,426) -
Assessments and connection charges 33,047,227 - - 33,047,227 -
Environmental protection fees for capital assets 18,780,717 - - 18,780,717 -
Payments of long-term debt (30,141,076) (2,911,723) - (33,052,799) -
Interest payments (23,839,581) (1,559,871) - (25,399,452) -
Rebates, interest income and reimbursements 1,130,658 - - 1,130,658 -
Acquisition and construction of capital assets (124,001,316) (15,870,220) - (139,871,536) (7,673,046)
Transfer in bond premium for capital project financing - 723,000 - 723,000 -
Premium on sale of bonds 33,549,182 - - 33,549,182 -
Proceeds from sale of equipment - - - - 273,754
Payment of capital related fees (967,552) - - (967,552) -
Transfer to Utility Debt Service Fund 281,250 - - 281,250 -
Transfer to capital projects (22,951,088) - - (22,951,088) -
Transfer to general county capital projects (676,829) (476,000) - (1,152,829) -
Net cash used for capital
and related financing activities (35,494,443) (15,717,814) - (51,212,257) (7,399,292)
A-32
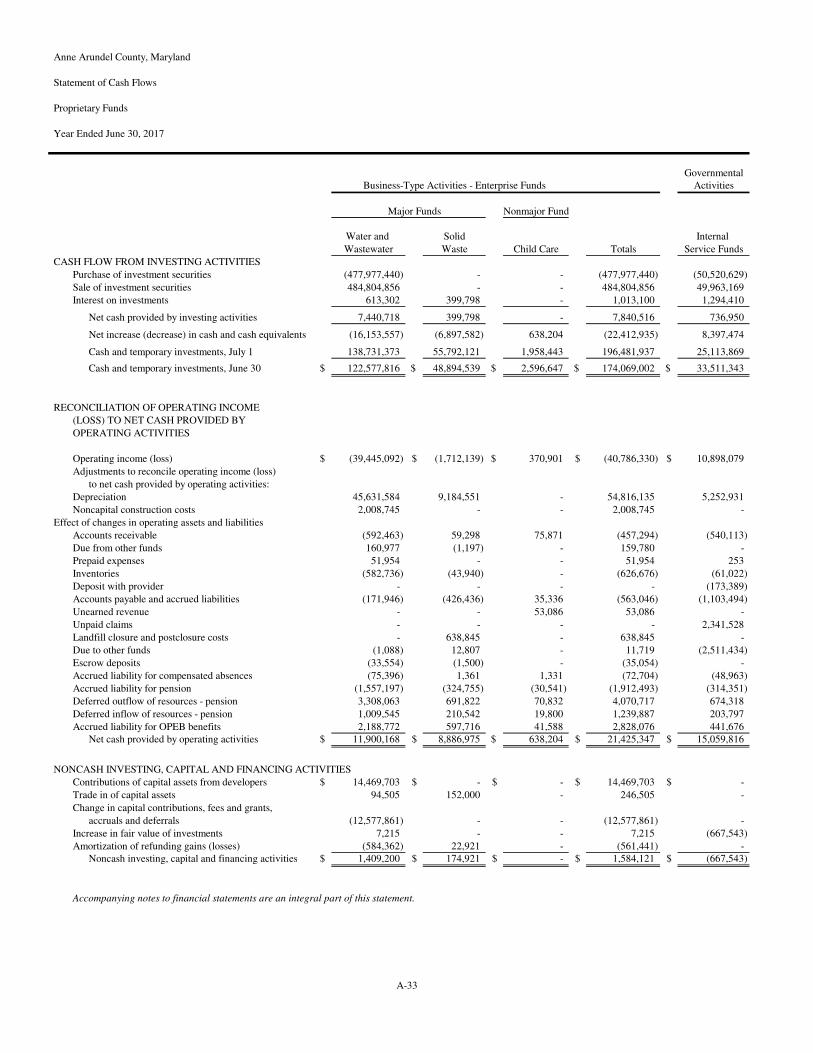
Anne Arundel County, Maryland
Statement of Cash Flows
Proprietary Funds
Year Ended June 30, 2017
Governmental
Business-Type Activities - Enterprise Funds Activities
Major Funds Nonmajor Fund
Water and Solid Internal
Wastewater Waste Child Care Totals Service Funds
CASH FLOW FROM INVESTING ACTIVITIES
Purchase of investment securities (477,977,440) - - (477,977,440) (50,520,629)
Sale of investment securities 484,804,856 - - 484,804,856 49,963,169
Interest on investments 613,302 399,798 - 1,013,100 1,294,410
Net cash provided by investing activities 7,440,718 399,798 - 7,840,516 736,950
Net increase (decrease) in cash and cash equivalents (16,153,557) (6,897,582) 638,204 (22,412,935) 8,397,474
Cash and temporary investments, July 1 138,731,373 55,792,121 1,958,443 196,481,937 25,113,869
Cash and temporary investments, June 30 $ 122,577,816 $ 48,894,539 $ 2,596,647 $ 174,069,002 $ 33,511,343
RECONCILIATION OF OPERATING INCOME
(LOSS) TO NET CASH PROVIDED BY
OPERATING ACTIVITIES
Operating income (loss) $ (39,445,092) $ (1,712,139) $ 370,901 $ (40,786,330) $ 10,898,079
Adjustments to reconcile operating income (loss)
to net cash provided by operating activities:
Depreciation 45,631,584 9,184,551 - 54,816,135 5,252,931
Noncapital construction costs 2,008,745 - - 2,008,745 -
Effect of changes in operating assets and liabilities
Accounts receivable (592,463) 59,298 75,871 (457,294) (540,113)
Due from other funds 160,977 (1,197) - 159,780 -
Prepaid expenses 51,954 - - 51,954 253
Inventories (582,736) (43,940) - (626,676) (61,022)
Deposit with provider - - - - (173,389)
Accounts payable and accrued liabilities (171,946) (426,436) 35,336 (563,046) (1,103,494)
Unearned revenue - - 53,086 53,086 -
Unpaid claims - - - - 2,341,528
Landfill closure and postclosure costs - 638,845 - 638,845 -
Due to other funds (1,088) 12,807 - 11,719 (2,511,434)
Escrow deposits (33,554) (1,500) - (35,054) -
Accrued liability for compensated absences (75,396) 1,361 1,331 (72,704) (48,963)
Accrued liability for pension (1,557,197) (324,755) (30,541) (1,912,493) (314,351)
Deferred outflow of resources - pension 3,308,063 691,822 70,832 4,070,717 674,318
Deferred inflow of resources - pension 1,009,545 210,542 19,800 1,239,887 203,797
Accrued liability for OPEB benefits 2,188,772 597,716 41,588 2,828,076 441,676
Net cash provided by operating activities $ 11,900,168 $ 8,886,975 $ 638,204 $ 21,425,347 $ 15,059,816
NONCASH INVESTING, CAPITAL AND FINANCING ACTIVITIES
Contributions of capital assets from developers $ 14,469,703 $ - $ - $ 14,469,703 $ -
Trade in of capital assets 94,505 152,000 - 246,505 -
Change in capital contributions, fees and grants,
accruals and deferrals (12,577,861) - - (12,577,861) -
Increase in fair value of investments 7,215 - - 7,215 (667,543)
Amortization of refunding gains (losses) (584,362) 22,921 - (561,441) -
Noncash investing, capital and financing activities $ 1,409,200 $ 174,921 $ - $ 1,584,121 $ (667,543)
Accompanying notes to financial statements are an integral part of this statement.
A-33
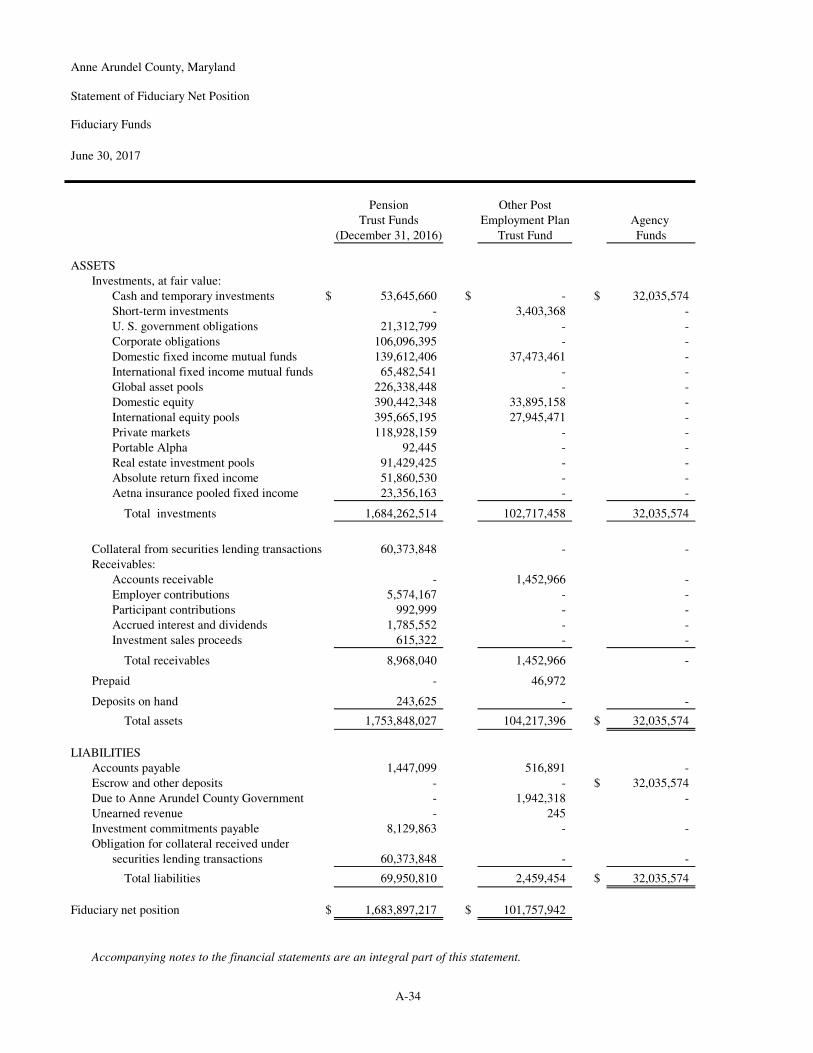
Anne Arundel County, Maryland
Statement of Fiduciary Net Position
Fiduciary Funds
June 30, 2017
Pension Other Post
Trust Funds Employment Plan Agency
(December 31, 2016) Trust Fund Funds
ASSETS
Investments, at fair value:
Cash and temporary investments $ 53,645,660 $ - $ 32,035,574
Short-term investments - 3,403,368 -
U. S. government obligations 21,312,799 - -
Corporate obligations 106,096,395 - -
Domestic fixed income mutual funds 139,612,406 37,473,461 -
International fixed income mutual funds 65,482,541 - -
Global asset pools 226,338,448 - -
Domestic equity 390,442,348 33,895,158 -
International equity pools 395,665,195 27,945,471 -
Private markets 118,928,159 - -
Portable Alpha 92,445 - -
Real estate investment pools 91,429,425 - -
Absolute return fixed income 51,860,530 - -
Aetna insurance pooled fixed income 23,356,163 - -
Total investments 1,684,262,514 102,717,458 32,035,574
Collateral from securities lending transactions 60,373,848 - -
Receivables:
Accounts receivable - 1,452,966 -
Employer contributions 5,574,167 - -
Participant contributions 992,999 - -
Accrued interest and dividends 1,785,552 - -
Investment sales proceeds 615,322 - -
Total receivables 8,968,040 1,452,966 -
Prepaid - 46,972
Deposits on hand 243,625 - -
Total assets 1,753,848,027 104,217,396 $ 32,035,574
LIABILITIES
Accounts payable 1,447,099 516,891 -
Escrow and other deposits - - $ 32,035,574
Due to Anne Arundel County Government - 1,942,318 -
Unearned revenue - 245
Investment commitments payable 8,129,863 - -
Obligation for collateral received under
securities lending transactions 60,373,848 - -
Total liabilities 69,950,810 2,459,454 $ 32,035,574
Fiduciary net position $ 1,683,897,217 $ 101,757,942
Accompanying notes to the financial statements are an integral part of this statement.
A-34
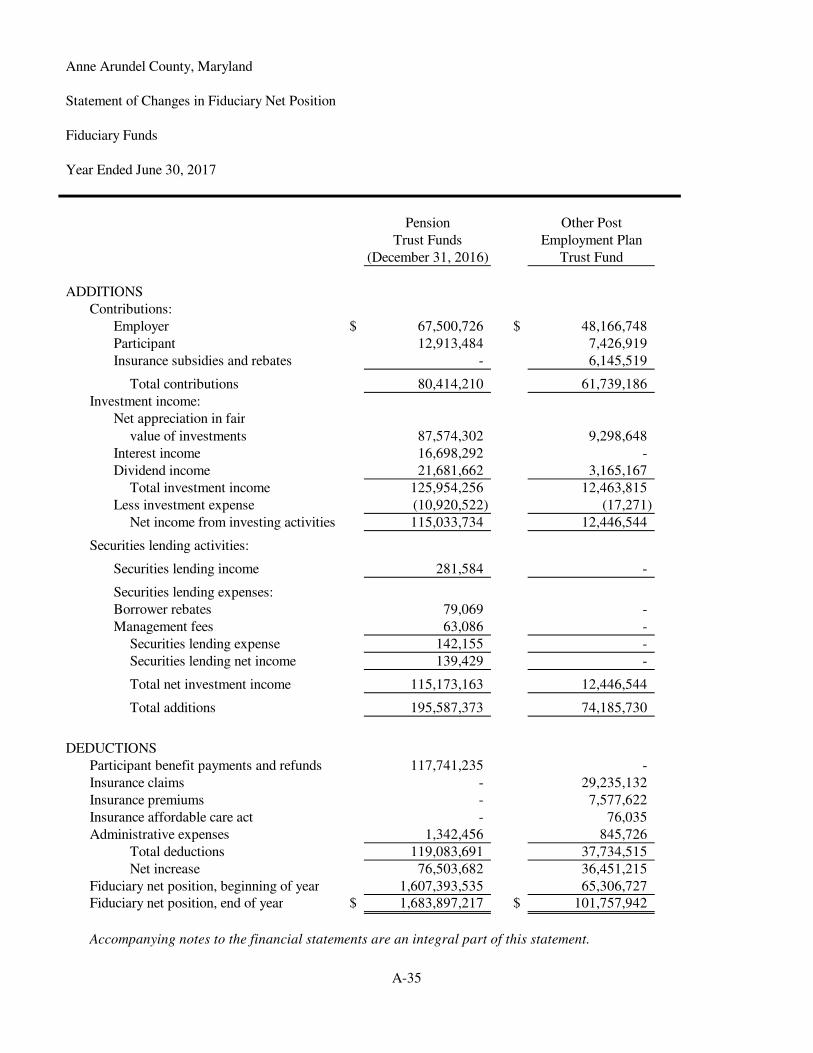
Anne Arundel County, Maryland
Statement of Changes in Fiduciary Net Position
Fiduciary Funds
Year Ended June 30, 2017
Pension Other Post
Trust Funds Employment Plan
(December 31, 2016) Trust Fund
ADDITIONS
Contributions:
Employer $ 67,500,726 $ 48,166,748
Participant 12,913,484 7,426,919
Insurance subsidies and rebates - 6,145,519
Total contributions 80,414,210 61,739,186
Investment income:
Net appreciation in fair
value of investments 87,574,302 9,298,648
Interest income 16,698,292 -
Dividend income 21,681,662 3,165,167
Total investment income 125,954,256 12,463,815
Less investment expense (10,920,522) (17,271)
Net income from investing activities 115,033,734 12,446,544
Securities lending activities:
Securities lending income 281,584 -
Securities lending expenses:
Borrower rebates 79,069 -
Management feesManagement fees 63,086 -
Securities lending expense 142,155 -
Securities lending net income 139,429 -
Total net investment income 115,173,163 12,446,544
Total additions 195,587,373 74,185,730
DEDUCTIONS
Participant benefit payments and refunds 117,741,235 -
Insurance claims - 29,235,132
Insurance premiums - 7,577,622
Insurance affordable care act - 76,035
Administrative expenses 1,342,456 845,726
Total deductions 119,083,691 37,734,515
Net increase 76,503,682 36,451,215
Fiduciary net position, beginning of year 1,607,393,535 65,306,727 Fiduciary net position, end of year $ 1,683,897,217 $ 101,757,942
Accompanying notes to the financial statements are an integral part of this statement.
A-35

Anne Arundel County, Maryland Notes to the Financial Statements June 30, 2017
A-36
1 Summary of Significant Accounting Policies The basic financial statements are prepared in accordance with accounting principles generally accepted in the United States of America applicable to governmental units as prescribed by the Governmental Accounting Standards Board (GASB). This note summarizes the significant accounting policies. A Reporting Entity – The County’s basic financial statements include various departments, agencies, and other organizational units governed directly by the County Executive and the County Council, herein referred to as the primary government. These statements also include other entities, which by the entities’ relationships with the primary government are considered component units of the County. Accounting principles dictate that those entities that are financially accountable to the primary government or where exclusion would cause the financial statements to be misleading or incomplete should be included in the County’s basic financial statements. The County’s component units and the reasons for the entities’ inclusion are as follows:
• Anne Arundel County Board of Education (Board of Education) - The Board of Education and the Anne Arundel County Public School System provide public education for the County’s students in grades kindergarten through twelve.
• Anne Arundel Community College (Community College) – The Community College and its Foundation operate an institution of higher education within the County.
• Public Library Association of Annapolis and Anne Arundel County, Inc. (A.A. County Public Library or Library) – The Library operates the public library system within the County.
• Anne Arundel Economic Development Corporation (Economic Development) – Economic Development provides services and programs that promote economic development within the County.
• Tipton Airport Authority (Tipton Airport) – Tipton Airport operates a general aviation airport in the western area of the County.
• Anne Arundel Workforce Development Corporation (Workforce Development) – Workforce Development provides job training and placement services to County citizens.
All of these entities are component units because the primary government approves the entities’ respective
budgets and/or provides a substantial amount of funding. In addition, the County Executive appoints a majority of the members of the governing bodies for Economic Development, Tipton Airport, and Workforce Development.
All of these entities are discretely presented in the government-wide statements. The Board of Education and
the Community College are considered major component units and have been presented in separate columns on the face of the government-wide statements.
Separately issued financial statements for the Board of Education, the Community College, Economic
Development, Tipton Airport, and Workforce Development may be obtained from the respective administrative offices. The addresses are provided below. The Library does not issue separate financial statements, and all of its required financial statements have been included in the County’s comprehensive annual financial report (CAFR). Anne Arundel County Board of Education Anne Arundel Community College 2644 Riva Road 101 College Parkway Annapolis, MD 21401 Arnold, MD 21012 Anne Arundel Economic Development Corp. Tipton Airport Authority 2660 Riva Road, Suite 200 P. O. Box 155 Annapolis, MD 21401 Odenton, MD 21113-0155 Anne Arundel Workforce Development Corp. 1131 Benfield Boulevard, Suite N Millersville, MD 21108
Anne Arundel County, Maryland Notes to the Financial Statements
A-37
B Financial Statement Presentation, Measurement Focus, and Basis of Accounting – The basic financial statements are divided into three categories: government–wide financial statements, fund financial statements, and budgetary statements.
Government-Wide Financial Statements
The government-wide financial statements, consisting of the Statement of Net Position and the Statement of Activities, are reported using the economic resources measurement focus and the accrual basis of accounting. Revenues are recorded when earned, and expenses are recorded when a liability is incurred, regardless of the timing of related cash flows. Property taxes are recognized in the year levied, and grants and similar revenues are recognized when all eligibility requirements imposed by the provider have been met.
The government-wide statements present governmental activities, which are supported primarily by taxes
and intergovernmental revenues, separately from business-type activities, which are funded primarily by user fees. In addition, the primary government’s activity is presented separately from its discretely presented component units. The government-wide statements do not include the net position or activities of the fiduciary funds, which include the pension trust funds, other post-employment trust funds and the agency funds, because these funds account for assets that are not owned by the County.
Interfund activity within the primary government’s governmental activities and business-type activities has
been eliminated from the government-wide statements. Residual balances between the governmental and business-type categories are presented on the Statement of Net Position as “Internal balances.” In addition, transactions between these activities and the internal service funds, which primarily serve the primary government, have been eliminated. Certain residual assets, liabilities, and net positions of the internal service funds have been added to governmental activities. In addition, transactions between the internal service funds and component units or other non-County agencies have been included in governmental activities. Fund Financial Statements The fund financial statements include statements for the governmental funds, the proprietary funds, and the fiduciary funds. Major funds within each category have been presented in separate columns, while all non-major funds are combined in one column.
Governmental fund financial statements - The governmental funds are reported using the current financial resources measurement focus and the modified accrual basis of accounting. Revenues are recognized when measurable and available. Revenues are considered available if those revenues are collectible within the current period or shortly thereafter to pay liabilities of the current period. Expenditures are generally recorded when incurred; however, expenditures for debt service, compensated absences, claims, and judgments are recorded when payments are due.
The County considers revenue collected within ninety days of the end of the year as available, except for
property taxes, which must be collected within sixty days. Property taxes, income taxes, certain shared taxes, and grants that have not been received within the availability period have been deferred to future periods and recorded as deferred inflow of resources.
The governmental fund financial statements separately present the following major funds:
• General Fund – This fund is the primary operating fund. It accounts for all financial resources of the primary government except those accounted for in another fund.
• Impact Fee Capital Projects Fund – This capital projects fund accounts for impact fees collected from developers to pay a share of the cost of additional school capacity, road improvements, and public safety facilities necessitated by the development.
• General County Capital Projects Fund – This fund accounts for all financial resources that are received and used for the acquisition or development of major capital improvements. Resources received are applied such that the most restrictive resources are used first. This generally results in the following order:
restricted revenues such as developer contributions, bonds, pay-as-you-go, and grants.
Anne Arundel County, Maryland Notes to the Financial Statements
A-38
Proprietary fund financial statements - The proprietary funds are reported using the economic resources
measurement focus and the accrual basis of accounting. Revenues are recognized when earned, and expenses are recognized when a liability is incurred, regardless of the timing of cash flows. These funds account for County services that operate as self-supporting activities. Those who benefit from these services bear the cost through the payment of user fees. The proprietary fund financial statements separately present the following major enterprise funds:
• Water and Wastewater – This fund accounts for the operating, debt service, and capital improvement activities of the water and wastewater utility services provided to County residents and businesses.
• Solid Waste – This fund accounts for the costs associated with the collection and disposal of refuse for County residents and businesses. This includes the cost of operations, debt service, capital improvements, and landfill restoration.
The proprietary fund statements also include a column that presents totals for internal service funds. These
funds operate as self-supporting activities that primarily serve the primary government and its component units. The internal service funds of the County are:
• Self Insurance – The County is self-insured for workers’ compensation, auto liability, and general liability insurance. This fund accounts for the self-insured activity and the purchase of policies from commercial insurers for certain specific exposures. These services, provided to the primary government and certain component units, are funded through charges to the users.
• Health Insurance – The County is self-insured for employee and retiree medical benefits. This fund accounts for this health insurance activity and the payment to outside administrators and medical service providers. These services are provided to the primary government and certain component units and other agencies and are funded through premiums charged to the users.
• Central Garage and Transportation – This fund accounts for activity in the County’s central garage, which provides the primary government and certain component units with vehicle maintenance, fuel usage, and motor pool vehicles. Costs are recovered through fees to users for maintenance, fuel use, and vehicle lease charges.
• Garage Vehicle Replacement – This fund accounts for the collection of replacement fees from participating funds within the primary government and certain component units. The fees are used to replace motor pool vehicles as needed.
Fiduciary fund financial statements - The fiduciary fund statements include the following:
• Pension Trust Fund – The activities of the Anne Arundel County Retirement and Pension System (Retirement System). The Retirement System accounts for the activity in the primary government’s four defined-benefit pension plans and reports on a calendar-year basis. The Pension Trust Fund is reported using the economic resources measurement focus and accrual basis of accounting. Revenues are recognized when earned, and expenses are recognized when a liability is incurred, regardless of the timing of related cash flows. These plans accumulate employer and employee contributions and invest these funds to provide guaranteed pension benefits after retirement. Employer contributions are based on actuarial recommendations.
• Anne Arundel Retiree Health Benefits Trust Fund – The activities of the Anne Arundel Retiree Health Benefits Trust (OPEB Trust Fund). The OPEB Trust Fund has fiduciary responsibility to administer multi-employer defined benefit plans for the purpose of providing retiree health benefits as “other post-employment benefit” for three entities: The Anne Arundel County Plan (County Plan), the Anne Arundel Community College Plan (College Plan), and the Public Library Association of Annapolis and Anne Arundel County, Inc. (Library Plan).
• Agency Funds – The balances of assets and liabilities maintained in the primary government’s agency funds. Since agency funds report only assets and liabilities, these funds do not have a measurement focus. Transactions in these funds are recorded using the accrual basis of accounting. Agnecy funds account for deposits that are collected and held on behalf of individuals, organizations, or other governments. These monies include the following: escrow deposits for developer subdivisions, sediment control, tax sale, special taxing districts, and other miscellaneous purposes; monies held in trust on behalf of the Special Tax and Assessment Districts; and taxes collected for other governments.
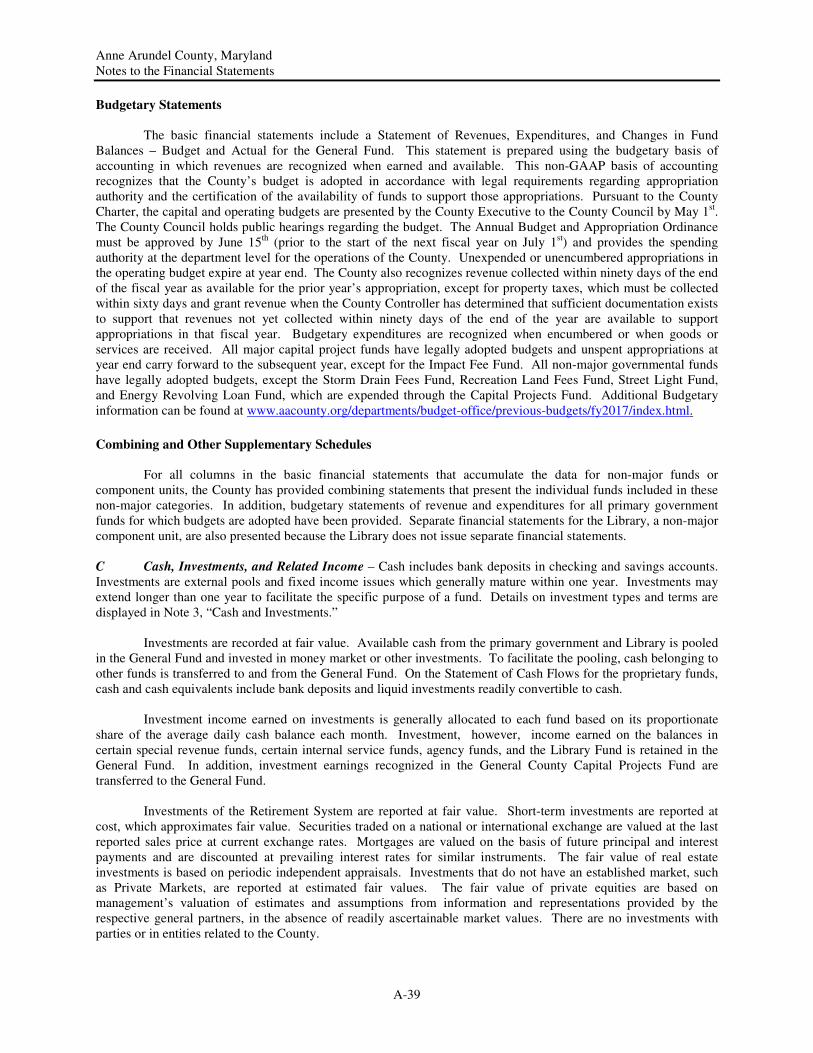
Anne Arundel County, Maryland Notes to the Financial Statements
A-39
Budgetary Statements
The basic financial statements include a Statement of Revenues, Expenditures, and Changes in Fund Balances – Budget and Actual for the General Fund. This statement is prepared using the budgetary basis of accounting in which revenues are recognized when earned and available. This non-GAAP basis of accounting recognizes that the County’s budget is adopted in accordance with legal requirements regarding appropriation authority and the certification of the availability of funds to support those appropriations. Pursuant to the County Charter, the capital and operating budgets are presented by the County Executive to the County Council by May 1st. The County Council holds public hearings regarding the budget. The Annual Budget and Appropriation Ordinance must be approved by June 15th (prior to the start of the next fiscal year on July 1st) and provides the spending authority at the department level for the operations of the County. Unexpended or unencumbered appropriations in the operating budget expire at year end. The County also recognizes revenue collected within ninety days of the end of the fiscal year as available for the prior year’s appropriation, except for property taxes, which must be collected within sixty days and grant revenue when the County Controller has determined that sufficient documentation exists to support that revenues not yet collected within ninety days of the end of the year are available to support appropriations in that fiscal year. Budgetary expenditures are recognized when encumbered or when goods or services are received. All major capital project funds have legally adopted budgets and unspent appropriations at year end carry forward to the subsequent year, except for the Impact Fee Fund. All non-major governmental funds have legally adopted budgets, except the Storm Drain Fees Fund, Recreation Land Fees Fund, Street Light Fund, and Energy Revolving Loan Fund, which are expended through the Capital Projects Fund. Additional Budgetary information can be found at www.aacounty.org/departments/budget-office/previous-budgets/fy2017/index.html.
Combining and Other Supplementary Schedules
For all columns in the basic financial statements that accumulate the data for non-major funds or component units, the County has provided combining statements that present the individual funds included in these non-major categories. In addition, budgetary statements of revenue and expenditures for all primary government funds for which budgets are adopted have been provided. Separate financial statements for the Library, a non-major component unit, are also presented because the Library does not issue separate financial statements. C Cash, Investments, and Related Income – Cash includes bank deposits in checking and savings accounts. Investments are external pools and fixed income issues which generally mature within one year. Investments may extend longer than one year to facilitate the specific purpose of a fund. Details on investment types and terms are displayed in Note 3, “Cash and Investments.”
Investments are recorded at fair value. Available cash from the primary government and Library is pooled in the General Fund and invested in money market or other investments. To facilitate the pooling, cash belonging to other funds is transferred to and from the General Fund. On the Statement of Cash Flows for the proprietary funds, cash and cash equivalents include bank deposits and liquid investments readily convertible to cash.
Investment income earned on investments is generally allocated to each fund based on its proportionate share of the average daily cash balance each month. Investment, however, income earned on the balances in certain special revenue funds, certain internal service funds, agency funds, and the Library Fund is retained in the General Fund. In addition, investment earnings recognized in the General County Capital Projects Fund are transferred to the General Fund.
Investments of the Retirement System are reported at fair value. Short-term investments are reported at cost, which approximates fair value. Securities traded on a national or international exchange are valued at the last reported sales price at current exchange rates. Mortgages are valued on the basis of future principal and interest payments and are discounted at prevailing interest rates for similar instruments. The fair value of real estate investments is based on periodic independent appraisals. Investments that do not have an established market, such as Private Markets, are reported at estimated fair values. The fair value of private equities are based on management’s valuation of estimates and assumptions from information and representations provided by the respective general partners, in the absence of readily ascertainable market values. There are no investments with parties or in entities related to the County.
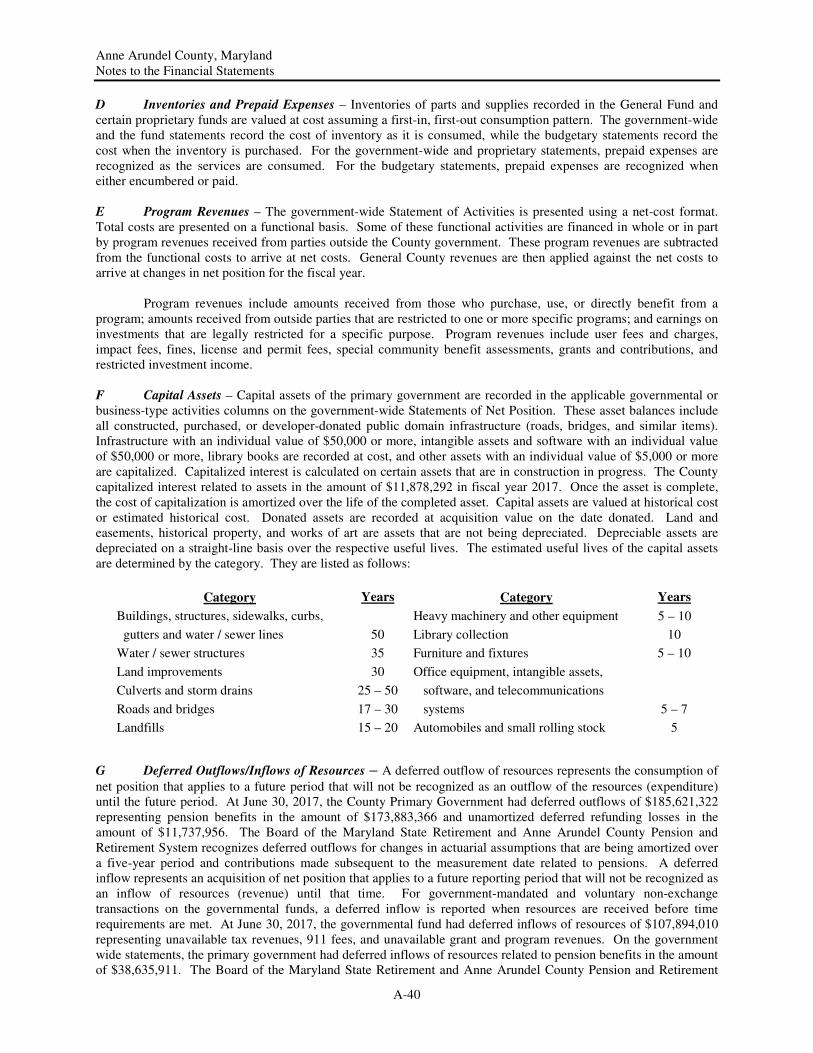
Anne Arundel County, Maryland Notes to the Financial Statements
A-40
D Inventories and Prepaid Expenses – Inventories of parts and supplies recorded in the General Fund and certain proprietary funds are valued at cost assuming a first-in, first-out consumption pattern. The government-wide and the fund statements record the cost of inventory as it is consumed, while the budgetary statements record the cost when the inventory is purchased. For the government-wide and proprietary statements, prepaid expenses are recognized as the services are consumed. For the budgetary statements, prepaid expenses are recognized when either encumbered or paid. E Program Revenues – The government-wide Statement of Activities is presented using a net-cost format. Total costs are presented on a functional basis. Some of these functional activities are financed in whole or in part by program revenues received from parties outside the County government. These program revenues are subtracted from the functional costs to arrive at net costs. General County revenues are then applied against the net costs to arrive at changes in net position for the fiscal year. Program revenues include amounts received from those who purchase, use, or directly benefit from a program; amounts received from outside parties that are restricted to one or more specific programs; and earnings on investments that are legally restricted for a specific purpose. Program revenues include user fees and charges, impact fees, fines, license and permit fees, special community benefit assessments, grants and contributions, and restricted investment income. F Capital Assets – Capital assets of the primary government are recorded in the applicable governmental or business-type activities columns on the government-wide Statements of Net Position. These asset balances include all constructed, purchased, or developer-donated public domain infrastructure (roads, bridges, and similar items). Infrastructure with an individual value of $50,000 or more, intangible assets and software with an individual value of $50,000 or more, library books are recorded at cost, and other assets with an individual value of $5,000 or more are capitalized. Capitalized interest is calculated on certain assets that are in construction in progress. The County capitalized interest related to assets in the amount of $11,878,292 in fiscal year 2017. Once the asset is complete, the cost of capitalization is amortized over the life of the completed asset. Capital assets are valued at historical cost or estimated historical cost. Donated assets are recorded at acquisition value on the date donated. Land and easements, historical property, and works of art are assets that are not being depreciated. Depreciable assets are depreciated on a straight-line basis over the respective useful lives. The estimated useful lives of the capital assets are determined by the category. They are listed as follows:
Category Years Category Years
Buildings, structures, sidewalks, curbs, Heavy machinery and other equipment 5 – 10
gutters and water / sewer lines 50 Library collection 10
Water / sewer structures 35 Furniture and fixtures 5 – 10
Land improvements 30 Office equipment, intangible assets,
Culverts and storm drains 25 – 50 software, and telecommunications
Roads and bridges 17 – 30 systems 5 – 7
Landfills 15 – 20 Automobiles and small rolling stock 5
G Deferred Outflows/Inflows of Resources – A deferred outflow of resources represents the consumption of
net position that applies to a future period that will not be recognized as an outflow of the resources (expenditure) until the future period. At June 30, 2017, the County Primary Government had deferred outflows of $185,621,322 representing pension benefits in the amount of $173,883,366 and unamortized deferred refunding losses in the amount of $11,737,956. The Board of the Maryland State Retirement and Anne Arundel County Pension and Retirement System recognizes deferred outflows for changes in actuarial assumptions that are being amortized over a five-year period and contributions made subsequent to the measurement date related to pensions. A deferred inflow represents an acquisition of net position that applies to a future reporting period that will not be recognized as an inflow of resources (revenue) until that time. For government-mandated and voluntary non-exchange transactions on the governmental funds, a deferred inflow is reported when resources are received before time requirements are met. At June 30, 2017, the governmental fund had deferred inflows of resources of $107,894,010 representing unavailable tax revenues, 911 fees, and unavailable grant and program revenues. On the government wide statements, the primary government had deferred inflows of resources related to pension benefits in the amount of $38,635,911. The Board of the Maryland State Retirement and Anne Arundel County Pension and Retirement
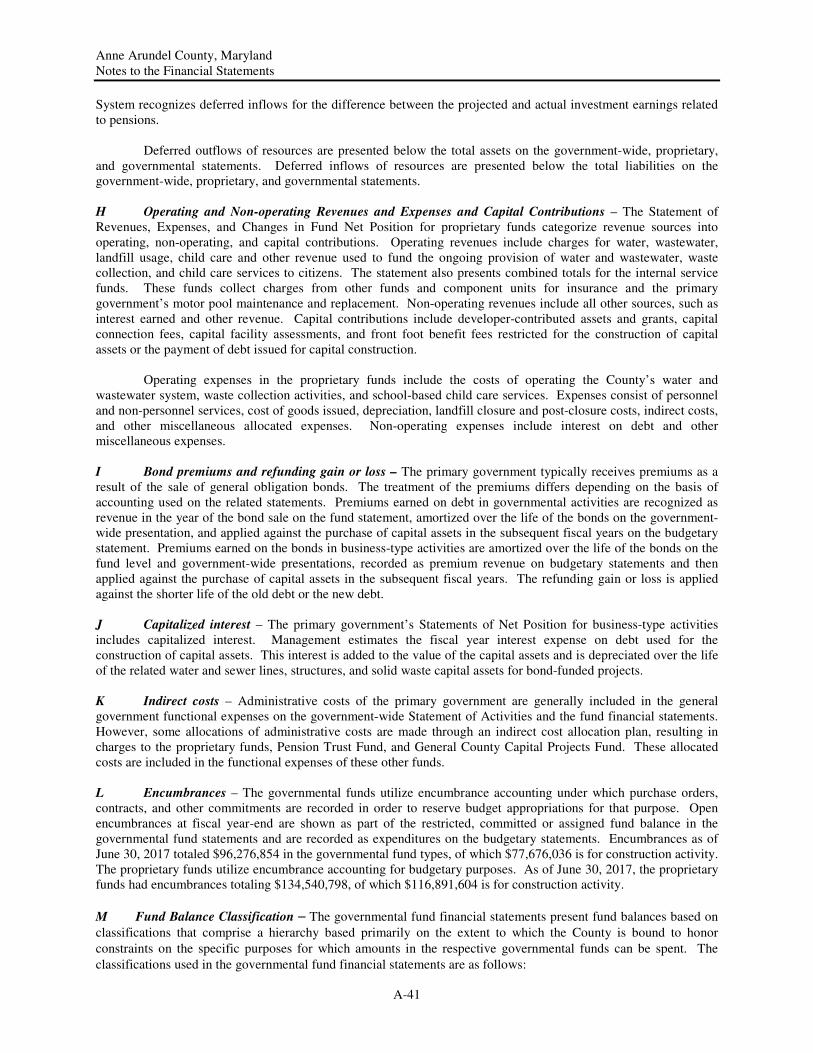
Anne Arundel County, Maryland Notes to the Financial Statements
A-41
System recognizes deferred inflows for the difference between the projected and actual investment earnings related to pensions.
Deferred outflows of resources are presented below the total assets on the government-wide, proprietary,
and governmental statements. Deferred inflows of resources are presented below the total liabilities on the government-wide, proprietary, and governmental statements.
H Operating and Non-operating Revenues and Expenses and Capital Contributions – The Statement of Revenues, Expenses, and Changes in Fund Net Position for proprietary funds categorize revenue sources into operating, non-operating, and capital contributions. Operating revenues include charges for water, wastewater, landfill usage, child care and other revenue used to fund the ongoing provision of water and wastewater, waste collection, and child care services to citizens. The statement also presents combined totals for the internal service funds. These funds collect charges from other funds and component units for insurance and the primary government’s motor pool maintenance and replacement. Non-operating revenues include all other sources, such as interest earned and other revenue. Capital contributions include developer-contributed assets and grants, capital connection fees, capital facility assessments, and front foot benefit fees restricted for the construction of capital assets or the payment of debt issued for capital construction. Operating expenses in the proprietary funds include the costs of operating the County’s water and wastewater system, waste collection activities, and school-based child care services. Expenses consist of personnel and non-personnel services, cost of goods issued, depreciation, landfill closure and post-closure costs, indirect costs, and other miscellaneous allocated expenses. Non-operating expenses include interest on debt and other miscellaneous expenses. I Bond premiums and refunding gain or loss – The primary government typically receives premiums as a result of the sale of general obligation bonds. The treatment of the premiums differs depending on the basis of accounting used on the related statements. Premiums earned on debt in governmental activities are recognized as revenue in the year of the bond sale on the fund statement, amortized over the life of the bonds on the government-wide presentation, and applied against the purchase of capital assets in the subsequent fiscal years on the budgetary statement. Premiums earned on the bonds in business-type activities are amortized over the life of the bonds on the fund level and government-wide presentations, recorded as premium revenue on budgetary statements and then applied against the purchase of capital assets in the subsequent fiscal years. The refunding gain or loss is applied against the shorter life of the old debt or the new debt.
J Capitalized interest – The primary government’s Statements of Net Position for business-type activities includes capitalized interest. Management estimates the fiscal year interest expense on debt used for the construction of capital assets. This interest is added to the value of the capital assets and is depreciated over the life of the related water and sewer lines, structures, and solid waste capital assets for bond-funded projects.
K Indirect costs – Administrative costs of the primary government are generally included in the general government functional expenses on the government-wide Statement of Activities and the fund financial statements. However, some allocations of administrative costs are made through an indirect cost allocation plan, resulting in charges to the proprietary funds, Pension Trust Fund, and General County Capital Projects Fund. These allocated costs are included in the functional expenses of these other funds.
L Encumbrances – The governmental funds utilize encumbrance accounting under which purchase orders, contracts, and other commitments are recorded in order to reserve budget appropriations for that purpose. Open encumbrances at fiscal year-end are shown as part of the restricted, committed or assigned fund balance in the governmental fund statements and are recorded as expenditures on the budgetary statements. Encumbrances as of June 30, 2017 totaled $96,276,854 in the governmental fund types, of which $77,676,036 is for construction activity. The proprietary funds utilize encumbrance accounting for budgetary purposes. As of June 30, 2017, the proprietary funds had encumbrances totaling $134,540,798, of which $116,891,604 is for construction activity.
M Fund Balance Classification – The governmental fund financial statements present fund balances based on
classifications that comprise a hierarchy based primarily on the extent to which the County is bound to honor
constraints on the specific purposes for which amounts in the respective governmental funds can be spent. The
classifications used in the governmental fund financial statements are as follows:
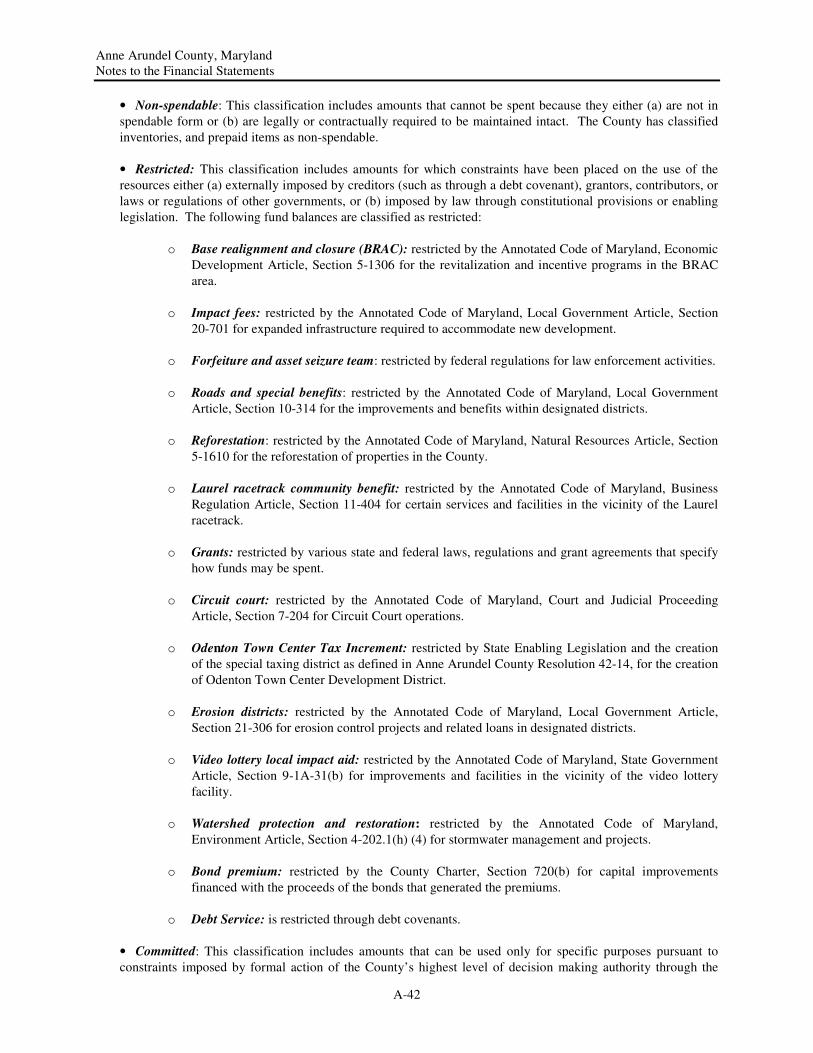
Anne Arundel County, Maryland Notes to the Financial Statements
A-42
• Non-spendable: This classification includes amounts that cannot be spent because they either (a) are not in
spendable form or (b) are legally or contractually required to be maintained intact. The County has classified
inventories, and prepaid items as non-spendable.
• Restricted: This classification includes amounts for which constraints have been placed on the use of the
resources either (a) externally imposed by creditors (such as through a debt covenant), grantors, contributors, or
laws or regulations of other governments, or (b) imposed by law through constitutional provisions or enabling
legislation. The following fund balances are classified as restricted:
o Base realignment and closure (BRAC): restricted by the Annotated Code of Maryland, Economic
Development Article, Section 5-1306 for the revitalization and incentive programs in the BRAC
area.
o Impact fees: restricted by the Annotated Code of Maryland, Local Government Article, Section
20-701 for expanded infrastructure required to accommodate new development.
o Forfeiture and asset seizure team: restricted by federal regulations for law enforcement activities.
o Roads and special benefits: restricted by the Annotated Code of Maryland, Local Government
Article, Section 10-314 for the improvements and benefits within designated districts.
o Reforestation: restricted by the Annotated Code of Maryland, Natural Resources Article, Section
5-1610 for the reforestation of properties in the County.
o Laurel racetrack community benefit: restricted by the Annotated Code of Maryland, Business
Regulation Article, Section 11-404 for certain services and facilities in the vicinity of the Laurel
racetrack.
o Grants: restricted by various state and federal laws, regulations and grant agreements that specify
how funds may be spent.
o Circuit court: restricted by the Annotated Code of Maryland, Court and Judicial Proceeding
Article, Section 7-204 for Circuit Court operations.
o Odenton Town Center Tax Increment: restricted by State Enabling Legislation and the creation
of the special taxing district as defined in Anne Arundel County Resolution 42-14, for the creation
of Odenton Town Center Development District.
o Erosion districts: restricted by the Annotated Code of Maryland, Local Government Article,
Section 21-306 for erosion control projects and related loans in designated districts.
o Video lottery local impact aid: restricted by the Annotated Code of Maryland, State Government
Article, Section 9-1A-31(b) for improvements and facilities in the vicinity of the video lottery
facility.
o Watershed protection and restoration: restricted by the Annotated Code of Maryland,
Environment Article, Section 4-202.1(h) (4) for stormwater management and projects.
o Bond premium: restricted by the County Charter, Section 720(b) for capital improvements
financed with the proceeds of the bonds that generated the premiums.
o Debt Service: is restricted through debt covenants.
• Committed: This classification includes amounts that can be used only for specific purposes pursuant to
constraints imposed by formal action of the County’s highest level of decision making authority through the
Anne Arundel County, Maryland Notes to the Financial Statements
A-43
passing of ordinances. These amounts cannot be used for any other purpose unless the County Council removes
or changes the ordinance that was employed when the funds were initially committed. Storm Drain Fees Fund,
Street Lights Capital Project Fund, Recreation Land Fees Fund, and Energy Revolving Loan Fund are
committed based on legislation in the County code. The Installment Purchase Agreement Fund is committed
for the purchase of agricultural and woodland preservation programs.
• Assigned: This classification includes amounts that are constrained by the County’s intent to be used for a
specific purpose, but are neither restricted nor committed. The policy to assign funds is established through the
Annual Budget and Appropriation Ordinance each year which is approved by both the County Council and the
County Executive. This classification also includes the remaining positive fund balance for all governmental
funds except for the General Fund. General County Capital Projects are assigned for the repair and
replacement of equipment.
• Unassigned: The General Fund is the only fund that reports a positive unassigned fund balance. In other
governmental funds, it is not appropriate to report a positive unassigned fund balance amount. However, in
governmental funds other than the General Fund, if expenditures incurred for specific purposes exceed the
amounts that are restricted, committed, or assigned to those purposes, it may be necessary to report a negative
unassigned fund balance in that fund. This classification includes the residual fund balance for the General
Fund. A.A. County Partnership for Children Youth and Family Fund, Arundel Community Development
Service Fund and the Grants Fund have negative unassigned fund balance which represents the timing
difference between the grant expenditures and payments received for the reimbursable grants. The County typically uses restricted resources first, followed by committed resources, and then assigned resources, as appropriate opportunities arise, but reserves the right to selectively spend unassigned resources first to defer the use of these other classified funds. N Compensated absences - The primary government’s Statements of Net Position include an accrual for compensated absences. This accrual is an estimate of unused annual leave as of June 30, 2017. The annual leave accrual is calculated using unused annual leave hours as of June 30, 2017 and pay rates in place for each employee at the end of the fiscal. The compensated absences accrual also includes an estimate of sick leave payouts earned as of fiscal year-end. Certain employees are paid $25 per day for unused sick leave upon retirement. The estimate uses unused sick days at year end multiplied by $25 per day. The accrual is then adjusted to reflect an estimate of the current employees that will ultimately retire with the primary government. Compensated absences are liquidated within the following governmental funds: the General Fund and Reforestation Fund. They are also liquidated in the following internal service and enterprise funds: Self Insurance, Central Garage and Transportation, Water and Wastewater, Solid Waste and Child Care. O New GASB Pronouncements - In fiscal year ended June 30, 2017, the County implemented the following Governmental Accounting Standard Board (GASB) pronouncements:
• Statement No. 73, Accounting and Financial Reporting for Pensions and Related Assets That Are Not
Within The Scope of GASB 68, and Amendments to Certain Provisions of GASB Statement 67 and 68 Plans. This statement establishes new accounting and financial reporting requirements for governments whose employees are provided with other pension benefits.
• Statement No. 74, Financial Reporting for Postemployment Benefit Plans Other Than Pension Plans. This statement establishes new accounting and financial reporting requirements for governments whose employees are provided with other postemployment benefits.
• Statement No. 77, Tax Abatement Disclosures. This statement requires governments to disclose certain information about entered into tax abatement agreements.
The following pronouncements will be evaluated for future implementation:
• As of the year ended June 30, 2017, GASB issued Statement No. 75, entitled, Accounting and Financial
Reporting for Postemployment Benefits Other Than Pensions; GASB Statement No. 71 entitled,
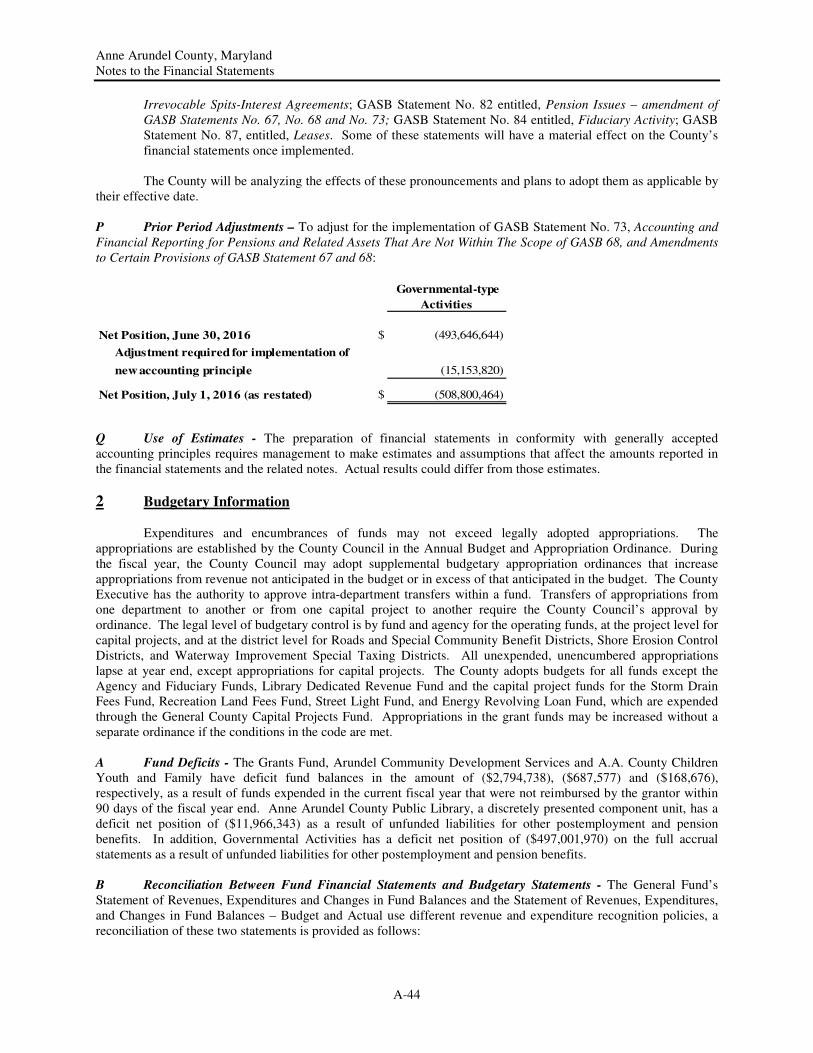
Anne Arundel County, Maryland Notes to the Financial Statements
A-44
Irrevocable Spits-Interest Agreements; GASB Statement No. 82 entitled, Pension Issues – amendment of
GASB Statements No. 67, No. 68 and No. 73; GASB Statement No. 84 entitled, Fiduciary Activity; GASB Statement No. 87, entitled, Leases. Some of these statements will have a material effect on the County’s financial statements once implemented.
The County will be analyzing the effects of these pronouncements and plans to adopt them as applicable by their effective date. P Prior Period Adjustments – To adjust for the implementation of GASB Statement No. 73, Accounting and
Financial Reporting for Pensions and Related Assets That Are Not Within The Scope of GASB 68, and Amendments
to Certain Provisions of GASB Statement 67 and 68:
Governmental-type
Activities
Net Position, June 30, 2016 $ (493,646,644)
Adjustment required for implementation of
new accounting principle (15,153,820)
Net Position, July 1, 2016 (as restated) $ (508,800,464)
Q Use of Estimates - The preparation of financial statements in conformity with generally accepted accounting principles requires management to make estimates and assumptions that affect the amounts reported in the financial statements and the related notes. Actual results could differ from those estimates.
2 Budgetary Information
Expenditures and encumbrances of funds may not exceed legally adopted appropriations. The appropriations are established by the County Council in the Annual Budget and Appropriation Ordinance. During the fiscal year, the County Council may adopt supplemental budgetary appropriation ordinances that increase appropriations from revenue not anticipated in the budget or in excess of that anticipated in the budget. The County Executive has the authority to approve intra-department transfers within a fund. Transfers of appropriations from one department to another or from one capital project to another require the County Council’s approval by ordinance. The legal level of budgetary control is by fund and agency for the operating funds, at the project level for capital projects, and at the district level for Roads and Special Community Benefit Districts, Shore Erosion Control Districts, and Waterway Improvement Special Taxing Districts. All unexpended, unencumbered appropriations lapse at year end, except appropriations for capital projects. The County adopts budgets for all funds except the Agency and Fiduciary Funds, Library Dedicated Revenue Fund and the capital project funds for the Storm Drain Fees Fund, Recreation Land Fees Fund, Street Light Fund, and Energy Revolving Loan Fund, which are expended through the General County Capital Projects Fund. Appropriations in the grant funds may be increased without a separate ordinance if the conditions in the code are met. A Fund Deficits - The Grants Fund, Arundel Community Development Services and A.A. County Children Youth and Family have deficit fund balances in the amount of ($2,794,738), ($687,577) and ($168,676), respectively, as a result of funds expended in the current fiscal year that were not reimbursed by the grantor within 90 days of the fiscal year end. Anne Arundel County Public Library, a discretely presented component unit, has a deficit net position of ($11,966,343) as a result of unfunded liabilities for other postemployment and pension benefits. In addition, Governmental Activities has a deficit net position of ($497,001,970) on the full accrual statements as a result of unfunded liabilities for other postemployment and pension benefits. B Reconciliation Between Fund Financial Statements and Budgetary Statements - The General Fund’s Statement of Revenues, Expenditures and Changes in Fund Balances and the Statement of Revenues, Expenditures, and Changes in Fund Balances – Budget and Actual use different revenue and expenditure recognition policies, a reconciliation of these two statements is provided as follows:
Anne Arundel County, Maryland Notes to the Financial Statements
A-45
General Fund
Revenue (under) over expenditures - budgetary basis $ 27,599,827
Net effect of encumbrances 742,633
Change in due to Central Garage and Transportation Fund (53,859)
Change in due to Self Insurance Fund (2,351,609)
Change in revenue reserve allocation 2,240,574
FMV interest adjustment (641,247)
Health Department encumbrance adjustment 236,110
Effects of Inmate Benefit Fund & Parking Garage Fund 29,807
Net inventory change 404,714
Change in fund balance - modified accrual basis $ 28,206,950
3 Cash and Investments The primary government pools available cash and centrally invests these funds to maximize earnings. The component units also pool available cash in this manner. Assets of the Anne Arundel County Pension and Retirement System (Retirement System) and the Anne Arundel Retiree Health Benefits Trust, which covers Other Post-Employment Benefits (OPEB), are held separately. Significant accounting policies related to cash and investments are included in Note 1C. A Policies – The primary government is authorized to invest available public money in obligations of the U.S. Government, its agencies and instrumentalities; repurchase agreements that are fully collateralized by direct U.S. Government obligations and U.S. Government agency and instrumentality obligations, including fixed rate Mortgage-Backed Securities; Bankers’ Acceptances; mutual funds that are registered with the Securities and Exchange Commission (SEC) under the Investment Company Act of 1940 (the Act), are operating in accordance with Rule 2A-7 of the Act, and have received the highest possible rating from at least one Nationally Recognized Statistical Rating Organization as designated by the SEC; Certificates of Deposit; and Commercial Paper. In addition, the primary government can participate in the local government investment pool authorized and maintained by the State of Maryland. The fair value of the position in the pool is the same as the value of the shares. Finally, the primary government is authorized to invest bond proceeds that are subject to arbitrage rebate requirements in State and local government obligations. The primary government, Board of Education, Community College, and Library all participate in the Maryland Local Government Investment Pool (MLGIP), which provides all local government units of the State a relatively safe investment vehicle for the short-term investment of funds. The State Legislature created MLGIP with the passage of Article 95 22G, of the Annotated Code of Maryland. The MLGIP, under the administrative control of the State Treasurer, is managed by PNC Capital Advisors, LLC. The pool is a 2a7 like pool, which is not registered with the Security and Exchange Commission (SEC), but generally operates in a manner consistent with the SEC’s rule 2a7 of the Investment Company Act of 1940 (Rule 2a7). The MLGIP, which maintains a $1 per share value, is designed to give local government units of the State an investment vehicle for short-term investment of funds. Legislation became effective during fiscal year 2015 that expanded the authorized investments for Self Insurance funds. In addition to the vehicles available for public money, the non-current portion of Self Insurance fund reserves may be invested in investment grade domestic corporate bonds, mutual funds, exchange traded funds, and taxable or tax-exempt municipal securities. Pooled cash is primarily used to purchase short-term investments. Policy requires that for repurchase agreement investments made by the County, the initial collateral securities underlying repurchase agreement investments have a market value of at least 102.0% of the cost of the repurchase agreement. The collateral is in the County’s name and held by an independent third party or at the Federal Reserve. When the collateral falls under 101.0% or is $100,000 less than the 102.0%, additional collateral is required to bring the total to the required level. At June 30, 2017, the collateral balance securing repurchase agreements was $109,750 short of the required 102.0%
Anne Arundel County, Maryland Notes to the Financial Statements
A-46
level. Additional collateral was requested by the custodian bank on the next business day and delivered by the broker on the following day, which eliminated the shortfall.
The Retirement System is authorized to invest in U.S. Government securities, insurance company general accounts, commercial paper, money market mutual funds, corporate bonds, common and international stocks, limited partnerships, absolute return funds, private equity, mortgage participations, and real estate. The Retirement System lends its securities to broker-dealers and other entities with a simultaneous agreement to return the collateral for the same securities in the future. Effective December 1, 2016, the Retirement System’s Lending Agent was Deutsche Bank AG. The previous Agent, State Street Bank and Trust, suspended lending activity for the Retirement System at the direction of the Board of Trustees as of May 31, 2016. Deutsche Bank AG lends securities for collateral in the form of cash or other securities of 102.0% for domestic securities and 105.0% for international. Cash collateral received by the Retirement System with respect to these transactions is invested in a separate, un-pooled account basis at the direction of the Board of Trustees in fully collateralized Repurchase Agreements.
At year end, the Retirement System had no credit risk exposure to borrowers, because the amount of
collateral held by the Retirement System was greater than the value of securities on loan. The market value of invested collateral held as of December 31, 2016 was $60,373,848. There were no securities held as collateral. The market value of securities on loan for the Retirement System as of December 31, 2016 was $59,084,503.
The Retirement System did not impose any restrictions during the year on the amount of the loans that the agent made on its behalf. Moreover, there were no losses during the year resulting from a default of the borrowers or agent. All security loans can be terminated on demand by either the Retirement System or the borrower. Cash collateral received was invested in Repurchase Agreements, which as of December 31, 2016 had a weighted average final maturity of 70.3 days. The interest rate risk is zero days, as assets and liabilities can be rate changed on a daily basis. The Anne Arundel Retiree Health Benefits Trust (OPEB Trust) is authorized to invest in large capitalized domestic equities, international equities, emerging international equities, core fixed income, and diversified fixed income. The OPEB Trust’s Board of Trustees has established an Investment Policy Statement (IPS) to set forth investment objectives, policies guidelines, monitoring and review procedures relating to the management and safekeeping of all assets of the OPEB Trusts. Policy allows the use of mutual/commingled funds as investment vehicles. B Balances and Custodial Credit Risk – As of June 30, 2017, the carrying amount of the primary government’s bank deposits was $1,085,144 and bank balances were $5,552,090. All bank balances were fully secured by Federal Deposit insurance or fully collateralized. The total money market fund balance was $122,230,760.
Cash balances of the Board of Education are fully secured by Federal Deposit insurance and collateral held in the Board’s name at the Federal Reserve Bank of Richmond. Deposits for Anne Arundel Community College are secured and properly protected. The cash balances of the other non-major component units are insured or collateralized except $474,000 for Tipton Airport, which as of June 30, 217, is not insured or collateralized. Money market fund balances for the Retirement System as of calendar year-end December 31, 2016 and OPEB Trust as of fiscal year-end June 30, 2017, were $53,645,660 and $3,403,368 respectively.
Custodial credit risk is the risk that the primary government will not be able to recover deposits in the event of the failure of a depository financial institution or will not be able to recover collateral securities that are in the possession of an outside party. Investment securities are exposed to custodial credit risk if the securities are uninsured, are not registered in the name of the primary government, and are held by either a counterparty or the counterparty’s trust department or agent, but not in the primary government’s name. The primary government’s Investment Policy requires that the Controller maintain a list of financial institutions authorized to provide investment services, including custodial services and collateral requirements. Internal procedures establish the methods for evaluating eligible institutions. Custodial credit risk for deposits is not addressed in the policy.
C Interest Rate Risk – Interest rate risk is the risk that changes in interest rates will adversely affect the value of an investment. The fair value of fixed income (debt) securities is affected by increases and declines in interest
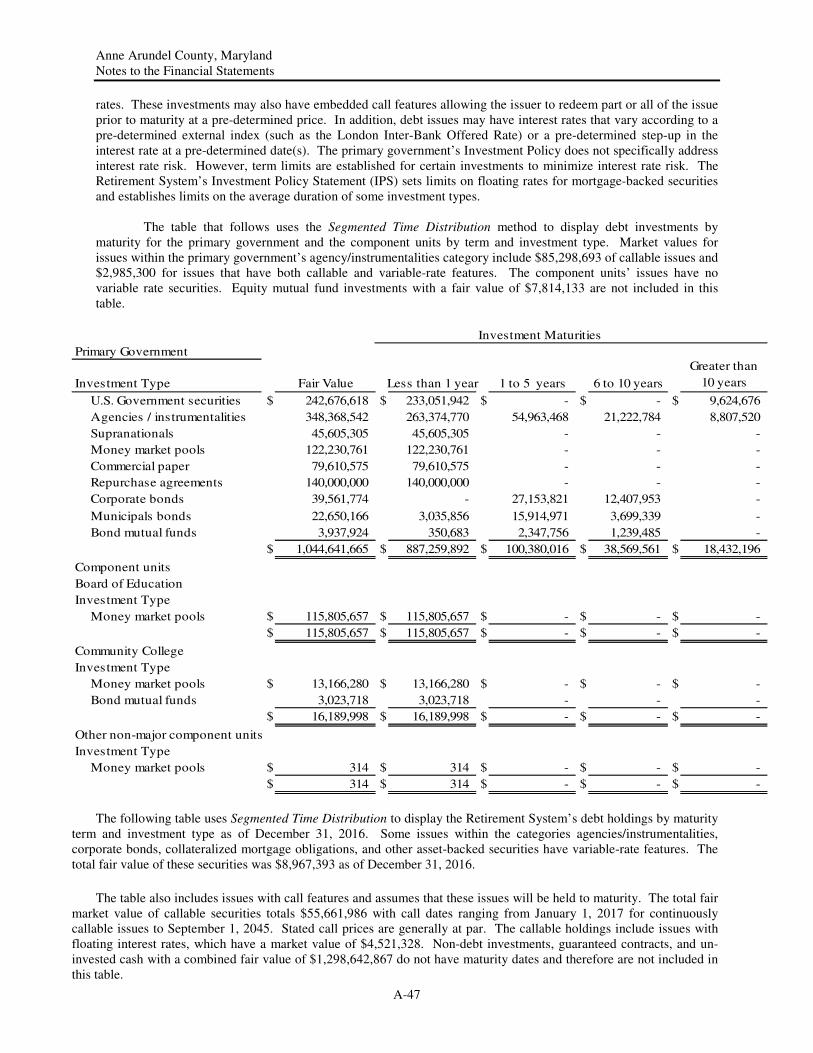
Anne Arundel County, Maryland Notes to the Financial Statements
A-47
rates. These investments may also have embedded call features allowing the issuer to redeem part or all of the issue prior to maturity at a pre-determined price. In addition, debt issues may have interest rates that vary according to a pre-determined external index (such as the London Inter-Bank Offered Rate) or a pre-determined step-up in the interest rate at a pre-determined date(s). The primary government’s Investment Policy does not specifically address interest rate risk. However, term limits are established for certain investments to minimize interest rate risk. The Retirement System’s Investment Policy Statement (IPS) sets limits on floating rates for mortgage-backed securities and establishes limits on the average duration of some investment types.
The table that follows uses the Segmented Time Distribution method to display debt investments by
maturity for the primary government and the component units by term and investment type. Market values for issues within the primary government’s agency/instrumentalities category include $85,298,693 of callable issues and $2,985,300 for issues that have both callable and variable-rate features. The component units’ issues have no variable rate securities. Equity mutual fund investments with a fair value of $7,814,133 are not included in this table.
Investment Maturities
Primary Government
Investment Type Fair Value Less than 1 year 1 to 5 years 6 to 10 years
Greater than
10 years
U.S. Government securities $ 242,676,618 $ 233,051,942 $ - $ - $ 9,624,676
Agencies / instrumentalities 348,368,542 263,374,770 54,963,468 21,222,784 8,807,520
Supranationals 45,605,305 45,605,305 - - -
Money market pools 122,230,761 122,230,761 - - -
Commercial paper 79,610,575 79,610,575 - - -
Repurchase agreements 140,000,000 140,000,000 - - -
Corporate bonds 39,561,774 - 27,153,821 12,407,953 -
Municipals bonds 22,650,166 3,035,856 15,914,971 3,699,339 -
Bond mutual funds 3,937,924 350,683 2,347,756 1,239,485 -
$ 1,044,641,665 $ 887,259,892 $ 100,380,016 $ 38,569,561 $ 18,432,196
Component units
Board of Education
Investment Type
Money market pools $ 115,805,657 $ 115,805,657 $ - $ - $ -
$ 115,805,657 $ 115,805,657 $ - $ - $ -
Community College
Investment Type
Money market pools $ 13,166,280 $ 13,166,280 $ - $ - $ -
Bond mutual funds 3,023,718 3,023,718 - - -
$ 16,189,998 $ 16,189,998 $ - $ - $ -
Other non-major component units
Investment Type
Money market pools $ 314 $ 314 $ - $ - $ -
$ 314 $ 314 $ - $ - $ -
The following table uses Segmented Time Distribution to display the Retirement System’s debt holdings by maturity term and investment type as of December 31, 2016. Some issues within the categories agencies/instrumentalities, corporate bonds, collateralized mortgage obligations, and other asset-backed securities have variable-rate features. The total fair value of these securities was $8,967,393 as of December 31, 2016.
The table also includes issues with call features and assumes that these issues will be held to maturity. The total fair market value of callable securities totals $55,661,986 with call dates ranging from January 1, 2017 for continuously callable issues to September 1, 2045. Stated call prices are generally at par. The callable holdings include issues with floating interest rates, which have a market value of $4,521,328. Non-debt investments, guaranteed contracts, and un-invested cash with a combined fair value of $1,298,642,867 do not have maturity dates and therefore are not included in this table.
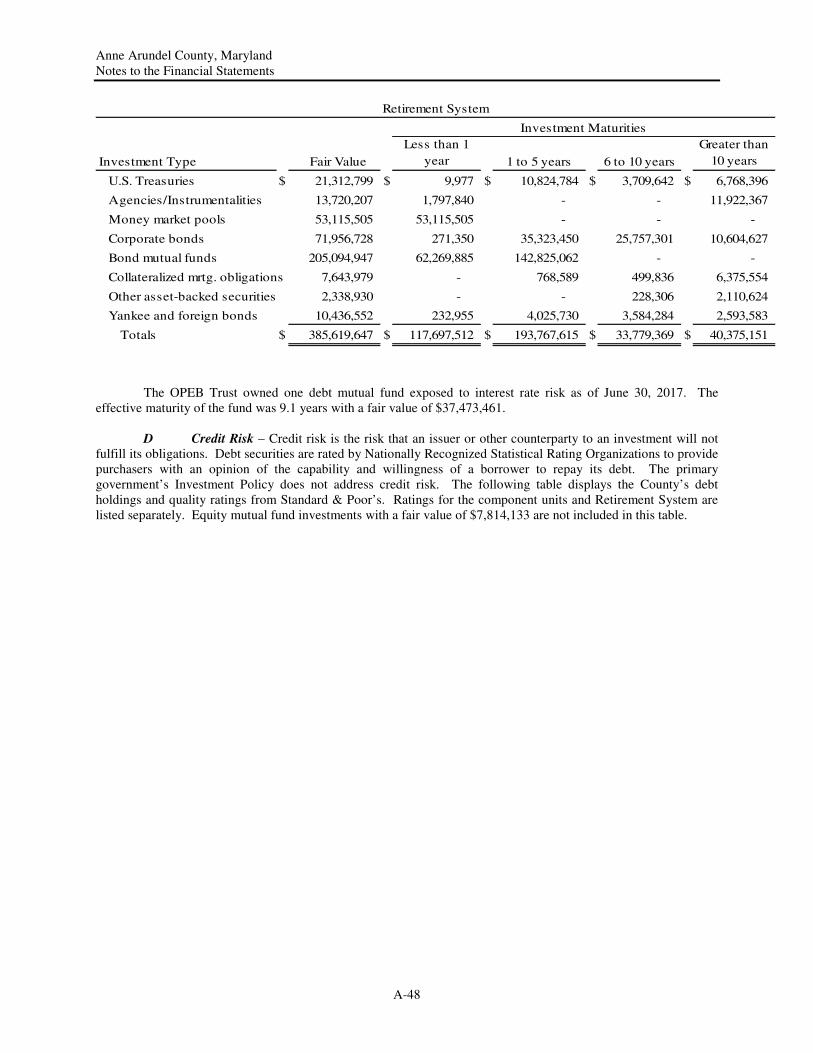
Anne Arundel County, Maryland Notes to the Financial Statements
A-48
Investment Type Fair Value
Less than 1
year 1 to 5 years 6 to 10 years
Greater than
10 years
U.S. Treasuries $ 21,312,799 $ 9,977 $ 10,824,784 $ 3,709,642 $ 6,768,396
Agencies/Instrumentalities 13,720,207 1,797,840 - - 11,922,367
Money market pools 53,115,505 53,115,505 - - -
Corporate bonds 71,956,728 271,350 35,323,450 25,757,301 10,604,627
Bond mutual funds 205,094,947 62,269,885 142,825,062 - -
Collateralized mrtg. obligations 7,643,979 - 768,589 499,836 6,375,554
Other asset-backed securities 2,338,930 - - 228,306 2,110,624
Yankee and foreign bonds 10,436,552 232,955 4,025,730 3,584,284 2,593,583
Totals $ 385,619,647 $ 117,697,512 $ 193,767,615 $ 33,779,369 $ 40,375,151
Investment Maturities
Retirement System
The OPEB Trust owned one debt mutual fund exposed to interest rate risk as of June 30, 2017. The effective maturity of the fund was 9.1 years with a fair value of $37,473,461.
D Credit Risk – Credit risk is the risk that an issuer or other counterparty to an investment will not fulfill its obligations. Debt securities are rated by Nationally Recognized Statistical Rating Organizations to provide purchasers with an opinion of the capability and willingness of a borrower to repay its debt. The primary government’s Investment Policy does not address credit risk. The following table displays the County’s debt holdings and quality ratings from Standard & Poor’s. Ratings for the component units and Retirement System are listed separately. Equity mutual fund investments with a fair value of $7,814,133 are not included in this table.
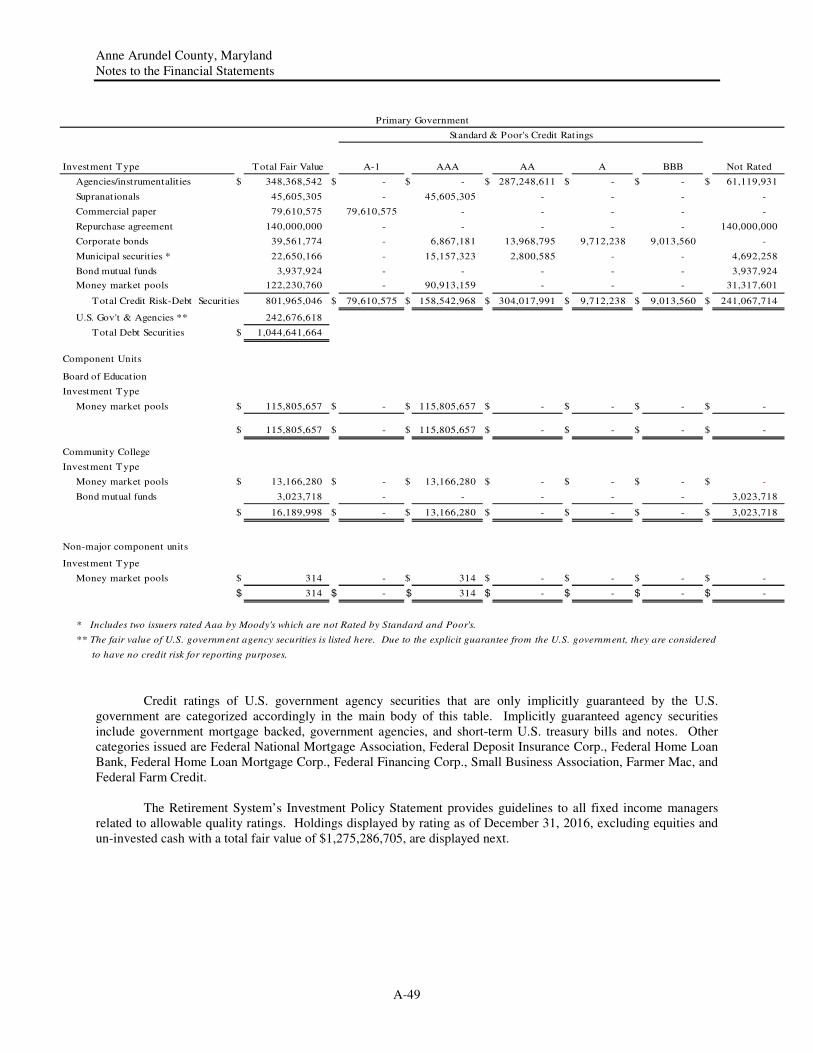
Anne Arundel County, Maryland Notes to the Financial Statements
A-49
Investment Type Total Fair Value A-1 AAA AA A BBB Not Rated
Agencies/instrumentalit ies $ 348,368,542 $ - $ - $ 287,248,611 $ - $ - $ 61,119,931
Supranationals 45,605,305 - 45,605,305 - - - -
Commercial paper 79,610,575 79,610,575 - - - - -
Repurchase agreement 140,000,000 - - - - - 140,000,000
Corporate bonds 39,561,774 - 6,867,181 13,968,795 9,712,238 9,013,560 -
Municipal securities * 22,650,166 - 15,157,323 2,800,585 - - 4,692,258
Bond mutual funds 3,937,924 - - - - - 3,937,924
Money market pools 122,230,760 - 90,913,159 - - - 31,317,601
Total Credit Risk-Debt Securit ies 801,965,046 $ 79,610,575 $ 158,542,968 $ 304,017,991 $ 9,712,238 $ 9,013,560 $ 241,067,714
U.S. Gov't & Agencies ** 242,676,618
Total Debt Securit ies $ 1,044,641,664
Component Units
Board of Education
Investment Type
Money market pools $ 115,805,657 $ - $ 115,805,657 $ - $ - $ - $ -
$ 115,805,657 $ - $ 115,805,657 $ - $ - $ - $ -
Community College
Investment Type
Money market pools $ 13,166,280 $ - $ 13,166,280 $ - $ - $ - $ -
Bond mutual funds 3,023,718 - - - - - 3,023,718
$ 16,189,998 $ - $ 13,166,280 $ - $ - $ - $ 3,023,718
Non-major component units
Investment Type
Money market pools $ 314 - $ 314 $ - $ - $ - $ -
$ 314 $ - $ 314 $ - $ - $ - $ -
* Includes two issuers rated Aaa by Moody's which are not Rated by Standard and Poor's.
** The fair value of U.S. government agency securities is listed here. Due to the explicit guarantee from the U.S. government, they are considered
to have no credit risk for reporting purposes.
Standard & Poor's Credit Ratings
Primary Government
Credit ratings of U.S. government agency securities that are only implicitly guaranteed by the U.S. government are categorized accordingly in the main body of this table. Implicitly guaranteed agency securities include government mortgage backed, government agencies, and short-term U.S. treasury bills and notes. Other categories issued are Federal National Mortgage Association, Federal Deposit Insurance Corp., Federal Home Loan Bank, Federal Home Loan Mortgage Corp., Federal Financing Corp., Small Business Association, Farmer Mac, and Federal Farm Credit.
The Retirement System’s Investment Policy Statement provides guidelines to all fixed income managers
related to allowable quality ratings. Holdings displayed by rating as of December 31, 2016, excluding equities and un-invested cash with a total fair value of $1,275,286,705, are displayed next.
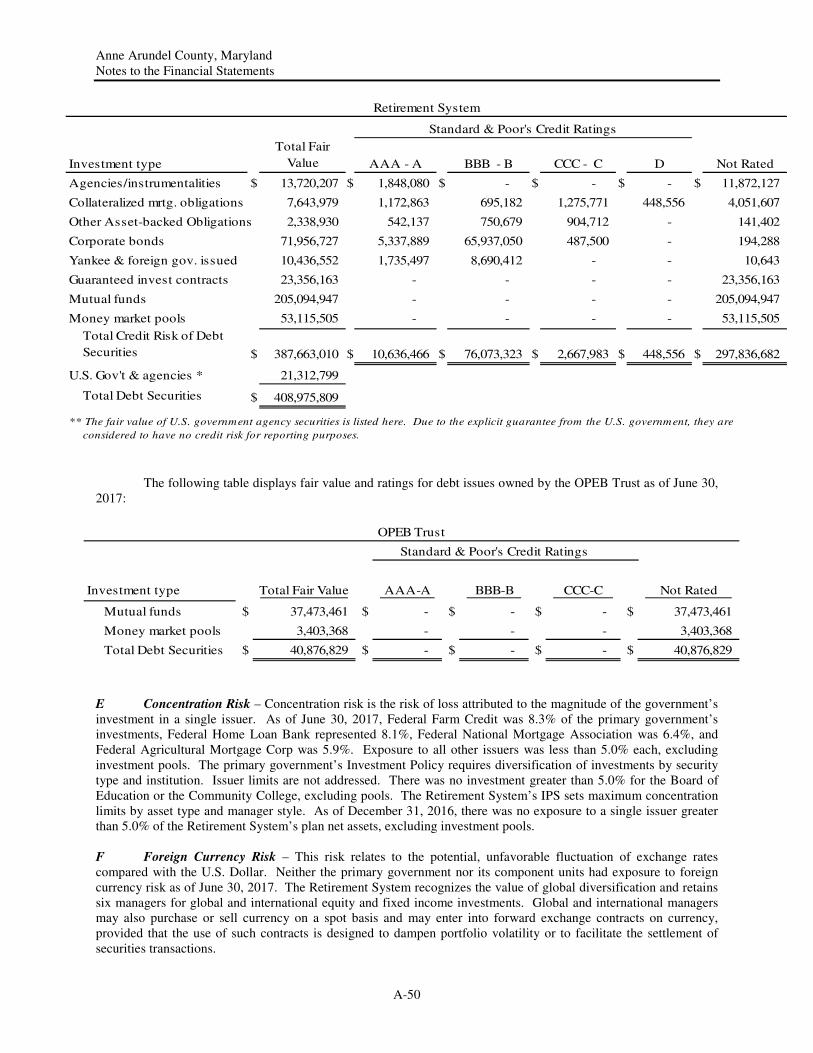
Anne Arundel County, Maryland Notes to the Financial Statements
A-50
Investment type
Total Fair
Value AAA - A BBB - B CCC - C D Not Rated
Agencies/instrumentalities $ 13,720,207 $ 1,848,080 $ - $ - $ - $ 11,872,127
Collateralized mrtg. obligations 7,643,979 1,172,863 695,182 1,275,771 448,556 4,051,607
Other Asset-backed Obligations 2,338,930 542,137 750,679 904,712 - 141,402
Corporate bonds 71,956,727 5,337,889 65,937,050 487,500 - 194,288
Yankee & foreign gov. issued 10,436,552 1,735,497 8,690,412 - - 10,643
Guaranteed invest contracts 23,356,163 - - - - 23,356,163
Mutual funds 205,094,947 - - - - 205,094,947
Money market pools 53,115,505 - - - - 53,115,505
Total Credit Risk of Debt
Securities $ 387,663,010 $ 10,636,466 $ 76,073,323 $ 2,667,983 $ 448,556 $ 297,836,682
U.S. Gov't & agencies * 21,312,799
Total Debt Securities $ 408,975,809
** The fair value of U.S. government agency securities is listed here. Due to the explicit guarantee from the U.S. government, they are
considered to have no credit risk for reporting purposes.
Retirement System
Standard & Poor's Credit Ratings
The following table displays fair value and ratings for debt issues owned by the OPEB Trust as of June 30, 2017:
Standard & Poor's Credit Ratings
Investment type Total Fair Value AAA-A BBB-B CCC-C Not Rated
Mutual funds $ 37,473,461 $ - $ - $ - $ 37,473,461
Money market pools 3,403,368 - - - 3,403,368
Total Debt Securities $ 40,876,829 $ - $ - $ - $ 40,876,829
OPEB Trust
E Concentration Risk – Concentration risk is the risk of loss attributed to the magnitude of the government’s investment in a single issuer. As of June 30, 2017, Federal Farm Credit was 8.3% of the primary government’s investments, Federal Home Loan Bank represented 8.1%, Federal National Mortgage Association was 6.4%, and Federal Agricultural Mortgage Corp was 5.9%. Exposure to all other issuers was less than 5.0% each, excluding investment pools. The primary government’s Investment Policy requires diversification of investments by security type and institution. Issuer limits are not addressed. There was no investment greater than 5.0% for the Board of Education or the Community College, excluding pools. The Retirement System’s IPS sets maximum concentration limits by asset type and manager style. As of December 31, 2016, there was no exposure to a single issuer greater than 5.0% of the Retirement System’s plan net assets, excluding investment pools. F Foreign Currency Risk – This risk relates to the potential, unfavorable fluctuation of exchange rates compared with the U.S. Dollar. Neither the primary government nor its component units had exposure to foreign currency risk as of June 30, 2017. The Retirement System recognizes the value of global diversification and retains six managers for global and international equity and fixed income investments. Global and international managers may also purchase or sell currency on a spot basis and may enter into forward exchange contracts on currency, provided that the use of such contracts is designed to dampen portfolio volatility or to facilitate the settlement of securities transactions.
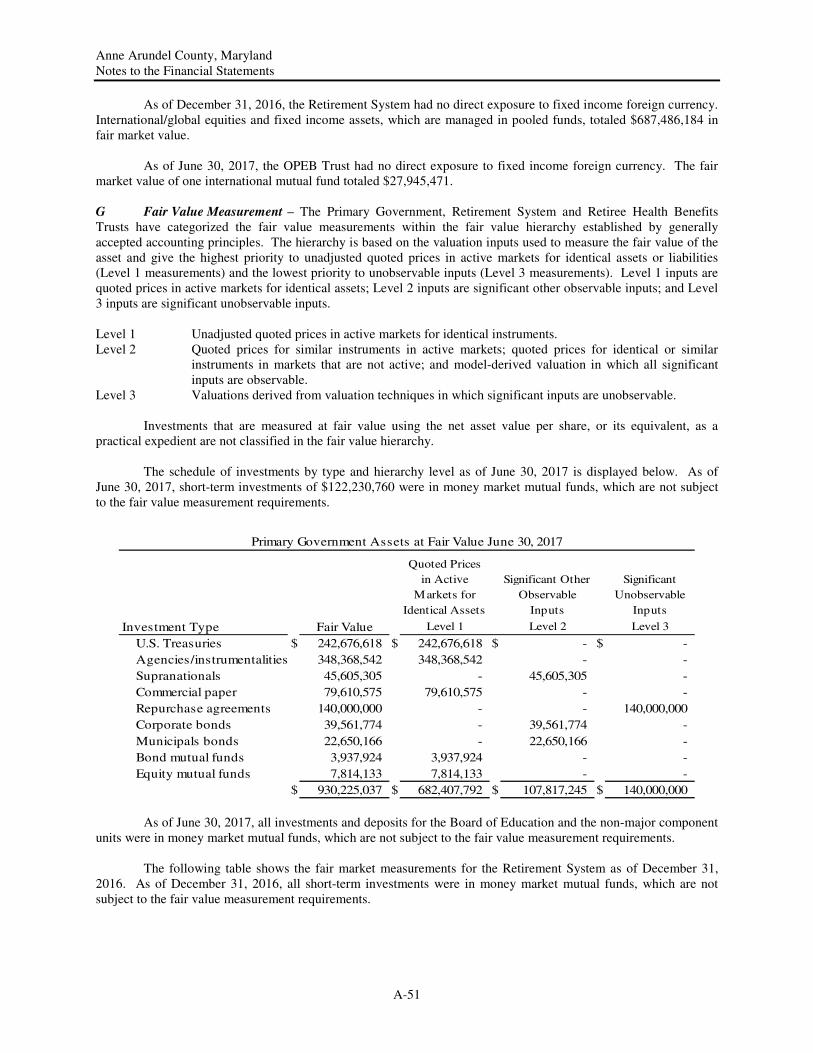
Anne Arundel County, Maryland Notes to the Financial Statements
A-51
As of December 31, 2016, the Retirement System had no direct exposure to fixed income foreign currency. International/global equities and fixed income assets, which are managed in pooled funds, totaled $687,486,184 in fair market value.
As of June 30, 2017, the OPEB Trust had no direct exposure to fixed income foreign currency. The fair market value of one international mutual fund totaled $27,945,471. G Fair Value Measurement – The Primary Government, Retirement System and Retiree Health Benefits Trusts have categorized the fair value measurements within the fair value hierarchy established by generally accepted accounting principles. The hierarchy is based on the valuation inputs used to measure the fair value of the asset and give the highest priority to unadjusted quoted prices in active markets for identical assets or liabilities (Level 1 measurements) and the lowest priority to unobservable inputs (Level 3 measurements). Level 1 inputs are quoted prices in active markets for identical assets; Level 2 inputs are significant other observable inputs; and Level 3 inputs are significant unobservable inputs. Level 1 Unadjusted quoted prices in active markets for identical instruments. Level 2 Quoted prices for similar instruments in active markets; quoted prices for identical or similar
instruments in markets that are not active; and model-derived valuation in which all significant inputs are observable.
Level 3 Valuations derived from valuation techniques in which significant inputs are unobservable.
Investments that are measured at fair value using the net asset value per share, or its equivalent, as a practical expedient are not classified in the fair value hierarchy.
The schedule of investments by type and hierarchy level as of June 30, 2017 is displayed below. As of June 30, 2017, short-term investments of $122,230,760 were in money market mutual funds, which are not subject to the fair value measurement requirements.
Quoted Prices
in Active
Markets for
Identical Assets
Significant Other
Observable
Inputs
Significant
Unobservable
Inputs
Investment Type Fair Value Level 1 Level 2 Level 3
U.S. Treasuries $ 242,676,618 $ 242,676,618 $ - $ -
Agencies/instrumentalities 348,368,542 348,368,542 - -
Supranationals 45,605,305 - 45,605,305 -
Commercial paper 79,610,575 79,610,575 - -
Repurchase agreements 140,000,000 - - 140,000,000
Corporate bonds 39,561,774 - 39,561,774 -
Municipals bonds 22,650,166 - 22,650,166 -
Bond mutual funds 3,937,924 3,937,924 - -
Equity mutual funds 7,814,133 7,814,133 - -
$ 930,225,037 $ 682,407,792 $ 107,817,245 $ 140,000,000
Primary Government Assets at Fair Value June 30, 2017
As of June 30, 2017, all investments and deposits for the Board of Education and the non-major component units were in money market mutual funds, which are not subject to the fair value measurement requirements. The following table shows the fair market measurements for the Retirement System as of December 31, 2016. As of December 31, 2016, all short-term investments were in money market mutual funds, which are not subject to the fair value measurement requirements.
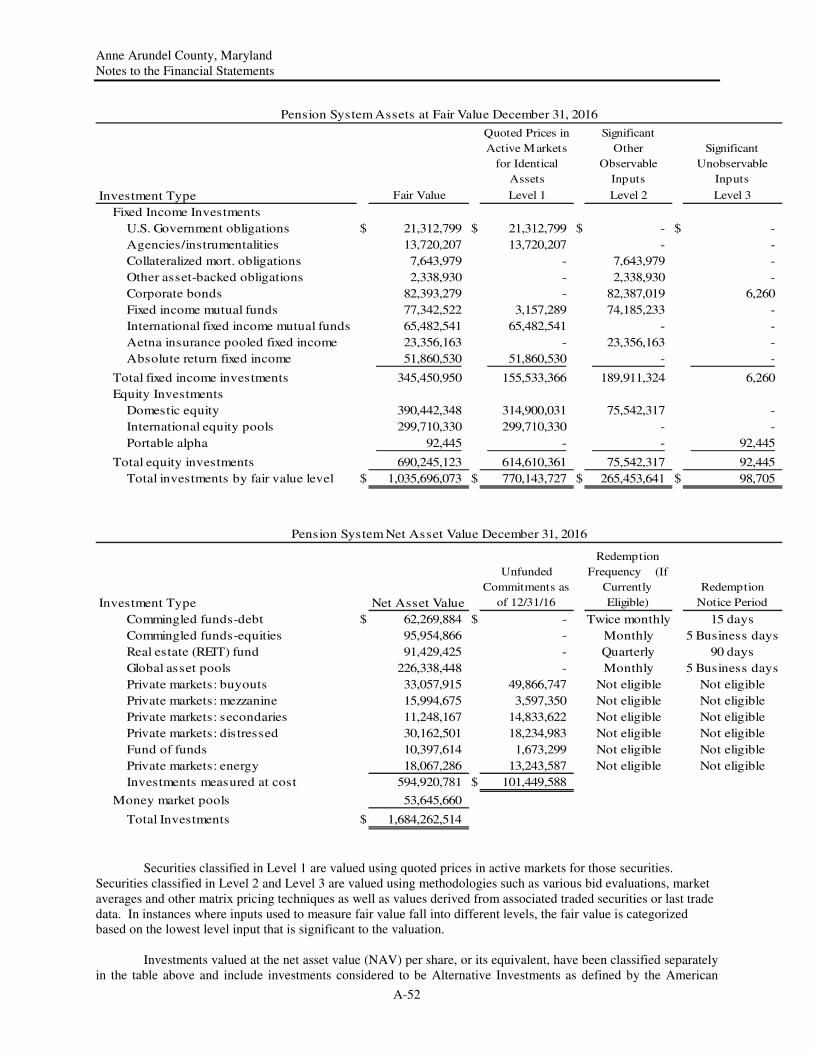
Anne Arundel County, Maryland Notes to the Financial Statements
A-52
Quoted Prices in
Active Markets
for Identical
Assets
Significant
Other
Observable
Inputs
Significant
Unobservable
Inputs
Investment Type Fair Value Level 1 Level 2 Level 3
Fixed Income Investments
U.S. Government obligations $ 21,312,799 $ 21,312,799 $ - $ -
Agencies/instrumentalities 13,720,207 13,720,207 - -
Collateralized mort. obligations 7,643,979 - 7,643,979 -
Other asset-backed obligations 2,338,930 - 2,338,930 -
Corporate bonds 82,393,279 - 82,387,019 6,260
Fixed income mutual funds 77,342,522 3,157,289 74,185,233 -
International fixed income mutual funds 65,482,541 65,482,541 - -
Aetna insurance pooled fixed income 23,356,163 - 23,356,163 -
Absolute return fixed income 51,860,530 51,860,530 - -
Total fixed income investments 345,450,950 155,533,366 189,911,324 6,260
Equity Investments
Domestic equity 390,442,348 314,900,031 75,542,317 -
International equity pools 299,710,330 299,710,330 - -
Portable alpha 92,445 - - 92,445
Total equity investments 690,245,123 614,610,361 75,542,317 92,445
Total investments by fair value level $ 1,035,696,073 $ 770,143,727 $ 265,453,641 $ 98,705
Investment Type Net Asset Value
Unfunded
Commitments as
of 12/31/16
Redemption
Frequency (If
Currently
Eligible)
Redemption
Notice Period
Commingled funds-debt $ 62,269,884 $ - Twice monthly 15 days
Commingled funds-equities 95,954,866 - Monthly 5 Business days
Real estate (REIT) fund 91,429,425 - Quarterly 90 days
Global asset pools 226,338,448 - Monthly 5 Business days
Private markets: buyouts 33,057,915 49,866,747 Not eligible Not eligible
Private markets: mezzanine 15,994,675 3,597,350 Not eligible Not eligible
Private markets: secondaries 11,248,167 14,833,622 Not eligible Not eligible
Private markets: distressed 30,162,501 18,234,983 Not eligible Not eligible
Fund of funds 10,397,614 1,673,299 Not eligible Not eligible
Private markets: energy 18,067,286 13,243,587 Not eligible Not eligible
Investments measured at cost 594,920,781 $ 101,449,588
Money market pools 53,645,660
Total Investments $ 1,684,262,514
Pension System Assets at Fair Value December 31, 2016
Pension System Net Asset Value December 31, 2016
Securities classified in Level 1 are valued using quoted prices in active markets for those securities. Securities classified in Level 2 and Level 3 are valued using methodologies such as various bid evaluations, market averages and other matrix pricing techniques as well as values derived from associated traded securities or last trade data. In instances where inputs used to measure fair value fall into different levels, the fair value is categorized based on the lowest level input that is significant to the valuation. Investments valued at the net asset value (NAV) per share, or its equivalent, have been classified separately in the table above and include investments considered to be Alternative Investments as defined by the American
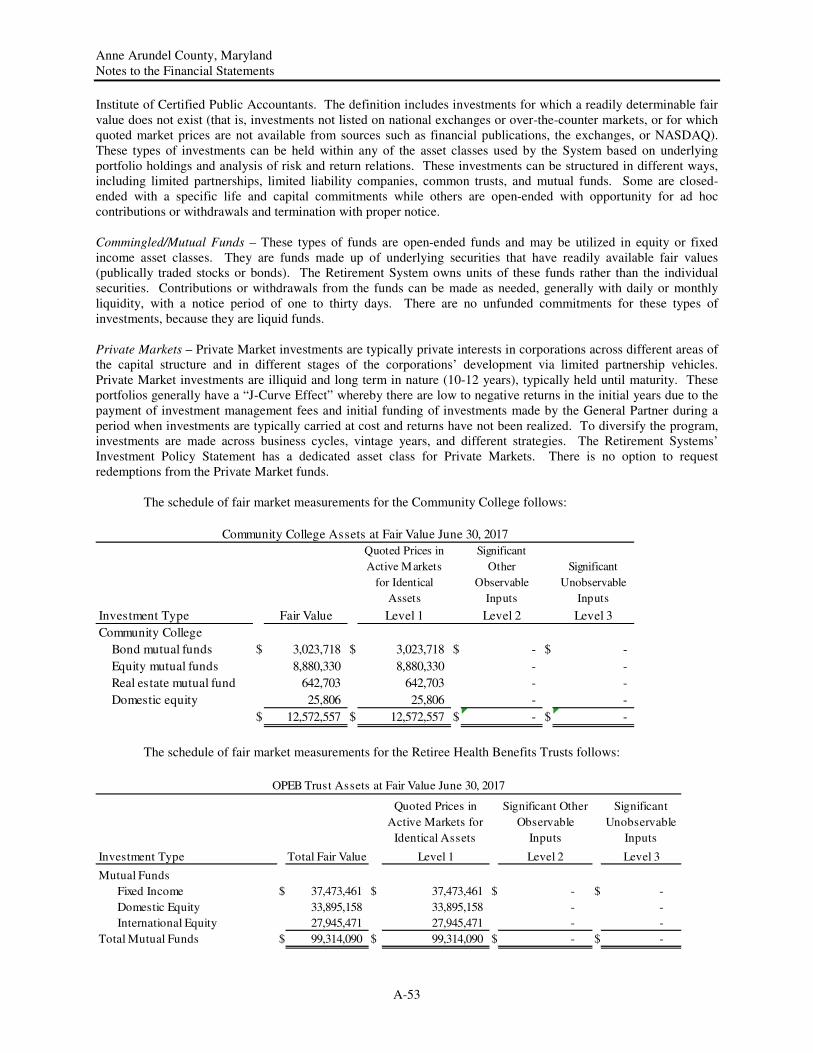
Anne Arundel County, Maryland Notes to the Financial Statements
A-53
Institute of Certified Public Accountants. The definition includes investments for which a readily determinable fair value does not exist (that is, investments not listed on national exchanges or over-the-counter markets, or for which quoted market prices are not available from sources such as financial publications, the exchanges, or NASDAQ). These types of investments can be held within any of the asset classes used by the System based on underlying portfolio holdings and analysis of risk and return relations. These investments can be structured in different ways, including limited partnerships, limited liability companies, common trusts, and mutual funds. Some are closed-ended with a specific life and capital commitments while others are open-ended with opportunity for ad hoc contributions or withdrawals and termination with proper notice. Commingled/Mutual Funds – These types of funds are open-ended funds and may be utilized in equity or fixed income asset classes. They are funds made up of underlying securities that have readily available fair values (publically traded stocks or bonds). The Retirement System owns units of these funds rather than the individual securities. Contributions or withdrawals from the funds can be made as needed, generally with daily or monthly liquidity, with a notice period of one to thirty days. There are no unfunded commitments for these types of investments, because they are liquid funds. Private Markets – Private Market investments are typically private interests in corporations across different areas of the capital structure and in different stages of the corporations’ development via limited partnership vehicles. Private Market investments are illiquid and long term in nature (10-12 years), typically held until maturity. These portfolios generally have a “J-Curve Effect” whereby there are low to negative returns in the initial years due to the payment of investment management fees and initial funding of investments made by the General Partner during a period when investments are typically carried at cost and returns have not been realized. To diversify the program, investments are made across business cycles, vintage years, and different strategies. The Retirement Systems’ Investment Policy Statement has a dedicated asset class for Private Markets. There is no option to request redemptions from the Private Market funds. The schedule of fair market measurements for the Community College follows:
Quoted Prices in
Active Markets
for Identical
Assets
Significant
Other
Observable
Inputs
Significant
Unobservable
Inputs
Investment Type Fair Value Level 1 Level 2 Level 3
Community College
Bond mutual funds $ 3,023,718 $ 3,023,718 $ - $ -
Equity mutual funds 8,880,330 8,880,330 - -
Real estate mutual fund 642,703 642,703 - -
Domestic equity 25,806 25,806 - -
$ 12,572,557 $ 12,572,557 $ - $ -
Community College Assets at Fair Value June 30, 2017
The schedule of fair market measurements for the Retiree Health Benefits Trusts follows:
Quoted Prices in
Active Markets for
Identical Assets
Significant Other
Observable
Inputs
Significant
Unobservable
Inputs
Investment Type Total Fair Value Level 1 Level 2 Level 3
Mutual Funds
Fixed Income $ 37,473,461 $ 37,473,461 $ - $ -
Domestic Equity 33,895,158 33,895,158 - -
International Equity 27,945,471 27,945,471 - -
Total Mutual Funds $ 99,314,090 $ 99,314,090 $ - $ -
OPEB Trust Assets at Fair Value June 30, 2017
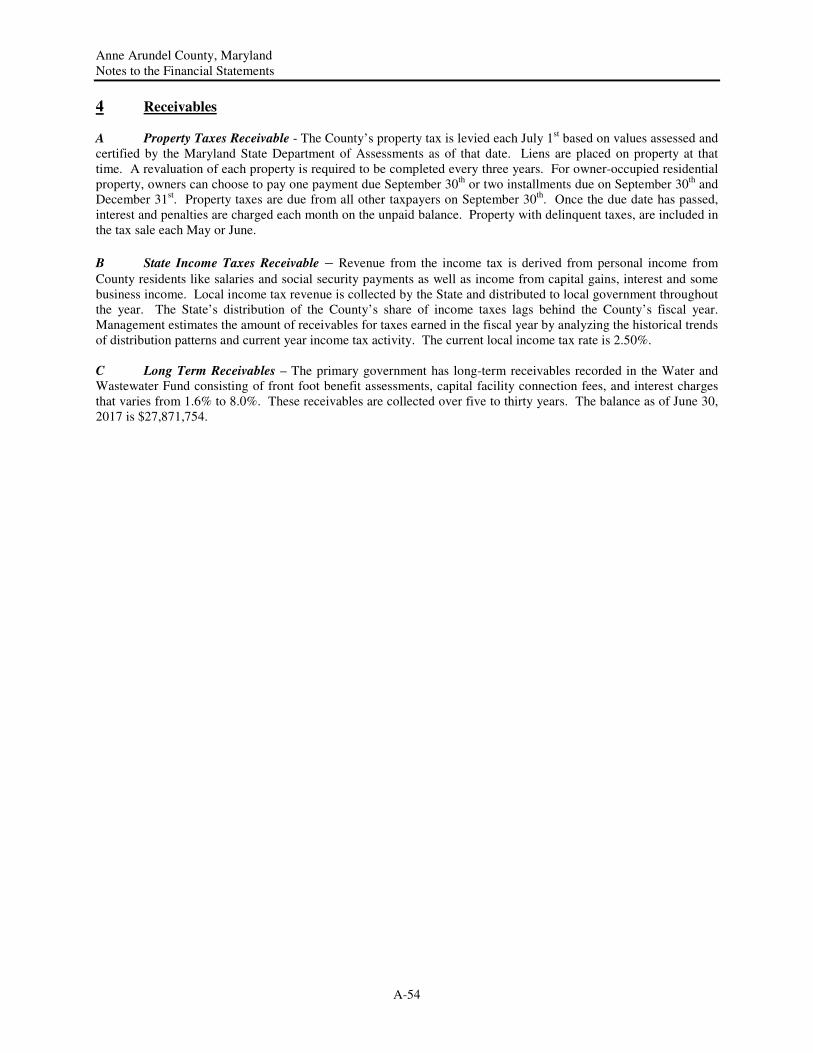
Anne Arundel County, Maryland Notes to the Financial Statements
A-54
4 Receivables A Property Taxes Receivable - The County’s property tax is levied each July 1st based on values assessed and certified by the Maryland State Department of Assessments as of that date. Liens are placed on property at that time. A revaluation of each property is required to be completed every three years. For owner-occupied residential property, owners can choose to pay one payment due September 30th or two installments due on September 30th and December 31st. Property taxes are due from all other taxpayers on September 30th. Once the due date has passed, interest and penalties are charged each month on the unpaid balance. Property with delinquent taxes, are included in the tax sale each May or June.
B State Income Taxes Receivable – Revenue from the income tax is derived from personal income from
County residents like salaries and social security payments as well as income from capital gains, interest and some business income. Local income tax revenue is collected by the State and distributed to local government throughout the year. The State’s distribution of the County’s share of income taxes lags behind the County’s fiscal year. Management estimates the amount of receivables for taxes earned in the fiscal year by analyzing the historical trends of distribution patterns and current year income tax activity. The current local income tax rate is 2.50%. C Long Term Receivables – The primary government has long-term receivables recorded in the Water and Wastewater Fund consisting of front foot benefit assessments, capital facility connection fees, and interest charges that varies from 1.6% to 8.0%. These receivables are collected over five to thirty years. The balance as of June 30, 2017 is $27,871,754.
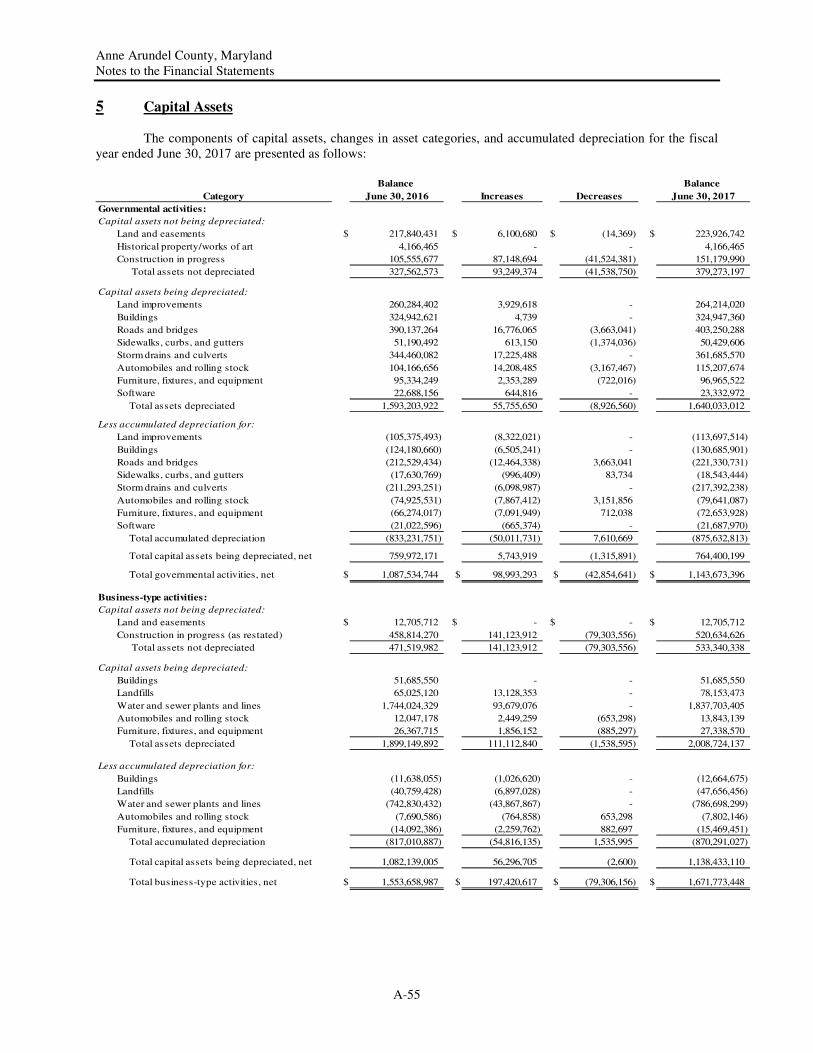
Anne Arundel County, Maryland Notes to the Financial Statements
A-55
5 Capital Assets
The components of capital assets, changes in asset categories, and accumulated depreciation for the fiscal year ended June 30, 2017 are presented as follows:
Balance Balance
Category June 30, 2016 Increases Decreases June 30, 2017
Governmental activities:
Capital assets not being depreciated:
Land and easements $ 217,840,431 $ 6,100,680 $ (14,369) $ 223,926,742
Historical property/works of art 4,166,465 - - 4,166,465
Construction in progress 105,555,677 87,148,694 (41,524,381) 151,179,990
Total assets not depreciated 327,562,573 93,249,374 (41,538,750) 379,273,197
Capital assets being depreciated:
Land improvements 260,284,402 3,929,618 - 264,214,020
Buildings 324,942,621 4,739 - 324,947,360
Roads and bridges 390,137,264 16,776,065 (3,663,041) 403,250,288
Sidewalks, curbs, and gutters 51,190,492 613,150 (1,374,036) 50,429,606
Storm drains and culverts 344,460,082 17,225,488 - 361,685,570
Automobiles and rolling stock 104,166,656 14,208,485 (3,167,467) 115,207,674
Furniture, fixtures, and equipment 95,334,249 2,353,289 (722,016) 96,965,522
Software 22,688,156 644,816 - 23,332,972
Total assets depreciated 1,593,203,922 55,755,650 (8,926,560) 1,640,033,012
Less accumulated depreciation for:
Land improvements (105,375,493) (8,322,021) - (113,697,514)
Buildings (124,180,660) (6,505,241) - (130,685,901)
Roads and bridges (212,529,434) (12,464,338) 3,663,041 (221,330,731)
Sidewalks, curbs, and gutters (17,630,769) (996,409) 83,734 (18,543,444)
Storm drains and culverts (211,293,251) (6,098,987) - (217,392,238)
Automobiles and rolling stock (74,925,531) (7,867,412) 3,151,856 (79,641,087)
Furniture, fixtures, and equipment (66,274,017) (7,091,949) 712,038 (72,653,928)
Software (21,022,596) (665,374) - (21,687,970)
Total accumulated depreciation (833,231,751) (50,011,731) 7,610,669 (875,632,813)
Total capital assets being depreciated, net 759,972,171 5,743,919 (1,315,891) 764,400,199
Total governmental activities, net $ 1,087,534,744 $ 98,993,293 $ (42,854,641) $ 1,143,673,396
Business-type activities:
Capital assets not being depreciated:
Land and easements $ 12,705,712 $ - $ - $ 12,705,712
Construction in progress (as restated) 458,814,270 141,123,912 (79,303,556) 520,634,626
Total assets not depreciated 471,519,982 141,123,912 (79,303,556) 533,340,338
Capital assets being depreciated:
Buildings 51,685,550 - - 51,685,550
Landfills 65,025,120 13,128,353 - 78,153,473
Water and sewer plants and lines 1,744,024,329 93,679,076 - 1,837,703,405
Automobiles and rolling stock 12,047,178 2,449,259 (653,298) 13,843,139
Furniture, fixtures, and equipment 26,367,715 1,856,152 (885,297) 27,338,570
Total assets depreciated 1,899,149,892 111,112,840 (1,538,595) 2,008,724,137
Less accumulated depreciation for:
Buildings (11,638,055) (1,026,620) - (12,664,675)
Landfills (40,759,428) (6,897,028) - (47,656,456)
Water and sewer plants and lines (742,830,432) (43,867,867) - (786,698,299)
Automobiles and rolling stock (7,690,586) (764,858) 653,298 (7,802,146)
Furniture, fixtures, and equipment (14,092,386) (2,259,762) 882,697 (15,469,451)
Total accumulated depreciation (817,010,887) (54,816,135) 1,535,995 (870,291,027)
Total capital assets being depreciated, net 1,082,139,005 56,296,705 (2,600) 1,138,433,110
Total business-type activities, net $ 1,553,658,987 $ 197,420,617 $ (79,306,156) $ 1,671,773,448
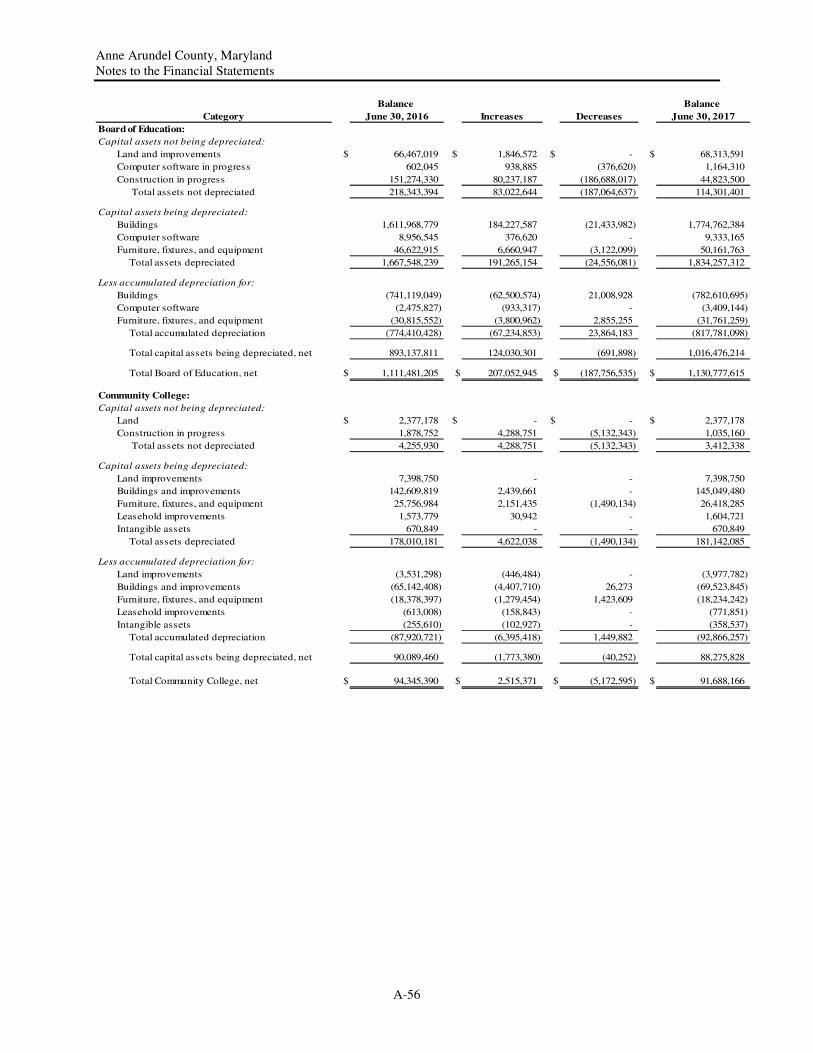
Anne Arundel County, Maryland Notes to the Financial Statements
A-56
Balance Balance
Category June 30, 2016 Increases Decreases June 30, 2017
Board of Education:
Capital assets not being depreciated:
Land and improvements $ 66,467,019 $ 1,846,572 $ - $ 68,313,591
Computer software in progress 602,045 938,885 (376,620) 1,164,310
Construction in progress 151,274,330 80,237,187 (186,688,017) 44,823,500
Total assets not depreciated 218,343,394 83,022,644 (187,064,637) 114,301,401
Capital assets being depreciated:
Buildings 1,611,968,779 184,227,587 (21,433,982) 1,774,762,384
Computer software 8,956,545 376,620 - 9,333,165
Furniture, fixtures, and equipment 46,622,915 6,660,947 (3,122,099) 50,161,763
Total assets depreciated 1,667,548,239 191,265,154 (24,556,081) 1,834,257,312
Less accumulated depreciation for:
Buildings (741,119,049) (62,500,574) 21,008,928 (782,610,695)
Computer software (2,475,827) (933,317) - (3,409,144)
Furniture, fixtures, and equipment (30,815,552) (3,800,962) 2,855,255 (31,761,259)
Total accumulated depreciation (774,410,428) (67,234,853) 23,864,183 (817,781,098)
Total capital assets being depreciated, net 893,137,811 124,030,301 (691,898) 1,016,476,214
Total Board of Education, net $ 1,111,481,205 $ 207,052,945 $ (187,756,535) $ 1,130,777,615
Community College:
Capital assets not being depreciated:
Land $ 2,377,178 $ - $ - $ 2,377,178
Construction in progress 1,878,752 4,288,751 (5,132,343) 1,035,160
Total assets not depreciated 4,255,930 4,288,751 (5,132,343) 3,412,338
Capital assets being depreciated:
Land improvements 7,398,750 - - 7,398,750
Buildings and improvements 142,609,819 2,439,661 - 145,049,480
Furniture, fixtures, and equipment 25,756,984 2,151,435 (1,490,134) 26,418,285
Leasehold improvements 1,573,779 30,942 - 1,604,721
Intangible assets 670,849 - - 670,849
Total assets depreciated 178,010,181 4,622,038 (1,490,134) 181,142,085
Less accumulated depreciation for:
Land improvements (3,531,298) (446,484) - (3,977,782)
Buildings and improvements (65,142,408) (4,407,710) 26,273 (69,523,845)
Furniture, fixtures, and equipment (18,378,397) (1,279,454) 1,423,609 (18,234,242)
Leasehold improvements (613,008) (158,843) - (771,851)
Intangible assets (255,610) (102,927) - (358,537)
Total accumulated depreciation (87,920,721) (6,395,418) 1,449,882 (92,866,257)
Total capital assets being depreciated, net 90,089,460 (1,773,380) (40,252) 88,275,828
Total Community College, net $ 94,345,390 $ 2,515,371 $ (5,172,595) $ 91,688,166
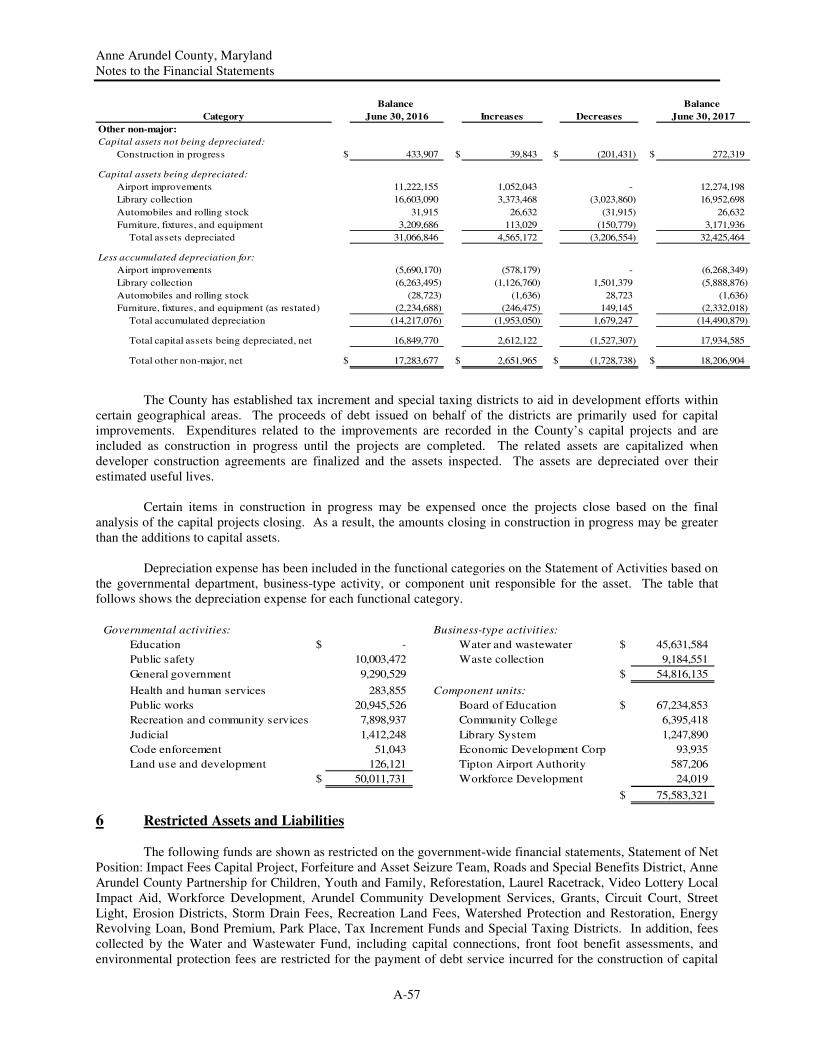
Anne Arundel County, Maryland Notes to the Financial Statements
A-57
Balance Balance
Category June 30, 2016 Increases Decreases June 30, 2017
Other non-major:
Capital assets not being depreciated:
Construction in progress $ 433,907 $ 39,843 $ (201,431) $ 272,319
Capital assets being depreciated:
Airport improvements 11,222,155 1,052,043 - 12,274,198
Library collection 16,603,090 3,373,468 (3,023,860) 16,952,698
Automobiles and rolling stock 31,915 26,632 (31,915) 26,632
Furniture, fixtures, and equipment 3,209,686 113,029 (150,779) 3,171,936
Total assets depreciated 31,066,846 4,565,172 (3,206,554) 32,425,464
Less accumulated depreciation for:
Airport improvements (5,690,170) (578,179) - (6,268,349)
Library collection (6,263,495) (1,126,760) 1,501,379 (5,888,876)
Automobiles and rolling stock (28,723) (1,636) 28,723 (1,636)
Furniture, fixtures, and equipment (as restated) (2,234,688) (246,475) 149,145 (2,332,018)
Total accumulated depreciation (14,217,076) (1,953,050) 1,679,247 (14,490,879)
Total capital assets being depreciated, net 16,849,770 2,612,122 (1,527,307) 17,934,585
Total other non-major, net $ 17,283,677 $ 2,651,965 $ (1,728,738) $ 18,206,904
The County has established tax increment and special taxing districts to aid in development efforts within certain geographical areas. The proceeds of debt issued on behalf of the districts are primarily used for capital improvements. Expenditures related to the improvements are recorded in the County’s capital projects and are included as construction in progress until the projects are completed. The related assets are capitalized when developer construction agreements are finalized and the assets inspected. The assets are depreciated over their estimated useful lives. Certain items in construction in progress may be expensed once the projects close based on the final analysis of the capital projects closing. As a result, the amounts closing in construction in progress may be greater than the additions to capital assets. Depreciation expense has been included in the functional categories on the Statement of Activities based on the governmental department, business-type activity, or component unit responsible for the asset. The table that follows shows the depreciation expense for each functional category.
Governmental activities: Business-type activities:
Education $ - Water and wastewater $ 45,631,584
Public safety 10,003,472 Waste collection 9,184,551
General government 9,290,529 $ 54,816,135
Health and human services 283,855 Component units:
Public works 20,945,526 Board of Education $ 67,234,853
Recreation and community services 7,898,937 Community College 6,395,418
Judicial 1,412,248 Library System 1,247,890
Code enforcement 51,043 Economic Development Corp 93,935
Land use and development 126,121 Tipton Airport Authority 587,206
$ 50,011,731 Workforce Development 24,019
$ 75,583,321
6 Restricted Assets and Liabilities The following funds are shown as restricted on the government-wide financial statements, Statement of Net Position: Impact Fees Capital Project, Forfeiture and Asset Seizure Team, Roads and Special Benefits District, Anne Arundel County Partnership for Children, Youth and Family, Reforestation, Laurel Racetrack, Video Lottery Local Impact Aid, Workforce Development, Arundel Community Development Services, Grants, Circuit Court, Street Light, Erosion Districts, Storm Drain Fees, Recreation Land Fees, Watershed Protection and Restoration, Energy Revolving Loan, Bond Premium, Park Place, Tax Increment Funds and Special Taxing Districts. In addition, fees collected by the Water and Wastewater Fund, including capital connections, front foot benefit assessments, and environmental protection fees are restricted for the payment of debt service incurred for the construction of capital
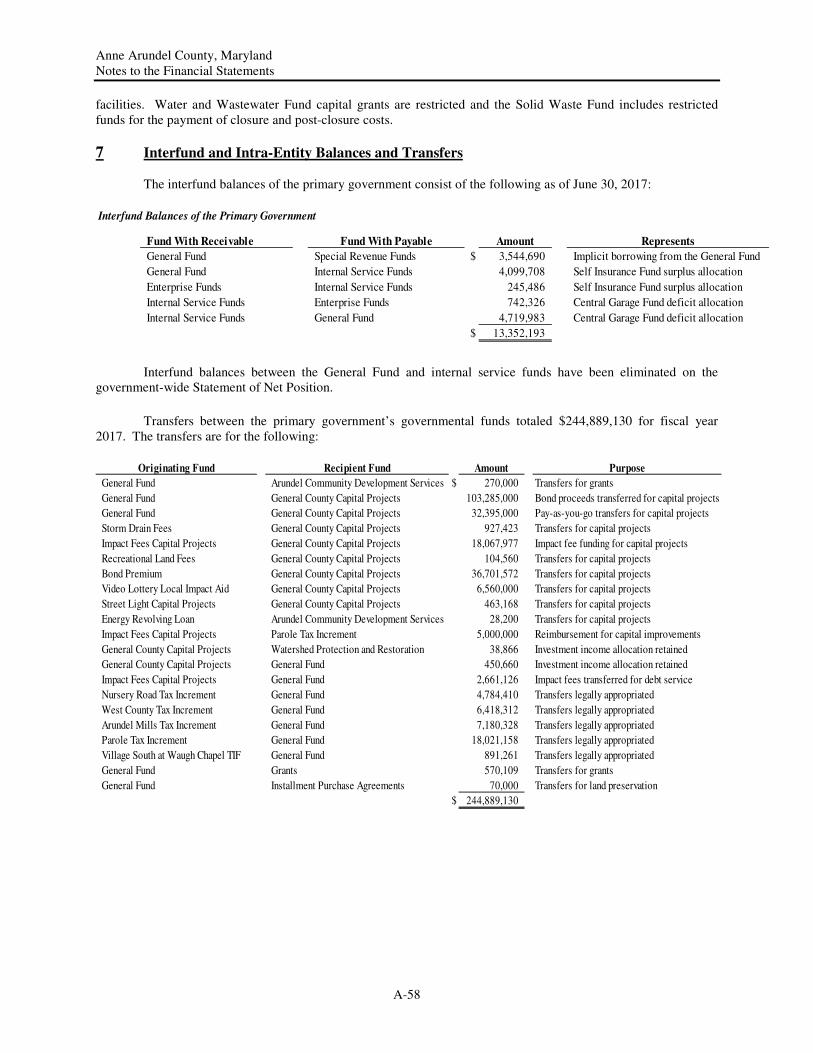
Anne Arundel County, Maryland Notes to the Financial Statements
A-58
facilities. Water and Wastewater Fund capital grants are restricted and the Solid Waste Fund includes restricted funds for the payment of closure and post-closure costs.
7 Interfund and Intra-Entity Balances and Transfers The interfund balances of the primary government consist of the following as of June 30, 2017:
Interfund Balances of the Primary Government
Fund With Receivable Fund With Payable Amount Represents
General Fund Special Revenue Funds $ 3,544,690 Implicit borrowing from the General Fund
General Fund Internal Service Funds 4,099,708 Self Insurance Fund surplus allocation
Enterprise Funds Internal Service Funds 245,486 Self Insurance Fund surplus allocation
Internal Service Funds Enterprise Funds 742,326 Central Garage Fund deficit allocation
Internal Service Funds General Fund 4,719,983 Central Garage Fund deficit allocation
$ 13,352,193
Interfund balances between the General Fund and internal service funds have been eliminated on the government-wide Statement of Net Position.
Transfers between the primary government’s governmental funds totaled $244,889,130 for fiscal year 2017. The transfers are for the following:
Originating Fund Recipient Fund Amount Purpose
General Fund Arundel Community Development Services $ 270,000 Transfers for grants
General Fund General County Capital Projects 103,285,000 Bond proceeds transferred for capital projects
General Fund General County Capital Projects 32,395,000 Pay-as-you-go transfers for capital projects
Storm Drain Fees General County Capital Projects 927,423 Transfers for capital projects
Impact Fees Capital Projects General County Capital Projects 18,067,977 Impact fee funding for capital projects
Recreational Land Fees General County Capital Projects 104,560 Transfers for capital projects
Bond Premium General County Capital Projects 36,701,572 Transfers for capital projects
Video Lottery Local Impact Aid General County Capital Projects 6,560,000 Transfers for capital projects
Street Light Capital Projects General County Capital Projects 463,168 Transfers for capital projects
Energy Revolving Loan Arundel Community Development Services 28,200 Transfers for capital projects
Impact Fees Capital Projects Parole Tax Increment 5,000,000 Reimbursement for capital improvements
General County Capital Projects Watershed Protection and Restoration 38,866 Investment income allocation retained
General County Capital Projects General Fund 450,660 Investment income allocation retained
Impact Fees Capital Projects General Fund 2,661,126 Impact fees transferred for debt service
Nursery Road Tax Increment General Fund 4,784,410 Transfers legally appropriated
West County Tax Increment General Fund 6,418,312 Transfers legally appropriated
Arundel Mills Tax Increment General Fund 7,180,328 Transfers legally appropriated
Parole Tax Increment General Fund 18,021,158 Transfers legally appropriated
Village South at Waugh Chapel TIF General Fund 891,261 Transfers legally appropriated
General Fund Grants 570,109 Transfers for grants
General Fund Installment Purchase Agreements 70,000 Transfers for land preservation
$ 244,889,130
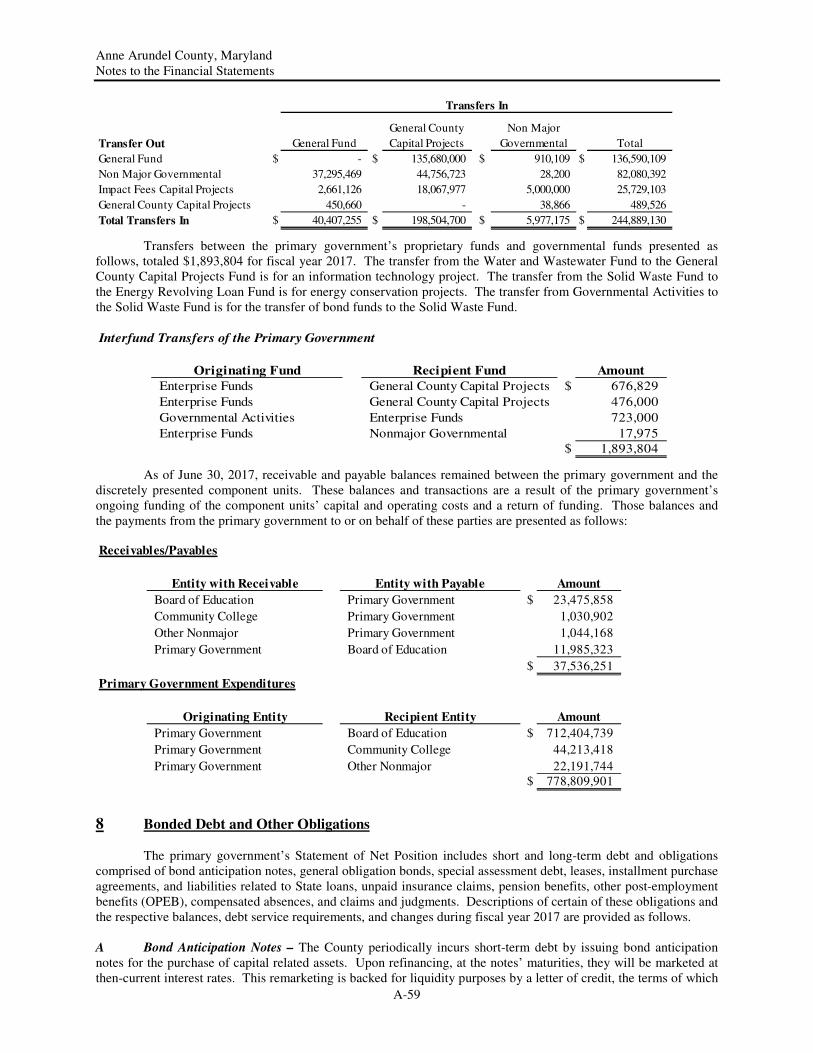
Anne Arundel County, Maryland Notes to the Financial Statements
A-59
General County Non Major
Transfer Out General Fund Capital Projects Governmental Total
General Fund $ - $ 135,680,000 $ 910,109 $ 136,590,109
Non Major Governmental 37,295,469 44,756,723 28,200 82,080,392
Impact Fees Capital Projects 2,661,126 18,067,977 5,000,000 25,729,103
General County Capital Projects 450,660 - 38,866 489,526
Total Transfers In $ 40,407,255 $ 198,504,700 $ 5,977,175 $ 244,889,130
Transfers In
Transfers between the primary government’s proprietary funds and governmental funds presented as
follows, totaled $1,893,804 for fiscal year 2017. The transfer from the Water and Wastewater Fund to the General County Capital Projects Fund is for an information technology project. The transfer from the Solid Waste Fund to the Energy Revolving Loan Fund is for energy conservation projects. The transfer from Governmental Activities to the Solid Waste Fund is for the transfer of bond funds to the Solid Waste Fund.
Interfund Transfers of the Primary Government
Originating Fund Recipient Fund Amount
Enterprise Funds General County Capital Projects $ 676,829
Enterprise Funds General County Capital Projects 476,000
Governmental Activities Enterprise Funds 723,000
Enterprise Funds Nonmajor Governmental 17,975
$ 1,893,804
As of June 30, 2017, receivable and payable balances remained between the primary government and the discretely presented component units. These balances and transactions are a result of the primary government’s ongoing funding of the component units’ capital and operating costs and a return of funding. Those balances and the payments from the primary government to or on behalf of these parties are presented as follows: Receivables/Payables
Entity with Receivable Entity with Payable Amount
Board of Education Primary Government $ 23,475,858
Community College Primary Government 1,030,902
Other Nonmajor Primary Government 1,044,168
Primary Government Board of Education 11,985,323
$ 37,536,251
Primary Government Expenditures
Originating Entity Recipient Entity Amount
Primary Government Board of Education $ 712,404,739
Primary Government Community College 44,213,418
Primary Government Other Nonmajor 22,191,744 $ 778,809,901
8 Bonded Debt and Other Obligations
The primary government’s Statement of Net Position includes short and long-term debt and obligations comprised of bond anticipation notes, general obligation bonds, special assessment debt, leases, installment purchase agreements, and liabilities related to State loans, unpaid insurance claims, pension benefits, other post-employment benefits (OPEB), compensated absences, and claims and judgments. Descriptions of certain of these obligations and the respective balances, debt service requirements, and changes during fiscal year 2017 are provided as follows.
A Bond Anticipation Notes – The County periodically incurs short-term debt by issuing bond anticipation notes for the purchase of capital related assets. Upon refinancing, at the notes’ maturities, they will be marketed at then-current interest rates. This remarketing is backed for liquidity purposes by a letter of credit, the terms of which
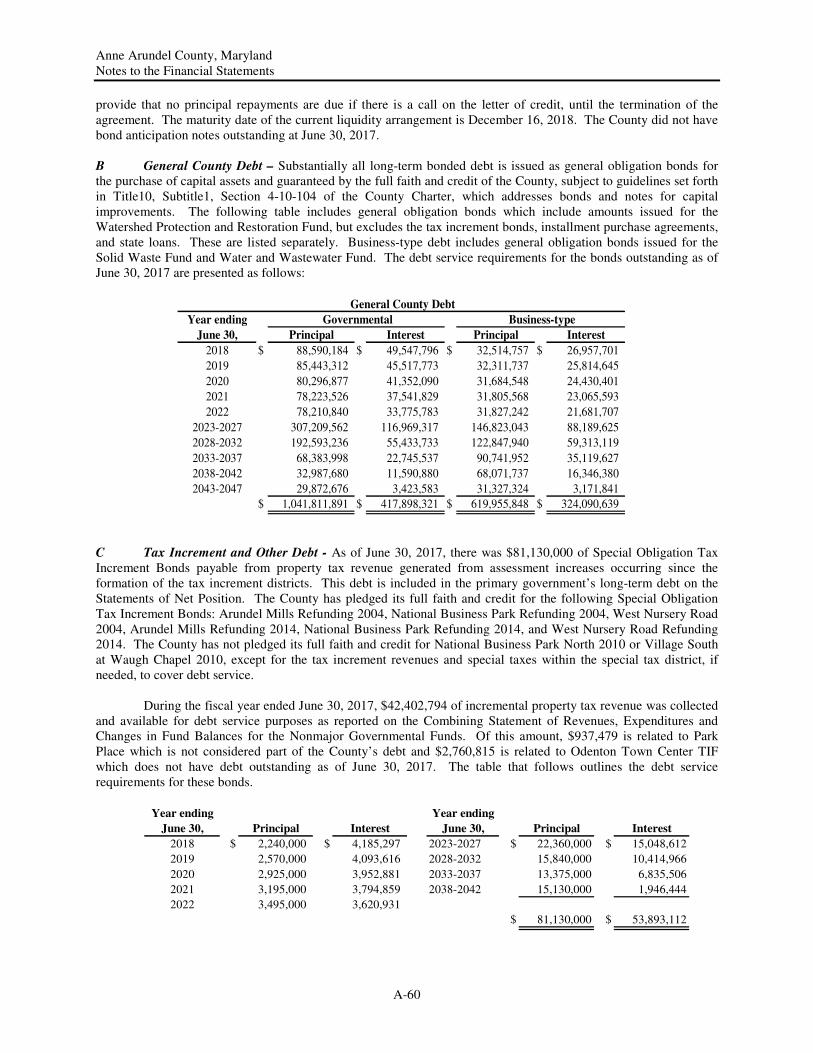
Anne Arundel County, Maryland Notes to the Financial Statements
A-60
provide that no principal repayments are due if there is a call on the letter of credit, until the termination of the agreement. The maturity date of the current liquidity arrangement is December 16, 2018. The County did not have bond anticipation notes outstanding at June 30, 2017.
B General County Debt – Substantially all long-term bonded debt is issued as general obligation bonds for the purchase of capital assets and guaranteed by the full faith and credit of the County, subject to guidelines set forth in Title10, Subtitle1, Section 4-10-104 of the County Charter, which addresses bonds and notes for capital improvements. The following table includes general obligation bonds which include amounts issued for the Watershed Protection and Restoration Fund, but excludes the tax increment bonds, installment purchase agreements, and state loans. These are listed separately. Business-type debt includes general obligation bonds issued for the Solid Waste Fund and Water and Wastewater Fund. The debt service requirements for the bonds outstanding as of June 30, 2017 are presented as follows:
Year ending
June 30, Principal Interest Principal Interest
2018 $ 88,590,184 $ 49,547,796 $ 32,514,757 $ 26,957,701
2019 85,443,312 45,517,773 32,311,737 25,814,645
2020 80,296,877 41,352,090 31,684,548 24,430,401
2021 78,223,526 37,541,829 31,805,568 23,065,593
2022 78,210,840 33,775,783 31,827,242 21,681,707
2023-2027 307,209,562 116,969,317 146,823,043 88,189,625
2028-2032 192,593,236 55,433,733 122,847,940 59,313,119
2033-2037 68,383,998 22,745,537 90,741,952 35,119,627
2038-2042 32,987,680 11,590,880 68,071,737 16,346,380
2043-2047 29,872,676 3,423,583 31,327,324 3,171,841
$ 1,041,811,891 $ 417,898,321 $ 619,955,848 $ 324,090,639
General County Debt
Governmental Business-type
C Tax Increment and Other Debt - As of June 30, 2017, there was $81,130,000 of Special Obligation Tax Increment Bonds payable from property tax revenue generated from assessment increases occurring since the formation of the tax increment districts. This debt is included in the primary government’s long-term debt on the Statements of Net Position. The County has pledged its full faith and credit for the following Special Obligation Tax Increment Bonds: Arundel Mills Refunding 2004, National Business Park Refunding 2004, West Nursery Road 2004, Arundel Mills Refunding 2014, National Business Park Refunding 2014, and West Nursery Road Refunding 2014. The County has not pledged its full faith and credit for National Business Park North 2010 or Village South at Waugh Chapel 2010, except for the tax increment revenues and special taxes within the special tax district, if needed, to cover debt service. During the fiscal year ended June 30, 2017, $42,402,794 of incremental property tax revenue was collected and available for debt service purposes as reported on the Combining Statement of Revenues, Expenditures and Changes in Fund Balances for the Nonmajor Governmental Funds. Of this amount, $937,479 is related to Park Place which is not considered part of the County’s debt and $2,760,815 is related to Odenton Town Center TIF which does not have debt outstanding as of June 30, 2017. The table that follows outlines the debt service requirements for these bonds.
Year ending Year ending
June 30, Principal Interest June 30, Principal Interest
2018 $ 2,240,000 $ 4,185,297 2023-2027 $ 22,360,000 $ 15,048,612
2019 2,570,000 4,093,616 2028-2032 15,840,000 10,414,966
2020 2,925,000 3,952,881 2033-2037 13,375,000 6,835,506
2021 3,195,000 3,794,859 2038-2042 15,130,000 1,946,444
2022 3,495,000 3,620,931
$ 81,130,000 $ 53,893,112
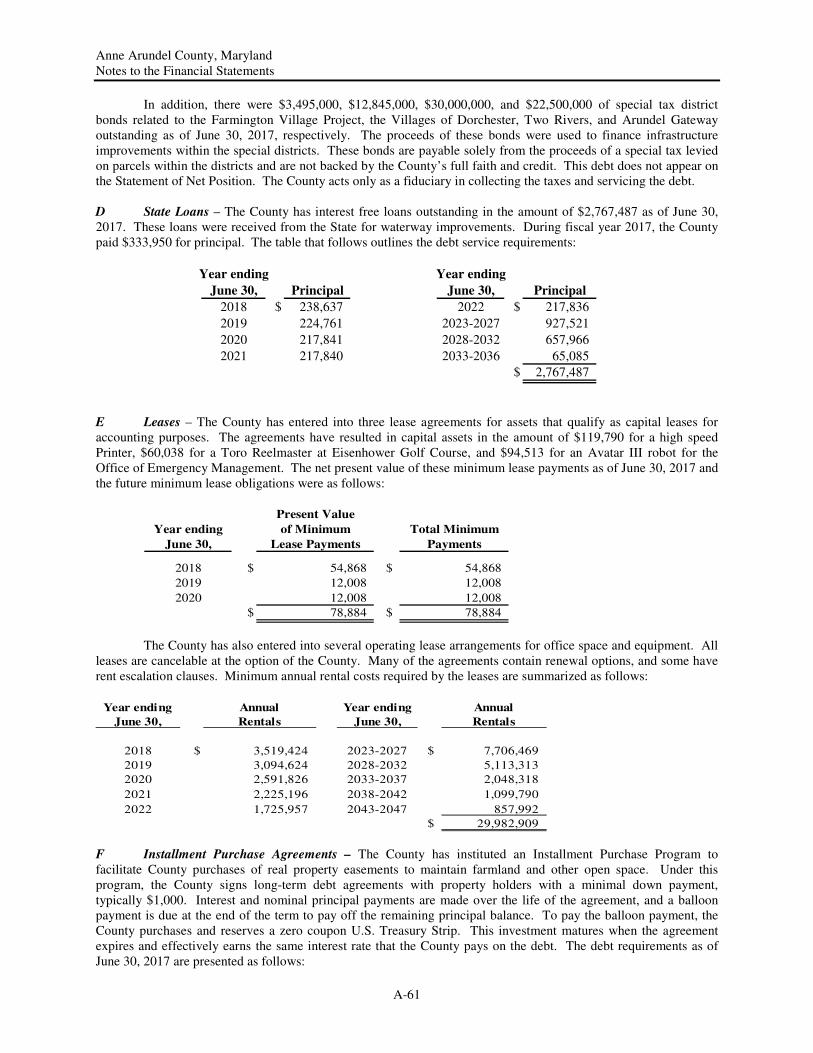
Anne Arundel County, Maryland Notes to the Financial Statements
A-61
In addition, there were $3,495,000, $12,845,000, $30,000,000, and $22,500,000 of special tax district bonds related to the Farmington Village Project, the Villages of Dorchester, Two Rivers, and Arundel Gateway outstanding as of June 30, 2017, respectively. The proceeds of these bonds were used to finance infrastructure improvements within the special districts. These bonds are payable solely from the proceeds of a special tax levied on parcels within the districts and are not backed by the County’s full faith and credit. This debt does not appear on the Statement of Net Position. The County acts only as a fiduciary in collecting the taxes and servicing the debt. D State Loans – The County has interest free loans outstanding in the amount of $2,767,487 as of June 30, 2017. These loans were received from the State for waterway improvements. During fiscal year 2017, the County paid $333,950 for principal. The table that follows outlines the debt service requirements:
Year ending Year ending
June 30, Principal June 30, Principal
2018 $ 238,637 2022 $ 217,836
2019 224,761 2023-2027 927,521
2020 217,841 2028-2032 657,966
2021 217,840 2033-2036 65,085
$ 2,767,487
E Leases – The County has entered into three lease agreements for assets that qualify as capital leases for accounting purposes. The agreements have resulted in capital assets in the amount of $119,790 for a high speed Printer, $60,038 for a Toro Reelmaster at Eisenhower Golf Course, and $94,513 for an Avatar III robot for the Office of Emergency Management. The net present value of these minimum lease payments as of June 30, 2017 and the future minimum lease obligations were as follows:
Present Value
Year ending of Minimum Total Minimum
June 30, Lease Payments Payments
2018 $ 54,868 $ 54,868
2019 12,008 12,008
2020 12,008 12,008
$ 78,884 $ 78,884
The County has also entered into several operating lease arrangements for office space and equipment. All leases are cancelable at the option of the County. Many of the agreements contain renewal options, and some have rent escalation clauses. Minimum annual rental costs required by the leases are summarized as follows:
Year ending Annual Year ending Annual
June 30, Rentals June 30, Rentals
2018 $ 3,519,424 2023-2027 $ 7,706,469
2019 3,094,624 2028-2032 5,113,313
2020 2,591,826 2033-2037 2,048,318
2021 2,225,196 2038-2042 1,099,790
2022 1,725,957 2043-2047 857,992
$ 29,982,909
F Installment Purchase Agreements – The County has instituted an Installment Purchase Program to facilitate County purchases of real property easements to maintain farmland and other open space. Under this program, the County signs long-term debt agreements with property holders with a minimal down payment, typically $1,000. Interest and nominal principal payments are made over the life of the agreement, and a balloon payment is due at the end of the term to pay off the remaining principal balance. To pay the balloon payment, the County purchases and reserves a zero coupon U.S. Treasury Strip. This investment matures when the agreement expires and effectively earns the same interest rate that the County pays on the debt. The debt requirements as of June 30, 2017 are presented as follows:
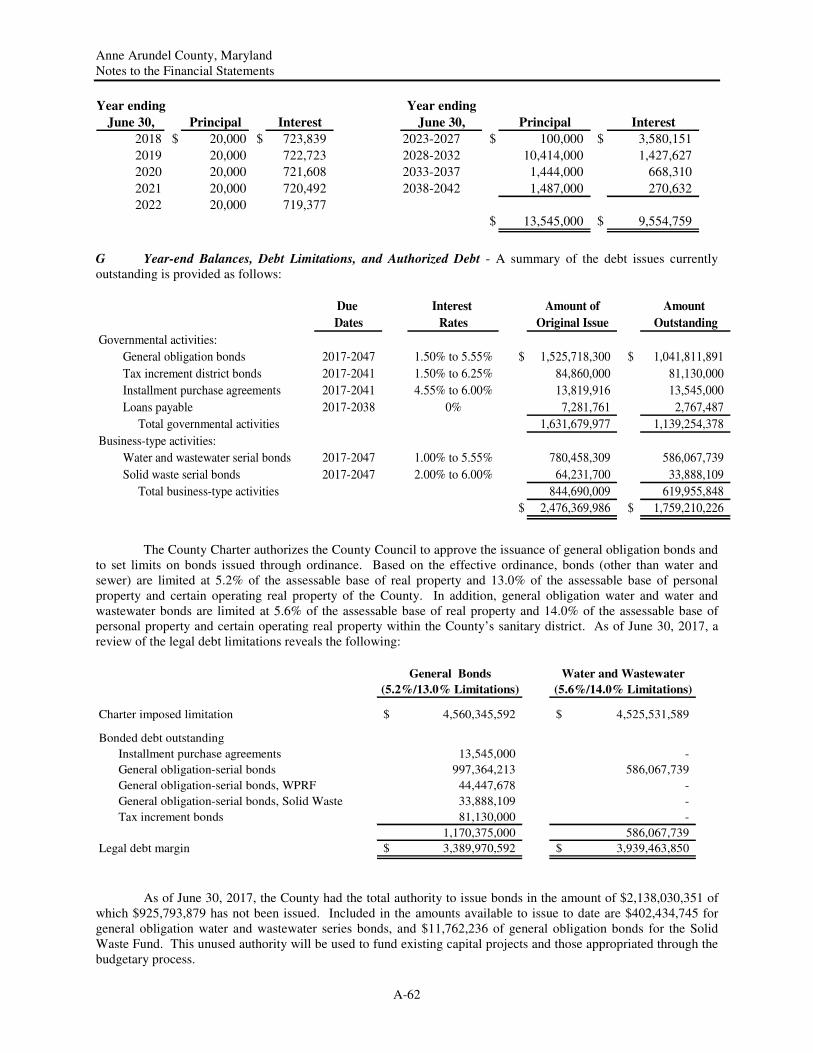
Anne Arundel County, Maryland Notes to the Financial Statements
A-62
Year ending Year ending
June 30, Principal Interest June 30, Principal Interest
2018 $ 20,000 $ 723,839 2023-2027 $ 100,000 $ 3,580,151
2019 20,000 722,723 2028-2032 10,414,000 1,427,627
2020 20,000 721,608 2033-2037 1,444,000 668,310
2021 20,000 720,492 2038-2042 1,487,000 270,632
2022 20,000 719,377
$ 13,545,000 $ 9,554,759
G Year-end Balances, Debt Limitations, and Authorized Debt - A summary of the debt issues currently outstanding is provided as follows:
Due Interest Amount of Amount
Dates Rates Original Issue Outstanding
Governmental activities:
General obligation bonds 2017-2047 1.50% to 5.55% $ 1,525,718,300 $ 1,041,811,891
Tax increment district bonds 2017-2041 1.50% to 6.25% 84,860,000 81,130,000
Installment purchase agreements 2017-2041 4.55% to 6.00% 13,819,916 13,545,000
Loans payable 2017-2038 0% 7,281,761 2,767,487
Total governmental activities 1,631,679,977 1,139,254,378
Business-type activities:
Water and wastewater serial bonds 2017-2047 1.00% to 5.55% 780,458,309 586,067,739
Solid waste serial bonds 2017-2047 2.00% to 6.00% 64,231,700 33,888,109
Total business-type activities 844,690,009 619,955,848
$ 2,476,369,986 $ 1,759,210,226
The County Charter authorizes the County Council to approve the issuance of general obligation bonds and to set limits on bonds issued through ordinance. Based on the effective ordinance, bonds (other than water and sewer) are limited at 5.2% of the assessable base of real property and 13.0% of the assessable base of personal property and certain operating real property of the County. In addition, general obligation water and water and wastewater bonds are limited at 5.6% of the assessable base of real property and 14.0% of the assessable base of personal property and certain operating real property within the County’s sanitary district. As of June 30, 2017, a review of the legal debt limitations reveals the following:
General Bonds Water and Wastewater
(5.2%/13.0% Limitations) (5.6%/14.0% Limitations)
Charter imposed limitation 4,560,345,592$ 4,525,531,589$
Bonded debt outstanding
Installment purchase agreements 13,545,000 -
General obligation-serial bonds 997,364,213 586,067,739
General obligation-serial bonds, WPRF 44,447,678 -
General obligation-serial bonds, Solid Waste 33,888,109 -
Tax increment bonds 81,130,000 -
1,170,375,000 586,067,739
Legal debt margin 3,389,970,592$ 3,939,463,850$
As of June 30, 2017, the County had the total authority to issue bonds in the amount of $2,138,030,351 of which $925,793,879 has not been issued. Included in the amounts available to issue to date are $402,434,745 for general obligation water and wastewater series bonds, and $11,762,236 of general obligation bonds for the Solid Waste Fund. This unused authority will be used to fund existing capital projects and those appropriated through the budgetary process.
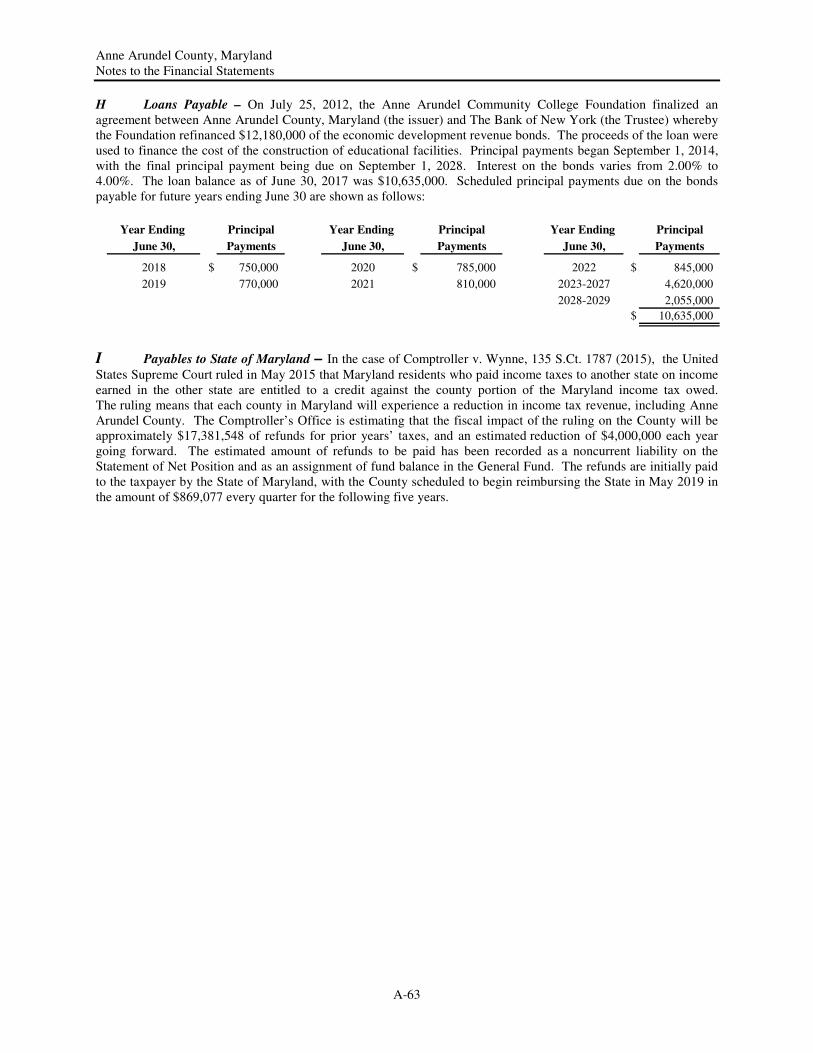
Anne Arundel County, Maryland Notes to the Financial Statements
A-63
H Loans Payable – On July 25, 2012, the Anne Arundel Community College Foundation finalized an agreement between Anne Arundel County, Maryland (the issuer) and The Bank of New York (the Trustee) whereby the Foundation refinanced $12,180,000 of the economic development revenue bonds. The proceeds of the loan were used to finance the cost of the construction of educational facilities. Principal payments began September 1, 2014, with the final principal payment being due on September 1, 2028. Interest on the bonds varies from 2.00% to 4.00%. The loan balance as of June 30, 2017 was $10,635,000. Scheduled principal payments due on the bonds payable for future years ending June 30 are shown as follows:
Year Ending Principal Year Ending Principal Year Ending Principal
June 30, Payments June 30, Payments June 30, Payments
2018 $ 750,000 2020 $ 785,000 2022 $ 845,000
2019 770,000 2021 810,000 2023-2027 4,620,000
2028-2029 2,055,000
$ 10,635,000
I Payables to State of Maryland – In the case of Comptroller v. Wynne, 135 S.Ct. 1787 (2015), the United
States Supreme Court ruled in May 2015 that Maryland residents who paid income taxes to another state on income earned in the other state are entitled to a credit against the county portion of the Maryland income tax owed. The ruling means that each county in Maryland will experience a reduction in income tax revenue, including Anne Arundel County. The Comptroller’s Office is estimating that the fiscal impact of the ruling on the County will be approximately $17,381,548 of refunds for prior years’ taxes, and an estimated reduction of $4,000,000 each year going forward. The estimated amount of refunds to be paid has been recorded as a noncurrent liability on the Statement of Net Position and as an assignment of fund balance in the General Fund. The refunds are initially paid to the taxpayer by the State of Maryland, with the County scheduled to begin reimbursing the State in May 2019 in the amount of $869,077 every quarter for the following five years.
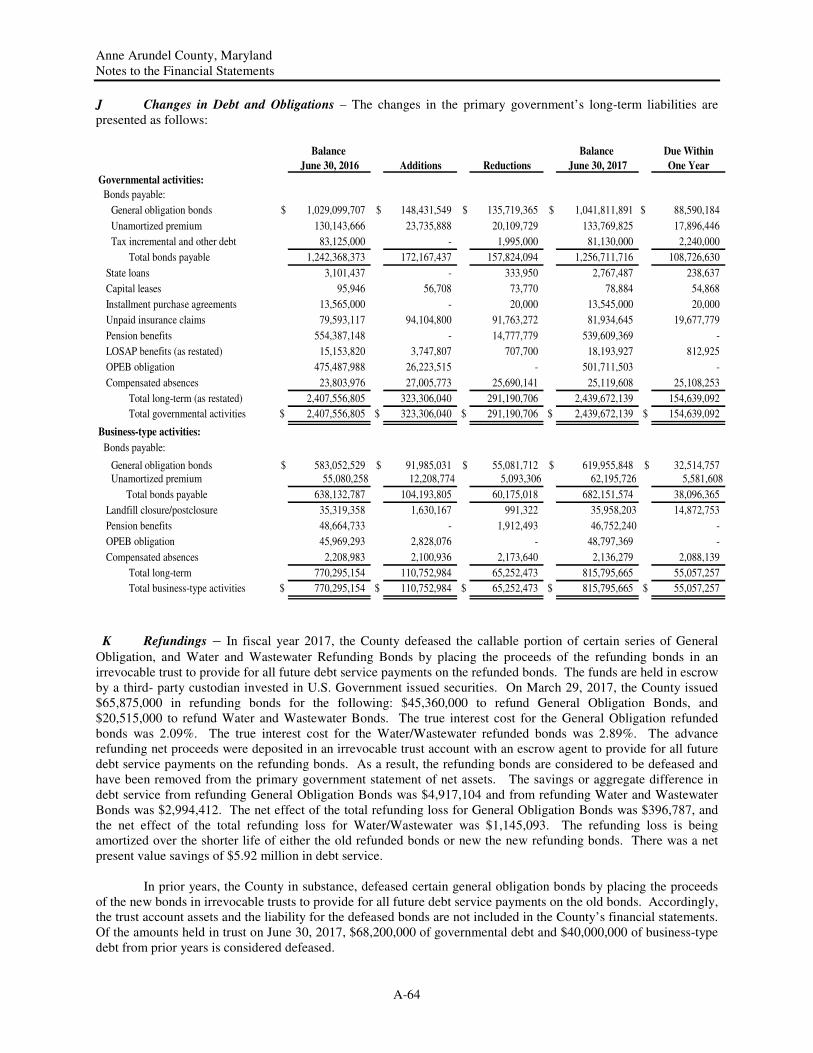
Anne Arundel County, Maryland Notes to the Financial Statements
A-64
J Changes in Debt and Obligations – The changes in the primary government’s long-term liabilities are presented as follows:
Balance Balance Due Within
June 30, 2016 Additions Reductions June 30, 2017 One Year
Governmental activities:
Bonds payable:
General obligation bonds $ 1,029,099,707 $ 148,431,549 $ 135,719,365 $ 1,041,811,891 $ 88,590,184
Unamortized premium 130,143,666 23,735,888 20,109,729 133,769,825 17,896,446
Tax incremental and other debt 83,125,000 - 1,995,000 81,130,000 2,240,000
Total bonds payable 1,242,368,373 172,167,437 157,824,094 1,256,711,716 108,726,630
State loans 3,101,437 - 333,950 2,767,487 238,637
Capital leases 95,946 56,708 73,770 78,884 54,868
Installment purchase agreements 13,565,000 - 20,000 13,545,000 20,000
Unpaid insurance claims 79,593,117 94,104,800 91,763,272 81,934,645 19,677,779
Pension benefits 554,387,148 - 14,777,779 539,609,369 -
LOSAP benefits (as restated) 15,153,820 3,747,807 707,700 18,193,927 812,925
OPEB obligation 475,487,988 26,223,515 - 501,711,503 -
Compensated absences 23,803,976 27,005,773 25,690,141 25,119,608 25,108,253
Total long-term (as restated) 2,407,556,805 323,306,040 291,190,706 2,439,672,139 154,639,092
Total governmental activities $ 2,407,556,805 $ 323,306,040 $ 291,190,706 $ 2,439,672,139 $ 154,639,092
Business-type activities:
Bonds payable:
General obligation bonds $ 583,052,529 $ 91,985,031 $ 55,081,712 $ 619,955,848 $ 32,514,757 Unamortized premium 55,080,258 12,208,774 5,093,306 62,195,726 5,581,608
Total bonds payable 638,132,787 104,193,805 60,175,018 682,151,574 38,096,365
Landfill closure/postclosure 35,319,358 1,630,167 991,322 35,958,203 14,872,753
Pension benefits 48,664,733 - 1,912,493 46,752,240 -
OPEB obligation 45,969,293 2,828,076 - 48,797,369 -
Compensated absences 2,208,983 2,100,936 2,173,640 2,136,279 2,088,139
Total long-term 770,295,154 110,752,984 65,252,473 815,795,665 55,057,257
Total business-type activities $ 770,295,154 $ 110,752,984 $ 65,252,473 $ 815,795,665 $ 55,057,257
K Refundings – In fiscal year 2017, the County defeased the callable portion of certain series of General
Obligation, and Water and Wastewater Refunding Bonds by placing the proceeds of the refunding bonds in an irrevocable trust to provide for all future debt service payments on the refunded bonds. The funds are held in escrow by a third- party custodian invested in U.S. Government issued securities. On March 29, 2017, the County issued $65,875,000 in refunding bonds for the following: $45,360,000 to refund General Obligation Bonds, and $20,515,000 to refund Water and Wastewater Bonds. The true interest cost for the General Obligation refunded bonds was 2.09%. The true interest cost for the Water/Wastewater refunded bonds was 2.89%. The advance refunding net proceeds were deposited in an irrevocable trust account with an escrow agent to provide for all future debt service payments on the refunding bonds. As a result, the refunding bonds are considered to be defeased and have been removed from the primary government statement of net assets. The savings or aggregate difference in debt service from refunding General Obligation Bonds was $4,917,104 and from refunding Water and Wastewater Bonds was $2,994,412. The net effect of the total refunding loss for General Obligation Bonds was $396,787, and the net effect of the total refunding loss for Water/Wastewater was $1,145,093. The refunding loss is being amortized over the shorter life of either the old refunded bonds or new the new refunding bonds. There was a net present value savings of $5.92 million in debt service.
In prior years, the County in substance, defeased certain general obligation bonds by placing the proceeds of the new bonds in irrevocable trusts to provide for all future debt service payments on the old bonds. Accordingly, the trust account assets and the liability for the defeased bonds are not included in the County’s financial statements. Of the amounts held in trust on June 30, 2017, $68,200,000 of governmental debt and $40,000,000 of business-type debt from prior years is considered defeased.
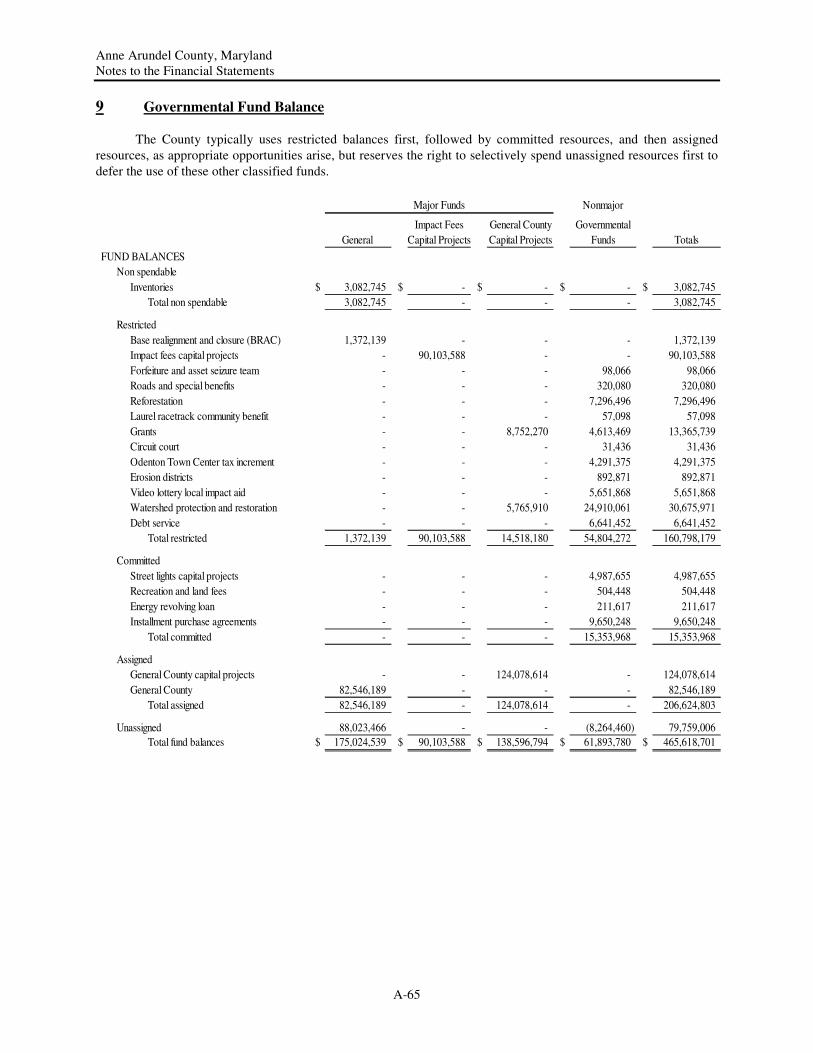
Anne Arundel County, Maryland Notes to the Financial Statements
A-65
9 Governmental Fund Balance
The County typically uses restricted balances first, followed by committed resources, and then assigned
resources, as appropriate opportunities arise, but reserves the right to selectively spend unassigned resources first to
defer the use of these other classified funds.
Major Funds Nonmajor
Impact Fees General County Governmental
General Capital Projects Capital Projects Funds Totals
FUND BALANCES
Non spendable
Inventories $ 3,082,745 $ - $ - $ - $ 3,082,745
Total non spendable 3,082,745 - - - 3,082,745
Restricted
Base realignment and closure (BRAC) 1,372,139 - - - 1,372,139
Impact fees capital projects - 90,103,588 - - 90,103,588
Forfeiture and asset seizure team - - - 98,066 98,066
Roads and special benefits - - - 320,080 320,080
Reforestation - - - 7,296,496 7,296,496
Laurel racetrack community benefit - - - 57,098 57,098
Grants - - 8,752,270 4,613,469 13,365,739
Circuit court - - - 31,436 31,436
Odenton Town Center tax increment - - - 4,291,375 4,291,375
Erosion districts - - - 892,871 892,871
Video lottery local impact aid - - - 5,651,868 5,651,868
Watershed protection and restoration - - 5,765,910 24,910,061 30,675,971
Debt service - - - 6,641,452 6,641,452
Total restricted 1,372,139 90,103,588 14,518,180 54,804,272 160,798,179
Committed
Street lights capital projects - - - 4,987,655 4,987,655
Recreation and land fees - - - 504,448 504,448
Energy revolving loan - - - 211,617 211,617
Installment purchase agreements - - - 9,650,248 9,650,248
Total committed - - - 15,353,968 15,353,968
Assigned
General County capital projects - - 124,078,614 - 124,078,614
General County 82,546,189 - - - 82,546,189
Total assigned 82,546,189 - 124,078,614 - 206,624,803
Unassigned 88,023,466 - - (8,264,460) 79,759,006
Total fund balances $ 175,024,539 $ 90,103,588 $ 138,596,794 $ 61,893,780 $ 465,618,701
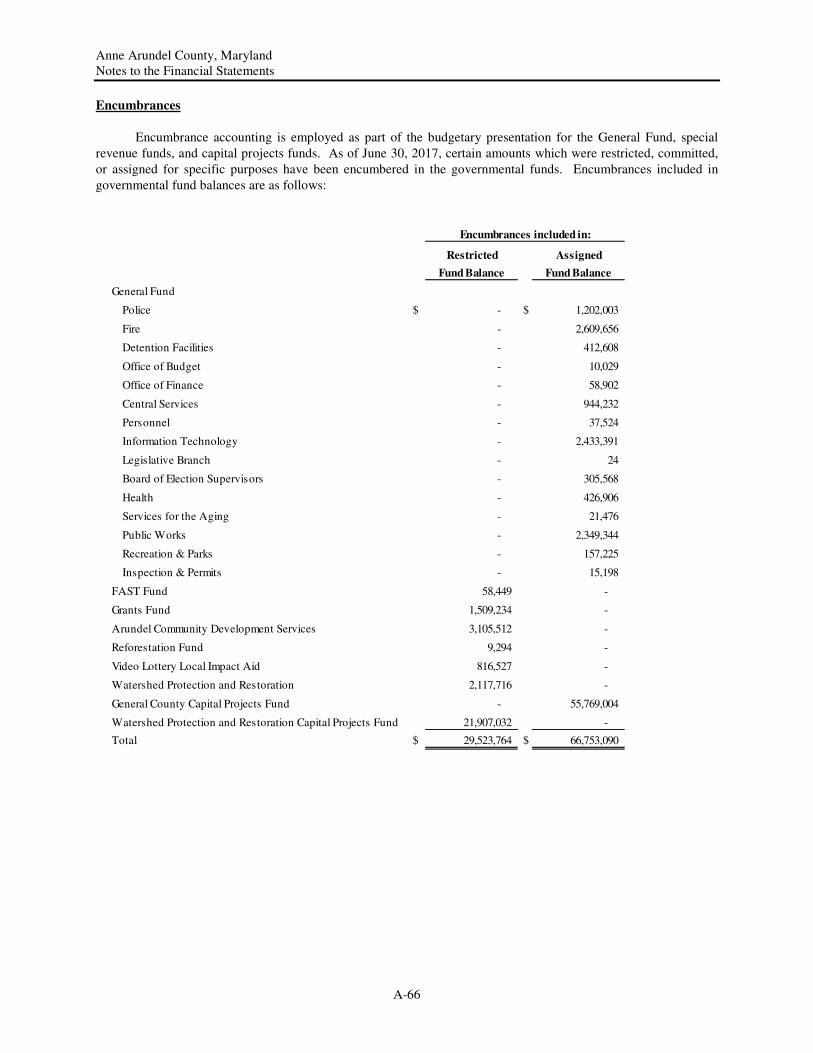
Anne Arundel County, Maryland Notes to the Financial Statements
A-66
Encumbrances
Encumbrance accounting is employed as part of the budgetary presentation for the General Fund, special
revenue funds, and capital projects funds. As of June 30, 2017, certain amounts which were restricted, committed,
or assigned for specific purposes have been encumbered in the governmental funds. Encumbrances included in
governmental fund balances are as follows:
Restricted Assigned
Fund Balance Fund Balance
General Fund
Police $ - $ 1,202,003
Fire - 2,609,656
Detention Facilities - 412,608
Office of Budget - 10,029
Office of Finance - 58,902
Central Services - 944,232
Personnel - 37,524
Information Technology - 2,433,391
Legislative Branch - 24
Board of Election Supervisors - 305,568
Health - 426,906
Services for the Aging - 21,476
Public Works - 2,349,344
Recreation & Parks - 157,225
Inspection & Permits - 15,198
FAST Fund 58,449 -
Grants Fund 1,509,234 -
Arundel Community Development Services 3,105,512 -
Reforestation Fund 9,294 -
Video Lottery Local Impact Aid 816,527 -
Watershed Protection and Restoration 2,117,716 -
General County Capital Projects Fund - 55,769,004
Watershed Protection and Restoration Capital Projects Fund 21,907,032 -
Total $ 29,523,764 $ 66,753,090
Encumbrances included in:
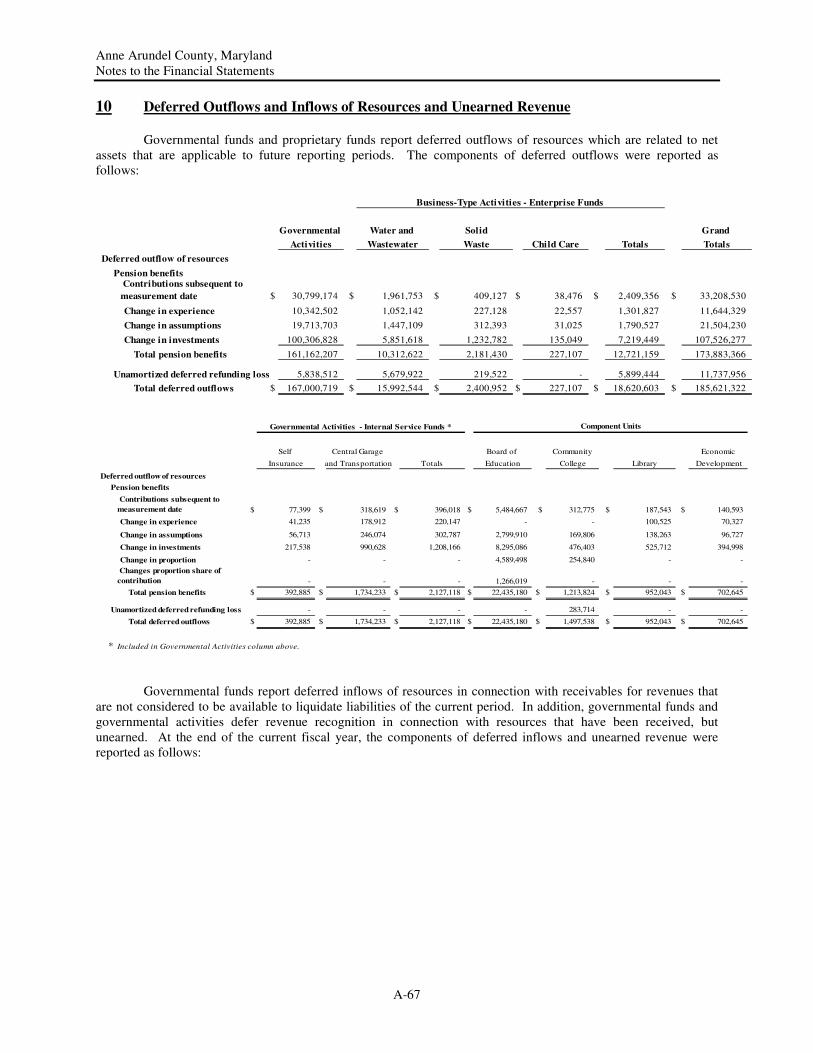
Anne Arundel County, Maryland Notes to the Financial Statements
A-67
10 Deferred Outflows and Inflows of Resources and Unearned Revenue
Governmental funds and proprietary funds report deferred outflows of resources which are related to net assets that are applicable to future reporting periods. The components of deferred outflows were reported as follows:
Governmental Water and Solid Grand
Activities Wastewater Waste Child Care Totals Totals
Deferred outflow of resources
Pension benefits
$ 30,799,174 $ 1,961,753 $ 409,127 $ 38,476 $ 2,409,356 $ 33,208,530
Change in experience 10,342,502 1,052,142 227,128 22,557 1,301,827 11,644,329
Change in assumptions 19,713,703 1,447,109 312,393 31,025 1,790,527 21,504,230
Change in investments 100,306,828 5,851,618 1,232,782 135,049 7,219,449 107,526,277
Total pension benefits 161,162,207 10,312,622 2,181,430 227,107 12,721,159 173,883,366
Unamortized deferred refunding loss 5,838,512 5,679,922 219,522 - 5,899,444 11,737,956
Total deferred outflows $ 167,000,719 $ 15,992,544 $ 2,400,952 $ 227,107 $ 18,620,603 $ 185,621,322
Business-Type Activities - Enterprise Funds
Contributions subsequent to
measurement date
Self Central Garage Board of Community Economic
Insurance and Transportation Totals Education College Library Development
Deferred outflow of resources
Pension benefits
$ 77,399 $ 318,619 $ 396,018 $ 5,484,667 $ 312,775 $ 187,543 $ 140,593
Change in experience 41,235 178,912 220,147 - - 100,525 70,327
Change in assumptions 56,713 246,074 302,787 2,799,910 169,806 138,263 96,727
Change in investments 217,538 990,628 1,208,166 8,295,086 476,403 525,712 394,998
Change in proportion - - - 4,589,498 254,840 - -
- - - 1,266,019 - - -
Total pension benefits $ 392,885 $ 1,734,233 $ 2,127,118 $ 22,435,180 $ 1,213,824 $ 952,043 $ 702,645
Unamortized deferred refunding loss - - - - 283,714 - -
Total deferred outflows $ 392,885 $ 1,734,233 $ 2,127,118 $ 22,435,180 $ 1,497,538 $ 952,043 $ 702,645
* Included in Governmental Activities column above.
Changes proportion share of
contribution
Contributions subsequent to
measurement date
Governmental Activities - Internal Service Funds * Component Units
Governmental funds report deferred inflows of resources in connection with receivables for revenues that are not considered to be available to liquidate liabilities of the current period. In addition, governmental funds and governmental activities defer revenue recognition in connection with resources that have been received, but unearned. At the end of the current fiscal year, the components of deferred inflows and unearned revenue were reported as follows:
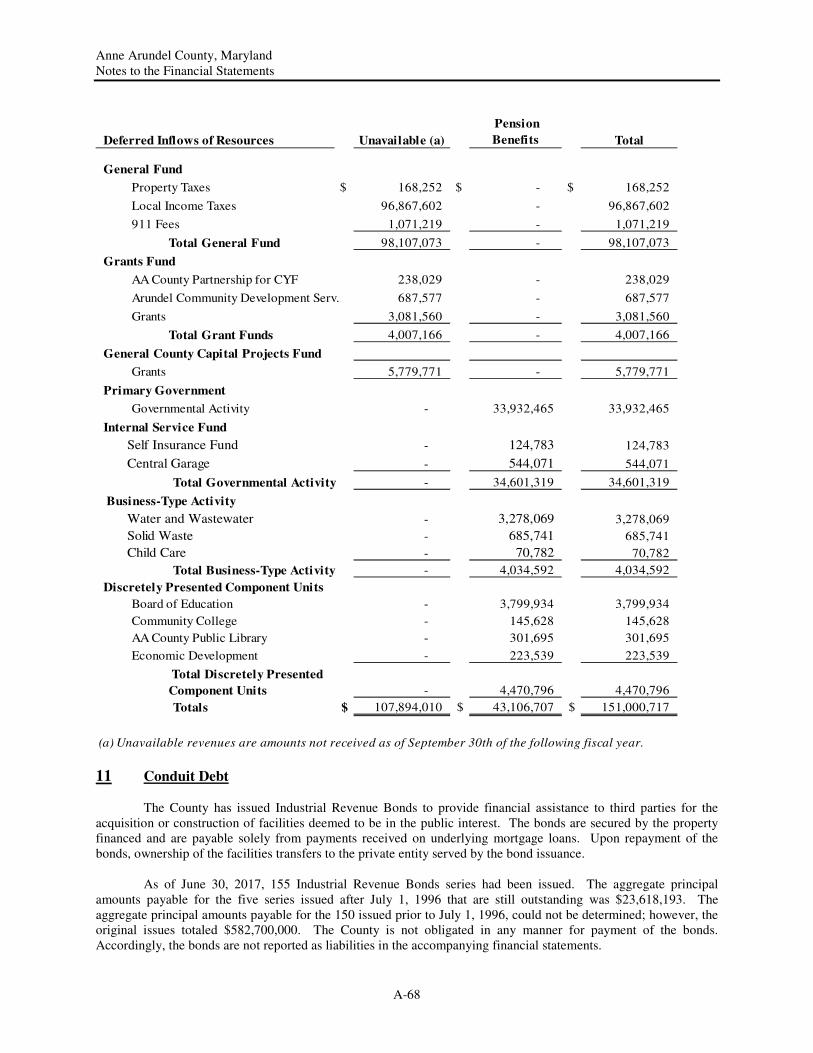
Anne Arundel County, Maryland Notes to the Financial Statements
A-68
Deferred Inflows of Resources Unavailable (a)
Pension
Benefits Total
General Fund
Property Taxes $ 168,252 $ - $ 168,252
Local Income Taxes 96,867,602 - 96,867,602
911 Fees 1,071,219 - 1,071,219
Total General Fund 98,107,073 - 98,107,073
Grants Fund
AA County Partnership for CYF 238,029 - 238,029
Arundel Community Development Serv. 687,577 - 687,577
Grants 3,081,560 - 3,081,560
Total Grant Funds 4,007,166 - 4,007,166
General County Capital Projects Fund
Grants 5,779,771 - 5,779,771
Primary Government
Governmental Activity - 33,932,465 33,932,465
Internal Service Fund
Self Insurance Fund - 124,783 124,783
Central Garage - 544,071 544,071
Total Governmental Activity - 34,601,319 34,601,319
Business-Type Activity
Water and Wastewater - 3,278,069 3,278,069
Solid Waste - 685,741 685,741
Child Care - 70,782 70,782
Total Business-Type Activity - 4,034,592 4,034,592
Discretely Presented Component Units
Board of Education - 3,799,934 3,799,934
Community College - 145,628 145,628
AA County Public Library - 301,695 301,695
Economic Development - 223,539 223,539
Total Discretely Presented
Component Units - 4,470,796 4,470,796
Totals $ 107,894,010 $ 43,106,707 $ 151,000,717
(a) Unavailable revenues are amounts not received as of September 30th of the following fiscal year.
11 Conduit Debt The County has issued Industrial Revenue Bonds to provide financial assistance to third parties for the acquisition or construction of facilities deemed to be in the public interest. The bonds are secured by the property financed and are payable solely from payments received on underlying mortgage loans. Upon repayment of the bonds, ownership of the facilities transfers to the private entity served by the bond issuance. As of June 30, 2017, 155 Industrial Revenue Bonds series had been issued. The aggregate principal amounts payable for the five series issued after July 1, 1996 that are still outstanding was $23,618,193. The aggregate principal amounts payable for the 150 issued prior to July 1, 1996, could not be determined; however, the original issues totaled $582,700,000. The County is not obligated in any manner for payment of the bonds. Accordingly, the bonds are not reported as liabilities in the accompanying financial statements.
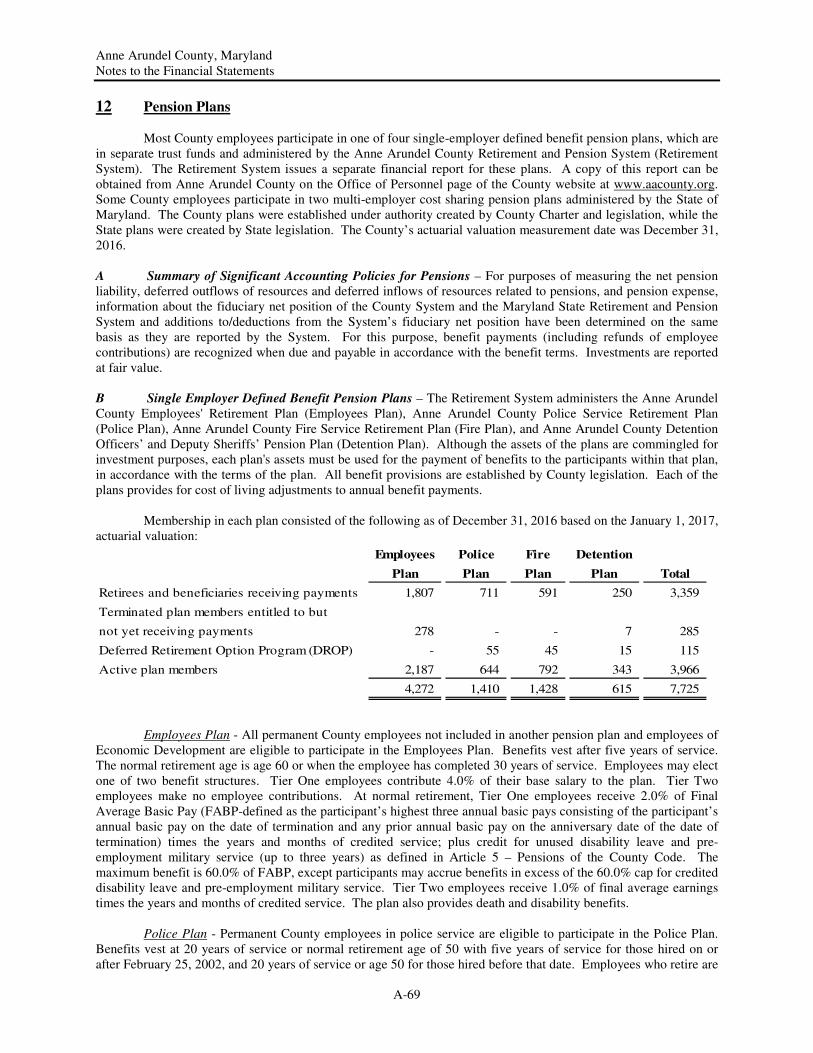
Anne Arundel County, Maryland Notes to the Financial Statements
A-69
12 Pension Plans
Most County employees participate in one of four single-employer defined benefit pension plans, which are
in separate trust funds and administered by the Anne Arundel County Retirement and Pension System (Retirement System). The Retirement System issues a separate financial report for these plans. A copy of this report can be obtained from Anne Arundel County on the Office of Personnel page of the County website at www.aacounty.org. Some County employees participate in two multi-employer cost sharing pension plans administered by the State of Maryland. The County plans were established under authority created by County Charter and legislation, while the State plans were created by State legislation. The County’s actuarial valuation measurement date was December 31, 2016.
A Summary of Significant Accounting Policies for Pensions – For purposes of measuring the net pension liability, deferred outflows of resources and deferred inflows of resources related to pensions, and pension expense, information about the fiduciary net position of the County System and the Maryland State Retirement and Pension System and additions to/deductions from the System’s fiduciary net position have been determined on the same basis as they are reported by the System. For this purpose, benefit payments (including refunds of employee contributions) are recognized when due and payable in accordance with the benefit terms. Investments are reported at fair value.
B Single Employer Defined Benefit Pension Plans – The Retirement System administers the Anne Arundel County Employees' Retirement Plan (Employees Plan), Anne Arundel County Police Service Retirement Plan (Police Plan), Anne Arundel County Fire Service Retirement Plan (Fire Plan), and Anne Arundel County Detention Officers’ and Deputy Sheriffs’ Pension Plan (Detention Plan). Although the assets of the plans are commingled for investment purposes, each plan's assets must be used for the payment of benefits to the participants within that plan, in accordance with the terms of the plan. All benefit provisions are established by County legislation. Each of the plans provides for cost of living adjustments to annual benefit payments.
Membership in each plan consisted of the following as of December 31, 2016 based on the January 1, 2017,
actuarial valuation:
Employees Police Fire Detention
Plan Plan Plan Plan Total
Retirees and beneficiaries receiving payments 1,807 711 591 250 3,359
Terminated plan members entitled to but
not yet receiving payments 278 - - 7 285
Deferred Retirement Option Program (DROP) - 55 45 15 115
Active plan members 2,187 644 792 343 3,966
4,272 1,410 1,428 615 7,725
Employees Plan - All permanent County employees not included in another pension plan and employees of Economic Development are eligible to participate in the Employees Plan. Benefits vest after five years of service. The normal retirement age is age 60 or when the employee has completed 30 years of service. Employees may elect one of two benefit structures. Tier One employees contribute 4.0% of their base salary to the plan. Tier Two employees make no employee contributions. At normal retirement, Tier One employees receive 2.0% of Final Average Basic Pay (FABP-defined as the participant’s highest three annual basic pays consisting of the participant’s annual basic pay on the date of termination and any prior annual basic pay on the anniversary date of the date of termination) times the years and months of credited service; plus credit for unused disability leave and pre-employment military service (up to three years) as defined in Article 5 – Pensions of the County Code. The maximum benefit is 60.0% of FABP, except participants may accrue benefits in excess of the 60.0% cap for credited disability leave and pre-employment military service. Tier Two employees receive 1.0% of final average earnings times the years and months of credited service. The plan also provides death and disability benefits.
Police Plan - Permanent County employees in police service are eligible to participate in the Police Plan. Benefits vest at 20 years of service or normal retirement age of 50 with five years of service for those hired on or after February 25, 2002, and 20 years of service or age 50 for those hired before that date. Employees who retire are
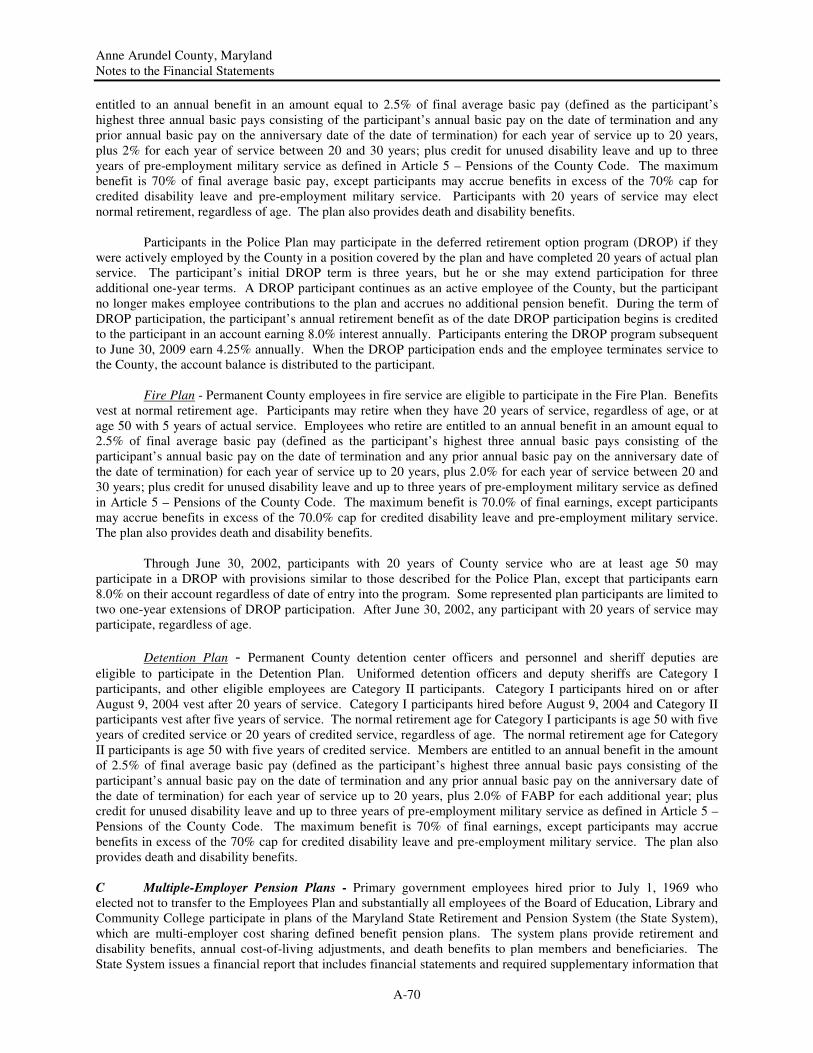
Anne Arundel County, Maryland Notes to the Financial Statements
A-70
entitled to an annual benefit in an amount equal to 2.5% of final average basic pay (defined as the participant’s highest three annual basic pays consisting of the participant’s annual basic pay on the date of termination and any prior annual basic pay on the anniversary date of the date of termination) for each year of service up to 20 years, plus 2% for each year of service between 20 and 30 years; plus credit for unused disability leave and up to three years of pre-employment military service as defined in Article 5 – Pensions of the County Code. The maximum benefit is 70% of final average basic pay, except participants may accrue benefits in excess of the 70% cap for credited disability leave and pre-employment military service. Participants with 20 years of service may elect normal retirement, regardless of age. The plan also provides death and disability benefits.
Participants in the Police Plan may participate in the deferred retirement option program (DROP) if they
were actively employed by the County in a position covered by the plan and have completed 20 years of actual plan service. The participant’s initial DROP term is three years, but he or she may extend participation for three additional one-year terms. A DROP participant continues as an active employee of the County, but the participant no longer makes employee contributions to the plan and accrues no additional pension benefit. During the term of DROP participation, the participant’s annual retirement benefit as of the date DROP participation begins is credited to the participant in an account earning 8.0% interest annually. Participants entering the DROP program subsequent to June 30, 2009 earn 4.25% annually. When the DROP participation ends and the employee terminates service to the County, the account balance is distributed to the participant.
Fire Plan - Permanent County employees in fire service are eligible to participate in the Fire Plan. Benefits vest at normal retirement age. Participants may retire when they have 20 years of service, regardless of age, or at age 50 with 5 years of actual service. Employees who retire are entitled to an annual benefit in an amount equal to 2.5% of final average basic pay (defined as the participant’s highest three annual basic pays consisting of the participant’s annual basic pay on the date of termination and any prior annual basic pay on the anniversary date of the date of termination) for each year of service up to 20 years, plus 2.0% for each year of service between 20 and 30 years; plus credit for unused disability leave and up to three years of pre-employment military service as defined in Article 5 – Pensions of the County Code. The maximum benefit is 70.0% of final earnings, except participants may accrue benefits in excess of the 70.0% cap for credited disability leave and pre-employment military service. The plan also provides death and disability benefits.
Through June 30, 2002, participants with 20 years of County service who are at least age 50 may
participate in a DROP with provisions similar to those described for the Police Plan, except that participants earn 8.0% on their account regardless of date of entry into the program. Some represented plan participants are limited to two one-year extensions of DROP participation. After June 30, 2002, any participant with 20 years of service may participate, regardless of age.
Detention Plan - Permanent County detention center officers and personnel and sheriff deputies are
eligible to participate in the Detention Plan. Uniformed detention officers and deputy sheriffs are Category I participants, and other eligible employees are Category II participants. Category I participants hired on or after August 9, 2004 vest after 20 years of service. Category I participants hired before August 9, 2004 and Category II participants vest after five years of service. The normal retirement age for Category I participants is age 50 with five years of credited service or 20 years of credited service, regardless of age. The normal retirement age for Category II participants is age 50 with five years of credited service. Members are entitled to an annual benefit in the amount of 2.5% of final average basic pay (defined as the participant’s highest three annual basic pays consisting of the participant’s annual basic pay on the date of termination and any prior annual basic pay on the anniversary date of the date of termination) for each year of service up to 20 years, plus 2.0% of FABP for each additional year; plus credit for unused disability leave and up to three years of pre-employment military service as defined in Article 5 – Pensions of the County Code. The maximum benefit is 70% of final earnings, except participants may accrue benefits in excess of the 70% cap for credited disability leave and pre-employment military service. The plan also provides death and disability benefits. C Multiple-Employer Pension Plans - Primary government employees hired prior to July 1, 1969 who elected not to transfer to the Employees Plan and substantially all employees of the Board of Education, Library and Community College participate in plans of the Maryland State Retirement and Pension System (the State System), which are multi-employer cost sharing defined benefit pension plans. The system plans provide retirement and disability benefits, annual cost-of-living adjustments, and death benefits to plan members and beneficiaries. The State System issues a financial report that includes financial statements and required supplementary information that
Anne Arundel County, Maryland Notes to the Financial Statements
A-71
can be obtained at http://www.sra.state.md.us or by writing to State Retirement Agency of Maryland, 120 East Baltimore Street, Baltimore, MD 21202. The County is liable through fiscal year 2020 for employees who were participants in the State System when the County withdrew from the State System. In addition there are two active employees allowed to participate in the State System. Information on the State System follows: Plan description: Retirees and employees of the County are covered by the Maryland State Retirement and Pension System (the System), which is a cost sharing employer public employee retirement system. The State System is made up of two cost-sharing pools: the “State Pool” and the “Municipal Pool”. The Municipal Pool consists of the participating governmental units that elected to join the System. Neither pool shares in each other’s actuarial liabilities, thus participant governmental units that elect to join the State System share in the liabilities of the Municipal Pool only. The State System is comprised of the Teachers’ Retirement and Pension Systems, Employees’ Retirement and Pension System, State Police Retirement System, Judges’ Retirement System, and Law Enforcement Officers’ Pension System. Most of the County retirees and employees participate in the Employees’ System. The State System was established by the State Personnel and Pensions Article of the Annotated Code of Maryland to provide retirement allowances and other benefits to State employees, teachers, police, judges, legislators, and employees of participating governmental units. The Plans are administered by the State Retirement Agency. Responsibility for the System’s administration and operation is vested in a 15-member Board of Trustees.
Benefits provided: The State System provides retirement allowances and other benefits to State employees of participating governmental units, among others. For individuals who become members of the Employees’ Retirement and Pension Systems on or before June 30, 2011, retirement/pension allowances are computed using both the highest three years Average Final Compensation (AFC) and the actual number of years of accumulated creditable service. For individuals who become members of the Employees’ Pension System on or after July 1, 2011, pension allowances are computed using both the highest five years AFC and the actual number of years of accumulated creditable service. Various retirement options are available under each system which ultimately determines how a retirees’ benefits allowance will be computed. Some of these options require actuarial reductions based on the retirees’ and/or designated beneficiary’s attained age and similar actuarial factors.
A member of the Employees’ Retirement System is generally eligible for full retirement benefits upon the earlier of attaining age 60 or accumulating 30 years of creditable service regardless of age. The annual retirement allowance equals 1/55 (1.81%) of the member’s average final compensation (AFC) multiplied by the number of years of accumulated creditable service.
A member of the Employees’ Pension System on or before June 30, 2011 is eligible for full retirement benefits upon the earlier of attaining age 62, with specified years of eligibility service, or accumulating 30 years of eligibility service regardless of age. An individual who becomes a member of the Employees’ Pension System on or after July 1, 2011, is eligible for full retirement benefits if the members’ combined age and eligibility service equals at least 90 years or if the member is at least age 65 and has accrued at least 10 years of eligibility service.
For most individuals who retired from the Employees’ Pension System on or before June 30, 2006, the annual pension allowance equals 1.2% of the members AFC, multiplied by the number of years of credible service accumulated prior to July 1, 1998, plus 1.4% of the members AFC, multiplied by the number of years of credible service accumulated subsequent to June 30, 1998. With certain exceptions, for individuals who are members of the Employees’ Pension System on or after July 1, 2006, the annual pension allowance equals 1.2% of the member’s AFC, multiplied by the number of years of credible service accumulated prior to July 1, 1998 plus 1.8% of the members AFC, multiplied by the number of years of credible service accumulated subsequent to June 30, 1998. Beginning in July 1, 2011, any new member of the Employees’ Pension System shall earn an annual pension allowance equal to 1.5% of the member’s AFC multiplied by the number of years of creditable service accumulated as a member of the Employees’ Pension System. Contributions: The County and covered members are required by State statute to contribute to the State System. Members of the Employees’ Pension System are required to contribute 7.0% annually. Members of the Employees’ Retirement System are required to contribute 5.0% to 7.0% annually, depending on the retirement option selected. The contribution requirements of the members, as well as the State and participating governmental employers are established and may be amended by the Board of Trustees for the State System.
Anne Arundel County, Maryland Notes to the Financial Statements
A-72
The County’s total required contributions during the year ended June 30, 2017 were $1,668,384. The rates varied from 0.0% for the actuarially determined contractual liability to 46.6% of covered payroll for the participant in the Judges Retirement System. The County made its share of the required contributions.
At June 30, 2017, the County reported a liability of $7,073,061 for its proportionate share of the net pension liability of the State System. The net pension liability was measured as of June 30, 2016 and the total pension liability used to calculate the net pension liability was determined by an actuarial valuation as of that date. The County’s proportion of the net pension liability was based on actual employer contributions billed to participating government units for the year ending June 30, 2016. The contributions were increased to adjust for differences between actuarial determined contributions and actual contributions by the State of Maryland. As of June 30, 2016, the County’s proportionate share was 0.004%.
Actuarial assumption: The total pension liability for the State System in the June 30, 2016 actuarial valuation was determined using the following actuarial assumptions, applied to all periods included in the measurement:
Inflation 2.70% general price, 3.20% wage Salary increases 3.30% to 9.20%, including inflation Investment rate of return 7.55%
Mortality rates were based on RP-2014 Mortality Tables with generational mortality projects using scale MP-2014, calibrated to the State System experience.
Actuarial assumptions used in the June 30, 2016 valuation were adopted by the State System’s Board of Trustees based upon review of the System’s experience study for the period 2010-2014, which was completed during FY 2015. Assumptions from the experience study including investment return, inflation, COLA increases, mortality rates, retirement rates, withdrawal rates, disability rates, and rates of salary increase were adopted by the Board for first the use in the actuarial valuation as of June 30, 2015. As a result, an investment return assumption of 7.55% including an inflation assumption of 2.70% was used for the June 30, 2016 valuation.
The long-term expected rate of return on pension plan investments was determined using a building block method in which best-estimate ranges of expected future real rates of return (expected returns, net of pension plan investment expense and inflation) are developed for each major asset class. These ranges are combined to produce the long-range expected rate of return by weighting the expected future real rates by the target asset allocation percentage and by adding expected inflation. Best estimates of geometric real rates of return were adopted by the Board after considering input from the State System’s investment consultant(s) and actuary(s). For each major asset class that is included in the State System’s target asset allocation as of June 30, 2016, these best estimates are summarized in the following table:
Long Term Expected
Target Allocation Real Rate of Return
Public Equity 37% 6.60%
Private Equity 10% 7.40%
Rate Sensitive 20% 1.30%
Credit Opportunity 9% 4.20%
Real Assets 15% 4.70%
Absolute Return 9% 3.70%
Total 100%
Asset Class
The above was the State System’s Board of Trustees adopted asset allocation policy and best estimate of geometric real rates for each major asset class as of June 30, 2016.
Discount rate: The single discount rate of 7.55% was used to measure the total pension liability. This single discount rate was based on the expected rate of return on pension plan investments of 7.55%. The projection of cash flows used to determine this single discount rate assumed that plan member contributions will be made at the current contribution rate and that employer contributions will be made at rates equal to the difference between actuarially determined contribution rates and the member rate. Based on these assumptions, the State System’s fiduciary net
Anne Arundel County, Maryland Notes to the Financial Statements
A-73
position was projected to be available to make all projected future benefit payments of current plan members. Therefore, the long-term expected rate of return on pension plan investments was applied to all periods of projected benefit payments to determine the total pension liability.
For the year ended June 30, 2016, the annual money-weighted rate of return on the Maryland State Retirement and Pension System investments, net of pension expenses was 1.10%. The money-weighted rate of return expresses investment performance, net of investment expense, adjusted for the changing amounts actually invested.
D Funding Policy and Annual Pension Costs – The employee contribution requirements for each defined benefit plan in the Retirement System are set by County legislation. The County’s annual contribution is based on annual actuarial valuations. The Required Supplementary Information following these notes presents changes in net pension liability and related ratios by Plan. Certain participants in the State Retirement and Pension Systems (State plans) are required to contribute 2.0% to 7.0% of compensation to the plans. The County is required to contribute the remaining amounts necessary to fund the plans, except that the State pays the employer’s share of retirement costs on behalf of certain teachers, professional librarians, and related positions for the Board of Education, Library, and Community College, in accordance with State law. These amounts are shown as grant revenue and current expenses in the financial statements of these component units. County expenditures for those employees in the State plans for the years ended June 30, 2017, 2016, and 2015 equal the required contributions and are summarized as follows along with the State’s contribution on behalf on the employees discussed previously.
2017 2016 2015
County contributions:
Primary Government $ 1,576,725 $ 1,379,458 $ 1,199,578
Board of Education 5,484,667 21,428,296 17,425,639
Community College 402,257 392,656 401,473
State contributions on behalf of:
Board of Education 65,114,865 62,703,947 62,052,080
Community College 5,092,151 4,510,355 4,104,793
Library * 1,558,508 1,583,617 1,351,722
$ 79,229,173 $ 91,998,329 $ 86,535,285
* Note: FY 2015 restated to correct amount.
Fiscal Year Ending June 30,
Anne Arundel County, Maryland Notes to the Financial Statements
A-74
E Net Pension Liability of the System by Plan - The components of the net pension liability and assumptions for each Plan at December 31, 2016 as calculated by the actuary are displayed as follows:
Employees' Police Service Fire Service
Detention Officers'
and Deputy
Sheriffs' Total
Retirement Retirement Retirement Retirement Pension
Plan ** Plan Plan Plan System
Total pension liability $ 830,383,057 $ 664,977,684 $ 598,835,855 $ 175,568,918 $ 2,269,765,514
Plan fiduciary net position* (592,099,006) (486,520,135) (485,690,368) (120,339,036) (1,684,648,545)
Plan net pension liability $ 238,284,051 $ 178,457,549 $ 113,145,487 $ 55,229,882 $ 585,116,969
71.30% 73.16% 81.11% 68.54% 74.22%
*Differences in value from Statement of Changes in Fiduciary Net Position are the result of estimates provided to the actuary prior to
completion of financials. Management deems the variances to be immaterial.
**Total includes Anne Arundel County Public Library, component unit, pension liability.
Actuarial assumptions:
Inflation 3.00% 3.00% 3.00% 3.00%
Salary increases Rates vary by participant age for each Plan.
Investment rate of return 7.5%, net of pension plan investment expense, including inflation for each Plan.
Mortality Scale RP-2000 Blue Collar Mortality tables with generational project by Scale AA for each Plan
Set forward for post-
disability mortality 9 years 5 years 5 years 5 years
Plan fiduciary net position as
a percentage of the total
pension liability
The total pension liability was determined by an actuarial valuation as of December 31, 2016 using the
following summarized actuarial assumptions, applied to all periods in that measurement.
An experience and assumption study was conducted in 2012 for the period 2007 to 2011.
Full descriptions of the actuarial assumptions are available in the January 1, 2017 valuation reports.
Long-Term Expected Returns - For investment purposes, the four County Plans which comprise the System
are managed on a co-mingled basis. Therefore, the long-term expected rates of investment return are the same for each Plan. The long-term (30 year) expected rate of return on pension System investments was determined using a building-block method in which best-estimate ranges of expected future real rates of return (expected returns, net of pension plan investment expense and inflation) are developed for each major asset class. These ranges are combined to produce the long-term expected rate of return by using an optimizer program that relies on the arithmetic return inputs, the standard deviation forecast (risk) for each asset class, and the correlations among them. The result is a 30-year nominal, geometric, net-of-fee return forecast for the pension assets. The 30-year real rate of return is calculated by netting the inflation assumption out of the nominal forecast. The nominal and real rates of return forecasts for each major asset class included in the pension System’s target asset allocation as of (December 31, 2016) are summarized in the following table. Data is provided by the System’s Investment Advisor, New England Pension Consultants, which uses a 30-year geometric inflation assumption of 2.75%.
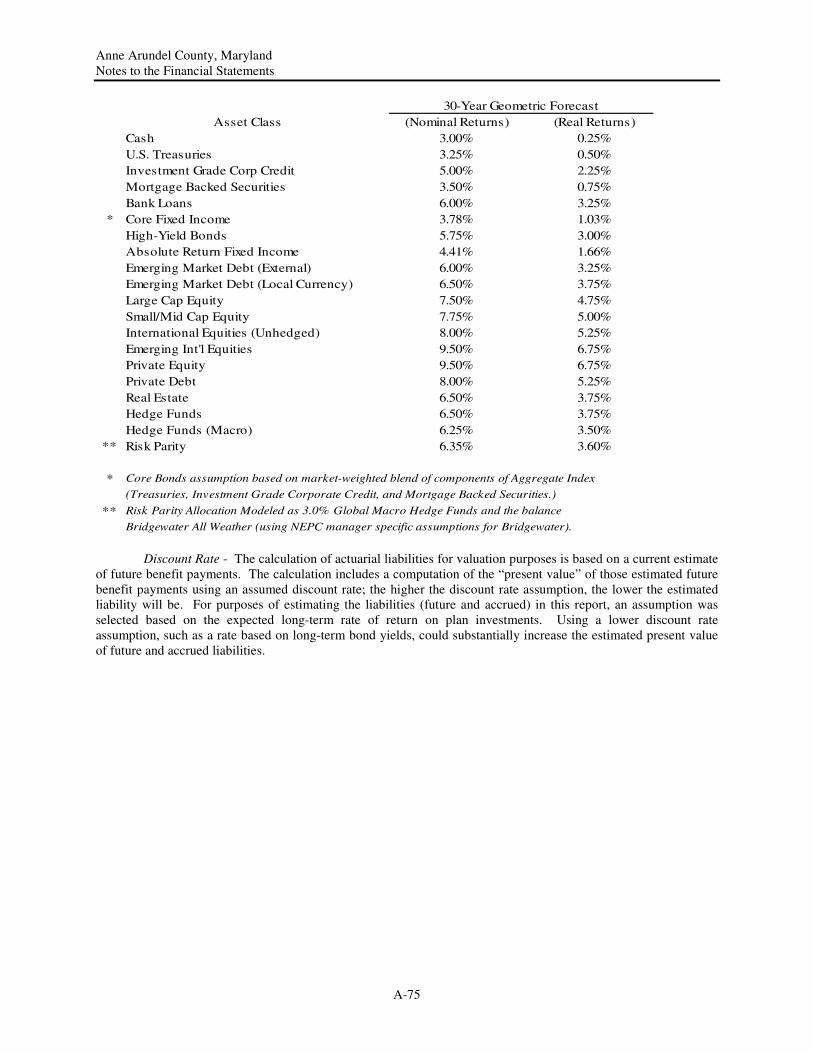
Anne Arundel County, Maryland Notes to the Financial Statements
A-75
Asset Class (Nominal Returns) (Real Returns)
Cash 3.00% 0.25%
U.S. Treasuries 3.25% 0.50%
Investment Grade Corp Credit 5.00% 2.25%
Mortgage Backed Securities 3.50% 0.75%
Bank Loans 6.00% 3.25%
* Core Fixed Income 3.78% 1.03%
High-Yield Bonds 5.75% 3.00%
Absolute Return Fixed Income 4.41% 1.66%
Emerging Market Debt (External) 6.00% 3.25%
Emerging Market Debt (Local Currency) 6.50% 3.75%
Large Cap Equity 7.50% 4.75%
Small/Mid Cap Equity 7.75% 5.00%
International Equities (Unhedged) 8.00% 5.25%
Emerging Int'l Equities 9.50% 6.75%
Private Equity 9.50% 6.75%
Private Debt 8.00% 5.25%
Real Estate 6.50% 3.75%
Hedge Funds 6.50% 3.75%
Hedge Funds (Macro) 6.25% 3.50%
** Risk Parity 6.35% 3.60%
* Core Bonds assumption based on market-weighted blend of components of Aggregate Index
(Treasuries, Investment Grade Corporate Credit, and Mortgage Backed Securities.)
** Risk Parity Allocation Modeled as 3.0% Global Macro Hedge Funds and the balance
Bridgewater All Weather (using NEPC manager specific assumptions for Bridgewater).
30-Year Geometric Forecast
Discount Rate - The calculation of actuarial liabilities for valuation purposes is based on a current estimate of future benefit payments. The calculation includes a computation of the “present value” of those estimated future benefit payments using an assumed discount rate; the higher the discount rate assumption, the lower the estimated liability will be. For purposes of estimating the liabilities (future and accrued) in this report, an assumption was selected based on the expected long-term rate of return on plan investments. Using a lower discount rate assumption, such as a rate based on long-term bond yields, could substantially increase the estimated present value of future and accrued liabilities.
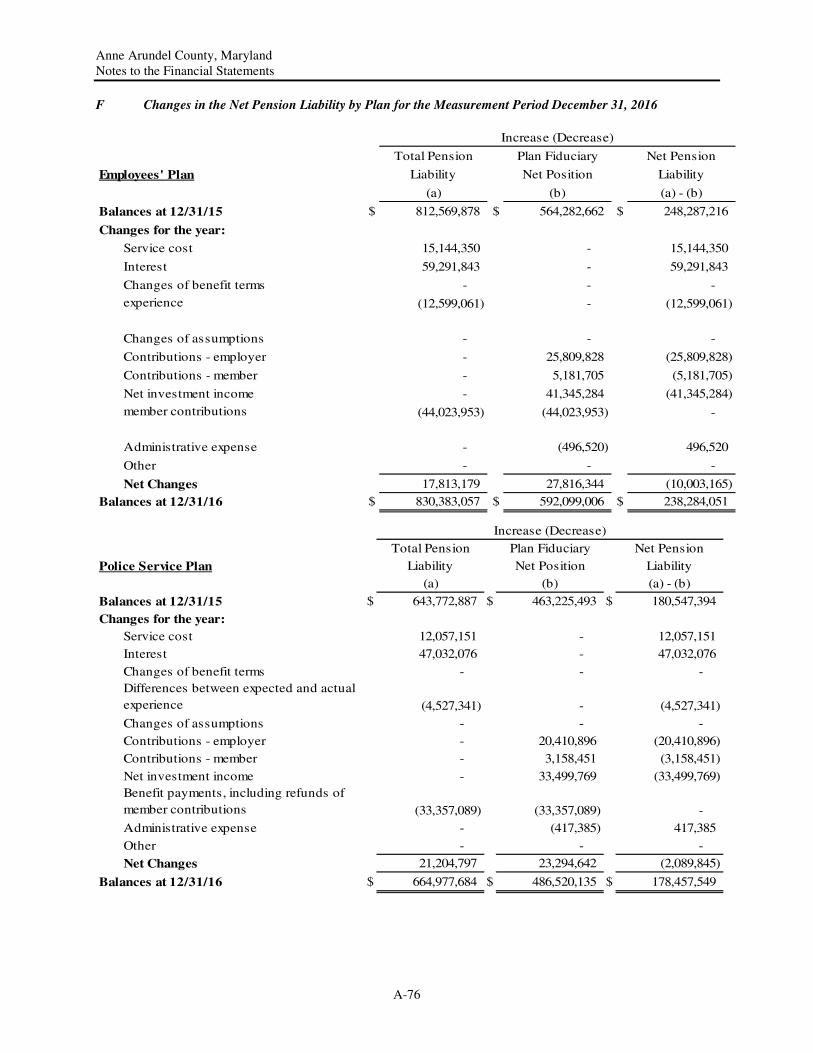
Anne Arundel County, Maryland Notes to the Financial Statements
A-76
F Changes in the Net Pension Liability by Plan for the Measurement Period December 31, 2016
Total Pension Plan Fiduciary Net Pension
Employees' Plan Liability Net Position Liability
(a) (b) (a) - (b)
Balances at 12/31/15 $ 812,569,878 $ 564,282,662 $ 248,287,216
Changes for the year:
Service cost 15,144,350 - 15,144,350
Interest 59,291,843 - 59,291,843
Changes of benefit terms - - -
experience (12,599,061) - (12,599,061)
Changes of assumptions - - -
Contributions - employer - 25,809,828 (25,809,828)
Contributions - member - 5,181,705 (5,181,705)
Net investment income - 41,345,284 (41,345,284)
member contributions (44,023,953) (44,023,953) -
Administrative expense - (496,520) 496,520
Other - - -
Net Changes 17,813,179 27,816,344 (10,003,165)
Balances at 12/31/16 $ 830,383,057 $ 592,099,006 $ 238,284,051
Increase (Decrease)
Total Pension Plan Fiduciary Net Pension
Police Service Plan Liability Net Position Liability
(a) (b) (a) - (b)
Balances at 12/31/15 $ 643,772,887 $ 463,225,493 $ 180,547,394
Changes for the year:
Service cost 12,057,151 - 12,057,151
Interest 47,032,076 - 47,032,076
Changes of benefit terms - - -
Differences between expected and actual
experience (4,527,341) - (4,527,341)
Changes of assumptions - - -
Contributions - employer - 20,410,896 (20,410,896)
Contributions - member - 3,158,451 (3,158,451)
Net investment income - 33,499,769 (33,499,769)
Benefit payments, including refunds of
member contributions (33,357,089) (33,357,089) -
Administrative expense - (417,385) 417,385
Other - - -
Net Changes 21,204,797 23,294,642 (2,089,845)
Balances at 12/31/16 $ 664,977,684 $ 486,520,135 $ 178,457,549
Increase (Decrease)
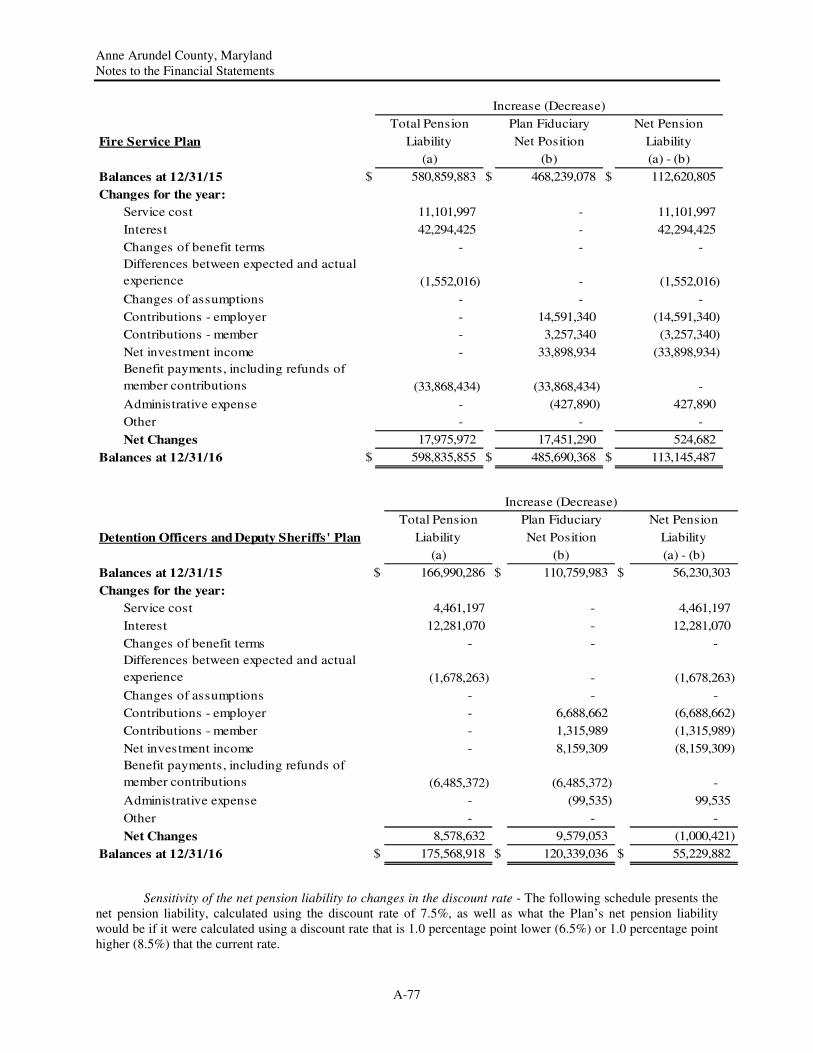
Anne Arundel County, Maryland Notes to the Financial Statements
A-77
Total Pension Plan Fiduciary Net Pension
Fire Service Plan Liability Net Position Liability
(a) (b) (a) - (b)
Balances at 12/31/15 $ 580,859,883 $ 468,239,078 $ 112,620,805
Changes for the year:
Service cost 11,101,997 - 11,101,997
Interest 42,294,425 - 42,294,425
Changes of benefit terms - - -
Differences between expected and actual
experience (1,552,016) - (1,552,016)
Changes of assumptions - - -
Contributions - employer - 14,591,340 (14,591,340)
Contributions - member - 3,257,340 (3,257,340)
Net investment income - 33,898,934 (33,898,934)
Benefit payments, including refunds of
member contributions (33,868,434) (33,868,434) -
Administrative expense - (427,890) 427,890
Other - - -
Net Changes 17,975,972 17,451,290 524,682
Balances at 12/31/16 $ 598,835,855 $ 485,690,368 $ 113,145,487
Increase (Decrease)
Total Pension Plan Fiduciary Net Pension
Detention Officers and Deputy Sheriffs' Plan Liability Net Position Liability
(a) (b) (a) - (b)
Balances at 12/31/15 $ 166,990,286 $ 110,759,983 $ 56,230,303
Changes for the year:
Service cost 4,461,197 - 4,461,197
Interest 12,281,070 - 12,281,070
Changes of benefit terms - - -
Differences between expected and actual
experience (1,678,263) - (1,678,263)
Changes of assumptions - - -
Contributions - employer - 6,688,662 (6,688,662)
Contributions - member - 1,315,989 (1,315,989)
Net investment income - 8,159,309 (8,159,309)
Benefit payments, including refunds of
member contributions (6,485,372) (6,485,372) -
Administrative expense - (99,535) 99,535
Other - - -
Net Changes 8,578,632 9,579,053 (1,000,421)
Balances at 12/31/16 $ 175,568,918 $ 120,339,036 $ 55,229,882
Increase (Decrease)
Sensitivity of the net pension liability to changes in the discount rate - The following schedule presents the net pension liability, calculated using the discount rate of 7.5%, as well as what the Plan’s net pension liability would be if it were calculated using a discount rate that is 1.0 percentage point lower (6.5%) or 1.0 percentage point higher (8.5%) that the current rate.
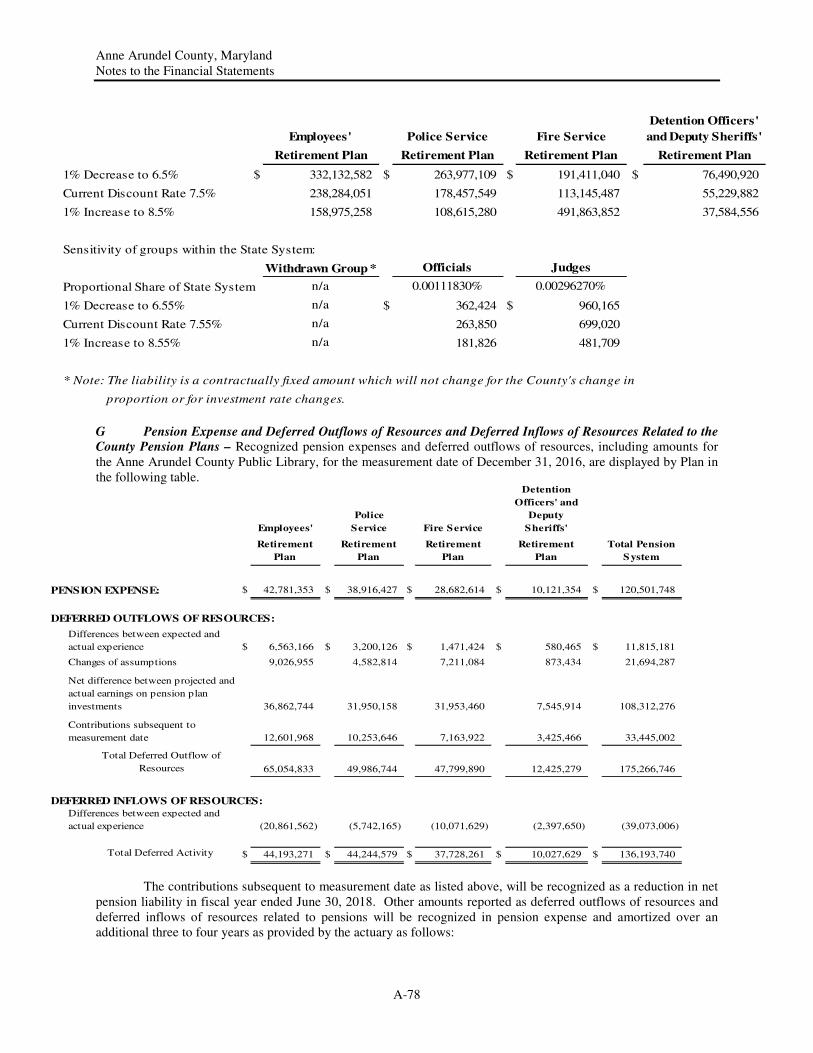
Anne Arundel County, Maryland Notes to the Financial Statements
A-78
Employees' Police Service Fire Service
Detention Officers'
and Deputy Sheriffs'
Retirement Plan Retirement Plan Retirement Plan Retirement Plan
1% Decrease to 6.5% $ 332,132,582 $ 263,977,109 $ 191,411,040 $ 76,490,920
Current Discount Rate 7.5% 238,284,051 178,457,549 113,145,487 55,229,882
1% Increase to 8.5% 158,975,258 108,615,280 491,863,852 37,584,556
Sensitivity of groups within the State System:
Withdrawn Group * Officials Judges
Proportional Share of State System n/a 0.00111830% 0.00296270%
1% Decrease to 6.55% n/a $ 362,424 $ 960,165
Current Discount Rate 7.55% n/a 263,850 699,020
1% Increase to 8.55% n/a 181,826 481,709
* Note: The liability is a contractually fixed amount which will not change for the County's change in
proportion or for investment rate changes.
G Pension Expense and Deferred Outflows of Resources and Deferred Inflows of Resources Related to the County Pension Plans – Recognized pension expenses and deferred outflows of resources, including amounts for the Anne Arundel County Public Library, for the measurement date of December 31, 2016, are displayed by Plan in the following table.
Employees'
Police
Service Fire Service
Detention
Officers' and
Deputy
Sheriffs'
Retirement
Plan
Retirement
Plan
Retirement
Plan
Retirement
Plan
Total Pension
System
PENSION EXPENSE: $ 42,781,353 $ 38,916,427 $ 28,682,614 $ 10,121,354 $ 120,501,748
DEFERRED OUTFLOWS OF RESOURCES:
$ 6,563,166 $ 3,200,126 $ 1,471,424 $ 580,465 $ 11,815,181
9,026,955 4,582,814 7,211,084 873,434 21,694,287
36,862,744 31,950,158 31,953,460 7,545,914 108,312,276
12,601,968 10,253,646 7,163,922 3,425,466 33,445,002
Total Deferred Outflow of
Resources 65,054,833 49,986,744 47,799,890 12,425,279 175,266,746
DEFERRED INFLOWS OF RESOURCES:
(20,861,562) (5,742,165) (10,071,629) (2,397,650) (39,073,006)
Total Deferred Activity $ 44,193,271 $ 44,244,579 $ 37,728,261 $ 10,027,629 $ 136,193,740
Differences between expected and
actual experience
Changes of assumptions
Net difference between projected and
actual earnings on pension plan
investments
Contributions subsequent to
measurement date
Differences between expected and
actual experience
The contributions subsequent to measurement date as listed above, will be recognized as a reduction in net pension liability in fiscal year ended June 30, 2018. Other amounts reported as deferred outflows of resources and deferred inflows of resources related to pensions will be recognized in pension expense and amortized over an additional three to four years as provided by the actuary as follows:
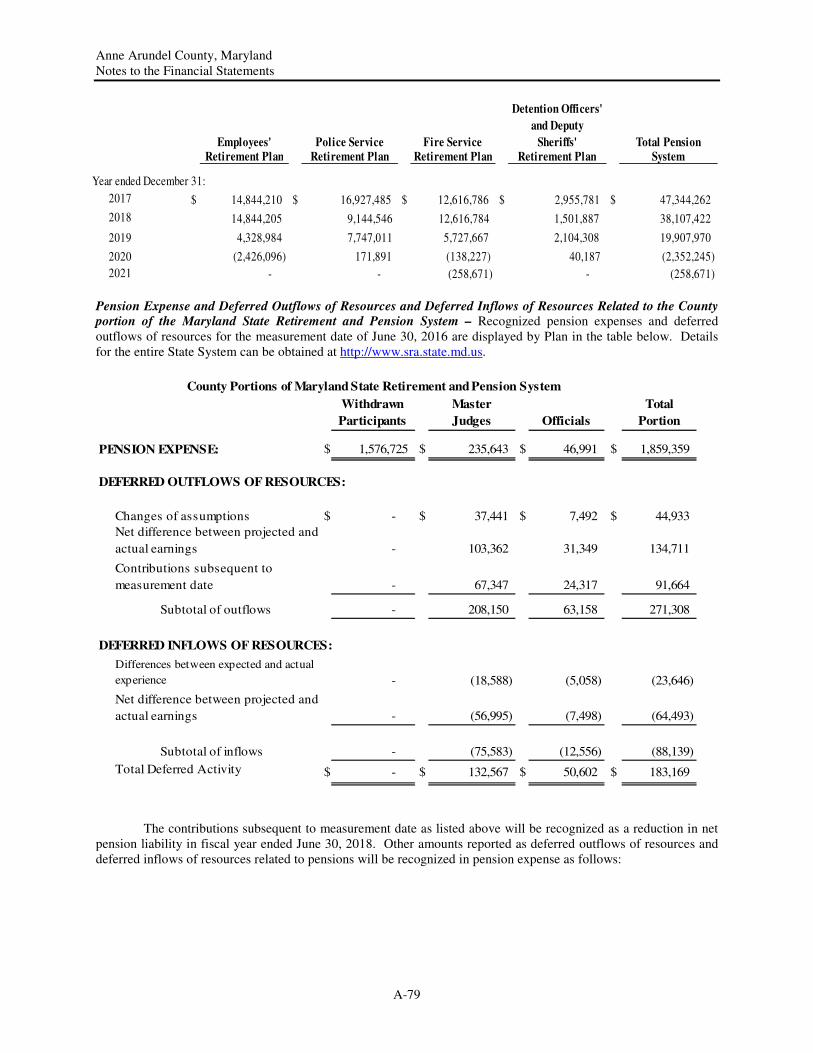
Anne Arundel County, Maryland Notes to the Financial Statements
A-79
Employees' Police Service Fire Service
Detention Officers'
and Deputy
Sheriffs' Total PensionRetirement Plan Retirement Plan Retirement Plan Retirement Plan System
Year ended December 31:
2017 $ 14,844,210 $ 16,927,485 $ 12,616,786 $ 2,955,781 $ 47,344,262
2018 14,844,205 9,144,546 12,616,784 1,501,887 38,107,422
2019 4,328,984 7,747,011 5,727,667 2,104,308 19,907,970
2020 (2,426,096) 171,891 (138,227) 40,187 (2,352,245)
2021 - - (258,671) - (258,671)
Pension Expense and Deferred Outflows of Resources and Deferred Inflows of Resources Related to the County portion of the Maryland State Retirement and Pension System – Recognized pension expenses and deferred outflows of resources for the measurement date of June 30, 2016 are displayed by Plan in the table below. Details for the entire State System can be obtained at http://www.sra.state.md.us.
County Portions of Maryland State Retirement and Pension System
Withdrawn
Participants
Master
Judges Officials
Total
Portion
PENSION EXPENSE: $ 1,576,725 $ 235,643 $ 46,991 $ 1,859,359
DEFERRED OUTFLOWS OF RESOURCES:
$ - $ 37,441 $ 7,492 $ 44,933
- 103,362 31,349 134,711
- 67,347 24,317 91,664
- 208,150 63,158 271,308
DEFERRED INFLOWS OF RESOURCES:
- (18,588) (5,058) (23,646)
- (56,995) (7,498) (64,493)
- (75,583) (12,556) (88,139)
$ - $ 132,567 $ 50,602 $ 183,169
Changes of assumptions
Net difference between projected and
actual earnings
Net difference between projected and
actual earnings
Contributions subsequent to
measurement date
Total Deferred Activity
Subtotal of outflows
Differences between expected and actual
experience
Subtotal of inflows
The contributions subsequent to measurement date as listed above will be recognized as a reduction in net pension liability in fiscal year ended June 30, 2018. Other amounts reported as deferred outflows of resources and deferred inflows of resources related to pensions will be recognized in pension expense as follows:
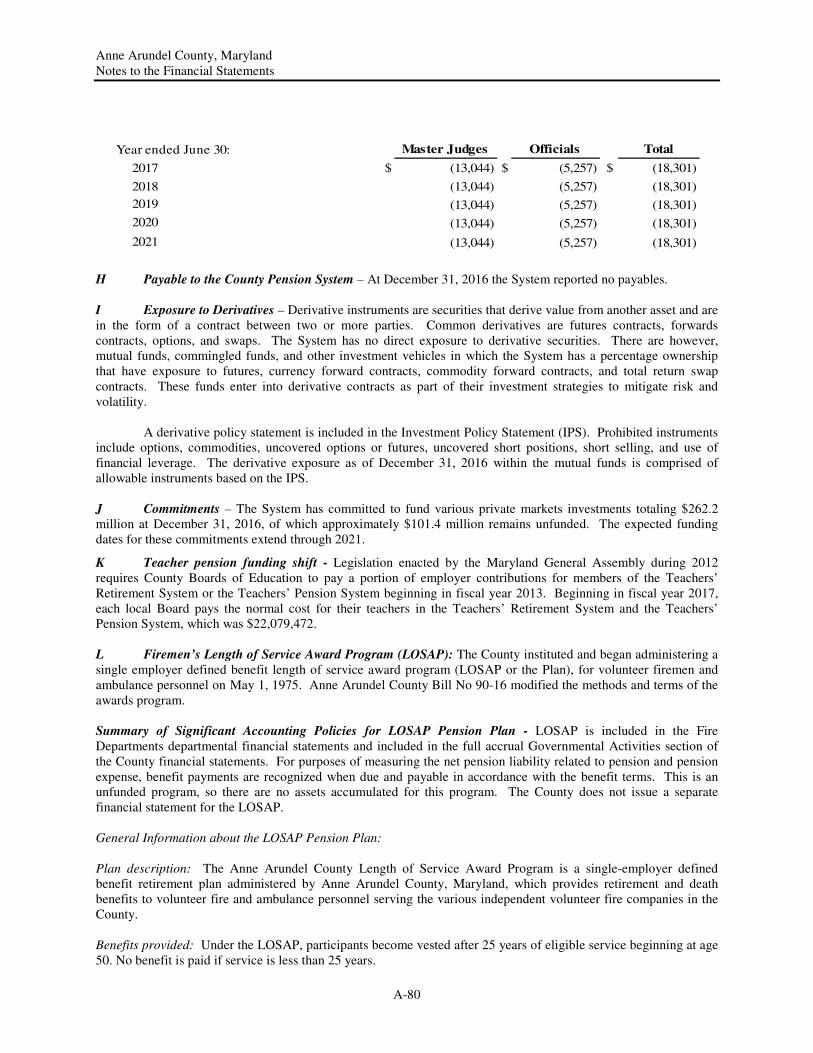
Anne Arundel County, Maryland Notes to the Financial Statements
A-80
Year ended June 30: Master Judges Officials Total
2017 $ (13,044) $ (5,257) $ (18,301)
2018 (13,044) (5,257) (18,301)
2019 (13,044) (5,257) (18,301)
2020 (13,044) (5,257) (18,301)
2021 (13,044) (5,257) (18,301)
H Payable to the County Pension System – At December 31, 2016 the System reported no payables.
I Exposure to Derivatives – Derivative instruments are securities that derive value from another asset and are in the form of a contract between two or more parties. Common derivatives are futures contracts, forwards contracts, options, and swaps. The System has no direct exposure to derivative securities. There are however, mutual funds, commingled funds, and other investment vehicles in which the System has a percentage ownership that have exposure to futures, currency forward contracts, commodity forward contracts, and total return swap contracts. These funds enter into derivative contracts as part of their investment strategies to mitigate risk and volatility. A derivative policy statement is included in the Investment Policy Statement (IPS). Prohibited instruments include options, commodities, uncovered options or futures, uncovered short positions, short selling, and use of financial leverage. The derivative exposure as of December 31, 2016 within the mutual funds is comprised of allowable instruments based on the IPS.
J Commitments – The System has committed to fund various private markets investments totaling $262.2 million at December 31, 2016, of which approximately $101.4 million remains unfunded. The expected funding dates for these commitments extend through 2021.
K Teacher pension funding shift - Legislation enacted by the Maryland General Assembly during 2012 requires County Boards of Education to pay a portion of employer contributions for members of the Teachers’ Retirement System or the Teachers’ Pension System beginning in fiscal year 2013. Beginning in fiscal year 2017, each local Board pays the normal cost for their teachers in the Teachers’ Retirement System and the Teachers’ Pension System, which was $22,079,472. L Firemen’s Length of Service Award Program (LOSAP): The County instituted and began administering a single employer defined benefit length of service award program (LOSAP or the Plan), for volunteer firemen and ambulance personnel on May 1, 1975. Anne Arundel County Bill No 90-16 modified the methods and terms of the awards program. Summary of Significant Accounting Policies for LOSAP Pension Plan - LOSAP is included in the Fire Departments departmental financial statements and included in the full accrual Governmental Activities section of the County financial statements. For purposes of measuring the net pension liability related to pension and pension expense, benefit payments are recognized when due and payable in accordance with the benefit terms. This is an unfunded program, so there are no assets accumulated for this program. The County does not issue a separate financial statement for the LOSAP.
General Information about the LOSAP Pension Plan:
Plan description: The Anne Arundel County Length of Service Award Program is a single-employer defined benefit retirement plan administered by Anne Arundel County, Maryland, which provides retirement and death benefits to volunteer fire and ambulance personnel serving the various independent volunteer fire companies in the County. Benefits provided: Under the LOSAP, participants become vested after 25 years of eligible service beginning at age 50. No benefit is paid if service is less than 25 years.
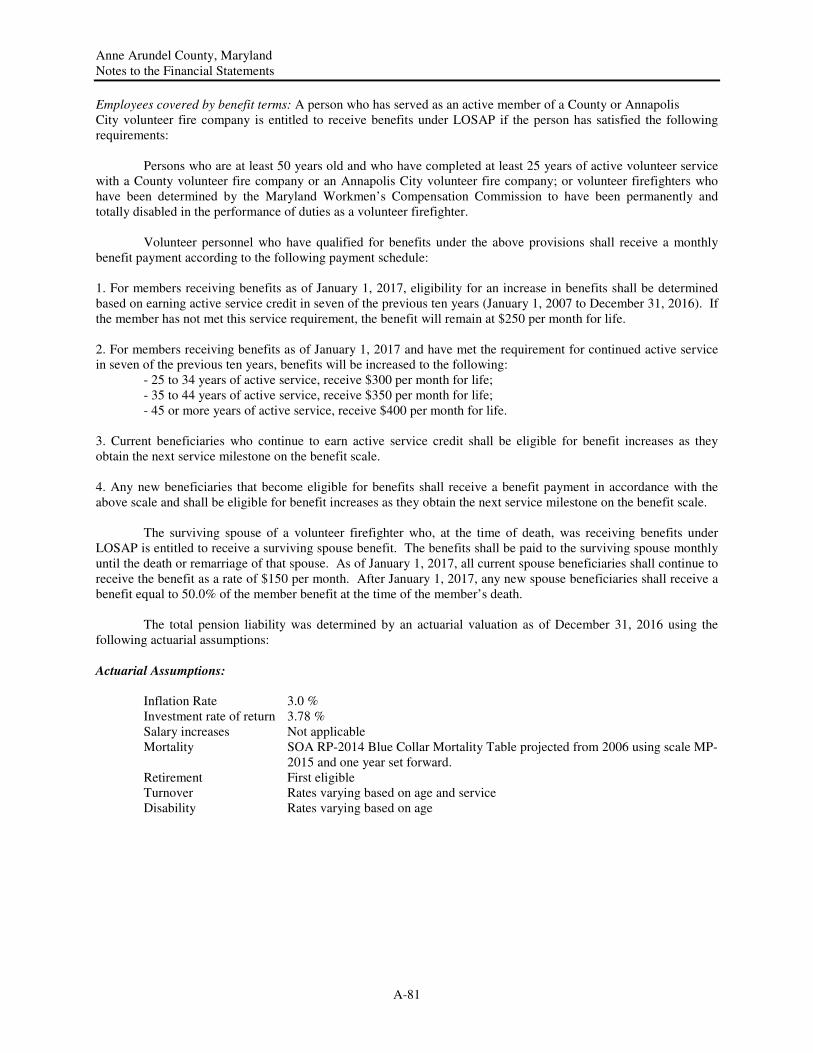
Anne Arundel County, Maryland Notes to the Financial Statements
A-81
Employees covered by benefit terms: A person who has served as an active member of a County or Annapolis City volunteer fire company is entitled to receive benefits under LOSAP if the person has satisfied the following requirements:
Persons who are at least 50 years old and who have completed at least 25 years of active volunteer service with a County volunteer fire company or an Annapolis City volunteer fire company; or volunteer firefighters who have been determined by the Maryland Workmen’s Compensation Commission to have been permanently and totally disabled in the performance of duties as a volunteer firefighter.
Volunteer personnel who have qualified for benefits under the above provisions shall receive a monthly benefit payment according to the following payment schedule: 1. For members receiving benefits as of January 1, 2017, eligibility for an increase in benefits shall be determined based on earning active service credit in seven of the previous ten years (January 1, 2007 to December 31, 2016). If the member has not met this service requirement, the benefit will remain at $250 per month for life. 2. For members receiving benefits as of January 1, 2017 and have met the requirement for continued active service in seven of the previous ten years, benefits will be increased to the following:
- 25 to 34 years of active service, receive $300 per month for life; - 35 to 44 years of active service, receive $350 per month for life; - 45 or more years of active service, receive $400 per month for life.
3. Current beneficiaries who continue to earn active service credit shall be eligible for benefit increases as they obtain the next service milestone on the benefit scale. 4. Any new beneficiaries that become eligible for benefits shall receive a benefit payment in accordance with the above scale and shall be eligible for benefit increases as they obtain the next service milestone on the benefit scale.
The surviving spouse of a volunteer firefighter who, at the time of death, was receiving benefits under LOSAP is entitled to receive a surviving spouse benefit. The benefits shall be paid to the surviving spouse monthly until the death or remarriage of that spouse. As of January 1, 2017, all current spouse beneficiaries shall continue to receive the benefit as a rate of $150 per month. After January 1, 2017, any new spouse beneficiaries shall receive a benefit equal to 50.0% of the member benefit at the time of the member’s death.
The total pension liability was determined by an actuarial valuation as of December 31, 2016 using the
following actuarial assumptions:
Actuarial Assumptions:
Inflation Rate 3.0 % Investment rate of return 3.78 %
Salary increases Not applicable Mortality SOA RP-2014 Blue Collar Mortality Table projected from 2006 using scale MP-
2015 and one year set forward. Retirement First eligible Turnover Rates varying based on age and service Disability Rates varying based on age
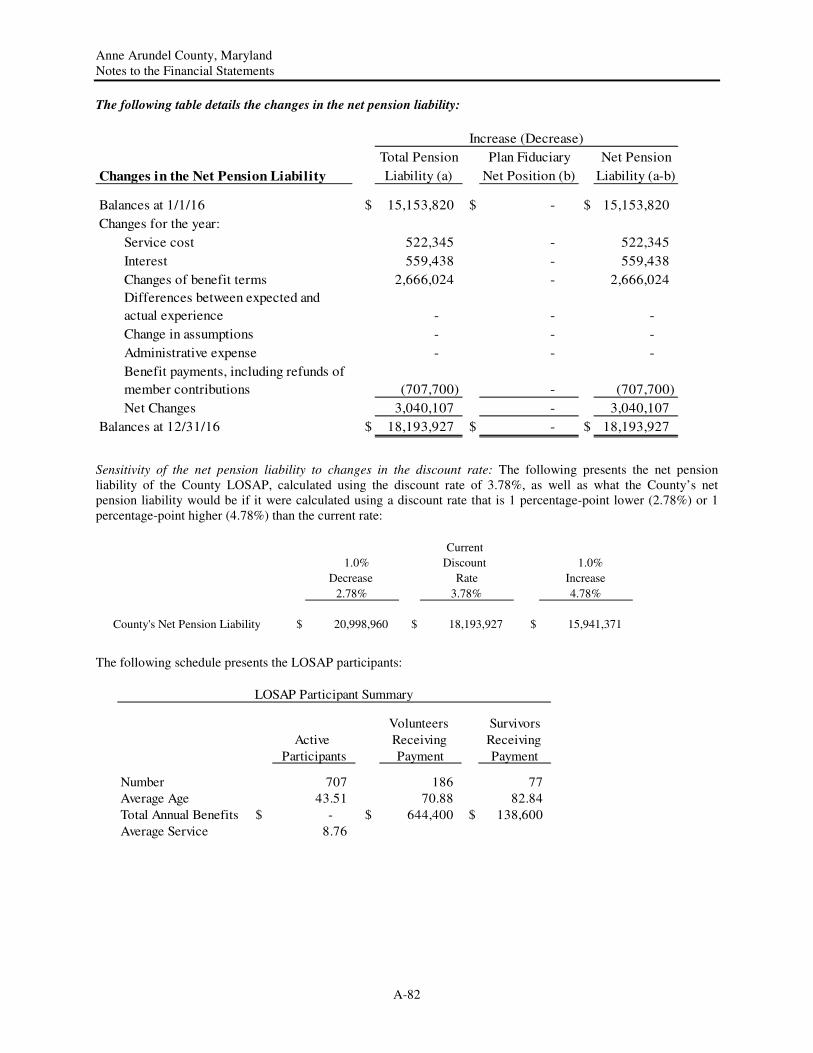
Anne Arundel County, Maryland Notes to the Financial Statements
A-82
The following table details the changes in the net pension liability:
Sensitivity of the net pension liability to changes in the discount rate: The following presents the net pension liability of the County LOSAP, calculated using the discount rate of 3.78%, as well as what the County’s net pension liability would be if it were calculated using a discount rate that is 1 percentage-point lower (2.78%) or 1 percentage-point higher (4.78%) than the current rate:
The following schedule presents the LOSAP participants:
Volunteers Survivors
Active Receiving Receiving
Participants Payment Payment
Number 707 186 77
Average Age 43.51 70.88 82.84
Total Annual Benefits $ - $ 644,400 $ 138,600
Average Service 8.76
LOSAP Participant Summary
Total Pension Plan Fiduciary Net Pension
Liability (a) Net Position (b) Liability (a-b)
$ 15,153,820 $ - $ 15,153,820
Service cost 522,345 - 522,345
Interest 559,438 - 559,438
Changes of benefit terms 2,666,024 - 2,666,024
Differences between expected and
actual experience - - -
Change in assumptions - - -
Administrative expense - - -
Benefit payments, including refunds of
member contributions (707,700) - (707,700)
Net Changes 3,040,107 - 3,040,107
$ 18,193,927 $ - $ 18,193,927
Increase (Decrease)
Balances at 1/1/16
Balances at 12/31/16
Changes for the year:
Changes in the Net Pension Liability
Current
1.0% Discount 1.0% Decrease Rate Increase
2.78% 3.78% 4.78%
County's Net Pension Liability $ 20,998,960 $ 18,193,927 $ 15,941,371
Anne Arundel County, Maryland Notes to the Financial Statements
A-83
13 Other Post-employment Benefits
The primary government, the Board of Education, the Community College, and the Library administer multi-employer defined benefit healthcare plans for retirees. The following provides a summary of the plans’ descriptions and eligibility, funding policies and sources of authorization, annual cost and net obligations, and the actuarial methods and assumptions used in determining costs and liabilities. In addition, required supplementary information includes trend data about these plans. The Supplementary Information following these notes presents multi-year trend information about whether the actuarial value of each plan’s assets is increasing or decreasing relative to the actuarial accrued liability for benefits year to year over a four-year period.
Actuarial valuation of an ongoing plan involves estimates of the value of reported amounts and
assumptions about the probability of occurrence of events far into the future. Amounts determined regarding the funding status of the plan and the annual required contributions of the employer are subject to continual revisions as actual results are compared with past expectations and new estimates are made about the future. A Plan Description, Eligibility, Authorization, and Funding Policy - The primary government provides a group health plan for employees and retirees under the authority of § 6-1-308 of the County Code. This health plan may be extended to other component units under § 6-1-309 of the County Code. The Community College and the Library provide retiree health insurance through participation in the County’s health plans. The County collects premiums from these entities to offset the related costs. The County Code requires the County to pay 80.0% of the health coverage cost for current County retirees and terminated vested employees that retired before July 1, 2014. Employees not eligible for normal or early retirement by January 1, 2017 will receive a subsidy based on years of service. The Library currently pays 80.0% for Library retirees. The primary government plan provides the same health plans to active employees and pre-age sixty-five retirees. The County offers a Medicare Advantage Plan to post age sixty-five retirees. The County offers the same prescription benefit for active employees and pre-age sixty-five retirees. Post age sixty-five retirees are eligible to participate in an Employer Group Waiver Plan (EGWP) plus WRAP for prescription benefits. County and Library retirees have the option of retaining dental and vision coverage, but must pay the full premium for these benefits. Anne Arundel County Public Schools (AACPS) employees eligible to retire and receive Maryland State Retirement Agency (MSRA) benefits may be eligible for retiree healthcare benefits based on date of hire and service criteria. Employees hired prior to September 15, 2002 receive Board funding of 75.0% for Medical/Rx and dental benefits. For employees hired after September 15, 2002, ten years of AACPS service is required to be eligible for retiree health benefits. The Board funds a portion of the medical premium ranging from 25.0% with ten years of service to 75.0% with twenty or more years of service. No Board funding is provided for dental benefits. No Board funding is provided for vision coverage regardless of service date. Active employees and retirees have the same medical, dental, and vision plans while retirees over sixty-five have three Medicare Supplemental Plans available. The retiree and active prescription plan co-payments differ. The retiree plan is evaluated separately based on claims experience; however, a blended percentage increase has been applied to the retiree rates. The Community College (the College) provides medical, dental, and vision benefits to eligible retirees who are enrolled in medical coverage at the time of retirement. The benefit levels, employee contributions, and employer contributions are governed by and may be amended by the College Board of Trustees. Retirees are eligible for these benefits if they have a minimum of ten years of service and meet the eligibility requirement of their retirement plan, (Maryland State Retirement System or Optional plan). The College contributes to the cost of retirees’ benefits at a rate of 2.5% for each year of service, and employees must have at least ten years of service to qualify. The maximum paid by the College is 75.0%. Retirees have no vested rights to these benefits. A copy of the Anne Arundel Retiree Health Benefits Trust (OPEB Trust) financial statements may be obtained by contacting Anne Arundel County Office of Personnel, 2660 Riva Road, Annapolis, MD 21401. The number of participants eligible to participate in the plans as of July 1, 2016 is presented as follows. Inactive individuals include both retirees and those who are terminated and vested.
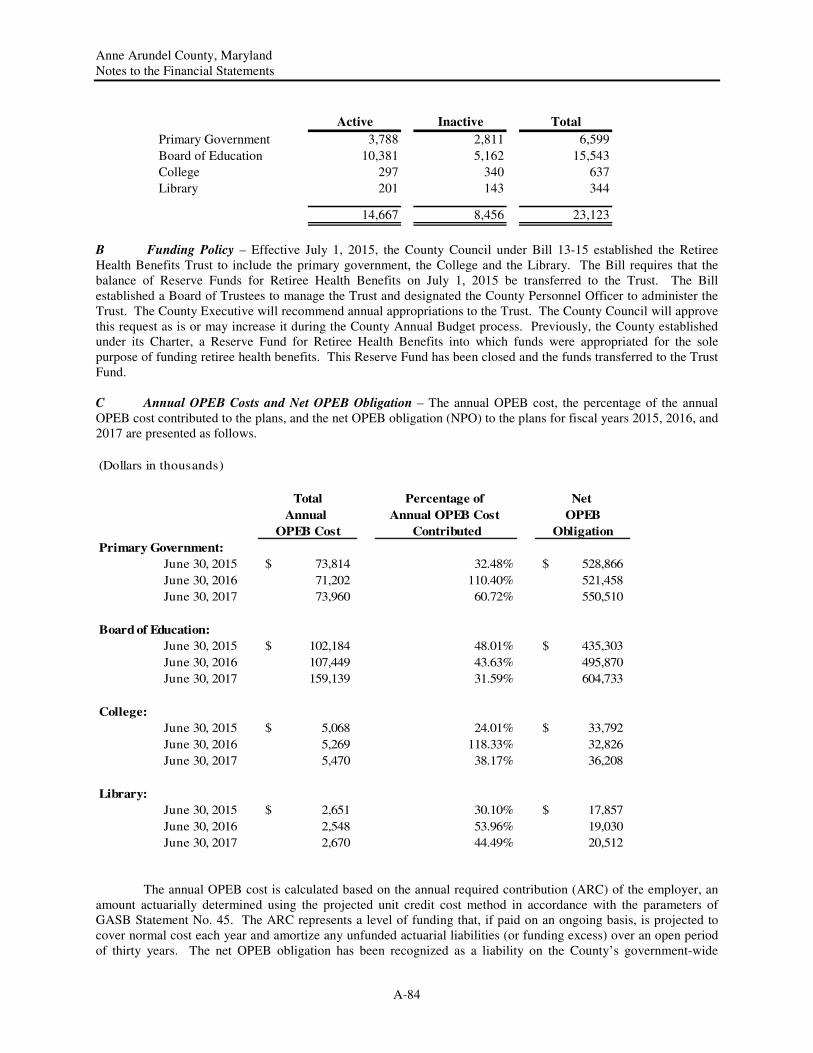
Anne Arundel County, Maryland Notes to the Financial Statements
A-84
Active Inactive Total
Primary Government 3,788 2,811 6,599
Board of Education 10,381 5,162 15,543
College 297 340 637
Library 201 143 344
14,667 8,456 23,123
B Funding Policy – Effective July 1, 2015, the County Council under Bill 13-15 established the Retiree Health Benefits Trust to include the primary government, the College and the Library. The Bill requires that the balance of Reserve Funds for Retiree Health Benefits on July 1, 2015 be transferred to the Trust. The Bill established a Board of Trustees to manage the Trust and designated the County Personnel Officer to administer the Trust. The County Executive will recommend annual appropriations to the Trust. The County Council will approve this request as is or may increase it during the County Annual Budget process. Previously, the County established under its Charter, a Reserve Fund for Retiree Health Benefits into which funds were appropriated for the sole purpose of funding retiree health benefits. This Reserve Fund has been closed and the funds transferred to the Trust Fund. C Annual OPEB Costs and Net OPEB Obligation – The annual OPEB cost, the percentage of the annual OPEB cost contributed to the plans, and the net OPEB obligation (NPO) to the plans for fiscal years 2015, 2016, and 2017 are presented as follows.
(Dollars in thousands)
Total Percentage of Net
Annual Annual OPEB Cost OPEB
OPEB Cost Contributed Obligation
Primary Government:
June 30, 2015 73,814$ 32.48% 528,866$
June 30, 2016 71,202 110.40% 521,458
June 30, 2017 73,960 60.72% 550,510
Board of Education:
June 30, 2015 102,184$ 48.01% 435,303$
June 30, 2016 107,449 43.63% 495,870
June 30, 2017 159,139 31.59% 604,733
College:
June 30, 2015 5,068$ 24.01% 33,792$
June 30, 2016 5,269 118.33% 32,826
June 30, 2017 5,470 38.17% 36,208
Library:
June 30, 2015 2,651$ 30.10% 17,857$
June 30, 2016 2,548 53.96% 19,030
June 30, 2017 2,670 44.49% 20,512
The annual OPEB cost is calculated based on the annual required contribution (ARC) of the employer, an amount actuarially determined using the projected unit credit cost method in accordance with the parameters of GASB Statement No. 45. The ARC represents a level of funding that, if paid on an ongoing basis, is projected to cover normal cost each year and amortize any unfunded actuarial liabilities (or funding excess) over an open period of thirty years. The net OPEB obligation has been recognized as a liability on the County’s government-wide
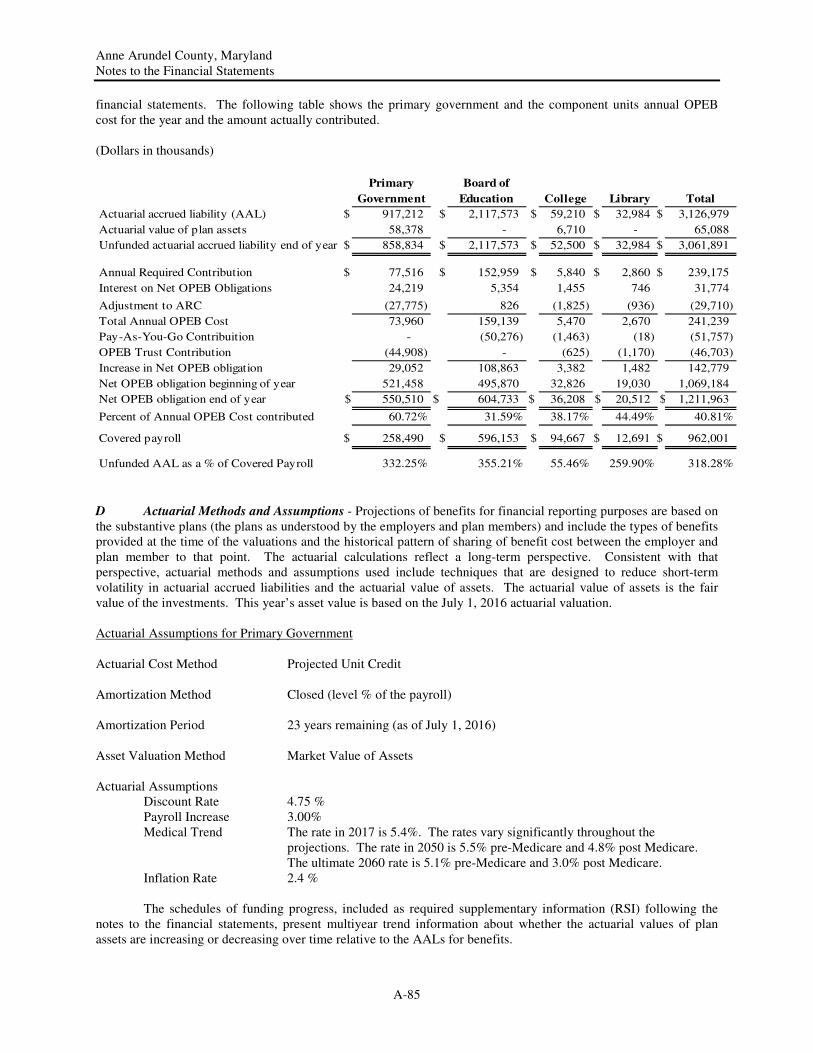
Anne Arundel County, Maryland Notes to the Financial Statements
A-85
financial statements. The following table shows the primary government and the component units annual OPEB cost for the year and the amount actually contributed. (Dollars in thousands)
Primary
Government
Board of
Education College Library Total
Actuarial accrued liability (AAL) $ 917,212 $ 2,117,573 $ 59,210 $ 32,984 $ 3,126,979
Actuarial value of plan assets 58,378 - 6,710 - 65,088
Unfunded actuarial accrued liability end of year $ 858,834 $ 2,117,573 $ 52,500 $ 32,984 $ 3,061,891
Annual Required Contribution $ 77,516 $ 152,959 $ 5,840 $ 2,860 $ 239,175
Interest on Net OPEB Obligations 24,219 5,354 1,455 746 31,774
Adjustment to ARC (27,775) 826 (1,825) (936) (29,710)
Total Annual OPEB Cost 73,960 159,139 5,470 2,670 241,239
Pay-As-You-Go Contribuition - (50,276) (1,463) (18) (51,757)
OPEB Trust Contribution (44,908) - (625) (1,170) (46,703)
Increase in Net OPEB obligation 29,052 108,863 3,382 1,482 142,779
Net OPEB obligation beginning of year 521,458 495,870 32,826 19,030 1,069,184
Net OPEB obligation end of year $ 550,510 $ 604,733 $ 36,208 $ 20,512 $ 1,211,963
Percent of Annual OPEB Cost contributed 60.72% 31.59% 38.17% 44.49% 40.81%
Covered payroll $ 258,490 $ 596,153 $ 94,667 $ 12,691 $ 962,001
Unfunded AAL as a % of Covered Payroll 332.25% 355.21% 55.46% 259.90% 318.28%
D Actuarial Methods and Assumptions - Projections of benefits for financial reporting purposes are based on the substantive plans (the plans as understood by the employers and plan members) and include the types of benefits provided at the time of the valuations and the historical pattern of sharing of benefit cost between the employer and plan member to that point. The actuarial calculations reflect a long-term perspective. Consistent with that perspective, actuarial methods and assumptions used include techniques that are designed to reduce short-term volatility in actuarial accrued liabilities and the actuarial value of assets. The actuarial value of assets is the fair value of the investments. This year’s asset value is based on the July 1, 2016 actuarial valuation. Actuarial Assumptions for Primary Government Actuarial Cost Method Projected Unit Credit Amortization Method Closed (level % of the payroll) Amortization Period 23 years remaining (as of July 1, 2016) Asset Valuation Method Market Value of Assets Actuarial Assumptions Discount Rate 4.75 % Payroll Increase 3.00%
Medical Trend The rate in 2017 is 5.4%. The rates vary significantly throughout the projections. The rate in 2050 is 5.5% pre-Medicare and 4.8% post Medicare. The ultimate 2060 rate is 5.1% pre-Medicare and 3.0% post Medicare.
Inflation Rate 2.4 %
The schedules of funding progress, included as required supplementary information (RSI) following the notes to the financial statements, present multiyear trend information about whether the actuarial values of plan assets are increasing or decreasing over time relative to the AALs for benefits.
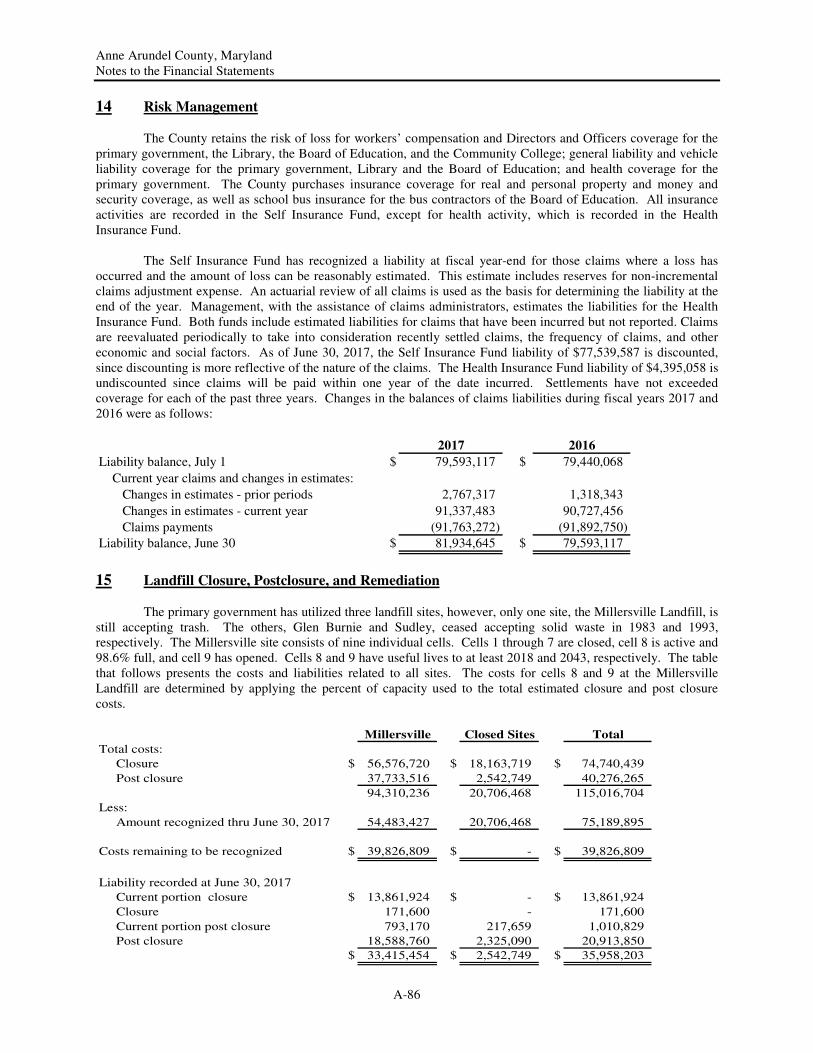
Anne Arundel County, Maryland Notes to the Financial Statements
A-86
14 Risk Management The County retains the risk of loss for workers’ compensation and Directors and Officers coverage for the primary government, the Library, the Board of Education, and the Community College; general liability and vehicle liability coverage for the primary government, Library and the Board of Education; and health coverage for the primary government. The County purchases insurance coverage for real and personal property and money and security coverage, as well as school bus insurance for the bus contractors of the Board of Education. All insurance activities are recorded in the Self Insurance Fund, except for health activity, which is recorded in the Health Insurance Fund. The Self Insurance Fund has recognized a liability at fiscal year-end for those claims where a loss has occurred and the amount of loss can be reasonably estimated. This estimate includes reserves for non-incremental claims adjustment expense. An actuarial review of all claims is used as the basis for determining the liability at the end of the year. Management, with the assistance of claims administrators, estimates the liabilities for the Health Insurance Fund. Both funds include estimated liabilities for claims that have been incurred but not reported. Claims are reevaluated periodically to take into consideration recently settled claims, the frequency of claims, and other economic and social factors. As of June 30, 2017, the Self Insurance Fund liability of $77,539,587 is discounted, since discounting is more reflective of the nature of the claims. The Health Insurance Fund liability of $4,395,058 is undiscounted since claims will be paid within one year of the date incurred. Settlements have not exceeded coverage for each of the past three years. Changes in the balances of claims liabilities during fiscal years 2017 and 2016 were as follows:
2017 2016
Liability balance, July 1 $ 79,593,117 $ 79,440,068
Current year claims and changes in estimates:
Changes in estimates - prior periods 2,767,317 1,318,343
Changes in estimates - current year 91,337,483 90,727,456
Claims payments (91,763,272) (91,892,750)
Liability balance, June 30 $ 81,934,645 $ 79,593,117
15 Landfill Closure, Postclosure, and Remediation The primary government has utilized three landfill sites, however, only one site, the Millersville Landfill, is still accepting trash. The others, Glen Burnie and Sudley, ceased accepting solid waste in 1983 and 1993, respectively. The Millersville site consists of nine individual cells. Cells 1 through 7 are closed, cell 8 is active and 98.6% full, and cell 9 has opened. Cells 8 and 9 have useful lives to at least 2018 and 2043, respectively. The table that follows presents the costs and liabilities related to all sites. The costs for cells 8 and 9 at the Millersville Landfill are determined by applying the percent of capacity used to the total estimated closure and post closure costs.
Millersville Closed Sites Total
Total costs:
Closure $ 56,576,720 $ 18,163,719 $ 74,740,439
Post closure 37,733,516 2,542,749 40,276,265
94,310,236 20,706,468 115,016,704
Less:
Amount recognized thru June 30, 2017 54,483,427 20,706,468 75,189,895
Costs remaining to be recognized $ 39,826,809 $ - $ 39,826,809
Liability recorded at June 30, 2017
Current portion closure $ 13,861,924 $ - $ 13,861,924
Closure 171,600 - 171,600
Current portion post closure 793,170 217,659 1,010,829
Post closure 18,588,760 2,325,090 20,913,850
$ 33,415,454 $ 2,542,749 $ 35,958,203
Anne Arundel County, Maryland Notes to the Financial Statements
A-87
The primary government accounts for landfill activities in the Solid Waste Fund. Management estimates the costs of closure, post closure, remediation, and monitoring the landfills based on federal and state regulations. These estimates are recorded at current costs and are management’s best judgment of the minimum cost required to correct identified problems and close and remediate open cells. These estimates are subject to periodic reevaluation, and actual costs may differ due to inflation or deflation, changes in technology, or changes in applicable laws and regulations. The closure reserves increased in the amount of $922,975 and post closure reserves decreased by $284,130 in fiscal year 2017. These amounts include changes to the estimates in the reserves, payments, and other adjustments. The Solid Waste Fund has restricted assets of $12,845,680 for closure and post closure care as of June 30, 2017.
16 Tax Abatements Anne Arundel County provides tax abatements through the following programs - Payment in Lieu of Taxes (PILOT), Brownfields Site property tax credits, Agricultural Land tax credits and Enterprise Zone tax credits. The purpose of the County PILOT program is to provide quality multi-family housing communities for households of limited income in the County. Agreements are made with the County in negotiated amounts in lieu of County real property taxes per Tax Property Article § 7-506.1. For fiscal year 2017, the net amount of taxes abated after receipt of the PILOT payments was $621,550. A Brownfields Site Tax Credit – The County provides a Brownfields Site tax credit on real property taxes levied on qualified brownfields sites as authorized by Tax Property Article § 9-229. The brownfields tax credit is effective for each of the five taxable years following the issuance of the notice of revaluation by the State Department of Assessments and Taxation after completion of a voluntary cleanup or a corrective action plan for a qualified site. For fiscal year 2017, the total amount of taxes abated for brownfields sites was $1,192,397.
B Agricultural Land Tax Credit – The County provides an agricultural land tax credit on real property taxes levied on agricultural land and woodland if the property is included in an agricultural preservation district as provided in the Agriculture Article § 2-509 of the State Code or a County agricultural district as provided in County Code and the landowner has agreed to remain in the district for at least ten years. For fiscal year 2017, the total amount of agricultural taxes abated was $559,098. C Enterprise Zone Tax Credit – The County provides enterprise zone tax incentives to businesses and property owners located in economically distressed communities. The Enterprise Zone tax credit from County real property taxes for eligible assessments of qualified properties is authorized per Tax Property Article § 9-103. For fiscal year 2017, there were no County participants in this program, therefore no taxes were abated. D The State of Maryland – The State of Maryland has programs that result in tax abatements for Anne Arundel County real property taxes. Per Tax Property Article § 8-209, property owners of qualified agricultural land receive a preferential land value. Land is assessed according to its current use and not according to its market value, resulting in a reduced assessed value of the land and thereby reducing the taxes. Lower assessments are given for land that is devoted to farm or woodland uses. For fiscal year 2017, there were 1,530 accounts totaling 46,673 acres receiving a preferential land value of $12,201,910. The exact amount of the tax abatement is unknown because the State Department of Assessments and Taxation is unable to provide the market value and can only provide the preferential land value.
Qualified country clubs and golf courses are assessed according to their preferred use value rather than their market value per Tax Property Article§§ 8-212 - 8-218 . This lower assessment results in lower taxes. For fiscal year 2017, the difference between the preferred use value and the market value reduced the assessments by $17,386,471, resulting in an abatement of $159,086 in County real property taxes.
17 Contingent Liabilities A Impact Fees – At June 30, 2017, the primary government held impact fees accumulated for construction of schools and roads in designated districts of the County. County legislation authorizes the collection of such fees. In addition, the County has entered into impact fee agreements with developers who provide offsite improvements
Anne Arundel County, Maryland Notes to the Financial Statements
A-88
designed to lessen the impact of development on the immediate community. Unredeemed impact fee credits totaled $20,056,865 as of June 30, 2017. B Lawsuits – Certain current owners of property on which impact fees were paid in fiscal years 1988 through 1996 have pursued a class action suit against the County seeking refunds of development impact fees paid to the County during these fiscal years on grounds that they were not expended or encumbered in a timely manner under the County Code. On July 24, 2012, the Circuit Court issued a judgment finding that with consideration of encumbrances, impact fee refunds of $1,342,360 (subject to 5% interest from the date of payment of each impact fee) are due to the current owners of certain specified impact fee paying properties. In a July 29, 2013 opinion, the Court of Special Appeals affirmed the Circuit Court. The amount of refunds and interest ordered to be paid by the County totaled $2,839,317. On November 7, 2016 the County mailed checks to individual property owners as required by law. It is possible that the County will be assessed a penalty by the Internal Revenue Service for payments made pursuant to Court order to property owners who failed to provide their social security number or tax identification number to the County despite request for the same. In the event of such a penalty, the County will request that it be abated, relying on its substantial efforts to obtain this information from the taxpayers. The property owners noted an appeal to the Court of Special Appeals on September 6, 2017 claiming that they are due an additional $2.7 million in impact fee refunds and interest. The appeal is pending.
On November 14, 2011, four individuals commenced a class action complaint against the County seeking refunds of impact fees paid to the County in fiscal years 1997 through 2002 on grounds that they were not expended or encumbered in a timely manner under the County Code. On April 25, 2013, the Circuit Court certified a class action of persons who are current property owners of property upon which impact fees were paid to the County in certain fiscal years subsequent to fiscal year 1996 and for which impact fees were not timely expended or encumbered. On November 17, 2014 through November 20, 2014, the Circuit Court held a trial on the Plaintiffs’ claim seeking approximately $25 million in refunds. The Circuit Court entered judgment in favor of the County on January 27, 2016. The Plaintiffs noted an appeal on February 11, 2016 to the Court of Special Appeals. The Court of Special Appeals affirmed the Circuit Court in a March 30, 2017 opinion. Plaintiffs appealed the Court of Special Appeals’ decision to the Court of Appeals, the highest court in Maryland. All briefs have been filed and oral arguments were held in the Court of Appeals on November 3, 2017. The Court of Appeals’ decision is expected to be issued in calendar year 2018.
Taxpayers, entities that own two power plants, sought refunds of personal property taxes paid to the County
in April 2017 for fiscal years 2016 and 2017. First-level administrative appeals that were noted by the taxpayers in May 2017 to the State Department of Assessments and Taxation (“SDAT”) asserted that the value of personal property of the power plants for the assessment dates is approximately $20 million below assessed value which would have resulted in a refund of approximately $460,000 for each fiscal year in addition to 6% interest. The SDAT affirmed its assessed values on December 12, 2017 which resulted in no refunds or interest due the taxpayers. The taxpayers have until January 11, 2018 to appeal to the Maryland Tax Court.
A complaint was filed in the Circuit Court against the County on March 27, 2015 asserting a claim for over
$9 million based upon a contract to audit the County’s health care expenses paid to third-party providers. Claimant asserts that the County failed to pay its fees which were based upon a percentage of the health care expense savings to the County as a result of its efforts. The County contends that the claimant’s actions resulted in a very small amount of health care expense savings. The case proceeded to trial and judgment was entered in favor of the County on November 17, 2017. Post-trial motions filed by the claimant are pending. An appeal by the claimant is likely.
In a case pending in the Maryland Tax Court, a taxpayer seeks refunds of real property taxes paid for fiscal
years 2012 through 2016 due to claimed fair market values below the assessed values upon which taxes were paid. Trial concluded in the Maryland Tax Court on May 17, 2017 and a decision is pending. The taxpayer claims it is entitled to tax refunds in the total amount of $3,876,256 in addition to 6% interest from the dates of the various years’ payments. The County disputes the taxpayer’s claimed valuations and is vigorously defending the assessed values.
The County is a party to other legal proceedings that normally occur in governmental operations. Such proceedings include developer’s claims, property damage, employee liability, and workers compensation. These proceedings are not, in the opinion of the County Attorney, likely to have a material, adverse impact on the financial position of the County as a whole. Reserves for much of the losses alleged have been established in the Self-Insurance Fund.
Anne Arundel County, Maryland Notes to the Financial Statements
A-89
C Federal Financial Assistance - The County receives significant financial assistance from the U.S. Government. Entitlement to the resources is generally conditioned upon compliance with terms and conditions of the grant agreements and applicable Federal regulations, including the expenditure of the resources for eligible purposes. Substantially all grants are subject to financial and compliance audits. Any disallowances as a result of these audits become a liability of the fund that received the grants. As of June 30, 2017, the County estimates that no material liabilities will result from such audits.
18 Subsequent Events
The Anne Arundel County Council passed legislation (Bill No. 89-17) with an effective date of December 24, 2017, which authorized the County Executive to enter into a Payment in Lieu of Taxes (PILOT) agreement for an economic development project with PPE Casino Resorts Maryland, LLC for payment of a negotiated amount in lieu of County real and personal property taxes. The exemption from real and personal property taxes described in the PILOT Agreement may not take effect until the requirements of the PILOT Agreement and Tax-Property § 7-520 of the State Code are met and shall take effect in accordance with the terms of the Agreement. The term of the PILOT Agreement is from July 1, 2018 through fiscal year 2048, ending June 30, 2048. For fiscal year 2019 through fiscal year 2048, the annual payment in lieu of taxes is one dollar and the annual fiscal year value accruing to the Owner of the agreement shall be equal to the actual amount of the County real property and personal property taxes attributable to the real and personal property assessment as determined by the Maryland State Department of Assessments and Taxation. The amount of taxes to be abated annually shall not exceed $1.2 million dollars.
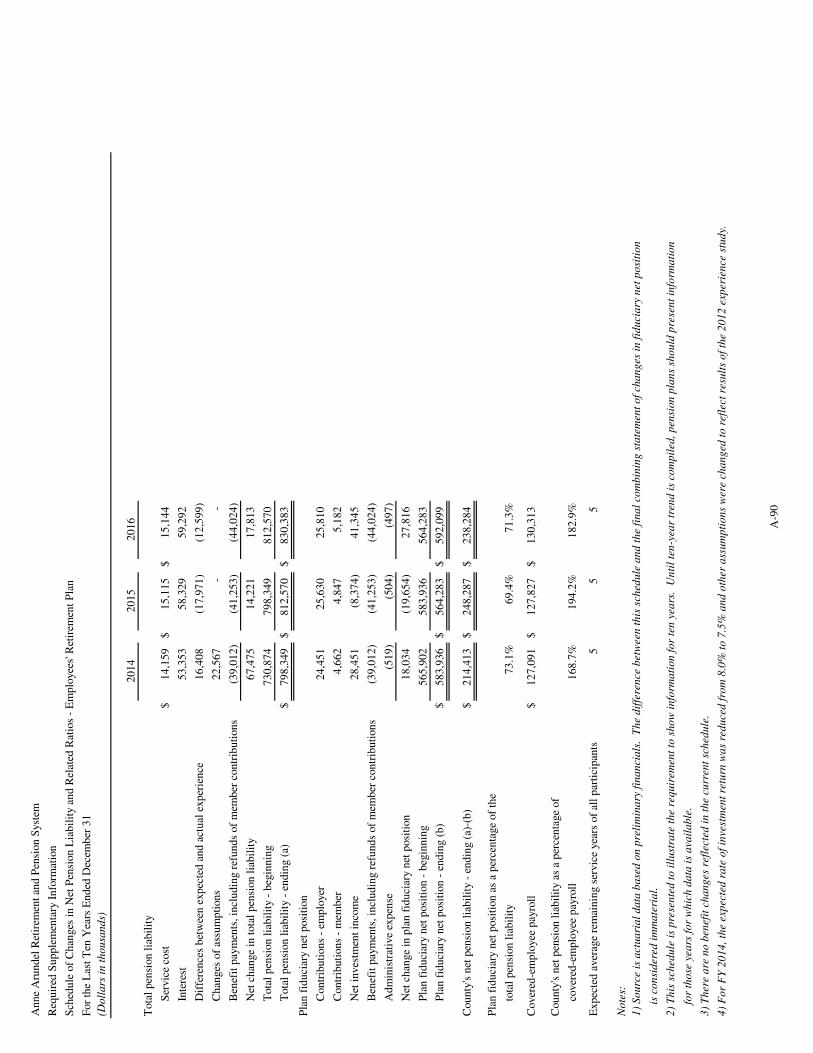
20
14
20
15
20
16
$1
4,1
59
$
15
,11
5
$1
5,1
44
53
,35
3
58
,32
9
59
,29
2
16
,40
8
(17
,97
1)
(1
2,5
99
)
22
,56
7
-
-
(39
,01
2)
(4
1,2
53
)
(44
,02
4)
67
,47
5
14
,22
1
17
,81
3
73
0,8
74
79
8,3
49
81
2,5
70
$7
98
,34
9
$
81
2,5
70
$8
30
,38
3
24
,45
1
25
,63
0
25
,81
0
4,6
62
4,8
47
5,1
82
28
,45
1
(8,3
74
)
4
1,3
45
(39
,01
2)
(4
1,2
53
)
(44
,02
4)
(51
9)
(5
04
)
(49
7)
18
,03
4
(19
,65
4)
2
7,8
16
56
5,9
02
58
3,9
36
56
4,2
83
$5
83
,93
6
$
56
4,2
83
$5
92
,09
9
$2
14
,41
3
$
24
8,2
87
$2
38
,28
4
73
.1%
69
.4%
71
.3%
$1
27
,09
1
$
12
7,8
27
$1
30
,31
3
16
8.7
%1
94
.2%
18
2.9
%
5
5
5
tota
l p
ensi
on
lia
bil
ity
cover
ed-e
mp
loye
e p
ayro
ll
4)
Fo
r F
Y 2
01
4,
the
exp
ecte
d r
ate
of
inve
stm
ent
retu
rn w
as
red
uce
d f
rom
8.0
% t
o 7
.5%
an
d o
ther
ass
um
pti
on
s w
ere
cha
ng
ed t
o r
efle
ct r
esu
lts
of
the
20
12
exp
erie
nce
stu
dy.
(Do
lla
rs i
n t
ho
usa
nd
s)
No
tes:
1)
So
urc
e is
act
ua
ria
l d
ata
ba
sed
on
pre
lim
ina
ry f
ina
nci
als
. T
he
dif
fere
nce
bet
wee
n t
his
sch
edu
le a
nd
th
e fi
na
l co
mb
inin
g s
tate
men
t o
f ch
an
ges
in
fid
uci
ary
net
po
siti
on
is c
on
sid
ered
im
ma
teri
al.
2)
Th
is s
ched
ule
is
pre
sen
ted
to
ill
ust
rate
th
e re
qu
irem
ent
to s
ho
w i
nfo
rma
tio
n f
or
ten
yea
rs.
Un
til
ten
-yea
r tr
end
is
com
pil
ed, p
ensi
on
pla
ns
sho
uld
pre
sen
t in
form
ati
on
for
tho
se y
ears
fo
r w
hic
h d
ata
is
ava
ila
ble
.
3)
Th
ere
are
no
ben
efit
ch
an
ges
ref
lect
ed i
n t
he
curr
ent
sched
ule
.
Pla
n f
idu
ciar
y n
et p
osi
tion
as
a p
erce
nta
ge
of
the
Cover
ed-e
mp
loye
e p
ayro
ll
Cou
nty
's n
et p
ensi
on
lia
bil
ity
as a
per
cen
tage
of
Exp
ecte
d a
ver
age
rem
ain
ing s
ervic
e ye
ars
of
all
par
tici
pan
ts
Ad
min
istr
ativ
e ex
pen
se
Net
ch
ange
in p
lan
fid
uci
ary
net
posi
tion
Pla
n f
idu
ciar
y n
et p
osi
tion
- b
egin
nin
g
Pla
n f
idu
ciar
y n
et p
osi
tion
- e
nd
ing (
b)
Cou
nty
's n
et p
ensi
on
lia
bil
ity
- en
din
g (
a)-(
b)
Tota
l p
ensi
on
lia
bil
ity
- b
egin
nin
g
Tota
l p
ensi
on
lia
bil
ity
- en
din
g (
a)
Con
trib
uti
on
s -
emp
loye
r
Con
trib
uti
on
s -
mem
ber
Net
in
ves
tmen
t in
com
e
Ben
efit
pay
men
ts,
incl
ud
ing r
efu
nd
s of
mem
ber
con
trib
uti
on
s
Pla
n f
idu
ciar
y n
et p
osi
tion
Ben
efit
pay
men
ts,
incl
ud
ing r
efu
nd
s of
mem
ber
con
trib
uti
on
s
Net
ch
ange
in t
ota
l p
ensi
on
lia
bil
ity
An
ne
Aru
nd
el R
etir
emen
t an
d P
ensi
on
Sys
tem
Req
uir
ed S
up
ple
men
tary
In
form
atio
n
Sch
edu
le o
f C
han
ges
in
Net
Pen
sion
Lia
bil
ity
and
Rel
ated
Rat
ios
- E
mp
loye
es' R
etir
emen
t P
lan
For
the
Las
t T
en Y
ears
En
ded
Dec
emb
er 3
1
Tota
l p
ensi
on
lia
bil
ity
Ser
vic
e co
st
Inte
rest
Dif
fere
nce
s b
etw
een
exp
ecte
d a
nd
act
ual
exp
erie
nce
Ch
anges
of
assu
mp
tion
s
A-9
0
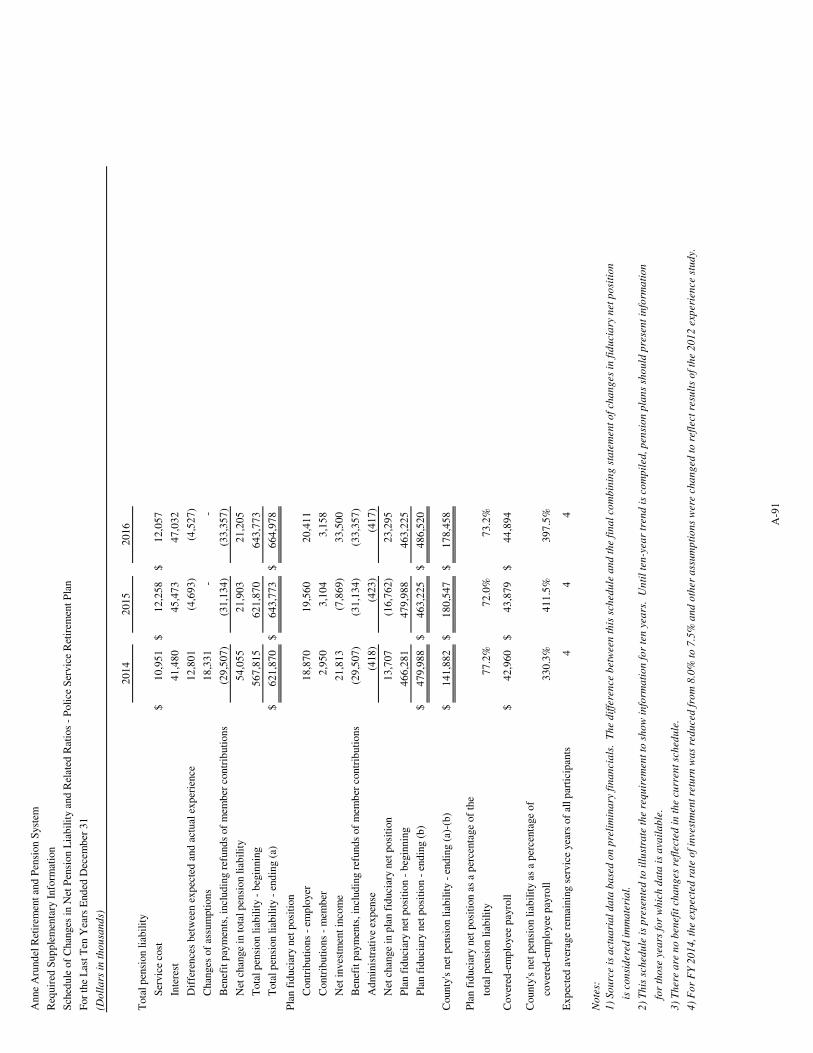
20
14
20
15
20
16
$1
0,9
51
$1
2,2
58
$1
2,0
57
41
,48
0
45
,47
3
47
,03
2
12
,80
1
(4,6
93
)
(4,5
27
)
18
,33
1
-
-
(29
,50
7)
(31
,13
4)
(33
,35
7)
54
,05
5
21
,90
3
21
,20
5
56
7,8
15
62
1,8
70
64
3,7
73
$6
21
,87
0
$6
43
,77
3
$6
64
,97
8
18
,87
0
19
,56
0
20
,41
1
2,9
50
3,1
04
3,1
58
21
,81
3
(7,8
69
)
33
,50
0
(29
,50
7)
(31
,13
4)
(33
,35
7)
(41
8)
(42
3)
(41
7)
13
,70
7
(16
,76
2)
23
,29
5
46
6,2
81
47
9,9
88
46
3,2
25
$4
79
,98
8
$4
63
,22
5
$4
86
,52
0
$1
41
,88
2
$1
80
,54
7
$1
78
,45
8
77
.2%
72
.0%
73
.2%
$4
2,9
60
$4
3,8
79
$4
4,8
94
33
0.3
%4
11
.5%
39
7.5
%
4
4
4
tota
l p
ensi
on l
iab
ilit
y
cover
ed-e
mp
loyee
pay
roll
3)
Th
ere
are
no
ben
efi
t ch
an
ges
refl
ecte
d i
n t
he c
urr
en
t sc
hed
ule
.
4)
Fo
r F
Y 2
01
4, th
e e
xp
ecte
d r
ate
of
invest
men
t re
turn
wa
s re
du
ced
fro
m 8
.0%
to
7.5
% a
nd
oth
er
ass
um
pti
on
s w
ere
ch
an
ged
to
refl
ect
resu
lts
of
the 2
01
2 e
xp
eri
en
ce s
tud
y.
(Do
lla
rs i
n t
ho
usa
nd
s)
Exp
ecte
d a
ver
age
rem
ainin
g s
ervic
e yea
rs o
f al
l p
arti
cip
ants
No
tes:
1)
So
urc
e i
s a
ctu
ari
al
da
ta b
ase
d o
n p
reli
min
ary
fin
an
cia
ls. T
he d
iffe
ren
ce b
etw
een
th
is s
ch
ed
ule
an
d t
he f
ina
l co
mb
inin
g s
tate
men
t o
f ch
an
ges
in f
idu
cia
ry n
et
po
siti
on
is
co
nsi
dere
d i
mm
ate
ria
l.
2)
Th
is s
ch
ed
ule
is
pre
sen
ted
to
ill
ust
rate
th
e r
eq
uir
em
en
t to
sh
ow
in
form
ati
on
fo
r te
n y
ea
rs. U
nti
l te
n-y
ea
r tr
en
d i
s co
mp
iled
, p
en
sio
n p
lan
s sh
ou
ld p
rese
nt
info
rma
tio
n
fo
r th
ose
yea
rs f
or
wh
ich
da
ta i
s a
va
ila
ble
.
County
's n
et p
ensi
on l
iab
ilit
y -
end
ing (
a)-(
b)
Pla
n f
iduci
ary n
et p
osi
tion a
s a
per
centa
ge
of
the
Cover
ed-e
mp
loyee
pay
roll
County
's n
et p
ensi
on l
iab
ilit
y a
s a
per
centa
ge
of
Ben
efit
pay
men
ts, in
clud
ing r
efund
s of
mem
ber
contr
ibuti
ons
Ad
min
istr
ativ
e ex
pen
se
Net
chan
ge
in p
lan f
iduci
ary n
et p
osi
tion
Pla
n f
iduci
ary n
et p
osi
tion -
beg
innin
g
Pla
n f
iduci
ary n
et p
osi
tion -
end
ing (
b)
Net
inves
tmen
t in
com
e
Pla
n f
iduci
ary n
et p
osi
tion
Ser
vic
e co
st
Inte
rest
Dif
fere
nce
s b
etw
een e
xp
ecte
d a
nd
act
ual
exp
erie
nce
Chan
ges
of
assu
mp
tions
Ben
efit
pay
men
ts, in
clud
ing r
efund
s of
mem
ber
contr
ibuti
ons
Net
chan
ge
in t
ota
l p
ensi
on l
iab
ilit
y
Tota
l p
ensi
on l
iab
ilit
y -
beg
innin
g
Tota
l p
ensi
on l
iab
ilit
y -
end
ing (
a)
Contr
ibuti
ons
- em
plo
yer
Contr
ibuti
ons
- m
emb
er
Anne
Aru
nd
el R
etir
emen
t an
d P
ensi
on S
yst
em
Req
uir
ed S
up
ple
men
tary
Info
rmat
ion
Sch
edule
of
Chan
ges
in N
et P
ensi
on L
iab
ilit
y a
nd
Rel
ated
Rat
ios
- P
oli
ce S
ervic
e R
etir
emen
t P
lan
For
the
Las
t T
en Y
ears
End
ed D
ecem
ber
31
Tota
l p
ensi
on l
iab
ilit
y
A-9
1
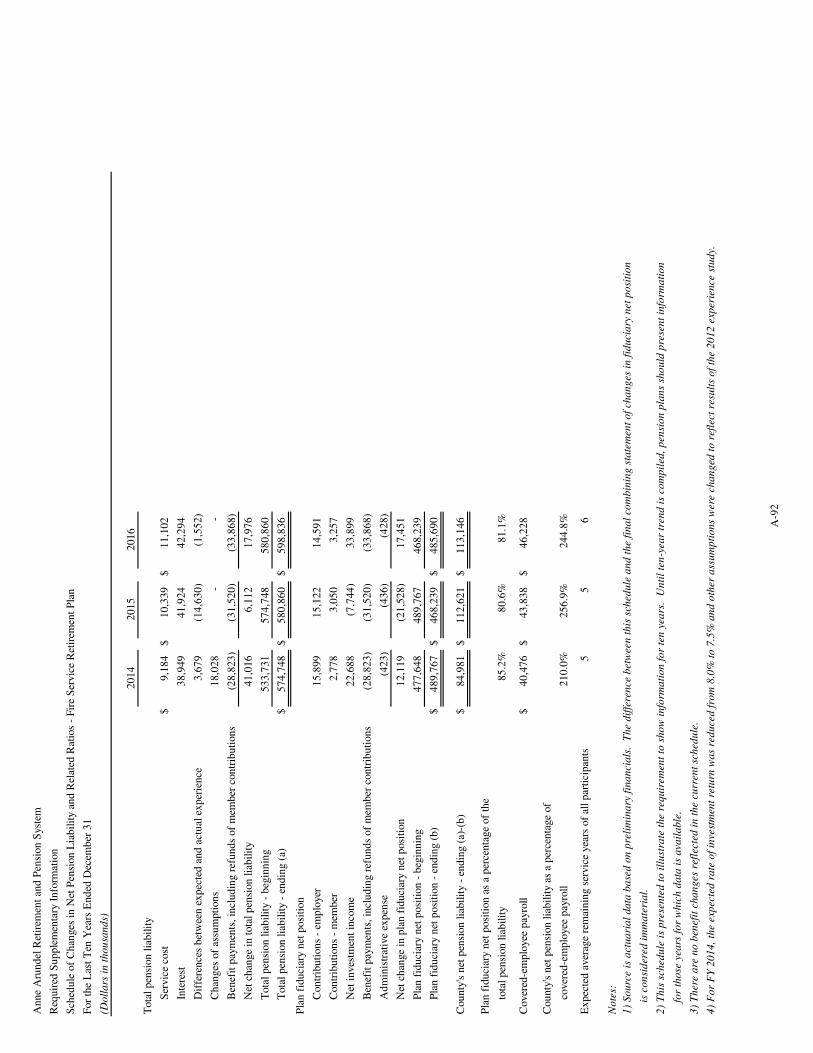
20
14
20
15
20
16
$9
,18
4
$
10
,33
9
$1
1,1
02
38
,94
9
41
,92
4
42
,29
4
3,6
79
(14
,63
0)
(1,5
52
)
18
,02
8
-
-
(28
,82
3)
(31
,52
0)
(33
,86
8)
41
,01
6
6,1
12
17
,97
6
53
3,7
31
57
4,7
48
58
0,8
60
$5
74
,74
8
$
58
0,8
60
$5
98
,83
6
15
,89
9
15
,12
2
14
,59
1
2,7
78
3,0
50
3,2
57
22
,68
8
(7,7
44
)
33
,89
9
(28
,82
3)
(31
,52
0)
(33
,86
8)
(42
3)
(4
36
)
(42
8)
12
,11
9
(21
,52
8)
17
,45
1
47
7,6
48
48
9,7
67
46
8,2
39
$4
89
,76
7
$
46
8,2
39
$4
85
,69
0
$8
4,9
81
$
11
2,6
21
$1
13
,14
6
85
.2%
80
.6%
81
.1%
$4
0,4
76
$
43
,83
8
$4
6,2
28
21
0.0
%2
56
.9%
24
4.8
%
5
5
6
tota
l p
ensi
on
lia
bil
ity
cover
ed-e
mp
loye
e p
ayro
ll
4)
Fo
r F
Y 2
01
4,
the
exp
ecte
d r
ate
of
inve
stm
ent
retu
rn w
as
red
uce
d f
rom
8.0
% t
o 7
.5%
an
d o
ther
ass
um
pti
on
s w
ere
cha
ng
ed t
o r
efle
ct r
esu
lts
of
the
20
12
exp
erie
nce
stu
dy.
Cover
ed-e
mp
loye
e p
ayro
ll
Cou
nty
's n
et p
ensi
on
lia
bil
ity
as a
per
cen
tage
of
Ex
pec
ted
aver
age
rem
ain
ing s
ervic
e ye
ars
of
all
par
tici
pan
ts
No
tes:
1)
So
urc
e is
act
ua
ria
l d
ata
ba
sed
on
pre
lim
ina
ry f
ina
nci
als
. T
he
dif
fere
nce
bet
wee
n t
his
sch
edu
le a
nd
th
e fi
na
l co
mb
inin
g s
tate
men
t o
f ch
an
ges
in
fid
uci
ary
net
po
siti
on
is c
on
sid
ered
im
ma
teri
al.
2)
Th
is s
ched
ule
is
pre
sen
ted
to
ill
ust
rate
th
e re
qu
irem
ent
to s
ho
w i
nfo
rma
tio
n f
or
ten
yea
rs.
Un
til
ten
-yea
r tr
end
is
com
pil
ed,
pen
sio
n p
lan
s sh
ou
ld p
rese
nt
info
rma
tio
n
for
tho
se y
ears
fo
r w
hic
h d
ata
is
ava
ila
ble
.
3)
Th
ere
are
no
ben
efit
ch
an
ges
ref
lect
ed i
n t
he
curr
ent
sch
edu
le.
Net
ch
ange
in p
lan
fid
uci
ary
net
posi
tion
Pla
n f
idu
ciar
y n
et p
osi
tion
- b
egin
nin
g
Pla
n f
idu
ciar
y n
et p
osi
tion
- e
nd
ing (
b)
Cou
nty
's n
et p
ensi
on
lia
bil
ity
- en
din
g (
a)-(
b)
Pla
n f
idu
ciar
y n
et p
osi
tion
as
a p
erce
nta
ge
of
the
Pla
n f
idu
ciar
y n
et p
osi
tion
Ser
vic
e co
st
Inte
rest
Dif
fere
nce
s b
etw
een
ex
pec
ted
an
d a
ctu
al e
xp
erie
nce
Ch
anges
of
assu
mp
tion
s
Ben
efit
pay
men
ts,
incl
ud
ing r
efu
nd
s of
mem
ber
con
trib
uti
on
s
Net
ch
ange
in t
ota
l p
ensi
on
lia
bil
ity
Tota
l p
ensi
on
lia
bil
ity
- b
egin
nin
g
Tota
l p
ensi
on
lia
bil
ity
- en
din
g (
a)
Con
trib
uti
on
s -
emp
loye
r
Con
trib
uti
on
s -
mem
ber
Net
in
ves
tmen
t in
com
e
Ben
efit
pay
men
ts,
incl
ud
ing r
efu
nd
s of
mem
ber
con
trib
uti
on
s
Ad
min
istr
ativ
e ex
pen
se
An
ne
Aru
nd
el R
etir
emen
t an
d P
ensi
on
Sys
tem
Req
uir
ed S
up
ple
men
tary
In
form
atio
n
Sch
edu
le o
f C
han
ges
in
Net
Pen
sion
Lia
bil
ity
and
Rel
ated
Rat
ios
- F
ire
Ser
vic
e R
etir
emen
t P
lan
For
the
Las
t T
en Y
ears
En
ded
Dec
emb
er 3
1
Tota
l p
ensi
on
lia
bil
ity
(Do
lla
rs i
n t
ho
usa
nd
s)
A-9
2
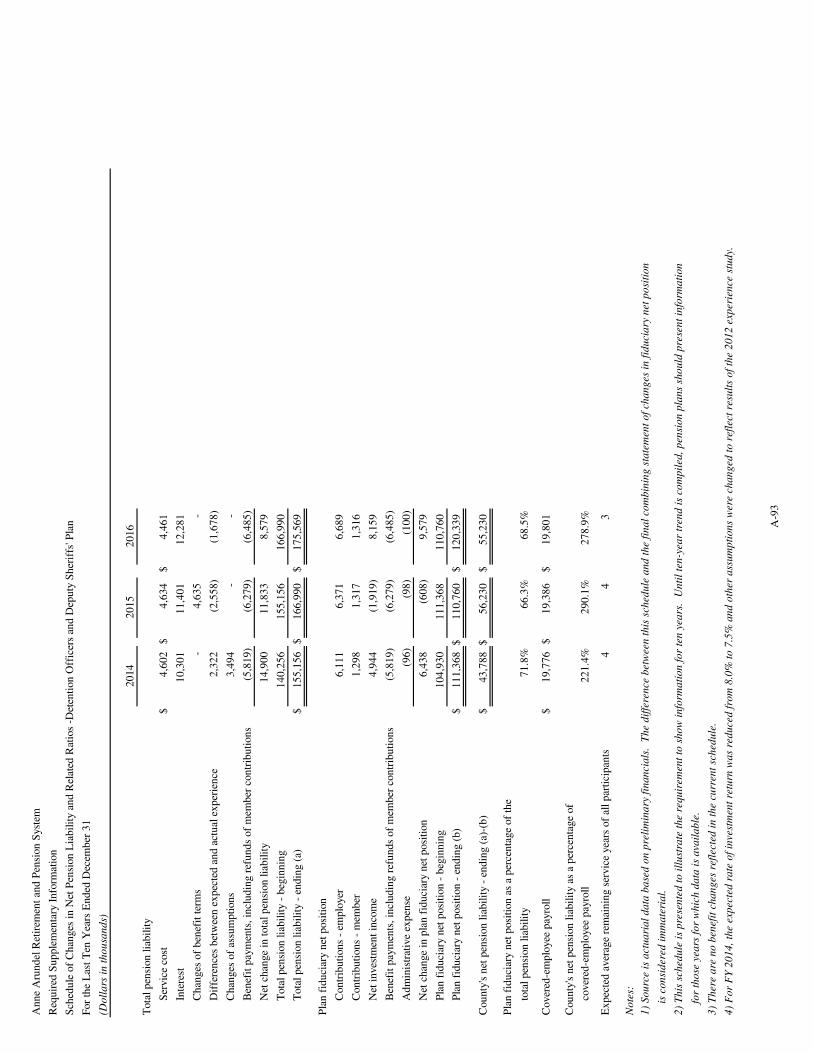
20
14
20
15
20
16
$4
,60
2
$4
,63
4
$4
,46
1
10
,30
1
1
1,4
01
12
,28
1
-
4
,63
5
-
2,3
22
(2
,55
8)
(1,6
78
)
3,4
94
-
-
(5,8
19
)
(6
,27
9)
(6,4
85
)
14
,90
0
1
1,8
33
8,5
79
14
0,2
56
1
55
,15
6
16
6,9
90
$1
55
,15
6
$1
66
,99
0
$1
75
,56
9
6,1
11
6
,37
1
6,6
89
1,2
98
1
,31
7
1,3
16
4,9
44
(1
,91
9)
8,1
59
(5,8
19
)
(6
,27
9)
(6,4
85
)
(96
)
(98
)
(10
0)
6,4
38
(6
08
)
9
,57
9
10
4,9
30
1
11
,36
8
11
0,7
60
$1
11
,36
8
$1
10
,76
0
$1
20
,33
9
$4
3,7
88
$5
6,2
30
$5
5,2
30
71
.8%
66
.3%
68
.5%
$1
9,7
76
$1
9,3
86
$1
9,8
01
22
1.4
%2
90
.1%
27
8.9
%
4
4
3
tota
l p
ensi
on
lia
bil
ity
cover
ed-e
mp
loye
e p
ayro
ll
Ch
anges
of
assu
mp
tion
s
Ben
efit
pay
men
ts,
incl
ud
ing r
efu
nd
s of
mem
ber
con
trib
uti
on
s
(Do
lla
rs i
n t
ho
usa
nd
s)
Ser
vic
e co
st
Inte
rest
Ch
anges
of
ben
efit
ter
ms
Dif
fere
nce
s b
etw
een
ex
pec
ted
an
d a
ctu
al e
xp
erie
nce
Net
ch
ange
in p
lan
fid
uci
ary
net
posi
tion
Pla
n f
idu
ciar
y n
et p
osi
tion
- b
egin
nin
g
Pla
n f
idu
ciar
y n
et p
osi
tion
Cou
nty
's n
et p
ensi
on
lia
bil
ity
- en
din
g (
a)-(
b)
Pla
n f
idu
ciar
y n
et p
osi
tion
as
a p
erce
nta
ge
of
the
Cover
ed-e
mp
loye
e p
ayro
ll
Net
ch
ange
in t
ota
l p
ensi
on
lia
bil
ity
for
tho
se y
ears
fo
r w
hic
h d
ata
is
ava
ila
ble
.
3)
Th
ere
are
no
ben
efit
ch
an
ges
ref
lect
ed i
n t
he
curr
ent
sch
edu
le.
4)
Fo
r F
Y 2
01
4,
the
exp
ecte
d r
ate
of
inve
stm
ent
retu
rn w
as
red
uce
d f
rom
8.0
% t
o 7
.5%
an
d o
ther
ass
um
pti
on
s w
ere
cha
ng
ed t
o r
efle
ct r
esu
lts
of
the
20
12
exp
erie
nce
stu
dy.
Pla
n f
idu
ciar
y n
et p
osi
tion
- e
nd
ing (
b)
Con
trib
uti
on
s -
emp
loye
r
Con
trib
uti
on
s -
mem
ber
Net
in
ves
tmen
t in
com
e
Ben
efit
pay
men
ts,
incl
ud
ing r
efu
nd
s of
mem
ber
con
trib
uti
on
s
Ad
min
istr
ativ
e ex
pen
se
Ex
pec
ted
aver
age
rem
ain
ing s
ervic
e ye
ars
of
all
par
tici
pan
ts
No
tes:
1)
So
urc
e is
act
ua
ria
l d
ata
ba
sed
on
pre
lim
ina
ry f
ina
nci
als
. T
he
dif
fere
nce
bet
wee
n t
his
sch
edu
le a
nd
th
e fi
na
l co
mb
inin
g s
tate
men
t o
f ch
an
ges
in
fid
uci
ary
net
po
siti
on
is c
on
sid
ered
im
ma
teri
al.
2)
Th
is s
ched
ule
is
pre
sen
ted
to
ill
ust
rate
th
e re
qu
irem
ent
to s
ho
w i
nfo
rma
tio
n f
or
ten
yea
rs.
Un
til
ten
-yea
r tr
end
is
com
pil
ed,
pen
sio
n p
lan
s sh
ou
ld p
rese
nt
info
rma
tio
n
Cou
nty
's n
et p
ensi
on
lia
bil
ity
as a
per
cen
tage
of
Tota
l p
ensi
on
lia
bil
ity
- b
egin
nin
g
Tota
l p
ensi
on
lia
bil
ity
- en
din
g (
a)
An
ne
Aru
nd
el R
etir
emen
t an
d P
ensi
on
Sys
tem
Req
uir
ed S
up
ple
men
tary
In
form
atio
n
Sch
edu
le o
f C
han
ges
in
Net
Pen
sion
Lia
bil
ity
and
Rel
ated
Rat
ios
-Det
enti
on
Off
icer
s an
d D
epu
ty S
her
iffs
' Pla
n
For
the
Las
t T
en Y
ears
En
ded
Dec
emb
er 3
1
Tota
l p
ensi
on
lia
bil
ity
A-9
3
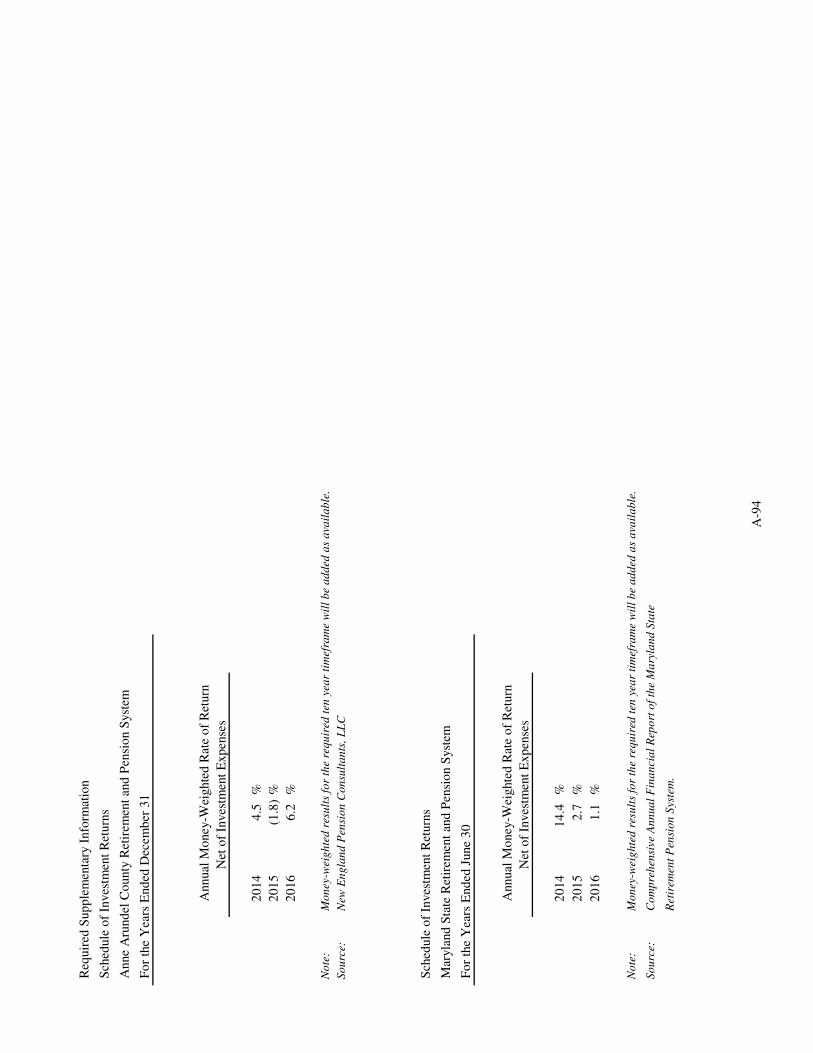
20
14
4.5
%
20
15
(1.8
)
%
20
16
6.2
%
No
te:
Mo
ney
-wei
gh
ted
res
ult
s fo
r th
e re
qu
ired
ten
yea
r ti
mef
ram
e w
ill
be
ad
ded
as
ava
ila
ble
.
So
urc
e:N
ew E
ng
lan
d P
ensi
on
Co
nsu
lta
nts
, L
LC
20
14
14
.4
%
20
15
2.7
%
20
16
1.1
%
No
te:
Mo
ney
-wei
gh
ted
res
ult
s fo
r th
e re
qu
ired
ten
yea
r ti
mef
ram
e w
ill
be
ad
ded
as
ava
ila
ble
.
So
urc
e:C
om
pre
hen
sive
An
nu
al
Fin
an
cia
l R
epo
rt o
f th
e M
ary
lan
d S
tate
Ret
irem
ent
Pen
sio
n S
yste
m.
Req
uir
ed S
up
ple
men
tary
Info
rmat
ion
Sch
edule
of
Inves
tmen
t R
eturn
s
Anne
Aru
nd
el C
ounty
Ret
irem
ent
and
Pen
sio
n S
yst
em
Fo
r th
e Y
ears
End
ed D
ecem
ber
31
Annual
Mo
ney
-Wei
ghte
d R
ate
of
Ret
urn
Net
of
Inves
tmen
t E
xp
ense
s
Sch
edule
of
Inves
tmen
t R
eturn
s
Mar
yla
nd
Sta
te R
etir
emen
t an
d P
ensi
on S
yst
em
Fo
r th
e Y
ears
End
ed J
une
30
Annual
Mo
ney
-Wei
ghte
d R
ate
of
Ret
urn
Net
of
Inves
tmen
t E
xp
ense
s
A-9
4
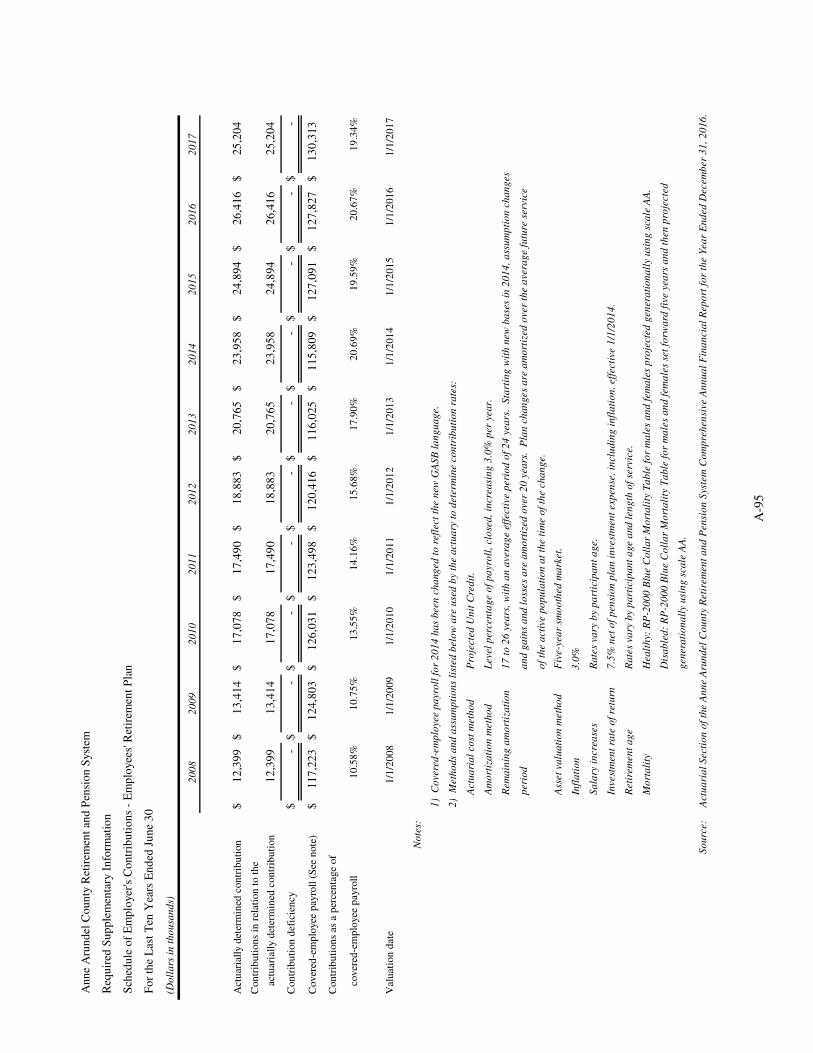
20
08
20
09
20
10
20
11
20
12
20
13
20
14
20
15
20
16
20
17
Act
uar
iall
y d
eter
min
ed c
on
trib
uti
on
$1
2,3
99
$
13
,41
4
$1
7,0
78
$
17
,49
0
$1
8,8
83
$
20
,76
5
$2
3,9
58
$
24
,89
4
$2
6,4
16
$
25
,20
4
Con
trib
uti
on
s in
rel
atio
n t
o t
he
a
ctu
aria
lly d
eter
min
ed c
on
trib
uti
on
12
,39
9
13
,41
4
17
,07
8
17
,49
0
18
,88
3
20
,76
5
23
,95
8
24
,89
4
26
,41
6
25
,20
4
Con
trib
uti
on
def
icie
ncy
$-
$
-
$-
$
-
$-
$
-
$-
$
-
$-
$
-
Cover
ed-e
mp
loyee
pay
roll
(S
ee n
ote
)$
11
7,2
23
$1
24
,80
3
$
12
6,0
31
$1
23
,49
8
$
12
0,4
16
$1
16
,02
5
$
11
5,8
09
$1
27
,09
1
$
12
7,8
27
$1
30
,31
3
Con
trib
uti
on
s as
a p
erce
nta
ge
of
c
over
ed-e
mp
loyee
pay
roll
10
.58
%1
0.7
5%
13
.55
%1
4.1
6%
15
.68
%1
7.9
0%
20
.69
%1
9.5
9%
20
.67
%1
9.3
4%
Val
uat
ion
dat
e1
/1/2
00
81
/1/2
00
91
/1/2
01
01
/1/2
01
11
/1/2
01
21
/1/2
01
31
/1/2
01
41
/1/2
01
51
/1/2
01
61
/1/2
01
7
No
tes:
So
urc
e:
1)
Co
vere
d-e
mp
loyee p
ayro
ll f
or
20
14
ha
s b
een
ch
an
ged
to
refl
ect
the n
ew
GA
SB
la
ng
ua
ge.
An
ne
Aru
nd
el C
ou
nty
Ret
irem
ent
and
Pen
sio
n S
yst
em
Req
uir
ed S
up
ple
men
tary
In
form
atio
n
Sch
edu
le o
f E
mp
loyer
's C
on
trib
uti
on
s -
Em
plo
yee
s' R
etir
emen
t P
lan
Fo
r th
e L
ast
Ten
Yea
rs E
nd
ed J
un
e 3
0
(Do
lla
rs i
n t
ho
usa
nd
s)
7.5
% n
et
of
pen
sio
n p
lan
in
vest
men
t exp
en
se,
inclu
din
g i
nfl
ati
on
, eff
ecti
ve 1
/1/2
01
4.
Ra
tes
va
ry b
y p
art
icip
an
t a
ge a
nd
len
gth
of
serv
ice.
Hea
lth
y:
RP
-20
00
Blu
e C
oll
ar
Mo
rta
lity
Ta
ble
fo
r m
ale
s a
nd
fem
ale
s p
roje
cte
d g
en
era
tio
na
lly u
sin
g s
ca
le A
A.
Rem
ain
ing
am
ort
iza
tio
n
2)
Meth
od
s a
nd
ass
um
pti
on
s li
sted
belo
w a
re u
sed
by t
he a
ctu
ary
to
dete
rmin
e c
on
trib
uti
on
ra
tes:
Actu
ari
al
co
st m
eth
od
Pro
jecte
d U
nit
Cre
dit
.
Dis
ab
led
: R
P-2
00
0 B
lue C
oll
ar
Mo
rta
lity
Ta
ble
fo
r m
ale
s a
nd
fem
ale
s se
t fo
rwa
rd f
ive y
ea
rs a
nd
th
en
pro
jecte
d
gen
era
tio
na
lly u
sin
g s
ca
le A
A.
Actu
ari
al
Secti
on
of
the A
nn
e A
run
del
Co
un
ty R
eti
rem
en
t a
nd
Pen
sio
n S
yst
em
Co
mp
reh
en
sive A
nn
ua
l F
ina
ncia
l R
ep
ort
fo
r th
e Y
ea
r E
nd
ed
Decem
ber
31
, 2
01
6.
Am
ort
iza
tio
n m
eth
od
peri
od
Ass
et
va
lua
tio
n m
eth
od
Infl
ati
on
Sa
lary
in
cre
ase
s
Invest
men
t ra
te o
f re
turn
Level
perc
en
tag
e o
f p
ayro
ll,
clo
sed
, in
cre
asi
ng
3.0
% p
er
yea
r.
17
to
26
yea
rs,
wit
h a
n a
vera
ge e
ffecti
ve p
eri
od
of
24
yea
rs.
Sta
rtin
g w
ith
new
ba
ses
in 2
01
4,
ass
um
pti
on
ch
an
ges
an
d g
ain
s a
nd
lo
sses
are
am
ort
ized
over
20
yea
rs.
Pla
n c
ha
ng
es
are
am
ort
ized
over
the a
vera
ge f
utu
re s
erv
ice
of
the a
cti
ve p
op
ula
tio
n a
t th
e t
ime o
f th
e c
ha
ng
e.
Fiv
e-y
ea
r sm
oo
thed
ma
rket.
Ra
tes
va
ry b
y p
art
icip
an
t a
ge.
3.0
%
Reti
rem
en
t a
ge
Mo
rta
lity
A-9
5
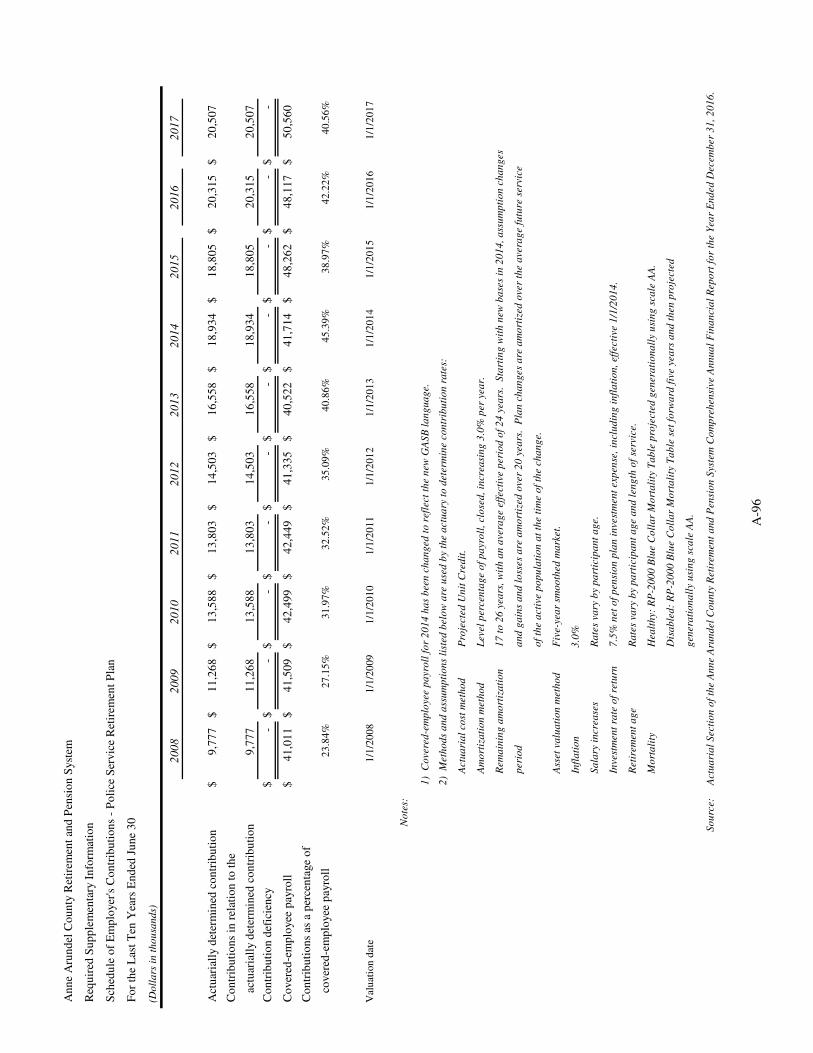
20
08
20
09
20
10
20
11
20
12
20
13
20
14
20
15
20
16
20
17
Act
uar
iall
y d
eter
min
ed c
on
trib
uti
on
$9
,77
7
$
11
,26
8
$
13
,58
8
$
13
,80
3
$
14
,50
3
$
16
,55
8
$
18
,93
4
$
18
,80
5
$
20
,31
5
$
20
,50
7
Co
ntr
ibu
tio
ns
in r
elat
ion
to
th
e
a
ctu
aria
lly d
eter
min
ed c
on
trib
uti
on
9,7
77
11
,26
8
1
3,5
88
13
,80
3
1
4,5
03
16
,55
8
1
8,9
34
18
,80
5
2
0,3
15
20
,50
7
Co
ntr
ibu
tio
n d
efic
ien
cy$
-
$-
$
-
$-
$
-
$-
$
-
$-
$
-
$-
Co
ver
ed-e
mp
loyee
pay
roll
$4
1,0
11
$
41
,50
9
$
42
,49
9
$
42
,44
9
$
41
,33
5
$
40
,52
2
$
41
,71
4
$
48
,26
2
$
48
,11
7
$
50
,56
0
Co
ntr
ibu
tio
ns
as a
per
cen
tage
of
c
over
ed-e
mp
loyee
pay
roll
23
.84
%2
7.1
5%
31
.97
%3
2.5
2%
35
.09
%4
0.8
6%
45
.39
%3
8.9
7%
42
.22
%4
0.5
6%
Val
uat
ion
dat
e1
/1/2
00
81
/1/2
00
91
/1/2
01
01
/1/2
01
11
/1/2
01
21
/1/2
01
31
/1/2
01
41
/1/2
01
51
/1/2
01
61
/1/2
01
7
No
tes:
So
urc
e:
Infl
ati
on
3.0
%
Sa
lary
in
cre
ase
sR
ate
s va
ry b
y p
art
icip
an
t a
ge.
Invest
men
t ra
te o
f re
turn
7.5
% n
et
of
pen
sio
n p
lan
in
vest
men
t exp
en
se,
inclu
din
g i
nfl
ati
on
, eff
ecti
ve 1
/1/2
01
4.
peri
od
an
d g
ain
s a
nd
lo
sses
are
am
ort
ized
over
20
yea
rs.
Pla
n c
ha
ng
es
are
am
ort
ized
over
the a
vera
ge f
utu
re s
erv
ice
of
the a
cti
ve p
op
ula
tio
n a
t th
e t
ime o
f th
e c
ha
ng
e.
Ass
et
va
lua
tio
n m
eth
od
Fiv
e-y
ea
r sm
oo
thed
ma
rket.
1)
Co
vere
d-e
mp
loyee p
ayro
ll f
or
20
14
ha
s b
een
ch
an
ged
to
refl
ect
the n
ew
GA
SB
la
ng
ua
ge.
Rem
ain
ing
am
ort
iza
tio
n
2)
Meth
od
s a
nd
ass
um
pti
on
s li
sted
belo
w a
re u
sed
by t
he a
ctu
ary
to
dete
rmin
e c
on
trib
uti
on
ra
tes:
Actu
ari
al
co
st m
eth
od
Pro
jecte
d U
nit
Cre
dit
.
Am
ort
iza
tio
n m
eth
od
Level
perc
en
tag
e o
f p
ayro
ll,
clo
sed
, in
cre
asi
ng
3.0
% p
er
yea
r.
17
to
26
yea
rs,
wit
h a
n a
vera
ge e
ffecti
ve p
eri
od
of
24
yea
rs.
Sta
rtin
g w
ith
new
ba
ses
in 2
01
4,
ass
um
pti
on
ch
an
ges
An
ne
Aru
nd
el C
ou
nty
Ret
irem
ent
and
Pen
sio
n S
yst
em
Req
uir
ed S
up
ple
men
tary
In
form
atio
n
Sch
edu
le o
f E
mp
loyer
's C
on
trib
uti
on
s -
Po
lice
Ser
vic
e R
etir
emen
t P
lan
Fo
r th
e L
ast
Ten
Yea
rs E
nd
ed J
un
e 3
0
(Do
lla
rs i
n t
ho
usa
nd
s)
gen
era
tio
na
lly u
sin
g s
ca
le A
A.
Actu
ari
al
Secti
on
of
the A
nn
e A
run
del
Co
un
ty R
eti
rem
en
t a
nd
Pen
sio
n S
yst
em
Co
mp
reh
en
sive A
nn
ua
l F
ina
ncia
l R
ep
ort
fo
r th
e Y
ea
r E
nd
ed
Decem
ber
31
, 2
01
6.
Reti
rem
en
t a
ge
Ra
tes
va
ry b
y p
art
icip
an
t a
ge a
nd
len
gth
of
serv
ice.
Mo
rta
lity
Hea
lth
y:
RP
-20
00
Blu
e C
oll
ar
Mo
rta
lity
Ta
ble
pro
jecte
d g
en
era
tio
na
lly u
sin
g s
ca
le A
A.
Dis
ab
led
: R
P-2
00
0 B
lue C
oll
ar
Mo
rta
lity
Ta
ble
set
forw
ard
fiv
e y
ea
rs a
nd
th
en
pro
jecte
d
A-9
6
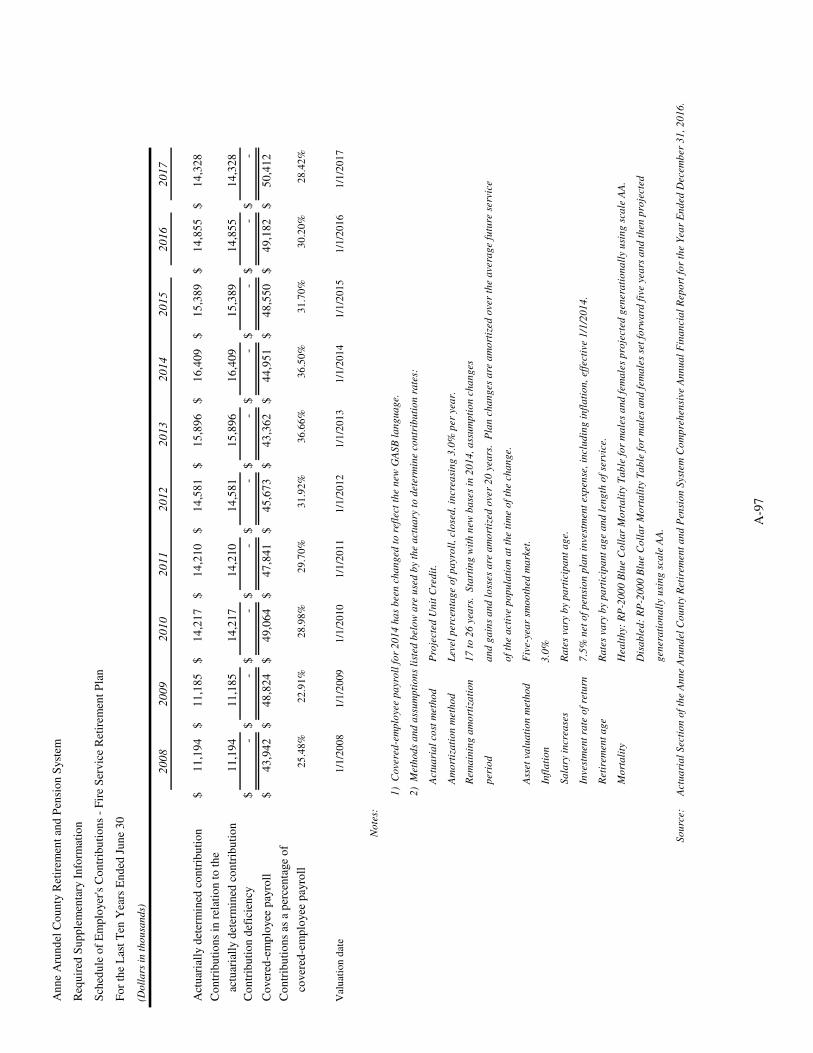
20
08
20
09
20
10
20
11
20
12
20
13
20
14
20
15
20
16
20
17
Act
uar
iall
y d
eter
min
ed c
on
trib
uti
on
$1
1,1
94
$
11
,18
5
$
14
,21
7
$
14
,21
0
$
14
,58
1
$
15
,89
6
$
16
,40
9
$
15
,38
9
$
14
,85
5
$
14
,32
8
Co
ntr
ibu
tio
ns
in r
elat
ion
to
th
e
a
ctu
aria
lly d
eter
min
ed c
on
trib
uti
on
11
,19
4
11
,18
5
1
4,2
17
14
,21
0
1
4,5
81
15
,89
6
1
6,4
09
15
,38
9
1
4,8
55
14
,32
8
Co
ntr
ibu
tio
n d
efic
ien
cy
$-
$
-
$-
$
-
$-
$
-
$-
$
-
$-
$
-
Co
ver
ed-e
mp
loyee
pay
roll
$4
3,9
42
$
48
,82
4
$
49
,06
4
$
47
,84
1
$
45
,67
3
$
43
,36
2
$
44
,95
1
$
48
,55
0
$
49
,18
2
$
50
,41
2
Co
ntr
ibu
tio
ns
as a
per
cen
tage
of
c
over
ed-e
mp
loyee
pay
roll
25
.48
%2
2.9
1%
28
.98
%2
9.7
0%
31
.92
%3
6.6
6%
36
.50
%3
1.7
0%
30
.20
%2
8.4
2%
Val
uat
ion
dat
e1
/1/2
00
81
/1/2
00
91
/1/2
01
01
/1/2
01
11
/1/2
01
21
/1/2
01
31
/1/2
01
41
/1/2
01
51
/1/2
01
61
/1/2
01
7
No
tes:
So
urc
e:
1)
Co
vere
d-e
mp
loyee p
ayro
ll f
or
20
14
ha
s b
een
ch
an
ged
to
refl
ect
the n
ew
GA
SB
la
ng
ua
ge.
An
ne
Aru
nd
el C
ou
nty
Ret
irem
ent
and
Pen
sio
n S
yst
em
Req
uir
ed S
up
ple
men
tary
In
form
atio
n
Sch
edu
le o
f E
mp
loyer
's C
on
trib
uti
on
s -
Fir
e S
ervic
e R
etir
emen
t P
lan
Fo
r th
e L
ast
Ten
Yea
rs E
nd
ed J
un
e 3
0
(Do
lla
rs i
n t
ho
usa
nd
s)
Rem
ain
ing
am
ort
iza
tio
n
2)
Meth
od
s a
nd
ass
um
pti
on
s li
sted
belo
w a
re u
sed
by t
he a
ctu
ary
to
dete
rmin
e c
on
trib
uti
on
ra
tes:
Actu
ari
al
co
st m
eth
od
Pro
jecte
d U
nit
Cre
dit
.
Am
ort
iza
tio
n m
eth
od
Level
perc
en
tag
e o
f p
ayro
ll,
clo
sed
, in
cre
asi
ng
3.0
% p
er
yea
r.
17
to
26
yea
rs.
Sta
rtin
g w
ith
new
ba
ses
in 2
01
4,
ass
um
pti
on
ch
an
ges
peri
od
an
d g
ain
s a
nd
lo
sses
are
am
ort
ized
over
20
yea
rs.
Pla
n c
ha
ng
es
are
am
ort
ized
over
the a
vera
ge f
utu
re s
erv
ice
of
the a
cti
ve p
op
ula
tio
n a
t th
e t
ime o
f th
e c
ha
ng
e.
Ass
et
va
lua
tio
n m
eth
od
Fiv
e-y
ea
r sm
oo
thed
ma
rket.
Infl
ati
on
3.0
%
Sa
lary
in
cre
ase
sR
ate
s va
ry b
y p
art
icip
an
t a
ge.
Invest
men
t ra
te o
f re
turn
7.5
% n
et
of
pen
sio
n p
lan
in
vest
men
t exp
en
se,
inclu
din
g i
nfl
ati
on
, eff
ecti
ve 1
/1/2
01
4.
gen
era
tio
na
lly u
sin
g s
ca
le A
A.
Actu
ari
al
Secti
on
of
the A
nn
e A
run
del
Co
un
ty R
eti
rem
en
t a
nd
Pen
sio
n S
yst
em
Co
mp
reh
en
sive A
nn
ua
l F
ina
ncia
l R
ep
ort
fo
r th
e Y
ea
r E
nd
ed
Decem
ber
31
, 2
01
6.
Reti
rem
en
t a
ge
Ra
tes
va
ry b
y p
art
icip
an
t a
ge a
nd
len
gth
of
serv
ice.
Mo
rta
lity
Hea
lth
y:
RP
-20
00
Blu
e C
oll
ar
Mo
rta
lity
Ta
ble
fo
r m
ale
s a
nd
fem
ale
s p
roje
cte
d g
en
era
tio
na
lly u
sin
g s
ca
le A
A.
Dis
ab
led
: R
P-2
00
0 B
lue C
oll
ar
Mo
rta
lity
Ta
ble
fo
r m
ale
s a
nd
fem
ale
s se
t fo
rwa
rd f
ive y
ea
rs a
nd
th
en
pro
jecte
d
A-9
7
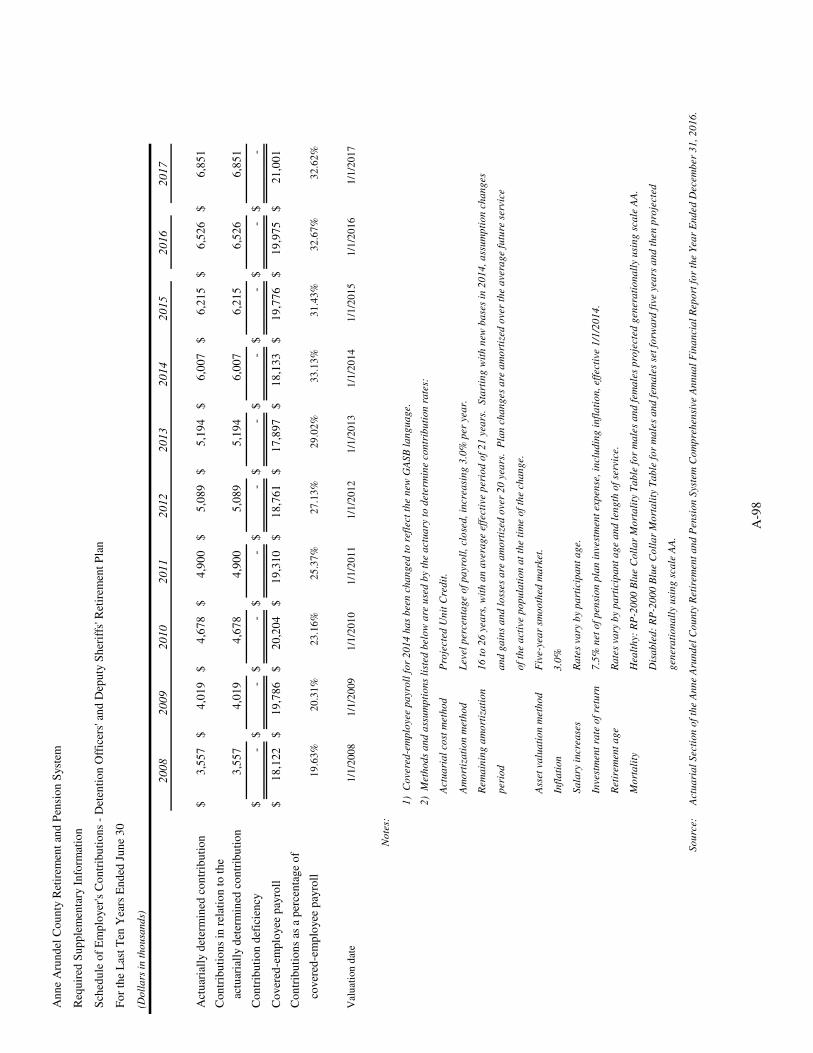
20
08
20
09
20
10
20
11
20
12
20
13
20
14
20
15
20
16
20
17
Act
uar
iall
y d
eter
min
ed c
on
trib
uti
on
$3
,55
7
$
4,0
19
$
4,6
78
$
4,9
00
$
5,0
89
$
5,1
94
$
6,0
07
$
6,2
15
$
6,5
26
$
6,8
51
Co
ntr
ibu
tio
ns
in r
elat
ion
to
th
e
a
ctu
aria
lly d
eter
min
ed c
on
trib
uti
on
3,5
57
4,0
19
4
,67
8
4,9
00
5
,08
9
5,1
94
6
,00
7
6,2
15
6
,52
6
6,8
51
Co
ntr
ibu
tio
n d
efic
ien
cy$
-
$-
$
-
$-
$
-
$-
$
-
$-
$
-
$-
Co
ver
ed-e
mp
loyee
pay
roll
$1
8,1
22
$
19
,78
6
$
20
,20
4
$
19
,31
0
$
18
,76
1
$
17
,89
7
$
18
,13
3
$
19
,77
6
$
19
,97
5
$
21
,00
1
Co
ntr
ibu
tio
ns
as a
per
cen
tage
of
c
over
ed-e
mp
loyee
pay
roll
19
.63
%2
0.3
1%
23
.16
%2
5.3
7%
27
.13
%2
9.0
2%
33
.13
%3
1.4
3%
32
.67
%3
2.6
2%
Val
uat
ion
dat
e1
/1/2
00
81
/1/2
00
91
/1/2
01
01
/1/2
01
11
/1/2
01
21
/1/2
01
31
/1/2
01
41
/1/2
01
51
/1/2
01
61
/1/2
01
7
No
tes:
So
urc
e:
1)
Co
vere
d-e
mp
loyee p
ayro
ll f
or
20
14
ha
s b
een
ch
an
ged
to
refl
ect
the n
ew
GA
SB
la
ng
ua
ge.
Infl
ati
on
3.0
%
Sa
lary
in
cre
ase
sR
ate
s va
ry b
y p
art
icip
an
t a
ge.
2)
Meth
od
s a
nd
ass
um
pti
on
s li
sted
belo
w a
re u
sed
by t
he a
ctu
ary
to
dete
rmin
e c
on
trib
uti
on
ra
tes:
Actu
ari
al
co
st m
eth
od
Pro
jecte
d U
nit
Cre
dit
.
Am
ort
iza
tio
n m
eth
od
Level
perc
en
tag
e o
f p
ayro
ll,
clo
sed
, in
cre
asi
ng
3.0
% p
er
yea
r.
16
to
26
yea
rs,
wit
h a
n a
vera
ge e
ffecti
ve p
eri
od
of
21
yea
rs.
Sta
rtin
g w
ith
new
ba
ses
in 2
01
4,
ass
um
pti
on
ch
an
ges
peri
od
an
d g
ain
s a
nd
lo
sses
are
am
ort
ized
over
20
yea
rs.
Pla
n c
ha
ng
es
are
am
ort
ized
over
the a
vera
ge f
utu
re s
erv
ice
of
the a
cti
ve p
op
ula
tio
n a
t th
e t
ime o
f th
e c
ha
ng
e.
Ass
et
va
lua
tio
n m
eth
od
Fiv
e-y
ea
r sm
oo
thed
ma
rket.
An
ne
Aru
nd
el C
ou
nty
Ret
irem
ent
and
Pen
sio
n S
yst
em
Req
uir
ed S
up
ple
men
tary
In
form
atio
n
Sch
edu
le o
f E
mp
loyer
's C
on
trib
uti
on
s -
Det
enti
on
Off
icer
s' a
nd
Dep
uty
Sh
erif
fs' R
etir
emen
t P
lan
Fo
r th
e L
ast
Ten
Yea
rs E
nd
ed J
un
e 3
0
(Do
lla
rs i
n t
ho
usa
nd
s)
Rem
ain
ing
am
ort
iza
tio
n
Actu
ari
al
Secti
on
of
the A
nn
e A
run
del
Co
un
ty R
eti
rem
en
t a
nd
Pen
sio
n S
yst
em
Co
mp
reh
en
sive A
nn
ua
l F
ina
ncia
l R
ep
ort
fo
r th
e Y
ea
r E
nd
ed
Decem
ber
31
, 2
01
6.
Hea
lth
y:
RP
-20
00
Blu
e C
oll
ar
Mo
rta
lity
Ta
ble
fo
r m
ale
s a
nd
fem
ale
s p
roje
cte
d g
en
era
tio
na
lly u
sin
g s
ca
le A
A.
Dis
ab
led
: R
P-2
00
0 B
lue C
oll
ar
Mo
rta
lity
Ta
ble
fo
r m
ale
s a
nd
fem
ale
s se
t fo
rwa
rd f
ive y
ea
rs a
nd
th
en
pro
jecte
d
gen
era
tio
na
lly u
sin
g s
ca
le A
A.
Invest
men
t ra
te o
f re
turn
7.5
% n
et
of
pen
sio
n p
lan
in
vest
men
t exp
en
se,
inclu
din
g i
nfl
ati
on
, eff
ecti
ve 1
/1/2
01
4.
Reti
rem
en
t a
ge
Ra
tes
va
ry b
y p
art
icip
an
t a
ge a
nd
len
gth
of
serv
ice.
Mo
rta
lity
A-9
8
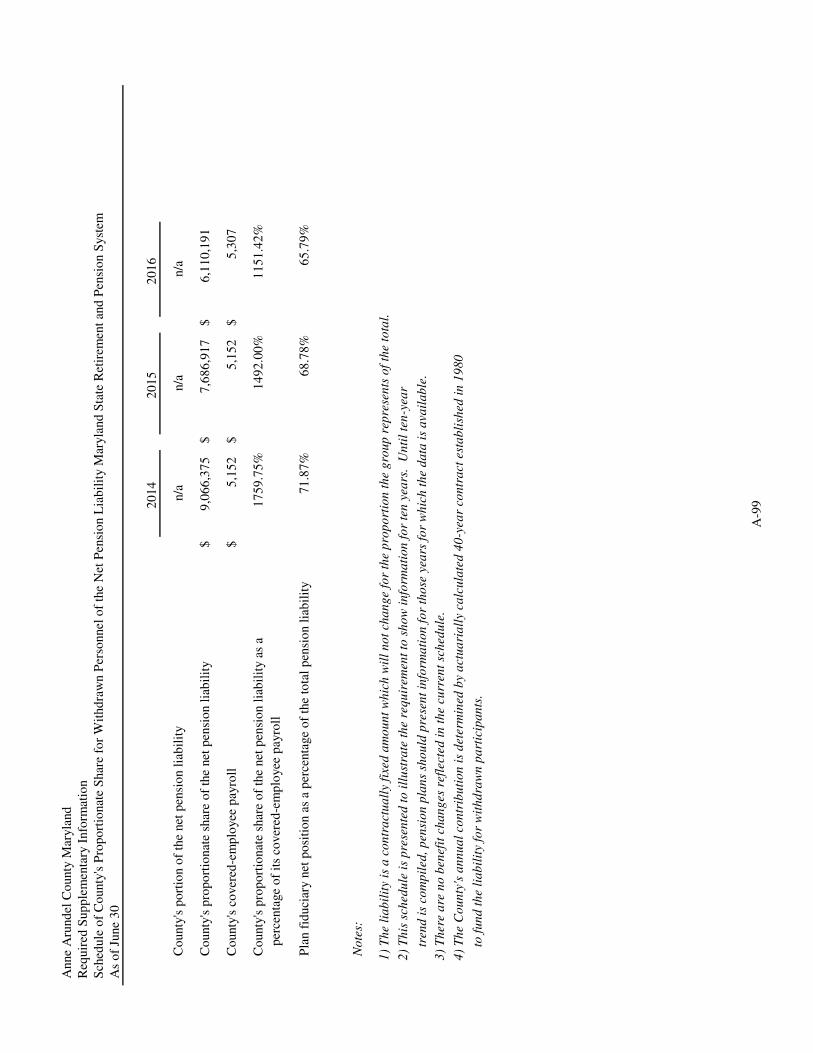
20
14
20
15
20
16
Co
unty
's p
ort
ion o
f th
e net
pen
sio
n l
iab
ilit
yn/a
n/a
n/a
Co
unty
's p
rop
ort
ionat
e sh
are
of
the
net
pen
sio
n l
iab
ilit
y$
9,0
66
,37
5
$7
,68
6,9
17
$6
,11
0,1
91
Co
unty
's c
over
ed-e
mp
loyee
pay
roll
$5
,15
2
$5
,15
2
$5
,30
7
Co
unty
's p
rop
ort
ionat
e sh
are
of
the
net
pen
sio
n l
iab
ilit
y a
s a
17
59
.75
%1
49
2.0
0%
11
51
.42
%
p
erce
nta
ge
of
its
cover
ed-e
mp
loyee
pay
roll
Pla
n f
iduci
ary n
et p
osi
tio
n a
s a
per
centa
ge
of
the
tota
l p
ensi
on l
iab
ilit
y7
1.8
7%
68
.78
%6
5.7
9%
No
tes:
1)
Th
e li
ab
ilit
y is
a c
on
tra
ctu
all
y fi
xed
am
ou
nt
wh
ich
wil
l n
ot
cha
ng
e fo
r th
e p
rop
ort
ion
th
e g
rou
p r
epre
sen
ts o
f th
e to
tal.
to f
un
d t
he
lia
bil
ity
for
wit
hd
raw
n p
art
icip
an
ts.
3)
Th
ere
are
no
ben
efit
ch
an
ges
ref
lect
ed i
n t
he
curr
ent
sch
edu
le.
4)
Th
e C
ou
nty
's a
nn
ua
l co
ntr
ibu
tio
n i
s d
eter
min
ed b
y a
ctu
ari
all
y ca
lcu
late
d 4
0-y
ear
con
tra
ct e
sta
bli
shed
in
19
80
Anne
Aru
nd
el C
ounty
Mar
yla
nd
Req
uir
ed S
up
ple
men
tary
Info
rmat
ion
Sch
edule
of
Co
unty
's P
rop
ort
ionat
e S
har
e fo
r W
ithd
raw
n P
erso
nnel
of
the
Net
Pen
sio
n L
iab
ilit
y M
aryla
nd
Sta
te R
etir
emen
t an
d P
ensi
on S
yst
em
As
of
June
30
2)
Th
is s
ched
ule
is
pre
sen
ted
to
ill
ust
rate
th
e re
qu
irem
ent
to s
ho
w i
nfo
rma
tio
n f
or
ten
yea
rs.
Un
til
ten
-yea
r
tren
d i
s co
mp
iled
, p
ensi
on
pla
ns
sho
uld
pre
sen
t in
form
ati
on
fo
r th
ose
yea
rs f
or
wh
ich
th
e d
ata
is
ava
ila
ble
.
A-9
9
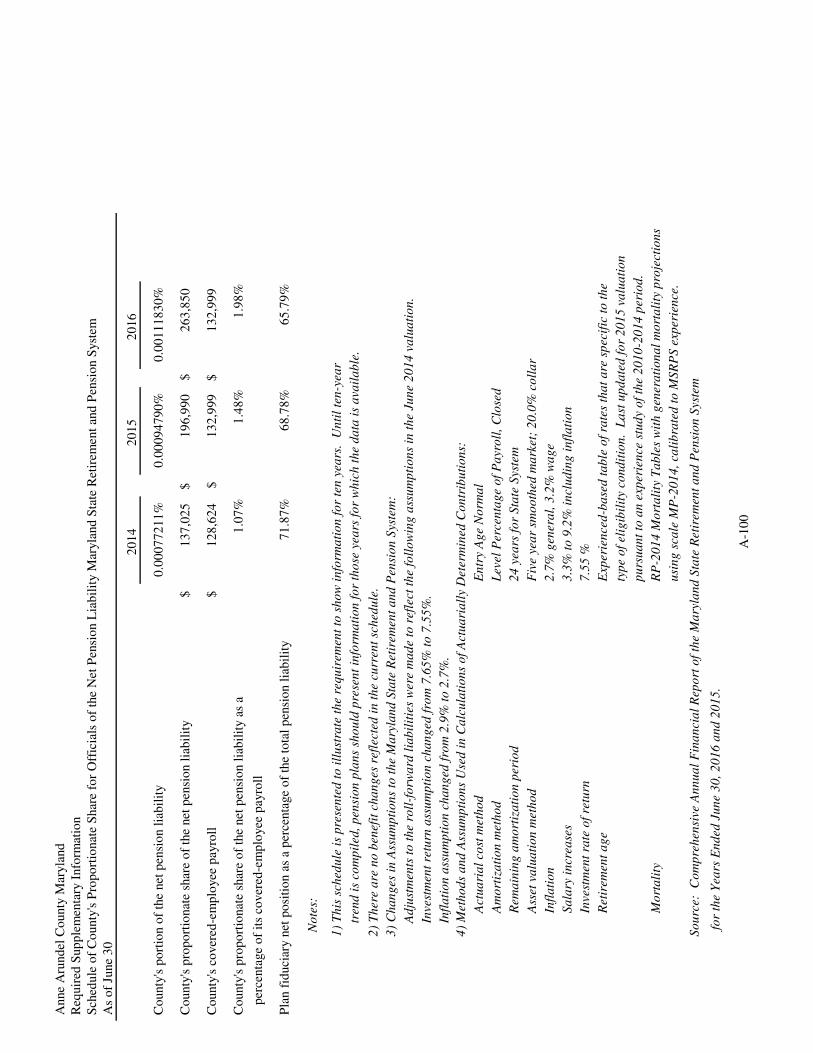
20
14
20
15
20
16
0.0
00
77
21
1%
0.0
00
94
79
0%
0.0
01
11
83
0%
$1
37
,02
5
$1
96
,99
0
$2
63
,85
0
$1
28
,62
4
$1
32
,99
9
$1
32
,99
9
1.0
7%
1.4
8%
1.9
8%
71
.87
%6
8.7
8%
65
.79
%
No
tes:
So
urc
e:
Co
mp
reh
ensi
ve A
nn
ua
l F
ina
nci
al
Rep
ort
of
the
Ma
ryla
nd
Sta
te R
etir
emen
t a
nd
Pen
sio
n S
yste
m
fo
r th
e Y
ears
En
ded
Ju
ne
30
, 2
01
6 a
nd
20
15
.
M
ort
ali
ty
usi
ng
sca
le M
P-2
01
4,
cali
bra
ted
to
MS
RP
S e
xper
ien
ce.
A
ctu
ari
al
cost
met
ho
d
A
mo
rtiz
ati
on
met
ho
d
R
ema
inin
g a
mo
rtiz
ati
on
per
iod
A
sset
va
lua
tio
n m
eth
od
I
nfl
ati
on
S
ala
ry i
ncr
ease
s
I
nve
stm
ent
rate
of
retu
rn
R
etir
emen
t a
ge
Exp
erie
nce
d-b
ase
d t
ab
le o
f ra
tes
tha
t a
re s
pec
ific
to
th
e
typ
e o
f el
igib
ilit
y co
nd
itio
n.
La
st u
pd
ate
d f
or
20
15
va
lua
tio
n
pu
rsu
an
t to
an
exp
erie
nce
stu
dy
of
the
20
10
-20
14
per
iod
.
RP
-20
14
Mo
rta
lity
Ta
ble
s w
ith
gen
era
tio
na
l m
ort
ali
ty p
roje
ctio
ns
24
yea
rs f
or
Sta
te S
yste
m
Fiv
e ye
ar
smo
oth
ed m
ark
et;
20
.0%
co
lla
r
2.7
% g
ener
al,
3.2
% w
ag
e
3.3
% t
o 9
.2%
in
clu
din
g i
nfl
ati
on
7.5
5 %
Anne
Aru
nd
el C
ounty
Mar
yla
nd
Req
uir
ed S
up
ple
men
tary
Info
rmat
ion
Sch
edule
of
Co
unty
's P
rop
ort
ionat
e S
har
e fo
r O
ffic
ials
of
the
Net
Pen
sio
n L
iab
ilit
y M
aryla
nd
Sta
te R
etir
emen
t an
d P
ensi
on S
yst
em
As
of
June
30
Co
unty
's p
ort
ion o
f th
e net
pen
sio
n l
iab
ilit
y
Co
unty
's p
rop
ort
ionat
e sh
are
of
the
net
pen
sio
n l
iab
ilit
y
Co
unty
's c
over
ed-e
mp
loyee
pay
roll
Co
unty
's p
rop
ort
ionat
e sh
are
of
the
net
pen
sio
n l
iab
ilit
y a
s a
per
centa
ge
of
its
cover
ed-e
mp
loyee
pay
roll
Pla
n f
iduci
ary n
et p
osi
tio
n a
s a
per
centa
ge
of
the
tota
l p
ensi
on l
iab
ilit
y
1)
Th
is s
ched
ule
is
pre
sen
ted
to
ill
ust
rate
th
e re
qu
irem
ent
to s
ho
w i
nfo
rma
tio
n f
or
ten
yea
rs.
Un
til
ten
-yea
r
tren
d i
s co
mp
iled
, p
ensi
on
pla
ns
sho
uld
pre
sen
t in
form
ati
on
fo
r th
ose
yea
rs f
or
wh
ich
th
e d
ata
is
ava
ila
ble
.
2)
Th
ere
are
no
ben
efit
ch
an
ges
ref
lect
ed i
n t
he
curr
ent
sch
edu
le.
3)
Ch
an
ges
in
Ass
um
pti
on
s to
th
e M
ary
lan
d S
tate
Ret
irem
ent
an
d P
ensi
on
Sys
tem
:
Ad
just
men
ts t
o t
he
roll
-fo
rwa
rd l
iab
ilit
ies
wer
e m
ad
e to
ref
lect
th
e fo
llo
win
g a
ssu
mp
tio
ns
in t
he
Jun
e 2
01
4 v
alu
ati
on
.
Inve
stm
ent
retu
rn a
ssu
mp
tio
n c
ha
ng
ed f
rom
7.6
5%
to
7.5
5%
.
Infl
ati
on
ass
um
pti
on
ch
an
ged
fro
m 2
.9%
to
2.7
%.
4)
Met
ho
ds
an
d A
ssu
mp
tio
ns
Use
d i
n C
alc
ula
tio
ns
of
Act
ua
ria
lly
Det
erm
ined
Co
ntr
ibu
tio
ns:
En
try
Ag
e N
orm
al
Lev
el P
erce
nta
ge
of
Pa
yro
ll,
Clo
sed
A-1
00
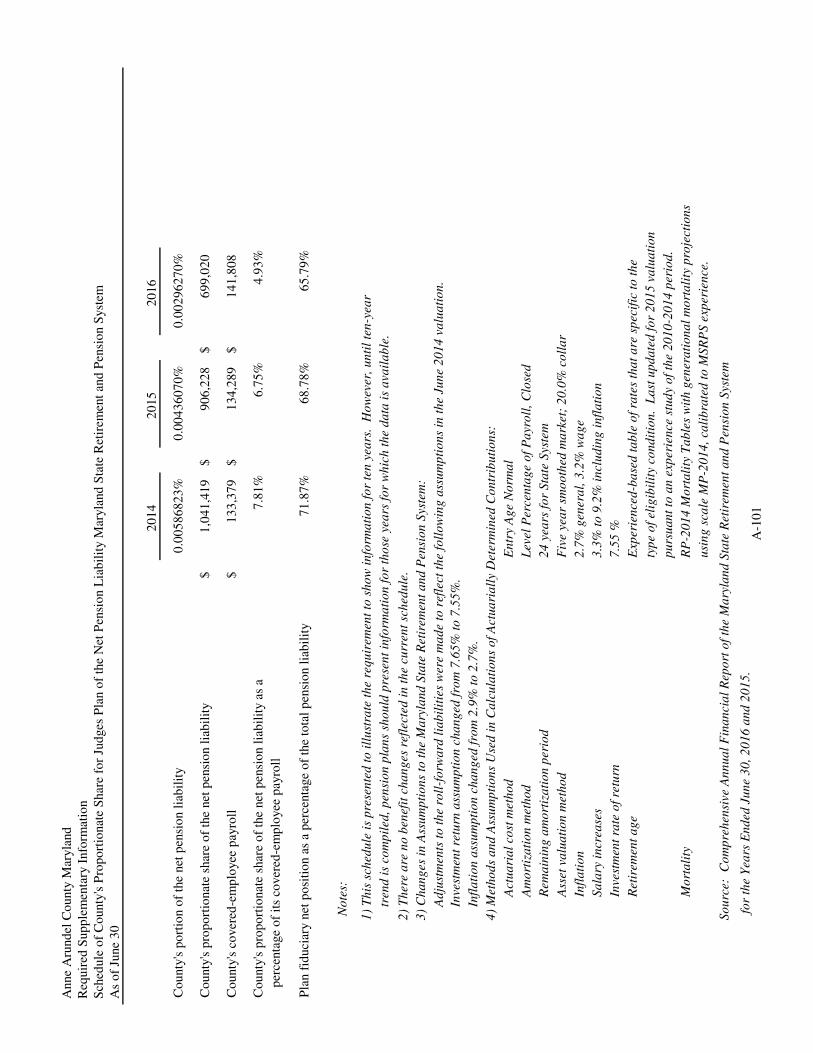
20
14
20
15
20
16
Co
unty
's p
ort
ion o
f th
e net
pen
sio
n l
iab
ilit
y0
.00
58
68
23
%0
.00
43
60
70
%0
.00
29
62
70
%
Co
unty
's p
rop
ort
ionat
e sh
are
of
the
net
pen
sio
n l
iab
ilit
y$
1,0
41
,41
9
$
90
6,2
28
$
69
9,0
20
Co
unty
's c
over
ed-e
mp
loyee
pay
roll
$1
33
,37
9
$1
34
,28
9
$1
41
,80
8
Co
unty
's p
rop
ort
ionat
e sh
are
of
the
net
pen
sio
n l
iab
ilit
y a
s a
7.8
1%
6.7
5%
4.9
3%
p
erce
nta
ge
of
its
cover
ed-e
mp
loyee
pay
roll
Pla
n f
iduci
ary n
et p
osi
tio
n a
s a
per
centa
ge
of
the
tota
l p
ensi
on l
iab
ilit
y7
1.8
7%
68
.78
%6
5.7
9%
No
tes:
So
urc
e:
Co
mp
reh
ensi
ve A
nn
ua
l F
ina
nci
al
Rep
ort
of
the
Ma
ryla
nd
Sta
te R
etir
emen
t a
nd
Pen
sio
n S
yste
m
fo
r th
e Y
ears
En
ded
Ju
ne
30
, 2
01
6 a
nd
20
15
.
pu
rsu
an
t to
an
exp
erie
nce
stu
dy
of
the
20
10
-20
14
per
iod
.
M
ort
ali
tyR
P-2
01
4 M
ort
ali
ty T
ab
les
wit
h g
ener
ati
on
al
mo
rta
lity
pro
ject
ion
s
usi
ng
sca
le M
P-2
01
4,
cali
bra
ted
to
MS
RP
S e
xper
ien
ce.
I
nve
stm
ent
rate
of
retu
rn7
.55
%
R
etir
emen
t a
ge
Exp
erie
nce
d-b
ase
d t
ab
le o
f ra
tes
tha
t a
re s
pec
ific
to
th
e
typ
e o
f el
igib
ilit
y co
nd
itio
n.
La
st u
pd
ate
d f
or
20
15
va
lua
tio
n
A
sset
va
lua
tio
n m
eth
od
Fiv
e ye
ar
smo
oth
ed m
ark
et;
20
.0%
co
lla
r
I
nfl
ati
on
2.7
% g
ener
al,
3.2
% w
ag
e
S
ala
ry i
ncr
ease
s3
.3%
to
9.2
% i
ncl
ud
ing
in
fla
tio
n
Anne
Aru
nd
el C
ounty
Mar
yla
nd
Req
uir
ed S
up
ple
men
tary
Info
rmat
ion
Sch
edule
of
Co
unty
's P
rop
ort
ionat
e S
har
e fo
r Ju
dges
Pla
n o
f th
e N
et P
ensi
on L
iab
ilit
y M
aryla
nd
Sta
te R
etir
emen
t an
d P
ensi
on S
yst
em
As
of
June
30
1)
Th
is s
ched
ule
is
pre
sen
ted
to
ill
ust
rate
th
e re
qu
irem
ent
to s
ho
w i
nfo
rma
tio
n f
or
ten
yea
rs.
Ho
wev
er,
un
til
ten
-yea
r
R
ema
inin
g a
mo
rtiz
ati
on
per
iod
24
yea
rs f
or
Sta
te S
yste
m
tren
d i
s co
mp
iled
, p
ensi
on
pla
ns
sho
uld
pre
sen
t in
form
ati
on
fo
r th
ose
yea
rs f
or
wh
ich
th
e d
ata
is
ava
ila
ble
.
2)
Th
ere
are
no
ben
efit
ch
an
ges
ref
lect
ed i
n t
he
curr
ent
sch
edu
le.
3)
Ch
an
ges
in
Ass
um
pti
on
s to
th
e M
ary
lan
d S
tate
Ret
irem
ent
an
d P
ensi
on
Sys
tem
:
A
mo
rtiz
ati
on
met
ho
dL
evel
Per
cen
tag
e o
f P
ayr
oll
, C
lose
d
Ad
just
men
ts t
o t
he
roll
-fo
rwa
rd l
iab
ilit
ies
wer
e m
ad
e to
ref
lect
th
e fo
llo
win
g a
ssu
mp
tio
ns
in t
he
Jun
e 2
01
4 v
alu
ati
on
.
Inve
stm
ent
retu
rn a
ssu
mp
tio
n c
ha
ng
ed f
rom
7.6
5%
to
7.5
5%
.
Infl
ati
on
ass
um
pti
on
ch
an
ged
fro
m 2
.9%
to
2.7
%.
4)
Met
ho
ds
an
d A
ssu
mp
tio
ns
Use
d i
n C
alc
ula
tio
ns
of
Act
ua
ria
lly
Det
erm
ined
Co
ntr
ibu
tio
ns:
A
ctu
ari
al
cost
met
ho
d
E
ntr
y A
ge
No
rma
l
A-1
01
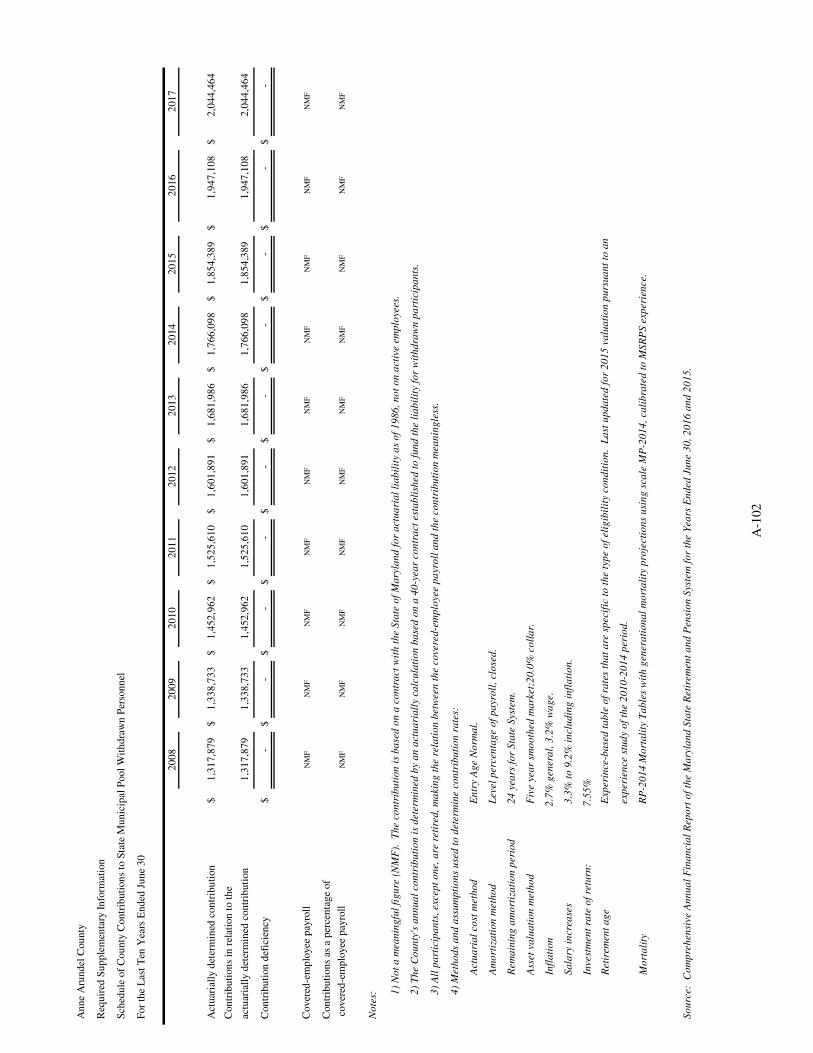
An
ne
Aru
nd
el C
ou
nty
Req
uir
ed S
up
ple
men
tary
In
form
atio
n
Sch
edu
le o
f C
ou
nty
Con
trib
uti
on
s to
Sta
te M
un
icip
al P
ool
Wit
hd
raw
n P
erso
nn
el
For
the
Las
t T
en Y
ears
En
ded
Ju
ne
30
20
08
20
09
20
10
20
11
20
12
20
13
20
14
20
15
20
16
20
17
Act
uar
iall
y d
eter
min
ed c
on
trib
uti
on
$1
,31
7,8
79
$
1,3
38
,73
3
$1
,45
2,9
62
$
1,5
25
,61
0
$1
,60
1,8
91
$
1,6
81
,98
6
$1
,76
6,0
98
$
1,8
54
,38
9
$1
,94
7,1
08
$2
,04
4,4
64
Con
trib
uti
on
s in
rel
atio
n t
o t
he
actu
aria
lly d
eter
min
ed c
on
trib
uti
on
1,3
17
,87
9
1,3
38
,73
3
1,4
52
,96
2
1,5
25
,61
0
1,6
01
,89
1
1,6
81
,98
6
1,7
66
,09
8
1,8
54
,38
9
1,9
47
,10
8
2
,04
4,4
64
Con
trib
uti
on
def
icie
ncy
$-
$-
$-
$-
$-
$-
$-
$-
$-
$
-
Cover
ed-e
mp
loyee
pay
roll
NM
FN
MF
NM
FN
MF
NM
FN
MF
NM
FN
MF
NM
FN
MF
Con
trib
uti
on
s as
a p
erce
nta
ge
of
cover
ed-e
mp
loyee
pay
roll
NM
FN
MF
NM
FN
MF
NM
FN
MF
NM
FN
MF
NM
FN
MF
No
tes:
Actu
ari
al
co
st m
eth
od
A
mo
rtiz
ati
on
meth
od
R
em
ain
ing
am
ort
iza
tio
n p
eri
od
A
sset
va
lua
tio
n m
eth
od
I
nfl
ati
on
S
ala
ry i
ncre
ase
s
I
nvest
men
t ra
te o
f re
turn
:
R
eti
rem
en
t a
ge
M
ort
ali
ty
So
urc
e:
Co
mp
reh
en
sive A
nn
ua
l F
ina
ncia
l R
ep
ort
of
the M
ary
lan
d S
tate
Reti
rem
en
t a
nd
Pen
sio
n S
yst
em
fo
r th
e Y
ea
rs E
nd
ed
Ju
ne 3
0,
20
16
an
d 2
01
5.
Level
perc
en
tag
e o
f p
ayro
ll,
clo
sed
.
En
try A
ge N
orm
al.
1)
No
t a
mea
nin
gfu
l fi
gu
re (
NM
F).
T
he c
on
trib
uti
on
is
ba
sed
on
a c
on
tra
ct
wit
h t
he S
tate
of
Ma
ryla
nd
fo
r a
ctu
ari
al
lia
bil
ity a
s o
f 1
98
6,
no
t o
n a
cti
ve e
mp
loyees.
2)
Th
e C
ou
nty
's a
nn
ua
l co
ntr
ibu
tio
n i
s d
ete
rmin
ed
by a
n a
ctu
ari
all
y c
alc
ula
tio
n b
ase
d o
n a
40
-yea
r co
ntr
act
est
ab
lish
ed
to
fu
nd
th
e l
iab
ilit
y f
or
wit
hd
raw
n p
art
icip
an
ts.
3)
All
pa
rtic
ipa
nts
, excep
t o
ne,
are
reti
red
, m
akin
g t
he r
ela
tio
n b
etw
een
th
e c
overe
d-e
mp
loyee p
ayro
ll a
nd
th
e c
on
trib
uti
on
mea
nin
gle
ss.
4)
Meth
od
s a
nd
ass
um
pti
on
s u
sed
to
dete
rmin
e c
on
trib
uti
on
ra
tes:
Exp
eri
nce-b
ase
d t
ab
le o
f ra
tes
tha
t a
re s
pecif
ic t
o t
he t
yp
e o
f eli
gib
ilit
y c
on
dit
ion
. L
ast
up
da
ted
fo
r 2
01
5 v
alu
ati
on
pu
rsu
an
t to
an
RP
-20
14
Mo
rta
lity
Ta
ble
s w
ith
gen
era
tio
na
l m
ort
ali
ty p
roje
cti
on
s u
sin
g s
ca
le M
P-2
01
4,
ca
lib
rate
d t
o M
SR
PS
exp
eri
en
ce.
24
yea
rs f
or
Sta
te S
yst
em
.
Fiv
e y
ea
r sm
oo
thed
ma
rket;
20
.0%
co
lla
r.
2.7
% g
en
era
l, 3
.2%
wa
ge.
3.3
% t
o 9
.2%
in
clu
din
g i
nfl
ati
on
.
7.5
5%
exp
eri
en
ce s
tud
y o
f th
e 2
01
0-2
01
4 p
eri
od
.
A-1
02
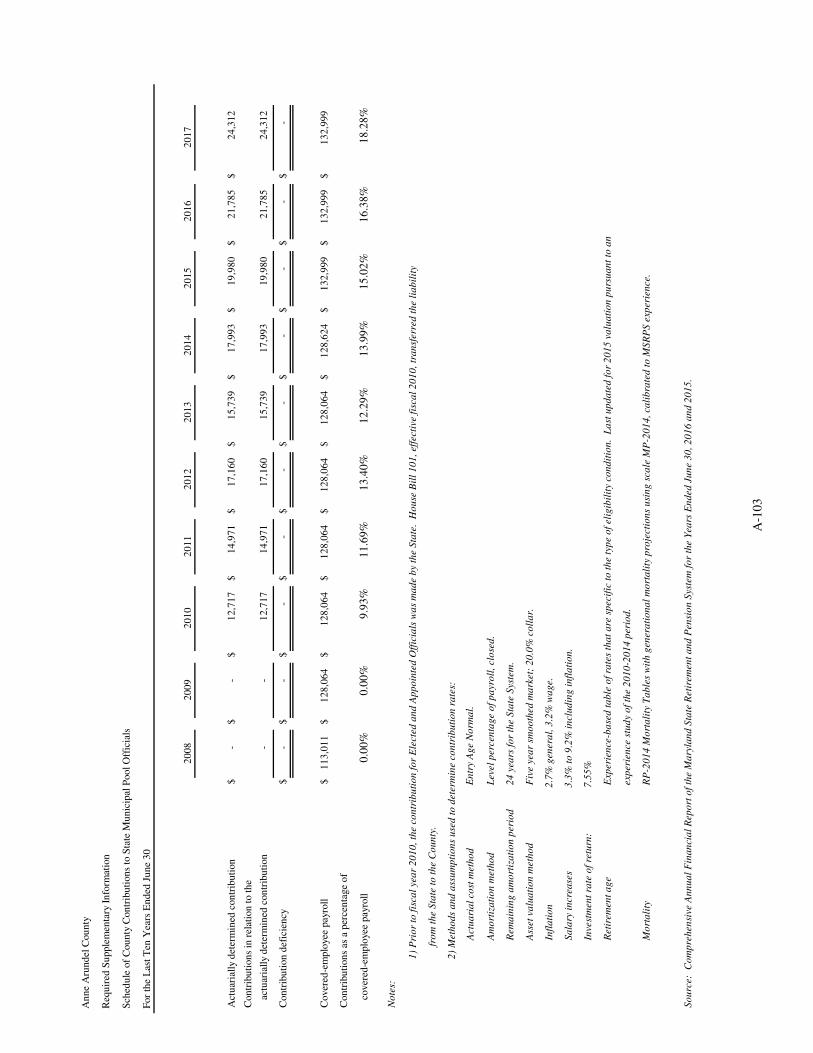
20
08
20
09
20
10
20
11
20
12
20
13
20
14
20
15
20
16
20
17
Act
uar
iall
y d
eter
min
ed c
on
trib
uti
on
$-
$-
$1
2,7
17
$1
4,9
71
$1
7,1
60
$1
5,7
39
$1
7,9
93
$1
9,9
80
$2
1,7
85
$2
4,3
12
Con
trib
uti
on
s in
rel
atio
n t
o t
he
a
ctu
aria
lly
det
erm
ined
con
trib
uti
on
-
-
12
,71
7
14
,97
1
17
,16
0
15
,73
9
17
,99
3
19
,98
0
21
,78
5
24
,31
2
Con
trib
uti
on
def
icie
ncy
$-
$-
$-
$-
$-
$-
$-
$-
$-
$-
Cover
ed-e
mplo
yee
pay
roll
$1
13
,01
1
$1
28
,06
4
$1
28
,06
4
$1
28
,06
4
$1
28
,06
4
$1
28
,06
4
$1
28
,62
4
$1
32
,99
9
$1
32
,99
9
$1
32
,99
9
Con
trib
uti
on
s as
a p
erce
nta
ge
of
c
over
ed-e
mplo
yee
pay
roll
0.0
0%
0.0
0%
9.9
3%
11
.69
%1
3.4
0%
12
.29
%1
3.9
9%
15
.02
%1
6.3
8%
18
.28
%
No
tes:
A
ctu
ari
al
co
st m
eth
od
A
mo
rtiz
ati
on
meth
od
R
em
ain
ing
am
ort
iza
tio
n p
eri
od
A
sset
va
lua
tio
n m
eth
od
I
nfl
ati
on
S
ala
ry i
ncre
ase
s
I
nvest
men
t ra
te o
f re
turn
:
R
eti
rem
en
t a
ge
M
ort
ali
ty
For
the
Las
t T
en Y
ears
En
ded
Ju
ne
30
Sch
edu
le o
f C
ou
nty
Con
trib
uti
on
s to
Sta
te M
un
icip
al P
ool
Off
icia
ls
2)
Meth
od
s a
nd
ass
um
pti
on
s u
sed
to
dete
rmin
e c
on
trib
uti
on
ra
tes:
fr
om
th
e S
tate
to
th
e C
ou
nty
.
An
ne
Aru
nd
el C
ou
nty
Req
uir
ed S
upple
men
tary
In
form
atio
n
En
try A
ge N
orm
al.
Level
perc
en
tag
e o
f p
ayro
ll, clo
sed
.
24
yea
rs f
or
the S
tate
Syst
em
.
Fiv
e y
ea
r sm
oo
thed
ma
rket;
20
.0%
co
lla
r.
2.7
% g
en
era
l, 3
.2%
wa
ge.
3.3
% t
o 9
.2%
in
clu
din
g i
nfl
ati
on
.
7.5
5%
Exp
eri
en
ce-b
ase
d t
ab
le o
f ra
tes
tha
t a
re s
pecif
ic t
o t
he t
yp
e o
f eli
gib
ilit
y c
on
dit
ion
. L
ast
up
da
ted
fo
r 2
01
5 v
alu
ati
on
pu
rsu
an
t to
an
exp
eri
en
ce s
tud
y o
f th
e 2
01
0-2
01
4 p
eri
od
.
RP
-20
14
Mo
rta
lity
Ta
ble
s w
ith
gen
era
tio
na
l m
ort
ali
ty p
roje
cti
on
s u
sin
g s
ca
le M
P-2
01
4, ca
lib
rate
d t
o M
SR
PS
exp
eri
en
ce.
So
urc
e:
Co
mp
reh
en
sive A
nn
ua
l F
ina
ncia
l R
ep
ort
of
the M
ary
lan
d S
tate
Reti
rem
en
t a
nd
Pen
sio
n S
yst
em
fo
r th
e Y
ea
rs E
nd
ed
Ju
ne 3
0, 2
01
6 a
nd
20
15
.
1)
Pri
or
to f
isca
l yea
r 2
01
0, th
e c
on
trib
uti
on
fo
r E
lecte
d a
nd
Ap
po
inte
d O
ffic
ials
wa
s m
ad
e b
y t
he S
tate
. H
ou
se B
ill
10
1, eff
ecti
ve f
isca
l 2
01
0, tr
an
sferr
ed
th
e l
iab
ilit
y
A-1
03
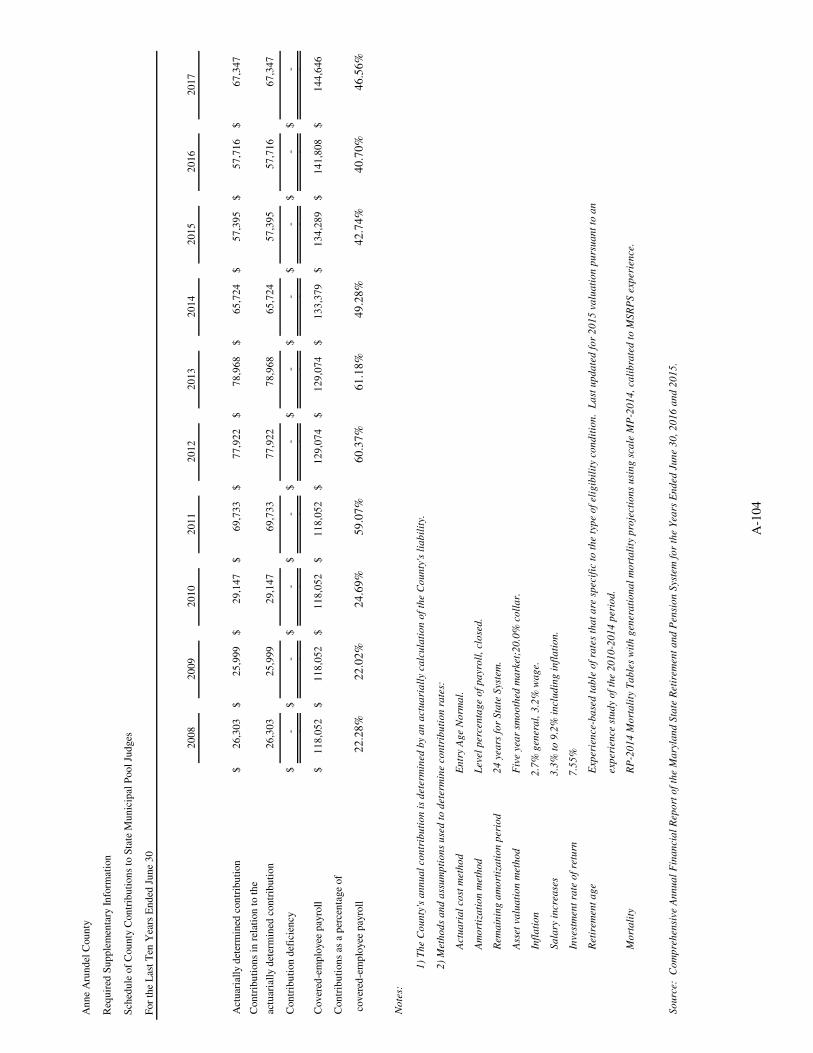
20
08
20
09
20
10
20
11
20
12
20
13
20
14
20
15
20
16
20
17
Act
uar
iall
y d
eter
min
ed c
on
trib
uti
on
$2
6,3
03
$2
5,9
99
$2
9,1
47
$6
9,7
33
$7
7,9
22
$7
8,9
68
$6
5,7
24
$5
7,3
95
$5
7,7
16
$6
7,3
47
Con
trib
uti
on
s in
rel
atio
n t
o t
he
actu
aria
lly d
eter
min
ed c
on
trib
uti
on
26
,30
3
2
5,9
99
29
,14
7
6
9,7
33
77
,92
2
7
8,9
68
65
,72
4
5
7,3
95
57
,71
6
6
7,3
47
Con
trib
uti
on
def
icie
ncy
$-
$
-
$
-
$
-
$
-
$
-
$
-
$
-
$
-
$
-
-
-
-
-
-
-
-
-
-
-
Cover
ed-e
mp
loyee
pay
roll
$
11
8,0
52
$
11
8,0
52
$
11
8,0
52
$
11
8,0
52
$
12
9,0
74
$
12
9,0
74
$
13
3,3
79
$
13
4,2
89
$
14
1,8
08
$
14
4,6
46
Con
trib
uti
on
s as
a p
erce
nta
ge
of
cover
ed-e
mp
loyee
pay
roll
22
.28
%2
2.0
2%
24
.69
%5
9.0
7%
60
.37
%6
1.1
8%
49
.28
%4
2.7
4%
40
.70
%4
6.5
6%
No
tes:
A
ctu
ari
al
co
st m
eth
od
A
mo
rtiz
ati
on
meth
od
R
em
ain
ing
am
ort
iza
tio
n p
eri
od
A
sset
va
lua
tio
n m
eth
od
I
nfl
ati
on
S
ala
ry i
ncre
ase
s
I
nvest
men
t ra
te o
f re
turn
R
eti
rem
en
t a
ge
M
ort
ali
ty
For
the
Las
t T
en Y
ears
En
ded
Ju
ne
30
Sch
edu
le o
f C
ou
nty
Con
trib
uti
on
s to
Sta
te M
un
icip
al P
ool
Jud
ges
An
ne
Aru
nd
el C
ou
nty
Req
uir
ed S
up
ple
men
tary
In
form
atio
n
En
try A
ge N
orm
al.
2)
Meth
od
s a
nd
ass
um
pti
on
s u
sed
to
dete
rmin
e c
on
trib
uti
on
ra
tes:
RP
-20
14
Mo
rta
lity
Ta
ble
s w
ith
gen
era
tio
na
l m
ort
ali
ty p
roje
cti
on
s u
sin
g s
ca
le M
P-2
01
4,
ca
lib
rate
d t
o M
SR
PS
exp
eri
en
ce.
So
urc
e:
Co
mp
reh
en
sive A
nn
ua
l F
ina
ncia
l R
ep
ort
of
the M
ary
lan
d S
tate
Reti
rem
en
t a
nd
Pen
sio
n S
yst
em
fo
r th
e Y
ea
rs E
nd
ed
Ju
ne 3
0,
20
16
an
d 2
01
5.
1)
Th
e C
ou
nty
's a
nn
ua
l co
ntr
ibu
tio
n i
s d
ete
rmin
ed
by a
n a
ctu
ari
all
y c
alc
ula
tio
n o
f th
e C
ou
nty
's l
iab
ilit
y.
2.7
% g
en
era
l, 3
.2%
wa
ge.
3.3
% t
o 9
.2%
in
clu
din
g i
nfl
ati
on
.
7.5
5%
Exp
eri
en
ce-b
ase
d t
ab
le o
f ra
tes
tha
t a
re s
pecif
ic t
o t
he t
yp
e o
f eli
gib
ilit
y c
on
dit
ion
. L
ast
up
da
ted
fo
r 2
01
5 v
alu
ati
on
pu
rsu
an
t to
an
exp
eri
en
ce s
tud
y o
f th
e 2
01
0-2
01
4 p
eri
od
.
Level
perc
en
tag
e o
f p
ayro
ll,
clo
sed
.
24
yea
rs f
or
Sta
te S
yst
em
.
Fiv
e y
ea
r sm
oo
thed
ma
rket;
20
.0%
co
lla
r.
A-1
04
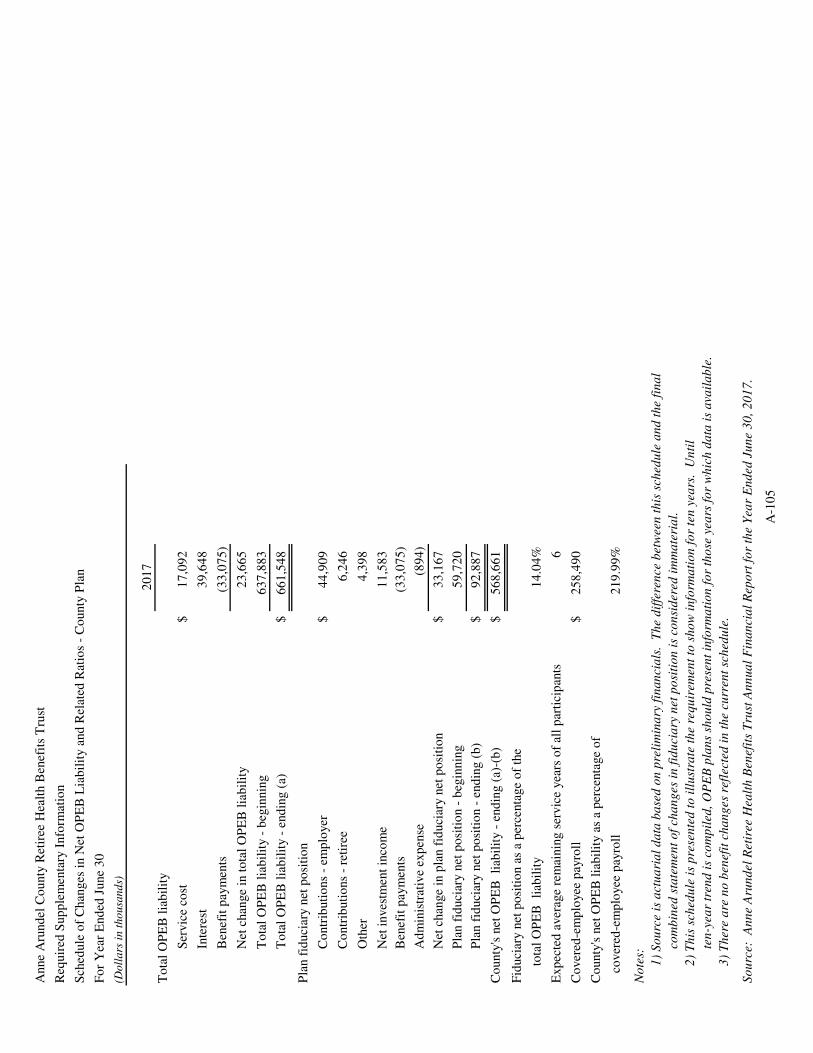
20
17
$1
7,0
92
39
,64
8
(3
3,0
75
)
23
,66
5
63
7,8
83
$6
61
,54
8
$4
4,9
09
6,2
46
4
,39
8
11
,58
3
(3
3,0
75
)
(89
4)
$3
3,1
67
59
,72
0
$9
2,8
87
$5
68
,66
1
14
.04
% 6
$2
58
,49
0
21
9.9
9%
So
urc
e:
An
ne
Aru
nd
el R
etir
ee H
ealt
h B
enef
its
Tru
st A
nn
ua
l F
ina
nci
al
Rep
ort
fo
r th
e Y
ear
En
ded
Ju
ne
30
, 2
01
7.
1)
So
urc
e is
act
ua
ria
l d
ata
ba
sed
on
pre
lim
ina
ry f
ina
nci
als
. T
he
dif
fere
nce
bet
wee
n t
his
sch
edu
le a
nd
th
e fi
na
l
com
bin
ed s
tate
men
t o
f ch
an
ges
in
fid
uci
ary
net
po
siti
on
is
con
sid
ered
im
ma
teri
al.
2)
Th
is s
ched
ule
is
pre
sen
ted
to
ill
ust
rate
th
e re
qu
irem
ent
to s
ho
w i
nfo
rma
tio
n f
or
ten
yea
rs.
Un
til
ten
-yea
r tr
end
is
com
pil
ed,
OP
EB
pla
ns
sho
uld
pre
sen
t in
form
ati
on
fo
r th
ose
yea
rs f
or
wh
ich
da
ta i
s a
vail
ab
le.
c
over
ed-e
mp
loyee
pay
roll
No
tes:
3)
Th
ere
are
no
ben
efit
ch
an
ges
ref
lect
ed i
n t
he
curr
ent
sch
edu
le.
Pla
n f
iduci
ary n
et p
osi
tio
n -
beg
innin
g
(Doll
ars
in t
housa
nds)
Anne
Aru
nd
el C
ounty
Ret
iree
Hea
lth B
enef
its
Tru
st
Req
uir
ed S
up
ple
men
tary
Info
rmat
ion
Sch
edule
of
Chan
ges
in N
et O
PE
B L
iab
ilit
y a
nd
Rel
ated
Rat
ios
- C
ounty
Pla
n
Fo
r Y
ear
End
ed J
une
30
To
tal
OP
EB
lia
bil
ity
Net
inves
tmen
t in
com
e
Ben
efit
pay
men
ts
Ad
min
istr
ativ
e ex
pen
se
Net
chan
ge
in p
lan f
iduci
ary n
et p
osi
tio
n
Pla
n f
iduci
ary n
et p
osi
tio
n
Co
unty
's n
et O
PE
B
liab
ilit
y -
end
ing (
a)-(
b)
Fid
uci
ary n
et p
osi
tio
n a
s a
per
centa
ge
of
the
Co
unty
's n
et O
PE
B l
iab
ilit
y a
s a
per
centa
ge
of
tota
l O
PE
B
liab
ilit
y
Exp
ecte
d a
ver
age
rem
ainin
g s
ervic
e yea
rs o
f al
l p
arti
cip
ants
Co
ver
ed-e
mp
loyee
pay
roll
To
tal
OP
EB
lia
bil
ity -
end
ing (
a)
Ser
vic
e co
st
Inte
rest
Ben
efit
pay
men
ts
Net
chan
ge
in t
ota
l O
PE
B l
iab
ilit
y
To
tal
OP
EB
lia
bil
ity -
beg
innin
g
Pla
n f
iduci
ary n
et p
osi
tio
n -
end
ing (
b)
Co
ntr
ibuti
ons
- em
plo
yer
Co
ntr
ibuti
ons
- re
tire
e
Oth
er
A-1
05
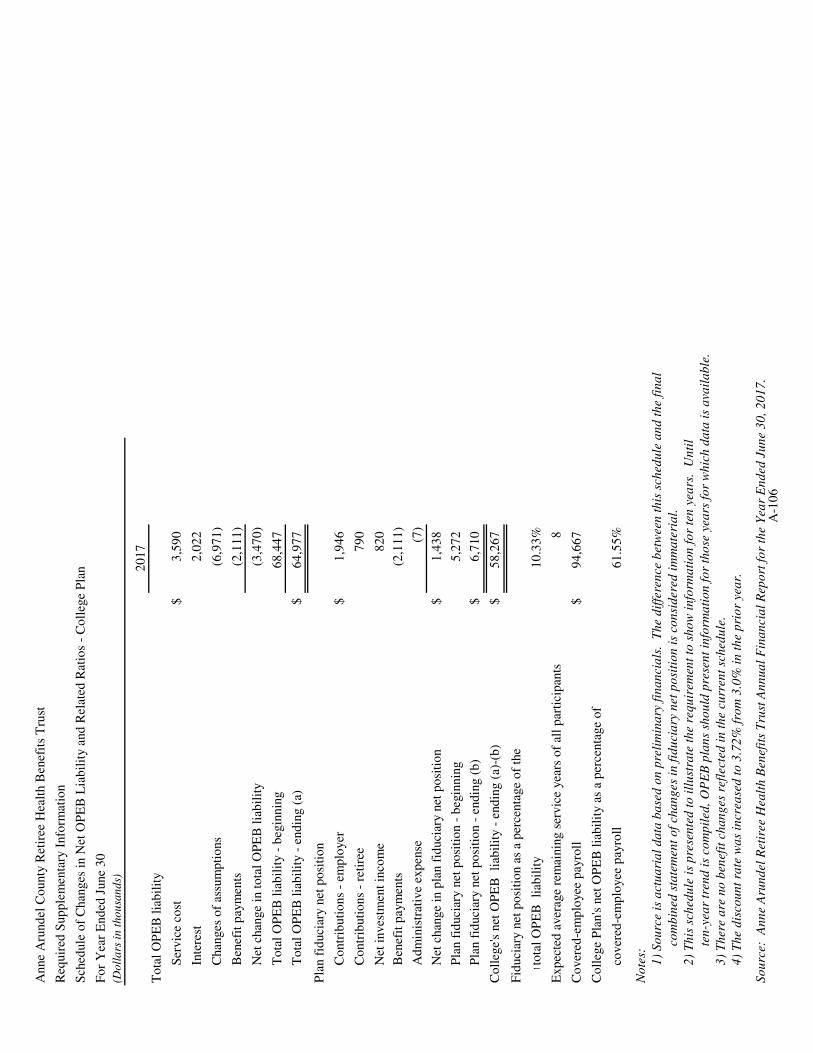
20
17
$3
,59
0
2,0
22
(6
,97
1)
(2
,11
1)
(3
,47
0)
68
,44
7
$6
4,9
77
$1
,94
6
79
0
82
0
(2,1
11
)
(7)
$1
,43
8
5,2
72
$6
,71
0
$5
8,2
67
tota
l O
PE
B
liab
ilit
y1
0.3
3% 8
$9
4,6
67
61
.55
%
So
urc
e:
An
ne
Aru
nd
el R
etir
ee H
ealt
h B
enef
its
Tru
st A
nn
ua
l F
ina
nci
al
Rep
ort
fo
r th
e Y
ear
En
ded
Ju
ne
30
, 2
01
7.
3)
Th
ere
are
no
ben
efit
ch
an
ges
ref
lect
ed i
n t
he
curr
ent
sch
edu
le.
4)
Th
e d
isco
un
t ra
te w
as
incr
ease
d t
o 3
.72
% f
rom
3.0
% i
n t
he
pri
or
yea
r.
To
tal
OP
EB
lia
bil
ity
Anne
Aru
nd
el C
ounty
Ret
iree
Hea
lth B
enef
its
Tru
st
Req
uir
ed S
up
ple
men
tary
Info
rmat
ion
Sch
edule
of
Chan
ges
in N
et O
PE
B L
iab
ilit
y a
nd
Rel
ated
Rat
ios
- C
oll
ege
Pla
n
Fo
r Y
ear
End
ed J
une
30
(Do
lla
rs i
n t
ho
usa
nd
s)
Ben
efit
pay
men
ts
Net
chan
ge
in t
ota
l O
PE
B l
iab
ilit
y
Co
lleg
e P
lan's
net
OP
EB
lia
bil
ity a
s a
per
centa
ge
of
cover
ed-e
mp
loyee
pay
roll
Co
ntr
ibuti
ons
- em
plo
yer
Co
ntr
ibuti
ons
- re
tire
e
Net
inves
tmen
t in
com
e
Pla
n f
iduci
ary n
et p
osi
tio
n -
end
ing (
b)
1)
So
urc
e is
act
ua
ria
l d
ata
ba
sed
on
pre
lim
ina
ry f
ina
nci
als
. T
he
dif
fere
nce
bet
wee
n t
his
sch
edu
le a
nd
th
e fi
na
l
Co
lleg
e's
net
OP
EB
li
abil
ity -
end
ing (
a)-(
b)
Fid
uci
ary n
et p
osi
tio
n a
s a
per
centa
ge
of
the
Ser
vic
e co
st
Inte
rest
Chan
ges
of
assu
mp
tio
ns
To
tal
OP
EB
lia
bil
ity -
beg
innin
g
To
tal
OP
EB
lia
bil
ity -
end
ing (
a)
Ben
efit
pay
men
ts
Ad
min
istr
ativ
e ex
pen
se
Net
chan
ge
in p
lan f
iduci
ary n
et p
osi
tio
n
Pla
n f
iduci
ary n
et p
osi
tio
n -
beg
innin
g
Pla
n f
iduci
ary n
et p
osi
tio
n
com
bin
ed s
tate
men
t o
f ch
an
ges
in
fid
uci
ary
net
po
siti
on
is
con
sid
ered
im
ma
teri
al.
2)
Th
is s
ched
ule
is
pre
sen
ted
to
ill
ust
rate
th
e re
qu
irem
ent
to s
ho
w i
nfo
rma
tio
n f
or
ten
yea
rs.
Un
til
ten
-yea
r tr
end
is
com
pil
ed,
OP
EB
pla
ns
sho
uld
pre
sen
t in
form
ati
on
fo
r th
ose
yea
rs f
or
wh
ich
da
ta i
s a
vail
ab
le.
tota
l O
PE
B
liab
ilit
y
No
tes:
Exp
ecte
d a
ver
age
rem
ainin
g s
ervic
e yea
rs o
f al
l p
arti
cip
ants
Co
ver
ed-e
mp
loyee
pay
roll
A-1
06
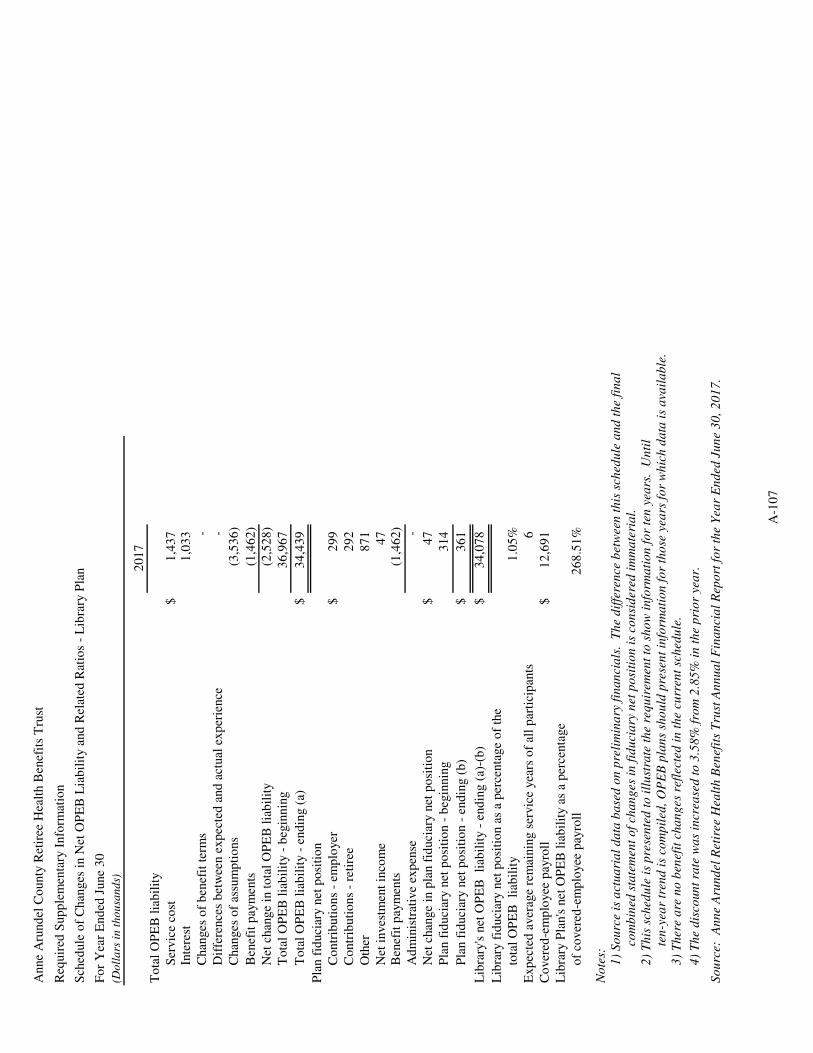
20
17
$1
,43
7
1,0
33
-
-
(3,5
36
)
(1,4
62
)
(2,5
28
)
36
,96
7
$3
4,4
39
$2
99
2
92
8
71
47
(1
,46
2)
-
$4
7
31
4
$3
61
$3
4,0
78
1.0
5% 6
$1
2,6
91
26
8.5
1%
No
tes:
So
urc
e:
An
ne
Aru
nd
el R
etir
ee H
ealt
h B
enef
its
Tru
st A
nn
ua
l F
ina
nci
al
Rep
ort
fo
r th
e Y
ear
En
ded
Ju
ne
30
, 2
01
7.
2)
Th
is s
ched
ule
is
pre
sen
ted
to
ill
ust
rate
th
e re
qu
irem
ent
to s
ho
w i
nfo
rma
tio
n f
or
ten
yea
rs.
Un
til
ten
-yea
r tr
end
is
com
pil
ed,
OP
EB
pla
ns
sho
uld
pre
sen
t in
form
ati
on
fo
r th
ose
yea
rs f
or
wh
ich
da
ta i
s a
vail
ab
le.
3)
Th
ere
are
no
ben
efit
ch
an
ges
ref
lect
ed i
n t
he
curr
ent
sch
edu
le.
4)
Th
e d
isco
un
t ra
te w
as
incr
ease
d t
o 3
.58
% f
rom
2.8
5%
in
th
e p
rio
r ye
ar.
To
tal
OP
EB
lia
bil
ity
Ser
vic
e co
stIn
tere
st
Chan
ges
of
ben
efit
ter
ms
Dif
fere
nce
s b
etw
een e
xp
ecte
d a
nd
act
ual
exp
erie
nce
Chan
ges
of
assu
mp
tio
ns
Pla
n f
iduci
ary n
et p
osi
tio
n -
beg
innin
g
Pla
n f
iduci
ary n
et p
osi
tio
n -
end
ing (
b)
Lib
rary
's n
et O
PE
B
liab
ilit
y -
end
ing (
a)-(
b)
Lib
rary
fid
uci
ary n
et p
osi
tio
n a
s a
per
centa
ge
of
the
Exp
ecte
d a
ver
age
rem
ainin
g s
ervic
e yea
rs o
f al
l p
arti
cip
ants
com
bin
ed s
tate
men
t o
f ch
an
ges
in
fid
uci
ary
net
po
siti
on
is
con
sid
ered
im
ma
teri
al.
Anne
Aru
nd
el C
ounty
Ret
iree
Hea
lth B
enef
its
Tru
st
Req
uir
ed S
up
ple
men
tary
Info
rmat
ion
Sch
edule
of
Chan
ges
in N
et O
PE
B L
iab
ilit
y a
nd
Rel
ated
Rat
ios
- L
ibra
ry P
lan
Fo
r Y
ear
End
ed J
une
30
(Do
lla
rs i
n t
ho
usa
nd
s)
Net
chan
ge
in p
lan f
iduci
ary n
et p
osi
tio
n
Ben
efit
pay
men
ts
Net
chan
ge
in t
ota
l O
PE
B l
iab
ilit
y
To
tal
OP
EB
lia
bil
ity -
beg
innin
g
To
tal
OP
EB
lia
bil
ity -
end
ing (
a)
Pla
n f
iduci
ary n
et p
osi
tio
n
Co
ntr
ibuti
ons
- em
plo
yer
Co
ntr
ibuti
ons
- re
tire
e
Oth
er
Net
inves
tmen
t in
com
eB
enef
it p
aym
ents
Ad
min
istr
ativ
e ex
pen
se
tota
l O
PE
B
liab
ilit
y
Co
ver
ed-e
mp
loyee
pay
roll
Lib
rary
Pla
n's
net
OP
EB
lia
bil
ity a
s a
per
centa
ge
of
cover
ed-e
mp
loyee
pay
roll
1)
So
urc
e is
act
ua
ria
l d
ata
ba
sed
on
pre
lim
ina
ry f
ina
nci
als
. T
he
dif
fere
nce
bet
wee
n t
his
sch
edu
le a
nd
th
e fi
na
l
A-1
07
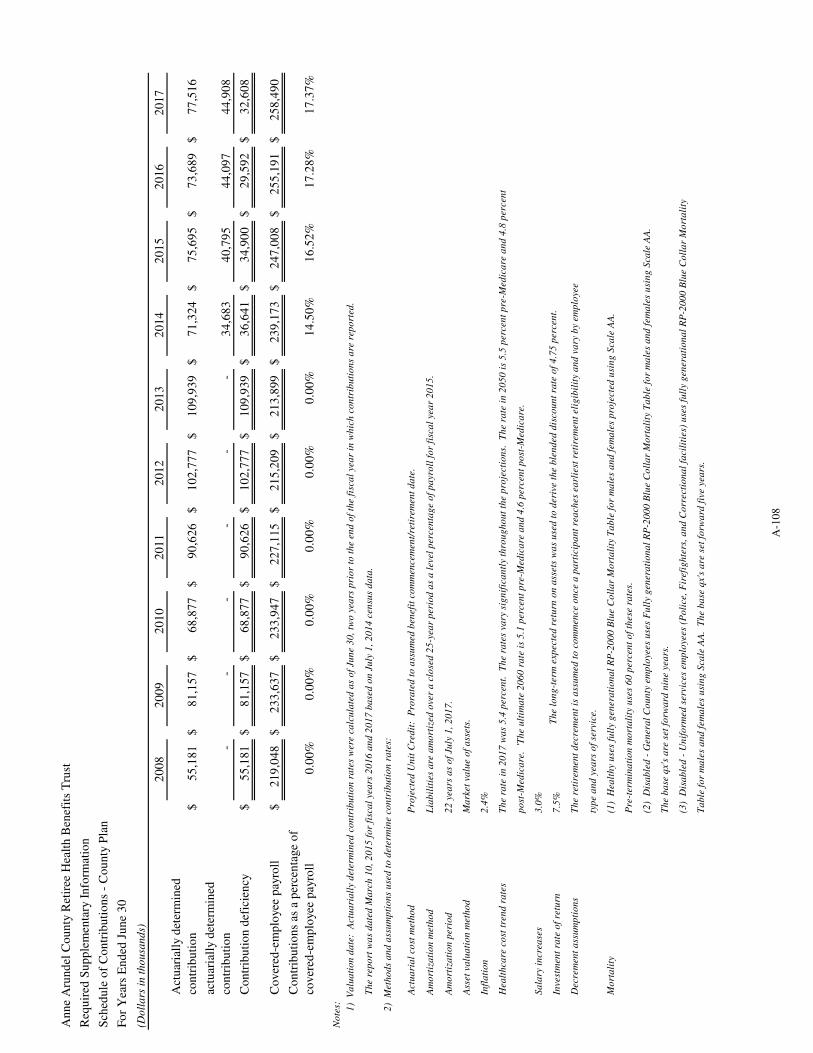
20
08
20
09
20
10
20
11
20
12
20
13
20
14
20
15
20
16
20
17
Act
uar
iall
y d
eter
min
ed
con
trib
uti
on
$5
5,1
81
$
81
,15
7
$6
8,8
77
$
90
,62
6
$1
02
,77
7
$
10
9,9
39
$7
1,3
24
$
75
,69
5
$7
3,6
89
$
77
,51
6
Co
ntr
ibu
tio
ns
in r
elat
ion
to
th
e
actu
aria
lly
det
erm
ined
con
trib
uti
on
-
-
-
-
-
-
34
,68
3
40
,79
5
44
,09
7
44
,90
8
Co
ntr
ibu
tio
n d
efic
ien
cy$
55
,18
1
$8
1,1
57
$
68
,87
7
$9
0,6
26
$
10
2,7
77
$1
09
,93
9
$
36
,64
1
$3
4,9
00
$
29
,59
2
$3
2,6
08
Co
ver
ed-e
mp
loye
e p
ayro
ll$
21
9,0
48
$2
33
,63
7
$
23
3,9
47
$2
27
,11
5
$
21
5,2
09
$2
13
,89
9
$
23
9,1
73
$2
47
,00
8
$
25
5,1
91
$2
58
,49
0
Co
ntr
ibu
tio
ns
as a
per
cen
tage
of
cover
ed-e
mp
loye
e p
ayro
ll0
.00
%0
.00
%0
.00
%0
.00
%0
.00
%0
.00
%1
4.5
0%
16
.52
%1
7.2
8%
17
.37
%
Act
ua
ria
l co
st m
eth
od
Am
ort
iza
tio
n m
eth
od
Am
ort
iza
tio
n p
erio
d
Ass
et v
alu
ati
on
met
ho
d
Infl
ati
on
Hea
lth
care
co
st t
ren
d r
ate
s
Sa
lary
in
crea
ses
Inve
stm
ent
rate
of
retu
rn
Dec
rem
ent
ass
um
pti
on
s
Mo
rta
lity
Th
e re
po
rt w
as
da
ted
Ma
rch
10
, 2
01
5 f
or
fisc
al
yea
rs 2
01
6 a
nd
20
17
ba
sed
on
Ju
ly 1
, 2
01
4 c
ensu
s d
ata
.
1)
Va
lua
tio
n d
ate
: A
ctu
ari
all
y d
eter
min
ed c
on
trib
uti
on
ra
tes
wer
e ca
lcu
late
d a
s o
f Ju
ne
30
, tw
o y
ears
pri
or
to t
he
end
of
the
fisc
al
yea
r in
wh
ich
co
ntr
ibu
tio
ns
are
rep
ort
ed.
2)
Met
ho
ds
an
d a
ssu
mp
tio
ns
use
d t
o d
eter
min
e co
ntr
ibu
tio
n r
ate
s:
No
tes:
An
ne
Aru
nd
el C
ou
nty
Ret
iree
Hea
lth
Ben
efit
s T
rust
(Do
lla
rs i
n t
ho
usa
nd
s)
Req
uir
ed S
up
ple
men
tary
In
form
atio
n
Sch
edu
le o
f C
on
trib
uti
on
s -
Co
un
ty P
lan
Fo
r Y
ears
En
ded
Ju
ne
30
3.0
%
Pro
ject
ed U
nit
Cre
dit
: P
rora
ted
to
ass
um
ed b
enef
it c
om
men
cem
ent/
reti
rem
ent
da
te.
Lia
bil
itie
s a
re a
mo
rtiz
ed o
ver
a c
lose
d 2
5-y
ear
per
iod
as
a l
evel
per
cen
tag
e o
f p
ayr
oll
fo
r fi
sca
l ye
ar
20
15
.
22
yea
rs a
s o
f Ju
ly 1
, 2
01
7.
Ma
rket
va
lue
of
ass
ets.
2.4
%
Th
e ra
te i
n 2
01
7 w
as
5.4
per
cen
t.
Th
e ra
tes
vary
sig
nif
ica
ntl
y th
rou
gh
ou
t th
e p
roje
ctio
ns.
T
he
rate
in
20
50
is
5.5
per
cen
t p
re-M
edic
are
an
d 4
.8 p
erce
nt
po
st-M
edic
are
. 'T
he
ult
ima
te 2
06
0 r
ate
is
5.1
per
cen
t p
re-M
edic
are
an
d 4
.6 p
erce
nt
po
st-M
edic
are
.
(2)
Dis
ab
led
- G
ener
al
Co
un
ty e
mp
loye
es u
ses
Fu
lly
gen
era
tio
na
l R
P-2
00
0 B
lue
Co
lla
r M
ort
ali
ty T
ab
le f
or
ma
les
an
d f
ema
les
usi
ng
Sca
le A
A.
Th
e b
ase
qx'
s a
re s
et f
orw
ard
nin
e ye
ars
.
(3)
Dis
ab
led
- U
nif
orm
ed s
ervi
ces
emp
loye
es (
Po
lice
, F
iref
igh
ters
, a
nd
Co
rrec
tio
na
l fa
cili
ties
) u
ses
full
y g
ener
ati
on
al
RP
-20
00
Blu
e C
oll
ar
Mo
rta
lity
Ta
ble
fo
r m
ale
s a
nd
fem
ale
s u
sin
g S
cale
AA
. T
he
ba
se q
x's
are
set
fo
rwa
rd f
ive
yea
rs.
7.5
%T
he
lon
g-t
erm
exp
ecte
d r
etu
rn o
n a
sset
s w
as
use
d t
o d
eriv
e th
e b
len
ded
dis
cou
nt
rate
of
4.7
5 p
erce
nt.
Th
e re
tire
men
t d
ecre
men
t is
ass
um
ed t
o c
om
men
ce o
nce
a p
art
icip
an
t re
ach
es e
arl
iest
ret
irem
ent
elig
ibil
ity
an
d v
ary
by
emp
loye
e
typ
e a
nd
yea
rs o
f se
rvic
e.
(1)
Hea
lth
y u
ses
full
y g
ener
ati
on
al
RP
-20
00
Blu
e C
oll
ar
Mo
rta
lity
Ta
ble
fo
r m
ale
s a
nd
fem
ale
s p
roje
cted
usi
ng
Sca
le A
A.
Pre
-ter
min
ati
on
mo
rta
lity
use
s 6
0 p
erce
nt
of
thes
e ra
tes.
A-1
08
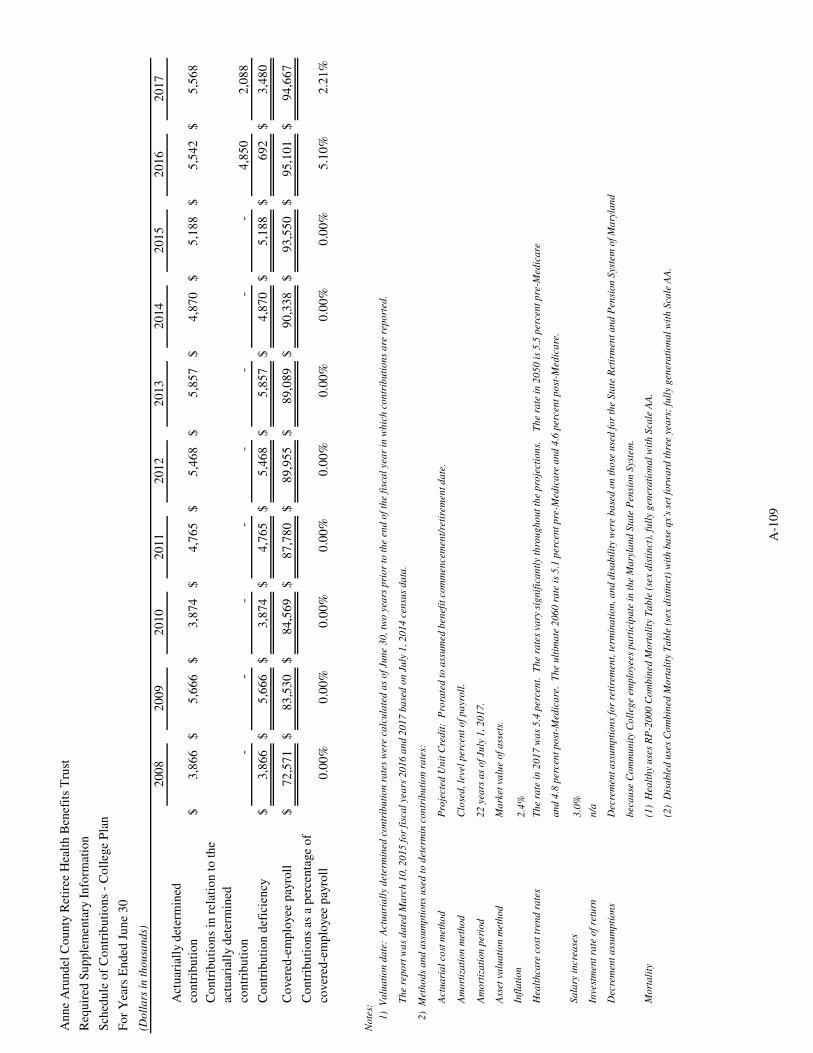
20
08
20
09
20
10
20
11
20
12
20
13
20
14
20
15
20
16
20
17
Act
uar
iall
y d
eter
min
ed
con
trib
uti
on
$3
,86
6
$5
,66
6
$3
,87
4
$4
,76
5
$5
,46
8
$5
,85
7
$4
,87
0
$5
,18
8
$5
,54
2
$5
,56
8
Co
ntr
ibu
tio
ns
in r
elat
ion
to
th
e
actu
aria
lly
det
erm
ined
con
trib
uti
on
-
-
-
-
-
-
-
-
4,8
50
2,0
88
Co
ntr
ibu
tio
n d
efic
ien
cy$
3,8
66
$5
,66
6
$3
,87
4
$4
,76
5
$5
,46
8
$5
,85
7
$4
,87
0
$5
,18
8
$6
92
$3
,48
0
Co
ver
ed-e
mp
loye
e p
ayro
ll$
72
,57
1
$8
3,5
30
$8
4,5
69
$8
7,7
80
$8
9,9
55
$8
9,0
89
$9
0,3
38
$9
3,5
50
$9
5,1
01
$9
4,6
67
Co
ntr
ibu
tio
ns
as a
per
cen
tage
of
cover
ed-e
mp
loye
e p
ayro
ll0
.00
%0
.00
%0
.00
%0
.00
%0
.00
%0
.00
%0
.00
%0
.00
%5
.10
%2
.21
%
1)
Va
lua
tio
n d
ate
: A
ctu
ari
all
y d
ete
rmin
ed
co
ntr
ibu
tio
n r
ate
s w
ere
ca
lcu
late
d a
s o
f Ju
ne 3
0, tw
o y
ea
rs p
rio
r to
th
e e
nd
of
the f
isca
l yea
r in
wh
ich
co
ntr
ibu
tio
ns
are
rep
ort
ed
.
2)
Meth
od
s a
nd
ass
um
pti
on
s u
sed
to
dete
rmin
co
ntr
ibu
tio
n r
ate
s:
Actu
ari
al
co
st m
eth
od
Am
ort
iza
tio
n m
eth
od
Am
ort
iza
tio
n p
eri
od
Ass
et
va
lua
tio
n m
eth
od
Infl
ati
on
Hea
lth
ca
re c
ost
tre
nd
ra
tes
Sa
lary
in
cre
ase
s
Invest
men
t ra
te o
f re
turn
Decre
men
t a
ssu
mp
tio
ns
Mo
rta
lity
An
ne
Aru
nd
el C
ou
nty
Ret
iree
Hea
lth
Ben
efit
s T
rust
Req
uir
ed S
up
ple
men
tary
In
form
atio
n
Sch
edu
le o
f C
on
trib
uti
on
s -
Co
lleg
e P
lan
Fo
r Y
ears
En
ded
Ju
ne
30
(2)
Dis
ab
led
use
s C
om
bin
ed
Mo
rta
lity
Ta
ble
(se
x d
isti
nct)
wit
h b
ase
qx's
set
forw
ard
th
ree y
ea
rs;
full
y g
en
era
tio
na
l w
ith
Sca
le A
A.
Th
e r
ep
ort
wa
s d
ate
d M
arc
h 1
0, 2
01
5 f
or
fisc
al
yea
rs 2
01
6 a
nd
20
17
ba
sed
on
Ju
ly 1
, 2
01
4 c
en
sus
da
ta.
(Do
lla
rs i
n t
ho
usa
nd
s)
an
d 4
.8 p
erc
en
t p
ost
-Med
ica
re. T
he u
ltim
ate
20
60
ra
te i
s 5
.1 p
erc
en
t p
re-M
ed
ica
re a
nd
4.6
perc
en
t p
ost
-Med
ica
re.
3.0
%
n/a
Decre
men
t a
ssu
mp
tio
ns
for
reti
rem
en
t, t
erm
ina
tio
n, a
nd
dis
ab
ilit
y w
ere
ba
sed
on
th
ose
use
d f
or
the S
tate
Reti
rmen
t a
nd
Pen
sio
n S
yst
em
of
Ma
ryla
nd
beca
use
Co
mm
un
ity C
oll
eg
e e
mp
loyees
pa
rtic
ipa
te i
n t
he M
ary
lan
d S
tate
Pen
sio
n S
yst
em
.
(1)
Hea
lth
y u
ses
RP
-20
00
Co
mb
ined
Mo
rta
lity
Ta
ble
(se
x d
isti
nct)
, fu
lly g
en
era
tio
na
l w
ith
Sca
le A
A.
No
tes:
Th
e r
ate
in
20
17
wa
s 5
.4 p
erc
en
t. T
he r
ate
s va
ry s
ign
ific
an
tly t
hro
ug
ho
ut
the p
roje
cti
on
s. T
he r
ate
in
20
50
is
5.5
perc
en
t p
re-M
ed
ica
re
Pro
jecte
d U
nit
Cre
dit
: P
rora
ted
to
ass
um
ed
ben
efi
t co
mm
en
cem
en
t/re
tire
men
t d
ate
.
Clo
sed
, le
vel
perc
en
t o
f p
ayro
ll.
22
yea
rs a
s o
f Ju
ly 1
, 2
01
7.
Ma
rket
va
lue o
f a
ssets
.
2.4
%
A-1
09
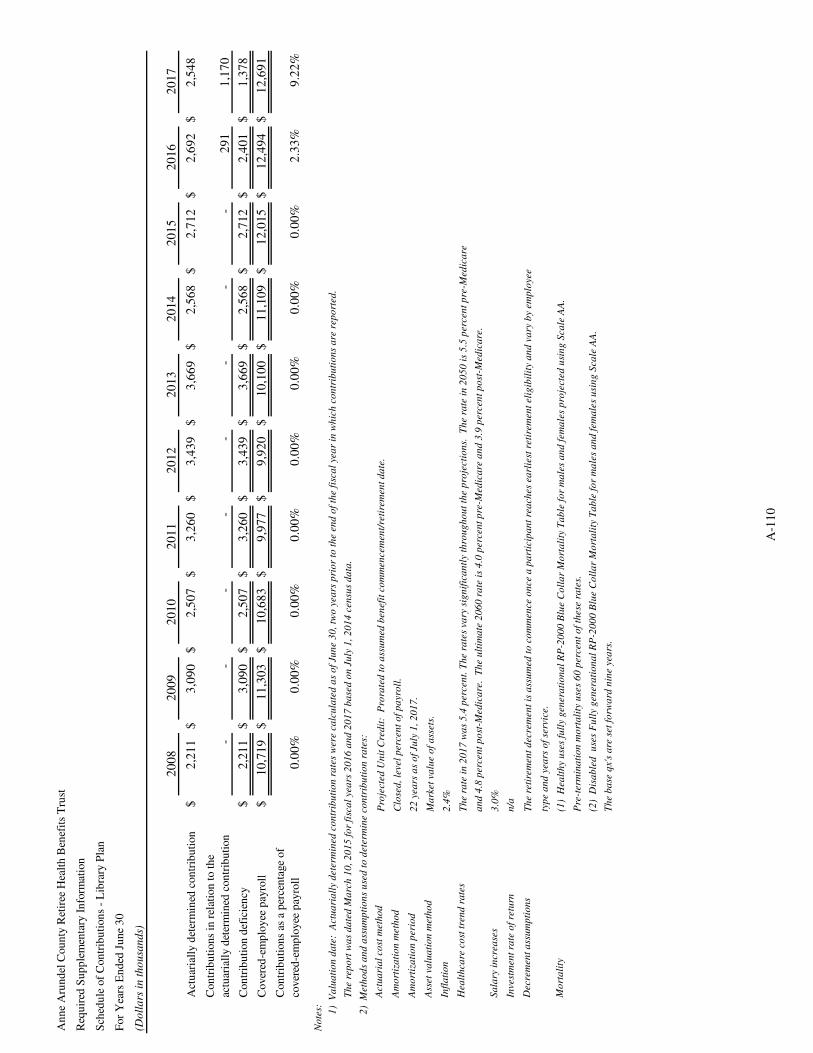
20
08
20
09
20
10
20
11
20
12
20
13
20
14
20
15
20
16
20
17
Act
uar
iall
y d
eter
min
ed c
on
trib
uti
on
$2
,21
1
$3
,09
0
$2
,50
7
$3
,26
0
$3
,43
9
$3
,66
9
$2
,56
8
$2
,71
2
$2
,69
2
$2
,54
8
Con
trib
uti
on
s in
rel
atio
n t
o t
he
actu
aria
lly d
eter
min
ed c
on
trib
uti
on
-
-
-
-
-
-
-
-
29
1
1,1
70
Con
trib
uti
on
def
icie
ncy
$2
,21
1
$3
,09
0
$2
,50
7
$3
,26
0
$3
,43
9
$3
,66
9
$2
,56
8
$2
,71
2
$2
,40
1
$1
,37
8
Cover
ed-e
mp
loyee
pay
roll
$1
0,7
19
$1
1,3
03
$1
0,6
83
$9
,97
7
$9
,92
0
$1
0,1
00
$1
1,1
09
$1
2,0
15
$1
2,4
94
$1
2,6
91
Con
trib
uti
on
s as
a p
erce
nta
ge
of
cover
ed-e
mp
loyee
pay
roll
0.0
0%
0.0
0%
0.0
0%
0.0
0%
0.0
0%
0.0
0%
0.0
0%
0.0
0%
2.3
3%
9.2
2%
1)
Va
lua
tio
n d
ate
: A
ctu
ari
all
y d
ete
rmin
ed
co
ntr
ibu
tio
n r
ate
s w
ere
ca
lcu
late
d a
s o
f Ju
ne 3
0, tw
o y
ea
rs p
rio
r to
th
e e
nd
of
the f
isca
l yea
r in
wh
ich
co
ntr
ibu
tio
ns
are
rep
ort
ed
.
2)
Meth
od
s a
nd
ass
um
pti
on
s u
sed
to
dete
rmin
e c
on
trib
uti
on
ra
tes:
Actu
ari
al
co
st m
eth
od
Am
ort
iza
tio
n m
eth
od
Am
ort
iza
tio
n p
eri
od
Ass
et
va
lua
tio
n m
eth
od
Infl
ati
on
Hea
lth
ca
re c
ost
tre
nd
ra
tes
Sa
lary
in
cre
ase
s
Invest
men
t ra
te o
f re
turn
Decre
men
t a
ssu
mp
tio
ns
Mo
rta
lity
22
yea
rs a
s o
f Ju
ly 1
, 2
01
7.
An
ne
Aru
nd
el C
ou
nty
Ret
iree
Hea
lth
Ben
efit
s T
rust
Req
uir
ed S
up
ple
men
tary
In
form
atio
n
Sch
edu
le o
f C
on
trib
uti
on
s -
Lib
rary
Pla
n
For
Yea
rs E
nd
ed J
un
e 3
0
(Do
lla
rs i
n t
ho
usa
nd
s)
Th
e r
ep
ort
wa
s d
ate
d M
arc
h 1
0, 2
01
5 f
or
fisc
al
yea
rs 2
01
6 a
nd
20
17
ba
sed
on
Ju
ly 1
, 2
01
4 c
en
sus
da
ta.
Pro
jecte
d U
nit
Cre
dit
: P
rora
ted
to
ass
um
ed
ben
efi
t co
mm
en
cem
en
t/re
tire
men
t d
ate
.
Clo
sed
, le
vel
perc
en
t o
f p
ayro
ll.
No
tes:
Th
e b
ase
qx's
are
set
forw
ard
nin
e y
ea
rs.
Ma
rket
va
lue o
f a
ssets
.
2.4
%
Th
e r
ate
in
20
17
wa
s 5
.4 p
erc
en
t. T
he r
ate
s va
ry s
ign
ific
an
tly t
hro
ug
ho
ut
the p
roje
cti
on
s. T
he r
ate
in
20
50
is
5.5
perc
en
t p
re-M
ed
ica
re
an
d 4
.8 p
erc
en
t p
ost
-Med
ica
re. T
he u
ltim
ate
20
60
ra
te i
s 4
.0 p
erc
en
t p
re-M
ed
ica
re a
nd
3.9
perc
en
t p
ost
-Med
ica
re.
3.0
%
n/a
Th
e r
eti
rem
en
t d
ecre
men
t is
ass
um
ed
to
co
mm
en
ce o
nce a
pa
rtic
ipa
nt
rea
ch
es
ea
rlie
st r
eti
rem
en
t eli
gib
ilit
y a
nd
va
ry b
y e
mp
loyee
typ
e a
nd
yea
rs o
f se
rvic
e.
(1)
Hea
lth
y u
ses
full
y g
en
era
tio
na
l R
P-2
00
0 B
lue C
oll
ar
Mo
rta
lity
Ta
ble
fo
r m
ale
s a
nd
fem
ale
s p
roje
cte
d u
sin
g S
ca
le A
A.
Pre
-term
ina
tio
n m
ort
ali
ty u
ses
60
perc
en
t o
f th
ese
ra
tes.
(2)
Dis
ab
led
u
ses
Fu
lly g
en
era
tio
na
l R
P-2
00
0 B
lue C
oll
ar
Mo
rta
lity
Ta
ble
fo
r m
ale
s a
nd
fem
ale
s u
sin
g S
ca
le A
A.
A-1
10
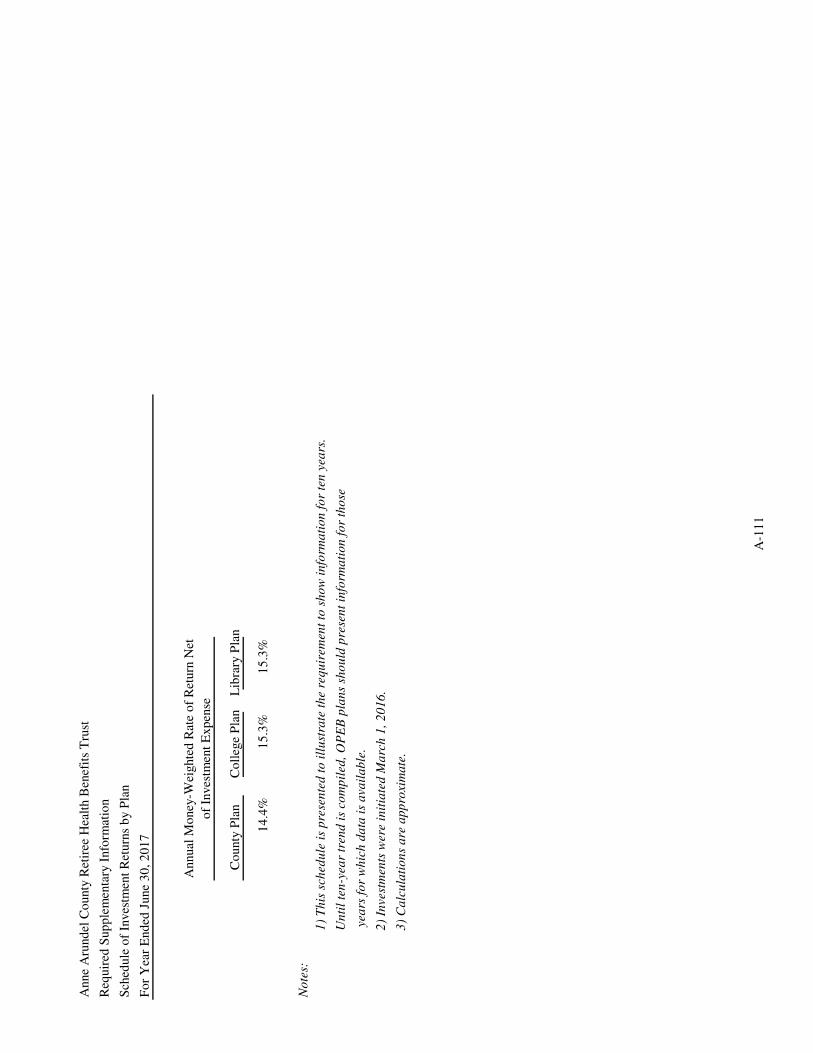
Co
unty
Pla
nC
oll
ege
Pla
nL
ibra
ry P
lan
14
.4%
15
.3%
15
.3%
1)
Th
is s
ched
ule
is
pre
sen
ted
to
ill
ust
rate
th
e re
qu
irem
ent
to s
ho
w i
nfo
rma
tio
n f
or
ten
yea
rs.
Un
til
ten
-yea
r tr
end
is
com
pil
ed,
OP
EB
pla
ns
sho
uld
pre
sen
t in
form
ati
on
fo
r th
ose
yea
rs f
or
wh
ich
da
ta i
s a
vail
ab
le.
2)
Inve
stm
ents
wer
e in
itia
ted
Ma
rch
1,
20
16
.
3)
Ca
lcu
lati
on
s a
re a
pp
roxi
ma
te.
Annual
Mo
ney
-Wei
ghte
d R
ate
of
Ret
urn
Net
of
Inves
tmen
t E
xp
ense
Anne
Aru
nd
el C
ounty
Ret
iree
Hea
lth B
enef
its
Tru
st
Req
uir
ed S
up
ple
men
tary
Info
rmat
ion
Sch
edule
of
Inves
tmen
t R
eturn
s b
y P
lan
Fo
r Y
ear
End
ed J
une
30
, 2
01
7
No
tes:
A-1
11
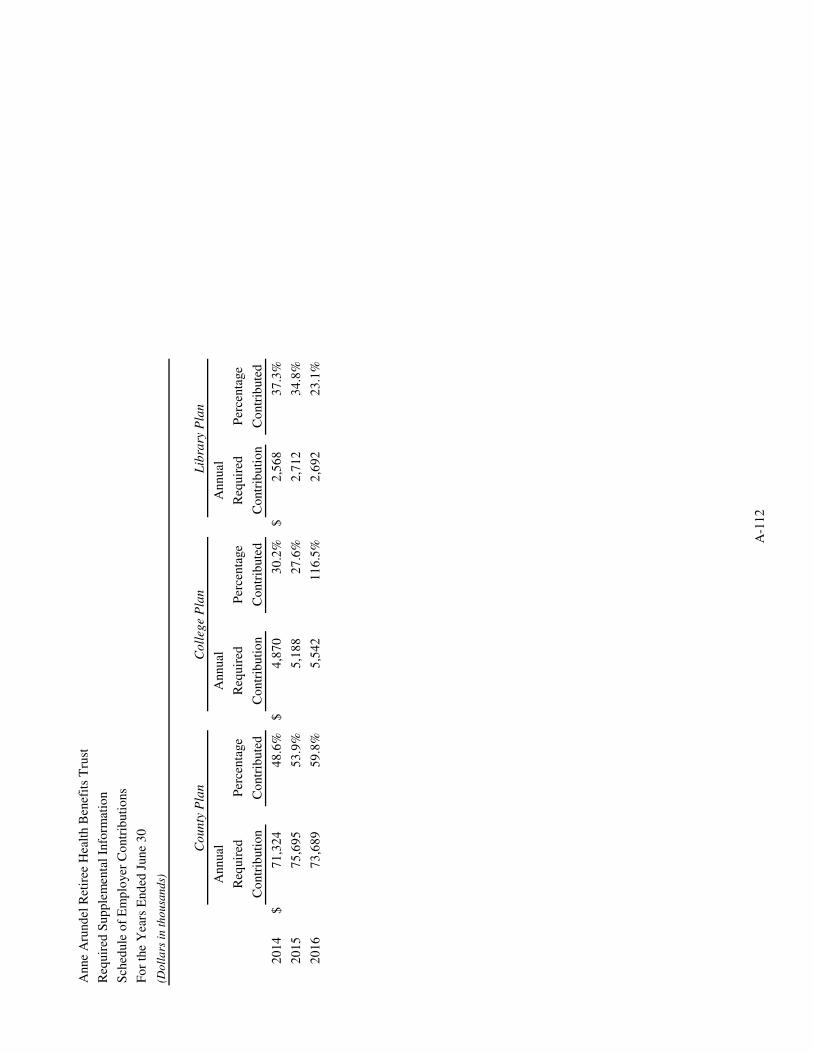
Fo
r th
e Y
ears
End
ed J
une
30
Annual
Annual
Annual
Req
uir
edP
erce
nta
ge
Req
uir
edP
erce
nta
ge
Req
uir
edP
erce
nta
ge
Co
ntr
ibuti
on
Co
ntr
ibute
dC
ontr
ibuti
on
Co
ntr
ibute
dC
ontr
ibuti
on
Co
ntr
ibute
d
20
14
$7
1,3
24
48
.6%
$4
,87
03
0.2
%$
2,5
68
37
.3%
20
15
75
,69
55
3.9
%5
,18
82
7.6
%2
,71
23
4.8
%
20
16
73
,68
95
9.8
%5
,54
21
16
.5%
2,6
92
23
.1%
Anne
Aru
nd
el R
etir
ee H
ealt
h B
enef
its
Tru
st
Req
uir
ed S
up
ple
men
tal
Info
rmat
ion
Sch
edule
of
Em
plo
yer
Co
ntr
ibuti
ons
(Do
lla
rs i
n t
ho
usa
nd
s)
Co
un
ty P
lan
Co
lleg
e P
lan
Lib
rary
Pla
n
A-1
12
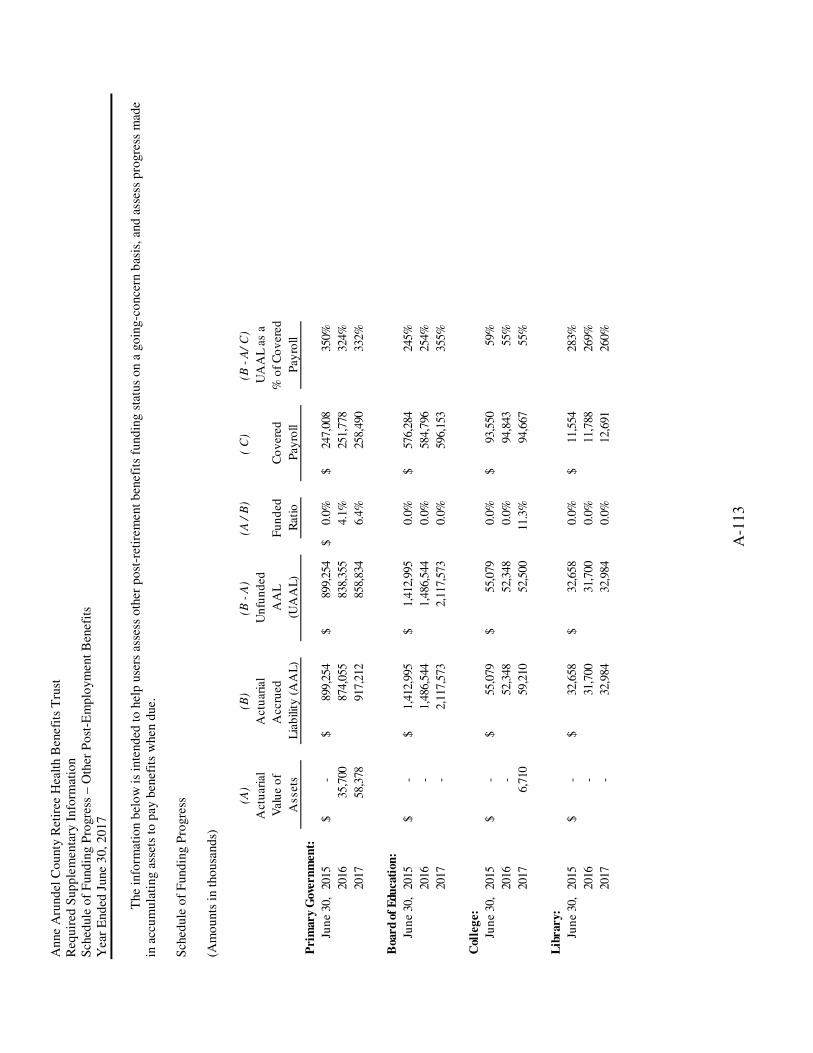
An
ne
Aru
nd
el C
ou
nty
Ret
iree
Hea
lth B
enef
its
Tru
st
Req
uir
ed S
up
ple
men
tary
In
form
atio
n
Sch
edule
of
Fund
ing P
rogre
ss –
Oth
er P
ost
-Em
plo
ym
ent
Ben
efit
s Y
ear
End
ed J
une
30
, 20
17
A-1
13
The
info
rmat
ion b
elo
w i
s in
tend
ed t
o h
elp
use
rs a
sses
s o
ther
po
st-r
etir
emen
t b
enef
its
fund
ing s
tatu
s o
n a
go
ing-c
once
rn b
asis
, an
d a
sses
s p
rogre
ss m
ade
in a
ccu
mu
lati
ng a
sset
s to
pay
ben
efit
s w
hen
due.
S
ched
ule
of
Fund
ing P
rogre
ss
(Am
ou
nts
in t
ho
usa
nd
s)
(A)
(B)
(B -
A)
(A /
B)
( C
)(B
- A
/ C
)
Act
uar
ial
Act
uar
ial
Un
fun
ded
UA
AL
as
a
Val
ue
of
Acc
rued
A
AL
Fu
nd
edC
ov
ered
% o
f C
ov
ered
Ass
ets
Lia
bili
ty (
AA
L)
(UA
AL
)R
atio
Pay
roll
Pay
roll
Pri
mary
Gove
rn
men
t:
Jun
e 30
,20
15-
$
89
9,25
4$
899,
254
$
$
0.0%
247,
008
$
350%
2016
35,7
00
874,
055
83
8,35
5
4.1%
251,
778
324%
2017
58,3
78
917,
212
85
8,83
4
6.4%
258,
490
332%
Boa
rd o
f E
du
cati
on
:
Jun
e 30
,20
15-
$
1,
412,
995
$
1,41
2,99
5$
0.
0%57
6,28
4$
24
5%
2016
-
1,48
6,54
4
1,
486,
544
0.0%
584,
796
254%
2017
-
2,11
7,57
3
2,
117,
573
0.0%
596,
153
355%
Col
leg
e:
Jun
e 30
,20
15-
$
55
,079
$
55
,079
$
0.
0%93
,550
$
59%
2016
-
52,3
48
52,3
48
0.0%
94,8
43
55
%
2017
6,71
0
59
,210
52
,500
11
.3%
94,6
67
55
%
Lib
rary:
Jun
e 30
,20
15-
$
32
,658
$
32
,658
$
0.
0%11
,554
$
283%
2016
-
31,7
00
31,7
00
0.0%
11,7
88
26
9%
2017
-
32,9
84
32,9
84
0.0%
12,6
91
26
0%
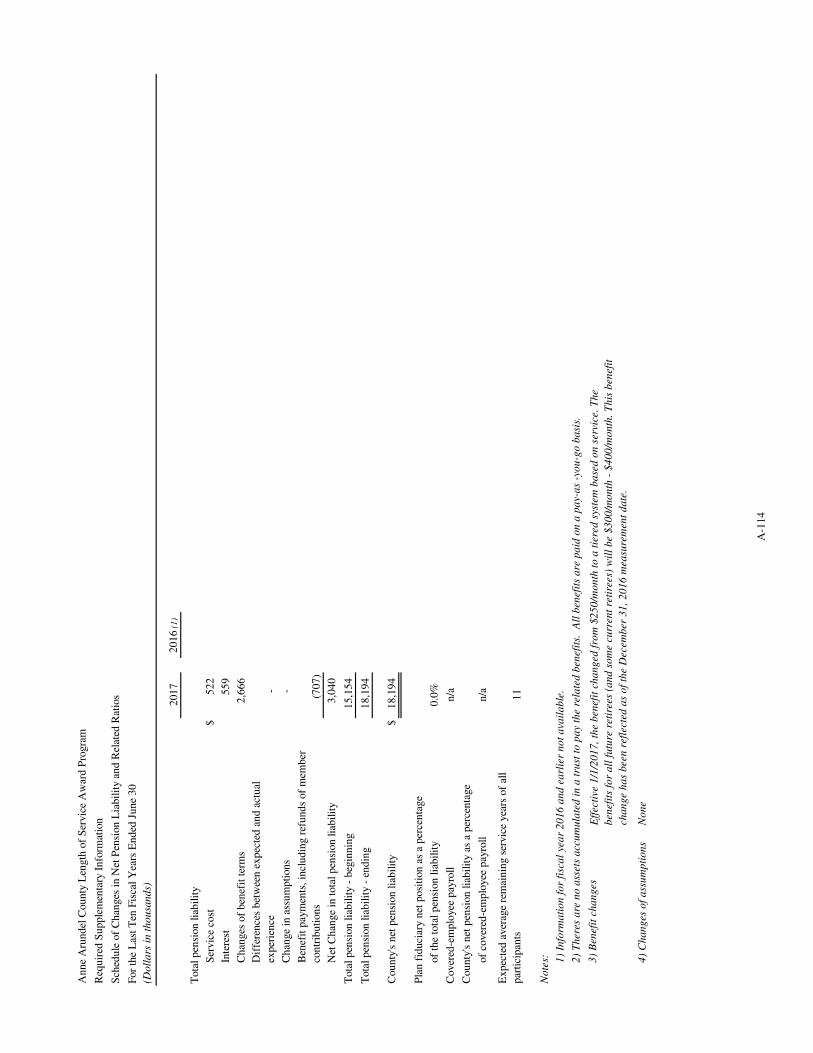
20
17
20
16
(1
)
$5
22
5
59
2,6
66
-
-
(70
7)
3,0
40
15
,15
4 1
8,1
94
$1
8,1
94
0.0
%
n/a
n/a 11
3)
Ben
efit
ch
an
ges
4)
Ch
an
ges
of
ass
um
pti
on
s N
on
e
Eff
ecti
ve 1
/1/2
01
7,
the
ben
efit
ch
an
ged
fro
m $
25
0/m
on
th t
o a
tie
red
sys
tem
ba
sed
on
ser
vice
. T
he
ben
efit
s fo
r a
ll f
utu
re r
etir
ees
(an
d s
om
e cu
rren
t re
tire
es)
wil
l b
e $
30
0/m
on
th -
$4
00
/mo
nth
. T
his
ben
efit
cha
ng
e h
as
bee
n r
efle
cted
as
of
the
Dec
emb
er 3
1,
20
16
mea
sure
men
t d
ate
.
Tota
l p
ensi
on
lia
bil
ity
Tota
l p
ensi
on
lia
bil
ity
- b
egin
nin
g
Tota
l p
ensi
on
lia
bil
ity
- en
din
g
Cou
nty
's n
et p
ensi
on
lia
bil
ity
Pla
n f
idu
ciar
y n
et p
osi
tion
as
a p
erce
nta
ge
Cover
ed-e
mp
loye
e p
ayro
ll
Dif
fere
nce
s b
etw
een
ex
pec
ted
an
d a
ctu
al
exp
erie
nce
Net
Ch
ange
in t
ota
l p
ensi
on
lia
bil
ity
of
the
tota
l p
ensi
on
lia
bil
ity
Ser
vic
e co
st
Inte
rest
Ch
anges
of
ben
efit
ter
ms
An
ne
Aru
nd
el C
ou
nty
Len
gth
of
Ser
vic
e A
war
d P
rogra
m
Req
uir
ed S
up
ple
men
tary
In
form
atio
n
Sch
edu
le o
f C
han
ges
in
Net
Pen
sion
Lia
bil
ity
and
Rel
ated
Rat
ios
For
the
Las
t T
en F
isca
l Y
ears
En
ded
Ju
ne
30
(Do
lla
rs i
n t
ho
usa
nd
s)
Ch
ange
in a
ssu
mp
tion
s
Ben
efit
pay
men
ts,
incl
ud
ing r
efu
nd
s of
mem
ber
con
trib
uti
on
s
2)
Th
eres
are
no
ass
ets
acc
um
ula
ted
in
a t
rust
to
pa
y th
e re
late
d b
enef
its.
A
ll b
enef
its
are
pa
id o
n a
pa
y-a
s -y
ou
-go
ba
sis.
1)
Info
rma
tio
n f
or
fisc
al
yea
r 2
01
6 a
nd
ea
rlie
r n
ot
ava
ila
ble
.
Cou
nty
's n
et p
ensi
on
lia
bil
ity
as a
per
cen
tage
Ex
pec
ted
aver
age
rem
ain
ing s
ervic
e ye
ars
of
all
par
tici
pan
ts
of
cover
ed-e
mp
loye
e p
ayro
ll
No
tes:
A-1
14

115
(This page left blank intentionally)
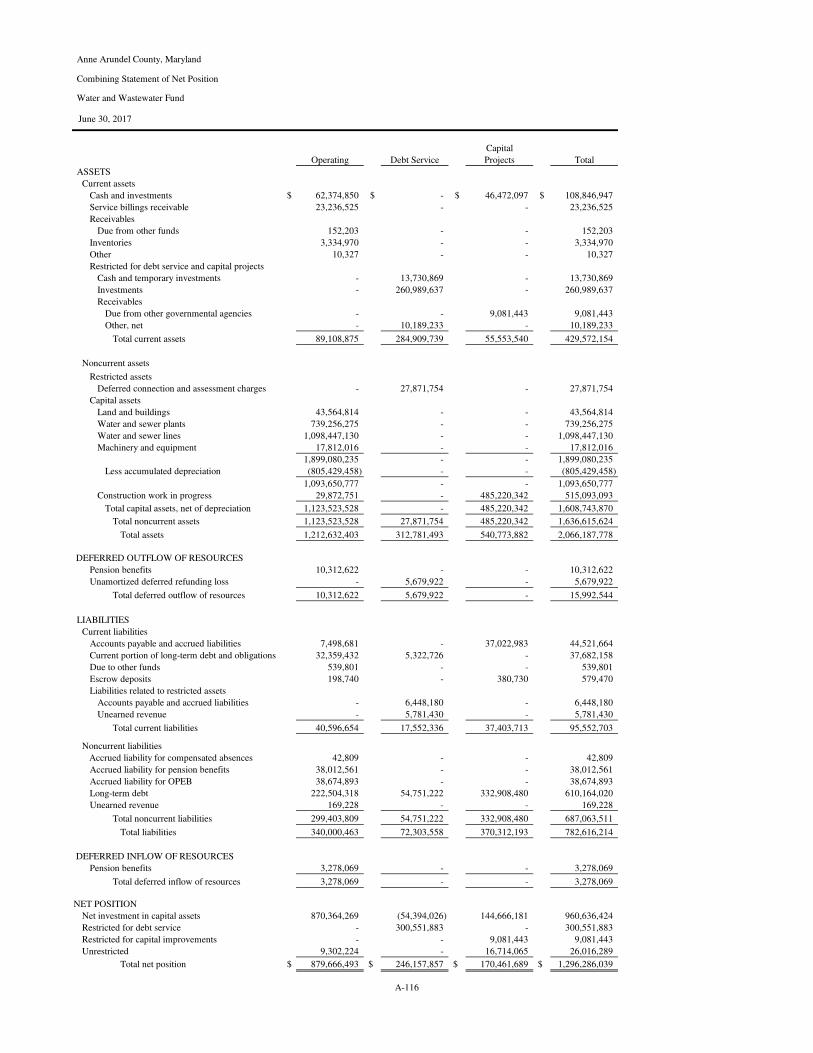
Anne Arundel County, Maryland
Combining Statement of Net Position
Water and Wastewater Fund
June 30, 2017
Capital
Operating Debt Service Projects Total
ASSETS
Current assets
Cash and investments $ 62,374,850 $ - $ 46,472,097 $ 108,846,947
Service billings receivable 23,236,525 - - 23,236,525
Receivables
Due from other funds 152,203 - - 152,203
Inventories 3,334,970 - - 3,334,970
Other 10,327 - - 10,327
Restricted for debt service and capital projects
Cash and temporary investments - 13,730,869 - 13,730,869
Investments - 260,989,637 - 260,989,637
Receivables
Due from other governmental agencies - - 9,081,443 9,081,443
Other, net - 10,189,233 - 10,189,233
Total current assets 89,108,875 284,909,739 55,553,540 429,572,154
Noncurrent assets
Restricted assetsRestricted assets
Deferred connection and assessment charges - 27,871,754 - 27,871,754
Capital assets
Land and buildings 43,564,814 - - 43,564,814
Water and sewer plants 739,256,275 - - 739,256,275
Water and sewer lines 1,098,447,130 - - 1,098,447,130
Machinery and equipment 17,812,016 - - 17,812,016
1,899,080,235 - - 1,899,080,235
Less accumulated depreciation (805,429,458) - - (805,429,458)
1,093,650,777 - - 1,093,650,777
Construction work in progress 29,872,751 - 485,220,342 515,093,093
Total capital assets, net of depreciation 1,123,523,528 - 485,220,342 1,608,743,870
Total noncurrent assets 1,123,523,528 27,871,754 485,220,342 1,636,615,624
Total assets 1,212,632,403 312,781,493 540,773,882 2,066,187,778
DEFERRED OUTFLOW OF RESOURCES
Pension benefits 10,312,622 - - 10,312,622
Unamortized deferred refunding loss - 5,679,922 - 5,679,922
Total deferred outflow of resources 10,312,622 5,679,922 - 15,992,544
LIABILITIES
Current liabilities
Accounts payable and accrued liabilities 7,498,681 - 37,022,983 44,521,664
Current portion of long-term debt and obligations 32,359,432 5,322,726 - 37,682,158
Due to other funds 539,801 - - 539,801
Escrow deposits 198,740 - 380,730 579,470
Liabilities related to restricted assets
Accounts payable and accrued liabilities - 6,448,180 - 6,448,180
Unearned revenue - 5,781,430 - 5,781,430
Total current liabilities 40,596,654 17,552,336 37,403,713 95,552,703
Noncurrent liabilities
Accrued liability for compensated absences 42,809 - - 42,809
Accrued liability for pension benefits 38,012,561 - - 38,012,561
Accrued liability for OPEB 38,674,893 - - 38,674,893
Long-term debt 222,504,318 54,751,222 332,908,480 610,164,020
Unearned revenue 169,228 - - 169,228
Total noncurrent liabilities 299,403,809 54,751,222 332,908,480 687,063,511
Total liabilities 340,000,463 72,303,558 370,312,193 782,616,214
DEFERRED INFLOW OF RESOURCES
Pension benefits 3,278,069 - - 3,278,069
Total deferred inflow of resources 3,278,069 - - 3,278,069
NET POSITION
Net investment in capital assets 870,364,269 (54,394,026) 144,666,181 960,636,424
Restricted for debt service - 300,551,883 - 300,551,883
Restricted for capital improvements - - 9,081,443 9,081,443
Unrestricted 9,302,224 - 16,714,065 26,016,289
Total net position $ 879,666,493 $ 246,157,857 $ 170,461,689 $ 1,296,286,039
A-116
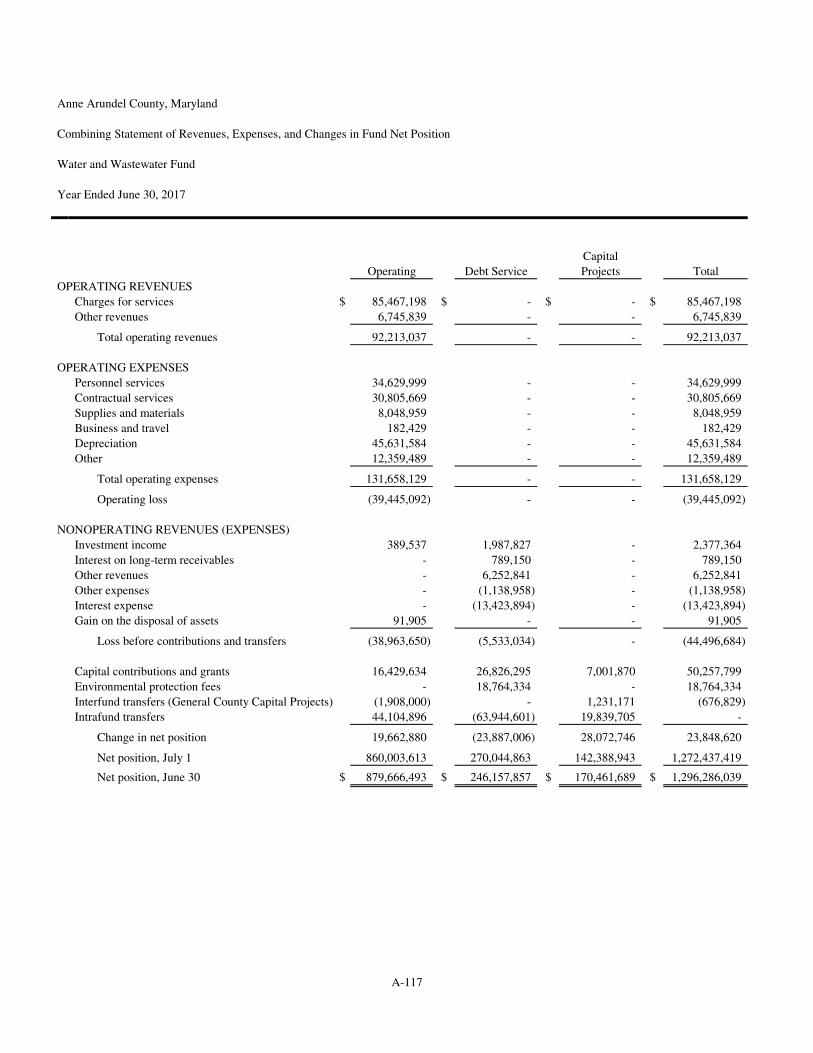
Anne Arundel County, Maryland
Combining Statement of Revenues, Expenses, and Changes in Fund Net Position
Water and Wastewater Fund
Year Ended June 30, 2017
Capital
Operating Debt Service Projects Total
OPERATING REVENUES
Charges for services $ 85,467,198 $ - $ - $ 85,467,198
Other revenues 6,745,839 - - 6,745,839
Total operating revenues 92,213,037 - - 92,213,037
OPERATING EXPENSES
Personnel services 34,629,999 - - 34,629,999
Contractual services 30,805,669 - - 30,805,669
Supplies and materials 8,048,959 - - 8,048,959
Business and travel 182,429 - - 182,429
Depreciation 45,631,584 - - 45,631,584
Other 12,359,489 - - 12,359,489
Total operating expenses 131,658,129 - - 131,658,129
Operating loss (39,445,092) - - (39,445,092)
NONOPERATING REVENUES (EXPENSES)
Investment income 389,537 1,987,827 - 2,377,364
Interest on long-term receivables - 789,150 - 789,150
Other revenues - 6,252,841 - 6,252,841
Other expenses - (1,138,958) - (1,138,958)
Interest expense - (13,423,894) - (13,423,894)
Gain on the disposal of assets 91,905 - - 91,905
Loss before contributions and transfers (38,963,650) (5,533,034) - (44,496,684)
Capital contributions and grants 16,429,634 26,826,295 7,001,870 50,257,799
Environmental protection fees - 18,764,334 - 18,764,334
Interfund transfers (General County Capital Projects) (1,908,000) - 1,231,171 (676,829)
Intrafund transfers 44,104,896 (63,944,601) 19,839,705 -
Change in net position 19,662,880 (23,887,006) 28,072,746 23,848,620
Net position, July 1 860,003,613 270,044,863 142,388,943 1,272,437,419
Net position, June 30 $ 879,666,493 $ 246,157,857 $ 170,461,689 $ 1,296,286,039
A-117
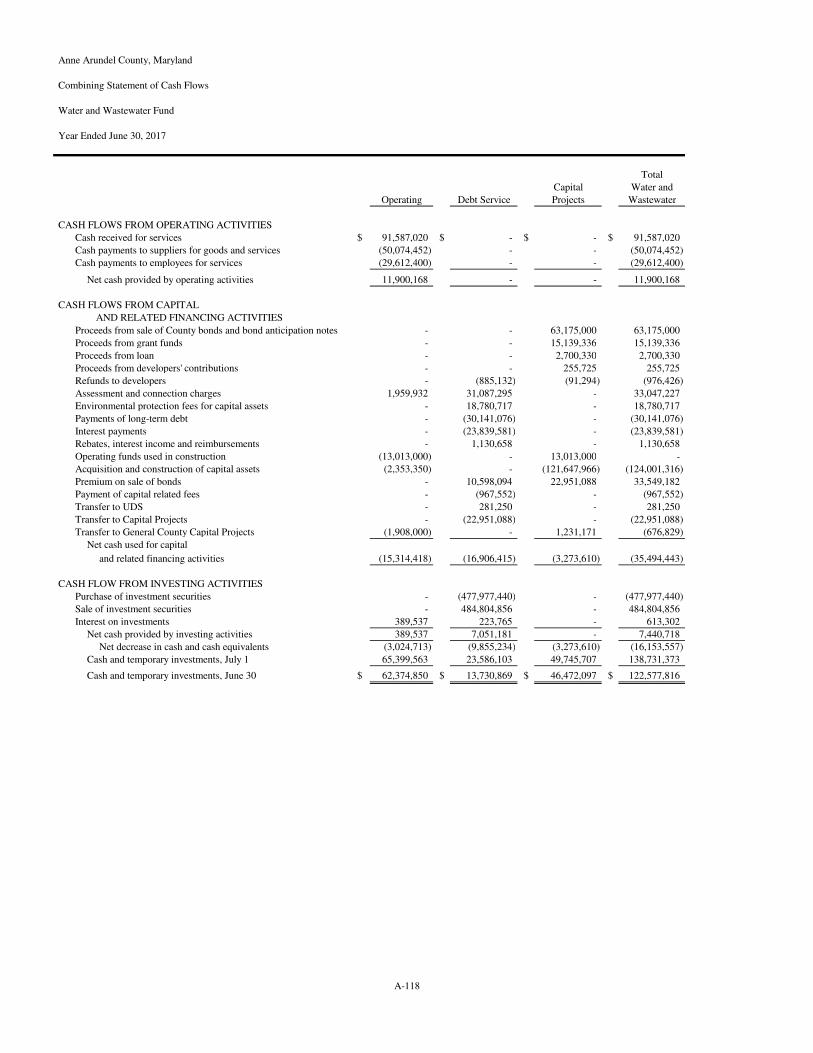
Anne Arundel County, Maryland
Combining Statement of Cash Flows
Water and Wastewater Fund
Year Ended June 30, 2017
Total
Capital Water and
Operating Debt Service Projects Wastewater
CASH FLOWS FROM OPERATING ACTIVITIES
Cash received for services $ 91,587,020 $ - $ - $ 91,587,020
Cash payments to suppliers for goods and services (50,074,452) - - (50,074,452)
Cash payments to employees for services (29,612,400) - - (29,612,400)
Net cash provided by operating activities 11,900,168 - - 11,900,168
CASH FLOWS FROM CAPITAL
AND RELATED FINANCING ACTIVITIES
Proceeds from sale of County bonds and bond anticipation notes - - 63,175,000 63,175,000
Proceeds from grant funds - - 15,139,336 15,139,336
Proceeds from loan - - 2,700,330 2,700,330
Proceeds from developers' contributions - - 255,725 255,725
Refunds to developers - (885,132) (91,294) (976,426)
Assessment and connection charges 1,959,932 31,087,295 - 33,047,227
Environmental protection fees for capital assets - 18,780,717 - 18,780,717
Payments of long-term debt - (30,141,076) - (30,141,076)
Interest payments - (23,839,581) - (23,839,581)
Rebates, interest income and reimbursements - 1,130,658 - 1,130,658
Operating funds used in construction (13,013,000) - 13,013,000 -
Acquisition and construction of capital assets (2,353,350) - (121,647,966) (124,001,316)
Premium on sale of bonds - 10,598,094 22,951,088 33,549,182
Payment of capital related fees - (967,552) - (967,552)
Transfer to UDS - 281,250 - 281,250
Transfer to Capital Projects - (22,951,088) - (22,951,088)
Transfer to General County Capital Projects (1,908,000) - 1,231,171 (676,829)
Net cash used for capital
and related financing activities (15,314,418) (16,906,415) (3,273,610) (35,494,443)
CASH FLOW FROM INVESTING ACTIVITIES
Purchase of investment securities - (477,977,440) - (477,977,440)
Sale of investment securities - 484,804,856 - 484,804,856
Interest on investments 389,537 223,765 - 613,302
Net cash provided by investing activities 389,537 7,051,181 - 7,440,718
Net decrease in cash and cash equivalents (3,024,713) (9,855,234) (3,273,610) (16,153,557)
Cash and temporary investments, July 1 65,399,563 23,586,103 49,745,707 138,731,373
Cash and temporary investments, June 30 $ 62,374,850 $ 13,730,869 $ 46,472,097 $ 122,577,816
A-118
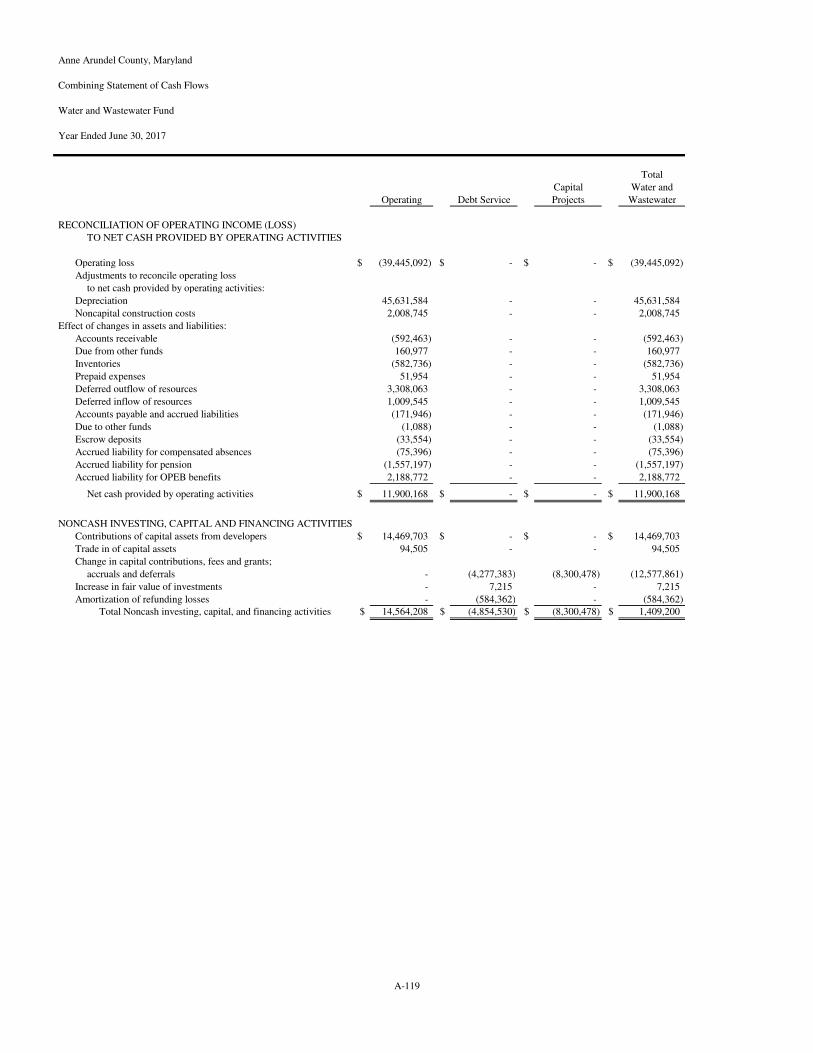
Anne Arundel County, Maryland
Combining Statement of Cash Flows
Water and Wastewater Fund
Year Ended June 30, 2017
Total
Capital Water and
Operating Debt Service Projects Wastewater
RECONCILIATION OF OPERATING INCOME (LOSS)
TO NET CASH PROVIDED BY OPERATING ACTIVITIES
Operating loss $ (39,445,092) $ - $ - $ (39,445,092)
Adjustments to reconcile operating loss
to net cash provided by operating activities:
Depreciation 45,631,584 - - 45,631,584
Noncapital construction costs 2,008,745 - - 2,008,745
Effect of changes in assets and liabilities:
Accounts receivable (592,463) - - (592,463)
Due from other funds 160,977 - - 160,977
Inventories (582,736) - - (582,736)
Prepaid expenses 51,954 - - 51,954
Deferred outflow of resources 3,308,063 - - 3,308,063
Deferred inflow of resources 1,009,545 - - 1,009,545
Accounts payable and accrued liabilities (171,946) - - (171,946)
Due to other funds (1,088) - - (1,088)
Escrow deposits (33,554) - - (33,554)
Accrued liability for compensated absences (75,396) - - (75,396)
Accrued liability for pension (1,557,197) - - (1,557,197)
Accrued liability for OPEB benefits 2,188,772 - - 2,188,772
Net cash provided by operating activities $ 11,900,168 $ - $ - $ 11,900,168
NONCASH INVESTING, CAPITAL AND FINANCING ACTIVITIES
Contributions of capital assets from developers $ 14,469,703 $ - $ - $ 14,469,703
Trade in of capital assets 94,505 - - 94,505
Change in capital contributions, fees and grants;
accruals and deferrals - (4,277,383) (8,300,478) (12,577,861)
Increase in fair value of investments - 7,215 - 7,215
Amortization of refunding losses - (584,362) - (584,362)
Total Noncash investing, capital, and financing activities $ 14,564,208 $ (4,854,530) $ (8,300,478) $ 1,409,200
A-119
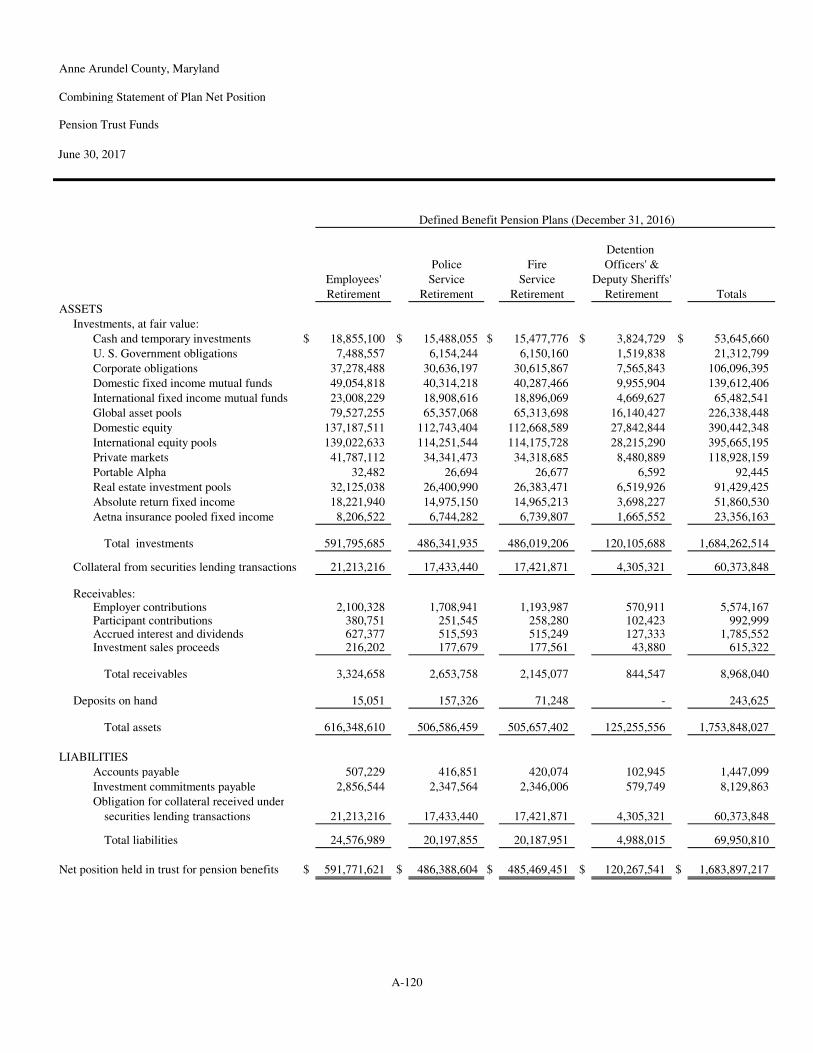
Anne Arundel County, Maryland
Combining Statement of Plan Net Position
Pension Trust Funds
June 30, 2017
Detention
Police Fire Officers' &
Employees' Service Service Deputy Sheriffs'
Retirement Retirement Retirement Retirement Totals
ASSETS
Investments, at fair value:
Cash and temporary investments $ 18,855,100 $ 15,488,055 $ 15,477,776 $ 3,824,729 $ 53,645,660
U. S. Government obligations 7,488,557 6,154,244 6,150,160 1,519,838 21,312,799
Corporate obligations 37,278,488 30,636,197 30,615,867 7,565,843 106,096,395
Domestic fixed income mutual funds 49,054,818 40,314,218 40,287,466 9,955,904 139,612,406
International fixed income mutual funds 23,008,229 18,908,616 18,896,069 4,669,627 65,482,541
Global asset pools 79,527,255 65,357,068 65,313,698 16,140,427 226,338,448
Domestic equity 137,187,511 112,743,404 112,668,589 27,842,844 390,442,348
International equity pools 139,022,633 114,251,544 114,175,728 28,215,290 395,665,195
Private markets 41,787,112 34,341,473 34,318,685 8,480,889 118,928,159
Portable Alpha 32,482 26,694 26,677 6,592 92,445
Real estate investment pools 32,125,038 26,400,990 26,383,471 6,519,926 91,429,425
Absolute return fixed income 18,221,940 14,975,150 14,965,213 3,698,227 51,860,530
Aetna insurance pooled fixed income 8,206,522 6,744,282 6,739,807 1,665,552 23,356,163
Total investments 591,795,685 486,341,935 486,019,206 120,105,688 1,684,262,514
Collateral from securities lending transactions 21,213,216 17,433,440 17,421,871 4,305,321 60,373,848
Receivables:Employer contributions 2,100,328 1,708,941 1,193,987 570,911 5,574,167 Participant contributions 380,751 251,545 258,280 102,423 992,999 Accrued interest and dividends 627,377 515,593 515,249 127,333 1,785,552 Investment sales proceeds 216,202 177,679 177,561 43,880 615,322
Total receivables 3,324,658 2,653,758 2,145,077 844,547 8,968,040
Deposits on hand 15,051 157,326 71,248 - 243,625
Total assets 616,348,610 506,586,459 505,657,402 125,255,556 1,753,848,027
LIABILITIES
Accounts payable 507,229 416,851 420,074 102,945 1,447,099
Investment commitments payable 2,856,544 2,347,564 2,346,006 579,749 8,129,863
Obligation for collateral received under
securities lending transactions 21,213,216 17,433,440 17,421,871 4,305,321 60,373,848
Total liabilities 24,576,989 20,197,855 20,187,951 4,988,015 69,950,810
Net position held in trust for pension benefits $ 591,771,621 $ 486,388,604 $ 485,469,451 $ 120,267,541 $ 1,683,897,217
Defined Benefit Pension Plans (December 31, 2016)
A-120
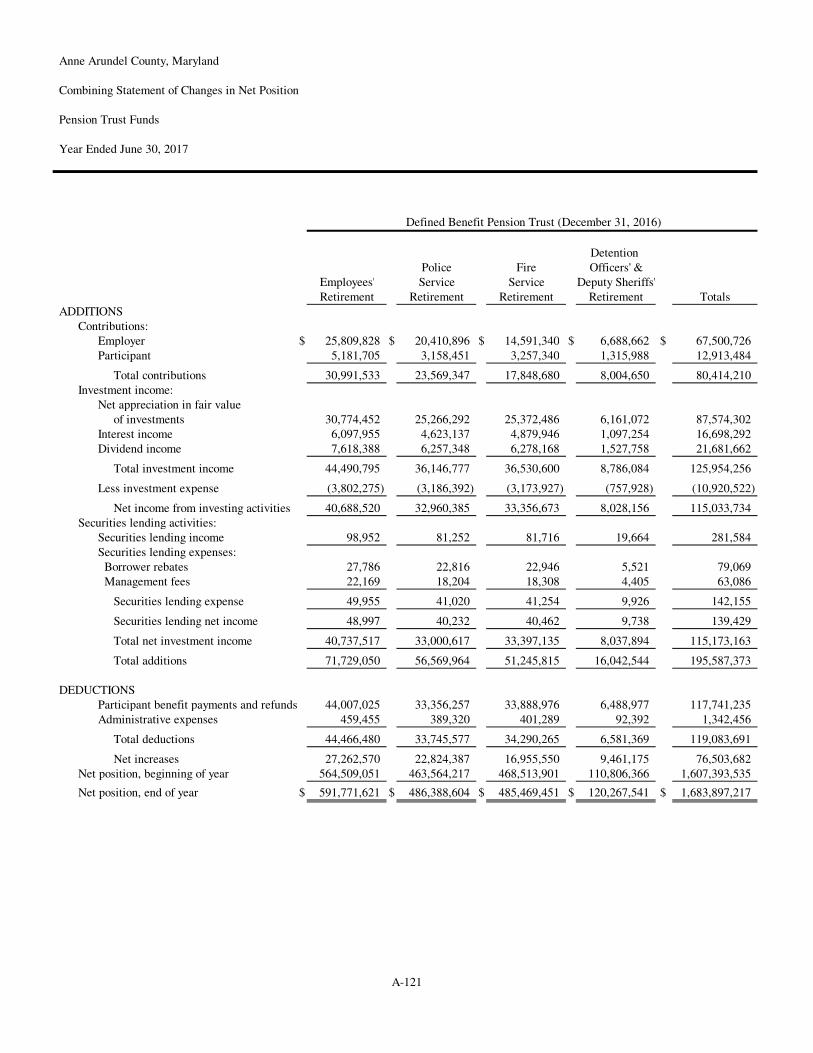
Anne Arundel County, Maryland
Combining Statement of Changes in Net Position
Pension Trust Funds
Year Ended June 30, 2017
Detention
Police Fire Officers' &
Employees' Service Service Deputy Sheriffs'
Retirement Retirement Retirement Retirement Totals
ADDITIONS
Contributions:
Employer $ 25,809,828 $ 20,410,896 $ 14,591,340 $ 6,688,662 $ 67,500,726
Participant 5,181,705 3,158,451 3,257,340 1,315,988 12,913,484
Total contributions 30,991,533 23,569,347 17,848,680 8,004,650 80,414,210
Investment income:
Net appreciation in fair value
of investments 30,774,452 25,266,292 25,372,486 6,161,072 87,574,302
Interest income 6,097,955 4,623,137 4,879,946 1,097,254 16,698,292
Dividend income 7,618,388 6,257,348 6,278,168 1,527,758 21,681,662
Total investment income 44,490,795 36,146,777 36,530,600 8,786,084 125,954,256
Less investment expense (3,802,275) (3,186,392) (3,173,927) (757,928) (10,920,522)
Net income from investing activities 40,688,520 32,960,385 33,356,673 8,028,156 115,033,734
Securities lending activities:
Securities lending income 98,952 81,252 81,716 19,664 281,584
Securities lending expenses:
Borrower rebates 27,786 22,816 22,946 5,521 79,069
Management fees 22,169 18,204 18,308 4,405 63,086
Securities lending expense 49,955 41,020 41,254 9,926 142,155
Securities lending net income 48,997 40,232 40,462 9,738 139,429
Total net investment income 40,737,517 33,000,617 33,397,135 8,037,894 115,173,163
Total additions 71,729,050 56,569,964 51,245,815 16,042,544 195,587,373
DEDUCTIONS
Participant benefit payments and refunds 44,007,025 33,356,257 33,888,976 6,488,977 117,741,235
Administrative expenses 459,455 389,320 401,289 92,392 1,342,456
Total deductions 44,466,480 33,745,577 34,290,265 6,581,369 119,083,691
Net increases 27,262,570 22,824,387 16,955,550 9,461,175 76,503,682
Net position, beginning of year 564,509,051 463,564,217 468,513,901 110,806,366 1,607,393,535
Net position, end of year $ 591,771,621 $ 486,388,604 $ 485,469,451 $ 120,267,541 $ 1,683,897,217
Defined Benefit Pension Trust (December 31, 2016)
A-121
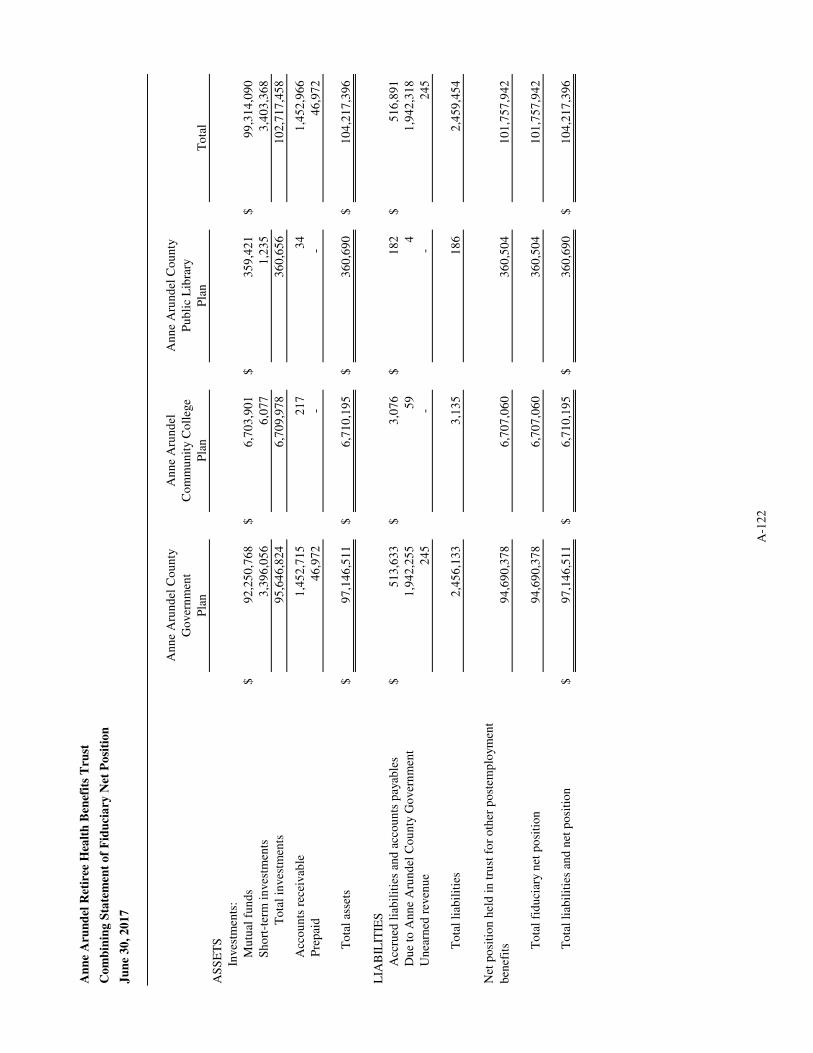
An
ne
Aru
nd
el C
ou
nty
An
ne
Aru
nd
elA
nn
e A
run
del
Co
un
ty
Go
ver
nm
ent
Co
mm
un
ity
Co
lleg
eP
ub
lic
Lib
rary
Pla
nP
lan
Pla
nT
ota
l
AS
SE
TS
Inves
tmen
ts:
Mu
tual
fu
nd
s$
92
,25
0,7
68
$6
,70
3,9
01
$3
59
,42
1
$9
9,3
14
,09
0
Sh
ort
-ter
m i
nves
tmen
ts3
,39
6,0
56
6
,07
7
1,2
35
3
,40
3,3
68
To
tal
inves
tmen
ts9
5,6
46
,82
4
6
,70
9,9
78
36
0,6
56
1
02
,71
7,4
58
Acc
ou
nts
rec
eivab
le1
,45
2,7
15
2
17
3
4
1,4
52
,96
6
P
rep
aid
46
,97
2
-
-
4
6,9
72
To
tal
asse
ts$
97
,14
6,5
11
$6
,71
0,1
95
$3
60
,69
0
$1
04
,21
7,3
96
LIA
BIL
ITIE
S
Acc
rued
lia
bil
itie
s an
d a
cco
un
ts p
ayab
les
$5
13
,63
3
$3
,07
6
$1
82
$5
16
,89
1
Du
e to
An
ne
Aru
nd
el C
ou
nty
Go
ver
nm
ent
1,9
42
,25
5
59
4
1
,94
2,3
18
Un
earn
ed r
even
ue
24
5
-
-
2
45
To
tal
liab
ilit
ies
2,4
56
,13
3
3,1
35
1
86
2,4
59
,45
4
94
,69
0,3
78
6,7
07
,06
0
3
60
,50
4
10
1,7
57
,94
2
To
tal
fid
uci
ary
net
po
siti
on
94
,69
0,3
78
6,7
07
,06
0
3
60
,50
4
10
1,7
57
,94
2
To
tal
liab
ilit
ies
and
net
po
siti
on
$9
7,1
46
,51
1
$
6,7
10
,19
5
$
36
0,6
90
$
10
4,2
17
,39
6
Net
po
siti
on
hel
d i
n t
rust
fo
r o
ther
po
stem
plo
ymen
t
ben
efit
s
An
ne
Aru
nd
el R
etir
ee H
ealt
h B
enef
its
Tru
st
Co
mb
inin
g S
tate
men
t o
f F
idu
cia
ry N
et P
osi
tio
n
Ju
ne
30
, 2
01
7
A-1
22
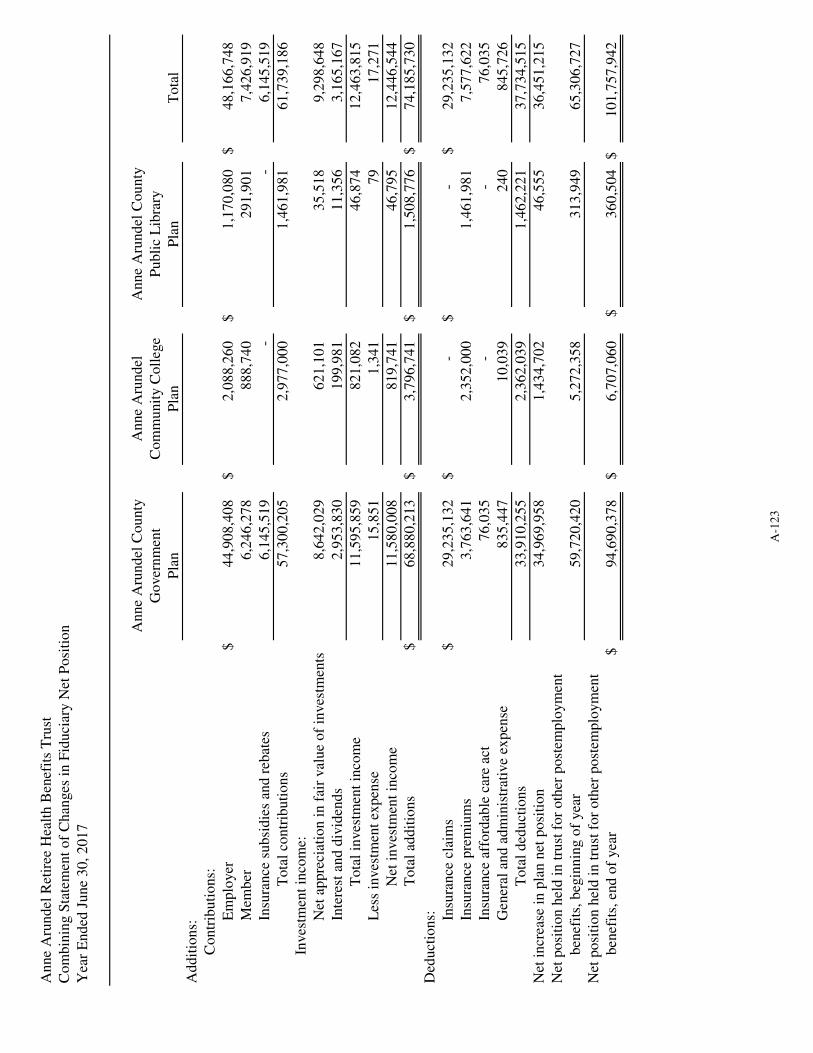
Anne
Aru
ndel
County
Anne
Aru
ndel
Anne
Aru
ndel
County
Gover
nm
ent
Com
munit
y C
oll
ege
Publi
c L
ibra
ry
Pla
nP
lan
Pla
nT
ota
l
Addit
ions:
Contr
ibuti
ons:
Em
plo
yer
$44,9
08,4
08
$
2,0
88,2
60
$1,1
70,0
80
$48,1
66,7
48
Mem
ber
6,2
46,2
78
888,7
40
291,9
01
7,4
26,9
19
Insu
rance
subsi
die
s an
d r
ebat
es6,1
45,5
19
-
-
6,1
45,5
19
Tota
l co
ntr
ibuti
ons
57,3
00,2
05
2,9
77,0
00
1,4
61,9
81
61,7
39,1
86
Inves
tmen
t in
com
e:
Net
appre
ciat
ion i
n f
air
val
ue
of
inves
tmen
ts8,6
42,0
29
621,1
01
35,5
18
9,2
98,6
48
Inte
rest
and d
ivid
ends
2,9
53,8
30
199,9
81
11,3
56
3,1
65,1
67
Tota
l in
ves
tmen
t in
com
e11,5
95,8
59
821,0
82
46,8
74
12,4
63,8
15
Les
s in
ves
tmen
t ex
pen
se15,8
51
1,3
41
79
17,2
71
Net
inves
tmen
t in
com
e11,5
80,0
08
819,7
41
46,7
95
12,4
46,5
44
Tota
l ad
dit
ions
$68,8
80,2
13
$
3,7
96,7
41
$1,5
08,7
76
$74,1
85,7
30
Ded
uct
ions: In
sura
nce
cla
ims
$29,2
35,1
32
$
-
$-
$
29,2
35,1
32
Insu
rance
pre
miu
ms
3,7
63,6
41
2,3
52,0
00
1,4
61,9
81
7,5
77,6
22
Insu
rance
aff
ord
able
car
e ac
t76,0
35
-
-
76,0
35
Gen
eral
and a
dm
inis
trat
ive
expen
se835,4
47
10,0
39
240
845,7
26
Tota
l ded
uct
ions
33,9
10,2
55
2,3
62,0
39
1,4
62,2
21
37,7
34,5
15
Net
incr
ease
in p
lan n
et p
osi
tion
34,9
69,9
58
1,4
34,7
02
46,5
55
36,4
51,2
15
Net
posi
tion h
eld i
n t
rust
for
oth
er p
ost
emplo
ym
ent
ben
efit
s, b
egin
nin
g o
f yea
r59,7
20,4
20
5,2
72,3
58
313,9
49
65,3
06,7
27
Net
posi
tion h
eld i
n t
rust
for
oth
er p
ost
emplo
ym
ent
ben
efit
s, e
nd o
f yea
r$
94,6
90,3
78
$
6,7
07,0
60
$360,5
04
$
101,7
57,9
42
Anne
Aru
ndel
Ret
iree
Hea
lth B
enef
its
Tru
st
Com
bin
ing S
tate
men
t of
Chan
ges
in F
iduci
ary N
et P
osi
tion
Yea
r E
nded
June
30,
2017
A-1
23
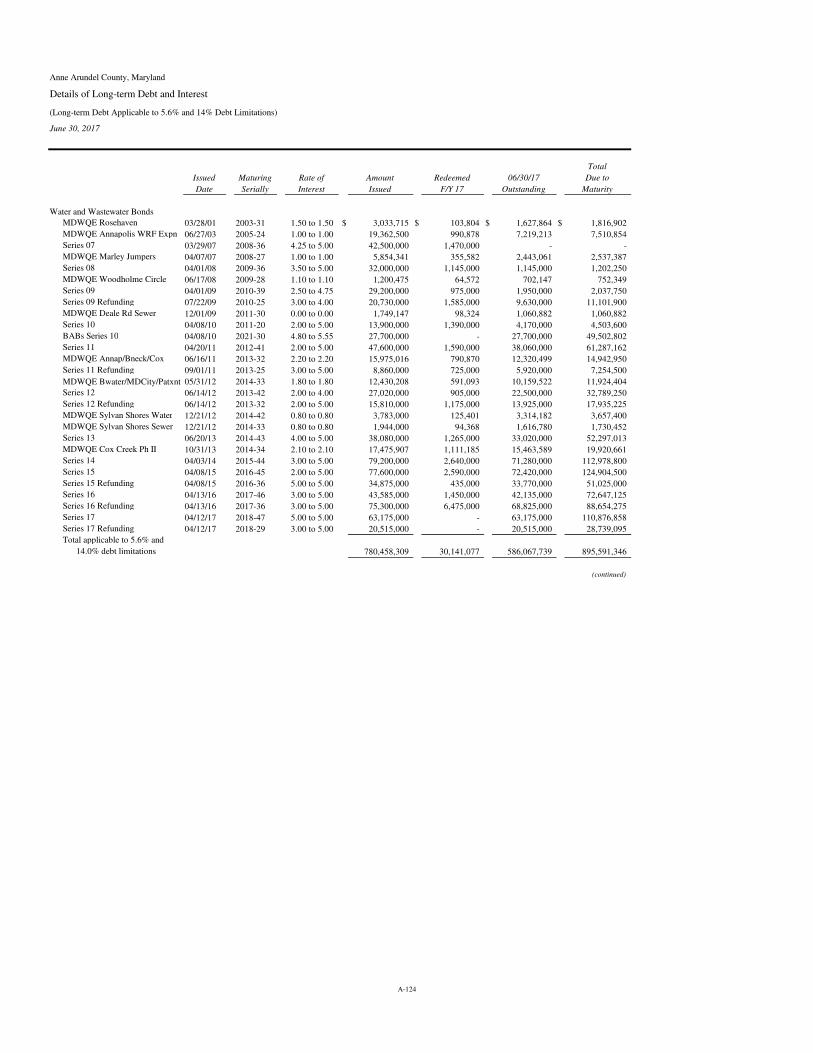
Anne Arundel County, Maryland
Details of Long-term Debt and Interest
(Long-term Debt Applicable to 5.6% and 14% Debt Limitations)
June 30, 2017
Total
Issued Maturing Rate of Amount Redeemed 06/30/17 Due to
Date Serially Interest Issued F/Y 17 Outstanding Maturity
Water and Wastewater Bonds
MDWQE Rosehaven 03/28/01 2003-31 1.50 to 1.50 $ 3,033,715 $ 103,804 $ 1,627,864 $ 1,816,902
MDWQE Annapolis WRF Expn 06/27/03 2005-24 1.00 to 1.00 19,362,500 990,878 7,219,213 7,510,854
Series 07 03/29/07 2008-36 4.25 to 5.00 42,500,000 1,470,000 - -
MDWQE Marley Jumpers 04/07/07 2008-27 1.00 to 1.00 5,854,341 355,582 2,443,061 2,537,387
Series 08 04/01/08 2009-36 3.50 to 5.00 32,000,000 1,145,000 1,145,000 1,202,250
MDWQE Woodholme Circle 06/17/08 2009-28 1.10 to 1.10 1,200,475 64,572 702,147 752,349
Series 09 04/01/09 2010-39 2.50 to 4.75 29,200,000 975,000 1,950,000 2,037,750
Series 09 Refunding 07/22/09 2010-25 3.00 to 4.00 20,730,000 1,585,000 9,630,000 11,101,900
MDWQE Deale Rd Sewer 12/01/09 2011-30 0.00 to 0.00 1,749,147 98,324 1,060,882 1,060,882
Series 10 04/08/10 2011-20 2.00 to 5.00 13,900,000 1,390,000 4,170,000 4,503,600
BABs Series 10 04/08/10 2021-30 4.80 to 5.55 27,700,000 - 27,700,000 49,502,802
Series 11 04/20/11 2012-41 2.00 to 5.00 47,600,000 1,590,000 38,060,000 61,287,162
MDWQE Annap/Bneck/Cox 06/16/11 2013-32 2.20 to 2.20 15,975,016 790,870 12,320,499 14,942,950
Series 11 Refunding 09/01/11 2013-25 3.00 to 5.00 8,860,000 725,000 5,920,000 7,254,500
MDWQE Bwater/MDCity/Patxnt 05/31/12 2014-33 1.80 to 1.80 12,430,208 591,093 10,159,522 11,924,404
Series 12 06/14/12 2013-42 2.00 to 4.00 27,020,000 905,000 22,500,000 32,789,250
Series 12 Refunding 06/14/12 2013-32 2.00 to 5.00 15,810,000 1,175,000 13,925,000 17,935,225
MDWQE Sylvan Shores Water 12/21/12 2014-42 0.80 to 0.80 3,783,000 125,401 3,314,182 3,657,400
MDWQE Sylvan Shores Sewer 12/21/12 2014-33 0.80 to 0.80 1,944,000 94,368 1,616,780 1,730,452
Series 13 06/20/13 2014-43 4.00 to 5.00 38,080,000 1,265,000 33,020,000 52,297,013
MDWQE Cox Creek Ph II 10/31/13 2014-34 2.10 to 2.10 17,475,907 1,111,185 15,463,589 19,920,661
Series 14 04/03/14 2015-44 3.00 to 5.00 79,200,000 2,640,000 71,280,000 112,978,800
Series 15 04/08/15 2016-45 2.00 to 5.00 77,600,000 2,590,000 72,420,000 124,904,500
Series 15 Refunding 04/08/15 2016-36 5.00 to 5.00 34,875,000 435,000 33,770,000 51,025,000
Series 16 04/13/16 2017-46 3.00 to 5.00 43,585,000 1,450,000 42,135,000 72,647,125
Series 16 Refunding 04/13/16 2017-36 3.00 to 5.00 75,300,000 6,475,000 68,825,000 88,654,275
Series 17 04/12/17 2018-47 5.00 to 5.00 63,175,000 - 63,175,000 110,876,858
Series 17 Refunding 04/12/17 2018-29 3.00 to 5.00 20,515,000 - 20,515,000 28,739,095
Total applicable to 5.6% and
14.0% debt limitations 780,458,309 30,141,077 586,067,739 895,591,346
(continued)
A-124
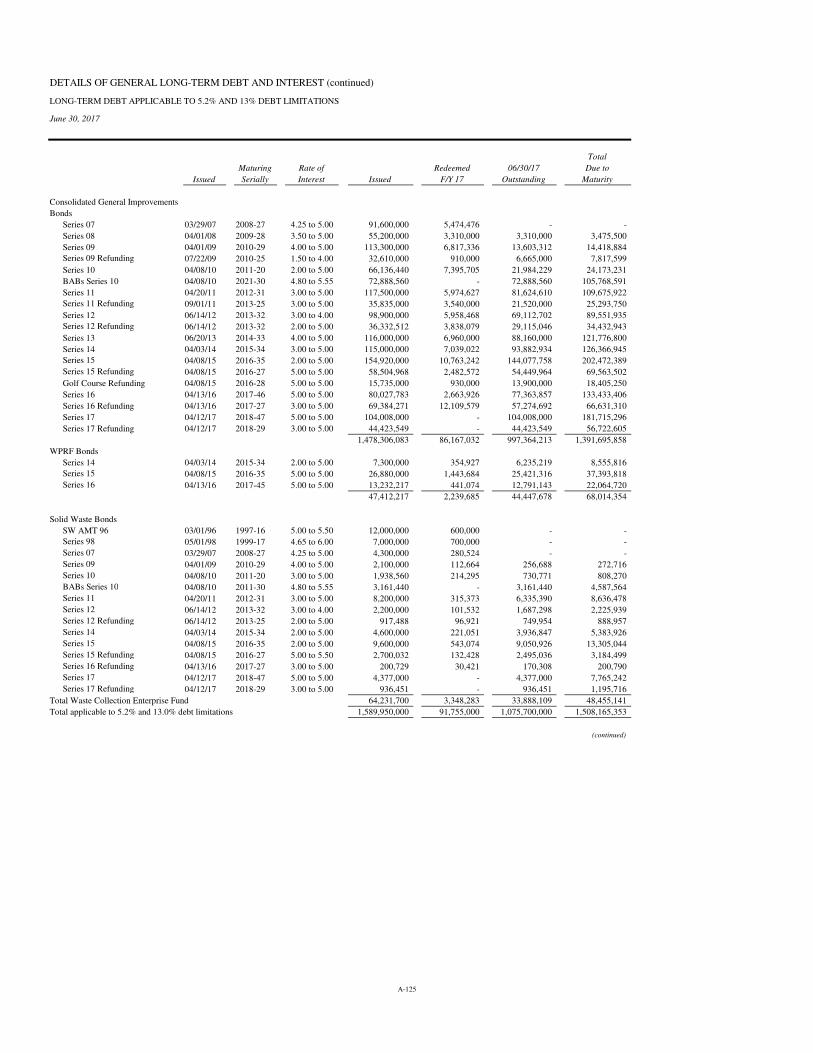
DETAILS OF GENERAL LONG-TERM DEBT AND INTEREST (continued)
LONG-TERM DEBT APPLICABLE TO 5.2% AND 13% DEBT LIMITATIONS
June 30, 2017
Total
Maturing Rate of Redeemed 06/30/17 Due to
Issued Serially Interest Issued F/Y 17 Outstanding Maturity
Consolidated General Improvements
Bonds
Series 07 03/29/07 2008-27 4.25 to 5.00 91,600,000 5,474,476 - -
Series 08 04/01/08 2009-28 3.50 to 5.00 55,200,000 3,310,000 3,310,000 3,475,500
Series 09 04/01/09 2010-29 4.00 to 5.00 113,300,000 6,817,336 13,603,312 14,418,884
Series 09 Refunding 07/22/09 2010-25 1.50 to 4.00 32,610,000 910,000 6,665,000 7,817,599
Series 10 04/08/10 2011-20 2.00 to 5.00 66,136,440 7,395,705 21,984,229 24,173,231
BABs Series 10 04/08/10 2021-30 4.80 to 5.55 72,888,560 - 72,888,560 105,768,591
Series 11 04/20/11 2012-31 3.00 to 5.00 117,500,000 5,974,627 81,624,610 109,675,922
Series 11 Refunding 09/01/11 2013-25 3.00 to 5.00 35,835,000 3,540,000 21,520,000 25,293,750
Series 12 06/14/12 2013-32 3.00 to 4.00 98,900,000 5,958,468 69,112,702 89,551,935
Series 12 Refunding 06/14/12 2013-32 2.00 to 5.00 36,332,512 3,838,079 29,115,046 34,432,943
Series 13 06/20/13 2014-33 4.00 to 5.00 116,000,000 6,960,000 88,160,000 121,776,800
Series 14 04/03/14 2015-34 3.00 to 5.00 115,000,000 7,039,022 93,882,934 126,366,945
Series 15 04/08/15 2016-35 2.00 to 5.00 154,920,000 10,763,242 144,077,758 202,472,389
Series 15 Refunding 04/08/15 2016-27 5.00 to 5.00 58,504,968 2,482,572 54,449,964 69,563,502
Golf Course Refunding 04/08/15 2016-28 5.00 to 5.00 15,735,000 930,000 13,900,000 18,405,250
Series 16 04/13/16 2017-46 5.00 to 5.00 80,027,783 2,663,926 77,363,857 133,433,406
Series 16 Refunding 04/13/16 2017-27 3.00 to 5.00 69,384,271 12,109,579 57,274,692 66,631,310
Series 17 04/12/17 2018-47 5.00 to 5.00 104,008,000 - 104,008,000 181,715,296
Series 17 Refunding 04/12/17 2018-29 3.00 to 5.00 44,423,549 - 44,423,549 56,722,605
1,478,306,083 86,167,032 997,364,213 1,391,695,858
WPRF Bonds
Series 14 04/03/14 2015-34 2.00 to 5.00 7,300,000 354,927 6,235,219 8,555,816
Series 15 04/08/15 2016-35 5.00 to 5.00 26,880,000 1,443,684 25,421,316 37,393,818
Series 16 04/13/16 2017-45 5.00 to 5.00 13,232,217 441,074 12,791,143 22,064,720
47,412,217 2,239,685 44,447,678 68,014,354
Solid Waste Bonds
SW AMT 96 03/01/96 1997-16 5.00 to 5.50 12,000,000 600,000 - -
Series 98 05/01/98 1999-17 4.65 to 6.00 7,000,000 700,000 - -
Series 07 03/29/07 2008-27 4.25 to 5.00 4,300,000 280,524 - -
Series 09 04/01/09 2010-29 4.00 to 5.00 2,100,000 112,664 256,688 272,716
Series 10 04/08/10 2011-20 3.00 to 5.00 1,938,560 214,295 730,771 808,270
BABs Series 10 04/08/10 2011-30 4.80 to 5.55 3,161,440 - 3,161,440 4,587,564
Series 11 04/20/11 2012-31 3.00 to 5.00 8,200,000 315,373 6,335,390 8,636,478
Series 12 06/14/12 2013-32 3.00 to 4.00 2,200,000 101,532 1,687,298 2,225,939
Series 12 Refunding 06/14/12 2013-25 2.00 to 5.00 917,488 96,921 749,954 888,957
Series 14 04/03/14 2015-34 2.00 to 5.00 4,600,000 221,051 3,936,847 5,383,926
Series 15 04/08/15 2016-35 2.00 to 5.00 9,600,000 543,074 9,050,926 13,305,044
Series 15 Refunding 04/08/15 2016-27 5.00 to 5.50 2,700,032 132,428 2,495,036 3,184,499
Series 16 Refunding 04/13/16 2017-27 3.00 to 5.00 200,729 30,421 170,308 200,790
Series 17 04/12/17 2018-47 5.00 to 5.00 4,377,000 - 4,377,000 7,765,242
Series 17 Refunding 04/12/17 2018-29 3.00 to 5.00 936,451 - 936,451 1,195,716
Total Waste Collection Enterprise Fund 64,231,700 3,348,283 33,888,109 48,455,141
Total applicable to 5.2% and 13.0% debt limitations 1,589,950,000 91,755,000 1,075,700,000 1,508,165,353
(continued)
A-125
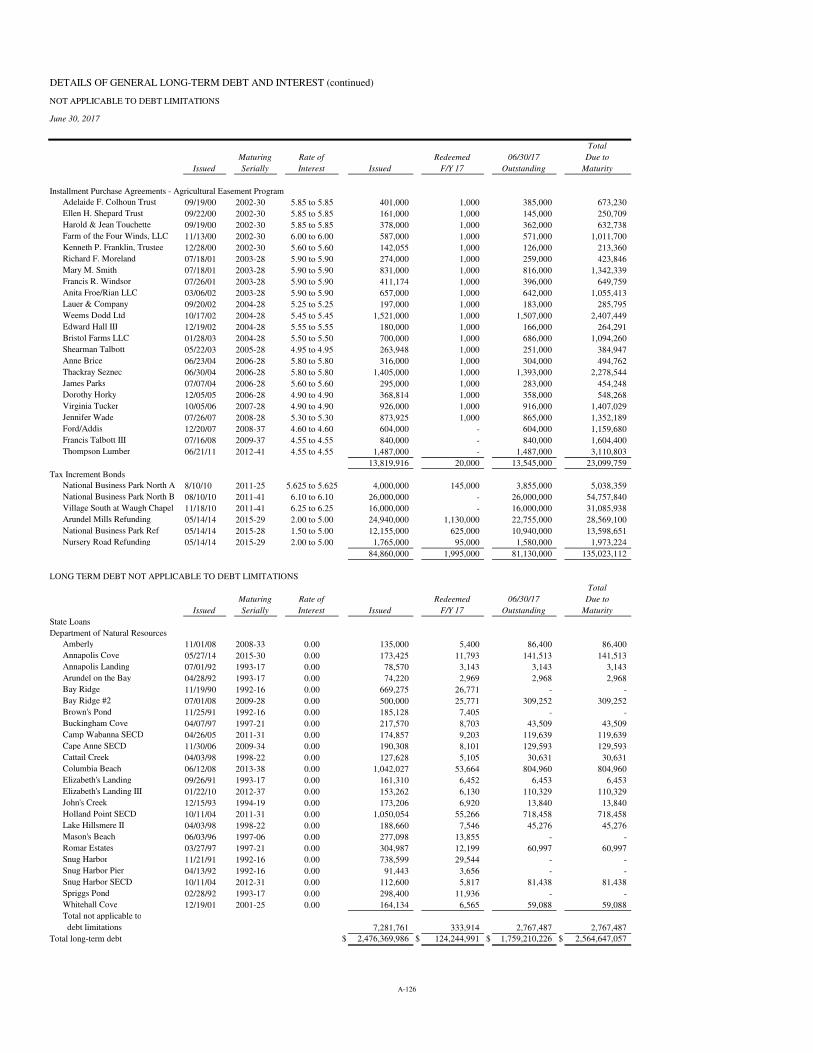
DETAILS OF GENERAL LONG-TERM DEBT AND INTEREST (continued)
NOT APPLICABLE TO DEBT LIMITATIONS
June 30, 2017
Total
Maturing Rate of Redeemed 06/30/17 Due to
Issued Serially Interest Issued F/Y 17 Outstanding Maturity
Installment Purchase Agreements - Agricultural Easement Program
Adelaide F. Colhoun Trust 09/19/00 2002-30 5.85 to 5.85 401,000 1,000 385,000 673,230
Ellen H. Shepard Trust 09/22/00 2002-30 5.85 to 5.85 161,000 1,000 145,000 250,709
Harold & Jean Touchette 09/19/00 2002-30 5.85 to 5.85 378,000 1,000 362,000 632,738
Farm of the Four Winds, LLC 11/13/00 2002-30 6.00 to 6.00 587,000 1,000 571,000 1,011,700
Kenneth P. Franklin, Trustee 12/28/00 2002-30 5.60 to 5.60 142,055 1,000 126,000 213,360
Richard F. Moreland 07/18/01 2003-28 5.90 to 5.90 274,000 1,000 259,000 423,846
Mary M. Smith 07/18/01 2003-28 5.90 to 5.90 831,000 1,000 816,000 1,342,339
Francis R. Windsor 07/26/01 2003-28 5.90 to 5.90 411,174 1,000 396,000 649,759
Anita Froe/Rian LLC 03/06/02 2003-28 5.90 to 5.90 657,000 1,000 642,000 1,055,413
Lauer & Company 09/20/02 2004-28 5.25 to 5.25 197,000 1,000 183,000 285,795
Weems Dodd Ltd 10/17/02 2004-28 5.45 to 5.45 1,521,000 1,000 1,507,000 2,407,449
Edward Hall III 12/19/02 2004-28 5.55 to 5.55 180,000 1,000 166,000 264,291
Bristol Farms LLC 01/28/03 2004-28 5.50 to 5.50 700,000 1,000 686,000 1,094,260
Shearman Talbott 05/22/03 2005-28 4.95 to 4.95 263,948 1,000 251,000 384,947
Anne Brice 06/23/04 2006-28 5.80 to 5.80 316,000 1,000 304,000 494,762
Thackray Seznec 06/30/04 2006-28 5.80 to 5.80 1,405,000 1,000 1,393,000 2,278,544
James Parks 07/07/04 2006-28 5.60 to 5.60 295,000 1,000 283,000 454,248
Dorothy Horky 12/05/05 2006-28 4.90 to 4.90 368,814 1,000 358,000 548,268
Virginia Tucker 10/05/06 2007-28 4.90 to 4.90 926,000 1,000 916,000 1,407,029
Jennifer Wade 07/26/07 2008-28 5.30 to 5.30 873,925 1,000 865,000 1,352,189
Ford/Addis 12/20/07 2008-37 4.60 to 4.60 604,000 - 604,000 1,159,680
Francis Talbott III 07/16/08 2009-37 4.55 to 4.55 840,000 - 840,000 1,604,400
Thompson Lumber 06/21/11 2012-41 4.55 to 4.55 1,487,000 - 1,487,000 3,110,803
13,819,916 20,000 13,545,000 23,099,759
Tax Increment Bonds
National Business Park North A 8/10/10 2011-25 5.625 to 5.625 4,000,000 145,000 3,855,000 5,038,359
National Business Park North B 08/10/10 2011-41 6.10 to 6.10 26,000,000 - 26,000,000 54,757,840
Village South at Waugh Chapel 11/18/10 2011-41 6.25 to 6.25 16,000,000 - 16,000,000 31,085,938
Arundel Mills Refunding 05/14/14 2015-29 2.00 to 5.00 24,940,000 1,130,000 22,755,000 28,569,100
National Business Park Ref 05/14/14 2015-28 1.50 to 5.00 12,155,000 625,000 10,940,000 13,598,651
Nursery Road Refunding 05/14/14 2015-29 2.00 to 5.00 1,765,000 95,000 1,580,000 1,973,224
84,860,000 1,995,000 81,130,000 135,023,112
LONG TERM DEBT NOT APPLICABLE TO DEBT LIMITATIONS
Total
Maturing Rate of Redeemed 06/30/17 Due to
Issued Serially Interest Issued F/Y 17 Outstanding Maturity
State Loans
Department of Natural Resources
Amberly 11/01/08 2008-33 0.00 135,000 5,400 86,400 86,400
Annapolis Cove 05/27/14 2015-30 0.00 173,425 11,793 141,513 141,513
Annapolis Landing 07/01/92 1993-17 0.00 78,570 3,143 3,143 3,143
Arundel on the Bay 04/28/92 1993-17 0.00 74,220 2,969 2,968 2,968
Bay Ridge 11/19/90 1992-16 0.00 669,275 26,771 - -
Bay Ridge #2 07/01/08 2009-28 0.00 500,000 25,771 309,252 309,252
Brown's Pond 11/25/91 1992-16 0.00 185,128 7,405 - -
Buckingham Cove 04/07/97 1997-21 0.00 217,570 8,703 43,509 43,509
Camp Wabanna SECD 04/26/05 2011-31 0.00 174,857 9,203 119,639 119,639
Cape Anne SECD 11/30/06 2009-34 0.00 190,308 8,101 129,593 129,593
Cattail Creek 04/03/98 1998-22 0.00 127,628 5,105 30,631 30,631
Columbia Beach 06/12/08 2013-38 0.00 1,042,027 53,664 804,960 804,960
Elizabeth's Landing 09/26/91 1993-17 0.00 161,310 6,452 6,453 6,453
Elizabeth's Landing III 01/22/10 2012-37 0.00 153,262 6,130 110,329 110,329
John's Creek 12/15/93 1994-19 0.00 173,206 6,920 13,840 13,840
Holland Point SECD 10/11/04 2011-31 0.00 1,050,054 55,266 718,458 718,458
Lake Hillsmere II 04/03/98 1998-22 0.00 188,660 7,546 45,276 45,276
Mason's Beach 06/03/96 1997-06 0.00 277,098 13,855 - -
Romar Estates 03/27/97 1997-21 0.00 304,987 12,199 60,997 60,997
Snug Harbor 11/21/91 1992-16 0.00 738,599 29,544 - -
Snug Harbor Pier 04/13/92 1992-16 0.00 91,443 3,656 - -
Snug Harbor SECD 10/11/04 2012-31 0.00 112,600 5,817 81,438 81,438
Spriggs Pond 02/28/92 1993-17 0.00 298,400 11,936 - -
Whitehall Cove 12/19/01 2001-25 0.00 164,134 6,565 59,088 59,088
Total not applicable to
debt limitations 7,281,761 333,914 2,767,487 2,767,487
Total long-term debt $ 2,476,369,986 $ 124,244,991 $ 1,759,210,226 $ 2,564,647,057
A-126
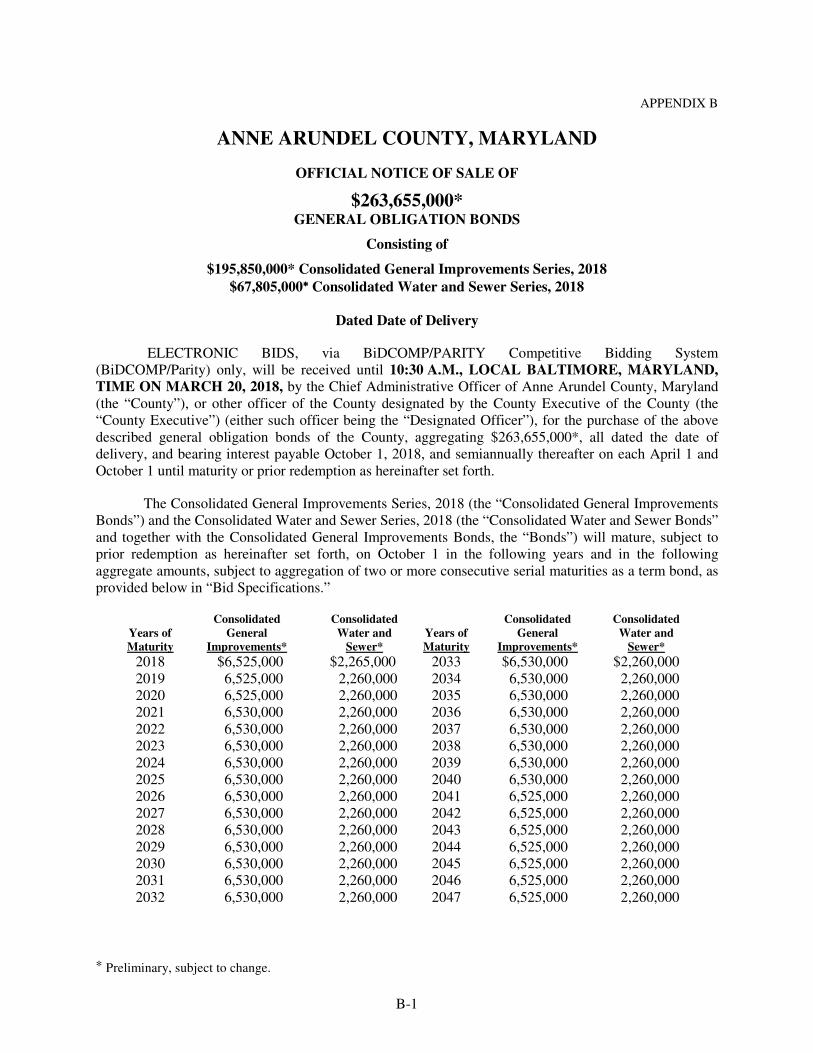
B-1
APPENDIX B
ANNE ARUNDEL COUNTY, MARYLAND
OFFICIAL NOTICE OF SALE OF
$263,655,000* GENERAL OBLIGATION BONDS
Consisting of
$195,850,000* Consolidated General Improvements Series, 2018
$67,805,000∗∗∗∗ Consolidated Water and Sewer Series, 2018
Dated Date of Delivery
ELECTRONIC BIDS, via BiDCOMP/PARITY Competitive Bidding System (BiDCOMP/Parity) only, will be received until 10:30 A.M., LOCAL BALTIMORE, MARYLAND, TIME ON MARCH 20, 2018, by the Chief Administrative Officer of Anne Arundel County, Maryland (the “County”), or other officer of the County designated by the County Executive of the County (the “County Executive”) (either such officer being the “Designated Officer”), for the purchase of the above described general obligation bonds of the County, aggregating $263,655,000*, all dated the date of delivery, and bearing interest payable October 1, 2018, and semiannually thereafter on each April 1 and October 1 until maturity or prior redemption as hereinafter set forth.
The Consolidated General Improvements Series, 2018 (the “Consolidated General Improvements Bonds”) and the Consolidated Water and Sewer Series, 2018 (the “Consolidated Water and Sewer Bonds” and together with the Consolidated General Improvements Bonds, the “Bonds”) will mature, subject to prior redemption as hereinafter set forth, on October 1 in the following years and in the following aggregate amounts, subject to aggregation of two or more consecutive serial maturities as a term bond, as provided below in “Bid Specifications.”
Years of Maturity
Consolidated General
Improvements*
Consolidated Water and
Sewer*
Years of Maturity
Consolidated General
Improvements*
Consolidated Water and
Sewer*
2018 $6,525,000 $2,265,000 2033 $6,530,000 $2,260,000 2019 6,525,000 2,260,000 2034 6,530,000 2,260,000 2020 6,525,000 2,260,000 2035 6,530,000 2,260,000 2021 6,530,000 2,260,000 2036 6,530,000 2,260,000 2022 6,530,000 2,260,000 2037 6,530,000 2,260,000 2023 6,530,000 2,260,000 2038 6,530,000 2,260,000 2024 6,530,000 2,260,000 2039 6,530,000 2,260,000 2025 6,530,000 2,260,000 2040 6,530,000 2,260,000 2026 6,530,000 2,260,000 2041 6,525,000 2,260,000 2027 6,530,000 2,260,000 2042 6,525,000 2,260,000 2028 6,530,000 2,260,000 2043 6,525,000 2,260,000 2029 6,530,000 2,260,000 2044 6,525,000 2,260,000 2030 6,530,000 2,260,000 2045 6,525,000 2,260,000 2031 6,530,000 2,260,000 2046 6,525,000 2,260,000 2032 6,530,000 2,260,000 2047 6,525,000 2,260,000
∗ Preliminary, subject to change.
B-2
The Bonds shall be issued only in fully registered form without coupons. One bond representing each maturity of each series will be issued to and registered in the name of Cede & Co., as nominee of The Depository Trust Company, New York, New York (“DTC”), as registered owner of the Bonds and each such bond shall be immobilized in the custody of DTC. DTC will act as securities depository for the Bonds. Individual purchases will be made in book-entry form only, in the principal amount of $5,000 or any integral multiple thereof. Purchasers will not receive physical delivery of certificates representing their interest in the Bonds purchased. The winning bidder of the Bonds, as a condition to delivery of the Bonds, will be required to deposit the bond certificates representing each maturity of each series with DTC.
General Information
The Bonds are authorized by Section 10-203 of the Local Government Article of the Annotated Code of Maryland (2013 Replacement Volume and 2017 Supplement), the Charter of Anne Arundel County, Maryland (the “County Charter”), and Bill No. 60-17, passed by the County Council of the County on July 17, 2017, approved by the County Executive on July 24, 2017, and effective on September 7, 2017 (as may be amended and supplemented, the “Authorizing Ordinance”).
The proceeds of the Consolidated General Improvements Bonds will be used to provide funding for general improvements. The proceeds of the Consolidated Water and Sewer Bonds will be used to provide funding for water and sewer improvements.
The full faith and credit and taxing power of the County are pledged to the payment of the Bonds and of the interest to accrue thereon. Such taxing power is subject, however, to the limitation set forth in Section 710(d) of the County Charter which provides, in part that “[f]rom and after July 1, 1993, revenues derived from taxes on properties existing on the County property tax rolls at the commencement of the County fiscal year shall not increase, compared with the previous year, more than the Consumer Price Index percentage of change, or 4.5 percent, whichever is the lesser.”
The sources of revenue for the payment of the principal of and interest on the Bonds are as described herein. The Consolidated General Improvements Bonds are payable from annual appropriations of the proceeds of ad valorem taxes which the County is empowered to levy on real and personal property and certain intangible personal property subject to assessment for County taxation subject to the limitations set forth in Section 710(d) of the County Charter. The Consolidated Water and Sewer Bonds are likewise payable from such appropriations in the event of any deficiency in their primary sources of payment. The primary sources of payment for the Consolidated Water and Sewer Bonds are the net revenues of the projects for which such bonds are to be issued, or the utilities of which they are a part, for the use and benefit of which the County has covenanted to fix and collect rates, charges and assessments sufficient to pay the costs of operation, maintenance and debt service.
Optional Redemption
The Bonds of each series maturing on or after October 1, 2028*, are subject to redemption, at the option of the County, on or after October 1, 2027*, as a whole or in part at any time, in any order of maturities, after at least 20 days’ notice, at a redemption price equal to the principal amount thereof, plus accrued interest thereon to the date fixed for redemption.
∗ Preliminary, subject to change.
B-3
Mandatory Sinking Fund Redemption
If two or more consecutive serial maturities are designated as a term bond, as provided below in “Bid Specifications,” such term bond shall be subject to mandatory redemption in each year on the principal payment date and in the entire amount of each serial maturity designated for inclusion in such term bond.
Electronic Bids
Notice is hereby given that proposals will be received via BiDCOMP/Parity Competitive Bidding System, in the manner described below, until 10:30 a.m., local Baltimore, Maryland time, on Tuesday, March 20, 2018, but no bid will be received after the time for receiving bids specified above.
All prospective bidders must be contracted customers of BiDCOMP/Parity Competitive Bidding System. If you do not have a contract with BiDCOMP, call (212) 849-5021 to become a customer. By submitting a bid for the Bonds, a prospective bidder represents and warrants to the County that such bidder’s bid for the purchase of the Bonds (if a bid is submitted in connection with the sale) is submitted for and on behalf of such prospective bidder by an officer or agent who is duly authorized to bind the prospective bidder to a legal, valid and enforceable contract for the purchase of the Bonds.
If any provisions of this Official Notice of Sale shall conflict with information provided by BiDCOMP/Parity as approved provider of electronic bidding services, this Official Notice of Sale shall control. Further information about BiDCOMP/Parity, including any fee charged, may be obtained from BiDCOMP/Parity at (212) 849-5021.
Disclaimer
Each prospective bidder shall be solely responsible to register to bid via BiDCOMP/Parity. Each qualified prospective bidder shall be solely responsible to make necessary arrangements to access BiDCOMP/Parity for purposes of submitting its bid in a timely manner and in compliance with the requirements of this Official Notice of Sale. Neither the County nor BiDCOMP/Parity shall have any duty or obligation to undertake such registration to bid for any prospective bidder or to provide or assure such access to any qualified prospective bidder, and neither the County nor BiDCOMP/Parity shall be responsible for a bidder’s failure to register to bid or for proper operation of, or have any liability for any delays or interruptions of, or any damages caused by BiDCOMP/Parity. The County is using BiDCOMP/Parity as a communication mechanism, and not as the County’s agent, to conduct the electronic bidding for the Bonds. The County is not bound by any advice and determination of BiDCOMP/Parity to the effect that any particular bid complies with the terms of this Official Notice of Sale and in particular the “Bid Specifications” hereinafter set forth. All costs and expenses incurred by prospective bidders in connection with their registration and submission of bids via BiDCOMP/Parity are the sole responsibility of the bidders; and the County is not responsible, directly or indirectly, for any such costs or expenses. If a prospective bidder encounters any difficulty in registering to bid or submitting, modifying or withdrawing a bid for the Bonds, it should telephone BiDCOMP/Parity and notify the County’s Financial Advisor, Public Resources Advisory Group, Inc., by facsimile at (212) 566-7816.
Bidding Procedures
Bids must be submitted for the purchase of the Bonds (all or none) via BiDCOMP/Parity. Bids will be communicated electronically to the County at 10:30 a.m., local Baltimore, Maryland time, on Tuesday, March 20, 2018. Prior to that time, a prospective bidder may input and save proposed terms of its bid in BiDCOMP. Once the final bid has been saved in BiDCOMP, the bidder may select the final bid button in BiDCOMP to submit the bid to BiDCOMP/Parity. Once the bids are communicated
B-4
electronically via BiDCOMP/Parity to the County, each bid will constitute an irrevocable offer to purchase the Bonds on the terms therein provided. For purposes of the bidding process, the time as maintained on BiDCOMP shall constitute the official time. For information purposes only, bidders are requested to state in their bids the true interest cost to the County, as described under “Award of Bonds” below, represented by the rate or rates of interest and the bid price specified in their respective bids.
No bids will be accepted in written form, by facsimile transmission or in any other medium or on any system other than by via BiDCOMP. No bid will be received after the time for receiving such bids specified above.
Good Faith Deposit
A good faith deposit in the amount of $2,636,550* (the “Deposit”) is required in connection with the sale and bid for the Bonds. The Deposit shall be provided for by a federal funds wire transfer to be submitted to the County by the successful bidder not later than 4:00 p.m. (local Baltimore, Maryland time) on the date of sale (the “Wire Transfer Deadline”) as set forth below. The Deposit of the successful bidder will be collected and the proceeds thereof retained by the County to be applied in partial payment for the Bonds and no interest will be allowed or paid upon the amount thereof, but in the event the successful bidder shall fail to comply with the terms of the respective bid, the proceeds thereof will be retained as and for full liquidated damages.
The County will distribute wiring instructions for the Deposit to the successful bidder upon verification of the bids submitted by the bidder and prior to the Wire Transfer Deadline. If the Deposit is not received by the Wire Transfer Deadline, the award of the sale of the Bonds to the successful bidder may be cancelled by the County in its discretion without any financial liability of the County to the successful bidder or any limitation whatsoever on the County’s right to sell the Bonds to a different purchaser upon such terms and conditions as the County shall deem appropriate.
Bid Specifications
Bidders shall state in their proposals a price for the Bonds that is not less than 100% of the aggregate par value of the Bonds. Bidders shall also state in their proposals the rate or rates of interest to be paid on all the Bonds, on which rate or rates their proposals are based and submitted. The rates so
named must be in multiples of 1/8 or 1
/20 of 1% and may not exceed 5.0% for any single maturity provided,
however, that the rate of interest on each series of Bonds maturing in the years 2028 to 2047 shall be 5% per annum. Each bidder must specify in its bid a single interest rate for each maturity of the Consolidated General Improvements Bonds and a single interest rate for each maturity of the Consolidated Water and Sewer Bonds. A zero rate cannot be named for any maturity. The minimum reoffering price of any single maturity shall not be less than 97% of par value of such maturity. Bidders may designate in their proposal two or more consecutive annual principal payments as a term bond, in either the Consolidated General Improvements Bonds or Consolidated Water and Sewer Bonds, which matures on the maturity date of the last annual principal payment of the sequence. Any term bond so designated shall be subject to mandatory sinking fund redemption in each year on the principal payment date and in the entire principal amount for each annual principal payment designated for inclusion in such term bond. There is no limitation on the number of term bonds in either the Consolidated General Improvements Bonds or Consolidated Water and Sewer Bonds.
∗ Preliminary, subject to change.
B-5
Procedures for Principal Amount Changes and Other Changes to Official Notice of Sale
The preliminary aggregate principal amount of the Bonds and the preliminary principal amount of each annual payment on the Bonds as set forth in this Official Notice of Sale (the “Preliminary Aggregate Principal Amount” and the “Preliminary Annual Principal Amount,” respectively; collectively the “Preliminary Amounts”) may be revised before the receipt and opening of the bids for their purchase. ANY SUCH REVISIONS (the “Revised Aggregate Principal Amount” and the “Revised Annual Principal Amount,” respectively; collectively, the “Revised Amounts”) WILL BE PUBLISHED ON THOMPSON MUNICIPAL MARKET MONITOR (“TM3”) (www.tm3.com) NOT LATER THAN 9:30 A.M. (LOCAL BALTIMORE, MARYLAND TIME) ON THE ANNOUNCED DATE FOR RECEIPT OF BIDS. In the event that no such revisions are made, the Preliminary Amounts will constitute the Revised Amounts. Bidders shall submit bids based on the Revised Amounts and the Revised Amounts will be used to compare bids and select a winning bidder.
Award of Bonds
As promptly as reasonably possible after the bids are received, the Designated Officer will notify the bidder to whom the Bonds will be awarded, if and when such award is made, and such bidder, upon such notice, shall advise the Designated Officer of the initial offering prices to the public of each maturity of each series of the Bonds (the “Initial Offering Prices”). Such Initial Offering Prices, among other things, will be used by the County to calculate the final aggregate principal amount of the Bonds and the final principal amount of each annual payment on the Bonds (the “Final Aggregate Principal Amount” and the “Final Annual Principal Amount,” respectively; collectively, the “Final Amounts”). In determining the Final Amounts, the County expects that the Revised Amounts will be changed as necessary to effect the greatest economic advantage, or to accommodate other objectives of the County, but the County will not reduce or increase the Revised Aggregate Principal Amount by more than 10% from the amount bid upon. THE SUCCESSFUL BIDDER MAY NOT WITHDRAW ITS BID OR CHANGE THE INTEREST RATES BID OR THE INITIAL REOFFERING PRICES AS A RESULT OF ANY CHANGES MADE TO THE REVISED AMOUNTS WITHIN THESE LIMITS. The dollar amount bid by the successful bidder will be adjusted to reflect any adjustments in the aggregate principal amount of the Bonds. Such adjusted bid price will reflect changes in the dollar amount of the underwriter’s discount and original issue discount/premium, if any, but will not change the underwriter’s discount per $1,000 of par amount of bonds from the underwriter’s discount that would have been received based on the purchase price in the winning bid and the initial public offering prices. The interest rates specified by the successful bidder for each maturity of each series in its bid for the Bonds will not change. ALL BIDS SHALL REMAIN FIRM FOR FIVE (5) HOURS AFTER THE TIME SPECIFIED FOR THE OPENING OF THE BIDS. An award of the Bonds, if made, will be made by the Designated Officer within such five (5) hour period of time. The Final Amounts will be communicated to the successful bidder as soon as possible, but not later than 3:00 p.m. the day after awarding the Bonds.
The award, if made, will be made as promptly as possible after the bids are opened to the bidder naming the lowest true interest cost for all the Bonds in any legally acceptable proposal. The lowest true interest cost will be determined with respect to each proposal by doubling the semiannual interest rate, compounded semiannually, necessary to discount the debt service payments to the date of the Bonds and to the price bid. Each bidder shall include in its bid a statement of the true interest cost offered in its bid, but this statement shall not be deemed to be part of the bid. Where the proposals of two or more bidders result in the same lowest true interest cost, the Bonds may be apportioned between such bidders, but if this shall not be acceptable to the County, the Designated Officer shall have the right to award all of such bonds to one bidder. THE RIGHT IS RESERVED TO THE DESIGNATED OFFICER TO REJECT ANY OR ALL PROPOSALS AND TO WAIVE ANY IRREGULARITIES IN ANY OF THE PROPOSALS. The judgment of the Designated Officer shall be final and binding upon all bidders
B-6
with respect to the form and adequacy of any proposal received and as to its conformity to the terms of this Official Notice of Sale.
Issue Price Determination
The County expects and intends that the bid for the Bonds will satisfy the federal tax requirements for a qualified competitive sale of bonds, including, among other things, receipt of bids for the Bonds from at least three underwriters, who have established industry reputations for underwriting new issuances of municipal bonds (a “Qualified Competitive Bid”). The Designated Officer, will advise the successful bidder as promptly as possible after the bids are opened whether the bid constitutes a Qualified Competitive Bid, or, in the alternative, a bid that fails to satisfy such requirements (a “Nonqualified Competitive Bid”).
If the bid is a Qualified Competitive Bid, as promptly as possible after the bids are opened, the Designated Officer, will notify the successful bidder, and such bidder, upon such notice, shall advise the Designated Officer, of the reasonably expected Initial Offering Price, as applicable, of each maturity of each series of the Bonds. In addition, the winning bidder shall be required to provide to the County information to establish the initial expected offering prices for each maturity of each series of the Bonds for federal income tax purposes by completing a certificate acceptable to Bond Counsel to the County, on or before the date of issuance of the Bonds, substantially in the form set forth in Appendix E to the Preliminary Official Statement, with appropriate completions, amendments and attachments.
If the bid is a Nonqualified Competitive Bid, as promptly as possible after the bids are opened,
the Designated Officer, will notify the successful bidder, and such bidder, upon such notice, shall advise the Designated Officer, of the initial sale price or Initial Offering Price, as applicable, of each maturity of each series of the Bonds. In addition, the winning bidder shall be required to provide to the County information and assurances to establish the initial sale price or the initial offering price to the public, as applicable, for each maturity of each series of the Bonds for federal income tax purposes by completing a certification acceptable to Bond Counsel in substantially the form set forth in Appendix F to the Preliminary Official Statement, with appropriate completions, omissions and attachments. It is noted that procedures for a Nonqualified Competitive Bid may require the winning bidder and, if applicable, other underwriters of the Bonds, to hold the initial offering prices for certain maturities of a series of the Bonds for up to five business days after the sale date, as further specified in the form of such certification.
Legal Opinions
The Bonds of each series described above will be issued and sold subject to approval as to legality by McKennon Shelton & Henn LLP of Baltimore, Maryland, Bond Counsel. Copies of the approving opinions of McKennon Shelton & Henn LLP will be delivered, upon request, to the purchaser or purchasers of the Bonds, without charge. Such opinions shall be substantially in the form included in Appendix C to the Preliminary Official Statement referred to below.
Continuing Disclosure
In order to assist bidder in complying with SEC Rule 15c2-12(b)(5), the County will execute and deliver a continuing disclosure agreement on or before the date of issuance of the Bonds pursuant to which it will undertake to provide or cause to be provided certain information annually and notices of certain events. A form of this agreement is set forth in the Preliminary Official Statement and will also be set forth in the Official Statement.
B-7
Delivery of the Bonds
When delivered, one bond representing each maturity of each series of bonds shall be duly executed and authenticated and registered in the name of Cede & Co., as nominee of DTC, as registered owner of bonds.
CUSIP identification numbers will be applied for by the successful bidder with respect to the Bonds, but the County will assume no obligation for the assignment or printing of such numbers on the Bonds or the correctness of such numbers, and neither the failure to print such numbers on any Bond nor any error with respect thereto shall constitute cause for a failure or refusal by the successful bidder to accept delivery of and pay for the Bonds in accordance with the terms of this Official Notice of Sale. THE CONSOLIDATED GENERAL IMPROVEMENTS BONDS AND THE CONSOLIDATED WATER AND SEWER BONDS WILL REQUIRE A SEPARATE SERIES OF CUSIP NUMBERS.
Not later than seven business days after the date of sale, the County will deliver to the successful bidder an Official Statement, which is expected to be substantially in the form of the Preliminary Official Statement referred to below. If so requested by the purchaser or purchasers at or before the close of business on the date of the sale, the County will include in the Official Statement such pricing and other information with respect to the terms of the reoffering of the Bonds by the successful bidder (“Reoffering Information”), if any, as may be specified and furnished in writing by such bidder. If no Reoffering Information is specified and furnished by the successful bidder, the Official Statement will include the interest rates on the Bonds resulting from the bid of the successful bidder and the other statements with respect to reoffering contained in the Preliminary Official Statement. The successful bidder shall be responsible to the County and its officials for the Reoffering Information, and for all decisions made by such bidder with respect to the use or omission of the Reoffering Information in any reoffering of the Bonds, including the presentation or exclusion of any Reoffering Information in any documents, including the Official Statement. The successful bidder will also be furnished, without cost, with copies of the Official Statement (and any amendments or supplements thereto) in such quantities as shall reasonably be requested by the successful bidder to allow the successful bidder to comply with the application rules of the Municipal Securities Rulemaking Board.
Delivery of the Bonds, without expense, will be made by the Designated Officer to DTC on or about March 29, 2018, or as soon as practicable thereafter, and, thereupon, the purchaser or purchasers will be required to accept delivery of the Bonds purchased and pay, in Federal funds, the balance of the purchase price due. Such bonds will be accompanied by the customary closing documents, including a no-litigation certificate, effective as of the date of delivery, stating that there is no litigation pending affecting the validity of the bonds in this issue. It shall be a condition to the obligation of such purchaser or purchasers to accept delivery of and pay for the bonds that, simultaneously with or before delivery and payment for the bonds, such purchaser or purchasers shall be furnished a certificate or certificates of authorized officers of the County to the effect that, to the best of their knowledge and belief, the Official Statement and any amendment or supplement thereto (except for the Reoffering Information provided by the purchaser and information regarding DTC and DTC’s book-entry system provided by DTC, as to which no view will be expressed), as of the date of sale and as of the date of delivery of the bonds, does not contain any untrue statement of a material fact and does not omit to state a material fact necessary to make the statements therein, in light of the circumstances under which they were made, not misleading, and that between the date of sale and the date of delivery of the bonds there has been no material adverse change in the financial position or revenues of the County, except as reflected or contemplated in the Official Statement.
Postponement of Sale
The County reserves the right to postpone the date established for the receipt of bids at any time before the bids are open. In the event of a postponement, the new date and time of sale will be announced
B-8
on TM3. Prospective bidders may request notification by facsimile transmission of any such changes in the date or time for the receipt of bids by so advising, and furnishing their telecopier numbers to Public Resources Advisory Group, Inc. at (212) 566-7800 by 12 Noon, Baltimore, Maryland time, on the day prior to the announced date for receipt of bids. Any new date and time of sale will be announced at least 24 hours prior to the time proposals are to be submitted. On any such alternative sale date, bidders may submit bids for the purchase of the Bonds in conformity with the provisions of this Official Notice of Sale, except for any changes to this Official Notice of Sale, the change of the date of sale and the changes described in the next sentence. If the date fixed for receipt of bids is postponed, the expected date of delivery of Bonds also may be postponed; if the sale is postponed to a later date, then the date of the Bonds, the dates of the semiannual interest payments and annual principal payments, and the optional redemption dates also may be changed. Such changes, if any, will be announced via TM3 at the time any alternative sale date is announced.
The Preliminary Official Statement, together with this Official Notice of Sale, may be obtained
from the Office of Finance, Anne Arundel County, Arundel Center, 44 Calvert Street, Annapolis, Maryland 21404 (410-222-1781) or from the County’s financial advisor, Public Resources Advisory Group, Inc., 39 Broadway, 12th Floor, New York, New York 10006 (212-566-7800). Such Preliminary Official Statement is deemed final by the County as of its date for purposes of SEC Rule 15c2-12, but is subject to revision, amendment and completion in the Official Statement referred to above.
ANNE ARUNDEL COUNTY, MARYLAND By: Steven R. Schuh
County Executive
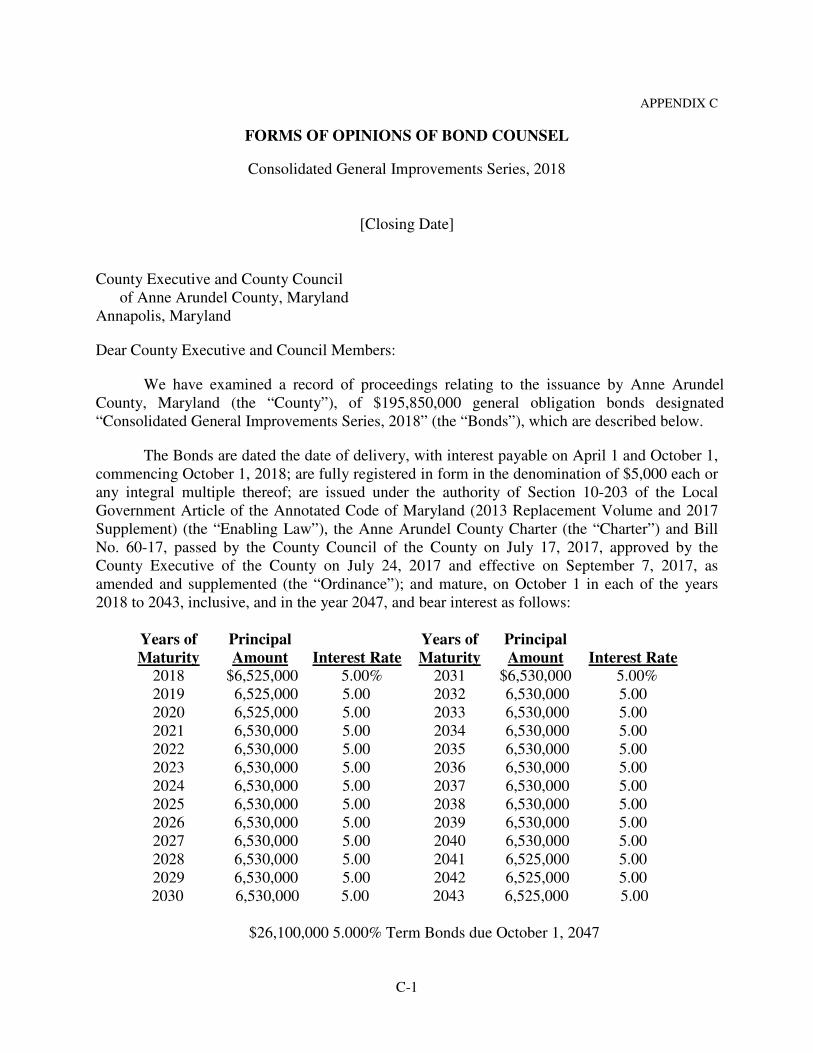
C-1
APPENDIX C
FORMS OF OPINIONS OF BOND COUNSEL
Consolidated General Improvements Series, 2018
[Closing Date]
County Executive and County Council of Anne Arundel County, Maryland Annapolis, Maryland
Dear County Executive and Council Members:
We have examined a record of proceedings relating to the issuance by Anne Arundel County, Maryland (the “County”), of $195,850,000 general obligation bonds designated “Consolidated General Improvements Series, 2018” (the “Bonds”), which are described below.
The Bonds are dated the date of delivery, with interest payable on April 1 and October 1, commencing October 1, 2018; are fully registered in form in the denomination of $5,000 each or any integral multiple thereof; are issued under the authority of Section 10-203 of the Local Government Article of the Annotated Code of Maryland (2013 Replacement Volume and 2017 Supplement) (the “Enabling Law”), the Anne Arundel County Charter (the “Charter”) and Bill No. 60-17, passed by the County Council of the County on July 17, 2017, approved by the County Executive of the County on July 24, 2017 and effective on September 7, 2017, as amended and supplemented (the “Ordinance”); and mature, on October 1 in each of the years 2018 to 2043, inclusive, and in the year 2047, and bear interest as follows:
Years of Maturity
Principal Amount
Interest Rate
Years of Maturity
Principal Amount
Interest Rate 2018 $6,525,000 5.00% 2031 $6,530,000 5.00% 2019 6,525,000 5.00 2032 6,530,000 5.00 2020 6,525,000 5.00 2033 6,530,000 5.00 2021 6,530,000 5.00 2034 6,530,000 5.00 2022 6,530,000 5.00 2035 6,530,000 5.00 2023 6,530,000 5.00 2036 6,530,000 5.00 2024 6,530,000 5.00 2037 6,530,000 5.00 2025 6,530,000 5.00 2038 6,530,000 5.00 2026 6,530,000 5.00 2039 6,530,000 5.00 2027 6,530,000 5.00 2040 6,530,000 5.00 2028 6,530,000 5.00 2041 6,525,000 5.00 2029 6,530,000 5.00 2042 6,525,000 5.00
2030 6,530,000 5.00 2043 6,525,000 5.00 $26,100,000 5.000% Term Bonds due October 1, 2047
C-2
The Bonds are subject to redemption in the manner and upon the terms and conditions set forth in the Bonds. The Term Bonds maturing on October 1, 2047 are subject to mandatory sinking fund redemption as set forth in the Bonds.
In rendering this opinion, we have relied without investigation on the County’s Tax and Section 148 Certificate dated this date made on behalf of the County by officers thereof with respect to certain material facts within the knowledge of the County relevant to the tax-exempt status of interest on the Bonds.
With respect to the executed and authenticated bond of the issue of Bonds that we have examined, and Bonds similarly executed and authenticated and identical thereto in form except for numbers, interest rates, denominations, maturities, and under existing statutes, regulations and decisions, we are of the opinion that:
(a) The County is a validly created and existing body politic and corporate of the State of Maryland, possessing authority under the Enabling Law, the Charter and the Ordinance to issue the Bonds.
(b) The Bonds are valid and legally binding general obligations of the County to which its full faith and credit and taxing power are pledged, and for the payment of which the County is empowered and directed to levy ad valorem taxes upon all real and tangible personal property and certain intangible personal property subject to assessment for County taxation; such tax levy is subject, however, to the limitation set forth in Section 710(d) of the Charter which provides, in part, that “[f]rom and after July 1, 1993, revenues derived from taxes on properties existing on the County property tax rolls at the commencement of the County fiscal year shall not increase, compared with the previous year, more than the Consumer Price Index percentage of change, or by 4.5 percent, whichever is the lesser.”
(c) To provide for the payment of the principal of and interest on the Bonds, the County, by the adoption of the Ordinance, has covenanted, subject to said Section 710(d) limitation, to levy such ad valorem taxes in rate and amount sufficient for that purpose in each fiscal year in which provision must be made for the payment of such principal and interest.
(d) The Bonds, their transfer, the interest payable on them and any income derived from them, including any profit realized from their sale and exchange, shall be exempt from taxation of any kind by the State of Maryland, any of its political subdivisions, or any other public entity; no opinion is expressed as to estate or inheritance taxes, or any other taxes not levied or assessed directly on the Bonds or the interest thereon.
(e) Assuming compliance with certain covenants described herein, interest on the Bonds is excludable from gross income for federal income tax purposes. It is noted that under the provisions of the Internal Revenue Code of 1986, as amended (the “Code”), there are certain restrictions that must be met subsequent to the delivery of the Bonds, including restrictions that must be complied with throughout the term of the bonds of the issue of bonds of which the Bonds are a part, in order that the interest thereon be excludable from gross income. These include (i) a requirement that certain investment earnings received from the investment of the proceeds of the bonds of the issue of bonds of which the Bonds are a part be rebated (or that certain payments in lieu of rebate be made) to the United States of America under certain
C-3
circumstances; (ii) other requirements applicable to the investment of the proceeds of the bonds of the issue of bonds of which the Bonds are a part; and (iii) requirements applicable to the use of the proceeds of the bonds of the issue of bonds of which the Bonds are part and the use of the facilities financed or refinanced with such proceeds. Failure to comply with one or more of these requirements could result in the inclusion of the interest payable on the Bonds in gross income for federal income tax purposes, effective from the date of their issuance. The County has covenanted to regulate the investment of the proceeds of the bonds of the issue of bonds of which the Bonds are a part and to take such other actions as may be required to maintain the excludability of interest on the Bonds from gross income for federal income tax purposes. It is our opinion that, assuming compliance with such covenants, the interest on the Bonds will remain excludable from gross income for federal income tax purposes under the provisions of the Code.
(f) Interest on the Bonds is not includable in the alternative minimum taxable income of individuals as an enumerated item of tax preference or other specific adjustment. Interest income on the Bonds will be includable in the applicable taxable base for the purpose of determining the branch profits tax imposed by the Code on certain foreign corporations engaged in a trade or business in the United States.
The opinion expressed above is limited to the matters set forth above, and no other opinions should be inferred beyond the matters expressly stated. We assume no obligation to supplement this opinion if any applicable laws or interpretations thereof change after the date hereof or if we become aware of any facts or circumstances that might change the opinions expressed herein after the date hereof.
Very truly yours,
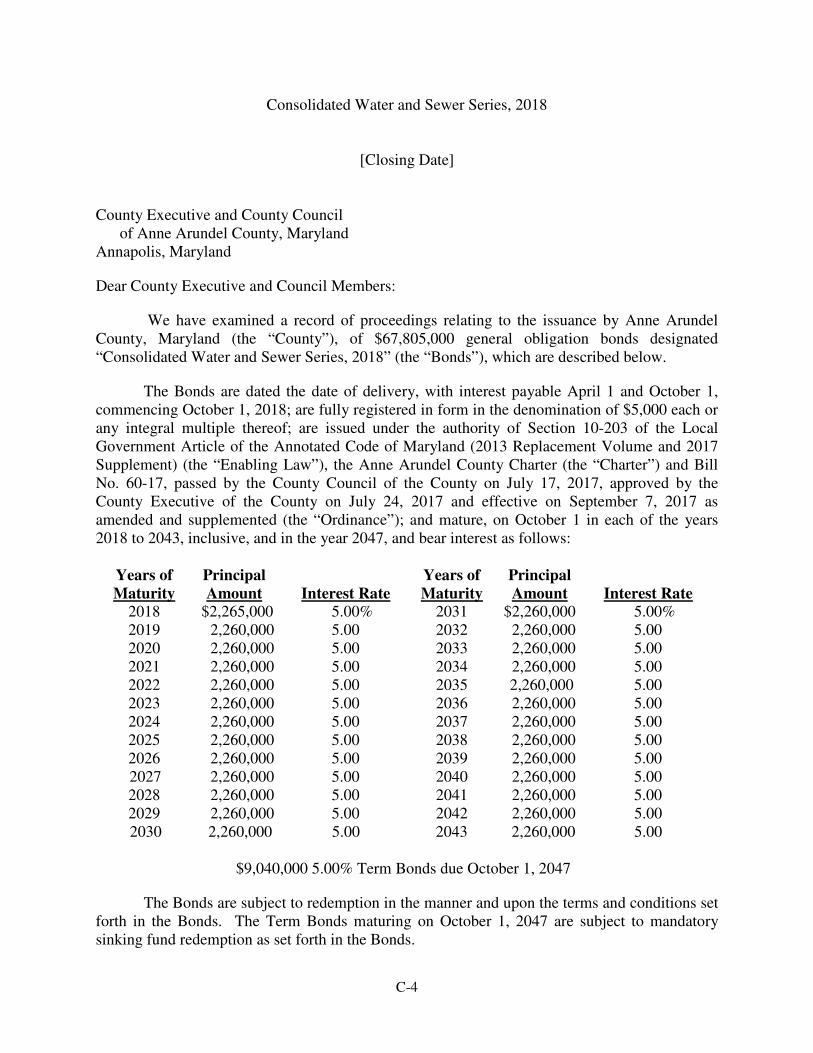
C-4
Consolidated Water and Sewer Series, 2018
[Closing Date]
County Executive and County Council of Anne Arundel County, Maryland Annapolis, Maryland
Dear County Executive and Council Members:
We have examined a record of proceedings relating to the issuance by Anne Arundel County, Maryland (the “County”), of $67,805,000 general obligation bonds designated “Consolidated Water and Sewer Series, 2018” (the “Bonds”), which are described below.
The Bonds are dated the date of delivery, with interest payable April 1 and October 1, commencing October 1, 2018; are fully registered in form in the denomination of $5,000 each or any integral multiple thereof; are issued under the authority of Section 10-203 of the Local Government Article of the Annotated Code of Maryland (2013 Replacement Volume and 2017 Supplement) (the “Enabling Law”), the Anne Arundel County Charter (the “Charter”) and Bill No. 60-17, passed by the County Council of the County on July 17, 2017, approved by the County Executive of the County on July 24, 2017 and effective on September 7, 2017 as amended and supplemented (the “Ordinance”); and mature, on October 1 in each of the years 2018 to 2043, inclusive, and in the year 2047, and bear interest as follows:
Years of Maturity
Principal Amount
Interest Rate
Years of Maturity
Principal Amount
Interest Rate 2018 $2,265,000 5.00% 2031 $2,260,000 5.00% 2019 2,260,000 5.00 2032 2,260,000 5.00 2020 2,260,000 5.00 2033 2,260,000 5.00 2021 2,260,000 5.00 2034 2,260,000 5.00 2022 2,260,000 5.00 2035 2,260,000 5.00 2023 2,260,000 5.00 2036 2,260,000 5.00 2024 2,260,000 5.00 2037 2,260,000 5.00 2025 2,260,000 5.00 2038 2,260,000 5.00 2026 2,260,000 5.00 2039 2,260,000 5.00
2027 2,260,000 5.00 2040 2,260,000 5.00 2028 2,260,000 5.00 2041 2,260,000 5.00 2029 2,260,000 5.00 2042 2,260,000 5.00 2030 2,260,000 5.00 2043 2,260,000 5.00
$9,040,000 5.00% Term Bonds due October 1, 2047
The Bonds are subject to redemption in the manner and upon the terms and conditions set forth in the Bonds. The Term Bonds maturing on October 1, 2047 are subject to mandatory sinking fund redemption as set forth in the Bonds.
C-5
In rendering this opinion, we have relied without investigation on the County’s Tax and Section 148 Certificate dated this date made on behalf of the County by officers thereof with respect to certain material facts within the knowledge of the County relevant to the tax-exempt status of interest on the Bonds.
With respect to the executed and authenticated bond of the issue of Bonds that we have examined, and Bonds similarly executed and authenticated and identical thereto in form except for numbers, interest rates, denominations, maturities, and under existing statutes, regulations and decisions, we are of the opinion that:
(a) The County is a validly created and existing body politic and corporate of the State of Maryland, possessing authority under the Enabling Law, the Charter and the Ordinance to issue the Bonds.
(b) The Bonds are valid and legally binding general obligations of the County to which its full faith and credit and taxing power are pledged, payable primarily from the net revenues and receipts of certain of its water and wastewater projects, or utilities of which they form a part, but if not so paid, are payable as to both principal and interest ultimately from ad valorem taxes, which the County is empowered to levy upon all real and tangible personal property and certain intangible personal property subject to assessment for County taxation; such tax levy is subject, however, to the limitation set forth in Section 710(d) of the Charter which provides, in part, that “[f]rom and after July 1, 1993, revenues derived from taxes on properties existing on the County property tax rolls at the commencement of the County fiscal year shall not increase, compared with the previous year, more than the Consumer Price Index percentage of change, or by 4.5 percent, whichever is the lesser.”
(c) To provide for the payment of the principal of and interest on the Bonds, the County, by the adoption of the Ordinance, has covenanted, subject to the above-described Section 710(d) limitation, to levy such ad valorem taxes in rate and amount sufficient for that purpose in each fiscal year in which provision must be made for the payment of such principal and interest.
(d) The Bonds, their transfer, the interest payable on them and any income derived from them, including any profit realized from their sale and exchange, shall be exempt from taxation of any kind by the State of Maryland any of its political subdivisions, or any other public entity; no opinion is expressed as to estate or inheritance taxes, or any other taxes not levied or assessed directly on the Bonds or the interest thereon.
(e) Assuming compliance with certain covenants described herein, interest on the Bonds is excludable from gross income for federal income tax purposes. It is noted that under the provisions of the Internal Revenue Code of 1986, as amended (the “Code”), there are certain restrictions that must be met subsequent to the delivery of the Bonds, including restrictions that must be complied with throughout the term of the bonds of the issue of bonds of which the Bonds are a part, in order that the interest thereon be excludable from gross income. These include (i) a requirement that certain investment earnings received from the investment of the proceeds of the bonds of the issue of bonds of which the Bonds are a part be rebated (or that certain payments in lieu of rebate be made) to the United States of America under certain circumstances; (ii) other requirements applicable to the investment of the proceeds of the bonds of the issue of bonds of which the Bonds are a part; and (iii) requirements applicable to the use
C-6
of the proceeds of the bonds of the issue of bonds of which the Bonds are part and the use of the facilities financed or refinanced with such proceeds. Failure to comply with one or more of these requirements could result in the inclusion of the interest payable on the Bonds in gross income for federal income tax purposes, effective from the date of their issuance. The County has covenanted to regulate the investment of the proceeds of the bonds of the issue of bonds of which the Bonds are a part and to take such other actions as may be required to maintain the excludability of interest on the Bonds from gross income for federal income tax purposes. It is our opinion that, assuming compliance with such covenants, the interest on the Bonds will remain excludable from gross income for federal income tax purposes under the provisions of the Code.
(f) Interest on the Bonds is not includable in the alternative minimum taxable income of individuals as an enumerated item of tax preference or other specific adjustment. Interest income on the Bonds will be includable in the applicable taxable base for the purpose of determining the branch profits tax imposed by the Code on certain foreign corporations engaged in a trade or business in the United States.
The opinion expressed above is limited to the matters set forth above, and no other opinions should be inferred beyond the matter expressly stated. We assume no obligation to supplement this opinion if any applicable laws or interpretations thereof change after the date hereof or if we become aware of any facts or circumstances that might change the opinions expressed herein after the date hereof.
Very truly yours,
D-1
APPENDIX D
FORM OF CONTINUING DISCLOSURE AGREEMENT
This CONTINUING DISCLOSURE AGREEMENT (this “Disclosure Agreement”) is executed and delivered by Anne Arundel County, Maryland, a body corporate and politic of the State of Maryland (the “County”) in connection with the issuance of its $195,850,000 Consolidated General Improvements Series, 2018 and its $67,805,000 Consolidated Water and Sewer Series, 2018. The Bonds are being issued pursuant to Bill No. 60-17, passed by the County Council of the County on July 17, 2017, approved by the County Executive of the County on July 24, 2017 and effective on September 7, 2017, as amended. The County, intending to be legally bound hereby and in consideration of good and valuable consideration, the receipt and sufficiency of which is hereby acknowledged, does hereby covenant and agree as follows: Section 1. Purpose of the Disclosure Agreement.
This Disclosure Agreement is being executed and delivered by the County for the benefit of the beneficial owners of the Bonds and in order to assist the Participating Underwriter in complying with Securities and Exchange Commission Rule 15c2-12(b)(5). Section 2. Definitions.
In addition to the definitions set forth above, which apply to any capitalized term used in this Disclosure Agreement unless otherwise defined in this Section, the following capitalized terms shall have the following meanings:
“EMMA” shall mean the Electronic Municipal Market Access system described in 1934 Act Release No. 59062 and maintained by the MSRB for purposes of the rule.
“Listed Events” shall mean any of the events listed in Section 4(a) herein.
“MSRB” shall mean the Municipal Securities Rulemaking Board established pursuant to Section 15B(b)1 of the Securities Exchange Act of 1934, as amended.
“Participating Underwriter” shall mean any of the original underwriters of the Bonds required to comply with the Rule in connection with offering of the Bonds.
“Rule” shall mean Rule 15c2-12(b)(5) adopted by the Securities and Exchange Commission under the Securities Exchange Act of 1934, as the same may be amended from time to time.
D-2
Section 3. Provision of Annual Financial Information, Operating Data and Audited Information.
(a) The County shall provide to the MSRB in an electronic format prescribed by the MSRB annual financial information and operating data regarding (i) revenues, expenditures and changes in fund balance for the County’s General Fund, (ii) revenues, expenses and changes in fund net assets for the County’s Water and Wastewater Operations Fund, (iii) revenues, expenses and net assets for the County’s Water and Wastewater Debt Service Fund, (iv) revenues, expenses and changes in net assets for the County’s Solid Waste Fund, (v) assessed values of taxable property in the County and County property tax rates and property tax levies, (vi) County Water and Wastewater utility system rates and (vii) the County solid waste system rate schedule, such information to be made available within 275 days after the end of the County’s fiscal year (commencing with the fiscal year ended June 30, 2018).
(b) The County shall provide to the MSRB in an electronic format prescribed by the MSRB annual audited financial statements for the County, such information to be made available within 275 days after the end of the County’s fiscal year, unless the audited financial statements are not available on or before such date, in which event said financial statements will be provided promptly when and if available. In the event that audited financial statements are not available within 275 days after the end of the County’s fiscal year, the County will provide unaudited financial statements within said time period (commencing with the fiscal year ended June 30, 2018).
(c) The presentation of the financial information referred to in clauses (i), (ii), (iii) and (iv) of paragraph (a) and in paragraph (b) shall be made in accordance with the same accounting principles as utilized in connection with the presentation of applicable comparable financial information included in the final official statement for the Bonds, provided that the County may modify the accounting principles utilized in the presentation of financial information by amending this Disclosure Agreement pursuant to the provisions of Section 6 hereof. Changes in Generally Accepted Accounting Principles, where applicable to financial information to be provided by the County, shall not require the County to amend this Disclosure Agreement.
(d) If the County is unable to provide the annual financial information and operating data within the applicable time periods specified in (a) and (b) above, the County shall send in a timely manner a notice of such failure to the MSRB. Section 4. Reporting of Significant Events.
(a) Pursuant to the provisions of this Section 4, the County shall provide notice of the occurrence of any of the following events with respect to the Bonds:
(1) principal and interest payment delinquencies;
(2) non-payment related defaults, if material;
(3) unscheduled draws on debt service reserves reflecting financial difficulties;
D-3
(4) unscheduled draws on credit enhancements reflecting financial difficulties;
(5) substitution of credit or liquidity providers, or their failure to perform;
(6) adverse tax opinions, the issuance by the Internal Revenue Service of proposed or final determinations of taxability, Notice of Proposed Issue (IRS Form 5701-TEB) or other material notices or determinations with respect to the tax status of the Bonds, or other material events affecting the tax status of the Bonds;
(7) modifications to rights of Bondholders, if material;
(8) bond calls, if material, and tender offers;
(9) defeasances;
(10) release, substitution or sale of property securing repayment of the Bonds, if material;
(11) rating changes;
(12) bankruptcy, insolvency, receivership or similar event of the County;
(13) consummation of a merger, consolidation, or acquisition involving the County or the sale of all or substantially all of the assets of the County, other than in the ordinary course of business, the entry into a definitive agreement to undertake such an action or the termination of a definitive agreement relating to any such actions, other than pursuant to its terms, if material; and
(14) appointment of a successor or additional trustee or the change of name of a trustee, if material.
(b) In a timely manner, not in excess of 10 business days after the occurrence of an event listed in Section 4(a), the County shall file a notice of such occurrence of such event with EMMA. Section 5. Termination of Reporting Obligation.
The County’s obligations under this Disclosure Agreement shall terminate upon the payment in full of all of the Bonds either at their maturity or by early redemption. In addition, the County may terminate its obligations under this Disclosure Agreement if and when the County no longer remains an obligated person with respect to the Bonds within the meaning of the Rule.
D-4
Section 6. Amendment.
The County may provide further or additional assurances that will become part of the County’s obligations under this Disclosure Agreement. In addition, this Disclosure Agreement may be amended by the County in its discretion provided that (i) the amendment may only be made in connection with a change in circumstances that arises from a change in legal requirements, change in law, or change in the identity, nature, or status of the County as the obligated person with respect to the Bonds, or type of business conducted, (ii) this Disclosure Agreement, as amended, would have complied with the requirements of the Rule at the time of the issuance of the Bonds, after taking into account any amendments or interpretations of the Rule, as well as any change in circumstances, as determined by counsel selected by the County that is expert in federal securities law matters and (iii) the amendment does not materially impair the interests of holders of the Bonds, as determined either by counsel selected by the County that is expert in federal securities law matters, or by an approving vote of the holders of 25% of the outstanding aggregate principal amount of Bonds. The reasons for the County agreeing to provide any further or additional assurances or for any amendment and the impact of the change in the type of operating data or financial information being provided will be explained in information provided with the annual financial information containing the additional or amended operating data or financial information. Section 7. Additional Information.
Nothing in this Disclosure Agreement shall be deemed to prevent the County from disseminating any other information, using the means of dissemination set forth in this Disclosure Agreement or any other means of communication, or including any other information in any disclosure made pursuant to Section 4(a) or (b) hereof or notice of occurrence of a Listed Event in addition to that which is required by this Disclosure Agreement. If the County chooses to include any information in any disclosure made pursuant to Section 4(a) or (b) hereof or notice of occurrence of a Listed Event in addition to that which is specifically required by this Disclosure Agreement, the County shall have no obligation under this Disclosure Agreement to update such information or include it in any future disclosure made pursuant to Section 4(a) or (b) hereof or notice of occurrence of a Listed Event. Section 8. Law of Maryland.
This Disclosure Agreement, and any claim made with respect to the performance by the County of its obligations hereunder, shall be governed by, subject to, and construed according to the laws of the State of Maryland. Section 9. Limitation of Forum.
Any suit or other proceeding seeking redress with regard to any claimed failure by the County to perform its obligations under this Disclosure Agreement must be filed in the Circuit Court for Anne Arundel County, Maryland.
D-5
Section 10. Limitation on Remedies.
The County shall be given written notice at the address set forth below of any claimed failure by the County to perform its obligations under this Disclosure Agreement, and the County shall be given 15 days to remedy any such claimed failure. Any suit or other proceeding seeking further redress with regard to any such claimed failure by the County shall be limited to specific performance as the adequate and exclusive remedy available in connection with such action. Written notice to the County shall be given to the Office of Finance, Arundel Center, P.O. Box 2700, Annapolis, Maryland 21404, or at such alternate address as shall be specified by the County with disclosures made pursuant to Section 4(a) or (b) hereof or a notice of occurrence of a Listed Event. Section 11. Relationship to Bonds.
This Disclosure Agreement constitutes an undertaking by the County that is independent of the County’s obligations with respect to the Bonds; any breach or default by the County under this Disclosure Agreement shall not constitute or give rise to a breach or default under the Bonds. Section 12. Beneficiaries.
This Disclosure Agreement shall inure solely to the benefit of the beneficial owners from time to time of the Bonds, and shall create no rights in any other person or entity.
[Remainder of page intentionally left blank]
D-6
IN WITNESS WHEREOF this Continuing Disclosure Agreement is being executed on behalf of Anne Arundel County, Maryland and the seal of the County is being impressed hereon attested to by the Administrative Officer to the County Council, as of this ___ day of _____, 2018. (SEAL) ANNE ARUNDEL COUNTY, MARYLAND ATTEST: By_____________________________________ STEVEN R. SCHUH County Executive ______________________________ Administrative Officer to the County Council

E-1
APPENDIX E
FORM OF ISSUE PRICE CERTIFICATE FOR QUALIFIED COMPETITIVE BID
$263,655,000 GENERAL OBLIGATION BONDS
Consisting of
$195,850,000 Consolidated General Improvements Series, 2018 $67,805,000 Consolidated Water and Sewer Series, 2018
ISSUE PRICE CERTIFICATE
The undersigned, on behalf of [NAME OF WINNING BIDDER] (the “[SHORT FORM NAME OF WINNING BIDDER]”), hereby certifies as set forth below with respect to the sale of the above-captioned obligations (the “Bonds”).
1. Reasonably Expected Initial Offering Price.
(a) As of the Sale Date, the reasonably expected initial offering prices of each series of the Bonds to the Public by [SHORT FORM NAME OF WINNING BIDDER] are the prices listed in Schedule A (the “Expected Offering Prices”). The Expected Offering Prices are the prices for the Maturities of each series of the Bonds used by [SHORT FORM NAME OF WINNING BIDDER] in formulating its bid to purchase the Bonds. Attached as Schedule B is a true and correct copy of the bid provided by [SHORT FORM NAME OF WINNING BIDDER] to purchase the Bonds.
(b) [SHORT FORM NAME OF WINNING BIDDER] was not given the
opportunity to review other bids prior to submitting its bid.
(c) The bid submitted by [SHORT FORM NAME OF WINNING BIDDER] constituted a firm bid to purchase the Bonds.
2. Defined Terms.
(a) Issuer means Anne Arundel County, Maryland. (b) Maturity means Bonds of a series with the same credit and payment terms.
Bonds of a series with different maturity dates, or Bonds of a series with the same maturity date but different stated interest rates, are treated as separate Maturities.
(c) Public means any person (including an individual, trust, estate, partnership,
association, company or corporation) other than an Underwriter or a related party to an Underwriter. The term “related party” for purposes of this Certificate generally means any two or more persons who have greater than 50 percent common ownership, directly or indirectly.
(d) Sale Date means the first day on which there is a binding contract in writing for
the sale or exchange the Bonds. The Sale Date of the Bonds is Tuesday, March 20, 2018. (e) Underwriter means (i) any person that agrees pursuant to a written contract
with the Issuer (or with the lead underwriter to form an underwriting syndicate) to participate in the initial
E-2
sale of the Bonds to the Public, and (ii) any person that agrees pursuant to a written contract directly or indirectly with a person described in clause (i) of this paragraph to participate in the initial sale of the Bonds to the Public (including a member of a selling group or a party to a retail distribution agreement participating in the initial sale of the Bonds to the Public).
The undersigned understands that the foregoing information will be relied upon by the Issuer with respect to certain of the representations set forth in the Tax and Section 148 Certificate and with respect to compliance with the federal income tax rules affecting the Bonds, and by McKennon Shelton & Henn LLP, as Bond Counsel to the Issuer in connection with rendering its opinions that the interest on the Bonds is excluded from gross income for federal income tax purposes, the preparation of the Internal Revenue Service Form 8038-G, and other federal income tax advice that they may give to the Issuer from time to time relating to the Bonds.
[NAME OF WINNING BIDDER], By: ____________________________________ Title: __________________________________
Dated: ___________, 2018

E-3
SCHEDULE A Expected Initial Offering Prices of the Bonds
$___________ Consolidated General Improvements Series, 2018
[Insert]
$___________ Consolidated Water and Sewer Series, 2018 [Insert]

E-4
SCHEDULE B Copy of Bid
[See Attached]
F-1
APPENDIX F
FORM OF ISSUE PRICE CERTIFICATE FOR
NONQUALIFIED COMPETITIVE BID
$263,655,000 GENERAL OBLIGATION BONDS
Consisting of
$195,850,000 Consolidated General Improvements Series, 2018 $67,805,000 Consolidated Water and Sewer Series, 2018
ISSUE PRICE CERTIFICATE
The undersigned, on behalf of [NAME OF WINNING BIDDER] (the “[SHORT FORM NAME
OF WINNING BIDDER]”), [on behalf of itself and [NAMES OF MEMBERS OF THE UNDERWRITING SYNDICATE] (together, the “Underwriting Syndicate”),] hereby certifies as set forth below with respect to the sale and issuance of the above-captioned obligations (the “Bonds”).
1. Sale of the General Rule Maturities. As of the date of this Certificate, for each Maturity of the General Rule Maturities, the first price at which 10% of such Maturity was sold by [SHORT FORM NAME OF WINNING BIDDER] [THE UNDERWRITING SYNDICATE] to the Public is the respective price listed in Schedule A.
2. Initial Offering Price of the Hold-the-Offering-Price Maturities.
(a) [SHORT FORM NAME OF WINNING BIDDER] [THE MEMBERS OF THE UNDERWRITING SYNDICATE] offered the Hold-the-Offering Price Maturities to the Public for purchase at the respective initial offering prices listed in Schedule A (the “Initial Offering Prices”) on or before the Sale Date. A copy of the pricing wire or equivalent communication for the Bonds is attached to this Certificate as Schedule B.
(b) As set forth in the Notice of Sale and bid award, the [SHORT FORM NAME
OF WINNING BIDDER] [MEMBERS OF THE UNDERWRITING SYNDICATE] [has] [have] agreed in writing that, (i) for each Maturity of the Hold-the-Offering-Price Maturities, [it] [they] would neither offer nor sell any of the Bonds of such Maturity to any person at a price that is higher than the Initial Offering Price for such Maturity during the Holding Period for such Maturity (the “hold-the-offering-price rule”), and (ii) any selling group agreement shall contain the agreement of each dealer who is a member of the selling group, and any retail distribution agreement shall contain the agreement of each broker-dealer who is a party to the retail distribution agreement, to comply with the hold-the-offering-price rule. Pursuant to the foregoing, no Underwriter has offered or sold any Maturity of the Hold-the-Offering Price Maturities at a price that is higher than the respective Initial Offering Price for that Maturity of the Bonds during the Holding Period.
3. Defined Terms.
(a) General Rule Maturities means those Maturities of each series of the Bonds shown in Schedule A hereto as the “General Rule Maturities.”
(b) Hold-the-Offering-Price Maturities means those Maturities of each series of the
Bonds listed in Schedule A hereto as the “Hold-the-Offering-Price Maturities.”

F-2
(c) Holding Period means, with respect to a Hold-the-Offering-Price Maturity, the period starting on the Sale Date and ending on the earlier of (i) the close of the fifth business day after the Sale Date, or (ii) the date on which [SHORT FORM NAME OF WINNING BIDDER] [the UNDERWRITING SYNDICATE] [has] [have] sold at least 10% of such Hold-the-Offering-Price Maturity to the Public at prices that are no higher than the Initial Offering Price for such Hold-the-Offering-Price Maturity.
(d) Issuer means Anne Arundel County, Maryland.
(e) Maturity means Bonds of a series with the same credit and payment terms.
Bonds of a series with different maturity dates, or Bonds of a series with the same maturity date but different stated interest rates, are treated as separate Maturities.
(f) Public means any person (including an individual, trust, estate, partnership,
association, company, or corporation) other than an Underwriter or a related party to an Underwriter. The term “related party” for purposes of this Certificate generally means any two or more persons who have greater than 50 percent common ownership, directly or indirectly.
(g) Sale Date means the first day on which there is a binding contract in writing for
the sale of a Maturity of the Bonds. The Sale Date of the Bonds is Tuesday, March 20, 2018. (h) Underwriter means (i) any person that agrees pursuant to a written contract
with the Issuer (or with the lead underwriter to form an underwriting syndicate) to participate in the initial sale of the Bonds to the Public, and (ii) any person that agrees pursuant to a written contract directly or indirectly with a person described in clause (i) of this paragraph to participate in the initial sale of the Bonds to the Public (including a member of a selling group or a party to a retail distribution agreement participating in the initial sale of the Bonds to the Public).
The undersigned understands that the foregoing information will be relied upon by the Issuer with respect to certain of the representations set forth in the Tax and Section 148 Certificate and with respect to compliance with the federal income tax rules affecting the Bonds, and by McKennon Shelton & Henn LLP, as Bond Counsel to the Issuer, in connection with rendering its opinions that the interest on the Bonds is excluded from gross income for federal income tax purposes, the preparation of the Internal Revenue Service Form 8038-G, and other federal income tax advice that they may give to the Issuer from time to time relating to the Bonds.
[NAME OF WINNING BIDDER], as
[_______________]
By: _________________________
Title: ______________________
Dated: ___________, 2018
F-3
SCHEDULE A
Sale Prices of the General Rule Maturities
$___________ Consolidated General Improvements Series, 2018 [Insert]
$___________ Consolidated Water and Sewer Series, 2018
[Insert]
Initial Offering Prices of the Hold-The-Offering-Price Maturities
$___________ Consolidated General Improvements Series, 2018 [Insert]
$___________ Consolidated Water and Sewer Series, 2018 [Insert]

F-4
SCHEDULE B
Pricing Wire or Equivalent Communication
[See Attached]