Embed Size (px)
Citation preview
More Than Shipping
ANNUAL REPORT 2011NIPPON YUSEN KABUSHIKI KAISHA
AN
NU
AL R
EPOR
T 2011N
IPPON
YU
SEN K
AB
USH
IKI K
AISH
A
This report is printed using environmentally friendly printing methods. Waterless printing, which releases no hazardous liquids, has been adopted as a
means of safeguarding the environment. The report was printed using vegetable oil ink on FSC-certified paper, which includes ingredients from carefully managed forests.
3-2, Marunouchi 2-chome, Chiyoda-ku, Tokyo 100-0005, JapanTelephone: +81-3-3284-5151http://www.nyk.com
Printed in Japan
NIPPON YUSEN KABUSHIKI KAISHA
Contents
Cautionary Statement with Regard to Forward-looking Statements Some statements made in this annual re-port are forward-looking statements, which involve certain risks and uncertainties that could cause actual results to differ materi-ally from those projected. Readers are cau-tioned not to place undue reliance on these forward-looking statements, which are val-id only as of the date thereof. NYK under-takes no obligation to republish revised forward-looking statements to reflect events or circumstances after the date thereof or to reflect the occurrence of un-anticipated events.
2 Our Vision6 Our Business
10 Our Sustainability
About us
16 Consolidated Financial Highlights
14 Message from NYK’s Executive Officers
18 Special Feature: Grow with Asia, Expand across the Globe 20 A Review of Recent Medium-Term Management Plans 22 “More Than Shipping 2013 — Grow with Asia, Expand across the Globe” — Plan Overview 24 NYK Group president Yasumi Kudo shows the new medium-term management plan
— “More Than Shipping 2013” “ We will pursue value-added strategies exploiting our strengths in order to escape
competitive conditions that are becoming commoditized.” 36 The Strategic Pillars of “More Than Shipping 2013” 44 An On-Site Report from Asia
MAnAgeMent
45 Review of Operations 46 Market Data 48 Highlights by Segment 50 Global Logistics Business 56 Bulk Shipping Business 63 Other Business 64 Efforts to Support the Area Devastated by the Japan Earthquake and Tsunami
PerforMAnce
73 Corporate Governance 74 Interviews with Outside Directors 78 Corporate Governance 84 Directors, Auditors & Corporate Officers 86 Independent Directors
governAnce
65 Sustainability 66 Environment 68 Safety 70 Human Resources 72 Social Contribution Activities
sustAinAbility
87 Company Information
fAct dAtA
93 Financial Section
finAnciAl dAtA
1ANNUAL REPORT 2011
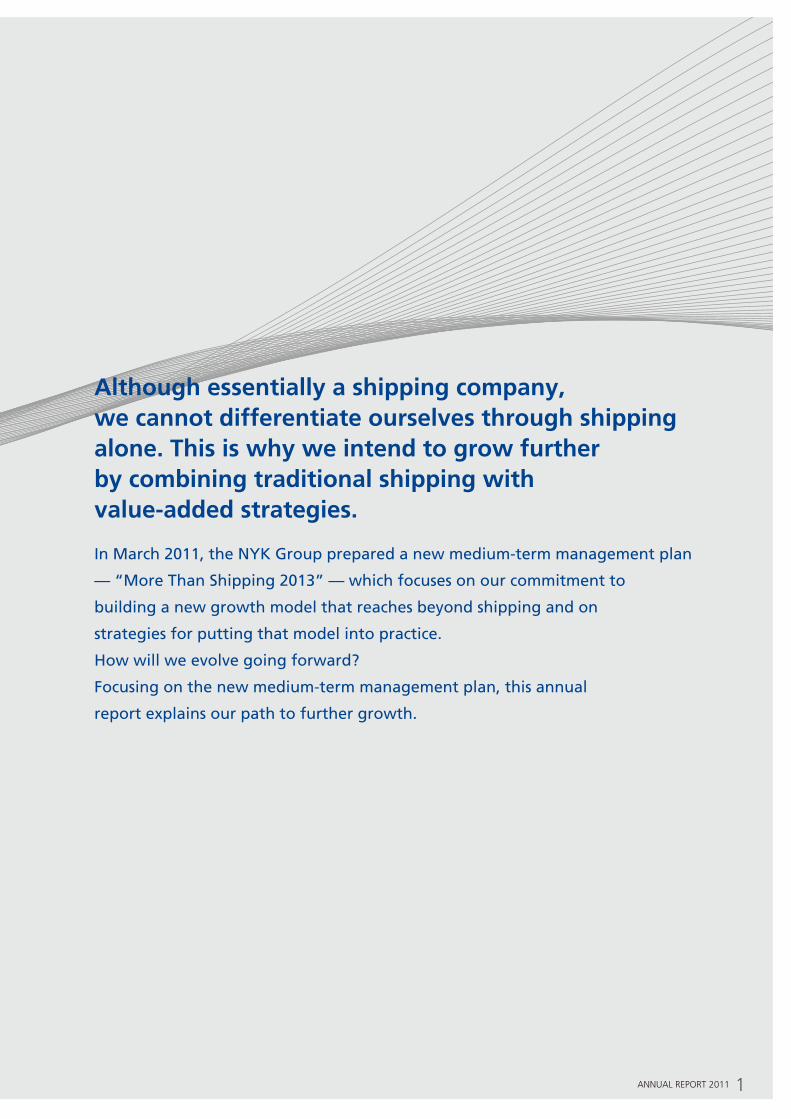
Although essentially a shipping company, we cannot differentiate ourselves through shipping alone. This is why we intend to grow further by combining traditional shipping with value-added strategies.
In March 2011, the NYK Group prepared a new medium-term management plan
— “More Than Shipping 2013” — which focuses on our commitment to
building a new growth model that reaches beyond shipping and on
strategies for putting that model into practice.
How will we evolve going forward?
Focusing on the new medium-term management plan, this annual
report explains our path to further growth.
2 NIPPON YUSEN KABUSHIKI KAISHA
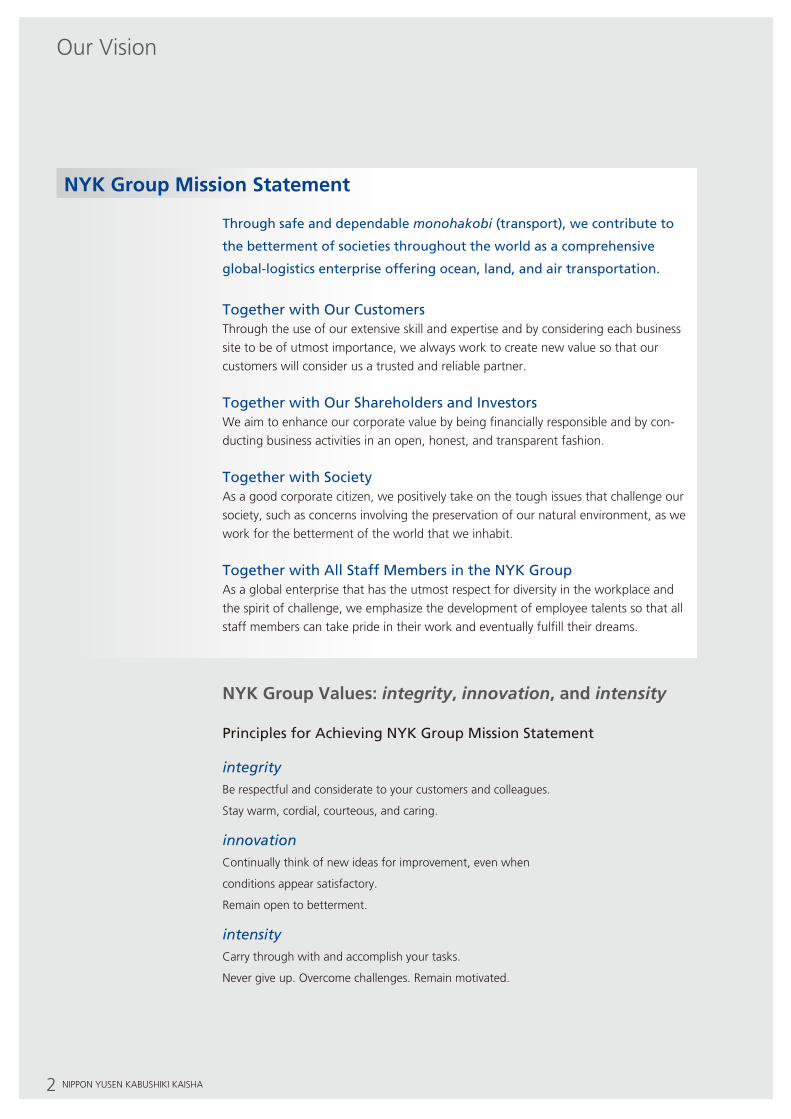
NYK Group Mission Statement
Through safe and dependable monohakobi (transport), we contribute to
the betterment of societies throughout the world as a comprehensive
global-logistics enterprise offering ocean, land, and air transportation.
Together with Our CustomersThrough the use of our extensive skill and expertise and by considering each business
site to be of utmost importance, we always work to create new value so that our
customers will consider us a trusted and reliable partner.
Together with Our Shareholders and InvestorsWe aim to enhance our corporate value by being financially responsible and by con-
ducting business activities in an open, honest, and transparent fashion.
Together with SocietyAs a good corporate citizen, we positively take on the tough issues that challenge our
society, such as concerns involving the preservation of our natural environment, as we
work for the betterment of the world that we inhabit.
Together with All Staff Members in the NYK Group As a global enterprise that has the utmost respect for diversity in the workplace and
the spirit of challenge, we emphasize the development of employee talents so that all
staff members can take pride in their work and eventually fulfill their dreams.
NYK Group Values: integrity, innovation, and intensity
Principles for Achieving NYK Group Mission Statement
integrityBe respectful and considerate to your customers and colleagues.
Stay warm, cordial, courteous, and caring.
innovation Continually think of new ideas for improvement, even when
conditions appear satisfactory.
Remain open to betterment.
intensity Carry through with and accomplish your tasks.
Never give up. Overcome challenges. Remain motivated.
Our Vision
NIPPON YUSEN KABUSHIKI KAISHA3ANNUAL REPORT 2011 6
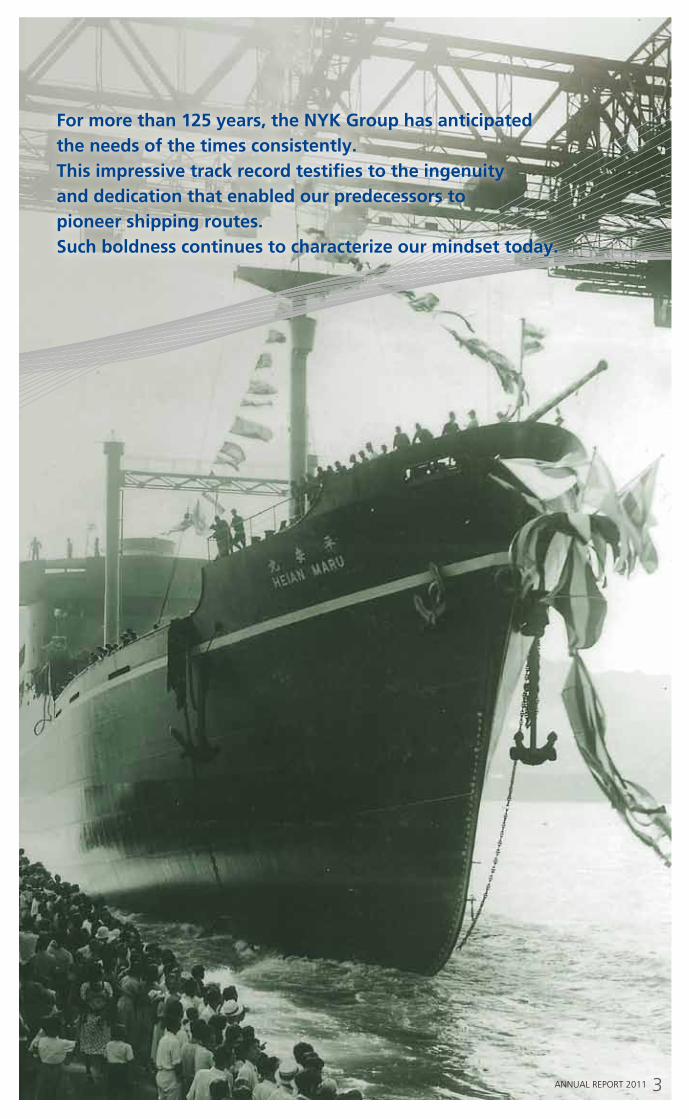
For more than 125 years, the NYK Group has anticipated the needs of the times consistently.This impressive track record testifies to the ingenuity and dedication that enabled our predecessors to pioneer shipping routes.Such boldness continues to characterize our mindset today.
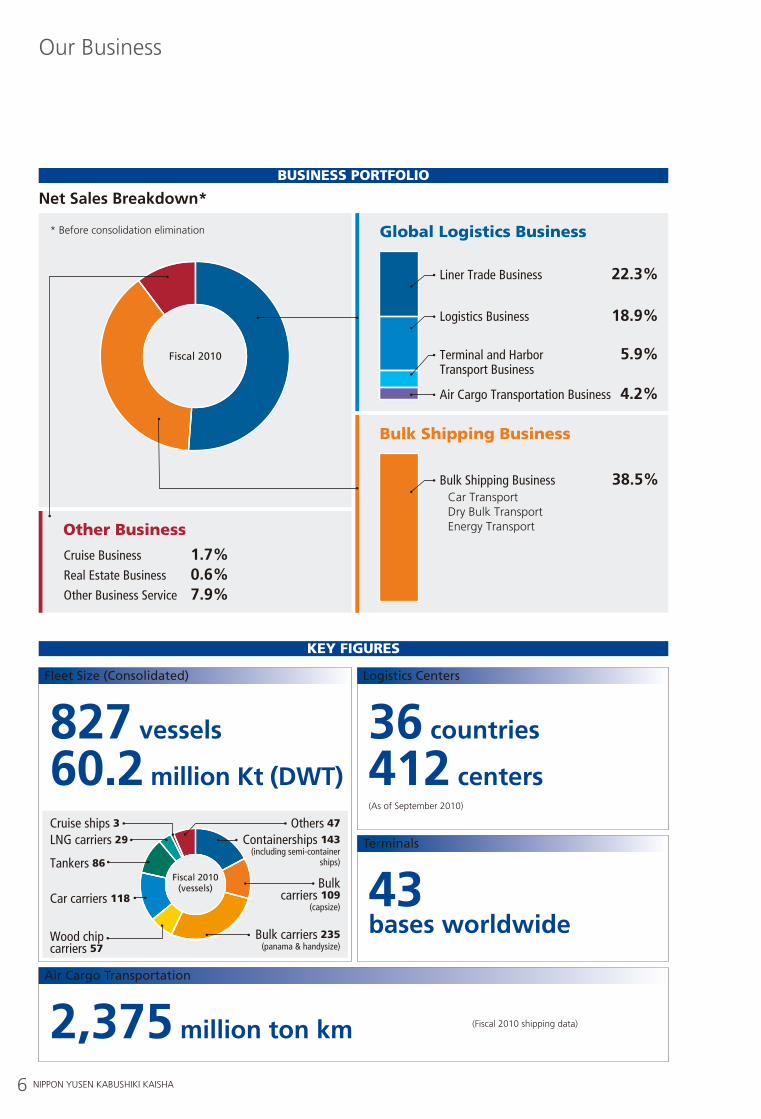
Net Sales Breakdown*
Our Business
Liner Trade Business
Logistics Business
Bulk Shipping BusinessCar TransportDry Bulk TransportEnergy Transport
38.5%
Terminal and Harbor Transport Business
Air Cargo Transportation Business
22.3%
18.9%
5.9%
4.2%
Cruise Business
Real Estate Business
Other Business Service
1.7%0.6%7.9%
Global Logistics Business
Other Business
Bulk Shipping Business
* Before consolidation elimination
Fiscal 2010
Business Portfolio
Key figures
Fleet Size (Consolidated)
827 vessels
60.2 million Kt (DWT)
Logistics Centers
36 countries
412 centers(As of September 2010)
Terminals
43 bases worldwide
Air Cargo Transportation
2,375 million ton km (Fiscal 2010 shipping data)
Others 47
Containerships 143 (including semi-container
ships)
Cruise ships 3LNG carriers 29
Tankers 86
Bulk carriers 109
(capsize)
Bulk carriers 235 (panama & handysize)
Wood chip carriers 57
Car carriers 118
Fiscal 2010(vessels)
1870 1875 1880 1885 1895 1905 1915 1925 1935 1945 1955 1965 1975 1985 1995 20051890 1900 1910 1920 1930 1940 1950 1960 1970 1980 1990 2000 2010
1,000
750
500
250
0
Operating Fleet Size (vessels)
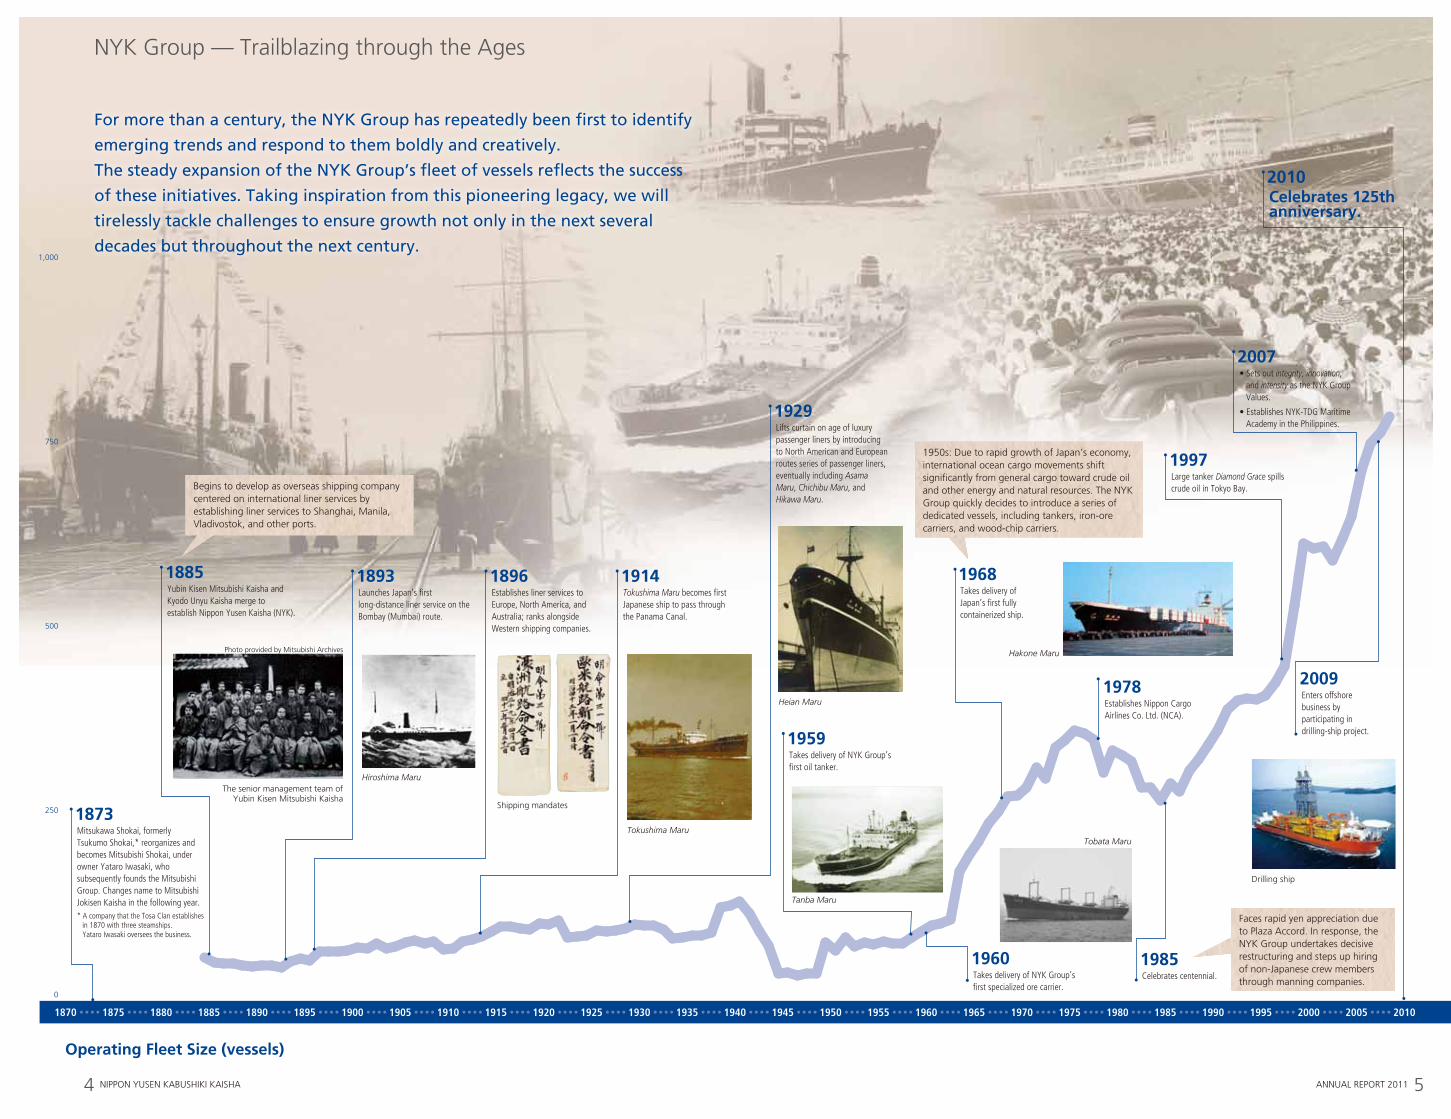
Mitsukawa Shokai, formerly Tsukumo Shokai,* reorganizes and becomes Mitsubishi Shokai, under owner Yataro Iwasaki, who subsequently founds the Mitsubishi Group. Changes name to Mitsubishi Jokisen Kaisha in the following year.* A company that the Tosa Clan establishes in 1870 with three steamships. Yataro Iwasaki oversees the business.
1873
Yubin Kisen Mitsubishi Kaisha and Kyodo Unyu Kaisha merge to establish Nippon Yusen Kaisha (NYK).
1885Launches Japan’s first long-distance liner service on the Bombay (Mumbai) route.
1893Tokushima Maru becomes first Japanese ship to pass through the Panama Canal.
1914
Lifts curtain on age of luxury passenger liners by introducing to North American and European routes series of passenger liners, eventually including Asama Maru, Chichibu Maru, and Hikawa Maru.
1929
Large tanker Diamond Grace spills crude oil in Tokyo Bay.
1997
• Sets out integrity, innovation, and intensity as the NYK Group Values.
• Establishes NYK-TDG Maritime Academy in the Philippines.
2007
Celebrates 125th anniversary.
2010
Establishes Nippon Cargo Airlines Co. Ltd. (NCA).
1978
Takes delivery of NYK Group’s first specialized ore carrier.
1960
Enters offshore business by participating in drilling-ship project.
2009
Celebrates centennial.
1985
Takes delivery of Japan’s first fully containerized ship.
1968Establishes liner services to Europe, North America, and Australia; ranks alongside Western shipping companies.
1896
Begins to develop as overseas shipping company centered on international liner services by establishing liner services to Shanghai, Manila, Vladivostok, and other ports.
Faces rapid yen appreciation due to Plaza Accord. In response, the NYK Group undertakes decisive restructuring and steps up hiring of non-Japanese crew members through manning companies.
1950s: Due to rapid growth of Japan’s economy, international ocean cargo movements shift significantly from general cargo toward crude oil and other energy and natural resources. The NYK Group quickly decides to introduce a series of dedicated vessels, including tankers, iron-ore carriers, and wood-chip carriers.
Takes delivery of NYK Group’s first oil tanker.
1959
4 NIPPON YUSEN KABUSHIKI KAISHA ANNUAL REPORT 2011
NYK Group — Trailblazing through the Ages
Hiroshima MaruThe senior management team of
Yubin Kisen Mitsubishi Kaisha
Photo provided by Mitsubishi Archives
Shipping mandates
Tokushima Maru
Heian Maru
Tanba Maru
Tobata Maru
Hakone Maru
Drilling ship
For more than a century, the NYK Group has repeatedly been first to identify
emerging trends and respond to them boldly and creatively.
The steady expansion of the NYK Group’s fleet of vessels reflects the success
of these initiatives. Taking inspiration from this pioneering legacy, we will
tirelessly tackle challenges to ensure growth not only in the next several
decades but throughout the next century.
5
NIPPON YUSEN KABUSHIKI KAISHA3ANNUAL REPORT 2011 6
For more than 125 years, the NYK Group has anticipated the needs of the times consistently.This impressive track record testifies to the ingenuity and dedication that enabled our predecessors to pioneer shipping routes.Such boldness continues to characterize our mindset today.
Net Sales Breakdown*
Our Business
Liner Trade Business
Logistics Business
Bulk Shipping BusinessCar TransportDry Bulk TransportEnergy Transport
38.5%
Terminal and Harbor Transport Business
Air Cargo Transportation Business
22.3%
18.9%
5.9%
4.2%
Cruise Business
Real Estate Business
Other Business Service
1.7%0.6%7.9%
Global Logistics Business
Other Business
Bulk Shipping Business
* Before consolidation elimination
Fiscal 2010
Business Portfolio
Key figures
Fleet Size (Consolidated)
827 vessels
60.2 million Kt (DWT)
Logistics Centers
36 countries
412 centers(As of September 2010)
Terminals
43 bases worldwide
Air Cargo Transportation
2,375 million ton km (Fiscal 2010 shipping data)
Others 47
Containerships 143 (including semi-container
ships)
Cruise ships 3LNG carriers 29
Tankers 86
Bulk carriers 109
(capsize)
Bulk carriers 235 (panama & handysize)
Wood chip carriers 57
Car carriers 118
Fiscal 2010(vessels)
7ANNUAL REPORT 2011 NIPPON YUSEN KABUSHIKI KAISHA10
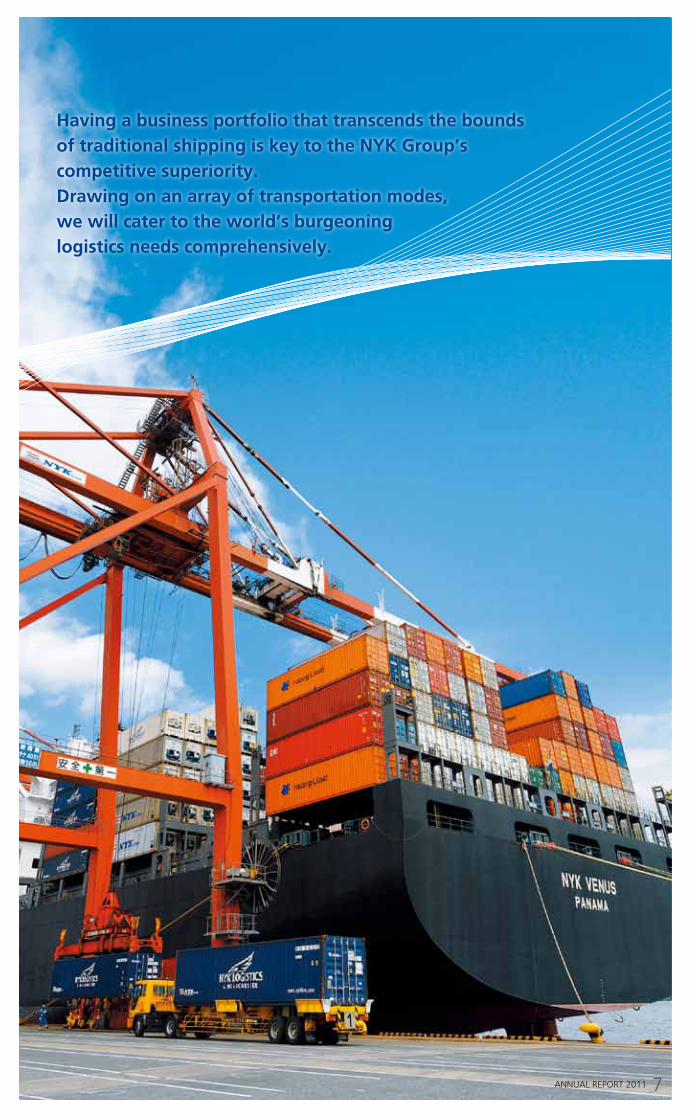
Having a business portfolio that transcends the bounds of traditional shipping is key to the NYK Group’s competitive superiority.Drawing on an array of transportation modes, we will cater to the world’s burgeoning logistics needs comprehensively.
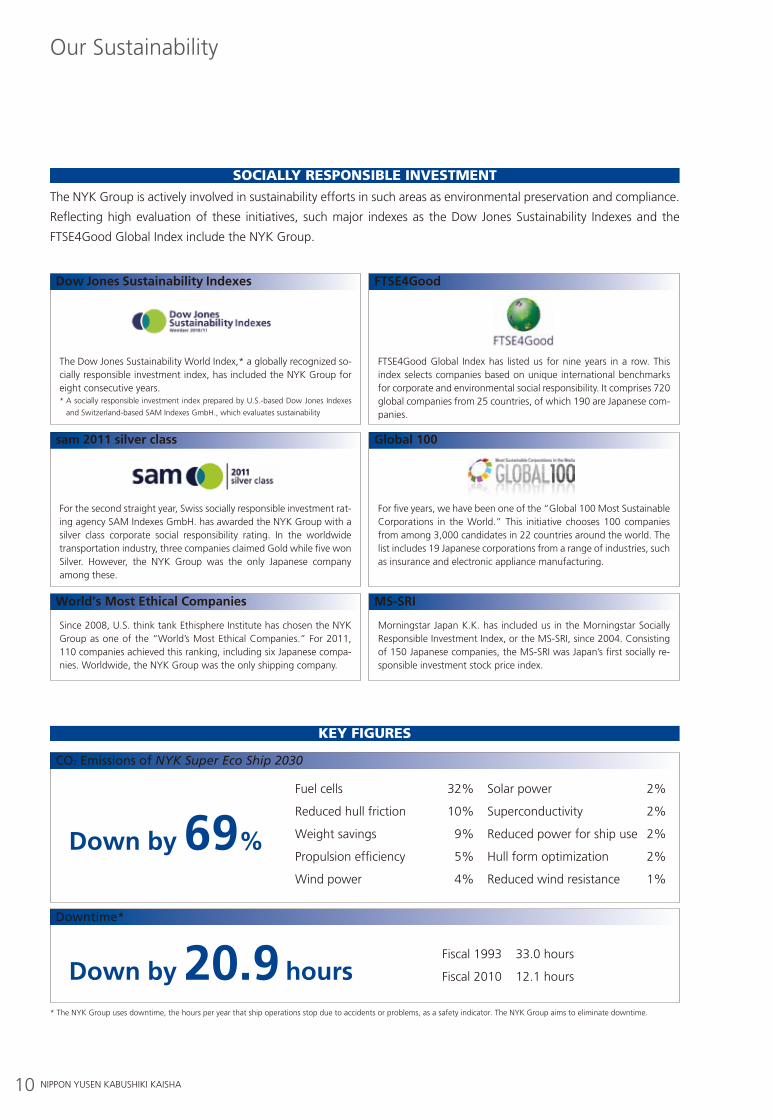
Our Sustainability
The NYK Group is actively involved in sustainability efforts in such areas as environmental preservation and compliance.
Reflecting high evaluation of these initiatives, such major indexes as the Dow Jones Sustainability Indexes and the
FTSE4Good Global Index include the NYK Group.
Socially ReSponSible inveStment
Key FiguReS
Dow Jones Sustainability Indexes
The Dow Jones Sustainability World Index,* a globally recognized so-cially responsible investment index, has included the NYK Group for eight consecutive years. * A socially responsible investment index prepared by U.S.-based Dow Jones Indexes
and Switzerland-based SAM Indexes GmbH., which evaluates sustainability
FTSE4Good
FTSE4Good Global Index has listed us for nine years in a row. This index selects companies based on unique international benchmarks for corporate and environmental social responsibility. It comprises 720 global companies from 25 countries, of which 190 are Japanese com-panies.
sam 2011 silver class
World’s Most Ethical Companies MS-SRI
For the second straight year, Swiss socially responsible investment rat-ing agency SAM Indexes GmbH. has awarded the NYK Group with a silver class corporate social responsibility rating. In the worldwide transportation industry, three companies claimed Gold while five won Silver. However, the NYK Group was the only Japanese company among these.
Since 2008, U.S. think tank Ethisphere Institute has chosen the NYK Group as one of the “World’s Most Ethical Companies.” For 2011, 110 companies achieved this ranking, including six Japanese compa-nies. Worldwide, the NYK Group was the only shipping company.
Morningstar Japan K.K. has included us in the Morningstar Socially Responsible Investment Index, or the MS-SRI, since 2004. Consisting of 150 Japanese companies, the MS-SRI was Japan’s first socially re-sponsible investment stock price index.
Global 100
For five years, we have been one of the “Global 100 Most Sustainable Corporations in the World.” This initiative chooses 100 companies from among 3,000 candidates in 22 countries around the world. The list includes 19 Japanese corporations from a range of industries, such as insurance and electronic appliance manufacturing.
CO2 Emissions of NYK Super Eco Ship 2030
Down by 69%
Fuel cells 32%
Reduced hull friction 10%
Weight savings 9%
Propulsion efficiency 5%
Wind power 4%
Solar power 2%
Superconductivity 2%
Reduced power for ship use 2%
Hull form optimization 2%
Reduced wind resistance 1%
Downtime*
Down by 20.9 hoursFiscal 1993 33.0 hours
Fiscal 2010 12.1 hours
* The NYK Group uses downtime, the hours per year that ship operations stop due to accidents or problems, as a safety indicator. The NYK Group aims to eliminate downtime.
8 NIPPON YUSEN KABUSHIKI KAISHA ANNUAL REPORT 2011 9
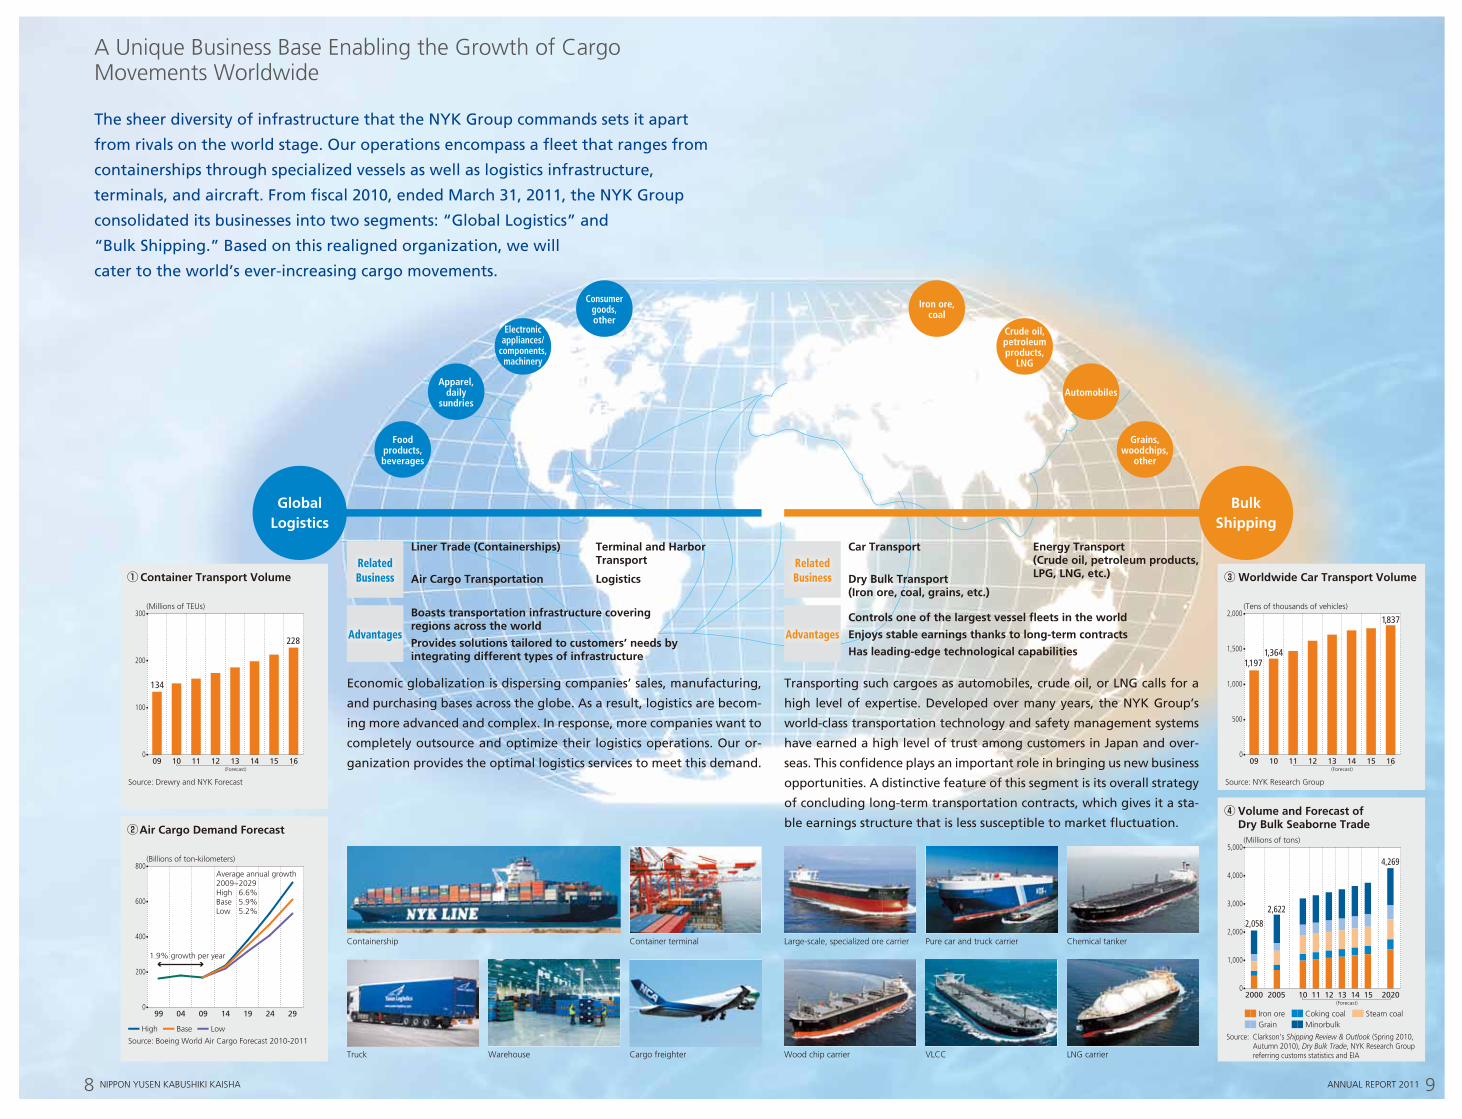
A Unique Business Base Enabling the Growth of Cargo Movements Worldwide
The sheer diversity of infrastructure that the NYK Group commands sets it apart
from rivals on the world stage. Our operations encompass a fleet that ranges from
containerships through specialized vessels as well as logistics infrastructure,
terminals, and aircraft. From fiscal 2010, ended March 31, 2011, the NYK Group
consolidated its businesses into two segments: “Global Logistics” and
“Bulk Shipping.” Based on this realigned organization, we will
cater to the world’s ever-increasing cargo movements.
Related Business
Liner Trade (Containerships)
Air Cargo Transportation
Terminal and Harbor Transport
LogisticsRelated Business
Car Transport
Dry Bulk Transport (Iron ore, coal, grains, etc.)
Energy Transport (Crude oil, petroleum products, LPG, LNG, etc.)
Advantages
Boasts transportation infrastructure covering regions across the world
Provides solutions tailored to customers’ needs by integrating different types of infrastructure
AdvantagesControls one of the largest vessel fleets in the world
Enjoys stable earnings thanks to long-term contracts
Has leading-edge technological capabilities
Economic globalization is dispersing companies’ sales, manufacturing,
and purchasing bases across the globe. As a result, logistics are becom-
ing more advanced and complex. In response, more companies want to
completely outsource and optimize their logistics operations. Our or-
ganization provides the optimal logistics services to meet this demand.
Transporting such cargoes as automobiles, crude oil, or LNG calls for a
high level of expertise. Developed over many years, the NYK Group’s
world-class transportation technology and safety management systems
have earned a high level of trust among customers in Japan and over-
seas. This confidence plays an important role in bringing us new business
opportunities. A distinctive feature of this segment is its overall strategy
of concluding long-term transportation contracts, which gives it a sta-
ble earnings structure that is less susceptible to market fluctuation.
Containership Large-scale, specialized ore carrier
Truck Wood chip carrier
Pure car and truck carrier
Warehouse VLCC
Container terminal Chemical tanker
Cargo freighter LNG carrier
Source: Drewry and NYK Forecast
Container Transport Volume
009 10 11 12 1413 15 16
228
134
100
200
300(Millions of TEUs)
(Forecast)
Worldwide Car Transport Volume
Source: NYK Research Group
009 10
1,364
11 12 1413 15 16
500
1,000
1,500
2,0001,837
1,197
(Tens of thousands of vehicles)
(Forecast)
(Billions of ton-kilometers)
0
Air Cargo Demand Forecast
800
400
200
600
1.9% growth per year
Average annual growth2009−2029High 6.6%Base 5.9%Low 5.2%
Source: Boeing World Air Cargo Forecast 2010-2011
High Base Low
99 04 1409 19 24 29
(Millions of tons)
4,269
2,622
2,058
5,000
1,000
4,000
3,000
2,000
0
Volume and Forecast of Dry Bulk Seaborne Trade
2000 2005 10 11 1312 14 15 2020
Source: Clarkson’s Shipping Review & Outlook (Spring 2010, Autumn 2010), Dry Bulk Trade, NYK Research Group referring customs statistics and EIA
Iron ore Coking coalGrain Minorbulk
Steam coal
(Forecast)
Consumer goods, other
Iron ore, coal
Electronic appliances/
components, machinery
Crude oil, petroleum products,
LNG
Apparel, daily
sundriesAutomobiles
Food products, beverages
Grains, woodchips,
other
Global Logistics
Bulk Shipping
7ANNUAL REPORT 2011 NIPPON YUSEN KABUSHIKI KAISHA10
Having a business portfolio that transcends the bounds of traditional shipping is key to the NYK Group’s competitive superiority.Drawing on an array of transportation modes, we will cater to the world’s burgeoning logistics needs comprehensively.
Our Sustainability
The NYK Group is actively involved in sustainability efforts in such areas as environmental preservation and compliance.
Reflecting high evaluation of these initiatives, such major indexes as the Dow Jones Sustainability Indexes and the
FTSE4Good Global Index include the NYK Group.
Socially ReSponSible inveStment
Key FiguReS
Dow Jones Sustainability Indexes
The Dow Jones Sustainability World Index,* a globally recognized so-cially responsible investment index, has included the NYK Group for eight consecutive years. * A socially responsible investment index prepared by U.S.-based Dow Jones Indexes
and Switzerland-based SAM Indexes GmbH., which evaluates sustainability
FTSE4Good
FTSE4Good Global Index has listed us for nine years in a row. This index selects companies based on unique international benchmarks for corporate and environmental social responsibility. It comprises 720 global companies from 25 countries, of which 190 are Japanese com-panies.
sam 2011 silver class
World’s Most Ethical Companies MS-SRI
For the second straight year, Swiss socially responsible investment rat-ing agency SAM Indexes GmbH. has awarded the NYK Group with a silver class corporate social responsibility rating. In the worldwide transportation industry, three companies claimed Gold while five won Silver. However, the NYK Group was the only Japanese company among these.
Since 2008, U.S. think tank Ethisphere Institute has chosen the NYK Group as one of the “World’s Most Ethical Companies.” For 2011, 110 companies achieved this ranking, including six Japanese compa-nies. Worldwide, the NYK Group was the only shipping company.
Morningstar Japan K.K. has included us in the Morningstar Socially Responsible Investment Index, or the MS-SRI, since 2004. Consisting of 150 Japanese companies, the MS-SRI was Japan’s first socially re-sponsible investment stock price index.
Global 100
For five years, we have been one of the “Global 100 Most Sustainable Corporations in the World.” This initiative chooses 100 companies from among 3,000 candidates in 22 countries around the world. The list includes 19 Japanese corporations from a range of industries, such as insurance and electronic appliance manufacturing.
CO2 Emissions of NYK Super Eco Ship 2030
Down by 69%
Fuel cells 32%
Reduced hull friction 10%
Weight savings 9%
Propulsion efficiency 5%
Wind power 4%
Solar power 2%
Superconductivity 2%
Reduced power for ship use 2%
Hull form optimization 2%
Reduced wind resistance 1%
Downtime*
Down by 20.9 hoursFiscal 1993 33.0 hours
Fiscal 2010 12.1 hours
* The NYK Group uses downtime, the hours per year that ship operations stop due to accidents or problems, as a safety indicator. The NYK Group aims to eliminate downtime.
NIPPON YUSEN KABUSHIKI KAISHA11ANNUAL REPORT 2011 14
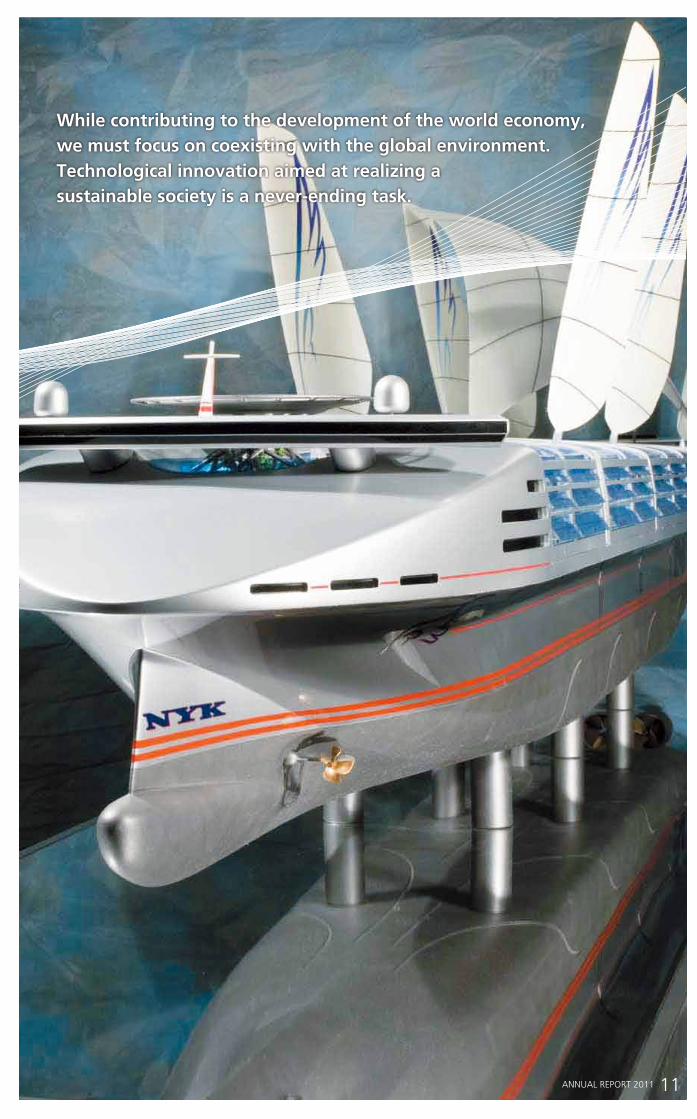
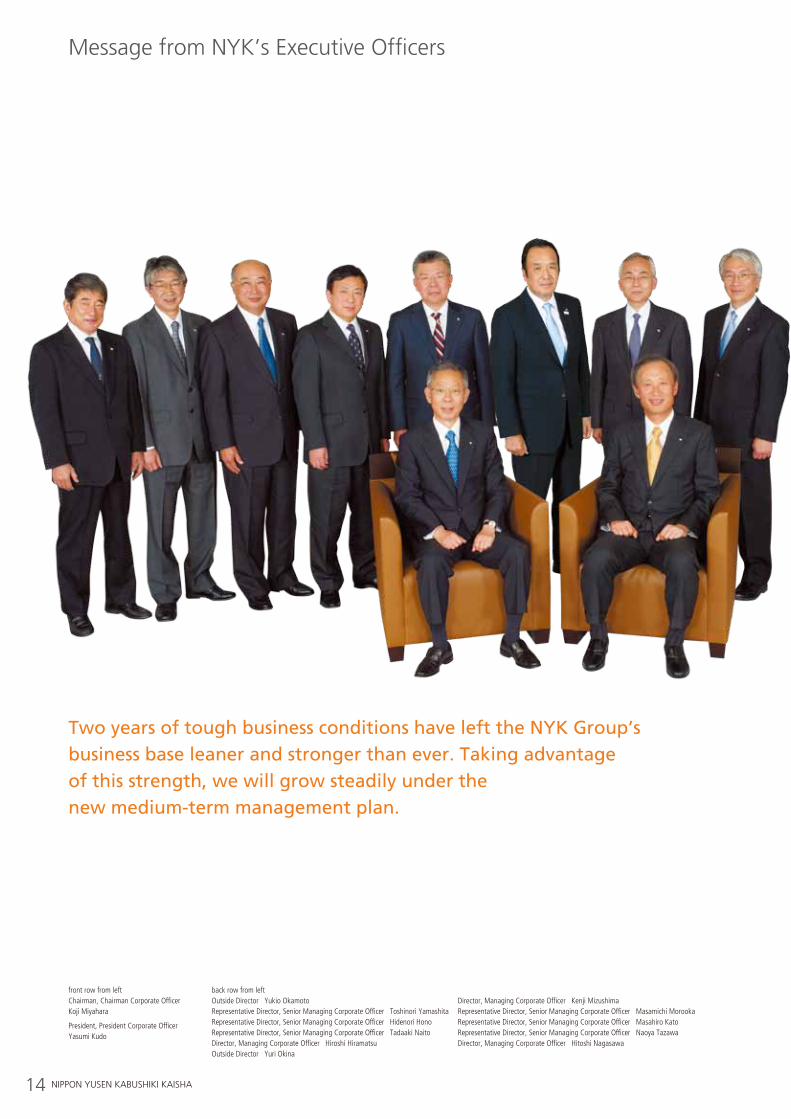
Message from NYK’s Executive Officers
While contributing to the development of the world economy, we must focus on coexisting with the global environment.Technological innovation aimed at realizing a sustainable society is a never-ending task.
front row from leftChairman, Chairman Corporate OfficerKoji Miyahara
President, President Corporate OfficerYasumi Kudo
back row from left Outside Director Yukio Okamoto Director, Managing Corporate Officer Kenji MizushimaRepresentative Director, Senior Managing Corporate Officer Toshinori Yamashita Representative Director, Senior Managing Corporate Officer Masamichi MorookaRepresentative Director, Senior Managing Corporate Officer Hidenori Hono Representative Director, Senior Managing Corporate Officer Masahiro KatoRepresentative Director, Senior Managing Corporate Officer Tadaaki Naito Representative Director, Senior Managing Corporate Officer Naoya TazawaDirector, Managing Corporate Officer Hiroshi Hiramatsu Director, Managing Corporate Officer Hitoshi NagasawaOutside Director Yuri Okina
Two years of tough business conditions have left the NYK Group’s business base leaner and stronger than ever. Taking advantage of this strength, we will grow steadily under the new medium-term management plan.
12 NIPPON YUSEN KABUSHIKI KAISHA ANNUAL REPORT 2011 13
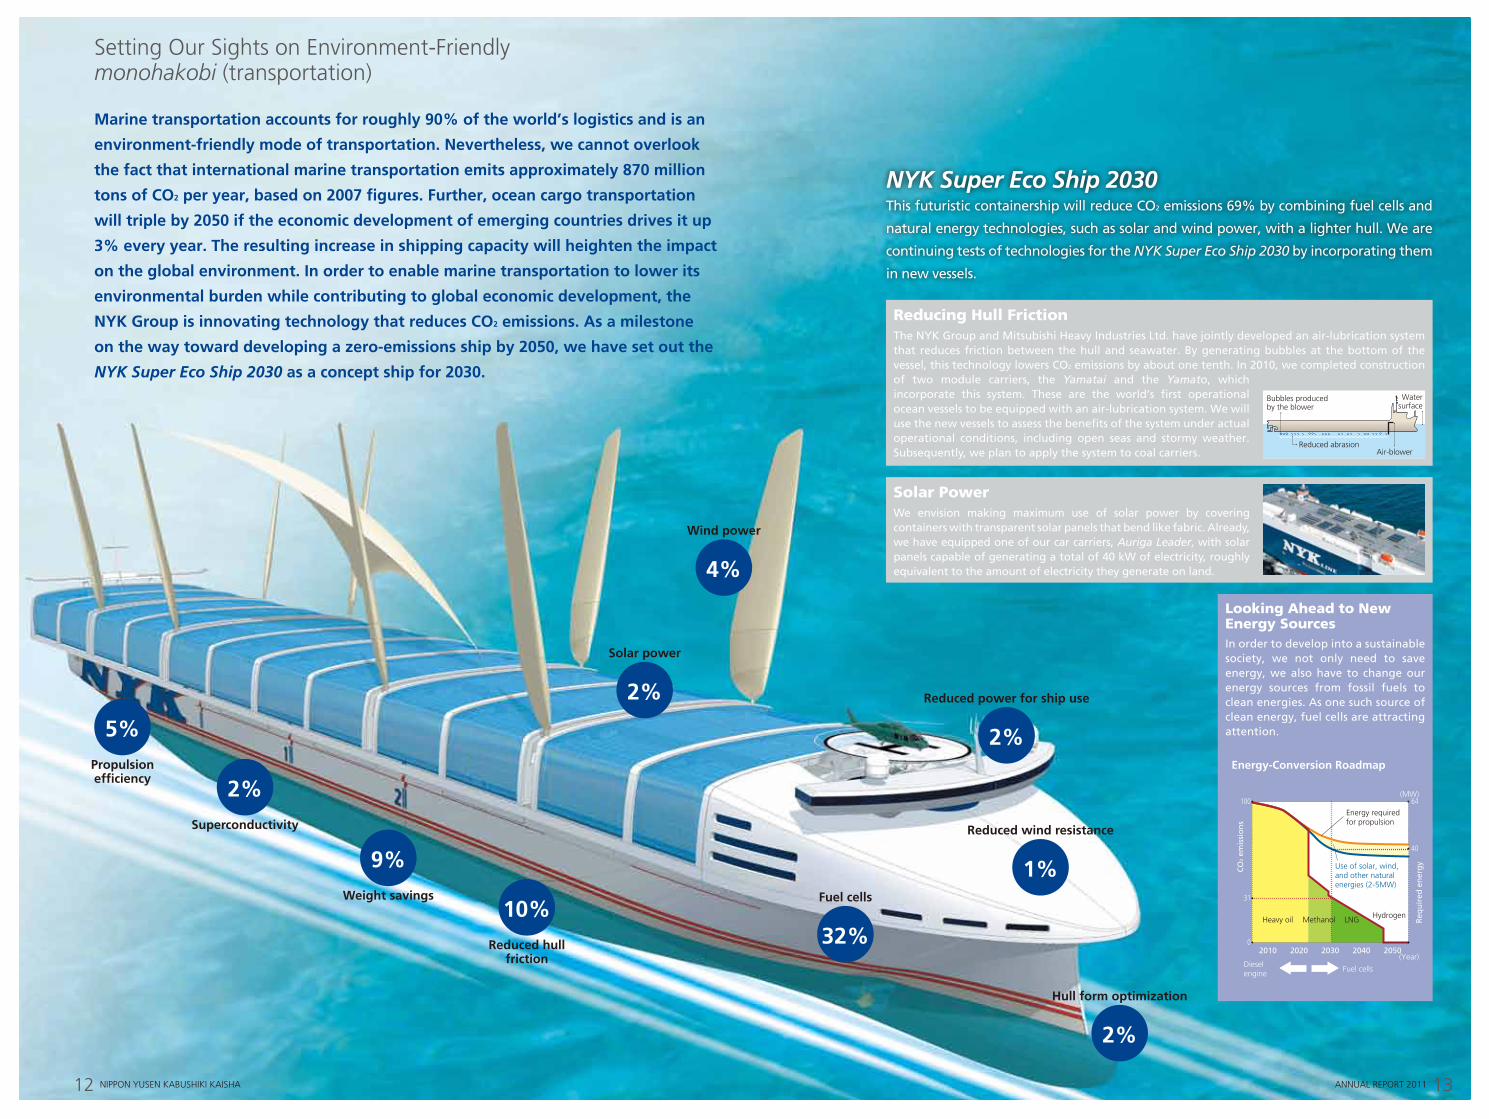
Setting Our Sights on Environment-Friendly monohakobi (transportation)
Marine transportation accounts for roughly 90% of the world’s logistics and is an
environment-friendly mode of transportation. Nevertheless, we cannot overlook
the fact that international marine transportation emits approximately 870 million
tons of CO2 per year, based on 2007 figures. Further, ocean cargo transportation
will triple by 2050 if the economic development of emerging countries drives it up
3% every year. The resulting increase in shipping capacity will heighten the impact
on the global environment. In order to enable marine transportation to lower its
environmental burden while contributing to global economic development, the
NYK Group is innovating technology that reduces CO2 emissions. As a milestone
on the way toward developing a zero-emissions ship by 2050, we have set out the
NYK Super Eco Ship 2030 as a concept ship for 2030.
NYK Super Eco Ship 2030This futuristic containership will reduce CO2 emissions 69% by combining fuel cells and
natural energy technologies, such as solar and wind power, with a lighter hull. We are
continuing tests of technologies for the NYK Super Eco Ship 2030 by incorporating them
in new vessels.
The NYK Group and Mitsubishi Heavy Industries Ltd. have jointly developed an air-lubrication system that reduces friction between the hull and seawater. By generating bubbles at the bottom of the vessel, this technology lowers CO2 emissions by about one tenth. In 2010, we completed construction of two module carriers, the Yamatai and the Yamato, which incorporate this system. These are the world’s first operational ocean vessels to be equipped with an air-lubrication system. We will use the new vessels to assess the benefits of the system under actual operational conditions, including open seas and stormy weather. Subsequently, we plan to apply the system to coal carriers.
Reducing Hull Friction
In order to develop into a sustainable society, we not only need to save energy, we also have to change our energy sources from fossil fuels to clean energies. As one such source of clean energy, fuel cells are attracting attention.
Looking Ahead to New Energy Sources
We envision making maximum use of solar power by covering containers with transparent solar panels that bend like fabric. Already, we have equipped one of our car carriers, Auriga Leader, with solar panels capable of generating a total of 40 kW of electricity, roughly equivalent to the amount of electricity they generate on land.
Solar Power
32%
Fuel cells
2%
Solar power
2%
Reduced power for ship use
9%Weight savings
10%Reduced hull
friction
2%Superconductivity
5%Propulsion efficiency
4%
Wind power
2%
Hull form optimization
1%
Reduced wind resistance
(MW)
0
Energy-Conversion Roadmap
2010 2020 2030 2040 2050
Diesel engine
Energy required for propulsion
Use of solar, wind, and other natural energies (2-5MW)
Heavy oil Methanol LNG Hydrogen
CO
2 em
issi
on
s
Req
uir
ed e
ner
gy
Fuel cells
100
31
64
40
(Year)
Bubbles produced by the blower
Watersurface
Air-blowerReduced abrasion
NIPPON YUSEN KABUSHIKI KAISHA11ANNUAL REPORT 2011 14
Message from NYK’s Executive Officers
While contributing to the development of the world economy, we must focus on coexisting with the global environment.Technological innovation aimed at realizing a sustainable society is a never-ending task.
front row from leftChairman, Chairman Corporate OfficerKoji Miyahara
President, President Corporate OfficerYasumi Kudo
back row from left Outside Director Yukio Okamoto Director, Managing Corporate Officer Kenji MizushimaRepresentative Director, Senior Managing Corporate Officer Toshinori Yamashita Representative Director, Senior Managing Corporate Officer Masamichi MorookaRepresentative Director, Senior Managing Corporate Officer Hidenori Hono Representative Director, Senior Managing Corporate Officer Masahiro KatoRepresentative Director, Senior Managing Corporate Officer Tadaaki Naito Representative Director, Senior Managing Corporate Officer Naoya TazawaDirector, Managing Corporate Officer Hiroshi Hiramatsu Director, Managing Corporate Officer Hitoshi NagasawaOutside Director Yuri Okina
Two years of tough business conditions have left the NYK Group’s business base leaner and stronger than ever. Taking advantage of this strength, we will grow steadily under the new medium-term management plan.
15ANNUAL REPORT 2011
45PERFORMANCE
65SUSTAINABILITY
73GOVERNANCE
87FACT DATA
93FINANCIAL DATA
14MANAGEMENT
We would like to thank our shareholders, other investors, customers,
business associates, local communities, and other stakeholders sin-
cerely for their continuing support and understanding of the NYK
Group’s activities.
Also, we want to express our heartfelt condolences for the victims
of the Great East Japan Earthquake on March 11, 2011. Although lost
for words whenever we learn further details about the almost unimag-
inable scale of the damage, we are doing what little we can to help
restore the disaster area. (Please see page 64 for details of our support
activities.)
In recent years, under the guidance of the New Horizon 2010 medium-
term management plan and the Yosoro (Steady Ahead!) Emergency
Structural Reform Project, the NYK Group has made an all-out effort to
expand businesses in growth areas. In conjunction with these efforts,
the NYK Group has worked to change over to a business model less
susceptible to fluctuation caused by outside conditions.
From April 2011, we launched a new medium-term manage-
ment plan, “More Than Shipping 2013.” Exploiting the business
base built under the previous medium-term management plan, we
intend to realize stable earnings — irrespective of whether favorable
market conditions are providing a tailwind — and thereby grow steadi-
ly. We give a detailed explanation of the new medium-term manage-
ment plan from page 18 onward.
In 2010, the NYK Group celebrated its 125th anniversary. The NYK
Group has prepared “More Than Shipping 2013” with a view to
sustained growth over the coming 125 years. We are confident that by
establishing concepts and structures that break the mold of traditional
shipping we will continue growing and advancing toward even greater
achievements.
16 NIPPON YUSEN KABUSHIKI KAISHA
Consolidated Financial Highlights
Millions of yen Thousands of U.S. dollars (Note 1)
2011 2010 2009 2011
Results of Operation
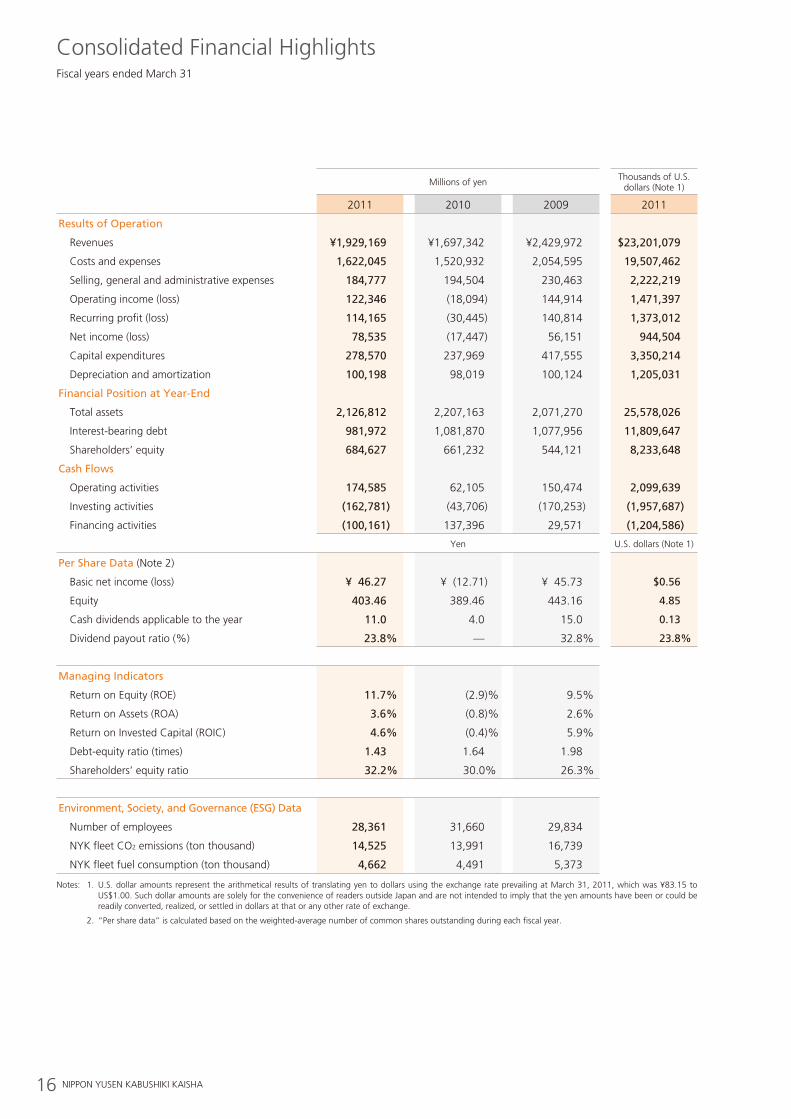
Revenues ¥1,929,169 ¥1,697,342 ¥2,429,972 $23,201,079
Costs and expenses 1,622,045 1,520,932 2,054,595 19,507,462
Selling, general and administrative expenses 184,777 194,504 230,463 2,222,219
Operating income (loss) 122,346 (18,094) 144,914 1,471,397
Recurring profit (loss) 114,165 (30,445) 140,814 1,373,012
Net income (loss) 78,535 (17,447) 56,151 944,504
Capital expenditures 278,570 237,969 417,555 3,350,214
Depreciation and amortization 100,198 98,019 100,124 1,205,031
Financial Position at Year-End
Total assets 2,126,812 2,207,163 2,071,270 25,578,026
Interest-bearing debt 981,972 1,081,870 1,077,956 11,809,647
Shareholders’ equity 684,627 661,232 544,121 8,233,648
Cash Flows
Operating activities 174,585 62,105 150,474 2,099,639
Investing activities (162,781) (43,706) (170,253) (1,957,687)
Financing activities (100,161) 137,396 29,571 (1,204,586)
Yen U.S. dollars (Note 1)
Per Share Data (Note 2)
Basic net income (loss) ¥ 46.27 ¥ (12.71) ¥ 45.73 $0.56
Equity 403.46 389.46 443.16 4.85
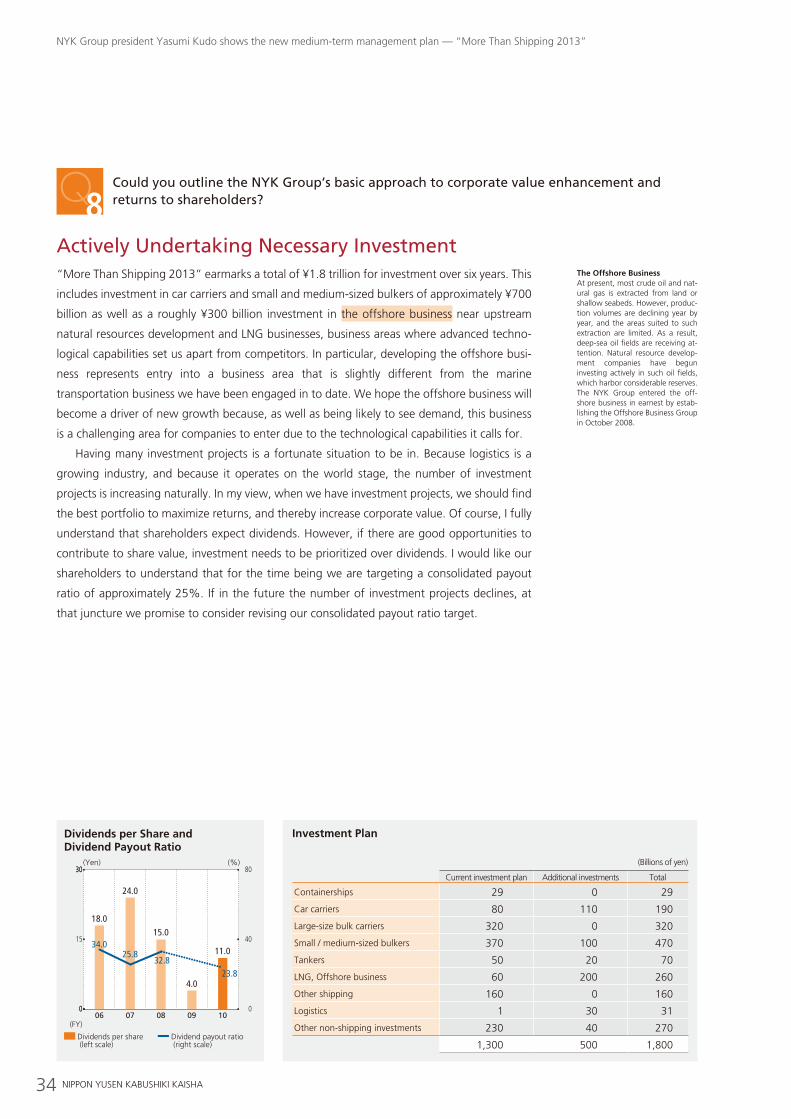
Cash dividends applicable to the year 11.0 4.0 15.0 0.13
Dividend payout ratio (%) 23.8% — 32.8% 23.8%
Managing Indicators
Return on Equity (ROE) 11.7% (2.9)% 9.5%
Return on Assets (ROA) 3.6% (0.8)% 2.6%
Return on Invested Capital (ROIC) 4.6% (0.4)% 5.9%
Debt-equity ratio (times) 1.43 1.64 1.98
Shareholders’ equity ratio 32.2% 30.0% 26.3%
Environment, Society, and Governance (ESG) Data
Number of employees 28,361 31,660 29,834
NYK fleet CO2 emissions (ton thousand) 14,525 13,991 16,739
NYK fleet fuel consumption (ton thousand) 4,662 4,491 5,373
Notes: 1. U.S. dollar amounts represent the arithmetical results of translating yen to dollars using the exchange rate prevailing at March 31, 2011, which was ¥83.15 to US$1.00. Such dollar amounts are solely for the convenience of readers outside Japan and are not intended to imply that the yen amounts have been or could be readily converted, realized, or settled in dollars at that or any other rate of exchange.
2. “Per share data” is calculated based on the weighted-average number of common shares outstanding during each fiscal year.
Fiscal years ended March 31
17ANNUAL REPORT 2011
45PERFORMANCE
65SUSTAINABILITY
73GOVERNANCE
87FACT DATA
93FINANCIAL DATA
14MANAGEMENT
(Billions of yen)
1,929.1
3,000
2,000
1,000
0
Revenues
07 08 09 10 11
2,164.2
2,584.62,429.9
1,697.3
(%) (Times)
1.43
32.2
40
35
30
25
2.0
1.5
20 107 08 09 10 11
1.36
1.60
1.98
1.6430.8
27.926.3
30.0
Shareholders’ equity ratio (left scale)
Debt-equity ratio (right scale)
Shareholders’ Equity Ratio and Debt-Equity Ratio
(Billions of yen)
78.5
150
100
50
–50
0
Net Income (Loss)
07 08 09 10 11
65.0
114.1
56.1
–17.4
(Ton thousand)
4,662
14,525
20,000
15,000
10,000
5,000
8,000
6,000
4,000
2,000
0 007 08 09 10 11
5,0695,444 5,373
4,491
15,922 16,969 16,739
13,991
NYK Fleet CO2 Emissions and Fuel Consumption
CO2 emissions (left scale)
Fuel consumption (right scale)
Ratings
(As of March 31, 2011)
Type Ratings
Japan Credit Rating Agency, Ltd. (JCR) Long term AA-
Rating and Investment Information, Inc. (R&I)
IssuerShort term
A+a-1+
Moody’s Issuer Baa1
Growth Indicators
Stability Indicators
Profitability Indicators
ESG Indicators
Fiscal 2010 Business Results Summary
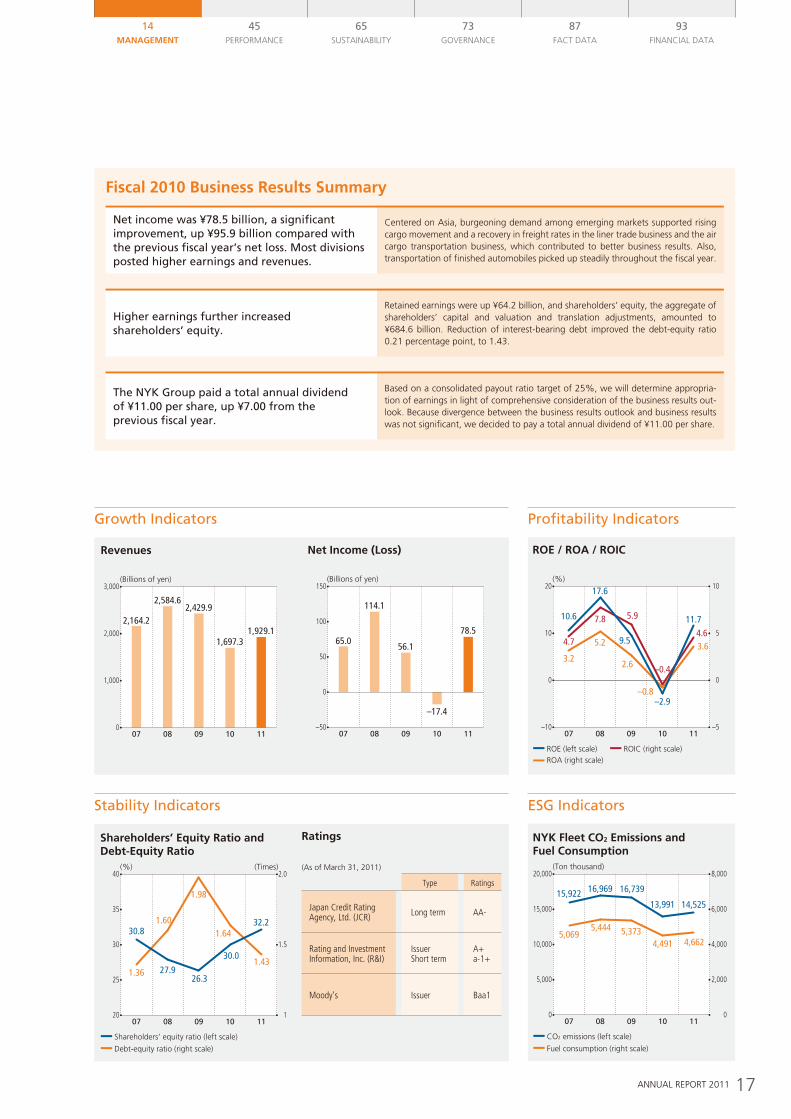
Net income was ¥78.5 billion, a significant improvement, up ¥95.9 billion compared with the previous fiscal year’s net loss. Most divisions posted higher earnings and revenues.
Centered on Asia, burgeoning demand among emerging markets supported rising cargo movement and a recovery in freight rates in the liner trade business and the air cargo transportation business, which contributed to better business results. Also, transportation of finished automobiles picked up steadily throughout the fiscal year.
Higher earnings further increased shareholders’ equity.
Retained earnings were up ¥64.2 billion, and shareholders’ equity, the aggregate of shareholders’ capital and valuation and translation adjustments, amounted to ¥684.6 billion. Reduction of interest-bearing debt improved the debt-equity ratio 0.21 percentage point, to 1.43.
The NYK Group paid a total annual dividend of ¥11.00 per share, up ¥7.00 from the previous fiscal year.
Based on a consolidated payout ratio target of 25%, we will determine appropria-tion of earnings in light of comprehensive consideration of the business results out-look. Because divergence between the business results outlook and business results was not significant, we decided to pay a total annual dividend of ¥11.00 per share.
0 0
–10 –5
(%)
3.64.6
11.7
20
10
10
5
ROE / ROA / ROIC
07 08 09 10 11
3.2
5.2
2.6
–0.8
4.7
7.8 5.9
–0.4
10.6
17.6
9.5
–2.9
ROE (left scale)ROA (right scale)
ROIC (right scale)
18 NIPPON YUSEN KABUSHIKI KAISHA
Special Feature
grow with Asia, expand across the globeNew Medium-Term Management Plan, “More Than Shipping 2013”
A review of recent Medium-term Management Plans1
An on-site report from Asia5
“More than shipping 2013 — grow with Asia, expand across the globe” — Plan overview2nyK group president yasumi Kudo shows the new medium-term management plan — “More than shipping 2013”3“We will pursue value-added strategies exploiting our strengths in order to escape competitive conditions that are becoming commoditized.”
the strategic Pillars of “More than shipping 2013”4• General Cargo — Leverage Logistics Capabilities: Effectively capture Asia’s growing transportation needs
• Automobiles — Utilize Auto Logistics Capabilities: Actively respond to all automobile transportation supply chain needs in Asia
• Energy / Natural resources (1) — Employ Technological Capabilities: Secure highly advanced energy-transportation business
• Energy / Natural resources (2) — Leverage Global Network: Proactively expand overseas natural resources and energy-transportation business
14MANAGEMENT
93FINANCIAL DATA
87FACT DATA
73GOVERNANCE
65SUSTAINABILITY
45PERFORMANCE
ANNUAL REPORT 2011 19
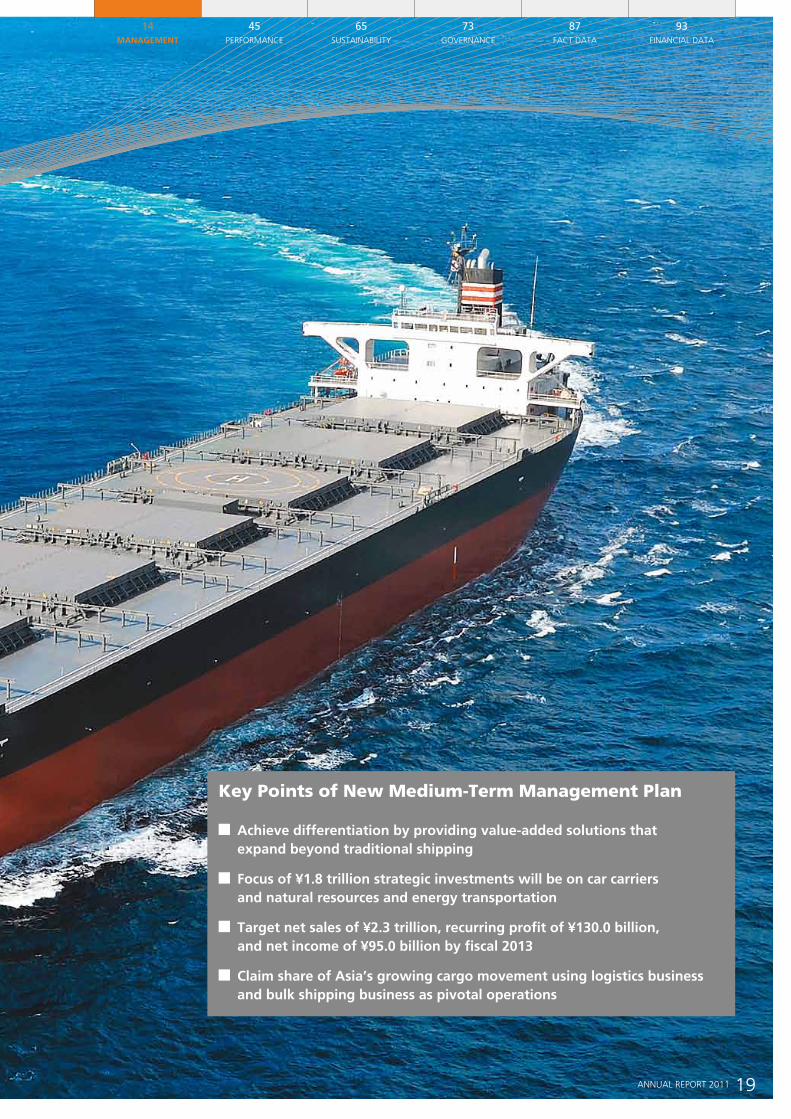
Key Points of new Medium-term Management Plan
Achieve differentiation by providing value-added solutions that expand beyond traditional shipping
Focus of ¥1.8 trillion strategic investments will be on car carriers and natural resources and energy transportation
Target net sales of ¥2.3 trillion, recurring profit of ¥130.0 billion, and net income of ¥95.0 billion by fiscal 2013
Claim share of Asia’s growing cargo movement using logistics business and bulk shipping business as pivotal operations
20 NIPPON YUSEN KABUSHIKI KAISHA
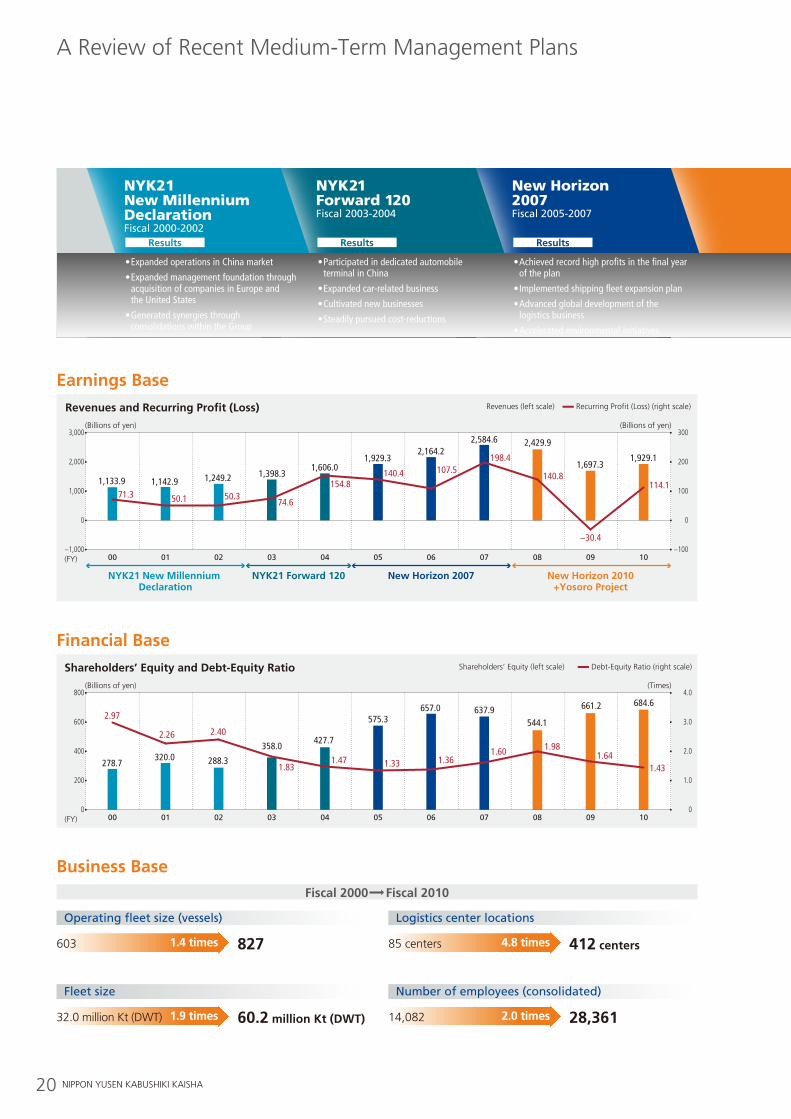
A Review of Recent Medium-Term Management Plans
Earnings BaseRevenues and Recurring Profit (Loss)
00 01 02 03 04 05 06 08 1007 09
1,249.21,142.91,133.9
1,929.31,606.0
1,398.3
1,929.11,697.3
140.8
2,164.2
(Billions of yen)3,000
2,000
1,000
−1,000
NYK21 New Millennium Declaration
NYK21 Forward 120 New Horizon 2007 New Horizon 2010+Yosoro Project
−100
0 0
(Billions of yen)
Revenues (left scale) Recurring Profit (Loss) (right scale)
300
200
10050.350.171.3
140.4154.8
74.6
2,429.9
−30.4
114.1
2,584.6
198.4107.5
(FY)
Financial BaseShareholders’ Equity and Debt-Equity Ratio
00 01 02 03 04 05 06 08 1007 09
288.3320.0278.7
657.0575.3
427.7358.0
661.2 684.6
544.1637.9
(Billions of yen)800
600
200
400
(FY)0
(Times)4.0
3.0
2.0
1.0
0
2.40
1.83
2.26
2.97
1.361.331.471.43
1.641.60 1.98
Shareholders’ Equity (left scale) Debt-Equity Ratio (right scale)
NYK21 New Millennium DeclarationFiscal 2000-2002
NYK21 Forward 120Fiscal 2003-2004
Results
New Horizon 2007Fiscal 2005-2007
Results
New Horizon 2010 (Revision) + Yosoro (Steady Ahead!) Emergency Structural Reform ProjectFiscal 2008-2010
Results
• Expanded operations in China market
• Expanded management foundation through acquisition of companies in Europe and the United States
• Generated synergies through consolidations within the Group
• Participated in dedicated automobile terminal in China
• Expanded car-related business
• Cultivated new businesses
• Steadily pursued cost-reductions
• Achieved record high profits in the final year of the plan
• Implemented shipping fleet expansion plan
• Advanced global development of the logistics business
• Accelerated environmental initiatives
Business BaseFiscal 2000 Fiscal 2010
Operating fleet size (vessels)
1.4 times603 827
Logistics center locations
4.8 times85 centers 412 centers
Fleet size
1.9 times32.0 million Kt (DWT) 60.2 million Kt (DWT)
Number of employees (consolidated)
2.0 times14,082 28,361
21ANNUAL REPORT 2011
45PERFORMANCE
65SUSTAINABILITY
73GOVERNANCE
87FACT DATA
93FINANCIAL DATA
14MANAGEMENT
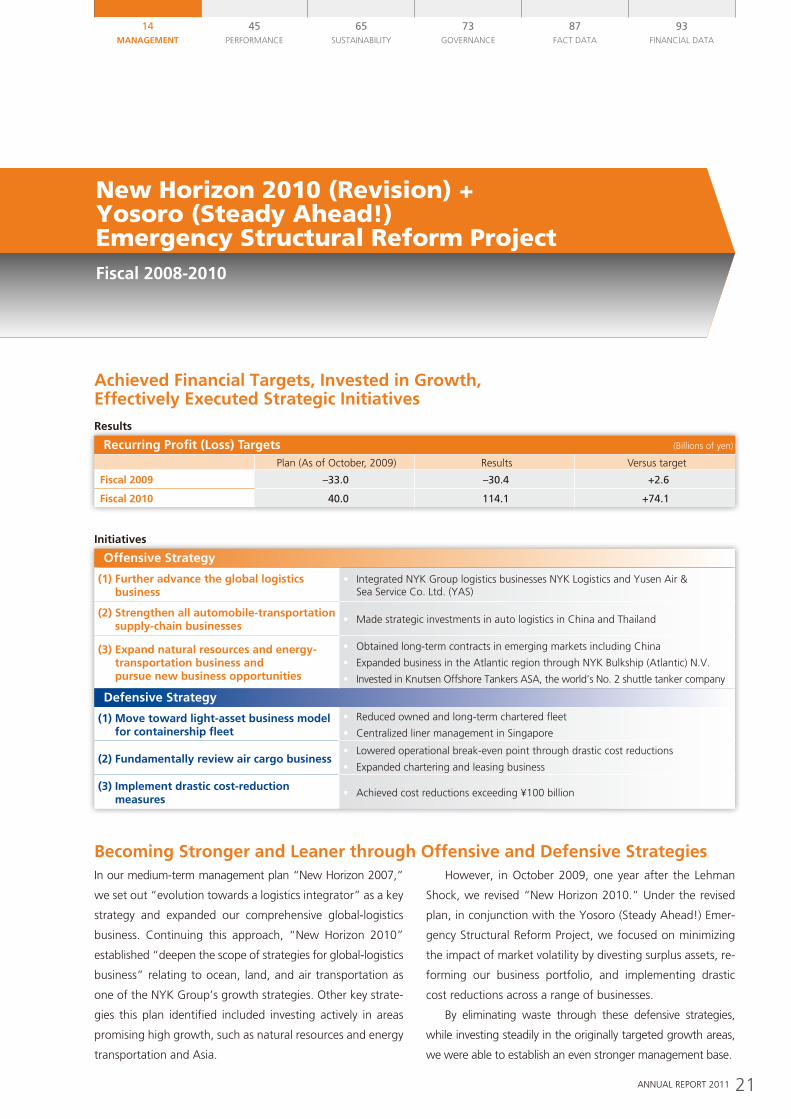
In our medium-term management plan “New Horizon 2007,”
we set out “evolution towards a logistics integrator” as a key
strategy and expanded our comprehensive global-logistics
business. Continuing this approach, “New Horizon 2010”
established “deepen the scope of strategies for global-logistics
business” relating to ocean, land, and air transportation as
one of the NYK Group’s growth strategies. Other key strate-
gies this plan identified included investing actively in areas
promising high growth, such as natural resources and energy
transportation and Asia.
However, in October 2009, one year after the Lehman
Shock, we revised “New Horizon 2010.” Under the revised
plan, in conjunction with the Yosoro (Steady Ahead!) Emer-
gency Structural Reform Project, we focused on minimizing
the impact of market volatility by divesting surplus assets, re-
forming our business portfolio, and implementing drastic
cost reductions across a range of businesses.
By eliminating waste through these defensive strategies,
while investing steadily in the originally targeted growth areas,
we were able to establish an even stronger management base.
Achieved Financial Targets, Invested in Growth, Effectively Executed Strategic Initiatives
Recurring Profit (Loss) Targets (Billions of yen)
Plan (As of October, 2009) Results Versus target
Fiscal 2009 –33.0 –30.4 +2.6
Fiscal 2010 40.0 114.1 +74.1
Results
Initiatives
Becoming Stronger and Leaner through Offensive and Defensive Strategies
NYK21 New Millennium DeclarationFiscal 2000-2002
NYK21 Forward 120Fiscal 2003-2004
Results
New Horizon 2007Fiscal 2005-2007
Results
New Horizon 2010 (Revision) + Yosoro (Steady Ahead!) Emergency Structural Reform ProjectFiscal 2008-2010
Results
• Expanded operations in China market
• Expanded management foundation through acquisition of companies in Europe and the United States
• Generated synergies through consolidations within the Group
• Participated in dedicated automobile terminal in China
• Expanded car-related business
• Cultivated new businesses
• Steadily pursued cost-reductions
• Achieved record high profits in the final year of the plan
• Implemented shipping fleet expansion plan
• Advanced global development of the logistics business
• Accelerated environmental initiatives
Offensive Strategy
(1) Further advance the global logistics business
• Integrated NYK Group logistics businesses NYK Logistics and Yusen Air & Sea Service Co. Ltd. (YAS)
(2) Strengthen all automobile-transportation supply-chain businesses
• Made strategic investments in auto logistics in China and Thailand
(3) Expand natural resources and energy-transportation business and pursue new business opportunities
• Obtained long-term contracts in emerging markets including China
• Expanded business in the Atlantic region through NYK Bulkship (Atlantic) N.V.
• Invested in Knutsen Offshore Tankers ASA, the world’s No. 2 shuttle tanker company
Defensive Strategy
(1) Move toward light-asset business model for containership fleet
• Reduced owned and long-term chartered fleet
• Centralized liner management in Singapore
(2) Fundamentally review air cargo business• Lowered operational break-even point through drastic cost reductions
• Expanded chartering and leasing business
(3) Implement drastic cost-reduction measures
• Achieved cost reductions exceeding ¥100 billion
22 NIPPON YUSEN KABUSHIKI KAISHA
“More Than Shipping 2013 — Grow with Asia, Expand across the Globe” — Plan Overview
(Billions of yen)
Current investment plan Additional investments Total
Containerships 29 0 29
Car carriers 80 110 190
Large-size bulk carriers 320 0 320
Small / medium-sized bulkers 370 100 470
Tankers 50 20 70
LNG, Offshore business 60 200 260
Other shipping 160 0 160
Logistics 1 30 31
Other non-shipping investments 230 40 270
1,300 500 1,800
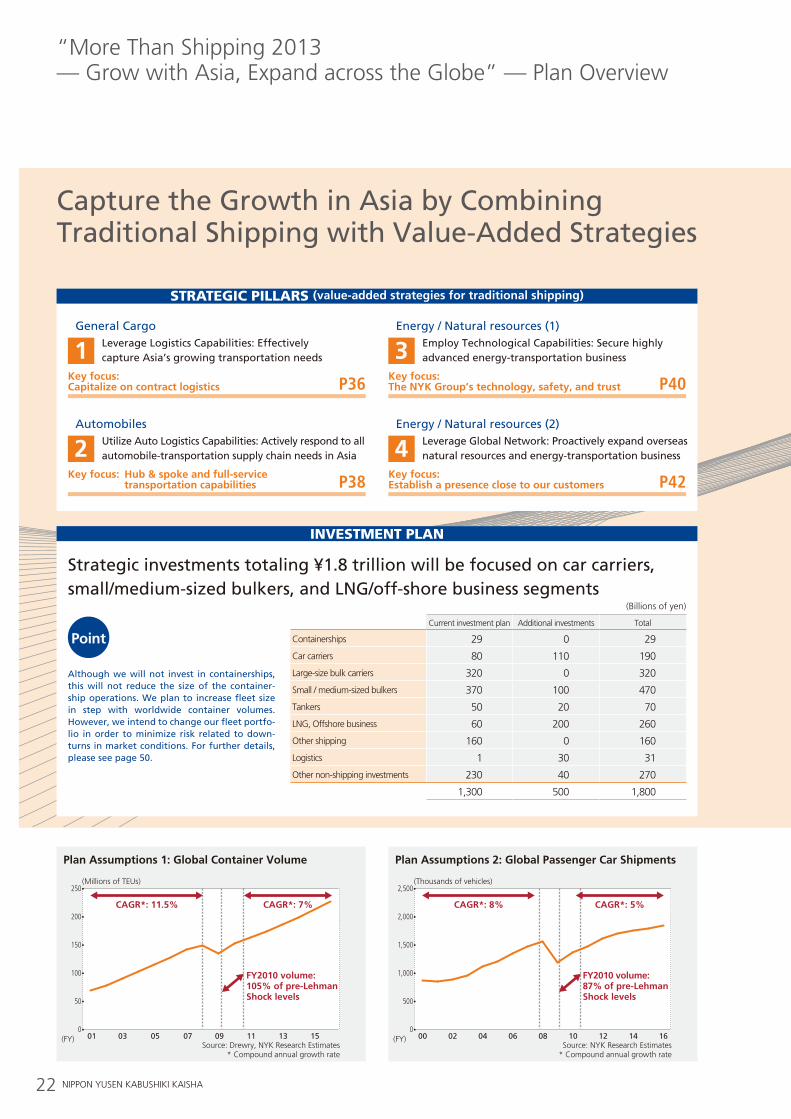
Capture the Growth in Asia by Combining Traditional Shipping with Value-Added Strategies
investMent PlAn
strAtegic PillArs (value-added strategies for traditional shipping)
General CargoLeverage Logistics Capabilities: Effectively capture Asia’s growing transportation needs1
Key focus: Capitalize on contract logistics P36
Energy / Natural resources (1)Employ Technological Capabilities: Secure highly advanced energy-transportation business3
Key focus: The NYK Group’s technology, safety, and trust P40
AutomobilesUtilize Auto Logistics Capabilities: Actively respond to all automobile-transportation supply chain needs in Asia2
Key focus: Hub & spoke and full-service transportation capabilities P38
Energy / Natural resources (2)Leverage Global Network: Proactively expand overseas natural resources and energy-transportation business4
Key focus: Establish a presence close to our customers P42
Although we will not invest in containerships, this will not reduce the size of the container-ship operations. We plan to increase fleet size in step with worldwide container volumes. However, we intend to change our fleet portfo-lio in order to minimize risk related to down-turns in market conditions. For further details, please see page 50.
Point
Strategic investments totaling ¥1.8 trillion will be focused on car carriers, small/medium-sized bulkers, and LNG/off-shore business segments
(Millions of TEUs)
CAGR*: 11.5%
250
200
100
50
CAGR*: 7%
150
0
Plan Assumptions 1: Global Container Volume
01 0503 07 09 11 13 15(FY)Source: Drewry, NYK Research Estimates
* Compound annual growth rate
FY2010 volume: 105% of pre-Lehman Shock levels
(Thousands of vehicles)
CAGR*: 8%
2,500
2,000
1,000
500
CAGR*: 5%
1,500
0
Plan Assumptions 2: Global Passenger Car Shipments
00 0402 06 08 10 12 14 16(FY)Source: NYK Research Estimates
* Compound annual growth rate
FY2010 volume: 87% of pre-Lehman Shock levels
23ANNUAL REPORT 2011
45PERFORMANCE
65SUSTAINABILITY
73GOVERNANCE
87FACT DATA
93FINANCIAL DATA
14MANAGEMENT
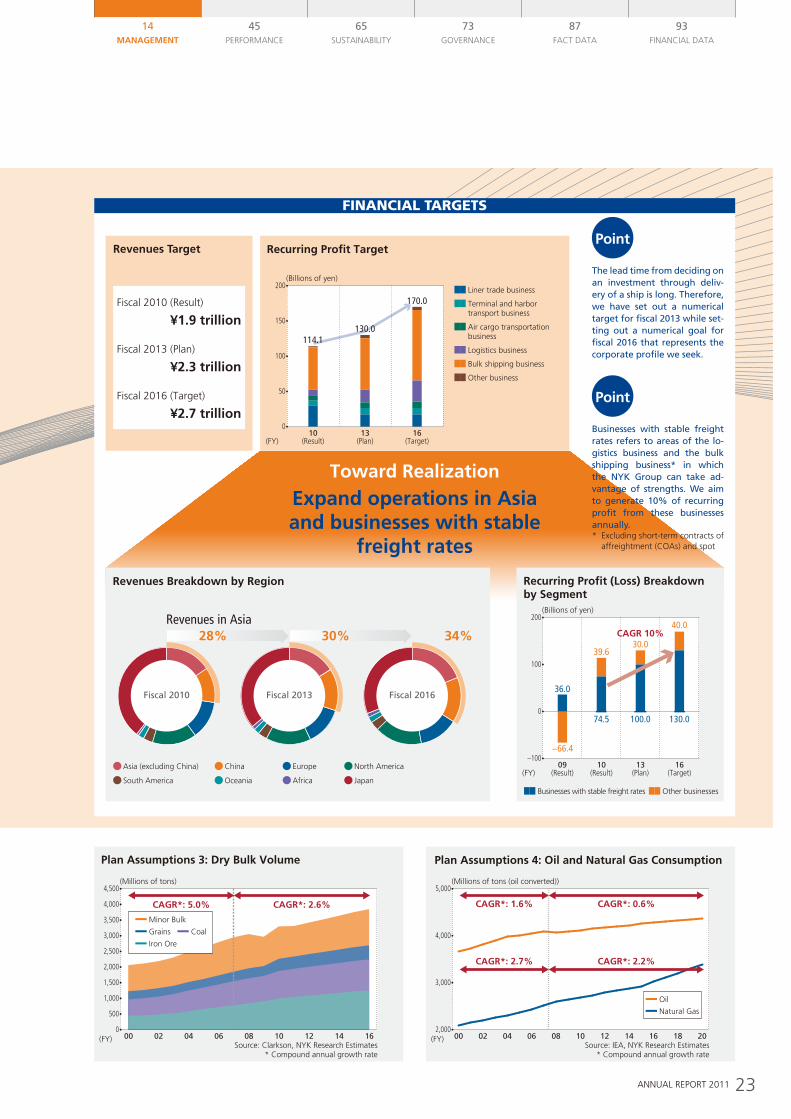
finAnciAl tArgets
The lead time from deciding on an investment through deliv-ery of a ship is long. Therefore, we have set out a numerical target for fiscal 2013 while set-ting out a numerical goal for fiscal 2016 that represents the corporate profile we seek.
Businesses with stable freight rates refers to areas of the lo-gistics business and the bulk shipping business* in which the NYK Group can take ad-vantage of strengths. We aim to generate 10% of recurring profit from these businesses annually.* Excluding short-term contracts of
affreightment (COAs) and spot
Point
Point
Revenues Breakdown by Region
Revenues in Asia
Fiscal 2010 Fiscal 2013 Fiscal 2016
Asia (excluding China) China Europe North America
South America Oceania Africa Japan
28% 30% 34%
(Billions of yen)
(FY)
200
100
09(Result)
10(Result)
16(Target)
13(Plan)
36.0
39.6
40.0
30.0
−66.4
74.5 130.0100.0
–100
0
Businesses with stable freight rates Other businesses
CAGR 10%
Recurring Profit (Loss) Breakdown by Segment
Recurring Profit Target
(Billions of yen)200
150
50
100
0
Liner trade business
Air cargo transportation business
Terminal and harbor transport business
Logistics business
Bulk shipping business
Other business
10(Result)
13(Plan)
16(Target)
170.0
130.0114.1
(FY)
Toward RealizationExpand operations in Asia and businesses with stable
freight rates
(Millions of tons)
CAGR*: 5.0%
4,500
4,000
3,500
3,000
2,500
2,000
1,000
500
CAGR*: 2.6%
1,500
0
Plan Assumptions 3: Dry Bulk Volume
00 0402 06 08 10 12 14 16(FY)Source: Clarkson, NYK Research Estimates
* Compound annual growth rate
Minor Bulk
Grains Coal
Iron Ore
Plan Assumptions 4: Oil and Natural Gas Consumption
00 0402 06 08 10 12 14 201816(FY)Source: IEA, NYK Research Estimates
* Compound annual growth rate
(Millions of tons (oil converted))
CAGR*: 1.6%
5,000
3,000
CAGR*: 0.6%
CAGR*: 2.7% CAGR*: 2.2%
4,000
2,000
Oil
Natural Gas
Fiscal 2010 (Result)
¥1.9 trillion
Fiscal 2013 (Plan)
¥2.3 trillion
Fiscal 2016 (Target)
¥2.7 trillion
Revenues Target
24 NIPPON YUSEN KABUSHIKI KAISHA
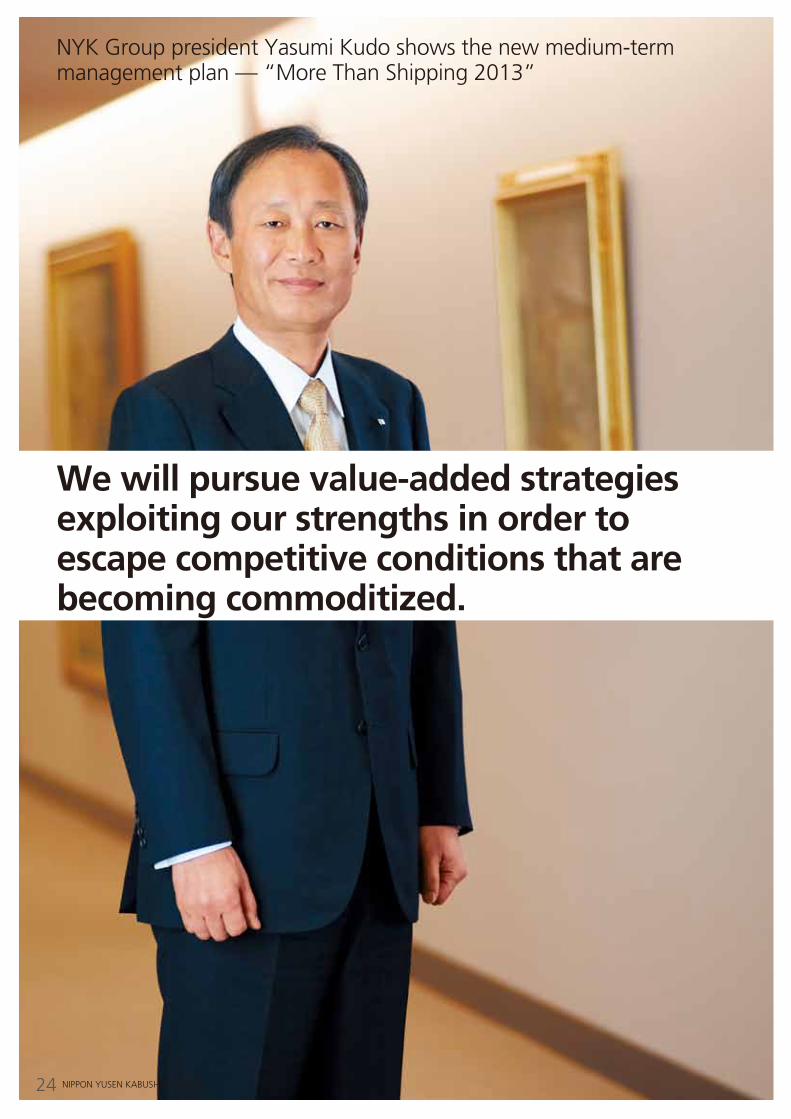
We will pursue value-added strategies exploiting our strengths in order to escape competitive conditions that are becoming commoditized.
NYK Group president Yasumi Kudo shows the new medium-term management plan — “More Than Shipping 2013”
25ANNUAL REPORT 2011
45PERFORMANCE
65SUSTAINABILITY
73GOVERNANCE
87FACT DATA
93FINANCIAL DATA
14MANAGEMENT
Q1How would you sum up the previous medium-term management plan, “New Horizon 2010,” and the NYK Group’s performance in fiscal 2010, ended March 31, 2011?
Q2You have announced a new medium-term management plan covering the three years through fiscal 2013. What management tasks did you have in mind as you prepared the plan?
Q8Could you outline the NYK Group’s basic approach to corporate value enhancement and returns to shareholders?
Q5 What are the keys to achieving the targets of “More Than Shipping 2013”?
Q3 Can you explain the thinking behind “More Than Shipping 2013”?
Q7What kind of corporate social responsibility (CSR) initiatives does “More Than Shipping 2013” include?
Q6How do you view fiscal 2011, ending March 31, 2012, the first year of the new medium-term management plan?
Q4 Why do you mention Asia in the plan’s subtitle?
Previous Medium-Term Management Plan
New Medium-Term Management Plan, “More Than Shipping 2013”
Corporate Value Enhancement and Returns to Shareholders
26 NIPPON YUSEN KABUSHIKI KAISHA
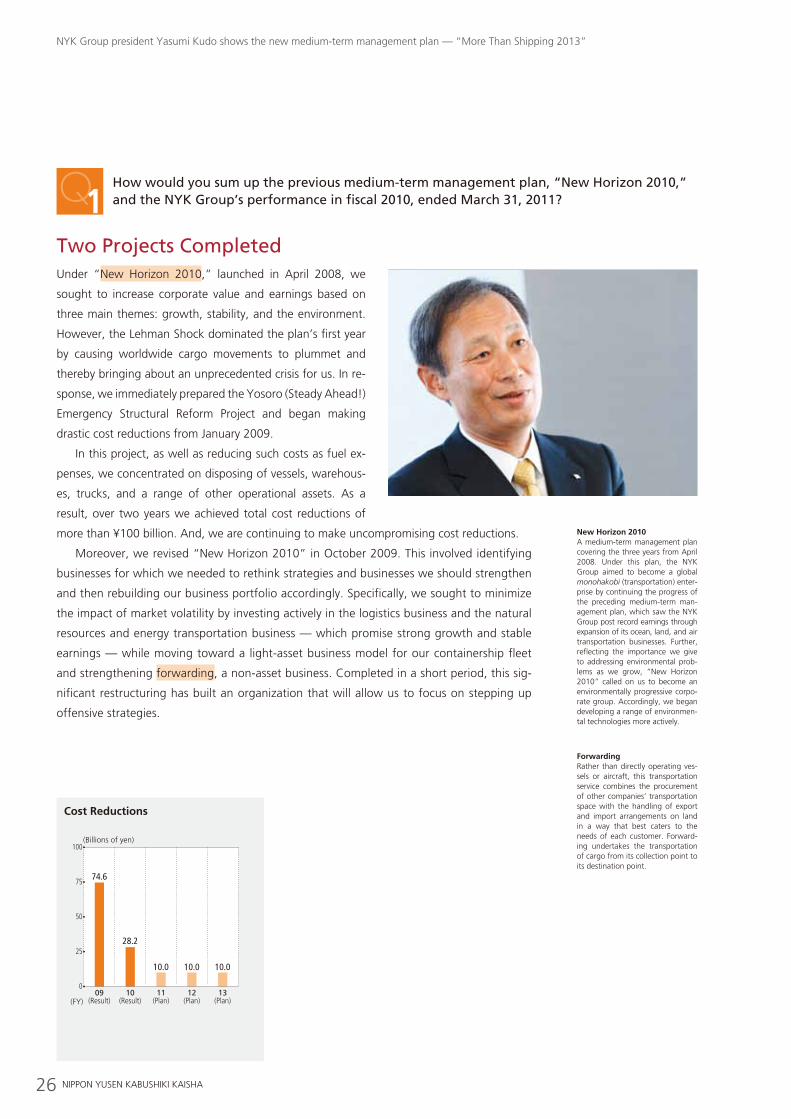
Two Projects CompletedUnder “New Horizon 2010,” launched in April 2008, we
sought to increase corporate value and earnings based on
three main themes: growth, stability, and the environment.
However, the Lehman Shock dominated the plan’s first year
by causing worldwide cargo movements to plummet and
thereby bringing about an unprecedented crisis for us. In re-
sponse, we immediately prepared the Yosoro (Steady Ahead!)
Emergency Structural Reform Project and began making
drastic cost reductions from January 2009.
In this project, as well as reducing such costs as fuel ex-
penses, we concentrated on disposing of vessels, warehous-
es, trucks, and a range of other operational assets. As a
result, over two years we achieved total cost reductions of
more than ¥100 billion. And, we are continuing to make uncompromising cost reductions.
Moreover, we revised “New Horizon 2010” in October 2009. This involved identifying
businesses for which we needed to rethink strategies and businesses we should strengthen
and then rebuilding our business portfolio accordingly. Specifically, we sought to minimize
the impact of market volatility by investing actively in the logistics business and the natural
resources and energy transportation business — which promise strong growth and stable
earnings — while moving toward a light-asset business model for our containership fleet
and strengthening forwarding, a non-asset business. Completed in a short period, this sig-
nificant restructuring has built an organization that will allow us to focus on stepping up
offensive strategies.
Q1How would you sum up the previous medium-term management plan, “New Horizon 2010,” and the NYK Group’s performance in fiscal 2010, ended March 31, 2011?
Cost Reductions
09(Result)(FY)
10(Result)
11(Plan)
12(Plan)
13(Plan)
74.6
28.2
10.0 10.0
(Billions of yen)
10.0
100
75
50
25
0
New Horizon 2010A medium-term management plan covering the three years from April 2008. Under this plan, the NYK Group aimed to become a global monohakobi (transportation) enter-prise by continuing the progress of the preceding medium-term man-agement plan, which saw the NYK Group post record earnings through expansion of its ocean, land, and air transportation businesses. Further, reflecting the importance we give to addressing environmental prob-lems as we grow, “New Horizon 2010” called on us to become an environmentally progressive corpo-rate group. Accordingly, we began developing a range of environmen-tal technologies more actively.
ForwardingRather than directly operating ves-sels or aircraft, this transportation service combines the procurement of other companies’ transportation space with the handling of export and import arrangements on land in a way that best caters to the needs of each customer. Forward-ing undertakes the transportation of cargo from its collection point to its destination point.
NYK Group president Yasumi Kudo shows the new medium-term management plan — “More Than Shipping 2013”
27ANNUAL REPORT 2011
45PERFORMANCE
65SUSTAINABILITY
73GOVERNANCE
87FACT DATA
93FINANCIAL DATA
14MANAGEMENT
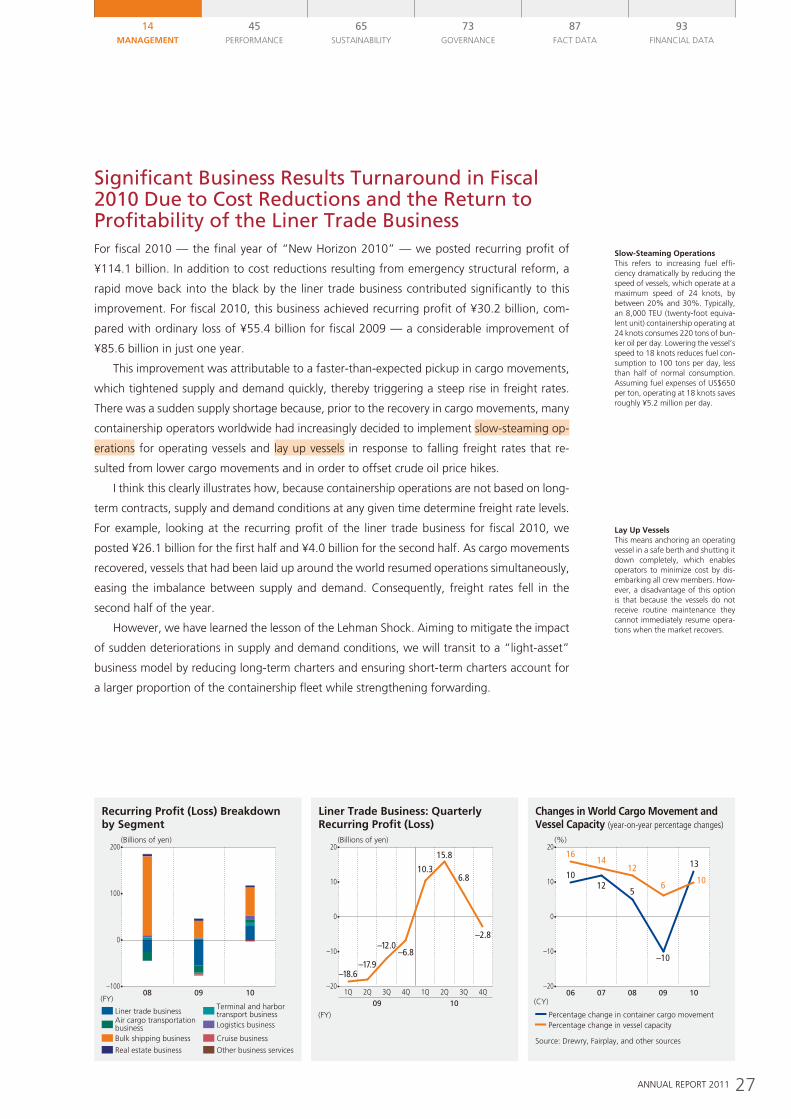
Significant Business Results Turnaround in Fiscal 2010 Due to Cost Reductions and the Return to Profitability of the Liner Trade BusinessFor fiscal 2010 — the final year of “New Horizon 2010” — we posted recurring profit of
¥114.1 billion. In addition to cost reductions resulting from emergency structural reform, a
rapid move back into the black by the liner trade business contributed significantly to this
improvement. For fiscal 2010, this business achieved recurring profit of ¥30.2 billion, com-
pared with ordinary loss of ¥55.4 billion for fiscal 2009 — a considerable improvement of
¥85.6 billion in just one year.
This improvement was attributable to a faster-than-expected pickup in cargo movements,
which tightened supply and demand quickly, thereby triggering a steep rise in freight rates.
There was a sudden supply shortage because, prior to the recovery in cargo movements, many
containership operators worldwide had increasingly decided to implement slow-steaming op-
erations for operating vessels and lay up vessels in response to falling freight rates that re-
sulted from lower cargo movements and in order to offset crude oil price hikes.
I think this clearly illustrates how, because containership operations are not based on long-
term contracts, supply and demand conditions at any given time determine freight rate levels.
For example, looking at the recurring profit of the liner trade business for fiscal 2010, we
posted ¥26.1 billion for the first half and ¥4.0 billion for the second half. As cargo movements
recovered, vessels that had been laid up around the world resumed operations simultaneously,
easing the imbalance between supply and demand. Consequently, freight rates fell in the
second half of the year.
However, we have learned the lesson of the Lehman Shock. Aiming to mitigate the impact
of sudden deteriorations in supply and demand conditions, we will transit to a “light-asset”
business model by reducing long-term charters and ensuring short-term charters account for
a larger proportion of the containership fleet while strengthening forwarding.
(Billions of yen)200
100
08 09 10(FY)
–100
0
Recurring Profit (Loss) Breakdown by Segment
Liner trade businessTerminal and harbor transport businessLogistics business
Air cargo transportation business
Cruise businessBulk shipping business
Other business servicesReal estate business
(Billions of yen)20
10
–10
0
–20
Liner Trade Business: Quarterly Recurring Profit (Loss)
–18.6–17.9
–12.0–6.8
10.3
15.8
6.8
–2.8
09 103Q2Q 4Q1Q 3Q2Q 4Q1Q
(FY)
(%)
13
10
20
10
–10
–20
0
Changes in World Cargo Movement andVessel Capacity (year-on-year percentage changes)
06(CY)
07 08 09 10
10
16
12
14
5
12
–10
6
Percentage change in vessel capacity Percentage change in container cargo movement
Source: Drewry, Fairplay, and other sources
Slow-Steaming OperationsThis refers to increasing fuel effi-ciency dramatically by reducing the speed of vessels, which operate at a maximum speed of 24 knots, by between 20% and 30%. Typically, an 8,000 TEU (twenty-foot equiva-lent unit) containership operating at 24 knots consumes 220 tons of bun-ker oil per day. Lowering the vessel’s speed to 18 knots reduces fuel con-sumption to 100 tons per day, less than half of normal consumption. Assuming fuel expenses of US$650 per ton, operating at 18 knots saves roughly ¥5.2 million per day.
Lay Up VesselsThis means anchoring an operating vessel in a safe berth and shutting it down completely, which enables operators to minimize cost by dis-embarking all crew members. How-ever, a disadvantage of this option is that because the vessels do not receive routine maintenance they cannot immediately resume opera-tions when the market recovers.
28 NIPPON YUSEN KABUSHIKI KAISHA
NYK Group president Yasumi Kudo shows the new medium-term management plan — “More Than Shipping 2013”
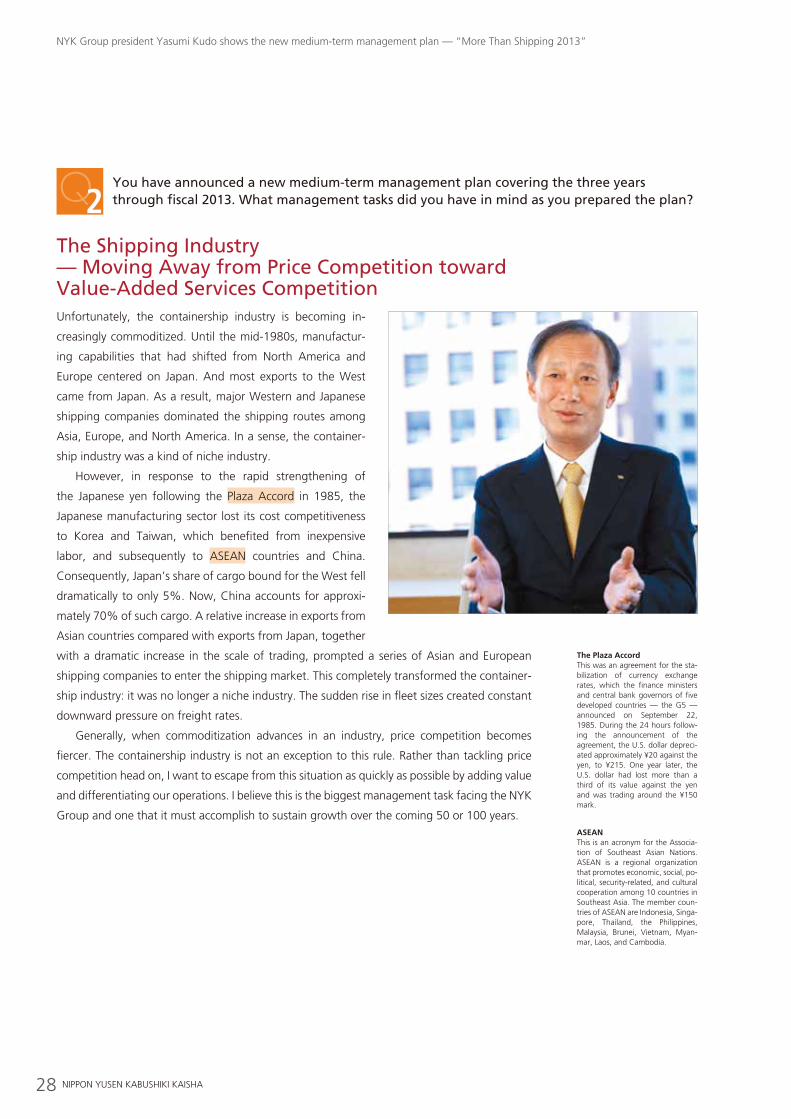
The Shipping Industry — Moving Away from Price Competition toward Value-Added Services CompetitionUnfortunately, the containership industry is becoming in-
creasingly commoditized. Until the mid-1980s, manufactur-
ing capabilities that had shifted from North America and
Europe centered on Japan. And most exports to the West
came from Japan. As a result, major Western and Japanese
shipping companies dominated the shipping routes among
Asia, Europe, and North America. In a sense, the container-
ship industry was a kind of niche industry.
However, in response to the rapid strengthening of
the Japanese yen following the Plaza Accord in 1985, the
Japanese manufacturing sector lost its cost competitiveness
to Korea and Taiwan, which benefited from inexpensive
labor, and subsequently to ASEAN countries and China.
Consequently, Japan’s share of cargo bound for the West fell
dramatically to only 5%. Now, China accounts for approxi-
mately 70% of such cargo. A relative increase in exports from
Asian countries compared with exports from Japan, together
with a dramatic increase in the scale of trading, prompted a series of Asian and European
shipping companies to enter the shipping market. This completely transformed the container-
ship industry: it was no longer a niche industry. The sudden rise in fleet sizes created constant
downward pressure on freight rates.
Generally, when commoditization advances in an industry, price competition becomes
fiercer. The containership industry is not an exception to this rule. Rather than tackling price
competition head on, I want to escape from this situation as quickly as possible by adding value
and differentiating our operations. I believe this is the biggest management task facing the NYK
Group and one that it must accomplish to sustain growth over the coming 50 or 100 years.
Q2You have announced a new medium-term management plan covering the three years through fiscal 2013. What management tasks did you have in mind as you prepared the plan?
The Plaza AccordThis was an agreement for the sta-bilization of currency exchange rates, which the finance ministers and central bank governors of five developed countries — the G5 — announced on September 22, 1985. During the 24 hours follow-ing the announcement of the agreement, the U.S. dollar depreci-ated approximately ¥20 against the yen, to ¥215. One year later, the U.S. dollar had lost more than a third of its value against the yen and was trading around the ¥150 mark.
ASEANThis is an acronym for the Associa-tion of Southeast Asian Nations. ASEAN is a regional organization that promotes economic, social, po-litical, security-related, and cultural cooperation among 10 countries in Southeast Asia. The member coun-tries of ASEAN are Indonesia, Singa-pore, Thailand, the Philippines, Malaysia, Brunei, Vietnam, Myan-mar, Laos, and Cambodia.
29ANNUAL REPORT 2011
45PERFORMANCE
65SUSTAINABILITY
73GOVERNANCE
87FACT DATA
93FINANCIAL DATA
14MANAGEMENT
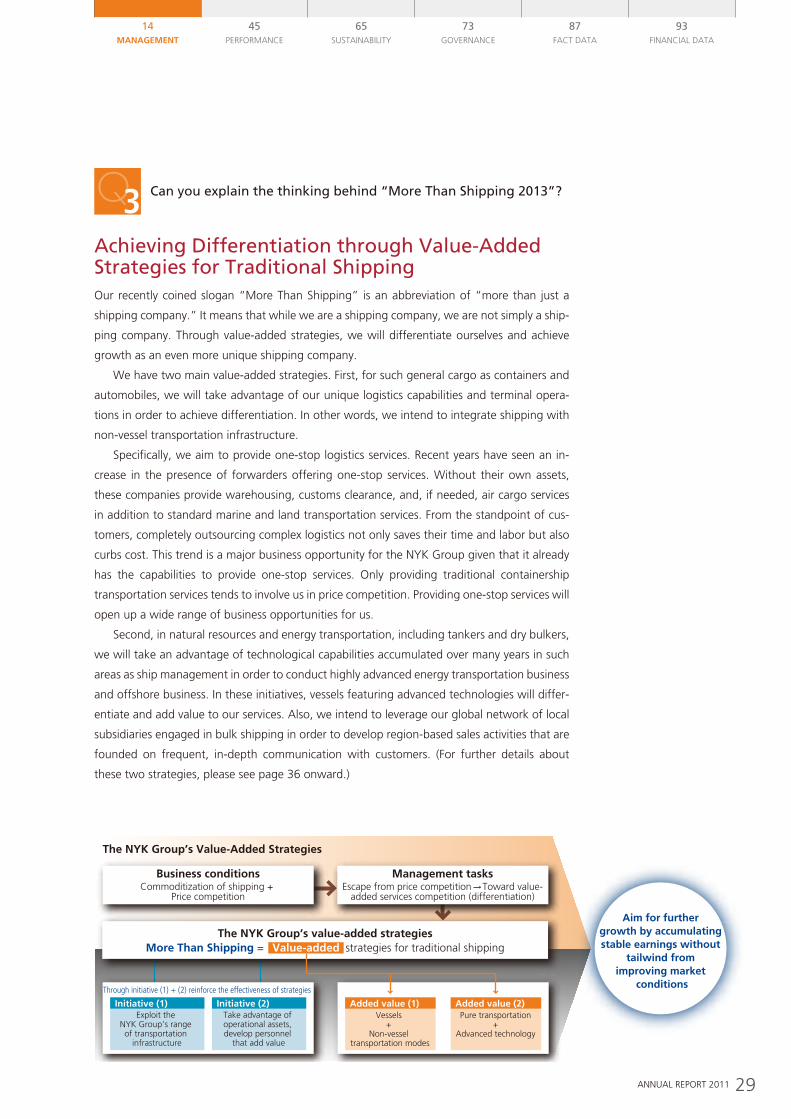
Achieving Differentiation through Value-Added Strategies for Traditional ShippingOur recently coined slogan “More Than Shipping” is an abbreviation of “more than just a
shipping company.” It means that while we are a shipping company, we are not simply a ship-
ping company. Through value-added strategies, we will differentiate ourselves and achieve
growth as an even more unique shipping company.
We have two main value-added strategies. First, for such general cargo as containers and
automobiles, we will take advantage of our unique logistics capabilities and terminal opera-
tions in order to achieve differentiation. In other words, we intend to integrate shipping with
non-vessel transportation infrastructure.
Specifically, we aim to provide one-stop logistics services. Recent years have seen an in-
crease in the presence of forwarders offering one-stop services. Without their own assets,
these companies provide warehousing, customs clearance, and, if needed, air cargo services
in addition to standard marine and land transportation services. From the standpoint of cus-
tomers, completely outsourcing complex logistics not only saves their time and labor but also
curbs cost. This trend is a major business opportunity for the NYK Group given that it already
has the capabilities to provide one-stop services. Only providing traditional containership
transportation services tends to involve us in price competition. Providing one-stop services will
open up a wide range of business opportunities for us.
Second, in natural resources and energy transportation, including tankers and dry bulkers,
we will take an advantage of technological capabilities accumulated over many years in such
areas as ship management in order to conduct highly advanced energy transportation business
and offshore business. In these initiatives, vessels featuring advanced technologies will differ-
entiate and add value to our services. Also, we intend to leverage our global network of local
subsidiaries engaged in bulk shipping in order to develop region-based sales activities that are
founded on frequent, in-depth communication with customers. (For further details about
these two strategies, please see page 36 onward.)
Q3 Can you explain the thinking behind “More Than Shipping 2013”?
The NYK Group’s Value-Added Strategies
Business conditionsCommoditization of shipping +
Price competition
Management tasksEscape from price competition Toward value-
added services competition (differentiation)
The NYK Group’s value-added strategiesMore Than Shipping = strategies for traditional shipping
Through initiative (1) + (2) reinforce the effectiveness of strategies
Aim for further growth by accumulating stable earnings without
tailwind from improving market
conditions
Initiative (1)Exploit the
NYK Group’s range of transportation
infrastructure
Initiative (2)Take advantage of operational assets, develop personnel
that add value
Added value (1)Vessels
+ Non-vessel
transportation modes
Added value (2)Pure transportation
+ Advanced technology
Value-added
30 NIPPON YUSEN KABUSHIKI KAISHA
NYK Group president Yasumi Kudo shows the new medium-term management plan — “More Than Shipping 2013”
Q4 Why do you mention Asia in the plan’s subtitle?
Global Economic Growth Will Center on AsiaGoing forward, given that Japan is unlikely to see significant increases in cargo imports and
exports, Asia is indispensable for the NYK Group’s growth.
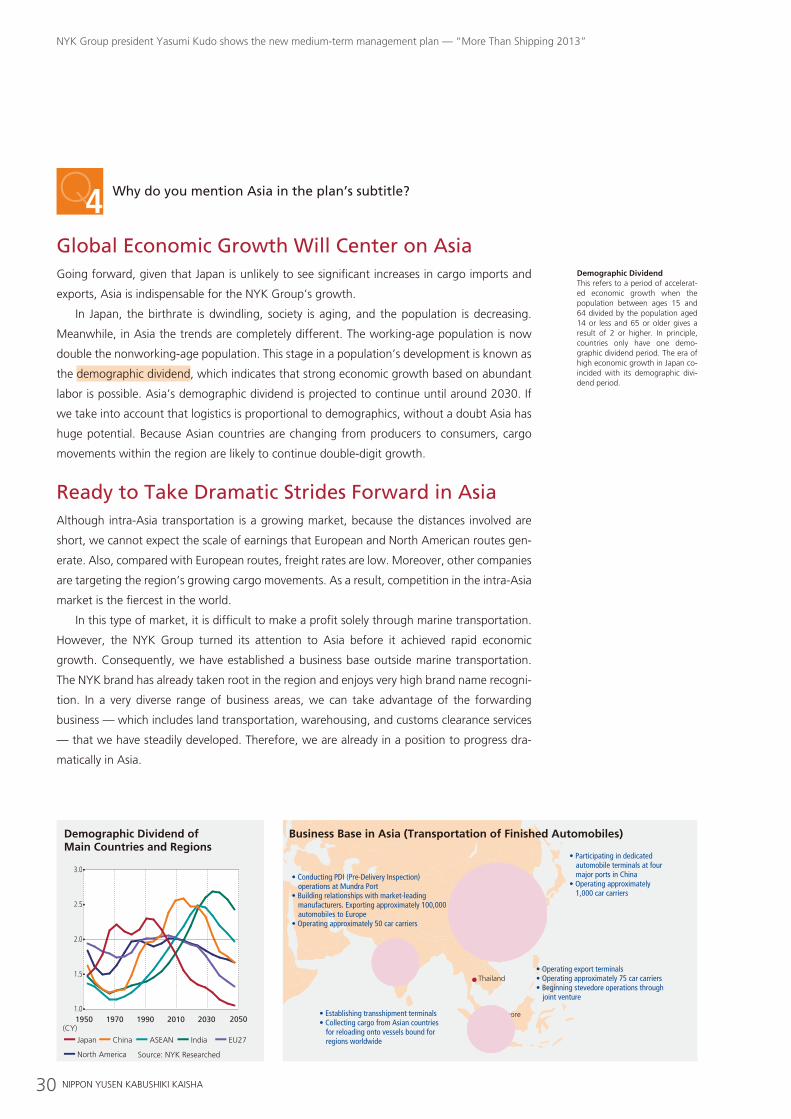
In Japan, the birthrate is dwindling, society is aging, and the population is decreasing.
Meanwhile, in Asia the trends are completely different. The working-age population is now
double the nonworking-age population. This stage in a population’s development is known as
the demographic dividend, which indicates that strong economic growth based on abundant
labor is possible. Asia’s demographic dividend is projected to continue until around 2030. If
we take into account that logistics is proportional to demographics, without a doubt Asia has
huge potential. Because Asian countries are changing from producers to consumers, cargo
movements within the region are likely to continue double-digit growth.
Ready to Take Dramatic Strides Forward in AsiaAlthough intra-Asia transportation is a growing market, because the distances involved are
short, we cannot expect the scale of earnings that European and North American routes gen-
erate. Also, compared with European routes, freight rates are low. Moreover, other companies
are targeting the region’s growing cargo movements. As a result, competition in the intra-Asia
market is the fiercest in the world.
In this type of market, it is difficult to make a profit solely through marine transportation.
However, the NYK Group turned its attention to Asia before it achieved rapid economic
growth. Consequently, we have established a business base outside marine transportation.
The NYK brand has already taken root in the region and enjoys very high brand name recogni-
tion. In a very diverse range of business areas, we can take advantage of the forwarding
business — which includes land transportation, warehousing, and customs clearance services
— that we have steadily developed. Therefore, we are already in a position to progress dra-
matically in Asia.
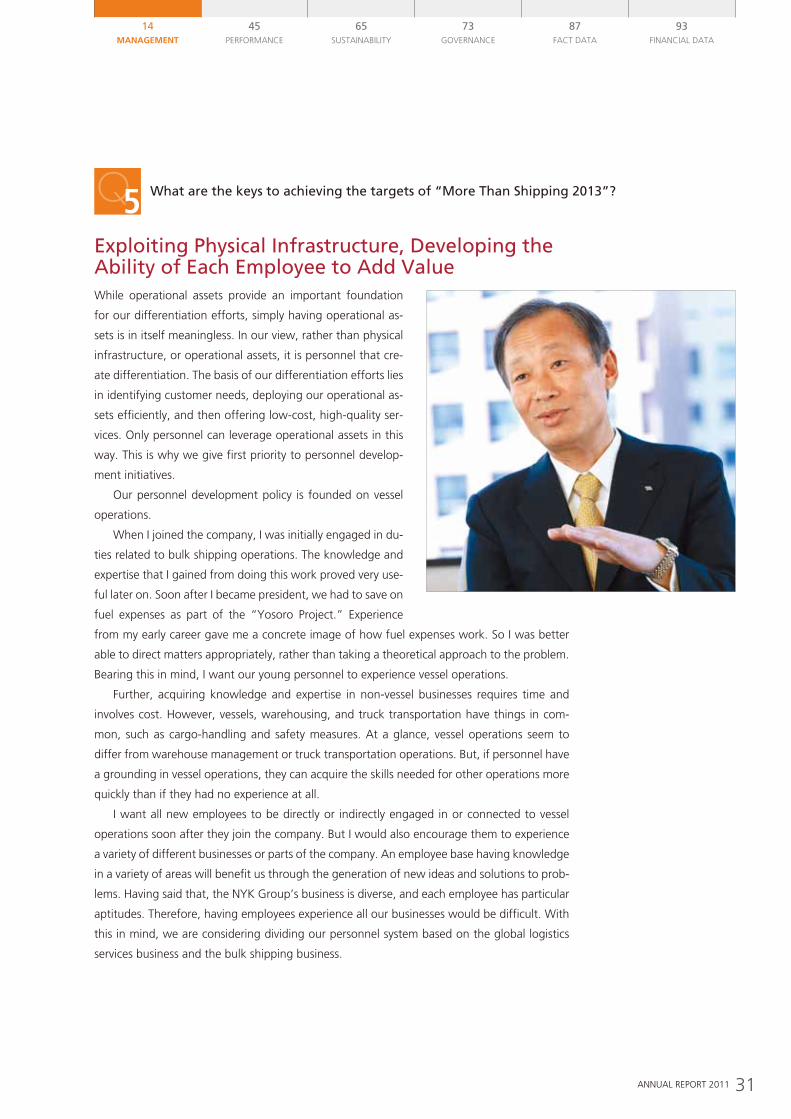
• Operating export terminals• Operating approximately 75 car carriers• Beginning stevedore operations through joint venture
• Participating in dedicated automobile terminals at four major ports in China• Operating approximately 1,000 car carriers
• Conducting PDI (Pre-Delivery Inspection) operations at Mundra Port• Building relationships with market-leading manufacturers. Exporting approximately 100,000 automobiles to Europe• Operating approximately 50 car carriers
• Establishing transshipment terminals• Collecting cargo from Asian countries for reloading onto vessels bound for regions worldwide
Business Base in Asia (Transportation of Finished Automobiles)
Tianjin
Dalian
Shanghai
Guangzhou
Singapore
Thailand
Mundra
Demographic DividendThis refers to a period of accelerat-ed economic growth when the population between ages 15 and 64 divided by the population aged 14 or less and 65 or older gives a result of 2 or higher. In principle, countries only have one demo-graphic dividend period. The era of high economic growth in Japan co-incided with its demographic divi-dend period.
Demographic Dividend of Main Countries and Regions
1950 1970 1990 2010 2030(CY)
2050
Japan China ASEAN India EU27
North America
3.0
2.5
1.5
1.0
2.0
Source: NYK Researched
31ANNUAL REPORT 2011
45PERFORMANCE
65SUSTAINABILITY
73GOVERNANCE
87FACT DATA
93FINANCIAL DATA
14MANAGEMENT
Q5 What are the keys to achieving the targets of “More Than Shipping 2013”?
Exploiting Physical Infrastructure, Developing the Ability of Each Employee to Add ValueWhile operational assets provide an important foundation
for our differentiation efforts, simply having operational as-
sets is in itself meaningless. In our view, rather than physical
infrastructure, or operational assets, it is personnel that cre-
ate differentiation. The basis of our differentiation efforts lies
in identifying customer needs, deploying our operational as-
sets efficiently, and then offering low-cost, high-quality ser-
vices. Only personnel can leverage operational assets in this
way. This is why we give first priority to personnel develop-
ment initiatives.
Our personnel development policy is founded on vessel
operations.
When I joined the company, I was initially engaged in du-
ties related to bulk shipping operations. The knowledge and
expertise that I gained from doing this work proved very use-
ful later on. Soon after I became president, we had to save on
fuel expenses as part of the “Yosoro Project.” Experience
from my early career gave me a concrete image of how fuel expenses work. So I was better
able to direct matters appropriately, rather than taking a theoretical approach to the problem.
Bearing this in mind, I want our young personnel to experience vessel operations.
Further, acquiring knowledge and expertise in non-vessel businesses requires time and
involves cost. However, vessels, warehousing, and truck transportation have things in com-
mon, such as cargo-handling and safety measures. At a glance, vessel operations seem to
differ from warehouse management or truck transportation operations. But, if personnel have
a grounding in vessel operations, they can acquire the skills needed for other operations more
quickly than if they had no experience at all.
I want all new employees to be directly or indirectly engaged in or connected to vessel
operations soon after they join the company. But I would also encourage them to experience
a variety of different businesses or parts of the company. An employee base having knowledge
in a variety of areas will benefit us through the generation of new ideas and solutions to prob-
lems. Having said that, the NYK Group’s business is diverse, and each employee has particular
aptitudes. Therefore, having employees experience all our businesses would be difficult. With
this in mind, we are considering dividing our personnel system based on the global logistics
services business and the bulk shipping business.
32 NIPPON YUSEN KABUSHIKI KAISHA
NYK Group president Yasumi Kudo shows the new medium-term management plan — “More Than Shipping 2013”
A Year of Concentrating on Generating Stable EarningsUnder the revised “New Horizon 2010” medium-term management plan and the “Yosoro
Project,” we advanced initiatives focused on two types of stability. The first initiative was the
reduction of volatility in our container business through the implementation of a “light-asset”
model. The second effort sought stability in earnings by acquiring long-term contracts in natu-
ral resources and energy transportation. In fiscal 2010, our aim was to accumulate stable
earnings and to achieve solid growth even without the support of the soaring dry bulk market
that we had in 2007. We will adhere to this strategy under the new medium-term manage-
ment plan, “More Than Shipping 2013.”
Against this backdrop, in fiscal 2011 we want to concentrate particularly on businesses
with stable freight rates. By “businesses with stable freight rates,” we mean the logistics busi-
ness in the global logistics business and ships under long-term contracts in the bulk shipping
business. There is a tendency to view the logistics business as low-margin operations. In fact,
however, this business provides wide-ranging points of contact with customers and generates
stable earnings. The bulk shipping business is based on long-term contracts and therefore
promises stable earnings. Among certain types of bulk carriers about 50% of vessels are under
long-term contracts. But for most types of bulk carriers, 80% of vessels are under long-term
contracts. Going forward, we intend to win as many long-term contracts as possible. Further,
we hope long-term contracts will deepen relationships of trust with customers and encourage
them to conclude contracts of affreightment (COAs) and contracts on a voyage-by-voyage
basis, known as spot contracts, with us. In these ways, we look forward to widening the scope
of our business opportunities.
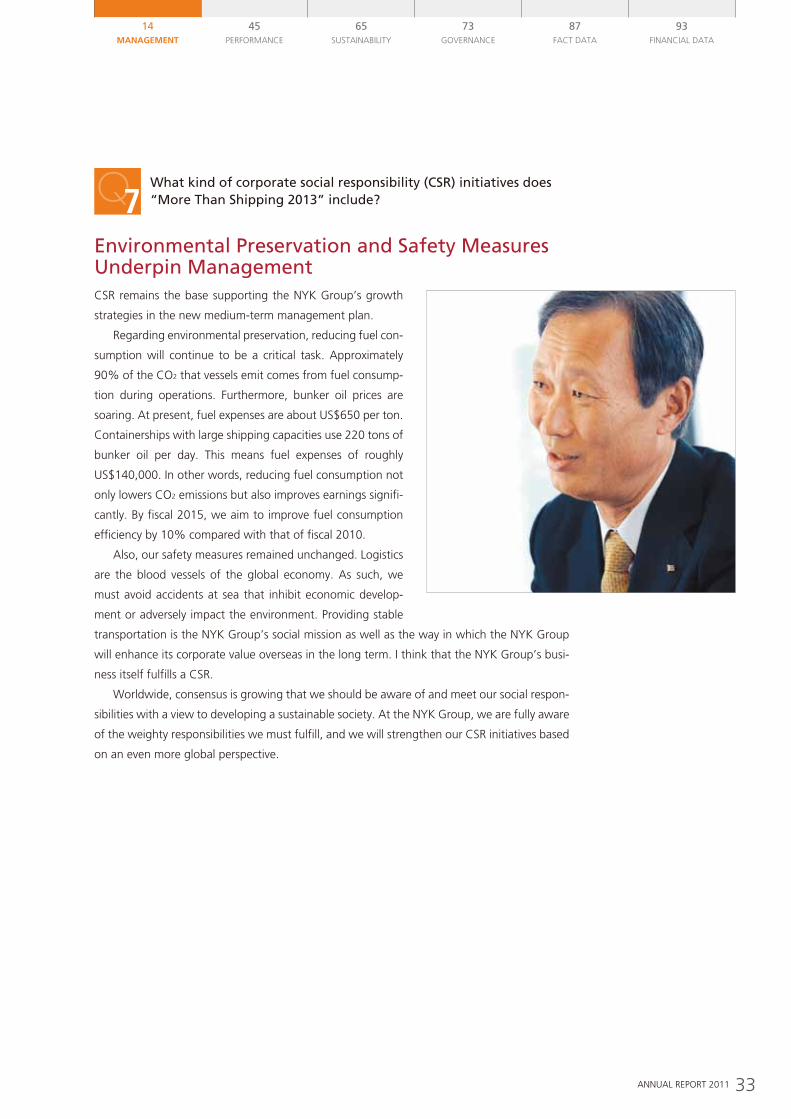
Through businesses with stable freight rates, we plan to earn the majority of the recurring
profit targeted in “More Than Shipping 2013.” Aiming to generate recurring profit of ¥100
billion from businesses with stable freight rates in fiscal 2013, we will take decisive measures
in the current fiscal year as the first year of the medium-term management plan.
Q6How do you view fiscal 2011, ending March 31, 2012, the first year of the new medium-term management plan?
Obtain Long-Term Contracts for Bulk / Energy Resources Transportation
The NYK Group’s operating fleet size
(vessels)
Percentage of long-term charter contracts
Capesize 105 80%
Panamax 84 55%
Wood chip carriers 50 80%
VLCC 35 85%
LNG carriers 63 100%
COAThis is an abbreviation for contract of affreightment. COAs are con-tracts for the transportation of a certain volume of a specific cargo from a specific port where cargo is loaded to a specific port where car-go is unloaded over a certain period and at a certain freight rate.
(Billions of yen)
(FY)
200
100
09(Result)
10(Result)
16(Plan)
13(Plan)
36.0
39.6
40.0
30.0
−66.4
74.5 130.0100.0
–100
0
Businesses with stable freight rates
Other businesses * Compound annual growth rate
CAGR* 10%
Earnings from Businesses with Stable Freight Rates
33ANNUAL REPORT 2011
45PERFORMANCE
65SUSTAINABILITY
73GOVERNANCE
87FACT DATA
93FINANCIAL DATA
14MANAGEMENT
Environmental Preservation and Safety Measures Underpin ManagementCSR remains the base supporting the NYK Group’s growth
strategies in the new medium-term management plan.
Regarding environmental preservation, reducing fuel con-
sumption will continue to be a critical task. Approximately
90% of the CO2 that vessels emit comes from fuel consump-
tion during operations. Furthermore, bunker oil prices are
soaring. At present, fuel expenses are about US$650 per ton.
Containerships with large shipping capacities use 220 tons of
bunker oil per day. This means fuel expenses of roughly
US$140,000. In other words, reducing fuel consumption not
only lowers CO2 emissions but also improves earnings signifi-
cantly. By fiscal 2015, we aim to improve fuel consumption
efficiency by 10% compared with that of fiscal 2010.
Also, our safety measures remained unchanged. Logistics
are the blood vessels of the global economy. As such, we
must avoid accidents at sea that inhibit economic develop-
ment or adversely impact the environment. Providing stable
transportation is the NYK Group’s social mission as well as the way in which the NYK Group
will enhance its corporate value overseas in the long term. I think that the NYK Group’s busi-
ness itself fulfills a CSR.
Worldwide, consensus is growing that we should be aware of and meet our social respon-
sibilities with a view to developing a sustainable society. At the NYK Group, we are fully aware
of the weighty responsibilities we must fulfill, and we will strengthen our CSR initiatives based
on an even more global perspective.
Q7What kind of corporate social responsibility (CSR) initiatives does “More Than Shipping 2013” include?
34 NIPPON YUSEN KABUSHIKI KAISHA
NYK Group president Yasumi Kudo shows the new medium-term management plan — “More Than Shipping 2013”
Actively Undertaking Necessary Investment“More Than Shipping 2013” earmarks a total of ¥1.8 trillion for investment over six years. This
includes investment in car carriers and small and medium-sized bulkers of approximately ¥700
billion as well as a roughly ¥300 billion investment in the offshore business near upstream
natural resources development and LNG businesses, business areas where advanced techno-
logical capabilities set us apart from competitors. In particular, developing the offshore busi-
ness represents entry into a business area that is slightly different from the marine
transportation business we have been engaged in to date. We hope the offshore business will
become a driver of new growth because, as well as being likely to see demand, this business
is a challenging area for companies to enter due to the technological capabilities it calls for.
Having many investment projects is a fortunate situation to be in. Because logistics is a
growing industry, and because it operates on the world stage, the number of investment
projects is increasing naturally. In my view, when we have investment projects, we should find
the best portfolio to maximize returns, and thereby increase corporate value. Of course, I fully
understand that shareholders expect dividends. However, if there are good opportunities to
contribute to share value, investment needs to be prioritized over dividends. I would like our
shareholders to understand that for the time being we are targeting a consolidated payout
ratio of approximately 25%. If in the future the number of investment projects declines, at
that juncture we promise to consider revising our consolidated payout ratio target.
Q8Could you outline the NYK Group’s basic approach to corporate value enhancement and returns to shareholders?
Dividends per Share and Dividend Payout Ratio
06(FY)
07 08 09 10
18.0
24.0
15.0
4.0
(Yen) (%)
11.0
30
0
15
30
0
Dividends per share (left scale)
Dividend payout ratio (right scale)
34.025.8
32.823.8
0
40
80
The Offshore BusinessAt present, most crude oil and nat-ural gas is extracted from land or shallow seabeds. However, produc-tion volumes are declining year by year, and the areas suited to such extraction are limited. As a result, deep-sea oil fields are receiving at-tention. Natural resource develop-ment companies have begun investing actively in such oil fields, which harbor considerable reserves. The NYK Group entered the off-shore business in earnest by estab-lishing the Offshore Business Group in October 2008.
(Billions of yen)
Current investment plan Additional investments Total
Containerships 29 0 29
Car carriers 80 110 190
Large-size bulk carriers 320 0 320
Small / medium-sized bulkers 370 100 470
Tankers 50 20 70
LNG, Offshore business 60 200 260
Other shipping 160 0 160
Logistics 1 30 31
Other non-shipping investments 230 40 270
1,300 500 1,800
Investment Plan
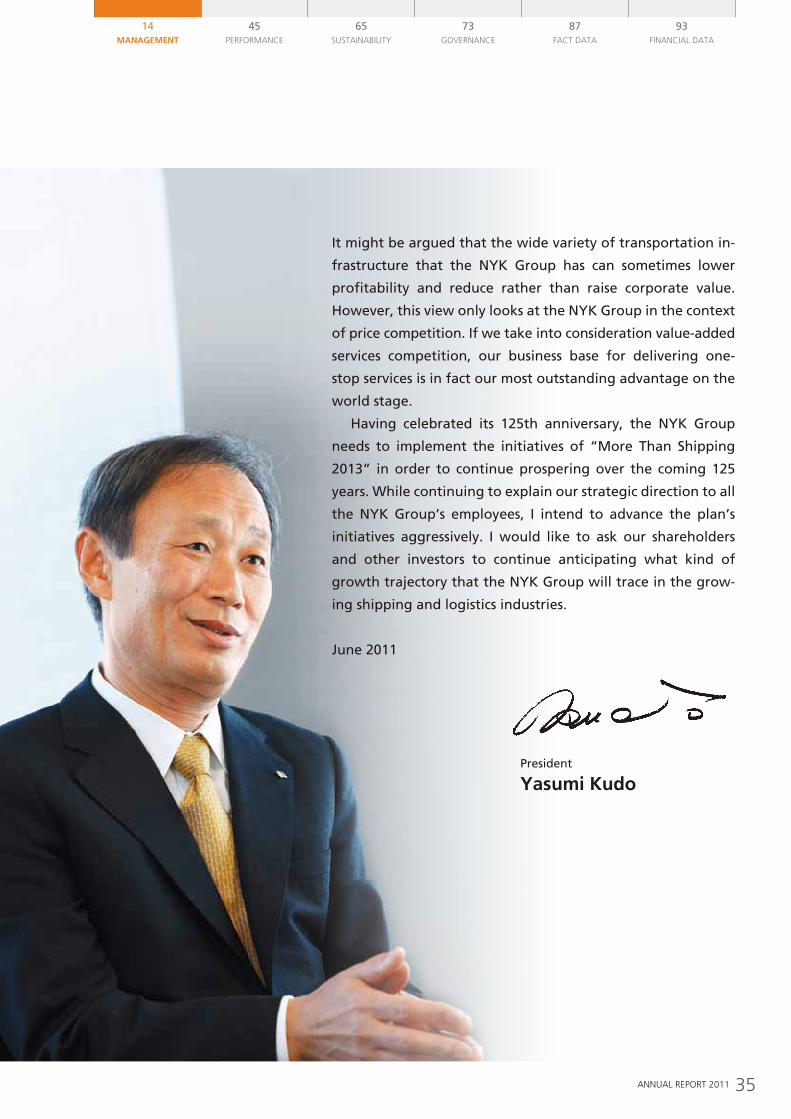
35ANNUAL REPORT 2011
45PERFORMANCE
65SUSTAINABILITY
73GOVERNANCE
87FACT DATA
93FINANCIAL DATA
14MANAGEMENT
It might be argued that the wide variety of transportation in-
frastructure that the NYK Group has can sometimes lower
profitability and reduce rather than raise corporate value.
However, this view only looks at the NYK Group in the context
of price competition. If we take into consideration value-added
services competition, our business base for delivering one-
stop services is in fact our most outstanding advantage on the
world stage.
Having celebrated its 125th anniversary, the NYK Group
needs to implement the initiatives of “More Than Shipping
2013” in order to continue prospering over the coming 125
years. While continuing to explain our strategic direction to all
the NYK Group’s employees, I intend to advance the plan’s
initiatives aggressively. I would like to ask our shareholders
and other investors to continue anticipating what kind of
growth trajectory that the NYK Group will trace in the grow-
ing shipping and logistics industries.
June 2011
President
Yasumi Kudo
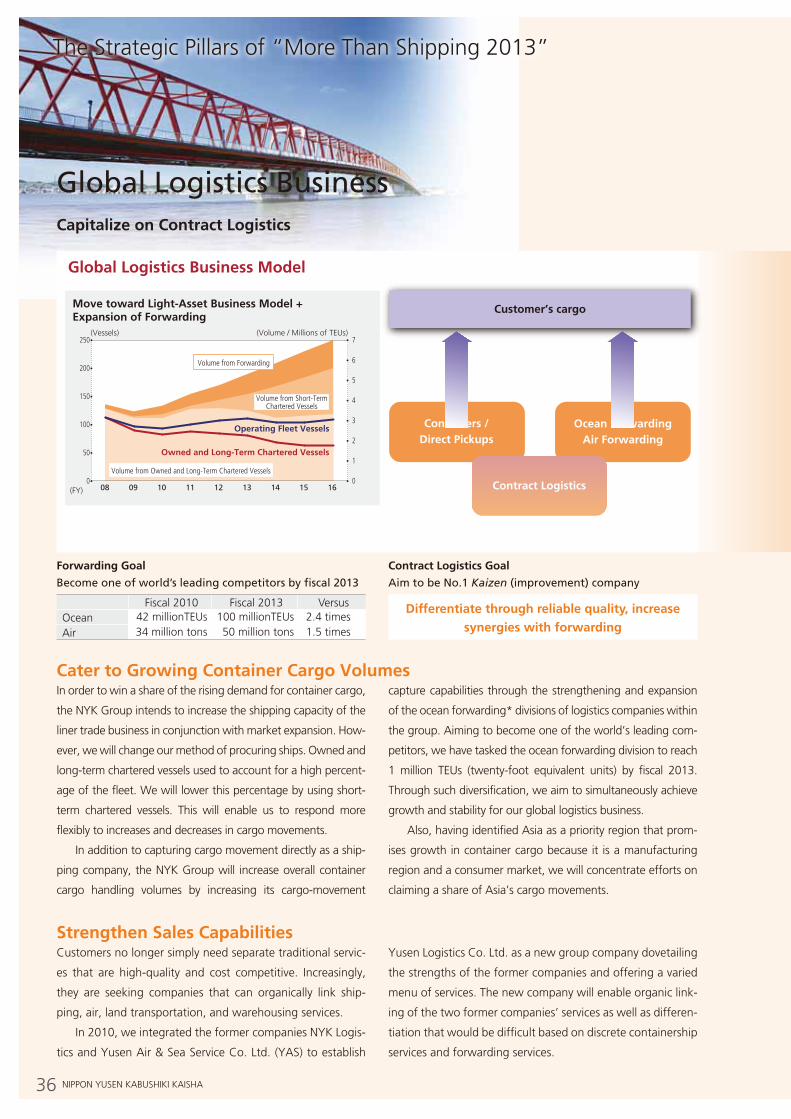
36 NIPPON YUSEN KABUSHIKI KAISHA
Global Logistics Business Model Contract Logistics: Supply Chain Model Case Study
Toward Improved Quality
Customer’s cargo
Containers /Direct Pickups
Ocean ForwardingAir Forwarding
Contract Logistics
Income and expenditure management by accountStrengthening of cost competitivenessManagement of improvement progress
Minimum required level
Standard KPI*1
Quality check list4S*2 check list
Evaluating executioncapabilities and on-site
capabilities of operations
Establish Yusen Logisticsquality standard
*1 An acronym for key performance indicator, these benchmarks enable organizations to evaluate how well they are performing and whether they are meeting important goals.*2 An acronym for four Japanese words that mean put in order, tidy up, cleanliness, and cleaning.
* An abbreviation of electronic data interchange, this refers to the exchange of electronic business documents, including orders and invoices, through the Internet or other means. Alternatively, it can mean transactions between companies based on such order information.
Cargo tracking / Movement monitoring
YLK System Customers
Forwarding
Port / AirportYLK warehouse
Cargo collection
OrderOrder
management
Direction
Consolidation
Vendor’s plant
YLK warehouse
Store
Store
Customer’swarehouse
Cross-docking
Information provision via Internet
EDI*
Returned productslogistics
Delivery
Order
Port / Airport
YusenLogistics
(YLK)
08 1009 11 12 13 14 15 16(FY)
7
6
4
2
3
1
5
0
(Vessels) (Volume / Millions of TEUs)250
200
100
50
Operating Fleet Vessels
Owned and Long-Term Chartered Vessels
150
0
Volume from Forwarding
Volume from Short-TermChartered Vessels
Volume from Owned and Long-Term Chartered Vessels
The Strategic Pillars of “More Than Shipping 2013”
Capitalize on Contract Logistics
Global Logistics Business
Forwarding Goal
Become one of world’s leading competitors by fiscal 2013
Fiscal 2010 Fiscal 2013 VersusOcean 42 millionTEUs 100 millionTEUs 2.4 timesAir 34 million tons 50 million tons 1.5 times
Contract Logistics Goal
Aim to be No.1 Kaizen (improvement) company
Differentiate through reliable quality, increase synergies with forwarding
Cater to Growing Container Cargo Volumes
Strengthen Sales Capabilities
In order to win a share of the rising demand for container cargo,
the NYK Group intends to increase the shipping capacity of the
liner trade business in conjunction with market expansion. How-
ever, we will change our method of procuring ships. Owned and
long-term chartered vessels used to account for a high percent-
age of the fleet. We will lower this percentage by using short-
term chartered vessels. This will enable us to respond more
flexibly to increases and decreases in cargo movements.
In addition to capturing cargo movement directly as a ship-
ping company, the NYK Group will increase overall container
cargo handling volumes by increasing its cargo-movement
capture capabilities through the strengthening and expansion
of the ocean forwarding* divisions of logistics companies within
the group. Aiming to become one of the world’s leading com-
petitors, we have tasked the ocean forwarding division to reach
1 million TEUs (twenty-foot equivalent units) by fiscal 2013.
Through such diversification, we aim to simultaneously achieve
growth and stability for our global logistics business.
Also, having identified Asia as a priority region that prom-
ises growth in container cargo because it is a manufacturing
region and a consumer market, we will concentrate efforts on
claiming a share of Asia’s cargo movements.
Customers no longer simply need separate traditional servic-
es that are high-quality and cost competitive. Increasingly,
they are seeking companies that can organically link ship-
ping, air, land transportation, and warehousing services.
In 2010, we integrated the former companies NYK Logis-
tics and Yusen Air & Sea Service Co. Ltd. (YAS) to establish
Yusen Logistics Co. Ltd. as a new group company dovetailing
the strengths of the former companies and offering a varied
menu of services. The new company will enable organic link-
ing of the two former companies’ services as well as differen-
tiation that would be difficult based on discrete containership
services and forwarding services.
Move toward Light-Asset Business Model + Expansion of Forwarding
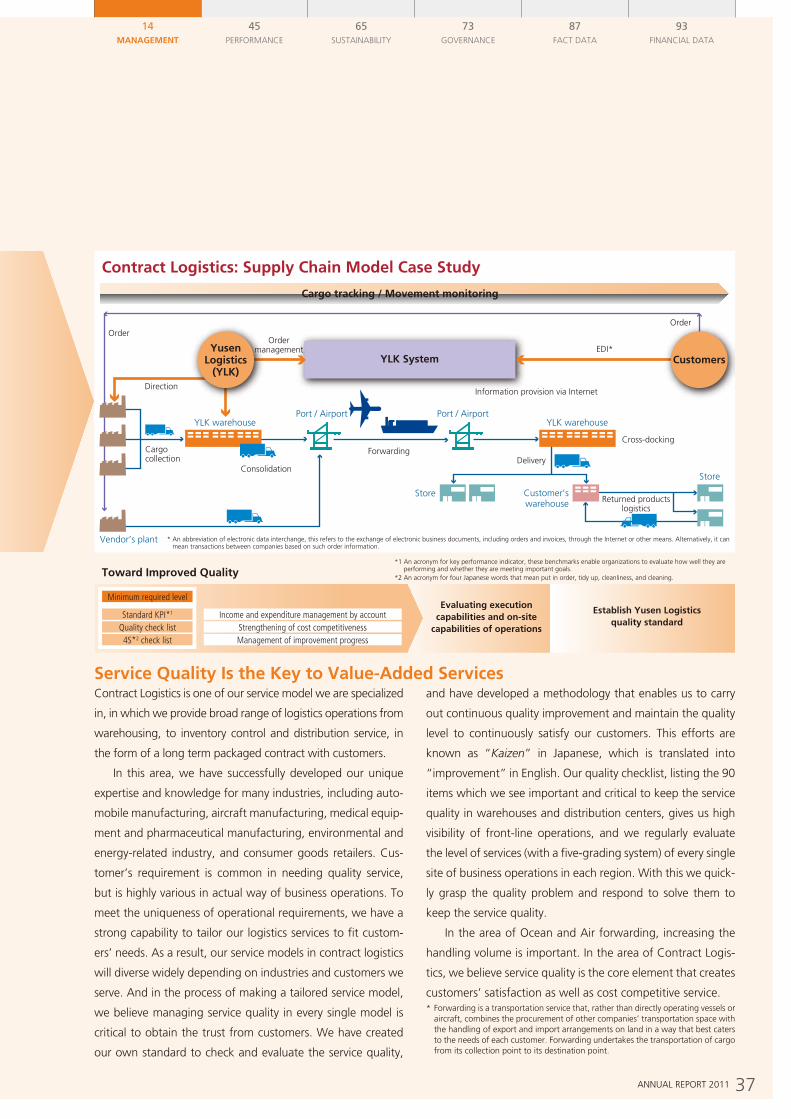
37ANNUAL REPORT 2011
45PERFORMANCE
65SUSTAINABILITY
73GOVERNANCE
87FACT DATA
93FINANCIAL DATA
14MANAGEMENT
Global Logistics Business Model Contract Logistics: Supply Chain Model Case Study
Toward Improved Quality
Customer’s cargo
Containers /Direct Pickups
Ocean ForwardingAir Forwarding
Contract Logistics
Income and expenditure management by accountStrengthening of cost competitivenessManagement of improvement progress
Minimum required level
Standard KPI*1
Quality check list4S*2 check list
Evaluating executioncapabilities and on-site
capabilities of operations
Establish Yusen Logisticsquality standard
*1 An acronym for key performance indicator, these benchmarks enable organizations to evaluate how well they are performing and whether they are meeting important goals.*2 An acronym for four Japanese words that mean put in order, tidy up, cleanliness, and cleaning.
* An abbreviation of electronic data interchange, this refers to the exchange of electronic business documents, including orders and invoices, through the Internet or other means. Alternatively, it can mean transactions between companies based on such order information.
Cargo tracking / Movement monitoring
YLK System Customers
Forwarding
Port / AirportYLK warehouse
Cargo collection
OrderOrder
management
Direction
Consolidation
Vendor’s plant
YLK warehouse
Store
Store
Customer’swarehouse
Cross-docking
Information provision via Internet
EDI*
Returned productslogistics
Delivery
Order
Port / Airport
YusenLogistics
(YLK)
Service Quality Is the Key to Value-Added ServicesContract Logistics is one of our service model we are specialized
in, in which we provide broad range of logistics operations from
warehousing, to inventory control and distribution service, in
the form of a long term packaged contract with customers.
In this area, we have successfully developed our unique
expertise and knowledge for many industries, including auto-
mobile manufacturing, aircraft manufacturing, medical equip-
ment and pharmaceutical manufacturing, environmental and
energy-related industry, and consumer goods retailers. Cus-
tomer’s requirement is common in needing quality service,
but is highly various in actual way of business operations. To
meet the uniqueness of operational requirements, we have a
strong capability to tailor our logistics services to fit custom-
ers’ needs. As a result, our service models in contract logistics
will diverse widely depending on industries and customers we
serve. And in the process of making a tailored service model,
we believe managing service quality in every single model is
critical to obtain the trust from customers. We have created
our own standard to check and evaluate the service quality,
and have developed a methodology that enables us to carry
out continuous quality improvement and maintain the quality
level to continuously satisfy our customers. This efforts are
known as “Kaizen” in Japanese, which is translated into
“improvement” in English. Our quality checklist, listing the 90
items which we see important and critical to keep the service
quality in warehouses and distribution centers, gives us high
visibility of front-line operations, and we regularly evaluate
the level of services (with a five-grading system) of every single
site of business operations in each region. With this we quick-
ly grasp the quality problem and respond to solve them to
keep the service quality.
In the area of Ocean and Air forwarding, increasing the
handling volume is important. In the area of Contract Logis-
tics, we believe service quality is the core element that creates
customers’ satisfaction as well as cost competitive service.* Forwarding is a transportation service that, rather than directly operating vessels or
aircraft, combines the procurement of other companies’ transportation space with the handling of export and import arrangements on land in a way that best caters to the needs of each customer. Forwarding undertakes the transportation of cargo from its collection point to its destination point.
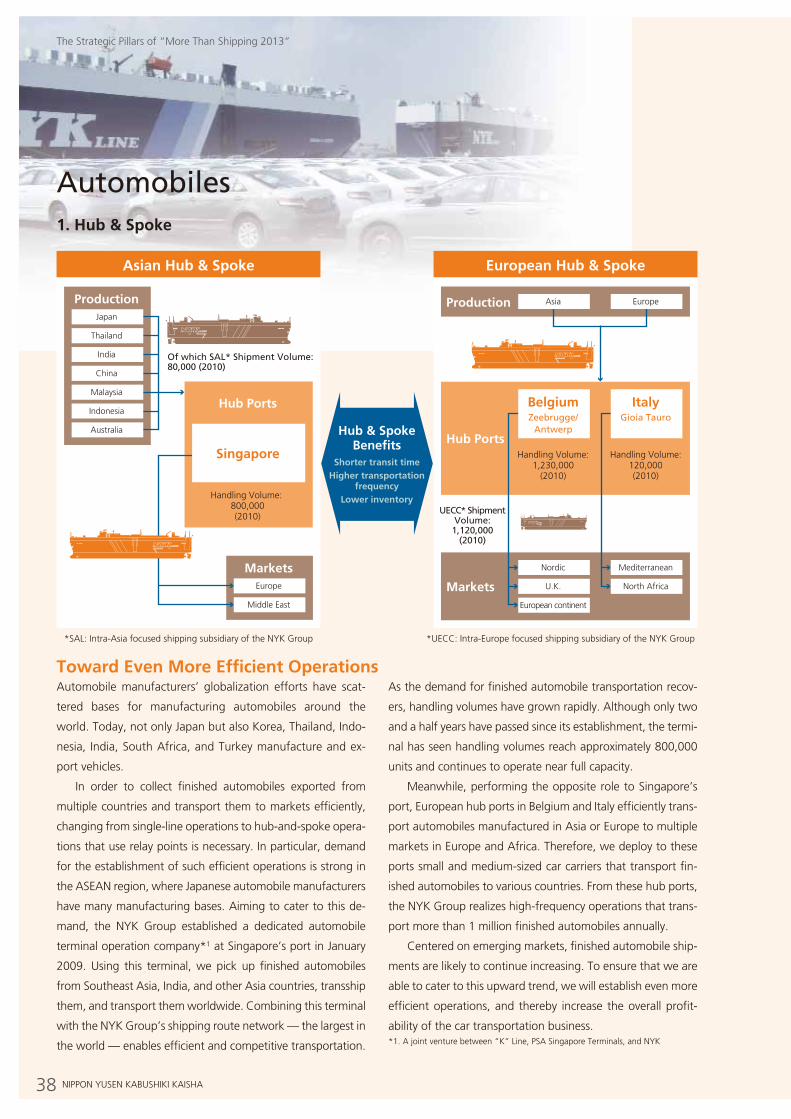
38 NIPPON YUSEN KABUSHIKI KAISHA
The Strategic Pillars of “More Than Shipping 2013”
Toward Even More Efficient OperationsAutomobile manufacturers’ globalization efforts have scat-
tered bases for manufacturing automobiles around the
world. Today, not only Japan but also Korea, Thailand, Indo-
nesia, India, South Africa, and Turkey manufacture and ex-
port vehicles.
In order to collect finished automobiles exported from
multiple countries and transport them to markets efficiently,
changing from single-line operations to hub-and-spoke opera-
tions that use relay points is necessary. In particular, demand
for the establishment of such efficient operations is strong in
the ASEAN region, where Japanese automobile manufacturers
have many manufacturing bases. Aiming to cater to this de-
mand, the NYK Group established a dedicated automobile
terminal operation company*1 at Singapore’s port in January
2009. Using this terminal, we pick up finished automobiles
from Southeast Asia, India, and other Asia countries, transship
them, and transport them worldwide. Combining this terminal
with the NYK Group’s shipping route network — the largest in
the world — enables efficient and competitive transportation.
As the demand for finished automobile transportation recov-
ers, handling volumes have grown rapidly. Although only two
and a half years have passed since its establishment, the termi-
nal has seen handling volumes reach approximately 800,000
units and continues to operate near full capacity.
Meanwhile, performing the opposite role to Singapore’s
port, European hub ports in Belgium and Italy efficiently trans-
port automobiles manufactured in Asia or Europe to multiple
markets in Europe and Africa. Therefore, we deploy to these
ports small and medium-sized car carriers that transport fin-
ished automobiles to various countries. From these hub ports,
the NYK Group realizes high-frequency operations that trans-
port more than 1 million finished automobiles annually.
Centered on emerging markets, finished automobile ship-
ments are likely to continue increasing. To ensure that we are
able to cater to this upward trend, we will establish even more
efficient operations, and thereby increase the overall profit-
ability of the car transportation business.*1. A joint venture between “K” Line, PSA Singapore Terminals, and NYK
Asian Hub & Spoke
Production
Hub Ports
MarketsEurope
Middle East
Japan
Thailand
India
China
Malaysia
Indonesia
Australia
Singapore
Handling Volume: 800,000(2010)
Of which SAL* Shipment Volume: 80,000 (2010)
European Hub & Spoke
Markets North Africa
Mediterranean
UECC* ShipmentVolume:
1,120,000(2010)
U.K.
Nordic
European continent
Production
Hub Ports
ItalyGioia Tauro
BelgiumZeebrugge/
Antwerp
Handling Volume:120,000(2010)
Handling Volume:1,230,000
(2010)
EuropeAsia
Hub & SpokeBenefits
Shorter transit timeHigher transportation
frequencyLower inventory
*UECC: Intra-Europe focused shipping subsidiary of the NYK Group*SAL: Intra-Asia focused shipping subsidiary of the NYK Group
1. Hub & Spoke
Automobiles
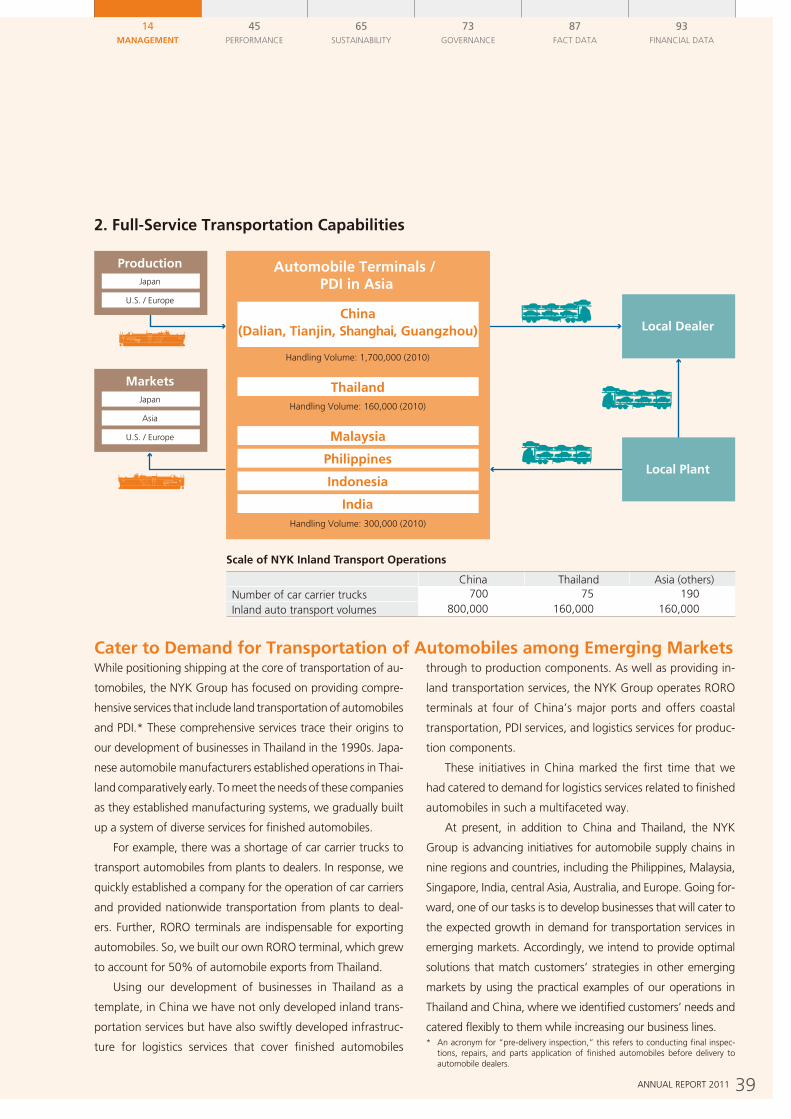
39ANNUAL REPORT 2011
45PERFORMANCE
65SUSTAINABILITY
73GOVERNANCE
87FACT DATA
93FINANCIAL DATA
14MANAGEMENT
Cater to Demand for Transportation of Automobiles among Emerging MarketsWhile positioning shipping at the core of transportation of au-
tomobiles, the NYK Group has focused on providing compre-
hensive services that include land transportation of automobiles
and PDI.* These comprehensive services trace their origins to
our development of businesses in Thailand in the 1990s. Japa-
nese automobile manufacturers established operations in Thai-
land comparatively early. To meet the needs of these companies
as they established manufacturing systems, we gradually built
up a system of diverse services for finished automobiles.
For example, there was a shortage of car carrier trucks to
transport automobiles from plants to dealers. In response, we
quickly established a company for the operation of car carriers
and provided nationwide transportation from plants to deal-
ers. Further, RORO terminals are indispensable for exporting
automobiles. So, we built our own RORO terminal, which grew
to account for 50% of automobile exports from Thailand.
Using our development of businesses in Thailand as a
template, in China we have not only developed inland trans-
portation services but have also swiftly developed infrastruc-
ture for logistics services that cover finished automobiles
through to production components. As well as providing in-
land transportation services, the NYK Group operates RORO
terminals at four of China’s major ports and offers coastal
transportation, PDI services, and logistics services for produc-
tion components.
These initiatives in China marked the first time that we
had catered to demand for logistics services related to finished
automobiles in such a multifaceted way.
At present, in addition to China and Thailand, the NYK
Group is advancing initiatives for automobile supply chains in
nine regions and countries, including the Philippines, Malaysia,
Singapore, India, central Asia, Australia, and Europe. Going for-
ward, one of our tasks is to develop businesses that will cater to
the expected growth in demand for transportation services in
emerging markets. Accordingly, we intend to provide optimal
solutions that match customers’ strategies in other emerging
markets by using the practical examples of our operations in
Thailand and China, where we identified customers’ needs and
catered flexibly to them while increasing our business lines.* An acronym for “pre-delivery inspection,” this refers to conducting final inspec-
tions, repairs, and parts application of finished automobiles before delivery to automobile dealers.
MarketsJapan
Asia
U.S. / Europe
Local Dealer
Automobile Terminals / PDI in Asia
China(Dalian, Tianjin, Shanghai, Guangzhou)
Handling Volume: 1,700,000 (2010)
ThailandHandling Volume: 160,000 (2010)
Malaysia
Philippines
Indonesia
IndiaHandling Volume: 300,000 (2010)
ProductionJapan
U.S. / Europe
Local Plant
Scale of NYK Inland Transport Operations
China Thailand Asia (others)Number of car carrier trucks 700 75 190Inland auto transport volumes 800,000 160,000 160,000
2. Full-Service Transportation Capabilities
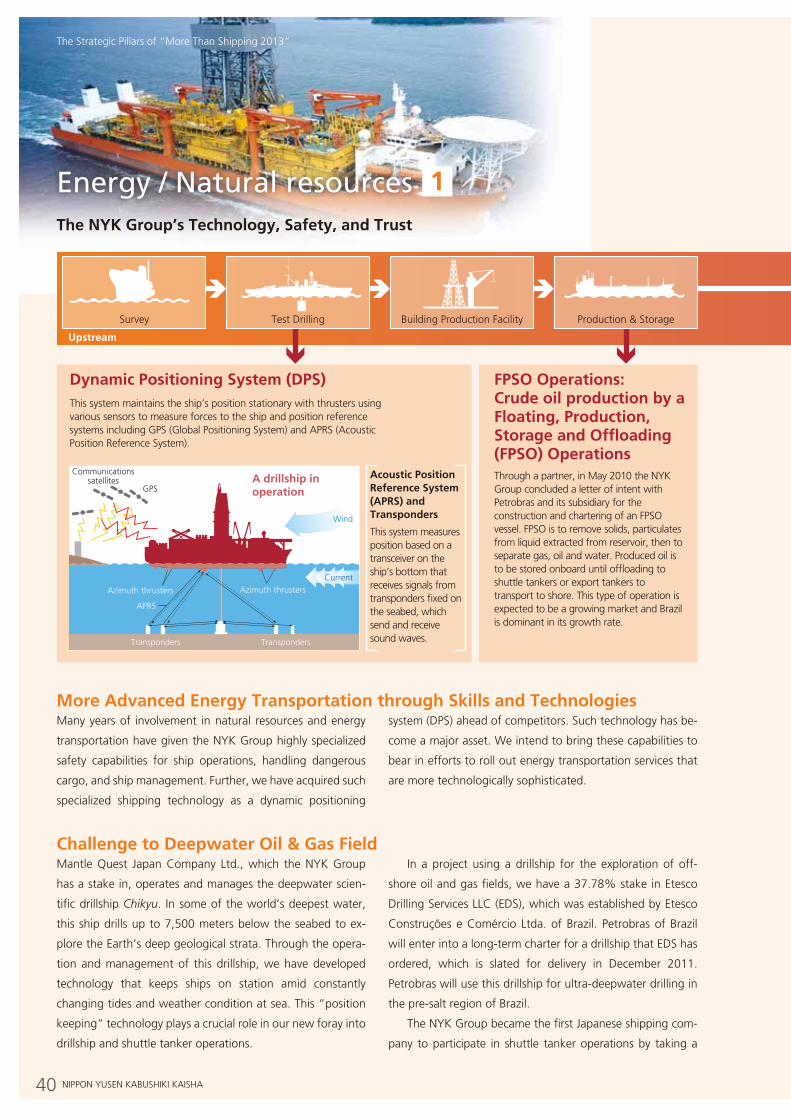
40 NIPPON YUSEN KABUSHIKI KAISHA
The Strategic Pillars of “More Than Shipping 2013”
The NYK Group’s Technology, Safety, and Trust
Energy / Natural resources
Storage & Refining SaleSurvey Production & StorageTest Drilling Building Production Facility Transportation
Azimuth thruster
Other features
• Reinforced hull to help ship handling in the North Sea’s severe sea conditions• Incorporates a system for recycling VOCs* generated by cargo during transportation in order to comply with Norway’s VOC emission rules * Volatile organic compounds
Variable pitch propeller
Propeller with angle-adjustable blades
DPS (Dynamic Positioning System) Bow-loading system
A system in which ships are positioned in line bow-to-stern and loading is conducted at the bow of the ship. Disconnecting the offloading hose string is easier than is normal for tankers to enable rapid separation in case of an emergency.
1
4
2
3
A Variety of Technologies Ideal for Offshore Oil TransportationDynamic Positioning System (DPS) FPSO Operations: Crude oil production by a Floating, Production, Storage and Offloading (FPSO) Operations
Transportation
Upstream Downstream
This is a propeller attached to a pod that can rotate 360 degrees horizontally. As well as forward and backward, it can move a ship laterally or in any other direction desired.
Through a partner, in May 2010 the NYK Group concluded a letter of intent with Petrobras and its subsidiary for the construction and chartering of an FPSO vessel. FPSO is to remove solids, particulates from liquid extracted from reservoir, then to separate gas, oil and water. Produced oil is to be stored onboard until offloading to shuttle tankers or export tankers to transport to shore. This type of operation is expected to be a growing market and Brazil is dominant in its growth rate.
This system maintains the ship’s position stationary with thrusters using various sensors to measure forces to the ship and position reference systems including GPS (Global Positioning System) and APRS (Acoustic Position Reference System).
Acoustic Position Reference System (APRS) and Transponders
This system measures position based on a transceiver on the ship’s bottom that receives signals from transponders fixed on the seabed, which send and receive sound waves.
4
332
1
FPSOShuttle tanker
Mooring line
Offloading hose stringCommunications
satellitesGPS
A drillship in operation
Transponders
Azimuth thrusters
APRS
Azimuth thrusters
Transponders
Wind
Current
More Advanced Energy Transportation through Skills and Technologies
Challenge to Deepwater Oil & Gas Field
Many years of involvement in natural resources and energy
transportation have given the NYK Group highly specialized
safety capabilities for ship operations, handling dangerous
cargo, and ship management. Further, we have acquired such
specialized shipping technology as a dynamic positioning
system (DPS) ahead of competitors. Such technology has be-
come a major asset. We intend to bring these capabilities to
bear in efforts to roll out energy transportation services that
are more technologically sophisticated.
Mantle Quest Japan Company Ltd., which the NYK Group
has a stake in, operates and manages the deepwater scien-
tific drillship Chikyu. In some of the world’s deepest water,
this ship drills up to 7,500 meters below the seabed to ex-
plore the Earth’s deep geological strata. Through the opera-
tion and management of this drillship, we have developed
technology that keeps ships on station amid constantly
changing tides and weather condition at sea. This “position
keeping” technology plays a crucial role in our new foray into
drillship and shuttle tanker operations.
In a project using a drillship for the exploration of off-
shore oil and gas fields, we have a 37.78% stake in Etesco
Drilling Services LLC (EDS), which was established by Etesco
Construções e Comércio Ltda. of Brazil. Petrobras of Brazil
will enter into a long-term charter for a drillship that EDS has
ordered, which is slated for delivery in December 2011.
Petrobras will use this drillship for ultra-deepwater drilling in
the pre-salt region of Brazil.
The NYK Group became the first Japanese shipping com-
pany to participate in shuttle tanker operations by taking a
1
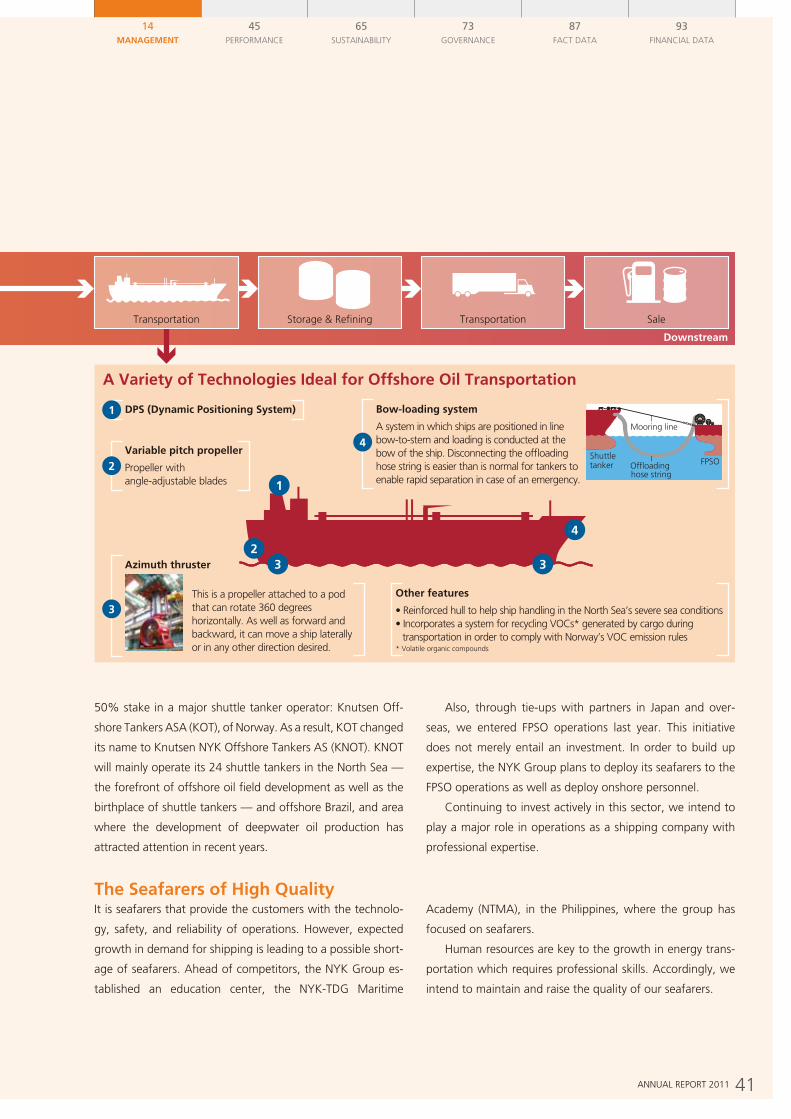
41ANNUAL REPORT 2011
45PERFORMANCE
65SUSTAINABILITY
73GOVERNANCE
87FACT DATA
93FINANCIAL DATA
14MANAGEMENT
Storage & Refining SaleSurvey Production & StorageTest Drilling Building Production Facility Transportation
Azimuth thruster
Other features
• Reinforced hull to help ship handling in the North Sea’s severe sea conditions• Incorporates a system for recycling VOCs* generated by cargo during transportation in order to comply with Norway’s VOC emission rules * Volatile organic compounds
Variable pitch propeller
Propeller with angle-adjustable blades
DPS (Dynamic Positioning System) Bow-loading system
A system in which ships are positioned in line bow-to-stern and loading is conducted at the bow of the ship. Disconnecting the offloading hose string is easier than is normal for tankers to enable rapid separation in case of an emergency.
1
4
2
3
A Variety of Technologies Ideal for Offshore Oil TransportationDynamic Positioning System (DPS) FPSO Operations: Crude oil production by a Floating, Production, Storage and Offloading (FPSO) Operations
Transportation
Upstream Downstream
This is a propeller attached to a pod that can rotate 360 degrees horizontally. As well as forward and backward, it can move a ship laterally or in any other direction desired.
Through a partner, in May 2010 the NYK Group concluded a letter of intent with Petrobras and its subsidiary for the construction and chartering of an FPSO vessel. FPSO is to remove solids, particulates from liquid extracted from reservoir, then to separate gas, oil and water. Produced oil is to be stored onboard until offloading to shuttle tankers or export tankers to transport to shore. This type of operation is expected to be a growing market and Brazil is dominant in its growth rate.
This system maintains the ship’s position stationary with thrusters using various sensors to measure forces to the ship and position reference systems including GPS (Global Positioning System) and APRS (Acoustic Position Reference System).
Acoustic Position Reference System (APRS) and Transponders
This system measures position based on a transceiver on the ship’s bottom that receives signals from transponders fixed on the seabed, which send and receive sound waves.
4
332
1
FPSOShuttle tanker
Mooring line
Offloading hose stringCommunications
satellitesGPS
A drillship in operation
Transponders
Azimuth thrusters
APRS
Azimuth thrusters
Transponders
Wind
Current
The Seafarers of High QualityIt is seafarers that provide the customers with the technolo-
gy, safety, and reliability of operations. However, expected
growth in demand for shipping is leading to a possible short-
age of seafarers. Ahead of competitors, the NYK Group es-
tablished an education center, the NYK-TDG Maritime
Academy (NTMA), in the Philippines, where the group has
focused on seafarers.
Human resources are key to the growth in energy trans-
portation which requires professional skills. Accordingly, we
intend to maintain and raise the quality of our seafarers.
50% stake in a major shuttle tanker operator: Knutsen Off-
shore Tankers ASA (KOT), of Norway. As a result, KOT changed
its name to Knutsen NYK Offshore Tankers AS (KNOT). KNOT
will mainly operate its 24 shuttle tankers in the North Sea —
the forefront of offshore oil field development as well as the
birthplace of shuttle tankers — and offshore Brazil, and area
where the development of deepwater oil production has
attracted attention in recent years.
Also, through tie-ups with partners in Japan and over-
seas, we entered FPSO operations last year. This initiative
does not merely entail an investment. In order to build up
expertise, the NYK Group plans to deploy its seafarers to the
FPSO operations as well as deploy onshore personnel.
Continuing to invest actively in this sector, we intend to
play a major role in operations as a shipping company with
professional expertise.
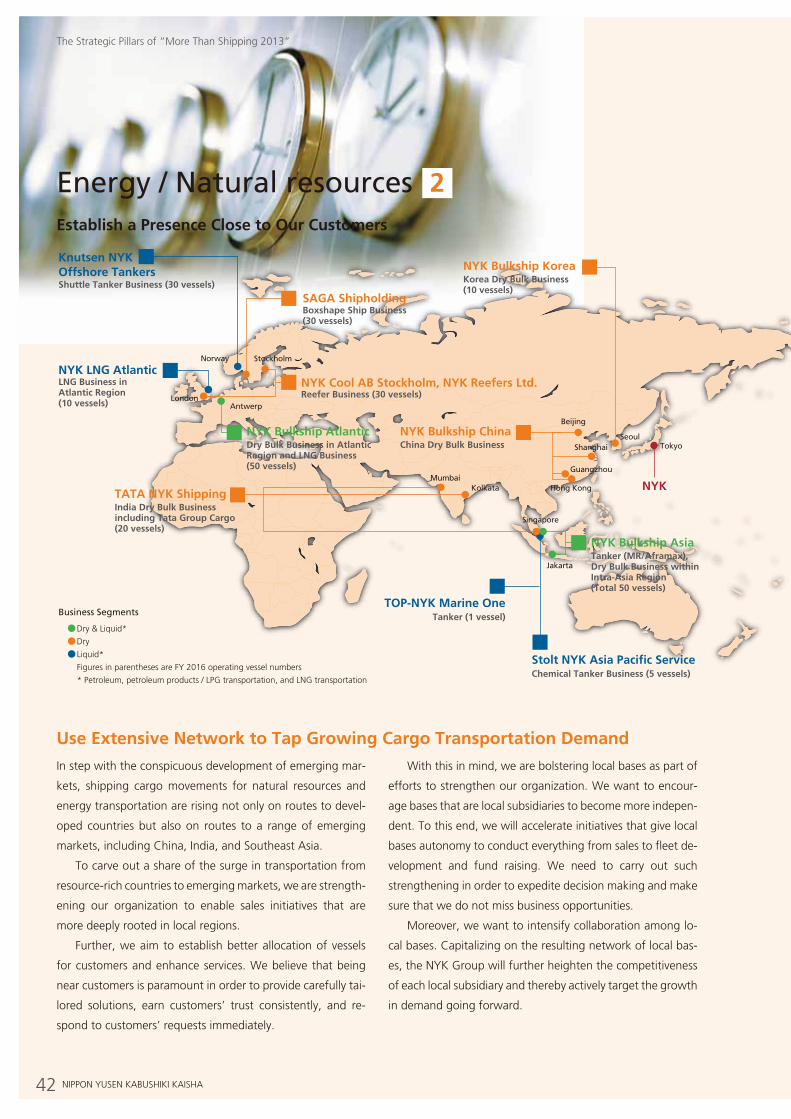
42 NIPPON YUSEN KABUSHIKI KAISHA
The Strategic Pillars of “More Than Shipping 2013”
Establish a Presence Close to Our Customers
Dry Bulk Business in Atlantic Region and LNG Business (50 vessels)
NYK Bulkship Atlantic
Dry Bulk Business in Atlantic Region and LNG Business (50 vessels)
NYK Bulkship Atlantic
Tanker (MR/Aframax), Dry Bulk Business within Intra-Asia Region (Total 50 vessels)
NYK Bulkship Asia
NYK
Korea Dry Bulk Business (10 vessels)
NYK Bulkship Korea
China Dry Bulk BusinessNYK Bulkship China
India Dry Bulk Business including Tata Group Cargo (20 vessels)
TATA NYK Shipping
Chemical Tanker Business (5 vessels)Stolt NYK Asia Pacific Service
Tanker (1 vessel)TOP-NYK Marine One
Reefer Business (30 vessels)NYK Cool AB Stockholm, NYK Reefers Ltd.LNG Business in
Atlantic Region (10 vessels)
NYK LNG Atlantic
Shuttle Tanker Business (30 vessels)
Knutsen NYK Offshore Tankers
Boxshape Ship Business (30 vessels)
SAGA Shipholding
Dry & Liquid*
Business Segments
Dry
Liquid*
Figures in parentheses are FY 2016 operating vessel numbers
* Petroleum, petroleum products / LPG transportation, and LNG transportation * Operating fleet size of main overseas bases
Fiscal 2010
170
Fiscal 2016
236
Operating fleet size*
Norway
London
Stockholm
Antwerp
MumbaiKolkata
Singapore
Jakarta
TokyoSeoul
Beijing
Shanghai
Hong Kong
Guangzhou
New York
Houston
Rio de Janeiro
Energy / Natural resources 2
Use Extensive Network to Tap Growing Cargo Transportation Demand
In step with the conspicuous development of emerging mar-
kets, shipping cargo movements for natural resources and
energy transportation are rising not only on routes to devel-
oped countries but also on routes to a range of emerging
markets, including China, India, and Southeast Asia.
To carve out a share of the surge in transportation from
resource-rich countries to emerging markets, we are strength-
ening our organization to enable sales initiatives that are
more deeply rooted in local regions.
Further, we aim to establish better allocation of vessels
for customers and enhance services. We believe that being
near customers is paramount in order to provide carefully tai-
lored solutions, earn customers’ trust consistently, and re-
spond to customers’ requests immediately.
With this in mind, we are bolstering local bases as part of
efforts to strengthen our organization. We want to encour-
age bases that are local subsidiaries to become more indepen-
dent. To this end, we will accelerate initiatives that give local
bases autonomy to conduct everything from sales to fleet de-
velopment and fund raising. We need to carry out such
strengthening in order to expedite decision making and make
sure that we do not miss business opportunities.
Moreover, we want to intensify collaboration among lo-
cal bases. Capitalizing on the resulting network of local bas-
es, the NYK Group will further heighten the competitiveness
of each local subsidiary and thereby actively target the growth
in demand going forward.
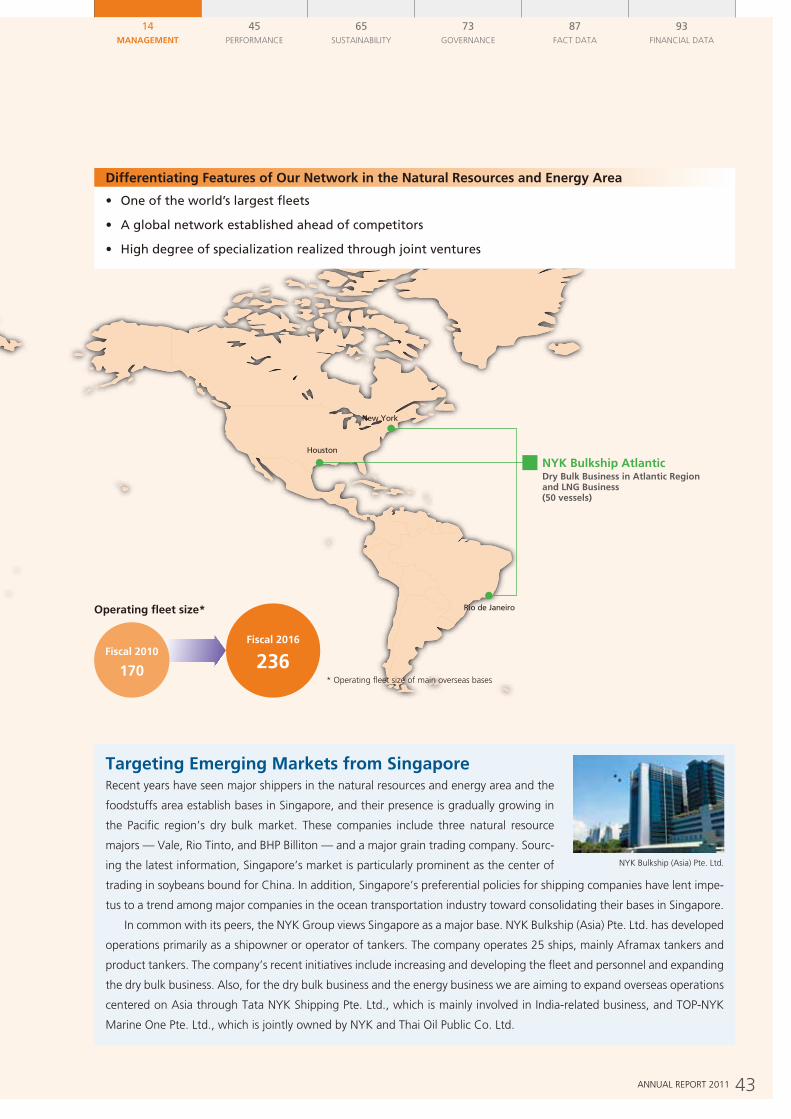
43ANNUAL REPORT 2011
45PERFORMANCE
65SUSTAINABILITY
73GOVERNANCE
87FACT DATA
93FINANCIAL DATA
14MANAGEMENT
Dry Bulk Business in Atlantic Region and LNG Business (50 vessels)
NYK Bulkship Atlantic
Dry Bulk Business in Atlantic Region and LNG Business (50 vessels)
NYK Bulkship Atlantic
Tanker (MR/Aframax), Dry Bulk Business within Intra-Asia Region (Total 50 vessels)
NYK Bulkship Asia
NYK
Korea Dry Bulk Business (10 vessels)
NYK Bulkship Korea
China Dry Bulk BusinessNYK Bulkship China
India Dry Bulk Business including Tata Group Cargo (20 vessels)
TATA NYK Shipping
Chemical Tanker Business (5 vessels)Stolt NYK Asia Pacific Service
Tanker (1 vessel)TOP-NYK Marine One
Reefer Business (30 vessels)NYK Cool AB Stockholm, NYK Reefers Ltd.LNG Business in
Atlantic Region (10 vessels)
NYK LNG Atlantic
Shuttle Tanker Business (30 vessels)
Knutsen NYK Offshore Tankers
Boxshape Ship Business (30 vessels)
SAGA Shipholding
Dry & Liquid*
Business Segments
Dry
Liquid*
Figures in parentheses are FY 2016 operating vessel numbers
* Petroleum, petroleum products / LPG transportation, and LNG transportation * Operating fleet size of main overseas bases
Fiscal 2010
170
Fiscal 2016
236
Operating fleet size*
Norway
London
Stockholm
Antwerp
MumbaiKolkata
Singapore
Jakarta
TokyoSeoul
Beijing
Shanghai
Hong Kong
Guangzhou
New York
Houston
Rio de Janeiro
Differentiating Features of Our Network in the Natural Resources and Energy Area
• One of the world’s largest fleets
• A global network established ahead of competitors
• High degree of specialization realized through joint ventures
Targeting Emerging Markets from SingaporeRecent years have seen major shippers in the natural resources and energy area and the
foodstuffs area establish bases in Singapore, and their presence is gradually growing in
the Pacific region’s dry bulk market. These companies include three natural resource
majors — Vale, Rio Tinto, and BHP Billiton — and a major grain trading company. Sourc-
ing the latest information, Singapore’s market is particularly prominent as the center of
trading in soybeans bound for China. In addition, Singapore’s preferential policies for shipping companies have lent impe-
tus to a trend among major companies in the ocean transportation industry toward consolidating their bases in Singapore.
In common with its peers, the NYK Group views Singapore as a major base. NYK Bulkship (Asia) Pte. Ltd. has developed
operations primarily as a shipowner or operator of tankers. The company operates 25 ships, mainly Aframax tankers and
product tankers. The company’s recent initiatives include increasing and developing the fleet and personnel and expanding
the dry bulk business. Also, for the dry bulk business and the energy business we are aiming to expand overseas operations
centered on Asia through Tata NYK Shipping Pte. Ltd., which is mainly involved in India-related business, and TOP-NYK
Marine One Pte. Ltd., which is jointly owned by NYK and Thai Oil Public Co. Ltd.
NYK Bulkship (Asia) Pte. Ltd.
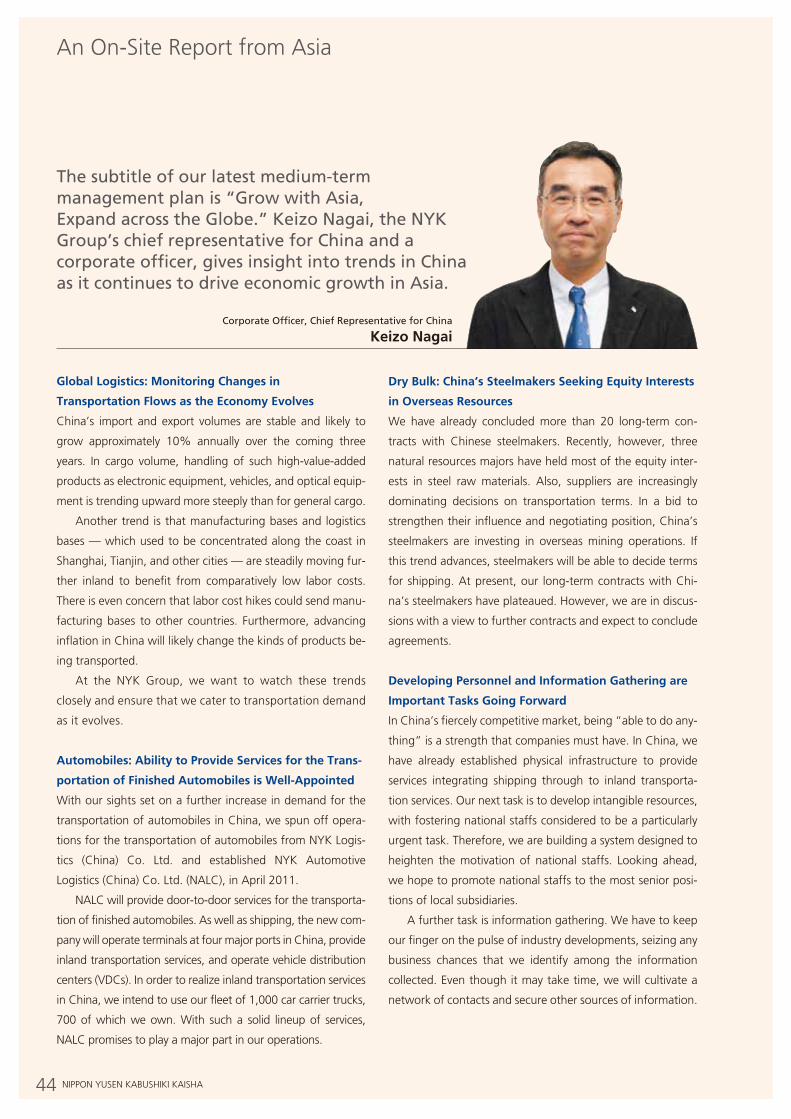
44 NIPPON YUSEN KABUSHIKI KAISHA
An On-Site Report from Asia
Global Logistics: Monitoring Changes in
Transportation Flows as the Economy Evolves
China’s import and export volumes are stable and likely to
grow approximately 10% annually over the coming three
years. In cargo volume, handling of such high-value-added
products as electronic equipment, vehicles, and optical equip-
ment is trending upward more steeply than for general cargo.
Another trend is that manufacturing bases and logistics
bases — which used to be concentrated along the coast in
Shanghai, Tianjin, and other cities — are steadily moving fur-
ther inland to benefit from comparatively low labor costs.
There is even concern that labor cost hikes could send manu-
facturing bases to other countries. Furthermore, advancing
inflation in China will likely change the kinds of products be-
ing transported.
At the NYK Group, we want to watch these trends
closely and ensure that we cater to transportation demand
as it evolves.
Automobiles: Ability to Provide Services for the Trans-
portation of Finished Automobiles is Well-Appointed
With our sights set on a further increase in demand for the
transportation of automobiles in China, we spun off opera-
tions for the transportation of automobiles from NYK Logis-
tics (China) Co. Ltd. and established NYK Automotive
Logistics (China) Co. Ltd. (NALC), in April 2011.
NALC will provide door-to-door services for the transporta-
tion of finished automobiles. As well as shipping, the new com-
pany will operate terminals at four major ports in China, provide
inland transportation services, and operate vehicle distribution
centers (VDCs). In order to realize inland transportation services
in China, we intend to use our fleet of 1,000 car carrier trucks,
700 of which we own. With such a solid lineup of services,
NALC promises to play a major part in our operations.
Dry Bulk: China’s Steelmakers Seeking Equity Interests
in Overseas Resources
We have already concluded more than 20 long-term con-
tracts with Chinese steelmakers. Recently, however, three
natural resources majors have held most of the equity inter-
ests in steel raw materials. Also, suppliers are increasingly
dominating decisions on transportation terms. In a bid to
strengthen their influence and negotiating position, China’s
steelmakers are investing in overseas mining operations. If
this trend advances, steelmakers will be able to decide terms
for shipping. At present, our long-term contracts with Chi-
na’s steelmakers have plateaued. However, we are in discus-
sions with a view to further contracts and expect to conclude
agreements.
Developing Personnel and Information Gathering are
Important Tasks Going Forward
In China’s fiercely competitive market, being “able to do any-
thing” is a strength that companies must have. In China, we
have already established physical infrastructure to provide
services integrating shipping through to inland transporta-
tion services. Our next task is to develop intangible resources,
with fostering national staffs considered to be a particularly
urgent task. Therefore, we are building a system designed to
heighten the motivation of national staffs. Looking ahead,
we hope to promote national staffs to the most senior posi-
tions of local subsidiaries.
A further task is information gathering. We have to keep
our finger on the pulse of industry developments, seizing any
business chances that we identify among the information
collected. Even though it may take time, we will cultivate a
network of contacts and secure other sources of information.
The subtitle of our latest medium-term management plan is “Grow with Asia, Expand across the Globe.” Keizo Nagai, the NYK Group’s chief representative for China and a corporate officer, gives insight into trends in China as it continues to drive economic growth in Asia.
Corporate Officer, Chief Representative for China
Keizo Nagai
45ANNUAL REPORT 2011
Review of Operations
46 Market Data
48 Highlights by Segment
50 Global Logistics Business
52 Liner Trade Business
53 Logistics Business
54 Terminal and Harbor Transport Business
54 Air Cargo Transportation Business
56 Bulk Shipping Business
59 Car Transport
60 Dry Bulk Transport
61 Energy Transport (Petroleum transport, chemical and LPG transport)
62 Energy Transport (LNG transport, offshore business)
63 Other Business
63 Cruise Business
64 Efforts to Support the Area Devastated by the Japan Earthquake and Tsunami
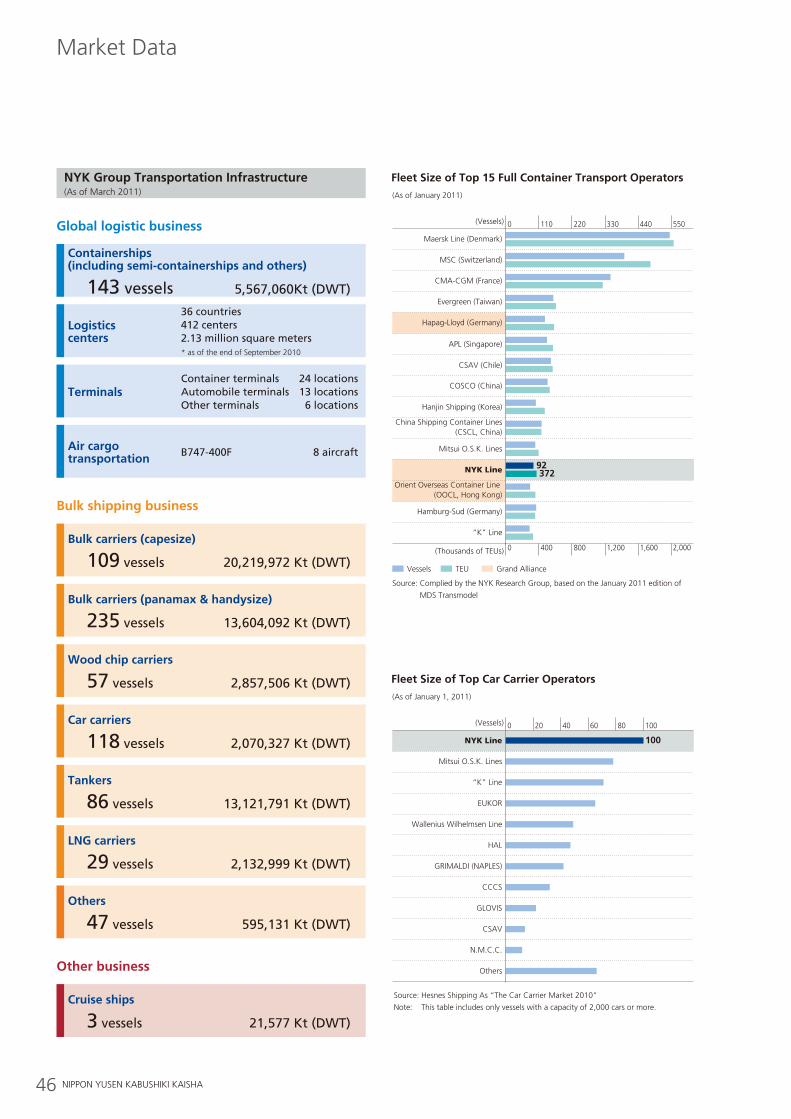
46 NIPPON YUSEN KABUSHIKI KAISHA
NYK Group Transportation Infrastructure (As of March 2011)
Market Data
Other business
Cruise ships
3vessels 21,577Kt(DWT)
Containerships (including semi-containerships and others)
143vessels 5,567,060Kt(DWT)
Global logistic business
Logistics centers
36countries412centers2.13millionsquaremeters* as of the end of September 2010
TerminalsContainerterminals 24locationsAutomobileterminals 13locationsOtherterminals 6locations
Air cargo transportation B747-400F 8aircraft
Bulk shipping business
Bulk carriers (capesize)
109vessels 20,219,972Kt(DWT)
Bulk carriers (panamax & handysize)
235vessels 13,604,092Kt(DWT)
Wood chip carriers
57vessels 2,857,506Kt(DWT)
Car carriers
118vessels 2,070,327Kt(DWT)
Tankers
86vessels 13,121,791Kt(DWT)
LNG carriers
29vessels 2,132,999Kt(DWT)
Others
47vessels 595,131Kt(DWT)
Fleet Size of Top 15 Full Container Transport Operators
(Vessels)
Maersk Line (Denmark)
MSC (Switzerland)
CMA-CGM (France)
Evergreen (Taiwan)
Hapag-Lloyd (Germany)
APL (Singapore)
CSAV (Chile)
COSCO (China)
China Shipping Container Lines (CSCL, China)
Hanjin Shipping (Korea)
NYK Line
“K” Line
Hamburg-Sud (Germany)
Orient Overseas Container Line (OOCL, Hong Kong)
Mitsui O.S.K. Lines
92372
0 110 220 330 440 550
(Thousands of TEUs) 0 400 800 1,200 1,600 2,000
Vessels TEU Grand Alliance
Source: Complied by the NYK Research Group, based on the January 2011 edition of
MDS Transmodel
(As of January 2011)
Fleet Size of Top Car Carrier Operators(As of January 1, 2011)
(Vessels)
NYK Line
Mitsui O.S.K. Lines
“K” Line
EUKOR
Wallenius Wilhelmsen Line
HAL
GRIMALDI (NAPLES)
CCCS
GLOVIS
CSAV
N.M.C.C.
Others
100
0 20 40 60 80 100
Source: Hesnes Shipping As “The Car Carrier Market 2010”
Note: This table includes only vessels with a capacity of 2,000 cars or more.
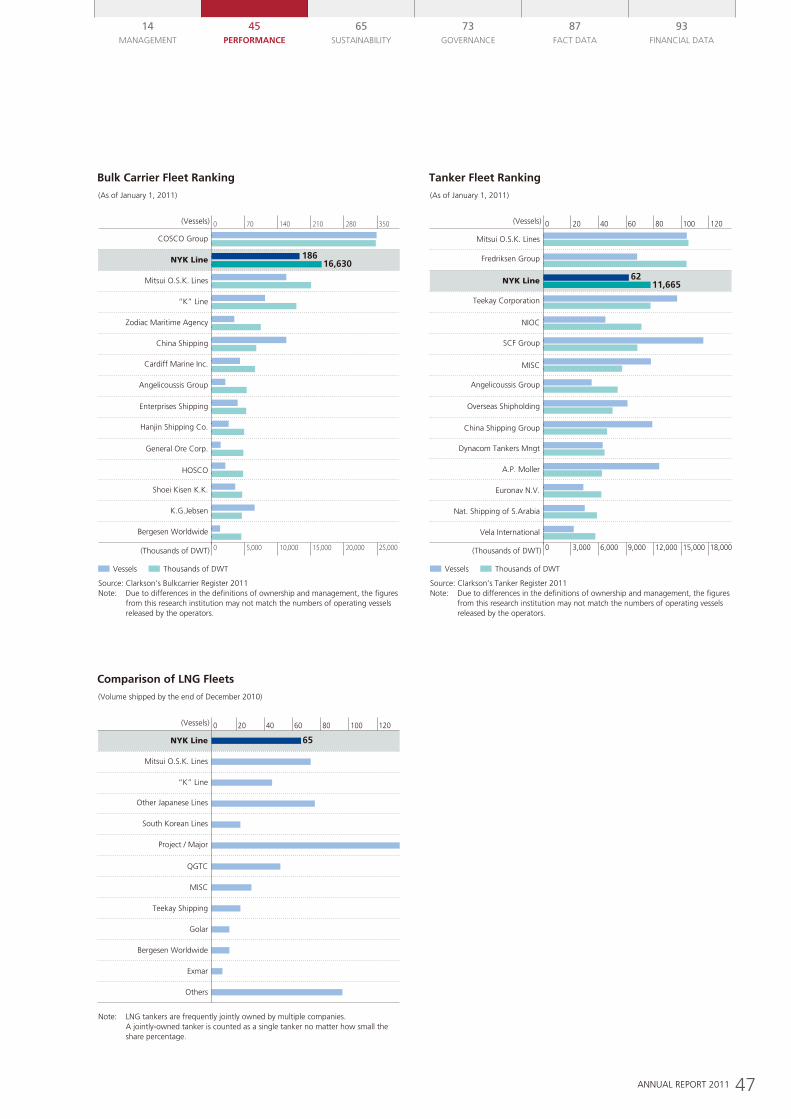
47ANNUAL REPORT 2011
14MANAgEMENT
65SUSTAINABILITY
73gOvERNANcE
87FAcT DATA
93FINANcIAL DATA
45PerfOrmANCe
Bulk Carrier Fleet Ranking
Vessels Thousands of DWT
Source: Clarkson’s Bulkcarrier Register 2011Note: Due to differences in the definitions of ownership and management, the figures from this research institution may not match the numbers of operating vessels released by the operators.
(As of January 1, 2011)
(Vessels)
COSCO Group
NYK Line
Mitsui O.S.K. Lines
“K” Line
Zodiac Maritime Agency
Cardiff Marine Inc.
China Shipping
Shoei Kisen K.K.
K.G.Jebsen
Bergesen Worldwide
General Ore Corp.
Hanjin Shipping Co.
HOSCO
Angelicoussis Group
Enterprises Shipping
18616,630
0 70 140 210 280 350
(Thousands of DWT) 0 5,000 10,000 15,000 20,000 25,000
Comparison of LNG Fleets(Volume shipped by the end of December 2010)
(Vessels)
NYK Line
Mitsui O.S.K. Lines
“K” Line
Other Japanese Lines
South Korean Lines
Project / Major
QGTC
MISC
Teekay Shipping
Golar
Bergesen Worldwide
Exmar
Others
65
0 20 40 60 80 100 120
Note: LNG tankers are frequently jointly owned by multiple companies. A jointly-owned tanker is counted as a single tanker no matter how small the share percentage.
Tanker Fleet Ranking
Vessels Thousands of DWT
Source: Clarkson’s Tanker Register 2011Note: Due to differences in the definitions of ownership and management, the figures from this research institution may not match the numbers of operating vessels released by the operators.
(As of January 1, 2011)
(Vessels)
Fredriksen Group
Mitsui O.S.K. Lines
NYK Line
NIOC
SCF Group
Teekay Corporation
Angelicoussis Group
MISC
Overseas Shipholding
Dynacom Tankers Mngt
China Shipping Group
A.P. Moller
Euronav N.V.
Nat. Shipping of S.Arabia
Vela International
6211,665
0
(Thousands of DWT) 0 3,000 6,000 9,000 12,000 15,000 18,000
20 40 60 80 100 120
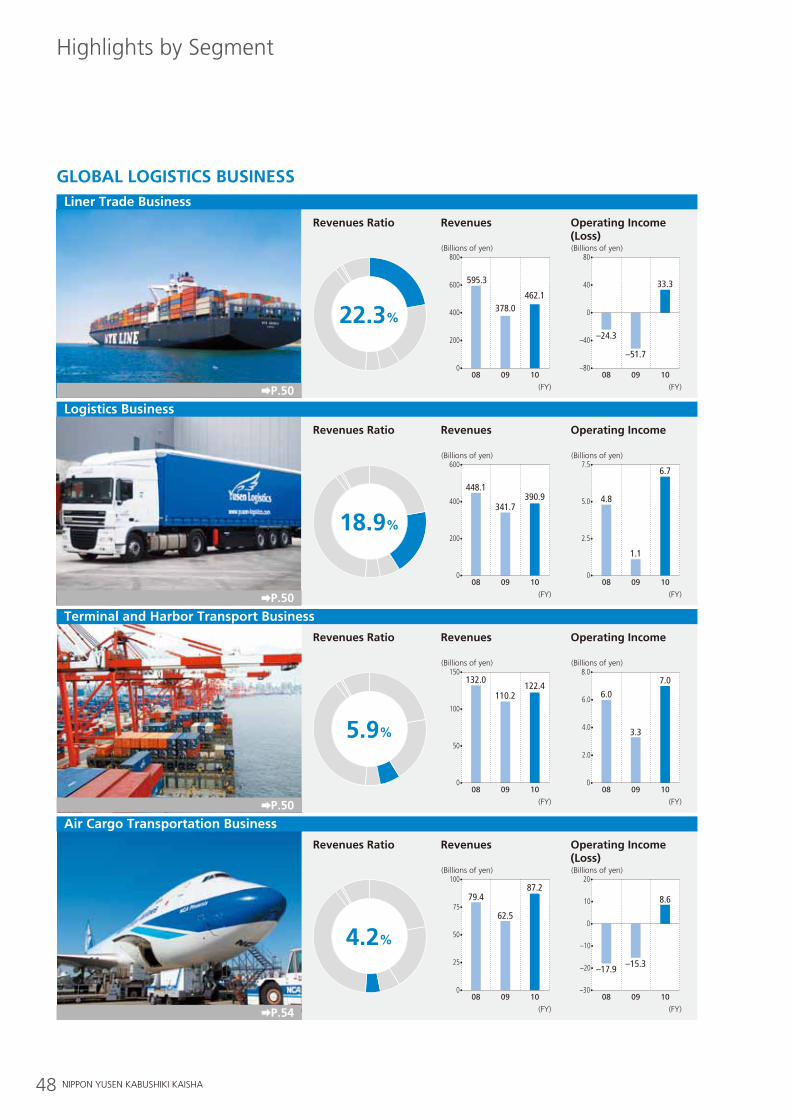
48 NIPPON YUSEN KABUSHIKI KAISHA
Liner Trade Business
P.50
Terminal and Harbor Transport Business
P.50
Logistics Business
P.50
Air Cargo Transportation Business
P.54
Highlights by Segment
GLOBAL LOGIsTICs BusINess
Revenues Ratio Revenues Operating Income (Loss)
0908
378.0
595.3
10
462.1
(FY)
0908
–51.7
–24.3
10
(FY)
(Billions of yen)(Billions of yen)800
0
600
400
200
80
–80
0
–40
40 33.3
22.3%
Revenues Ratio Revenues Operating Income
0908
341.7
448.1
10
390.9
(FY)
0908
1.1
4.8
10
6.7
(FY)
(Billions of yen)(Billions of yen)600
0
400
200
7.5
0
5.0
2.518.9%
Revenues Ratio Revenues Operating Income
0908
110.2
132.0
10
122.4
(FY)
0908
3.3
6.0
10
7.0
(FY)
(Billions of yen)(Billions of yen)150
0
100
50
8.0
0
4.0
2.0
6.0
5.9%
Revenues Ratio Revenues Operating Income (Loss)
0908
62.5
79.4
10
87.2
(FY)
0908
–15.3–17.9
10
(FY)
(Billions of yen)(Billions of yen)100
0
50
75
25
20
0
–30
–10
–20
10 8.6
4.2%
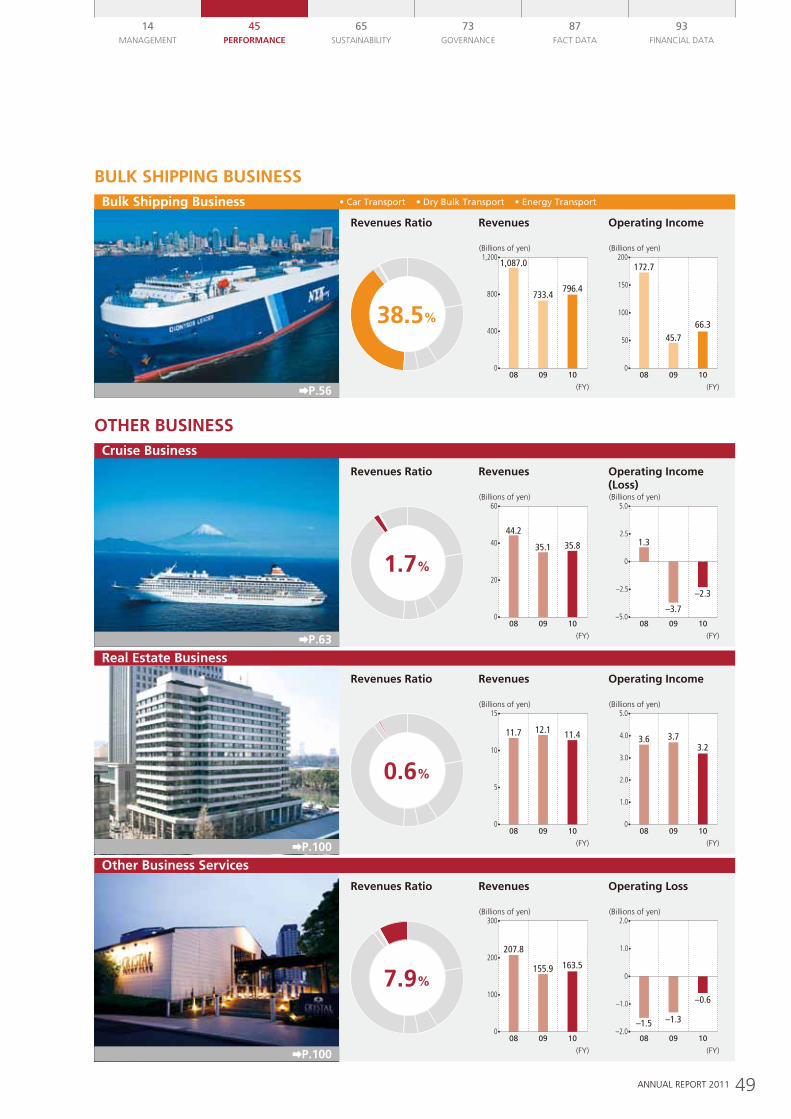
49ANNUAL REPORT 2011
14MANAgEMENT
65SUSTAINABILITY
73gOvERNANcE
87FAcT DATA
93FINANcIAL DATA
45PerfOrmANCe
Bulk shipping Business •CarTransport•DryBulkTransport•EnergyTransport
P.56
Cruise Business
P.63
Other Business services
P.100
real estate Business
P.100
BuLK sHIPPING BusINess
OTHer BusINess
Revenues Ratio Revenues Operating Income
0908
733.4
1,087.0
10
796.4
(FY)
0908
45.7
172.7
10
66.3
(FY)
(Billions of yen)(Billions of yen)1,200
0
800
400
200
0
100
50
150
38.5%
Revenues Ratio Revenues Operating Income (Loss)
0908
35.1
44.2
10
35.8
(FY)
0908
–3.7
1.3
10
–2.3
(FY)
(Billions of yen)(Billions of yen)60
0
40
20
5.0
–5.0
0
2.5
–2.5
1.7%
Revenues Ratio Revenues Operating Income
0908
12.111.7
10
11.4
(FY)
0908
3.73.6
10
3.2
(FY)
(Billions of yen)(Billions of yen)15
0
10
5
5.0
0
1.0
2.0
3.0
4.0
0.6%
Revenues Ratio Revenues Operating Loss
0908
155.9
207.8
10
163.5
(FY)
0908
–1.3–1.5
10
–0.6
(FY)
(Billions of yen)(Billions of yen)300
0
200
100
2.0
–2.0
0
1.0
–1.0
7.9%
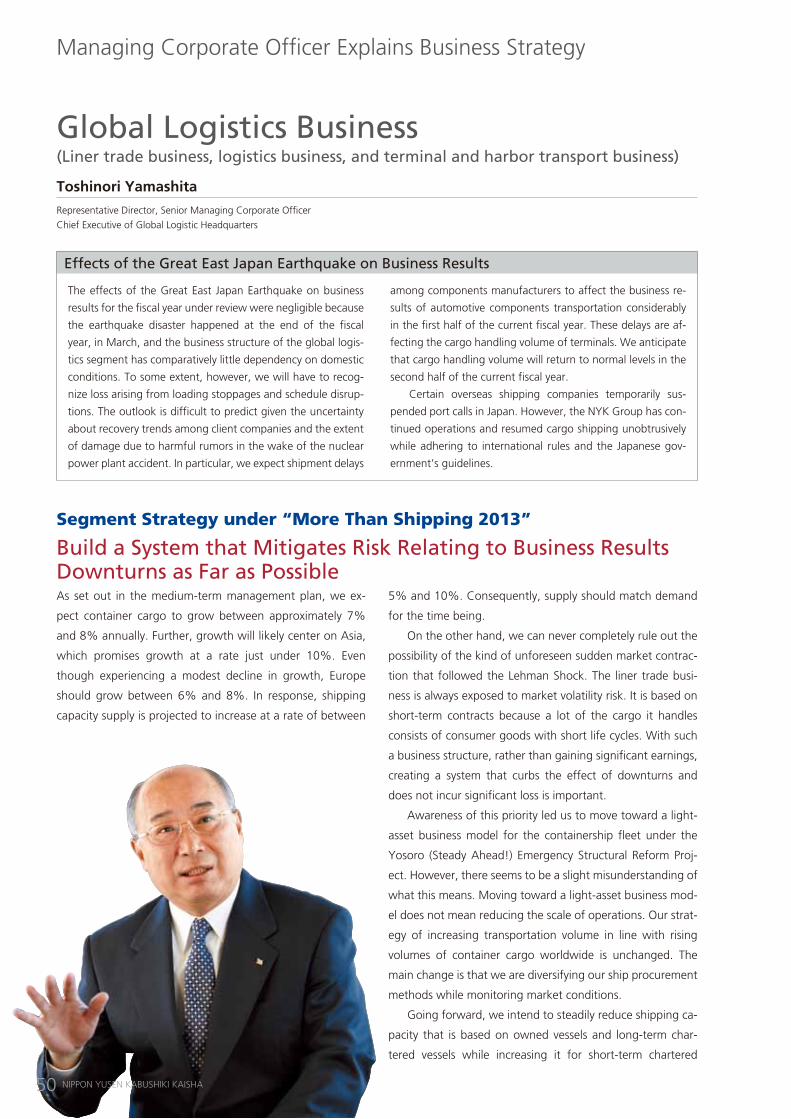
NIPPON YUSEN KABUSHIKI KAISHA50
Managing corporate Officer Explains Business Strategy
GlobalLogisticsBusiness(Linertradebusiness,logisticsbusiness,andterminalandharbortransportbusiness)
Toshinori Yamashita
Representative Director, Senior Managing corporate Officer
chief Executive of global Logistic Headquarters
Segment Strategy under “More Than Shipping 2013”
BuildaSystemthatMitigatesRiskRelatingtoBusinessResultsDownturnsasFarasPossibleAs set out in the medium-term management plan, we ex-
pect container cargo to grow between approximately 7%
and 8% annually. Further, growth will likely center on Asia,
which promises growth at a rate just under 10%. Even
though experiencing a modest decline in growth, Europe
should grow between 6% and 8%. In response, shipping
capacity supply is projected to increase at a rate of between
5% and 10%. consequently, supply should match demand
for the time being.
On the other hand, we can never completely rule out the
possibility of the kind of unforeseen sudden market contrac-
tion that followed the Lehman Shock. The liner trade busi-
ness is always exposed to market volatility risk. It is based on
short-term contracts because a lot of the cargo it handles
consists of consumer goods with short life cycles. With such
a business structure, rather than gaining significant earnings,
creating a system that curbs the effect of downturns and
does not incur significant loss is important.
Awareness of this priority led us to move toward a light-
asset business model for the containership fleet under the
Yosoro (Steady Ahead!) Emergency Structural Reform Proj-
ect. However, there seems to be a slight misunderstanding of
what this means. Moving toward a light-asset business mod-
el does not mean reducing the scale of operations. Our strat-
egy of increasing transportation volume in line with rising
volumes of container cargo worldwide is unchanged. The
main change is that we are diversifying our ship procurement
methods while monitoring market conditions.
going forward, we intend to steadily reduce shipping ca-
pacity that is based on owned vessels and long-term char-
tered vessels while increasing it for short-term chartered
EffectsoftheGreatEastJapanEarthquakeonBusinessResults
The effects of the great East Japan Earthquake on business
results for the fiscal year under review were negligible because
the earthquake disaster happened at the end of the fiscal
year, in March, and the business structure of the global logis-
tics segment has comparatively little dependency on domestic
conditions. To some extent, however, we will have to recog-
nize loss arising from loading stoppages and schedule disrup-
tions. The outlook is difficult to predict given the uncertainty
about recovery trends among client companies and the extent
of damage due to harmful rumors in the wake of the nuclear
power plant accident. In particular, we expect shipment delays
among components manufacturers to affect the business re-
sults of automotive components transportation considerably
in the first half of the current fiscal year. These delays are af-
fecting the cargo handling volume of terminals. We anticipate
that cargo handling volume will return to normal levels in the
second half of the current fiscal year.
certain overseas shipping companies temporarily sus-
pended port calls in Japan. However, the NYK group has con-
tinued operations and resumed cargo shipping unobtrusively
while adhering to international rules and the Japanese gov-
ernment’s guidelines.
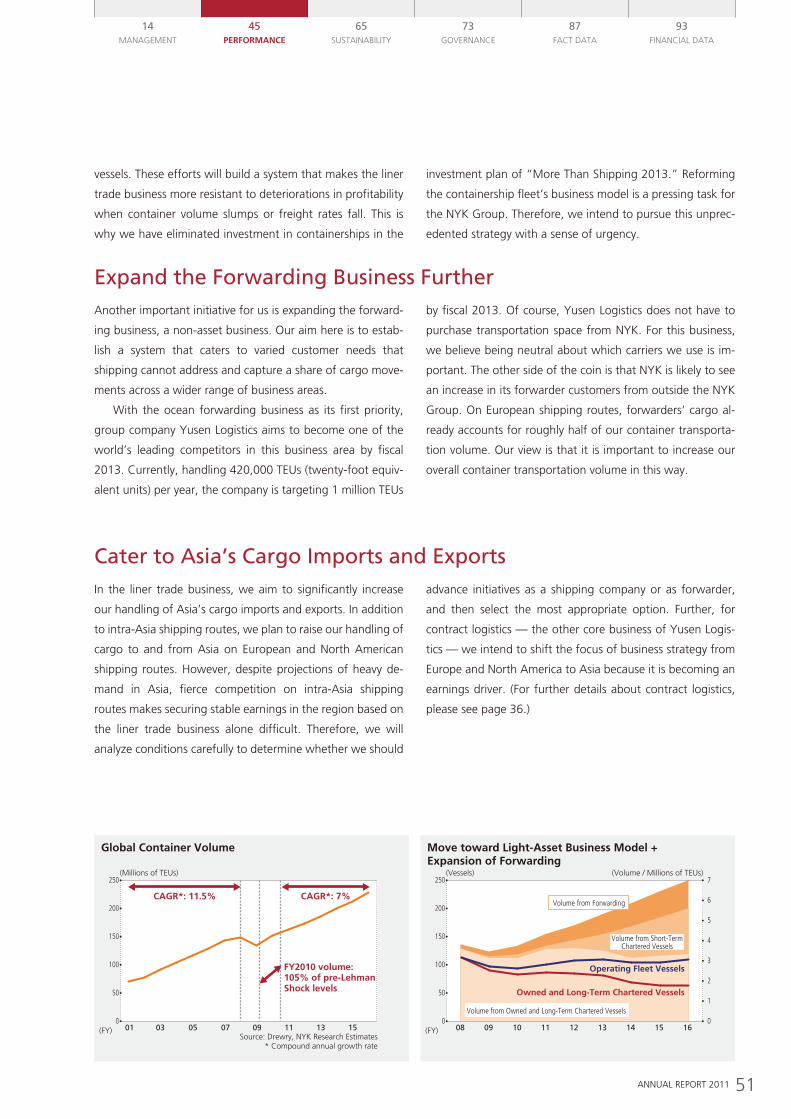
51ANNUAL REPORT 2011
14MANAgEMENT
65SUSTAINABILITY
73gOvERNANcE
87FAcT DATA
93FINANcIAL DATA
45PerfOrmANCe
ExpandtheForwardingBusinessFurther
CatertoAsia’sCargoImportsandExports
Another important initiative for us is expanding the forward-
ing business, a non-asset business. Our aim here is to estab-
lish a system that caters to varied customer needs that
shipping cannot address and capture a share of cargo move-
ments across a wider range of business areas.
With the ocean forwarding business as its first priority,
group company Yusen Logistics aims to become one of the
world’s leading competitors in this business area by fiscal
2013. currently, handling 420,000 TEUs (twenty-foot equiv-
alent units) per year, the company is targeting 1 million TEUs
by fiscal 2013. Of course, Yusen Logistics does not have to
purchase transportation space from NYK. For this business,
we believe being neutral about which carriers we use is im-
portant. The other side of the coin is that NYK is likely to see
an increase in its forwarder customers from outside the NYK
group. On European shipping routes, forwarders’ cargo al-
ready accounts for roughly half of our container transporta-
tion volume. Our view is that it is important to increase our
overall container transportation volume in this way.
In the liner trade business, we aim to significantly increase
our handling of Asia’s cargo imports and exports. In addition
to intra-Asia shipping routes, we plan to raise our handling of
cargo to and from Asia on European and North American
shipping routes. However, despite projections of heavy de-
mand in Asia, fierce competition on intra-Asia shipping
routes makes securing stable earnings in the region based on
the liner trade business alone difficult. Therefore, we will
analyze conditions carefully to determine whether we should
advance initiatives as a shipping company or as forwarder,
and then select the most appropriate option. Further, for
contract logistics — the other core business of Yusen Logis-
tics — we intend to shift the focus of business strategy from
Europe and North America to Asia because it is becoming an
earnings driver. (For further details about contract logistics,
please see page 36.)
vessels. These efforts will build a system that makes the liner
trade business more resistant to deteriorations in profitability
when container volume slumps or freight rates fall. This is
why we have eliminated investment in containerships in the
investment plan of “More Than Shipping 2013.” Reforming
the containership fleet’s business model is a pressing task for
the NYK group. Therefore, we intend to pursue this unprec-
edented strategy with a sense of urgency.
08 1009 11 12 13 14 15 16(FY)
7
6
4
2
3
1
5
0
(Vessels) (Volume / Millions of TEUs)250
200
100
50
Operating Fleet Vessels
Owned and Long-Term Chartered Vessels
150
0
Move toward Light-Asset Business Model + Expansion of Forwarding
Volume from Forwarding
Volume from Short-TermChartered Vessels
Volume from Owned and Long-Term Chartered Vessels
(Millions of TEUs)
CAGR*: 11.5%
250
200
100
50
CAGR*: 7%
150
001 0503 07 09 11 13 15(FY)
Source: Drewry, NYK Research Estimates* Compound annual growth rate
FY2010 volume: 105% of pre-Lehman Shock levels
Global Container Volume
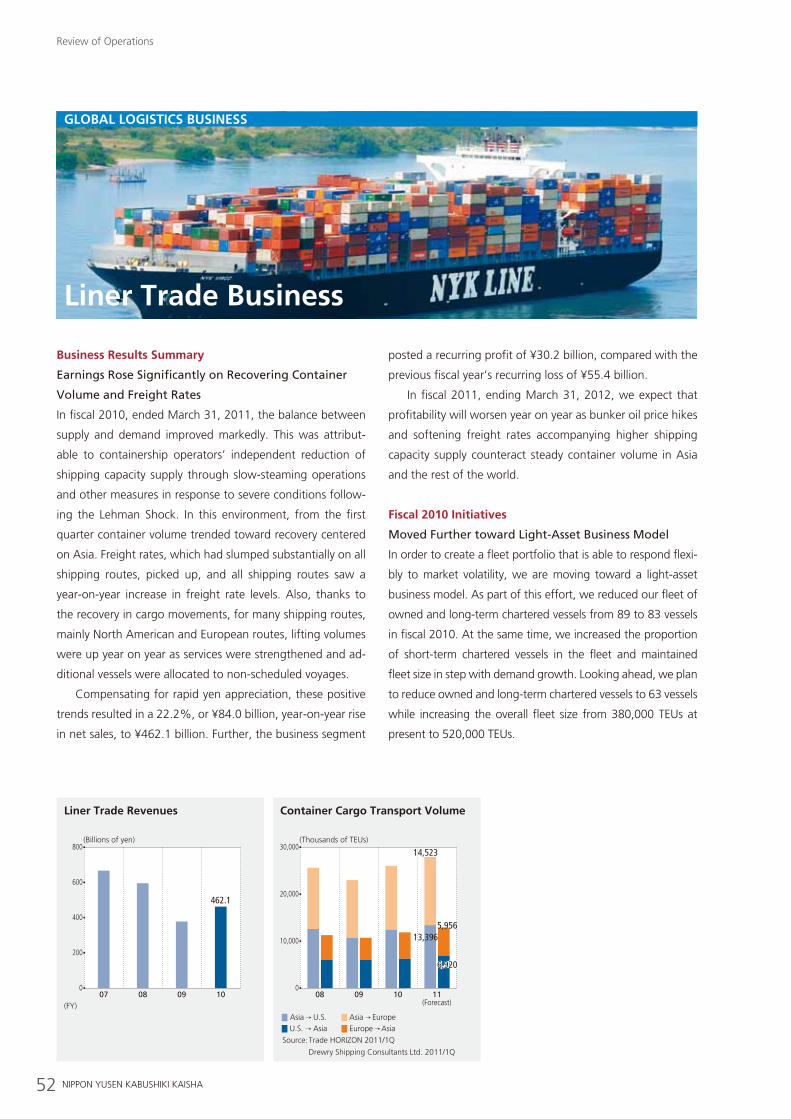
52 NIPPON YUSEN KABUSHIKI KAISHA
Review of Operations
GLOBAL LOGIsTICs BusINess
Liner Trade Business
Business results summary
EarningsRoseSignificantlyonRecoveringContainer
VolumeandFreightRates
In fiscal 2010, ended March 31, 2011, the balance between
supply and demand improved markedly. This was attribut-
able to containership operators’ independent reduction of
shipping capacity supply through slow-steaming operations
and other measures in response to severe conditions follow-
ing the Lehman Shock. In this environment, from the first
quarter container volume trended toward recovery centered
on Asia. Freight rates, which had slumped substantially on all
shipping routes, picked up, and all shipping routes saw a
year-on-year increase in freight rate levels. Also, thanks to
the recovery in cargo movements, for many shipping routes,
mainly North American and European routes, lifting volumes
were up year on year as services were strengthened and ad-
ditional vessels were allocated to non-scheduled voyages.
compensating for rapid yen appreciation, these positive
trends resulted in a 22.2%, or ¥84.0 billion, year-on-year rise
in net sales, to ¥462.1 billion. Further, the business segment
posted a recurring profit of ¥30.2 billion, compared with the
previous fiscal year’s recurring loss of ¥55.4 billion.
In fiscal 2011, ending March 31, 2012, we expect that
profitability will worsen year on year as bunker oil price hikes
and softening freight rates accompanying higher shipping
capacity supply counteract steady container volume in Asia
and the rest of the world.
fiscal 2010 Initiatives
MovedFurthertowardLight-AssetBusinessModel
In order to create a fleet portfolio that is able to respond flexi-
bly to market volatility, we are moving toward a light-asset
business model. As part of this effort, we reduced our fleet of
owned and long-term chartered vessels from 89 to 83 vessels
in fiscal 2010. At the same time, we increased the proportion
of short-term chartered vessels in the fleet and maintained
fleet size in step with demand growth. Looking ahead, we plan
to reduce owned and long-term chartered vessels to 63 vessels
while increasing the overall fleet size from 380,000 TEUs at
present to 520,000 TEUs.
Liner Trade Revenues
07 08 09 10
(Billions of yen)
462.1
800
600
400
200
0
(FY)
Container Cargo Transport Volume
08 09 10 11(Forecast)
(Thousands of TEUs)
14,52330,000
20,000
10,000 13,3965,956
6,9206,920
0
AsiaU.S.
Source: Trade HORIZON 2011/1Q
Drewry Shipping Consultants Ltd. 2011/1Q
EuropeAsia Europe
Asia AsiaU.S.
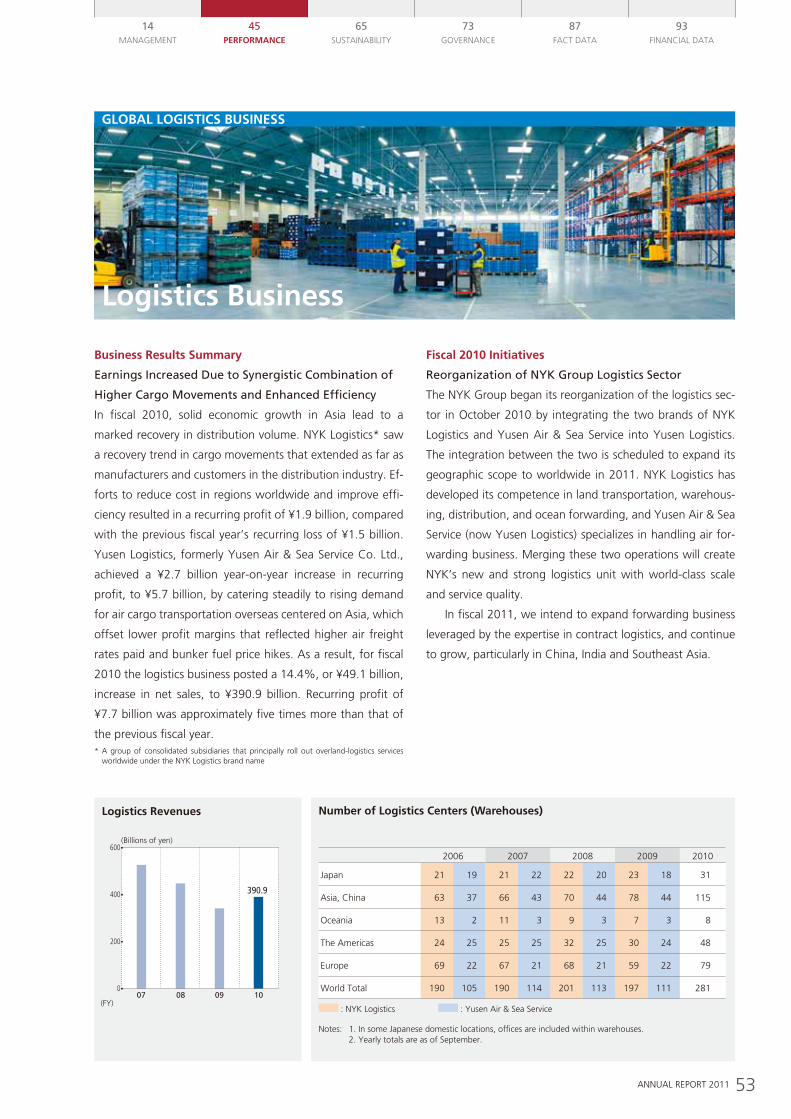
53ANNUAL REPORT 2011
14MANAgEMENT
65SUSTAiNAbiLiTy
73gOvERNANcE
87FAcT dATA
93FiNANciAL dATA
45Performance
Global loGistics business
logistics business
business results summary
Earnings Increased Due to Synergistic Combination of
Higher Cargo Movements and Enhanced Efficiency
in fiscal 2010, solid economic growth in Asia lead to a
marked recovery in distribution volume. NyK Logistics* saw
a recovery trend in cargo movements that extended as far as
manufacturers and customers in the distribution industry. Ef-
forts to reduce cost in regions worldwide and improve effi-
ciency resulted in a recurring profit of ¥1.9 billion, compared
with the previous fiscal year’s recurring loss of ¥1.5 billion.
yusen Logistics, formerly yusen Air & Sea Service co. Ltd.,
achieved a ¥2.7 billion year-on-year increase in recurring
profit, to ¥5.7 billion, by catering steadily to rising demand
for air cargo transportation overseas centered on Asia, which
offset lower profit margins that reflected higher air freight
rates paid and bunker fuel price hikes. As a result, for fiscal
2010 the logistics business posted a 14.4%, or ¥49.1 billion,
increase in net sales, to ¥390.9 billion. Recurring profit of
¥7.7 billion was approximately five times more than that of
the previous fiscal year.* A group of consolidated subsidiaries that principally roll out overland-logistics services
worldwide under the NyK Logistics brand name
fiscal 2010 initiatives
Reorganization of NYK Group Logistics Sector
The NyK group began its reorganization of the logistics sec-
tor in October 2010 by integrating the two brands of NyK
Logistics and yusen Air & Sea Service into yusen Logistics.
The integration between the two is scheduled to expand its
geographic scope to worldwide in 2011. NyK Logistics has
developed its competence in land transportation, warehous-
ing, distribution, and ocean forwarding, and yusen Air & Sea
Service (now yusen Logistics) specializes in handling air for-
warding business. Merging these two operations will create
NyK’s new and strong logistics unit with world-class scale
and service quality.
in fiscal 2011, we intend to expand forwarding business
leveraged by the expertise in contract logistics, and continue
to grow, particularly in china, india and Southeast Asia.
Logistics Revenues
(Billions of yen)600
400
200
07 08 09 10(FY)
390.9
0
2006 2007 2008 2009 2010
Japan 21 19 21 22 22 20 23 18 31
Asia, china 63 37 66 43 70 44 78 44 115
Oceania 13 2 11 3 9 3 7 3 8
The Americas 24 25 25 25 32 25 30 24 48
Europe 69 22 67 21 68 21 59 22 79
World Total 190 105 190 114 201 113 197 111 281
: NyK Logistics : yusen Air & Sea Service
Notes: 1. in some Japanese domestic locations, offices are included within warehouses. 2. yearly totals are as of September.
number of logistics centers (Warehouses)
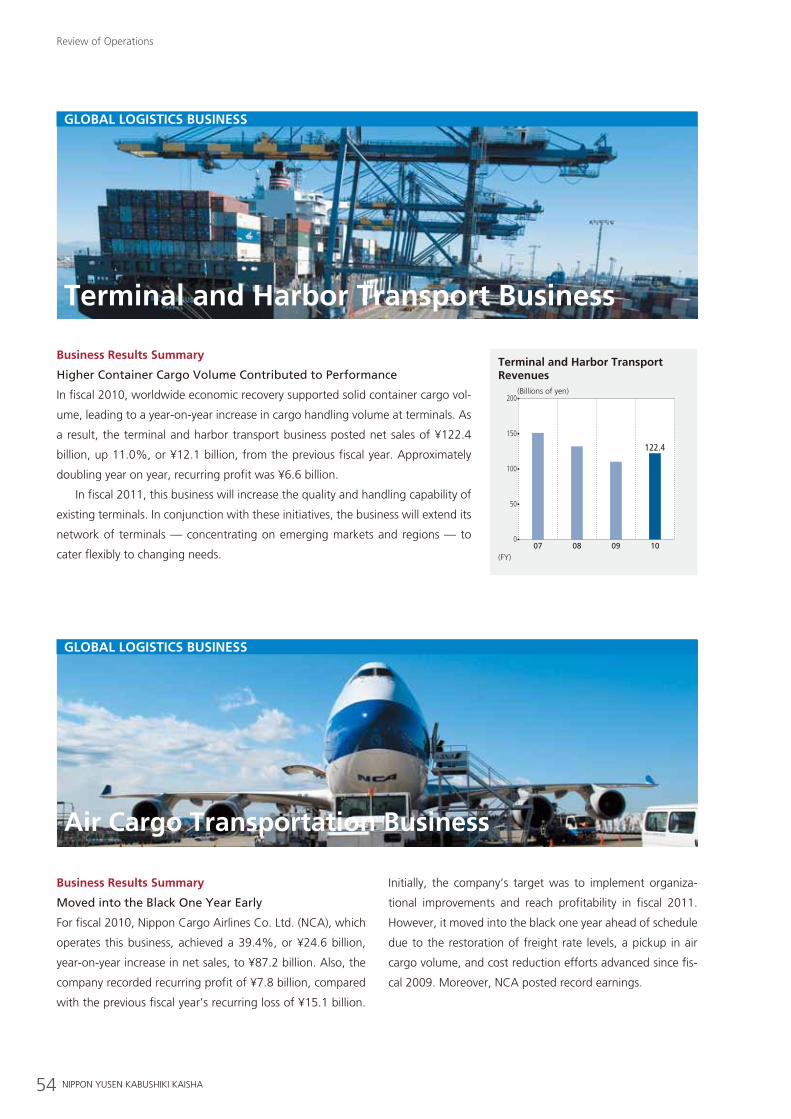
54 NIPPON YUSEN KABUSHIKI KAISHA
GLOBAL LOGIsTICs BusINess
GLOBAL LOGIsTICs BusINess
Terminal and Harbor Transport Business
Air Cargo Transportation Business
Business results summary
HigherContainerCargoVolumeContributedtoPerformance
In fiscal 2010, worldwide economic recovery supported solid container cargo vol-
ume, leading to a year-on-year increase in cargo handling volume at terminals. As
a result, the terminal and harbor transport business posted net sales of ¥122.4
billion, up 11.0%, or ¥12.1 billion, from the previous fiscal year. Approximately
doubling year on year, recurring profit was ¥6.6 billion.
In fiscal 2011, this business will increase the quality and handling capability of
existing terminals. In conjunction with these initiatives, the business will extend its
network of terminals — concentrating on emerging markets and regions — to
cater flexibly to changing needs.
Business results summary
MovedintotheBlackOneYearEarly
For fiscal 2010, Nippon cargo Airlines co. Ltd. (NcA), which
operates this business, achieved a 39.4%, or ¥24.6 billion,
year-on-year increase in net sales, to ¥87.2 billion. Also, the
company recorded recurring profit of ¥7.8 billion, compared
with the previous fiscal year’s recurring loss of ¥15.1 billion.
Initially, the company’s target was to implement organiza-
tional improvements and reach profitability in fiscal 2011.
However, it moved into the black one year ahead of schedule
due to the restoration of freight rate levels, a pickup in air
cargo volume, and cost reduction efforts advanced since fis-
cal 2009. Moreover, NcA posted record earnings.
Review of Operations
Terminal and Harbor Transport Revenues
07 08 09 10
(Billions of yen)
122.4
200
150
100
50
(FY)
0
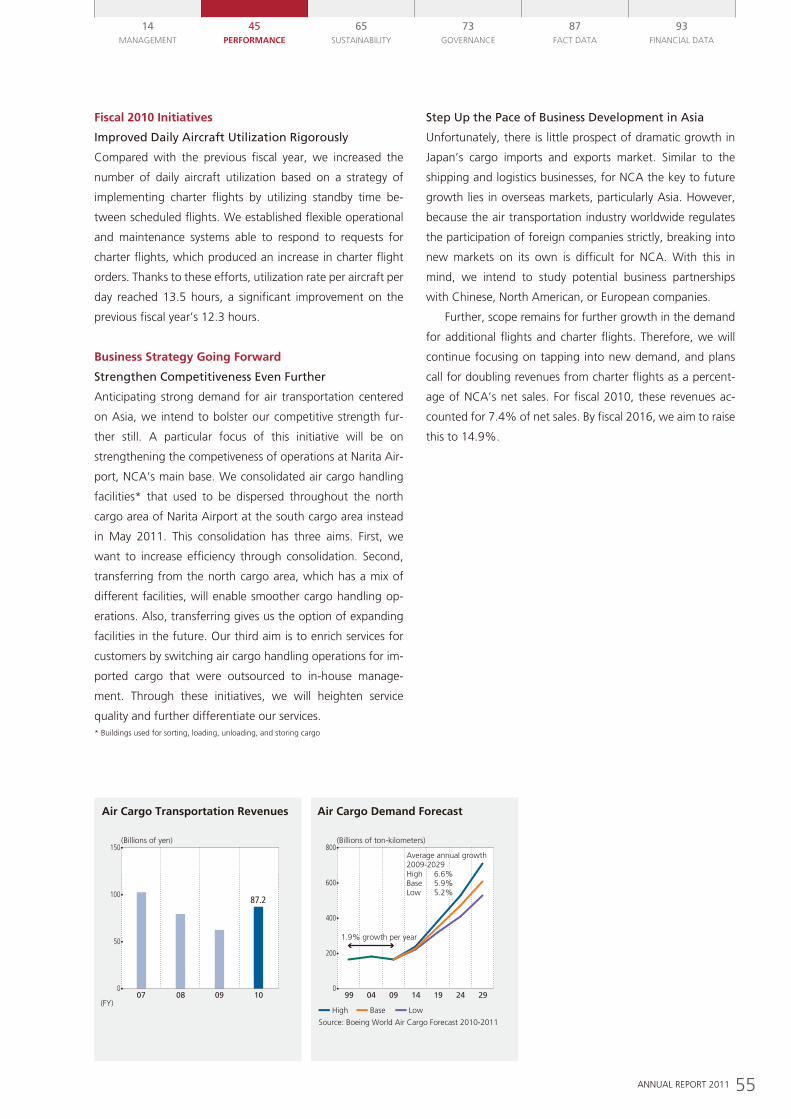
55ANNUAL REPORT 2011
14MANAgEMENT
65SUSTAINABILITY
73gOvERNANcE
87FAcT DATA
93FINANcIAL DATA
45PerfOrmANCe
fiscal 2010 Initiatives
ImprovedDailyAircraftUtilizationRigorously
compared with the previous fiscal year, we increased the
number of daily aircraft utilization based on a strategy of
implementing charter flights by utilizing standby time be-
tween scheduled flights. We established flexible operational
and maintenance systems able to respond to requests for
charter flights, which produced an increase in charter flight
orders. Thanks to these efforts, utilization rate per aircraft per
day reached 13.5 hours, a significant improvement on the
previous fiscal year’s 12.3 hours.
Business strategy Going forward
StrengthenCompetitivenessEvenFurther
Anticipating strong demand for air transportation centered
on Asia, we intend to bolster our competitive strength fur-
ther still. A particular focus of this initiative will be on
strengthening the competiveness of operations at Narita Air-
port, NcA’s main base. We consolidated air cargo handling
facilities* that used to be dispersed throughout the north
cargo area of Narita Airport at the south cargo area instead
in May 2011. This consolidation has three aims. First, we
want to increase efficiency through consolidation. Second,
transferring from the north cargo area, which has a mix of
different facilities, will enable smoother cargo handling op-
erations. Also, transferring gives us the option of expanding
facilities in the future. Our third aim is to enrich services for
customers by switching air cargo handling operations for im-
ported cargo that were outsourced to in-house manage-
ment. Through these initiatives, we will heighten service
quality and further differentiate our services.* Buildings used for sorting, loading, unloading, and storing cargo
StepUpthePaceofBusinessDevelopmentinAsia
Unfortunately, there is little prospect of dramatic growth in
Japan’s cargo imports and exports market. Similar to the
shipping and logistics businesses, for NcA the key to future
growth lies in overseas markets, particularly Asia. However,
because the air transportation industry worldwide regulates
the participation of foreign companies strictly, breaking into
new markets on its own is difficult for NcA. With this in
mind, we intend to study potential business partnerships
with chinese, North American, or European companies.
Further, scope remains for further growth in the demand
for additional flights and charter flights. Therefore, we will
continue focusing on tapping into new demand, and plans
call for doubling revenues from charter flights as a percent-
age of NcA’s net sales. For fiscal 2010, these revenues ac-
counted for 7.4% of net sales. By fiscal 2016, we aim to raise
this to 14.9%.
Air Cargo Transportation Revenues
(Billions of yen)150
100
50
07 08 09 10(FY)
87.2
0
(Billions of ton-kilometers)
0
Air Cargo Demand Forecast
800
400
200
600
High
Source: Boeing World Air Cargo Forecast 2010-2011
Base Low
99 04 1409 19 24 29
1.9% growth per year
Average annual growth 2009-2029High 6.6%Base 5.9%Low 5.2%
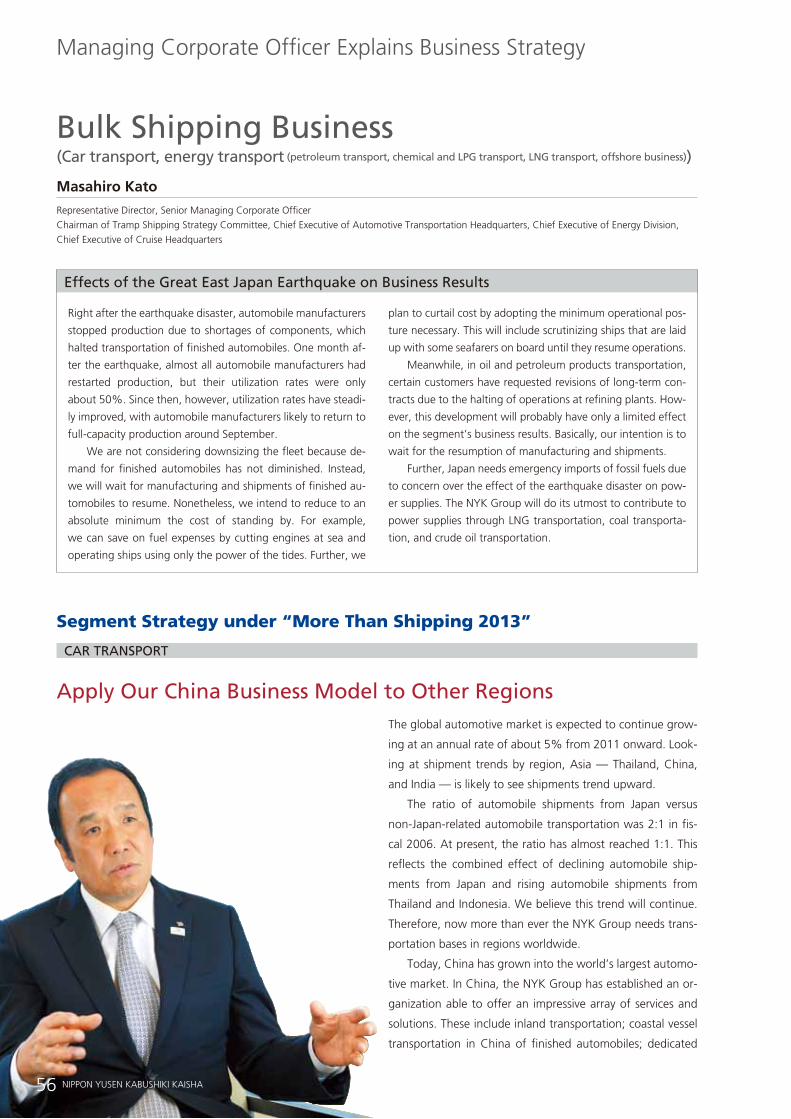
EffectsoftheGreatEastJapanEarthquakeonBusinessResults
NIPPON YUSEN KABUSHIKI KAISHA56
Managing corporate Officer Explains Business Strategy
BulkShippingBusiness(Cartransport,energytransport(petroleumtransport,chemicalandLPGtransport,LNGtransport,offshorebusiness))
masahiro Kato
Representative Director, Senior Managing corporate Officer
chairman of Tramp Shipping Strategy committee, chief Executive of Automotive Transportation Headquarters, chief Executive of Energy Division,
chief Executive of cruise Headquarters
Segment Strategy under “More Than Shipping 2013”
CARTRANSPORT
ApplyOurChinaBusinessModeltoOtherRegionsThe global automotive market is expected to continue grow-
ing at an annual rate of about 5% from 2011 onward. Look-
ing at shipment trends by region, Asia — Thailand, china,
and India — is likely to see shipments trend upward.
The ratio of automobile shipments from Japan versus
non-Japan-related automobile transportation was 2:1 in fis-
cal 2006. At present, the ratio has almost reached 1:1. This
reflects the combined effect of declining automobile ship-
ments from Japan and rising automobile shipments from
Thailand and Indonesia. We believe this trend will continue.
Therefore, now more than ever the NYK group needs trans-
portation bases in regions worldwide.
Today, china has grown into the world’s largest automo-
tive market. In china, the NYK group has established an or-
ganization able to offer an impressive array of services and
solutions. These include inland transportation; coastal vessel
transportation in china of finished automobiles; dedicated
Right after the earthquake disaster, automobile manufacturers
stopped production due to shortages of components, which
halted transportation of finished automobiles. One month af-
ter the earthquake, almost all automobile manufacturers had
restarted production, but their utilization rates were only
about 50%. Since then, however, utilization rates have steadi-
ly improved, with automobile manufacturers likely to return to
full-capacity production around September.
We are not considering downsizing the fleet because de-
mand for finished automobiles has not diminished. Instead,
we will wait for manufacturing and shipments of finished au-
tomobiles to resume. Nonetheless, we intend to reduce to an
absolute minimum the cost of standing by. For example,
we can save on fuel expenses by cutting engines at sea and
operating ships using only the power of the tides. Further, we
plan to curtail cost by adopting the minimum operational pos-
ture necessary. This will include scrutinizing ships that are laid
up with some seafarers on board until they resume operations.
Meanwhile, in oil and petroleum products transportation,
certain customers have requested revisions of long-term con-
tracts due to the halting of operations at refining plants. How-
ever, this development will probably have only a limited effect
on the segment’s business results. Basically, our intention is to
wait for the resumption of manufacturing and shipments.
Further, Japan needs emergency imports of fossil fuels due
to concern over the effect of the earthquake disaster on pow-
er supplies. The NYK group will do its utmost to contribute to
power supplies through LNg transportation, coal transporta-
tion, and crude oil transportation.
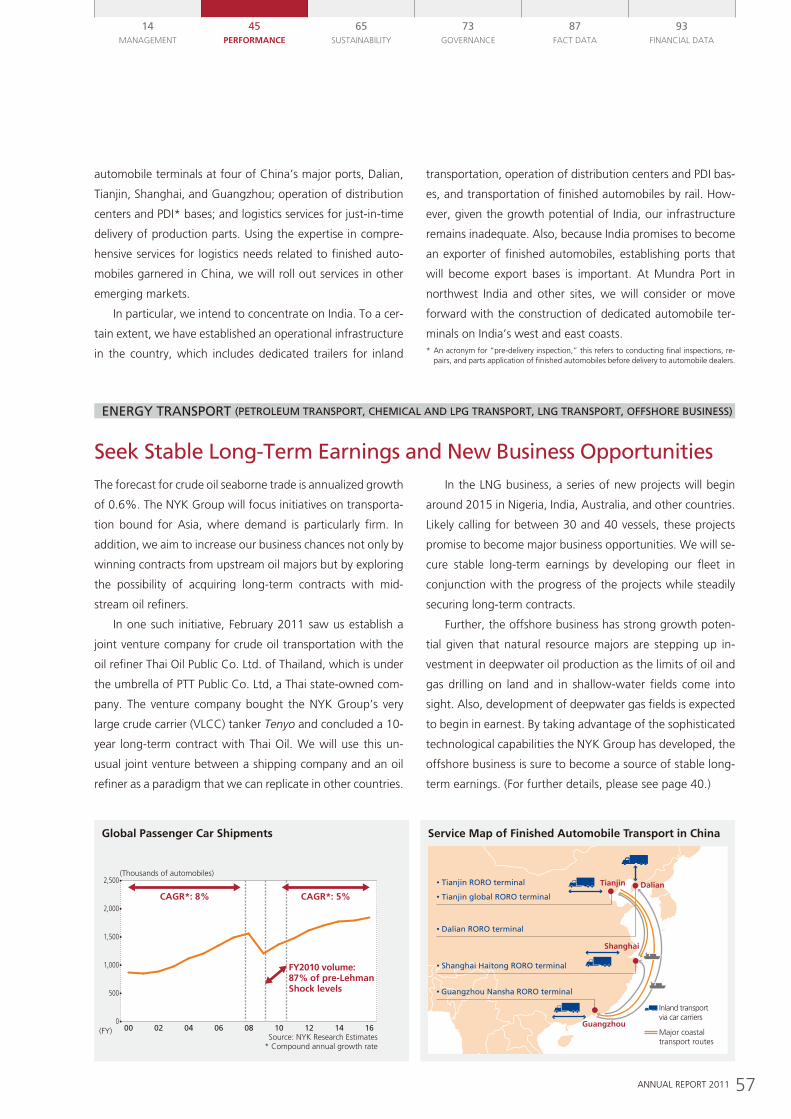
57ANNUAL REPORT 2011
14MANAgEMENT
65SUSTAINABILITY
73gOvERNANcE
87FAcT DATA
93FINANcIAL DATA
45PerfOrmANCe
ENERGYTRANSPORT(PETROLEUMTRANSPORT,CHEMICALANDLPGTRANSPORT,LNGTRANSPORT,OFFSHOREBUSINESS)
SeekStableLong-TermEarningsandNewBusinessOpportunitiesThe forecast for crude oil seaborne trade is annualized growth
of 0.6%. The NYK group will focus initiatives on transporta-
tion bound for Asia, where demand is particularly firm. In
addition, we aim to increase our business chances not only by
winning contracts from upstream oil majors but by exploring
the possibility of acquiring long-term contracts with mid-
stream oil refiners.
In one such initiative, February 2011 saw us establish a
joint venture company for crude oil transportation with the
oil refiner Thai Oil Public co. Ltd. of Thailand, which is under
the umbrella of PTT Public co. Ltd, a Thai state-owned com-
pany. The venture company bought the NYK group’s very
large crude carrier (vLcc) tanker Tenyo and concluded a 10-
year long-term contract with Thai Oil. We will use this un-
usual joint venture between a shipping company and an oil
refiner as a paradigm that we can replicate in other countries.
In the LNg business, a series of new projects will begin
around 2015 in Nigeria, India, Australia, and other countries.
Likely calling for between 30 and 40 vessels, these projects
promise to become major business opportunities. We will se-
cure stable long-term earnings by developing our fleet in
conjunction with the progress of the projects while steadily
securing long-term contracts.
Further, the offshore business has strong growth poten-
tial given that natural resource majors are stepping up in-
vestment in deepwater oil production as the limits of oil and
gas drilling on land and in shallow-water fields come into
sight. Also, development of deepwater gas fields is expected
to begin in earnest. By taking advantage of the sophisticated
technological capabilities the NYK group has developed, the
offshore business is sure to become a source of stable long-
term earnings. (For further details, please see page 40.)
automobile terminals at four of china’s major ports, Dalian,
Tianjin, Shanghai, and guangzhou; operation of distribution
centers and PDI* bases; and logistics services for just-in-time
delivery of production parts. Using the expertise in compre-
hensive services for logistics needs related to finished auto-
mobiles garnered in china, we will roll out services in other
emerging markets.
In particular, we intend to concentrate on India. To a cer-
tain extent, we have established an operational infrastructure
in the country, which includes dedicated trailers for inland
transportation, operation of distribution centers and PDI bas-
es, and transportation of finished automobiles by rail. How-
ever, given the growth potential of India, our infrastructure
remains inadequate. Also, because India promises to become
an exporter of finished automobiles, establishing ports that
will become export bases is important. At Mundra Port in
northwest India and other sites, we will consider or move
forward with the construction of dedicated automobile ter-
minals on India’s west and east coasts.* An acronym for “pre-delivery inspection,” this refers to conducting final inspections, re-
pairs, and parts application of finished automobiles before delivery to automobile dealers.
Global Passenger Car shipments service map of finished Automobile Transport in China
• Tianjin RORO terminal
• Tianjin global RORO terminal
• Guangzhou Nansha RORO terminal
Major coastal transport routes
Inland transport via car carriers
Tianjin Dalian
Shanghai
• Shanghai Haitong RORO terminal
• Dalian RORO terminal
Guangzhou
(Thousands of automobiles)
CAGR*: 8%
2,500
2,000
1,000
500
CAGR*: 5%
1,500
0
Global Passenger Car Shipments
00 0402 06 08 10 12 14 16(FY)Source: NYK Research Estimates
* Compound annual growth rate
FY2010 volume: 87% of pre-Lehman Shock levels
EffectsoftheGreatEastJapanEarthquakeonBusinessResults
58 NIPPON YUSEN KABUSHIKI KAISHA
Managing corporate Officer Explains Business Strategy
BulkShippingBusiness(Drybulktransport)
Hidenori Hono
Representative Director, Senior Managing corporate Officer
chief Executive of Dry Bulk Division
Segment Strategy under “More Than Shipping 2013”
HeightenCostCompetitiveness,ObtainNewContractsDemand for respective types of dry bulk began to decline
from the second half of fiscal 2010. In particular, china,
which had supported iron ore demand worldwide, has begun
shifting toward domestic production of iron ore. This change
is affecting market conditions significantly. Also, in light of
the numerous new ships due for delivery by 2012, we expect
an oversupply of shipping capacity to continue.
In response, the NYK group will concentrate on reducing
the average cost of the fleet and acquiring long-term con-
tracts. Strengthening cost competitiveness is a particularly
pressing task. The NYK group’s fleet includes ships with high
tonnage value or charterage fees. We want to dispose of
these ships rapidly in order to lower fleet cost. However, dis-
posal incurs commensurate cost, so we intend to proceed
carefully. At the same time, given the current surplus of ship-
ping capacity supply, we need to incorporate into the fleet
more ships that are highly competitive.
Meanwhile, as an immediately effective cost-reduction
measure we are implementing slow-steaming operations.
Slow-steaming operations help improve profit margins at
times, such as now, when market conditions are unfavorable.
The NYK group has been implementing slow-steaming op-
erations for containerships for the past two years. Using this
as a model, we are pursuing optimal measures. For chartered
vessels, however, we need the cooperation of shipowners.
Therefore, we are considering making shipowners amenable
to slow-steaming operations by offering them some type
of incentive.
The NYK group’s global network gives it a major com-
petitive advantage over other companies. (Please see page
42.) With this in mind, we plan to further intensify collabora-
tion among local subsidiaries. By fully exploiting this sales
base and heightening cost competitiveness rapidly, we will
win more long-term contracts.
Direct damage included the grounding of three bulk carriers
due to the tsunami after the earthquake. Two of these ships
are reparable. However, the third may not be reparable.
Regarding indirect damage, coal transportation for electric
power companies has slumped. Also, the halting of production
at paper manufacturing plants has affected the transportation
of wood chips for paper manufacturers. Further, iron ore
transportation volumes for steel plants are sluggish. We expect
it will take time before the situation returns to normal.
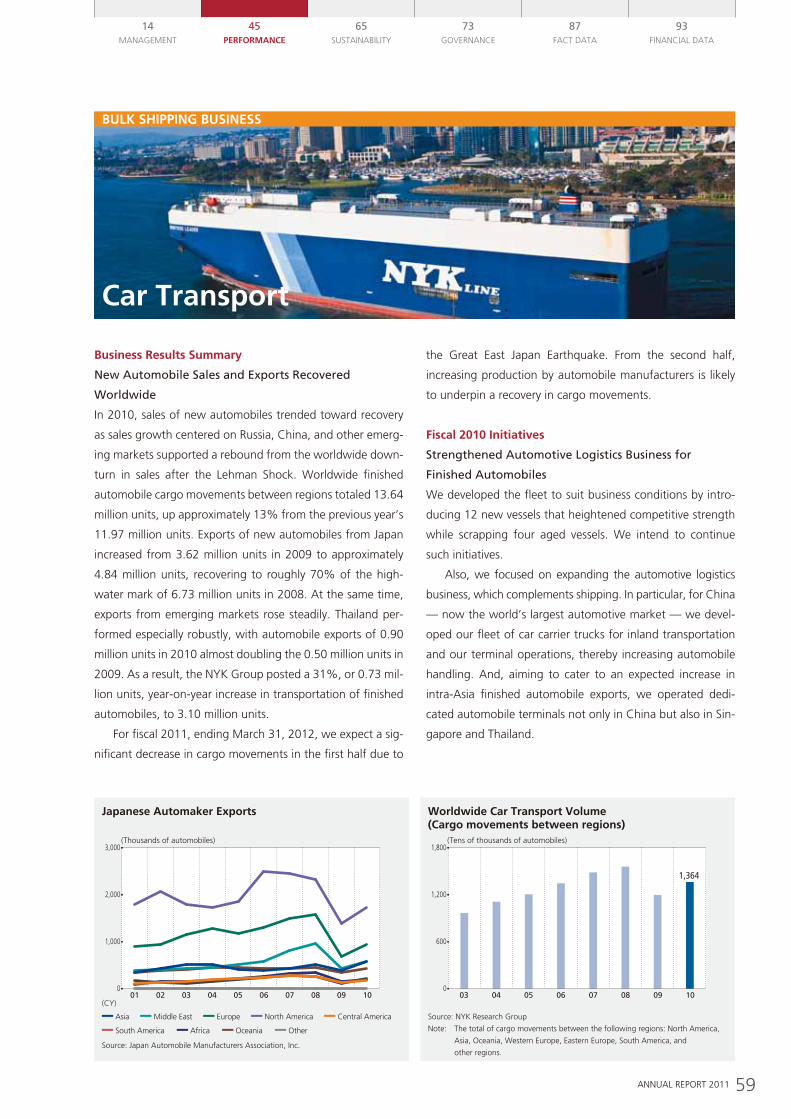
BuLK sHIPPING BusINess
Car Transport
59ANNUAL REPORT 2011
14MANAgEMENT
65SUSTAINABILITY
73gOvERNANcE
87FAcT DATA
93FINANcIAL DATA
45PerfOrmANCe
Business results summary
NewAutomobileSalesandExportsRecovered
Worldwide
In 2010, sales of new automobiles trended toward recovery
as sales growth centered on Russia, china, and other emerg-
ing markets supported a rebound from the worldwide down-
turn in sales after the Lehman Shock. Worldwide finished
automobile cargo movements between regions totaled 13.64
million units, up approximately 13% from the previous year’s
11.97 million units. Exports of new automobiles from Japan
increased from 3.62 million units in 2009 to approximately
4.84 million units, recovering to roughly 70% of the high-
water mark of 6.73 million units in 2008. At the same time,
exports from emerging markets rose steadily. Thailand per-
formed especially robustly, with automobile exports of 0.90
million units in 2010 almost doubling the 0.50 million units in
2009. As a result, the NYK group posted a 31%, or 0.73 mil-
lion units, year-on-year increase in transportation of finished
automobiles, to 3.10 million units.
For fiscal 2011, ending March 31, 2012, we expect a sig-
nificant decrease in cargo movements in the first half due to
the great East Japan Earthquake. From the second half,
increasing production by automobile manufacturers is likely
to underpin a recovery in cargo movements.
fiscal 2010 Initiatives
StrengthenedAutomotiveLogisticsBusinessfor
FinishedAutomobiles
We developed the fleet to suit business conditions by intro-
ducing 12 new vessels that heightened competitive strength
while scrapping four aged vessels. We intend to continue
such initiatives.
Also, we focused on expanding the automotive logistics
business, which complements shipping. In particular, for china
— now the world’s largest automotive market — we devel-
oped our fleet of car carrier trucks for inland transportation
and our terminal operations, thereby increasing automobile
handling. And, aiming to cater to an expected increase in
intra-Asia finished automobile exports, we operated dedi-
cated automobile terminals not only in china but also in Sin-
gapore and Thailand.
Japanese Automaker Exports
01 02 03 04 05 06 07 08 09 10
(Thousands of automobiles)3,000
2,000
1,000
(CY)
0
Source: Japan Automobile Manufacturers Association, Inc.
Asia Middle East Europe
Africa Oceania Other
North America Central America
South America
Worldwide Car Transport Volume (Cargo movements between regions)
03 04 05 06 07 08 09 10
Source: NYK Research Group
Note: The total of cargo movements between the following regions: North America,
Asia, Oceania, Western Europe, Eastern Europe, South America, and
other regions.
(Tens of thousands of automobiles)1,800
1,200
600
1,364
0
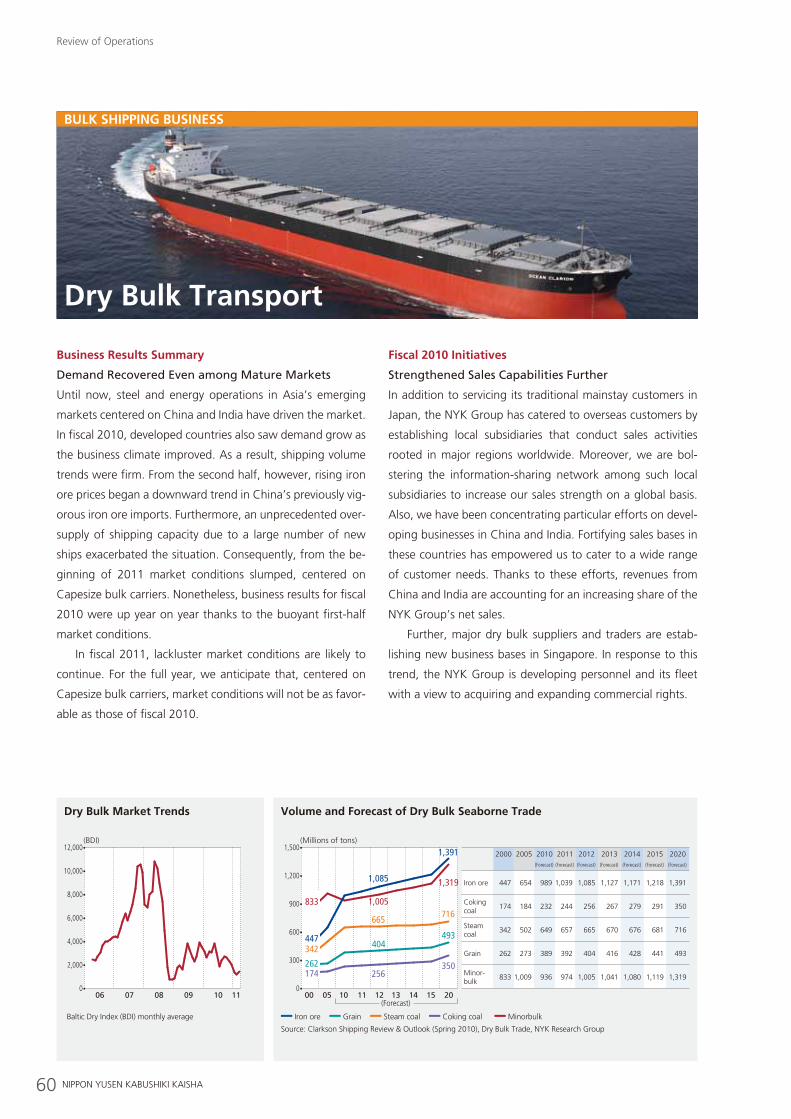
Bulk shipping Business
Dry Bulk Transport
Business Results summary
Demand Recovered Even among Mature Markets
Until now, steel and energy operations in Asia’s emerging
markets centered on China and India have driven the market.
In fiscal 2010, developed countries also saw demand grow as
the business climate improved. As a result, shipping volume
trends were firm. From the second half, however, rising iron
ore prices began a downward trend in China’s previously vig-
orous iron ore imports. Furthermore, an unprecedented over-
supply of shipping capacity due to a large number of new
ships exacerbated the situation. Consequently, from the be-
ginning of 2011 market conditions slumped, centered on
Capesize bulk carriers. Nonetheless, business results for fiscal
2010 were up year on year thanks to the buoyant first-half
market conditions.
In fiscal 2011, lackluster market conditions are likely to
continue. For the full year, we anticipate that, centered on
Capesize bulk carriers, market conditions will not be as favor-
able as those of fiscal 2010.
Fiscal 2010 initiatives
Strengthened Sales Capabilities Further
In addition to servicing its traditional mainstay customers in
Japan, the NYK Group has catered to overseas customers by
establishing local subsidiaries that conduct sales activities
rooted in major regions worldwide. Moreover, we are bol-
stering the information-sharing network among such local
subsidiaries to increase our sales strength on a global basis.
Also, we have been concentrating particular efforts on devel-
oping businesses in China and India. Fortifying sales bases in
these countries has empowered us to cater to a wide range
of customer needs. Thanks to these efforts, revenues from
China and India are accounting for an increasing share of the
NYK Group’s net sales.
Further, major dry bulk suppliers and traders are estab-
lishing new business bases in Singapore. In response to this
trend, the NYK Group is developing personnel and its fleet
with a view to acquiring and expanding commercial rights.
60 NIPPON YUSEN KABUSHIKI KAISHA
Review of Operations
Dry Bulk Market Trends
06 07 08 09 10 11
(BDI)12,000
10,000
8,000
6,000
4,000
2,000
0
Baltic Dry Index (BDI) monthly average
Volume and Forecast of Dry Bulk Seaborne Trade
00 05 10 11 12 13(Forecast)
14 15 20
(Millions of tons)1,500
1,200
900
600
300
0
Source: Clarkson Shipping Review & Outlook (Spring 2010), Dry Bulk Trade, NYK Research Group
Iron ore Grain Steam coal Coking coal Minorbulk
1,085
665
256
1,391
1,319
493
350174
447342
262
404
833 1,005716
2000 2005 2010 2011 2012 2013 2014 2015 2020(Forecast) (Forecast) (Forecast) (Forecast) (Forecast) (Forecast) (Forecast)
Iron ore 447 654 989 1,039 1,085 1,127 1,171 1,218 1,391
Coking coal
174 184 232 244 256 267 279 291 350
Steam coal
342 502 649 657 665 670 676 681 716
Grain 262 273 389 392 404 416 428 441 493
Minor-bulk
833 1,009 936 974 1,005 1,041 1,080 1,119 1,319
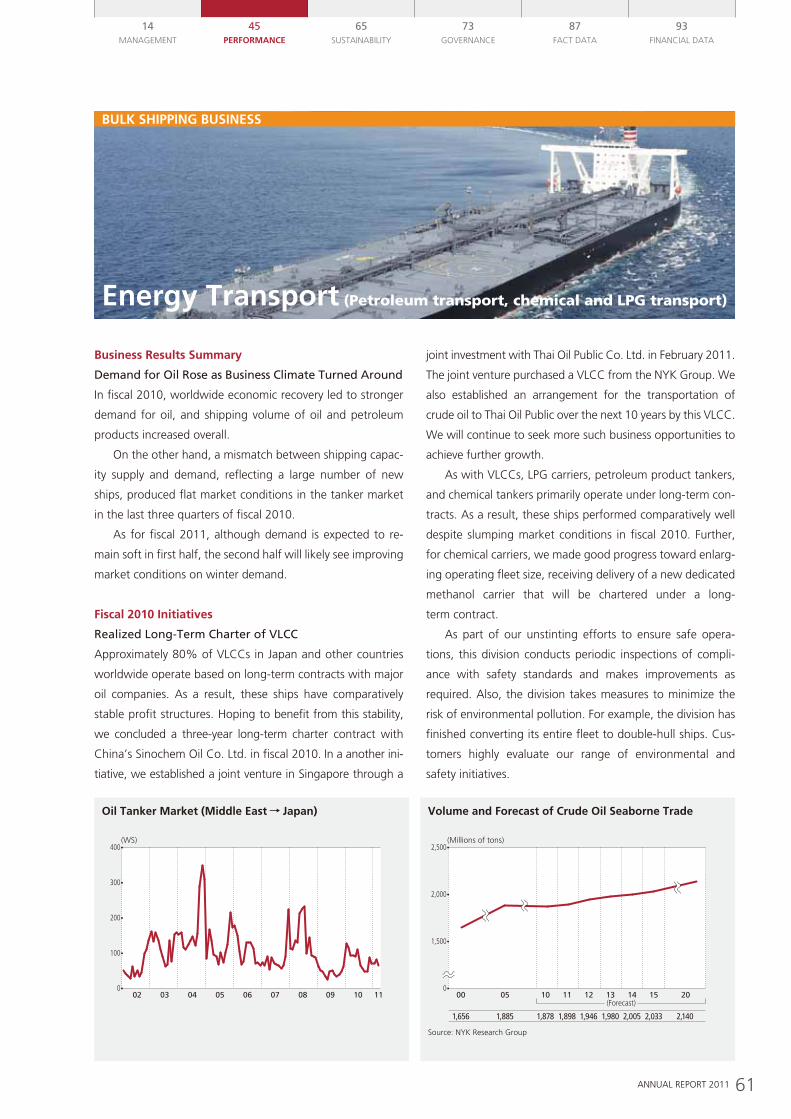
BuLK sHIPPING BusINess
energy Transport (Petroleum transport, chemical and LPG transport)
Business results summary
DemandforOilRoseasBusinessClimateTurnedAround
In fiscal 2010, worldwide economic recovery led to stronger
demand for oil, and shipping volume of oil and petroleum
products increased overall.
On the other hand, a mismatch between shipping capac-
ity supply and demand, reflecting a large number of new
ships, produced flat market conditions in the tanker market
in the last three quarters of fiscal 2010.
As for fiscal 2011, although demand is expected to re-
main soft in first half, the second half will likely see improving
market conditions on winter demand.
fiscal 2010 Initiatives
RealizedLong-TermCharterofVLCC
Approximately 80% of vLccs in Japan and other countries
worldwide operate based on long-term contracts with major
oil companies. As a result, these ships have comparatively
stable profit structures. Hoping to benefit from this stability,
we concluded a three-year long-term charter contract with
china’s Sinochem Oil co. Ltd. in fiscal 2010. In a another ini-
tiative, we established a joint venture in Singapore through a
joint investment with Thai Oil Public co. Ltd. in February 2011.
The joint venture purchased a vLcc from the NYK group. We
also established an arrangement for the transportation of
crude oil to Thai Oil Public over the next 10 years by this vLcc.
We will continue to seek more such business opportunities to
achieve further growth.
As with vLccs, LPg carriers, petroleum product tankers,
and chemical tankers primarily operate under long-term con-
tracts. As a result, these ships performed comparatively well
despite slumping market conditions in fiscal 2010. Further,
for chemical carriers, we made good progress toward enlarg-
ing operating fleet size, receiving delivery of a new dedicated
methanol carrier that will be chartered under a long-
term contract.
As part of our unstinting efforts to ensure safe opera-
tions, this division conducts periodic inspections of compli-
ance with safety standards and makes improvements as
required. Also, the division takes measures to minimize the
risk of environmental pollution. For example, the division has
finished converting its entire fleet to double-hull ships. cus-
tomers highly evaluate our range of environmental and
safety initiatives.
61ANNUAL REPORT 2011
14MANAgEMENT
65SUSTAINABILITY
73gOvERNANcE
87FAcT DATA
93FINANcIAL DATA
45PerfOrmANCe
Oil Tanker Market (Middle East Japan)
02 03 04 05 06 07 08 09 10 11
(WS)400
200
300
100
0
Volume and Forecast of Crude Oil Seaborne Trade
00 05 10 11 12 13 14 15 20
1,656 1,885 1,878 1,898 1,946 1,980 2,005 2,033 2,140
(Forecast)
(Millions of tons)2,500
1,500
2,000
0
Source: NYK Research Group
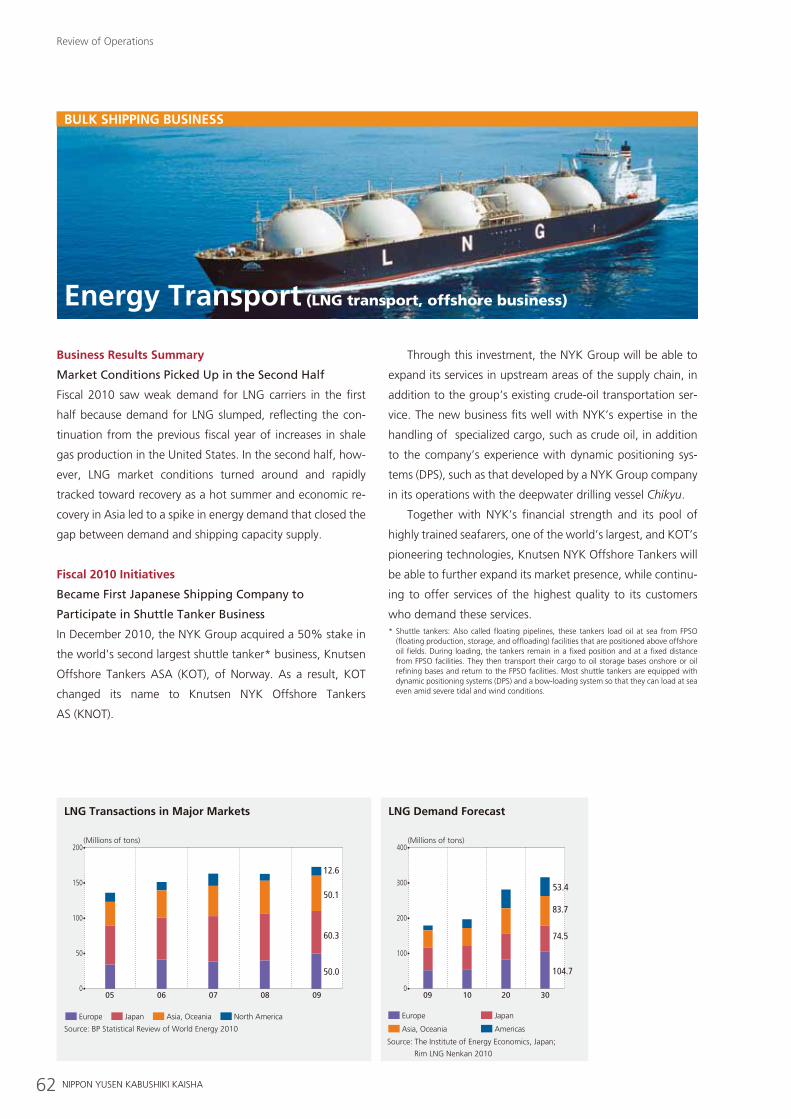
BuLK sHIPPING BusINess
energy Transport (LNG transport, offshore business)
Business results summary
MarketConditionsPickedUpintheSecondHalf
Fiscal 2010 saw weak demand for LNg carriers in the first
half because demand for LNg slumped, reflecting the con-
tinuation from the previous fiscal year of increases in shale
gas production in the United States. In the second half, how-
ever, LNg market conditions turned around and rapidly
tracked toward recovery as a hot summer and economic re-
covery in Asia led to a spike in energy demand that closed the
gap between demand and shipping capacity supply.
fiscal 2010 Initiatives
BecameFirstJapaneseShippingCompanyto
ParticipateinShuttleTankerBusiness
In December 2010, the NYK group acquired a 50% stake in
the world’s second largest shuttle tanker* business, Knutsen
Offshore Tankers ASA (KOT), of Norway. As a result, KOT
changed its name to Knutsen NYK Offshore Tankers
AS (KNOT).
Through this investment, the NYK group will be able to
expand its services in upstream areas of the supply chain, in
addition to the group’s existing crude-oil transportation ser-
vice. The new business fits well with NYK’s expertise in the
handling of specialized cargo, such as crude oil, in addition
to the company’s experience with dynamic positioning sys-
tems (DPS), such as that developed by a NYK group company
in its operations with the deepwater drilling vessel Chikyu.
Together with NYK’s financial strength and its pool of
highly trained seafarers, one of the world’s largest, and KOT’s
pioneering technologies, Knutsen NYK Offshore Tankers will
be able to further expand its market presence, while continu-
ing to offer services of the highest quality to its customers
who demand these services.* Shuttle tankers: Also called floating pipelines, these tankers load oil at sea from FPSO
(floating production, storage, and offloading) facilities that are positioned above offshore oil fields. During loading, the tankers remain in a fixed position and at a fixed distance from FPSO facilities. They then transport their cargo to oil storage bases onshore or oil refining bases and return to the FPSO facilities. Most shuttle tankers are equipped with dynamic positioning systems (DPS) and a bow-loading system so that they can load at sea even amid severe tidal and wind conditions.
62 NIPPON YUSEN KABUSHIKI KAISHA
Review of Operations
LNG Demand Forecast
AmericasAsia, Oceania
Europe Japan
(Millions of tons)400
300
100
200
09 10 20 30
Source: The Institute of Energy Economics, Japan;
Rim LNG Nenkan 2010
0
104.7
74.5
83.7
53.4
LNG Transactions in Major Markets
05 06 07 08 09
(Millions of tons)200
150
100
50
0
North AmericaJapan Asia, OceaniaEurope
Source: BP Statistical Review of World Energy 2010
60.3
50.1
12.6
50.0
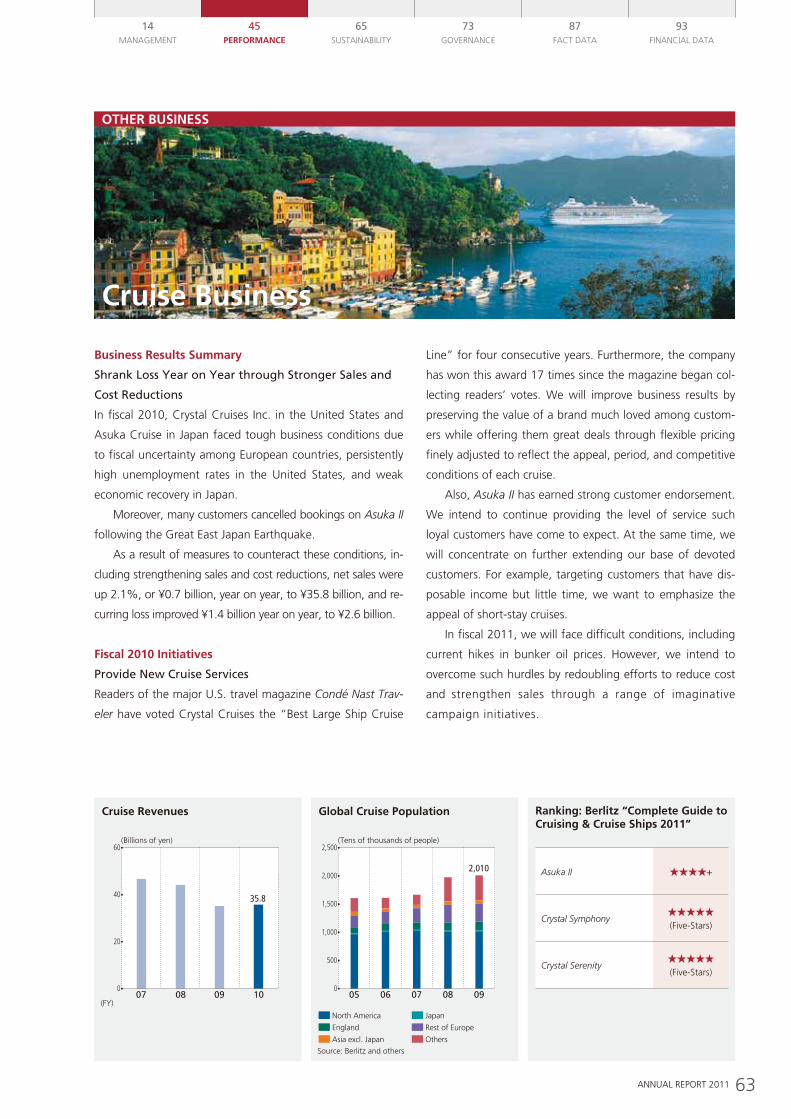
OTHer BusINess
Cruise Business
Business results summary
ShrankLossYearonYearthroughStrongerSalesand
CostReductions
In fiscal 2010, crystal cruises Inc. in the United States and
Asuka cruise in Japan faced tough business conditions due
to fiscal uncertainty among European countries, persistently
high unemployment rates in the United States, and weak
economic recovery in Japan.
Moreover, many customers cancelled bookings on Asuka II
following the great East Japan Earthquake.
As a result of measures to counteract these conditions, in-
cluding strengthening sales and cost reductions, net sales were
up 2.1%, or ¥0.7 billion, year on year, to ¥35.8 billion, and re-
curring loss improved ¥1.4 billion year on year, to ¥2.6 billion.
fiscal 2010 Initiatives
ProvideNewCruiseServices
Readers of the major U.S. travel magazine Condé Nast Trav-
eler have voted crystal cruises the “Best Large Ship cruise
Line” for four consecutive years. Furthermore, the company
has won this award 17 times since the magazine began col-
lecting readers’ votes. We will improve business results by
preserving the value of a brand much loved among custom-
ers while offering them great deals through flexible pricing
finely adjusted to reflect the appeal, period, and competitive
conditions of each cruise.
Also, Asuka II has earned strong customer endorsement.
We intend to continue providing the level of service such
loyal customers have come to expect. At the same time, we
will concentrate on further extending our base of devoted
customers. For example, targeting customers that have dis-
posable income but little time, we want to emphasize the
appeal of short-stay cruises.
In fiscal 2011, we will face difficult conditions, including
current hikes in bunker oil prices. However, we intend to
overcome such hurdles by redoubling efforts to reduce cost
and strengthen sales through a range of imaginative
campaign initiatives.
63ANNUAL REPORT 2011
14MANAgEMENT
65SUSTAINABILITY
73gOvERNANcE
87FAcT DATA
93FINANcIAL DATA
45PerfOrmANCe
Cruise Revenues
(Billions of yen)60
40
20
07 08 09 10(FY)
35.8
0
Global Cruise Population
(Tens of thousands of people)2,500
1,500
2,000
1,000
500
05 0706 08 09
Source: Berlitz and others
North America Japan
Rest of EuropeEngland
OthersAsia excl. Japan
2,010
0
Asuka II
Crystal Symphony(Five-Stars)
Crystal Serenity(Five-Stars)
ranking: Berlitz “Complete Guide to Cruising & Cruise ships 2011”
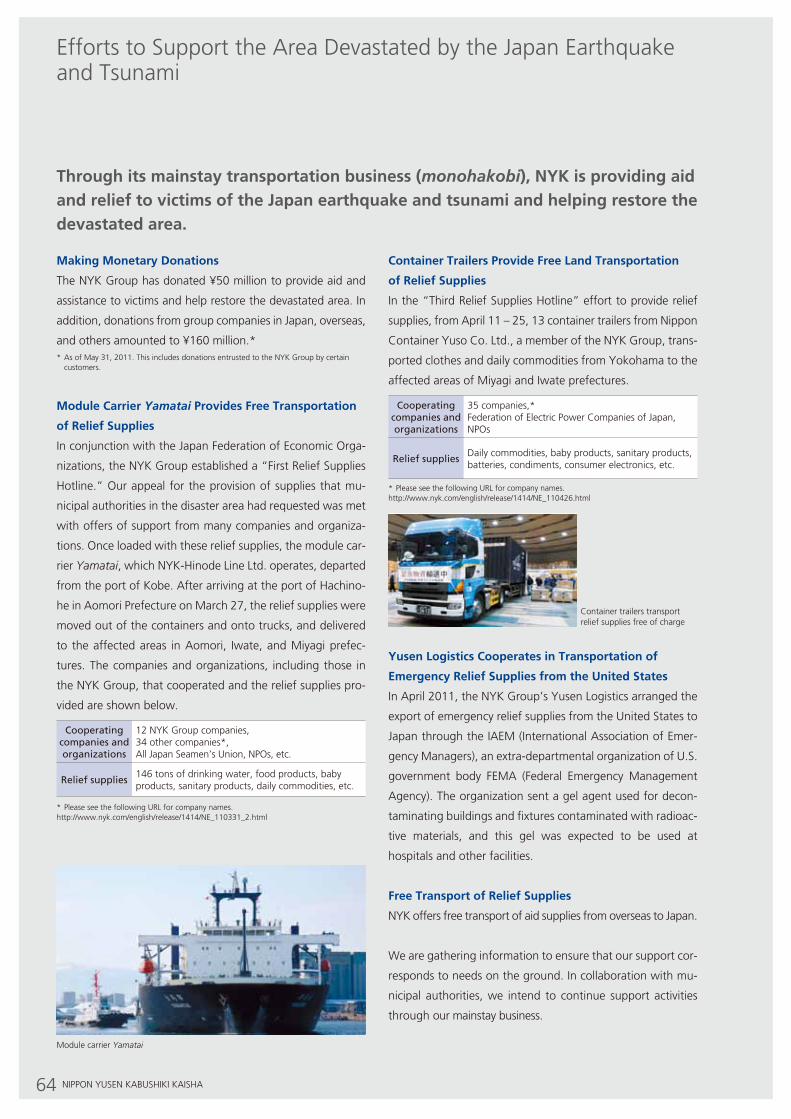
64 NIPPON YUSEN KABUSHIKI KAISHA
Efforts to Support the Area Devastated by the Japan Earthquake and Tsunami
making monetary Donations
The NYK group has donated ¥50 million to provide aid and
assistance to victims and help restore the devastated area. In
addition, donations from group companies in Japan, overseas,
and others amounted to ¥160 million.** As of May 31, 2011. This includes donations entrusted to the NYK group by certain
customers.
module Carrier Yamatai Provides free Transportation
of relief supplies
In conjunction with the Japan Federation of Economic Orga-
nizations, the NYK group established a “First Relief Supplies
Hotline.” Our appeal for the provision of supplies that mu-
nicipal authorities in the disaster area had requested was met
with offers of support from many companies and organiza-
tions. Once loaded with these relief supplies, the module car-
rier Yamatai, which NYK-Hinode Line Ltd. operates, departed
from the port of Kobe. After arriving at the port of Hachino-
he in Aomori Prefecture on March 27, the relief supplies were
moved out of the containers and onto trucks, and delivered
to the affected areas in Aomori, Iwate, and Miyagi prefec-
tures. The companies and organizations, including those in
the NYK group, that cooperated and the relief supplies pro-
vided are shown below.
Cooperatingcompaniesandorganizations
12 NYK group companies, 34 other companies*, All Japan Seamen’s Union, NPOs, etc.
Reliefsupplies146 tons of drinking water, food products, baby products, sanitary products, daily commodities, etc.
* Please see the following URL for company names.http://www.nyk.com/english/release/1414/NE_110331_2.html
Container Trailers Provide free Land Transportation
of relief supplies
In the “Third Relief Supplies Hotline” effort to provide relief
supplies, from April 11 – 25, 13 container trailers from Nippon
container Yuso co. Ltd., a member of the NYK group, trans-
ported clothes and daily commodities from Yokohama to the
affected areas of Miyagi and Iwate prefectures.
Cooperatingcompaniesandorganizations
35 companies,* Federation of Electric Power companies of Japan, NPOs
ReliefsuppliesDaily commodities, baby products, sanitary products, batteries, condiments, consumer electronics, etc.
* Please see the following URL for company names.http://www.nyk.com/english/release/1414/NE_110426.html
Yusen Logistics Cooperates in Transportation of
emergency relief supplies from the united states
In April 2011, the NYK group’s Yusen Logistics arranged the
export of emergency relief supplies from the United States to
Japan through the IAEM (International Association of Emer-
gency Managers), an extra-departmental organization of U.S.
government body FEMA (Federal Emergency Management
Agency). The organization sent a gel agent used for decon-
taminating buildings and fixtures contaminated with radioac-
tive materials, and this gel was expected to be used at
hospitals and other facilities.
free Transport of relief supplies
NYK offers free transport of aid supplies from overseas to Japan.
We are gathering information to ensure that our support cor-
responds to needs on the ground. In collaboration with mu-
nicipal authorities, we intend to continue support activities
through our mainstay business.
Through its mainstay transportation business (monohakobi), NYK is providing aid and relief to victims of the Japan earthquake and tsunami and helping restore the devastated area.
Module carrier Yamatai
container trailers transport relief supplies free of charge
65ANNUAL REPORT 2011
Sustainability
united Nations (uN) Global Compact Initiatives
Aiming to be a truly global enterprise, the NYK group has incorpo-
rated the 10 internationally recognized principles of the United Na-
tions (UN) global compact (gc hereinafter) into its cSR guidelines.
By implementing these guidelines, we hope to create workplaces in
which our employees can be proud and contribute to the realiza-
tion of a sustainable society through safe, dependable monohakobi
(transportation).
Csr report
For details of specific NYK group cSR initiatives, please see the
2011 edition of our cSR report. The report’s stakeholder dialogue
is themed on developing seafarers and looks at how this relates to
the NYK group’s business. Such dialogues allow us to benefit from
expert opinions and confirm our direction going forward.
Web site URL (Planned release: End of August 2011)
http://www.nyk.com/english/csr/report/
66 Environment: Working for the Environment Now and Tomorrow
68 Safety: Supporting Everyday Life
70 Human Resources: Developing the Leaders of the Next generation
72 Social contribution Activities
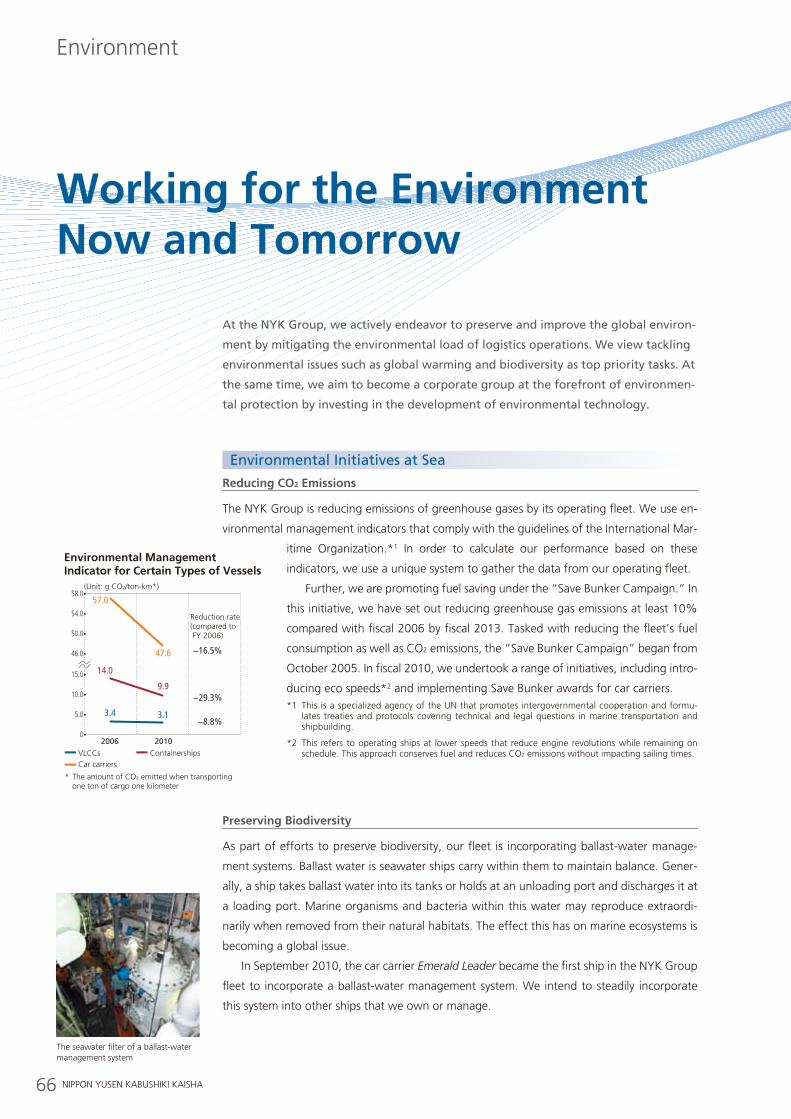
The seawater filter of a ballast-water management system
0
(Unit: g CO2/ton-km*)58.0
46.0
50.0
54.0
15.0
10.0
5.0
Environmental Management Indicator for Certain Types of Vessels
2006 2010
57.0
47.6
14.0
9.9−29.3%
−16.5%
−8.8%3.4 3.1
VLCCsCar carriers
Containerships
Reduction rate (compared to FY 2006)
* The amount of CO2 emitted when transporting one ton of cargo one kilometer
66 NIPPON YUSEN KABUSHIKI KAISHA
Environment
Working for the Environment Now and Tomorrow
At the NYK Group, we actively endeavor to preserve and improve the global environ-
ment by mitigating the environmental load of logistics operations. We view tackling
environmental issues such as global warming and biodiversity as top priority tasks. At
the same time, we aim to become a corporate group at the forefront of environmen-
tal protection by investing in the development of environmental technology.
Reducing CO2 Emissions
The NYK Group is reducing emissions of greenhouse gases by its operating fleet. We use en-
vironmental management indicators that comply with the guidelines of the International Mar-
itime Organization.*1 In order to calculate our performance based on these
indicators, we use a unique system to gather the data from our operating fleet.
Further, we are promoting fuel saving under the “Save Bunker Campaign.” In
this initiative, we have set out reducing greenhouse gas emissions at least 10%
compared with fiscal 2006 by fiscal 2013. Tasked with reducing the fleet’s fuel
consumption as well as CO2 emissions, the “Save Bunker Campaign” began from
October 2005. In fiscal 2010, we undertook a range of initiatives, including intro-
ducing eco speeds*2 and implementing Save Bunker awards for car carriers.*1 This is a specialized agency of the UN that promotes intergovernmental cooperation and formu-
lates treaties and protocols covering technical and legal questions in marine transportation and shipbuilding.
*2 This refers to operating ships at lower speeds that reduce engine revolutions while remaining on schedule. This approach conserves fuel and reduces CO2 emissions without impacting sailing times.
Preserving Biodiversity
As part of efforts to preserve biodiversity, our fleet is incorporating ballast-water manage-
ment systems. Ballast water is seawater ships carry within them to maintain balance. Gener-
ally, a ship takes ballast water into its tanks or holds at an unloading port and discharges it at
a loading port. Marine organisms and bacteria within this water may reproduce extraordi-
narily when removed from their natural habitats. The effect this has on marine ecosystems is
becoming a global issue.
In September 2010, the car carrier Emerald Leader became the first ship in the NYK Group
fleet to incorporate a ballast-water management system. We intend to steadily incorporate
this system into other ships that we own or manage.
Environmental Initiatives at Sea
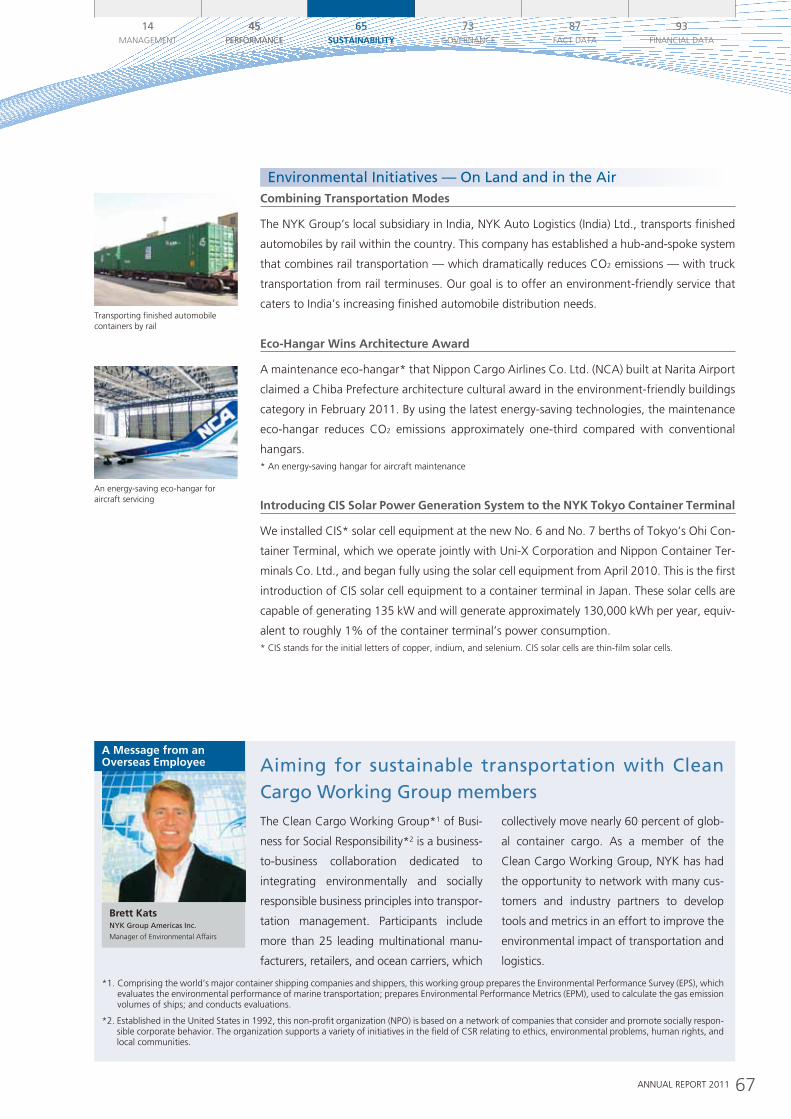
Transporting finished automobile containers by rail
An energy-saving eco-hangar for aircraft servicing
67ANNUAL REPORT 2011
14MANAGEMENT
45PERFORMANCE
73GOvERNANCE
87FACT dATA
93FINANCIAL dATA
65SuSTaiNaBiliTy
45PERFORMANCE
Combining Transportation Modes
The NYK Group’s local subsidiary in India, NYK Auto Logistics (India) Ltd., transports finished
automobiles by rail within the country. This company has established a hub-and-spoke system
that combines rail transportation — which dramatically reduces CO2 emissions — with truck
transportation from rail terminuses. Our goal is to offer an environment-friendly service that
caters to India’s increasing finished automobile distribution needs.
Eco-Hangar Wins architecture award
A maintenance eco-hangar* that Nippon Cargo Airlines Co. Ltd. (NCA) built at Narita Airport
claimed a Chiba Prefecture architecture cultural award in the environment-friendly buildings
category in February 2011. By using the latest energy-saving technologies, the maintenance
eco-hangar reduces CO2 emissions approximately one-third compared with conventional
hangars.* An energy-saving hangar for aircraft maintenance
introducing CiS Solar Power Generation System to the NyK Tokyo Container Terminal
We installed CIS* solar cell equipment at the new No. 6 and No. 7 berths of Tokyo’s Ohi Con-
tainer Terminal, which we operate jointly with Uni-X Corporation and Nippon Container Ter-
minals Co. Ltd., and began fully using the solar cell equipment from April 2010. This is the first
introduction of CIS solar cell equipment to a container terminal in Japan. These solar cells are
capable of generating 135 kW and will generate approximately 130,000 kWh per year, equiv-
alent to roughly 1% of the container terminal’s power consumption.* CIS stands for the initial letters of copper, indium, and selenium. CIS solar cells are thin-film solar cells.
Environmental Initiatives — On Land and in the Air
a Message from an Overseas Employee Aiming for sustainable transportation with Clean
Cargo Working Group members The Clean Cargo Working Group*1 of Busi-
ness for Social Responsibility*2 is a business-
to-business collaboration dedicated to
integrating environmentally and socially
responsible business principles into transpor-
tation management. Participants include
more than 25 leading multinational manu-
facturers, retailers, and ocean carriers, which
collectively move nearly 60 percent of glob-
al container cargo. As a member of the
Clean Cargo Working Group, NYK has had
the opportunity to network with many cus-
tomers and industry partners to develop
tools and metrics in an effort to improve the
environmental impact of transportation and
logistics.
*1. Comprising the world’s major container shipping companies and shippers, this working group prepares the Environmental Performance Survey (EPS), which evaluates the environmental performance of marine transportation; prepares Environmental Performance Metrics (EPM), used to calculate the gas emission volumes of ships; and conducts evaluations.
*2. Established in the United States in 1992, this non-profit organization (NPO) is based on a network of companies that consider and promote socially respon-sible corporate behavior. The organization supports a variety of initiatives in the field of CSR relating to ethics, environmental problems, human rights, and local communities.
Brett KatsNYK Group Americas Inc.
Manager of Environmental Affairs
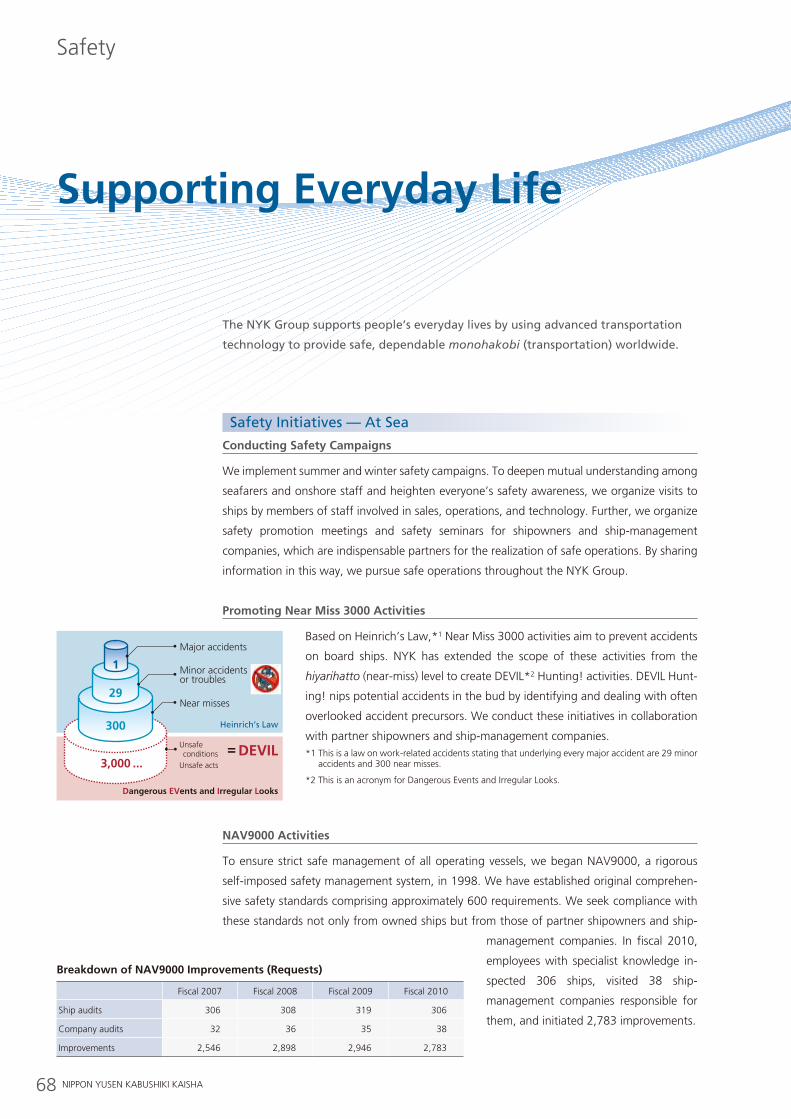
29
300
3,000 ...
1
Major accidents
Minor accidents or troubles
Near misses
Unsafe conditionsUnsafe acts
Dangerous EVents and Irregular Looks
= DEVIL
Heinrich’s Law
68 NIPPON YUSEN KABUSHIKI KAISHA
Safety
Supporting Everyday life
The NYK Group supports people’s everyday lives by using advanced transportation
technology to provide safe, dependable monohakobi (transportation) worldwide.
Conducting Safety Campaigns
We implement summer and winter safety campaigns. To deepen mutual understanding among
seafarers and onshore staff and heighten everyone’s safety awareness, we organize visits to
ships by members of staff involved in sales, operations, and technology. Further, we organize
safety promotion meetings and safety seminars for shipowners and ship-management
companies, which are indispensable partners for the realization of safe operations. By sharing
information in this way, we pursue safe operations throughout the NYK Group.
Promoting Near Miss 3000 activities
Based on Heinrich’s Law,*1 Near Miss 3000 activities aim to prevent accidents
on board ships. NYK has extended the scope of these activities from the
hiyarihatto (near-miss) level to create dEvIL*2 Hunting! activities. dEvIL Hunt-
ing! nips potential accidents in the bud by identifying and dealing with often
overlooked accident precursors. We conduct these initiatives in collaboration
with partner shipowners and ship-management companies.*1 This is a law on work-related accidents stating that underlying every major accident are 29 minor
accidents and 300 near misses.
*2 This is an acronym for dangerous Events and Irregular Looks.
NaV9000 activities
To ensure strict safe management of all operating vessels, we began NAv9000, a rigorous
self-imposed safety management system, in 1998. We have established original comprehen-
sive safety standards comprising approximately 600 requirements. We seek compliance with
these standards not only from owned ships but from those of partner shipowners and ship-
management companies. In fiscal 2010,
employees with specialist knowledge in-
spected 306 ships, visited 38 ship-
management companies responsible for
them, and initiated 2,783 improvements.
Safety Initiatives — At Sea
Breakdown of NaV9000 improvements (Requests)
Fiscal 2007 Fiscal 2008 Fiscal 2009 Fiscal 2010
Ship audits 306 308 319 306
Company audits 32 36 35 38
Improvements 2,546 2,898 2,946 2,783
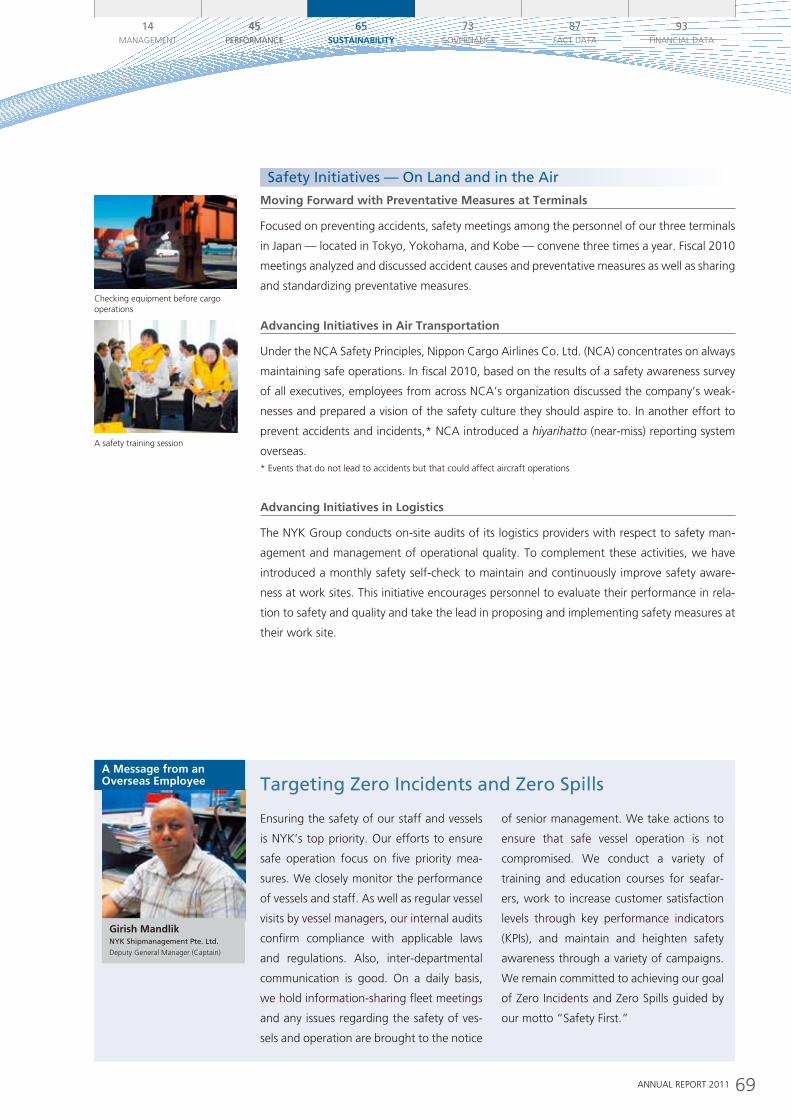
Checking equipment before cargo operations
A safety training session
69ANNUAL REPORT 2011
14MANAGEMENT
45PERFORMANCE
73GOvERNANCE
87FACT dATA
93FINANCIAL dATA
65SuSTaiNaBiliTy
45PERFORMANCE
a Message from an Overseas Employee Targeting Zero Incidents and Zero Spills
Ensuring the safety of our staff and vessels
is NYK’s top priority. Our efforts to ensure
safe operation focus on five priority mea-
sures. We closely monitor the performance
of vessels and staff. As well as regular vessel
visits by vessel managers, our internal audits
confirm compliance with applicable laws
and regulations. Also, inter-departmental
communication is good. On a daily basis,
we hold information-sharing fleet meetings
and any issues regarding the safety of ves-
sels and operation are brought to the notice
of senior management. We take actions to
ensure that safe vessel operation is not
compromised. We conduct a variety of
training and education courses for seafar-
ers, work to increase customer satisfaction
levels through key performance indicators
(KPIs), and maintain and heighten safety
awareness through a variety of campaigns.
We remain committed to achieving our goal
of Zero Incidents and Zero Spills guided by
our motto “Safety First.”
Girish MandlikNYK Shipmanagement Pte. Ltd.
deputy General Manager (Captain)
Moving Forward with Preventative Measures at Terminals
Focused on preventing accidents, safety meetings among the personnel of our three terminals
in Japan — located in Tokyo, Yokohama, and Kobe — convene three times a year. Fiscal 2010
meetings analyzed and discussed accident causes and preventative measures as well as sharing
and standardizing preventative measures.
advancing initiatives in air Transportation
Under the NCA Safety Principles, Nippon Cargo Airlines Co. Ltd. (NCA) concentrates on always
maintaining safe operations. In fiscal 2010, based on the results of a safety awareness survey
of all executives, employees from across NCA’s organization discussed the company’s weak-
nesses and prepared a vision of the safety culture they should aspire to. In another effort to
prevent accidents and incidents,* NCA introduced a hiyarihatto (near-miss) reporting system
overseas.* Events that do not lead to accidents but that could affect aircraft operations
advancing initiatives in logistics
The NYK Group conducts on-site audits of its logistics providers with respect to safety man-
agement and management of operational quality. To complement these activities, we have
introduced a monthly safety self-check to maintain and continuously improve safety aware-
ness at work sites. This initiative encourages personnel to evaluate their performance in rela-
tion to safety and quality and take the lead in proposing and implementing safety measures at
their work site.
Safety Initiatives — On Land and in the Air
70 NIPPON YUSEN KABUSHIKI KAISHA
Human Resources
Developing the leaders of the Next Generation
To empower individual employees from a variety of countries to fully realize their
potential, NYK is expanding and improving its global personnel development programs.
Securing and Training Seafarers
Through manning companies we have established in the Philippines, Indonesia, India, Croatia,
Romania, the Ukraine, and Russia, we hire high-quality seafarers who are able to make an im-
mediate contribution to operations. Furthermore, we have established special NYK classes at
maritime colleges in these countries. As well as conducing training on board NYK’s operating
vessels, we hire approximately 200 cadets annually as prospective officer candidates.
Training Our Own Outstanding Seafarers
We opened a four-year merchant marine college, the NYK-TdG Maritime Academy (NTMA),
in the Philippines in 2007. At NTMA, we aim to have students acquire the practical knowledge
and skills needed for frontline operations. After completing three years of study, students re-
ceive 12 months of onboard training. The college’s first batch of students graduated in Sep-
tember 2011 and promise to fulfill key roles in ensuring the safety of the NYK Group’s
operations.
In another initiative, we have begun building a system designed to raise the professional
capabilities of seafarers worldwide. The NYK Group has established 11 educational centers in
eight countries worldwide that use its unique educational system, known as the NYK Maritime
College (NMC). Local instructors conduct training focused on developing seafarers that meet
the NYK Unified Requirements, which stipulate the knowledge and skills required for each
position and rank.
NyK-TDG Maritime academy
Opened June 3, 2007
SizeNumber of students: Navigation class: 60, Engineering class: 60Total for single academic year: 120Instructors: Approximately 30 (including part-time instructors)
Location Calamba City, in the suburbs of Manila
Site area 9 hectares
System 4-year course, 3 years of lectures and 1 year of practical training onboard ships
Philosophy Conduct higher education aimed at developing world-class seafarers and focus on forming the character of each student and giving them practical maritime skills.
Personnel Development Initiatives at Sea
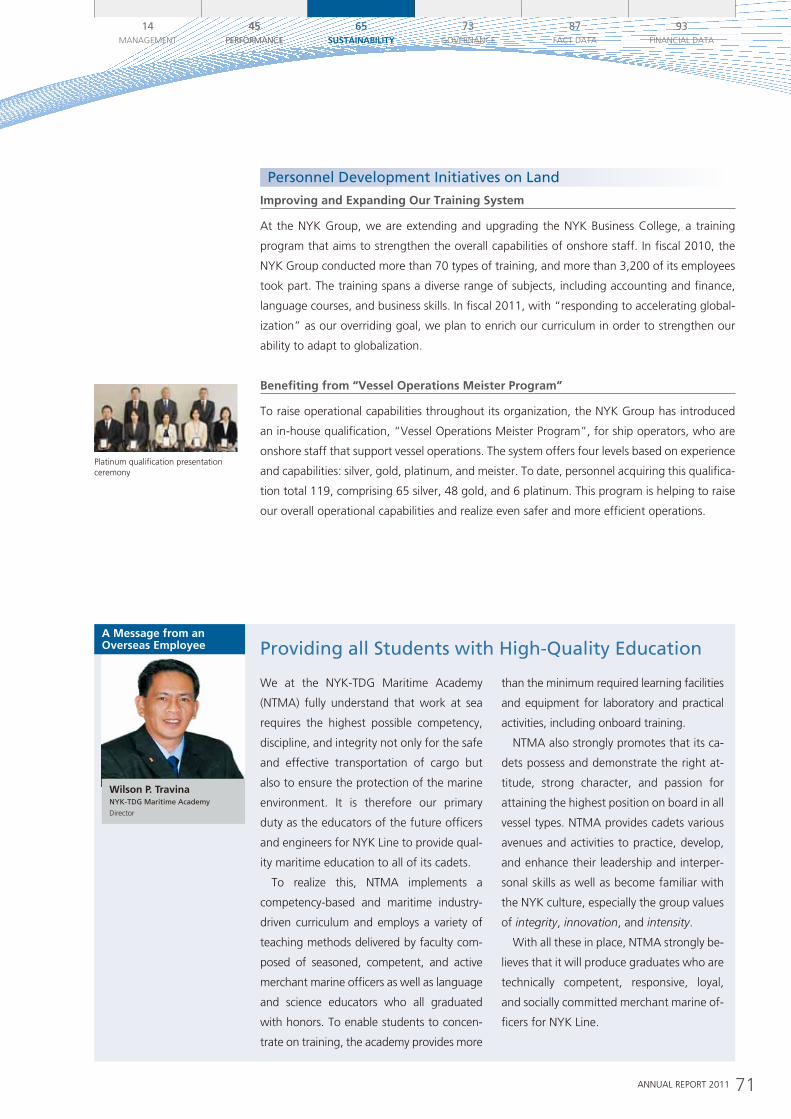
Platinum qualification presentation ceremony
71ANNUAL REPORT 2011
14MANAGEMENT
45PERFORMANCE
73GOvERNANCE
87FACT dATA
93FINANCIAL dATA
65SuSTaiNaBiliTy
45PERFORMANCE
improving and Expanding Our Training System
At the NYK Group, we are extending and upgrading the NYK Business College, a training
program that aims to strengthen the overall capabilities of onshore staff. In fiscal 2010, the
NYK Group conducted more than 70 types of training, and more than 3,200 of its employees
took part. The training spans a diverse range of subjects, including accounting and finance,
language courses, and business skills. In fiscal 2011, with “responding to accelerating global-
ization” as our overriding goal, we plan to enrich our curriculum in order to strengthen our
ability to adapt to globalization.
Benefiting from “Vessel Operations Meister Program”
To raise operational capabilities throughout its organization, the NYK Group has introduced
an in-house qualification, “vessel Operations Meister Program”, for ship operators, who are
onshore staff that support vessel operations. The system offers four levels based on experience
and capabilities: silver, gold, platinum, and meister. To date, personnel acquiring this qualifica-
tion total 119, comprising 65 silver, 48 gold, and 6 platinum. This program is helping to raise
our overall operational capabilities and realize even safer and more efficient operations.
Personnel Development Initiatives on Land
a Message from an Overseas Employee Providing all Students with High-Quality Education
We at the NYK-TdG Maritime Academy
(NTMA) fully understand that work at sea
requires the highest possible competency,
discipline, and integrity not only for the safe
and effective transportation of cargo but
also to ensure the protection of the marine
environment. It is therefore our primary
duty as the educators of the future officers
and engineers for NYK Line to provide qual-
ity maritime education to all of its cadets.
To realize this, NTMA implements a
competency-based and maritime industry-
driven curriculum and employs a variety of
teaching methods delivered by faculty com-
posed of seasoned, competent, and active
merchant marine officers as well as language
and science educators who all graduated
with honors. To enable students to concen-
trate on training, the academy provides more
than the minimum required learning facilities
and equipment for laboratory and practical
activities, including onboard training.
NTMA also strongly promotes that its ca-
dets possess and demonstrate the right at-
titude, strong character, and passion for
attaining the highest position on board in all
vessel types. NTMA provides cadets various
avenues and activities to practice, develop,
and enhance their leadership and interper-
sonal skills as well as become familiar with
the NYK culture, especially the group values
of integrity, innovation, and intensity.
With all these in place, NTMA strongly be-
lieves that it will produce graduates who are
technically competent, responsive, loyal,
and socially committed merchant marine of-
ficers for NYK Line.
Wilson P. TravinaNYK-TDG Maritime Academy
director
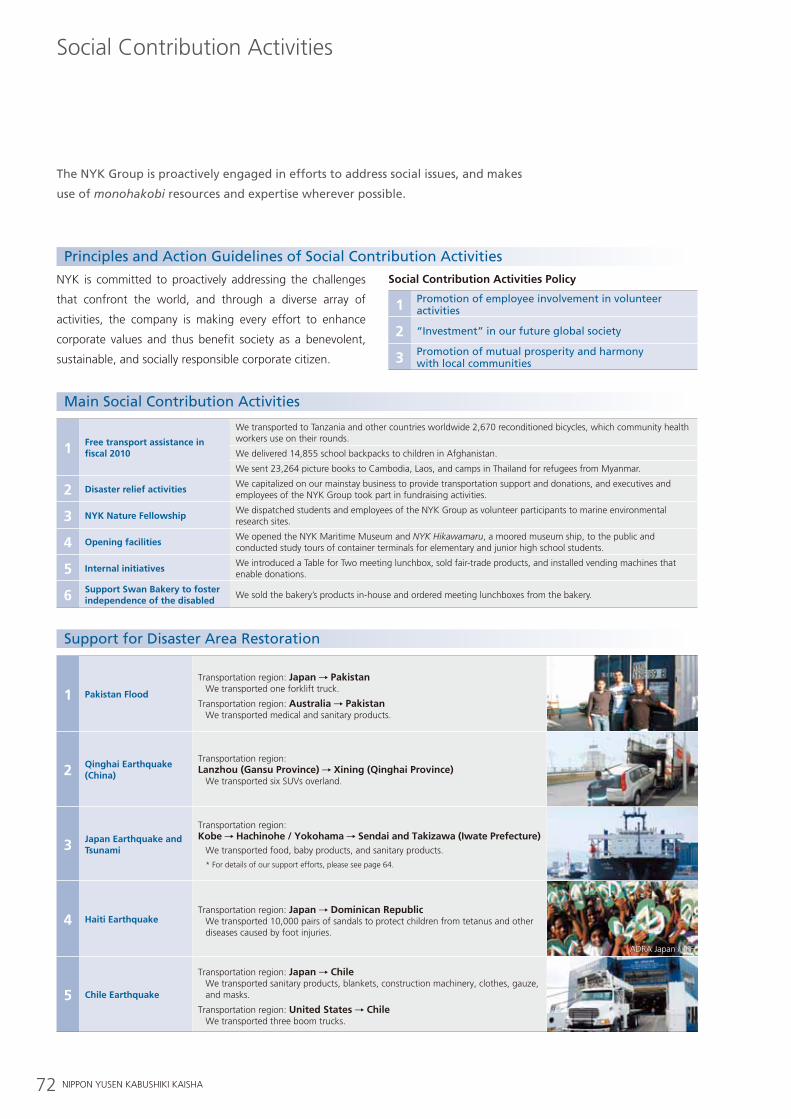
AdRA Japan / JPF
72 NIPPON YUSEN KABUSHIKI KAISHA
Social Contribution Activities
The NYK Group is proactively engaged in efforts to address social issues, and makes
use of monohakobi resources and expertise wherever possible.
NYK is committed to proactively addressing the challenges
that confront the world, and through a diverse array of
activities, the company is making every effort to enhance
corporate values and thus benefit society as a benevolent,
sustainable, and socially responsible corporate citizen.
1 Pakistan Flood
Transportation region: Japan Pakistan We transported one forklift truck.
Transportation region: australia Pakistan We transported medical and sanitary products.
2 Qinghai Earthquake (China)
Transportation region: lanzhou (Gansu Province) Xining (Qinghai Province) We transported six SUvs overland.
3 Japan Earthquake and Tsunami
Transportation region: Kobe Hachinohe / yokohama Sendai and Takizawa (iwate Prefecture) We transported food, baby products, and sanitary products.
* For details of our support efforts, please see page 64.
4 Haiti EarthquakeTransportation region: Japan Dominican Republic We transported 10,000 pairs of sandals to protect children from tetanus and other
diseases caused by foot injuries.
5 Chile Earthquake
Transportation region: Japan Chile We transported sanitary products, blankets, construction machinery, clothes, gauze,
and masks.
Transportation region: united States Chile We transported three boom trucks.
1 Free transport assistance in fiscal 2010
We transported to Tanzania and other countries worldwide 2,670 reconditioned bicycles, which community health workers use on their rounds.
We delivered 14,855 school backpacks to children in Afghanistan.
We sent 23,264 picture books to Cambodia, Laos, and camps in Thailand for refugees from Myanmar.
2 Disaster relief activitiesWe capitalized on our mainstay business to provide transportation support and donations, and executives and employees of the NYK Group took part in fundraising activities.
3 NyK Nature FellowshipWe dispatched students and employees of the NYK Group as volunteer participants to marine environmental research sites.
4 Opening facilitiesWe opened the NYK Maritime Museum and NYK Hikawamaru, a moored museum ship, to the public and conducted study tours of container terminals for elementary and junior high school students.
5 internal initiativesWe introduced a Table for Two meeting lunchbox, sold fair-trade products, and installed vending machines that enable donations.
6 Support Swan Bakery to foster independence of the disabled
We sold the bakery’s products in-house and ordered meeting lunchboxes from the bakery.
Social Contribution activities Policy
1 Promotion of employee involvement in volunteer activities
2 “Investment” in our future global society
3 Promotion of mutual prosperity and harmony with local communities
Principles and Action Guidelines of Social Contribution Activities
Support for Disaster Area Restoration
Main Social Contribution Activities
73ANNUAL REPORT 2011
Corporate Governance
74 Interviews with Outside directors
78 Corporate Governance
84 directors, Auditors & Corporate Officers
86 Independent directors
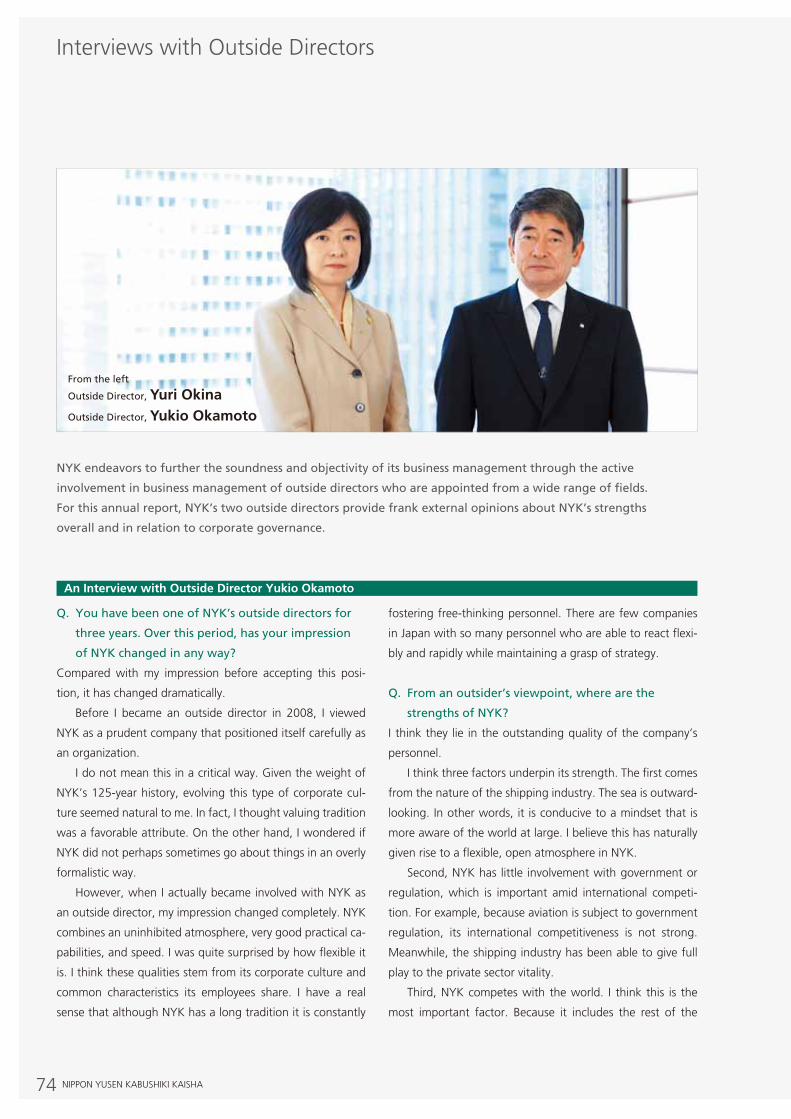
74 NIPPON YUSEN KABUSHIKI KAISHA
An Interview with Outside Director Yukio Okamoto
Q. YouhavebeenoneofNYK’soutsidedirectorsfor
threeyears.Overthisperiod,hasyourimpression
ofNYKchangedinanyway?
Compared with my impression before accepting this posi-
tion, it has changed dramatically.
Before I became an outside director in 2008, I viewed
NYK as a prudent company that positioned itself carefully as
an organization.
I do not mean this in a critical way. Given the weight of
NYK’s 125-year history, evolving this type of corporate cul-
ture seemed natural to me. In fact, I thought valuing tradition
was a favorable attribute. On the other hand, I wondered if
NYK did not perhaps sometimes go about things in an overly
formalistic way.
However, when I actually became involved with NYK as
an outside director, my impression changed completely. NYK
combines an uninhibited atmosphere, very good practical ca-
pabilities, and speed. I was quite surprised by how flexible it
is. I think these qualities stem from its corporate culture and
common characteristics its employees share. I have a real
sense that although NYK has a long tradition it is constantly
fostering free-thinking personnel. There are few companies
in Japan with so many personnel who are able to react flexi-
bly and rapidly while maintaining a grasp of strategy.
Q. Fromanoutsider’sviewpoint,wherearethe
strengthsofNYK?
I think they lie in the outstanding quality of the company’s
personnel.
I think three factors underpin its strength. The first comes
from the nature of the shipping industry. The sea is outward-
looking. In other words, it is conducive to a mindset that is
more aware of the world at large. I believe this has naturally
given rise to a flexible, open atmosphere in NYK.
Second, NYK has little involvement with government or
regulation, which is important amid international competi-
tion. For example, because aviation is subject to government
regulation, its international competitiveness is not strong.
Meanwhile, the shipping industry has been able to give full
play to the private sector vitality.
Third, NYK competes with the world. I think this is the
most important factor. Because it includes the rest of the
Interviews with Outside Directors
NYKendeavorstofurtherthesoundnessandobjectivityofitsbusinessmanagementthroughtheactive
involvementinbusinessmanagementofoutsidedirectorswhoareappointedfromawiderangeoffields.
Forthisannualreport,NYK’stwooutsidedirectorsprovidefrankexternalopinionsaboutNYK’sstrengths
overallandinrelationtocorporategovernance.
Fromtheleft
OutsideDirector,Yuri OkinaOutsideDirector,Yukio Okamoto
75ANNUAL REPORT 2011
14MANAGEMENT
45PERFORMANCE
65SUSTAINABILITY
87FACT DATA
93FINANCIAL DATA
73GOvernAnce
world, NYK’s competitive environment changes constantly
and very rapidly. Companies that generate more than half of
their revenues overseas must have flexible organizational
structures. Such companies are unmistakably different from
those without a strong dependence on overseas business.
More than 80% of NYK’s revenues come from overseas.
Further, ships have service lives of 20 years or more. There-
fore, shipping company personnel need to have a long-term
outlook as they compete with the rest of the world. The ship-
ping industry calls for companies to constantly check their
position and respond to change.
At the same time as personnel to think about strategy
flexibly, such factors propel the company forward.
Q. WhatisyourevaluationofNYK’sexecutivesand
corporategovernance?
As a member of the board of directors, I have been able to
discuss matters to a considerable extent. All the directors have
a strong sense of risk based on an awareness that “without
reform survival is not possible.” Consequently, they are eager
to acquire knowledge and information. I am impressed.
As for corporate governance, there are no problems with
compliance and other basic governance systems. Governance
in a broader sense is more important. In today’s world, even
if a company has no problems legally, ethical questions can
arise about social justice.
This trend is becoming particularly pronounced in the
West. It partly stems from the investment funds of educa-
tional institutions, pension funds, and other funds requiring
companies to realize governance that encompasses social and
moral considerations. Legal compliance alone is not enough.
I think NYK has firm beliefs in CSR. The Great East Japan
Earthquake is a good example of how agile and fast its reac-
tions are. In my view, NYK operates a very good corporate
governance system.
Q. Recently,NYKhasannouncedanewmedium-term
managementplan,“MoreThanShipping2013.”
Whatisyourimpressionofit?Andhowwereyou
involvedintheplan’spreparation?
The thrust of its strategy as a provider of global logistics ser-
vices is correct in my opinion. By increasing its business op-
portunities, NYK can cater to the world’s ever changing needs.
Businesses that were profitable previously can become
unprofitable due to external factors. In readying itself for
such eventualities, I think the approach of understanding
customers’ needs and growing and evolving business formats
to secure earnings from businesses that promise profits is
correct.
Regarding the preparation of the plan, I took part in inter-
nal discussions and was able to offer analysis and outlooks
relating to the international situation, my special area of in-
terest. I am grateful for such opportunities to participate.
Q. WhataretherequirementsforNYKtogrow
globally?
I believe NYK has to develop its characteristic flexibility and
immediate responsiveness even further.
The scale and pace of change in the international eco-
nomic environment has been greater than expected, and
leading players are gradually being replaced. The spread of
information technology (IT) is significantly stepping up the
pace of improvements in productivity. As a result, the center
of the economy is shifting from developed countries to
emerging markets. A representative example is mold manu-
facturing. Taking advantage of advanced craftsmanship, Ja-
pan used to manufacture products of unmatched quality.
Now, however, by using computer-aided design (CAD) and
moving overseas, companies are able to manufacture molds
of the same quality anywhere.
In conditions where this kind of incorporation of IT is clos-
ing the gaps in productivity among countries, population in-
creases become important. Population is beginning to
determine the growth potential of countries.
Regions and countries with large populations, such as
China, India, Brazil, and Africa, are growing steadily. And,
logistics demand is increasing correspondingly. Meanwhile,
among developed countries, those that can take advantage
of diversity are winning out. It is important for companies to
reexamine their key capabilities and build new platforms that
include diverse values.
Amid globalization, competitive conditions are becoming
tough. To prevail against competitors, companies must al-
ways carefully monitor and identify changes in business con-
ditions and global structural changes. Rapid responses and
flexibility are becoming more important than ever.
76 NIPPON YUSEN KABUSHIKI KAISHA
Q. Goingforward,inwhatcapacitydoyouwanttobe
involvedinNYK’sbusinessmanagement?
Rather than abstract discussion, I favor rigorously emphasiz-
ing on-site conditions. Therefore, I hope to always focus my
contributions on concrete discussions.
To provide a basis for such concrete discussions, I need to
further my understanding of NYK’s work sites. With this in
mind, I aim to create more opportunities to meet personnel
working on the frontlines of operations. In particular, I would
like to meet young employees. In part, this is because I want
to pass on to young employees the experience I have
accumulated, but for me it is also a very important way of
gaining new stimulus.
People should succeed based on their actual ability. Age,
gender, and nationality are irrelevant. Rather than resting on
our laurels, we must remind ourselves that we will not be able
to keep up with competition if we do not continue self-
growth.
I do not simply want to have conversations with young
employees, I want to learn about their passion and mindset. I
will be extremely happy if through a variety of different dia-
logues I can contribute to the development of NYK.
An Interview with Outside Director Yuri Okina
Q. YouhavebeenoneofNYK’soutsidedirectorsfor
threeyears.Overthisperiod,hasyourimpression
ofNYKchangedinanyway?
Following the collapse of Lehman Brothers, NYK tackled sub-
stantial cost reductions under the Yosoro (Steady Ahead!)
Emergency Structural Reform Project. With the achievement
of these cost reductions in sight, the company has turned its
attention to aggressive strategies aimed at growing emerg-
ing markets. Having witnessed these developments, I get the
impression that president Yasumi Kudo’s convictions have
taken root and spread throughout NYK. Although some as-
pects of the effect of the Great East Japan Earthquake remain
unknown, I feel that global economic trends have become
identifiable, and NYK’s strategies have become clear.
Q. Fromanoutsider’sviewpoint,wherearethe
strengthsofNYK?
Being a global corporation with a logistics business that ben-
efits from a worldwide network is its strength. Japan’s mar-
ket may shrink due to the aging of society. However, the rest
of the world is the main focus of NYK’s business. Therefore,
the company has the potential for growth in a wide range of
areas. Its major strengths are a network and a customer base
built up over many years in regions worldwide.
Further, personnel are a unique strength of NYK. Even
though it is a large company, communication among em-
ployees is lively, the atmosphere is cheerful, and loyalty is
strong. Because personnel work in regions worldwide, I think
they naturally acquire professional capabilities that they can
use anywhere in the world. Also, for overseas marine
transportation, seafarers are very important. This is why NYK
established a maritime college in the Philippines at an early
stage. While contributing to the region, NYK develops and
secures highly proficient personnel.
Q. WhatisyourevaluationofNYK’sexecutivesand
corporategovernance?
The executives’ responses are rapid and clear. After the col-
lapse of Lehman Brothers, they quickly prepared and imple-
mented emergency structural reforms. Also, I think the timing
of the announcement of the new medium-term manage-
ment plan was excellent. I think it was an extremely impor-
tant initiative that showed the executives’ commitment to
taking a long-term view and tirelessly examining in advance
different facets of business management strategy. I think
that directors do not offer many opinions at meetings of the
board of directors because discussions appear to have been
previously exhausted. However, I would like to see a little
more free speech and lively debate.
In respect of governance systems, NYK introduced out-
side directors comparatively early. Among listed companies,
only about half have outside directors. NYK has also appoint-
ed outside auditors. Because overseas investors have become
increasingly exacting in their requirements, heightening busi-
ness management transparency is very important for NYK as
a company that operates businesses all over the world. NYK’s
public offering in fall 2009 increased the proportion of over-
seas shareholders, and the company’s corporate governance
system adequately satisfies their expectations.
Interviews with Outside Directors
77ANNUAL REPORT 2011
14MANAGEMENT
45PERFORMANCE
65SUSTAINABILITY
87FACT DATA
93FINANCIAL DATA
73GOvernAnce
Q. Recently,NYKhasannouncedanewmedium-term
managementplan,“MoreThanShipping2013.”
Whatisyourimpressionofit?Andhowwereyou
involvedintheplan’spreparation?
The new medium-term management plan’s strategic focus
on Asia as a priority region has significant value. Not only
Japanese companies but companies from around the world
are likely to continue shifting their manufacturing bases to
growing Asia. In accordance with this trend, intra-Asia dis-
tribution will increase. NYK’s strategy of playing an impor-
tant role across the entire supply chain as well as in shipping
is not mistaken.
In addition, the shipping industry is susceptible to the ef-
fect of market volatility. NYK has set out a strategy of escap-
ing from this business structure and securing stable earnings.
Some may view this as conservative, but I think it deserves
recognition as a solid strategy for growth.
When NYK was preparing the plan, I had several oppor-
tunities to participate in discussions about the business con-
dition forecasts that formed the basis of the plan, mainly
relating to such factors as demographic, economic, and new
technology trends in respective countries worldwide over the
medium-to-long term. For example, when looking at coun-
tries’ demographic forecasts, as well as population size, we
discussed trends in the working-age population as a percent-
age of the overall population and how this affects economic
growth. Also, in discussions of technological trends, we ex-
amined the automobile manufacturing industry, which is
progressing with the development of environmental tech-
nologies. We discussed how changes in technology, such as
the spread of electric cars incorporating modularized compo-
nents, is likely to affect supply chains over the medium-to-
long term.
Q. WhataretherequirementsforNYKtogrow
globally?
NYK will have to place greater priority on generating earnings.
One aspect of the shipping industry is that if you grow
revenues earnings will increase. Because NYK operates busi-
nesses around the world, if it can generate revenues in a new
region, earnings will naturally follow. However, I think that
profitability is more important than revenues. In my view,
NYK has to give greater importance to profit management.
In the business results targets of the new medium-term
management plan, revenues and earnings proceed on paral-
lel paths. Instead, I think NYK should have a mindset that
looks for earnings much more than revenues. From the view-
point of shareholders, who emphasize cash flows over reve-
nues, the desirability of such an approach is self-evident.
Quickly seizing opportunities in a variety of different
regions will become increasingly important. In developing a
highly profitable business, acquiring information ahead of
others and then analyzing and using it as the basis of invest-
ment projects is paramount.
Q. Goingforward,inwhatcapacitydoyouwanttobe
involvedinNYK’sbusinessmanagement?
In my career so far, I have analyzed economic trends, special-
izing in the financial sector. I will draw on the experience and
expertise this has given me to make statements that I think
will benefit NYK. Also, I will always closely observe whether
NYK is being accountable from the viewpoint of shareholders
and other stakeholders. I will offer an opinion if I find any-
thing that seems acceptable when viewed from within the
company but irregular when viewed from outside it. I believe
this is my role and my responsibility as an outside director.
In addition, NYK is exposed to a wide variety of risks due
to the diversity of its businesses. Companies must rapidly
identify and respond to the risks inherent in their operations.
Therefore, risk management is the most important task of
companies. However, even though there is risk, companies
must invest boldly in new business areas in order to grow. As
far as possible, I aim to provide the executives with insight
into the viewpoint of investors and other outside perspec-
tives. At the same time, I want to capitalize on my experience
and expertise to evaluate risk correctly and monitor whether
NYK’s systems are able to manage such risk adequately.
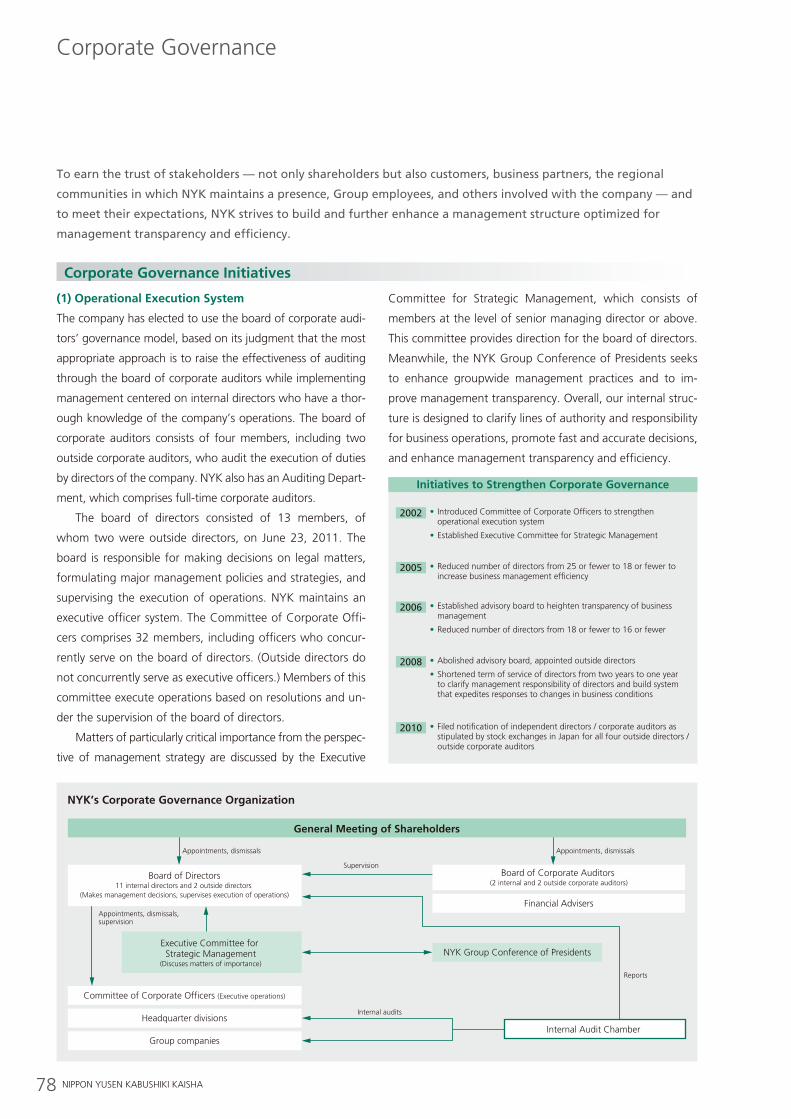
78 NIPPON YUSEN KABUSHIKI KAISHA
(1) Operational execution System
The company has elected to use the board of corporate audi-
tors’ governance model, based on its judgment that the most
appropriate approach is to raise the effectiveness of auditing
through the board of corporate auditors while implementing
management centered on internal directors who have a thor-
ough knowledge of the company’s operations. The board of
corporate auditors consists of four members, including two
outside corporate auditors, who audit the execution of duties
by directors of the company. NYK also has an Auditing Depart-
ment, which comprises full-time corporate auditors.
The board of directors consisted of 13 members, of
whom two were outside directors, on June 23, 2011. The
board is responsible for making decisions on legal matters,
formulating major management policies and strategies, and
supervising the execution of operations. NYK maintains an
executive officer system. The Committee of Corporate Offi-
cers comprises 32 members, including officers who concur-
rently serve on the board of directors. (Outside directors do
not concurrently serve as executive officers.) Members of this
committee execute operations based on resolutions and un-
der the supervision of the board of directors.
Matters of particularly critical importance from the perspec-
tive of management strategy are discussed by the Executive
Committee for Strategic Management, which consists of
members at the level of senior managing director or above.
This committee provides direction for the board of directors.
Meanwhile, the NYK Group Conference of Presidents seeks
to enhance groupwide management practices and to im-
prove management transparency. Overall, our internal struc-
ture is designed to clarify lines of authority and responsibility
for business operations, promote fast and accurate decisions,
and enhance management transparency and efficiency.
Toearnthetrustofstakeholders—notonlyshareholdersbutalsocustomers,businesspartners,theregional
communitiesinwhichNYKmaintainsapresence,Groupemployees,andothersinvolvedwiththecompany—and
tomeettheirexpectations,NYKstrivestobuildandfurtherenhanceamanagementstructureoptimizedfor
managementtransparencyandefficiency.
Corporate Governance
corporate Governance Initiatives
2002 • Introduced Committee of Corporate Officers to strengthen operational execution system
• Established Executive Committee for Strategic Management
2005 • Reduced number of directors from 25 or fewer to 18 or fewer to increase business management efficiency
2006 • Established advisory board to heighten transparency of business management
• Reduced number of directors from 18 or fewer to 16 or fewer
2008 • Abolished advisory board, appointed outside directors
• Shortened term of service of directors from two years to one year to clarify management responsibility of directors and build system that expedites responses to changes in business conditions
2010 • Filed notification of independent directors / corporate auditors as stipulated by stock exchanges in Japan for all four outside directors / outside corporate auditors
Initiatives to Strengthen corporate Governance
General Meeting of Shareholders
Board of Corporate Auditors (2 internal and 2 outside corporate auditors)
Financial Advisers
NYK Group Conference of Presidents
Board of Directors11 internal directors and 2 outside directors
(Makes management decisions, supervises execution of operations)
Executive Committee for Strategic Management
(Discuses matters of importance)
Committee of Corporate Officers (Executive operations)
Headquarter divisions
Group companiesInternal Audit Chamber
NYK’s Corporate Governance Organization
Appointments, dismissals Appointments, dismissals
Reports
Internal audits
Supervision
Appointments, dismissals, supervision
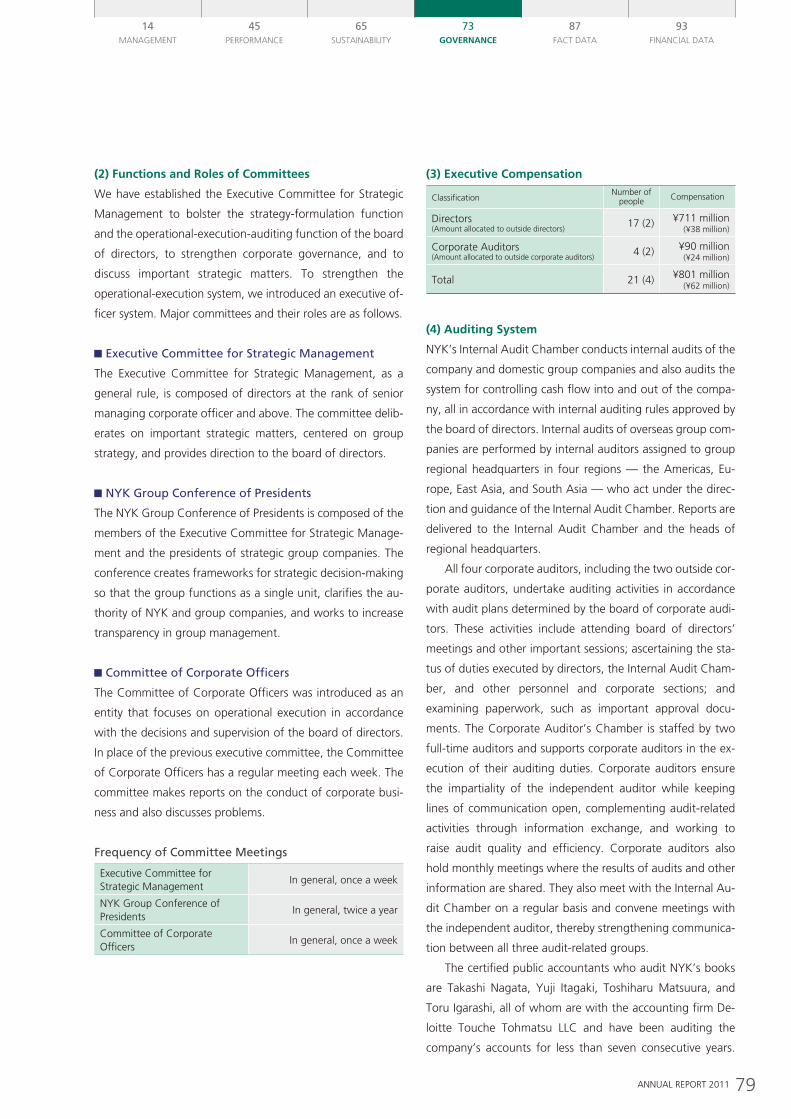
79ANNUAL REPORT 2011
14MANAGEMENT
45PERFORMANCE
65SUSTAINABILITY
87FACT DATA
93FINANCIAL DATA
73GOvernAnce
(2) Functions and roles of committees
We have established the Executive Committee for Strategic
Management to bolster the strategy-formulation function
and the operational-execution-auditing function of the board
of directors, to strengthen corporate governance, and to
discuss important strategic matters. To strengthen the
operational-execution system, we introduced an executive of-
ficer system. Major committees and their roles are as follows.
ExecutiveCommitteeforStrategicManagement
The Executive Committee for Strategic Management, as a
general rule, is composed of directors at the rank of senior
managing corporate officer and above. The committee delib-
erates on important strategic matters, centered on group
strategy, and provides direction to the board of directors.
NYKGroupConferenceofPresidents
The NYK Group Conference of Presidents is composed of the
members of the Executive Committee for Strategic Manage-
ment and the presidents of strategic group companies. The
conference creates frameworks for strategic decision-making
so that the group functions as a single unit, clarifies the au-
thority of NYK and group companies, and works to increase
transparency in group management.
CommitteeofCorporateOfficers
The Committee of Corporate Officers was introduced as an
entity that focuses on operational execution in accordance
with the decisions and supervision of the board of directors.
In place of the previous executive committee, the Committee
of Corporate Officers has a regular meeting each week. The
committee makes reports on the conduct of corporate busi-
ness and also discusses problems.
FrequencyofCommitteeMeetings
Executive Committee for Strategic Management
In general, once a week
NYK Group Conference of Presidents
In general, twice a year
Committee of Corporate Officers
In general, once a week
(3) executive compensation
ClassificationNumber of
people Compensation
Directors (Amount allocated to outside directors)
17 (2) ¥711 million (¥38 million)
Corporate Auditors (Amount allocated to outside corporate auditors)
4 (2) ¥90 million (¥24 million)
Total 21 (4) ¥801 million (¥62 million)
(4) Auditing System
NYK’s Internal Audit Chamber conducts internal audits of the
company and domestic group companies and also audits the
system for controlling cash flow into and out of the compa-
ny, all in accordance with internal auditing rules approved by
the board of directors. Internal audits of overseas group com-
panies are performed by internal auditors assigned to group
regional headquarters in four regions — the Americas, Eu-
rope, East Asia, and South Asia — who act under the direc-
tion and guidance of the Internal Audit Chamber. Reports are
delivered to the Internal Audit Chamber and the heads of
regional headquarters.
All four corporate auditors, including the two outside cor-
porate auditors, undertake auditing activities in accordance
with audit plans determined by the board of corporate audi-
tors. These activities include attending board of directors’
meetings and other important sessions; ascertaining the sta-
tus of duties executed by directors, the Internal Audit Cham-
ber, and other personnel and corporate sections; and
examining paperwork, such as important approval docu-
ments. The Corporate Auditor’s Chamber is staffed by two
full-time auditors and supports corporate auditors in the ex-
ecution of their auditing duties. Corporate auditors ensure
the impartiality of the independent auditor while keeping
lines of communication open, complementing audit-related
activities through information exchange, and working to
raise audit quality and efficiency. Corporate auditors also
hold monthly meetings where the results of audits and other
information are shared. They also meet with the Internal Au-
dit Chamber on a regular basis and convene meetings with
the independent auditor, thereby strengthening communica-
tion between all three audit-related groups.
The certified public accountants who audit NYK’s books
are Takashi Nagata, Yuji Itagaki, Toshiharu Matsuura, and
Toru Igarashi, all of whom are with the accounting firm De-
loitte Touche Tohmatsu LLC and have been auditing the
company’s accounts for less than seven consecutive years.
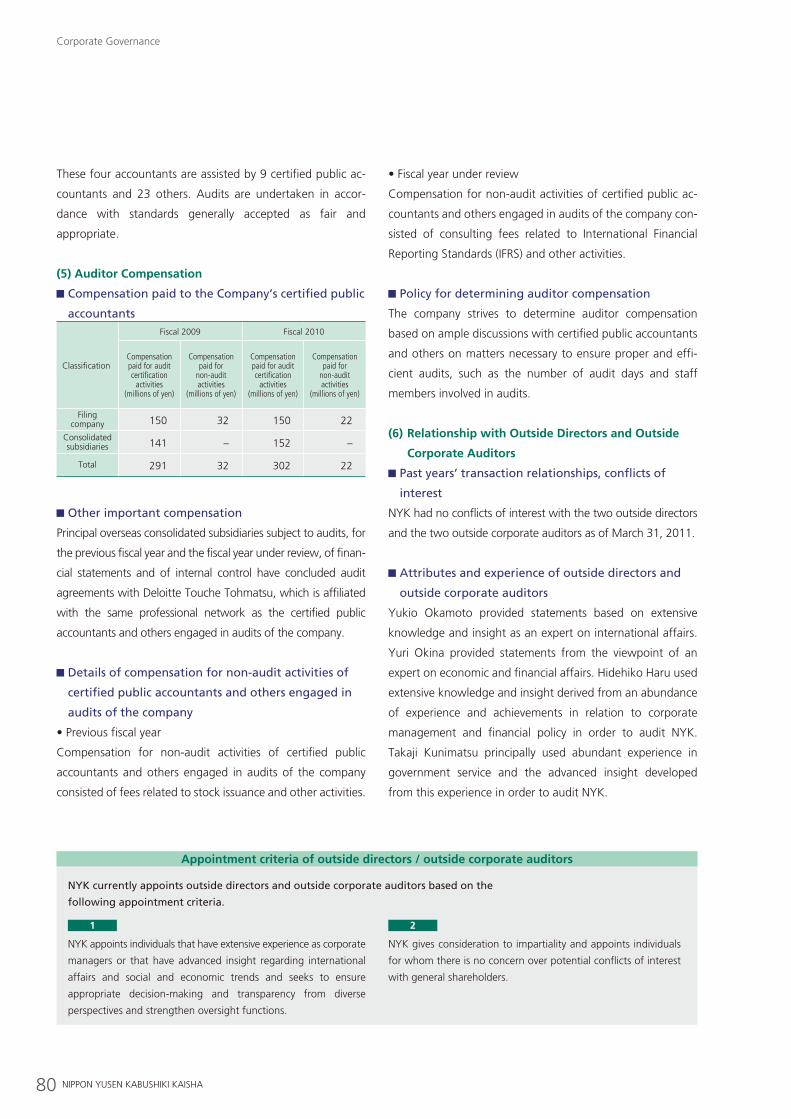
80 NIPPON YUSEN KABUSHIKI KAISHA
Corporate Governance
These four accountants are assisted by 9 certified public ac-
countants and 23 others. Audits are undertaken in accor-
dance with standards generally accepted as fair and
appropriate.
(5) Auditor compensation
CompensationpaidtotheCompany’scertifiedpublic
accountants
Classification
Fiscal 2009 Fiscal 2010
Compensation paid for audit certification
activities (millions of yen)
Compensation paid for
non-audit activities
(millions of yen)
Compensation paid for audit certification
activities (millions of yen)
Compensation paid for
non-audit activities
(millions of yen)
Filing company 150 32 150 22
Consolidated subsidiaries 141 – 152 –
Total 291 32 302 22
Otherimportantcompensation
Principal overseas consolidated subsidiaries subject to audits, for
the previous fiscal year and the fiscal year under review, of finan-
cial statements and of internal control have concluded audit
agreements with Deloitte Touche Tohmatsu, which is affiliated
with the same professional network as the certified public
accountants and others engaged in audits of the company.
Detailsofcompensationfornon-auditactivitiesof
certifiedpublicaccountantsandothersengagedin
auditsofthecompany
• Previous fiscal year
Compensation for non-audit activities of certified public
accountants and others engaged in audits of the company
consisted of fees related to stock issuance and other activities.
• Fiscal year under review
Compensation for non-audit activities of certified public ac-
countants and others engaged in audits of the company con-
sisted of consulting fees related to International Financial
Reporting Standards (IFRS) and other activities.
Policyfordeterminingauditorcompensation
The company strives to determine auditor compensation
based on ample discussions with certified public accountants
and others on matters necessary to ensure proper and effi-
cient audits, such as the number of audit days and staff
members involved in audits.
(6) relationship with Outside Directors and Outside
corporate Auditors
Pastyears’transactionrelationships,conflictsof
interest
NYK had no conflicts of interest with the two outside directors
and the two outside corporate auditors as of March 31, 2011.
Attributesandexperienceofoutsidedirectorsand
outsidecorporateauditors
Yukio Okamoto provided statements based on extensive
knowledge and insight as an expert on international affairs.
Yuri Okina provided statements from the viewpoint of an
expert on economic and financial affairs. Hidehiko Haru used
extensive knowledge and insight derived from an abundance
of experience and achievements in relation to corporate
management and financial policy in order to audit NYK.
Takaji Kunimatsu principally used abundant experience in
government service and the advanced insight developed
from this experience in order to audit NYK.
1
NYK appoints individuals that have extensive experience as corporate
managers or that have advanced insight regarding international
affairs and social and economic trends and seeks to ensure
appropriate decision-making and transparency from diverse
perspectives and strengthen oversight functions.
2
NYK gives consideration to impartiality and appoints individuals
for whom there is no concern over potential conflicts of interest
with general shareholders.
Appointment criteria of outside directors / outside corporate auditors
NYKcurrentlyappointsoutsidedirectorsandoutsidecorporateauditorsbasedonthe
followingappointmentcriteria.
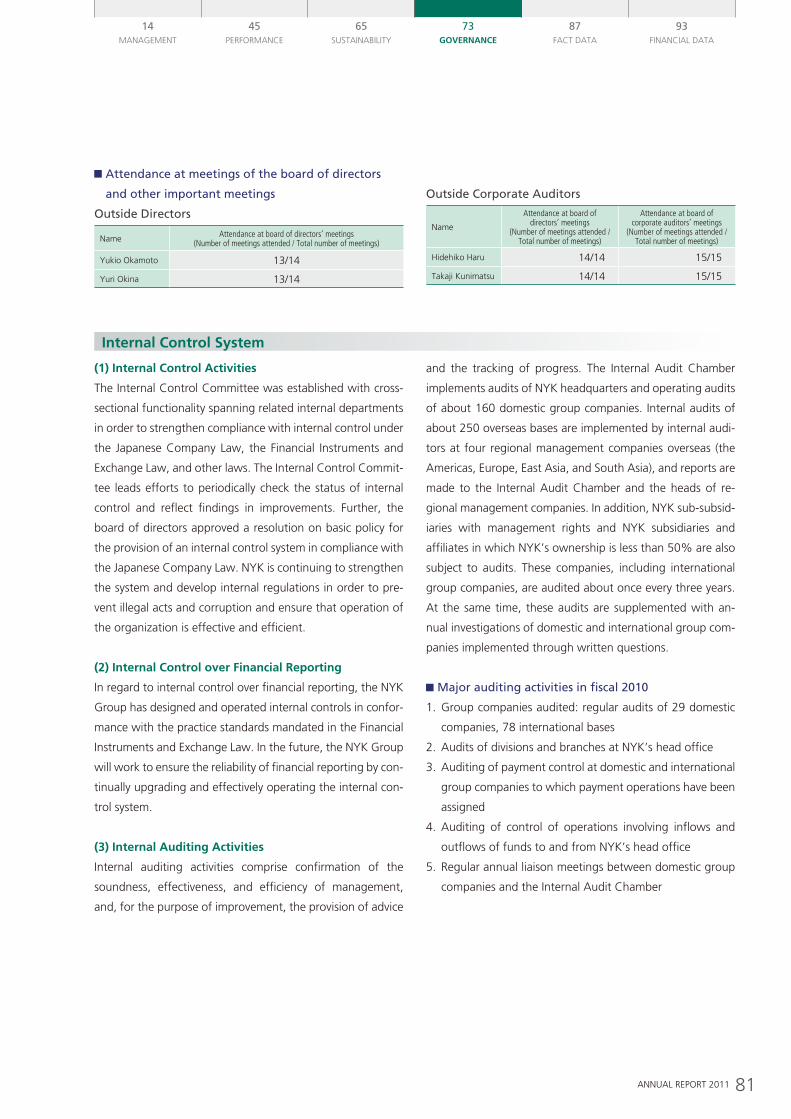
81ANNUAL REPORT 2011
14MANAGEMENT
45PERFORMANCE
65SUSTAINABILITY
87FACT DATA
93FINANCIAL DATA
73GOvernAnce
Attendanceatmeetingsoftheboardofdirectors
andotherimportantmeetings
OutsideDirectors
Name Attendance at board of directors’ meetings (Number of meetings attended / Total number of meetings)
Yukio Okamoto 13/14
Yuri Okina 13/14
OutsideCorporateAuditors
Name
Attendance at board of directors’ meetings
(Number of meetings attended / Total number of meetings)
Attendance at board of corporate auditors’ meetings
(Number of meetings attended / Total number of meetings)
Hidehiko Haru 14/14 15/15
Takaji Kunimatsu 14/14 15/15
Internal control System
(1) Internal control Activities
The Internal Control Committee was established with cross-
sectional functionality spanning related internal departments
in order to strengthen compliance with internal control under
the Japanese Company Law, the Financial Instruments and
Exchange Law, and other laws. The Internal Control Commit-
tee leads efforts to periodically check the status of internal
control and reflect findings in improvements. Further, the
board of directors approved a resolution on basic policy for
the provision of an internal control system in compliance with
the Japanese Company Law. NYK is continuing to strengthen
the system and develop internal regulations in order to pre-
vent illegal acts and corruption and ensure that operation of
the organization is effective and efficient.
(2) Internal control over Financial reporting
In regard to internal control over financial reporting, the NYK
Group has designed and operated internal controls in confor-
mance with the practice standards mandated in the Financial
Instruments and Exchange Law. In the future, the NYK Group
will work to ensure the reliability of financial reporting by con-
tinually upgrading and effectively operating the internal con-
trol system.
(3) Internal Auditing Activities
Internal auditing activities comprise confirmation of the
soundness, effectiveness, and efficiency of management,
and, for the purpose of improvement, the provision of advice
and the tracking of progress. The Internal Audit Chamber
implements audits of NYK headquarters and operating audits
of about 160 domestic group companies. Internal audits of
about 250 overseas bases are implemented by internal audi-
tors at four regional management companies overseas (the
Americas, Europe, East Asia, and South Asia), and reports are
made to the Internal Audit Chamber and the heads of re-
gional management companies. In addition, NYK sub-subsid-
iaries with management rights and NYK subsidiaries and
affiliates in which NYK’s ownership is less than 50% are also
subject to audits. These companies, including international
group companies, are audited about once every three years.
At the same time, these audits are supplemented with an-
nual investigations of domestic and international group com-
panies implemented through written questions.
Majorauditingactivitiesinfiscal2010
1. Group companies audited: regular audits of 29 domestic
companies, 78 international bases
2. Audits of divisions and branches at NYK’s head office
3. Auditing of payment control at domestic and international
group companies to which payment operations have been
assigned
4. Auditing of control of operations involving inflows and
outflows of funds to and from NYK’s head office
5. Regular annual liaison meetings between domestic group
companies and the Internal Audit Chamber
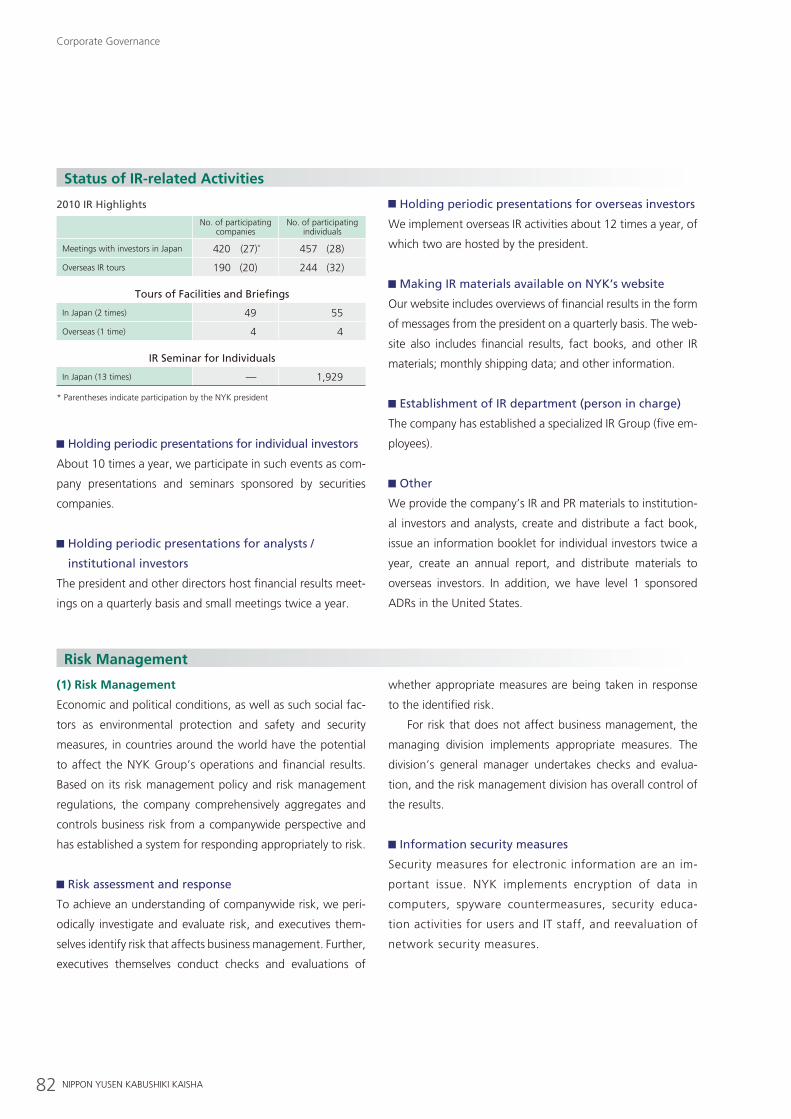
82 NIPPON YUSEN KABUSHIKI KAISHA
2010IRHighlights
No. of participating companies
No. of participating individuals
Meetings with investors in Japan 420 (27)* 457 (28)
Overseas IR tours 190 (20) 244 (32)
ToursofFacilitiesandBriefings
In Japan (2 times) 49 55
Overseas (1 time) 4 4
IRSeminarforIndividuals
In Japan (13 times) — 1,929
* Parentheses indicate participation by the NYK president
Holdingperiodicpresentationsforindividualinvestors
About 10 times a year, we participate in such events as com-
pany presentations and seminars sponsored by securities
companies.
Holdingperiodicpresentationsforanalysts/
institutionalinvestors
The president and other directors host financial results meet-
ings on a quarterly basis and small meetings twice a year.
Holdingperiodicpresentationsforoverseasinvestors
We implement overseas IR activities about 12 times a year, of
which two are hosted by the president.
MakingIRmaterialsavailableonNYK’swebsite
Our website includes overviews of financial results in the form
of messages from the president on a quarterly basis. The web-
site also includes financial results, fact books, and other IR
materials; monthly shipping data; and other information.
EstablishmentofIRdepartment(personincharge)
The company has established a specialized IR Group (five em-
ployees).
Other
We provide the company’s IR and PR materials to institution-
al investors and analysts, create and distribute a fact book,
issue an information booklet for individual investors twice a
year, create an annual report, and distribute materials to
overseas investors. In addition, we have level 1 sponsored
ADRs in the United States.
(1) risk Management
Economic and political conditions, as well as such social fac-
tors as environmental protection and safety and security
measures, in countries around the world have the potential
to affect the NYK Group’s operations and financial results.
Based on its risk management policy and risk management
regulations, the company comprehensively aggregates and
controls business risk from a companywide perspective and
has established a system for responding appropriately to risk.
Riskassessmentandresponse
To achieve an understanding of companywide risk, we peri-
odically investigate and evaluate risk, and executives them-
selves identify risk that affects business management. Further,
executives themselves conduct checks and evaluations of
whether appropriate measures are being taken in response
to the identified risk.
For risk that does not affect business management, the
managing division implements appropriate measures. The
division’s general manager undertakes checks and evalua-
tion, and the risk management division has overall control of
the results.
Informationsecuritymeasures
Security measures for electronic information are an im-
portant issue. NYK implements encryption of data in
computers, spyware countermeasures, security educa-
tion activities for users and IT staff, and reevaluation of
network security measures.
risk Management
Status of Ir-related Activities
Corporate Governance
83ANNUAL REPORT 2011
14MANAGEMENT
45PERFORMANCE
65SUSTAINABILITY
87FACT DATA
93FINANCIAL DATA
73GOvernAnce
(2) crisis Management
Emergencyresponse
NYK has prepared business continuity plans (BCPs) for all
important operational functions, including group companies,
so that in the event of damage, such as from a disaster or ac-
cident, the company will be able to maintain its important
functions uninterrupted wherever possible, or if interrupted,
to quickly restore them. When the Great East Japan Earth-
quake occurred in March 2011, we established a president-
led earthquake disaster headquarters that collected and
organized information and prepared countermeasures for our
businesses and in support of the disaster area. Further, we
prepared more practical BCPs that include preparations for
working from home. We are currently verifying these plans.
Fundamentalapproach
NYK has clearly defined compliance as the “strict observance
of laws, regulations, corporate ethics, and key practical stan-
dards in the operational decision-making and execution of
the company and group companies.” We consider compli-
ance to be one of our most important management issues.
NYK is working to ensure rigorous compliance in accordance
with the NYK Business Credo and the Code of Conduct. To
that end, the Compliance Committee, which is led by the
president, meets twice a year, and the company takes other
steps such as compliance training.
Compliancetraining
NYK implements a range of compliance training activities to
enhance awareness of compliance-related issues and to fos-
ter knowledge regarding compliance implementation. From
2002, group training sessions have been implemented for
directors and employees of NYK and domestic and interna-
tional group companies. We offer training sessions for such
groups as newly hired employees, employees in similar ranks,
people posted overseas, and directors. From 2005, we have
also implemented e-learning activities. Since 2002, we have
implemented 291 training sessions, which were attended by
a total of 6,795 people.
ComplianceTrainingSessionsinFiscal2010
Number of sessions
Number of attendees
Group training sessions* 18 686
e-learning training sessions 1 1,823
* Since 2002, we have implemented 291 training sessions, which were attended by a total of 6,795 people.
Compliancewithantitrust/competitionlaw
In July 2008, NYK established its Antitrust Law Task Force
(ALTF) in the headquarters to respond to the rapid expansion
and more strict enforcement of antitrust / competition law
around the world and to regrettable violations of such law
among our group companies. The ALTF then set up antitrust
law-related internal governance systems, procedures, and
schemes covering about 250 companies in 47 countries (as
of the end of March 2011). The ALTF also conducted train-
ing courses, carried out e-learning training, and served as a
consultation service on antitrust issues. In fiscal 2010, a
manual about antitrust and competition laws (Japanese and
English versions) was created and distributed to group com-
panies. Training for domestic and international organiza-
tions was also emphasized. In April 2011, the ALTF was
replaced by a new organization, the Fair Trade Promotion
Group, to encourage all NYK staff members to cultivate an
appropriate understanding of antitrust laws and develop an
unconscious law-abiding spirit.
compliance
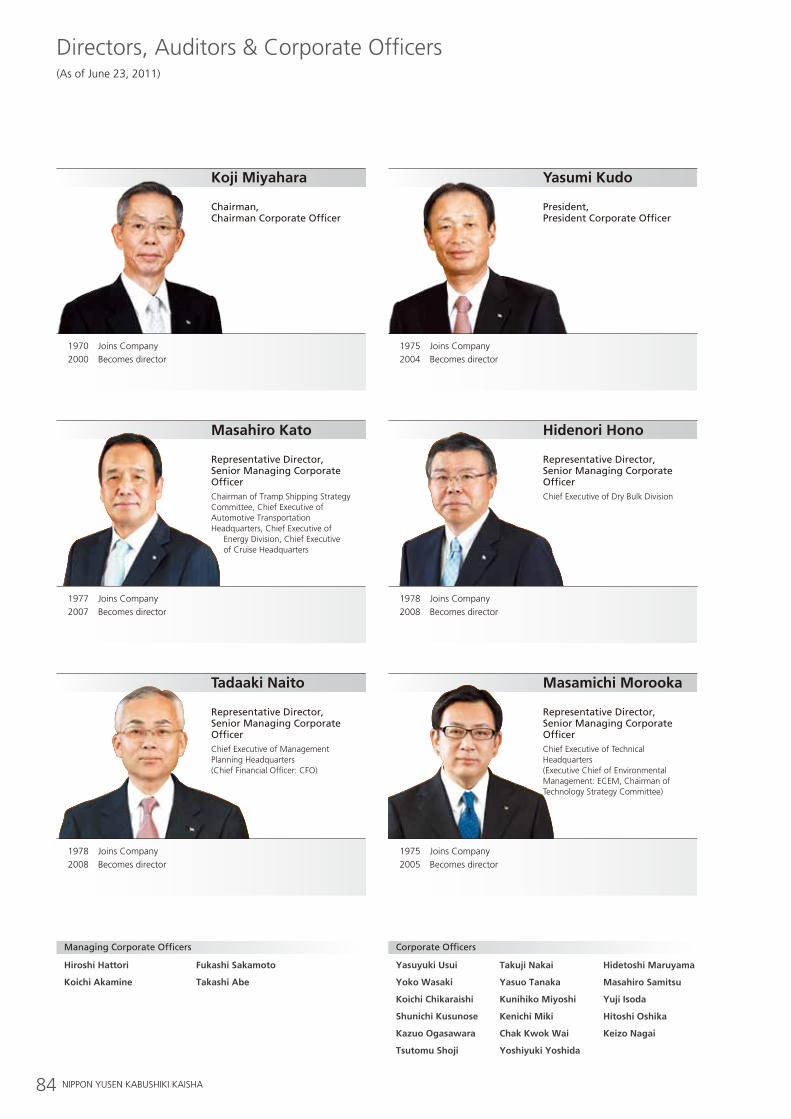
84 NIPPON YUSEN KABUSHIKI KAISHA
Directors, Auditors & Corporate Officers(As of June 23, 2011)
ManagingCorporateOfficers
Hiroshi Hattori
Koichi Akamine
Fukashi Sakamoto
Takashi Abe
CorporateOfficers
Yasuyuki Usui
Yoko Wasaki
Koichi chikaraishi
Shunichi Kusunose
Kazuo Ogasawara
Tsutomu Shoji
Takuji nakai
Yasuo Tanaka
Kunihiko Miyoshi
Kenichi Miki
chak Kwok Wai
Yoshiyuki Yoshida
Hidetoshi Maruyama
Masahiro Samitsu
Yuji Isoda
Hitoshi Oshika
Keizo nagai
Koji Miyahara
Chairman,ChairmanCorporateOfficer
1970 Joins Company2000 Becomes director
Tadaaki naito
RepresentativeDirector,SeniorManagingCorporateOfficerChief Executive of Management Planning Headquarters (Chief Financial Officer: CFO)
1978 Joins Company2008 Becomes director
Yasumi Kudo
President,PresidentCorporateOfficer
1975 Joins Company2004 Becomes director
Masamichi Morooka
RepresentativeDirector,SeniorManagingCorporateOfficerChief Executive of Technical Headquarters (Executive Chief of Environmental Management: ECEM, Chairman of Technology Strategy Committee)
1975 Joins Company2005 Becomes director
Masahiro Kato
RepresentativeDirector,SeniorManagingCorporateOfficerChairman of Tramp Shipping Strategy Committee, Chief Executive of Automotive Transportation Headquarters, Chief Executive of
Energy Division, Chief Executive of Cruise Headquarters
1977 Joins Company2007 Becomes director
Hidenori Hono
RepresentativeDirector,SeniorManagingCorporateOfficerChief Executive of Dry Bulk Division
1978 Joins Company2008 Becomes director
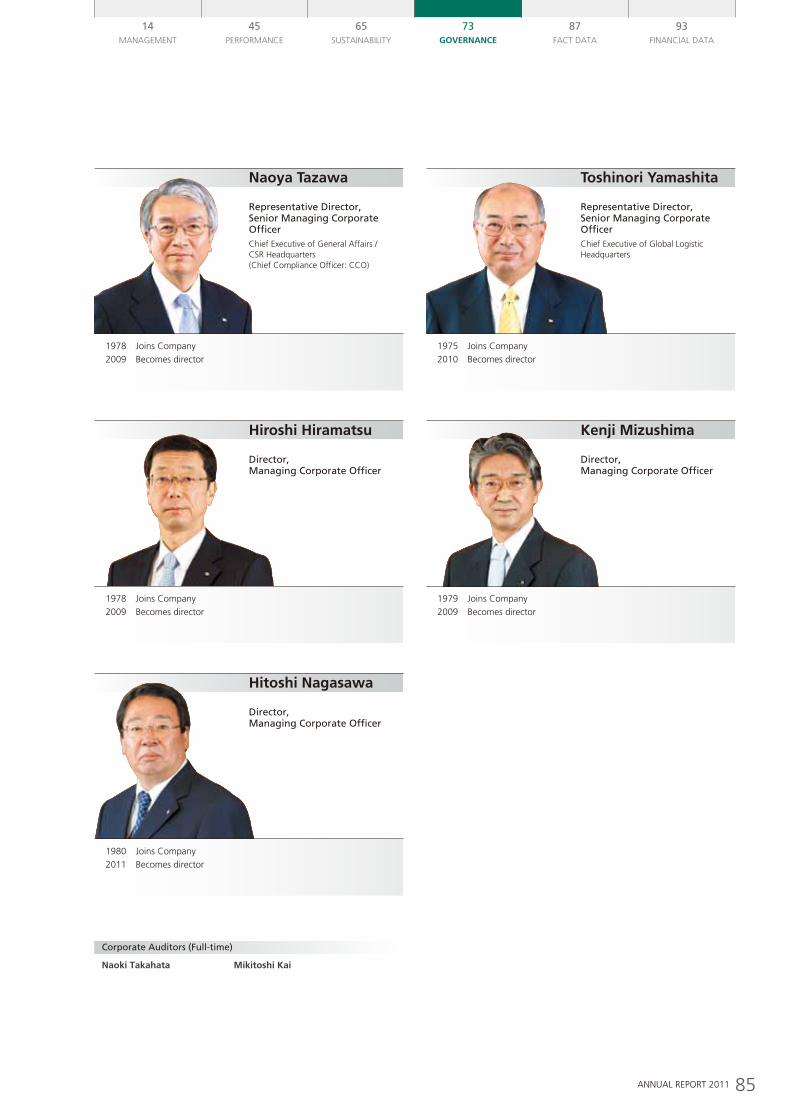
85ANNUAL REPORT 2011
14MANAGEMENT
45PERFORMANCE
65SUSTAINABILITY
87FACT DATA
93FINANCIAL DATA
73GOvernAnce
CorporateAuditors(Full-time)
naoki Takahata Mikitoshi Kai
Hiroshi Hiramatsu
Director,ManagingCorporateOfficer
1978 Joins Company2009 Becomes director
Hitoshi nagasawa
Director,ManagingCorporateOfficer
1980 Joins Company2011 Becomes director
Toshinori Yamashita
RepresentativeDirector,SeniorManagingCorporateOfficerChief Executive of Global Logistic Headquarters
1975 Joins Company2010 Becomes director
naoya Tazawa
RepresentativeDirector,SeniorManagingCorporateOfficerChief Executive of General Affairs / CSR Headquarters (Chief Compliance Officer: CCO)
1978 Joins Company2009 Becomes director
Kenji Mizushima
Director,ManagingCorporateOfficer
1979 Joins Company2009 Becomes director
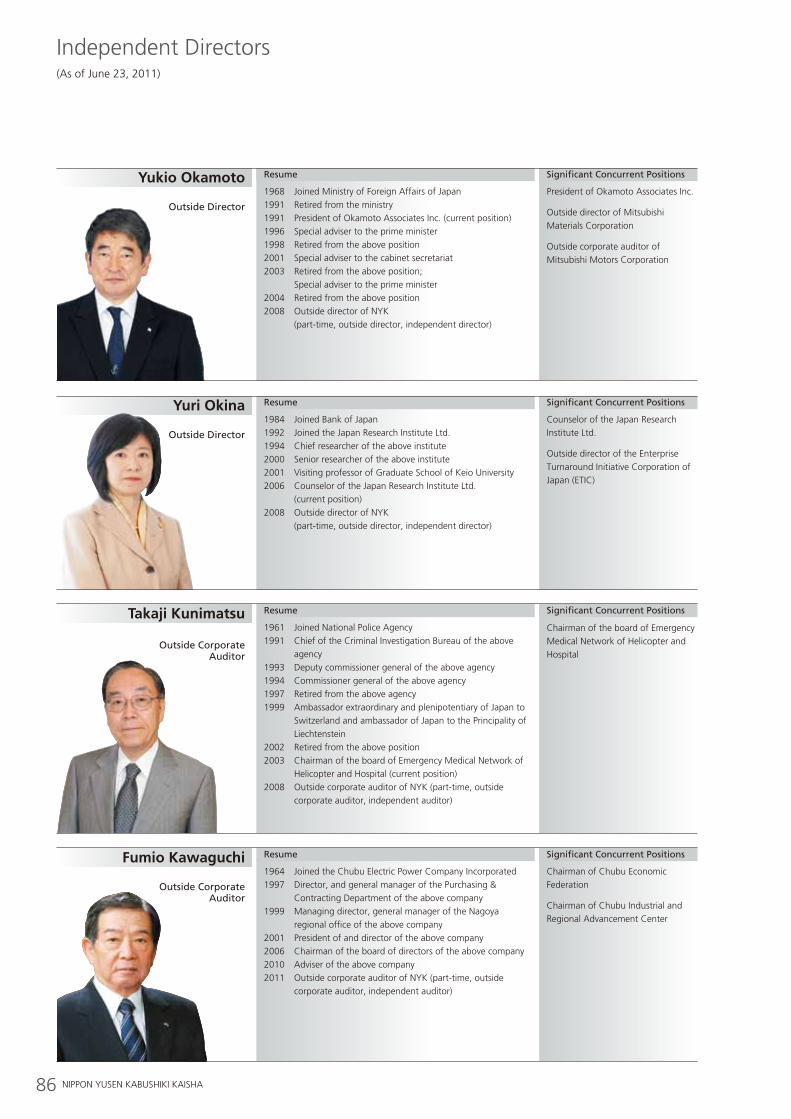
86 NIPPON YUSEN KABUSHIKI KAISHA
Independent Directors(As of June 23, 2011)
Resume SignificantConcurrentPositions
SignificantConcurrentPositions
SignificantConcurrentPositions
SignificantConcurrentPositions
1968 Joined Ministry of Foreign Affairs of Japan1991 Retired from the ministry1991 President of Okamoto Associates Inc. (current position)1996 Special adviser to the prime minister1998 Retired from the above position2001 Special adviser to the cabinet secretariat2003 Retired from the above position;
Special adviser to the prime minister2004 Retired from the above position2008 Outside director of NYK
(part-time, outside director, independent director)
President of Okamoto Associates Inc.
Outside director of Mitsubishi Materials Corporation
Outside corporate auditor of Mitsubishi Motors Corporation
Counselor of the Japan Research Institute Ltd.
Outside director of the Enterprise Turnaround Initiative Corporation of Japan (ETIC)
Chairman of the board of Emergency Medical Network of Helicopter and Hospital
Resume
1984 Joined Bank of Japan1992 Joined the Japan Research Institute Ltd.1994 Chief researcher of the above institute2000 Senior researcher of the above institute2001 Visiting professor of Graduate School of Keio University2006 Counselor of the Japan Research Institute Ltd.
(current position)2008 Outside director of NYK
(part-time, outside director, independent director)
Yukio Okamoto
OutsideDirector
Yuri Okina
OutsideDirector
Fumio Kawaguchi
Takaji Kunimatsu
OutsideCorporateAuditor
OutsideCorporateAuditor
Resume
Resume
Chairman of Chubu Economic Federation
Chairman of Chubu Industrial and Regional Advancement Center
1964 Joined the Chubu Electric Power Company Incorporated1997 Director, and general manager of the Purchasing &
Contracting Department of the above company1999 Managing director, general manager of the Nagoya
regional office of the above company2001 President of and director of the above company2006 Chairman of the board of directors of the above company2010 Adviser of the above company2011 Outside corporate auditor of NYK (part-time, outside
corporate auditor, independent auditor)
1961 Joined National Police Agency1991 Chief of the Criminal Investigation Bureau of the above
agency1993 Deputy commissioner general of the above agency1994 Commissioner general of the above agency1997 Retired from the above agency1999 Ambassador extraordinary and plenipotentiary of Japan to
Switzerland and ambassador of Japan to the Principality of Liechtenstein
2002 Retired from the above position2003 Chairman of the board of Emergency Medical Network of
Helicopter and Hospital (current position)2008 Outside corporate auditor of NYK (part-time, outside
corporate auditor, independent auditor)
87ANNUAL REPORT 2011
Company Information
88 Investor Information
90 Worldwide Service Network
92 Major Consolidated Subsidiaries
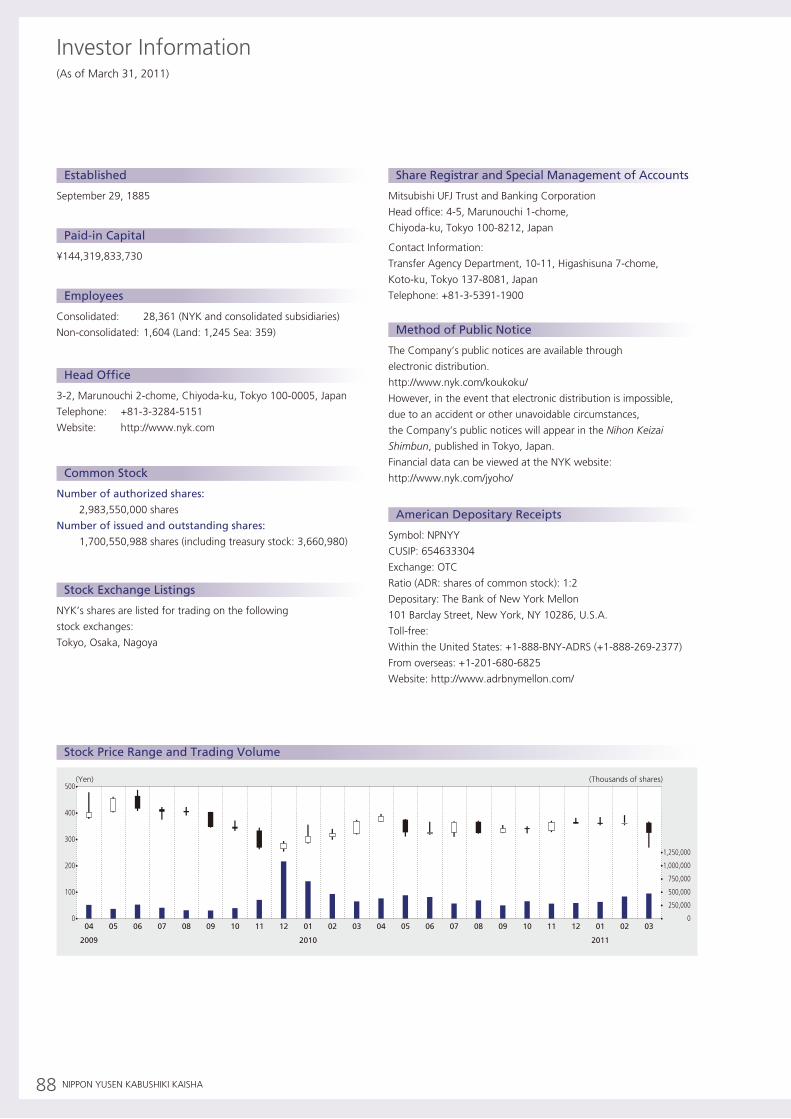
88 NIPPON YUSEN KABUSHIKI KAISHA
Investor Information(As of March 31, 2011)
September 29, 1885
Established
¥144,319,833,730
Paid-in Capital
Symbol: NPNYY
CUSIP: 654633304
Exchange: OTC
Ratio (ADR: shares of common stock): 1:2
Depositary: The Bank of New York Mellon
101 Barclay Street, New York, NY 10286, U.S.A.
Toll-free:
Within the United States: +1-888-BNY-ADRS (+1-888-269-2377)
From overseas: +1-201-680-6825
Website: http://www.adrbnymellon.com/
American Depositary Receipts
Consolidated: 28,361 (NYK and consolidated subsidiaries)
Non-consolidated: 1,604 (Land: 1,245 Sea: 359)
Employees
3-2, Marunouchi 2-chome, Chiyoda-ku, Tokyo 100-0005, Japan
Telephone: +81-3-3284-5151
Website: http://www.nyk.com
Head Office
Number of authorized shares:
2,983,550,000 shares
Number of issued and outstanding shares:
1,700,550,988 shares (including treasury stock: 3,660,980)
Common Stock
NYK’s shares are listed for trading on the following
stock exchanges:
Tokyo, Osaka, Nagoya
Stock Exchange Listings
Mitsubishi UFJ Trust and Banking Corporation
Head office: 4-5, Marunouchi 1-chome,
Chiyoda-ku, Tokyo 100-8212, Japan
Contact Information:
Transfer Agency Department, 10-11, Higashisuna 7-chome,
Koto-ku, Tokyo 137-8081, Japan
Telephone: +81-3-5391-1900
Share Registrar and Special Management of Accounts
The Company’s public notices are available through
electronic distribution.
http://www.nyk.com/koukoku/
However, in the event that electronic distribution is impossible,
due to an accident or other unavoidable circumstances,
the Company’s public notices will appear in the Nihon Keizai
Shimbun, published in Tokyo, Japan.
Financial data can be viewed at the NYK website:
http://www.nyk.com/jyoho/
Method of Public Notice
Stock Price Range and Trading Volume
04
2009 2010 2011
05 06 07 08 09 10 11 12 04 05 0601 02 03 01 02 0307 08 09 10 11 12
(Yen) (Thousands of shares)500
400
300
200
100
1,250,000
1,000,000
750,000
500,000
250,000
0 0
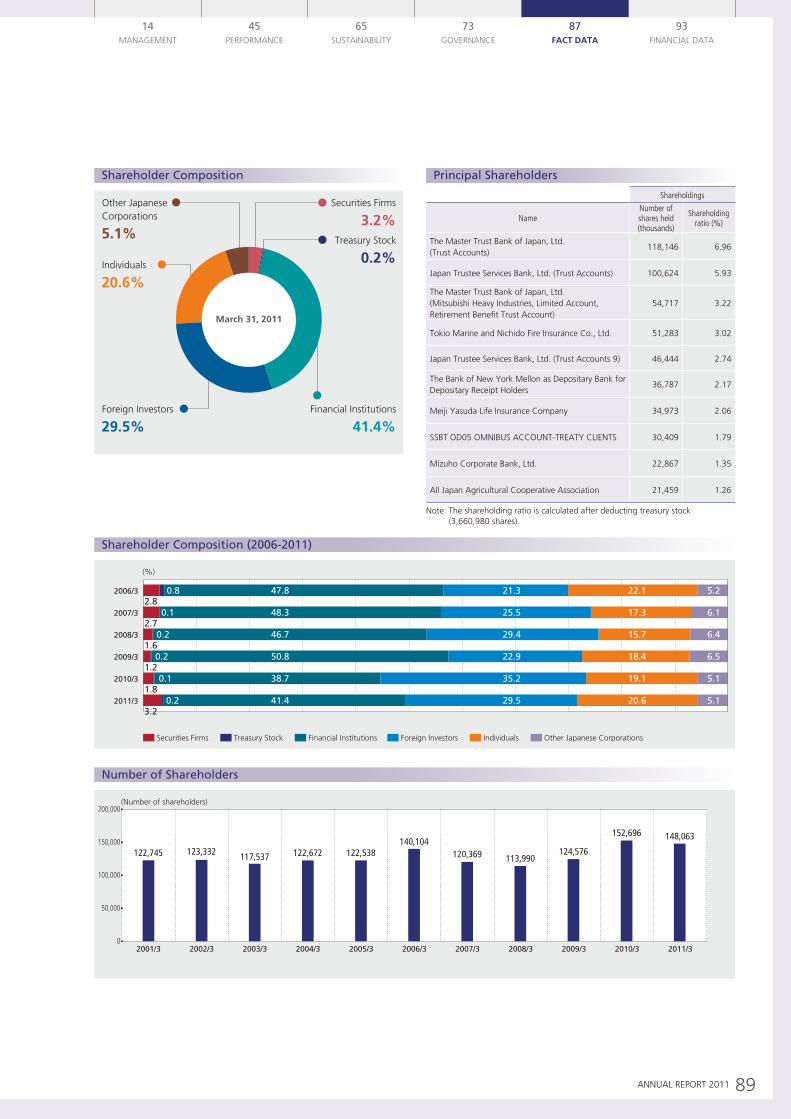
89ANNUAL REPORT 2011
2011 / 07 / 19 [21:06]
14MANAgEMENT
45PERFORMANCE
65SUSTAINABILITY
73gOvERNANCE
93FINANCIAL DATA
87Fact data
Shareholdings
NameNumber of shares held (thousands)
Shareholding ratio (%)
The Master Trust Bank of Japan, Ltd. (Trust Accounts)
118,146 6.96
Japan Trustee Services Bank, Ltd. (Trust Accounts) 100,624 5.93
The Master Trust Bank of Japan, Ltd. (Mitsubishi Heavy Industries, Limited Account, Retirement Benefit Trust Account)
54,717 3.22
Tokio Marine and Nichido Fire Insurance Co., Ltd. 51,283 3.02
Japan Trustee Services Bank, Ltd. (Trust Accounts 9) 46,444 2.74
The Bank of New York Mellon as Depositary Bank for Depositary Receipt Holders
36,787 2.17
Meiji Yasuda Life Insurance Company 34,973 2.06
SSBT OD05 OMNIBUS ACCOUNT-TREATY CLIENTS 30,409 1.79
Mizuho Corporate Bank, Ltd. 22,867 1.35
All Japan Agricultural Cooperative Association 21,459 1.26
Note: The shareholding ratio is calculated after deducting treasury stock (3,660,980 shares).
Principal ShareholdersShareholder Composition
Number of Shareholders
02001/3 2002/3 2003/3 2004/3 2005/3 2006/3 2007/3 2008/3 2009/3 2010/3 2011/3
(Number of shareholders)200,000
150,000
100,000
50,000
122,745 123,332 117,537 122,672 122,538140,104
120,369 113,990124,576
152,696 148,063
Shareholder Composition (2006-2011)
(%)
2006/3
2007/3
2008/3
2009/3
2010/3
2011/3
Securities Firms Treasury Stock Financial Institutions Foreign Investors Individuals Other Japanese Corporations
2.8
2.7
1.6
1.2
1.8
3.2
0.8
0.1
0.2
0.2
0.1
0.2
47.8
48.3
46.7
50.8
38.7
41.4
21.3
25.5
29.4
22.9
35.2
29.5
22.1
17.3
15.7
18.4
19.1
20.6
5.2
6.1
6.4
6.5
5.1
5.1
Individuals
20.6%
Securities Firms
Treasury Stock
3.2%
0.2%
Financial Institutions
41.4%Foreign Investors
29.5%
Other Japanese Corporations
5.1%
March 31, 2011
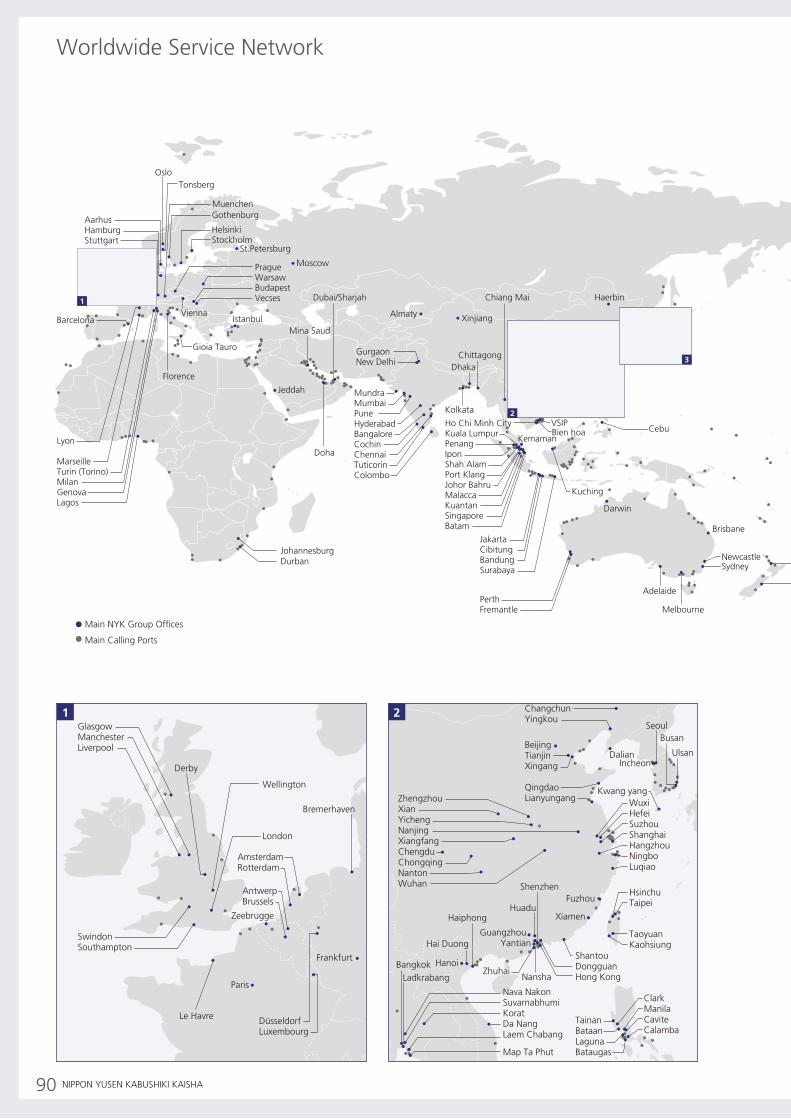
Manaus
Mexico City
São PauloRio de Janeiro
Buenos Aires
Santiago
MontrealBolton
Halifax
Boston
Vancouver (BC)Seattle
ClevelandRaleighJohnstownWashington
NashvilleAtlanta
Callao Lima
Iquique
Valparaiso
SavannahJacksonvilleMiami
SpartanburghMilwaukeeChicagoBloomingtonMinneapolisIndianapolisCincinnatiMemphis
TorontoColumbusDetroit
DenverBentonville
WacoMonterreyLaredo
El Paso
Houston
BoisePortlandSan FranciscoLas VegasLos AngelesSan DiegoTijuanaPhoenix
Honolulu
Brisbane
PerthFremantle
Sydney
Melbourne
Adelaide
Newcastle
Christchurch
Auckland
Cebu
JakartaCibitungBandungSurabaya
Kemaman
Kuching
Darwin
Bien hoaVSIPHo Chi Minh City
Kuala LumpurPenangIponShah AlamPort KlangJohor BahruMalaccaKuantanSingaporeBatam
Kolkata
Chittagong
Chiang Mai Haerbin
Dhaka
MundraMumbaiPuneHyderabadBangaloreCochinChennaiTuticorinColombo
JohannesburgDurban
GurgaonNew Delhi
Almaty Xinjiang
Dubai/Sharjah
Mina Saud
Doha
Jeddah
Istanbul
Lyon
MarseilleTurin (Torino)MilanGenovaLagos
Barcelona
Moscow
St.Petersburg
Vienna
Gioia Tauro
Florence
PragueWarsawBudapestVecses
Muenchen
Tonsberg
AarhusHamburgStuttgart
Gothenburg
HelsinkiStockholm
Oslo
Dallas
Rogers
New YorkNew JerseyBaltimoreChesapeakeNorfolk
1
2
3
Main NYK group Offices
Main Calling Ports
Frankfurt
DüsseldorfLuxembourg
Paris
Bremerhaven
SwindonSouthampton
Le Havre
London
Wellington
GlasgowManchesterLiverpool
AntwerpBrussels
Zeebrugge
AmsterdamRotterdam
Derby
BeijingTianjinXingang
QingdaoLianyungang
Dalian
ChangchunYingkou
Incheon
Busan
Ulsan
Kwang yang
Seoul
WuxiHefeiSuzhouShanghaiHangzhouNingboLuqiao
ZhengzhouXianYichengNanjingXiangfangChengduChongqingNantonWuhan
Xiamen
FuzhouShenzhen
Huadu
ShantouDongguanHong KongNansha
Zhuhai
GuangzhouYantian
TainanBataanLagunaBataugas
ClarkManilaCaviteCalamba
Haiphong
Hai Duong
HsinchuTaipei
TaoyuanKaohsiung
HanoiBangkok
Nava NakonSuvarnabhumiKoratDa NangLaem Chabang
Map Ta Phut
Ladkrabang
21
90 NIPPON YUSEN KABUSHIKI KAISHA
Worldwide Service Network
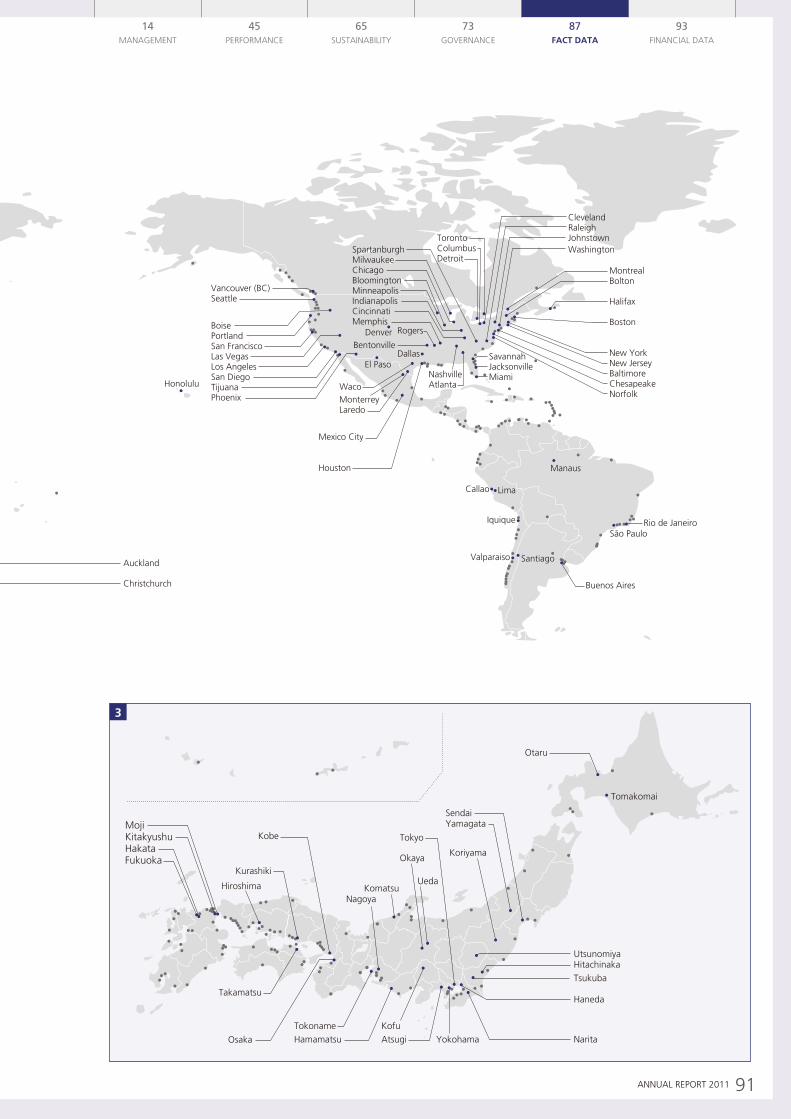
Manaus
Mexico City
São PauloRio de Janeiro
Buenos Aires
Santiago
MontrealBolton
Halifax
Boston
Vancouver (BC)Seattle
ClevelandRaleighJohnstownWashington
NashvilleAtlanta
Callao Lima
Iquique
Valparaiso
SavannahJacksonvilleMiami
SpartanburghMilwaukeeChicagoBloomingtonMinneapolisIndianapolisCincinnatiMemphis
TorontoColumbusDetroit
DenverBentonville
WacoMonterreyLaredo
El Paso
Houston
BoisePortlandSan FranciscoLas VegasLos AngelesSan DiegoTijuanaPhoenix
Honolulu
Brisbane
PerthFremantle
Sydney
Melbourne
Adelaide
Newcastle
Christchurch
Auckland
Cebu
JakartaCibitungBandungSurabaya
Kemaman
Kuching
Darwin
Bien hoaVSIPHo Chi Minh City
Kuala LumpurPenangIponShah AlamPort KlangJohor BahruMalaccaKuantanSingaporeBatam
Kolkata
Chittagong
Chiang Mai Haerbin
Dhaka
MundraMumbaiPuneHyderabadBangaloreCochinChennaiTuticorinColombo
JohannesburgDurban
GurgaonNew Delhi
Almaty Xinjiang
Dubai/Sharjah
Mina Saud
Doha
Jeddah
Istanbul
Lyon
MarseilleTurin (Torino)MilanGenovaLagos
Barcelona
Moscow
St.Petersburg
Vienna
Gioia Tauro
Florence
PragueWarsawBudapestVecses
Muenchen
Tonsberg
AarhusHamburgStuttgart
Gothenburg
HelsinkiStockholm
Oslo
Dallas
Rogers
New YorkNew JerseyBaltimoreChesapeakeNorfolk
1
2
3
MojiKitakyushuHakataFukuoka
Otaru
Tomakomai
Narita
SendaiYamagata
Koriyama
UtsunomiyaHitachinaka
Tsukuba
Haneda
Tokyo
YokohamaAtsugiKofu
Hamamatsu
Nagoya
Okaya
UedaKomatsu
Kobe
Osaka
Tokoname
Takamatsu
Kurashiki
Hiroshima
3
91ANNUAL REPORT 2011
2011 / 07 / 19 [21:06]
14MANAgEMENT
45PERFORMANCE
65SUSTAINABILITY
73gOvERNANCE
93FINANCIAL DATA
87Fact data
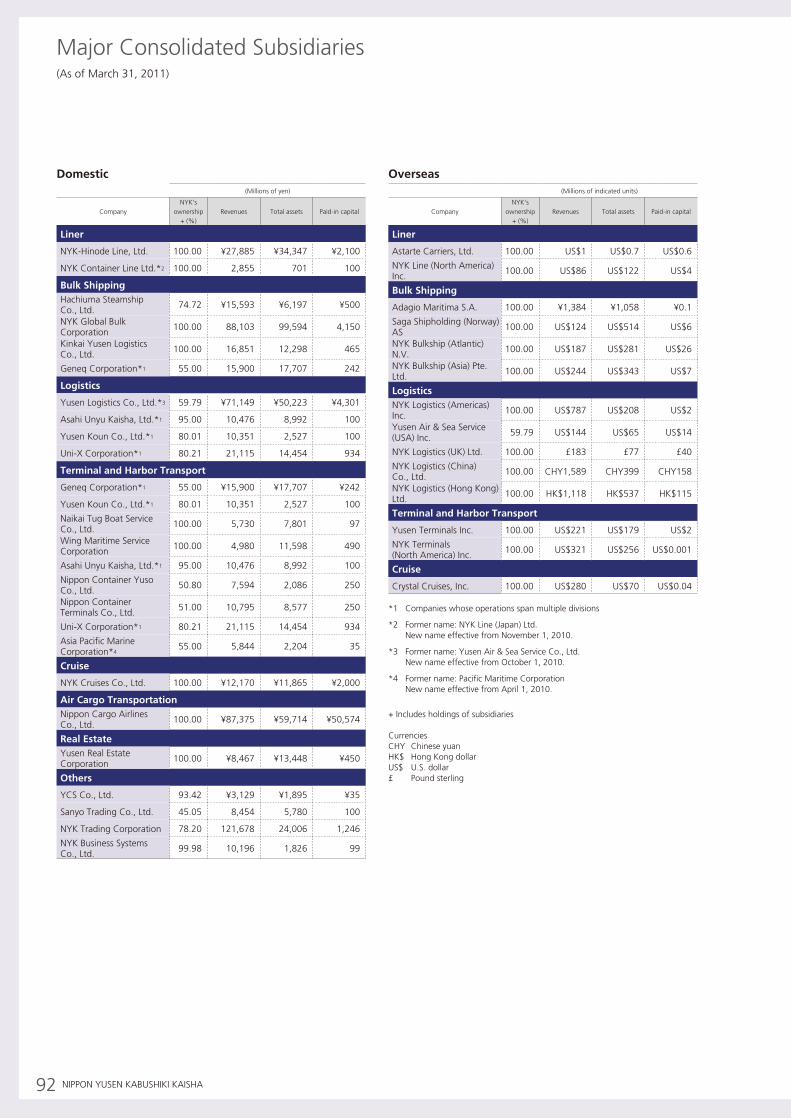
92 NIPPON YUSEN KABUSHIKI KAISHA
Major Consolidated Subsidiaries(As of March 31, 2011)
(Millions of yen)
CompanyNYK’s
ownership + (%)
Revenues Total assets Paid-in capital
Liner
NYK-Hinode Line, Ltd. 100.00 ¥27,885 ¥34,347 ¥2,100
NYK Container Line Ltd.*2 100.00 2,855 701 100
Bulk ShippingHachiuma Steamship Co., Ltd. 74.72 ¥15,593 ¥6,197 ¥500
NYK global Bulk Corporation 100.00 88,103 99,594 4,150
Kinkai Yusen Logistics Co., Ltd. 100.00 16,851 12,298 465
geneq Corporation*1 55.00 15,900 17,707 242
Logistics
Yusen Logistics Co., Ltd.*3 59.79 ¥71,149 ¥50,223 ¥4,301
Asahi Unyu Kaisha, Ltd.*1 95.00 10,476 8,992 100
Yusen Koun Co., Ltd.*1 80.01 10,351 2,527 100
Uni-X Corporation*1 80.21 21,115 14,454 934
terminal and Harbor transport
geneq Corporation*1 55.00 ¥15,900 ¥17,707 ¥242
Yusen Koun Co., Ltd.*1 80.01 10,351 2,527 100
Naikai Tug Boat Service Co., Ltd. 100.00 5,730 7,801 97
Wing Maritime Service Corporation 100.00 4,980 11,598 490
Asahi Unyu Kaisha, Ltd.*1 95.00 10,476 8,992 100
Nippon Container Yuso Co., Ltd. 50.80 7,594 2,086 250
Nippon Container Terminals Co., Ltd. 51.00 10,795 8,577 250
Uni-X Corporation*1 80.21 21,115 14,454 934
Asia Pacific Marine Corporation*4
55.00 5,844 2,204 35
cruise
NYK Cruises Co., Ltd. 100.00 ¥12,170 ¥11,865 ¥2,000
air cargo transportationNippon Cargo Airlines Co., Ltd. 100.00 ¥87,375 ¥59,714 ¥50,574
Real EstateYusen Real Estate Corporation 100.00 ¥8,467 ¥13,448 ¥450
Others
YCS Co., Ltd. 93.42 ¥3,129 ¥1,895 ¥35
Sanyo Trading Co., Ltd. 45.05 8,454 5,780 100
NYK Trading Corporation 78.20 121,678 24,006 1,246
NYK Business Systems Co., Ltd. 99.98 10,196 1,826 99
(Millions of indicated units)
CompanyNYK’s
ownership + (%)
Revenues Total assets Paid-in capital
Liner
Astarte Carriers, Ltd. 100.00 US$1 US$0.7 US$0.6
NYK Line (North America) Inc. 100.00 US$86 US$122 US$4
Bulk Shipping
Adagio Maritima S.A. 100.00 ¥1,384 ¥1,058 ¥0.1
Saga Shipholding (Norway) AS 100.00 US$124 US$514 US$6
NYK Bulkship (Atlantic) N.v. 100.00 US$187 US$281 US$26
NYK Bulkship (Asia) Pte. Ltd. 100.00 US$244 US$343 US$7
Logistics NYK Logistics (Americas) Inc. 100.00 US$787 US$208 US$2
Yusen Air & Sea Service (USA) Inc. 59.79 US$144 US$65 US$14
NYK Logistics (UK) Ltd. 100.00 £183 £77 £40
NYK Logistics (China) Co., Ltd. 100.00 CHY1,589 CHY399 CHY158
NYK Logistics (Hong Kong) Ltd. 100.00 HK$1,118 HK$537 HK$115
terminal and Harbor transport
Yusen Terminals Inc. 100.00 US$221 US$179 US$2
NYK Terminals (North America) Inc. 100.00 US$321 US$256 US$0.001
cruise
Crystal Cruises, Inc. 100.00 US$280 US$70 US$0.04
*1 Companies whose operations span multiple divisions
*2 Former name: NYK Line (Japan) Ltd. New name effective from November 1, 2010.
*3 Former name: Yusen Air & Sea Service Co., Ltd. New name effective from October 1, 2010.
*4 Former name: Pacific Maritime Corporation New name effective from April 1, 2010.
+ Includes holdings of subsidiaries
CurrenciesCHY Chinese yuanHK$ Hong Kong dollarUS$ U.S. dollar£ Pound sterling
domestic Overseas
93ANNUAL REPORT 2011
2011 / 07 / 19 [21:06]
Financial Section
94 A Message from the Chief Financial Officer
96 Consolidated 11-Year Summary
98 Management’s Discussion and Analysis
103 Operating Risks
108 Consolidated Balance Sheets
110 Consolidated Statements of Operations and Consolidated Statement of Comprehensive Income
111 Consolidated Statements of Changes in Equity
112 Consolidated Statements of Cash Flows
113 Notes to Consolidated Financial Statements
138 Management’s Report on Internal Control Over Financial Reporting
139 Independent Auditors’ Report
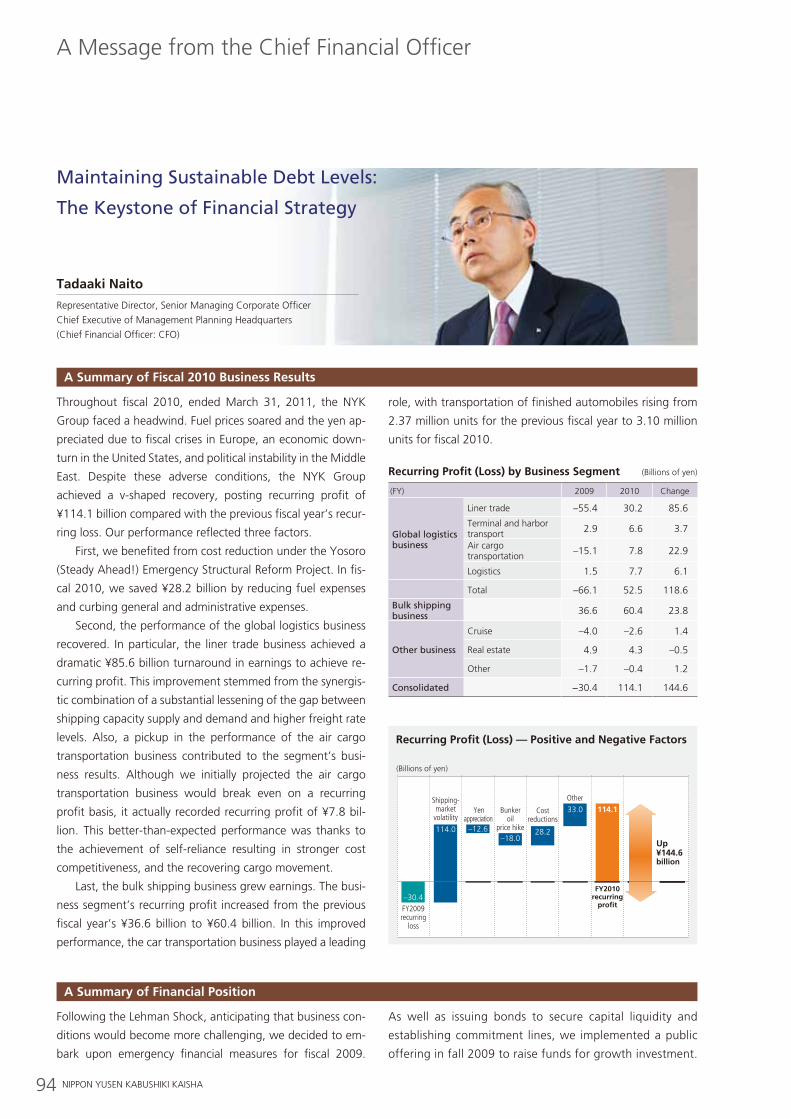
94 NIPPON YUSEN KABUSHIKI KAISHA
A Message from the Chief Financial Officer
Throughout fiscal 2010, ended March 31, 2011, the NYK
group faced a headwind. Fuel prices soared and the yen ap-
preciated due to fiscal crises in Europe, an economic down-
turn in the United States, and political instability in the Middle
East. Despite these adverse conditions, the NYK group
achieved a v-shaped recovery, posting recurring profit of
¥114.1 billion compared with the previous fiscal year’s recur-
ring loss. Our performance reflected three factors.
First, we benefited from cost reduction under the Yosoro
(Steady Ahead!) Emergency Structural Reform Project. In fis-
cal 2010, we saved ¥28.2 billion by reducing fuel expenses
and curbing general and administrative expenses.
Second, the performance of the global logistics business
recovered. In particular, the liner trade business achieved a
dramatic ¥85.6 billion turnaround in earnings to achieve re-
curring profit. This improvement stemmed from the synergis-
tic combination of a substantial lessening of the gap between
shipping capacity supply and demand and higher freight rate
levels. Also, a pickup in the performance of the air cargo
transportation business contributed to the segment’s busi-
ness results. Although we initially projected the air cargo
transportation business would break even on a recurring
profit basis, it actually recorded recurring profit of ¥7.8 bil-
lion. This better-than-expected performance was thanks to
the achievement of self-reliance resulting in stronger cost
competitiveness, and the recovering cargo movement.
Last, the bulk shipping business grew earnings. The busi-
ness segment’s recurring profit increased from the previous
fiscal year’s ¥36.6 billion to ¥60.4 billion. In this improved
performance, the car transportation business played a leading
role, with transportation of finished automobiles rising from
2.37 million units for the previous fiscal year to 3.10 million
units for fiscal 2010.
Recurring Profit (Loss) by Business Segment (Billions of yen)
(FY) 2009 2010 Change
Global logistics business
Liner trade –55.4 30.2 85.6
Terminal and harbor transport 2.9 6.6 3.7
Air cargo transportation –15.1 7.8 22.9
Logistics 1.5 7.7 6.1
Total –66.1 52.5 118.6
Bulk shipping business 36.6 60.4 23.8
Other business
Cruise –4.0 –2.6 1.4
Real estate 4.9 4.3 –0.5
Other –1.7 –0.4 1.2
Consolidated −30.4 114.1 144.6
a Summary of Fiscal 2010 Business Results
Following the Lehman Shock, anticipating that business con-
ditions would become more challenging, we decided to em-
bark upon emergency financial measures for fiscal 2009.
As well as issuing bonds to secure capital liquidity and
establishing commitment lines, we implemented a public
offering in fall 2009 to raise funds for growth investment.
a Summary of Financial Position
Maintaining Sustainable Debt Levels:
The Keystone of Financial Strategy
Recurring Profit (Loss) — Positive and Negative Factors
FY2009recurring
loss
Shipping-market
volatilityYen
appreciation Bunker
oilprice hike
Costreductions
Other
FY2010recurring
profit–30.4
114.0 –12.6–18.0
28.2
33.0 114.1
Up ¥144.6billion
(Billions of yen)
tadaaki Naito
Representative Director, Senior Managing Corporate Officer
Chief Executive of Management Planning Headquarters
(Chief Financial Officer: CFO)
95ANNUAL REPORT 2011
2011 / 07 / 19 [21:06]
14MANAgEMENT
45PERFORMANCE
65SUSTAINABILITY
73gOvERNANCE
87FACT DATA
93FiNaNciaL data
In fiscal 2010, our results were above expectations. However,
we should not be complacent about the future. In the im-
mediate future, we expect to see a continuation of instability
in the U.S. economy, fiscal crises in Europe, and political in-
stability in the Middle East. Also, the impact of the great East
Japan Earthquake is a cause for concern.
Based on this outlook, we have decided that we need to
balance efforts to achieve growth with efforts to strengthen
our financial position. Accordingly, we have set out maintain-
ing sustainable levels of debt as the overriding goal of our
financial strategy. To realize this strategy, curbing investment
is key. Therefore, we need to scrutinize and be highly selec-
tive about investment projects. To this end, we have strength-
ened structures designed to promote a stringent selection
process. For example, we require divisions to submit docu-
ments that give a comprehensive picture of investment
projects. Rather than just accepting general explanations of
investment projects, we seek detailed explanations of con-
crete earnings targets and business strategies. Also, we are
considering strict business management measures under
which, in some cases, we would ask divisions to dispose of
their assets. If they were not able to do so, we would not ap-
prove the new investment.
The aim of such structures is to heighten awareness of
financial discipline within NYK and thereby make it leaner.
For fiscal 2011, ending March 31, 2012, based on the
effect of the great East Japan Earthquake on respective busi-
nesses to date and the latest trends in the markets for dry
bulk and other cargos, we anticipate net sales of ¥1,970 bil-
lion, operating income of ¥60 billion, recurring profit of ¥50
billion, and net income of ¥34 billion.
Financial tasks and targets
With a view to maintaining debt at sustainable levels, we will
take three measures.
First, we intend to strengthen balance sheet management
through plan–do–check–act (PDCA) cycles. For example, we
will dispose of unprofitable businesses or inefficient assets
based on exit rules. We will identify “companies that are insol-
vent or that have recorded net loss for three consecutive years
or more as companies requiring management.” If after a fur-
ther year such companies show no sign of improvement, we
will sell or liquidate them. We want to complete PDCA cycles
at least every two quarters, preferably every quarter.
Further, aiming to make asset efficiency visible, we have
established return on assets (ROA) figures for each division. To
increase return on equity (ROE), there are two options: lower
our level of debt or heighten ROA. We believe that raising
ROA is a task we must address. While reaching companywide
targets for ROA is our ultimate objective, if divisions do not
reach their targets, we intend to sell or liquidate businesses.
Our second measure focuses on overall optimization.
Until now, we have pursued optimization on an individual
project basis. For example, for construction of ships we have
raised funds at the lowest possible interest rates. However,
this has exposed us to risk arising from mismatches between
assets and liabilities in relation to currencies and periods as
well as fixed and variable interest rates. Our strategy will be
to rectify this by realizing overall optimization through
strengthened centralized financing. Consequently, for con-
struction of ships, as before, we will provide sales division
personnel with financing in the currencies and at the interest
rates they require. At the same time, however, centralized
financing will hedge the risk by externally raising funds based
on different currencies, loan periods, interest, and other
terms. This will enable us to build an optimal risk portfolio.
Third, we will increase our responsiveness to emerging
markets’ currencies. Until now the main currencies we have
handled have been the yen, U.S. dollar, euro, and pound.
given the likely growth of emerging markets, we will estab-
lish a system that enables us to handle the currencies of
emerging markets by deploying experts familiar with such
currencies as the Chinese yuan and the Indian rupee. Also,
although we have until now raised funds mainly from Japa-
nese banks, we will extend the scope of our fundraising op-
tions to include foreign financial institutions.
Financial Strategy Going Forward
In expenditures, we curbed overall investment by prioritizing
investment projects. Further, we sold investment securities in
order to streamline our balance sheet.
In fiscal 2010, however, as business results recovered
we were able to steadily return to a normal financial posi-
tion. In addition to lowering commitment lines, we shrunk
interest-bearing debt by using higher-than-expected earn-
ings to repay loans. As a result, fiscal 2010 saw an
improvement in our financial position, with the sharehold-
ers’ equity ratio rising from 30.0% to 32.2% and the
debt–equity ratio (DER) decreasing from 1.64 to 1.43.
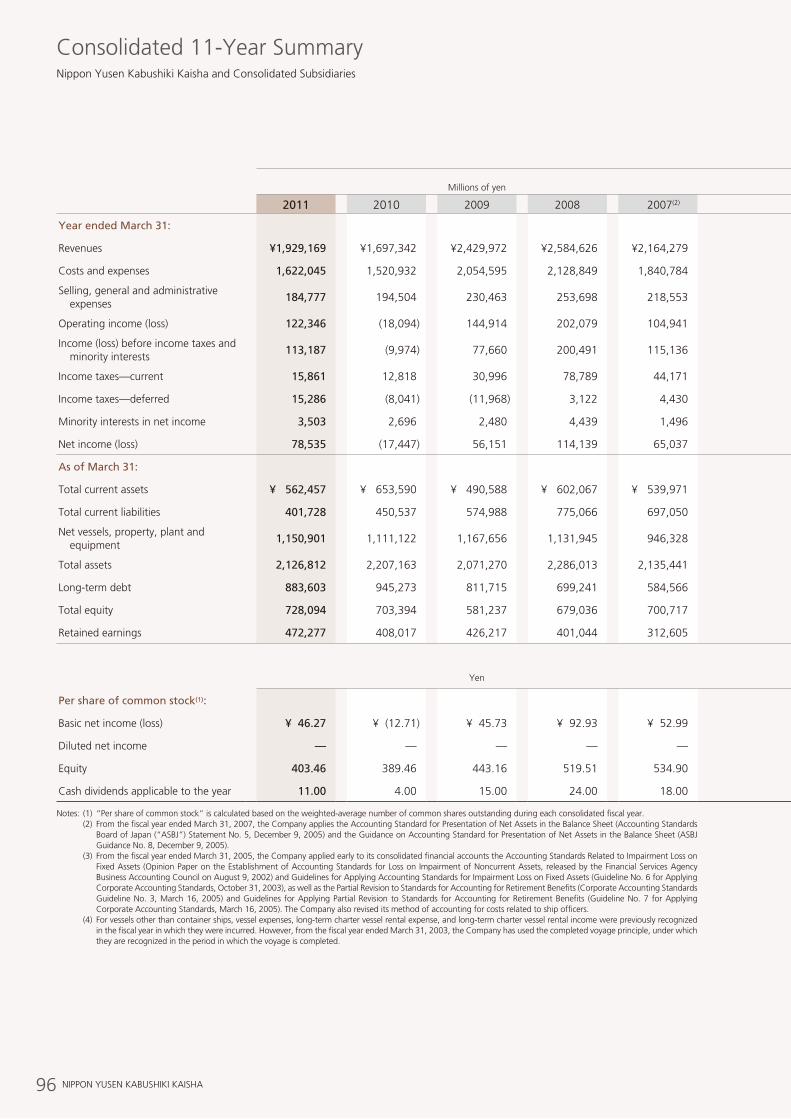
96 NIPPON YUSEN KABUSHIKI KAISHA
Consolidated 11-Year Summary
Millions of yen
Millions of yen
Thousands of U.S. dollars (Note 2)
2011 2010 2009 2008 2007(2) 2006 2005(3) 2004 2003(4) 2002 2001 2011
Year ended March 31:
Revenues ¥1,929,169 ¥1,697,342 ¥2,429,972 ¥2,584,626 ¥2,164,279 ¥1,929,302 ¥1,606,098 ¥1,398,320 ¥1,249,242 ¥1,142,934 ¥1,133,905 $23,201,079
Costs and expenses 1,622,045 1,520,932 2,054,595 2,128,849 1,840,784 1,594,598 1,283,769 1,158,352 1,037,373 945,950 918,645 19,507,462
Selling, general and administrative expenses
184,777 194,504 230,463 253,698 218,553 194,222 160,953 148,034 142,746 131,425 127,619 2,222,219
Operating income (loss) 122,346 (18,094) 144,914 202,079 104,941 140,481 161,375 91,933 69,122 65,558 87,640 1,471,397
Income (loss) before income taxes and minority interests
113,187 (9,974) 77,660 200,491 115,136 145,560 127,213 61,535 32,647 31,708 57,803 1,361,243
Income taxes—current 15,861 12,818 30,996 78,789 44,171 53,838 51,365 33,797 15,350 13,158 26,590 190,760
Income taxes—deferred 15,286 (8,041) (11,968) 3,122 4,430 (3,261) 579 (9,511) (92) (336) (5,134) 183,847
Minority interests in net income 3,503 2,696 2,480 4,439 1,496 2,924 3,940 2,439 3,097 1,347 784 42,131
Net income (loss) 78,535 (17,447) 56,151 114,139 65,037 92,058 71,326 34,810 14,292 17,538 35,562 944,504
As of March 31:
Total current assets ¥ 562,457 ¥ 653,590 ¥ 490,588 ¥ 602,067 ¥ 539,971 ¥ 460,536 ¥ 399,500 ¥ 370,673 ¥ 350,228 ¥ 313,916 ¥ 322,779 $ 6,764,373
Total current liabilities 401,728 450,537 574,988 775,066 697,050 612,154 477,865 425,753 370,521 387,321 378,954 4,831,374
Net vessels, property, plant and equipment
1,150,901 1,111,122 1,167,656 1,131,945 946,328 856,065 701,157 652,405 651,159 685,711 750,324 13,841,265
Total assets 2,126,812 2,207,163 2,071,270 2,286,013 2,135,441 1,877,440 1,476,226 1,376,664 1,287,170 1,339,922 1,381,593 25,578,026
Long-term debt 883,603 945,273 811,715 699,241 584,566 506,230 464,196 491,233 548,926 547,656 659,358 10,626,620
Total equity 728,094 703,394 581,237 679,036 700,717 575,366 427,770 358,044 288,363 320,096 278,747 8,756,400
Retained earnings 472,277 408,017 426,217 401,044 312,605 266,567 203,774 146,755 122,271 116,349 113,684 5,679,822
Yen Yen U.S. dollars (Note 2)
Per share of common stock(1):
Basic net income (loss) ¥ 46.27 ¥ (12.71) ¥ 45.73 ¥ 92.93 ¥ 52.99 ¥ 75.04 ¥ 58.12 ¥ 28.27 ¥ 11.48 ¥ 14.23 ¥ 28.88 $0.56
Diluted net income — — — — — — — — — 14.23 28.21 —
Equity 403.46 389.46 443.16 519.51 534.90 471.05 350.10 292.88 235.81 260.80 225.36 4.85
Cash dividends applicable to the year 11.00 4.00 15.00 24.00 18.00 18.00 18.00 10.00 7.50 7.50 7.50 0.13
Notes: (1) “Per share of common stock” is calculated based on the weighted-average number of common shares outstanding during each consolidated fiscal year. (2) From the fiscal year ended March 31, 2007, the Company applies the Accounting Standard for Presentation of Net Assets in the Balance Sheet (Accounting Standards
Board of Japan (“ASBJ”) Statement No. 5, December 9, 2005) and the Guidance on Accounting Standard for Presentation of Net Assets in the Balance Sheet (ASBJ Guidance No. 8, December 9, 2005).
(3) From the fiscal year ended March 31, 2005, the Company applied early to its consolidated financial accounts the Accounting Standards Related to Impairment Loss on Fixed Assets (Opinion Paper on the Establishment of Accounting Standards for Loss on Impairment of Noncurrent Assets, released by the Financial Services Agency Business Accounting Council on August 9, 2002) and Guidelines for Applying Accounting Standards for Impairment Loss on Fixed Assets (Guideline No. 6 for Applying Corporate Accounting Standards, October 31, 2003), as well as the Partial Revision to Standards for Accounting for Retirement Benefits (Corporate Accounting Standards Guideline No. 3, March 16, 2005) and Guidelines for Applying Partial Revision to Standards for Accounting for Retirement Benefits (Guideline No. 7 for Applying Corporate Accounting Standards, March 16, 2005). The Company also revised its method of accounting for costs related to ship officers.
(4) For vessels other than container ships, vessel expenses, long-term charter vessel rental expense, and long-term charter vessel rental income were previously recognized in the fiscal year in which they were incurred. However, from the fiscal year ended March 31, 2003, the Company has used the completed voyage principle, under which they are recognized in the period in which the voyage is completed.
Nippon Yusen Kabushiki Kaisha and Consolidated Subsidiaries
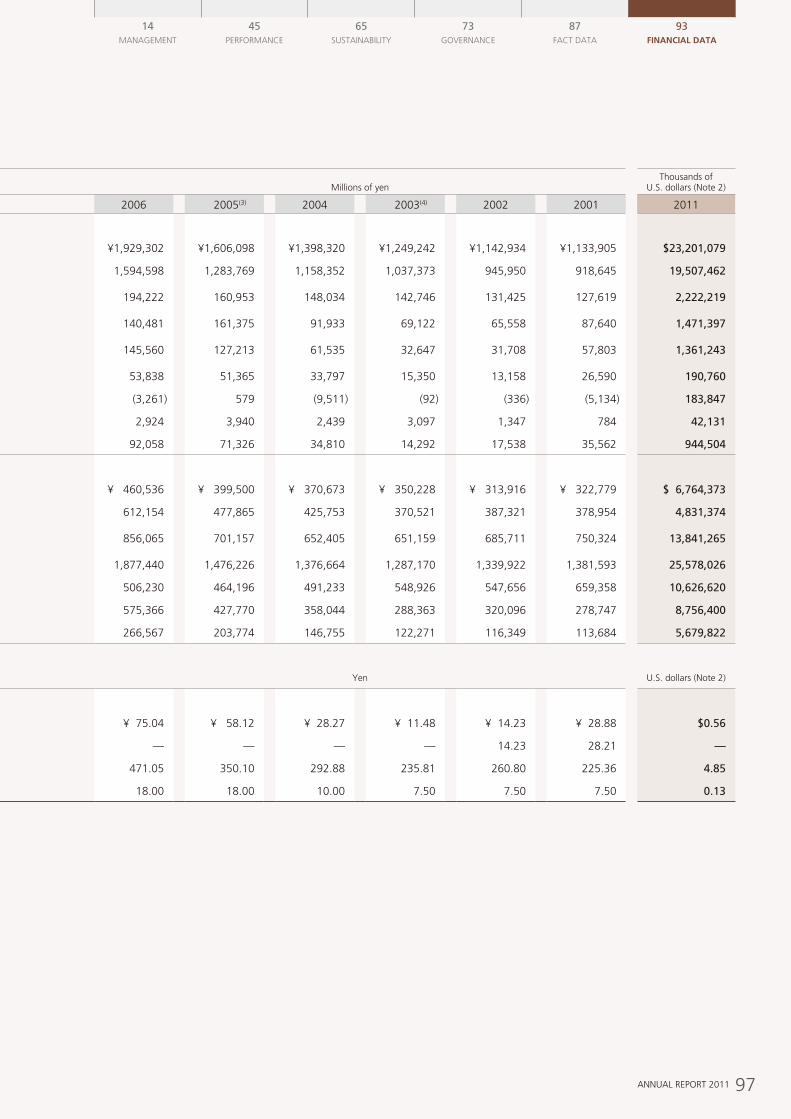
97ANNUAL REPORT 2011
14MANAGEMENT
45PERFORMANCE
65SUSTAINABILITY
73GOvERNANCE
87FACT DATA
93Financial data
Millions of yen
Millions of yen
Thousands of U.S. dollars (Note 2)
2011 2010 2009 2008 2007(2) 2006 2005(3) 2004 2003(4) 2002 2001 2011
Year ended March 31:
Revenues ¥1,929,169 ¥1,697,342 ¥2,429,972 ¥2,584,626 ¥2,164,279 ¥1,929,302 ¥1,606,098 ¥1,398,320 ¥1,249,242 ¥1,142,934 ¥1,133,905 $23,201,079
Costs and expenses 1,622,045 1,520,932 2,054,595 2,128,849 1,840,784 1,594,598 1,283,769 1,158,352 1,037,373 945,950 918,645 19,507,462
Selling, general and administrative expenses
184,777 194,504 230,463 253,698 218,553 194,222 160,953 148,034 142,746 131,425 127,619 2,222,219
Operating income (loss) 122,346 (18,094) 144,914 202,079 104,941 140,481 161,375 91,933 69,122 65,558 87,640 1,471,397
Income (loss) before income taxes and minority interests
113,187 (9,974) 77,660 200,491 115,136 145,560 127,213 61,535 32,647 31,708 57,803 1,361,243
Income taxes—current 15,861 12,818 30,996 78,789 44,171 53,838 51,365 33,797 15,350 13,158 26,590 190,760
Income taxes—deferred 15,286 (8,041) (11,968) 3,122 4,430 (3,261) 579 (9,511) (92) (336) (5,134) 183,847
Minority interests in net income 3,503 2,696 2,480 4,439 1,496 2,924 3,940 2,439 3,097 1,347 784 42,131
Net income (loss) 78,535 (17,447) 56,151 114,139 65,037 92,058 71,326 34,810 14,292 17,538 35,562 944,504
As of March 31:
Total current assets ¥ 562,457 ¥ 653,590 ¥ 490,588 ¥ 602,067 ¥ 539,971 ¥ 460,536 ¥ 399,500 ¥ 370,673 ¥ 350,228 ¥ 313,916 ¥ 322,779 $ 6,764,373
Total current liabilities 401,728 450,537 574,988 775,066 697,050 612,154 477,865 425,753 370,521 387,321 378,954 4,831,374
Net vessels, property, plant and equipment
1,150,901 1,111,122 1,167,656 1,131,945 946,328 856,065 701,157 652,405 651,159 685,711 750,324 13,841,265
Total assets 2,126,812 2,207,163 2,071,270 2,286,013 2,135,441 1,877,440 1,476,226 1,376,664 1,287,170 1,339,922 1,381,593 25,578,026
Long-term debt 883,603 945,273 811,715 699,241 584,566 506,230 464,196 491,233 548,926 547,656 659,358 10,626,620
Total equity 728,094 703,394 581,237 679,036 700,717 575,366 427,770 358,044 288,363 320,096 278,747 8,756,400
Retained earnings 472,277 408,017 426,217 401,044 312,605 266,567 203,774 146,755 122,271 116,349 113,684 5,679,822
Yen Yen U.S. dollars (Note 2)
Per share of common stock(1):
Basic net income (loss) ¥ 46.27 ¥ (12.71) ¥ 45.73 ¥ 92.93 ¥ 52.99 ¥ 75.04 ¥ 58.12 ¥ 28.27 ¥ 11.48 ¥ 14.23 ¥ 28.88 $0.56
Diluted net income — — — — — — — — — 14.23 28.21 —
Equity 403.46 389.46 443.16 519.51 534.90 471.05 350.10 292.88 235.81 260.80 225.36 4.85
Cash dividends applicable to the year 11.00 4.00 15.00 24.00 18.00 18.00 18.00 10.00 7.50 7.50 7.50 0.13
Notes: (1) “Per share of common stock” is calculated based on the weighted-average number of common shares outstanding during each consolidated fiscal year. (2) From the fiscal year ended March 31, 2007, the Company applies the Accounting Standard for Presentation of Net Assets in the Balance Sheet (Accounting Standards
Board of Japan (“ASBJ”) Statement No. 5, December 9, 2005) and the Guidance on Accounting Standard for Presentation of Net Assets in the Balance Sheet (ASBJ Guidance No. 8, December 9, 2005).
(3) From the fiscal year ended March 31, 2005, the Company applied early to its consolidated financial accounts the Accounting Standards Related to Impairment Loss on Fixed Assets (Opinion Paper on the Establishment of Accounting Standards for Loss on Impairment of Noncurrent Assets, released by the Financial Services Agency Business Accounting Council on August 9, 2002) and Guidelines for Applying Accounting Standards for Impairment Loss on Fixed Assets (Guideline No. 6 for Applying Corporate Accounting Standards, October 31, 2003), as well as the Partial Revision to Standards for Accounting for Retirement Benefits (Corporate Accounting Standards Guideline No. 3, March 16, 2005) and Guidelines for Applying Partial Revision to Standards for Accounting for Retirement Benefits (Guideline No. 7 for Applying Corporate Accounting Standards, March 16, 2005). The Company also revised its method of accounting for costs related to ship officers.
(4) For vessels other than container ships, vessel expenses, long-term charter vessel rental expense, and long-term charter vessel rental income were previously recognized in the fiscal year in which they were incurred. However, from the fiscal year ended March 31, 2003, the Company has used the completed voyage principle, under which they are recognized in the period in which the voyage is completed.
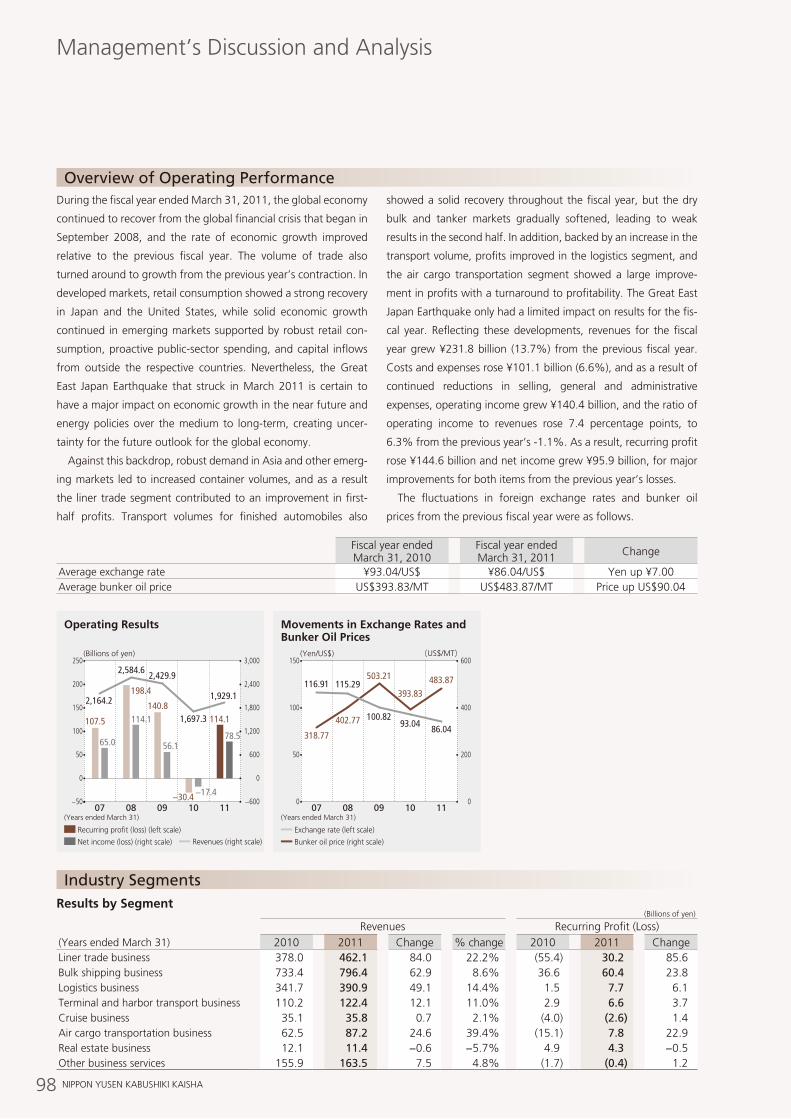
98 NIPPON YUSEN KABUSHIKI KAISHA
Management’s Discussion and Analysis
During the fiscal year ended March 31, 2011, the global economy
continued to recover from the global financial crisis that began in
September 2008, and the rate of economic growth improved
relative to the previous fiscal year. The volume of trade also
turned around to growth from the previous year’s contraction. In
developed markets, retail consumption showed a strong recovery
in Japan and the United States, while solid economic growth
continued in emerging markets supported by robust retail con-
sumption, proactive public-sector spending, and capital inflows
from outside the respective countries. Nevertheless, the Great
East Japan Earthquake that struck in March 2011 is certain to
have a major impact on economic growth in the near future and
energy policies over the medium to long-term, creating uncer-
tainty for the future outlook for the global economy.
Against this backdrop, robust demand in Asia and other emerg-
ing markets led to increased container volumes, and as a result
the liner trade segment contributed to an improvement in first-
half profits. Transport volumes for finished automobiles also
showed a solid recovery throughout the fiscal year, but the dry
bulk and tanker markets gradually softened, leading to weak
results in the second half. In addition, backed by an increase in the
transport volume, profits improved in the logistics segment, and
the air cargo transportation segment showed a large improve-
ment in profits with a turnaround to profitability. The Great East
Japan Earthquake only had a limited impact on results for the fis-
cal year. Reflecting these developments, revenues for the fiscal
year grew ¥231.8 billion (13.7%) from the previous fiscal year.
Costs and expenses rose ¥101.1 billion (6.6%), and as a result of
continued reductions in selling, general and administrative
expenses, operating income grew ¥140.4 billion, and the ratio of
operating income to revenues rose 7.4 percentage points, to
6.3% from the previous year’s -1.1%. As a result, recurring profit
rose ¥144.6 billion and net income grew ¥95.9 billion, for major
improvements for both items from the previous year’s losses.
The fluctuations in foreign exchange rates and bunker oil
prices from the previous fiscal year were as follows.
Overview of Operating Performance
Industry Segments
Fiscal year ended March 31, 2010
Fiscal year ended March 31, 2011 Change
Average exchange rate ¥93.04/US$ ¥86.04/US$ Yen up ¥7.00Average bunker oil price US$393.83/MT US$483.87/MT Price up US$90.04
(US$/MT)
0 0
318.77
402.77
503.21
100.82
393.83116.91 115.29
93.04
483.87
86.04
150
100
600
400
200
07 08 09 10 11
50
(Yen/US$)
Movements in Exchange Rates and Bunker Oil Prices
(Years ended March 31)
Exchange rate (left scale)
Bunker oil price (right scale)
Results by Segment(Billions of yen)
Revenues Recurring Profit (Loss)(Years ended March 31) 2010 2011 Change % change 2010 2011 ChangeLiner trade business 378.0 462.1 84.0 22.2% (55.4) 30.2 85.6 Bulk shipping business 733.4 796.4 62.9 8.6% 36.6 60.4 23.8 Logistics business 341.7 390.9 49.1 14.4% 1.5 7.7 6.1 Terminal and harbor transport business 110.2 122.4 12.1 11.0% 2.9 6.6 3.7 Cruise business 35.1 35.8 0.7 2.1% (4.0) (2.6) 1.4 Air cargo transportation business 62.5 87.2 24.6 39.4% (15.1) 7.8 22.9 Real estate business 12.1 11.4 −0.6 −5.7% 4.9 4.3 −0.5Other business services 155.9 163.5 7.5 4.8% (1.7) (0.4) 1.2
(Billions of yen)
Operating Results
07(Years ended March 31)
08 09 10 11
107.5
65.0
114.1
56.178.5
−17.4
198.4
140.8114.1
−30.4
50
250
150
100
200
0
−50
3,000
600
1,200
1,800
2,400
0
−600
2,164.2
2,584.62,429.9
1,697.3
1,929.1
Recurring profit (loss) (left scale)
Net income (loss) (right scale) Revenues (right scale)
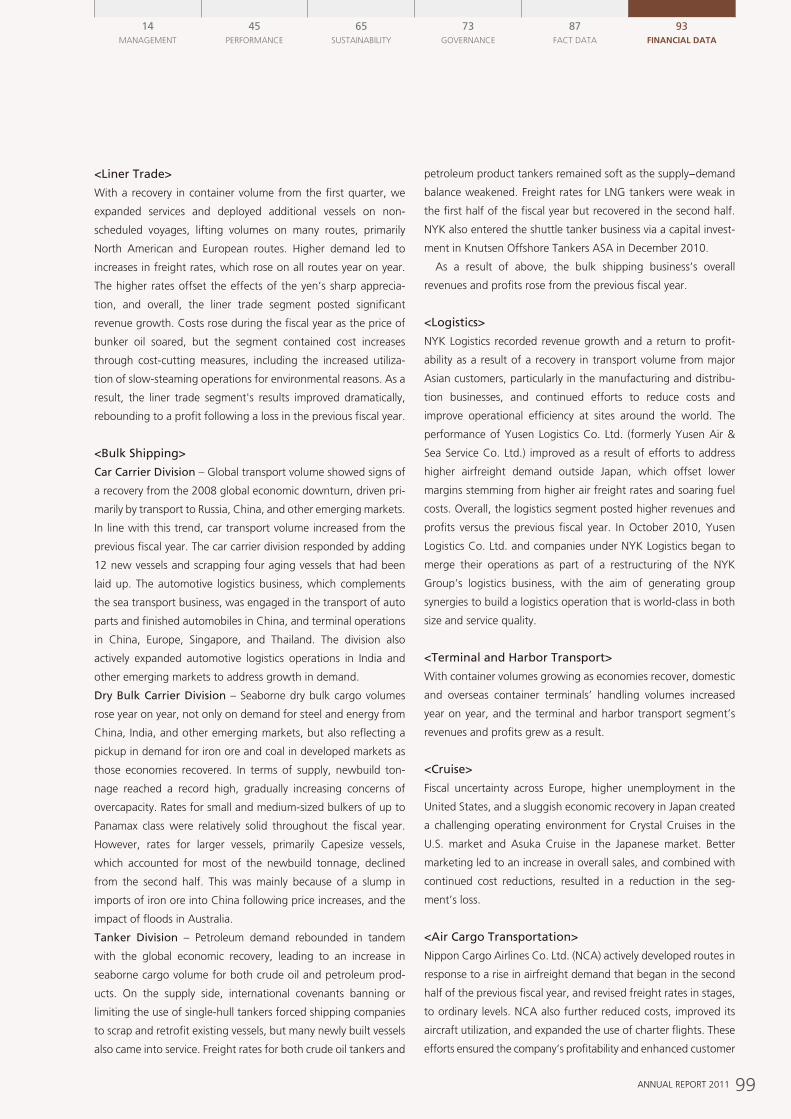
99ANNUAL REPORT 2011
14MANAGEMENT
45PERFORMANCE
65SUSTAINABILITY
73GOvERNANCE
87FACT DATA
93Financial data
<Liner Trade>
With a recovery in container volume from the first quarter, we
expanded services and deployed additional vessels on non-
scheduled voyages, lifting volumes on many routes, primarily
North American and European routes. Higher demand led to
increases in freight rates, which rose on all routes year on year.
The higher rates offset the effects of the yen’s sharp apprecia-
tion, and overall, the liner trade segment posted significant
revenue growth. Costs rose during the fiscal year as the price of
bunker oil soared, but the segment contained cost increases
through cost-cutting measures, including the increased utiliza-
tion of slow-steaming operations for environmental reasons. As a
result, the liner trade segment's results improved dramatically,
rebounding to a profit following a loss in the previous fiscal year.
<Bulk Shipping>
Car Carrier Division – Global transport volume showed signs of
a recovery from the 2008 global economic downturn, driven pri-
marily by transport to Russia, China, and other emerging markets.
In line with this trend, car transport volume increased from the
previous fiscal year. The car carrier division responded by adding
12 new vessels and scrapping four aging vessels that had been
laid up. The automotive logistics business, which complements
the sea transport business, was engaged in the transport of auto
parts and finished automobiles in China, and terminal operations
in China, Europe, Singapore, and Thailand. The division also
actively expanded automotive logistics operations in India and
other emerging markets to address growth in demand.
Dry Bulk Carrier Division – Seaborne dry bulk cargo volumes
rose year on year, not only on demand for steel and energy from
China, India, and other emerging markets, but also reflecting a
pickup in demand for iron ore and coal in developed markets as
those economies recovered. In terms of supply, newbuild ton-
nage reached a record high, gradually increasing concerns of
overcapacity. Rates for small and medium-sized bulkers of up to
Panamax class were relatively solid throughout the fiscal year.
However, rates for larger vessels, primarily Capesize vessels,
which accounted for most of the newbuild tonnage, declined
from the second half. This was mainly because of a slump in
imports of iron ore into China following price increases, and the
impact of floods in Australia.
Tanker Division – Petroleum demand rebounded in tandem
with the global economic recovery, leading to an increase in
seaborne cargo volume for both crude oil and petroleum prod-
ucts. On the supply side, international covenants banning or
limiting the use of single-hull tankers forced shipping companies
to scrap and retrofit existing vessels, but many newly built vessels
also came into service. Freight rates for both crude oil tankers and
petroleum product tankers remained soft as the supply−demand
balance weakened. Freight rates for LNG tankers were weak in
the first half of the fiscal year but recovered in the second half.
NYK also entered the shuttle tanker business via a capital invest-
ment in Knutsen Offshore Tankers ASA in December 2010.
As a result of above, the bulk shipping business’s overall
revenues and profits rose from the previous fiscal year.
<Logistics>
NYK Logistics recorded revenue growth and a return to profit-
ability as a result of a recovery in transport volume from major
Asian customers, particularly in the manufacturing and distribu-
tion businesses, and continued efforts to reduce costs and
improve operational efficiency at sites around the world. The
performance of Yusen Logistics Co. Ltd. (formerly Yusen Air &
Sea Service Co. Ltd.) improved as a result of efforts to address
higher airfreight demand outside Japan, which offset lower
margins stemming from higher air freight rates and soaring fuel
costs. Overall, the logistics segment posted higher revenues and
profits versus the previous fiscal year. In October 2010, Yusen
Logistics Co. Ltd. and companies under NYK Logistics began to
merge their operations as part of a restructuring of the NYK
Group’s logistics business, with the aim of generating group
synergies to build a logistics operation that is world-class in both
size and service quality.
<Terminal and Harbor Transport>
With container volumes growing as economies recover, domestic
and overseas container terminals’ handling volumes increased
year on year, and the terminal and harbor transport segment’s
revenues and profits grew as a result.
<Cruise>
Fiscal uncertainty across Europe, higher unemployment in the
United States, and a sluggish economic recovery in Japan created
a challenging operating environment for Crystal Cruises in the
U.S. market and Asuka Cruise in the Japanese market. Better
marketing led to an increase in overall sales, and combined with
continued cost reductions, resulted in a reduction in the seg-
ment’s loss.
<Air Cargo Transportation>
Nippon Cargo Airlines Co. Ltd. (NCA) actively developed routes in
response to a rise in airfreight demand that began in the second
half of the previous fiscal year, and revised freight rates in stages,
to ordinary levels. NCA also further reduced costs, improved its
aircraft utilization, and expanded the use of charter flights. These
efforts ensured the company’s profitability and enhanced customer
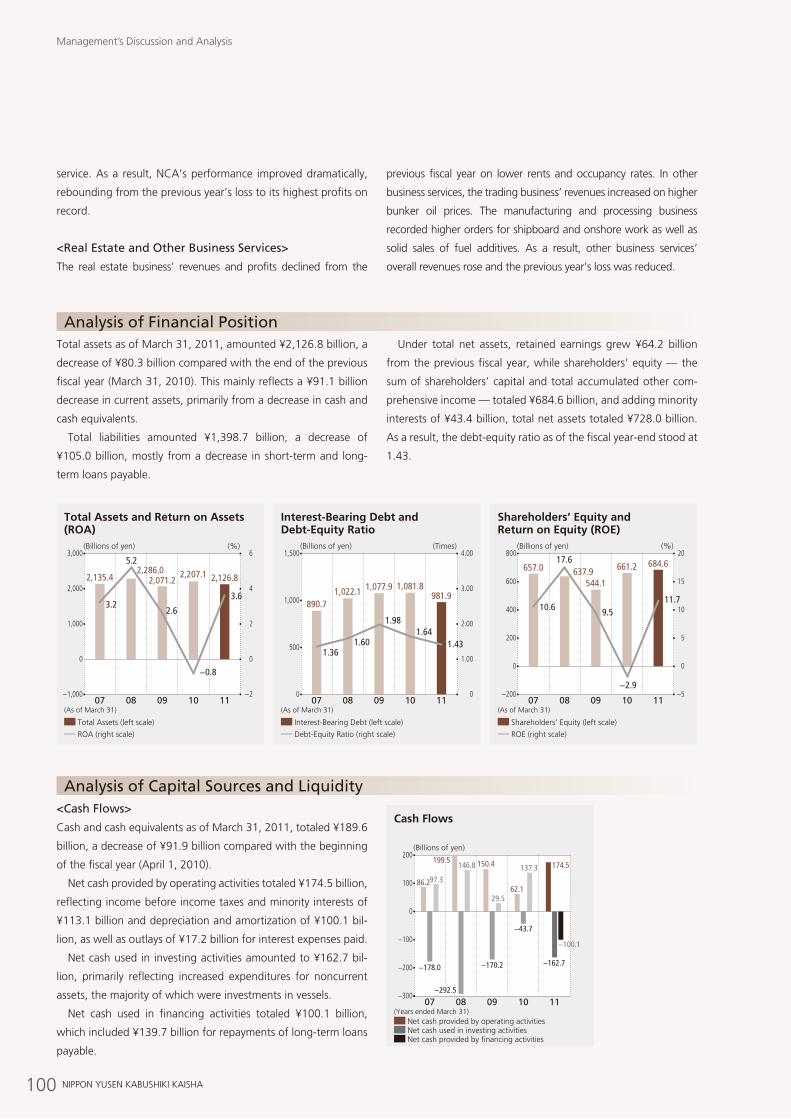
100 NIPPON YUSEN KABUSHIKI KAISHA
Total assets as of March 31, 2011, amounted ¥2,126.8 billion, a
decrease of ¥80.3 billion compared with the end of the previous
fiscal year (March 31, 2010). This mainly reflects a ¥91.1 billion
decrease in current assets, primarily from a decrease in cash and
cash equivalents.
Total liabilities amounted ¥1,398.7 billion, a decrease of
¥105.0 billion, mostly from a decrease in short-term and long-
term loans payable.
Under total net assets, retained earnings grew ¥64.2 billion
from the previous fiscal year, while shareholders’ equity — the
sum of shareholders’ capital and total accumulated other com-
prehensive income — totaled ¥684.6 billion, and adding minority
interests of ¥43.4 billion, total net assets totaled ¥728.0 billion.
As a result, the debt-equity ratio as of the fiscal year-end stood at
1.43.
<Cash Flows>
Cash and cash equivalents as of March 31, 2011, totaled ¥189.6
billion, a decrease of ¥91.9 billion compared with the beginning
of the fiscal year (April 1, 2010).
Net cash provided by operating activities totaled ¥174.5 billion,
reflecting income before income taxes and minority interests of
¥113.1 billion and depreciation and amortization of ¥100.1 bil-
lion, as well as outlays of ¥17.2 billion for interest expenses paid.
Net cash used in investing activities amounted to ¥162.7 bil-
lion, primarily reflecting increased expenditures for noncurrent
assets, the majority of which were investments in vessels.
Net cash used in financing activities totaled ¥100.1 billion,
which included ¥139.7 billion for repayments of long-term loans
payable.
Analysis of Financial Position
Analysis of Capital Sources and Liquidity
(Billions of yen)
−1,000
6
0
2
4
−2
3.2
5.2
2.6
−0.8
3.6
Total Assets and Return on Assets (ROA)
2,135.42,286.0
2,071.22,207.1 2,126.8
3,000
2,000
1,000
07 08 09 10 11
0
(%)
(As of March 31)
Total Assets (left scale)
ROA (right scale)
0
890.71,022.1 1,077.9 1,081.8
981.9
1.361.60
1.981.64
1.43
1,500
1,000
07 08 09 10 11
500
4.00
1.00
2.00
3.00
0
(Billions of yen)
Interest-Bearing Debt and Debt-Equity Ratio
(Times)
(As of March 31)
Interest-Bearing Debt (left scale)
Debt-Equity Ratio (right scale)
−200
0
657.0 637.9544.1
661.2 684.6
10.6
17.6
9.5
−2.9
11.7
800
600
400
07 08 09 10 11
200
20
5
0
10
15
−5
(Billions of yen)
Shareholders’ Equity and Return on Equity (ROE)
(%)
(As of March 31)
Shareholders’ Equity (left scale)
ROE (right scale)
(Billions of yen)
Cash Flows
07 08 09 10 11
86.2
150.4
62.1
174.5
97.3
146.8
29.5
137.3
−100.1
−200
200
0
−100
100
−300
−178.0 −170.2
−43.7
−162.7
Net cash provided by operating activitiesNet cash used in investing activitiesNet cash provided by financing activities
(Years ended March 31)
199.5
−292.5
Management’s Discussion and Analysis
service. As a result, NCA’s performance improved dramatically,
rebounding from the previous year’s loss to its highest profits on
record.
<Real Estate and Other Business Services>
The real estate business’ revenues and profits declined from the
previous fiscal year on lower rents and occupancy rates. In other
business services, the trading business’ revenues increased on higher
bunker oil prices. The manufacturing and processing business
recorded higher orders for shipboard and onshore work as well as
solid sales of fuel additives. As a result, other business services’
overall revenues rose and the previous year’s loss was reduced.
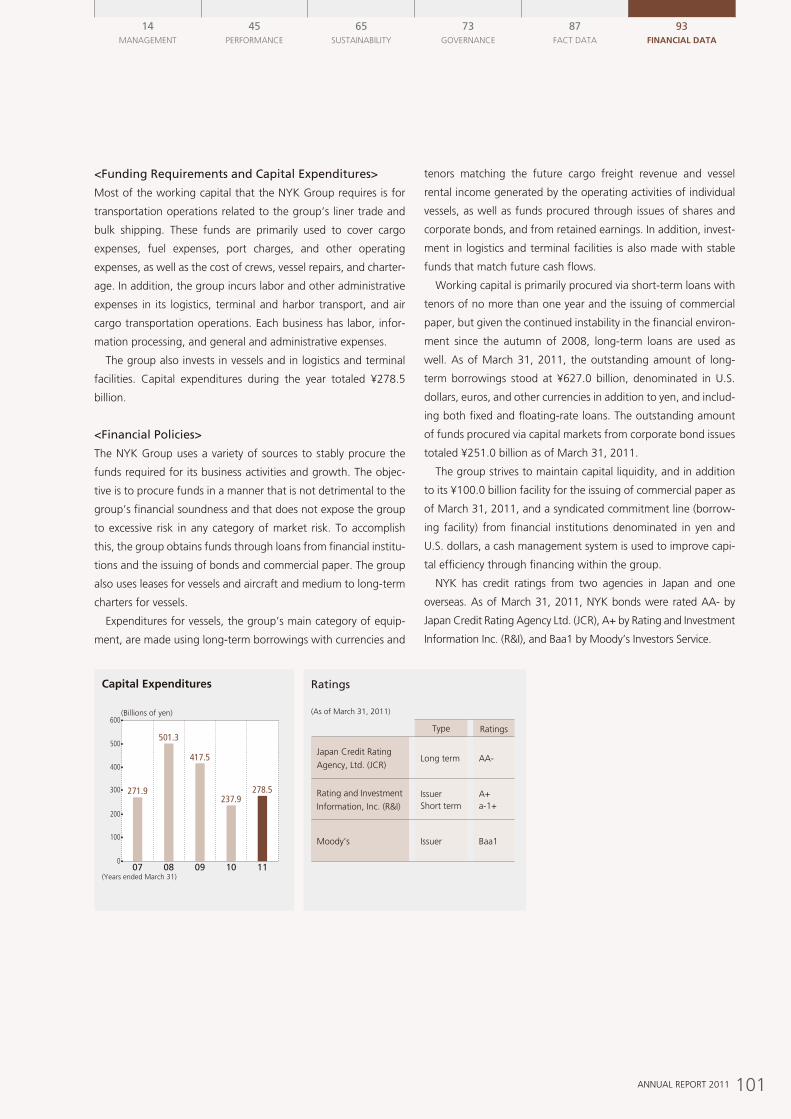
101ANNUAL REPORT 2011
14MANAGEMENT
45PERFORMANCE
65SUSTAINABILITY
73GOvERNANCE
87FACT DATA
93Financial data
(Billions of yen)
0
Capital Expenditures
271.9
501.3
417.5
237.9278.5
600
400
300
500
100
07 08 09 10 11
200
(Years ended March 31)
Ratings
(As of March 31, 2011)
Type Ratings
Japan Credit Rating
Agency, Ltd. (JCR)Long term AA-
Rating and Investment
Information, Inc. (R&I)IssuerShort term
A+a-1+
Moody’s Issuer Baa1
<Funding Requirements and Capital Expenditures>
Most of the working capital that the NYK Group requires is for
transportation operations related to the group’s liner trade and
bulk shipping. These funds are primarily used to cover cargo
expenses, fuel expenses, port charges, and other operating
expenses, as well as the cost of crews, vessel repairs, and charter-
age. In addition, the group incurs labor and other administrative
expenses in its logistics, terminal and harbor transport, and air
cargo transportation operations. Each business has labor, infor-
mation processing, and general and administrative expenses.
The group also invests in vessels and in logistics and terminal
facilities. Capital expenditures during the year totaled ¥278.5
billion.
<Financial Policies>
The NYK Group uses a variety of sources to stably procure the
funds required for its business activities and growth. The objec-
tive is to procure funds in a manner that is not detrimental to the
group’s financial soundness and that does not expose the group
to excessive risk in any category of market risk. To accomplish
this, the group obtains funds through loans from financial institu-
tions and the issuing of bonds and commercial paper. The group
also uses leases for vessels and aircraft and medium to long-term
charters for vessels.
Expenditures for vessels, the group’s main category of equip-
ment, are made using long-term borrowings with currencies and
tenors matching the future cargo freight revenue and vessel
rental income generated by the operating activities of individual
vessels, as well as funds procured through issues of shares and
corporate bonds, and from retained earnings. In addition, invest-
ment in logistics and terminal facilities is also made with stable
funds that match future cash flows.
Working capital is primarily procured via short-term loans with
tenors of no more than one year and the issuing of commercial
paper, but given the continued instability in the financial environ-
ment since the autumn of 2008, long-term loans are used as
well. As of March 31, 2011, the outstanding amount of long-
term borrowings stood at ¥627.0 billion, denominated in U.S.
dollars, euros, and other currencies in addition to yen, and includ-
ing both fixed and floating-rate loans. The outstanding amount
of funds procured via capital markets from corporate bond issues
totaled ¥251.0 billion as of March 31, 2011.
The group strives to maintain capital liquidity, and in addition
to its ¥100.0 billion facility for the issuing of commercial paper as
of March 31, 2011, and a syndicated commitment line (borrow-
ing facility) from financial institutions denominated in yen and
U.S. dollars, a cash management system is used to improve capi-
tal efficiency through financing within the group.
NYK has credit ratings from two agencies in Japan and one
overseas. As of March 31, 2011, NYK bonds were rated AA- by
Japan Credit Rating Agency Ltd. (JCR), A+ by Rating and Investment
Information Inc. (R&I), and Baa1 by Moody’s Investors Service.
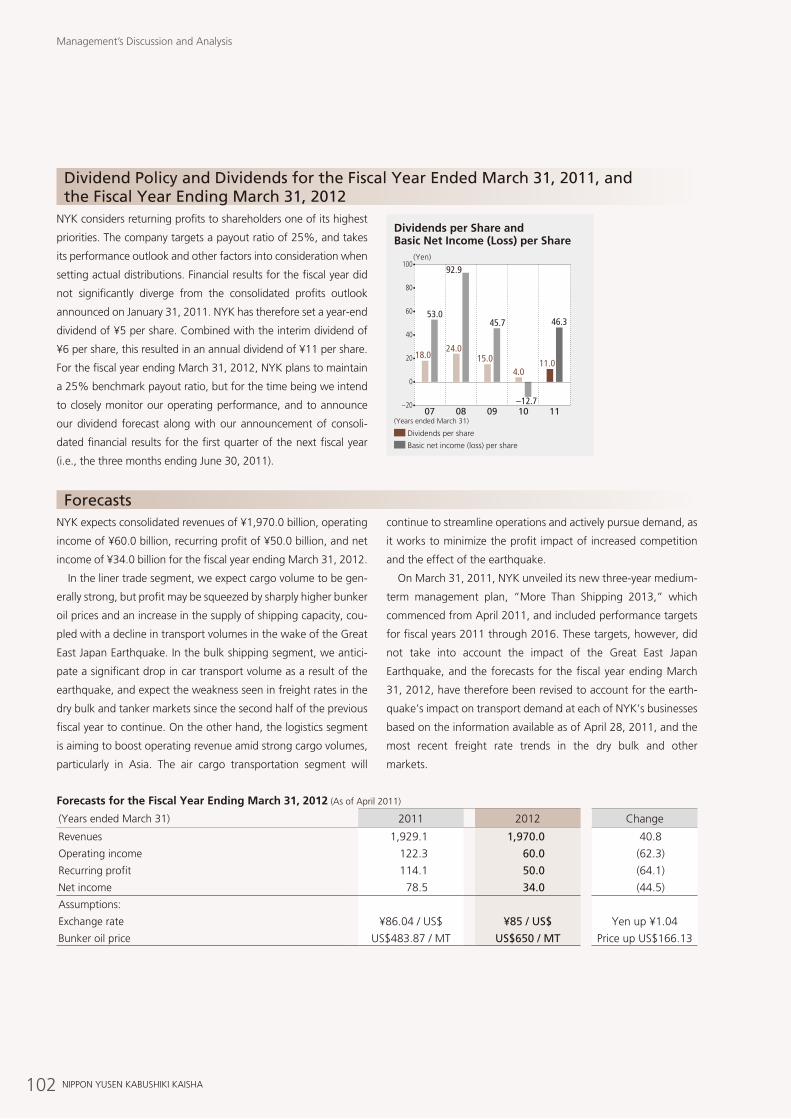
102 NIPPON YUSEN KABUSHIKI KAISHA
NYK expects consolidated revenues of ¥1,970.0 billion, operating
income of ¥60.0 billion, recurring profit of ¥50.0 billion, and net
income of ¥34.0 billion for the fiscal year ending March 31, 2012.
In the liner trade segment, we expect cargo volume to be gen-
erally strong, but profit may be squeezed by sharply higher bunker
oil prices and an increase in the supply of shipping capacity, cou-
pled with a decline in transport volumes in the wake of the Great
East Japan Earthquake. In the bulk shipping segment, we antici-
pate a significant drop in car transport volume as a result of the
earthquake, and expect the weakness seen in freight rates in the
dry bulk and tanker markets since the second half of the previous
fiscal year to continue. On the other hand, the logistics segment
is aiming to boost operating revenue amid strong cargo volumes,
particularly in Asia. The air cargo transportation segment will
continue to streamline operations and actively pursue demand, as
it works to minimize the profit impact of increased competition
and the effect of the earthquake.
On March 31, 2011, NYK unveiled its new three-year medium-
term management plan, “More Than Shipping 2013,” which
commenced from April 2011, and included performance targets
for fiscal years 2011 through 2016. These targets, however, did
not take into account the impact of the Great East Japan
Earthquake, and the forecasts for the fiscal year ending March
31, 2012, have therefore been revised to account for the earth-
quake’s impact on transport demand at each of NYK’s businesses
based on the information available as of April 28, 2011, and the
most recent freight rate trends in the dry bulk and other
markets.
Forecasts
Forecasts for the Fiscal Year Ending March 31, 2012 (As of April 2011)
(Years ended March 31) 2011 2012 Change
Revenues 1,929.1 1,970.0 40.8
Operating income 122.3 60.0 (62.3)
Recurring profit 114.1 50.0 (64.1)
Net income 78.5 34.0 (44.5)
Assumptions:
Exchange rate ¥86.04 / US$ ¥85 / US$ Yen up ¥1.04
Bunker oil price US$483.87 / MT US$650 / MT Price up US$166.13
−20
0
18.024.0
15.04.0
11.0
53.0
92.9
45.7
−12.7
46.3
100
60
80
40
20
07 08 09 10 11
(Yen)
Dividends per Share and Basic Net Income (Loss) per Share
(Years ended March 31)
Dividends per share
Basic net income (loss) per share
NYK considers returning profits to shareholders one of its highest
priorities. The company targets a payout ratio of 25%, and takes
its performance outlook and other factors into consideration when
setting actual distributions. Financial results for the fiscal year did
not significantly diverge from the consolidated profits outlook
announced on January 31, 2011. NYK has therefore set a year-end
dividend of ¥5 per share. Combined with the interim dividend of
¥6 per share, this resulted in an annual dividend of ¥11 per share.
For the fiscal year ending March 31, 2012, NYK plans to maintain
a 25% benchmark payout ratio, but for the time being we intend
to closely monitor our operating performance, and to announce
our dividend forecast along with our announcement of consoli-
dated financial results for the first quarter of the next fiscal year
(i.e., the three months ending June 30, 2011).
Dividend Policy and Dividends for the Fiscal Year Ended March 31, 2011, and the Fiscal Year Ending March 31, 2012
Management’s Discussion and Analysis
103ANNUAL REPORT 2011
Operating Risks
A wide variety of economic, political, and social factors in coun-
tries throughout the world have the potential to impact negatively
the NYK Group’s mainstay shipping and integrated logistics
operations, as well as its cruise and other businesses. Indicated
below are some of the risks that could affect the group’s operat-
ing performance, share price, and financial conditions. The items
described in the text below represent the group’s judgment of
potential future events as of March 31, 2011.
(1) a MaJOR SHiPPinG accidEntBased on the group mission statement that we contribute to the
betterment of societies throughout the world as a comprehensive
global-logistics enterprise offering ocean, land, and air transpor-
tation through safe and dependable monohakobi (transport), the
NYK Group operates and controls vessels throughout the world.
We recognize the safe operation of vessels and preservation of
the environment as our top operational imperatives. To ensure
operational safety, we have implemented our own safety man-
agement system, NAv9000, to pursue environmental management
certification. We have established the Environmental Safety
Measures Promotion Council, which is chaired by the president of
NYK, to periodically review safety measures for shipping and
other operations. This structure is designed to guarantee steady
improvements in the group’s safety levels and to ensure appropri-
ate responses in the event of an emergency. Nevertheless, a
major unforeseen accident, such as an oil spill or some other type
of environmental contamination, injury to or death of a crew
member or passenger, damage to or loss of a vessel, or a safety-
related incident such as an act of piracy or terrorism could delay
or halt cargo transport; nullify transport agreements or render
them uncollectible; result in administrative fines, lawsuits, penal-
ties, or trade restrictions; prompt higher insurance premiums; or
cause damage to the group’s reputation and relationships with
customers. The materialization of such risks or the inability to
cover them with insurance could impact the operating perfor-
mance and financial condition of the NYK Group.
(2) cHanGES in tHE OVERall SHiPPinG and FREiGHt MaRKEtS
The NYK Group endeavors to generate stable operating revenue
that is not affected by overall changes in the shipping market.
However, such factors as general economic fluctuations, a falloff
in international freight demand, increasingly severe competition,
or changes in the balance of shipping supply and demand could
cause a substantial decline in shipping revenues or vessel rental
income. Such a situation could impact the operating performance
and financial condition of the NYK Group.
Furthermore, recent imbalances in shipping supply and
demand are causing major fluctuations in freight rates. This dis-
parity between capacity and demand is forecast to continue
affecting the shipping industry in the future, which could signifi-
cantly impact the NYK Group’s revenues. The value of the NYK
Group’s vessels might also be affected.
Factors that affect shipping industry demand include the
following.
• Global and regional economic conditions
• Trends in the demand for and consumption of the energy
resources, raw materials, and products that the NYK Group
transports
• The globalization of production
• Inventory levels
• Changes in marine and other transport methods, as well as
the development of alternative methods
• International trade development, global and regional political
trends and economic conditions
• Environmental development and other legislative trends
Moreover, excess shipping capacity could affect the financial
condition and operating performance of the NYK Group.
Factors that affect shipping supply include the following.
• The number and capacities of new vessels
• Scrap prices for used vessels
• Congestion or closure of ports and canals
• The number of vessels out of service due to periodic mainte-
nance or idling
• vessel reductions owing to changes in or expanded provi-
sions for environmental legislation or other regulations that
could limit the useful life of vessels
Falling market rates for chartered freight and declines in the
value of the NYK Group’s vessels as a result of oversupply could
impact the operating performance and financial condition of the
NYK Group.
The NYK Group sources part of its fleet through the construc-
tion and ownership of new vessels. Long-term fixed costs to the
NYK Group related to new vessel construction include deprecia-
tion and amortization, interest on loans, and ship operation and
maintenance costs. Some of the vessels in the NYK Group’s fleet
are provided as long-term charter vessels, for which the group
has agreed to pay charter fees over the charter period. However,
shipping demand and freight rates can vary significantly in short
periods of time. The NYK Group places orders for the construc-
tion of new vessels or enters into long-term charter contracts
based on its forecasts of demand trends and the number of ves-
sels needed to satisfy this demand. If vessel utilization rates do
not exceed a certain level or if market freight rates fall dramati-
cally after entering into short-term agreements, the NYK Group
104 NIPPON YUSEN KABUSHIKI KAISHA
may be unable to generate revenue from transportation sufficient
to cover its costs. This situation could affect the NYK Group’s
business, operating performance, and financial position.
(3) iMPactS OF cOMPEtitiOn WitH OtHER cOMPaniES
In addition to Japanese marine transport operators, the NYK
Group competes with international shipping companies operat-
ing throughout the globe, and the competitive situation is
growing more intense. If the NYK Group becomes unable to
maintain its competitive position in any of the sectors in which it
operates, the NYK Group’s business, operating performance, and
financial condition could be affected.
(4) FlUctUatiOnS in cURREncY EXcHanGE RatESMany of the NYK Group’s operations are denominated in foreign
currencies, creating the possibility of losses resulting from
exchange rate fluctuations. To match the currencies in which it
generates revenue and pays expenses, the NYK Group conducts
hedging transactions, including foreign exchange contracts and
currency swaps, to minimize the effects of exchange rate fluctua-
tions. When preparing consolidated financial statements, the
NYK Group converts the financial statements of its overseas
consolidated subsidiaries into yen. As a result, fluctuations in
currency exchange rates could affect the operating performance
and financial condition of the NYK Group.
(5) cHanGES in FUEl PRicESThe NYK Group regularly purchases bunker oil for use as fuel for
the vessels and aircraft it uses to transport cargo throughout the
world. Bunker oil prices account for a substantial portion of the
costs the NYK Group incurs in the liner trade, bulk shipping, and
air cargo transportation businesses. Bunker oil prices and pur-
chase availability are subject to global crude oil supply and
demand, foreign exchange market fluctuations, changes involv-
ing OPEC and other crude oil producing countries, the state of
environmental legislation, competition, and changes in myriad
other factors, and forecasting the changes in all of these condi-
tions is difficult. The NYK Group seeks to minimize the impact of
such factors on its operating performance by purchasing bunker
oil from diverse regions, using derivative transactions to hedge
against fuel price fluctuations, and economizing on fuel con-
sumption. Even so, these measures have limited effect, and there
is no guarantee that they will be sufficient to protect the group
against price fluctuations and supply shortages. Furthermore,
low-sulfur fuel regulations that are slated for future expansion
and enhancement call for vessels to use fuels that are more
expensive. The NYK Group typically is unable to pass on all the
costs of bunker fuel price increases to customers through rate
hikes or fuel surcharges. Consequently, a rise in fuel costs could
affect the NYK Group’s business, operating performance, and
financial position.
(6) cHanGES in REGiOnal EcOnOMic cOnditiOnS aFFEctinG GlOBal OPERatiOnal dEVElOPMEntS
As the NYK Group’s sphere of operations includes Japan, North
America, Europe, Asia, the Middle East, and other regions, eco-
nomic conditions in each of these areas can influence the group’s
operations. We gather information ourselves and employ outside
consultants to minimize and, where possible, avoid such risks.
Nevertheless, these changes could affect the operating perfor-
mance and financial condition of the NYK Group. Some potential
risks are described below.
1. Disadvantageous political or economic factors
2. Government regulations, such as operational or investment
permissions, taxes, foreign exchange controls, monopolies, or
commercial limitations
3. Joint operations or tie-ups with other companies
4. Social upheaval, such as wars, riots, terrorist acts, piracy, infec-
tious diseases, strikes, and computer viruses
5. Earthquakes, tsunamis, typhoons, and other natural disasters
6. Difficulty in situating or managing personnel involved in inter-
national operations
7. Standards of liability that differ from those in Japan and legal
systems that are difficult to predict
These factors have the potential to negatively affect the NYK
Group’s operations in certain international markets, which in turn
could have a negative impact on the business of the NYK Group.
Through its containership business, the NYK Group is a mem-
ber of the Grand Alliance — a strategic alliance that also includes
three overseas marine transport companies. The NYK Group
considers the alliance necessary to ensure the efficiency of its
containership operations and the ability to maintain a global
network. At the same time, it is difficult to maintain the same
safety and service standards and management directions and
procedures across alliance activities, and the alliance could be
dissolved or members could withdraw from the alliance, which
presents the risk that the alliance may not deliver the anticipated
results. If it is unable to respond appropriately to such factors, the
NYK Group’s business, operating performance, and financial
condition could be affected.
The NYK Group’s business depends on having sufficient marine
crew members. High-quality crew members are particularly vital to
the safe operation of vessels. The majority of the NYK Group’s crew
members are citizens of Asian countries other than Japan, particu-
larly the Philippines. The NYK Group employs various methods to
Operating Risks
105ANNUAL REPORT 2011
14MANAGEMENT
45PERFORMANCE
65SUSTAINABILITY
73GOvERNANCE
87FACT DATA
93Financial data
secure quality crew members, such as providing education and
training and recruiting in other countries, but there is no guarantee
that the group will always be able to employ enough crew members
that have the necessary skills at an appropriate price. For instance,
for several years before the financial crisis hit, shipping demand was
high, and personnel costs for crew members skyrocketed. If the
NYK Group becomes unable to employ a sufficient number of crew
members for a reasonable price, its business, operating perfor-
mance, and financial condition could be affected. In addition,
roughly 70% of the NYK Group’s current crew members are
Philippine nationals, and war or other political factors could
adversely affect the NYK Group’s business. Furthermore, some NYK
Group employees, including crew members, belong to labor
unions. Any employee strikes, work stoppages, or acts of sabotage
could impact the NYK Group’s business, financial condition, and
operating performance. Third-party strikes or work stoppages by
employees outside the NYK Group could also impact the NYK
Group’s business, operating performance, and financial condition.
The NYK Group is affected by the risk of conflicts throughout
the world, including the Middle East. Some of the vessels the
NYK Group owns or charters operate in the Straits of Malacca
and Singapore, an area of frequent pirate attacks, and the Gulf
of Aden, the Arabian Sea, and Indian Ocean, where Somali
pirates are active. The areas in which acts of terrorism and piracy
occur are expanding, and the frequency of attacks is increasing.
Terrorist or pirate attacks, or political instability or conflict, could
impact the NYK Group’s business, operating performance, and
financial condition. The exclusion of regions in which NYK Group
vessels operate from coverage by standard war risks insurance
(certain areas are already so designated) could impact insurance
premiums and claim payments.
(7) iMPactS OF incidEntS aRiSinG dURinG SYStEM dEVElOPMEnt OR OPERatiOn
The smooth operation of its fundamental IT systems is essential to
the operations of the NYK Group. In the event that an earth-
quake, fire, or other calamity affects the stable operation of these
systems or causes them to go down, the group will make every
effort to get these systems back online promptly. However, if
these systems remain down for more than a certain period of
time, the provision of information to customers and our business
operations could be affected. Such incidents could impact the
NYK Group’s operating performance and financial condition.
(8) StROnGER lEGiSlatiOn On EnViROnMEntal PRESERVatiOn, SaFEtY, and SEcURitY
In each of the regions in which it operates, the NYK Group is
obliged to observe international law regarding the safe operation
of its vessels and the prevention of marine accidents. The group
also must comply with regional legislation and other require-
ments concerning environmental protection, import-export,
taxation, and foreign exchange.
The NYK Group recognizes the importance of environmental
preservation activities and measures to ensure the stability and
safety of its distribution supply chain, while developing and
expanding its global operations. Increasingly stringent public regu-
lations to preserve the environment include moves toward
double-hull construction, which reduces the danger of oil spills in
the event of an oil tanker collision; standards to reduce CO2, SOx,
and NOx emissions; and the use of electronically controlled engines.
The costs required to respond to increasingly stringent legislative
measures or social expectations on environmental preservation —
including the prevention of global warming, atmospheric pollution,
and the preservation of biodiversity, as well as safety and security,
could affect the operating performance and financial condition of
the NYK Group. In the event that compliance with legislation or
other regulations in certain regions becomes problematic, this situ-
ation could limit the NYK Group’s operations in that region, which
could impact the group’s operating performance.
(9) aiR caRGO tRanSPORtatiOn BUSinESSThe 747–8F aircraft that the NYK Group has ordered from Boeing
are presently scheduled for delivery in or after fiscal 2011.
However, the delivery of these 14 aircraft could be delayed,
which could result in losses for the NYK Group. Conversely, even
if these aircraft do become available, the NYK Group may not be
able to deploy all of them if the air cargo transportation market
enters a downturn. In that situation, the group could face losses
unless it takes aircraft out of service or leases or sells them.
As with its marine transport business, the NYK Group’s air
cargo transportation business faces various potential risks, out-
lined below. These factors could impact the NYK Group’s
operating performance and financial condition.
• Aircraft accidents
• The promotion of environmental legislation or other regulations
• A downturn in air freight rates owing to increasingly stringent
competition or a drop-off in demand
• Fluctuations in aircraft fuel prices
• Currency exchange fluctuations
• Insufficient insurance coverage
• Takeoff / landing slots granted by legislation or competent
authorities
• IT system malfunctions
• Fixed-cost inflexibility
• Acts of terrorism, political unrest, and natural disaster
106 NIPPON YUSEN KABUSHIKI KAISHA
(10) RElatiOnS WitH BUSinESS PaRtnERSThe NYK Group’s Dry Bulk Carrier Division and Tanker Division
place importance on long-term contracts with business partners,
particularly for large vessels. These long-term agreements help
stabilize the group’s business in the face of market fluctuations
by fixing freight rates, carrying volumes, and rate adjustment
conditions. If business conditions for some of the business part-
ners with which the NYK Group maintains long-term agreements
were to deteriorate, these business partners may become unable
to continue fulfilling all terms of the agreements that are in place.
Furthermore, the NYK Group may find itself unable to procure
third-party charter vessels that would enable it to fulfill the terms
of the long-term agreements it has made. If charter companies
become unable to fulfill the terms of their agreements with the
NYK Group before their charter period has ended, the NYK
Group could suffer losses due to an inability to procure alterna-
tive vessels. Such circumstances could impact the NYK Group’s
business, operating performance, and financial condition. Also,
although long-term agreements provide some insulation against
market fluctuations, in an upward-trending market the NYK
Group may become unable to pass on rising market prices imme-
diately by demanding higher freight rates.
Important business partners of the NYK Group include leading
Japanese automakers, paper manufacturers, electronics manu-
facturers, steelmakers, and public utilities, as well as U.S.-based
retailers. The scale of its transactions with important business
partners could shrink, or the NYK Group could lose an important
business partner. Such a situation could impact the NYK Group’s
financial condition.
(11) OPERatiOnal REStRUctURinGThe NYK Group has restructured its operations when necessary.
Future operational restructuring activities, if implemented, could
affect the operating performance and financial condition of the
NYK Group.
(12) MEdiUM-tERM ManaGEMEnt PlanIn March 2011 the NYK Group formulated “More Than Shipping
2013,” a new three-year medium-term management plan.
Nevertheless, progress under this medium-term management
plan could be affected by a variety of factors, and the plan’s
achievement is not necessarily guaranteed.
(13) inVEStMEnt PlanSAlthough the NYK Group’s plans include investment in the
expansion of its fleet of vessels and aircraft, fluctuations including
market conditions and government regulations could prevent
these plans from progressing as initially intended. Such changes
could affect the operating performance and financial condition
of the NYK Group.
The NYK Group spends a substantial amount of money on
capital investments in new vessels. Large-scale shipbuilding plans
are subject to delays and may be affected by shipyard labor dis-
putes, management difficulties, or other factors that affect the
shipyard itself. Cargo transport demand could slacken just as new
vessels are delivered, or demand could increase while vessel
delivery is delayed beyond expected dates. Such situations could
impact the business, operating performance, and financial condi-
tion of the NYK Group.
(14) FlUctUatiOnS in intERESt RatESTo meet funding requirements for capital investment, such as in
vessels, aircraft, and transportation-related facilities, and for
working capital, the NYK Group uses internal funds as well as
funds procured from external sources. Currently, a portion of the
external funds are procured at floating interest rates. The group
seeks to minimize the effect of interest rate changes by moving
toward fixed interest rates on the basis of its assumptions about
the interest rate environment. However, certain changes in inter-
est rates could impact the operating performance and financial
condition of the NYK Group, and affect the future cost of procur-
ing funds.
(15) diSPOSal OF VESSElSChanges in shipping supply and demand conditions, as well as
technical developments and advances, cause physical limitations
on the use of vessels as they become outdated or no longer
comply with safety and other legal requirements. In such cases,
the NYK Group may dispose of its vessels or aircraft, or cancel
certain charter contracts for vessels to be chartered. Such activi-
ties could affect the operating performance and financial
condition of the NYK Group.
The NYK Group typically sells fully depreciated vessels and air-
craft. However, there is no guarantee that the NYK Group will be
able to sell such vessels and aircraft under attractive conditions
or, indeed, be able to sell them at all. The group also may face a
growing need to sell superannuated vessels or aircraft during
times of economic stagnation or when market prices on vessels
and aircraft are falling. If the NYK Group were compelled to sell
vessels or aircraft that were not fully depreciated for prices below
their book values, it could be forced to record a loss on their sale
and retirement. Furthermore, if markets fail to recover from their
current malaise or deteriorate further, the group may suffer valu-
ation losses on its vessels, aircraft, and other assets.
Operating Risks
107ANNUAL REPORT 2011
14MANAGEMENT
45PERFORMANCE
65SUSTAINABILITY
73GOvERNANCE
87FACT DATA
93Financial data
(16) ValUatiOn lOSSES On inVEStMEnt SEcURitiESThe NYK Group uses the current value method to evaluate its
holdings of investment securities that have explicit market values,
taking as the market value the average market price during the
one-month period preceding the end of the fiscal year. As a
result, changes in stock market conditions could affect the oper-
ating performance and financial condition of the NYK Group.
(17) REtiREMEnt BEnEFitS PlanThe NYK Group’s defined benefit plans include a defined benefit
pension plan law, a qualified retirement benefits plan, an
employees’ pension fund plan, and a temporary retirement fund
plan. Legally, the NYK Group was required to change from a
defined benefit pension plan law to a different type of plan by
the end of March 2012. As of April 1, 2007, a defined benefit
pension plan law is applied. Changes in the pension plan, the
investment of pension assets, or the assumptions underlying the
accounting for retirement benefits could affect the operating
performance and financial condition of the NYK Group.
(18) EValUatiOn OF PROSPEctS FOR REcOVERY OF dEFERREd taX aSSEtS
The NYK Group performs an evaluation based on estimated
future taxable income to determine the likelihood of recovering
deferred tax assets. If we decide that part of or all deferred tax
assets cannot be recovered because of a decline in estimated
future taxable income or a revision in a nation’s tax system,
including a change in the statutory tax rate, we will reduce
deferred tax assets and post a corresponding expense for taxes in
the fiscal period when this decision was made.
These expenses could affect the operating performance and
financial condition of the NYK Group.
(19) litiGatiOnThe NYK Group is engaged in the ocean cargo transport, global
logistics, cruise, air cargo transportation and other businesses.
There is a risk of litigation concerning all of these business activi-
ties. Depending on the outcome, litigation could affect the
operating performance and financial condition of the NYK
Group. Two examples of ongoing litigation are provided below.
1. Nippon Cargo Airlines Co. Ltd.
Major airline companies around the world are being investi-
gated by South Korean authorities as part of a probe into
price-cartel activity regarding air cargo transport services, and
NYK Group consolidated subsidiary Nippon Cargo Airlines Co.
Ltd. (NCA), is cooperating with these investigations.
NCA had been served with a written notification from the
Korea Fair Trade Commission (KFTC) that a fine was to be
imposed for violations of Korea’s Monopoly Regulation and Fair
Trade Act. After carefully reviewing the contents and considering
its response to the KFTC’s notification, NCA determined that it
could not accept the finding of the KFTC, and in December 2010
filed a lawsuit against the KFTC with the Seoul High Court in
Korea seeking to have the KFTC’s decision reversed.
In the United States, NCA is a defendant in a class action law-
suit demanding an unspecified payment to compensate for
damages caused by an alleged price-fixing cartel. As it is difficult
to reasonably estimate the outcome of this lawsuit, no provision
has been set aside.
2. Yusen Logistics Co. Ltd. (former name: Yusen Air & Sea
Service Co. Ltd.)
In April 2008, the Japan Fair Trade Commission began investi-
gating consolidated subsidiary Yusen Logistics Co. Ltd. (YLK) and
other major users in Japan of international air cargo services for
alleged violations of the Anti-Monopoly Act involving freight
rates and fuel surcharges. In March 2009, the commission issued
a cease-and-desist order and surcharge payment order. Following
an examination and confirmation of these orders and the careful
consideration of a response, YLK concluded that these orders
cannot be accepted. Consequently, the board of directors of YLK
approved a resolution at an extraordinary meeting held in April
2009 to file an application with the Fair Trade Commission to
initiate a hearing regarding this matter. In July 2009, the com-
pany received notice concerning the initiation of hearing
procedures. The hearing procedures concluded on the date of
the sixth hearing (July 2, 2010), but as of March 31, 2011, a
decision had yet to be rendered.
Despite taking this action, as of March 31, 2011, YLK had
established an anti-monopoly law allowance equal to the sur-
charge that the Japan Fair Trade Commission has ordered this
company to pay.
The specific items described above are some of the ongoing
risks that the NYK Group faces in its everyday operations, and are
not intended to encompass all potential risks.
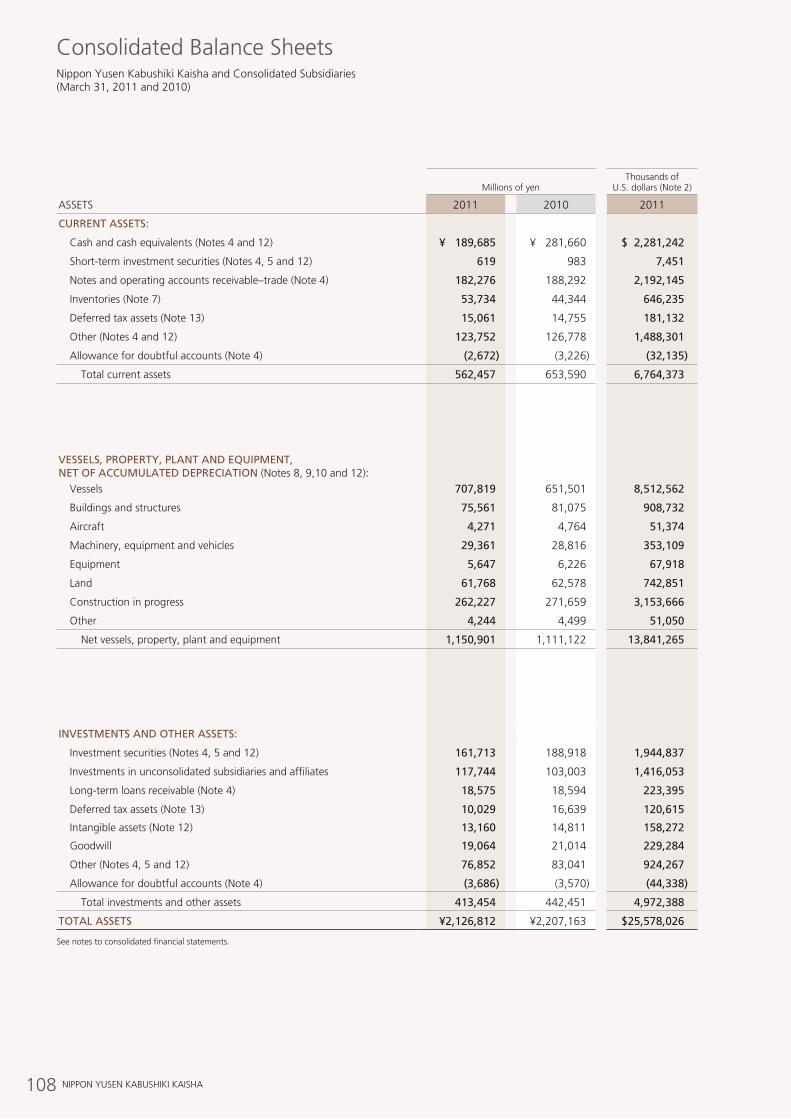
108 NIPPON YUSEN KABUSHIKI KAISHA
Consolidated Balance Sheets
Millions of yen
Thousands of U.S. dollars (Note 2)
ASSETS 2011 2010 2011
CURRENT ASSETS:
Cash and cash equivalents (Notes 4 and 12) ¥ 189,685 ¥ 281,660 $ 2,281,242
Short-term investment securities (Notes 4, 5 and 12) 619 983 7,451
Notes and operating accounts receivable–trade (Note 4) 182,276 188,292 2,192,145
Inventories (Note 7) 53,734 44,344 646,235
Deferred tax assets (Note 13) 15,061 14,755 181,132
Other (Notes 4 and 12) 123,752 126,778 1,488,301
Allowance for doubtful accounts (Note 4) (2,672) (3,226) (32,135)
Total current assets 562,457 653,590 6,764,373
VESSELS, PROPERTY, PLANT AND EQUIPMENT, NET OF ACCUMULATED DEPRECIATION (Notes 8, 9,10 and 12): vessels 707,819 651,501 8,512,562
Buildings and structures 75,561 81,075 908,732
Aircraft 4,271 4,764 51,374
Machinery, equipment and vehicles 29,361 28,816 353,109
Equipment 5,647 6,226 67,918
Land 61,768 62,578 742,851
Construction in progress 262,227 271,659 3,153,666
Other 4,244 4,499 51,050
Net vessels, property, plant and equipment 1,150,901 1,111,122 13,841,265
INVESTMENTS AND OTHER ASSETS:
Investment securities (Notes 4, 5 and 12) 161,713 188,918 1,944,837
Investments in unconsolidated subsidiaries and affiliates 117,744 103,003 1,416,053
Long-term loans receivable (Note 4) 18,575 18,594 223,395
Deferred tax assets (Note 13) 10,029 16,639 120,615
Intangible assets (Note 12) 13,160 14,811 158,272
Goodwill 19,064 21,014 229,284
Other (Notes 4, 5 and 12) 76,852 83,041 924,267
Allowance for doubtful accounts (Note 4) (3,686) (3,570) (44,338)
Total investments and other assets 413,454 442,451 4,972,388
TOTAL ASSETS ¥2,126,812 ¥2,207,163 $25,578,026
See notes to consolidated financial statements.
Nippon Yusen Kabushiki Kaisha and Consolidated Subsidiaries(March 31, 2011 and 2010)
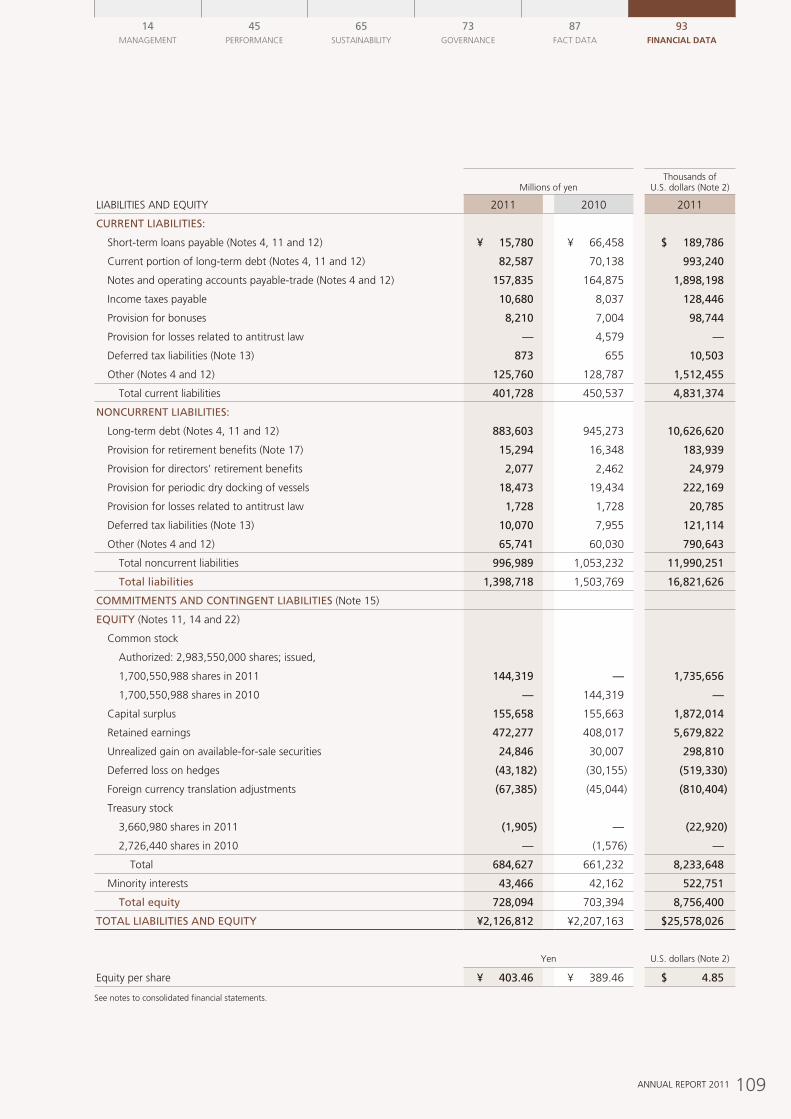
109ANNUAL REPORT 2011
14MANAGEMENT
45PERFORMANCE
65SUSTAINABILITY
73GOvERNANCE
87FACT DATA
93Financial data
Millions of yen
Thousands of U.S. dollars (Note 2)
LIABILITIES AND EQUITY 2011 2010 2011
CURRENT LIABILITIES:
Short-term loans payable (Notes 4, 11 and 12) ¥ 15,780 ¥ 66,458 $ 189,786
Current portion of long-term debt (Notes 4, 11 and 12) 82,587 70,138 993,240
Notes and operating accounts payable-trade (Notes 4 and 12) 157,835 164,875 1,898,198
Income taxes payable 10,680 8,037 128,446
Provision for bonuses 8,210 7,004 98,744
Provision for losses related to antitrust law — 4,579 —
Deferred tax liabilities (Note 13) 873 655 10,503
Other (Notes 4 and 12) 125,760 128,787 1,512,455
Total current liabilities 401,728 450,537 4,831,374
NONCURRENT LIABILITIES:
Long-term debt (Notes 4, 11 and 12) 883,603 945,273 10,626,620
Provision for retirement benefits (Note 17) 15,294 16,348 183,939
Provision for directors’ retirement benefits 2,077 2,462 24,979
Provision for periodic dry docking of vessels 18,473 19,434 222,169
Provision for losses related to antitrust law 1,728 1,728 20,785
Deferred tax liabilities (Note 13) 10,070 7,955 121,114
Other (Notes 4 and 12) 65,741 60,030 790,643
Total noncurrent liabilities 996,989 1,053,232 11,990,251
Total liabilities 1,398,718 1,503,769 16,821,626
COMMITMENTS AND CONTINGENT LIABILITIES (Note 15)
EQUITY (Notes 11, 14 and 22)
Common stock
Authorized: 2,983,550,000 shares; issued,
1,700,550,988 shares in 2011 144,319 — 1,735,656
1,700,550,988 shares in 2010 — 144,319 —
Capital surplus 155,658 155,663 1,872,014
Retained earnings 472,277 408,017 5,679,822
Unrealized gain on available-for-sale securities 24,846 30,007 298,810
Deferred loss on hedges (43,182) (30,155) (519,330)
Foreign currency translation adjustments (67,385) (45,044) (810,404)
Treasury stock
3,660,980 shares in 2011 (1,905) — (22,920)
2,726,440 shares in 2010 — (1,576) —
Total 684,627 661,232 8,233,648
Minority interests 43,466 42,162 522,751
Total equity 728,094 703,394 8,756,400
TOTAL LIABILITIES AND EQUITY ¥2,126,812 ¥2,207,163 $25,578,026
Yen U.S. dollars (Note 2)
Equity per share ¥ 403.46 ¥ 389.46 $ 4.85
See notes to consolidated financial statements.
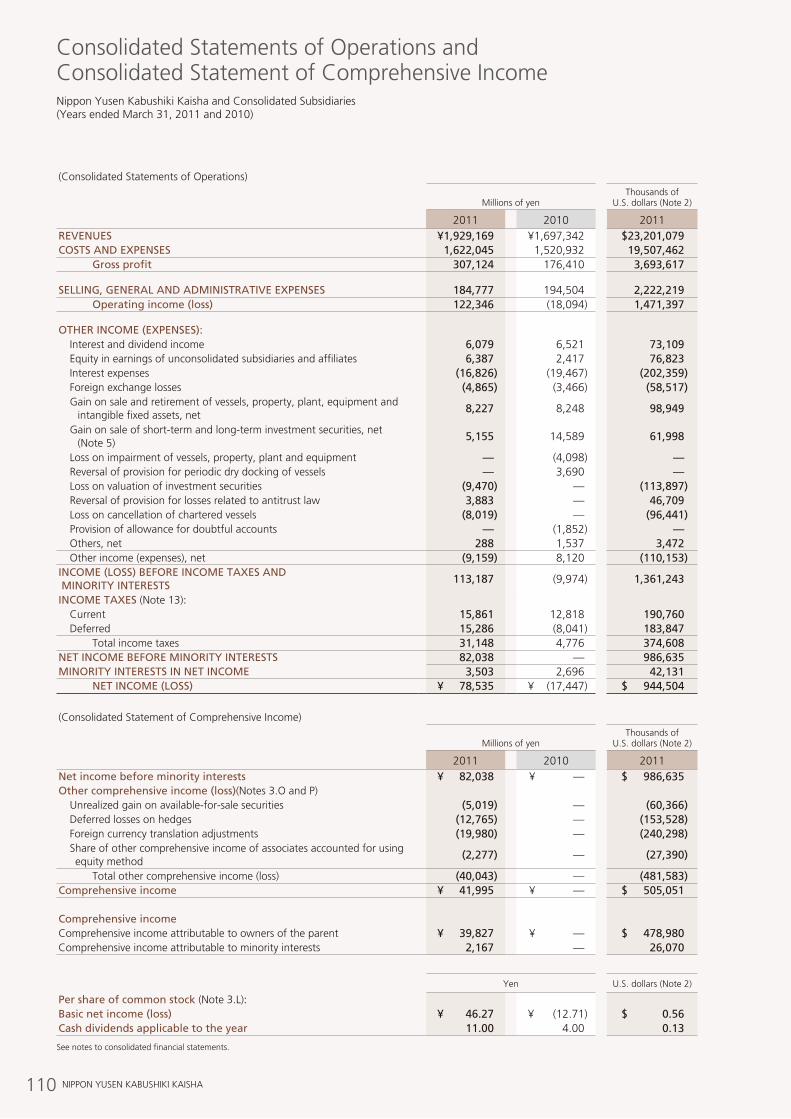
110 NIPPON YUSEN KABUSHIKI KAISHA
(Consolidated Statements of Operations)
Millions of yenThousands of
U.S. dollars (Note 2)
2011 2010 2011REVENUES ¥1,929,169 ¥1,697,342 $23,201,079COSTS AND EXPENSES 1,622,045 1,520,932 19,507,462 Gross profit 307,124 176,410 3,693,617
SELLING, GENERAL AND ADMINISTRATIVE EXPENSES 184,777 194,504 2,222,219 Operating income (loss) 122,346 (18,094) 1,471,397
OTHER INCOME (EXPENSES): Interest and dividend income 6,079 6,521 73,109 Equity in earnings of unconsolidated subsidiaries and affiliates 6,387 2,417 76,823 Interest expenses (16,826) (19,467) (202,359) Foreign exchange losses (4,865) (3,466) (58,517) G ain on sale and retirement of vessels, property, plant, equipment and
intangible fixed assets, net8,227 8,248 98,949
G ain on sale of short-term and long-term investment securities, net (Note 5)
5,155 14,589 61,998
Loss on impairment of vessels, property, plant and equipment — (4,098) — Reversal of provision for periodic dry docking of vessels — 3,690 — Loss on valuation of investment securities (9,470) — (113,897) Reversal of provision for losses related to antitrust law 3,883 — 46,709 Loss on cancellation of chartered vessels (8,019) — (96,441) Provision of allowance for doubtful accounts — (1,852) — Others, net 288 1,537 3,472 Other income (expenses), net (9,159) 8,120 (110,153)INCOME (LOSS) BEFORE INCOME TAXES AND MINORITY INTERESTS
113,187 (9,974) 1,361,243
INCOME TAXES (Note 13): Current 15,861 12,818 190,760 Deferred 15,286 (8,041) 183,847 Total income taxes 31,148 4,776 374,608NET INCOME BEFORE MINORITY INTERESTS 82,038 — 986,635MINORITY INTERESTS IN NET INCOME 3,503 2,696 42,131 NET INCOME (LOSS) ¥ 78,535 ¥ (17,447) $ 944,504
(Consolidated Statement of Comprehensive Income)
Millions of yenThousands of
U.S. dollars (Note 2)
2011 2010 2011Net income before minority interests ¥ 82,038 ¥ — $ 986,635Other comprehensive income (loss)(Notes 3.O and P) Unrealized gain on available-for-sale securities (5,019) — (60,366) Deferred losses on hedges (12,765) — (153,528) Foreign currency translation adjustments (19,980) — (240,298) S hare of other comprehensive income of associates accounted for using
equity method(2,277) — (27,390)
Total other comprehensive income (loss) (40,043) — (481,583)Comprehensive income ¥ 41,995 ¥ — $ 505,051
Comprehensive incomeComprehensive income attributable to owners of the parent ¥ 39,827 ¥ — $ 478,980Comprehensive income attributable to minority interests 2,167 — 26,070
Yen U.S. dollars (Note 2)
Per share of common stock (Note 3.L):Basic net income (loss) ¥ 46.27 ¥ (12.71) $ 0.56Cash dividends applicable to the year 11.00 4.00 0.13
See notes to consolidated financial statements.
Consolidated Statements of Operations and Consolidated Statement of Comprehensive IncomeNippon Yusen Kabushiki Kaisha and Consolidated Subsidiaries(Years ended March 31, 2011 and 2010)
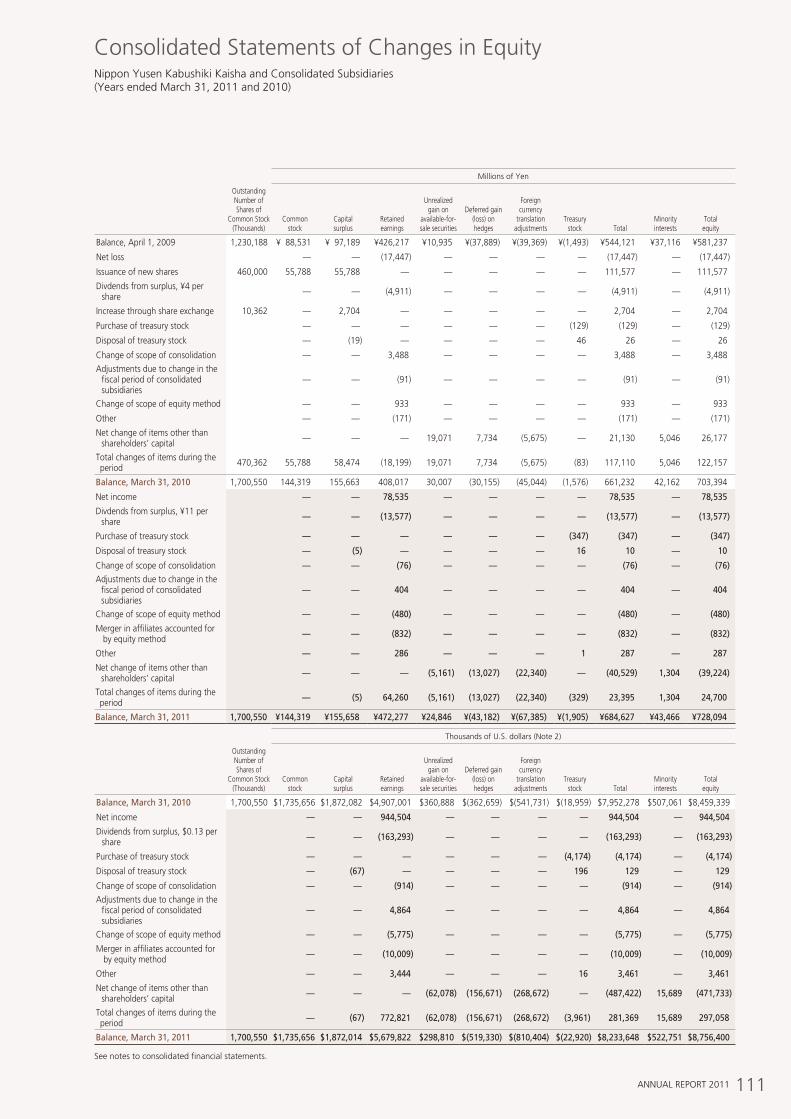
111ANNUAL REPORT 2011
Millions of Yen
Outstanding Number of Shares of
Common Stock (Thousands)
Common stock
Capital surplus
Retained earnings
Unrealized gain on
available-for-sale securities
Deferred gain (loss) on hedges
Foreign currency
translation adjustments
Treasury stock Total
Minority interests
Total equity
Balance, April 1, 2009 1,230,188 ¥ 88,531 ¥ 97,189 ¥426,217 ¥10,935 ¥(37,889) ¥(39,369) ¥(1,493) ¥544,121 ¥37,116 ¥581,237
Net loss — — (17,447) — — — — (17,447) — (17,447)
Issuance of new shares 460,000 55,788 55,788 — — — — — 111,577 — 111,577
D ivdends from surplus, ¥4 per share — — (4,911) — — — — (4,911) — (4,911)
Increase through share exchange 10,362 — 2,704 — — — — — 2,704 — 2,704
Purchase of treasury stock — — — — — — (129) (129) — (129)
Disposal of treasury stock — (19) — — — — 46 26 — 26
Change of scope of consolidation — — 3,488 — — — — 3,488 — 3,488
A djustments due to change in the fiscal period of consolidated subsidiaries
— — (91) — — — — (91) — (91)
Change of scope of equity method — — 933 — — — — 933 — 933
Other — — (171) — — — — (171) — (171)
N et change of items other than shareholders’ capital — — — 19,071 7,734 (5,675) — 21,130 5,046 26,177
T otal changes of items during the period 470,362 55,788 58,474 (18,199) 19,071 7,734 (5,675) (83) 117,110 5,046 122,157
Balance, March 31, 2010 1,700,550 144,319 155,663 408,017 30,007 (30,155) (45,044) (1,576) 661,232 42,162 703,394
Net income — — 78,535 — — — — 78,535 — 78,535
D ivdends from surplus, ¥11 per share — — (13,577) — — — — (13,577) — (13,577)
Purchase of treasury stock — — — — — — (347) (347) — (347)
Disposal of treasury stock — (5) — — — — 16 10 — 10
Change of scope of consolidation — — (76) — — — — (76) — (76)A djustments due to change in the
fiscal period of consolidated subsidiaries
— — 404 — — — — 404 — 404
Change of scope of equity method — — (480) — — — — (480) — (480)
M erger in affiliates accounted for by equity method — — (832) — — — — (832) — (832)
Other — — 286 — — — 1 287 — 287
N et change of items other than shareholders’ capital — — — (5,161) (13,027) (22,340) — (40,529) 1,304 (39,224)
T otal changes of items during the period — (5) 64,260 (5,161) (13,027) (22,340) (329) 23,395 1,304 24,700
Balance, March 31, 2011 1,700,550 ¥144,319 ¥155,658 ¥472,277 ¥24,846 ¥(43,182) ¥(67,385) ¥(1,905) ¥684,627 ¥43,466 ¥728,094
Thousands of U.S. dollars (Note 2)
Outstanding Number of Shares of
Common Stock (Thousands)
Common stock
Capital surplus
Retained earnings
Unrealized gain on
available-for-sale securities
Deferred gain (loss) on hedges
Foreign currency
translation adjustments
Treasury stock Total
Minority interests
Total equity
Balance, March 31, 2010 1,700,550 $1,735,656 $1,872,082 $4,907,001 $360,888 $(362,659) $(541,731) $(18,959) $7,952,278 $507,061 $8,459,339
Net income — — 944,504 — — — — 944,504 — 944,504
D ividends from surplus, $0.13 per share — — (163,293) — — — — (163,293) — (163,293)
Purchase of treasury stock — — — — — — (4,174) (4,174) — (4,174)
Disposal of treasury stock — (67) — — — — 196 129 — 129
Change of scope of consolidation — — (914) — — — — (914) — (914)A djustments due to change in the
fiscal period of consolidated subsidiaries
— — 4,864 — — — — 4,864 — 4,864
Change of scope of equity method — — (5,775) — — — — (5,775) — (5,775)
M erger in affiliates accounted for by equity method — — (10,009) — — — — (10,009) — (10,009)
Other — — 3,444 — — — 16 3,461 — 3,461
N et change of items other than shareholders’ capital — — — (62,078) (156,671) (268,672) — (487,422) 15,689 (471,733)
T otal changes of items during the period — (67) 772,821 (62,078) (156,671) (268,672) (3,961) 281,369 15,689 297,058
Balance, March 31, 2011 1,700,550 $1,735,656 $1,872,014 $5,679,822 $298,810 $(519,330) $(810,404) $(22,920) $8,233,648 $522,751 $8,756,400
See notes to consolidated financial statements.
Consolidated Statements of Changes in EquityNippon Yusen Kabushiki Kaisha and Consolidated Subsidiaries(Years ended March 31, 2011 and 2010)
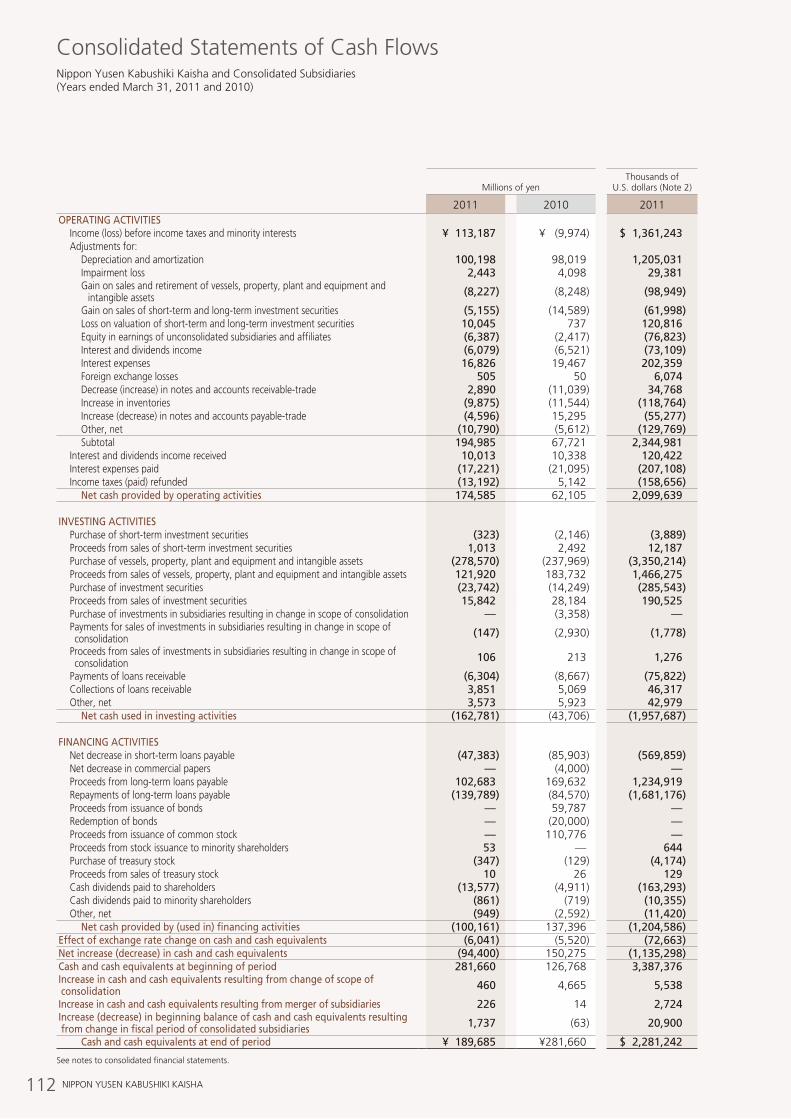
112 NIPPON YUSEN KABUSHIKI KAISHA
Consolidated Statements of Cash Flows
Millions of yen
Thousands of U.S. dollars (Note 2)
2011 2010 2011OPERATING ACTIVITIES Income (loss) before income taxes and minority interests ¥ 113,187 ¥ (9,974) $ 1,361,243 Adjustments for: Depreciation and amortization 100,198 98,019 1,205,031 Impairment loss 2,443 4,098 29,381 G ain on sales and retirement of vessels, property, plant and equipment and
intangible assets (8,227) (8,248) (98,949)
Gain on sales of short-term and long-term investment securities (5,155) (14,589) (61,998) Loss on valuation of short-term and long-term investment securities 10,045 737 120,816 Equity in earnings of unconsolidated subsidiaries and affiliates (6,387) (2,417) (76,823) Interest and dividends income (6,079) (6,521) (73,109) Interest expenses 16,826 19,467 202,359 Foreign exchange losses 505 50 6,074 Decrease (increase) in notes and accounts receivable-trade 2,890 (11,039) 34,768 Increase in inventories (9,875) (11,544) (118,764) Increase (decrease) in notes and accounts payable-trade (4,596) 15,295 (55,277) Other, net (10,790) (5,612) (129,769) Subtotal 194,985 67,721 2,344,981 Interest and dividends income received 10,013 10,338 120,422 Interest expenses paid (17,221) (21,095) (207,108) Income taxes (paid) refunded (13,192) 5,142 (158,656) Net cash provided by operating activities 174,585 62,105 2,099,639
INVESTING ACTIVITIES Purchase of short-term investment securities (323) (2,146) (3,889) Proceeds from sales of short-term investment securities 1,013 2,492 12,187 Purchase of vessels, property, plant and equipment and intangible assets (278,570) (237,969) (3,350,214) Proceeds from sales of vessels, property, plant and equipment and intangible assets 121,920 183,732 1,466,275 Purchase of investment securities (23,742) (14,249) (285,543) Proceeds from sales of investment securities 15,842 28,184 190,525 Purchase of investments in subsidiaries resulting in change in scope of consolidation — (3,358) — P ayments for sales of investments in subsidiaries resulting in change in scope of
consolidation (147) (2,930) (1,778)
P roceeds from sales of investments in subsidiaries resulting in change in scope of consolidation 106 213 1,276
Payments of loans receivable (6,304) (8,667) (75,822) Collections of loans receivable 3,851 5,069 46,317 Other, net 3,573 5,923 42,979 Net cash used in investing activities (162,781) (43,706) (1,957,687)
FINANCING ACTIVITIES Net decrease in short-term loans payable (47,383) (85,903) (569,859) Net decrease in commercial papers — (4,000) — Proceeds from long-term loans payable 102,683 169,632 1,234,919 Repayments of long-term loans payable (139,789) (84,570) (1,681,176) Proceeds from issuance of bonds — 59,787 — Redemption of bonds — (20,000) — Proceeds from issuance of common stock — 110,776 — Proceeds from stock issuance to minority shareholders 53 — 644 Purchase of treasury stock (347) (129) (4,174) Proceeds from sales of treasury stock 10 26 129 Cash dividends paid to shareholders (13,577) (4,911) (163,293) Cash dividends paid to minority shareholders (861) (719) (10,355) Other, net (949) (2,592) (11,420) Net cash provided by (used in) financing activities (100,161) 137,396 (1,204,586)Effect of exchange rate change on cash and cash equivalents (6,041) (5,520) (72,663)Net increase (decrease) in cash and cash equivalents (94,400) 150,275 (1,135,298)Cash and cash equivalents at beginning of period 281,660 126,768 3,387,376Increase in cash and cash equivalents resulting from change of scope of consolidation 460 4,665 5,538
Increase in cash and cash equivalents resulting from merger of subsidiaries 226 14 2,724I ncrease (decrease) in beginning balance of cash and cash equivalents resulting from change in fiscal period of consolidated subsidiaries 1,737 (63) 20,900
Cash and cash equivalents at end of period ¥ 189,685 ¥281,660 $ 2,281,242
See notes to consolidated financial statements.
Nippon Yusen Kabushiki Kaisha and Consolidated Subsidiaries(Years ended March 31, 2011 and 2010)
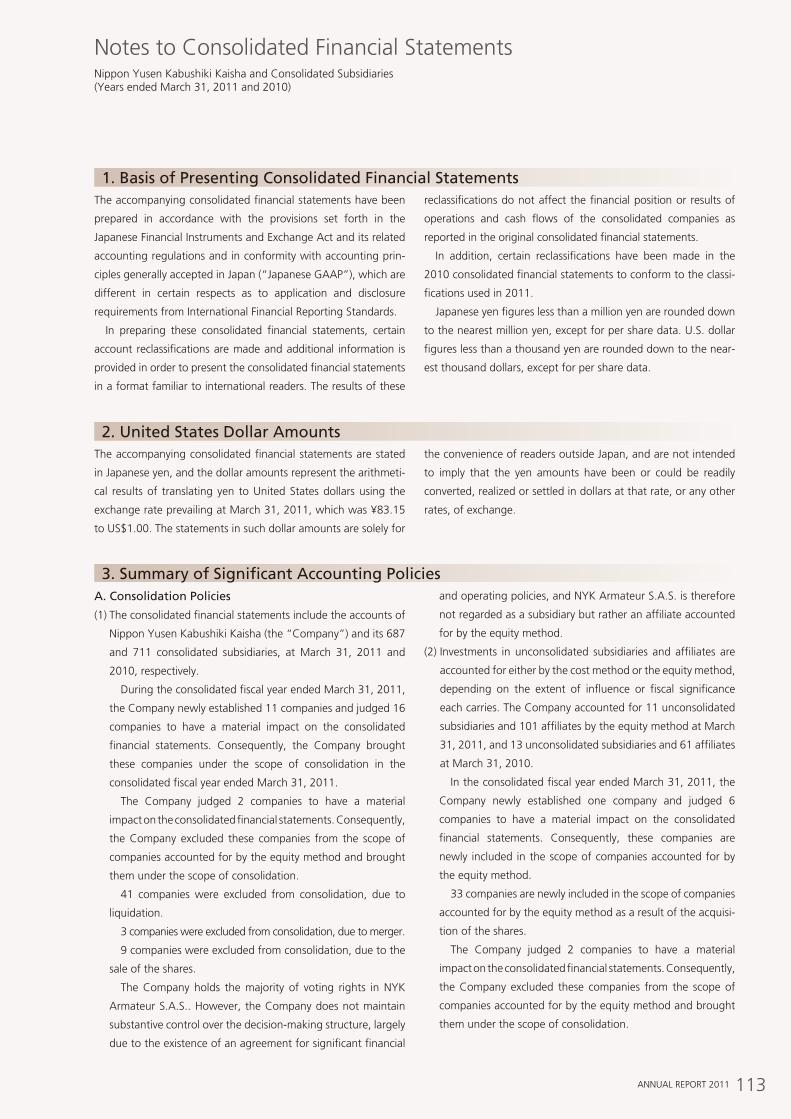
113ANNUAL REPORT 2011
Notes to Consolidated Financial StatementsNippon Yusen Kabushiki Kaisha and Consolidated Subsidiaries(Years ended March 31, 2011 and 2010)
The accompanying consolidated financial statements have been
prepared in accordance with the provisions set forth in the
Japanese Financial Instruments and Exchange Act and its related
accounting regulations and in conformity with accounting prin-
ciples generally accepted in Japan (“Japanese GAAP”), which are
different in certain respects as to application and disclosure
requirements from International Financial Reporting Standards.
In preparing these consolidated financial statements, certain
account reclassifications are made and additional information is
provided in order to present the consolidated financial statements
in a format familiar to international readers. The results of these
reclassifications do not affect the financial position or results of
operations and cash flows of the consolidated companies as
reported in the original consolidated financial statements.
In addition, certain reclassifications have been made in the
2010 consolidated financial statements to conform to the classi-
fications used in 2011.
Japanese yen figures less than a million yen are rounded down
to the nearest million yen, except for per share data. U.S. dollar
figures less than a thousand yen are rounded down to the near-
est thousand dollars, except for per share data.
The accompanying consolidated financial statements are stated
in Japanese yen, and the dollar amounts represent the arithmeti-
cal results of translating yen to United States dollars using the
exchange rate prevailing at March 31, 2011, which was ¥83.15
to US$1.00. The statements in such dollar amounts are solely for
the convenience of readers outside Japan, and are not intended
to imply that the yen amounts have been or could be readily
converted, realized or settled in dollars at that rate, or any other
rates, of exchange.
A. Consolidation Policies
(1) The consolidated financial statements include the accounts of
Nippon Yusen Kabushiki Kaisha (the “Company”) and its 687
and 711 consolidated subsidiaries, at March 31, 2011 and
2010, respectively.
During the consolidated fiscal year ended March 31, 2011,
the Company newly established 11 companies and judged 16
companies to have a material impact on the consolidated
financial statements. Consequently, the Company brought
these companies under the scope of consolidation in the
consolidated fiscal year ended March 31, 2011.
The Company judged 2 companies to have a material
impact on the consolidated financial statements. Consequently,
the Company excluded these companies from the scope of
companies accounted for by the equity method and brought
them under the scope of consolidation.
41 companies were excluded from consolidation, due to
liquidation.
3 companies were excluded from consolidation, due to merger.
9 companies were excluded from consolidation, due to the
sale of the shares.
The Company holds the majority of voting rights in NYK
Armateur S.A.S.. However, the Company does not maintain
substantive control over the decision-making structure, largely
due to the existence of an agreement for significant financial
and operating policies, and NYK Armateur S.A.S. is therefore
not regarded as a subsidiary but rather an affiliate accounted
for by the equity method.
(2) Investments in unconsolidated subsidiaries and affiliates are
accounted for either by the cost method or the equity method,
depending on the extent of influence or fiscal significance
each carries. The Company accounted for 11 unconsolidated
subsidiaries and 101 affiliates by the equity method at March
31, 2011, and 13 unconsolidated subsidiaries and 61 affiliates
at March 31, 2010.
In the consolidated fiscal year ended March 31, 2011, the
Company newly established one company and judged 6
companies to have a material impact on the consolidated
financial statements. Consequently, these companies are
newly included in the scope of companies accounted for by
the equity method.
33 companies are newly included in the scope of companies
accounted for by the equity method as a result of the acquisi-
tion of the shares.
The Company judged 2 companies to have a material
impact on the consolidated financial statements. Consequently,
the Company excluded these companies from the scope of
companies accounted for by the equity method and brought
them under the scope of consolidation.
1. Basis of Presenting Consolidated Financial Statements
2. United States Dollar Amounts
3. Summary of Significant Accounting Policies
114 NIPPON YUSEN KABUSHIKI KAISHA
(3) Any material difference between the cost of an investment in
a subsidiary and the amount of underlying equity in net assets
of the subsidiary upon inclusion in the consolidation, unless
specifically identified and reclassified to the applicable
accounts from which the value originates, is treated as good-
will and negative goodwill, as the case may be, and amortized
over a period of 5 to 20 years on a straight-line basis.
(4) All significant intercompany balances, transactions and all
material unrealized profit within the consolidated group have
been eliminated in consolidation.
B. Accounting Period
The Company’s accounting period begins each year on April 1
and ends the following year on March 31.
During the fiscal year ended March 31, 2011, December 31
was used by 41 consolidated subsidiaries as the closing date for
their financial statements and February 28 was used by one con-
solidated subsidiary. Necessary adjustments have been made to
address transactions that occurred between closing dates differ-
ent to that of the Company and March 31.
2 companies with a fiscal year–end of December 31 provide
financial statements based on provisional settlement of accounts
as of March 31 to facilitate preparation of the consolidated
financial statements.
During the current fiscal year, 22 consolidated subsidiaries
changed their year–end closing date from December 31 to March
31. The effect of this change on retained earnings is presented in
the consolidated statements of changes in equity.
C. Foreign Currency Financial Statements
The balance sheet accounts of consolidated foreign subsidiaries
are translated into Japanese yen at the current exchange rate as
of the balance sheet date except for equity, which is translated at
the historical rate. Differences arising from such translation are
shown as “Foreign currency translation adjustments” in a sepa-
rate component of equity. Revenue and expense accounts of
consolidated foreign subsidiaries are translated into yen at the
average exchange rate.
D. Valuation of Assets
(1) Short-term and long-term investment securities are classified
and accounted for, depending on management’s intent, as
follows:
i) held-to-maturity debt securities, which are expected to be
held to maturity with the positive intent and ability to hold
to maturity are reported at amortized cost, and
ii) (a) available-for-sale securities with fair value, which are not
classified as either of the aforementioned securities, are
reported at fair value, with unrealized gains and losses, net
of applicable taxes, reported in a separate component of
equity, and (b) available-for-sale securities whose fair value
was not readily determinable are reported at cost using the
moving average method.
(2) Derivatives are valued at market.
(3) Inventories are stated at the lower of cost, determined by the
moving average cost method, or net selling value, which is
defined as the selling price less additional estimated manufac-
turing costs and estimated direct selling expenses.
E. Depreciation and Amortization
(1) vessels, property, plant and equipment except for lease assets
are depreciated as follows: vessels, property, plant and equip-
ment are depreciated generally by the straight–line method
based on useful lives stipulated in the Japanese Corporation
Tax Law. Assets for which the purchase price is more than
¥100,000 but less than ¥200,000 are depreciated generally in
equal allotments over 3 years based on the Japanese
Corporation Tax Law.
(2) Intangible assets except for lease assets are amortized as
follows:
Computer software is amortized by the straight–line method
based principally on the length of period it can be used internally
(5 years). Other intangible assets are amortized by the straight-
line method based on the Japanese Corporation Tax Law.
(3) Leased assets are depreciated as follows:
Leased assets related to financial leases that transfer ownership
rights are depreciated by the same depreciation method that is
applied to fixed assets owned by the Company. Leased assets
related to financial leases that do not transfer ownership rights
are depreciated under the straight-line method based on the
lease term as the useful life and assuming no residual value.
F. Capitalization of Interest Expenses
Interest expense is generally charged to income as incurred.
However, interest expense incurred in the construction of certain
assets, particularly projects for vessels, is capitalized and included
in the costs of assets when a construction period is substantially
long and the amount of interest incurred in such a period is sig-
nificantly material.
G. Provisions
(1) Allowance for doubtful accounts:
The allowance for doubtful accounts is stated in amounts
considered to be appropriate based on the companies’ past
credit loss experience and an evaluation of potential losses in
receivables outstanding.
115ANNUAL REPORT 2011
14MANAGEMENT
45PERFORMANCE
65SUSTAINABILITY
73GOvERNANCE
87FACT DATA
93Financial data
(2) Provision for bonuses:
Bonuses to employees are accrued at the year end to which
such bonuses are attributable.
(3) Provision for directors’ bonuses:
Bonuses to directors and corporate auditors are accrued at the
year end to which such bonuses are attributable.
(4) Provision for retirement benefits:
To provide for employees’ retirement benefits, this provision is
recorded based on the estimated actuarial present value of
the Company’s and its consolidated subsidiaries’ retirement
benefit obligations and the estimated fair value of pension
assets at the end of the fiscal year. The Company amortizes
prior service cost using the straight–line method over the term
that does not exceed the average remaining service period
(eight years) of employees who are eligible for postretirement
benefits.
Unrecognized net actuarial differences are mainly amortized
beginning immediately the following year on a straight-line
basis over a term that does not exceed the average remaining
service period of employees who are expected to receive
benefits under the plans (eight years).
(5) Provision for directors’ retirement benefits:
To provide for the payment of retirement benefits to directors
and corporate auditors, in accordance with internal policies,
consolidated subsidiaries record such provisions calculated as
the estimated amount which would be payable if all directors
and corporate auditors were to retire at the balance sheet date.
(6) Provision for periodic dry docking of vessels:
Provision for periodic dry docking of vessels is provided based
on the estimated amount of expenditures for periodic dry
docking in the future.
(7) Provision for losses related to antitrust law:
The Company’s consolidated subsidiary, YUSEN LOGISTICS
CO. LTD., has recorded a provision in preparation for the
order to pay an administrative surcharge for alleged violations
of Article 3 of the Act on Prohibition of Private Monopolization
and Maintenance of Fair Trade, in the amount of the adminis-
trative surcharge based on this order.
H. Income Taxes
The Company and its domestic subsidiaries recognize future tax
consequences of temporary differences between assets and lia-
bilities in accounting and tax treatments. Deferred taxes are
computed based on the pretax income or loss included in the
consolidated statements of operations and measured by applying
currently enacted laws to the temporary differences. The asset
and liability approach is used to recognize deferred tax assets and
liabilities for the expected future tax consequences of temporary
differences between the carrying amounts and the tax bases of
assets and liabilities.
I. Freight Revenue and Expense Recognition
Freight revenues and expenses are recognized by two different
methods depending on types of cargo transportation.
(1) Transportation by container ships:
Revenues and expenses arising from ocean transportation of
containers are principally recognized proportionately as ship-
ments move.
(2) Transportation by vessels other than container ships:
Revenues and expenses from transportation by vessels other
than container ships are principally recognized upon the voy-
age completion method.
J. Accounting for Leases
Finance leases which existed at March 31, 2008 and do not
transfer ownership of the leased property to the lessee are
accounted for as operating lease transactions.
K. Method of Accounting for Material Hedge Transactions
For derivative transactions used to offset the risks of assets and
liabilities due to fluctuations in interest rates, foreign currency
exchange rates and cash flow, the Company and its consolidated
subsidiaries apply hedge accounting. In addition, hedge account-
ing is also applied to derivative transactions used to mitigate the
risks of price fluctuations in fuel procurement and others. For
hedge accounting, the Company and its consolidated subsidiaries
adopt a deferred hedge method that requires the Company to
mark the derivative transactions, effective as hedges, to market,
and to defer the valuation loss/gain. For currency swap contracts
and forward foreign exchange contracts that meet the required
conditions under the accounting standard, the Company and its
consolidated subsidiaries translate hedged foreign currency assets
and liabilities at the rates of these contracts. In addition, for inter-
est rate swap contracts and interest rate cap contracts that meet
specified conditions under the accounting standard, the related
interest differentials paid or received under the contracts are
included in the interest income/expense of the hedged financial
assets and liabilities. In addition, the following hedging methods
for various risks are utilized: interest rate swaps to hedge the risk
of interest rate fluctuations related to borrowings, bonds and
others; currency swap contracts, forward foreign exchange con-
tracts, debts and credits in foreign currency to hedge the foreign
exchange risk associated with monetary assets and liabilities,
expected transactions and others; and fuel swap contracts to
hedge the risk of price fluctuations in fuel oil and others. Semi-
annually, the Company and its consolidated subsidiaries evaluate
116 NIPPON YUSEN KABUSHIKI KAISHA
the effectiveness of hedging methods, except interest rate swaps
and interest rate caps that meet specified conditions under the
accounting standard, by analyzing the ratios of the cumulative
amount of market fluctuation or cash flow among the hedging
financial instruments and the hedged items.
Foreign Currency Transactions—Both short–term and long–
term receivables and payables denominated in foreign currencies
are translated into Japanese yen at exchange rates in effect at the
balance sheet date.
However, short-term and long-term receivables and payables
covered by forward exchange contracts are translated at the
contract rates.
Any differences between the foreign exchange contract rates
and historical rates resulting from the translation of receivables
and payables are recognized as income or expense over the lives
of the related contracts.
L. Per Share Information
Basic net income per share is computed by dividing net income
available to common shareholders by the weighted-average
number of common shares outstanding for the period, retroac-
tively adjusted for stock splits.
Diluted net income per share is not disclosed because of the
Company’s net loss position for the fiscal year ended March 31, 2010.
Cash dividends per share consist of interim dividends paid dur-
ing the year and dividends to be paid after the end of the year.
M. Cash and Cash Equivalents
Cash and cash equivalents are composed of cash on hand, bank
deposits that are able to be withdrawn on demand and short–
term investments with original maturities of three months or less
that are exposed to minor value fluctuation risk.
N. Change in Accounting Policies
(1) Application of “Accounting Standard for Asset Retirement
Obligations”, etc.
Effective from this fiscal year, the Company has adopted the
“Accounting Standard for Asset Retirement Obligations” (ASBJ
Statement No. 18, March 31, 2008) and “Guidance on
Accounting Standard for Asset Retirement Obligations” (ASBJ
Guidance No. 21, March 31, 2008). The impact of the applica-
tion of this standard and guidance on profit and loss, and the
changes in the amount of asset retirement obligations due to the
commencement of the application of this standard and guidance
are negligible.
(2) Application of “Accounting Standard for Business
Combinations”, etc.
Effective from this fiscal year, the Company has adopted the
“Accounting Standard for Business Combinations” (ASBJ
Statement No. 21, December 26, 2008), “Accounting Standard
for Consolidated Financial Statements” (ASBJ Statement No.
22, December 26, 2008), “Partial Amendment to Accounting
Standard for Research and Development Costs” (ASBJ
Statement No. 23, December 26, 2008), “Accounting Standard
for Business Divestitures” (ASBJ Statement No. 7, revised on
December 26, 2008), “Accounting Standard for Equity Method
of Accounting for Investments” (ASBJ Statement No. 16,
announced as revised on December 26, 2008) and “Guidance
on Accounting Standard for Business Combinations and
Accounting Standard for Business Divestitures” (ASBJ Guidance
No. 10, revised on December 26, 2008).
O. Additional Information
Effective from this fiscal year ended March 31, 2011, the Com-
pany has adopted the “Accounting Standard for Presentation of
Comprehensive Income” (ASBJ Statement No. 25, June 30, 2010).
P. Explanatory Notes to Consolidated Financial
Statements
Fiscal Year Ended March 31, 2011
(1) Comprehensive income of previous fiscal year
Comprehensive income attributable to owners of the parent
¥4,518 million
Comprehensive income attributable to minority interests
¥3,465 million
Total ¥7,984 million
(2) Other comprehensive income of previous fiscal year
Unrealized gain on available-for-sale securities
¥18,978 million
Deferred gain on hedges ¥5,289 million
Foreign currency translation adjustments ¥(3,499) million
S hare of other comprehensive income of associates accounted
for using equity method ¥1,966 million
Total ¥22,735 million
117ANNUAL REPORT 2011
14MANAGEMENT
45PERFORMANCE
65SUSTAINABILITY
73GOvERNANCE
87FACT DATA
93Financial data
(1) Disclosure on Financial Instruments
a. Policy on financial instruments
Internal funding provides the Company and its consolidated
subsidiaries with some of the funds they require for capital
expenditures for vessels, aircraft and transport equipment, as
well as working capital. Other funds are procured from out-
side sources. Methods of raising funds include loans from
banks and other financial institutions, as well as issuing corpo-
rate bonds. Funds are invested mainly in short-term deposits.
The Company and its consolidated subsidiaries utilize deriva-
tives to hedge risks mentioned below and do not engage in
speculative financial transactions.
b. Contents and risks of financial instruments
Notes and operating accounts receivable-trade are subject to
client credit risk. In addition, foreign currency denominated
transactions are subject to foreign exchange rate risk.
Investment securities include held-to-maturity debt securi-
ties and corporate shares. The Company and its consolidated
subsidiaries used the current value method to evaluate invest-
ment securities that have explicit market values, taking as the
market value the average market price during the one-month
period preceding the end of the fiscal year. Consequently,
shifts in stock market conditions could affect the operating
performance and financial condition of the Company and its
consolidated subsidiaries.
Notes and operating accounts payable-trade are settled in
the short term. Of these, transactions denominated in foreign
currencies are subject to foreign exchange rate risk.
Loans payable are subject to interest rate risk, and the
Company and its consolidated subsidiaries utilize derivative
financial instruments to hedge against these risks.
As for derivative financial instruments, to avert interest rate
risks associated with loans payable, the Company and its
consolidated subsidiaries utilize interest rate swap contracts.
To avert foreign exchange risk associated with foreign cur-
rency assets and liabilities, the Company and its consolidated
subsidiaries utilize forward foreign exchange contracts and
currency swap contracts. Similarly, to deal with the risk of
price fluctuations in fuel and chartered freight, the Company
and its consolidated subsidiaries utilize fuel swap contracts,
freight (chartered-freight) forward transactions and other
methods.
The details of hedge accounting for derivative financial
instruments are described below. Methods for evaluating
effectiveness of hedging are described above in “3. Summary
of Significant Accounting Policies,” “K. Method of Accounting
for Material Hedge Transactions.”
��Hedge accounting method
The Company and its consolidated subsidiaries primarily
adopt deferral hedge accounting that requires them to
mark the derivative financial instruments effective as hedges
to market, and to defer the valuation loss/gain. For forward
foreign exchange contracts and currency swap contracts
that meet the required conditions as designation account-
ing under the accounting standard, the Company and its
consolidated subsidiaries translate hedged foreign currency
assets and liabilities at the rates of these contracts. In addi-
tion, for interest rate swap contracts that meet specified
conditions as exceptional accounting under the accounting
standard, the related interest differentials paid or received
under the contracts are included in the interest income/
expense of the hedged financial assets and liabilities.
� Principal hedging methods and items hedged
� Risks inherent in derivative transactions
Derivative transactions are subject to inherent market risk,
which is derived from future changes in market prices (cur-
rency rates, interest rates and share prices), and credit risk,
which arises from the counterparty becoming unable to
perform their contractual obligations. The derivative finan-
cial instruments utilized by the Company and its consolidated
subsidiaries are only those that offset the fluctuation in fair
value of the underlying financial assets and liabilities,
thereby the Company and its consolidated subsidiaries are
not exposed to material market risk. The counterparties in
the derivative transactions are financial institutions with
high credit ratings, implying that credit risk is immaterial.
c. Risk management for financial instruments
��Credit risk management
The Company utilizes credit management regulations to
minimize its risk on notes and operating accounts receiv-
able-trade and long-term loans receivable. In terms of
held-to-maturity debt securities, in line with its asset man-
agement regulations, the Company and its consolidated
subsidiaries hold only highly rated debt securities, so credit
risk is negligible.
4. Financial Instruments
Principal hedging methods
Currency swap contacts
Interest rate swap contracts
Fuel swap contracts
Forward foreign exchange
contracts
Principal items hedged
Charterage paid
Loans payable and receivable
Purchase price of fuel
Forecasted foreign currency
transactions
118 NIPPON YUSEN KABUSHIKI KAISHA
� Market risk management
To hedge exchange rate fluctuation risk associated with
foreign currency assets and liabilities, the Company and its
consolidated subsidiaries make use of forward foreign
exchange contracts, currency swap contracts and other
methods.
The Company and its consolidated subsidiaries utilize
interest rate swaps and other methods to avert the fluctua-
tion risks of interest paid on loans payable.
The Company and its consolidated subsidiaries periodi-
cally ascertain the price of short-term and long-term
investment securities and the financial conditions of their
issuers (corporate business partners). The Company and its
consolidated subsidiaries review the status of their holdings
in instruments other than held-to-maturity debt securities
on an ongoing basis, taking into consideration their rela-
tionships with their corporate business partners.
The derivative transactions of the Company and its con-
solidated subsidiaries follow the internal approval process
specified in the Company’s Rules for Risk Management
Employing Financial Instruments and other rules as well as
regulations, and are subject to internal control operated
principally by the divisions in charge of accounting. In addi-
tion, to prevent improper transactions, the back-office
function for these transactions is performed by personnel of
the Company and its consolidated subsidiaries who are not
directly involved in the transactions. The contract amounts
and other information related to derivative financial instru-
ments are reported to a director in charge periodically, and,
as necessary, to the Board of Directors.
� Management of liquidity risk associated with capital raising
activities
Cash planning is made and updated by the financial divi-
sion of the Company on a timely basis based on reports
from business divisions of the Company and the Company
also enters into commitment- line contracts with a number
of financial institutions in order to meet unexpected cash
demand.
d. Supplementary explanation of fair value of financial instru-
ments and others
The fair value of financial instruments includes, in addition to
the value determined based on market prices, valuations cal-
culated on a reasonable basis if no market price is available.
However, as certain variables are used for these calculations,
the result of such calculations may vary if different assump-
tions are used.
The contract amounts of interest rate swap transactions and
currency swap transactions do not represent the amounts
exchanged by the parties and do not measure the Company and
its consolidated subsidiaries’ exposure to credit or market risk.
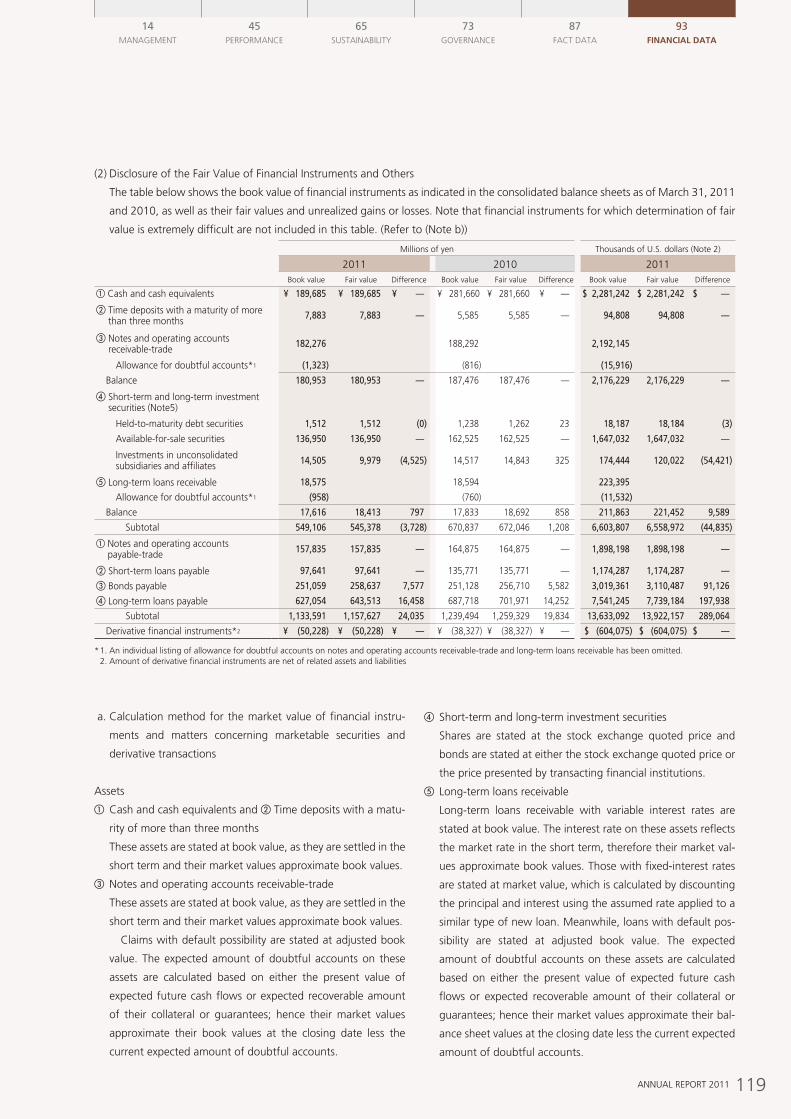
119ANNUAL REPORT 2011
14MANAGEMENT
45PERFORMANCE
65SUSTAINABILITY
73GOvERNANCE
87FACT DATA
93Financial data
(2) Disclosure of the Fair value of Financial Instruments and Others
The table below shows the book value of financial instruments as indicated in the consolidated balance sheets as of March 31, 2011
and 2010, as well as their fair values and unrealized gains or losses. Note that financial instruments for which determination of fair
value is extremely difficult are not included in this table. (Refer to (Note b))
Millions of yen Thousands of U.S. dollars (Note 2)
2011 2010 2011Book value Fair value Difference Book value Fair value Difference Book value Fair value Difference
Cash and cash equivalents ¥ 189,685 ¥ 189,685 ¥ — ¥ 281,660 ¥ 281,660 ¥ — $ 2,281,242 $ 2,281,242 $ —
Time deposits with a maturity of more than three months 7,883 7,883 — 5,585 5,585 — 94,808 94,808 —
Notes and operating accounts receivable-trade 182,276 188,292 2,192,145
Allowance for doubtful accounts*1 (1,323) (816) (15,916)
Balance 180,953 180,953 — 187,476 187,476 — 2,176,229 2,176,229 —
Short-term and long-term investment securities (Note5)
Held-to-maturity debt securities 1,512 1,512 (0) 1,238 1,262 23 18,187 18,184 (3)
Available-for-sale securities 136,950 136,950 — 162,525 162,525 — 1,647,032 1,647,032 —
Investments in unconsolidated subsidiaries and affiliates 14,505 9,979 (4,525) 14,517 14,843 325 174,444 120,022 (54,421)
Long-term loans receivable 18,575 18,594 223,395
Allowance for doubtful accounts*1 (958) (760) (11,532)
Balance 17,616 18,413 797 17,833 18,692 858 211,863 221,452 9,589
Subtotal 549,106 545,378 (3,728) 670,837 672,046 1,208 6,603,807 6,558,972 (44,835)
Notes and operating accounts payable-trade 157,835 157,835 — 164,875 164,875 — 1,898,198 1,898,198 —
Short-term loans payable 97,641 97,641 — 135,771 135,771 — 1,174,287 1,174,287 — Bonds payable 251,059 258,637 7,577 251,128 256,710 5,582 3,019,361 3,110,487 91,126 Long-term loans payable 627,054 643,513 16,458 687,718 701,971 14,252 7,541,245 7,739,184 197,938
Subtotal 1,133,591 1,157,627 24,035 1,239,494 1,259,329 19,834 13,633,092 13,922,157 289,064
Derivative financial instruments*2 ¥ (50,228) ¥ (50,228) ¥ — ¥ (38,327) ¥ (38,327) ¥ — $ (604,075) $ (604,075) $ —
* 1. An individual listing of allowance for doubtful accounts on notes and operating accounts receivable-trade and long-term loans receivable has been omitted. 2. Amount of derivative financial instruments are net of related assets and liabilities
a. Calculation method for the market value of financial instru-
ments and matters concerning marketable securities and
derivative transactions
Assets
����Cash and cash equivalents and Time deposits with a matu-
rity of more than three months
These assets are stated at book value, as they are settled in the
short term and their market values approximate book values.
����Notes and operating accounts receivable-trade
These assets are stated at book value, as they are settled in the
short term and their market values approximate book values.
Claims with default possibility are stated at adjusted book
value. The expected amount of doubtful accounts on these
assets are calculated based on either the present value of
expected future cash flows or expected recoverable amount
of their collateral or guarantees; hence their market values
approximate their book values at the closing date less the
current expected amount of doubtful accounts.
����Short-term and long-term investment securities
Shares are stated at the stock exchange quoted price and
bonds are stated at either the stock exchange quoted price or
the price presented by transacting financial institutions.
����Long-term loans receivable
Long-term loans receivable with variable interest rates are
stated at book value. The interest rate on these assets reflects
the market rate in the short term, therefore their market val-
ues approximate book values. Those with fixed-interest rates
are stated at market value, which is calculated by discounting
the principal and interest using the assumed rate applied to a
similar type of new loan. Meanwhile, loans with default pos-
sibility are stated at adjusted book value. The expected
amount of doubtful accounts on these assets are calculated
based on either the present value of expected future cash
flows or expected recoverable amount of their collateral or
guarantees; hence their market values approximate their bal-
ance sheet values at the closing date less the current expected
amount of doubtful accounts.
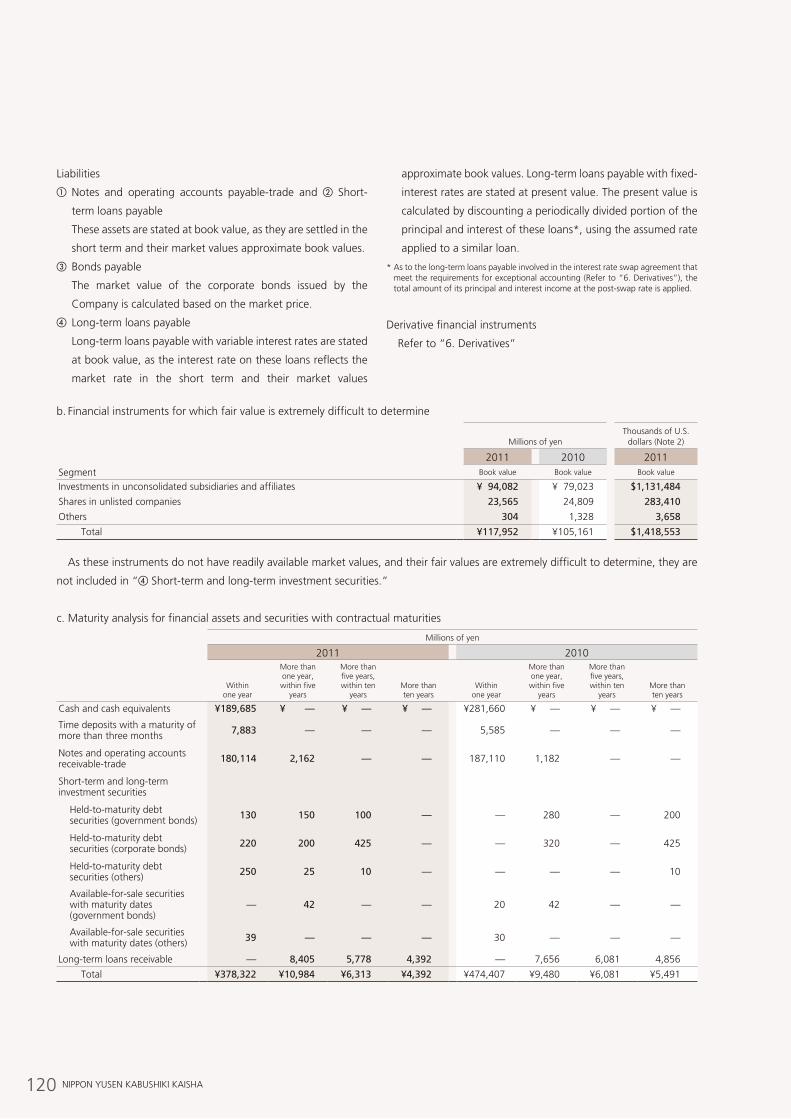
120 NIPPON YUSEN KABUSHIKI KAISHA
Liabilities
����Notes and operating accounts payable-trade and Short-
term loans payable
These assets are stated at book value, as they are settled in the
short term and their market values approximate book values.
���Bonds payable
The market value of the corporate bonds issued by the
Company is calculated based on the market price.
���Long-term loans payable
Long-term loans payable with variable interest rates are stated
at book value, as the interest rate on these loans reflects the
market rate in the short term and their market values
approximate book values. Long-term loans payable with fixed-
interest rates are stated at present value. The present value is
calculated by discounting a periodically divided portion of the
principal and interest of these loans*, using the assumed rate
applied to a similar loan.
* As to the long-term loans payable involved in the interest rate swap agreement that meet the requirements for exceptional accounting (Refer to “6. Derivatives”), the total amount of its principal and interest income at the post-swap rate is applied.
Derivative financial instruments
Refer to “6. Derivatives”
b. Financial instruments for which fair value is extremely difficult to determine
Millions of yen
Thousands of U.S. dollars (Note 2)
2011 2010 2011Segment Book value Book value Book value
Investments in unconsolidated subsidiaries and affiliates ¥ 94,082 ¥ 79,023 $1,131,484
Shares in unlisted companies 23,565 24,809 283,410
Others 304 1,328 3,658
Total ¥117,952 ¥105,161 $1,418,553
As these instruments do not have readily available market values, and their fair values are extremely difficult to determine, they are
not included in “ Short-term and long-term investment securities.”
c. Maturity analysis for financial assets and securities with contractual maturities
Millions of yen
2011 2010
Within one year
More than one year, within five
years
More than five years, within ten
yearsMore than ten years
Within one year
More than one year, within five
years
More than five years, within ten
yearsMore than ten years
Cash and cash equivalents ¥189,685 ¥ — ¥ — ¥ — ¥281,660 ¥ — ¥ — ¥ —
Time deposits with a maturity of more than three months 7,883 — — — 5,585 — — —
Notes and operating accounts receivable-trade 180,114 2,162 — — 187,110 1,182 — —
Short-term and long-term investment securities
Held-to-maturity debt securities (government bonds) 130 150 100 — — 280 — 200
Held-to-maturity debt securities (corporate bonds) 220 200 425 — — 320 — 425
Held-to-maturity debt securities (others) 250 25 10 — — — — 10
Available-for-sale securities with maturity dates (government bonds)
— 42 — — 20 42 — —
Available-for-sale securities with maturity dates (others) 39 — — — 30 — — —
Long-term loans receivable — 8,405 5,778 4,392 — 7,656 6,081 4,856
Total ¥378,322 ¥10,984 ¥6,313 ¥4,392 ¥474,407 ¥9,480 ¥6,081 ¥5,491
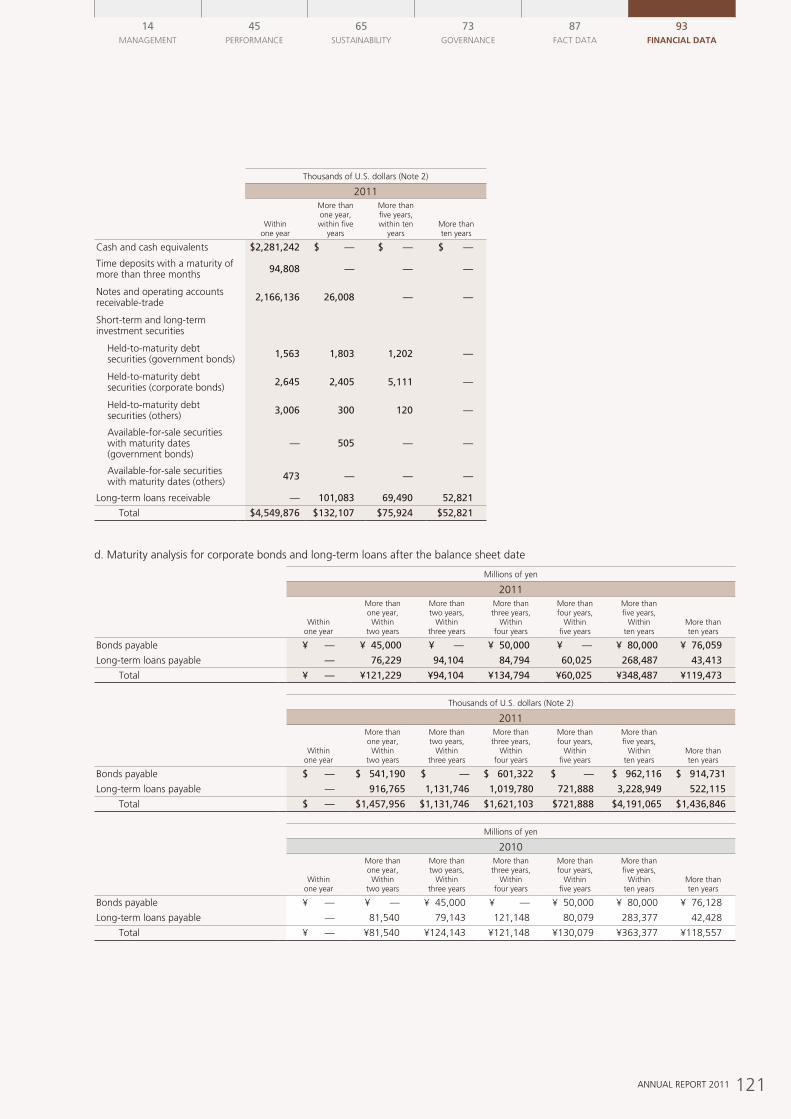
121ANNUAL REPORT 2011
14MANAGEMENT
45PERFORMANCE
65SUSTAINABILITY
73GOvERNANCE
87FACT DATA
93Financial data
Thousands of U.S. dollars (Note 2)
2011
Within one year
More than one year, within five
years
More than five years, within ten
yearsMore than ten years
Cash and cash equivalents $2,281,242 $ — $ — $ —
Time deposits with a maturity of more than three months 94,808 — — —
Notes and operating accounts receivable-trade 2,166,136 26,008 — —
Short-term and long-term investment securities
Held-to-maturity debt securities (government bonds) 1,563 1,803 1,202 —
Held-to-maturity debt securities (corporate bonds) 2,645 2,405 5,111 —
Held-to-maturity debt securities (others) 3,006 300 120 —
Available-for-sale securities with maturity dates (government bonds)
— 505 — —
Available-for-sale securities with maturity dates (others) 473 — — —
Long-term loans receivable — 101,083 69,490 52,821
Total $4,549,876 $132,107 $75,924 $52,821
d. Maturity analysis for corporate bonds and long-term loans after the balance sheet date
Millions of yen
2011
Within one year
More than one year, Within
two years
More than two years,
Within three years
More than three years,
Within four years
More than four years,
Within five years
More than five years,
Within ten years
More than ten years
Bonds payable ¥ — ¥ 45,000 ¥ — ¥ 50,000 ¥ — ¥ 80,000 ¥ 76,059
Long-term loans payable — 76,229 94,104 84,794 60,025 268,487 43,413
Total ¥ — ¥121,229 ¥94,104 ¥134,794 ¥60,025 ¥348,487 ¥119,473
Thousands of U.S. dollars (Note 2)
2011
Within one year
More than one year, Within
two years
More than two years,
Within three years
More than three years,
Within four years
More than four years,
Within five years
More than five years,
Within ten years
More than ten years
Bonds payable $ — $ 541,190 $ — $ 601,322 $ — $ 962,116 $ 914,731
Long-term loans payable — 916,765 1,131,746 1,019,780 721,888 3,228,949 522,115
Total $ — $1,457,956 $1,131,746 $1,621,103 $721,888 $4,191,065 $1,436,846
Millions of yen
2010
Within one year
More than one year, Within
two years
More than two years,
Within three years
More than three years,
Within four years
More than four years,
Within five years
More than five years,
Within ten years
More than ten years
Bonds payable ¥ — ¥ — ¥ 45,000 ¥ — ¥ 50,000 ¥ 80,000 ¥ 76,128
Long-term loans payable — 81,540 79,143 121,148 80,079 283,377 42,428
Total ¥ — ¥81,540 ¥124,143 ¥121,148 ¥130,079 ¥363,377 ¥118,557
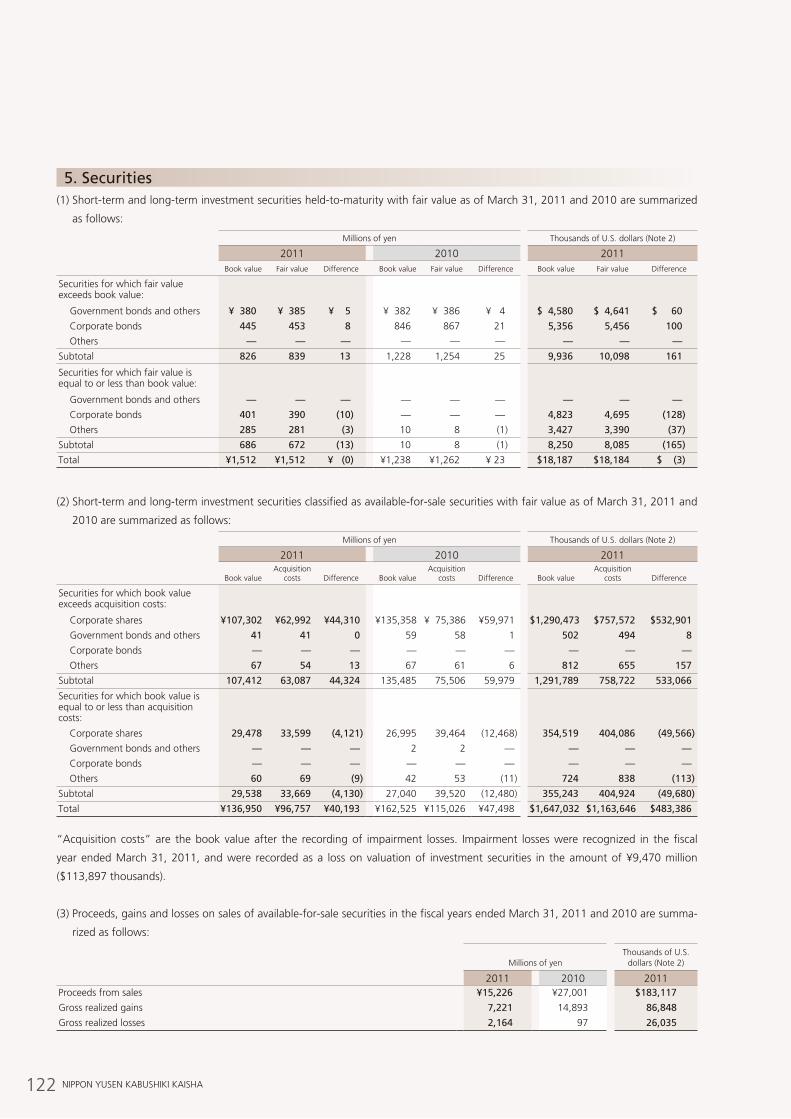
122 NIPPON YUSEN KABUSHIKI KAISHA
(1) Short-term and long-term investment securities held-to-maturity with fair value as of March 31, 2011 and 2010 are summarized
as follows:
Millions of yen Thousands of U.S. dollars (Note 2)
2011 2010 2011Book value Fair value Difference Book value Fair value Difference Book value Fair value Difference
Securities for which fair value exceeds book value:
Government bonds and others ¥ 380 ¥ 385 ¥ 5 ¥ 382 ¥ 386 ¥ 4 $ 4,580 $ 4,641 $ 60
Corporate bonds 445 453 8 846 867 21 5,356 5,456 100
Others — — — — — — — — —
Subtotal 826 839 13 1,228 1,254 25 9,936 10,098 161
Securities for which fair value is equal to or less than book value:
Government bonds and others — — — — — — — — —
Corporate bonds 401 390 (10) — — — 4,823 4,695 (128)
Others 285 281 (3) 10 8 (1) 3,427 3,390 (37)
Subtotal 686 672 (13) 10 8 (1) 8,250 8,085 (165)
Total ¥1,512 ¥1,512 ¥ (0) ¥1,238 ¥1,262 ¥ 23 $18,187 $18,184 $ (3)
(2) Short-term and long-term investment securities classified as available-for-sale securities with fair value as of March 31, 2011 and
2010 are summarized as follows:
Millions of yen Thousands of U.S. dollars (Note 2)
2011 2010 2011
Book valueAcquisition
costs Difference Book valueAcquisition
costs Difference Book valueAcquisition
costs Difference
Securities for which book value exceeds acquisition costs:
Corporate shares ¥107,302 ¥62,992 ¥44,310 ¥135,358 ¥ 75,386 ¥59,971 $1,290,473 $757,572 $532,901
Government bonds and others 41 41 0 59 58 1 502 494 8
Corporate bonds — — — — — — — — —
Others 67 54 13 67 61 6 812 655 157
Subtotal 107,412 63,087 44,324 135,485 75,506 59,979 1,291,789 758,722 533,066
Securities for which book value is equal to or less than acquisition costs:
Corporate shares 29,478 33,599 (4,121) 26,995 39,464 (12,468) 354,519 404,086 (49,566)
Government bonds and others — — — 2 2 — — — —
Corporate bonds — — — — — — — — —
Others 60 69 (9) 42 53 (11) 724 838 (113)
Subtotal 29,538 33,669 (4,130) 27,040 39,520 (12,480) 355,243 404,924 (49,680)
Total ¥136,950 ¥96,757 ¥40,193 ¥162,525 ¥115,026 ¥47,498 $1,647,032 $1,163,646 $483,386
“Acquisition costs” are the book value after the recording of impairment losses. Impairment losses were recognized in the fiscal
year ended March 31, 2011, and were recorded as a loss on valuation of investment securities in the amount of ¥9,470 million
($113,897 thousands).
(3) Proceeds, gains and losses on sales of available-for-sale securities in the fiscal years ended March 31, 2011 and 2010 are summa-
rized as follows:
Millions of yen
Thousands of U.S. dollars (Note 2)
2011 2010 2011Proceeds from sales ¥15,226 ¥27,001 $183,117
Gross realized gains 7,221 14,893 86,848
Gross realized losses 2,164 97 26,035
5. Securities
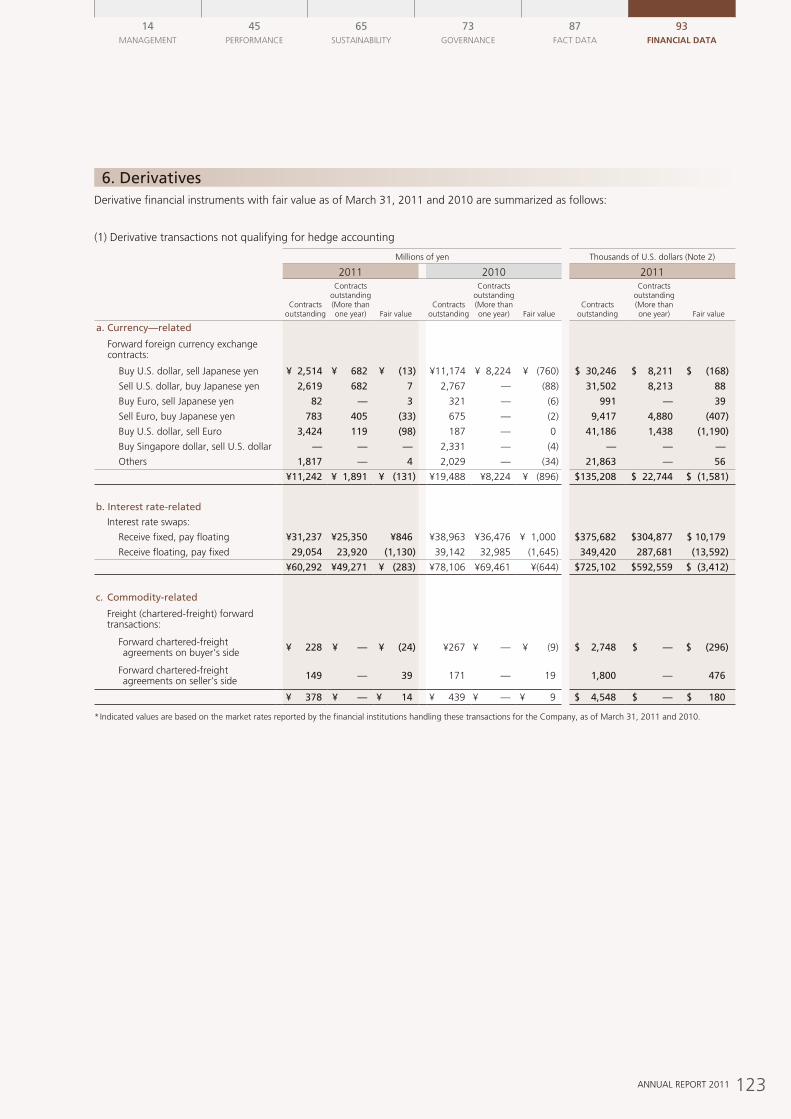
123ANNUAL REPORT 2011
14MANAGEMENT
45PERFORMANCE
65SUSTAINABILITY
73GOvERNANCE
87FACT DATA
93Financial data
Derivative financial instruments with fair value as of March 31, 2011 and 2010 are summarized as follows:
(1) Derivative transactions not qualifying for hedge accounting
Millions of yen Thousands of U.S. dollars (Note 2)
2011 2010 2011
Contracts outstanding
Contracts outstanding(More than one year) Fair value
Contracts outstanding
Contracts outstanding(More than one year) Fair value
Contracts outstanding
Contracts outstanding(More than one year) Fair value
a. Currency—related
Forward foreign currency exchange contracts:
Buy U.S. dollar, sell Japanese yen ¥ 2,514 ¥ 682 ¥ (13) ¥11,174 ¥ 8,224 ¥ (760) $ 30,246 $ 8,211 $ (168)
Sell U.S. dollar, buy Japanese yen 2,619 682 7 2,767 — (88) 31,502 8,213 88
Buy Euro, sell Japanese yen 82 — 3 321 — (6) 991 — 39
Sell Euro, buy Japanese yen 783 405 (33) 675 — (2) 9,417 4,880 (407)
Buy U.S. dollar, sell Euro 3,424 119 (98) 187 — 0 41,186 1,438 (1,190)
Buy Singapore dollar, sell U.S. dollar — — — 2,331 — (4) — — —
Others 1,817 — 4 2,029 — (34) 21,863 — 56
¥11,242 ¥ 1,891 ¥ (131) ¥19,488 ¥8,224 ¥ (896) $135,208 $ 22,744 $ (1,581)
b. Interest rate-related
Interest rate swaps:
Receive fixed, pay floating ¥31,237 ¥25,350 ¥846 ¥38,963 ¥36,476 ¥ 1,000 $375,682 $304,877 $ 10,179
Receive floating, pay fixed 29,054 23,920 (1,130) 39,142 32,985 (1,645) 349,420 287,681 (13,592)
¥60,292 ¥49,271 ¥ (283) ¥78,106 ¥69,461 ¥(644) $725,102 $592,559 $ (3,412)
c. Commodity-related
Freight (chartered-freight) forward transactions:
F orward chartered-freight agreements on buyer’s side ¥ 228 ¥ — ¥ (24) ¥267 ¥ — ¥ (9) $ 2,748 $ — $ (296)
F orward chartered-freight agreements on seller’s side 149 — 39 171 — 19 1,800 — 476
¥ 378 ¥ — ¥ 14 ¥ 439 ¥ — ¥ 9 $ 4,548 $ — $ 180
* Indicated values are based on the market rates reported by the financial institutions handling these transactions for the Company, as of March 31, 2011 and 2010.
6. Derivatives
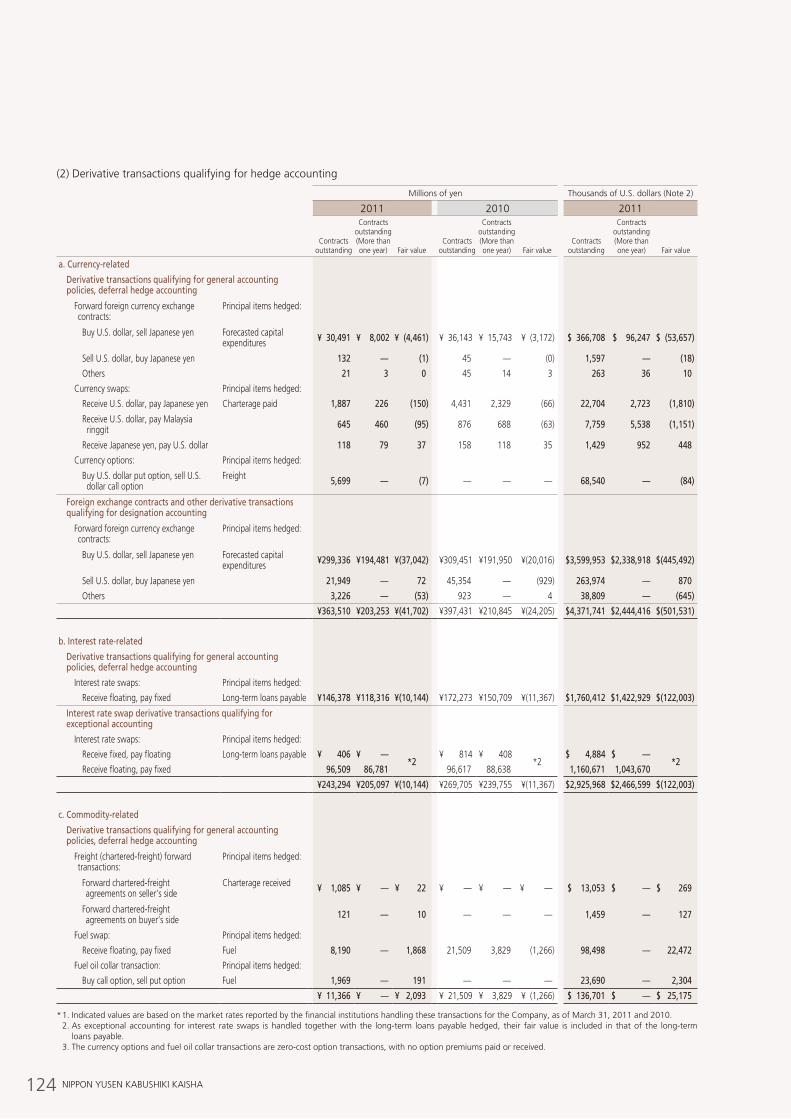
124 NIPPON YUSEN KABUSHIKI KAISHA
(2) Derivative transactions qualifying for hedge accounting
Millions of yen Thousands of U.S. dollars (Note 2)
2011 2010 2011
Contracts outstanding
Contracts outstanding(More than one year) Fair value
Contracts outstanding
Contracts outstanding(More than one year) Fair value
Contracts outstanding
Contracts outstanding(More than one year) Fair value
a. Currency-related
Derivative transactions qualifying for general accounting policies, deferral hedge accounting
F orward foreign currency exchange contracts:
Principal items hedged:
Buy U.S. dollar, sell Japanese yen Forecasted capital expenditures ¥ 30,491 ¥ 8,002 ¥ (4,461) ¥ 36,143 ¥ 15,743 ¥ (3,172) $ 366,708 $ 96,247 $ (53,657)
Sell U.S. dollar, buy Japanese yen 132 — (1) 45 — (0) 1,597 — (18)
Others 21 3 0 45 14 3 263 36 10
Currency swaps: Principal items hedged:
Receive U.S. dollar, pay Japanese yen Charterage paid 1,887 226 (150) 4,431 2,329 (66) 22,704 2,723 (1,810)
R eceive U.S. dollar, pay Malaysia ringgit 645 460 (95) 876 688 (63) 7,759 5,538 (1,151)
Receive Japanese yen, pay U.S. dollar 118 79 37 158 118 35 1,429 952 448
Currency options: Principal items hedged:
B uy U.S. dollar put option, sell U.S. dollar call option
Freight 5,699 — (7) — — — 68,540 — (84)
Foreign exchange contracts and other derivative transactions qualifying for designation accounting
F orward foreign currency exchange contracts:
Principal items hedged:
Buy U.S. dollar, sell Japanese yen Forecasted capital expenditures ¥299,336 ¥194,481 ¥(37,042) ¥309,451 ¥191,950 ¥(20,016) $3,599,953 $2,338,918 $(445,492)
Sell U.S. dollar, buy Japanese yen 21,949 — 72 45,354 — (929) 263,974 — 870
Others 3,226 — (53) 923 — 4 38,809 — (645)
¥363,510 ¥203,253 ¥(41,702) ¥397,431 ¥210,845 ¥(24,205) $4,371,741 $2,444,416 $(501,531)
b. Interest rate-related
Derivative transactions qualifying for general accounting policies, deferral hedge accounting
Interest rate swaps: Principal items hedged:
Receive floating, pay fixed Long-term loans payable ¥146,378 ¥118,316 ¥(10,144) ¥172,273 ¥150,709 ¥(11,367) $1,760,412 $1,422,929 $(122,003)
Interest rate swap derivative transactions qualifying for exceptional accounting
Interest rate swaps: Principal items hedged:
Receive fixed, pay floating Long-term loans payable ¥ 406 ¥ —*2
¥ 814 ¥ 408*2
$ 4,884 $ —*2
Receive floating, pay fixed 96,509 86,781 96,617 88,638 1,160,671 1,043,670
¥243,294 ¥205,097 ¥(10,144) ¥269,705 ¥239,755 ¥(11,367) $2,925,968 $2,466,599 $(122,003)
c. Commodity-related
Derivative transactions qualifying for general accounting policies, deferral hedge accounting
F reight (chartered-freight) forward transactions:
Principal items hedged:
F orward chartered-freight agreements on seller’s side
Charterage received ¥ 1,085 ¥ — ¥ 22 ¥ — ¥ — ¥ — $ 13,053 $ — $ 269
F orward chartered-freight agreements on buyer’s side 121 — 10 — — — 1,459 — 127
Fuel swap: Principal items hedged:
Receive floating, pay fixed Fuel 8,190 — 1,868 21,509 3,829 (1,266) 98,498 — 22,472
Fuel oil collar transaction: Principal items hedged:
Buy call option, sell put option Fuel 1,969 — 191 — — — 23,690 — 2,304
¥ 11,366 ¥ — ¥ 2,093 ¥ 21,509 ¥ 3,829 ¥ (1,266) $ 136,701 $ — $ 25,175
* 1. Indicated values are based on the market rates reported by the financial institutions handling these transactions for the Company, as of March 31, 2011 and 2010. 2. As exceptional accounting for interest rate swaps is handled together with the long-term loans payable hedged, their fair value is included in that of the long-term
loans payable. 3. The currency options and fuel oil collar transactions are zero-cost option transactions, with no option premiums paid or received.
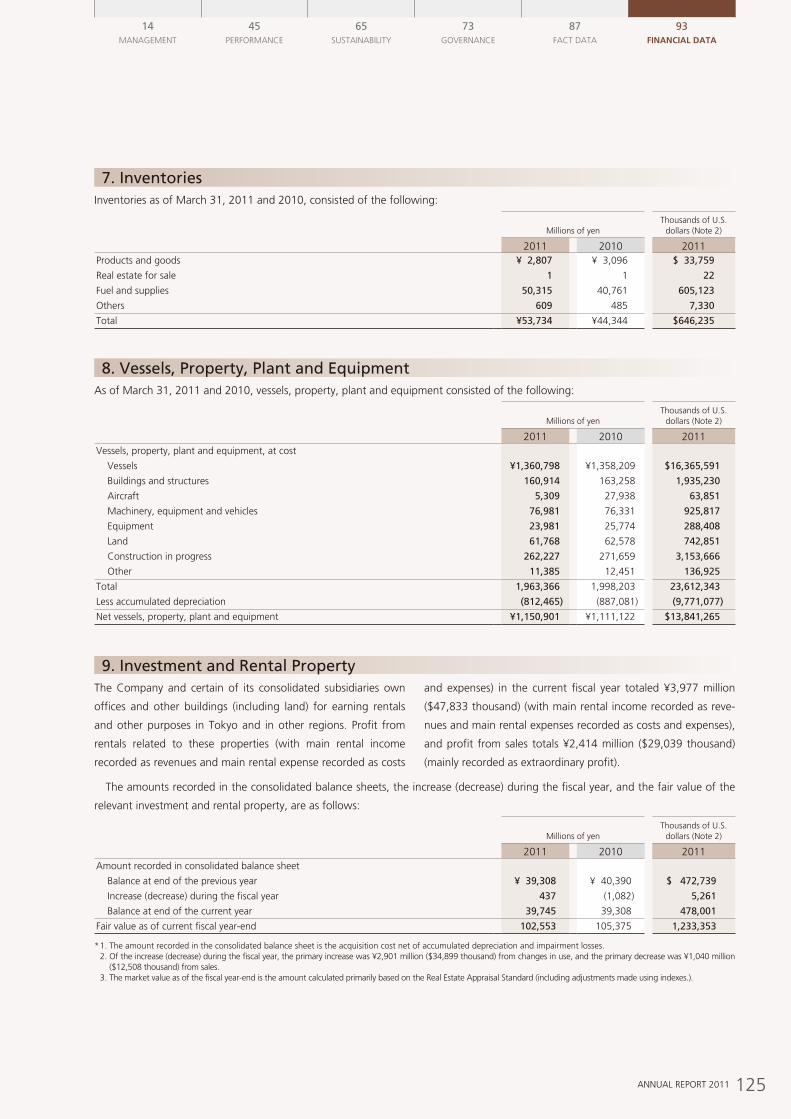
125ANNUAL REPORT 2011
14MANAGEMENT
45PERFORMANCE
65SUSTAINABILITY
73GOvERNANCE
87FACT DATA
93Financial data
Inventories as of March 31, 2011 and 2010, consisted of the following:
Millions of yen
Thousands of U.S. dollars (Note 2)
2011 2010 2011Products and goods ¥ 2,807 ¥ 3,096 $ 33,759
Real estate for sale 1 1 22
Fuel and supplies 50,315 40,761 605,123
Others 609 485 7,330
Total ¥53,734 ¥44,344 $646,235
As of March 31, 2011 and 2010, vessels, property, plant and equipment consisted of the following:
Millions of yen
Thousands of U.S. dollars (Note 2)
2011 2010 2011vessels, property, plant and equipment, at cost
vessels ¥1,360,798 ¥1,358,209 $16,365,591
Buildings and structures 160,914 163,258 1,935,230
Aircraft 5,309 27,938 63,851
Machinery, equipment and vehicles 76,981 76,331 925,817
Equipment 23,981 25,774 288,408
Land 61,768 62,578 742,851
Construction in progress 262,227 271,659 3,153,666
Other 11,385 12,451 136,925
Total 1,963,366 1,998,203 23,612,343
Less accumulated depreciation (812,465) (887,081) (9,771,077)
Net vessels, property, plant and equipment ¥1,150,901 ¥1,111,122 $13,841,265
The amounts recorded in the consolidated balance sheets, the increase (decrease) during the fiscal year, and the fair value of the
relevant investment and rental property, are as follows:
Millions of yen
Thousands of U.S. dollars (Note 2)
2011 2010 2011Amount recorded in consolidated balance sheet
Balance at end of the previous year ¥ 39,308 ¥ 40,390 $ 472,739
Increase (decrease) during the fiscal year 437 (1,082) 5,261
Balance at end of the current year 39,745 39,308 478,001
Fair value as of current fiscal year-end 102,553 105,375 1,233,353
* 1. The amount recorded in the consolidated balance sheet is the acquisition cost net of accumulated depreciation and impairment losses. 2. Of the increase (decrease) during the fiscal year, the primary increase was ¥2,901 million ($34,899 thousand) from changes in use, and the primary decrease was ¥1,040 million
($12,508 thousand) from sales. 3. The market value as of the fiscal year-end is the amount calculated primarily based on the Real Estate Appraisal Standard (including adjustments made using indexes.).
7. Inventories
8. Vessels, Property, Plant and Equipment
9. Investment and Rental PropertyThe Company and certain of its consolidated subsidiaries own
offices and other buildings (including land) for earning rentals
and other purposes in Tokyo and in other regions. Profit from
rentals related to these properties (with main rental income
recorded as revenues and main rental expense recorded as costs
and expenses) in the current fiscal year totaled ¥3,977 million
($47,833 thousand) (with main rental income recorded as reve-
nues and main rental expenses recorded as costs and expenses),
and profit from sales totals ¥2,414 million ($29,039 thousand)
(mainly recorded as extraordinary profit).
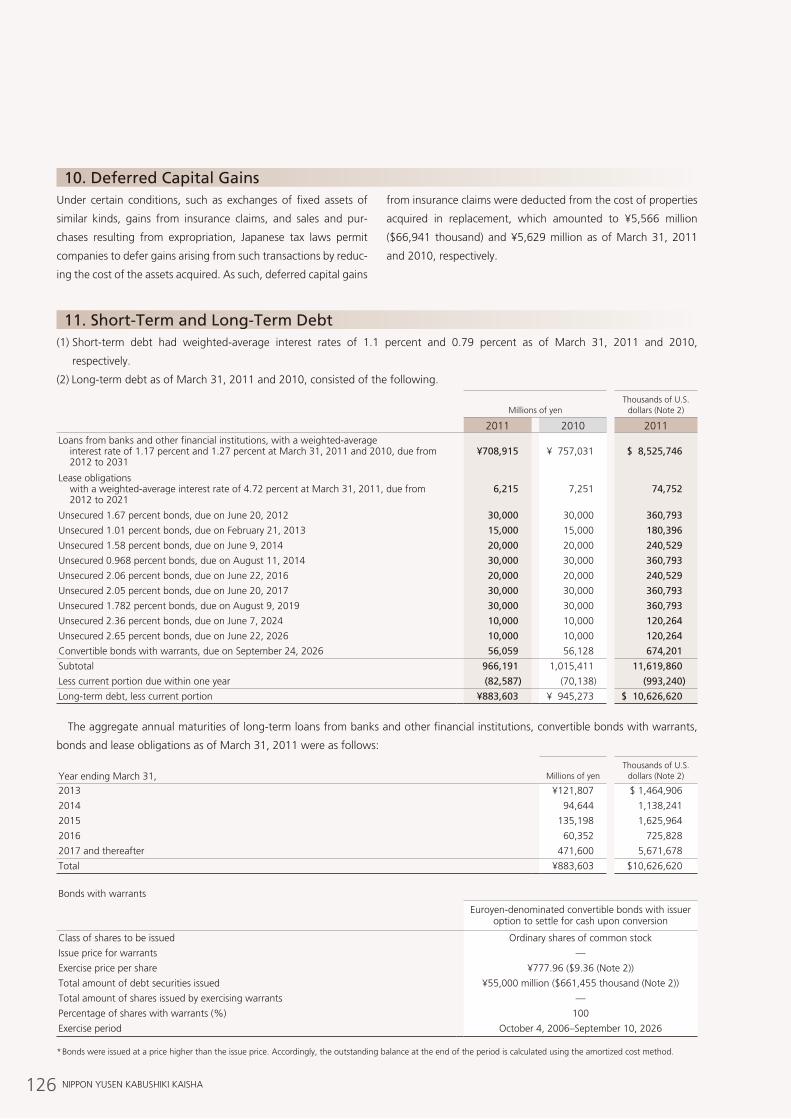
126 NIPPON YUSEN KABUSHIKI KAISHA
Under certain conditions, such as exchanges of fixed assets of
similar kinds, gains from insurance claims, and sales and pur-
chases resulting from expropriation, Japanese tax laws permit
companies to defer gains arising from such transactions by reduc-
ing the cost of the assets acquired. As such, deferred capital gains
from insurance claims were deducted from the cost of properties
acquired in replacement, which amounted to ¥5,566 million
($66,941 thousand) and ¥5,629 million as of March 31, 2011
and 2010, respectively.
10. Deferred Capital Gains
(1) Short-term debt had weighted-average interest rates of 1.1 percent and 0.79 percent as of March 31, 2011 and 2010,
respectively.
(2) Long-term debt as of March 31, 2011 and 2010, consisted of the following.
Millions of yen
Thousands of U.S. dollars (Note 2)
2011 2010 2011Loans from banks and other financial institutions, with a weighted-average interest rate of 1.17 percent and 1.27 percent at March 31, 2011 and 2010, due from
2012 to 2031¥708,915 ¥ 757,031 $ 8,525,746
Lease obligations with a weighted-average interest rate of 4.72 percent at March 31, 2011, due from
2012 to 20216,215 7,251 74,752
Unsecured 1.67 percent bonds, due on June 20, 2012 30,000 30,000 360,793
Unsecured 1.01 percent bonds, due on February 21, 2013 15,000 15,000 180,396
Unsecured 1.58 percent bonds, due on June 9, 2014 20,000 20,000 240,529
Unsecured 0.968 percent bonds, due on August 11, 2014 30,000 30,000 360,793
Unsecured 2.06 percent bonds, due on June 22, 2016 20,000 20,000 240,529
Unsecured 2.05 percent bonds, due on June 20, 2017 30,000 30,000 360,793
Unsecured 1.782 percent bonds, due on August 9, 2019 30,000 30,000 360,793
Unsecured 2.36 percent bonds, due on June 7, 2024 10,000 10,000 120,264
Unsecured 2.65 percent bonds, due on June 22, 2026 10,000 10,000 120,264
Convertible bonds with warrants, due on September 24, 2026 56,059 56,128 674,201
Subtotal 966,191 1,015,411 11,619,860
Less current portion due within one year (82,587) (70,138) (993,240)
Long-term debt, less current portion ¥883,603 ¥ 945,273 $ 10,626,620
The aggregate annual maturities of long-term loans from banks and other financial institutions, convertible bonds with warrants,
bonds and lease obligations as of March 31, 2011 were as follows:
Year ending March 31,
Millions of yen
Thousands of U.S. dollars (Note 2)
2013 ¥121,807 $ 1,464,906
2014 94,644 1,138,241
2015 135,198 1,625,964
2016 60,352 725,828
2017 and thereafter 471,600 5,671,678
Total ¥883,603 $10,626,620
Bonds with warrants
Euroyen-denominated convertible bonds with issuer option to settle for cash upon conversion
Class of shares to be issued Ordinary shares of common stock
Issue price for warrants —
Exercise price per share ¥777.96 ($9.36 (Note 2))
Total amount of debt securities issued ¥55,000 million ($661,455 thousand (Note 2))
Total amount of shares issued by exercising warrants —
Percentage of shares with warrants (%) 100
Exercise period October 4, 2006–September 10, 2026
* Bonds were issued at a price higher than the issue price. Accordingly, the outstanding balance at the end of the period is calculated using the amortized cost method.
11. Short-Term and Long-Term Debt
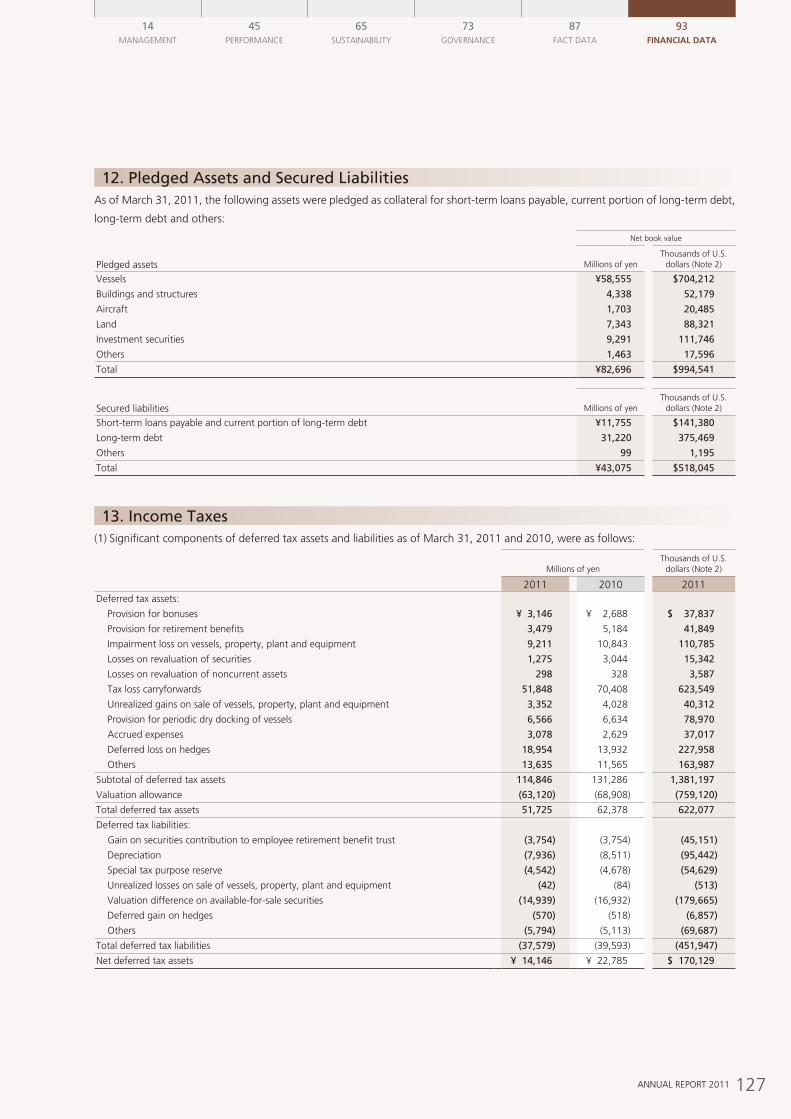
127ANNUAL REPORT 2011
14MANAGEMENT
45PERFORMANCE
65SUSTAINABILITY
73GOvERNANCE
87FACT DATA
93Financial data
As of March 31, 2011, the following assets were pledged as collateral for short-term loans payable, current portion of long-term debt,
long-term debt and others:
Net book value
Pledged assets
Millions of yen
Thousands of U.S. dollars (Note 2)
vessels ¥58,555 $704,212
Buildings and structures 4,338 52,179
Aircraft 1,703 20,485
Land 7,343 88,321
Investment securities 9,291 111,746
Others 1,463 17,596
Total ¥82,696 $994,541
Secured liabilities
Millions of yen
Thousands of U.S. dollars (Note 2)
Short-term loans payable and current portion of long-term debt ¥11,755 $141,380
Long-term debt 31,220 375,469
Others 99 1,195
Total ¥43,075 $518,045
(1) Significant components of deferred tax assets and liabilities as of March 31, 2011 and 2010, were as follows:
Millions of yen
Thousands of U.S. dollars (Note 2)
2011 2010 2011Deferred tax assets:
Provision for bonuses ¥ 3,146 ¥ 2,688 $ 37,837
Provision for retirement benefits 3,479 5,184 41,849
Impairment loss on vessels, property, plant and equipment 9,211 10,843 110,785
Losses on revaluation of securities 1,275 3,044 15,342
Losses on revaluation of noncurrent assets 298 328 3,587
Tax loss carryforwards 51,848 70,408 623,549
Unrealized gains on sale of vessels, property, plant and equipment 3,352 4,028 40,312
Provision for periodic dry docking of vessels 6,566 6,634 78,970
Accrued expenses 3,078 2,629 37,017
Deferred loss on hedges 18,954 13,932 227,958
Others 13,635 11,565 163,987
Subtotal of deferred tax assets 114,846 131,286 1,381,197
valuation allowance (63,120) (68,908) (759,120)
Total deferred tax assets 51,725 62,378 622,077
Deferred tax liabilities:
Gain on securities contribution to employee retirement benefit trust (3,754) (3,754) (45,151)
Depreciation (7,936) (8,511) (95,442)
Special tax purpose reserve (4,542) (4,678) (54,629)
Unrealized losses on sale of vessels, property, plant and equipment (42) (84) (513)
valuation difference on available-for-sale securities (14,939) (16,932) (179,665)
Deferred gain on hedges (570) (518) (6,857)
Others (5,794) (5,113) (69,687)
Total deferred tax liabilities (37,579) (39,593) (451,947)
Net deferred tax assets ¥ 14,146 ¥ 22,785 $ 170,129
12. Pledged Assets and Secured Liabilities
13. Income Taxes
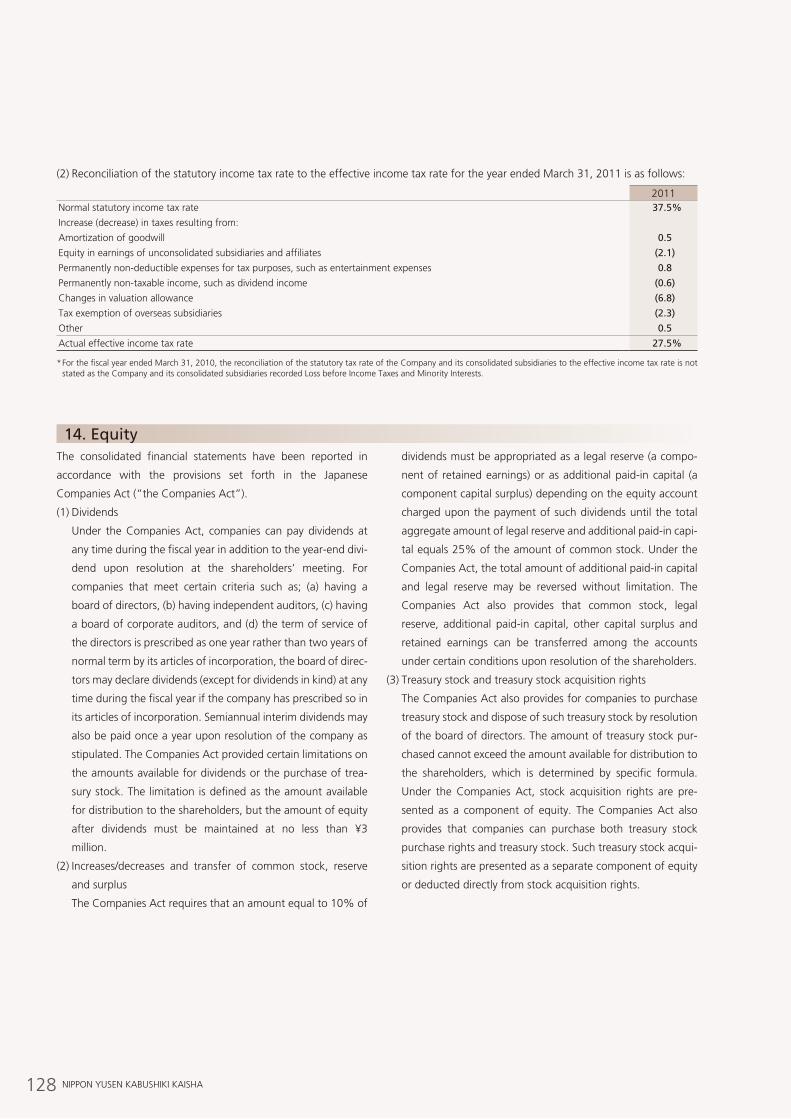
128 NIPPON YUSEN KABUSHIKI KAISHA
(2) Reconciliation of the statutory income tax rate to the effective income tax rate for the year ended March 31, 2011 is as follows:
2011Normal statutory income tax rate 37.5%
Increase (decrease) in taxes resulting from:
Amortization of goodwill 0.5
Equity in earnings of unconsolidated subsidiaries and affiliates (2.1)
Permanently non-deductible expenses for tax purposes, such as entertainment expenses 0.8
Permanently non-taxable income, such as dividend income (0.6)
Changes in valuation allowance (6.8)
Tax exemption of overseas subsidiaries (2.3)
Other 0.5
Actual effective income tax rate 27.5%
* For the fiscal year ended March 31, 2010, the reconciliation of the statutory tax rate of the Company and its consolidated subsidiaries to the effective income tax rate is not stated as the Company and its consolidated subsidiaries recorded Loss before Income Taxes and Minority Interests.
The consolidated financial statements have been reported in
accordance with the provisions set forth in the Japanese
Companies Act (“the Companies Act”).
(1) Dividends
Under the Companies Act, companies can pay dividends at
any time during the fiscal year in addition to the year-end divi-
dend upon resolution at the shareholders’ meeting. For
companies that meet certain criteria such as; (a) having a
board of directors, (b) having independent auditors, (c) having
a board of corporate auditors, and (d) the term of service of
the directors is prescribed as one year rather than two years of
normal term by its articles of incorporation, the board of direc-
tors may declare dividends (except for dividends in kind) at any
time during the fiscal year if the company has prescribed so in
its articles of incorporation. Semiannual interim dividends may
also be paid once a year upon resolution of the company as
stipulated. The Companies Act provided certain limitations on
the amounts available for dividends or the purchase of trea-
sury stock. The limitation is defined as the amount available
for distribution to the shareholders, but the amount of equity
after dividends must be maintained at no less than ¥3
million.
(2) Increases/decreases and transfer of common stock, reserve
and surplus
The Companies Act requires that an amount equal to 10% of
dividends must be appropriated as a legal reserve (a compo-
nent of retained earnings) or as additional paid-in capital (a
component capital surplus) depending on the equity account
charged upon the payment of such dividends until the total
aggregate amount of legal reserve and additional paid-in capi-
tal equals 25% of the amount of common stock. Under the
Companies Act, the total amount of additional paid-in capital
and legal reserve may be reversed without limitation. The
Companies Act also provides that common stock, legal
reserve, additional paid-in capital, other capital surplus and
retained earnings can be transferred among the accounts
under certain conditions upon resolution of the shareholders.
(3) Treasury stock and treasury stock acquisition rights
The Companies Act also provides for companies to purchase
treasury stock and dispose of such treasury stock by resolution
of the board of directors. The amount of treasury stock pur-
chased cannot exceed the amount available for distribution to
the shareholders, which is determined by specific formula.
Under the Companies Act, stock acquisition rights are pre-
sented as a component of equity. The Companies Act also
provides that companies can purchase both treasury stock
purchase rights and treasury stock. Such treasury stock acqui-
sition rights are presented as a separate component of equity
or deducted directly from stock acquisition rights.
14. Equity
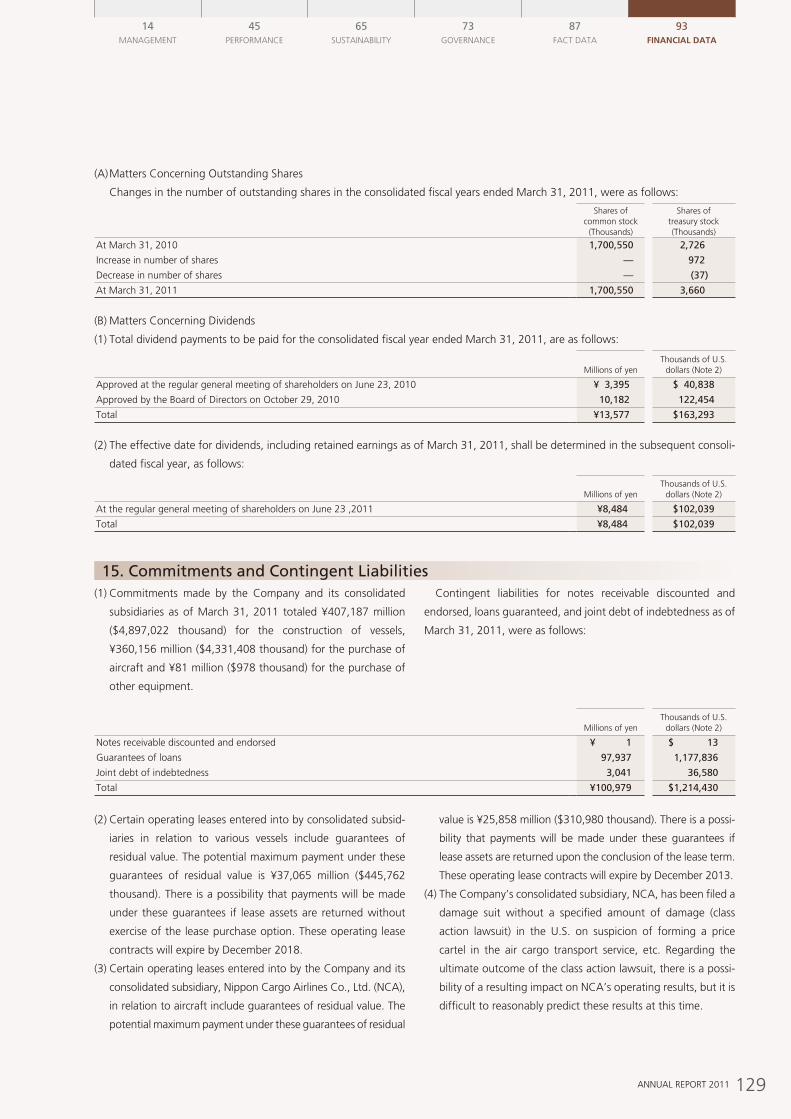
129ANNUAL REPORT 2011
14MANAGEMENT
45PERFORMANCE
65SUSTAINABILITY
73GOvERNANCE
87FACT DATA
93Financial data
(A) Matters Concerning Outstanding Shares
Changes in the number of outstanding shares in the consolidated fiscal years ended March 31, 2011, were as follows:
Shares of common stock
(Thousands)
Shares of treasury stock (Thousands)
At March 31, 2010 1,700,550 2,726
Increase in number of shares — 972
Decrease in number of shares — (37)
At March 31, 2011 1,700,550 3,660
(B) Matters Concerning Dividends
(1) Total dividend payments to be paid for the consolidated fiscal year ended March 31, 2011, are as follows:
Millions of yen
Thousands of U.S. dollars (Note 2)
Approved at the regular general meeting of shareholders on June 23, 2010 ¥ 3,395 $ 40,838
Approved by the Board of Directors on October 29, 2010 10,182 122,454
Total ¥13,577 $163,293
(2) The effective date for dividends, including retained earnings as of March 31, 2011, shall be determined in the subsequent consoli-
dated fiscal year, as follows:
Millions of yen
Thousands of U.S. dollars (Note 2)
At the regular general meeting of shareholders on June 23 ,2011 ¥8,484 $102,039
Total ¥8,484 $102,039
Millions of yen
Thousands of U.S. dollars (Note 2)
Notes receivable discounted and endorsed ¥ 1 $ 13
Guarantees of loans 97,937 1,177,836
Joint debt of indebtedness 3,041 36,580
Total ¥100,979 $1,214,430
(1) Commitments made by the Company and its consolidated
subsidiaries as of March 31, 2011 totaled ¥407,187 million
($4,897,022 thousand) for the construction of vessels,
¥360,156 million ($4,331,408 thousand) for the purchase of
aircraft and ¥81 million ($978 thousand) for the purchase of
other equipment.
Contingent liabilities for notes receivable discounted and
endorsed, loans guaranteed, and joint debt of indebtedness as of
March 31, 2011, were as follows:
15. Commitments and Contingent Liabilities
(2) Certain operating leases entered into by consolidated subsid-
iaries in relation to various vessels include guarantees of
residual value. The potential maximum payment under these
guarantees of residual value is ¥37,065 million ($445,762
thousand). There is a possibility that payments will be made
under these guarantees if lease assets are returned without
exercise of the lease purchase option. These operating lease
contracts will expire by December 2018.
(3) Certain operating leases entered into by the Company and its
consolidated subsidiary, Nippon Cargo Airlines Co., Ltd. (NCA),
in relation to aircraft include guarantees of residual value. The
potential maximum payment under these guarantees of residual
value is ¥25,858 million ($310,980 thousand). There is a possi-
bility that payments will be made under these guarantees if
lease assets are returned upon the conclusion of the lease term.
These operating lease contracts will expire by December 2013.
(4) The Company’s consolidated subsidiary, NCA, has been filed a
damage suit without a specified amount of damage (class
action lawsuit) in the U.S. on suspicion of forming a price
cartel in the air cargo transport service, etc. Regarding the
ultimate outcome of the class action lawsuit, there is a possi-
bility of a resulting impact on NCA’s operating results, but it is
difficult to reasonably predict these results at this time.
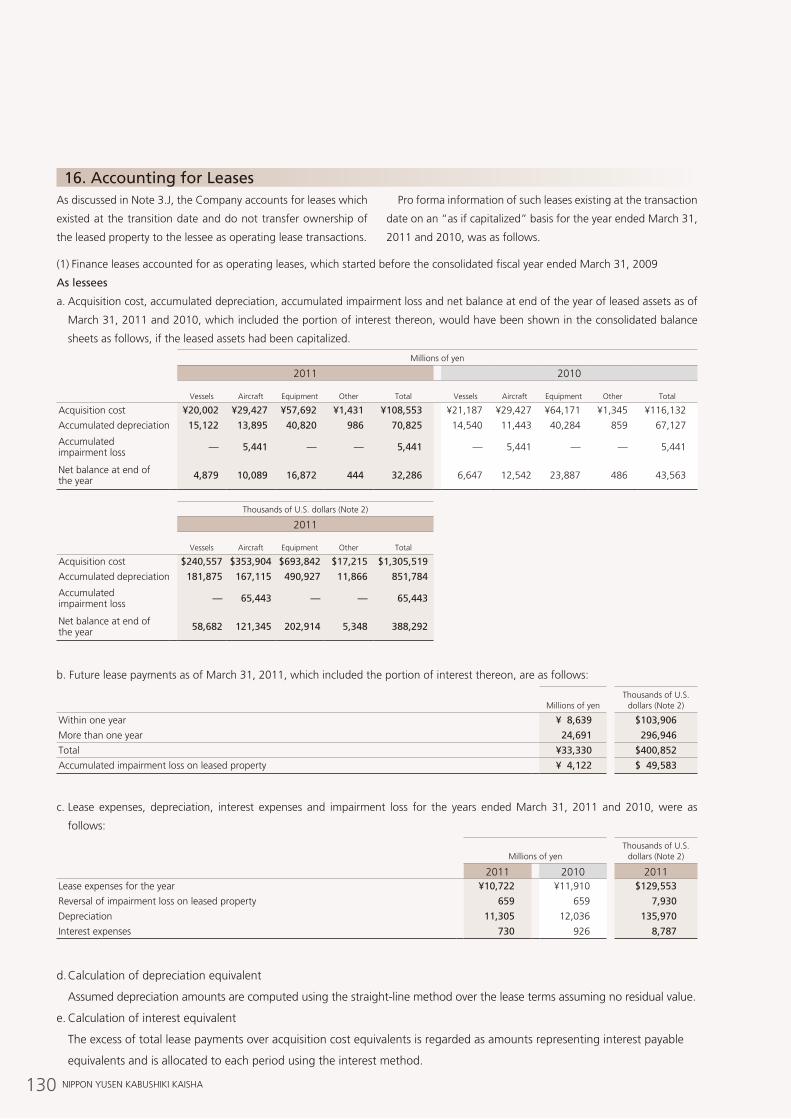
130 NIPPON YUSEN KABUSHIKI KAISHA
As discussed in Note 3.J, the Company accounts for leases which
existed at the transition date and do not transfer ownership of
the leased property to the lessee as operating lease transactions.
Pro forma information of such leases existing at the transaction
date on an “as if capitalized” basis for the year ended March 31,
2011 and 2010, was as follows.
(1) Finance leases accounted for as operating leases, which started before the consolidated fiscal year ended March 31, 2009
As lessees
a. Acquisition cost, accumulated depreciation, accumulated impairment loss and net balance at end of the year of leased assets as of
March 31, 2011 and 2010, which included the portion of interest thereon, would have been shown in the consolidated balance
sheets as follows, if the leased assets had been capitalized.
Millions of yen
2011 2010
vessels Aircraft Equipment Other Total vessels Aircraft Equipment Other Total
Acquisition cost ¥20,002 ¥29,427 ¥57,692 ¥1,431 ¥108,553 ¥21,187 ¥29,427 ¥64,171 ¥1,345 ¥116,132
Accumulated depreciation 15,122 13,895 40,820 986 70,825 14,540 11,443 40,284 859 67,127
Accumulated impairment loss — 5,441 — — 5,441 — 5,441 — — 5,441
Net balance at end of the year 4,879 10,089 16,872 444 32,286 6,647 12,542 23,887 486 43,563
Thousands of U.S. dollars (Note 2)
2011
vessels Aircraft Equipment Other Total
Acquisition cost $240,557 $353,904 $693,842 $17,215 $1,305,519
Accumulated depreciation 181,875 167,115 490,927 11,866 851,784
Accumulated impairment loss — 65,443 — — 65,443
Net balance at end of the year 58,682 121,345 202,914 5,348 388,292
b. Future lease payments as of March 31, 2011, which included the portion of interest thereon, are as follows:
Millions of yen
Thousands of U.S. dollars (Note 2)
Within one year ¥ 8,639 $103,906
More than one year 24,691 296,946
Total ¥33,330 $400,852
Accumulated impairment loss on leased property ¥ 4,122 $ 49,583
c. Lease expenses, depreciation, interest expenses and impairment loss for the years ended March 31, 2011 and 2010, were as
follows:
Millions of yen
Thousands of U.S. dollars (Note 2)
2011 2010 2011Lease expenses for the year ¥10,722 ¥11,910 $129,553
Reversal of impairment loss on leased property 659 659 7,930
Depreciation 11,305 12,036 135,970
Interest expenses 730 926 8,787
d. Calculation of depreciation equivalent
Assumed depreciation amounts are computed using the straight-line method over the lease terms assuming no residual value.
e. Calculation of interest equivalent
The excess of total lease payments over acquisition cost equivalents is regarded as amounts representing interest payable
equivalents and is allocated to each period using the interest method.
16. Accounting for Leases
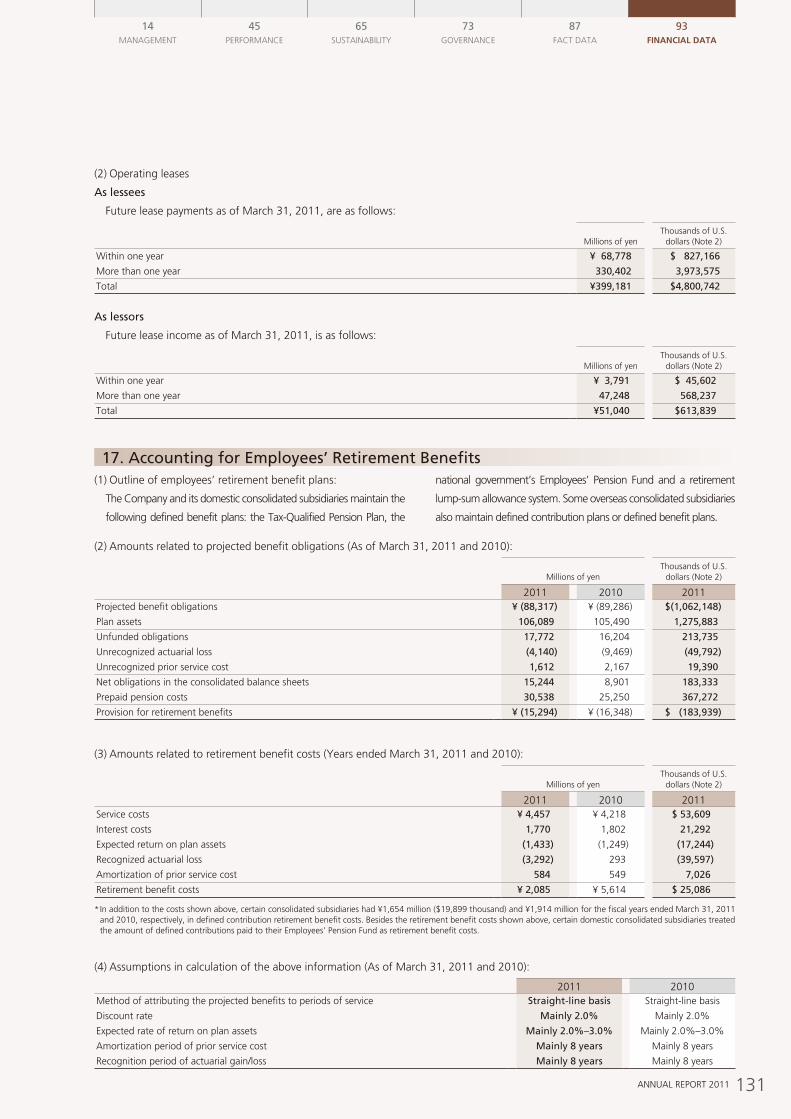
131ANNUAL REPORT 2011
14MANAGEMENT
45PERFORMANCE
65SUSTAINABILITY
73GOvERNANCE
87FACT DATA
93Financial data
(2) Operating leases
As lessees
Future lease payments as of March 31, 2011, are as follows:
Millions of yen
Thousands of U.S. dollars (Note 2)
Within one year ¥ 68,778 $ 827,166
More than one year 330,402 3,973,575
Total ¥399,181 $4,800,742
As lessors
Future lease income as of March 31, 2011, is as follows:
Millions of yen
Thousands of U.S. dollars (Note 2)
Within one year ¥ 3,791 $ 45,602
More than one year 47,248 568,237
Total ¥51,040 $613,839
(1) Outline of employees’ retirement benefit plans:
The Company and its domestic consolidated subsidiaries maintain the
following defined benefit plans: the Tax-Qualified Pension Plan, the
national government’s Employees’ Pension Fund and a retirement
lump-sum allowance system. Some overseas consolidated subsidiaries
also maintain defined contribution plans or defined benefit plans.
17. Accounting for Employees’ Retirement Benefits
(2) Amounts related to projected benefit obligations (As of March 31, 2011 and 2010):
Millions of yen
Thousands of U.S. dollars (Note 2)
2011 2010 2011Projected benefit obligations ¥ (88,317) ¥ (89,286) $(1,062,148)
Plan assets 106,089 105,490 1,275,883
Unfunded obligations 17,772 16,204 213,735
Unrecognized actuarial loss (4,140) (9,469) (49,792)
Unrecognized prior service cost 1,612 2,167 19,390
Net obligations in the consolidated balance sheets 15,244 8,901 183,333
Prepaid pension costs 30,538 25,250 367,272
Provision for retirement benefits ¥ (15,294) ¥ (16,348) $ (183,939)
(3) Amounts related to retirement benefit costs (Years ended March 31, 2011 and 2010):
Millions of yen
Thousands of U.S. dollars (Note 2)
2011 2010 2011Service costs ¥ 4,457 ¥ 4,218 $ 53,609
Interest costs 1,770 1,802 21,292
Expected return on plan assets (1,433) (1,249) (17,244)
Recognized actuarial loss (3,292) 293 (39,597)
Amortization of prior service cost 584 549 7,026
Retirement benefit costs ¥ 2,085 ¥ 5,614 $ 25,086
* In addition to the costs shown above, certain consolidated subsidiaries had ¥1,654 million ($19,899 thousand) and ¥1,914 million for the fiscal years ended March 31, 2011 and 2010, respectively, in defined contribution retirement benefit costs. Besides the retirement benefit costs shown above, certain domestic consolidated subsidiaries treated the amount of defined contributions paid to their Employees’ Pension Fund as retirement benefit costs.
(4) Assumptions in calculation of the above information (As of March 31, 2011 and 2010):
2011 2010Method of attributing the projected benefits to periods of service Straight-line basis Straight-line basis
Discount rate Mainly 2.0% Mainly 2.0%
Expected rate of return on plan assets Mainly 2.0%–3.0% Mainly 2.0%–3.0%
Amortization period of prior service cost Mainly 8 years Mainly 8 years
Recognition period of actuarial gain/loss Mainly 8 years Mainly 8 years

132 NIPPON YUSEN KABUSHIKI KAISHA
A. Industry Segment Information
The Company and its consolidated subsidiaries operate in eight businesses: Liner Trade, Bulk Shipping, Logistics, Terminal and Harbor
Transport, Cruise, Air Cargo Transport, Real Estate and Others. The table below presents certain segment information for the fiscal year
ended March 31, 2010.
Millions of yen
Liner TradeBulk
Shipping Logistics
Terminal andHarbor
Transport Cruise
AirCargo
TransportReal
Estate Others Total
Eliminationor
CorporateConsolidated
Total
I Revenues and Operating Income (Loss)
Revenues:
(1) Revenues from customers ¥374,035 ¥ 727,665 ¥340,437 ¥ 85,249 ¥ 35,155 ¥ 55,493 ¥ 9,828 ¥ 69,477 ¥1,697,342 ¥ — ¥1,697,342
(2) Inter-segment revenues 4,050 5,805 1,345 25,030 — 7,086 2,326 86,504 132,148 (132,148) —
Total revenues 378,085 733,471 341,782 110,279 35,155 62,579 12,154 155,981 1,829,491 (132,148) 1,697,342
Operating costs and expenses 429,823 687,718 340,592 106,949 38,859 77,938 8,413 157,303 1,847,599 (132,162) 1,715,437
Operating income (loss) ¥ (51,737) ¥ 45,752 ¥ 1,190 ¥ 3,330 ¥ (3,703) ¥(15,358) ¥ 3,740 ¥ (1,321) ¥ (18,108) ¥13 ¥ (18,094)
II Total Assets, Depreciation and Amortization, Impairment Loss, and Capital Expenditures
Total assets ¥275,877 ¥1,237,619 ¥208,477 ¥135,983 ¥ 33,214 ¥ 64,329 ¥56,790 ¥507,599 ¥2,519,891 ¥(312,727) ¥2,207,163
Depreciation and amortization 8,452 73,353 6,563 4,676 1,796 688 1,027 1,472 98,031 (11) 98,019
Impairment loss — 932 878 1,995 — 292 — — 4,098 — 4,098
Capital expenditures 41,900 169,890 7,120 6,366 2,823 9,393 307 167 237,969 — 237,969
Within the asset balance for the consolidated fiscal year ended March 31, 2010, company-wide assets included under Elimination or
Corporate had a value of ¥141,186 million ($1,517,484 thousand). A primary component of this amount is the Company’s investment
of surplus funds (cash and deposit).
B. Geographical Segment Information
Major countries and regions in each segment are as follows:
North America: United States and Canada
Europe: United Kingdom, Germany, the Netherlands, Italy, France and Belgium
Asia: Singapore, Thailand, Hong Kong and China
Others: Australia
The table below contains segment information for the fiscal year ended March 31, 2010.
Millions of yen
Japan North America Europe Asia Others TotalElimination or
Corporate Consolidated
I Revenues and Operating Income (Loss)
Revenues:
(1) Revenues from customers ¥1,259,304 ¥128,835 ¥180,385 ¥115,554 ¥13,263 ¥1,697,342 ¥ — ¥1,697,342
(2) Inter-segment revenues 35,377 25,446 14,903 15,141 1,964 92,832 (92,832) —
Subtotal 1,294,681 154,281 195,288 130,695 15,227 1,790,174 (92,832) 1,697,342
Operating costs and expenses 1,327,001 155,583 185,125 125,907 15,182 1,808,801 (93,364) 1,715,437
Operating income (loss) ¥ (32,320) ¥ (1,301) ¥ 10,162 ¥ 4,788 ¥ 44 ¥ (18,626) ¥ 531 ¥ (18,094)
II Total assets ¥1,867,130 ¥ 83,535 ¥267,766 ¥280,224 ¥12,145 ¥2,510,802 ¥(303,638) ¥2,207,163
Within the asset balance for the consolidated fiscal year ended March 31, 2010, company-wide assets included under Elimination or
Corporate had a value of ¥141,186 million ($1,517,484 thousand). A primary component of this amount is the Company’s investment
of surplus funds (cash and deposit).
18. Segment Information
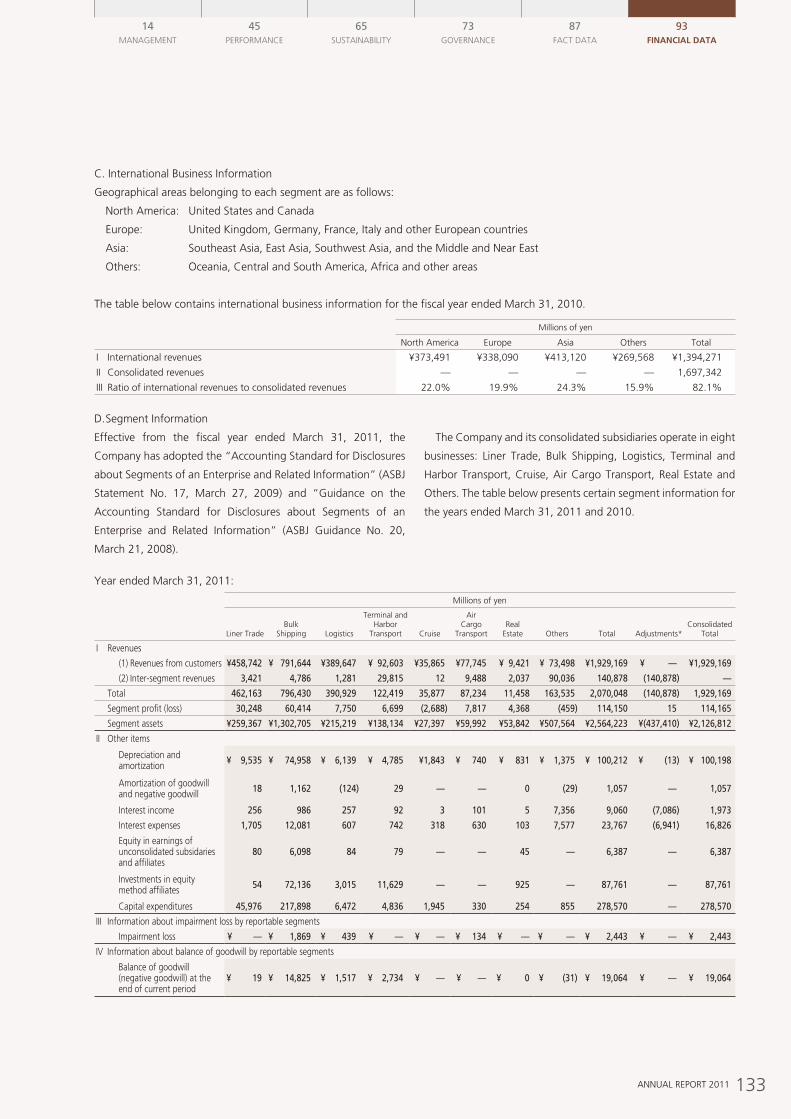
133ANNUAL REPORT 2011
14MANAGEMENT
45PERFORMANCE
65SUSTAINABILITY
73GOvERNANCE
87FACT DATA
93Financial data
C. International Business Information
Geographical areas belonging to each segment are as follows:
North America: United States and Canada
Europe: United Kingdom, Germany, France, Italy and other European countries
Asia: Southeast Asia, East Asia, Southwest Asia, and the Middle and Near East
Others: Oceania, Central and South America, Africa and other areas
The table below contains international business information for the fiscal year ended March 31, 2010.
Millions of yen
North America Europe Asia Others Total
I International revenues ¥373,491 ¥338,090 ¥413,120 ¥269,568 ¥1,394,271
II Consolidated revenues — — — — 1,697,342
III Ratio of international revenues to consolidated revenues 22.0% 19.9% 24.3% 15.9% 82.1%
D. Segment Information
Effective from the fiscal year ended March 31, 2011, the
Company has adopted the “Accounting Standard for Disclosures
about Segments of an Enterprise and Related Information” (ASBJ
Statement No. 17, March 27, 2009) and “Guidance on the
Accounting Standard for Disclosures about Segments of an
Enterprise and Related Information” (ASBJ Guidance No. 20,
March 21, 2008).
The Company and its consolidated subsidiaries operate in eight
businesses: Liner Trade, Bulk Shipping, Logistics, Terminal and
Harbor Transport, Cruise, Air Cargo Transport, Real Estate and
Others. The table below presents certain segment information for
the years ended March 31, 2011 and 2010.
Year ended March 31, 2011:
Millions of yen
Liner TradeBulk
Shipping Logistics
Terminal andHarbor
Transport Cruise
AirCargo
TransportReal
Estate Others Total Adjustments*Consolidated
Total
I Revenues
(1) Revenues from customers ¥458,742 ¥ 791,644 ¥389,647 ¥ 92,603 ¥35,865 ¥77,745 ¥ 9,421 ¥ 73,498 ¥1,929,169 ¥ — ¥1,929,169
(2) Inter-segment revenues 3,421 4,786 1,281 29,815 12 9,488 2,037 90,036 140,878 (140,878) —
Total 462,163 796,430 390,929 122,419 35,877 87,234 11,458 163,535 2,070,048 (140,878) 1,929,169
Segment profit (loss) 30,248 60,414 7,750 6,699 (2,688) 7,817 4,368 (459) 114,150 15 114,165
Segment assets ¥259,367 ¥1,302,705 ¥215,219 ¥138,134 ¥27,397 ¥59,992 ¥53,842 ¥507,564 ¥2,564,223 ¥(437,410) ¥2,126,812
II Other items
Depreciation and amortization ¥ 9,535 ¥ 74,958 ¥ 6,139 ¥ 4,785 ¥1,843 ¥ 740 ¥ 831 ¥ 1,375 ¥ 100,212 ¥ (13) ¥ 100,198
Amortization of goodwill and negative goodwill 18 1,162 (124) 29 — — 0 (29) 1,057 — 1,057
Interest income 256 986 257 92 3 101 5 7,356 9,060 (7,086) 1,973
Interest expenses 1,705 12,081 607 742 318 630 103 7,577 23,767 (6,941) 16,826
Equity in earnings of unconsolidated subsidaries and affiliates
80 6,098 84 79 — — 45 — 6,387 — 6,387
Investments in equity method affiliates 54 72,136 3,015 11,629 — — 925 — 87,761 — 87,761
Capital expenditures 45,976 217,898 6,472 4,836 1,945 330 254 855 278,570 — 278,570
III Information about impairment loss by reportable segments
Impairment loss ¥ — ¥ 1,869 ¥ 439 ¥ — ¥ — ¥ 134 ¥ — ¥ — ¥ 2,443 ¥ — ¥ 2,443
Iv Information about balance of goodwill by reportable segments
Balance of goodwill (negative goodwill) at the end of current period
¥ 19 ¥ 14,825 ¥ 1,517 ¥ 2,734 ¥ — ¥ — ¥ 0 ¥ (31) ¥ 19,064 ¥ — ¥ 19,064
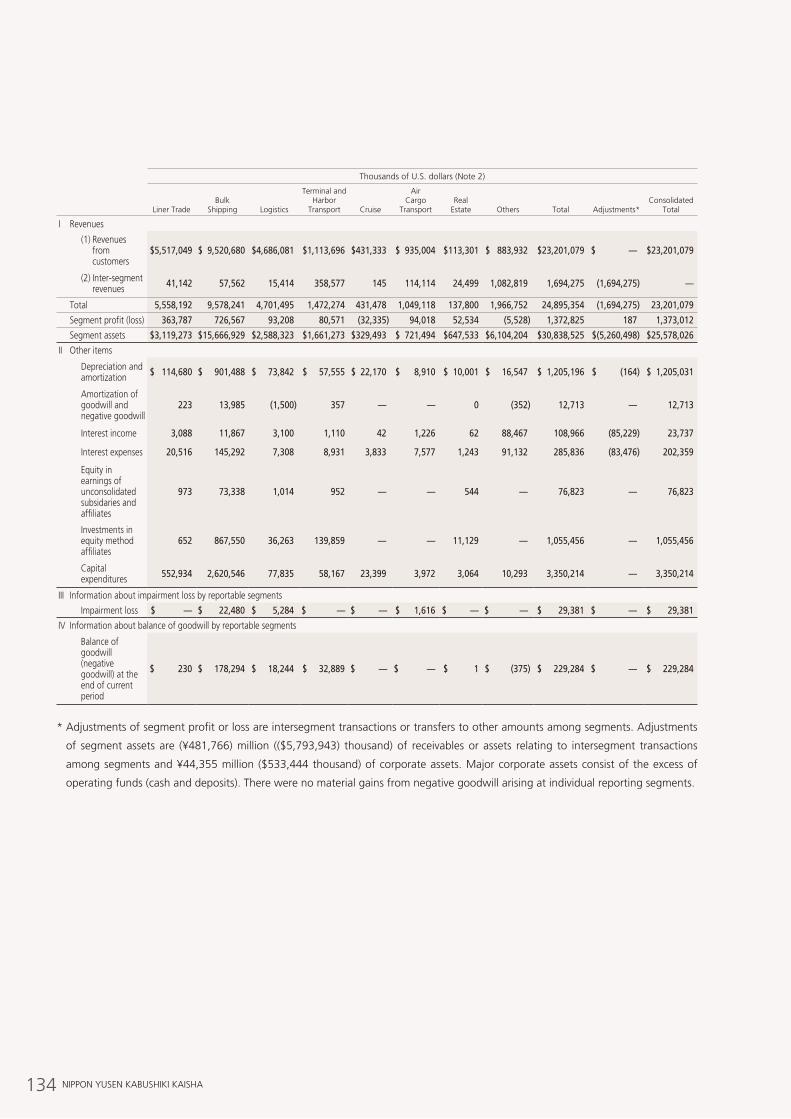
134 NIPPON YUSEN KABUSHIKI KAISHA
Thousands of U.S. dollars (Note 2)
Liner TradeBulk
Shipping Logistics
Terminal andHarbor
Transport Cruise
AirCargo
TransportReal
Estate Others Total Adjustments*Consolidated
Total
I Revenues
(1) Revenues from customers
$5,517,049 $ 9,520,680 $4,686,081 $1,113,696 $431,333 $ 935,004 $113,301 $ 883,932 $23,201,079 $ — $23,201,079
(2) Inter-segment revenues 41,142 57,562 15,414 358,577 145 114,114 24,499 1,082,819 1,694,275 (1,694,275) —
Total 5,558,192 9,578,241 4,701,495 1,472,274 431,478 1,049,118 137,800 1,966,752 24,895,354 (1,694,275) 23,201,079
Segment profit (loss) 363,787 726,567 93,208 80,571 (32,335) 94,018 52,534 (5,528) 1,372,825 187 1,373,012
Segment assets $3,119,273 $15,666,929 $2,588,323 $1,661,273 $329,493 $ 721,494 $647,533 $6,104,204 $30,838,525 $(5,260,498) $25,578,026
II Other items
Depreciation and amortization $ 114,680 $ 901,488 $ 73,842 $ 57,555 $ 22,170 $ 8,910 $ 10,001 $ 16,547 $ 1,205,196 $ (164) $ 1,205,031
Amortization of goodwill and negative goodwill
223 13,985 (1,500) 357 — — 0 (352) 12,713 — 12,713
Interest income 3,088 11,867 3,100 1,110 42 1,226 62 88,467 108,966 (85,229) 23,737
Interest expenses 20,516 145,292 7,308 8,931 3,833 7,577 1,243 91,132 285,836 (83,476) 202,359
Equity in earnings of unconsolidated subsidaries and affiliates
973 73,338 1,014 952 — — 544 — 76,823 — 76,823
Investments in equity method affiliates
652 867,550 36,263 139,859 — — 11,129 — 1,055,456 — 1,055,456
Capital expenditures 552,934 2,620,546 77,835 58,167 23,399 3,972 3,064 10,293 3,350,214 — 3,350,214
III Information about impairment loss by reportable segments
Impairment loss $ — $ 22,480 $ 5,284 $ — $ — $ 1,616 $ — $ — $ 29,381 $ — $ 29,381
Iv Information about balance of goodwill by reportable segments
Balance of goodwill (negative goodwill) at the end of current period
$ 230 $ 178,294 $ 18,244 $ 32,889 $ — $ — $ 1 $ (375) $ 229,284 $ — $ 229,284
* Adjustments of segment profit or loss are intersegment transactions or transfers to other amounts among segments. Adjustments
of segment assets are (¥481,766) million (($5,793,943) thousand) of receivables or assets relating to intersegment transactions
among segments and ¥44,355 million ($533,444 thousand) of corporate assets. Major corporate assets consist of the excess of
operating funds (cash and deposits). There were no material gains from negative goodwill arising at individual reporting segments.
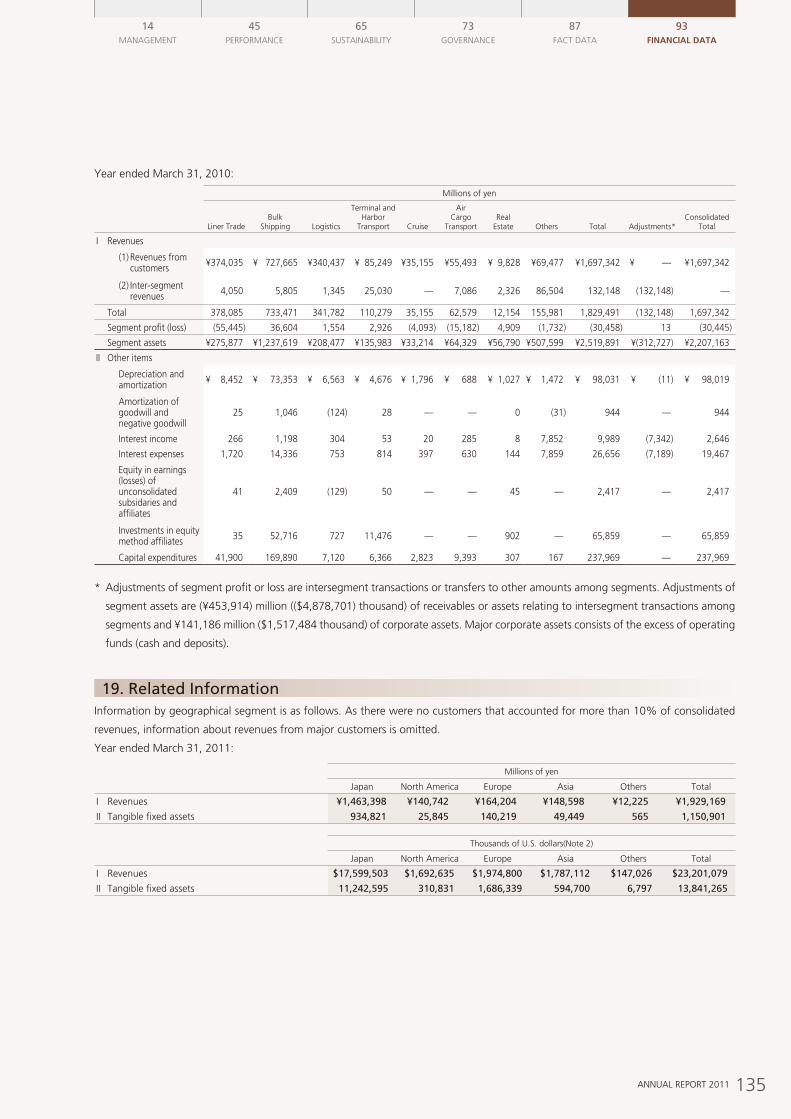
135ANNUAL REPORT 2011
14MANAGEMENT
45PERFORMANCE
65SUSTAINABILITY
73GOvERNANCE
87FACT DATA
93Financial data
Year ended March 31, 2010:
Millions of yen
Liner TradeBulk
Shipping Logistics
Terminal andHarbor
Transport Cruise
AirCargo
TransportReal
Estate Others Total Adjustments*Consolidated
Total
I Revenues
(1) Revenues from customers ¥374,035 ¥ 727,665 ¥340,437 ¥ 85,249 ¥35,155 ¥55,493 ¥ 9,828 ¥69,477 ¥1,697,342 ¥ — ¥1,697,342
(2) Inter-segment revenues 4,050 5,805 1,345 25,030 — 7,086 2,326 86,504 132,148 (132,148) —
Total 378,085 733,471 341,782 110,279 35,155 62,579 12,154 155,981 1,829,491 (132,148) 1,697,342
Segment profit (loss) (55,445) 36,604 1,554 2,926 (4,093) (15,182) 4,909 (1,732) (30,458) 13 (30,445)
Segment assets ¥275,877 ¥1,237,619 ¥208,477 ¥135,983 ¥33,214 ¥64,329 ¥56,790 ¥507,599 ¥2,519,891 ¥(312,727) ¥2,207,163
II Other items
Depreciation and amortization ¥ 8,452 ¥ 73,353 ¥ 6,563 ¥ 4,676 ¥ 1,796 ¥ 688 ¥ 1,027 ¥ 1,472 ¥ 98,031 ¥ (11) ¥ 98,019
Amortization of goodwill and negative goodwill
25 1,046 (124) 28 — — 0 (31) 944 — 944
Interest income 266 1,198 304 53 20 285 8 7,852 9,989 (7,342) 2,646
Interest expenses 1,720 14,336 753 814 397 630 144 7,859 26,656 (7,189) 19,467
Equity in earnings (losses) of unconsolidated subsidaries and affiliates
41 2,409 (129) 50 — — 45 — 2,417 — 2,417
Investments in equity method affiliates 35 52,716 727 11,476 — — 902 — 65,859 — 65,859
Capital expenditures 41,900 169,890 7,120 6,366 2,823 9,393 307 167 237,969 — 237,969
* Adjustments of segment profit or loss are intersegment transactions or transfers to other amounts among segments. Adjustments of
segment assets are (¥453,914) million (($4,878,701) thousand) of receivables or assets relating to intersegment transactions among
segments and ¥141,186 million ($1,517,484 thousand) of corporate assets. Major corporate assets consists of the excess of operating
funds (cash and deposits).
Information by geographical segment is as follows. As there were no customers that accounted for more than 10% of consolidated
revenues, information about revenues from major customers is omitted.
Year ended March 31, 2011:
Millions of yen
Japan North America Europe Asia Others Total
I Revenues ¥1,463,398 ¥140,742 ¥164,204 ¥148,598 ¥12,225 ¥1,929,169
II Tangible fixed assets 934,821 25,845 140,219 49,449 565 1,150,901
Thousands of U.S. dollars(Note 2)
Japan North America Europe Asia Others Total
I Revenues $17,599,503 $1,692,635 $1,974,800 $1,787,112 $147,026 $23,201,079
II Tangible fixed assets 11,242,595 310,831 1,686,339 594,700 6,797 13,841,265
19. Related Information
136 NIPPON YUSEN KABUSHIKI KAISHA
The Company was contingently liable as guarantors of indebtedness of related parties at March 31, 2011 and 2010 as follows:
Millions of yen
Thousands of U.S. dollars (Note 2)
2011 2010 2011Guarantee amount ¥31,303 ¥32,961 $376,466
Transactions under common control
(Merger with Taiheiyo Kaiun Co., Ltd.)
For the year ended March 31, 2011
Based on a meeting of the Board of Directors held on July 29,
2010, the Company absorbed its wholly owned subsidiary,
Taiheiyo Kaiun Co., Ltd., effective October 1, 2010.
1. Name and businesses of combined companies, date of busi-
ness combination, legal framework of business combination,
name of companies subsequent to the combination, and
overview of the transaction, including its objectives.
(1) Name and Business Description of the Companies under
Business Combination
Name of Companies under Business Combination: Taiheiyo
Kaiun Co., Ltd. (consolidated subsidiary)
Business Description: Ship operation, leasing, and management
(2) Date of Business Combination
October 1, 2010
(3) Legal Framework of Business Combination
Absorption-type merger, with the Company as the surviving
entity and Taiheiyo Kaiun Co., Ltd. as the absorbed company.
(4) Name of Company Subsequent to the Combination
Nippon Yusen Kabushiki Kaisha
(5) Overview of the Transaction, including its Objectives
Taiheiyo Kaiun Co., Ltd. was made a wholly owned subsidiary
of the Company via a capital increase via third-party alloca-
tion of shares carried out in June 2009 and a share exchange
carried out on December 1, 2009, for the purpose of acquir-
ing the proprietary vessel operations and sophisticated
expertise developed by Taiheiyo Kaiun Co., Ltd. and expand-
ing the Company’s small and medium-sized tanker business.
Building on this, the merger aims to further strengthen and
effectively expand the business base for bulk and energy
transport operations, and in particular for the transport of
petroleum products and chemicals.
Because the Company held all of the outstanding shares
of Taiheiyo Kaiun Co., Ltd., no new shares were issued,
capital was not increased, and no monies were paid as a
result of the merger.
2. Overview of Accounting Treatment of Transaction
The merger was accounted for as a transaction under common
control as per “Accounting Standard for Business Combinations”
(ASBJ Statement No. 21, December 26, 2008) and the “Revised
Guidance on Accounting Standard for Business Combinations
and Accounting Standard for Business Divestitures” (ASBJ
Guidance No. 10, December 26, 2008).
(Transfer of business from Tokyo Senpaku Kaisha, Ltd.)
Based on a contract for the transfer of business dated August 26,
2010, the container ship business of the Company’s wholly
owned subsidiary, Tokyo Senpaku Kaisha, Ltd., was transferred
to the Company effective November 1, 2010.
1. Name and businesses of combined companies, date of busi-
ness combination, legal framework of business combination,
name of companies subsequent to the combination, and
overview of the transaction, including its objectives.
(1) Name and Business Description of the Companies under
Business Combination
Name of Companies under Business Combination: Tokyo
Senpaku Kaisha, Ltd.
Business Description: Container ship operations
(2) Date of Business Combination
November 1, 2010
(3) Legal Framework of Business Combination
Business transfer, with the Company as the receiving entity
and Tokyo Senpaku Kaisha, as the transferring company.
(4) Name of Company Subsequent to the Combination
There were no changes in the names of the companies.
(5) Overview of the Transaction, including its Objectives
The transfer was carried out with the aim of enhancing the
efficiency of the NYK Group’s liner operations by integrating
the management of all lines of the East-West and North-South
container lines operated by the Company and the intra-Asia
container lines operated by Tokyo Senpaku Kaisha, and to be
able to offer a more competitive, diverse range of services.
20. Related Party Transactions
21. Business Combinations
137ANNUAL REPORT 2011
14MANAGEMENT
45PERFORMANCE
65SUSTAINABILITY
73GOvERNANCE
87FACT DATA
93Financial data
2. Overview of Accounting Treatment of Transaction
The transfer was accounted for as a transaction under common
control as per “Accounting Standard for Business Combinations”
(ASBJ Statement No. 21, December 26, 2008) and the “Revised
Guidance on Accounting Standard for Business Combinations
and Accounting Standard for Business Divestitures” (ASBJ
Guidance No. 10, December 26, 2008).
Appropriation of Retained Earnings
The following appropriation of retained earnings at March 31, 2011 was approved at the Company’s shareholders’ meeting held on
June 23, 2011:
Millions of yen
Thousands of U.S. dollars (Note 2)
Year-end cash dividends, ¥5.00 ($0.06) per share ¥8,484 $102,039
22. Subsequent Event
138 NIPPON YUSEN KABUSHIKI KAISHA
Management’s Report on Internal Control Over Financial Reporting
1. Matters relating to the basic framework of internal control over financial reportingYasumi Kudo, President, President Corporate Officer, and Tadaaki Naito, Representative Director, Senior Managing Corporate Officer,
are responsible for designing and operating effective internal control over financial reporting of the Company and have designed and
operated internal control over financial reporting of the consolidated financial statements in accordance with the basic framework for
internal control set forth in “On the Setting of the Standards and Practice Standards for Management Assessment and Audit concern-
ing Internal Control Over Financial Reporting (Council Opinions)” published by the Business Accounting Council.
The internal control is designed to achieve its objectives to the extent reasonable through the effective function and combination of
its basic elements. Therefore, there is a possibility that material misstatements may not be completely prevented or detected by internal
control over financial reporting.
2. Matters relating to the scope of assessment, the basis date of assessment and the assessment proceduresThe assessment of internal control over financial reporting was performed as of March 31, 2011, which is the end of this fiscal year.
The assessment was performed in accordance with assessment standards for internal control over financial reporting generally accepted
in Japan.
In conducting this assessment, we evaluated internal controls which may have a material effect on our entire financial reporting on
a consolidated basis (“company-level controls”) and based on the results of this assessment, we selected business processes to be
tested. We analyzed these selected business processes, identified key controls that may have a material impact on the reliability of the
Company’s financial reporting, and assessed the design and operation of these key controls. These procedures have allowed us to
evaluate the effectiveness of the internal controls of the Company.
We determined the required scope of assessment of internal control over financial reporting for the Company, as well as its consoli-
dated subsidiaries and equity-method affiliated companies, from the perspective of the materiality that may affect the reliability of their
financial reporting. The materiality that may affect the reliability of the financial reporting is determined taking into account the
materiality of quantitative and qualitative impacts on financial reporting. In light of the results of assessment of company-level controls
conducted for the Company and consolidated subsidiaries, we reasonably determined the scope of assessment of process-level con-
trols. Regarding the consolidated subsidiaries and the equity-method affiliated companies that do not have a material effect on
financial reporting, we did not include them in the scope of assessment of company-level controls.
Regarding the scope of assessment of process-level controls, we selected locations and business units to be tested in descending
order of revenues, and the companies whose combined revenues reaches two thirds of revenues on a consolidated basis were selected
as “significant locations and/or business units”. We included in the scope of assessment, at the selected significant locations and/or
business units, business processes leading to revenues, costs and expenses, accounts receivable-trade, and fixed assets as significant
accounts that may have a material impact on the business objectives of the Company. Further, in addition to selected significant
locations and/or business units, we also selected for testing the business processes having greater materiality, taking into account their
impact on the financial reporting.
3. Matters relating to the results of the assessmentAs a result of the assessment described above, as of the end of this fiscal year, we concluded that the Company’s internal control over
financial reporting of the consolidated financial statements was effectively maintained.
Yasumi Kudo Tadaaki Naito
President, President Corporate Officer Representative Director, Senior Managing Corporate Officer
June 23, 2011
139ANNUAL REPORT 2011
Independent Auditors’ Report
To the Board of Directors of
Nippon Yusen Kabushiki Kaisha:
We have audited the accompanying consolidated balance sheets of Nippon Yusen Kabushiki Kaisha (the “Company”) and consolidated
subsidiaries as of March 31, 2011 and 2010, and the related consolidated statements of operations for the years then ended, the
consolidated statement of comprehensive income for the year ended March 31, 2011, and the related consolidated statements of
changes in equity, and cash flows for the years then ended, all expressed in Japanese yen. These consolidated financial statements are
the responsibility of the Company’s management. Our responsibility is to express an opinion on these consolidated financial statements
based on our audits.
We conducted our audits in accordance with auditing standards generally accepted in Japan. Those standards require that we plan and
perform the audit to obtain reasonable assurance about whether the financial statements are free of material misstatement. An audit
includes examining, on a test basis, evidence supporting the amounts and disclosures in the financial statements. An audit also includes
assessing the accounting principles used and significant estimates made by management, as well as evaluating the overall financial
statement presentation. We believe that our audits provide a reasonable basis for our opinion.
In our opinion, the consolidated financial statements referred to above present fairly, in all material respects, the consolidated financial
position of Nippon Yusen Kabushiki Kaisha and consolidated subsidiaries as of March 31, 2011 and 2010, and the consolidated results
of their operations and their cash flows for the years then ended in conformity with accounting principles generally accepted in Japan.
We have also audited management’s report on internal control over financial reporting of the consolidated financial statements of
Nippon Yusen Kabushiki Kaisha as of March 31, 2011. The Company’s management is responsible for designing and operating
effective internal control over financial reporting and for preparing its report on internal control. Our responsibility is to express an
opinion on management’s report on internal control based on our audit. There is a possibility that misstatements may not be com-
pletely prevented or detected by internal control over financial reporting.
We conducted our internal control audit in accordance with auditing standards for internal control over financial reporting generally
accepted in Japan. Those standards require that we plan and perform the audit to obtain reasonable assurance about whether man-
agement’s report on internal control is free of material misstatement. An internal control audit includes examining, on a test basis,
representations on the scope, procedures and results of the assessment of internal control over financial reporting made by manage-
ment, as well as evaluating the overall presentation of management’s report on internal control. We believe that our internal control
audit provides a reasonable basis for our opinion.
In our opinion, management’s report on internal control referred to above, which represents that the internal control over financial
reporting of the consolidated financial statements of Nippon Yusen Kabushiki Kaisha as of March 31, 2011 is effectively maintained,
presents fairly, in all material respects, the assessment of internal control over financial reporting in conformity with assessment stan-
dards for internal control over financial reporting generally accepted in Japan.
Our audits also comprehended the translation of Japanese yen amounts into U.S. dollar amounts and, in our opinion, such translation
has been made in conformity with the basis stated in Note 2. Such U.S. dollar amounts are presented solely for the convenience of
readers outside Japan.
June 23, 2011
More Than Shipping
ANNUAL REPORT 2011NIPPON YUSEN KABUSHIKI KAISHA
AN
NU
AL R
EPOR
T 2011N
IPPON
YU
SEN K
AB
USH
IKI K
AISH
A
3-2, Marunouchi 2-chome, Chiyoda-ku, Tokyo 100-0005, JapanTelephone: +81-3-3284-5151http://www.nyk.com
Printed in Japan


