Embed Size (px)
Citation preview
Annual Report2020
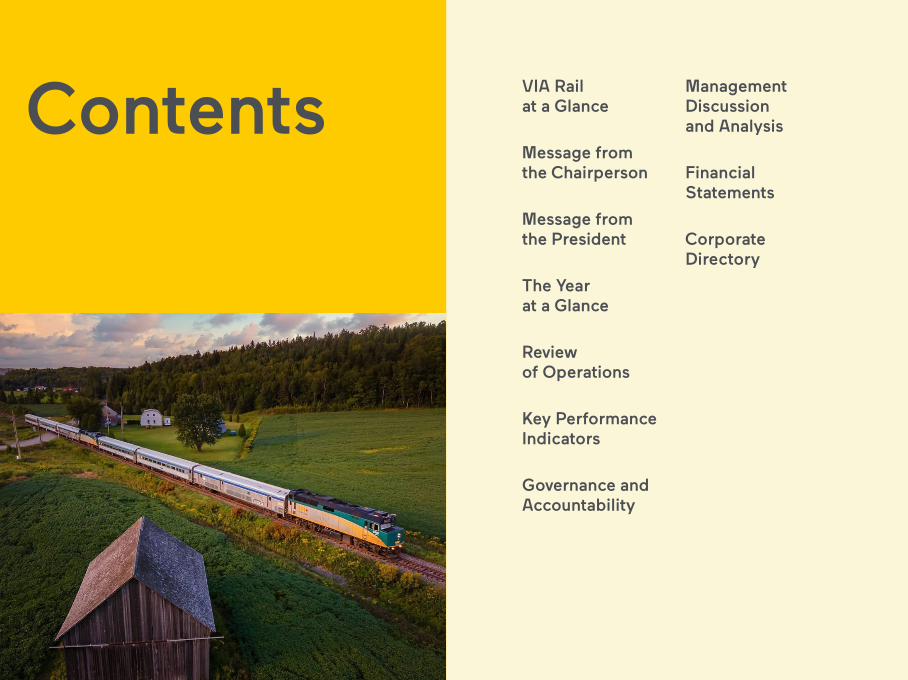
ContentsVIA Rail at a Glance
Message from the Chairperson
Message from the President
The Year at a Glance
Review of Operations
Key Performance Indicators
Governance and Accountability
Management Discussion and Analysis
Financial Statements
Corporate Directory
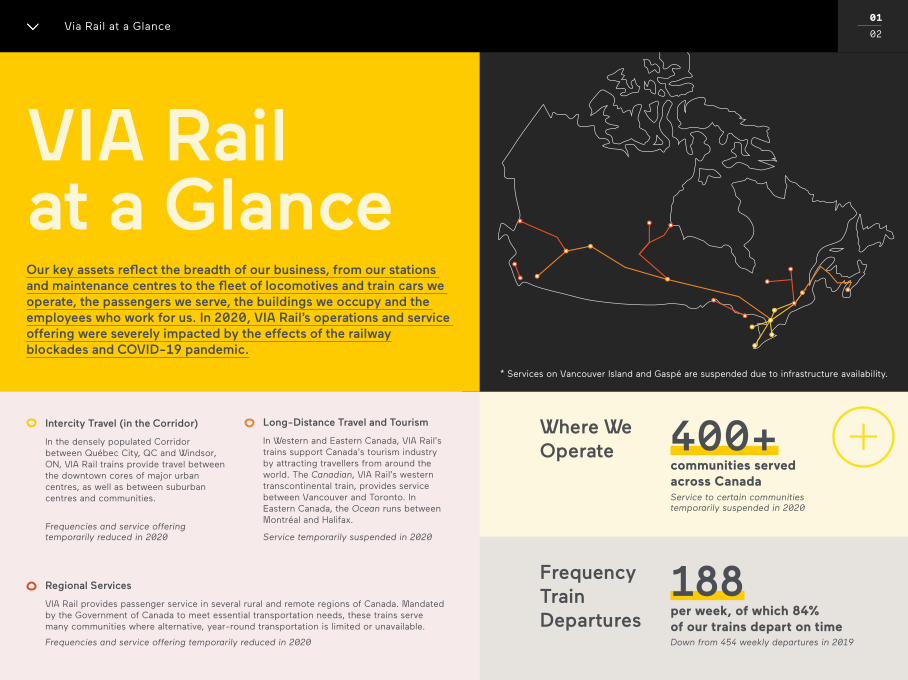
VIA Rail at a GlanceOur key assets reflect the breadth of our business, from our stations and maintenance centres to the fleet of locomotives and train cars we operate, the passengers we serve, the buildings we occupy and the employees who work for us. In 2020, VIA Rail’s operations and service offering were severely impacted by the effects of the railway blockades and COVID-19 pandemic.
Where We Operate 400+
communities served across Canada
Frequency Train Departures
188per week, of which 84% of our trains depart on time
* Services on Vancouver Island and Gaspé are suspended due to infrastructure availability.
Frequencies and service offering temporarily reduced in 2020
Frequencies and service offering temporarily reduced in 2020
Service temporarily suspended in 2020
Service to certain communities temporarily suspended in 2020
Down from 454 weekly departures in 2019
Intercity Travel (in the Corridor)
In the densely populated Corridor between Québec City, QC and Windsor, ON, VIA Rail trains provide travel between the downtown cores of major urban centres, as well as between suburban centres and communities.
Long-Distance Travel and Tourism
In Western and Eastern Canada, VIA Rail’s trains support Canada’s tourism industry by attracting travellers from around the world. The Canadian, VIA Rail’s western transcontinental train, provides service between Vancouver and Toronto. In Eastern Canada, the Ocean runs between Montréal and Halifax.
Regional Services
VIA Rail provides passenger service in several rural and remote regions of Canada. Mandated by the Government of Canada to meet essential transportation needs, these trains serve many communities where alternative, year-round transportation is limited or unavailable.
Via Rail at a Glance01
02
01
02
Wh
ere
W
e
Op
erat
e
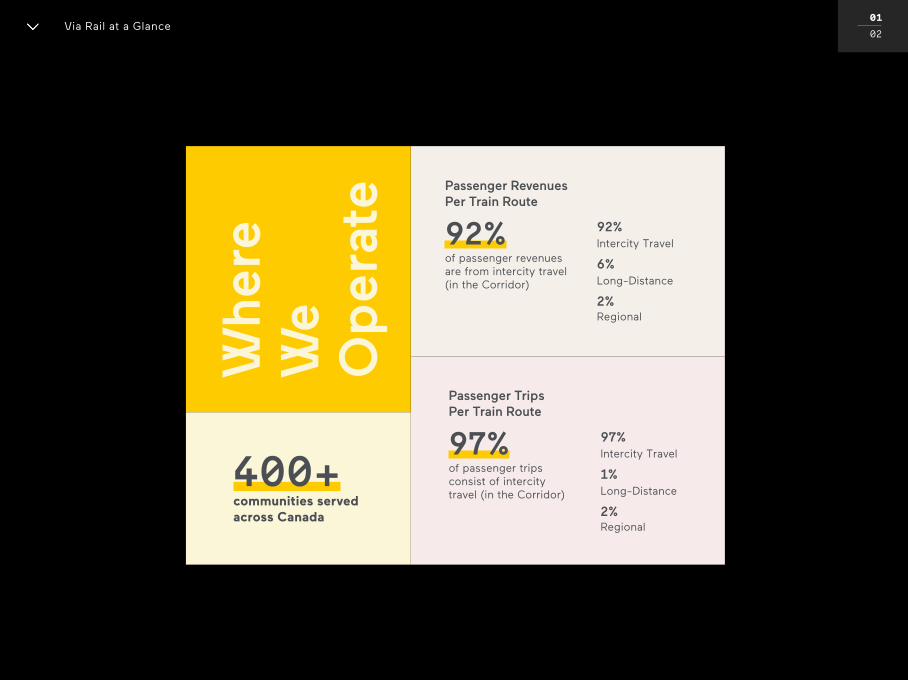
400+communities served across Canada
Passenger Revenues Per Train Route
92%of passenger revenues are from intercity travel (in the Corridor)
92% Intercity Travel
6% Long-Distance
2% Regional
Passenger Trips Per Train Route
97%of passenger trips consist of intercity travel (in the Corridor)
97% Intercity Travel
1% Long-Distance
2% Regional
Via Rail at a Glance
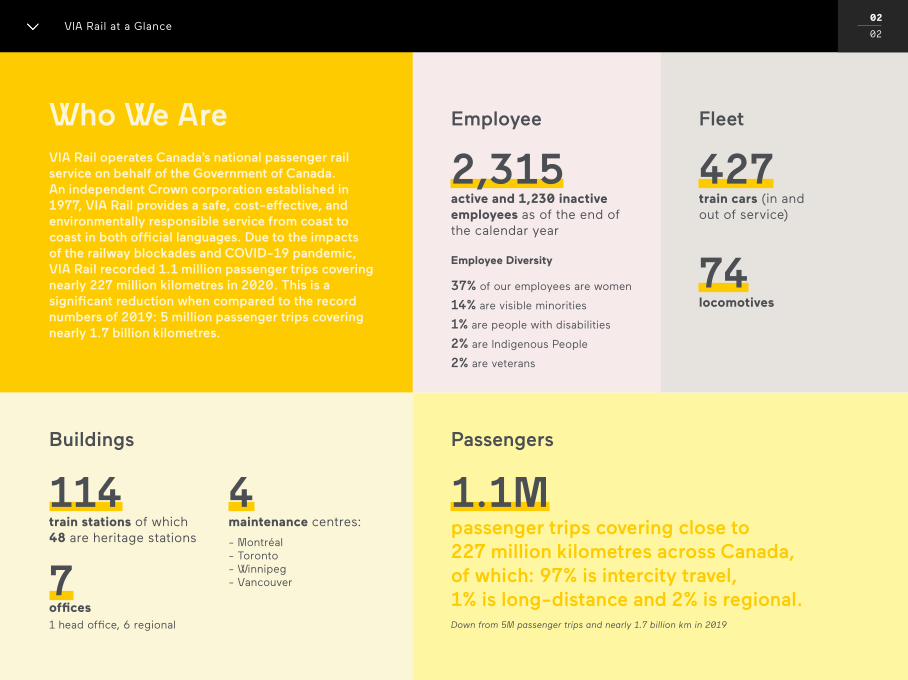
VIA Rail operates Canada’s national passenger rail service on behalf of the Government of Canada. An independent Crown corporation established in 1977, VIA Rail provides a safe, cost-effective, and environmentally responsible service from coast to coast in both official languages. Due to the impacts of the railway blockades and COVID-19 pandemic, VIA Rail recorded 1.1 million passenger trips covering nearly 227 million kilometres in 2020. This is a significant reduction when compared to the record numbers of 2019: 5 million passenger trips covering nearly 1.7 billion kilometres.
Buildings Passengers
FleetEmployee
114train stations of which 48 are heritage stations
7 offices1 head office, 6 regional
4maintenance centres:
- Montréal- Toronto- Winnipeg- Vancouver
427train cars (in and out of service)
74locomotives
2,315active and 1,230 inactive employees as of the end of the calendar year
1.1Mpassenger trips covering close to 227 million kilometres across Canada, of which: 97% is intercity travel, 1% is long-distance and 2% is regional.
Who We Are
Employee Diversity
37% of our employees are women
14% are visible minorities
1% are people with disabilities
2% are Indigenous People
2% are veterans
VIA Rail at a Glance 02
02
Down from 5M passenger trips and nearly 1.7 billion km in 2019

Message from the Chairperson
Message from the Chairperson 01
02
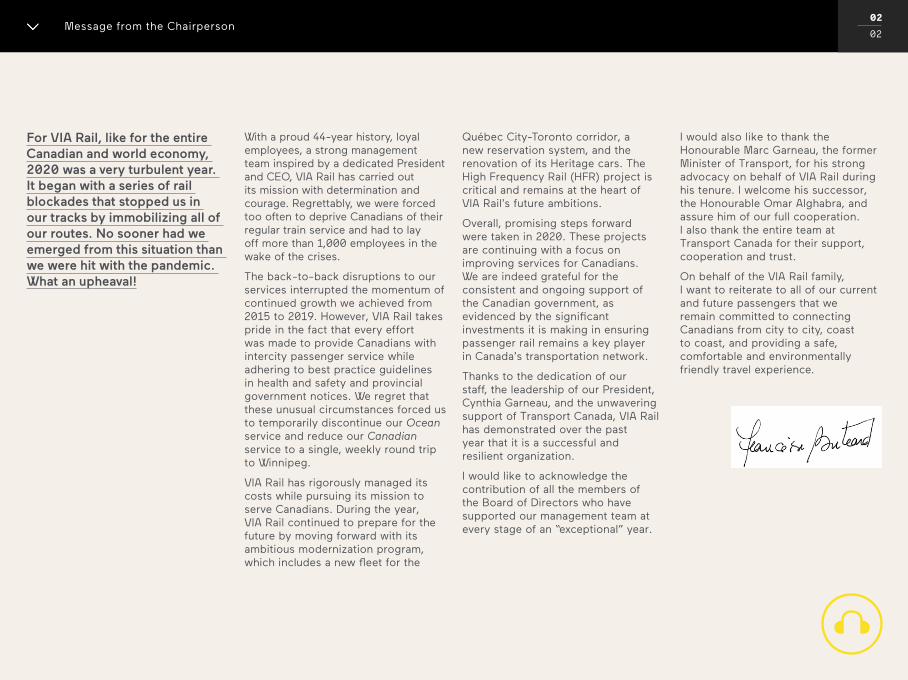
– Françoise Bertrand, o.c., c.q. Chairperson of the Board of Directors, VIA Rail
“The year 2020 tested our ability to respond to dramatic and rapidly evolving events. Ultimately, I think it proved that we have the people and systems needed to adapt and to come out even stronger.”
02
02Message from the Chairperson
For VIA Rail, like for the entire Canadian and world economy, 2020 was a very turbulent year. It began with a series of rail blockades that stopped us in our tracks by immobilizing all of our routes. No sooner had we emerged from this situation than we were hit with the pandemic. What an upheaval!
With a proud 44-year history, loyal employees, a strong management team inspired by a dedicated President and CEO, VIA Rail has carried out its mission with determination and courage. Regrettably, we were forced too often to deprive Canadians of their regular train service and had to lay off more than 1,000 employees in the wake of the crises.
The back-to-back disruptions to our services interrupted the momentum of continued growth we achieved from 2015 to 2019. However, VIA Rail takes pride in the fact that every effort was made to provide Canadians with intercity passenger service while adhering to best practice guidelines in health and safety and provincial government notices. We regret that these unusual circumstances forced us to temporarily discontinue our Ocean service and reduce our Canadian service to a single, weekly round trip to Winnipeg.
VIA Rail has rigorously managed its costs while pursuing its mission to serve Canadians. During the year, VIA Rail continued to prepare for the future by moving forward with its ambitious modernization program, which includes a new fleet for the
Québec City-Toronto corridor, a new reservation system, and the renovation of its Heritage cars. The High Frequency Rail (HFR) project is critical and remains at the heart of VIA Rail’s future ambitions.
Overall, promising steps forward were taken in 2020. These projects are continuing with a focus on improving services for Canadians. We are indeed grateful for the consistent and ongoing support of the Canadian government, as evidenced by the significant investments it is making in ensuring passenger rail remains a key player in Canada’s transportation network.
Thanks to the dedication of our staff, the leadership of our President, Cynthia Garneau, and the unwavering support of Transport Canada, VIA Rail has demonstrated over the past year that it is a successful and resilient organization.
I would like to acknowledge the contribution of all the members of the Board of Directors who have supported our management team at every stage of an “exceptional” year.
I would also like to thank the Honourable Marc Garneau, the former Minister of Transport, for his strong advocacy on behalf of VIA Rail during his tenure. I welcome his successor, the Honourable Omar Alghabra, and assure him of our full cooperation. I also thank the entire team at Transport Canada for their support, cooperation and trust.
On behalf of the VIA Rail family, I want to reiterate to all of our current and future passengers that we remain committed to connecting Canadians from city to city, coast to coast, and providing a safe, comfortable and environmentally friendly travel experience.

01
02Message from the President
“That we always continued to operate and did so safely – even in the face of monumental challenges – powerfully demonstrates the role that VIA Rail plays as an essential service for all Canadians.”
Message from the President
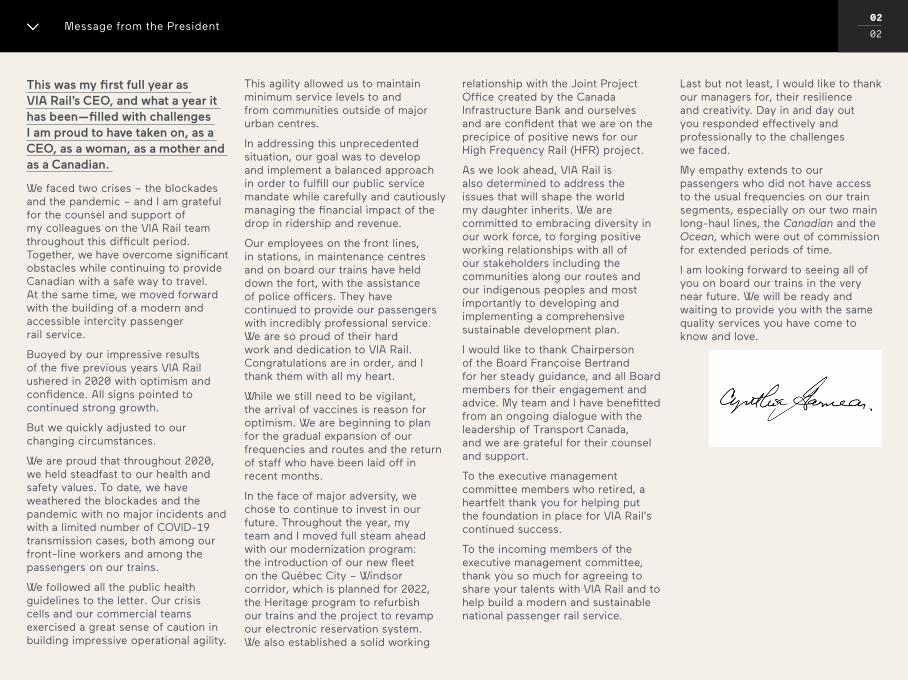
– Cynthia Garneau, President and Chief Executive Officer, VIA Rail
02
02Message from the President
This was my first full year as VIA Rail’s CEO, and what a year it has been—filled with challenges I am proud to have taken on, as a CEO, as a woman, as a mother and as a Canadian.
We faced two crises – the blockades and the pandemic – and I am grateful for the counsel and support of my colleagues on the VIA Rail team throughout this difficult period. Together, we have overcome significant obstacles while continuing to provide Canadian with a safe way to travel. At the same time, we moved forward with the building of a modern and accessible intercity passenger rail service.
Buoyed by our impressive results of the five previous years VIA Rail ushered in 2020 with optimism and confidence. All signs pointed to continued strong growth.
But we quickly adjusted to our changing circumstances.
We are proud that throughout 2020, we held steadfast to our health and safety values. To date, we have weathered the blockades and the pandemic with no major incidents and with a limited number of COVID-19 transmission cases, both among our front-line workers and among the passengers on our trains.
We followed all the public health guidelines to the letter. Our crisis cells and our commercial teams exercised a great sense of caution in building impressive operational agility.
This agility allowed us to maintain minimum service levels to and from communities outside of major urban centres.
In addressing this unprecedented situation, our goal was to develop and implement a balanced approach in order to fulfill our public service mandate while carefully and cautiously managing the financial impact of the drop in ridership and revenue.
Our employees on the front lines, in stations, in maintenance centres and on board our trains have held down the fort, with the assistance of police officers. They have continued to provide our passengers with incredibly professional service. We are so proud of their hard work and dedication to VIA Rail. Congratulations are in order, and I thank them with all my heart.
While we still need to be vigilant, the arrival of vaccines is reason for optimism. We are beginning to plan for the gradual expansion of our frequencies and routes and the return of staff who have been laid off in recent months.
In the face of major adversity, we chose to continue to invest in our future. Throughout the year, my team and I moved full steam ahead with our modernization program: the introduction of our new fleet on the Québec City – Windsor corridor, which is planned for 2022, the Heritage program to refurbish our trains and the project to revamp our electronic reservation system. We also established a solid working
relationship with the Joint Project Office created by the Canada Infrastructure Bank and ourselves and are confident that we are on the precipice of positive news for our High Frequency Rail (HFR) project.
As we look ahead, VIA Rail is also determined to address the issues that will shape the world my daughter inherits. We are committed to embracing diversity in our work force, to forging positive working relationships with all of our stakeholders including the communities along our routes and our indigenous peoples and most importantly to developing and implementing a comprehensive sustainable development plan.
I would like to thank Chairperson of the Board Françoise Bertrand for her steady guidance, and all Board members for their engagement and advice. My team and I have benefitted from an ongoing dialogue with the leadership of Transport Canada, and we are grateful for their counsel and support.
To the executive management committee members who retired, a heartfelt thank you for helping put the foundation in place for VIA Rail’s continued success.
To the incoming members of the executive management committee, thank you so much for agreeing to share your talents with VIA Rail and to help build a modern and sustainable national passenger rail service.
Last but not least, I would like to thank our managers for, their resilience and creativity. Day in and day out you responded effectively and professionally to the challenges we faced.
My empathy extends to our passengers who did not have access to the usual frequencies on our train segments, especially on our two main long-haul lines, the Canadian and the Ocean, which were out of commission for extended periods of time.
I am looking forward to seeing all of you on board our trains in the very near future. We will be ready and waiting to provide you with the same quality services you have come to know and love.
The Year at a Glance
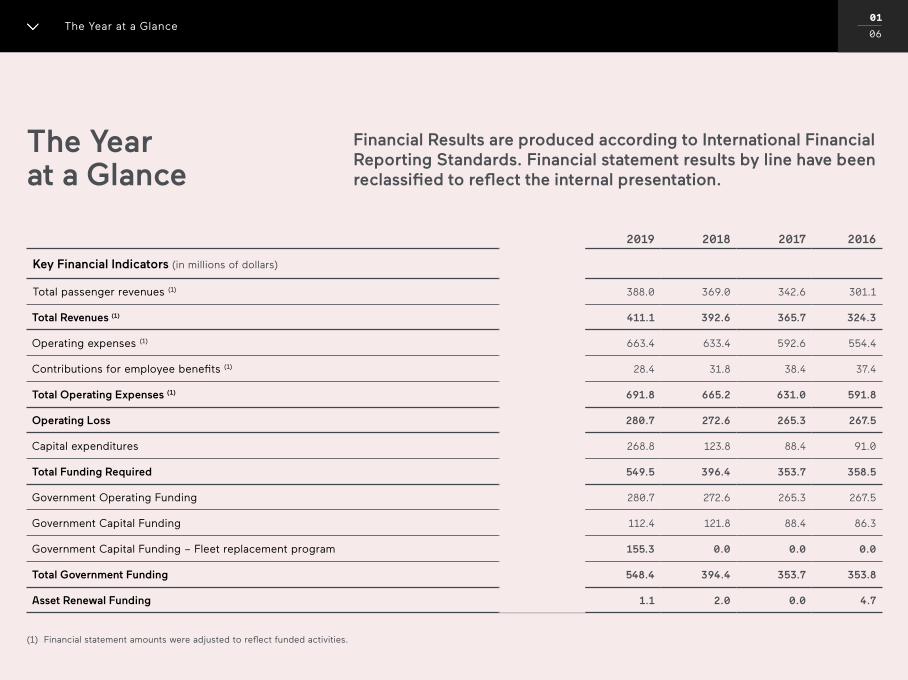
Financial Results are produced according to International Financial Reporting Standards. Financial statement results by line have been reclassified to reflect the internal presentation.
The Year at a Glance 01
06
2020 2019 2018 2017 2016
Key Financial Indicators (in millions of dollars)
Total passenger revenues (1) 76.0 388.0 369.0 342.6 301.1
Total Revenues (1) 92.0 411.1 392.6 365.7 324.3
Operating expenses (1) 482.0 663.4 633.4 592.6 554.4
Contributions for employee benefits (1) 25.8 28.4 31.8 38.4 37.4
Total Operating Expenses (1) 507.8 691.8 665.2 631.0 591.8
Operating Loss 415.8 280.7 272.6 265.3 267.5
Capital expenditures 252.9 268.8 123.8 88.4 91.0
Total Funding Required 668.7 549.5 396.4 353.7 358.5
Government Operating Funding 415.8 280.7 272.6 265.3 267.5
Government Capital Funding 88.5 112.4 121.8 88.4 86.3
Government Capital Funding – Fleet replacement program 164.4 155.3 0.0 0.0 0.0
Total Government Funding 668.7 548.4 394.4 353.7 353.8
Asset Renewal Funding 0.0 1.1 2.0 0.0 4.7
(1) Financial statement amounts were adjusted to reflect funded activities.
The Year at a Glance (cont’d)
02
06
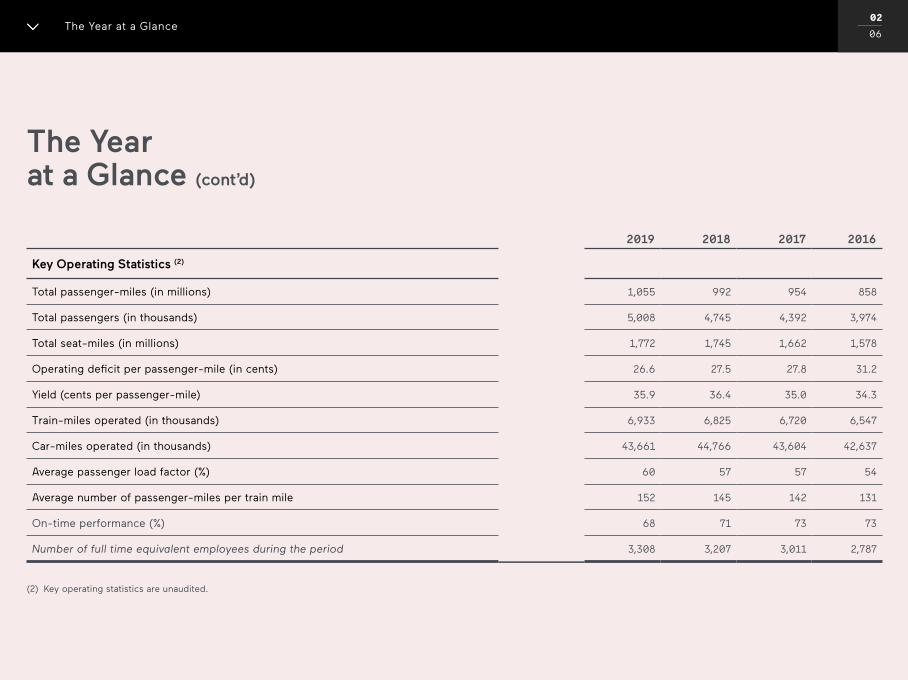
2020 2019 2018 2017 2016
Key Operating Statistics (2)
Total passenger-miles (in millions) 227 1,055 992 954 858
Total passengers (in thousands) 1,147 5,008 4,745 4,392 3,974
Total seat-miles (in millions) 508 1,772 1,745 1,662 1,578
Operating deficit per passenger-mile (in cents) 183.2 26.6 27.5 27.8 31.2
Yield (cents per passenger-mile) 31.2 35.9 36.4 35.0 34.3
Train-miles operated (in thousands) 2,870 6,933 6,825 6,720 6,547
Car-miles operated (in thousands) 14,583 43,661 44,766 43,604 42,637
Average passenger load factor (%) 45 60 57 57 54
Average number of passenger-miles per train mile 79 152 145 142 131
On-time performance (%) 71 68 71 73 73
Number of full time equivalent employees during the period 2,825 3,308 3,207 3,011 2,787
(2) Key operating statistics are unaudited.
The Year at a Glance
The Year at a Glance (cont’d)
03
06
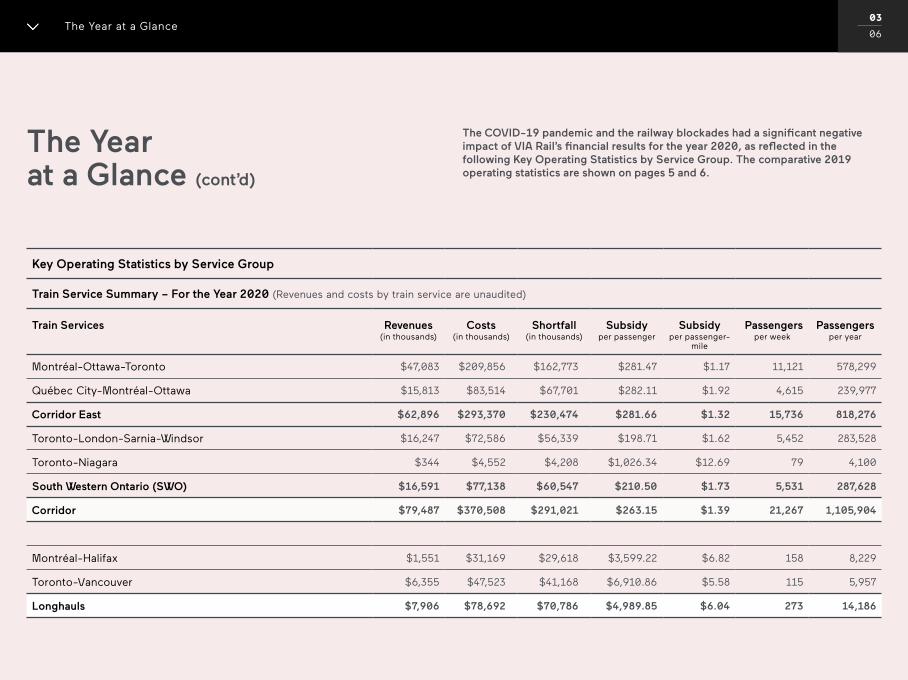
Key Operating Statistics by Service Group
Train Service Summary – For the Year 2020 (Revenues and costs by train service are unaudited)
Train Services Revenues (in thousands)
Costs(in thousands)
Shortfall(in thousands)
Subsidy per passenger
Subsidy per passenger-
mile
Passengers per week
Passengers per year
Montréal-Ottawa-Toronto $47,083 $209,856 $162,773 $281.47 $1.17 11,121 578,299
Québec City-Montréal-Ottawa $15,813 $83,514 $67,701 $282.11 $1.92 4,615 239,977
Corridor East $62,896 $293,370 $230,474 $281.66 $1.32 15,736 818,276
Toronto-London-Sarnia-Windsor $16,247 $72,586 $56,339 $198.71 $1.62 5,452 283,528
Toronto-Niagara $344 $4,552 $4,208 $1,026.34 $12.69 79 4,100
South Western Ontario (SWO) $16,591 $77,138 $60,547 $210.50 $1.73 5,531 287,628
Corridor $79,487 $370,508 $291,021 $263.15 $1.39 21,267 1,105,904
Montréal-Halifax $1,551 $31,169 $29,618 $3,599.22 $6.82 158 8,229
Toronto-Vancouver $6,355 $47,523 $41,168 $6,910.86 $5.58 115 5,957
Longhauls $7,906 $78,692 $70,786 $4,989.85 $6.04 273 14,186
The Year at a Glance
The COVID-19 pandemic and the railway blockades had a significant negative impact of VIA Rail’s financial results for the year 2020, as reflected in the following Key Operating Statistics by Service Group. The comparative 2019 operating statistics are shown on pages 5 and 6.
The Year at a Glance (cont’d)
04
06
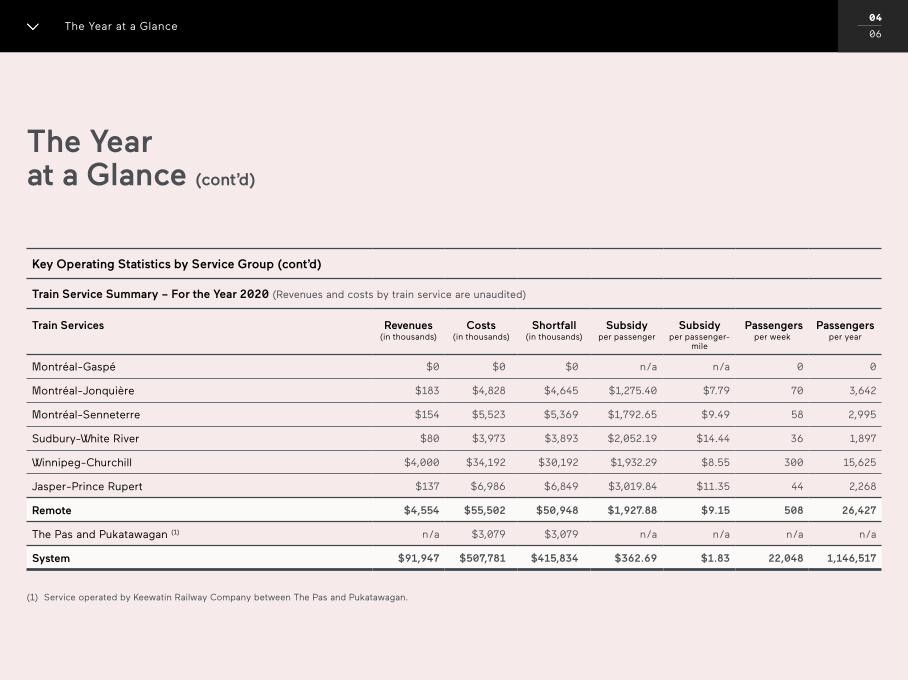
Key Operating Statistics by Service Group (cont’d)
Train Service Summary – For the Year 2020 (Revenues and costs by train service are unaudited)
Train Services Revenues (in thousands)
Costs(in thousands)
Shortfall(in thousands)
Subsidy per passenger
Subsidy per passenger-
mile
Passengers per week
Passengers per year
Montréal-Gaspé $0 $0 $0 n/a n/a 0 0
Montréal-Jonquière $183 $4,828 $4,645 $1,275.40 $7.79 70 3,642
Montréal-Senneterre $154 $5,523 $5,369 $1,792.65 $9.49 58 2,995
Sudbury-White River $80 $3,973 $3,893 $2,052.19 $14.44 36 1,897
Winnipeg-Churchill $4,000 $34,192 $30,192 $1,932.29 $8.55 300 15,625
Jasper-Prince Rupert $137 $6,986 $6,849 $3,019.84 $11.35 44 2,268
Remote $4,554 $55,502 $50,948 $1,927.88 $9.15 508 26,427
The Pas and Pukatawagan (1) n/a $3,079 $3,079 n/a n/a n/a n/a
System $91,947 $507,781 $415,834 $362.69 $1.83 22,048 1,146,517
(1) Service operated by Keewatin Railway Company between The Pas and Pukatawagan.
The Year at a Glance
The Year at a Glance (cont’d)
05
06
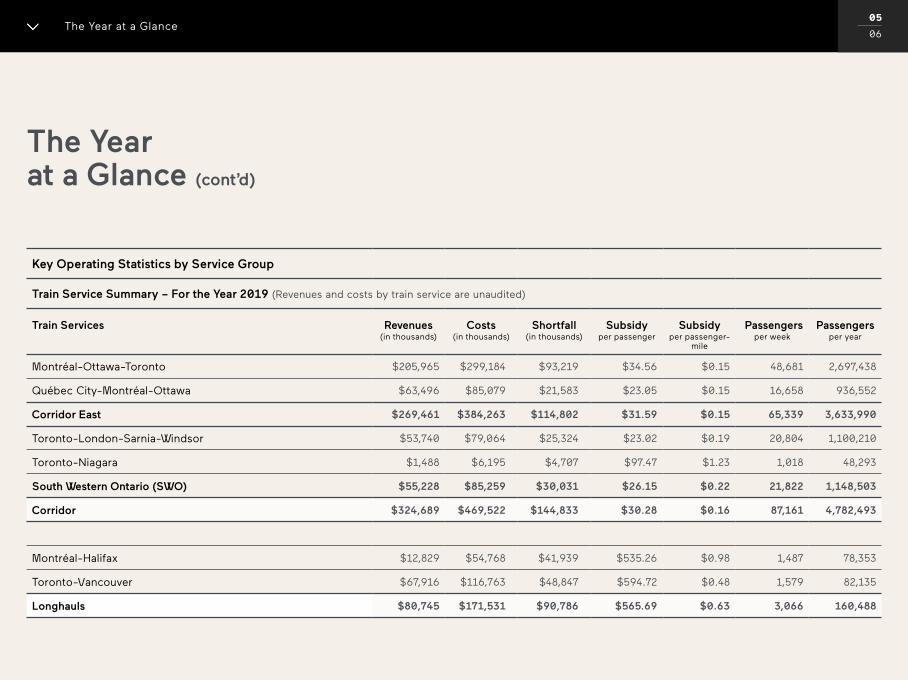
Key Operating Statistics by Service Group
Train Service Summary – For the Year 2019 (Revenues and costs by train service are unaudited)
Train Services Revenues (in thousands)
Costs(in thousands)
Shortfall(in thousands)
Subsidy per passenger
Subsidy per passenger-
mile
Passengers per week
Passengers per year
Montréal-Ottawa-Toronto $205,965 $299,184 $93,219 $34.56 $0.15 48,681 2,697,438
Québec City-Montréal-Ottawa $63,496 $85,079 $21,583 $23.05 $0.15 16,658 936,552
Corridor East $269,461 $384,263 $114,802 $31.59 $0.15 65,339 3,633,990
Toronto-London-Sarnia-Windsor $53,740 $79,064 $25,324 $23.02 $0.19 20,804 1,100,210
Toronto-Niagara $1,488 $6,195 $4,707 $97.47 $1.23 1,018 48,293
South Western Ontario (SWO) $55,228 $85,259 $30,031 $26.15 $0.22 21,822 1,148,503
Corridor $324,689 $469,522 $144,833 $30.28 $0.16 87,161 4,782,493
Montréal-Halifax $12,829 $54,768 $41,939 $535.26 $0.98 1,487 78,353
Toronto-Vancouver $67,916 $116,763 $48,847 $594.72 $0.48 1,579 82,135
Longhauls $80,745 $171,531 $90,786 $565.69 $0.63 3,066 160,488
The Year at a Glance
The Year at a Glance (cont’d)
06
06
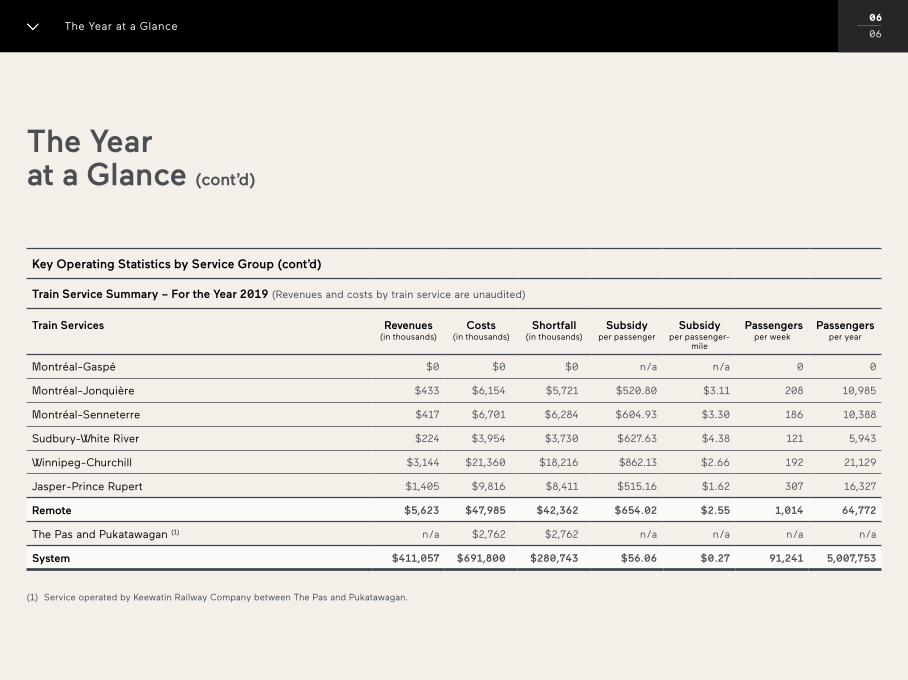
Key Operating Statistics by Service Group (cont’d)
Train Service Summary – For the Year 2019 (Revenues and costs by train service are unaudited)
Train Services Revenues (in thousands)
Costs(in thousands)
Shortfall(in thousands)
Subsidy per passenger
Subsidy per passenger-
mile
Passengers per week
Passengers per year
Montréal-Gaspé $0 $0 $0 n/a n/a 0 0
Montréal-Jonquière $433 $6,154 $5,721 $520.80 $3.11 208 10,985
Montréal-Senneterre $417 $6,701 $6,284 $604.93 $3.30 186 10,388
Sudbury-White River $224 $3,954 $3,730 $627.63 $4.38 121 5,943
Winnipeg-Churchill $3,144 $21,360 $18,216 $862.13 $2.66 192 21,129
Jasper-Prince Rupert $1,405 $9,816 $8,411 $515.16 $1.62 307 16,327
Remote $5,623 $47,985 $42,362 $654.02 $2.55 1,014 64,772
The Pas and Pukatawagan (1) n/a $2,762 $2,762 n/a n/a n/a n/a
System $411,057 $691,800 $280,743 $56.06 $0.27 91,241 5,007,753
(1) Service operated by Keewatin Railway Company between The Pas and Pukatawagan.
The Year at a Glance
Review of Operations
Review of Operations 01
42
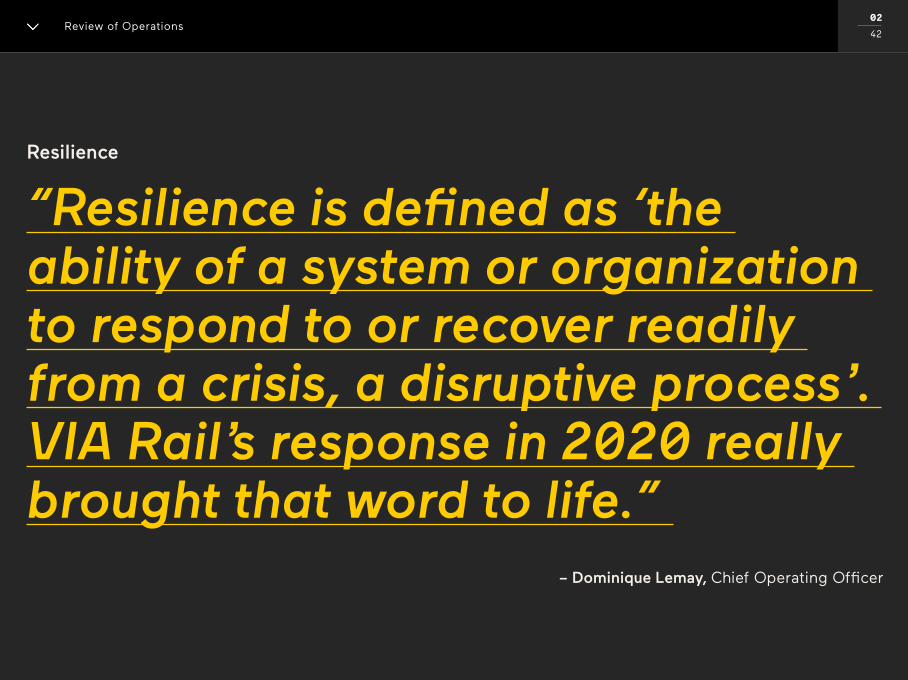
– Dominique Lemay, Chief Operating Officer
Resilience
“Resilience is defined as ‘the ability of a system or organization to respond to or recover readily from a crisis, a disruptive process’. VIA Rail’s response in 2020 really brought that word to life.”
Review of Operations 02
42
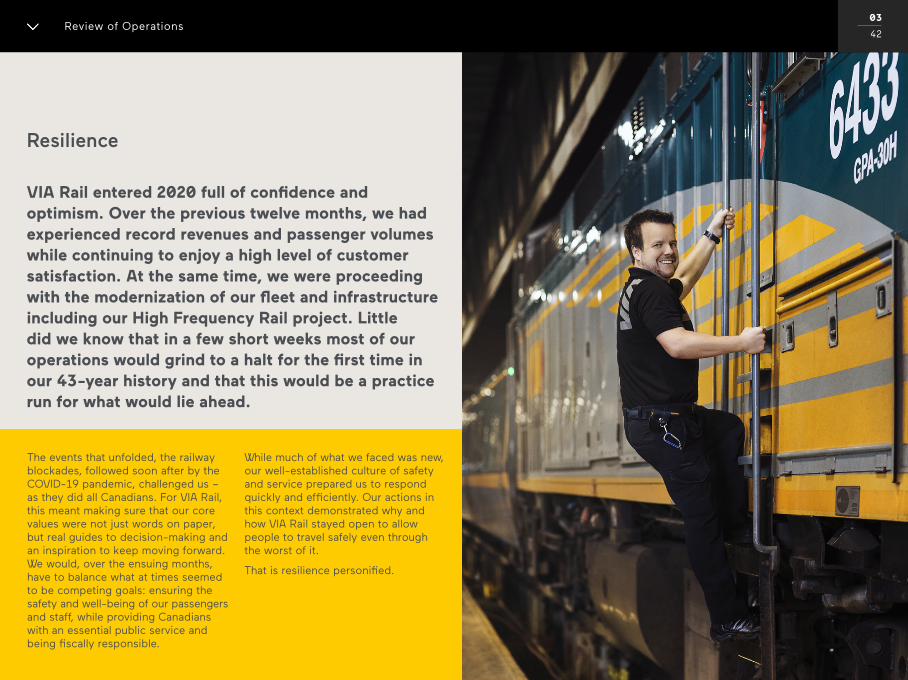
Resilience
VIA Rail entered 2020 full of confidence and optimism. Over the previous twelve months, we had experienced record revenues and passenger volumes while continuing to enjoy a high level of customer satisfaction. At the same time, we were proceeding with the modernization of our fleet and infrastructure including our High Frequency Rail project. Little did we know that in a few short weeks most of our operations would grind to a halt for the first time in our 43-year history and that this would be a practice run for what would lie ahead.
The events that unfolded, the railway blockades, followed soon after by the COVID-19 pandemic, challenged us – as they did all Canadians. For VIA Rail, this meant making sure that our core values were not just words on paper, but real guides to decision-making and an inspiration to keep moving forward. We would, over the ensuing months, have to balance what at times seemed to be competing goals: ensuring the safety and well-being of our passengers and staff, while providing Canadians with an essential public service and being fiscally responsible.
While much of what we faced was new, our well-established culture of safety and service prepared us to respond quickly and efficiently. Our actions in this context demonstrated why and how VIA Rail stayed open to allow people to travel safely even through the worst of it.
That is resilience personified.
Review of Operations 03
42
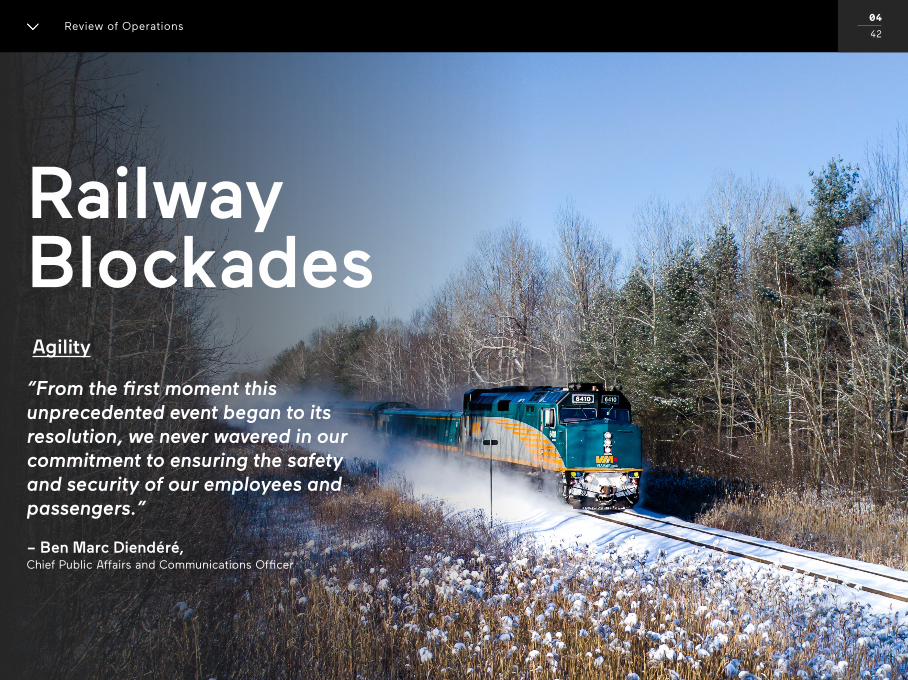
Railway Blockades
“From the first moment this unprecedented event began to its resolution, we never wavered in our commitment to ensuring the safety and security of our employees and passengers.”
– Ben Marc Diendéré, Chief Public Affairs and Communications Officer
Agility
Review of Operations 04
42
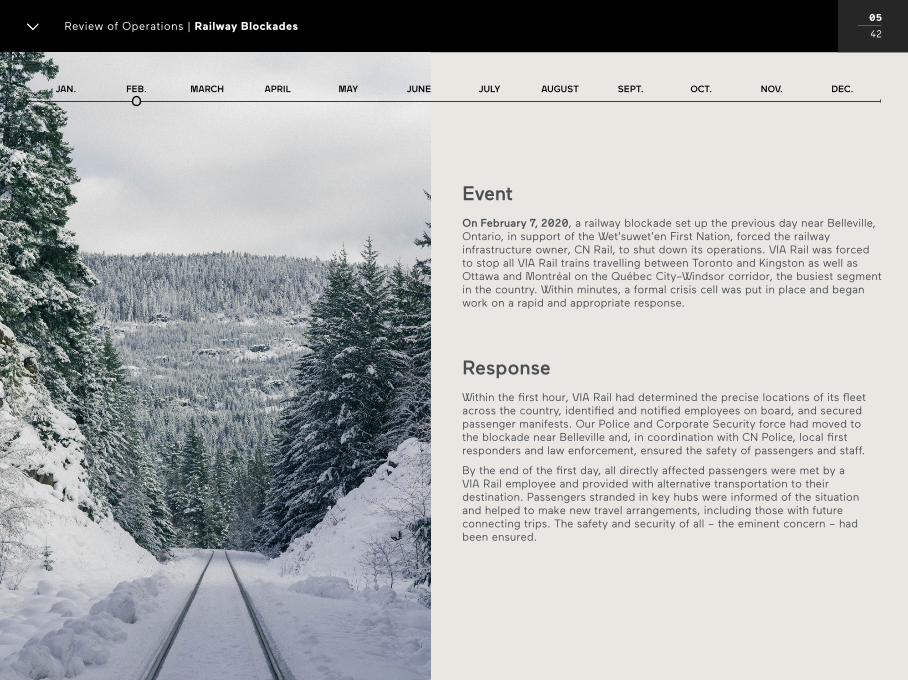
EventOn February 7, 2020, a railway blockade set up the previous day near Belleville, Ontario, in support of the Wet’suwet’en First Nation, forced the railway infrastructure owner, CN Rail, to shut down its operations. VIA Rail was forced to stop all VIA Rail trains travelling between Toronto and Kingston as well as Ottawa and Montréal on the Québec City–Windsor corridor, the busiest segment in the country. Within minutes, a formal crisis cell was put in place and began work on a rapid and appropriate response.
ResponseWithin the first hour, VIA Rail had determined the precise locations of its fleet across the country, identified and notified employees on board, and secured passenger manifests. Our Police and Corporate Security force had moved to the blockade near Belleville and, in coordination with CN Police, local first responders and law enforcement, ensured the safety of passengers and staff.
By the end of the first day, all directly affected passengers were met by a VIA Rail employee and provided with alternative transportation to their destination. Passengers stranded in key hubs were informed of the situation and helped to make new travel arrangements, including those with future connecting trips. The safety and security of all – the eminent concern – had been ensured.
Review of Operations | Railway Blockades05
42
An Evolving Situation
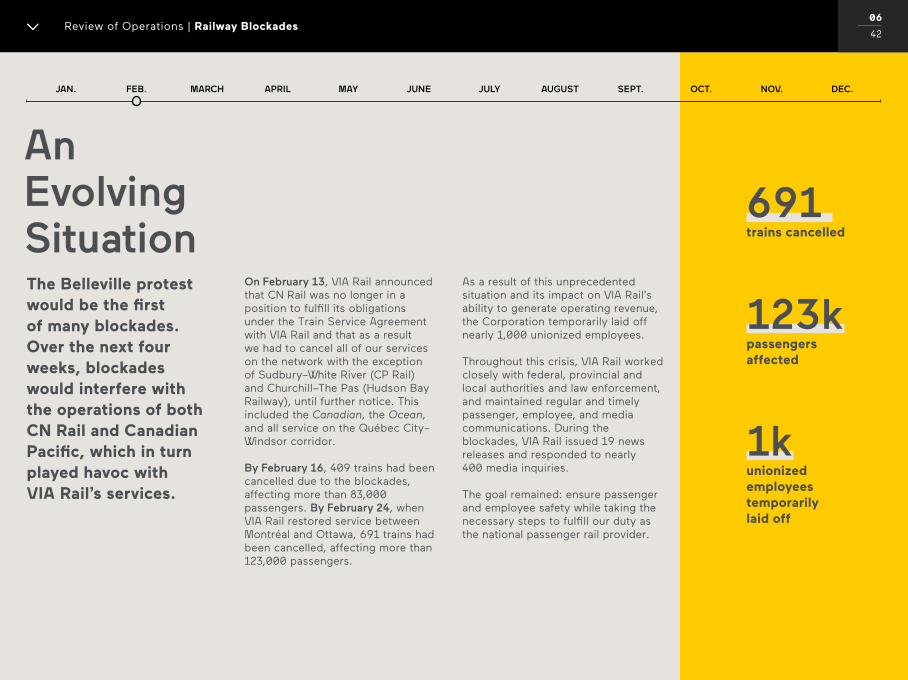
691 trains cancelled
123k passengers affected
1k unionized employees temporarily laid off
The Belleville protest would be the first of many blockades. Over the next four weeks, blockades would interfere with the operations of both CN Rail and Canadian Pacific, which in turn played havoc with VIA Rail’s services.
As a result of this unprecedented situation and its impact on VIA Rail’s ability to generate operating revenue, the Corporation temporarily laid off nearly 1,000 unionized employees.
Throughout this crisis, VIA Rail worked closely with federal, provincial and local authorities and law enforcement, and maintained regular and timely passenger, employee, and media communications. During the blockades, VIA Rail issued 19 news releases and responded to nearly 400 media inquiries.
The goal remained: ensure passenger and employee safety while taking the necessary steps to fulfill our duty as the national passenger rail provider.
On February 13, VIA Rail announced that CN Rail was no longer in a position to fulfill its obligations under the Train Service Agreement with VIA Rail and that as a result we had to cancel all of our services on the network with the exception of Sudbury–White River (CP Rail) and Churchill–The Pas (Hudson Bay Railway), until further notice. This included the Canadian, the Ocean, and all service on the Québec City–Windsor corridor.
By February 16, 409 trains had been cancelled due to the blockades, affecting more than 83,000 passengers. By February 24, when VIA Rail restored service between Montréal and Ottawa, 691 trains had been cancelled, affecting more than 123,000 passengers.
Review of Operations | Railway Blockades06
42
FEBRUARY

Review of Operations | Railway Blockades07
42
FEBRUARYFEBRUARY
6FEBRUARY
11FEBRUARY
16
FEBRUARY
7FEBRUARY
13CN announces that it
is forced to shut down significant parts of its
Canadian network imminently unless the blockades on its
rail lines are removed.
VIA Rail’s services are still cancelled with
the exception of Sudbury–White River (CP Rail) and
Churchill–The Pas (Hudson Bay Railway).
VIA Rail’s Québec City–Windsor
corridor service, which operates on the
affected CN-owned tracks, is forced to cancel most of
its services for the first time in its history.
VIA Rail announces that CN is no longer in a position to fulfill its obligations under
the Train Service Agreement between VIA Rail and CN.
Near Belleville, ON, members of the Mohawks of the Bay
of Quinte First Nation block the Canadian National
Railway (CN) rail line just north of Tyendinaga Mohawk Territory.
At approx. 5 p.m., CN shuts down its main line and the company obtains a court
injunction to end the demonstration.

691 trains cancelled
691 trains cancelled
123k passengers affected
On February 13, VIA Rail announced that CN Rail was no longer in a position to fulfill its obligations under the Train Service Agreement with VIA Rail and that as a result we had to cancel all of our services on the network with the exception of Sudbury–White River (CP Rail) and Churchill–The Pas (Hudson Bay Railway), until further notice. This included the Canadian, the Ocean, and all service on the Québec City–Windsor corridor.
By February 16, 409 trains had been cancelled due to the blockades, affecting more than 83,000 passengers. By February 24, when VIA Rail restored service between Montréal and Ottawa, 691 trains had been cancelled, affecting more than 123,000 passengers.
Review of Operations | Railway Blockades08
42
FEBRUARY
19MARCH
3MARCH
7
FEBRUARY
18MARCH
1MARCH
4-6
A blockade set up on the Mont-Saint-Hilaire rail line in Saint-Lambert,
Québec, causes VIA Rail to postpone resuming
service between Montréal and Québec City.
VIA Rail announces temporary layoffs
of more than 1,000 employees due to
the blockades.
Most VIA Rail services are progressively back in operation, including
between Toronto–Montréal and Toronto–
Ottawa.
VIA Rail service has resumed on most
routes, after more than 123,000 passengers
were affected.
VIA Rail receives a notification from CN
allowing a partial resumption of service
between Québec City – Montréal – Ottawa and
full resumption of service in
Southwestern Ontario.
Regular service between Winnipeg and The Pas
resumes.
The Canadian begins operating two
departures, one from Toronto–Vancouver
and another from Vancouver–Toronto.
MARCH
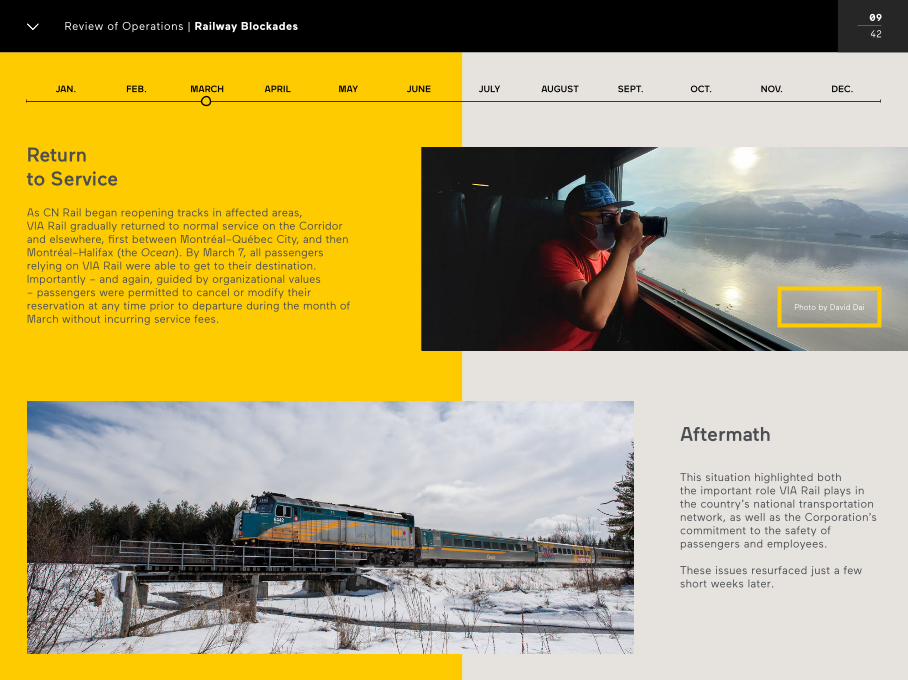
This situation highlighted both the important role VIA Rail plays in the country’s national transportation network, as well as the Corporation’s commitment to the safety of passengers and employees. These issues resurfaced just a few short weeks later.
Aftermath
As CN Rail began reopening tracks in affected areas, VIA Rail gradually returned to normal service on the Corridor and elsewhere, first between Montréal–Québec City, and then Montréal–Halifax (the Ocean). By March 7, all passengers relying on VIA Rail were able to get to their destination. Importantly – and again, guided by organizational values – passengers were permitted to cancel or modify their reservation at any time prior to departure during the month of March without incurring service fees.
Return to Service
Review of Operations | Railway Blockades09
42
Photo by David Dai

COVID-19 Pandemic
“While we didn’t know the magnitude of the situation that would unfold – no one did – we fortunately have a corporate culture obsessed with health and safety and a well-developed (and recently tested) crisis management system in place.”
– Jean-François Legault, Chief Legal & Risk Officer and Corporate Secretary
Preparation
Review of Operations 10
42
MARCH
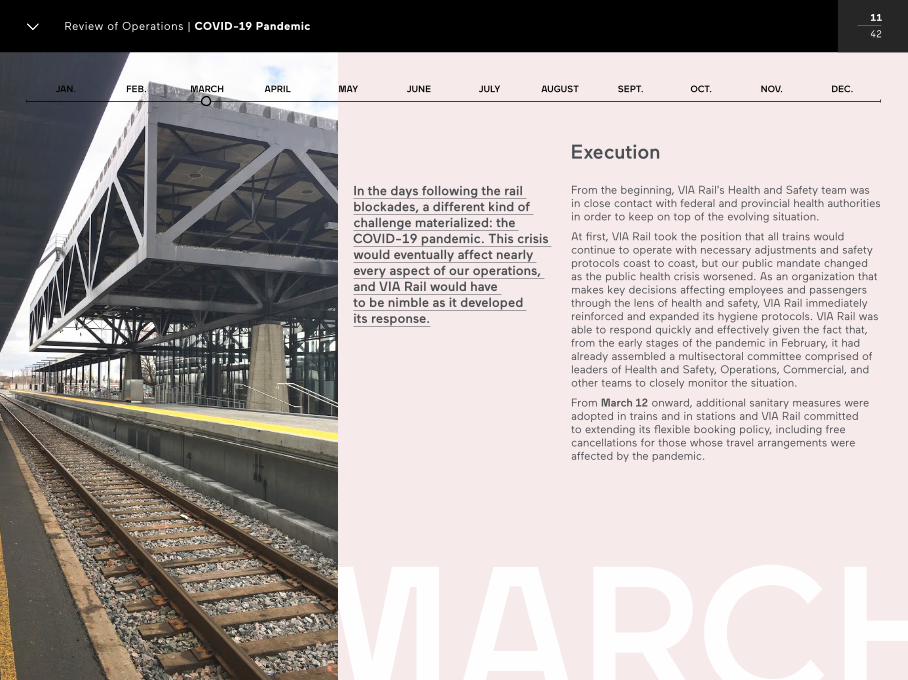
Execution
From the beginning, VIA Rail’s Health and Safety team was in close contact with federal and provincial health authorities in order to keep on top of the evolving situation.
At first, VIA Rail took the position that all trains would continue to operate with necessary adjustments and safety protocols coast to coast, but our public mandate changed as the public health crisis worsened. As an organization that makes key decisions affecting employees and passengers through the lens of health and safety, VIA Rail immediately reinforced and expanded its hygiene protocols. VIA Rail was able to respond quickly and effectively given the fact that, from the early stages of the pandemic in February, it had already assembled a multisectoral committee comprised of leaders of Health and Safety, Operations, Commercial, and other teams to closely monitor the situation.
From March 12 onward, additional sanitary measures were adopted in trains and in stations and VIA Rail committed to extending its flexible booking policy, including free cancellations for those whose travel arrangements were affected by the pandemic.
In the days following the rail blockades, a different kind of challenge materialized: the COVID-19 pandemic. This crisis would eventually affect nearly every aspect of our operations, and VIA Rail would have to be nimble as it developed its response.
Review of Operations | COVID-19 Pandemic11
42
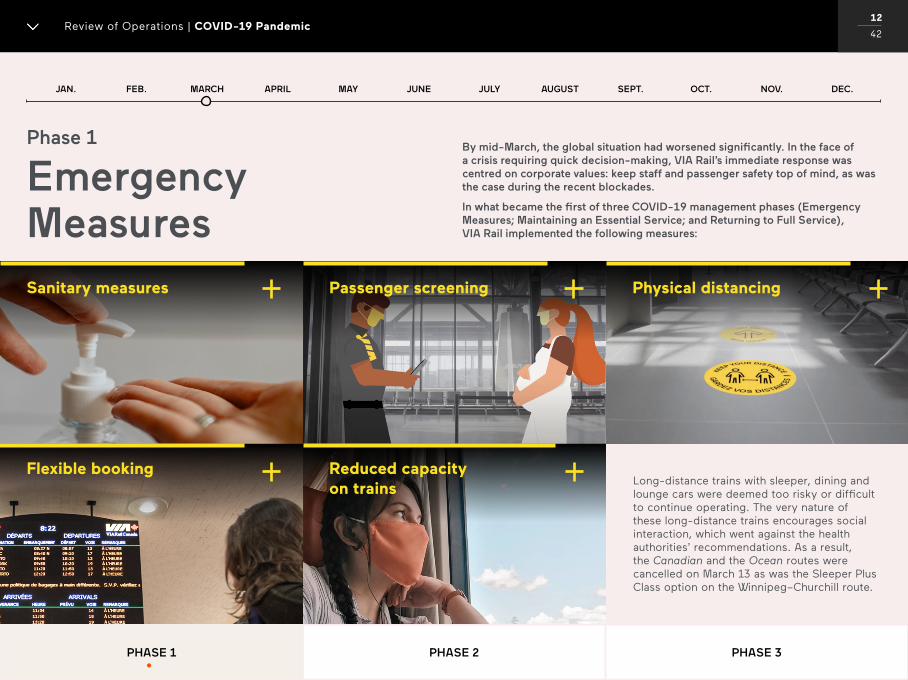
Long-distance trains with sleeper, dining and lounge cars were deemed too risky or difficult to continue operating. The very nature of these long-distance trains encourages social interaction, which went against the health authorities’ recommendations. As a result, the Canadian and the Ocean routes were cancelled on March 13 as was the Sleeper Plus Class option on the Winnipeg–Churchill route.
Phase 1
Emergency Measures
By mid-March, the global situation had worsened significantly. In the face of a crisis requiring quick decision-making, VIA Rail’s immediate response was centred on corporate values: keep staff and passenger safety top of mind, as was the case during the recent blockades.
In what became the first of three COVID-19 management phases (Emergency Measures; Maintaining an Essential Service; and Returning to Full Service), VIA Rail implemented the following measures:
Review of Operations | COVID-19 Pandemic12
42
Sanitary measures Passenger screening Physical distancing
Flexible booking Reduced capacityon trains
PHASE 3PHASE 2PHASE 1
Review of Operations | COVID-19 Pandemic12
42
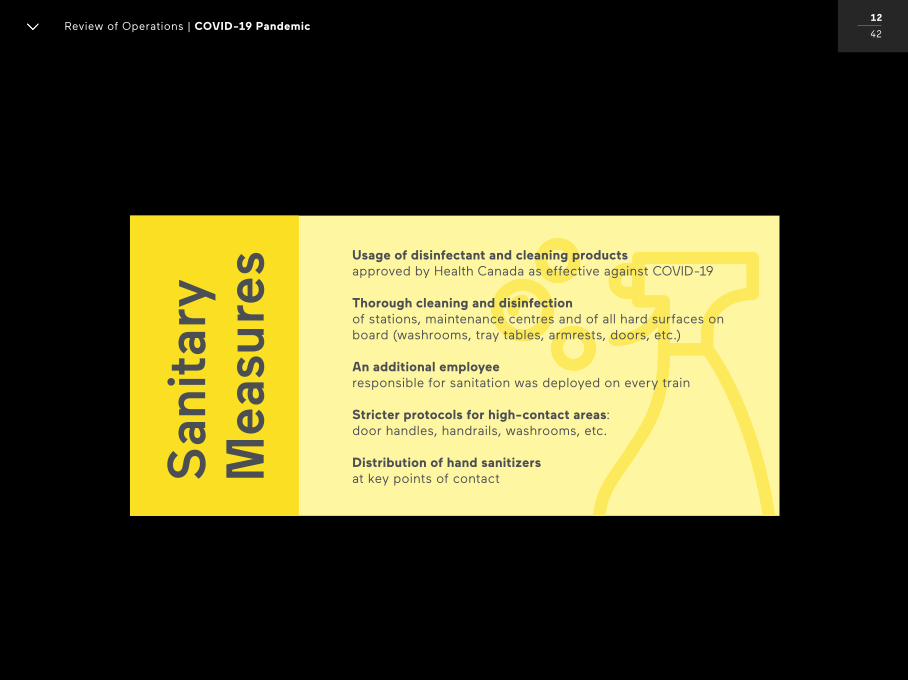
San
itar
y
Mea
sure
s Usage of disinfectant and cleaning products approved by Health Canada as effective against COVID-19 Thorough cleaning and disinfection of stations, maintenance centres and of all hard surfaces on board (washrooms, tray tables, armrests, doors, etc.) An additional employee responsible for sanitation was deployed on every train Stricter protocols for high-contact areas: door handles, handrails, washrooms, etc. Distribution of hand sanitizers at key points of contact
Review of Operations | COVID-19 Pandemic12
42
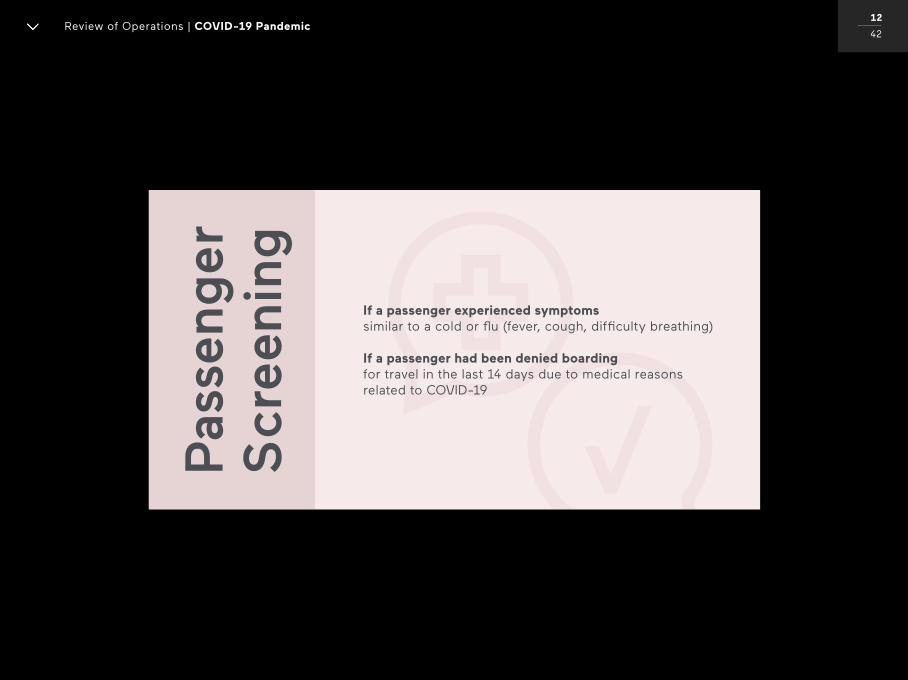
Pas
sen
ger
S
cre
enin
gIf a passenger experienced symptoms similar to a cold or flu (fever, cough, difficulty breathing) If a passenger had been denied boarding for travel in the last 14 days due to medical reasons related to COVID-19
Ph
ysic
al
Dis
tan
cin
g
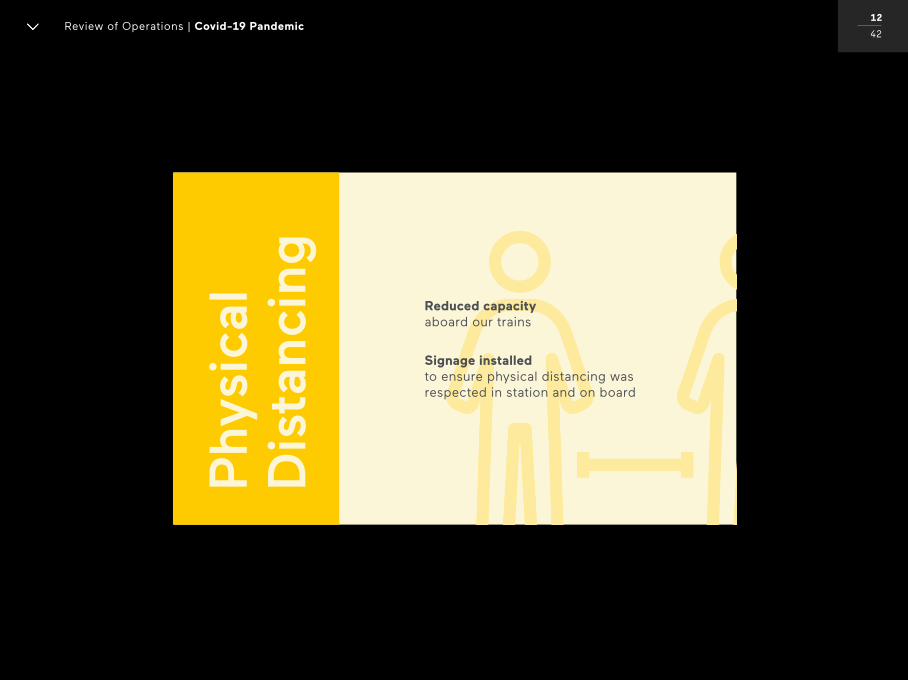
Review of Operations | Covid-19 Pandemic12
42
Reduced capacity aboard our trains
Signage installed to ensure physical distancing was respected in station and on board
Review of Operations | COVID-19 Pandemic12
42
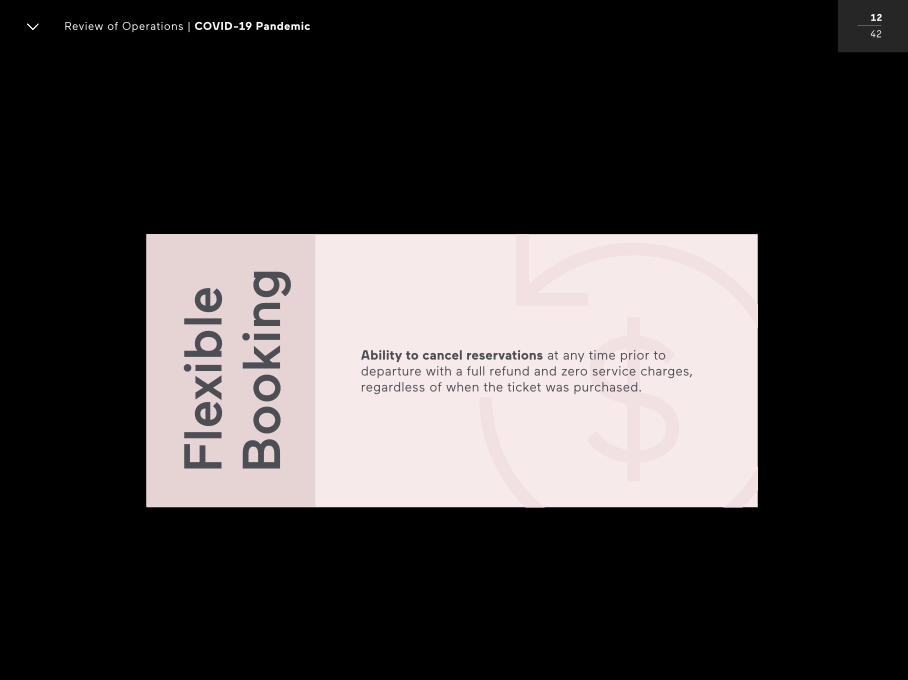
Fle
xib
le
Bo
oki
ng
Ability to cancel reservations at any time prior to departure with a full refund and zero service charges, regardless of when the ticket was purchased.
Review of Operations | COVID-19 Pandemic12
42
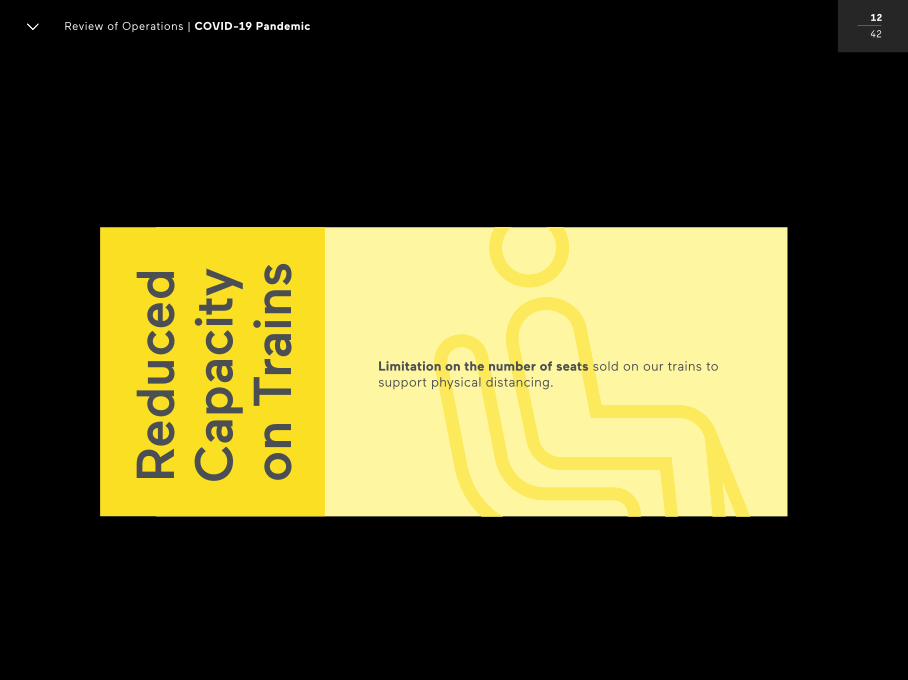
Re
du
ced
C
apac
ity
o
n T
rain
s
Limitation on the number of seats sold on our trains to support physical distancing.
12 / 35
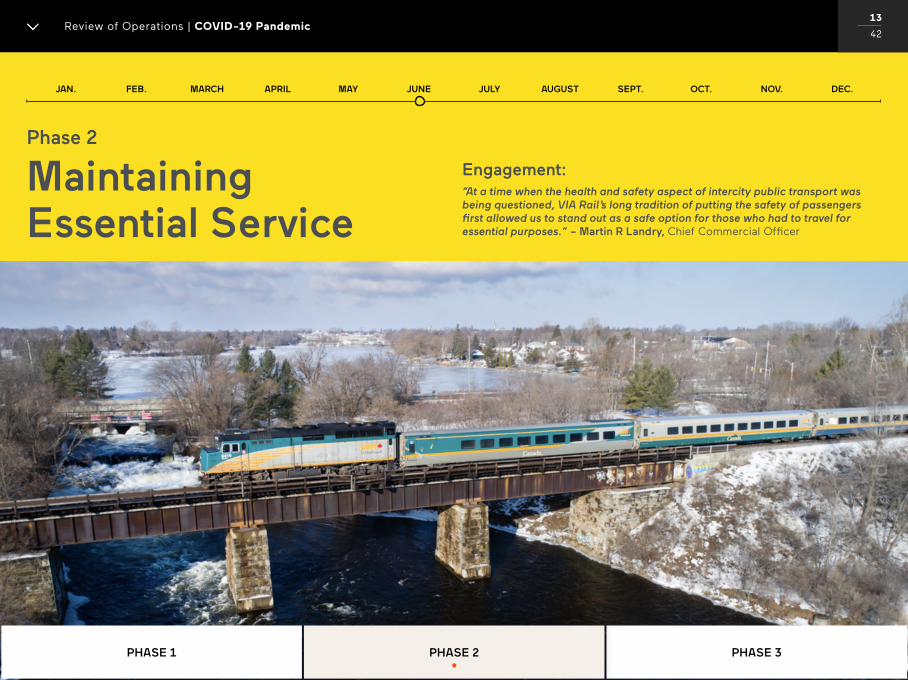
Engagement:“At a time when the health and safety aspect of intercity public transport was being questioned, VIA Rail’s long tradition of putting the safety of passengers first allowed us to stand out as a safe option for those who had to travel for essential purposes.” – Martin R Landry, Chief Commercial Officer
Phase 2
Maintaining Essential Service
Review of Operations | COVID-19 PandemicReview of Operations | COVID-19 Pandemic
13
42
PHASE 3PHASE 2PHASE 1
New Reality
Mandatory Mask Policy
By June, it was clear that the pandemic was not going away any time soon, with health authorities indicating a second wave was likely on the horizon. In turn, VIA Rail started to increase service levels, and had already committed to providing a safe, essential service, while offering flexible booking options for those whose travel arrangements had been affected by the pandemic or who simply chose not to travel. This would form the foundation for Phase 2 of VIA’s COVID-19 response and stands in stark contrast to other transportation providers in Canada. VIA Rail would continue to operate—in markets where governments and health guidelines would allow us to do so—for those who relied on our service for work and other emergencies, while also encouraging Canadians to avoid travel whenever possible.
Key factors driving VIA Rail’s response in Phase 2 and throughout the year were the evolving scientific understanding of the coronavirus as well as changes to federal and provincial health guidelines. By the summer VIA Rail developed and implemented an integrated response plan designed to adjust its service levels while maintaining safe operation of the network, which included a mandatory mask protocol and modified services on board and in station.
In accordance with Transport Canada guidelines and requirements, in June VIA Rail began enforcing a mandatory mask policy. Specific regulations of the policy were:
Masks were made mandatory for all employees at all times on trains and in stations.
All passengers were required to wear a mask or face covering at all times, except when eating or drinking.
Boarding was denied to passengers refusing to wear a mask, and passengers were detrained if they refused to wear a mask during the trip (some exemptions were available).
12 / 35Review of Operations | COVID-19 PandemicReview of Operations | COVID-19 Pandemic
14
42
PHASE 3PHASE 2PHASE 1
JUNE
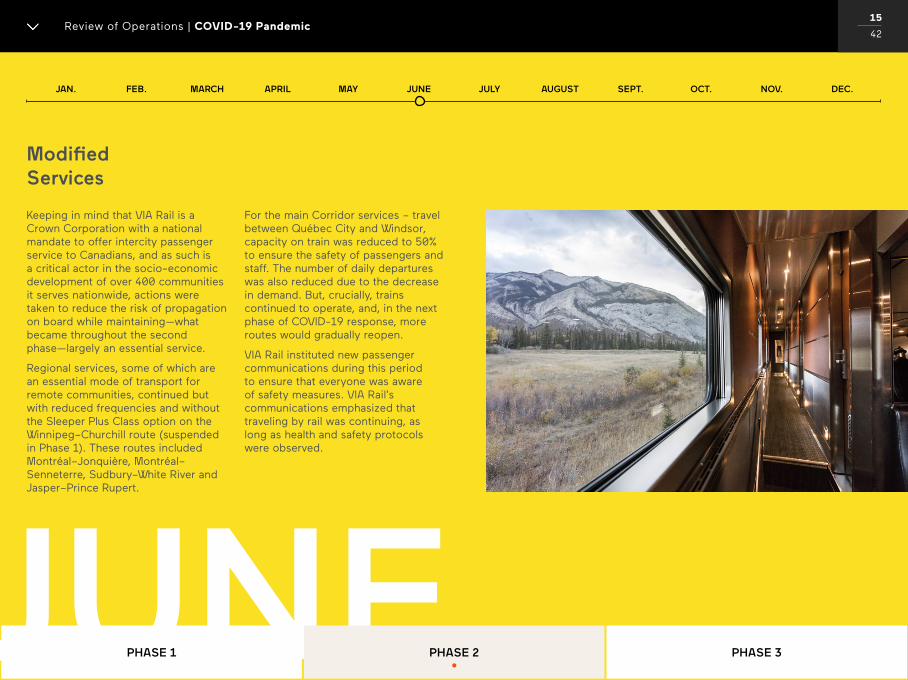
Modified Services
Keeping in mind that VIA Rail is a Crown Corporation with a national mandate to offer intercity passenger service to Canadians, and as such is a critical actor in the socio-economic development of over 400 communities it serves nationwide, actions were taken to reduce the risk of propagation on board while maintaining—what became throughout the second phase—largely an essential service.
Regional services, some of which are an essential mode of transport for remote communities, continued but with reduced frequencies and without the Sleeper Plus Class option on the Winnipeg–Churchill route (suspended in Phase 1). These routes included Montréal–Jonquière, Montréal–Senneterre, Sudbury–White River and Jasper–Prince Rupert.
For the main Corridor services – travel between Québec City and Windsor, capacity on train was reduced to 50% to ensure the safety of passengers and staff. The number of daily departures was also reduced due to the decrease in demand. But, crucially, trains continued to operate, and, in the next phase of COVID-19 response, more routes would gradually reopen.
VIA Rail instituted new passenger communications during this period to ensure that everyone was aware of safety measures. VIA Rail’s communications emphasized that traveling by rail was continuing, as long as health and safety protocols were observed.
12 / 35Review of Operations | COVID-19 PandemicReview of Operations | COVID-19 Pandemic
15
42
PHASE 3PHASE 2PHASE 1
Employees
During all of this, health and safety protocols were continually enhanced:
In 2020, 28 employees tested positive for COVID-19, and one was confirmed to have contracted the virus in the workplace. The sources of infection for three others were inconclusive. The results point to the effectiveness of VIA Rail’s many workplace health and safety initiatives.
Throughout the second phase, revenues continued to decline for the Corporation. VIA Rail actively tried to find solutions, but with revenues not improving, we made the difficult decision to carry-out another round of layoffs, some temporary. Approximately 1,000 employees, both unionized and non-unionized, were laid off in July.
12 / 35Review of Operations | COVID-19 PandemicReview of Operations | COVID-19 Pandemic
16
42
PHASE 3PHASE 2PHASE 1
Telework was required for all employees whose work permitted it;
Awareness and training programs were instituted;
Communication with health authorities was established to report positive cases;
COVID-19 self-screening health check for employees was made mandatory;
Predictively modelling and testing were done in operating environments to ensure that sanitary measures would be effective; and
Contractors and suppliers were brought into the process to ensure seamless implementation of protocols and their enhancements.
Appropriate self-isolation measures were implemented for any positive cases among employees;
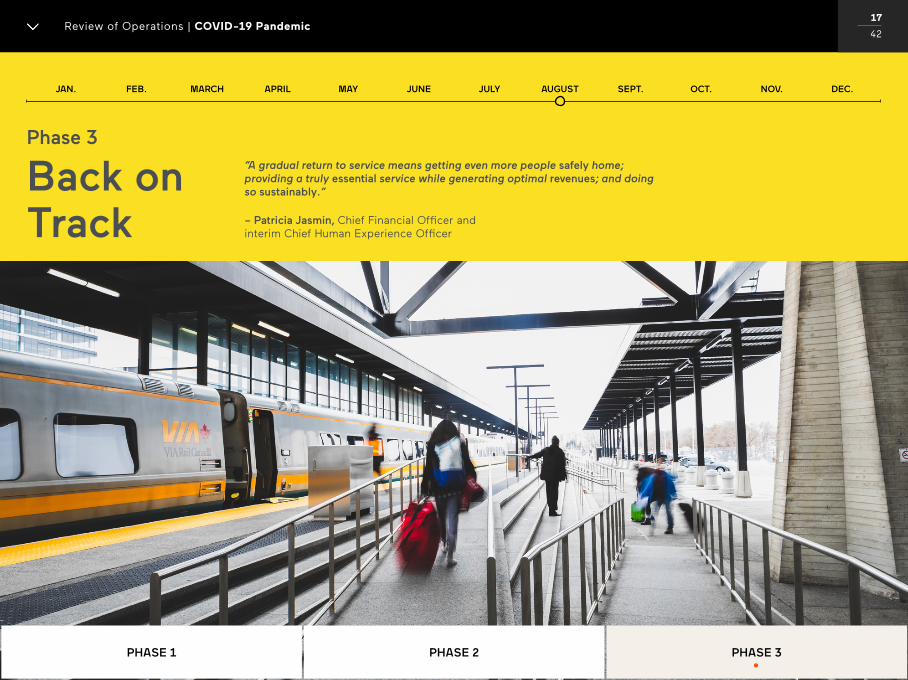
“A gradual return to service means getting even more people safely home; providing a truly essential service while generating optimal revenues; and doing so sustainably.”
– Patricia Jasmin, Chief Financial Officer and interim Chief Human Experience Officer
Phase 3
Back on Track
12 / 35Review of Operations | COVID-19 PandemicReview of Operations | COVID-19 Pandemic
17
42
PHASE 3PHASE 2PHASE 1
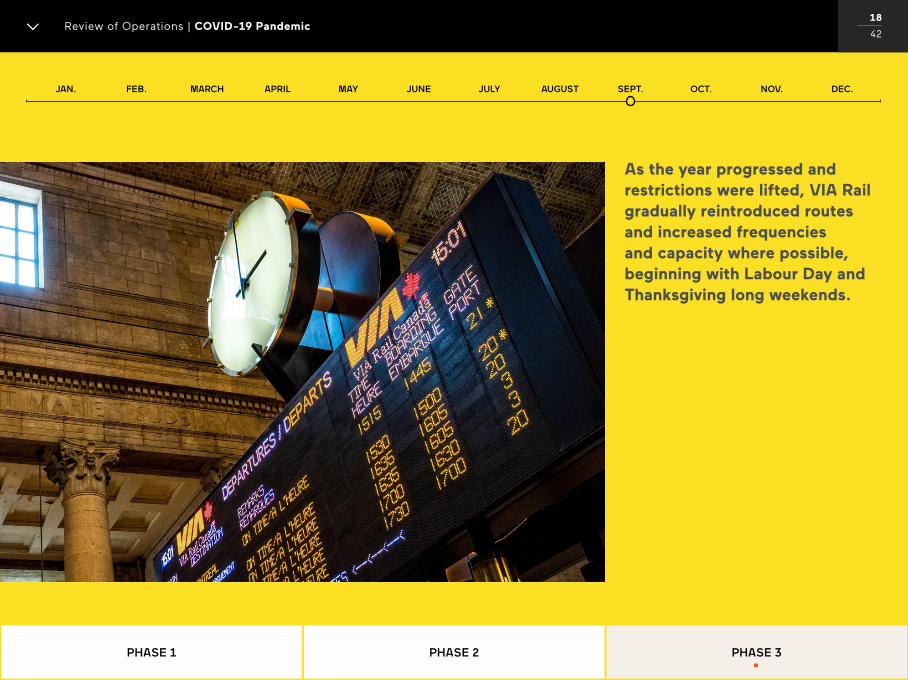
As the year progressed and restrictions were lifted, VIA Rail gradually reintroduced routes and increased frequencies and capacity where possible, beginning with Labour Day and Thanksgiving long weekends.
12 / 35Review of Operations | COVID-19 PandemicReview of Operations | COVID-19 Pandemic
18
42
PHASE 3PHASE 2PHASE 1
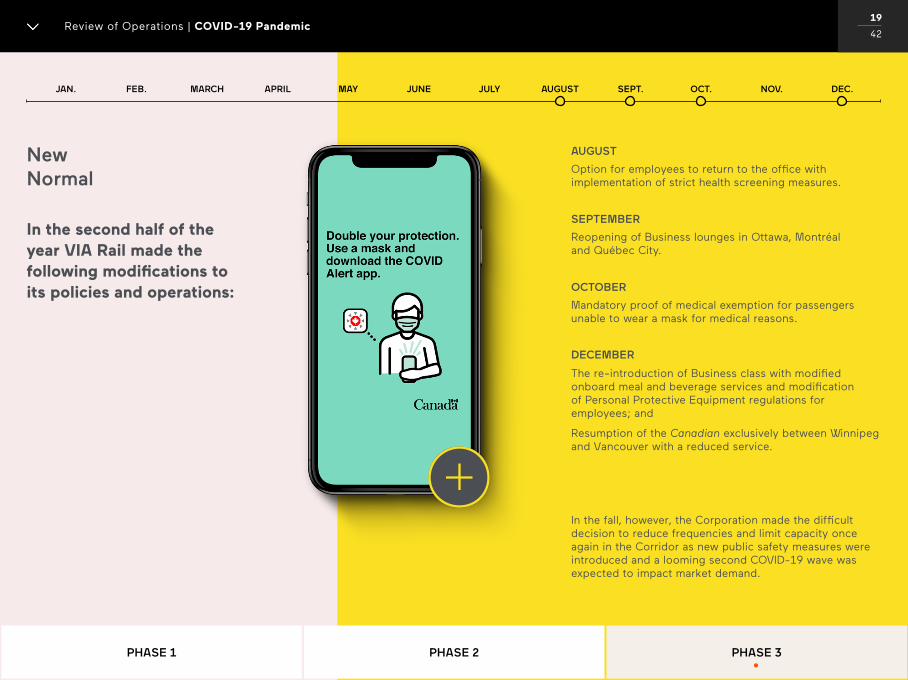
In the second half of the year VIA Rail made the following modifications to its policies and operations:
New Normal
Option for employees to return to the office with implementation of strict health screening measures.
AUGUST
Reopening of Business lounges in Ottawa, Montréal and Québec City.
SEPTEMBER
Mandatory proof of medical exemption for passengers unable to wear a mask for medical reasons.
OCTOBER
The re-introduction of Business class with modified onboard meal and beverage services and modification of Personal Protective Equipment regulations for employees; and
Resumption of the Canadian exclusively between Winnipeg and Vancouver with a reduced service.
DECEMBER
12 / 35Review of Operations | COVID-19 PandemicReview of Operations | COVID-19 Pandemic
19
42
PHASE 3PHASE 2PHASE 1
In the fall, however, the Corporation made the difficult decision to reduce frequencies and limit capacity once again in the Corridor as new public safety measures were introduced and a looming second COVID-19 wave was expected to impact market demand.

12 / 35Review of Operations | COVID-19 PandemicReview of Operations | COVID-19 Pandemic
19
42
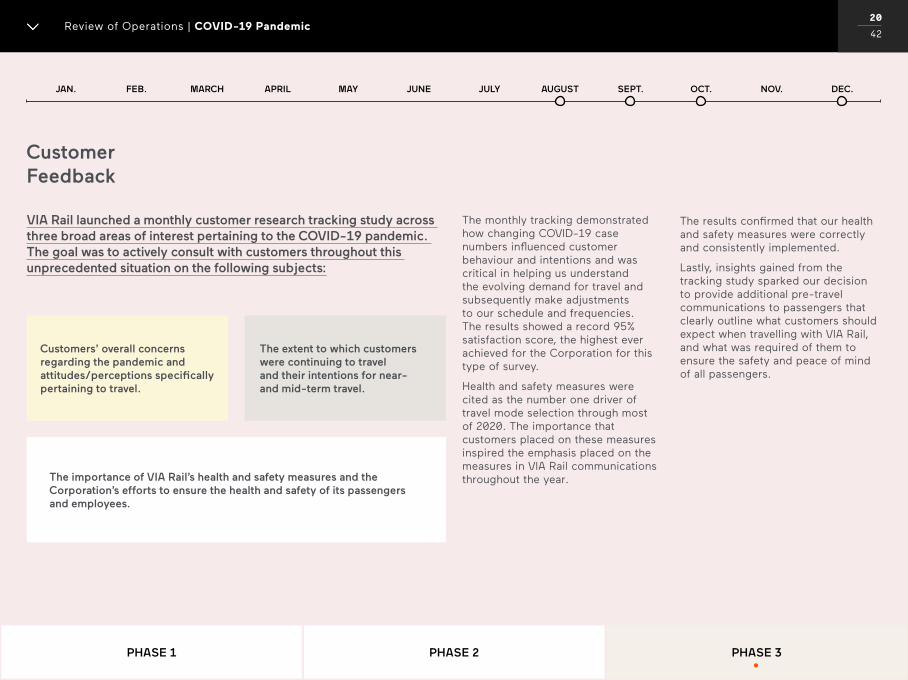
VIA Rail launched a monthly customer research tracking study across three broad areas of interest pertaining to the COVID-19 pandemic. The goal was to actively consult with customers throughout this unprecedented situation on the following subjects:
The monthly tracking demonstrated how changing COVID-19 case numbers influenced customer behaviour and intentions and was critical in helping us understand the evolving demand for travel and subsequently make adjustments to our schedule and frequencies. The results showed a record 95% satisfaction score, the highest ever achieved for the Corporation for this type of survey.
Health and safety measures were cited as the number one driver of travel mode selection through most of 2020. The importance that customers placed on these measures inspired the emphasis placed on the measures in VIA Rail communications throughout the year.
Customer Feedback
The importance of VIA Rail’s health and safety measures and the Corporation’s efforts to ensure the health and safety of its passengers and employees.
Customers’ overall concerns regarding the pandemic and attitudes/perceptions specifically pertaining to travel.
The extent to which customers were continuing to travel and their intentions for near- and mid-term travel.
12 / 35Review of Operations | COVID-19 PandemicReview of Operations | COVID-19 Pandemic
20
42
The results confirmed that our health and safety measures were correctly and consistently implemented.
Lastly, insights gained from the tracking study sparked our decision to provide additional pre-travel communications to passengers that clearly outline what customers should expect when travelling with VIA Rail, and what was required of them to ensure the safety and peace of mind of all passengers.
PHASE 3PHASE 2PHASE 1
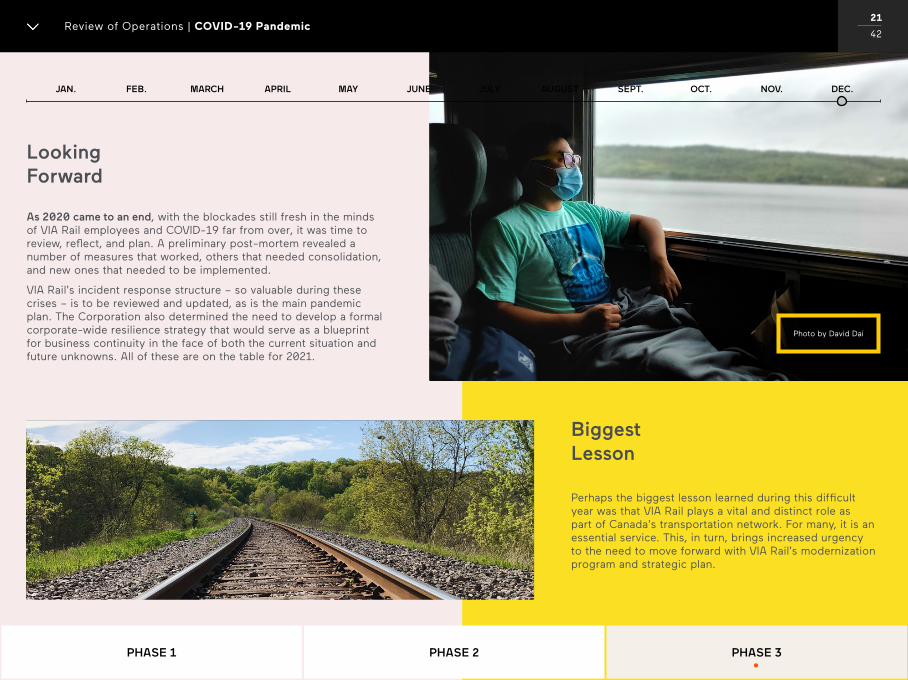
As 2020 came to an end, with the blockades still fresh in the minds of VIA Rail employees and COVID-19 far from over, it was time to review, reflect, and plan. A preliminary post-mortem revealed a number of measures that worked, others that needed consolidation, and new ones that needed to be implemented.
VIA Rail’s incident response structure – so valuable during these crises – is to be reviewed and updated, as is the main pandemic plan. The Corporation also determined the need to develop a formal corporate-wide resilience strategy that would serve as a blueprint for business continuity in the face of both the current situation and future unknowns. All of these are on the table for 2021.
Looking Forward
Perhaps the biggest lesson learned during this difficult year was that VIA Rail plays a vital and distinct role as part of Canada’s transportation network. For many, it is an essential service. This, in turn, brings increased urgency to the need to move forward with VIA Rail’s modernization program and strategic plan.
Biggest Lesson
12 / 35Review of Operations | COVID-19 PandemicReview of Operations | COVID-19 Pandemic
21
42
PHASE 3PHASE 2PHASE 1
Photo by David Dai
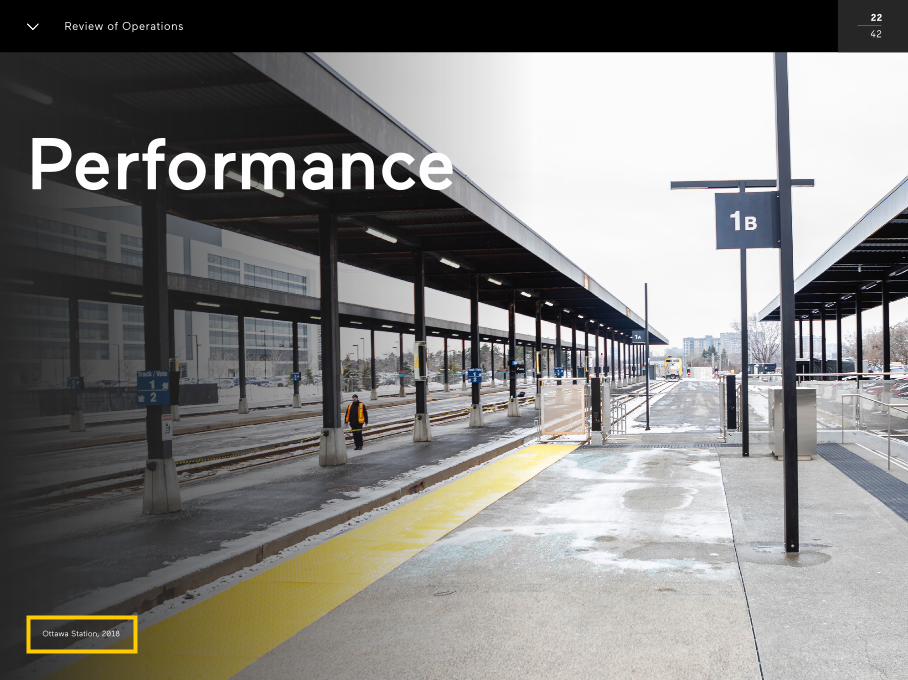
Ottawa Station, 2018
Performance
Review of Operations 22
42
1.1M passenger trips were taken in 2020
319M in revenue decline compared to 2019
1,000 employees were laid off
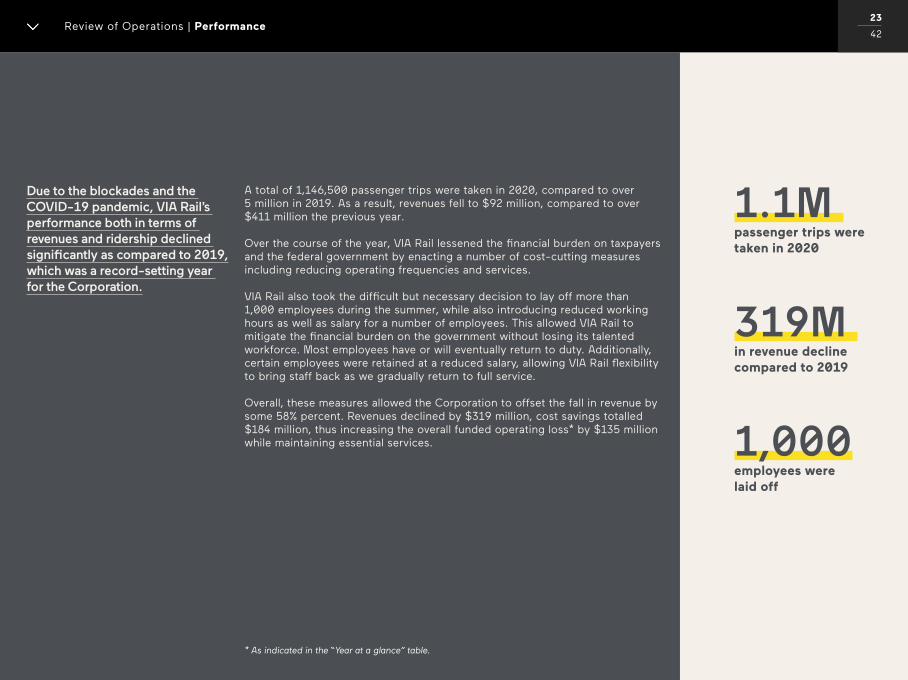
Due to the blockades and the COVID-19 pandemic, VIA Rail’s performance both in terms of revenues and ridership declined significantly as compared to 2019, which was a record-setting year for the Corporation.
* As indicated in the “Year at a glance” table.
A total of 1,146,500 passenger trips were taken in 2020, compared to over 5 million in 2019. As a result, revenues fell to $92 million, compared to over $411 million the previous year.
Over the course of the year, VIA Rail lessened the financial burden on taxpayers and the federal government by enacting a number of cost-cutting measures including reducing operating frequencies and services.
VIA Rail also took the difficult but necessary decision to lay off more than 1,000 employees during the summer, while also introducing reduced working hours as well as salary for a number of employees. This allowed VIA Rail to mitigate the financial burden on the government without losing its talented workforce. Most employees have or will eventually return to duty. Additionally, certain employees were retained at a reduced salary, allowing VIA Rail flexibility to bring staff back as we gradually return to full service.
Overall, these measures allowed the Corporation to offset the fall in revenue by some 58% percent. Revenues declined by $319 million, cost savings totalled $184 million, thus increasing the overall funded operating loss* by $135 million while maintaining essential services.
12 / 35Review of Operations | COVID-19 PandemicReview of Operations | Performance
23
42
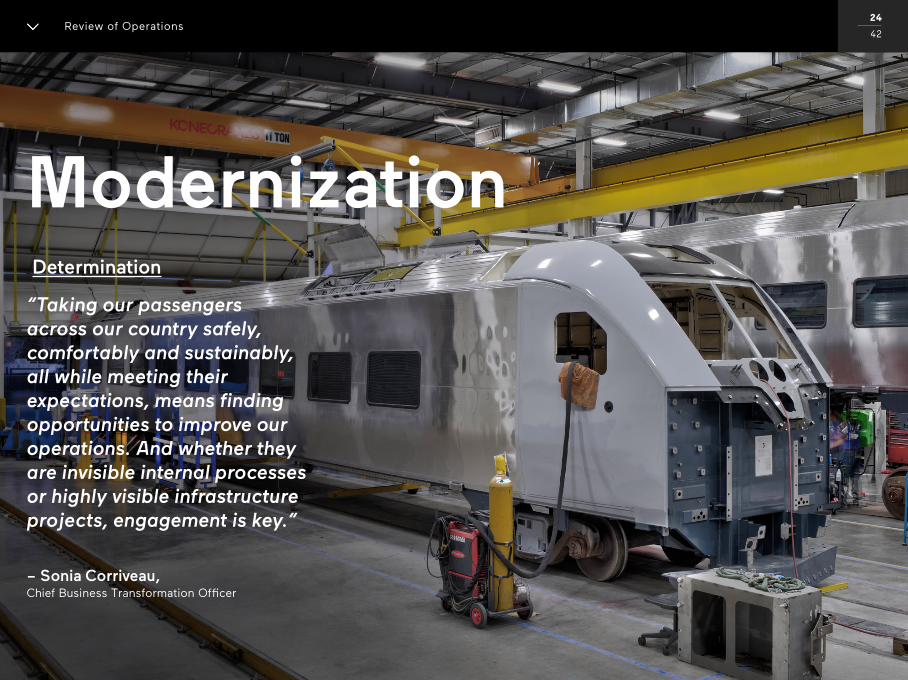
Modernization
“Taking our passengers across our country safely, comfortably and sustainably, all while meeting their expectations, means finding opportunities to improve our operations. And whether they are invisible internal processes or highly visible infrastructure projects, engagement is key.”
– Sonia Corriveau, Chief Business Transformation Officer
Determination
Review of Operations 24
42
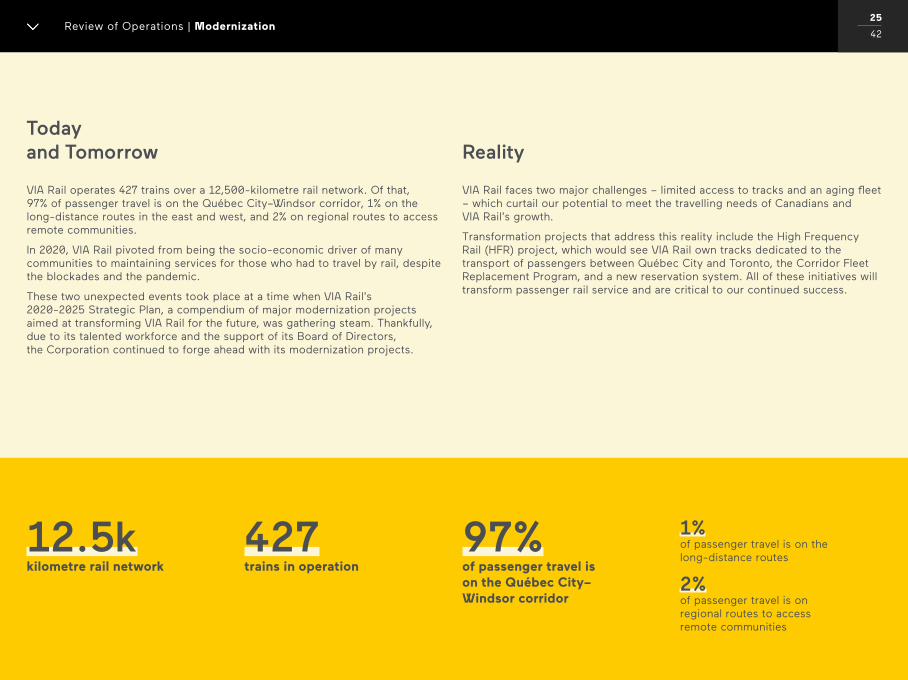
VIA Rail operates 427 trains over a 12,500-kilometre rail network. Of that, 97% of passenger travel is on the Québec City–Windsor corridor, 1% on the long-distance routes in the east and west, and 2% on regional routes to access remote communities.
In 2020, VIA Rail pivoted from being the socio-economic driver of many communities to maintaining services for those who had to travel by rail, despite the blockades and the pandemic.
These two unexpected events took place at a time when VIA Rail’s 2020-2025 Strategic Plan, a compendium of major modernization projects aimed at transforming VIA Rail for the future, was gathering steam. Thankfully, due to its talented workforce and the support of its Board of Directors, the Corporation continued to forge ahead with its modernization projects.
VIA Rail faces two major challenges – limited access to tracks and an aging fleet – which curtail our potential to meet the travelling needs of Canadians and VIA Rail’s growth.
Transformation projects that address this reality include the High Frequency Rail (HFR) project, which would see VIA Rail own tracks dedicated to the transport of passengers between Québec City and Toronto, the Corridor Fleet Replacement Program, and a new reservation system. All of these initiatives will transform passenger rail service and are critical to our continued success.
Today and Tomorrow Reality
12 / 35Review of Operations | COVID-19 PandemicReview of Operations | Modernization
25
42
1% of passenger travel is on the long-distance routes
2% of passenger travel is on regional routes to access remote communities
12.5kkilometre rail network
427trains in operation
97%of passenger travel is on the Québec City– Windsor corridor
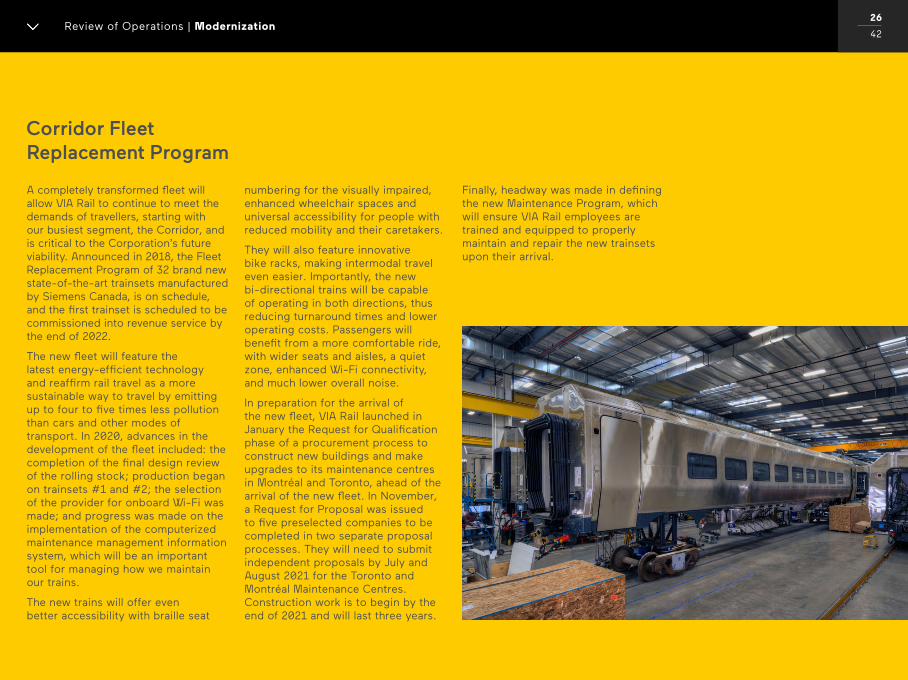
A completely transformed fleet will allow VIA Rail to continue to meet the demands of travellers, starting with our busiest segment, the Corridor, and is critical to the Corporation’s future viability. Announced in 2018, the Fleet Replacement Program of 32 brand new state-of-the-art trainsets manufactured by Siemens Canada, is on schedule, and the first trainset is scheduled to be commissioned into revenue service by the end of 2022.
The new fleet will feature the latest energy-efficient technology and reaffirm rail travel as a more sustainable way to travel by emitting up to four to five times less pollution than cars and other modes of transport. In 2020, advances in the development of the fleet included: the completion of the final design review of the rolling stock; production began on trainsets #1 and #2; the selection of the provider for onboard Wi-Fi was made; and progress was made on the implementation of the computerized maintenance management information system, which will be an important tool for managing how we maintain our trains.
The new trains will offer even better accessibility with braille seat
numbering for the visually impaired, enhanced wheelchair spaces and universal accessibility for people with reduced mobility and their caretakers.
They will also feature innovative bike racks, making intermodal travel even easier. Importantly, the new bi-directional trains will be capable of operating in both directions, thus reducing turnaround times and lower operating costs. Passengers will benefit from a more comfortable ride, with wider seats and aisles, a quiet zone, enhanced Wi-Fi connectivity, and much lower overall noise.
In preparation for the arrival of the new fleet, VIA Rail launched in January the Request for Qualification phase of a procurement process to construct new buildings and make upgrades to its maintenance centres in Montréal and Toronto, ahead of the arrival of the new fleet. In November, a Request for Proposal was issued to five preselected companies to be completed in two separate proposal processes. They will need to submit independent proposals by July and August 2021 for the Toronto and Montréal Maintenance Centres. Construction work is to begin by the end of 2021 and will last three years.
Corridor Fleet Replacement Program
Finally, headway was made in defining the new Maintenance Program, which will ensure VIA Rail employees are trained and equipped to properly maintain and repair the new trainsets upon their arrival.
12 / 35Review of Operations | COVID-19 PandemicReview of Operations | Modernization
26
42
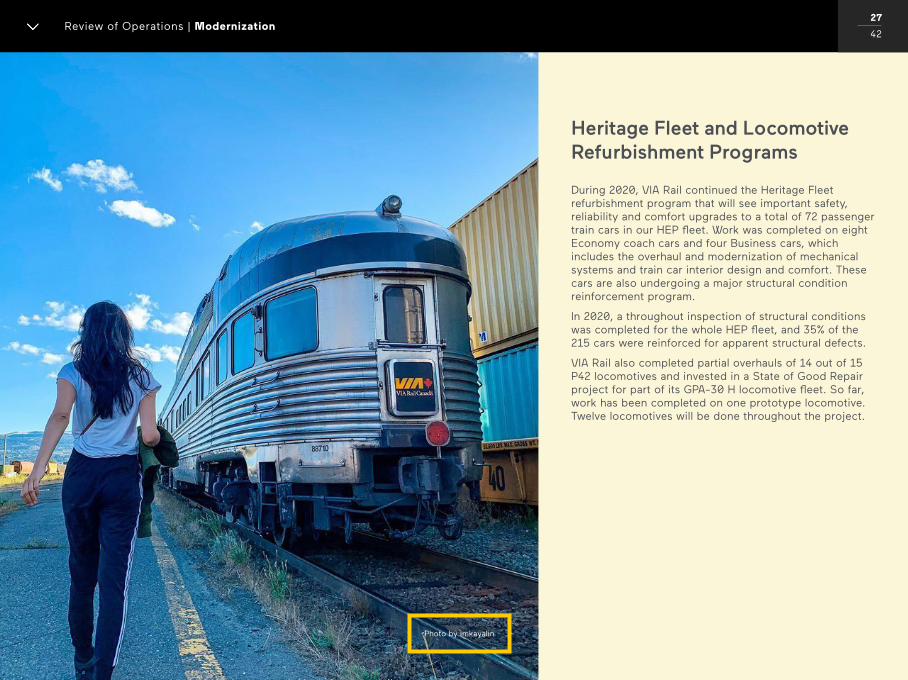
During 2020, VIA Rail continued the Heritage Fleet refurbishment program that will see important safety, reliability and comfort upgrades to a total of 72 passenger train cars in our HEP fleet. Work was completed on eight Economy coach cars and four Business cars, which includes the overhaul and modernization of mechanical systems and train car interior design and comfort. These cars are also undergoing a major structural condition reinforcement program.
In 2020, a throughout inspection of structural conditions was completed for the whole HEP fleet, and 35% of the 215 cars were reinforced for apparent structural defects.
VIA Rail also completed partial overhauls of 14 out of 15 P42 locomotives and invested in a State of Good Repair project for part of its GPA-30 H locomotive fleet. So far, work has been completed on one prototype locomotive. Twelve locomotives will be done throughout the project.
Heritage Fleet and Locomotive Refurbishment Programs
12 / 35Review of Operations | COVID-19 PandemicReview of Operations | Modernization
27
42
Photo by imkayalin
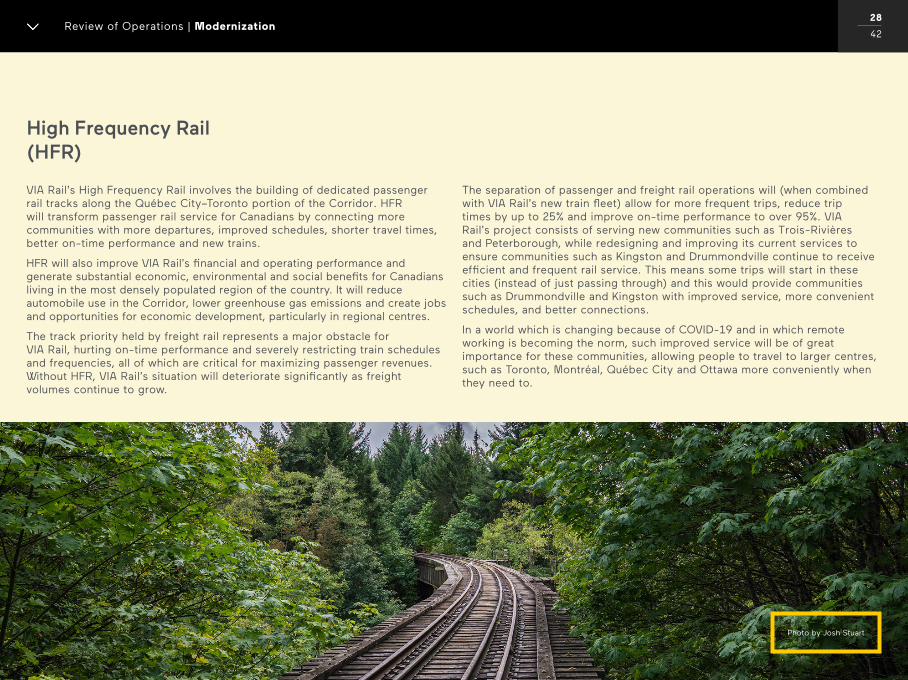
VIA Rail’s High Frequency Rail involves the building of dedicated passenger rail tracks along the Québec City–Toronto portion of the Corridor. HFR will transform passenger rail service for Canadians by connecting more communities with more departures, improved schedules, shorter travel times, better on-time performance and new trains.
HFR will also improve VIA Rail’s financial and operating performance and generate substantial economic, environmental and social benefits for Canadians living in the most densely populated region of the country. It will reduce automobile use in the Corridor, lower greenhouse gas emissions and create jobs and opportunities for economic development, particularly in regional centres.
The track priority held by freight rail represents a major obstacle for VIA Rail, hurting on-time performance and severely restricting train schedules and frequencies, all of which are critical for maximizing passenger revenues. Without HFR, VIA Rail’s situation will deteriorate significantly as freight volumes continue to grow.
High Frequency Rail (HFR)
12 / 35Review of Operations | COVID-19 PandemicReview of Operations | Modernization
28
42
Photo by Josh Stuart
The separation of passenger and freight rail operations will (when combined with VIA Rail’s new train fleet) allow for more frequent trips, reduce trip times by up to 25% and improve on-time performance to over 95%. VIA Rail’s project consists of serving new communities such as Trois-Rivières and Peterborough, while redesigning and improving its current services to ensure communities such as Kingston and Drummondville continue to receive efficient and frequent rail service. This means some trips will start in these cities (instead of just passing through) and this would provide communities such as Drummondville and Kingston with improved service, more convenient schedules, and better connections.
In a world which is changing because of COVID-19 and in which remote working is becoming the norm, such improved service will be of great importance for these communities, allowing people to travel to larger centres, such as Toronto, Montréal, Québec City and Ottawa more conveniently when they need to.
High Frequency Rail (HFR) (cont’d)
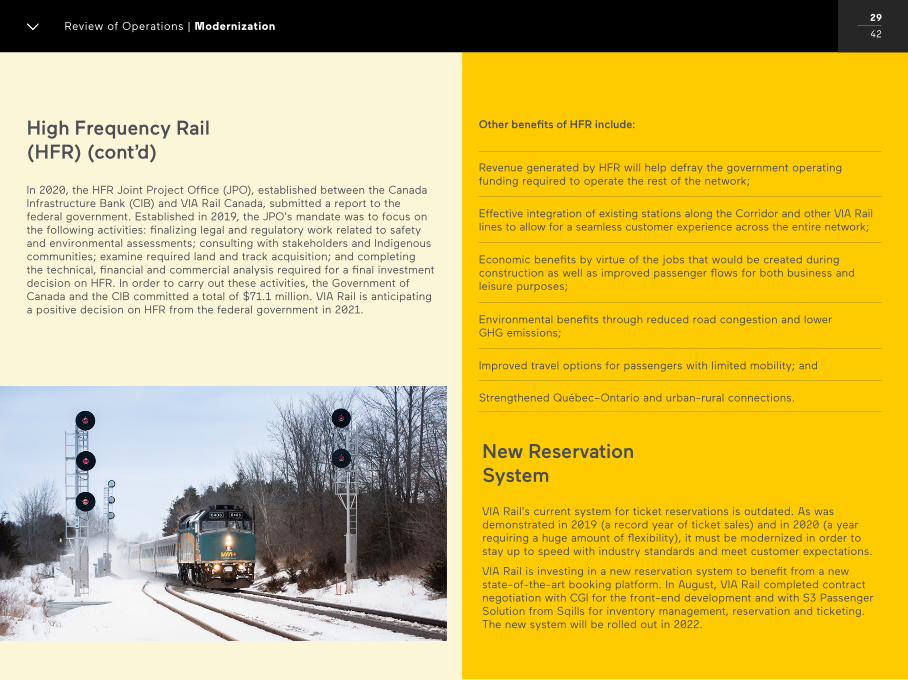
In 2020, the HFR Joint Project Office (JPO), established between the Canada Infrastructure Bank (CIB) and VIA Rail Canada, submitted a report to the federal government. Established in 2019, the JPO’s mandate was to focus on the following activities: finalizing legal and regulatory work related to safety and environmental assessments; consulting with stakeholders and Indigenous communities; examine required land and track acquisition; and completing the technical, financial and commercial analysis required for a final investment decision on HFR. In order to carry out these activities, the Government of Canada and the CIB committed a total of $71.1 million. VIA Rail is anticipating a positive decision on HFR from the federal government in 2021.
12 / 35Review of Operations | COVID-19 PandemicReview of Operations | Modernization
29
42
Effective integration of existing stations along the Corridor and other VIA Rail lines to allow for a seamless customer experience across the entire network;
Revenue generated by HFR will help defray the government operating funding required to operate the rest of the network;
Economic benefits by virtue of the jobs that would be created during construction as well as improved passenger flows for both business and leisure purposes;
Strengthened Québec–Ontario and urban-rural connections.
Improved travel options for passengers with limited mobility; and
Environmental benefits through reduced road congestion and lower GHG emissions;
Other benefits of HFR include:
VIA Rail’s current system for ticket reservations is outdated. As was demonstrated in 2019 (a record year of ticket sales) and in 2020 (a year requiring a huge amount of flexibility), it must be modernized in order to stay up to speed with industry standards and meet customer expectations.
VIA Rail is investing in a new reservation system to benefit from a new state-of-the-art booking platform. In August, VIA Rail completed contract negotiation with CGI for the front-end development and with S3 Passenger Solution from Sqills for inventory management, reservation and ticketing. The new system will be rolled out in 2022.
New Reservation System
Accessibility“As the national passenger rail service, we have a responsibility to provide a safe, inclusive and accessible travel experience to all Canadians. 2020 was a key year for accessibility at VIA Rail, and the steps taken brought us closer to our objective of becoming Canada’s most accessible national and intercity mode of transportation.”
– Jean-François Legault, Chief Legal & Risk Officer and Corporate Secretary
Review of Operations 30
42
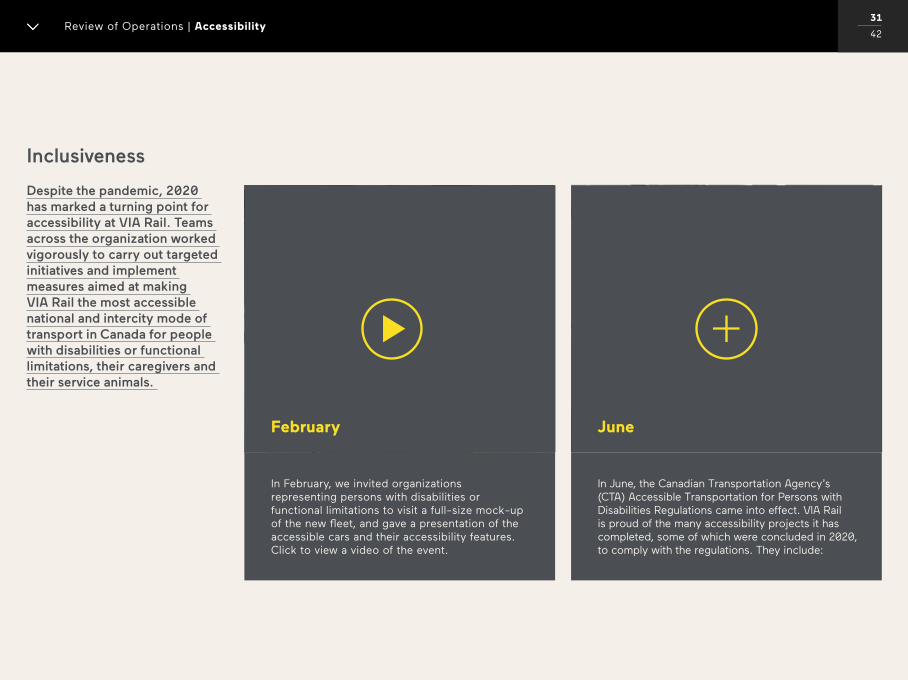
Inclusiveness
Despite the pandemic, 2020 has marked a turning point for accessibility at VIA Rail. Teams across the organization worked vigorously to carry out targeted initiatives and implement measures aimed at making VIA Rail the most accessible national and intercity mode of transport in Canada for people with disabilities or functional limitations, their caregivers and their service animals.
Review of Operations | Accessibility31
42
In February, we invited organizations representing persons with disabilities or functional limitations to visit a full-size mock-up of the new fleet, and gave a presentation of the accessible cars and their accessibility features. Click to view a video of the event.
In June, the Canadian Transportation Agency’s (CTA) Accessible Transportation for Persons with Disabilities Regulations came into effect. VIA Rail is proud of the many accessibility projects it has completed, some of which were concluded in 2020, to comply with the regulations. They include:
JuneFebruary
Review of Operations | Accessibility31
42
Acc
essi
bili
ty
Pro
jec
ts
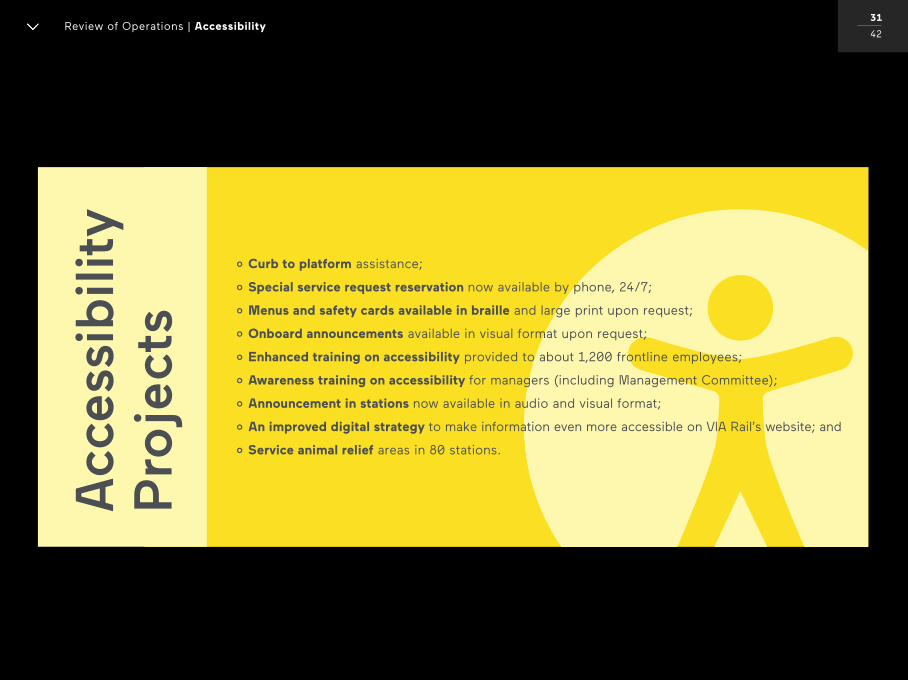
o Curb to platform assistance;
o Special service request reservation now available by phone, 24/7;
o Menus and safety cards available in braille and large print upon request;
o Onboard announcements available in visual format upon request;
o Enhanced training on accessibility provided to about 1,200 frontline employees;
o Awareness training on accessibility for managers (including Management Committee);
o Announcement in stations now available in audio and visual format;
o An improved digital strategy to make information even more accessible on VIA Rail’s website; and
o Service animal relief areas in 80 stations.
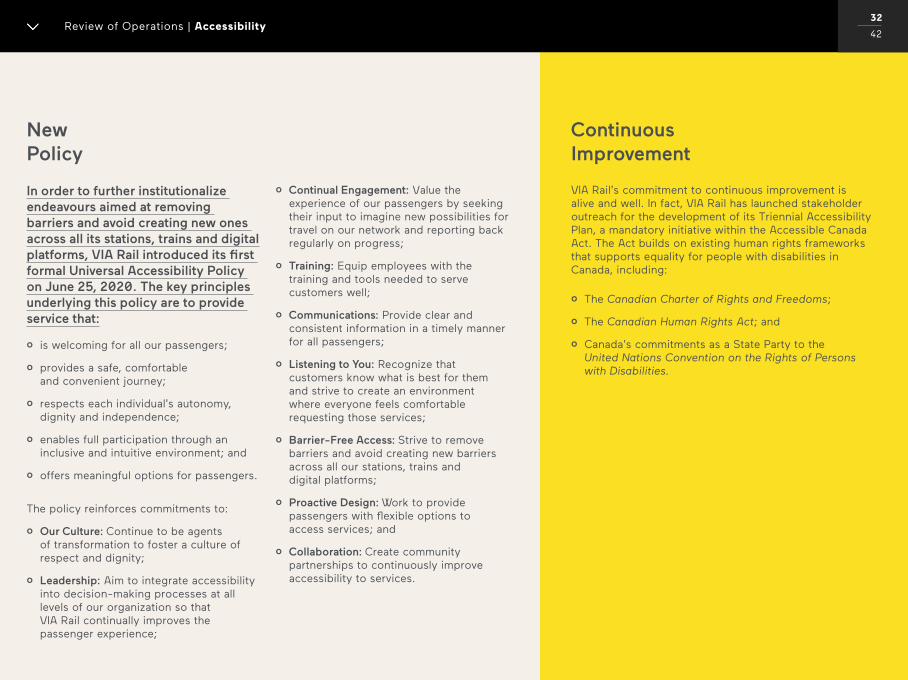
New Policy
Continuous Improvement
In order to further institutionalize endeavours aimed at removing barriers and avoid creating new ones across all its stations, trains and digital platforms, VIA Rail introduced its first formal Universal Accessibility Policy on June 25, 2020. The key principles underlying this policy are to provide service that:
o is welcoming for all our passengers;
o provides a safe, comfortable and convenient journey;
o respects each individual’s autonomy, dignity and independence;
o enables full participation through an inclusive and intuitive environment; and
o offers meaningful options for passengers.
The policy reinforces commitments to:
o Our Culture: Continue to be agents of transformation to foster a culture of respect and dignity;
o Leadership: Aim to integrate accessibility into decision-making processes at all levels of our organization so that VIA Rail continually improves the passenger experience;
o Continual Engagement: Value the experience of our passengers by seeking their input to imagine new possibilities for travel on our network and reporting back regularly on progress;
o Training: Equip employees with the training and tools needed to serve customers well;
o Communications: Provide clear and consistent information in a timely manner for all passengers;
o Listening to You: Recognize that customers know what is best for them and strive to create an environment where everyone feels comfortable requesting those services;
o Barrier-Free Access: Strive to remove barriers and avoid creating new barriers across all our stations, trains and digital platforms;
o Proactive Design: Work to provide passengers with flexible options to access services; and
o Collaboration: Create community partnerships to continuously improve accessibility to services.
VIA Rail’s commitment to continuous improvement is alive and well. In fact, VIA Rail has launched stakeholder outreach for the development of its Triennial Accessibility Plan, a mandatory initiative within the Accessible Canada Act. The Act builds on existing human rights frameworks that supports equality for people with disabilities in Canada, including:
o The Canadian Charter of Rights and Freedoms;
o The Canadian Human Rights Act; and
o Canada’s commitments as a State Party to the United Nations Convention on the Rights of Persons with Disabilities.
Review of Operations | Accessibility32
42
Communities and Donations
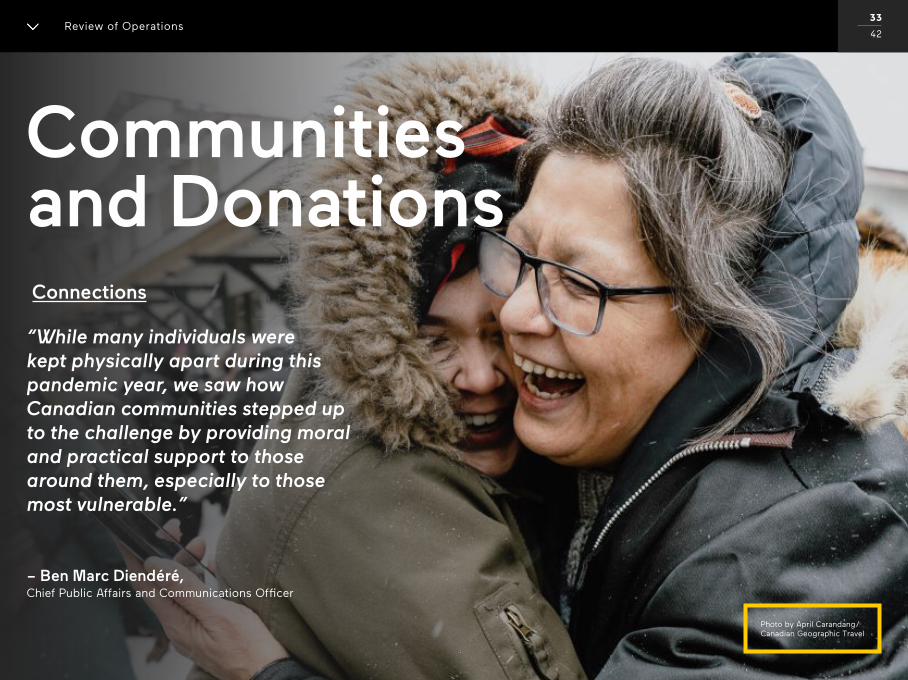
“While many individuals were kept physically apart during this pandemic year, we saw how Canadian communities stepped up to the challenge by providing moral and practical support to those around them, especially to those most vulnerable.”
– Ben Marc Diendéré, Chief Public Affairs and Communications Officer
Connections
Review of Operations 33
42
Photo by April Carandang/Canadian Geographic Travel

Community investment and involvement at VIA Rail mainly takes the form of in-kind support, exchange of services, and volunteerism. And, because VIA Rail is a true chain that links communities from east to west and north to south, maintaining an open dialogue with our key local stakeholders is critical to our ability to operate sustainably within these communities.
2020 marked a substantial decrease in services and revenue, which meant VIA Rail had to review and reduce in scope some partnerships. However, thanks to open communications, VIA Rail’s community teams continued to solidify existing relationships and looks forward to boosting support in the near future.
Despite the challenges of 2020, VIA Rail continued to help Canadian organizations, including helping promote the national sustainable mobility movement. Partner dialogues continued with such leading organizations as Transport Action Canada and its regional sections,
the Canadian Chamber of Commerce, the Union des Municipalités du Québec and the Sustainable Mobility Chair of École Polytechnique, to name just a few.
VIA Rail also held numerous meetings with elected officials from the three levels of government and several Indigenous community leaders to review the impact of the COVID-19 crisis on the communities we serve and on mitigation efforts. Also discussed were return to service strategies and the importance of VIA Rail’s long-term modernization plans.
Honouring Commitments
Review of Operations | Communities and Donations34
42
On International Women’s Day, VIA Rail President and CEO, Cynthia Garneau, was among the panelists in a virtual conference hosted by Transport Canada featuring pioneering women in the Canadian transportation sector.
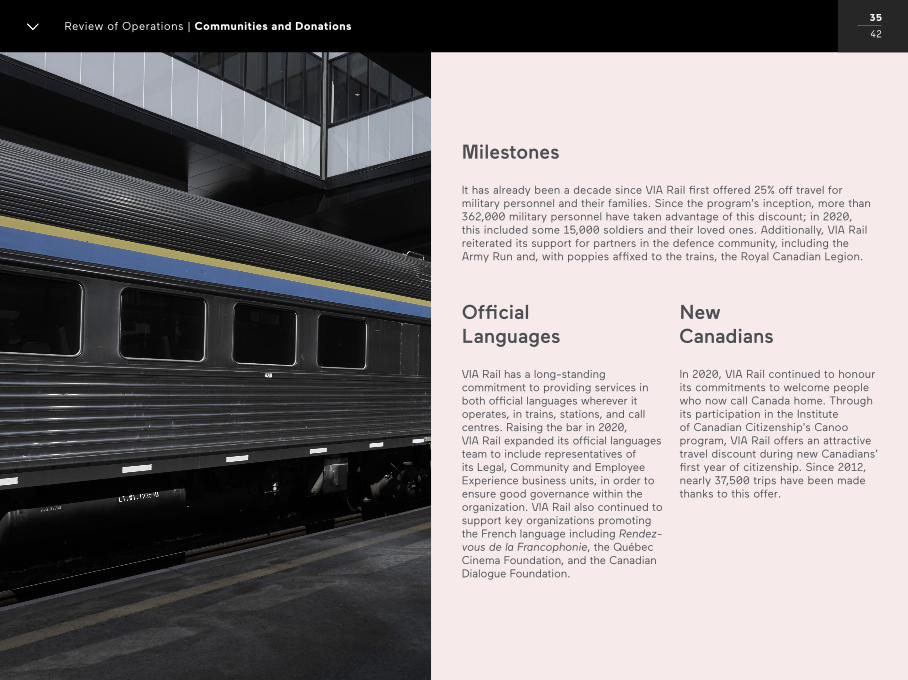
It has already been a decade since VIA Rail first offered 25% off travel for military personnel and their families. Since the program’s inception, more than 362,000 military personnel have taken advantage of this discount; in 2020, this included some 15,000 soldiers and their loved ones. Additionally, VIA Rail reiterated its support for partners in the defence community, including the Army Run and, with poppies affixed to the trains, the Royal Canadian Legion.
VIA Rail has a long-standing commitment to providing services in both official languages wherever it operates, in trains, stations, and call centres. Raising the bar in 2020, VIA Rail expanded its official languages team to include representatives of its Legal, Community and Employee Experience business units, in order to ensure good governance within the organization. VIA Rail also continued to support key organizations promoting the French language including Rendez-vous de la Francophonie, the Québec Cinema Foundation, and the Canadian Dialogue Foundation.
In 2020, VIA Rail continued to honour its commitments to welcome people who now call Canada home. Through its participation in the Institute of Canadian Citizenship’s Canoo program, VIA Rail offers an attractive travel discount during new Canadians’ first year of citizenship. Since 2012, nearly 37,500 trips have been made thanks to this offer.
Milestones
Official Languages
New Canadians
Review of Operations | Communities and Donations35
42

Most of VIA Rail’s partners struggled with events during the year for obvious reasons; some were modified to a virtual format while other major sponsorships were cancelled. However, VIA Rail stayed close to all of them and continued to provide in-kind support where it could.
Looking forward to 2021, VIA Rail is committed to re-engaging with long-standing partners including CFB Kingston FunFest, Festival d’Été de Québec, Comedi’ha, CFB Halifax Family Days, and North American Indigenous Games.
Special Events
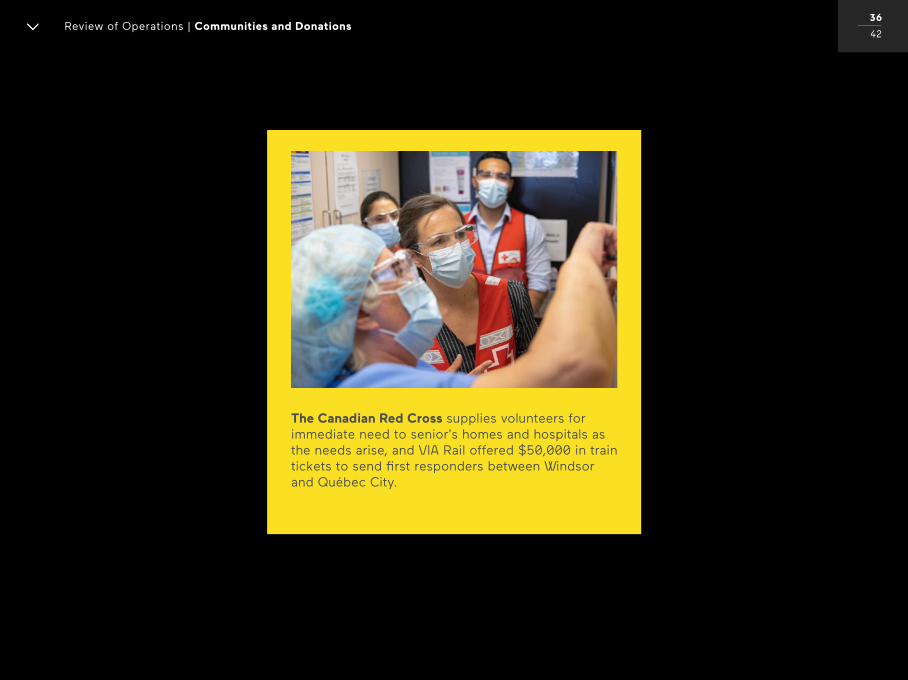
The Canadian Red Cross The Canadian Tulip Festival
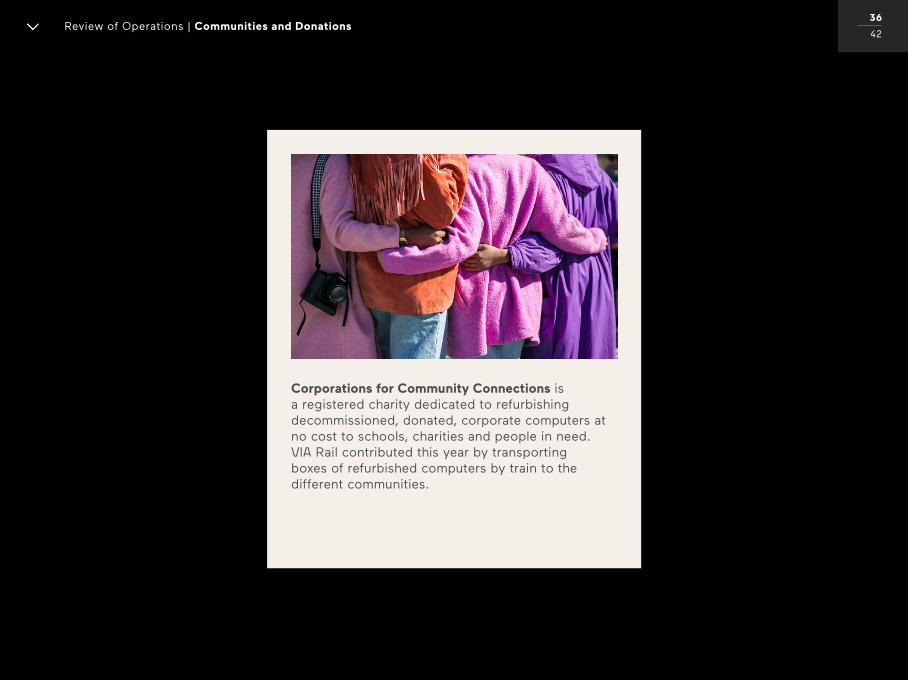
Corporations for Community Connections
Review of Operations | Communities and Donations36
42
Réseau Avant de Craquer
Canadian Nurses Foundation
National Trust Canada and Parks Canada
Review of Operations | Communities and Donations36
42
The Canadian Red Cross supplies volunteers for immediate need to senior’s homes and hospitals as the needs arise, and VIA Rail offered $50,000 in train tickets to send first responders between Windsor and Québec City.

Review of Operations | Communities and Donations36
42
The Canadian Tulip Festival, which has been an in-person annual event since 1945, was reinvented in 2020 as an online program using photography, 360-degree virtual garden tours, Video Walking Tour, interactive garden maps, and daily Facebook live check-ins. VIA Rail donated one prize per day in order to encourage the public to stay home and safe and to engage in a daily conversation with the Canadian Tulip Festival.
Review of Operations | Communities and Donations36
42
Corporations for Community Connections is a registered charity dedicated to refurbishing decommissioned, donated, corporate computers at no cost to schools, charities and people in need. VIA Rail contributed this year by transporting boxes of refurbished computers by train to the different communities.
Review of Operations | Communities and Donations36
42
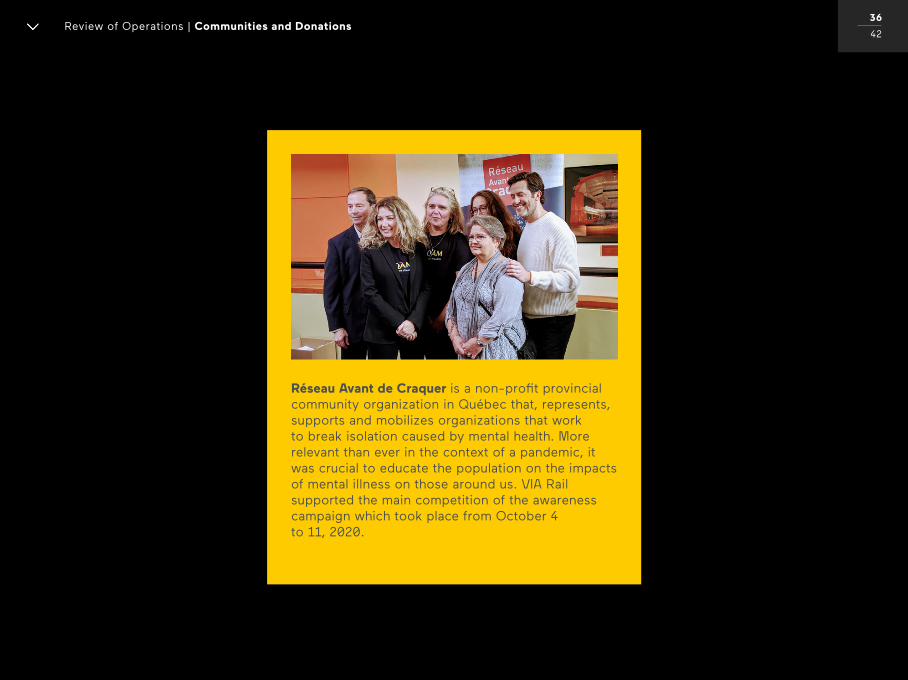
Réseau Avant de Craquer is a non-profit provincial community organization in Québec that, represents, supports and mobilizes organizations that work to break isolation caused by mental health. More relevant than ever in the context of a pandemic, it was crucial to educate the population on the impacts of mental illness on those around us. VIA Rail supported the main competition of the awareness campaign which took place from October 4 to 11, 2020.
Review of Operations | Communities and Donations36
42
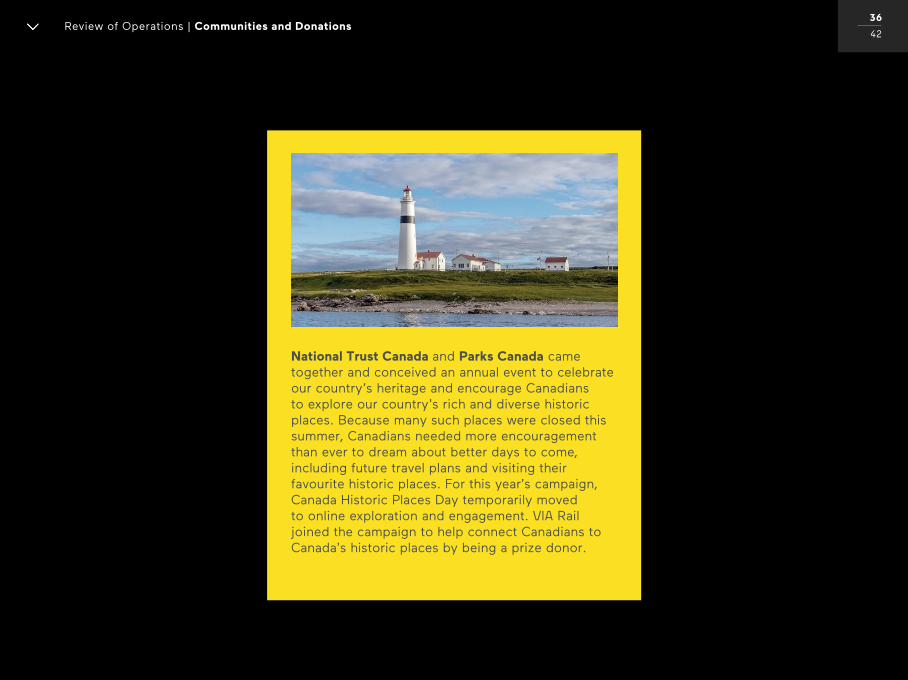
National Trust Canada and Parks Canada came together and conceived an annual event to celebrate our country’s heritage and encourage Canadians to explore our country’s rich and diverse historic places. Because many such places were closed this summer, Canadians needed more encouragement than ever to dream about better days to come, including future travel plans and visiting their favourite historic places. For this year’s campaign, Canada Historic Places Day temporarily moved to online exploration and engagement. VIA Rail joined the campaign to help connect Canadians to Canada’s historic places by being a prize donor.
Review of Operations | Communities and Donations36
42
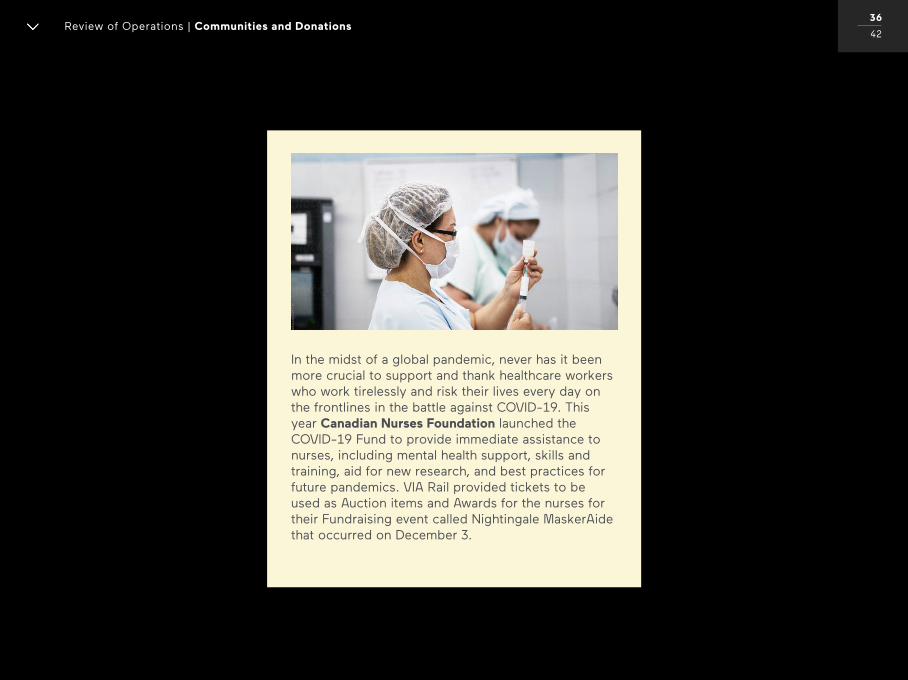
In the midst of a global pandemic, never has it been more crucial to support and thank healthcare workers who work tirelessly and risk their lives every day on the frontlines in the battle against COVID-19. This year Canadian Nurses Foundation launched the COVID-19 Fund to provide immediate assistance to nurses, including mental health support, skills and training, aid for new research, and best practices for future pandemics. VIA Rail provided tickets to be used as Auction items and Awards for the nurses for their Fundraising event called Nightingale MaskerAide that occurred on December 3.
Employees
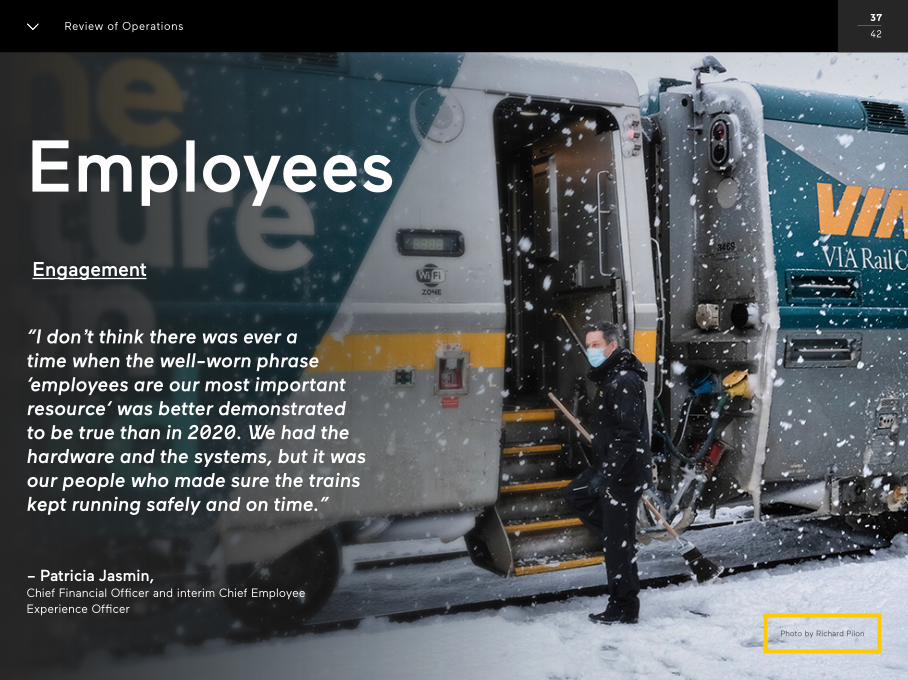
“I don’t think there was ever a time when the well-worn phrase ‘employees are our most important resource‘ was better demonstrated to be true than in 2020. We had the hardware and the systems, but it was our people who made sure the trains kept running safely and on time.”
– Patricia Jasmin, Chief Financial Officer and interim Chief Employee Experience Officer
Engagement
Review of Operations 37
42
Photo by Richard Pilon
Experience
Faced with the lengthy disruption of operations, VIA Rail offered staff ongoing training, insights, and coaching through its Employee Experience team. Crisis support measures were introduced and expanded in the pandemic to include:
While managing this ongoing situation, the Employee Experience team nonetheless moved forward with its key longer-term strategic initiatives related to the new corporate Diversity and Inclusion values, multiculturalism, and employment equity.
TrainingIn addition to the training activities delivered according to the original 2020 plan, 73 additional training sessions covering topics such as resilience, coaching, psychological safety and others were delivered in response to the pandemic. A total of 1,200 employees participated in these important activities.
A health and safety information toolkit for teleworkers
Continued access to free health and wellness support services for employees and their families, available 24/7
Tools to support managers
New human resources centre
Increasing the number of employee surveys (well-being, mobilization, telework, etc.)
Knowledge Centre
Launch of a Yammer Community
A review of our recognition program for the current year in order to recognize everyone’s contribution
Review of Operations | Employees38
42
Experience
Faced with the lengthy disruption of operations, VIA Rail offered staff ongoing training, insights, and coaching through its Employee Experience team. Crisis support measures were introduced and expanded in the pandemic to include:
While managing this ongoing situation, the Employee Experience team nonetheless moved forward with its key longer-term strategic initiatives related to the new corporate Diversity and Inclusion values, multiculturalism, and employment equity.
TrainingIn addition to the training activities delivered according to the original 2020 plan, 73 additional training sessions covering topics such as resilience, coaching, psychological safety and others were delivered in response to the pandemic. A total of 1,200 employees participated in these important activities.
A COVID-19 telework tool kit
Continued access to free health and wellness support services for employees and their families, available 24/7
Tools to support managers
New human resources centre
Increasing the number of employee surveys (well-being, mobilization, telework, etc.)
Knowledge Centre
Launch of a Yammer Community
A review of our recognition program for the current year in order to recognize everyone’s contribution
Review of Operations | Employees38
42
A health and safety information toolkit for teleworkers, Health and Safety While Teleworking – Safety Talks, which included: a guide on ergonomics and temporary work from home, video capsule on setting up a workstation, tips and tricks on boosting team morale when working remotely, as well as a link to a wellness campaign and resources and much more.
Experience
Faced with the lengthy disruption of operations, VIA Rail offered staff ongoing training, insights, and coaching through its Employee Experience team. Crisis support measures were introduced and expanded in the pandemic to include:
While managing this ongoing situation, the Employee Experience team nonetheless moved forward with its key longer-term strategic initiatives related to the new corporate Diversity and Inclusion values, multiculturalism, and employment equity.
TrainingIn addition to the training activities delivered according to the original 2020 plan, 73 additional training sessions covering topics such as resilience, coaching, psychological safety and others were delivered in response to the pandemic. A total of 1,200 employees participated in these important activities.
A COVID-19 telework tool kit
Continued access to free health and wellness support services for employees and their families, available 24/7
Tools to support managers
New human resources centre
Increasing the number of employee surveys (well-being, mobilization, telework, etc.)
Knowledge Centre
Launch of a Yammer Community
A review of our recognition program for the current year in order to recognize everyone’s contribution
Review of Operations | Employees38
42
Tools to support managers on health and safety initiatives, including a telemedicine program, Dialogue, for working and temporarily laid off employees.
Experience
Faced with the lengthy disruption of operations, VIA Rail offered staff ongoing training, insights, and coaching through its Employee Experience team. Crisis support measures were introduced and expanded in the pandemic to include:
While managing this ongoing situation, the Employee Experience team nonetheless moved forward with its key longer-term strategic initiatives related to the new corporate Diversity and Inclusion values, multiculturalism, and employment equity.
TrainingIn addition to the training activities delivered according to the original 2020 plan, 73 additional training sessions covering topics such as resilience, coaching, psychological safety and others were delivered in response to the pandemic. A total of 1,200 employees participated in these important activities.
A health and safety information toolkit for teleworkers
Continued access to free health and wellness support services for employees and their families, available 24/7
Tools to support managers
New human resource centre
Increasing the number of employee surveys (well-being, mobilization, telework, etc.)
Knowledge Centre
Launch of a Yammer Community
A review of our recognition program for the current year in order to recognize everyone’s contribution
Review of Operations | Employees38
42
Launch of a new human resources centre which serves as a first stop for any HR-related questions for all employees and managers, including all matters from on-boarding to off-boarding of employees are now treated through this service centre which is also responsible for sending out all HR related communications.
Experience
Faced with the lengthy disruption of operations, VIA Rail offered staff ongoing training, insights, and coaching through its Employee Experience team. Crisis support measures were introduced and expanded in the pandemic to include:
While managing this ongoing situation, the Employee Experience team nonetheless moved forward with its key longer-term strategic initiatives related to the new corporate Diversity and Inclusion values, multiculturalism, and employment equity.
TrainingIn addition to the training activities delivered according to the original 2020 plan, 73 additional training sessions covering topics such as resilience, coaching, psychological safety and others were delivered in response to the pandemic. A total of 1,200 employees participated in these important activities.
A health and safety information toolkit for teleworkers
Continued access to free health and wellness support services for employees and their families, available 24/7
Tools to support managers
New human resources centre
Increasing the number of employee surveys (well-being, mobilization, telework, etc.)
Knowledge Centre
Launch of a Yammer Community
A review of our recognition program for the current year in order to recognize everyone’s contribution
Review of Operations | Employees38
42
Launch of a Yammer Community created for managers and professionals to give visibility to sector initiatives and share best practices regarding employee recognition.

Experience
Faced with the lengthy disruption of operations, VIA Rail offered staff ongoing training, insights, and coaching through its Employee Experience team. Crisis support measures were introduced and expanded in the pandemic to include:
While managing this ongoing situation, the Employee Experience team nonetheless moved forward with its key longer-term strategic initiatives related to the new corporate Diversity and Inclusion values, multiculturalism, and employment equity.
TrainingIn addition to the training activities delivered according to the original 2020 plan, 73 additional training sessions covering topics such as resilience, coaching, psychological safety and others were delivered in response to the pandemic. A total of 1,200 employees participated in these important activities.
A health and safety information toolkit for teleworkers
Continued access to free health and wellness support services for employees and their families, available 24/7
Tools to support managers
New human resources centre
Increasing the number of employee surveys (well-being, mobilization, telework, etc.)
Knowledge Centre
Launch of a Yammer Community
A review of our recognition program for the current year in order to recognize everyone’s contribution
Review of Operations | Employees38
42
Promotion of the Knowledge Centre, a centralized library of living documents to equip managers with the most recent information.
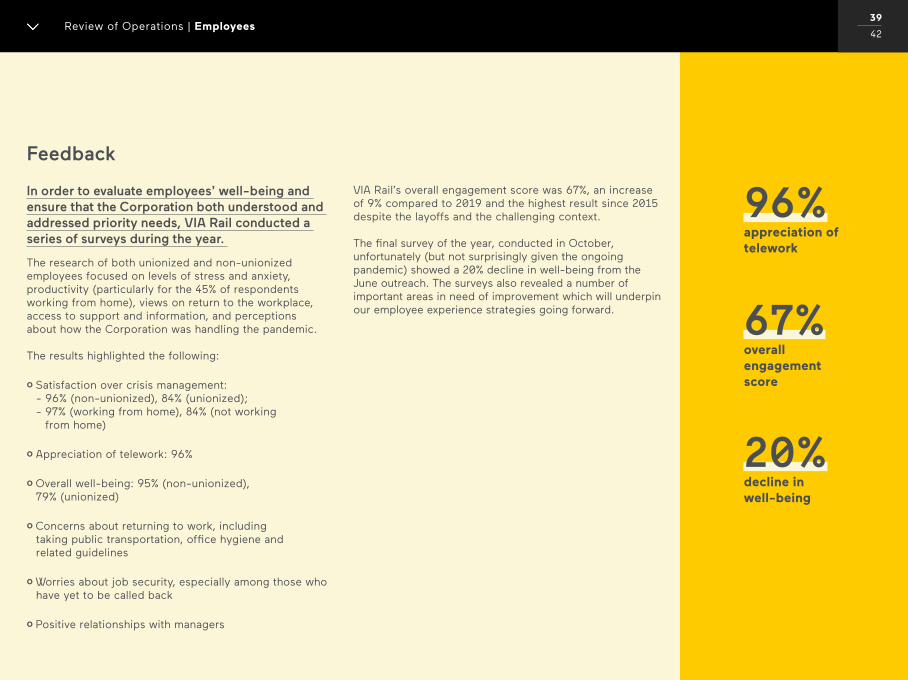
Feedback
In order to evaluate employees’ well-being and ensure that the Corporation both understood and addressed priority needs, VIA Rail conducted a series of surveys during the year.
The research of both unionized and non-unionized employees focused on levels of stress and anxiety, productivity (particularly for the 45% of respondents working from home), views on return to the workplace, access to support and information, and perceptions about how the Corporation was handling the pandemic. The results highlighted the following:
o Satisfaction over crisis management: - 96% (non-unionized), 84% (unionized); - 97% (working from home), 84% (not working from home)
o Appreciation of telework: 96% o Overall well-being: 95% (non-unionized), 79% (unionized)
o Concerns about returning to work, including taking public transportation, office hygiene and related guidelines
o Worries about job security, especially among those who have yet to be called back
o Positive relationships with managers
VIA Rail’s overall engagement score was 67%, an increase of 9% compared to 2019 and the highest result since 2015 despite the layoffs and the challenging context.
The final survey of the year, conducted in October, unfortunately (but not surprisingly given the ongoing pandemic) showed a 20% decline in well-being from the June outreach. The surveys also revealed a number of important areas in need of improvement which will underpin our employee experience strategies going forward.
Review of Operations | Employees39
42
96%appreciation of telework
20%decline in well-being
67%overall engagement score
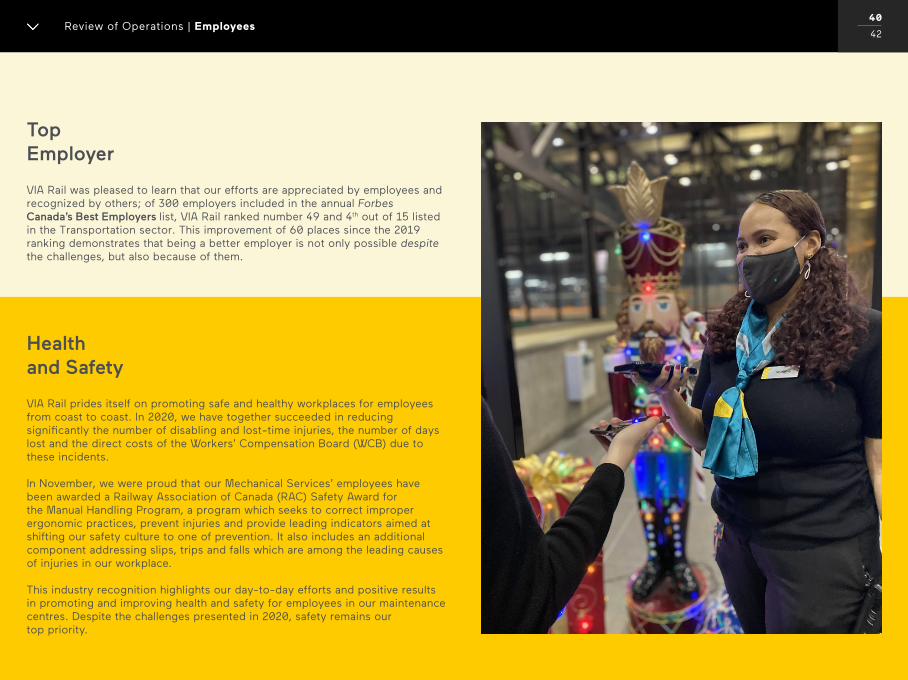
Top Employer
Health and Safety
VIA Rail was pleased to learn that our efforts are appreciated by employees and recognized by others; of 300 employers included in the annual Forbes Canada’s Best Employers list, VIA Rail ranked number 49 and 4th out of 15 listed in the Transportation sector. This improvement of 60 places since the 2019 ranking demonstrates that being a better employer is not only possible despite the challenges, but also because of them.
VIA Rail prides itself on promoting safe and healthy workplaces for employees from coast to coast. In 2020, we have together succeeded in reducing significantly the number of disabling and lost-time injuries, the number of days lost and the direct costs of the Workers’ Compensation Board (WCB) due to these incidents.
In November, we were proud that our Mechanical Services’ employees have been awarded a Railway Association of Canada (RAC) Safety Award for the Manual Handling Program, a program which seeks to correct improper ergonomic practices, prevent injuries and provide leading indicators aimed at shifting our safety culture to one of prevention. It also includes an additional component addressing slips, trips and falls which are among the leading causes of injuries in our workplace.
This industry recognition highlights our day-to-day efforts and positive results in promoting and improving health and safety for employees in our maintenance centres. Despite the challenges presented in 2020, safety remains our top priority.
Review of Operations | Employees40
42
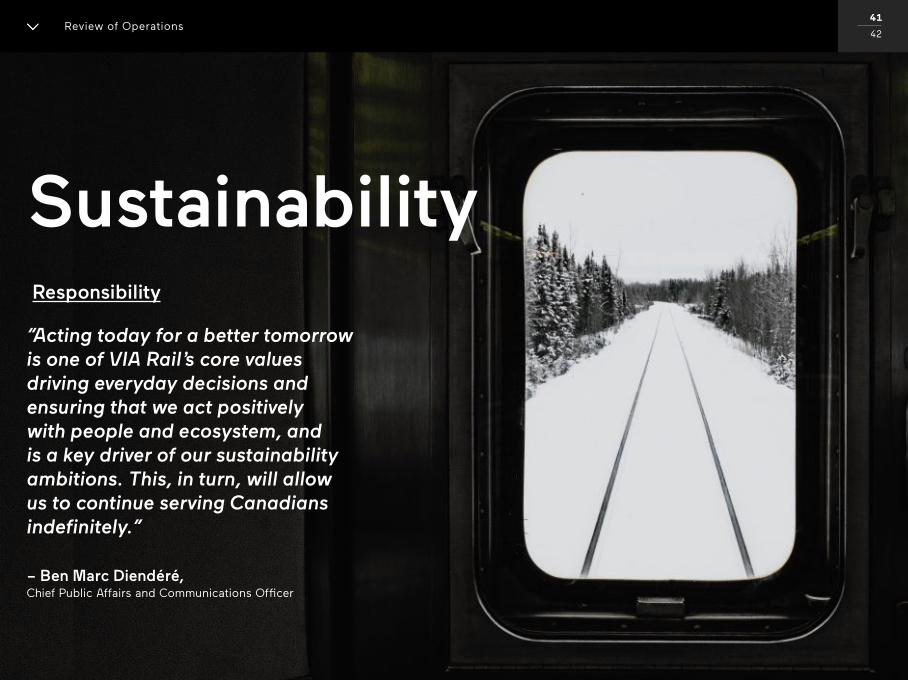
Sustainability
“Acting today for a better tomorrow is one of VIA Rail’s core values driving everyday decisions and ensuring that we act positively with people and ecosystem, and is a key driver of our sustainability ambitions. This, in turn, will allow us to continue serving Canadians indefinitely.”
– Ben Marc Diendéré, Chief Public Affairs and Communications Officer
Responsibility
Review of Operations 41
42
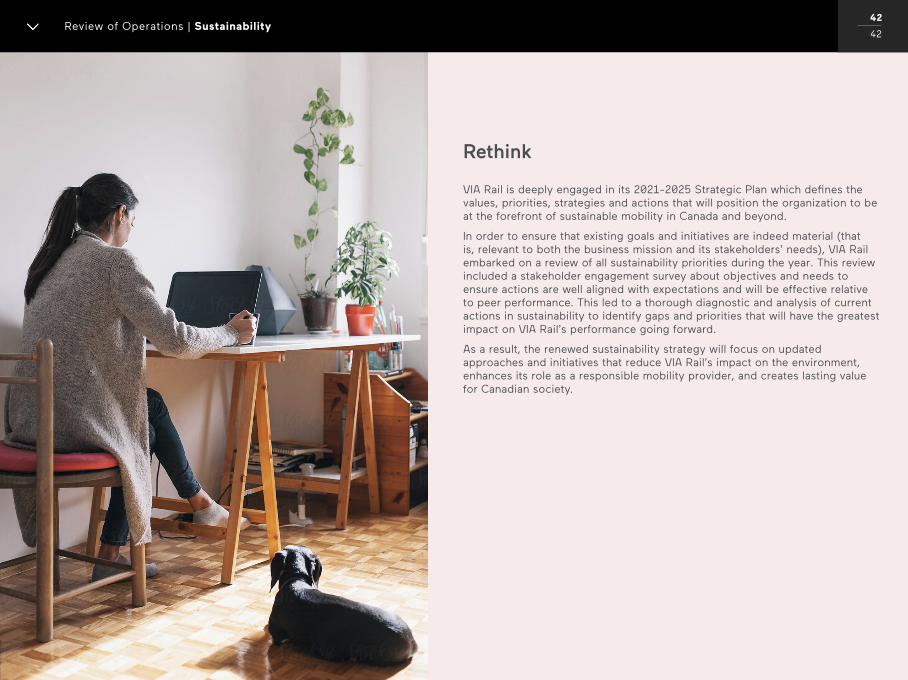
VIA Rail is deeply engaged in its 2021-2025 Strategic Plan which defines the values, priorities, strategies and actions that will position the organization to be at the forefront of sustainable mobility in Canada and beyond.
In order to ensure that existing goals and initiatives are indeed material (that is, relevant to both the business mission and its stakeholders’ needs), VIA Rail embarked on a review of all sustainability priorities during the year. This review included a stakeholder engagement survey about objectives and needs to ensure actions are well aligned with expectations and will be effective relative to peer performance. This led to a thorough diagnostic and analysis of current actions in sustainability to identify gaps and priorities that will have the greatest impact on VIA Rail’s performance going forward.
As a result, the renewed sustainability strategy will focus on updated approaches and initiatives that reduce VIA Rail’s impact on the environment, enhances its role as a responsible mobility provider, and creates lasting value for Canadian society.
Rethink
Review of Operations | Sustainability42
42
Key Performance Indicators
VIA Rail uses the following performance indicators as an integral part of its LEAN Management process. For detailed information on financial and operating performance during the quarter, consult the Management Discussion and Analysis section.
Key Performance Indicators01
02
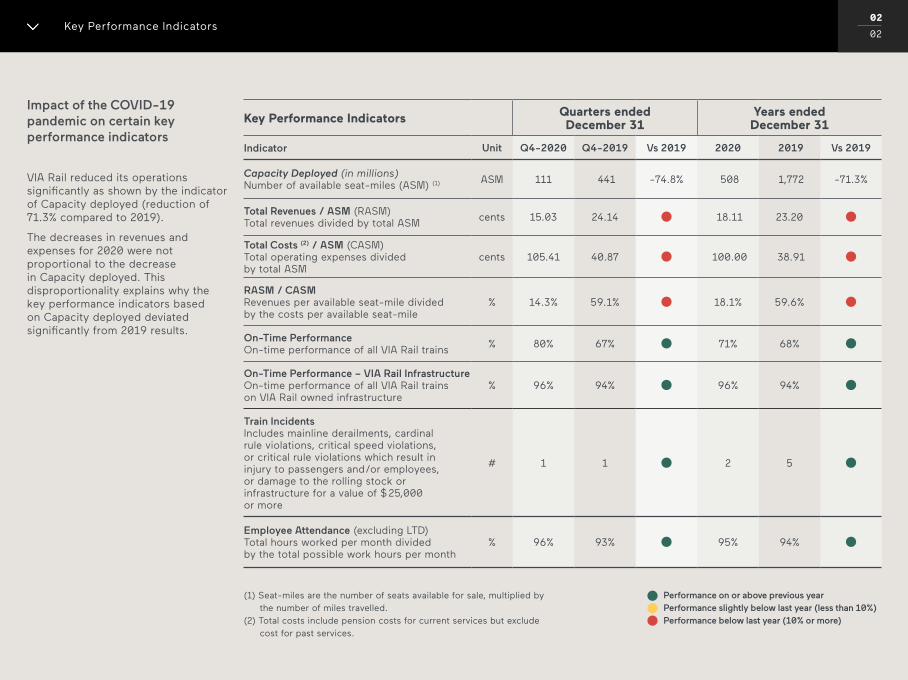
Key Performance Indicators02
02
Key Performance Indicators Quarters ended December 31
Years ended December 31
Indicator Unit Q4-2020 Q4-2019 Vs 2019 2020 2019 Vs 2019
Capacity Deployed (in millions) Number of available seat-miles (ASM) (1) ASM 111 441 -74.8% 508 1,772 -71.3%
Total Revenues / ASM (RASM) Total revenues divided by total ASM
cents 15.03 24.14 18.11 23.20
Total Costs (2) / ASM (CASM) Total operating expenses divided by total ASM
cents 105.41 40.87 100.00 38.91
RASM / CASM Revenues per available seat-mile divided by the costs per available seat-mile
% 14.3% 59.1% 18.1% 59.6%
On-Time Performance On-time performance of all VIA Rail trains
% 80% 67% 71% 68%
On-Time Performance – VIA Rail Infrastructure On-time performance of all VIA Rail trains on VIA Rail owned infrastructure
% 96% 94% 96% 94%
Train Incidents Includes mainline derailments, cardinal rule violations, critical speed violations, or critical rule violations which result in injury to passengers and/or employees, or damage to the rolling stock or infrastructure for a value of $ 25,000 or more
# 1 1 2 5
Employee Attendance (excluding LTD) Total hours worked per month divided by the total possible work hours per month
% 96% 93% 95% 94%
(1) Seat-miles are the number of seats available for sale, multiplied by the number of miles travelled.(2) Total costs include pension costs for current services but exclude cost for past services.
Performance on or above previous yearPerformance slightly below last year (less than 10%)Performance below last year (10% or more)
Impact of the COVID-19 pandemic on certain key performance indicators
VIA Rail reduced its operations significantly as shown by the indicator of Capacity deployed (reduction of 71.3% compared to 2019).
The decreases in revenues and expenses for 2020 were not proportional to the decrease in Capacity deployed. This disproportionality explains why the key performance indicators based on Capacity deployed deviated significantly from 2019 results.
Governance and Accountability
Governance and Accountability01
12
Continued Evolution of Risk Management Practices
With the COVID-19 pandemic disrupting the transportation sector in 2020, a prioritization exercise was conducted in order to maintain strong focus on the most impactful risks facing the Corporation in this “new normal” business environment. This led to the identification, evaluation and the development of treatment plans for two new risk categories which are Service Offering and Severe Interruption. Service Offering addresses both VIA Rail’s mandate as well as its capacity to deliver said mandate while the Severe Interruption risk category covers significant disturbances such as the inability to operate a full schedule due to the actions of third parties or a pandemic.
In 2020, a revised reporting format was also proposed to centre discussions between Management and the Board of Directors on risk levels, perceived effectiveness of treatment plans, residual risks and executive accountability to ensure that proper governance is adhered to and that mitigation plans are progressing, while maintaining the existing identification and analysis methods for risks.
Modernization Projects
As a Corporation which is amid a transformational agenda, VIA Rail is leveraging risk management as a key activity deeply integrated with its project management function. All business cases and vendor selections for material or complex projects have a detailed risk analysis made by a neutral facilitator, while simpler projects benefit from risk assessments conducted by the project teams. For major initiatives such as the Corridor Fleet Replacement Program, a dedicated Program Risk Manager is ensuring that robust risk management is conducted. Existing risk assessments for VIA Rail’s modernization projects are maintained on a regular basis in order to assess potential impacts on scope, budget and schedule. Material changes against the project baseline or project decisions are also conducted while considering potential risks.
Improved Risk Management Processes
In 2020, VIA Rail has continued its efforts on maintaining and improving the various risk management processes that are being used. These processes are ERM, project risk management and resiliency planning which includes crisis management, emergency response and business continuity.
Over time, VIA Rail has been deploying increasingly robust methodologies such as the use of Key Risk Indicators, Monte Carlo simulations as well as data analytics in order to improve risk management and provide better decision support.
VIA Rail is using a 3-tier approach for risk monitoring by the Board of Directors, where risks which could adversely impact the implementation of the Corporation’s strategic plan are discussed at the Board of Directors’ level while other material risks are discussed within the various Committees of the Board of Directors, on a quarterly basis, and operational risks are monitored at the management level and discussed yearly at the Board of Directors level.
Governance and Accountability02
12
Enterprise Risk Management
Enterprise Risk Management (ERM) strives to identify, assess and address threats and opportunities that may impact the attainment of the corporate objectives of an organization. The mission of the ERM team is to increase the usefulness and range of VIA Rail’s understanding of uncertainty in order to support better risk-informed decisions. This is to say that ERM is not only an activity which is a compliance requirement, but rather a useful methodology to support decision making at VIA Rail.
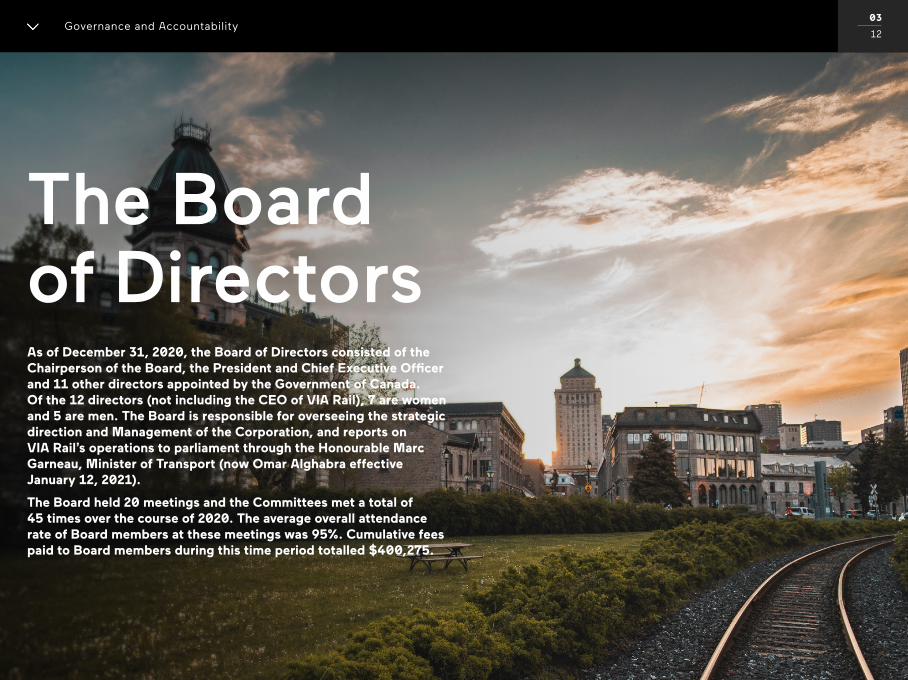
The Boardof Directors
Governance and Accountability03
12
As of December 31, 2020, the Board of Directors consisted of the Chairperson of the Board, the President and Chief Executive Officer and 11 other directors appointed by the Government of Canada. Of the 12 directors (not including the CEO of VIA Rail), 7 are women and 5 are men. The Board is responsible for overseeing the strategic direction and Management of the Corporation, and reports on VIA Rail’s operations to parliament through the Honourable Marc Garneau, Minister of Transport (now Omar Alghabra effective January 12, 2021).
The Board held 20 meetings and the Committees met a total of 45 times over the course of 2020. The average overall attendance rate of Board members at these meetings was 95%. Cumulative fees paid to Board members during this time period totalled $400,275.
Committees of the Board
Governance and Accountability04
12
As of December 31, 2020, the Board and Committee structure was composed of the following Committees:
Audit & Pension InvestmentJane Mowat, Chairperson Miranda Erickson Gail Stephens Kenneth Tan Geneviève Tanguay
Major ProjectsKenneth Tan, Chairperson Kathy Baig Daniel Gallivan Jane Mowat Vianne Timmons
Human ResourcesGail Stephens, Chairperson Jonathan Goldbloom Glenn Rainbird Vianne Timmons
Commercial & Stakeholders’ RelationsDaniel Gallivan, Chairperson Grant Christoff Jonathan Goldbloom Glenn Rainbird Geneviève Tanguay
Fleet ModernizationGlenn Rainbird, Chairperson Grant Christoff Jane Mowat Geneviève Tanguay
High Frequency RailJonathan Goldbloom, Chairperson Kathy Baig Miranda Erickson Daniel Gallivan Gail Stephens
The Committees’ mandates are available under the “Board of Directors” section of VIA Rail’s corpo.viarail.ca website.
The Chairperson of the Board of Directors is an ex officio member of all Committees. The President and Chief Executive Officer is also an ex officio member of all Committees, except the Audit & Pension Investment Committee.
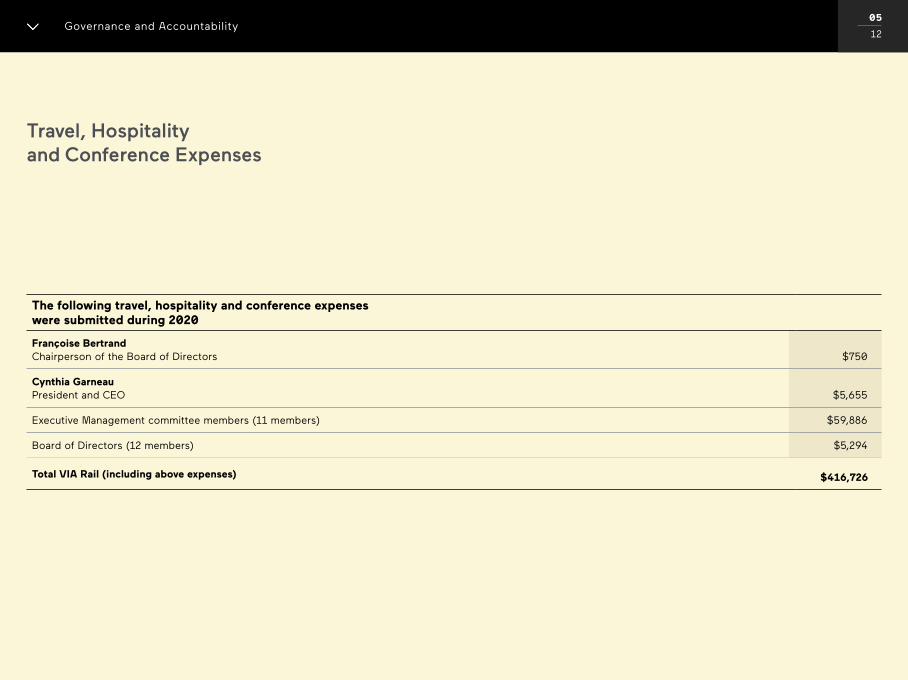
Travel, Hospitality and Conference Expenses
Governance and Accountability05
12
The following travel, hospitality and conference expenses were submitted during 2020
Françoise BertrandChairperson of the Board of Directors $750
Cynthia GarneauPresident and CEO $5,655
Executive Management committee members (11 members) $59,886
Board of Directors (12 members) $5,294
Total VIA Rail (including above expenses) $416,726
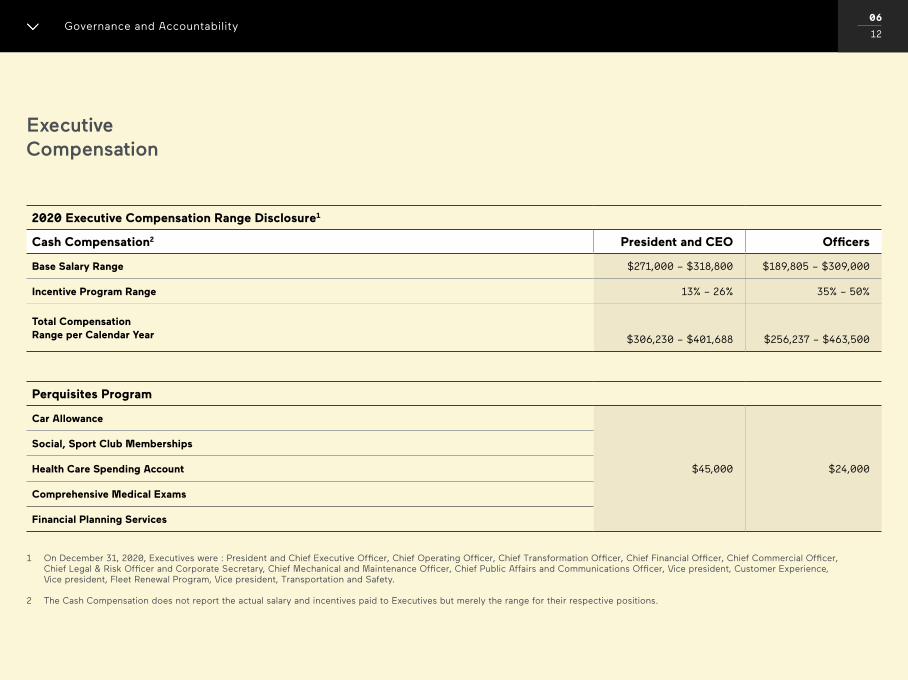
Executive Compensation
Governance and Accountability06
12
2020 Executive Compensation Range Disclosure1
Cash Compensation2 President and CEO Officers
Base Salary Range $271,000 – $318,800 $189,805 – $309,000
Incentive Program Range 13% – 26% 35% – 50%
Total Compensation Range per Calendar Year $306,230 – $401,688 $256,237 – $463,500
Perquisites Program
Car Allowance
$45,000 $24,000
Social, Sport Club Memberships
Health Care Spending Account
Comprehensive Medical Exams
Financial Planning Services
1 On December 31, 2020, Executives were : President and Chief Executive Officer, Chief Operating Officer, Chief Transformation Officer, Chief Financial Officer, Chief Commercial Officer, Chief Legal & Risk Officer and Corporate Secretary, Chief Mechanical and Maintenance Officer, Chief Public Affairs and Communications Officer, Vice president, Customer Experience, Vice president, Fleet Renewal Program, Vice president, Transportation and Safety.
2 The Cash Compensation does not report the actual salary and incentives paid to Executives but merely the range for their respective positions.
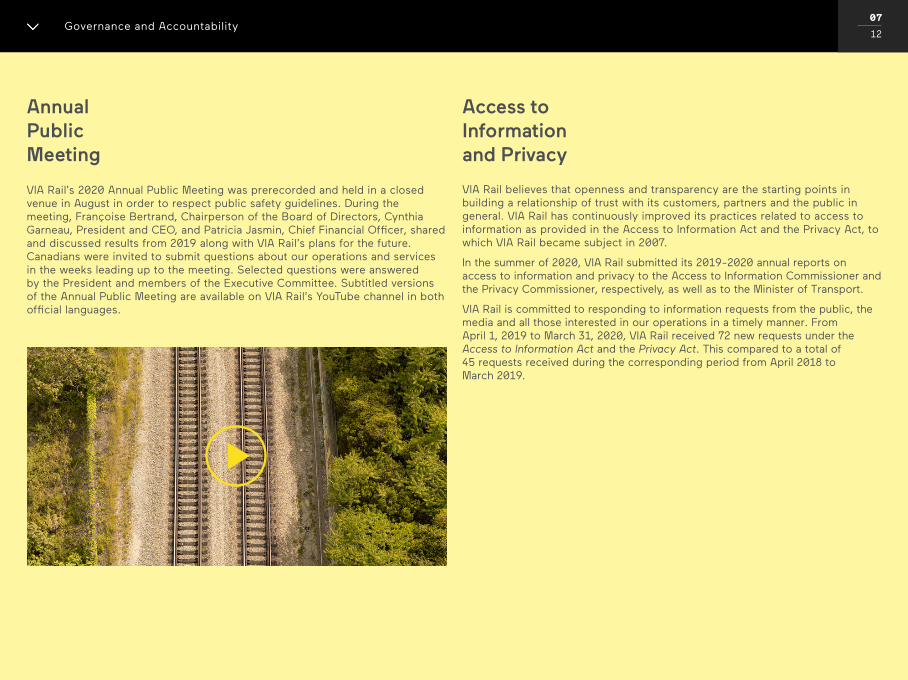
VIA Rail’s 2020 Annual Public Meeting was prerecorded and held in a closed venue in August in order to respect public safety guidelines. During the meeting, Françoise Bertrand, Chairperson of the Board of Directors, Cynthia Garneau, President and CEO, and Patricia Jasmin, Chief Financial Officer, shared and discussed results from 2019 along with VIA Rail’s plans for the future. Canadians were invited to submit questions about our operations and services in the weeks leading up to the meeting. Selected questions were answered by the President and members of the Executive Committee. Subtitled versions of the Annual Public Meeting are available on VIA Rail’s YouTube channel in both official languages.
VIA Rail believes that openness and transparency are the starting points in building a relationship of trust with its customers, partners and the public in general. VIA Rail has continuously improved its practices related to access to information as provided in the Access to Information Act and the Privacy Act, to which VIA Rail became subject in 2007.
In the summer of 2020, VIA Rail submitted its 2019-2020 annual reports on access to information and privacy to the Access to Information Commissioner and the Privacy Commissioner, respectively, as well as to the Minister of Transport.
VIA Rail is committed to responding to information requests from the public, the media and all those interested in our operations in a timely manner. From April 1, 2019 to March 31, 2020, VIA Rail received 72 new requests under the Access to Information Act and the Privacy Act. This compared to a total of 45 requests received during the corresponding period from April 2018 to March 2019.
Annual Public Meeting
Access to Information and Privacy
Governance and Accountability07
12

Governance and Accountability08
12
The Board of Directors
1.
3.
2.
4.
Françoise Bertrand Montréal, Québec Chairperson of the Board of Directors Ex officio member of all Committees
Kathy Baig Laval, Québec Member of the Major Projects Committee, and Member of the High Frequency Rail Committee
Grant Christoff Vancouver, British Columbia Member of the Commercial & Stakeholders’ Relations Committee, and Member of the Fleet Modernization Committee
Daniel Gallivan Halifax, Nova Scotia Chairperson of the Commercial & Stakeholders’ Relations Committee, Member of the Major Projects Committee, and Member of the High Frequency Rail Committee
1.
2.
3.
4.

Governance and Accountability09
12
The Board of Directors (cont’d)
Jonathan Goldbloom Montréal, Québec Chairperson of the High Frequency Rail Committee, Member of the Commercial & Stakeholders’ Relations Committee, and Member of the Human Resources Committee
Miranda Keating Erickson Calgary, Alberta Member of the Audit & Pension Investment Committee, and Member of the High Frequency Rail Committee
Jane Mowat Toronto, Ontario Chairperson of the Audit & Pension Investment Committee, Member of the Major Projects Committee, and Member of the Fleet Modernization Committee
Glenn Rainbird Belleville, Ontario Chairperson of the Fleet Modernization Committee, Member of the Commercial & Stakeholders’ Relations Committee, and Member of the Human Resources Committee
5.
7.
6.
8.
5.
6.
7.
8.
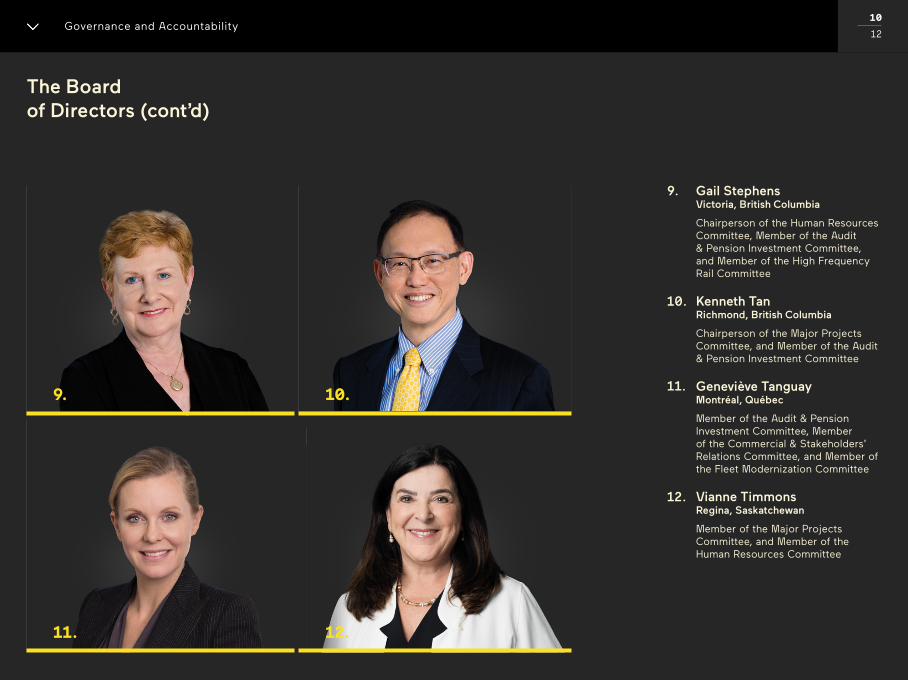
Governance and Accountability10
12
The Board of Directors (cont’d)
9.
11.
10.
12.
9.
10.
11.
12.
Gail Stephens Victoria, British Columbia Chairperson of the Human Resources Committee, Member of the Audit & Pension Investment Committee, and Member of the High Frequency Rail Committee
Kenneth Tan Richmond, British Columbia Chairperson of the Major Projects Committee, and Member of the Audit & Pension Investment Committee
Geneviève Tanguay Montréal, Québec Member of the Audit & Pension Investment Committee, Member of the Commercial & Stakeholders’ Relations Committee, and Member of the Fleet Modernization Committee
Vianne Timmons Regina, Saskatchewan Member of the Major Projects Committee, and Member of the Human Resources Committee

Governance and Accountability11
12
Senior Leadership Team
Cynthia Garneau President and Chief Executive Officer
Sonia Corriveau Chief Business Transformation Officer
Ben Marc Diendéré Chief Public Affairs and Communications Officer
Patricia Jasmin Chief Financial Officer

Governance and Accountability12
12
Senior Leadership Team (cont’d)
Martin R Landry Chief Commercial Officer
Jean-François Legault Chief Legal & Risk Officer and Corporate Secretary
Dominique Lemay Chief Operating Officer

Management Discussion and Analysis
Management Discussion and Analysis01
26
00 / 00
1. IntroductionManagement’s discussion and analysis report outlines the financial results of VIA Rail for the quarter and the year ended December 31, 2020 compared with the quarter and the year ended December 31, 2019. This document should be read in conjunction with the audited financial statements and notes.
Materiality
In assessing what information is to be provided in this report, management applies the materiality principle as guidance for disclosure. Management considers information material if it is probable that its omission or misstatement, judged in the surrounding circumstances, would influence decisions that VIA Rail’s stakeholders make on the basis of the financial information.
Forward looking statement disclosure
This Management’s discussion and analysis report contains forward-looking statements which may be identified with the words “may”, “likely to”, “could”. These statements reflect our evaluation of the information currently available and are subject to a number of risks and uncertainties referred to in the risk section of this document.
2. Corporate OverviewVIA Rail is a non-agent Crown corporation which operates Canada’s national passenger rail service on behalf of the Government of Canada. The Corporation’s objectives are to manage and provide a safe, efficient, reliable, and environmentally sustainable passenger rail service that meets the needs of travelers in Canada.
The Government of Canada determines VIA Rail’s role within the overall structure and services provided by the Federal government and provides appropriations to subsidize passenger rail services.
3. COVID-19 PandemicVIA Rail, as well as all other passenger transportation providers, has been significantly affected by the COVID-19 pandemic. The Corporation reduced its capacity by up to 79 per cent as demand for travel plummeted, resulting in a decrease of 84.3 per cent in revenues compared to the corresponding quarter last year.
Operating expenses for the quarter decreased in part due to the impact of the reduction in services but also as a result of cost cutting measures including employee layoffs and reduced pay for some employees not at work, as well as the cancellation or delay of operating initiatives non-essential to current operations.
The cost savings will not be sufficient to fully offset the reduction in revenues, and following discussion with Transport Canada, the Corporation has a reasonable expectation that additional funding will be obtained.
Safety of passengers and employees remains the Corporation’s key priority and new health and safety measures were implemented to address health & safety requirements. These measures include physical distancing in stations, health screening procedures for passengers boarding trains and the requirement for passengers and staff who interact with customers to wear protective face covering. Sanitizing products are distributed to passengers in key contact points and additional cleaning protocols have also been put in place on board trains, in stations, maintenance centers and offices. The Corporation continues to monitor safety requirements in all provinces in which trains operate to ensures they are all respected.
Management Discussion and Analysis02
26
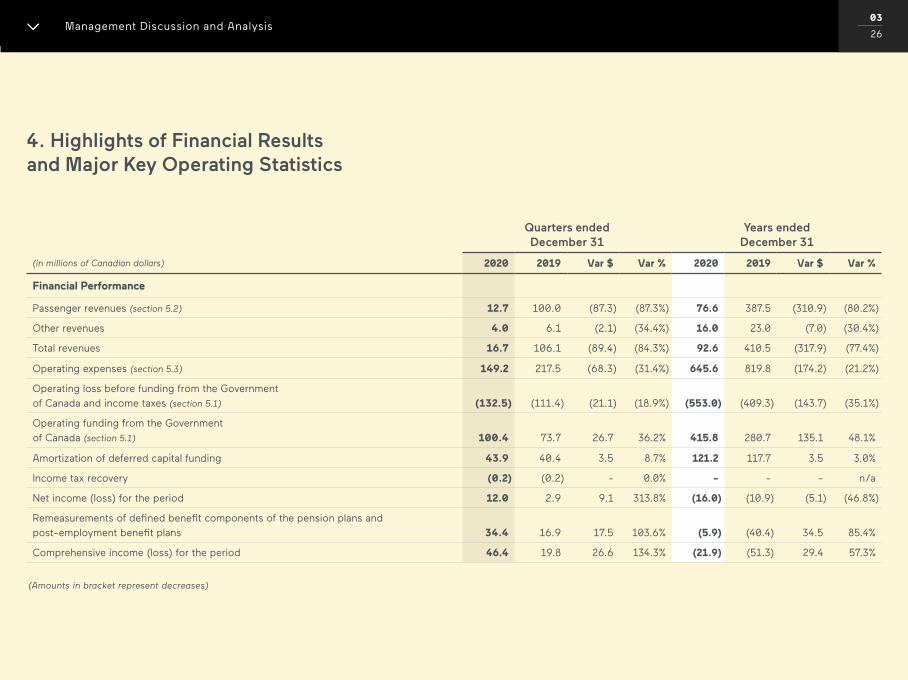
00 / 00
Quarters ended December 31
Years ended December 31
(in millions of Canadian dollars) 2020 2019 Var $ Var % 2020 2019 Var $ Var %
Financial Performance
Passenger revenues (section 5.2) 12.7 100.0 (87.3) (87.3%) 76.6 387.5 (310.9) (80.2%)
Other revenues 4.0 6.1 (2.1) (34.4%) 16.0 23.0 (7.0) (30.4%)
Total revenues 16.7 106.1 (89.4) (84.3%) 92.6 410.5 (317.9) (77.4%)
Operating expenses (section 5.3) 149.2 217.5 (68.3) (31.4%) 645.6 819.8 (174.2) (21.2%)
Operating loss before funding from the Government
of Canada and income taxes (section 5.1) (132.5) (111.4) (21.1) (18.9%) (553.0) (409.3) (143.7) (35.1%)
Operating funding from the Government
of Canada (section 5.1) 100.4 73.7 26.7 36.2% 415.8 280.7 135.1 48.1%
Amortization of deferred capital funding 43.9 40.4 3.5 8.7% 121.2 117.7 3.5 3.0%
Income tax recovery (0.2) (0.2) - 0.0% - - - n/a
Net income (loss) for the period 12.0 2.9 9.1 313.8% (16.0) (10.9) (5.1) (46.8%)
Remeasurements of defined benefit components of the pension plans and
post-employment benefit plans 34.4 16.9 17.5 103.6% (5.9) (40.4) 34.5 85.4%
Comprehensive income (loss) for the period 46.4 19.8 26.6 134.3% (21.9) (51.3) 29.4 57.3%
4. Highlights of Financial Results and Major Key Operating Statistics
Management Discussion and Analysis03
26
(Amounts in bracket represent decreases)
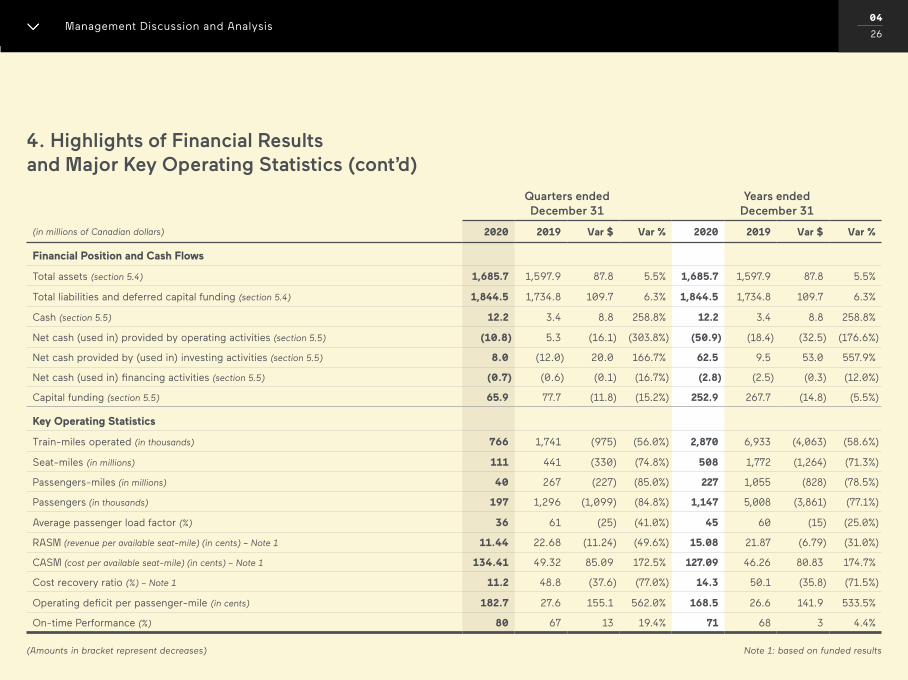
00 / 00
Financial Position and Cash Flows
Total assets (section 5.4) 1,685.7 1,597.9 87.8 5.5% 1,685.7 1,597.9 87.8 5.5%
Total liabilities and deferred capital funding (section 5.4) 1,844.5 1,734.8 109.7 6.3% 1,844.5 1,734.8 109.7 6.3%
Cash (section 5.5) 12.2 3.4 8.8 258.8% 12.2 3.4 8.8 258.8%
Net cash (used in) provided by operating activities (section 5.5) (10.8) 5.3 (16.1) (303.8%) (50.9) (18.4) (32.5) (176.6%)
Net cash provided by (used in) investing activities (section 5.5) 8.0 (12.0) 20.0 166.7% 62.5 9.5 53.0 557.9%
Net cash (used in) financing activities (section 5.5) (0.7) (0.6) (0.1) (16.7%) (2.8) (2.5) (0.3) (12.0%)
Capital funding (section 5.5) 65.9 77.7 (11.8) (15.2%) 252.9 267.7 (14.8) (5.5%)
Key Operating Statistics
Train-miles operated (in thousands) 766 1,741 (975) (56.0%) 2,870 6,933 (4,063) (58.6%)
Seat-miles (in millions) 111 441 (330) (74.8%) 508 1,772 (1,264) (71.3%)
Passengers-miles (in millions) 40 267 (227) (85.0%) 227 1,055 (828) (78.5%)
Passengers (in thousands) 197 1,296 (1,099) (84.8%) 1,147 5,008 (3,861) (77.1%)
Average passenger load factor (%) 36 61 (25) (41.0%) 45 60 (15) (25.0%)
RASM (revenue per available seat-mile) (in cents) – Note 1 11.44 22.68 (11.24) (49.6%) 15.08 21.87 (6.79) (31.0%)
CASM (cost per available seat-mile) (in cents) – Note 1 134.41 49.32 85.09 172.5% 127.09 46.26 80.83 174.7%
Cost recovery ratio (%) – Note 1 11.2 48.8 (37.6) (77.0%) 14.3 50.1 (35.8) (71.5%)
Operating deficit per passenger-mile (in cents) 182.7 27.6 155.1 562.0% 168.5 26.6 141.9 533.5%
On-time Performance (%) 80 67 13 19.4% 71 68 3 4.4%
(Amounts in bracket represent decreases) Note 1: based on funded results
4. Highlights of Financial Results and Major Key Operating Statistics (cont’d)
Quarters ended December 31
Years ended December 31
(in millions of Canadian dollars) 2020 2019 Var $ Var % 2020 2019 Var $ Var %
Management Discussion and Analysis04
26
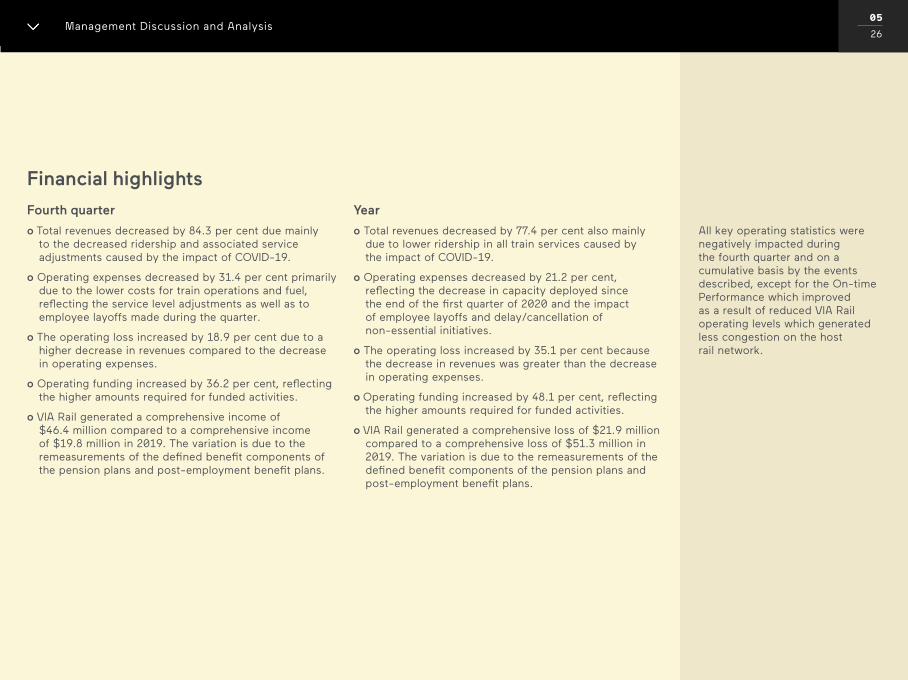
All key operating statistics were negatively impacted during the fourth quarter and on a cumulative basis by the events described, except for the On-time Performance which improved as a result of reduced VIA Rail operating levels which generated less congestion on the host rail network.
Financial highlights
Fourth quarter
o Total revenues decreased by 84.3 per cent due mainly to the decreased ridership and associated service adjustments caused by the impact of COVID-19.
o Operating expenses decreased by 31.4 per cent primarily due to the lower costs for train operations and fuel, reflecting the service level adjustments as well as to employee layoffs made during the quarter.
o The operating loss increased by 18.9 per cent due to a higher decrease in revenues compared to the decrease in operating expenses.
o Operating funding increased by 36.2 per cent, reflecting the higher amounts required for funded activities.
o VIA Rail generated a comprehensive income of $46.4 million compared to a comprehensive income of $19.8 million in 2019. The variation is due to the remeasurements of the defined benefit components of the pension plans and post-employment benefit plans.
Year
o Total revenues decreased by 77.4 per cent also mainly due to lower ridership in all train services caused by the impact of COVID-19.
o Operating expenses decreased by 21.2 per cent, reflecting the decrease in capacity deployed since the end of the first quarter of 2020 and the impact of employee layoffs and delay/cancellation of non-essential initiatives.
o The operating loss increased by 35.1 per cent because the decrease in revenues was greater than the decrease in operating expenses.
o Operating funding increased by 48.1 per cent, reflecting the higher amounts required for funded activities.
o VIA Rail generated a comprehensive loss of $21.9 million compared to a comprehensive loss of $51.3 million in 2019. The variation is due to the remeasurements of the defined benefit components of the pension plans and post-employment benefit plans.
Management Discussion and Analysis05
26
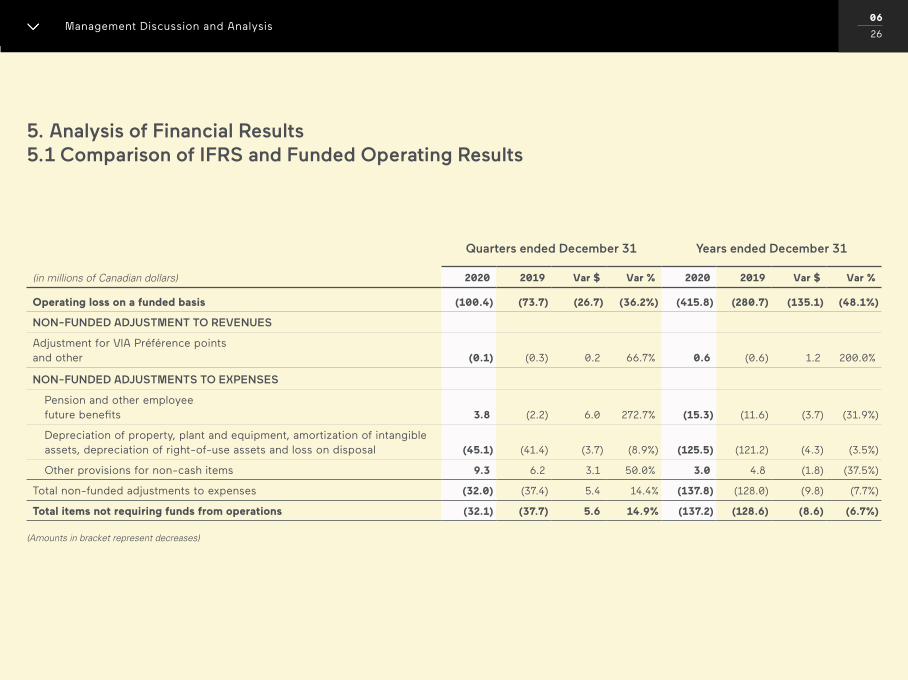
00 / 00
5. Analysis of Financial Results 5.1 Comparison of IFRS and Funded Operating Results
Quarters ended December 31 Years ended December 31
(in millions of Canadian dollars) 2020 2019 Var $ Var % 2020 2019 Var $ Var %
Operating loss on a funded basis (100.4) (73.7) (26.7) (36.2%) (415.8) (280.7) (135.1) (48.1%)
NON-FUNDED ADJUSTMENT TO REVENUES
Adjustment for VIA Préférence points and other (0.1) (0.3) 0.2 66.7% 0.6 (0.6) 1.2 200.0%
NON-FUNDED ADJUSTMENTS TO EXPENSES
Pension and other employee future benefits 3.8 (2.2) 6.0 272.7% (15.3) (11.6) (3.7) (31.9%)
Depreciation of property, plant and equipment, amortization of intangible assets, depreciation of right-of-use assets and loss on disposal (45.1) (41.4) (3.7) (8.9%) (125.5) (121.2) (4.3) (3.5%)
Other provisions for non-cash items 9.3 6.2 3.1 50.0% 3.0 4.8 (1.8) (37.5%)
Total non-funded adjustments to expenses (32.0) (37.4) 5.4 14.4% (137.8) (128.0) (9.8) (7.7%)
Total items not requiring funds from operations (32.1) (37.7) 5.6 14.9% (137.2) (128.6) (8.6) (6.7%)
(Amounts in bracket represent decreases)
Management Discussion and Analysis06
26
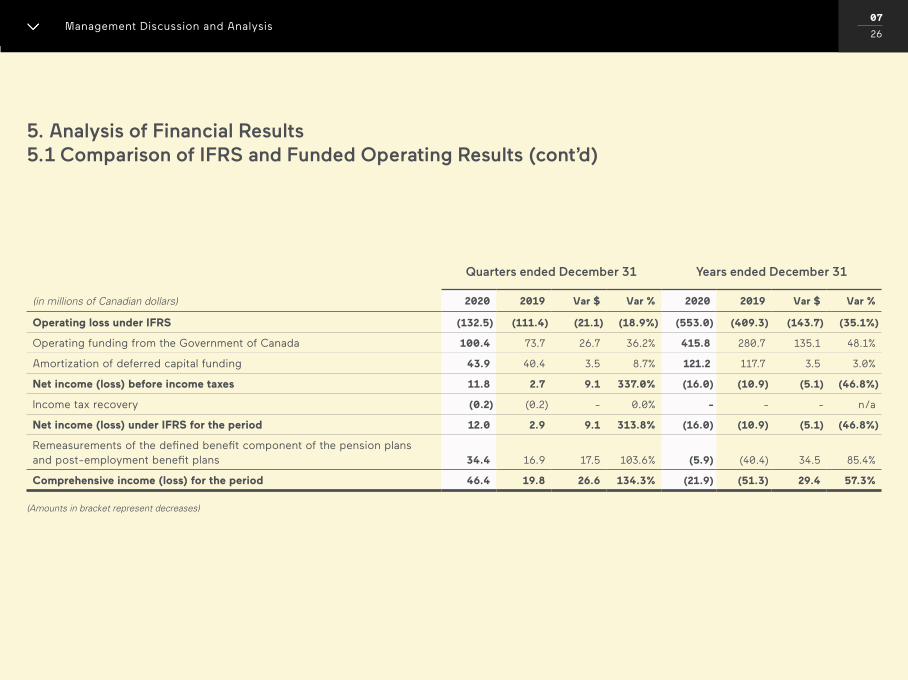
00 / 00
Quarters ended December 31 Years ended December 31
(in millions of Canadian dollars) 2020 2019 Var $ Var % 2020 2019 Var $ Var %
5. Analysis of Financial Results 5.1 Comparison of IFRS and Funded Operating Results (cont’d)
Operating loss under IFRS (132.5) (111.4) (21.1) (18.9%) (553.0) (409.3) (143.7) (35.1%)
Operating funding from the Government of Canada 100.4 73.7 26.7 36.2% 415.8 280.7 135.1 48.1%
Amortization of deferred capital funding 43.9 40.4 3.5 8.7% 121.2 117.7 3.5 3.0%
Net income (loss) before income taxes 11.8 2.7 9.1 337.0% (16.0) (10.9) (5.1) (46.8%)
Income tax recovery (0.2) (0.2) - 0.0% - - - n/a
Net income (loss) under IFRS for the period 12.0 2.9 9.1 313.8% (16.0) (10.9) (5.1) (46.8%)
Remeasurements of the defined benefit component of the pension plans and post-employment benefit plans 34.4 16.9 17.5 103.6% (5.9) (40.4) 34.5 85.4%
Comprehensive income (loss) for the period 46.4 19.8 26.6 134.3% (21.9) (51.3) 29.4 57.3%
(Amounts in bracket represent decreases)
Management Discussion and Analysis07
26
00 / 00
Net income under IFRS for the quarter:
Net income of $12.0 million this quarter, compared to a net income of $2.9 million last year, representing an improvement of $9.1 million mainly due to:
o Higher government funding received during the quarter ($26.7 million), as a consequence of:
o Higher operating loss ($21.1 million), attributable to lower revenues of $89.4 million partly offset by lower expenses of $68.3 million.
o Higher amortization of deferred capital funding ($3.5 million).
Net loss under IFRS for the year:
Net loss of $16.0 million for the year, compared to a net loss of $10.9 million last year, representing a deterioration of $5.1 million mainly due to:
o Higher operating loss ($143.7 million), attributable to lower revenues of $317.9 million partly offset by lower expenses of $174.2 million, as well as:
o Higher government funding received during the year ($135.1 million).
o Higher amortization of deferred capital funding ($3.5 million).
Comprehensive income of $46.4 million in the fourth quarter of 2020 and comprehensive loss of $21.9 million for the year ended December 31, 2020 include the following:
Remeasurement of defined benefit component of the pension plans and post-employment benefit plans is composed of quarterly non-cash remeasurements resulting from changes in actuarial assumptions and the return on pension plan assets.
Remeasurement of the defined benefit component of the pension plans and post-employment benefit plans of $34.4 million in the fourth quarter of 2020 is due to an actuarial loss of $84.0 million on the defined benefit obligation arising from a 20 basis point decrease in the discount rate since September 30, 2020 and to a remeasurement gain of $118.6 million resulting from higher actual rate of return on plan assets.
The remeasurement of the defined benefit component of the pension plans and post-employment benefit plans of ($5.9) million for the year is due to the decrease in discount rate used to determine the defined benefit obligation (2.50 per cent as at December 31, 2020 compared to 3.10 per cent as at December 31, 2019), which resulted in an actuarial loss of $227.8 million, partly offset by a return on plan assets of $223.5 million during the period. The remeasurement also includes an actuarial loss of $1.7 million due to the decrease in discount rate used to determine the post-employment benefit obligation (2.60 per cent as at December 31, 2020 compared to 3.10 per cent as at December 31, 2019).
Comprehensive income of $19.8 million in the fourth quarter of 2019 and comprehensive loss of $51.3 million for the year ended December 31, 2019 include the following:
The remeasurement of the defined benefit component of the pension plans of $16.9 million for the fourth quarter of 2019 is due to an actuarial gain of $13.9 million arising from a 10 basis point increase in the discount rate since September 30, 2019 and to a remeasurement gain of $2.3 million resulting from higher return on assets. The remeasurement also includes an actuarial gain of $0.6 million due to the increase in discount rate used to determine the post-employment benefit obligation.
The remeasurements of the defined benefit component of the pension plans of ($40.4) million for the year ended December 31, 2019 was due to the decrease of the discount rate used to determine the defined benefit obligation (3.10 per cent as at December 31, 2019 compared to 3.90 per cent as at December 31, 2018) which resulted in an actuarial loss of $256.5 million for the period, partly offset by a return on plan assets of $219.3 million generated during the period. The remeasurement also includes an actuarial loss of $3.3 million due to the decrease in discount rate used to determine the post-employment obligation (3.10 per cent as at December 31, 2019 compared to 4.00 per cent as at December 31, 2018).
Management Discussion and Analysis08
26
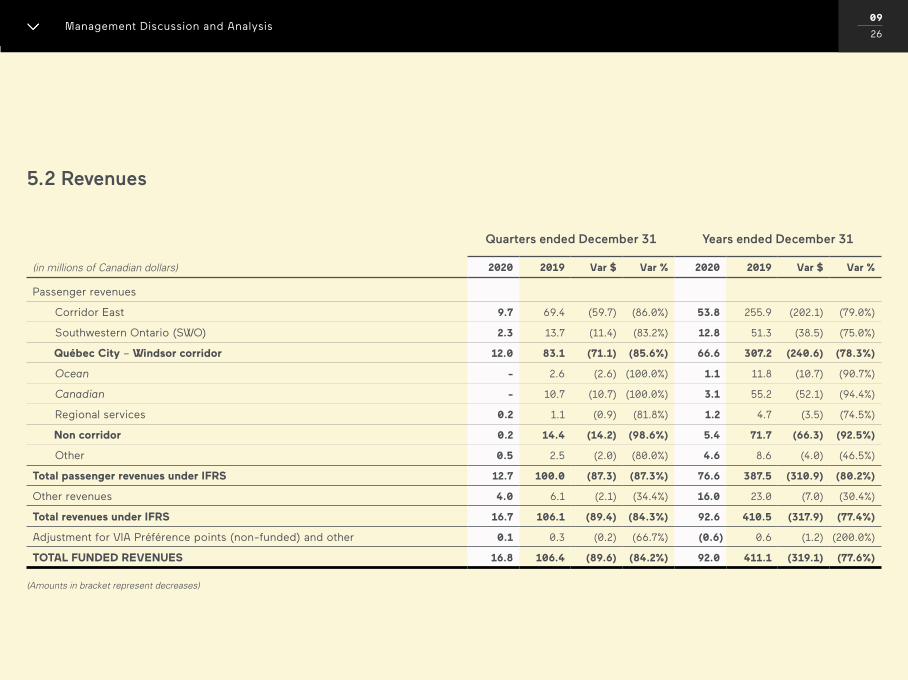
00 / 00
5.2 Revenues
Quarters ended December 31 Years ended December 31
(in millions of Canadian dollars) 2020 2019 Var $ Var % 2020 2019 Var $ Var %
Passenger revenues
Corridor East 9.7 69.4 (59.7) (86.0%) 53.8 255.9 (202.1) (79.0%)
Southwestern Ontario (SWO) 2.3 13.7 (11.4) (83.2%) 12.8 51.3 (38.5) (75.0%)
Québec City – Windsor corridor 12.0 83.1 (71.1) (85.6%) 66.6 307.2 (240.6) (78.3%)
Ocean - 2.6 (2.6) (100.0%) 1.1 11.8 (10.7) (90.7%)
Canadian - 10.7 (10.7) (100.0%) 3.1 55.2 (52.1) (94.4%)
Regional services 0.2 1.1 (0.9) (81.8%) 1.2 4.7 (3.5) (74.5%)
Non corridor 0.2 14.4 (14.2) (98.6%) 5.4 71.7 (66.3) (92.5%)
Other 0.5 2.5 (2.0) (80.0%) 4.6 8.6 (4.0) (46.5%)
Total passenger revenues under IFRS 12.7 100.0 (87.3) (87.3%) 76.6 387.5 (310.9) (80.2%)
Other revenues 4.0 6.1 (2.1) (34.4%) 16.0 23.0 (7.0) (30.4%)
Total revenues under IFRS 16.7 106.1 (89.4) (84.3%) 92.6 410.5 (317.9) (77.4%)
Adjustment for VIA Préférence points (non-funded) and other 0.1 0.3 (0.2) (66.7%) (0.6) 0.6 (1.2) (200.0%)
TOTAL FUNDED REVENUES 16.8 106.4 (89.6) (84.2%) 92.0 411.1 (319.1) (77.6%)
(Amounts in bracket represent decreases)
Management Discussion and Analysis09
26
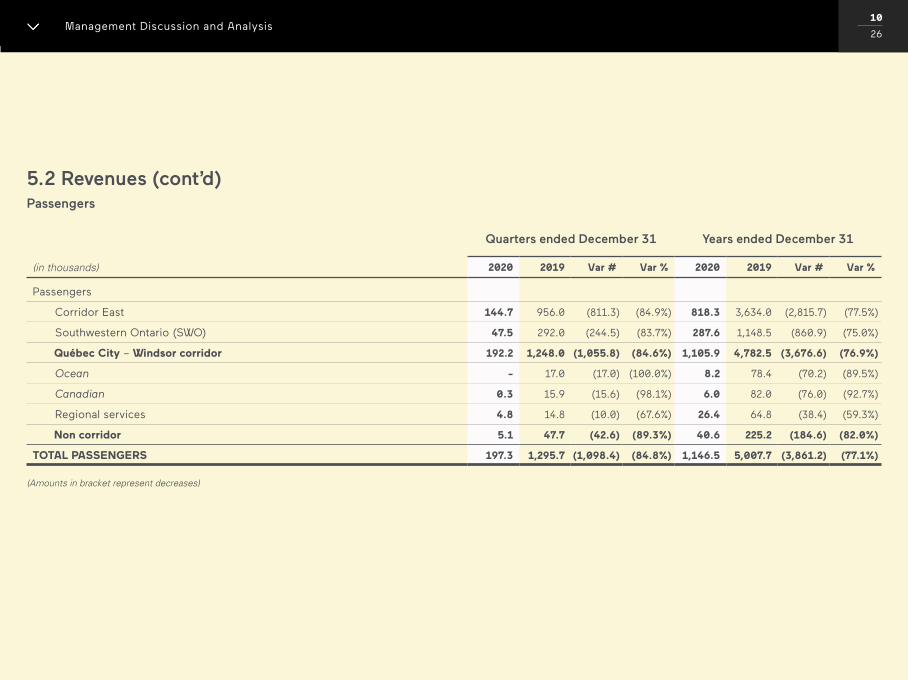
00 / 00
Passengers
Quarters ended December 31 Years ended December 31
(in thousands) 2020 2019 Var # Var % 2020 2019 Var # Var %
Passengers
Corridor East 144.7 956.0 (811.3) (84.9%) 818.3 3,634.0 (2,815.7) (77.5%)
Southwestern Ontario (SWO) 47.5 292.0 (244.5) (83.7%) 287.6 1,148.5 (860.9) (75.0%)
Québec City – Windsor corridor 192.2 1,248.0 (1,055.8) (84.6%) 1,105.9 4,782.5 (3,676.6) (76.9%)
Ocean - 17.0 (17.0) (100.0%) 8.2 78.4 (70.2) (89.5%)
Canadian 0.3 15.9 (15.6) (98.1%) 6.0 82.0 (76.0) (92.7%)
Regional services 4.8 14.8 (10.0) (67.6%) 26.4 64.8 (38.4) (59.3%)
Non corridor 5.1 47.7 (42.6) (89.3%) 40.6 225.2 (184.6) (82.0%)
TOTAL PASSENGERS 197.3 1,295.7 (1,098.4) (84.8%) 1,146.5 5,007.7 (3,861.2) (77.1%)
(Amounts in bracket represent decreases)
5.2 Revenues (cont’d)
Management Discussion and Analysis10
26
00 / 00
Passenger revenues
Passenger revenues have decreased by $87.3 million (87.3 per cent) during the quarter and have decreased by $310.9 million (80.2 per cent) for the year. These decreases are mainly attributable to events that started during the first quarter of 2020.
Blockades started on February 6, 2020 and forced VIA Rail to cancel all its services on the network except for the Sudbury–White river and Churchill–The Pas routes. Most services resumed at the end of February and in early March, except for the service on the Prince Rupert–Prince George–Jasper route which resumed on July 5.
On March 11, 2020, the World Health Organization characterized the outbreak of a strain of the novel coronavirus (‘’COVID-19’’) as a pandemic which resulted in a series of public health and emergency measures that have been put in place to combat the spread of the virus. On March 12, 2020, in response to the COVID-19 outbreak, VIA Rail enforced special health and safety measures for its passengers and employees, and subsequently reduced service levels for most major train services.
Québec City – Windsor corridor
Revenues and ridership for the quarter and the twelve-month period were directly impacted by the COVID-19 pandemic.
Corridor service was partially reduced to 50 per cent on March 17, with further reductions on March 23 (operations reduced to 33 per cent further reduced to 18 per cent on March 31), and gradually increased back to 28 per cent during the second quarter and up to 46 per cent during the third quarter. It was further reduced to 41 per cent during the fourth quarter as a result of the second wave of the virus.
Revenues for the quarter have decreased by $71.1 million (85.6 per cent) and have decreased by $240.6 million (78.3 per cent) for the year. These decreases stem in most part from lower ridership of 84.6 per cent for the quarter and of 76.9 per cent for the year.
Ocean
No revenues were generated on this service since it ceased operating in March 2020.
The service was initially shut down on February 14 as a result of the blockades and resumed on February 28. It was shut down again on March 13 and on May 6, the suspension of the service has been extended until further notice because of the COVID-19 pandemic.
Revenues for the quarter have therefore decreased by $2.6 million (100.0 per cent) and by $10.7 million (90.7 per cent) for the year. Ridership also decreased by 100.0 per cent for the quarter and by 89.5 per cent for the year.
Management Discussion and Analysis11
26
00 / 00
Canadian
The service was initially shut down on February 12 as a result of the blockades and resumed on March 4. It was shut down again on March 13 because of the COVID-19 pandemic. On May 6, in light of the continued expansion of travel limitations as well as the physical distancing and isolation measures, the service was interrupted until December 11, 2020 when it resumed between Winnipeg and Vancouver with one roundtrip frequency per week.
Revenues for the quarter are $10.7 million (practically 100.0 per cent) lower than last year and have decreased by $52.1 million (94.4 per cent) for the year. Ridership has decreased by 98.1 per cent for the quarter and by 92.7 per cent for the twelve-month period.
Regional services
Revenues on Regional services have decreased by $0.9 million (81.8 per cent) for the quarter, and by $3.5 million (74.5 per cent) for the year.
The Jasper to Prince-Rupert service was cancelled on February 14 due to the blockades and resumed on July 5.
The Winnipeg to Churchill service was interrupted South of The Pas between February 15 and February 28 as a result of the blockades. Since March 24 and as a result of the COVID-19 pandemic, the service has been operating with Economy class only and remains the only VIA Rail train service operating on a regular schedule.
The Montréal–Jonquière and Montréal–Senneterre services were interrupted between February 14 and March 4 due to the February blockades. Together with the Sudbury–White River service (which was not affected by the February blockades), they have been operating at one third of their regular frequencies since March 23 because of the COVID-19 pandemic.
Other revenues
Other revenues for the quarter have decreased by $2.1 million (34.4 per cent) and by $7.0 million (30.4 per cent) for the year. These decreases are mainly attributable to lower station revenues due to lower ridership and to the loss of tenants in some stations and to rent relief provided to some tenants as part of the Canada Emergency Commercial Rent Assistance (CECRA) program. Third party revenues also decreased due to lower revenues at the Toronto and Montréal Maintenance Centers.
Management Discussion and Analysis12
26
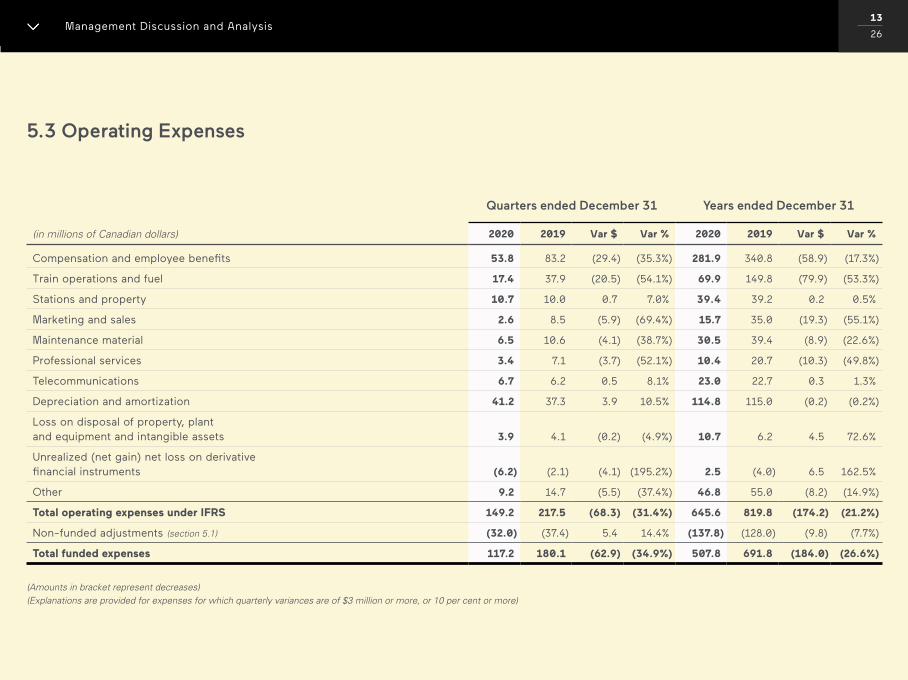
00 / 00
5.3 Operating Expenses
Quarters ended December 31 Years ended December 31
(in millions of Canadian dollars) 2020 2019 Var $ Var % 2020 2019 Var $ Var %
Compensation and employee benefits 53.8 83.2 (29.4) (35.3%) 281.9 340.8 (58.9) (17.3%)
Train operations and fuel 17.4 37.9 (20.5) (54.1%) 69.9 149.8 (79.9) (53.3%)
Stations and property 10.7 10.0 0.7 7.0% 39.4 39.2 0.2 0.5%
Marketing and sales 2.6 8.5 (5.9) (69.4%) 15.7 35.0 (19.3) (55.1%)
Maintenance material 6.5 10.6 (4.1) (38.7%) 30.5 39.4 (8.9) (22.6%)
Professional services 3.4 7.1 (3.7) (52.1%) 10.4 20.7 (10.3) (49.8%)
Telecommunications 6.7 6.2 0.5 8.1% 23.0 22.7 0.3 1.3%
Depreciation and amortization 41.2 37.3 3.9 10.5% 114.8 115.0 (0.2) (0.2%)
Loss on disposal of property, plant and equipment and intangible assets 3.9 4.1 (0.2) (4.9%) 10.7 6.2 4.5 72.6%
Unrealized (net gain) net loss on derivative financial instruments (6.2) (2.1) (4.1) (195.2%) 2.5 (4.0) 6.5 162.5%
Other 9.2 14.7 (5.5) (37.4%) 46.8 55.0 (8.2) (14.9%)
Total operating expenses under IFRS 149.2 217.5 (68.3) (31.4%) 645.6 819.8 (174.2) (21.2%)
Non-funded adjustments (section 5.1) (32.0) (37.4) 5.4 14.4% (137.8) (128.0) (9.8) (7.7%)
Total funded expenses 117.2 180.1 (62.9) (34.9%) 507.8 691.8 (184.0) (26.6%)
(Amounts in bracket represent decreases) (Explanations are provided for expenses for which quarterly variances are of $3 million or more, or 10 per cent or more)
Management Discussion and Analysis13
26
00 / 00
The Corporation, in its objective to reduce costs and minimize the impact of the pandemic on its deficit, implemented various cost saving measures including:
o The reduction of some of its operating expenses in proportion to the level of operations,
o Employee layoffs and reduction of compensation for some employees not working,
o Reduction of publicity and advertising activities,
o Reduction of services in stations, as well as
o Reduction of administrative costs and the postponement of non-essential initiatives.
VIA Rail’s cost structure includes a substantial portion of fixed costs which cannot easily be reduced on a short-term basis, the Corporation is therefore constantly looking for different ways to maintain fixed costs as the lowest level possible.
Total operating expenses decreased by $68.3 million (31.4 per cent) for the quarter, and by $174.2 million (21.2 per cent) for the year. The primary variances are:
Management Discussion and Analysis14
26
Compensation and employee benefits
The expenses decreased by $29.4 million (35.3 per cent) during the quarter and by $58.9 million (17.3 per cent) for the year. The decreases result mainly from the reduced level of operations due to the COVID-19 pandemic, as well as from employee layoffs and reduction of pay for some employees not at work.
Train operations and fuel
The expenses decreased by $20.5 million (54.1 per cent) during the quarter and by $79.9 million (53.3 per cent) for the year. The decreases result mainly from the reduced level of operations due to the COVID-19 pandemic.
Marketing and sales
The expenses decreased by $5.9 million (69.4 per cent) during the quarter, and by $19.3 million (55.1 per cent) for the year as a consequence of the suspension of most advertising campaigns, as well as to lower credit card commissions as less sales were generated.
Maintenance material
The expenses have decreased by $4.1 million (38.7 per cent) for the quarter, and by $8.9 million (22.6 per cent) for the year. The decrease reflects the lower utilization of equipment with the reduced level of services.
Professional services
The expenses decreased by $3.7 million (52.1 per cent) during the quarter and by $10.3 million (49.8 per cent) for the year. These decreases are attributable to the fact that because of the COVID-19 pandemic, various initiatives requiring consulting services non-essential for current operations have been postponed or cancelled.
Loss on disposal of property, plant and equipment and intangible assets
The expenses decreased by $0.2 million (4.9 per cent) during the quarter and have increased by $4.5 million (72.6 per cent) for the year.
The increase for the twelve-month period is due to the fact that, as part of capital projects, replaced assets with remaining book value were written off.
Unrealized (net gain) net loss on derivative financial instruments
Net gain of $6.2 million for the quarter and net loss of $2.5 million for the year compared to a net gain of $2.1 million for the quarter ended December 31, 2019 and a net gain of $4.0 million for the year. Net loss for the year ending December 31, 2020 reflects the fact that market fuel prices are lower than contract prices, explaining the loss of $2.5 million, however market prices have increased compared to what they were as at September 30, 2020 justifying the gain during the fourth quarter.
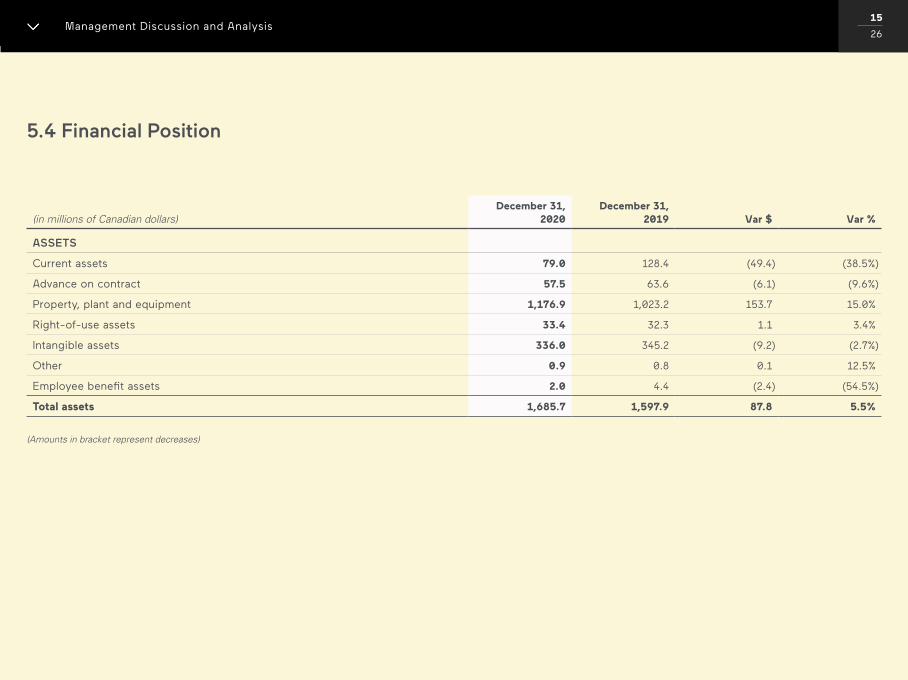
00 / 00
5.4 Financial Position
(in millions of Canadian dollars)December 31,
2020December 31,
2019 Var $ Var %
ASSETS
Current assets 79.0 128.4 (49.4) (38.5%)
Advance on contract 57.5 63.6 (6.1) (9.6%)
Property, plant and equipment 1,176.9 1,023.2 153.7 15.0%
Right-of-use assets 33.4 32.3 1.1 3.4%
Intangible assets 336.0 345.2 (9.2) (2.7%)
Other 0.9 0.8 0.1 12.5%
Employee benefit assets 2.0 4.4 (2.4) (54.5%)
Total assets 1,685.7 1,597.9 87.8 5.5%
(Amounts in bracket represent decreases)
Management Discussion and Analysis15
26
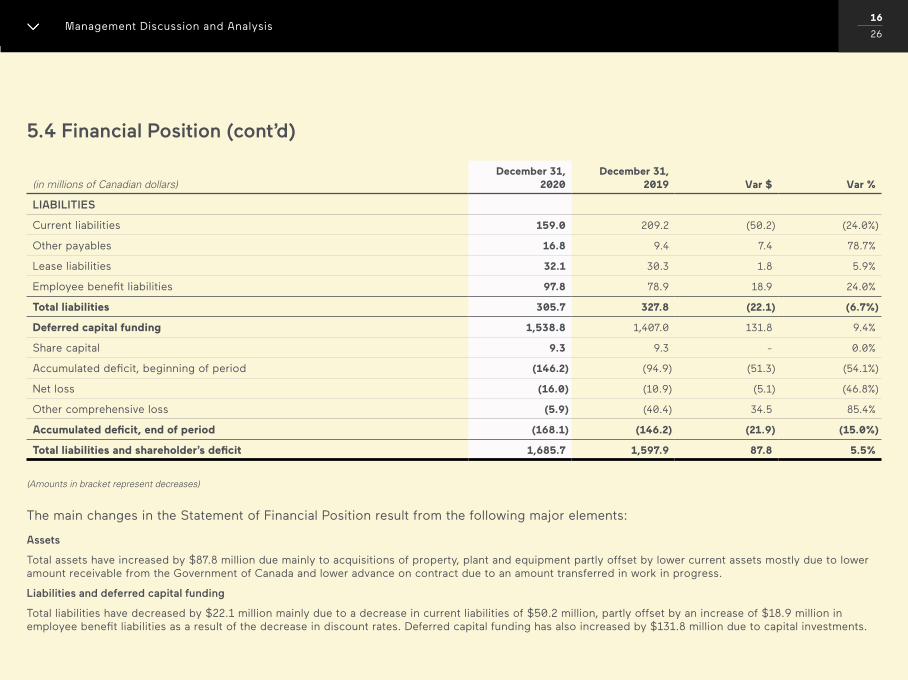
00 / 00
The main changes in the Statement of Financial Position result from the following major elements:
Assets
Total assets have increased by $87.8 million due mainly to acquisitions of property, plant and equipment partly offset by lower current assets mostly due to lower amount receivable from the Government of Canada and lower advance on contract due to an amount transferred in work in progress.
Liabilities and deferred capital funding
Total liabilities have decreased by $22.1 million mainly due to a decrease in current liabilities of $50.2 million, partly offset by an increase of $18.9 million in employee benefit liabilities as a result of the decrease in discount rates. Deferred capital funding has also increased by $131.8 million due to capital investments.
(in millions of Canadian dollars)December 31,
2020December 31,
2019 Var $ Var %
LIABILITIES
Current liabilities 159.0 209.2 (50.2) (24.0%)
Other payables 16.8 9.4 7.4 78.7%
Lease liabilities 32.1 30.3 1.8 5.9%
Employee benefit liabilities 97.8 78.9 18.9 24.0%
Total liabilities 305.7 327.8 (22.1) (6.7%)
Deferred capital funding 1,538.8 1,407.0 131.8 9.4%
Share capital 9.3 9.3 - 0.0%
Accumulated deficit, beginning of period (146.2) (94.9) (51.3) (54.1%)
Net loss (16.0) (10.9) (5.1) (46.8%)
Other comprehensive loss (5.9) (40.4) 34.5 85.4%
Accumulated deficit, end of period (168.1) (146.2) (21.9) (15.0%)
Total liabilities and shareholder’s deficit 1,685.7 1,597.9 87.8 5.5%
(Amounts in bracket represent decreases)
5.4 Financial Position (cont’d)
Management Discussion and Analysis16
26
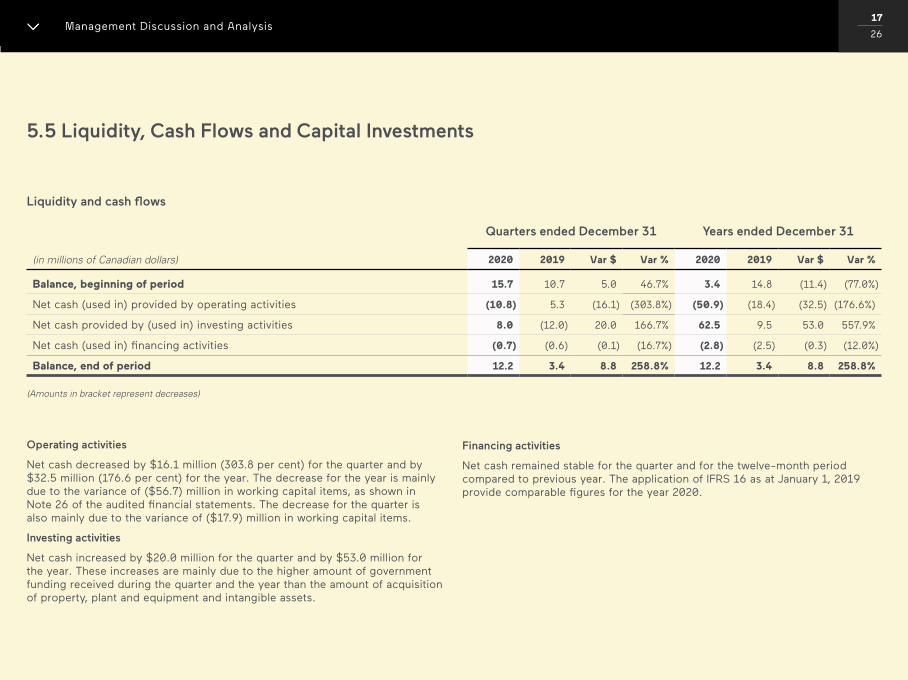
00 / 00
5.5 Liquidity, Cash Flows and Capital Investments
Operating activities
Net cash decreased by $16.1 million (303.8 per cent) for the quarter and by $32.5 million (176.6 per cent) for the year. The decrease for the year is mainly due to the variance of ($56.7) million in working capital items, as shown in Note 26 of the audited financial statements. The decrease for the quarter is also mainly due to the variance of ($17.9) million in working capital items.
Investing activities
Net cash increased by $20.0 million for the quarter and by $53.0 million for the year. These increases are mainly due to the higher amount of government funding received during the quarter and the year than the amount of acquisition of property, plant and equipment and intangible assets.
Financing activities
Net cash remained stable for the quarter and for the twelve-month period compared to previous year. The application of IFRS 16 as at January 1, 2019 provide comparable figures for the year 2020.
Quarters ended December 31 Years ended December 31
(in millions of Canadian dollars) 2020 2019 Var $ Var % 2020 2019 Var $ Var %
Balance, beginning of period 15.7 10.7 5.0 46.7% 3.4 14.8 (11.4) (77.0%)
Net cash (used in) provided by operating activities (10.8) 5.3 (16.1) (303.8%) (50.9) (18.4) (32.5) (176.6%)
Net cash provided by (used in) investing activities 8.0 (12.0) 20.0 166.7% 62.5 9.5 53.0 557.9%
Net cash (used in) financing activities (0.7) (0.6) (0.1) (16.7%) (2.8) (2.5) (0.3) (12.0%)
Balance, end of period 12.2 3.4 8.8 258.8% 12.2 3.4 8.8 258.8%
(Amounts in bracket represent decreases)
Management Discussion and Analysis17
26
Liquidity and cash flows
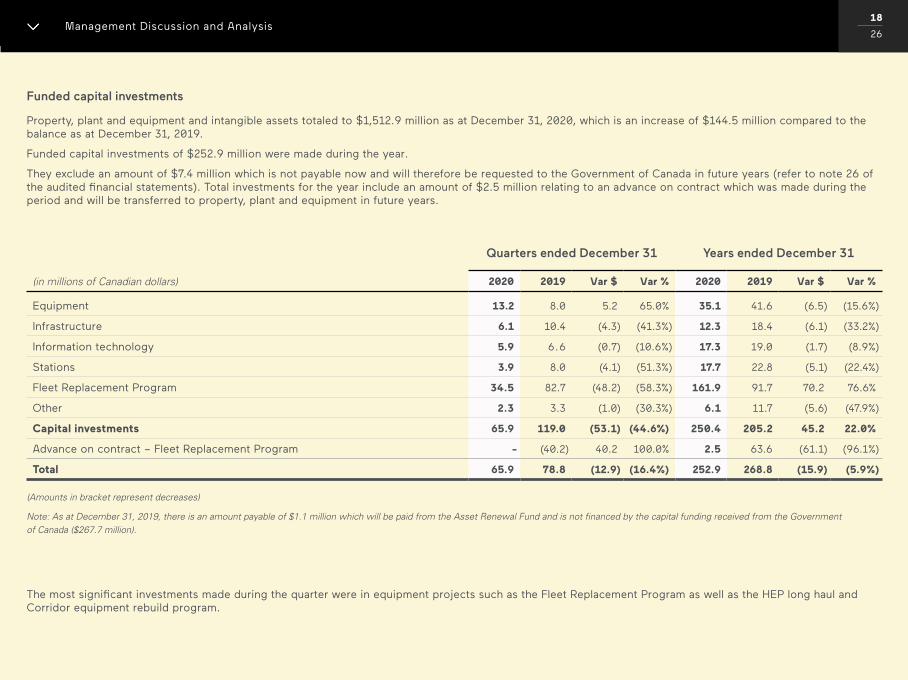
00 / 00
Quarters ended December 31 Years ended December 31
(in millions of Canadian dollars) 2020 2019 Var $ Var % 2020 2019 Var $ Var %
Equipment 13.2 8.0 5.2 65.0% 35.1 41.6 (6.5) (15.6%)
Infrastructure 6.1 10.4 (4.3) (41.3%) 12.3 18.4 (6.1) (33.2%)
Information technology 5.9 6.6 (0.7) (10.6%) 17.3 19.0 (1.7) (8.9%)
Stations 3.9 8.0 (4.1) (51.3%) 17.7 22.8 (5.1) (22.4%)
Fleet Replacement Program 34.5 82.7 (48.2) (58.3%) 161.9 91.7 70.2 76.6%
Other 2.3 3.3 (1.0) (30.3%) 6.1 11.7 (5.6) (47.9%)
Capital investments 65.9 119.0 (53.1) (44.6%) 250.4 205.2 45.2 22.0%
Advance on contract – Fleet Replacement Program - (40.2) 40.2 100.0% 2.5 63.6 (61.1) (96.1%)
Total 65.9 78.8 (12.9) (16.4%) 252.9 268.8 (15.9) (5.9%)
(Amounts in bracket represent decreases)
Note: As at December 31, 2019, there is an amount payable of $1.1 million which will be paid from the Asset Renewal Fund and is not financed by the capital funding received from the Government of Canada ($267.7 million).
The most significant investments made during the quarter were in equipment projects such as the Fleet Replacement Program as well as the HEP long haul and Corridor equipment rebuild program.
Management Discussion and Analysis18
26
Funded capital investments
Property, plant and equipment and intangible assets totaled to $1,512.9 million as at December 31, 2020, which is an increase of $144.5 million compared to the balance as at December 31, 2019.
Funded capital investments of $252.9 million were made during the year.
They exclude an amount of $7.4 million which is not payable now and will therefore be requested to the Government of Canada in future years (refer to note 26 of the audited financial statements). Total investments for the year include an amount of $2.5 million relating to an advance on contract which was made during the period and will be transferred to property, plant and equipment in future years.
00 / 00
6. Results compared to the 2020-2024 Corporate Plan (1)
(1): The Corporate plan provides information on funded activities, therefore comparison between actual and planned results are based on funded activities.
The Corporation continues to work towards achieving the goals and strategies identified in its corporate plan, however the financial results of the quarter differ from the plan as a result of the impact of the February blockades and the COVID-19 pandemic, mostly due to lower revenues reflecting the sharp decrease in travel and the associated reductions in capacity.
In terms of capital expenditures, work progresses on the major strategic projects identified in the plan such as the Fleet Replacement Program, rolling equipment modernisation and station upgrades.
Management Discussion and Analysis19
26
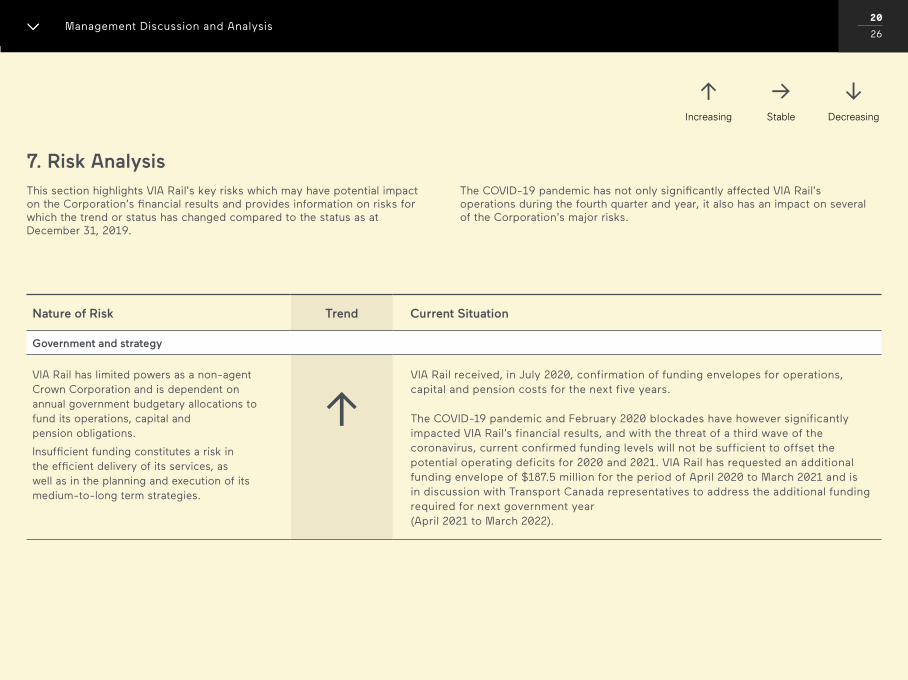
00 / 00
7. Risk AnalysisThis section highlights VIA Rail’s key risks which may have potential impact on the Corporation’s financial results and provides information on risks for which the trend or status has changed compared to the status as at December 31, 2019.
The COVID-19 pandemic has not only significantly affected VIA Rail’s operations during the fourth quarter and year, it also has an impact on several of the Corporation’s major risks.
Nature of Risk Trend Current Situation
Government and strategy
VIA Rail has limited powers as a non-agent Crown Corporation and is dependent on annual government budgetary allocations to fund its operations, capital and pension obligations.
Insufficient funding constitutes a risk in the efficient delivery of its services, as well as in the planning and execution of its medium-to-long term strategies.
VIA Rail received, in July 2020, confirmation of funding envelopes for operations, capital and pension costs for the next five years.
The COVID-19 pandemic and February 2020 blockades have however significantly impacted VIA Rail’s financial results, and with the threat of a third wave of the coronavirus, current confirmed funding levels will not be sufficient to offset the potential operating deficits for 2020 and 2021. VIA Rail has requested an additional funding envelope of $187.5 million for the period of April 2020 to March 2021 and is in discussion with Transport Canada representatives to address the additional funding required for next government year (April 2021 to March 2022).
Increasing Stable Decreasing
Management Discussion and Analysis20
26
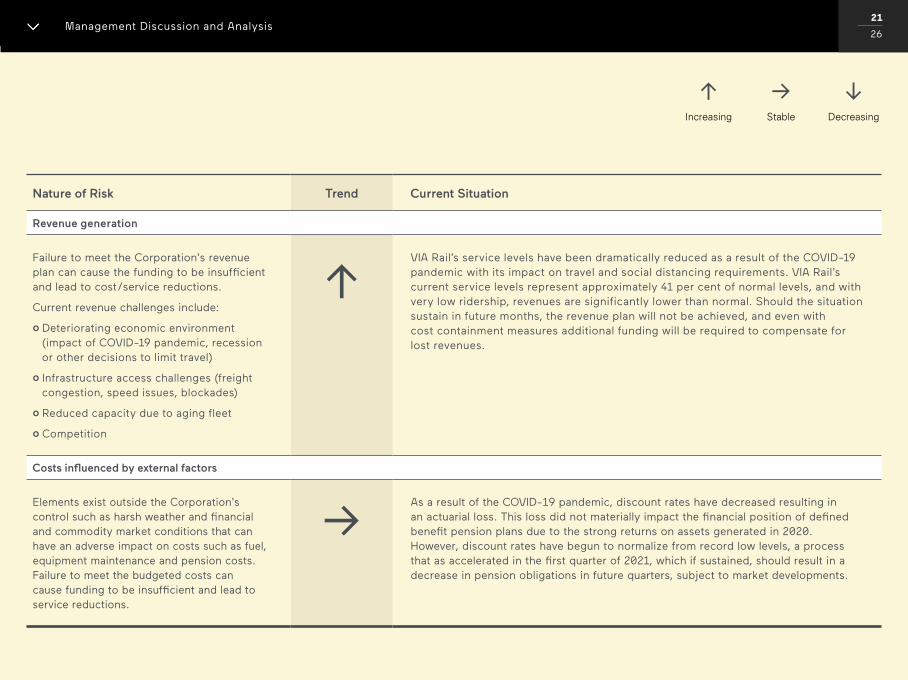
00 / 00
Nature of Risk Trend Current Situation
Revenue generation
Failure to meet the Corporation’s revenue plan can cause the funding to be insufficient and lead to cost/service reductions.
Current revenue challenges include:
o Deteriorating economic environment (impact of COVID-19 pandemic, recession or other decisions to limit travel)
o Infrastructure access challenges (freight congestion, speed issues, blockades)
o Reduced capacity due to aging fleet
o Competition
VIA Rail’s service levels have been dramatically reduced as a result of the COVID-19 pandemic with its impact on travel and social distancing requirements. VIA Rail’s current service levels represent approximately 41 per cent of normal levels, and with very low ridership, revenues are significantly lower than normal. Should the situation sustain in future months, the revenue plan will not be achieved, and even with cost containment measures additional funding will be required to compensate for lost revenues.
Costs influenced by external factors
Elements exist outside the Corporation’s control such as harsh weather and financial and commodity market conditions that can have an adverse impact on costs such as fuel, equipment maintenance and pension costs. Failure to meet the budgeted costs can cause funding to be insufficient and lead to service reductions.
As a result of the COVID-19 pandemic, discount rates have decreased resulting in an actuarial loss. This loss did not materially impact the financial position of defined benefit pension plans due to the strong returns on assets generated in 2020. However, discount rates have begun to normalize from record low levels, a process that as accelerated in the first quarter of 2021, which if sustained, should result in a decrease in pension obligations in future quarters, subject to market developments.
Increasing Stable Decreasing
Management Discussion and Analysis21
26
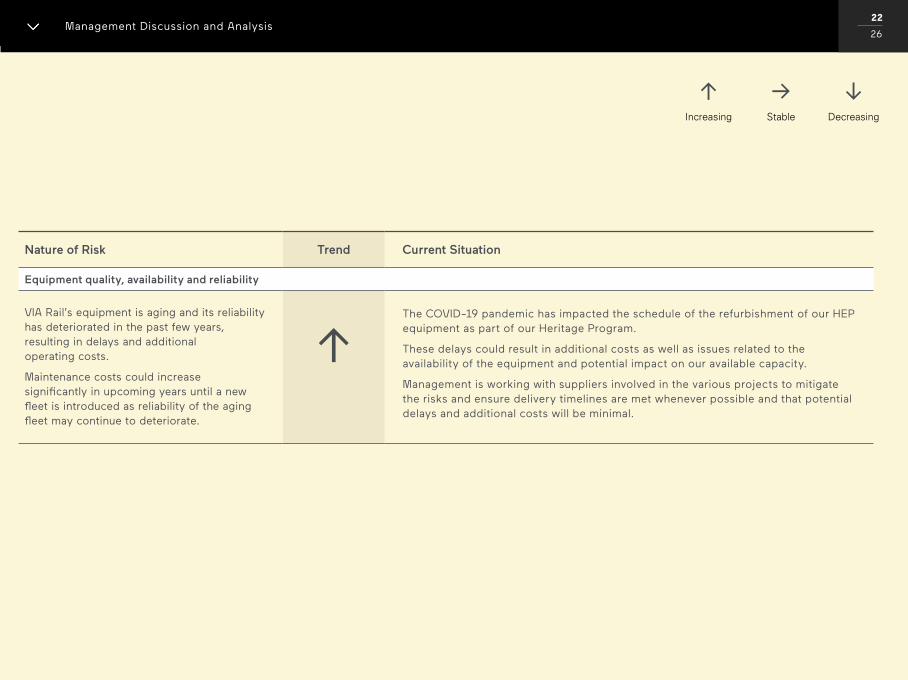
00 / 00
Nature of Risk Trend Current Situation
Equipment quality, availability and reliability
VIA Rail’s equipment is aging and its reliability has deteriorated in the past few years, resulting in delays and additional operating costs.
Maintenance costs could increase significantly in upcoming years until a new fleet is introduced as reliability of the aging fleet may continue to deteriorate.
The COVID-19 pandemic has impacted the schedule of the refurbishment of our HEP equipment as part of our Heritage Program.
These delays could result in additional costs as well as issues related to the availability of the equipment and potential impact on our available capacity.
Management is working with suppliers involved in the various projects to mitigate the risks and ensure delivery timelines are met whenever possible and that potential delays and additional costs will be minimal.
Increasing Stable Decreasing
Management Discussion and Analysis22
26
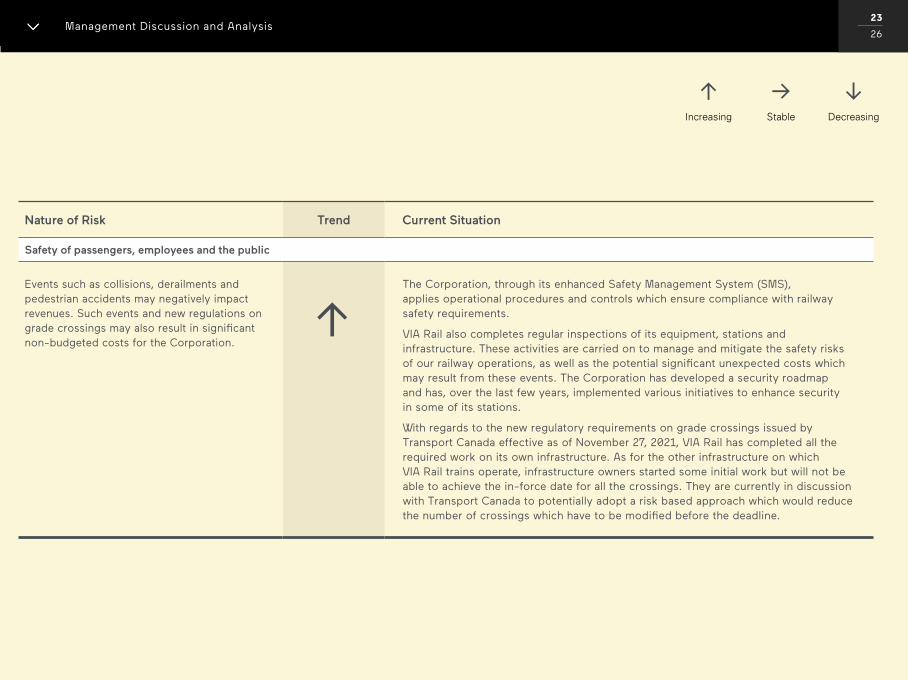
00 / 00
Nature of Risk Trend Current Situation
Safety of passengers, employees and the public
Events such as collisions, derailments and pedestrian accidents may negatively impact revenues. Such events and new regulations on grade crossings may also result in significant non-budgeted costs for the Corporation.
The Corporation, through its enhanced Safety Management System (SMS), applies operational procedures and controls which ensure compliance with railway safety requirements.
VIA Rail also completes regular inspections of its equipment, stations and infrastructure. These activities are carried on to manage and mitigate the safety risks of our railway operations, as well as the potential significant unexpected costs which may result from these events. The Corporation has developed a security roadmap and has, over the last few years, implemented various initiatives to enhance security in some of its stations.
With regards to the new regulatory requirements on grade crossings issued by Transport Canada effective as of November 27, 2021, VIA Rail has completed all the required work on its own infrastructure. As for the other infrastructure on which VIA Rail trains operate, infrastructure owners started some initial work but will not be able to achieve the in-force date for all the crossings. They are currently in discussion with Transport Canada to potentially adopt a risk based approach which would reduce the number of crossings which have to be modified before the deadline.
Increasing Stable Decreasing
Management Discussion and Analysis23
26
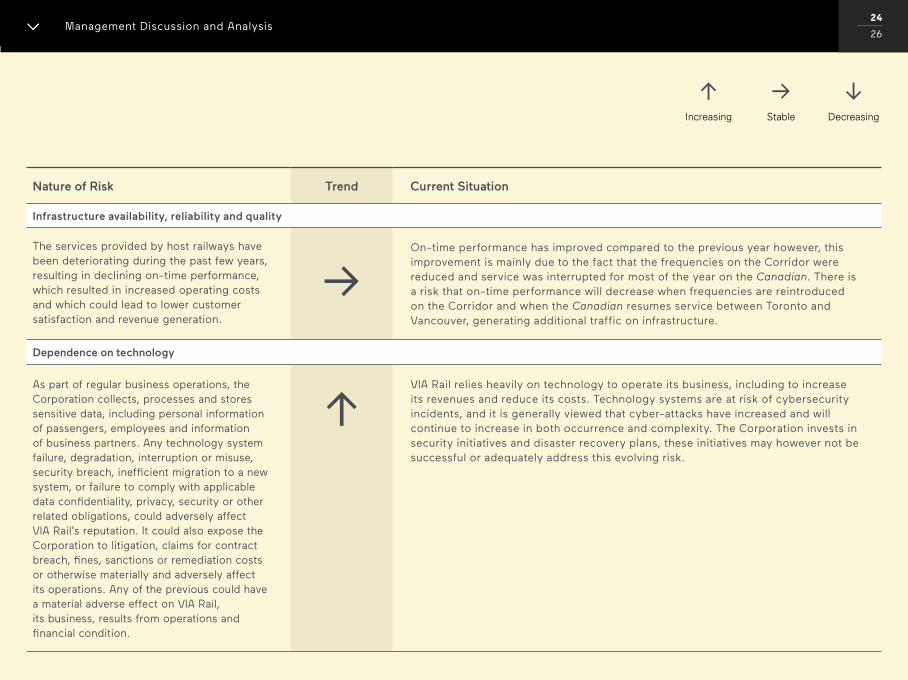
00 / 00
Nature of Risk Trend Current Situation
Infrastructure availability, reliability and quality
The services provided by host railways have been deteriorating during the past few years, resulting in declining on-time performance, which resulted in increased operating costs and which could lead to lower customer satisfaction and revenue generation.
On-time performance has improved compared to the previous year however, this improvement is mainly due to the fact that the frequencies on the Corridor were reduced and service was interrupted for most of the year on the Canadian. There is a risk that on-time performance will decrease when frequencies are reintroduced on the Corridor and when the Canadian resumes service between Toronto and Vancouver, generating additional traffic on infrastructure.
Dependence on technology
As part of regular business operations, the Corporation collects, processes and stores sensitive data, including personal information of passengers, employees and information of business partners. Any technology system failure, degradation, interruption or misuse, security breach, inefficient migration to a new system, or failure to comply with applicable data confidentiality, privacy, security or other related obligations, could adversely affect VIA Rail’s reputation. It could also expose the Corporation to litigation, claims for contract breach, fines, sanctions or remediation costs or otherwise materially and adversely affect its operations. Any of the previous could have a material adverse effect on VIA Rail, its business, results from operations and financial condition.
VIA Rail relies heavily on technology to operate its business, including to increase its revenues and reduce its costs. Technology systems are at risk of cybersecurity incidents, and it is generally viewed that cyber-attacks have increased and will continue to increase in both occurrence and complexity. The Corporation invests in security initiatives and disaster recovery plans, these initiatives may however not be successful or adequately address this evolving risk.
Increasing Stable Decreasing
Management Discussion and Analysis24
26
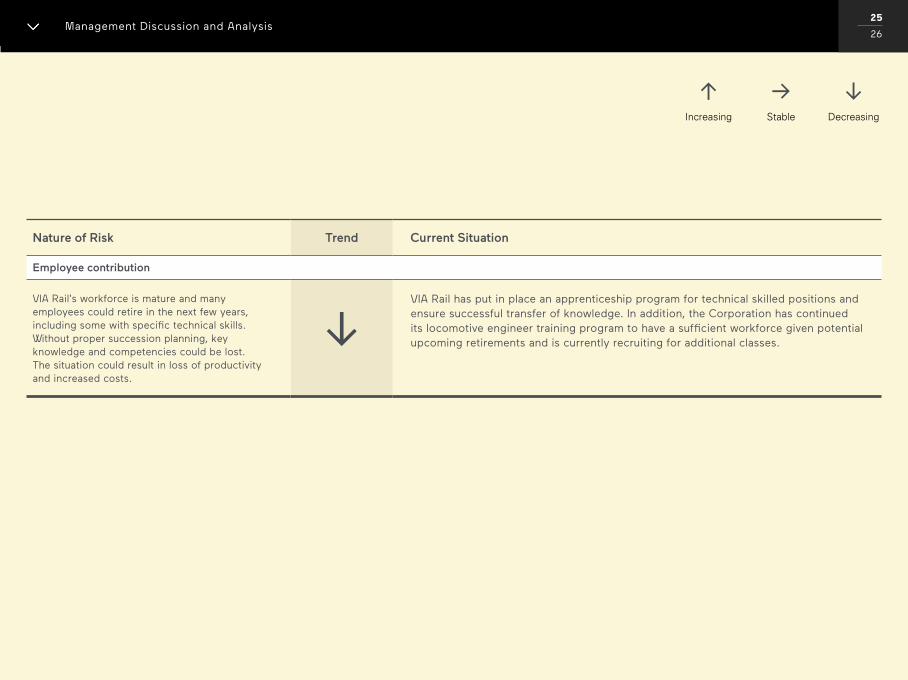
00 / 00
Nature of Risk Trend Current Situation
Employee contribution
VIA Rail’s workforce is mature and many employees could retire in the next few years, including some with specific technical skills. Without proper succession planning, key knowledge and competencies could be lost. The situation could result in loss of productivity and increased costs.
VIA Rail has put in place an apprenticeship program for technical skilled positions and ensure successful transfer of knowledge. In addition, the Corporation has continued its locomotive engineer training program to have a sufficient workforce given potential upcoming retirements and is currently recruiting for additional classes.
Increasing Stable Decreasing
Management Discussion and Analysis25
26
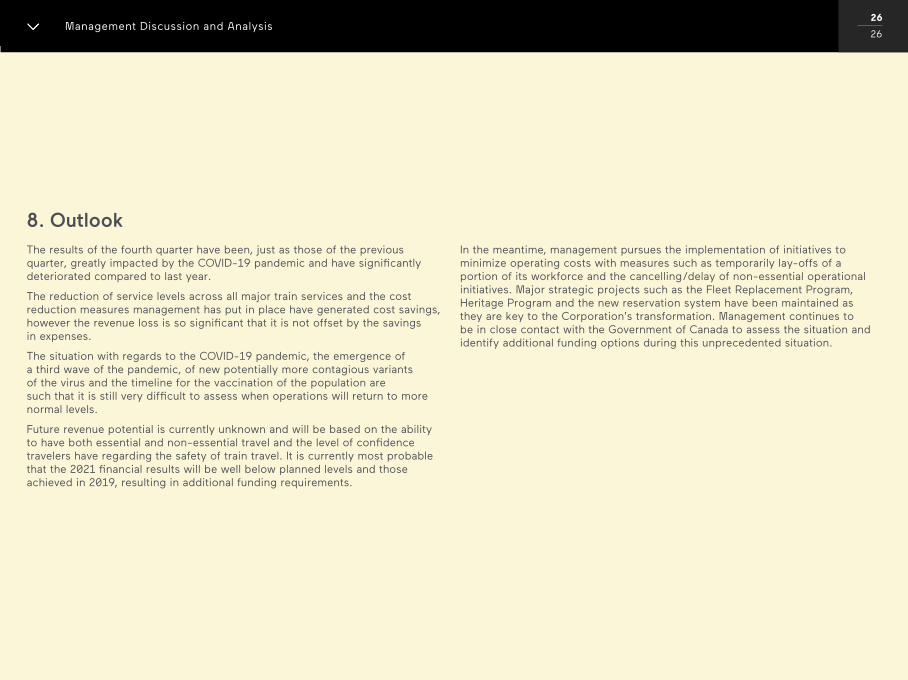
00 / 00
8. OutlookThe results of the fourth quarter have been, just as those of the previous quarter, greatly impacted by the COVID-19 pandemic and have significantly deteriorated compared to last year.
The reduction of service levels across all major train services and the cost reduction measures management has put in place have generated cost savings, however the revenue loss is so significant that it is not offset by the savings in expenses.
The situation with regards to the COVID-19 pandemic, the emergence of a third wave of the pandemic, of new potentially more contagious variants of the virus and the timeline for the vaccination of the population are such that it is still very difficult to assess when operations will return to more normal levels.
Future revenue potential is currently unknown and will be based on the ability to have both essential and non-essential travel and the level of confidence travelers have regarding the safety of train travel. It is currently most probable that the 2021 financial results will be well below planned levels and those achieved in 2019, resulting in additional funding requirements.
In the meantime, management pursues the implementation of initiatives to minimize operating costs with measures such as temporarily lay-offs of a portion of its workforce and the cancelling/delay of non-essential operational initiatives. Major strategic projects such as the Fleet Replacement Program, Heritage Program and the new reservation system have been maintained as they are key to the Corporation’s transformation. Management continues to be in close contact with the Government of Canada to assess the situation and identify additional funding options during this unprecedented situation.
Management Discussion and Analysis26
26

Financial Statements
01
80 Financial Statements
00 / 00 Financial Statements
Management’s Responsibility StatementYear ended December 31, 2020
Management of the Corporation is responsible for the preparation and fair presentation of the financial statements contained in the Annual Report. These financial statements have been prepared in accordance with International Financial Reporting Standards (IFRS) and necessarily include certain amounts that are based on management’s best estimates and judgment. Financial information contained throughout the Annual Report is consistent with that in the financial statements. Management considers that the financial statements present fairly the financial position of the Corporation and its financial performance and its cash flows.
To fulfil its responsibility, the Corporation maintains systems of internal controls, policies and procedures to ensure the reliability of financial information and the safeguarding of assets. The external auditor, the Auditor General of Canada, has audited the Corporation’s financial statements for the year ended December 31, 2020 and her report indicates the scope of her audit and her opinion on the financial statements.
The Audit & Pension Investment Committee of the Board of Directors, consisting of independent Directors, meets periodically with the internal auditors KPMG and external auditors and with management, to review the scope of their audits and to assess reports on audit work performed. The financial statements have been reviewed and approved by the Board of Directors on the recommendation of the Audit & Pension Investment Committee.
Cynthia Garneau Patricia Jasmin President and Chief Executive Officer Chief Financial Officer
Montréal, Canada March 24, 2021
02
80

00 / 00 Financial Statements
03
80
INDEPENDENT AUDITOR’S REPORT
To the Minister of Transport
Report on the Audit of the Financial Statements
Opinion
We have audited the financial statements of VIA Rail Canada Inc., which comprise the statement of financial position as at 31 December 2020, and the statement of comprehensive income, statement of changes in shareholder’s deficiency and statement of cash flows for the year then ended, and notes to the financial statements, including a summary of significant accounting policies.
In our opinion, the accompanying financial statements present fairly, in all material respects, the financial position of VIA Rail Canada Inc. as at 31 December 2020, and its financial performance and its cash flows for the year then ended in accordance with International Financial Reporting Standards (IFRSs).
Basis for Opinion
We conducted our audit in accordance with Canadian generally accepted auditing standards. Our responsibilities under those standards are further described in the Auditor’s Responsibilities for the Audit of the Financial Statements section of our report. We are independent of VIA Rail Canada Inc. in accordance with the ethical requirements that are relevant to our audit of the financial statements in Canada, and we have fulfilled our other ethical responsibilities in accordance with these requirements. We believe that the audit evidence we have obtained is sufficient and appropriate to provide a basis for our opinion.
00 / 00 Financial Statements
04
80
Other Information
Management is responsible for the other information. The other information comprises the information included in the annual report, but does not include the financial statements and our auditor’s report thereon.
Our opinion on the financial statements does not cover the other information and we do not express any form of assurance conclusion thereon.
In connection with our audit of the financial statements, our responsibility is to read the other information and, in doing so, consider whether the other information is materially inconsistent with the financial statements or our knowledge obtained in the audit, or otherwise appears to be materially misstated. If, based on the work we have performed, we conclude that there is a material misstatement of this other information, we are required to report that fact. We have nothing to report in this regard.
Responsibilities of Management and Those Charged with Governance for the Financial Statements
Management is responsible for the preparation and fair presentation of the financial statements in accordance with IFRSs, and for such internal control as management determines is necessary to enable the preparation of financial statements that are free from material misstatement, whether due to fraud or error.
In preparing the financial statements, management is responsible for assessing VIA Rail Canada Inc.’s ability to continue as a going concern, disclosing, as applicable, matters related to going concern and using the going concern basis of accounting unless management either intends to liquidate VIA Rail Canada Inc. or to cease operations, or has no realistic alternative but to do so.
Those charged with governance are responsible for overseeing VIA Rail Canada Inc.’s financial reporting process.
Auditor’s Responsibilities for the Audit of the Financial Statements
Our objectives are to obtain reasonable assurance about whether the financial statements as a whole are free from material misstatement, whether due to fraud or error, and to issue an auditor’s report that includes our opinion. Reasonable assurance is a high level of assurance, but is not a guarantee that an audit conducted in accordance with Canadian generally accepted auditing standards will always detect a material misstatement when it exists. Misstatements can arise from fraud or error and are considered material if, individually or in the aggregate, they could reasonably be expected to influence the economic decisions of users taken on the basis of these financial statements.
00 / 00 Financial Statements
05
80
As part of an audit in accordance with Canadian generally accepted auditing standards, we exercise professional judgment and maintain professional skepticism throughout the audit. We also:
• Identify and assess the risks of material misstatement of the financial statements, whether due to fraud or error, design and perform audit procedures responsive to those risks, and obtain audit evidence that is sufficient and appropriate to provide a basis for our opinion. The risk of not detecting a material misstatement resulting from fraud is higher than for one resulting from error, as fraud may involve collusion, forgery, intentional omissions, misrepresentations, or the override of internal control.
• Obtain an understanding of internal control relevant to the audit in order to design audit procedures that are appropriate in the circumstances, but not for the purpose of expressing an opinion on the effectiveness of VIA Rail Canada Inc.’s internal control.
• Evaluate the appropriateness of accounting policies used and the reasonableness of accounting estimates and related disclosures made by management.
• Conclude on the appropriateness of management’s use of the going concern basis of accounting and, based on the audit evidence obtained, whether a material uncertainty exists related to events or conditions that may cast significant doubt on VIA Rail Canada Inc.’s ability to continue as a going concern. If we conclude that a material uncertainty exists, we are required to draw attention in our auditor’s report to the related disclosures in the financial statements or, if such disclosures are inadequate, to modify our opinion. Our conclusions are based on the audit evidence obtained up to the date of our auditor’s report. However, future events or conditions may cause VIA Rail Canada Inc. to cease to continue as a going concern.
• Evaluate the overall presentation, structure and content of the financial statements, including the disclosures, and whether the financial statements represent the underlying transactions and events in a manner that achieves fair presentation.
We communicate with those charged with governance regarding, among other matters, the planned scope and timing of the audit and significant audit findings, including any significant deficiencies in internal control that we identify during our audit.
00 / 00 Financial Statements
06
80
Report on Compliance with Specified Authorities
Opinion
In conjunction with the audit of the financial statements, we have audited transactions of VIA Rail Canada Inc. coming to our notice for compliance with specified authorities. The specified authorities against which compliance was audited are Part X of the Financial Administration Act and regulations, the Canada Business Corporations Act and regulations, the articles and by laws of VIA Rail Canada Inc., and the directives issued pursuant to section 89 of the Financial Administration Act.
In our opinion, the transactions of VIA Rail Canada Inc. that came to our notice during the audit of the financial statements have complied, in all material respects, with the specified authorities referred to above. Further, as required by the Financial Administration Act, we report that, in our opinion, the accounting principles in IFRSs have been applied on a basis consistent with that of the preceding year.
Responsibilities of Management for Compliance with Specified Authorities
Management is responsible for VIA Rail Canada Inc.’s compliance with the specified authorities named above, and for such internal control as management determines is necessary to enable VIA Rail Canada Inc. to comply with the specified authorities.
Auditor’s Responsibilities for the Audit of Compliance with Specified Authorities
Our audit responsibilities include planning and performing procedures to provide an audit opinion and reporting on whether the transactions coming to our notice during the audit of the financial statements are in compliance with the specified authorities referred to above.
Tina Swiderski, CPA auditor, CA Principal for the Auditor General of Canada
Montréal, Canada 24 March 2021
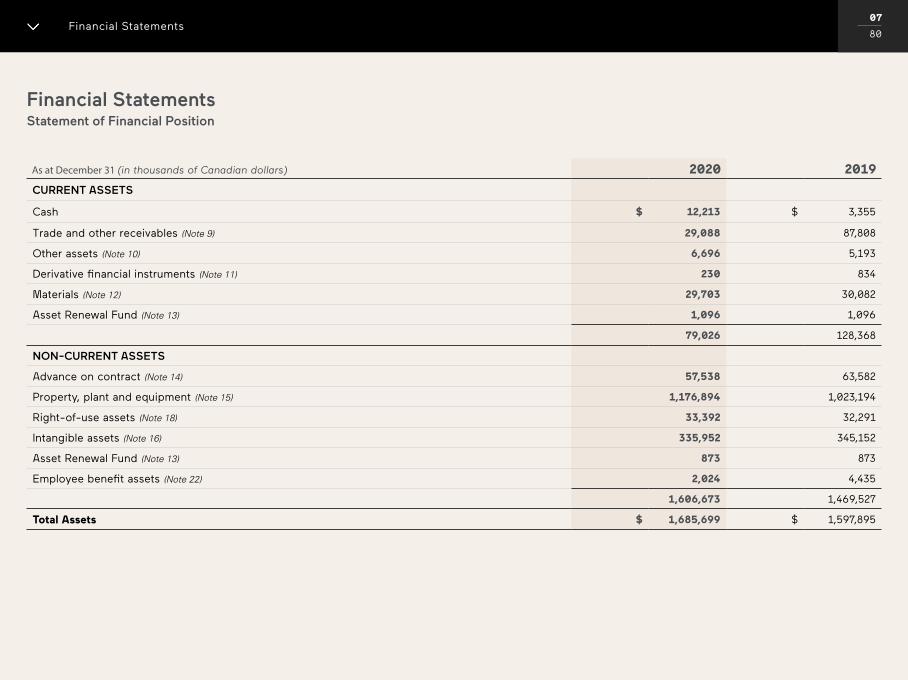
00 / 00 Financial Statements
Financial StatementsStatement of Financial Position
As at December 31 (in thousands of Canadian dollars) 2020 2019
CURRENT ASSETS
Cash $ 12,213 $ 3,355
Trade and other receivables (Note 9) 29,088 87,808
Other assets (Note 10) 6,696 5,193
Derivative financial instruments (Note 11) 230 834
Materials (Note 12) 29,703 30,082
Asset Renewal Fund (Note 13) 1,096 1,096
79,026 128,368
NON-CURRENT ASSETS
Advance on contract (Note 14) 57,538 63,582
Property, plant and equipment (Note 15) 1,176,894 1,023,194
Right-of-use assets (Note 18) 33,392 32,291
Intangible assets (Note 16) 335,952 345,152
Asset Renewal Fund (Note 13) 873 873
Employee benefit assets (Note 22) 2,024 4,435
1,606,673 1,469,527
Total Assets $ 1,685,699 $ 1,597,895
07
80
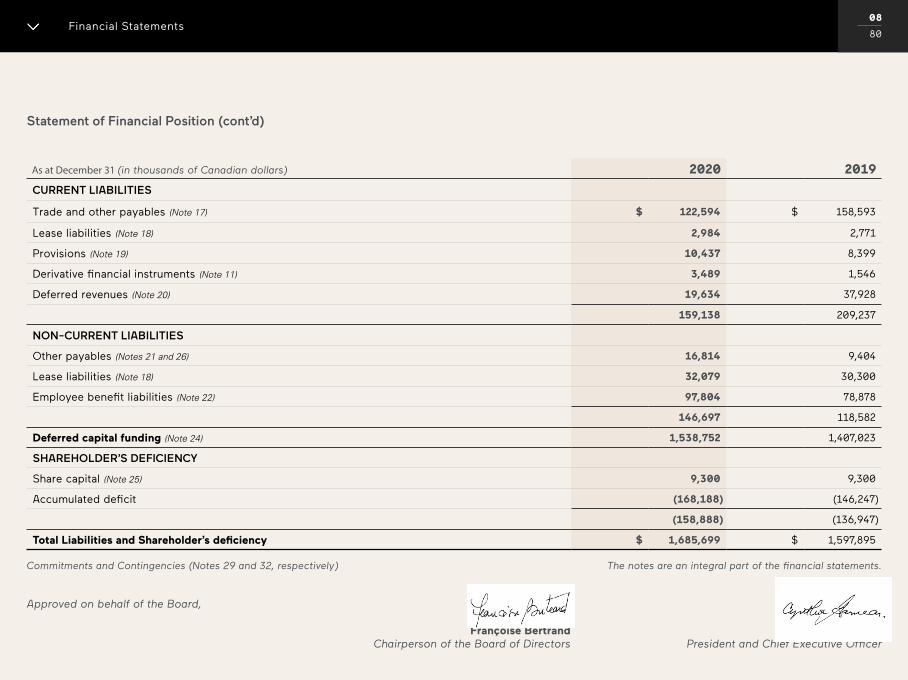
00 / 00 Financial Statements
Statement of Financial Position (cont’d)
As at December 31 (in thousands of Canadian dollars) 2020 2019
CURRENT LIABILITIES
Trade and other payables (Note 17) $ 122,594 $ 158,593
Lease liabilities (Note 18) 2,984 2,771
Provisions (Note 19) 10,437 8,399
Derivative financial instruments (Note 11) 3,489 1,546
Deferred revenues (Note 20) 19,634 37,928
159,138 209,237
NON-CURRENT LIABILITIES
Other payables (Notes 21 and 26) 16,814 9,404
Lease liabilities (Note 18) 32,079 30,300
Employee benefit liabilities (Note 22) 97,804 78,878
146,697 118,582
Deferred capital funding (Note 24) 1,538,752 1,407,023
SHAREHOLDER’S DEFICIENCY
Share capital (Note 25) 9,300 9,300
Accumulated deficit (168,188) (146,247)
(158,888) (136,947)
Total Liabilities and Shareholder’s deficiency $ 1,685,699 $ 1,597,895
Commitments and Contingencies (Notes 29 and 32, respectively) The notes are an integral part of the financial statements.
Approved on behalf of the Board, Françoise Bertrand Cynthia Garneau Chairperson of the Board of Directors President and Chief Executive Officer
08
80
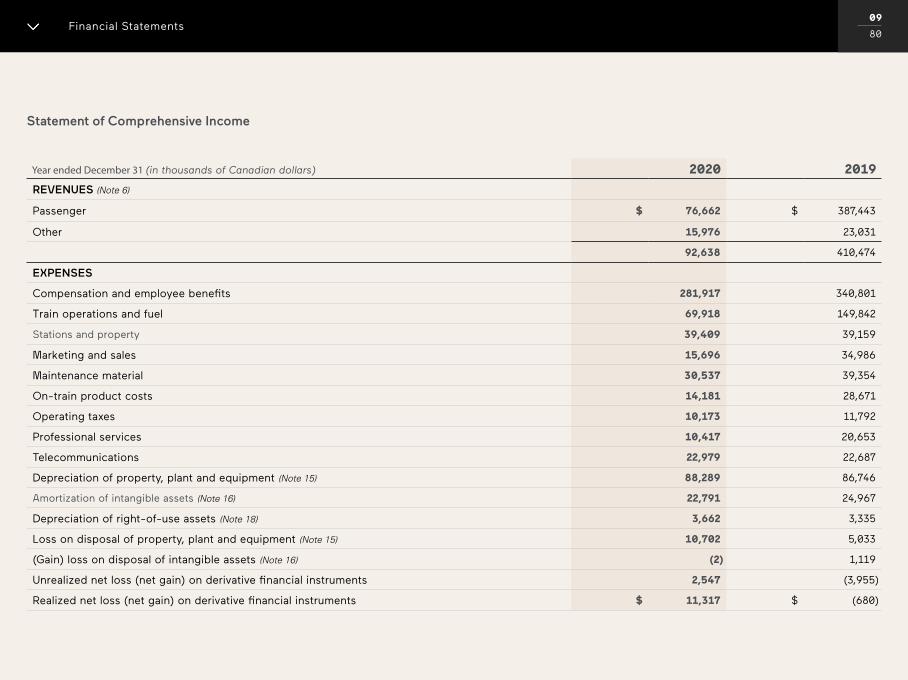
Financial Statements
Statement of Comprehensive Income
Year ended December 31 (in thousands of Canadian dollars) 2020 2019
REVENUES (Note 6)
Passenger $ 76,662 $ 387,443
Other 15,976 23,031
92,638 410,474
EXPENSES
Compensation and employee benefits 281,917 340,801
Train operations and fuel 69,918 149,842
Stations and property 39,409 39,159
Marketing and sales 15,696 34,986
Maintenance material 30,537 39,354
On-train product costs 14,181 28,671
Operating taxes 10,173 11,792
Professional services 10,417 20,653
Telecommunications 22,979 22,687
Depreciation of property, plant and equipment (Note 15) 88,289 86,746
Amortization of intangible assets (Note 16) 22,791 24,967
Depreciation of right-of-use assets (Note 18) 3,662 3,335
Loss on disposal of property, plant and equipment (Note 15) 10,702 5,033
(Gain) loss on disposal of intangible assets (Note 16) (2) 1,119
Unrealized net loss (net gain) on derivative financial instruments 2,547 (3,955)
Realized net loss (net gain) on derivative financial instruments $ 11,317 $ (680)
09
80
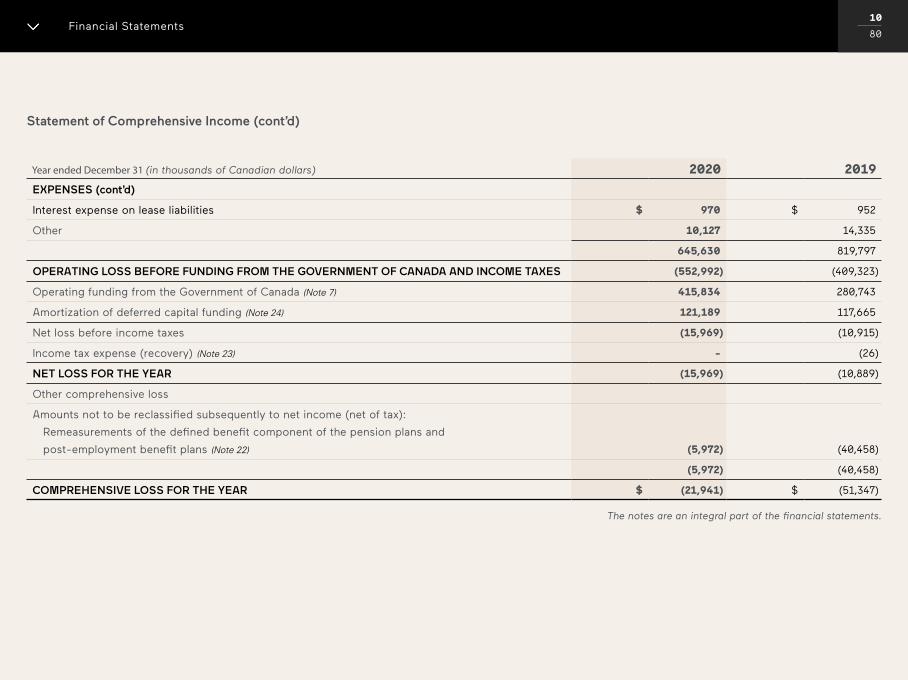
00 / 00 Financial Statements
Statement of Comprehensive Income (cont’d)
Year ended December 31 (in thousands of Canadian dollars) 2020 2019
EXPENSES (cont’d)
Interest expense on lease liabilities $ 970 $ 952
Other 10,127 14,335
645,630 819,797
OPERATING LOSS BEFORE FUNDING FROM THE GOVERNMENT OF CANADA AND INCOME TAXES (552,992) (409,323)
Operating funding from the Government of Canada (Note 7) 415,834 280,743
Amortization of deferred capital funding (Note 24) 121,189 117,665
Net loss before income taxes (15,969) (10,915)
Income tax expense (recovery) (Note 23) - (26)
NET LOSS FOR THE YEAR (15,969) (10,889)
Other comprehensive loss
Amounts not to be reclassified subsequently to net income (net of tax):
Remeasurements of the defined benefit component of the pension plans and
post-employment benefit plans (Note 22) (5,972) (40,458)
(5,972) (40,458)
COMPREHENSIVE LOSS FOR THE YEAR $ (21,941) $ (51,347)
The notes are an integral part of the financial statements.
10
80
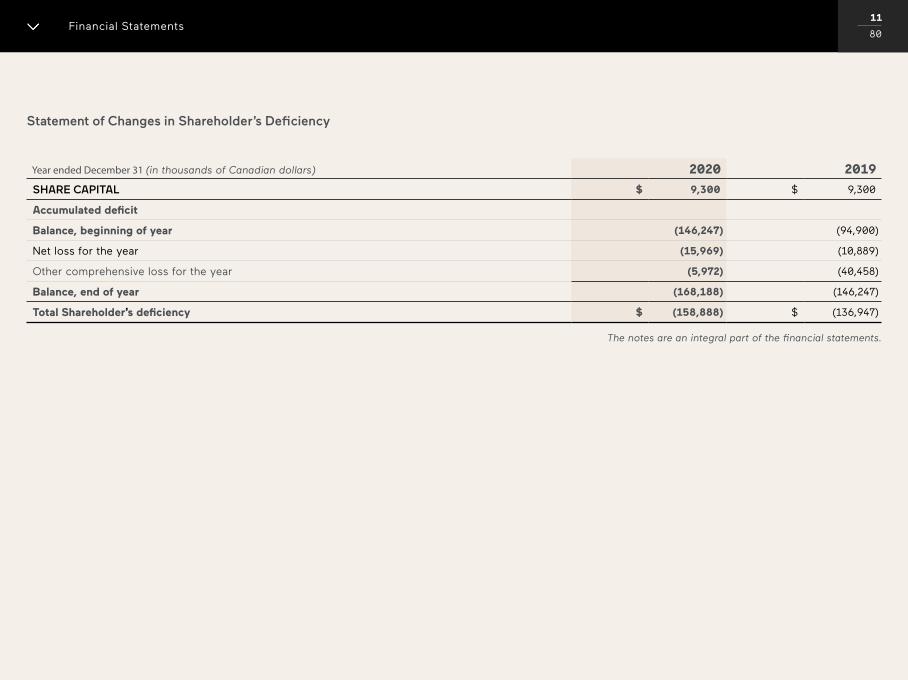
00 / 00 Financial Statements
Statement of Changes in Shareholder’s Deficiency
Year ended December 31 (in thousands of Canadian dollars) 2020 2019
SHARE CAPITAL $ 9,300 $ 9,300
Accumulated deficit
Balance, beginning of year (146,247) (94,900)
Net loss for the year (15,969) (10,889)
Other comprehensive loss for the year (5,972) (40,458)
Balance, end of year (168,188) (146,247)
Total Shareholder’s deficiency $ (158,888) $ (136,947)
The notes are an integral part of the financial statements.
11
80
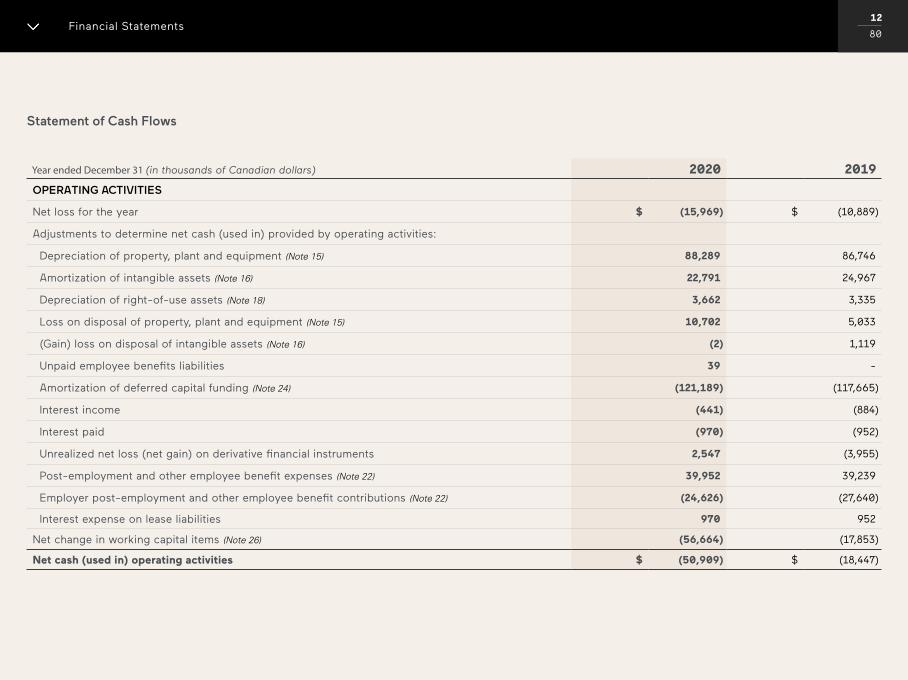
00 / 00 Financial Statements
Statement of Cash Flows
Year ended December 31 (in thousands of Canadian dollars) 2020 2019
OPERATING ACTIVITIES
Net loss for the year $ (15,969) $ (10,889)
Adjustments to determine net cash (used in) provided by operating activities:
Depreciation of property, plant and equipment (Note 15) 88,289 86,746
Amortization of intangible assets (Note 16) 22,791 24,967
Depreciation of right-of-use assets (Note 18) 3,662 3,335
Loss on disposal of property, plant and equipment (Note 15) 10,702 5,033
(Gain) loss on disposal of intangible assets (Note 16) (2) 1,119
Unpaid employee benefits liabilities 39 -
Amortization of deferred capital funding (Note 24) (121,189) (117,665)
Interest income (441) (884)
Interest paid (970) (952)
Unrealized net loss (net gain) on derivative financial instruments 2,547 (3,955)
Post-employment and other employee benefit expenses (Note 22) 39,952 39,239
Employer post-employment and other employee benefit contributions (Note 22) (24,626) (27,640)
Interest expense on lease liabilities 970 952
Net change in working capital items (Note 26) (56,664) (17,853)
Net cash (used in) operating activities $ (50,909) $ (18,447)
12
80
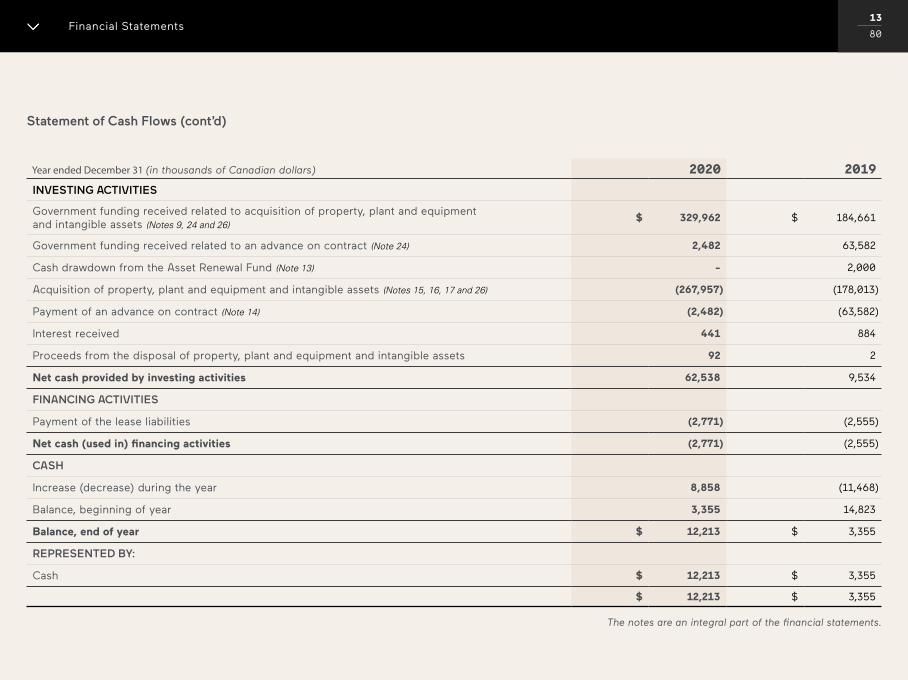
00 / 00 Financial Statements
Statement of Cash Flows (cont’d)
Year ended December 31 (in thousands of Canadian dollars) 2020 2019
INVESTING ACTIVITIES
Government funding received related to acquisition of property, plant and equipment and intangible assets (Notes 9, 24 and 26)
$ 329,962 $ 184,661
Government funding received related to an advance on contract (Note 24) 2,482 63,582
Cash drawdown from the Asset Renewal Fund (Note 13) - 2,000
Acquisition of property, plant and equipment and intangible assets (Notes 15, 16, 17 and 26) (267,957) (178,013)
Payment of an advance on contract (Note 14) (2,482) (63,582)
Interest received 441 884
Proceeds from the disposal of property, plant and equipment and intangible assets 92 2
Net cash provided by investing activities 62,538 9,534
FINANCING ACTIVITIES
Payment of the lease liabilities (2,771) (2,555)
Net cash (used in) financing activities (2,771) (2,555)
CASH
Increase (decrease) during the year 8,858 (11,468)
Balance, beginning of year 3,355 14,823
Balance, end of year $ 12,213 $ 3,355
REPRESENTED BY:
Cash $ 12,213 $ 3,355
$ 12,213 $ 3,355
The notes are an integral part of the financial statements.
13
80
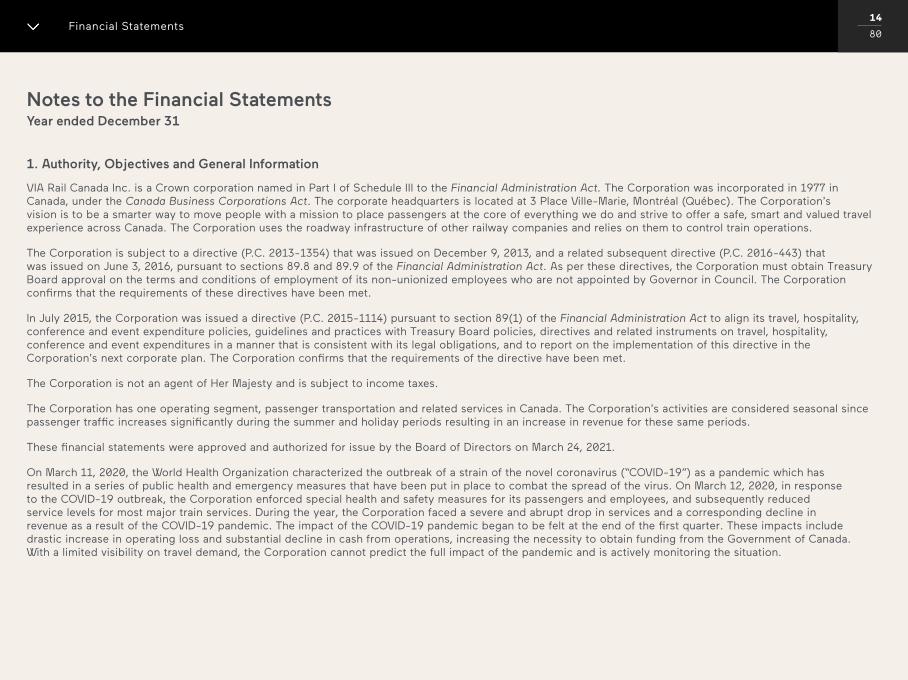
00 / 00 Financial Statements
Notes to the Financial StatementsYear ended December 31
1. Authority, Objectives and General Information
VIA Rail Canada Inc. is a Crown corporation named in Part I of Schedule III to the Financial Administration Act. The Corporation was incorporated in 1977 in Canada, under the Canada Business Corporations Act. The corporate headquarters is located at 3 Place Ville-Marie, Montréal (Québec). The Corporation’s vision is to be a smarter way to move people with a mission to place passengers at the core of everything we do and strive to offer a safe, smart and valued travel experience across Canada. The Corporation uses the roadway infrastructure of other railway companies and relies on them to control train operations.
The Corporation is subject to a directive (P.C. 2013-1354) that was issued on December 9, 2013, and a related subsequent directive (P.C. 2016-443) that was issued on June 3, 2016, pursuant to sections 89.8 and 89.9 of the Financial Administration Act. As per these directives, the Corporation must obtain Treasury Board approval on the terms and conditions of employment of its non-unionized employees who are not appointed by Governor in Council. The Corporation confirms that the requirements of these directives have been met.
In July 2015, the Corporation was issued a directive (P.C. 2015-1114) pursuant to section 89(1) of the Financial Administration Act to align its travel, hospitality, conference and event expenditure policies, guidelines and practices with Treasury Board policies, directives and related instruments on travel, hospitality, conference and event expenditures in a manner that is consistent with its legal obligations, and to report on the implementation of this directive in the Corporation’s next corporate plan. The Corporation confirms that the requirements of the directive have been met.
The Corporation is not an agent of Her Majesty and is subject to income taxes.
The Corporation has one operating segment, passenger transportation and related services in Canada. The Corporation’s activities are considered seasonal since passenger traffic increases significantly during the summer and holiday periods resulting in an increase in revenue for these same periods.
These financial statements were approved and authorized for issue by the Board of Directors on March 24, 2021.
On March 11, 2020, the World Health Organization characterized the outbreak of a strain of the novel coronavirus (“COVID-19”) as a pandemic which has resulted in a series of public health and emergency measures that have been put in place to combat the spread of the virus. On March 12, 2020, in response to the COVID-19 outbreak, the Corporation enforced special health and safety measures for its passengers and employees, and subsequently reduced service levels for most major train services. During the year, the Corporation faced a severe and abrupt drop in services and a corresponding decline in revenue as a result of the COVID-19 pandemic. The impact of the COVID-19 pandemic began to be felt at the end of the first quarter. These impacts include drastic increase in operating loss and substantial decline in cash from operations, increasing the necessity to obtain funding from the Government of Canada. With a limited visibility on travel demand, the Corporation cannot predict the full impact of the pandemic and is actively monitoring the situation.
14
80
00 / 00 Financial Statements | Notes to the Financial Statements
1. Authority, Objectives and General Information (cont’d)
The Corporation, in its objective to reduce costs and minimize the impact of the pandemic on its deficit, has implemented various cost saving measures including:
The reduction of a portion of its operating expenses in proportion to the level of operations,
Employee layoffs and reduction of compensation for some employees not working,
Reduction of publicity and advertising activities,
Reduction of services in stations, as well as
Reduction of administrative costs and the postponement of non-essential initiatives.
The directors have, at the time of approving the financial statements, a reasonable expectation that the Corporation will receive the additional funding from the Government of Canada and has adequate resources to continue in operational existence for the foreseeable future. Thus they continue to adopt the going concern basis of accounting in preparing the financial statements.
2. Basis of Preparation
a) Statement of compliance
The Corporation’s financial statements have been prepared in accordance with the International Financial Reporting Standards (IFRS).
b) Basis of measurement
The financial statements have been prepared on the historical cost basis except when a specific IFRS standard requires fair values measurement as explained in the accounting policies below.
c) Functional and presentation currency
These financial statements are presented in Canadian dollars, which is the Corporation’s functional currency. All financial information presented in Canadian dollars has been rounded to the nearest thousand in the Corporation’s financial statements and rounded to the nearest million in the notes to the financial statements.
15
80
00 / 00 Financial Statements | Notes to the Financial Statements
3. New and Revised IFRS Issued but not yet Effective
Other than those disclosed in Note 4 of the Corporation’s financial statements for the year ended December 31, 2020, new standards, amendments and interpretations were issued by the IASB or the Interpretations Committee that could have a possible effect on the Corporation in the future. The IASB issued amendments to the following standards, which are effective for annual periods beginning on or after January 1, 2022. Early application is permitted.
Amendments to IAS 1 Classification of Liabilities as Current or Non-current
Amendments to IFRS 3 Reference to the Conceptual Framework
Amendments to IAS 16 Property, Plant and Equipment – Proceeds before Intended Use
Amendments to IAS 37 Onerous Contracts – Cost of Fulfilling a Contract
Annual Improvements to IFRS Standards 2018-2020 Cycle: Amendments to: IFRS 1 First-time Adoption of International Financial Reporting Standards and IFRS 9 Financial Instruments
Management is currently assessing the impact of adopting these amendments on the Corporation’s financial statements.
4. Summary of Significant Accounting Policies
The significant accounting policies followed by the Corporation are summarized as follows:
a) Funding from the Government of Canada
Operating funding, which pertains to services, activities and other undertakings of the Corporation for the management and operation of railway passenger services in Canada, is recorded as a reduction of the operating loss. The funding is determined on the basis of operating expenses less revenues excluding unrealized gains and losses on financial instruments, non-cash employee benefits, non-cash transactions relating to property, plant and equipment, right-of-use assets, intangible assets, lease liabilities, deferred income taxes, adjustment for accrued compensation and adjustment for VIA Préférence loyalty program and is based on the operating budget approved by the Government of Canada for each year.
Funding for depreciable property, plant and equipment and intangible assets is recorded as deferred capital funding in the Statement of Financial Position and is amortized on the same basis and over the same periods as the funded depreciable property, plant and equipment and intangible assets. Upon disposal of the funded depreciable property, plant and equipment and intangible assets, the Corporation recognizes into net income all remaining deferred capital funding related to the relevant assets.
Funding for non-depreciable property, plant and equipment is recorded as deferred capital funding in the Statement of Financial Position and is amortized on the same basis and over the same periods as the related depreciable property, plant and equipment.
16
80
00 / 00 Financial Statements | Notes to the Financial Statements
4. Summary of Significant Accounting Policies (cont’d)
b) Revenue recognition
i) Passenger revenues
Revenue related to train services is recorded as deferred revenue until the transportation service has been provided. The service is rendered to the customer as the train journey is made. The performance obligation is satisfied over time. The customer simultaneously receives and consumes the benefits provided by the Corporation’s performance as the Corporation performs the train service.
For sales of on-train food and beverages and other revenues, revenues are recognized when control of the goods has transferred, being at the point the customer purchases the goods.
The Corporation offers its customers the opportunity to earn points in a loyalty program. This program allows customers to purchase additional services – future train tickets from the accumulated VIA Préférence points. The Corporation considers that the awarding of points gives rise to a performance obligation separate from the purchase of the train ticket, since they confer on the customer a significant right to which he would not have been entitled if he had not bought a train ticket. The customer pays in advance for future services. The consideration received in respect of ticket sales is split between the points awarded under the VIA Préférence loyalty program and the passenger transportation services. The amount allocated to the loyalty program is based on the probability of the awards being converted into train tickets. The probability is reviewed at the end of each annual reporting period. Revenue related to loyalty program points is recognized as deferred revenue until it is exchanged for train tickets. When points are redeemed, the proceeds are determined by the number of points redeemed in exchange for train tickets.
ii) Other revenues
Investment income and third-party servicing
Investment income are recognized as they are earned. For third-party servicing, the customer simultaneously receives and consumes the benefits provided by the Corporation’s performance as the Corporation performs the third-party services.
Rental income and other
The Corporation enters into lease agreements as a lessor with respect to some of its stations and installations. Leases for which the Corporation is a lessor are classified as finance or operating leases. Whenever the terms of the lease transfer substantially all the risks and rewards of ownership to the lessee, the contract is classified as finance lease. All other leases are classified as operating leases. Rental income from operating leases is recognized on a straight-line basis over the term of the relevant lease. For rental income and other revenues, the customer simultaneously receives and consumes the benefits provided by the Corporation’s performance as the Corporation performs the rental services. The change in fair value of financial instruments at FVTPL that are not derivative financial instruments is recognized in other revenues.
17
80
00 / 00 Financial Statements | Notes to the Financial Statements
4. Summary of Significant Accounting Policies (cont’d)
c) Materials
Materials, consisting primarily of items used for the maintenance of rolling stock, are valued at the lower of cost and net realizable value. The cost is determined using the weighted average method and net realizable value is defined as the replacement cost. Materials are presented net of the related obsolescence provision.
d) Property, Plant and Equipment
Property, plant and equipment are recorded at the cost, less accumulated depreciation and any accumulated impairment losses. The cost includes all expenditures directly attributable to the acquisition of the asset.
Projects in progress are recorded at cost and include direct costs of construction, materials, direct labour and overhead.
When major components of an item of property, plant and equipment have different useful lives, they are accounted for as separate items of property, plant and equipment and are depreciated over their respective useful lives.
Maintenance and repair costs are recognized as follows:
i) Rolling stock:
Maintenance expenses incurred during the useful life of equipment (regular maintenance activities to maintain the asset in a good condition) are recorded as operating expenses.
The cost of periodic major overhaul programs is capitalized as a separate component and depreciated over its expected useful life.
ii) Fixed installations:
Maintenance and repair expenses (technical inspections, maintenance contracts, etc.) are recorded as operating expenses.
The costs of periodic major building repair programs are capitalized as a separate component and depreciated over its expected useful life.
Depreciation of property, plant and equipment is calculated on a straight-line basis, from the date they are available for use, at rates sufficient to depreciate the cost of property, plant and equipment, less their residual value, over their estimated useful lives except for leasehold improvements related to the lease of buildings and stations where the depreciation period is the shorter of the lease term or its estimated useful life.
18
80
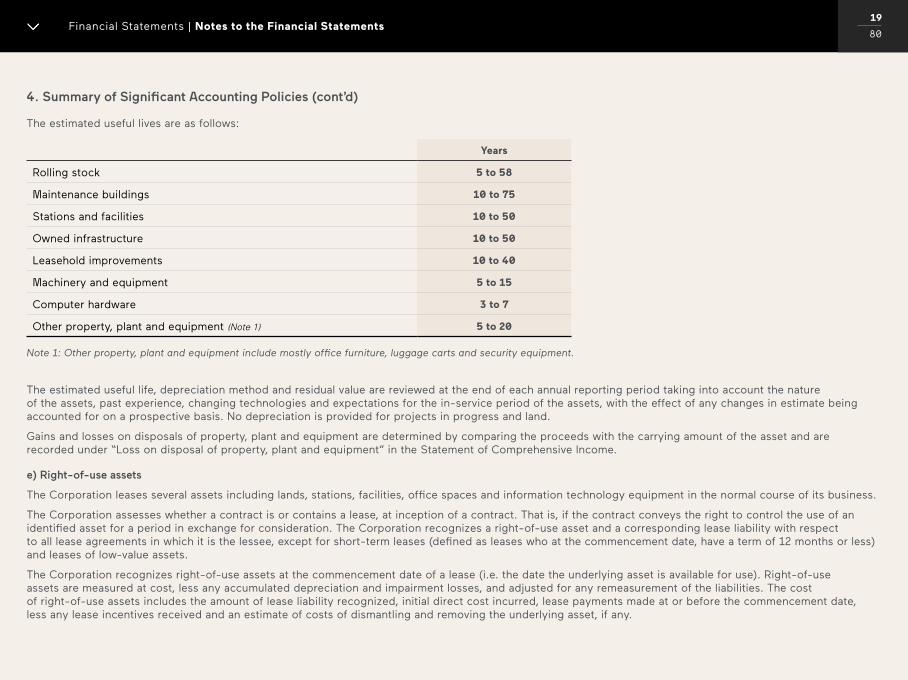
00 / 00 Financial Statements | Notes to the Financial Statements
4. Summary of Significant Accounting Policies (cont’d)
The estimated useful lives are as follows:
Years
Rolling stock 5 to 58
Maintenance buildings 10 to 75
Stations and facilities 10 to 50
Owned infrastructure 10 to 50
Leasehold improvements 10 to 40
Machinery and equipment 5 to 15
Computer hardware 3 to 7
Other property, plant and equipment (Note 1) 5 to 20
Note 1: Other property, plant and equipment include mostly office furniture, luggage carts and security equipment.
The estimated useful life, depreciation method and residual value are reviewed at the end of each annual reporting period taking into account the nature of the assets, past experience, changing technologies and expectations for the in-service period of the assets, with the effect of any changes in estimate being accounted for on a prospective basis. No depreciation is provided for projects in progress and land.
Gains and losses on disposals of property, plant and equipment are determined by comparing the proceeds with the carrying amount of the asset and are recorded under “Loss on disposal of property, plant and equipment” in the Statement of Comprehensive Income.
e) Right-of-use assets
The Corporation leases several assets including lands, stations, facilities, office spaces and information technology equipment in the normal course of its business.
The Corporation assesses whether a contract is or contains a lease, at inception of a contract. That is, if the contract conveys the right to control the use of an identified asset for a period in exchange for consideration. The Corporation recognizes a right-of-use asset and a corresponding lease liability with respect to all lease agreements in which it is the lessee, except for short-term leases (defined as leases who at the commencement date, have a term of 12 months or less) and leases of low-value assets.
The Corporation recognizes right-of-use assets at the commencement date of a lease (i.e. the date the underlying asset is available for use). Right-of-use assets are measured at cost, less any accumulated depreciation and impairment losses, and adjusted for any remeasurement of the liabilities. The cost of right-of-use assets includes the amount of lease liability recognized, initial direct cost incurred, lease payments made at or before the commencement date, less any lease incentives received and an estimate of costs of dismantling and removing the underlying asset, if any.
19
80
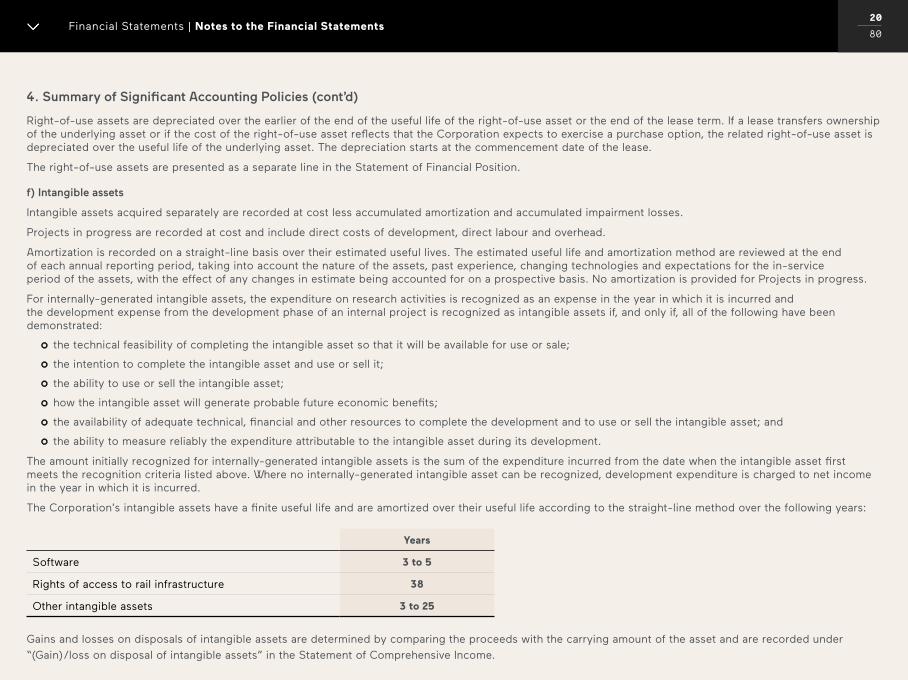
00 / 00 Financial Statements | Notes to the Financial Statements
4. Summary of Significant Accounting Policies (cont’d)
Right-of-use assets are depreciated over the earlier of the end of the useful life of the right-of-use asset or the end of the lease term. If a lease transfers ownership of the underlying asset or if the cost of the right-of-use asset reflects that the Corporation expects to exercise a purchase option, the related right-of-use asset is depreciated over the useful life of the underlying asset. The depreciation starts at the commencement date of the lease.
The right-of-use assets are presented as a separate line in the Statement of Financial Position.
f) Intangible assets
Intangible assets acquired separately are recorded at cost less accumulated amortization and accumulated impairment losses.
Projects in progress are recorded at cost and include direct costs of development, direct labour and overhead.
Amortization is recorded on a straight-line basis over their estimated useful lives. The estimated useful life and amortization method are reviewed at the end of each annual reporting period, taking into account the nature of the assets, past experience, changing technologies and expectations for the in-service period of the assets, with the effect of any changes in estimate being accounted for on a prospective basis. No amortization is provided for Projects in progress.
For internally-generated intangible assets, the expenditure on research activities is recognized as an expense in the year in which it is incurred and the development expense from the development phase of an internal project is recognized as intangible assets if, and only if, all of the following have been demonstrated:
the technical feasibility of completing the intangible asset so that it will be available for use or sale;
the intention to complete the intangible asset and use or sell it;
the ability to use or sell the intangible asset;
how the intangible asset will generate probable future economic benefits;
the availability of adequate technical, financial and other resources to complete the development and to use or sell the intangible asset; and
the ability to measure reliably the expenditure attributable to the intangible asset during its development.
The amount initially recognized for internally-generated intangible assets is the sum of the expenditure incurred from the date when the intangible asset first meets the recognition criteria listed above. Where no internally-generated intangible asset can be recognized, development expenditure is charged to net income in the year in which it is incurred.
The Corporation’s intangible assets have a finite useful life and are amortized over their useful life according to the straight-line method over the following years:
Years
Software 3 to 5
Rights of access to rail infrastructure 38
Other intangible assets 3 to 25
Gains and losses on disposals of intangible assets are determined by comparing the proceeds with the carrying amount of the asset and are recorded under
“(Gain)/loss on disposal of intangible assets” in the Statement of Comprehensive Income.
20
80
00 / 00 Financial Statements | Notes to the Financial Statements
4. Summary of Significant Accounting Policies (cont’d)
g) Impairment of non-financial assets
The Corporation reviews at each Statement of Financial Position date whether there is any indication of impairment (obsolescence, physical deterioration, significant changes in the method of utilisation, performances falling short of forecasts, decline in revenues, other external indicators) or reversal of impairment loss. Non-financial assets are considered to be impaired when there is objective evidence that, as a result of one or more events that occurred after the initial recognition of the non-financial asset, the asset’s carrying amount exceeds its recoverable amount. If there are indicators of impairment present, the asset’s recoverable amount is estimated. Assets that are not yet available for use are tested for impairment at every reporting period regardless of whether an indicator exists.
The recoverable amount of an asset is the greater of its value in use and its fair value less costs of disposal. The fair value is determined using the current replacement cost. The value in use is determined by the estimated present value of future cash flows generated by the asset.
The carrying amount of the Corporation’s property, plant and equipment, right-of-use assets and intangible assets are reviewed at the cash-generating unit (CGU) level to determine whether there is any indication of impairment. For the purpose of impairment testing, a CGU is the smallest group of assets that generates cash inflows from continuing use that are largely independent of the cash inflows of other assets or group of assets. Assets are tested at the CGU level when they cannot be tested individually.
Under the Corporation’s business model, no assets are considered to generate cash flows that are largely independent of the cash flows of other assets and liabilities. Instead, all assets interact to create the passenger train service which include property, plant and equipment, right-of-use assets and intangible assets. These operations are funded by parliamentary appropriations, revenues from passengers and revenues from other sources. Overall levels of cash flows reflect public policy requirements and decisions. They reflect budgetary funding provided to the Corporation in its entirety.
An impairment loss is recognized in net income and calculated as the difference between the carrying amount and the recoverable amount.
When there is a reversal of impairment loss, the carrying amount of the asset is increased to the lower of the recoverable amount and the carrying amount (net of depreciation or amortization) that the asset would have had if previous impairment loss had not been recognized. The reversal of impairment loss is recognized in the Statement of Comprehensive Income.
21
80
00 / 00 Financial Statements | Notes to the Financial Statements
4. Summary of Significant Accounting Policies (cont’d)
h) Lease liabilities
The Corporation as a lessee:
The Corporation recognizes at the commencement date of the lease, a lease liability which is initially measured at the present value of the lease payments that are not paid at the commencement date, discounted by using the lease’s implicit rate. If this rate cannot be readily determined, the Corporation uses the incremental borrowing rate.
Lease payments included in the measurement of the lease liability are:
Fixed lease payments (including in-substance fixed payments), less any lease incentives receivable;
Variable lease payments that depend on an index or rate, initially measured using the index or rate at the commencement date;
The amount expected to be payable by the lessee under residual value guarantees;
The exercise price of purchase options, if the lessee is reasonably certain to exercise the options; and
Payments of penalties for terminating the lease, if the lease term reflects the exercise of an option to terminate the lease.
Variable lease payments that do not depend on an index or a rate are recognized as expenses in the period in which the event or condition that triggers the payment occurs.
In calculating the present value of lease payments, the Corporation uses its incremental borrowing rate at the lease commencement date because the interest rate implicit in the lease is not readily determinable.
The Corporation recognizes non-lease components as expenses and record these expenses on a straight-line basis.
The lease liability is presented as a separate line in the Statement of Financial Position.
The lease liability is subsequently measured by increasing the carrying amount to reflect interest on the lease liability (using the effective interest rate method) and by reducing the carrying amount to reflect the lease payments made.
The Corporation remeasures the lease liability and makes a corresponding adjustment to the related right-of-use asset whenever:
The lease term has changed or there is a change in the assessment of exercise of a purchase option, in which case the lease liability is remeasured by discounting the revised lease payments using a revised discount rate;
The lease payments change due to variations in an index or rate or a change in expected payment under a guaranteed residual value, in which cases the lease liability is remeasured by discounting the revised lease payments using the initial discount rate (unless the lease payments change due to fluctuations in a floating interest rate, in which case a revised discount rate is used); and
A lease contract is modified, and the lease modification is not accounted for as a separate lease, in which case the liability is remeasured by discounting the revised lease payments using a revised discount rate.
The Corporation’s accounting policies as a lessor are describe in Note 4 b) Revenue recognition ii) Rental income and other.
22
80
00 / 00 Financial Statements | Notes to the Financial Statements
4. Summary of Significant Accounting Policies (cont’d)
Short-term leases and leases of low-value assets
The Corporation applies the short-term lease recognition exemption to its short-term leases (i.e. those with a lease term of 12 months or less from the commencement date and who do not contain a purchase option). The Corporation also applies the low-value asset recognition exemption to leases that are considered of low value (such as point-of-sale terminal). For these leases, the Corporation recognizes the lease payments as an operating expense on a straight-line basis over the term of the lease unless another systematic basis is more representative of the time pattern in which economic benefits from the leased asset are consumed.
i) Provisions and contingencies
Provisions, including provisions for legal litigations, restructuring and environmental issues, are recognized when it becomes probable that a present obligation (legal or constructive) resulting from a past event will require a settlement and when the amount can be estimated reliably.
The amount recognized as a provision is the best estimate of the consideration required to settle the present obligation at the Statement of Financial Position date, taking into account the risks and uncertainties surrounding the obligation. Where a provision is measured using the cash flows estimated to settle the present obligation, its carrying amount is the present value of those cash flows.
Contingent liabilities are not recognized in the Statement of Financial Position, unless they meet the criteria of a provision. Contingent liabilities may arise from uncertainty as to the existence of a liability or represent an existing liability in respect of which settlement is not probable or the amount cannot be reliably measured. These contingent liabilities are disclosed in the notes.
When some or all of the economic benefits required to settle a provision are expected to be recovered from a third party, the receivable is recognized as an asset if it is virtually certain that reimbursement will be received, and the amount of the receivable can be measured reliably.
The provision for litigations is determined on a case by case basis by the legal service group of the Corporation. External consultants are solicited for the most significant and complex litigations.
A restructuring provision is recognized when the Corporation has developed a detailed formal plan for the restructuring and has raised a valid expectation that it will carry out the restructuring by starting to implement the plan or announcing its main features to the affected employees. The measurement of a restructuring provision includes only the direct expenditures, mainly severance costs, arising from the restructuring, which are those amounts that are both necessarily entailed by the restructuring and not associated with the ongoing activities of the Corporation.
The environmental provision includes estimated costs to meet Government standards and regulations when such costs can be reasonably estimated. Estimates of the anticipated future costs for remediation work are based on the Corporation’s prior experience.
j) Income taxes
The Corporation utilizes the asset and liability method of accounting for taxes under which deferred income tax assets and liabilities are recognized for the estimated future tax consequences attributable to differences between the financial statement carrying amount and the tax basis of assets and liabilities. Deferred income tax assets and liabilities are measured using enacted or substantively enacted tax rates that are expected to apply for the year in which those temporary differences are expected to be recovered or settled. The effect on deferred income tax assets and liabilities of a change in tax rates is recognized in net income in the year based on tax rates that have been enacted, or substantially enacted, by the end of the reporting period. Deferred income tax assets are recognized to the extent that realization is considered probable.
23
80
00 / 00 Financial Statements | Notes to the Financial Statements
4. Summary of Significant Accounting Policies (cont’d)
k) Employee benefits
i) Pension plans
Employer contributions related to the defined contribution component of the pension plan are recognized as an expense when employees render the service entitling them to the contributions.
The Corporation’s obligations for the defined benefit component of the pension plans as well as for other post-employment benefits are actuarially determined using the projected unit credit method and management’s best estimate. The present value of the defined benefit obligations is calculated using discount rates based on an interest rate curve that represents the yields on corporate AA bonds. The CIA’s calculation model establishes the rates for longer maturities by extrapolating the yield curve to maturity of AA-rated corporate bonds based on the observed relationship between the yields of AA-rated corporate bonds or A-rated corporate bonds and those of provincial AA-rated bonds in the medium-term maturity range. This relationship is then transposed to the universe of provincial AA-rated bonds with longer maturities to extrapolate the bond yields of AA-rated corporate bonds.
The Corporation determines the net interest expense on the net defined benefit liability for the year by applying the discount rate used to measure the defined obligation at the beginning of the year to the net defined benefit liability.
The current service costs, the net interest expense on the net defined benefit liability, the gains and losses on curtailment or settlement and plan amendments are recognized in net income in the year they are incurred.
Remeasurements arising from defined benefit plans comprised of changes in demographic assumptions, changes in financial assumptions, experience adjustments and the return on plan assets excluding amounts included in net interest on the net defined benefit liability are recognized in other comprehensive income (loss) in the year they are incurred.
ii) Post-employment benefits
Post-employment benefits include post-retirement medical and life insurance benefits.
Remeasurements arising from post-employment benefit plans comprised of changes in demographic assumptions, changes in financial assumptions and experience adjustments are recognized in other comprehensive income (loss) in the year they are incurred.
24
80
00 / 00 Financial Statements | Notes to the Financial Statements
4. Summary of Significant Accounting Policies (cont’d)
iii) Employment benefits other than post-employment benefits
The Corporation provides employment benefits other than post-employment benefits as follows:
Compensation and short-term employee benefits include the annual salary, performance bonuses, paid vacations not included in the annual salary, short-term sick leave, health, dental and life insurance benefits. These benefits are measured on an undiscounted basis and are expensed as the related service is provided.
Long-term employee benefits include workers’ compensation benefits as well as long-term disability benefits and continuation of benefit coverage for employees on long-term disability.
The actuarial obligation for workers’ compensation benefits is calculated on an event driven basis. The method involves dividing the obligation into two distinct components: awarded pensions and future awards. The actuarial obligation for awarded pensions is the actuarial present value of all future projected payments for the award determined as at the valuation date. The actuarial obligation for future awards is the discounted value of expected cash flow for awards yet to be made. The Corporation is self-insured for its workers’ compensation benefits.
The actuarial obligation for other long-term disability benefits and continuation of benefit coverage for employees on long-term disability is calculated on an event driven basis. This method incorporates management’s best estimate of cost escalation as well as demographic and other financial assumptions.
Actuarial gains and losses and other changes in the Corporation’s obligations are recognized in net income in the year in which they arise.
Termination benefits include benefits that are payable when an employment contract is terminated before the normal retirement date. They are recognized as a liability and expense for termination benefits at the earlier of the following dates:
(a) when the Corporation can no longer withdraw the offer of those benefits; and
(b) when the Corporation recognizes costs for a restructuring (provision) and involves the payment of termination benefits.
Other long-term employee benefits include job security benefits administered by various union agreements. These benefits are calculated on an event driven basis and represents management’s best estimates of the present value of all future projected payments to unionized employees.
25
80
00 / 00 Financial Statements | Notes to the Financial Statements
4. Summary of Significant Accounting Policies (cont’d)
l) Financial instruments
Financial assets and liabilities are recognized when the Corporation becomes a party to the contractual provisions of the instrument. They are initially measured at fair value.
i) Financial assets
Classification and measurement
Financial assets are measured at fair value at initial recognition, and subsequently measured at amortized cost, fair value through other comprehensive income (FVTOCI) or at fair value through profit or loss (FVTPL).
The classification of a financial assets at initial recognition depends on the financial asset’s contractual cash flows characteristics and the Corporation’s business model for managing them. With the exception for trade and other receivables that do not contain a significant financing component for which the Corporation has applied the practical expedient, the Corporation measures a financial asset at its fair value plus, in the case of a financial asset not at FVTPL, transaction costs. Transaction costs directly attributable to the acquisition of financial assets at FVTPL are recognized immediately in net income.
For a financial asset to be classified and measured at amortized cost or FVTOCI, it needs to give rise to cash flows that are “solely payments of principal and interest” on the principal amount outstanding. This assessment is performed at an instrument level.
Financial assets that do not give rise to cash flows that are “solely payments of principal and interest” are classified and measured at FVTPL.
The Corporation’s business model for managing financial assets refers to how it manages its financial assets to generate cash flows. The business model determines whether cash flows will result from collecting contractual cash flows, selling the financial assets, or both.
Purchases or sales of financial assets that require delivery of assets within a time frame established by regulation or convention in the market place (regular way trades) are recognized on the trade date, i.e., the date that the Corporation commits to purchase or sell the asset.
Subsequent measurement
For purposes of subsequent measurement, financial assets are classified in four categories:
Financial assets at amortized cost;
Financial assets at FVTOCI with recycling of cumulative gains and losses;
Financial assets designated at FVTOCI with no recycling of cumulative gains and losses upon derecognition;
Financial assets at FVTPL.
26
80
00 / 00 Financial Statements | Notes to the Financial Statements
4. Summary of Significant Accounting Policies (cont’d)
Financial assets at amortized cost
This category is the most relevant for the Corporation. The Corporation measures financial assets at amortized cost if both of the following conditions are met:
The financial asset is held within a business model with the objective to hold financial assets to collect contractual cash flows and,
The contractual terms of the financial asset give rise on specified dates to cash flows that are solely payments of principal and interest on the principal amount outstanding.
Financial assets at amortized cost are subsequently measured using the effective interest method and are subject to impairment. Gains and losses are recognized in net income when the asset is derecognized, modified or impaired.
The Corporation’s financial assets at amortized cost includes cash, trade and other receivables, current advance to third parties and Asset Renewal Fund.
Financial assets at FVTOCI
The Corporation measures a financial asset at FVTOCI if both of the following conditions are met:
The financial asset is held within a business model with the objective of both holding to collect contractual cash flows and selling and,
The contractual terms of the financial asset give rise on specified dates to cash flows that are solely payments of principal and interest on the principal amount outstanding.
For financial assets at FVTOCI, interest income, foreign exchange revaluation and impairment losses or reversals are recognized in net income and computed in the same manner as for financial assets measured at amortized cost. The remaining fair value changes are recognized in OCI. Upon derecognition, the cumulative fair value change recognized in OCI is recycled to net income.
In the current period, the Corporation has no financial assets at FVTOCI.
Financial assets at FVTPL
Financial assets that do not meet the criteria necessary to be measured at amortized cost or at FVTOCI are measured at FVTPL. More precisely financial assets at FVTPL are financial assets held for trading or financial assets designated upon initial recognition at FVTPL. Financial assets are classified at FVTPL if they are acquired for selling or repurchasing in the near term. Derivative financial instruments are also classified as held for trading unless they are designated as effective hedging instruments. Financial assets with cash flows that are not solely payments of principal and interest are classified and measured at FVTPL, irrespective of the business model. Notwithstanding the criteria for financial assets to be classified at amortized cost or at FVTOCI, as described above, financial assets may be designated at FVTPL on initial recognition if doing so eliminates, or significantly reduces, an accounting mismatch.
Financial assets at FVTPL are carried in the Statement of Financial Position at fair value with net changes in fair value recognized in net income.
The Corporation’s financial assets at FVTPL includes derivative financial instruments.
27
80
00 / 00 Financial Statements | Notes to the Financial Statements
4. Summary of Significant Accounting Policies (cont’d)
Derecognition
A financial asset is primarily derecognized i.e. removed from the Corporation’s Statement of Financial Position when:
The rights to receive cash flows from the asset have expired, or
The Corporation has transferred its rights to receive cash flows from the asset or has assumed an obligation to pay the received cash flows in full without material delay to a third party under a “pass-through” arrangement; and either the Corporation has transferred substantially all the risks and rewards of the asset, or the Corporation has neither transferred nor retained substantially all the risks and rewards of the asset, but has transferred control of the asset.
Impairment of financial assets
The Corporation recognizes a loss allowance for expected credit losses (ECLs) for all financial assets not held at FVTPL. ECLs are based on the difference between the contractual cash flows due in accordance with the contract and all the cash flows that the Corporation expects to receive, discounted at an approximation of the original effective interest rate. The expected cash flows will include cash flows from the sale of collateral held or other credit enhancements that are integral to the contractual terms.
ECLs are recognized in two stages. For credit exposures for which there has not been a significant increase in credit risk since initial recognition, ECLs are provided for credit losses that result from default events that are possible within the next 12-months (a 12-month ECL). For those credit exposures for which there has been a significant increase in credit risk since initial recognition, a loss allowance is required for credit losses expected over the remaining life of the exposure, irrespective of the timing of the default (a lifetime ECL).
For trade and other receivables, the Corporation applies a simplified approach in calculating ECLs which is possible under IFRS 9 when certain conditions apply. The Corporation uses the practical expedient and need not to adjust the promised amount of consideration for the effects of a significant financing component if the Corporation expects, at contract inception, that the period between when the Corporation performs the service to a customer and when the customer pays for that service will be one year or less. Therefore, the Corporation does not track changes in credit risk, but instead recognizes a loss allowance based on lifetime ECLs at each reporting date. The Corporation has established a loss allowance matrix that is based on past default experience of the debtor, adjusted as appropriate to reflect current conditions and estimates of future economic conditions. Amounts considered uncollectible are written off and are included in the “Other” expenses line item in the Statement of Comprehensive Income. The Corporation do not recognize an ECL for cash and Asset Renewal Fund as they comprise solely of cash.
28
80
00 / 00 Financial Statements | Notes to the Financial Statements
4. Summary of Significant Accounting Policies (cont’d)
ii) Financial liabilities
Initial recognition and measurement
Financial liabilities are classified, at initial recognition, and subsequently measured at amortized cost or at FVTPL.
All financial liabilities are recognized initially at fair value.
The Corporation financial liabilities include trade and other payables, lease liabilities, derivative financial instruments and other payables.
Subsequent measurement
The measurement of financial liabilities depends on their classification, as described below:
Other financial liabilities at amortized cost
A financial liability that is not a contingent consideration from an acquirer in a business combination, held for trading, or designated at FVTPL is subsequently measured at amortized cost using the effective interest rate method.
Gains and losses are recognized in net income when the financial liabilities are derecognized as well as through the effective interest rate method amortization process.
Amortized cost is calculated by considering any discount or premium on acquisition and fees or costs that are an integral part of the effective interest rate method.
The Corporation’s liabilities at amortized cost includes trade and other payables, lease liabilities and other payables.
Financial liabilities measured at FVTPL
Financial liabilities at FVTPL include financial liabilities that are incurred for repurchasing in the near term and financial liabilities designated upon initial recognition as at FVTPL.
Financial liabilities classified as FVTPL also includes derivative financial instruments entered by the Corporation that are not designated as hedging instruments in hedge relationships as defined by IFRS 9. Separated embedded derivatives are also classified as FVTPL unless they are designated as effective hedging instruments.
Gains or losses on financial liabilities classified at FVTPL are recognized in net income.
The Corporation’s financial liabilities at FVTPL include derivative financial instruments.
Derecognition
A financial liability is derecognized when the obligation under the liability is discharged or cancelled or expires. When an existing financial liability is replaced by another from the same lender on substantially different terms, or the terms of an existing liability are substantially modified, such an exchange or modification is treated as the derecognition of the original liability and the recognition of a new liability. The difference in the respective carrying amounts is recognized in net income.
29
80
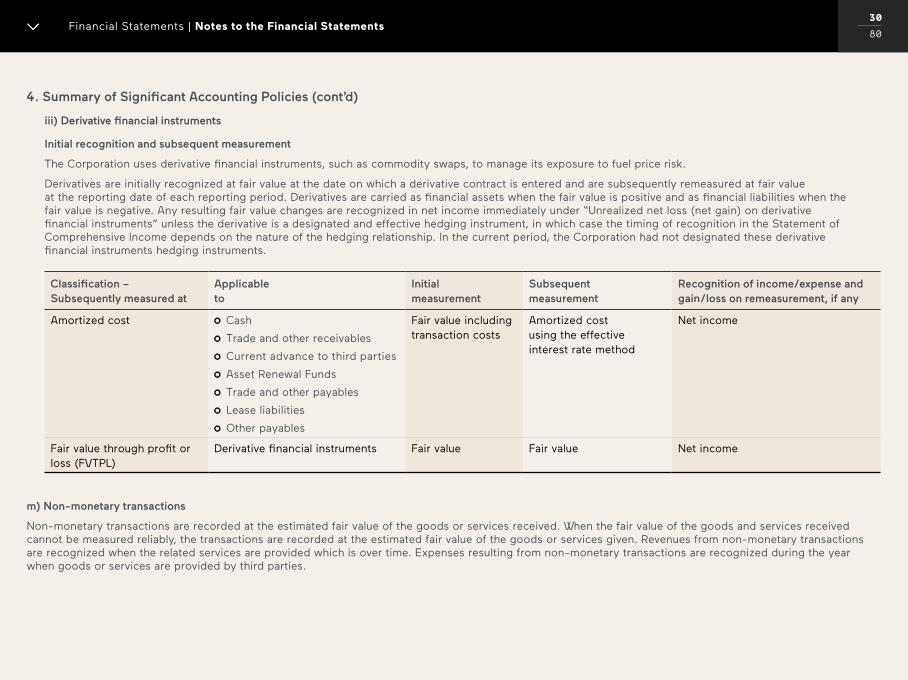
00 / 00 Financial Statements | Notes to the Financial Statements
4. Summary of Significant Accounting Policies (cont’d)
iii) Derivative financial instruments
Initial recognition and subsequent measurement
The Corporation uses derivative financial instruments, such as commodity swaps, to manage its exposure to fuel price risk.
Derivatives are initially recognized at fair value at the date on which a derivative contract is entered and are subsequently remeasured at fair value at the reporting date of each reporting period. Derivatives are carried as financial assets when the fair value is positive and as financial liabilities when the fair value is negative. Any resulting fair value changes are recognized in net income immediately under “Unrealized net loss (net gain) on derivative financial instruments” unless the derivative is a designated and effective hedging instrument, in which case the timing of recognition in the Statement of Comprehensive Income depends on the nature of the hedging relationship. In the current period, the Corporation had not designated these derivative financial instruments hedging instruments.
Classification – Subsequently measured at
Applicable to
Initial measurement
Subsequent measurement
Recognition of income/expense and gain/loss on remeasurement, if any
Amortized cost Cash
Trade and other receivables
Current advance to third parties
Asset Renewal Funds
Trade and other payables
Lease liabilities
Other payables
Fair value including transaction costs
Amortized cost using the effective interest rate method
Net income
Fair value through profit or loss (FVTPL)
Derivative financial instruments Fair value Fair value Net income
m) Non-monetary transactions
Non-monetary transactions are recorded at the estimated fair value of the goods or services received. When the fair value of the goods and services received cannot be measured reliably, the transactions are recorded at the estimated fair value of the goods or services given. Revenues from non-monetary transactions are recognized when the related services are provided which is over time. Expenses resulting from non-monetary transactions are recognized during the year when goods or services are provided by third parties.
30
80
00 / 00 Financial Statements | Notes to the Financial Statements
5. Key Sources of Estimation Uncertainty and Critical Judgments
In the application of the Corporation accounting policies, management is required to make certain judgments, estimates and assumptions that affect the reported amounts of revenues, expenses, assets and liabilities, and the disclosure of contingent liabilities, at the reporting date. They are reviewed on an ongoing basis. Changes to accounting estimates are recognized in the period in which the estimates are revised and in any future period affected. Uncertainty about these judgments, assumptions and estimates could results in outcomes that require a material adjustment to the carrying amount of assets or liabilities affected in future periods.
Other disclosure relating to the Corporation’s exposure to risks and uncertainties are include in Financial risks (Note 28).
Judgments
In the process of applying the Corporation’s accounting policies, management has made the following judgments, which have the most significant effect on the amounts recognized in the financial statements.
a) Determining the lease term of contracts with renewal and termination options
When the Corporation recognizes a lease as a lessee, it assesses the lease term based on the conditions of the lease. The lease term is the non-cancellable term of the lease, together with any periods covered by an option to extend the lease if it is reasonably certain to be exercised, and any periods covered by an option to terminate the lease, if it is reasonably certain not to be exercised. The Corporation has several lease contracts that include extension and termination options. The Corporation applies judgement in evaluating whether it is reasonably certain whether or not to exercise the option to renew or terminate the lease. That is, it considers all relevant factors that create an economic incentive for it to exercise either the renewal or termination. After the commencement date, the Corporation reassesses the lease term if there is a significant event or change in circumstances that is within its control and affects its ability to exercise or not to exercise the option to renew or to terminate. As such, a change in the assumption used could result in a significant impact in the amount recognized as right-of-use asset and lease liability, as well as in the amount of depreciation of right-of-use asset and interest expense on lease liability.
Refer to Note 18 for information on potential future rental payments relating to periods following the exercise date of extension and termination options that are not included in the lease term.
b) Determining the value of the projects in progress
Management uses judgement in determining the percentage of completion of the projects in progress as well as the value of the activities performed for these projects in progress. Management reviews progress of these projects on a regular basis. Percentage of completion and value of the projects in progress reflect management’s best assessment and are assessed by taking in consideration all information available at the reporting date. Actual amounts of projects in progress could differ from best assessment of management. Differences from estimates and actual amount is eliminated once projects in progress are completed and transferred to property, plant and equipment as actual completion would be known.
31
80
00 / 00 Financial Statements | Notes to the Financial Statements
5. Key Sources of Estimation Uncertainty and Critical Judgments (cont’d)
Estimates and assumptions
The key assumptions concerning the future and other key sources of estimation uncertainty at the reporting date, that have a significant risk of causing a material adjustment to the carrying amounts of assets and liabilities within the next financial year, are described below. The Corporation based its assumptions and estimates on parameters available when the financial statements were prepared. Estimates and assumptions are based on historical experience and other factors, including expectations of future events that are believed to be reasonable under the circumstances. Existing circumstances and assumptions about future developments, however, may change due to market changes or circumstances arising that are beyond the control of the Corporation.
a) Useful lives of depreciable assets
The key estimate used for Property, plant and equipment and intangible assets is their useful lives. When determining the expected useful lives of these assets, management takes into account the nature of the assets, past experience, changing technologies and expectations for the in-service period of the assets. Management reviews the useful lives of depreciable assets annually. As at December 31, 2020, management assessed that the revised useful lives represent the expected utility of the assets to the Corporation. The impact of the revised useful lives is presented in Note 15.
b) VIA Préférence Loyalty Program
The VIA Préférence loyalty program allows members to acquire “award points” as they travel on the train. These award points entitle members to free travel on the Corporation’s trains. In determining the fair value of the award points recorded as deferred revenues, the Corporation takes into consideration the probability of the awards being converted into train tickets. The estimated probabilities on point redemption are based on management experience and on changing customer behavior and may not reflect the actual redemption rate in the future. Any significant changes in customers’ redemption patterns will impact the estimated redemption rate. As such, the amount allocated between the transportation service and the award points may have been significantly different if different probability estimates had been used.
The Corporation also estimates the stand-alone selling price of the loyalty points awarded under the VIA Préférence loyalty program. As points issued under the program are not sold to third parties, estimates of the stand-alone selling price are subject to significant uncertainty. The stand-alone selling price of the loyalty points awarded is based on the average points spent on train tickets and the average fares.
c) Post-employment and other employee benefits
Except for the defined contribution component of the pension plans, the cost of post-employment and other employee benefits and the present value of the related obligations are determined using actuarial valuations. The actuarial valuation involves making assumptions about discount rates used to measure the obligations, expected future salary increases, expected retirement age, expected mortality rates, expected health care cost trends, expected inflation and expected future pension increase. When determining these assumptions, management takes into account past experience, current market conditions and rates, and the expertise of its actuaries. Due to the complexities involved in the valuation and the long-term nature of these plans, such estimates are subject to significant uncertainty. All assumptions are reviewed at each reporting period. Actual results may differ from results that are estimated based on assumptions.
The parameter most subject to change is the discount rate. In determining the appropriate discount rate, management considers the interest rates of corporate bonds with at least an “AA” rating or above, as set by internationally recognized credit rating agency, and extrapolated as needed along the yield curve to correspond with the expected term of the defined benefit obligation. The underlying bonds are further reviewed for quality corporate bonds.
The mortality rate is based on publicly available mortality tables. Those mortality tables tend to change only at intervals in response to demographic changes.
Future salary increases and pension increases are based on expected future inflation rates.
A sensitivity analysis of key assumptions is presented in Note 22.
32
80
00 / 00 Financial Statements | Notes to the Financial Statements
5. Key Sources of Estimation Uncertainty and Critical Judgments (cont’d)
d) Income taxes
Management uses judgment and estimates in determining the appropriate rates and amounts in recording deferred income taxes, giving consideration to timing and probability of realization. Actual taxes could significantly vary from these estimates as a result of a variety of factors including future events, changes in income tax law or the outcome of reviews by tax authorities and related appeals. The Corporation has not recognized any deferred income tax assets on its deductible temporary differences and unused tax losses as it has determined that it is not probable that taxable profit will be available against which the deductible temporary differences and unused tax losses can be utilized. The resolution of these uncertainties and the associated final taxes may result in adjustments to the Corporation’s deferred and current income tax assets and liabilities.
e) Impairment of non-financial assets
Impairment exists when the carrying value of an asset or cash generating unit exceeds its recoverable amount, which is the higher of its fair value less costs of disposal and its value in use. The Corporation uses judgment in assessing, at each reporting date, whether there is any indication that non-financial assets may have lost value requiring the completion of an impairment test. These tests are designed, in part, to determine a recoverable amount, which is the fair value, based on current replacement cost, less costs of disposal. The current replacement cost and the costs of disposal calculations are based on management’s best estimates. Difference in estimates could materially affect the financial statements in determining both the impairment existence and the amount of impairment.
f) Provisions
Determining whether a past event should be recognized as a provision requires management to exercise judgment. The Corporation must determine if a present obligation arises from past events, if it is probable that the Corporation will be required to settle the obligation and if a reliable estimate can be made of the amount of the obligation. The decision is based on management’s experience and judgment. If the Corporation considers that one of the three conditions is not satisfied, it must still determine if a contingent liability should be disclosed in the notes, unless the possibility of any outflow in settlements is remote.
g) Lease liabilities: estimating the incremental borrowing rate
Accounting standards require the Corporation to discount the lease payments using the rate implicit in the lease if that rate is readily available. If that rate cannot be readily determined, the lessee is required to use its incremental borrowing rate (IBR). The Corporation cannot readily determine the interest rate implicit in its leases, therefore, it uses its incremental borrowing rate to measure lease liabilities. The IBR is the rate of interest that the Corporation would have to pay to borrow over a similar term, and with a similar security, the funds necessary to obtain an asset of a similar value to the right-of-use asset in a similar economic environment. The determination of the IBR requires the use of various assumptions which, if different than those being used, could result in a significant impact in the amount recognized as right-of-use asset and lease liability, as well as in the amount of depreciation of right-of-use asset and interest expense on lease liability. The Corporation estimates the IBR using observable inputs (such as market interest rates) when available and is required to make certain entity-specific estimates.
33
80
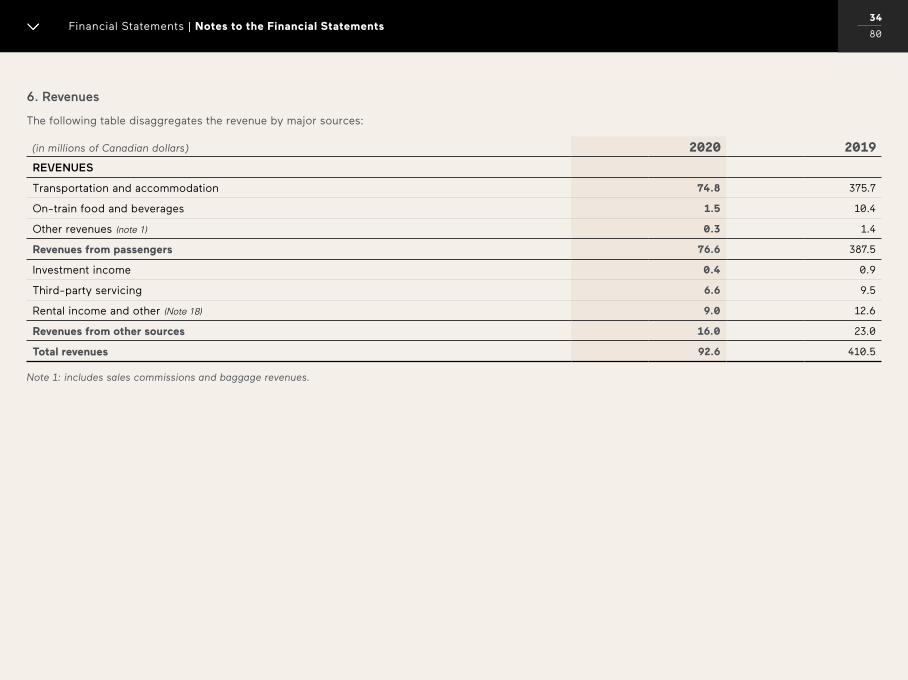
00 / 00 Financial Statements | Notes to the Financial Statements
6. Revenues
The following table disaggregates the revenue by major sources:
(in millions of Canadian dollars) 2020 2019
REVENUES
Transportation and accommodation 74.8 375.7
On-train food and beverages 1.5 10.4
Other revenues (note 1) 0.3 1.4
Revenues from passengers 76.6 387.5
Investment income 0.4 0.9
Third-party servicing 6.6 9.5
Rental income and other (Note 18) 9.0 12.6
Revenues from other sources 16.0 23.0
Total revenues 92.6 410.5
Note 1: includes sales commissions and baggage revenues.
34
80
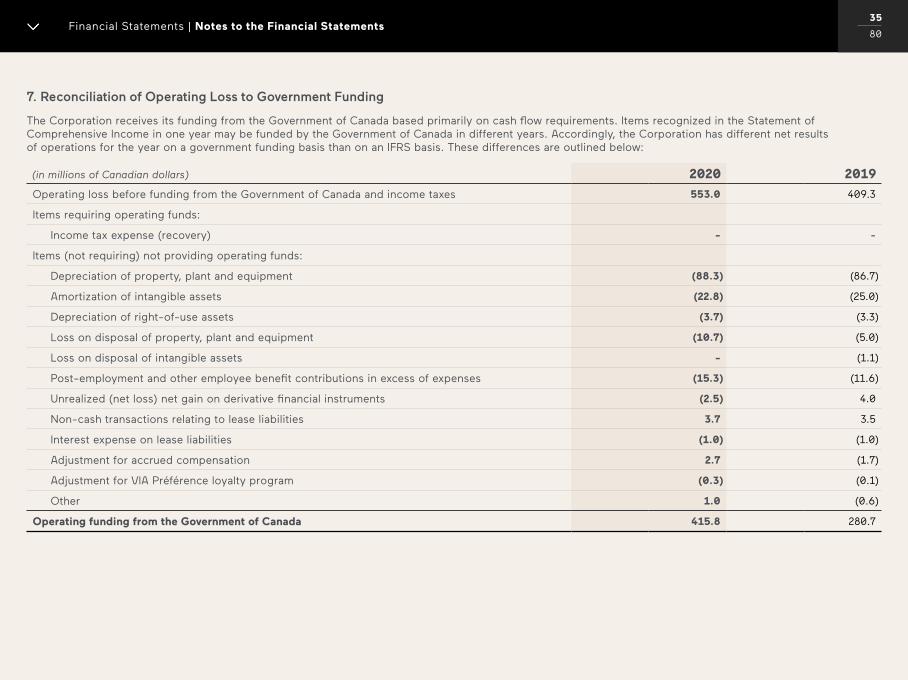
00 / 00 Financial Statements | Notes to the Financial Statements
7. Reconciliation of Operating Loss to Government Funding
The Corporation receives its funding from the Government of Canada based primarily on cash flow requirements. Items recognized in the Statement of Comprehensive Income in one year may be funded by the Government of Canada in different years. Accordingly, the Corporation has different net results of operations for the year on a government funding basis than on an IFRS basis. These differences are outlined below:
(in millions of Canadian dollars) 2020 2019
Operating loss before funding from the Government of Canada and income taxes 553.0 409.3
Items requiring operating funds:
Income tax expense (recovery) - -
Items (not requiring) not providing operating funds:
Depreciation of property, plant and equipment (88.3) (86.7)
Amortization of intangible assets (22.8) (25.0)
Depreciation of right-of-use assets (3.7) (3.3)
Loss on disposal of property, plant and equipment (10.7) (5.0)
Loss on disposal of intangible assets - (1.1)
Post-employment and other employee benefit contributions in excess of expenses (15.3) (11.6)
Unrealized (net loss) net gain on derivative financial instruments (2.5) 4.0
Non-cash transactions relating to lease liabilities 3.7 3.5
Interest expense on lease liabilities (1.0) (1.0)
Adjustment for accrued compensation 2.7 (1.7)
Adjustment for VIA Préférence loyalty program (0.3) (0.1)
Other 1.0 (0.6)
Operating funding from the Government of Canada 415.8 280.7
35
80
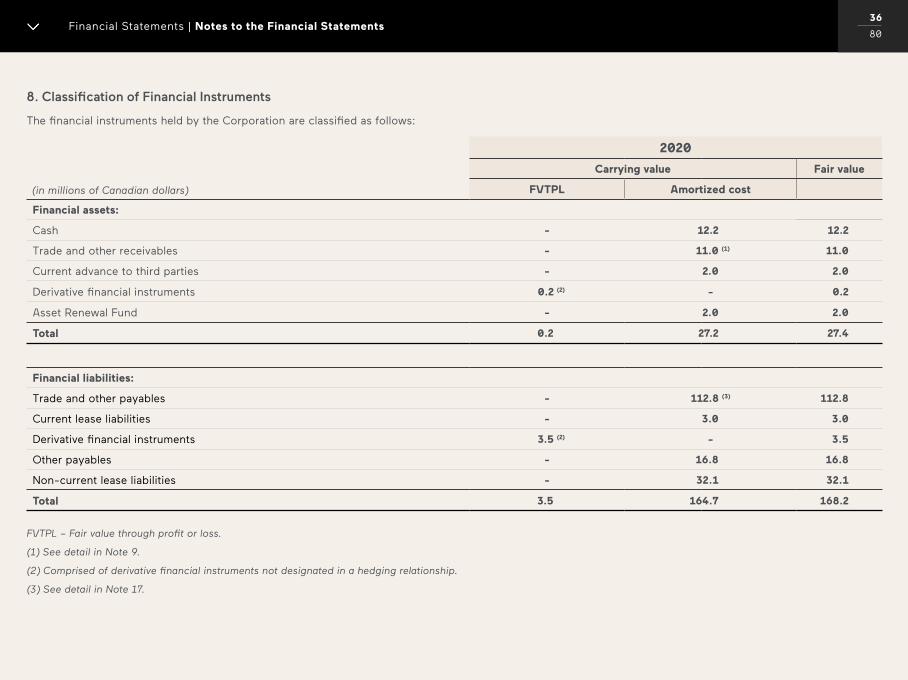
00 / 00 Financial Statements | Notes to the Financial Statements
8. Classification of Financial Instruments
The financial instruments held by the Corporation are classified as follows:
(in millions of Canadian dollars)
2020
Carrying value Fair value
FVTPL Amortized cost
Financial assets:
Cash - 12.2 12.2
Trade and other receivables - 11.0 (1) 11.0
Current advance to third parties - 2.0 2.0
Derivative financial instruments 0.2 (2) - 0.2
Asset Renewal Fund - 2.0 2.0
Total 0.2 27.2 27.4
Financial liabilities:
Trade and other payables - 112.8 (3) 112.8
Current lease liabilities - 3.0 3.0
Derivative financial instruments 3.5 (2) - 3.5
Other payables - 16.8 16.8
Non-current lease liabilities - 32.1 32.1
Total 3.5 164.7 168.2
FVTPL – Fair value through profit or loss.
(1) See detail in Note 9.
(2) Comprised of derivative financial instruments not designated in a hedging relationship.
(3) See detail in Note 17.
36
80
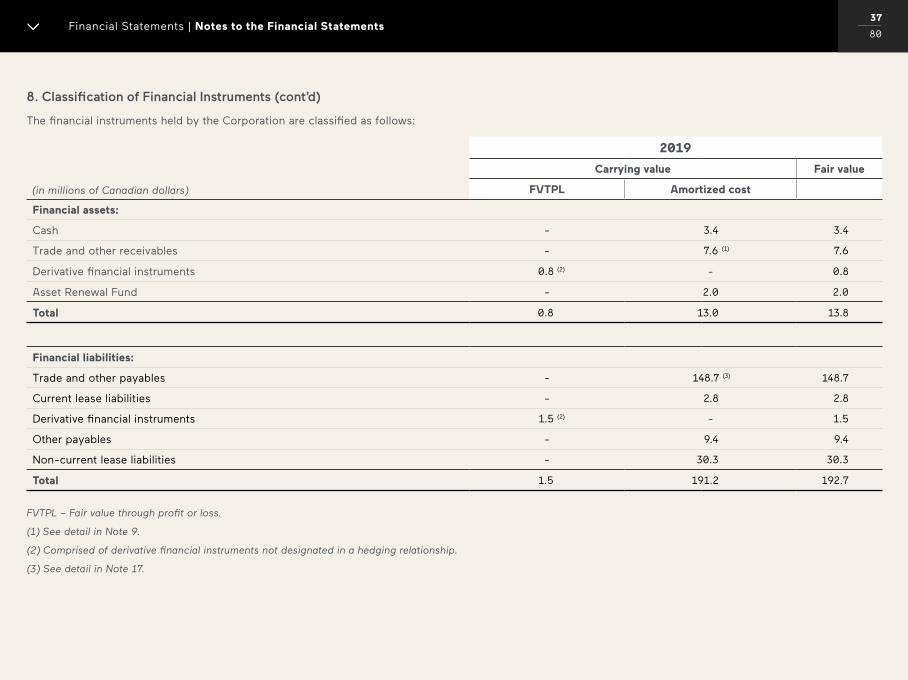
00 / 00 Financial Statements | Notes to the Financial Statements
8. Classification of Financial Instruments (cont’d)
The financial instruments held by the Corporation are classified as follows:
(in millions of Canadian dollars)
2019
Carrying value Fair value
FVTPL Amortized cost
Financial assets:
Cash - 3.4 3.4
Trade and other receivables - 7.6 (1) 7.6
Derivative financial instruments 0.8 (2) - 0.8
Asset Renewal Fund - 2.0 2.0
Total 0.8 13.0 13.8
Financial liabilities:
Trade and other payables - 148.7 (3) 148.7
Current lease liabilities - 2.8 2.8
Derivative financial instruments 1.5 (2) - 1.5
Other payables - 9.4 9.4
Non-current lease liabilities - 30.3 30.3
Total 1.5 191.2 192.7
FVTPL – Fair value through profit or loss.
(1) See detail in Note 9.
(2) Comprised of derivative financial instruments not designated in a hedging relationship.
(3) See detail in Note 17.
37
80
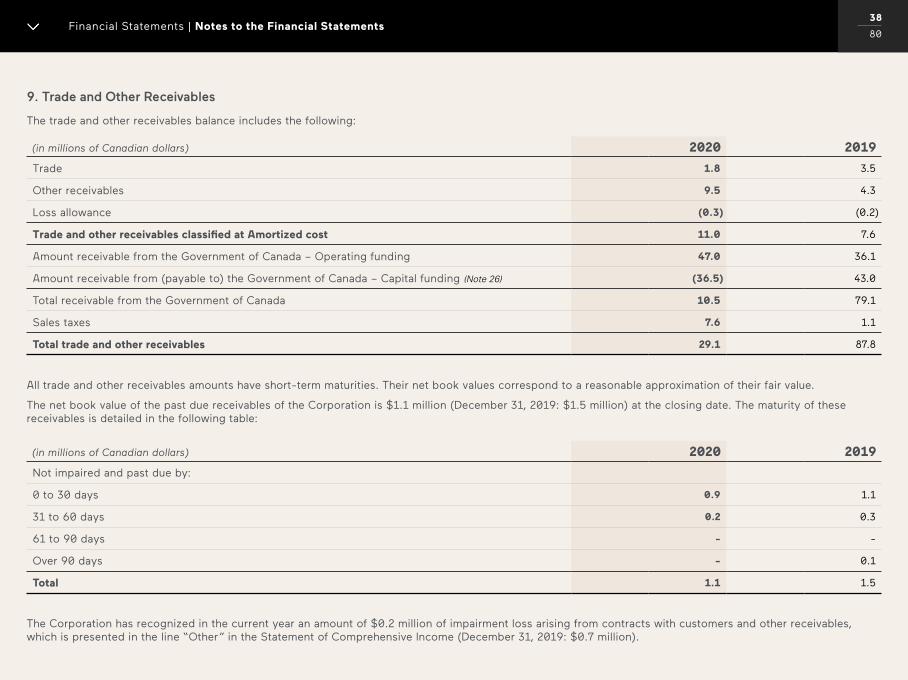
00 / 00 Financial Statements | Notes to the Financial Statements
9. Trade and Other Receivables
The trade and other receivables balance includes the following:
(in millions of Canadian dollars) 2020 2019
Trade 1.8 3.5
Other receivables 9.5 4.3
Loss allowance (0.3) (0.2)
Trade and other receivables classified at Amortized cost 11.0 7.6
Amount receivable from the Government of Canada – Operating funding 47.0 36.1
Amount receivable from (payable to) the Government of Canada – Capital funding (Note 26) (36.5) 43.0
Total receivable from the Government of Canada 10.5 79.1
Sales taxes 7.6 1.1
Total trade and other receivables 29.1 87.8
All trade and other receivables amounts have short-term maturities. Their net book values correspond to a reasonable approximation of their fair value.
The net book value of the past due receivables of the Corporation is $1.1 million (December 31, 2019: $1.5 million) at the closing date. The maturity of these receivables is detailed in the following table:
(in millions of Canadian dollars) 2020 2019
Not impaired and past due by:
0 to 30 days 0.9 1.1
31 to 60 days 0.2 0.3
61 to 90 days - -
Over 90 days - 0.1
Total 1.1 1.5
The Corporation has recognized in the current year an amount of $0.2 million of impairment loss arising from contracts with customers and other receivables, which is presented in the line “Other” in the Statement of Comprehensive Income (December 31, 2019: $0.7 million).
38
80
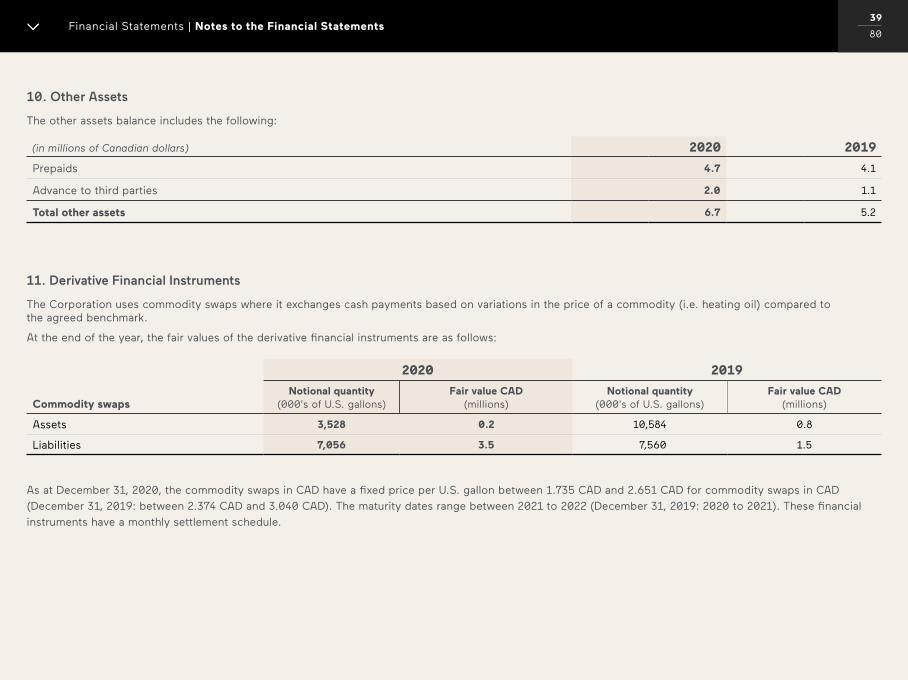
00 / 00 Financial Statements | Notes to the Financial Statements
10. Other Assets
The other assets balance includes the following:
(in millions of Canadian dollars) 2020 2019
Prepaids 4.7 4.1
Advance to third parties 2.0 1.1
Total other assets 6.7 5.2
11. Derivative Financial Instruments
The Corporation uses commodity swaps where it exchanges cash payments based on variations in the price of a commodity (i.e. heating oil) compared to the agreed benchmark.
At the end of the year, the fair values of the derivative financial instruments are as follows:
2020 2019
Commodity swapsNotional quantity
(000’s of U.S. gallons)Fair value CAD
(millions)Notional quantity
(000’s of U.S. gallons)Fair value CAD
(millions)
Assets 3,528 0.2 10,584 0.8
Liabilities 7,056 3.5 7,560 1.5
As at December 31, 2020, the commodity swaps in CAD have a fixed price per U.S. gallon between 1.735 CAD and 2.651 CAD for commodity swaps in CAD
(December 31, 2019: between 2.374 CAD and 3.040 CAD). The maturity dates range between 2021 to 2022 (December 31, 2019: 2020 to 2021). These financial
instruments have a monthly settlement schedule.
39
80
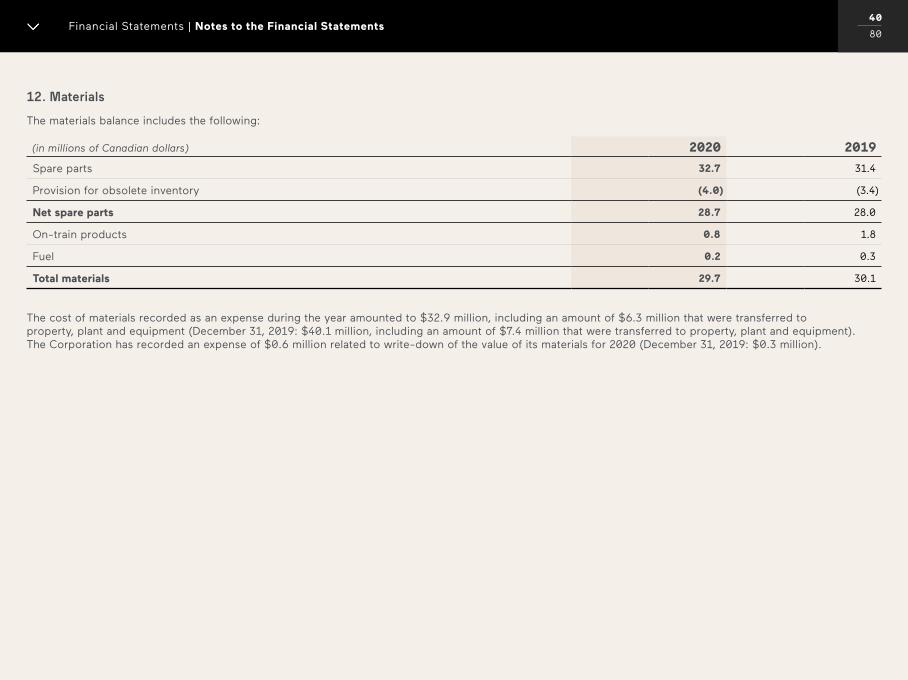
00 / 00 Financial Statements | Notes to the Financial Statements
12. Materials
The materials balance includes the following:
(in millions of Canadian dollars) 2020 2019
Spare parts 32.7 31.4
Provision for obsolete inventory (4.0) (3.4)
Net spare parts 28.7 28.0
On-train products 0.8 1.8
Fuel 0.2 0.3
Total materials 29.7 30.1
The cost of materials recorded as an expense during the year amounted to $32.9 million, including an amount of $6.3 million that were transferred to property, plant and equipment (December 31, 2019: $40.1 million, including an amount of $7.4 million that were transferred to property, plant and equipment). The Corporation has recorded an expense of $0.6 million related to write-down of the value of its materials for 2020 (December 31, 2019: $0.3 million).
40
80
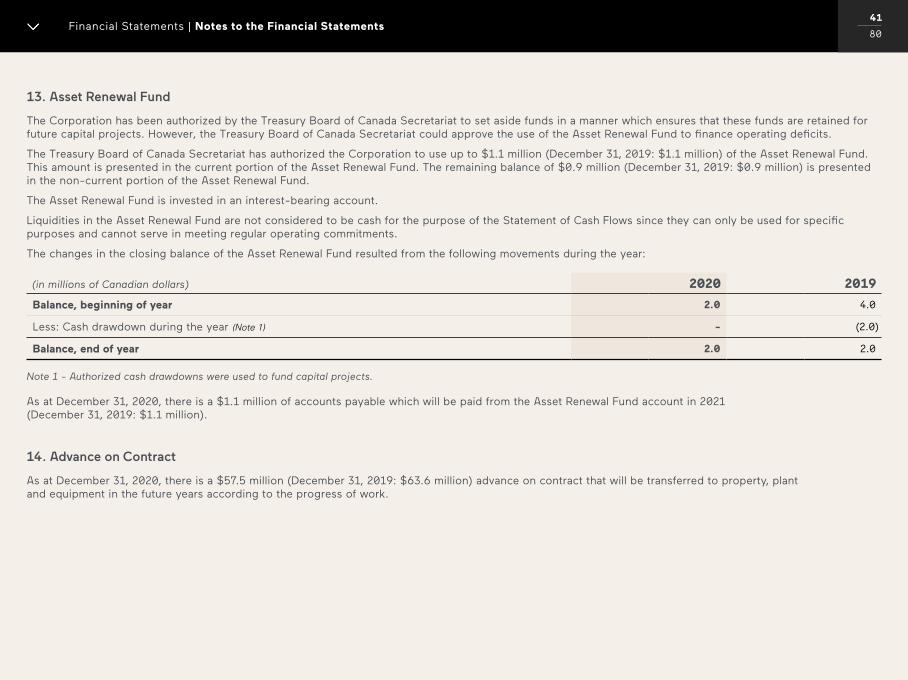
00 / 00 Financial Statements | Notes to the Financial Statements
13. Asset Renewal Fund
The Corporation has been authorized by the Treasury Board of Canada Secretariat to set aside funds in a manner which ensures that these funds are retained for future capital projects. However, the Treasury Board of Canada Secretariat could approve the use of the Asset Renewal Fund to finance operating deficits.
The Treasury Board of Canada Secretariat has authorized the Corporation to use up to $1.1 million (December 31, 2019: $1.1 million) of the Asset Renewal Fund. This amount is presented in the current portion of the Asset Renewal Fund. The remaining balance of $0.9 million (December 31, 2019: $0.9 million) is presented in the non-current portion of the Asset Renewal Fund.
The Asset Renewal Fund is invested in an interest-bearing account.
Liquidities in the Asset Renewal Fund are not considered to be cash for the purpose of the Statement of Cash Flows since they can only be used for specific purposes and cannot serve in meeting regular operating commitments.
The changes in the closing balance of the Asset Renewal Fund resulted from the following movements during the year:
(in millions of Canadian dollars) 2020 2019
Balance, beginning of year 2.0 4.0
Less: Cash drawdown during the year (Note 1) - (2.0)
Balance, end of year 2.0 2.0
Note 1 - Authorized cash drawdowns were used to fund capital projects.
As at December 31, 2020, there is a $1.1 million of accounts payable which will be paid from the Asset Renewal Fund account in 2021 (December 31, 2019: $1.1 million).
14. Advance on Contract
As at December 31, 2020, there is a $57.5 million (December 31, 2019: $63.6 million) advance on contract that will be transferred to property, plant and equipment in the future years according to the progress of work.
41
80
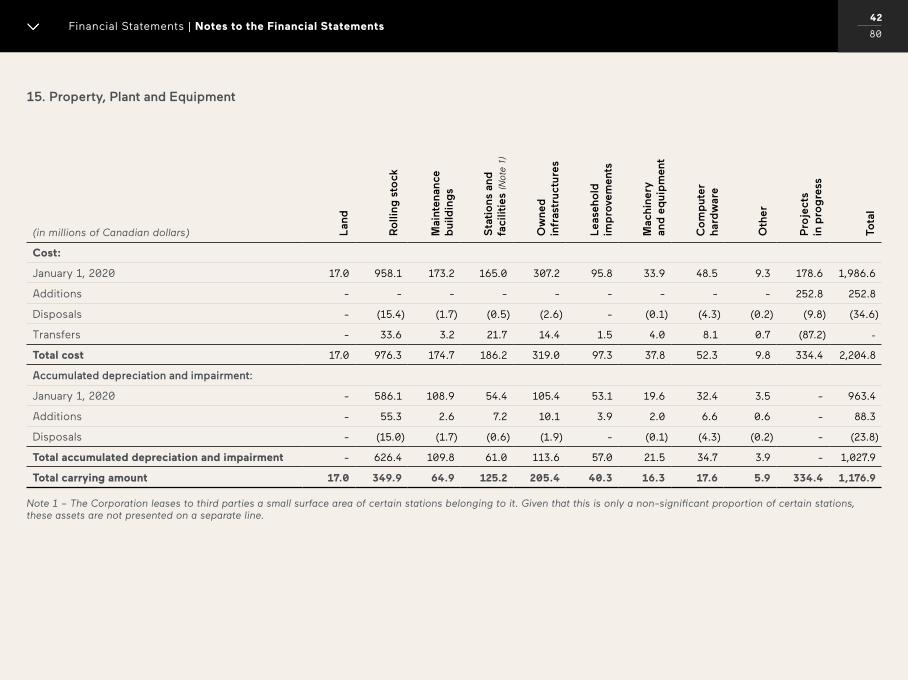
00 / 00 Financial Statements | Notes to the Financial Statements
15. Property, Plant and Equipment
(in millions of Canadian dollars) Lan
d
Ro
llin
g s
tock
Mai
nte
nan
ce
bu
ildin
gs
Sta
tio
ns
and
fa
cilit
ies
(Not
e 1)
Ow
ne
d
infr
astr
uc
ture
s
Lea
seh
old
im
pro
vem
ents
Mac
hin
ery
an
d e
qu
ipm
ent
Co
mp
ute
r
har
dw
are
Oth
er
Pro
jec
ts
in p
rog
ress
Tota
l
Cost:
January 1, 2020 17.0 958.1 173.2 165.0 307.2 95.8 33.9 48.5 9.3 178.6 1,986.6
Additions - - - - - - - - - 252.8 252.8
Disposals - (15.4) (1.7) (0.5) (2.6) - (0.1) (4.3) (0.2) (9.8) (34.6)
Transfers - 33.6 3.2 21.7 14.4 1.5 4.0 8.1 0.7 (87.2) -
Total cost 17.0 976.3 174.7 186.2 319.0 97.3 37.8 52.3 9.8 334.4 2,204.8
Accumulated depreciation and impairment:
January 1, 2020 - 586.1 108.9 54.4 105.4 53.1 19.6 32.4 3.5 - 963.4
Additions - 55.3 2.6 7.2 10.1 3.9 2.0 6.6 0.6 - 88.3
Disposals - (15.0) (1.7) (0.6) (1.9) - (0.1) (4.3) (0.2) - (23.8)
Total accumulated depreciation and impairment - 626.4 109.8 61.0 113.6 57.0 21.5 34.7 3.9 - 1,027.9
Total carrying amount 17.0 349.9 64.9 125.2 205.4 40.3 16.3 17.6 5.9 334.4 1,176.9
Note 1 – The Corporation leases to third parties a small surface area of certain stations belonging to it. Given that this is only a non-significant proportion of certain stations, these assets are not presented on a separate line.
42
80
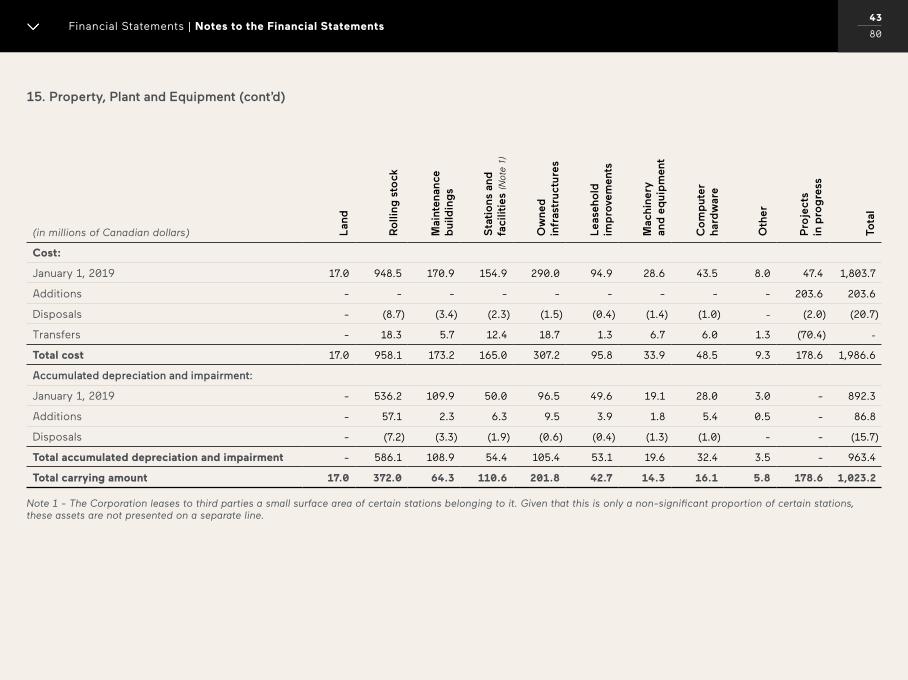
00 / 00 Financial Statements | Notes to the Financial Statements
15. Property, Plant and Equipment (cont’d)
(in millions of Canadian dollars) Lan
d
Ro
llin
g s
tock
Mai
nte
nan
ce
bu
ildin
gs
Sta
tio
ns
and
fa
cilit
ies
(Not
e 1)
Ow
ne
d
infr
astr
uc
ture
s
Lea
seh
old
im
pro
vem
ents
Mac
hin
ery
an
d e
qu
ipm
ent
Co
mp
ute
r
har
dw
are
Oth
er
Pro
jec
ts
in p
rog
ress
Tota
l
Cost:
January 1, 2019 17.0 948.5 170.9 154.9 290.0 94.9 28.6 43.5 8.0 47.4 1,803.7
Additions - - - - - - - - - 203.6 203.6
Disposals - (8.7) (3.4) (2.3) (1.5) (0.4) (1.4) (1.0) - (2.0) (20.7)
Transfers - 18.3 5.7 12.4 18.7 1.3 6.7 6.0 1.3 (70.4) -
Total cost 17.0 958.1 173.2 165.0 307.2 95.8 33.9 48.5 9.3 178.6 1,986.6
Accumulated depreciation and impairment:
January 1, 2019 - 536.2 109.9 50.0 96.5 49.6 19.1 28.0 3.0 - 892.3
Additions - 57.1 2.3 6.3 9.5 3.9 1.8 5.4 0.5 - 86.8
Disposals - (7.2) (3.3) (1.9) (0.6) (0.4) (1.3) (1.0) - - (15.7)
Total accumulated depreciation and impairment - 586.1 108.9 54.4 105.4 53.1 19.6 32.4 3.5 - 963.4
Total carrying amount 17.0 372.0 64.3 110.6 201.8 42.7 14.3 16.1 5.8 178.6 1,023.2
Note 1 - The Corporation leases to third parties a small surface area of certain stations belonging to it. Given that this is only a non-significant proportion of certain stations, these assets are not presented on a separate line.
43
80
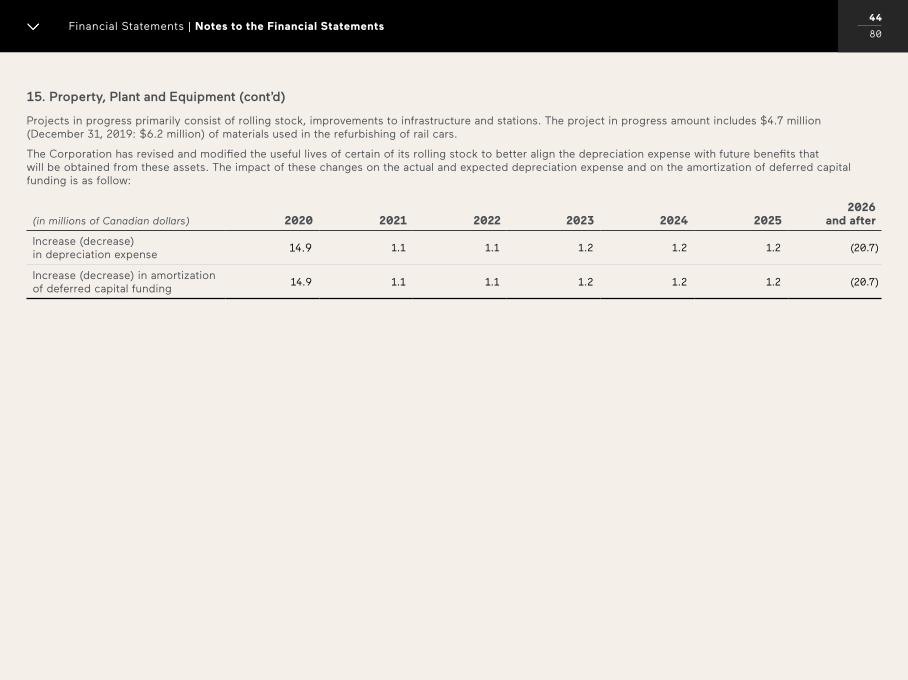
00 / 00 Financial Statements | Notes to the Financial Statements
15. Property, Plant and Equipment (cont’d)
Projects in progress primarily consist of rolling stock, improvements to infrastructure and stations. The project in progress amount includes $4.7 million (December 31, 2019: $6.2 million) of materials used in the refurbishing of rail cars.
The Corporation has revised and modified the useful lives of certain of its rolling stock to better align the depreciation expense with future benefits that will be obtained from these assets. The impact of these changes on the actual and expected depreciation expense and on the amortization of deferred capital funding is as follow:
(in millions of Canadian dollars) 2020 2021 2022 2023 2024 2025 2026
and after
Increase (decrease) in depreciation expense
14.9 1.1 1.1 1.2 1.2 1.2 (20.7)
Increase (decrease) in amortization of deferred capital funding
14.9 1.1 1.1 1.2 1.2 1.2 (20.7)
44
80
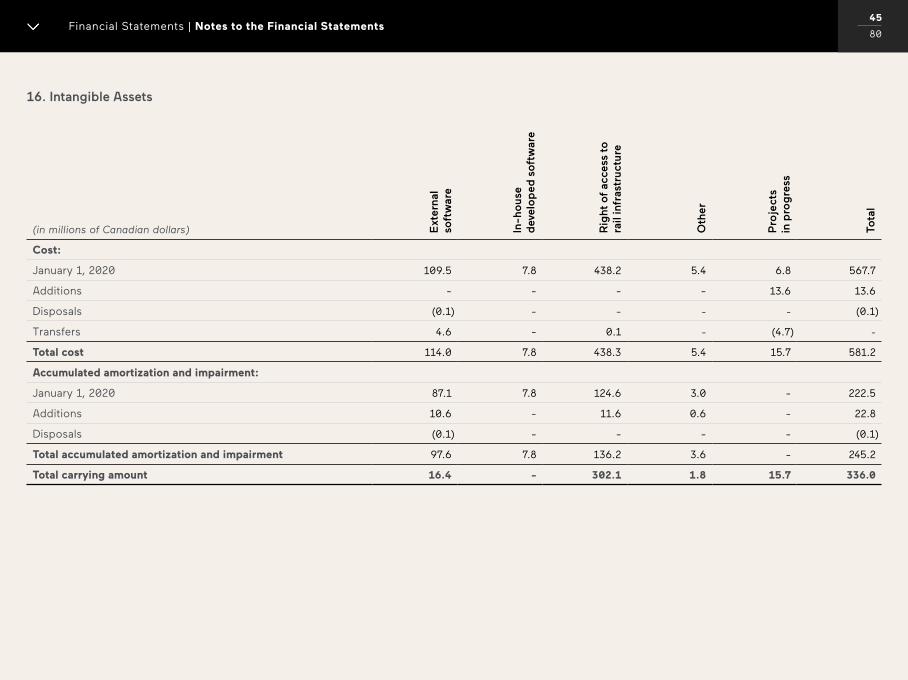
00 / 00 Financial Statements | Notes to the Financial Statements
16. Intangible Assets
(in millions of Canadian dollars) Ext
ern
al
soft
war
e
In-h
ou
se
dev
elo
pe
d s
oft
war
e
Rig
ht
of
acce
ss t
o
rail
infr
astr
uc
ture
Oth
er
Pro
jec
ts
in p
rog
ress
Tota
l
Cost:
January 1, 2020 109.5 7.8 438.2 5.4 6.8 567.7
Additions - - - - 13.6 13.6
Disposals (0.1) - - - - (0.1)
Transfers 4.6 - 0.1 - (4.7) -
Total cost 114.0 7.8 438.3 5.4 15.7 581.2
Accumulated amortization and impairment:
January 1, 2020 87.1 7.8 124.6 3.0 - 222.5
Additions 10.6 - 11.6 0.6 - 22.8
Disposals (0.1) - - - - (0.1)
Total accumulated amortization and impairment 97.6 7.8 136.2 3.6 - 245.2
Total carrying amount 16.4 - 302.1 1.8 15.7 336.0
45
80
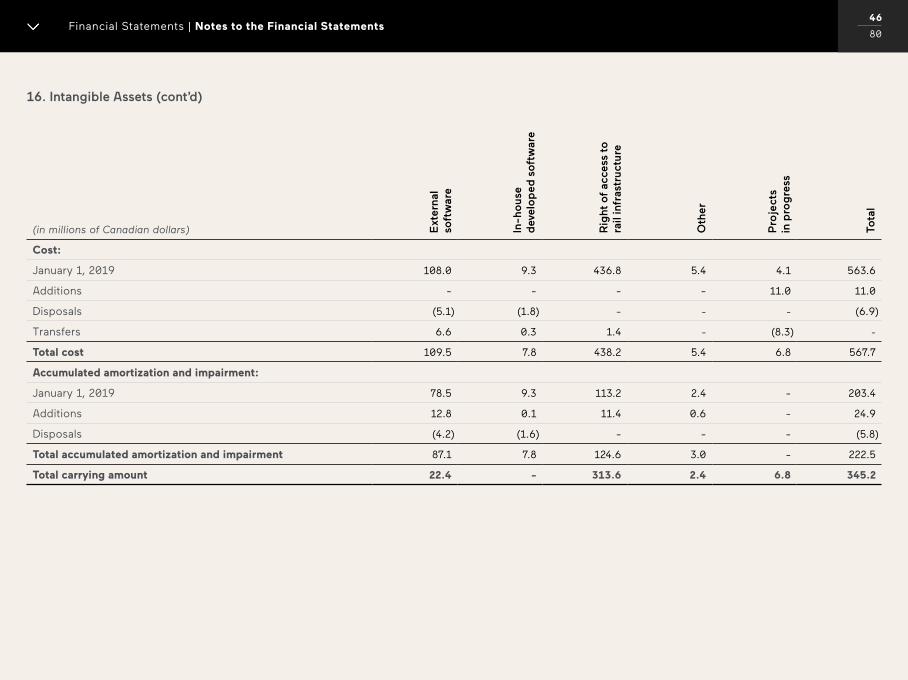
00 / 00 Financial Statements | Notes to the Financial Statements
16. Intangible Assets (cont’d)
(in millions of Canadian dollars) Ext
ern
al
soft
war
e
In-h
ou
se
dev
elo
pe
d s
oft
war
e
Rig
ht
of
acce
ss t
o
rail
infr
astr
uc
ture
Oth
er
Pro
jec
ts
in p
rog
ress
Tota
l
Cost:
January 1, 2019 108.0 9.3 436.8 5.4 4.1 563.6
Additions - - - - 11.0 11.0
Disposals (5.1) (1.8) - - - (6.9)
Transfers 6.6 0.3 1.4 - (8.3) -
Total cost 109.5 7.8 438.2 5.4 6.8 567.7
Accumulated amortization and impairment:
January 1, 2019 78.5 9.3 113.2 2.4 - 203.4
Additions 12.8 0.1 11.4 0.6 - 24.9
Disposals (4.2) (1.6) - - - (5.8)
Total accumulated amortization and impairment 87.1 7.8 124.6 3.0 - 222.5
Total carrying amount 22.4 - 313.6 2.4 6.8 345.2
46
80
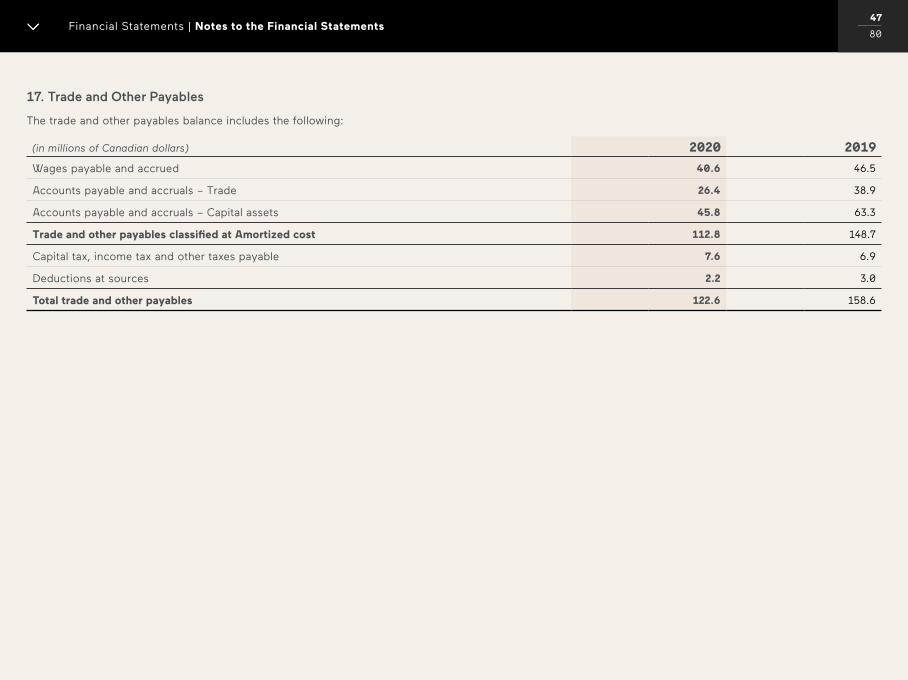
00 / 00 Financial Statements | Notes to the Financial Statements
17. Trade and Other Payables
The trade and other payables balance includes the following:
(in millions of Canadian dollars) 2020 2019
Wages payable and accrued 40.6 46.5
Accounts payable and accruals – Trade 26.4 38.9
Accounts payable and accruals – Capital assets 45.8 63.3
Trade and other payables classified at Amortized cost 112.8 148.7
Capital tax, income tax and other taxes payable 7.6 6.9
Deductions at sources 2.2 3.0
Total trade and other payables 122.6 158.6
47
80
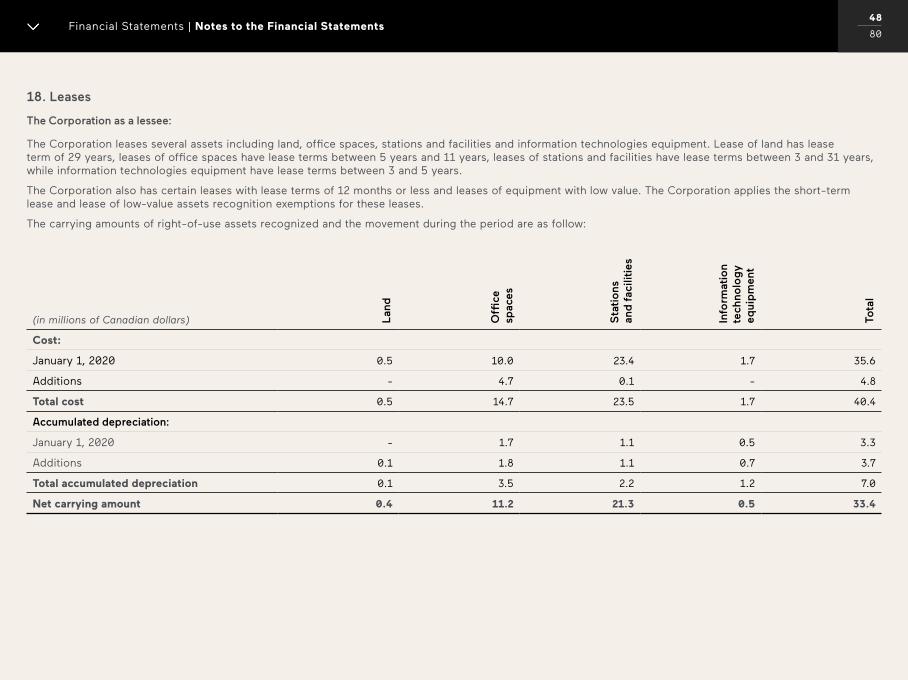
00 / 00 Financial Statements | Notes to the Financial Statements
18. Leases
The Corporation as a lessee:
The Corporation leases several assets including land, office spaces, stations and facilities and information technologies equipment. Lease of land has lease term of 29 years, leases of office spaces have lease terms between 5 years and 11 years, leases of stations and facilities have lease terms between 3 and 31 years, while information technologies equipment have lease terms between 3 and 5 years.
The Corporation also has certain leases with lease terms of 12 months or less and leases of equipment with low value. The Corporation applies the short-term lease and lease of low-value assets recognition exemptions for these leases.
The carrying amounts of right-of-use assets recognized and the movement during the period are as follow:
(in millions of Canadian dollars) Lan
d
Offi
ce
spac
es
Sta
tio
ns
an
d f
acili
ties
Info
rmat
ion
te
chn
olo
gy
e
qu
ipm
ent
Tota
l
Cost:
January 1, 2020 0.5 10.0 23.4 1.7 35.6
Additions - 4.7 0.1 - 4.8
Total cost 0.5 14.7 23.5 1.7 40.4
Accumulated depreciation:
January 1, 2020 - 1.7 1.1 0.5 3.3
Additions 0.1 1.8 1.1 0.7 3.7
Total accumulated depreciation 0.1 3.5 2.2 1.2 7.0
Net carrying amount 0.4 11.2 21.3 0.5 33.4
48
80
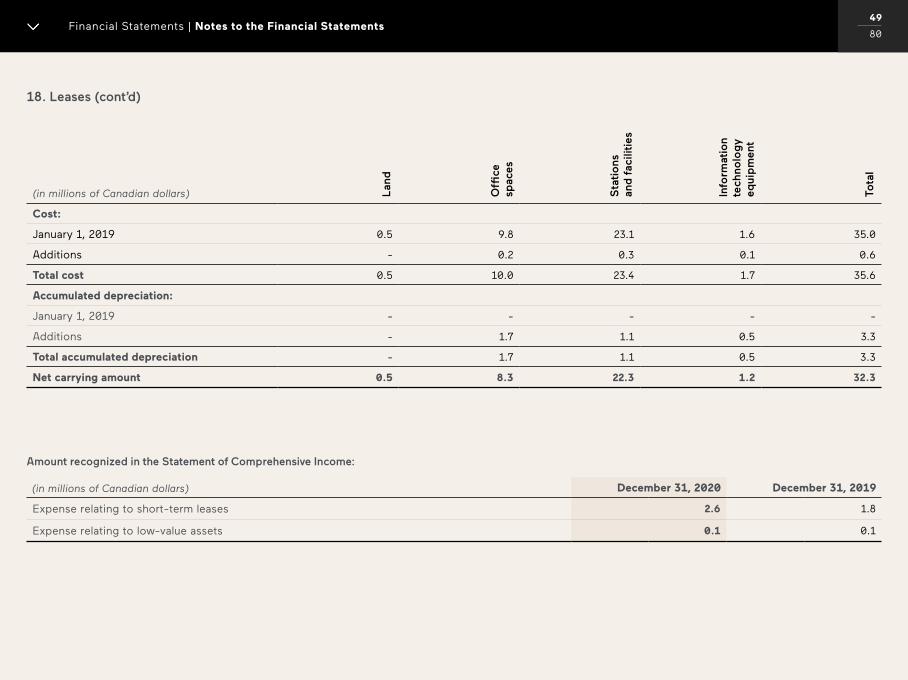
00 / 00 Financial Statements | Notes to the Financial Statements
18. Leases (cont’d)
(in millions of Canadian dollars) Lan
d
Offi
ce
spac
es
Sta
tio
ns
an
d f
acili
ties
Info
rmat
ion
te
chn
olo
gy
e
qu
ipm
ent
Tota
l
Cost:
January 1, 2019 0.5 9.8 23.1 1.6 35.0
Additions - 0.2 0.3 0.1 0.6
Total cost 0.5 10.0 23.4 1.7 35.6
Accumulated depreciation:
January 1, 2019 - - - - -
Additions - 1.7 1.1 0.5 3.3
Total accumulated depreciation - 1.7 1.1 0.5 3.3
Net carrying amount 0.5 8.3 22.3 1.2 32.3
Amount recognized in the Statement of Comprehensive Income:
(in millions of Canadian dollars) December 31, 2020 December 31, 2019
Expense relating to short-term leases 2.6 1.8
Expense relating to low-value assets 0.1 0.1
49
80
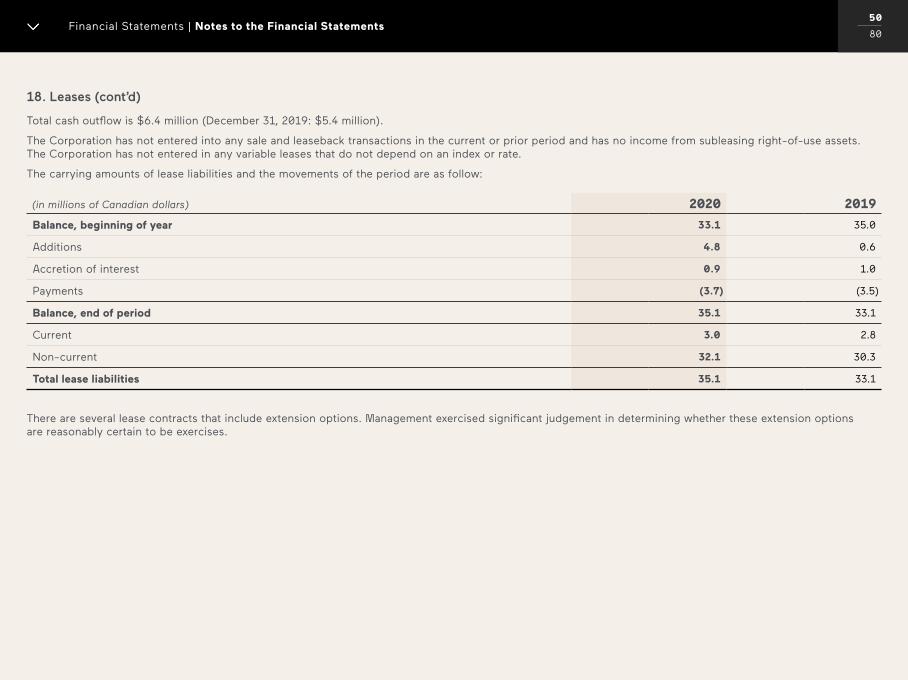
00 / 00 Financial Statements | Notes to the Financial Statements
18. Leases (cont’d)
Total cash outflow is $6.4 million (December 31, 2019: $5.4 million).
The Corporation has not entered into any sale and leaseback transactions in the current or prior period and has no income from subleasing right-of-use assets. The Corporation has not entered in any variable leases that do not depend on an index or rate.
The carrying amounts of lease liabilities and the movements of the period are as follow:
(in millions of Canadian dollars) 2020 2019
Balance, beginning of year 33.1 35.0
Additions 4.8 0.6
Accretion of interest 0.9 1.0
Payments (3.7) (3.5)
Balance, end of period 35.1 33.1
Current 3.0 2.8
Non-current 32.1 30.3
Total lease liabilities 35.1 33.1
There are several lease contracts that include extension options. Management exercised significant judgement in determining whether these extension options are reasonably certain to be exercises.
50
80
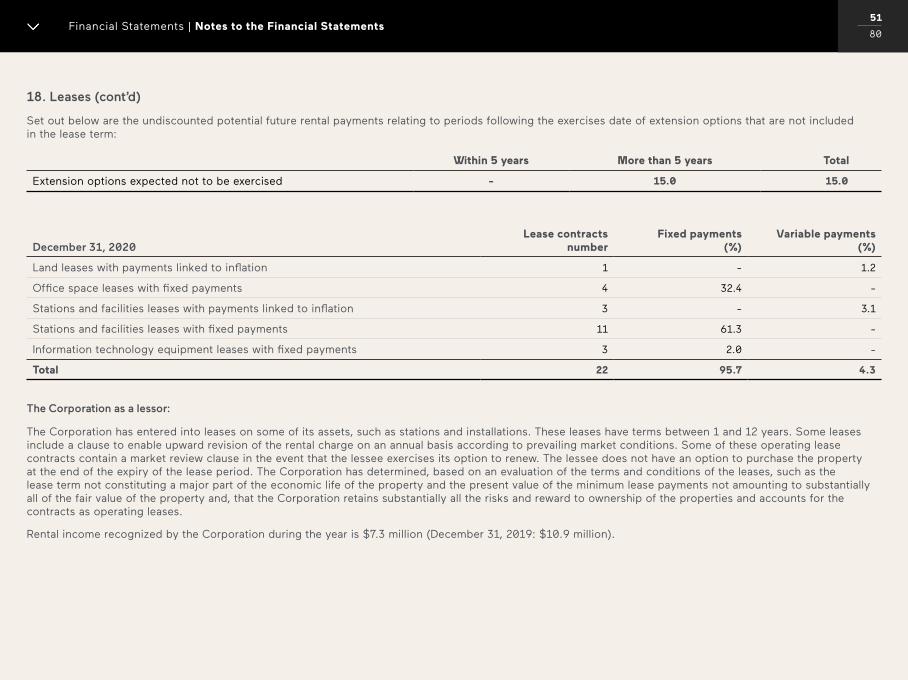
00 / 00 Financial Statements | Notes to the Financial Statements
18. Leases (cont’d)
Set out below are the undiscounted potential future rental payments relating to periods following the exercises date of extension options that are not included in the lease term:
Within 5 years More than 5 years Total
Extension options expected not to be exercised - 15.0 15.0
December 31, 2020Lease contracts
numberFixed payments
(%)Variable payments
(%)
Land leases with payments linked to inflation 1 - 1.2
Office space leases with fixed payments 4 32.4 -
Stations and facilities leases with payments linked to inflation 3 - 3.1
Stations and facilities leases with fixed payments 11 61.3 -
Information technology equipment leases with fixed payments 3 2.0 -
Total 22 95.7 4.3
The Corporation as a lessor:
The Corporation has entered into leases on some of its assets, such as stations and installations. These leases have terms between 1 and 12 years. Some leases include a clause to enable upward revision of the rental charge on an annual basis according to prevailing market conditions. Some of these operating lease contracts contain a market review clause in the event that the lessee exercises its option to renew. The lessee does not have an option to purchase the property at the end of the expiry of the lease period. The Corporation has determined, based on an evaluation of the terms and conditions of the leases, such as the lease term not constituting a major part of the economic life of the property and the present value of the minimum lease payments not amounting to substantially all of the fair value of the property and, that the Corporation retains substantially all the risks and reward to ownership of the properties and accounts for the contracts as operating leases.
Rental income recognized by the Corporation during the year is $7.3 million (December 31, 2019: $10.9 million).
51
80
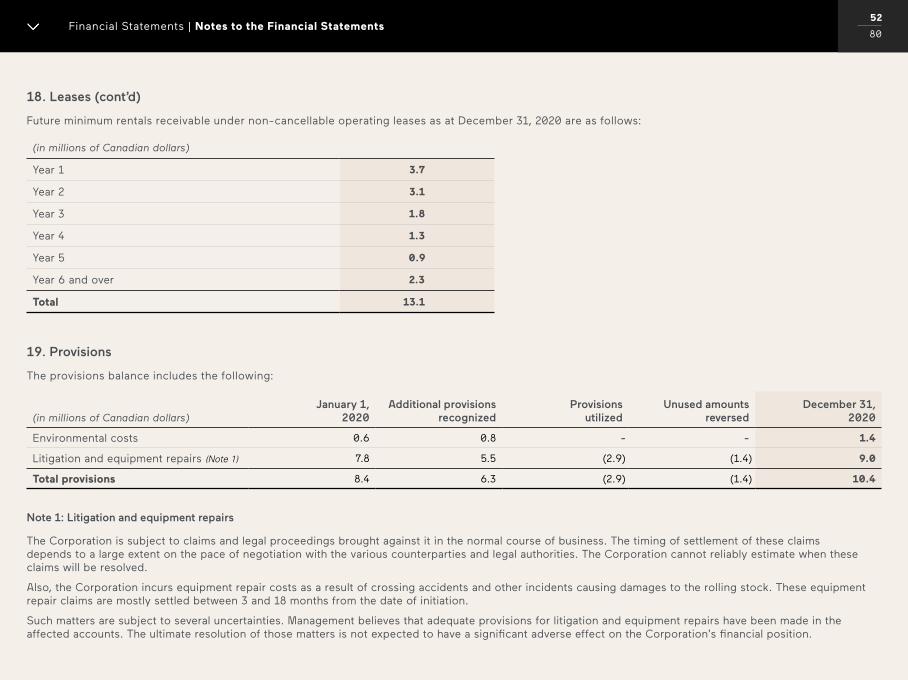
00 / 00 Financial Statements | Notes to the Financial Statements
18. Leases (cont’d)
Future minimum rentals receivable under non-cancellable operating leases as at December 31, 2020 are as follows:
(in millions of Canadian dollars)
Year 1 3.7
Year 2 3.1
Year 3 1.8
Year 4 1.3
Year 5 0.9
Year 6 and over 2.3
Total 13.1
19. Provisions
The provisions balance includes the following:
(in millions of Canadian dollars)January 1,
2020Additional provisions
recognizedProvisions
utilizedUnused amounts
reversedDecember 31,
2020
Environmental costs 0.6 0.8 - - 1.4
Litigation and equipment repairs (Note 1) 7.8 5.5 (2.9) (1.4) 9.0
Total provisions 8.4 6.3 (2.9) (1.4) 10.4
Note 1: Litigation and equipment repairs
The Corporation is subject to claims and legal proceedings brought against it in the normal course of business. The timing of settlement of these claims depends to a large extent on the pace of negotiation with the various counterparties and legal authorities. The Corporation cannot reliably estimate when these claims will be resolved.
Also, the Corporation incurs equipment repair costs as a result of crossing accidents and other incidents causing damages to the rolling stock. These equipment repair claims are mostly settled between 3 and 18 months from the date of initiation.
Such matters are subject to several uncertainties. Management believes that adequate provisions for litigation and equipment repairs have been made in the affected accounts. The ultimate resolution of those matters is not expected to have a significant adverse effect on the Corporation’s financial position.
52
80
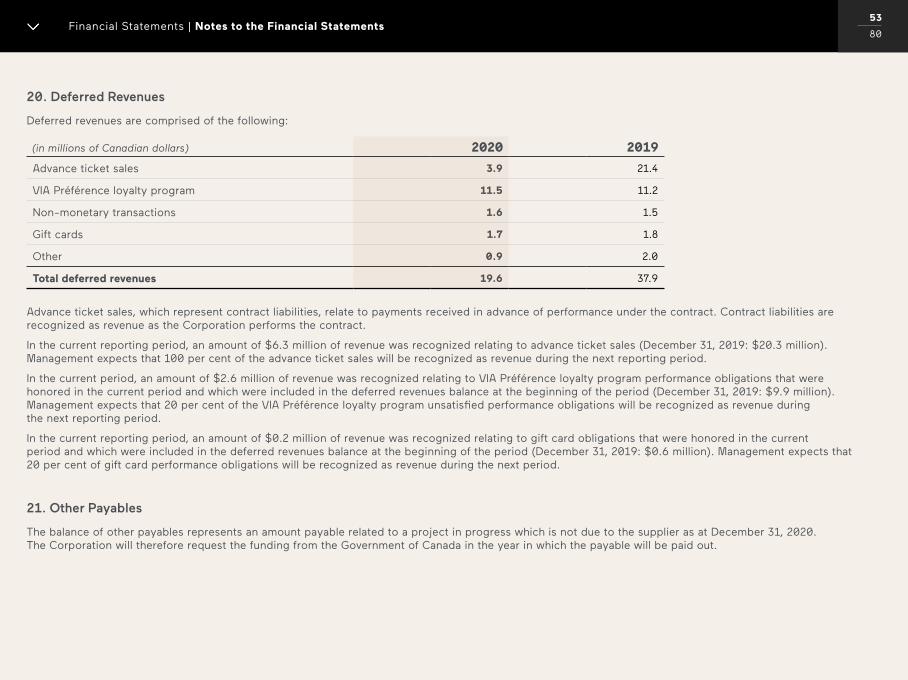
00 / 00 Financial Statements | Notes to the Financial Statements
20. Deferred Revenues
Deferred revenues are comprised of the following:
(in millions of Canadian dollars) 2020 2019
Advance ticket sales 3.9 21.4
VIA Préférence loyalty program 11.5 11.2
Non-monetary transactions 1.6 1.5
Gift cards 1.7 1.8
Other 0.9 2.0
Total deferred revenues 19.6 37.9
Advance ticket sales, which represent contract liabilities, relate to payments received in advance of performance under the contract. Contract liabilities are recognized as revenue as the Corporation performs the contract.
In the current reporting period, an amount of $6.3 million of revenue was recognized relating to advance ticket sales (December 31, 2019: $20.3 million). Management expects that 100 per cent of the advance ticket sales will be recognized as revenue during the next reporting period.
In the current period, an amount of $2.6 million of revenue was recognized relating to VIA Préférence loyalty program performance obligations that were honored in the current period and which were included in the deferred revenues balance at the beginning of the period (December 31, 2019: $9.9 million). Management expects that 20 per cent of the VIA Préférence loyalty program unsatisfied performance obligations will be recognized as revenue during the next reporting period.
In the current reporting period, an amount of $0.2 million of revenue was recognized relating to gift card obligations that were honored in the current period and which were included in the deferred revenues balance at the beginning of the period (December 31, 2019: $0.6 million). Management expects that 20 per cent of gift card performance obligations will be recognized as revenue during the next period.
21. Other Payables
The balance of other payables represents an amount payable related to a project in progress which is not due to the supplier as at December 31, 2020. The Corporation will therefore request the funding from the Government of Canada in the year in which the payable will be paid out.
53
80
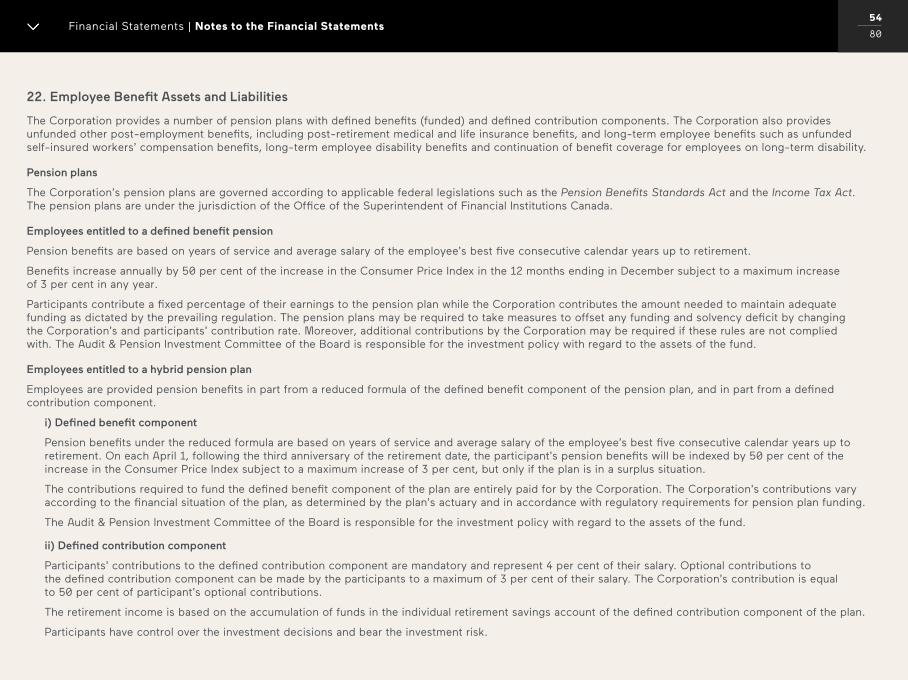
00 / 00 Financial Statements | Notes to the Financial Statements
22. Employee Benefit Assets and Liabilities
The Corporation provides a number of pension plans with defined benefits (funded) and defined contribution components. The Corporation also provides unfunded other post-employment benefits, including post-retirement medical and life insurance benefits, and long-term employee benefits such as unfunded self-insured workers’ compensation benefits, long-term employee disability benefits and continuation of benefit coverage for employees on long-term disability.
Pension plans
The Corporation’s pension plans are governed according to applicable federal legislations such as the Pension Benefits Standards Act and the Income Tax Act. The pension plans are under the jurisdiction of the Office of the Superintendent of Financial Institutions Canada.
Employees entitled to a defined benefit pension
Pension benefits are based on years of service and average salary of the employee’s best five consecutive calendar years up to retirement.
Benefits increase annually by 50 per cent of the increase in the Consumer Price Index in the 12 months ending in December subject to a maximum increase of 3 per cent in any year.
Participants contribute a fixed percentage of their earnings to the pension plan while the Corporation contributes the amount needed to maintain adequate funding as dictated by the prevailing regulation. The pension plans may be required to take measures to offset any funding and solvency deficit by changing the Corporation’s and participants’ contribution rate. Moreover, additional contributions by the Corporation may be required if these rules are not complied with. The Audit & Pension Investment Committee of the Board is responsible for the investment policy with regard to the assets of the fund.
Employees entitled to a hybrid pension plan
Employees are provided pension benefits in part from a reduced formula of the defined benefit component of the pension plan, and in part from a defined contribution component.
i) Defined benefit component
Pension benefits under the reduced formula are based on years of service and average salary of the employee’s best five consecutive calendar years up to retirement. On each April 1, following the third anniversary of the retirement date, the participant’s pension benefits will be indexed by 50 per cent of the increase in the Consumer Price Index subject to a maximum increase of 3 per cent, but only if the plan is in a surplus situation.
The contributions required to fund the defined benefit component of the plan are entirely paid for by the Corporation. The Corporation’s contributions vary according to the financial situation of the plan, as determined by the plan’s actuary and in accordance with regulatory requirements for pension plan funding.
The Audit & Pension Investment Committee of the Board is responsible for the investment policy with regard to the assets of the fund.
ii) Defined contribution component
Participants’ contributions to the defined contribution component are mandatory and represent 4 per cent of their salary. Optional contributions to the defined contribution component can be made by the participants to a maximum of 3 per cent of their salary. The Corporation’s contribution is equal to 50 per cent of participant’s optional contributions.
The retirement income is based on the accumulation of funds in the individual retirement savings account of the defined contribution component of the plan.
Participants have control over the investment decisions and bear the investment risk.
54
80
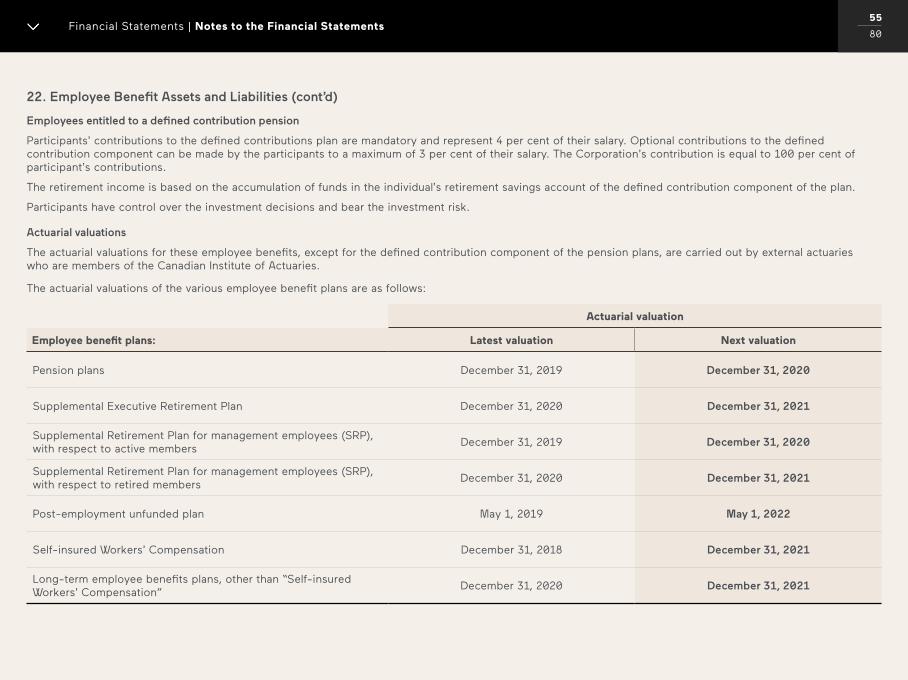
00 / 00 Financial Statements | Notes to the Financial Statements
22. Employee Benefit Assets and Liabilities (cont’d)
Employees entitled to a defined contribution pension
Participants’ contributions to the defined contributions plan are mandatory and represent 4 per cent of their salary. Optional contributions to the defined contribution component can be made by the participants to a maximum of 3 per cent of their salary. The Corporation’s contribution is equal to 100 per cent of participant’s contributions.
The retirement income is based on the accumulation of funds in the individual’s retirement savings account of the defined contribution component of the plan.
Participants have control over the investment decisions and bear the investment risk.
Actuarial valuations
The actuarial valuations for these employee benefits, except for the defined contribution component of the pension plans, are carried out by external actuaries who are members of the Canadian Institute of Actuaries.
The actuarial valuations of the various employee benefit plans are as follows:
Actuarial valuation
Employee benefit plans: Latest valuation Next valuation
Pension plans December 31, 2019 December 31, 2020
Supplemental Executive Retirement Plan December 31, 2020 December 31, 2021
Supplemental Retirement Plan for management employees (SRP), with respect to active members
December 31, 2019 December 31, 2020
Supplemental Retirement Plan for management employees (SRP), with respect to retired members
December 31, 2020 December 31, 2021
Post-employment unfunded plan May 1, 2019 May 1, 2022
Self-insured Workers’ Compensation December 31, 2018 December 31, 2021
Long-term employee benefits plans, other than “Self-insured Workers’ Compensation”
December 31, 2020 December 31, 2021
55
80
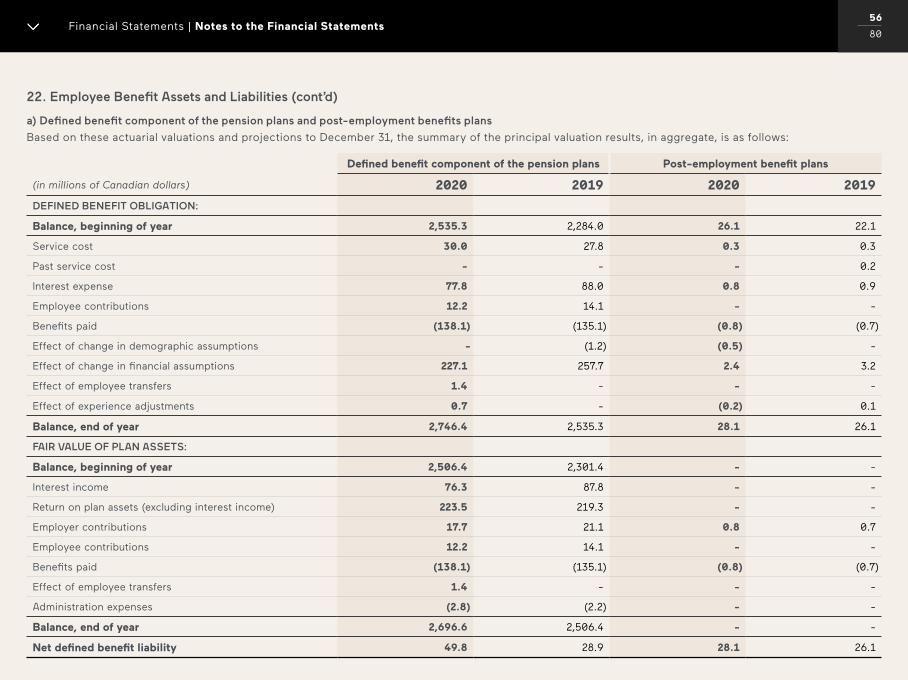
00 / 00 Financial Statements | Notes to the Financial Statements
22. Employee Benefit Assets and Liabilities (cont’d)
a) Defined benefit component of the pension plans and post-employment benefits plans
Based on these actuarial valuations and projections to December 31, the summary of the principal valuation results, in aggregate, is as follows:
Defined benefit component of the pension plans Post-employment benefit plans
(in millions of Canadian dollars) 2020 2019 2020 2019
DEFINED BENEFIT OBLIGATION:
Balance, beginning of year 2,535.3 2,284.0 26.1 22.1
Service cost 30.0 27.8 0.3 0.3
Past service cost - - - 0.2
Interest expense 77.8 88.0 0.8 0.9
Employee contributions 12.2 14.1 - -
Benefits paid (138.1) (135.1) (0.8) (0.7)
Effect of change in demographic assumptions - (1.2) (0.5) -
Effect of change in financial assumptions 227.1 257.7 2.4 3.2
Effect of employee transfers 1.4 - - -
Effect of experience adjustments 0.7 - (0.2) 0.1
Balance, end of year 2,746.4 2,535.3 28.1 26.1
FAIR VALUE OF PLAN ASSETS:
Balance, beginning of year 2,506.4 2,301.4 - -
Interest income 76.3 87.8 - -
Return on plan assets (excluding interest income) 223.5 219.3 - -
Employer contributions 17.7 21.1 0.8 0.7
Employee contributions 12.2 14.1 - -
Benefits paid (138.1) (135.1) (0.8) (0.7)
Effect of employee transfers 1.4 - - -
Administration expenses (2.8) (2.2) - -
Balance, end of year 2,696.6 2,506.4 - -
Net defined benefit liability 49.8 28.9 28.1 26.1
56
80
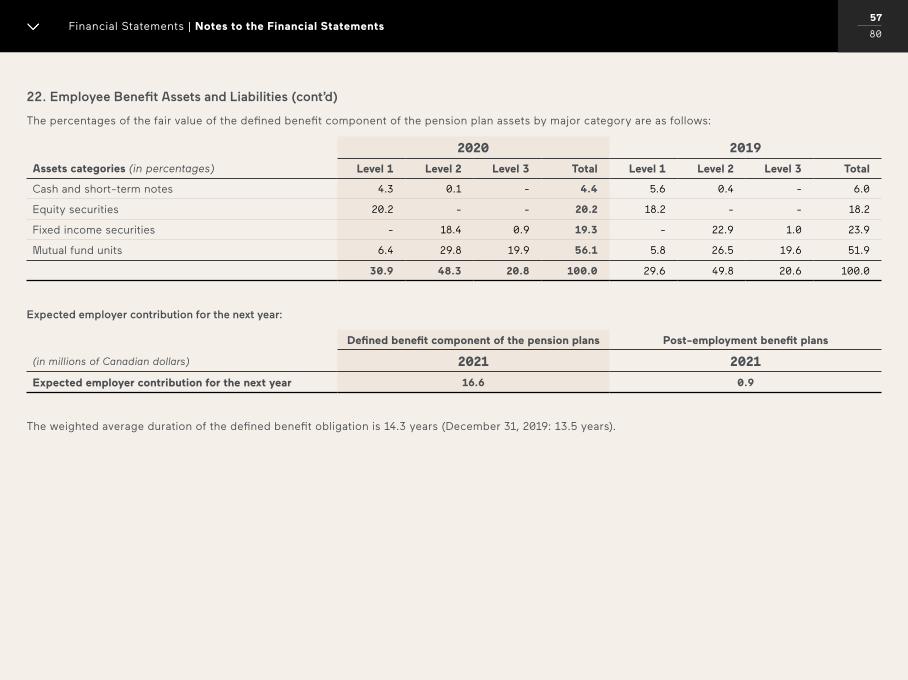
00 / 00 Financial Statements | Notes to the Financial Statements
22. Employee Benefit Assets and Liabilities (cont’d)
The percentages of the fair value of the defined benefit component of the pension plan assets by major category are as follows:
Assets categories (in percentages)
2020 2019
Level 1 Level 2 Level 3 Total Level 1 Level 2 Level 3 Total
Cash and short-term notes 4.3 0.1 - 4.4 5.6 0.4 - 6.0
Equity securities 20.2 - - 20.2 18.2 - - 18.2
Fixed income securities - 18.4 0.9 19.3 - 22.9 1.0 23.9
Mutual fund units 6.4 29.8 19.9 56.1 5.8 26.5 19.6 51.9
30.9 48.3 20.8 100.0 29.6 49.8 20.6 100.0
Expected employer contribution for the next year:
Defined benefit component of the pension plans Post-employment benefit plans
(in millions of Canadian dollars) 2021 2021
Expected employer contribution for the next year 16.6 0.9
The weighted average duration of the defined benefit obligation is 14.3 years (December 31, 2019: 13.5 years).
57
80
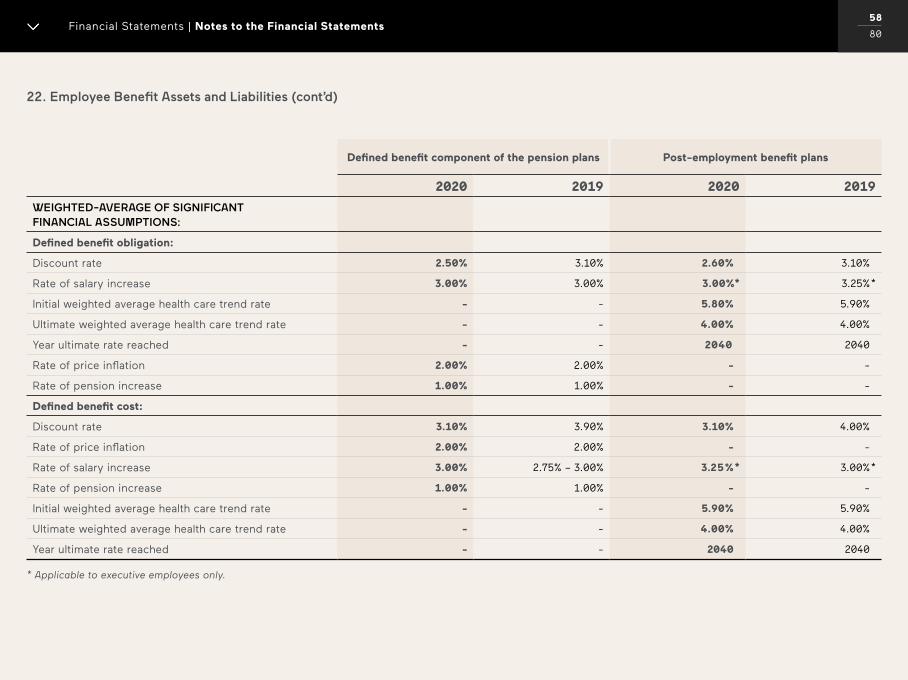
00 / 00 Financial Statements | Notes to the Financial Statements
22. Employee Benefit Assets and Liabilities (cont’d)
Defined benefit component of the pension plans Post-employment benefit plans
2020 2019 2020 2019
WEIGHTED-AVERAGE OF SIGNIFICANT FINANCIAL ASSUMPTIONS:
Defined benefit obligation:
Discount rate 2.50% 3.10% 2.60% 3.10%
Rate of salary increase 3.00% 3.00% 3.00%* 3.25%*
Initial weighted average health care trend rate - - 5.80% 5.90%
Ultimate weighted average health care trend rate - - 4.00% 4.00%
Year ultimate rate reached - - 2040 2040
Rate of price inflation 2.00% 2.00% - -
Rate of pension increase 1.00% 1.00% - -
Defined benefit cost:
Discount rate 3.10% 3.90% 3.10% 4.00%
Rate of price inflation 2.00% 2.00% - -
Rate of salary increase 3.00% 2.75% – 3.00% 3.25%* 3.00%*
Rate of pension increase 1.00% 1.00% - -
Initial weighted average health care trend rate - - 5.90% 5.90%
Ultimate weighted average health care trend rate - - 4.00% 4.00%
Year ultimate rate reached - - 2040 2040
* Applicable to executive employees only.
58
80
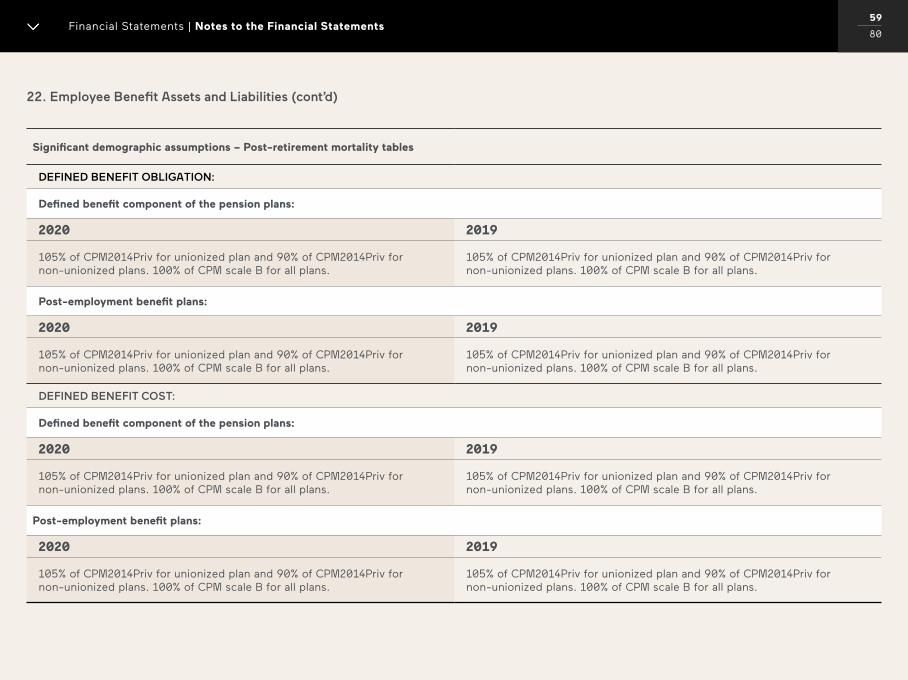
00 / 00 Financial Statements | Notes to the Financial Statements
22. Employee Benefit Assets and Liabilities (cont’d)
Significant demographic assumptions – Post-retirement mortality tables
DEFINED BENEFIT OBLIGATION:
Defined benefit component of the pension plans:
2020 2019
105% of CPM2014Priv for unionized plan and 90% of CPM2014Priv for non-unionized plans. 100% of CPM scale B for all plans.
105% of CPM2014Priv for unionized plan and 90% of CPM2014Priv for non-unionized plans. 100% of CPM scale B for all plans.
Post-employment benefit plans:
2020 2019
105% of CPM2014Priv for unionized plan and 90% of CPM2014Priv for non-unionized plans. 100% of CPM scale B for all plans.
105% of CPM2014Priv for unionized plan and 90% of CPM2014Priv for non-unionized plans. 100% of CPM scale B for all plans.
DEFINED BENEFIT COST:
Defined benefit component of the pension plans:
2020 2019
105% of CPM2014Priv for unionized plan and 90% of CPM2014Priv for non-unionized plans. 100% of CPM scale B for all plans.
105% of CPM2014Priv for unionized plan and 90% of CPM2014Priv for non-unionized plans. 100% of CPM scale B for all plans.
Post-employment benefit plans:
2020 2019
105% of CPM2014Priv for unionized plan and 90% of CPM2014Priv for non-unionized plans. 100% of CPM scale B for all plans.
105% of CPM2014Priv for unionized plan and 90% of CPM2014Priv for non-unionized plans. 100% of CPM scale B for all plans.
59
80
00 / 00 Financial Statements | Notes to the Financial Statements
22. Employee Benefit Assets and Liabilities (cont’d)
Risk associated with defined benefit plans
The major risk associated with the pension plans is the funding risk, which is the risk that the investment asset growth and the contributions to the pension plans will not be sufficient to cover the pension obligations, resulting in unfunded liabilities.
The funding risk is linked to the following risks: investment risk, interest rate risk, longevity risk, salary risk and inflation risk.
Investment risk: The present value of the defined benefit plan liability is calculated using a discount rate determined by reference to high quality Canadian corporate bond yields; if the return on plan asset is below this rate, it will create a plan deficit. Consequently, the Corporation has adopted a conservative investment policy which is overseen by the Audit & Pension Investment Committee of the Board.
Interest rate risk: A decrease in the bond interest rate will increase the plan liability; however, due to a liability alignment investment policy, this will be partially offset by an increase in value on the plan’s investments in fixed income securities.
Longevity risk: The present value of the defined plan liability is calculated by reference to the best estimate of the mortality of plan participants both during and after their employment. An increase in the life expectancy of the plan participants will increase the plan’s liability.
Salary risk: The present value of the defined benefit plan liability is calculated by reference to the future salaries of plan participants. As such, an increase in the salary of the plan participants will increase the plan’s liability.
Inflation risk: A significant proportion of the defined benefit liability is linked to inflation. An increase in the inflation rate will increase the Corporation’s liability. A portion of the plan assets are in real returns bonds which will mitigate some of the effects of inflation.
60
80
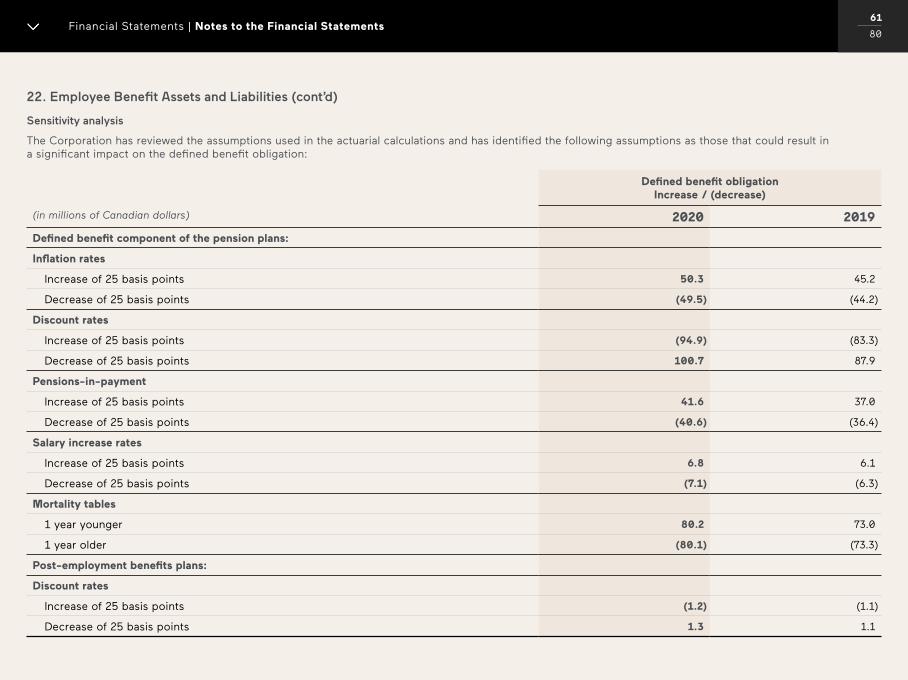
00 / 00 Financial Statements | Notes to the Financial Statements
22. Employee Benefit Assets and Liabilities (cont’d)
Sensitivity analysis
The Corporation has reviewed the assumptions used in the actuarial calculations and has identified the following assumptions as those that could result in a significant impact on the defined benefit obligation:
(in millions of Canadian dollars)
Defined benefit obligation Increase / (decrease)
2020 2019
Defined benefit component of the pension plans:
Inflation rates
Increase of 25 basis points 50.3 45.2
Decrease of 25 basis points (49.5) (44.2)
Discount rates
Increase of 25 basis points (94.9) (83.3)
Decrease of 25 basis points 100.7 87.9
Pensions-in-payment
Increase of 25 basis points 41.6 37.0
Decrease of 25 basis points (40.6) (36.4)
Salary increase rates
Increase of 25 basis points 6.8 6.1
Decrease of 25 basis points (7.1) (6.3)
Mortality tables
1 year younger 80.2 73.0
1 year older (80.1) (73.3)
Post-employment benefits plans:
Discount rates
Increase of 25 basis points (1.2) (1.1)
Decrease of 25 basis points 1.3 1.1
61
80
00 / 00 Financial Statements | Notes to the Financial Statements
22. Employee Benefit Assets and Liabilities (cont’d)
In the sensitivity analysis presented above, the present value of the defined benefit obligation has been calculated using the projected unit credit method at the end of the reporting period, which is the same method as the one applied in calculating the defined benefit obligation recognized in the Statement of Financial Position.
There was no change in the methods and assumptions used in preparing the sensitivity analysis from prior years.
Asset-liability matching strategies
The Corporation reassesses the pension plans investment policy annually to take into account material changes in plan demographics, the investment environment, and the financial circumstances of the plans as well as changes in risk tolerance. Every few years or when significant changes in circumstances warrant it, the Corporation will conduct a more complete asset liability modelling exercise to determine an optimal investment policy asset mix.
The current asset mix, with its sizable allocation to fixed income securities and income based alternative investments, provides a significant amount of interest rate hedging compared to plan liabilities. This policy posture is expected to deliver a lower volatility of required funding while preserving ongoing funding costs at an acceptable level, when considering the plan maturity profile.
b) Defined contribution component of the pension plan
The expense for the defined contribution component of the pension plan for the year ended December 31, 2020 is $1.4 million (December 31, 2019: $1.0 million). The employer contributions are expected to be $1.5 million in 2021.
62
80
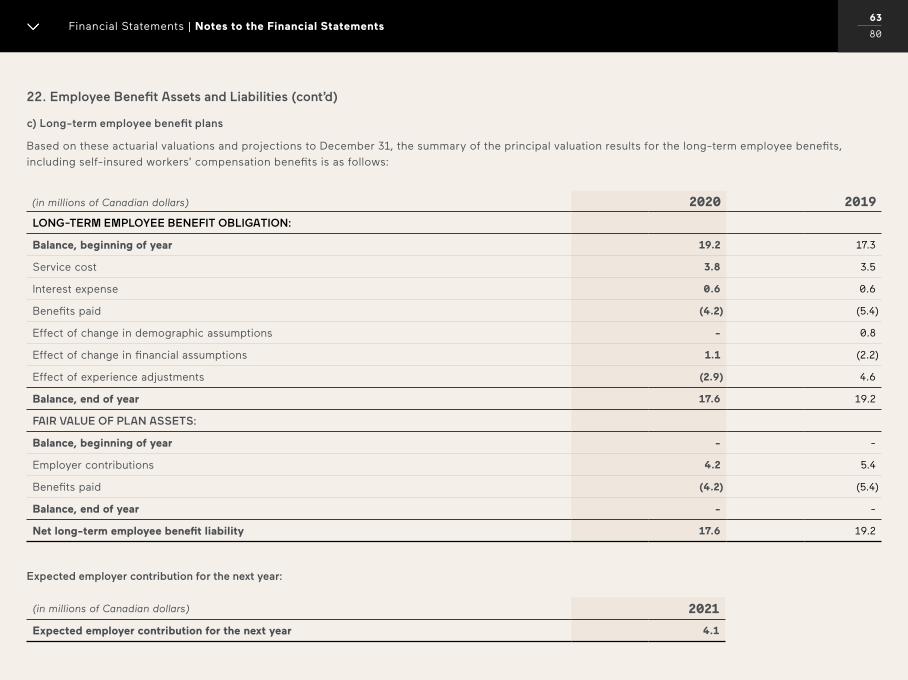
00 / 00 Financial Statements | Notes to the Financial Statements
22. Employee Benefit Assets and Liabilities (cont’d)
c) Long-term employee benefit plans
Based on these actuarial valuations and projections to December 31, the summary of the principal valuation results for the long-term employee benefits,
including self-insured workers’ compensation benefits is as follows:
(in millions of Canadian dollars) 2020 2019
LONG-TERM EMPLOYEE BENEFIT OBLIGATION:
Balance, beginning of year 19.2 17.3
Service cost 3.8 3.5
Interest expense 0.6 0.6
Benefits paid (4.2) (5.4)
Effect of change in demographic assumptions - 0.8
Effect of change in financial assumptions 1.1 (2.2)
Effect of experience adjustments (2.9) 4.6
Balance, end of year 17.6 19.2
FAIR VALUE OF PLAN ASSETS:
Balance, beginning of year - -
Employer contributions 4.2 5.4
Benefits paid (4.2) (5.4)
Balance, end of year - -
Net long-term employee benefit liability 17.6 19.2
Expected employer contribution for the next year:
(in millions of Canadian dollars) 2021
Expected employer contribution for the next year 4.1
63
80
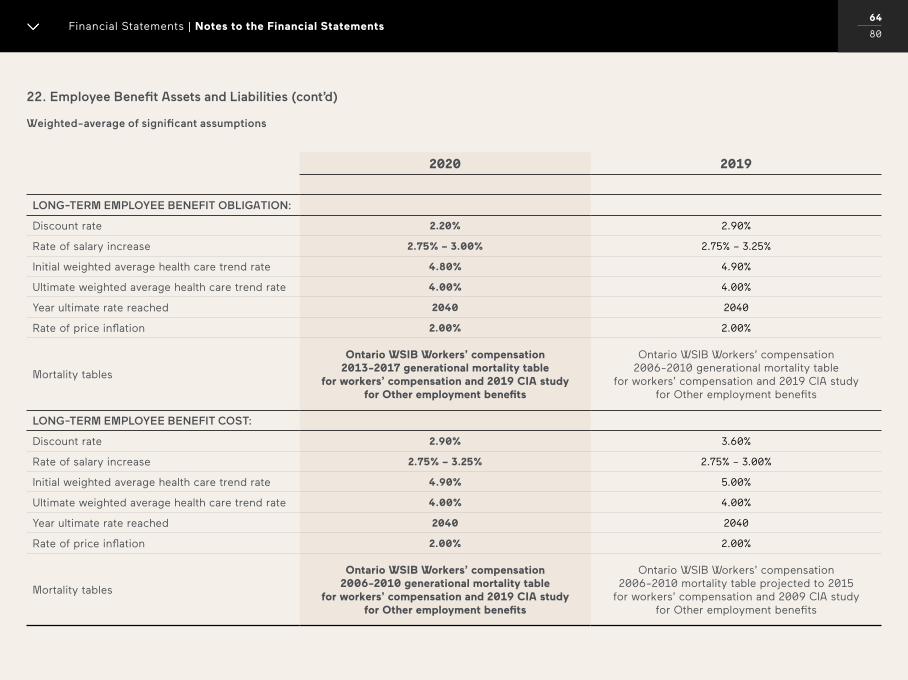
00 / 00 Financial Statements | Notes to the Financial Statements
22. Employee Benefit Assets and Liabilities (cont’d)
Weighted-average of significant assumptions
2020 2019
LONG-TERM EMPLOYEE BENEFIT OBLIGATION:
Discount rate 2.20% 2.90%
Rate of salary increase 2.75% – 3.00% 2.75% – 3.25%
Initial weighted average health care trend rate 4.80% 4.90%
Ultimate weighted average health care trend rate 4.00% 4.00%
Year ultimate rate reached 2040 2040
Rate of price inflation 2.00% 2.00%
Mortality tables
Ontario WSIB Workers’ compensation 2013-2017 generational mortality table
for workers’ compensation and 2019 CIA study for Other employment benefits
Ontario WSIB Workers’ compensation 2006-2010 generational mortality table
for workers’ compensation and 2019 CIA study for Other employment benefits
LONG-TERM EMPLOYEE BENEFIT COST:
Discount rate 2.90% 3.60%
Rate of salary increase 2.75% – 3.25% 2.75% – 3.00%
Initial weighted average health care trend rate 4.90% 5.00%
Ultimate weighted average health care trend rate 4.00% 4.00%
Year ultimate rate reached 2040 2040
Rate of price inflation 2.00% 2.00%
Mortality tables
Ontario WSIB Workers’ compensation 2006-2010 generational mortality table
for workers’ compensation and 2019 CIA study for Other employment benefits
Ontario WSIB Workers’ compensation 2006-2010 mortality table projected to 2015
for workers’ compensation and 2009 CIA study for Other employment benefits
64
80
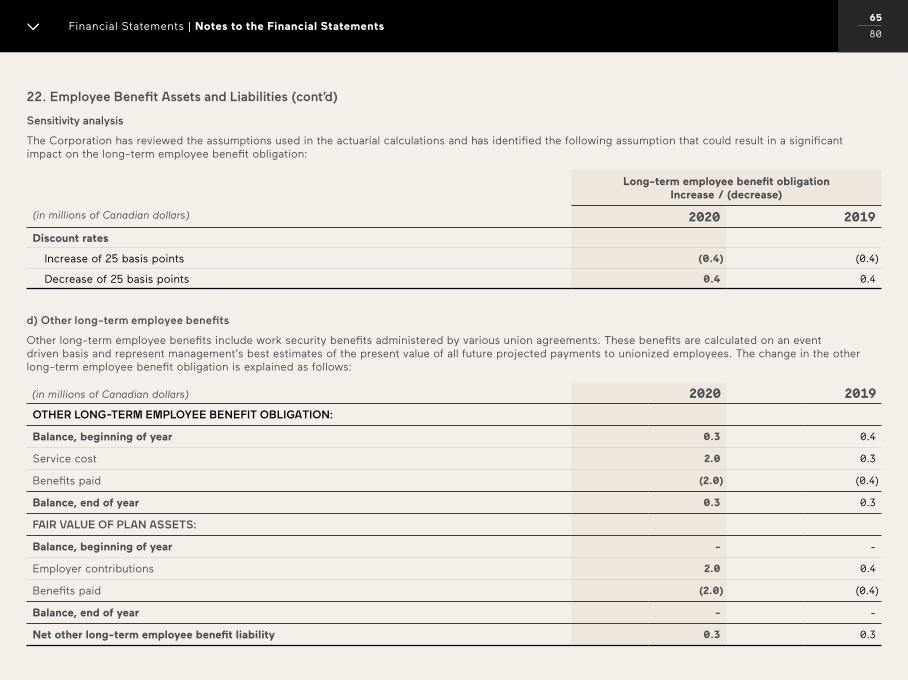
00 / 00 Financial Statements | Notes to the Financial Statements
22. Employee Benefit Assets and Liabilities (cont’d)
Sensitivity analysis
The Corporation has reviewed the assumptions used in the actuarial calculations and has identified the following assumption that could result in a significant impact on the long-term employee benefit obligation:
(in millions of Canadian dollars)
Long-term employee benefit obligation Increase / (decrease)
2020 2019
Discount rates
Increase of 25 basis points (0.4) (0.4)
Decrease of 25 basis points 0.4 0.4
d) Other long-term employee benefits
Other long-term employee benefits include work security benefits administered by various union agreements. These benefits are calculated on an event driven basis and represent management’s best estimates of the present value of all future projected payments to unionized employees. The change in the other long-term employee benefit obligation is explained as follows:
(in millions of Canadian dollars) 2020 2019
OTHER LONG-TERM EMPLOYEE BENEFIT OBLIGATION:
Balance, beginning of year 0.3 0.4
Service cost 2.0 0.3
Benefits paid (2.0) (0.4)
Balance, end of year 0.3 0.3
FAIR VALUE OF PLAN ASSETS:
Balance, beginning of year - -
Employer contributions 2.0 0.4
Benefits paid (2.0) (0.4)
Balance, end of year - -
Net other long-term employee benefit liability 0.3 0.3
65
80
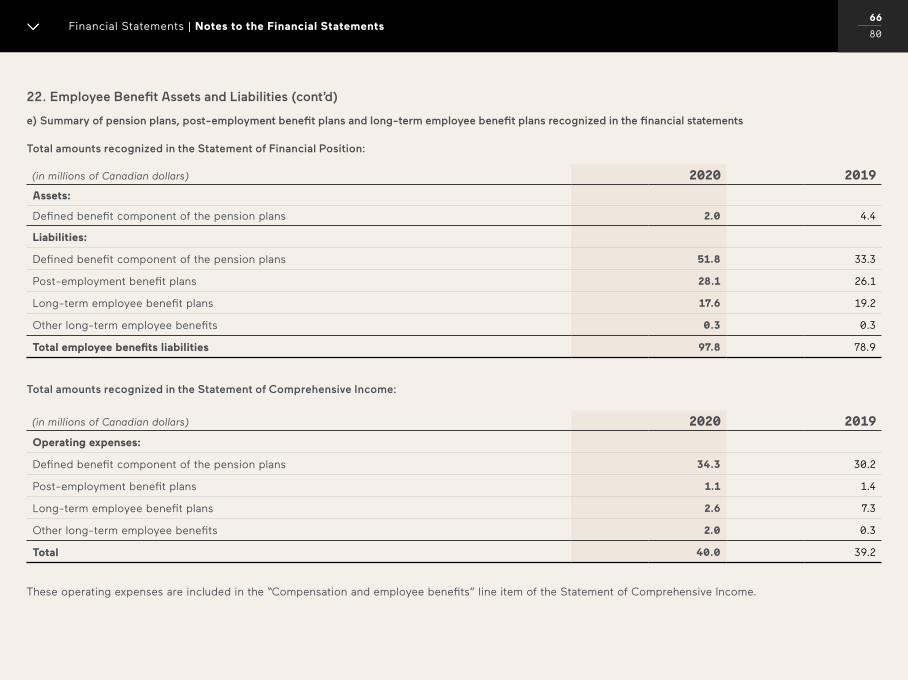
00 / 00 Financial Statements | Notes to the Financial Statements
22. Employee Benefit Assets and Liabilities (cont’d)
e) Summary of pension plans, post-employment benefit plans and long-term employee benefit plans recognized in the financial statements
Total amounts recognized in the Statement of Financial Position:
(in millions of Canadian dollars) 2020 2019
Assets:
Defined benefit component of the pension plans 2.0 4.4
Liabilities:
Defined benefit component of the pension plans 51.8 33.3
Post-employment benefit plans 28.1 26.1
Long-term employee benefit plans 17.6 19.2
Other long-term employee benefits 0.3 0.3
Total employee benefits liabilities 97.8 78.9
Total amounts recognized in the Statement of Comprehensive Income:
(in millions of Canadian dollars) 2020 2019
Operating expenses:
Defined benefit component of the pension plans 34.3 30.2
Post-employment benefit plans 1.1 1.4
Long-term employee benefit plans 2.6 7.3
Other long-term employee benefits 2.0 0.3
Total 40.0 39.2
These operating expenses are included in the “Compensation and employee benefits” line item of the Statement of Comprehensive Income.
66
80
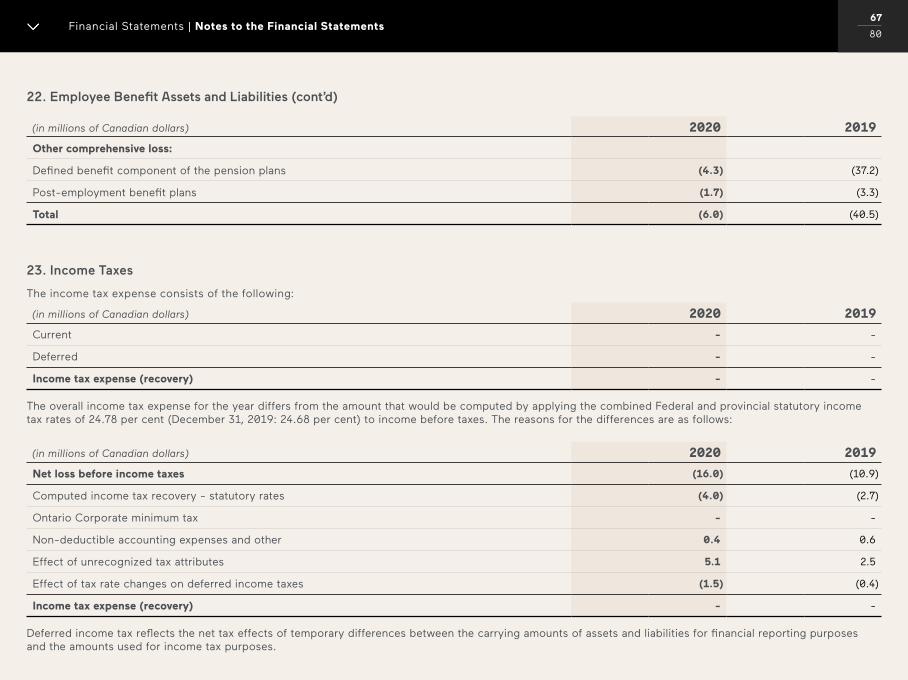
00 / 00 Financial Statements | Notes to the Financial Statements
22. Employee Benefit Assets and Liabilities (cont’d)
(in millions of Canadian dollars) 2020 2019
Other comprehensive loss:
Defined benefit component of the pension plans (4.3) (37.2)
Post-employment benefit plans (1.7) (3.3)
Total (6.0) (40.5)
23. Income Taxes
The income tax expense consists of the following:
(in millions of Canadian dollars) 2020 2019
Current - -
Deferred - -
Income tax expense (recovery) - -
The overall income tax expense for the year differs from the amount that would be computed by applying the combined Federal and provincial statutory income tax rates of 24.78 per cent (December 31, 2019: 24.68 per cent) to income before taxes. The reasons for the differences are as follows:
(in millions of Canadian dollars) 2020 2019
Net loss before income taxes (16.0) (10.9)
Computed income tax recovery - statutory rates (4.0) (2.7)
Ontario Corporate minimum tax - -
Non-deductible accounting expenses and other 0.4 0.6
Effect of unrecognized tax attributes 5.1 2.5
Effect of tax rate changes on deferred income taxes (1.5) (0.4)
Income tax expense (recovery) - -
Deferred income tax reflects the net tax effects of temporary differences between the carrying amounts of assets and liabilities for financial reporting purposes and the amounts used for income tax purposes.
67
80
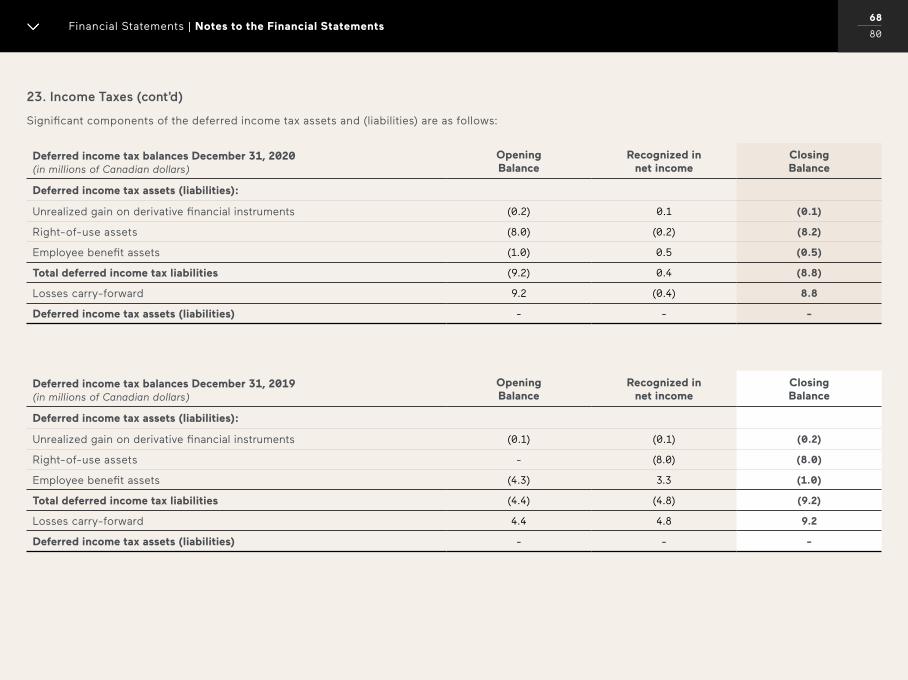
00 / 00 Financial Statements | Notes to the Financial Statements
23. Income Taxes (cont’d)
Significant components of the deferred income tax assets and (liabilities) are as follows:
Deferred income tax balances December 31, 2020 (in millions of Canadian dollars)
Opening Balance
Recognized in net income
Closing Balance
Deferred income tax assets (liabilities):
Unrealized gain on derivative financial instruments (0.2) 0.1 (0.1)
Right-of-use assets (8.0) (0.2) (8.2)
Employee benefit assets (1.0) 0.5 (0.5)
Total deferred income tax liabilities (9.2) 0.4 (8.8)
Losses carry-forward 9.2 (0.4) 8.8
Deferred income tax assets (liabilities) - - -
Deferred income tax balances December 31, 2019 (in millions of Canadian dollars)
Opening Balance
Recognized in net income
Closing Balance
Deferred income tax assets (liabilities):
Unrealized gain on derivative financial instruments (0.1) (0.1) (0.2)
Right-of-use assets - (8.0) (8.0)
Employee benefit assets (4.3) 3.3 (1.0)
Total deferred income tax liabilities (4.4) (4.8) (9.2)
Losses carry-forward 4.4 4.8 9.2
Deferred income tax assets (liabilities) - - -
68
80
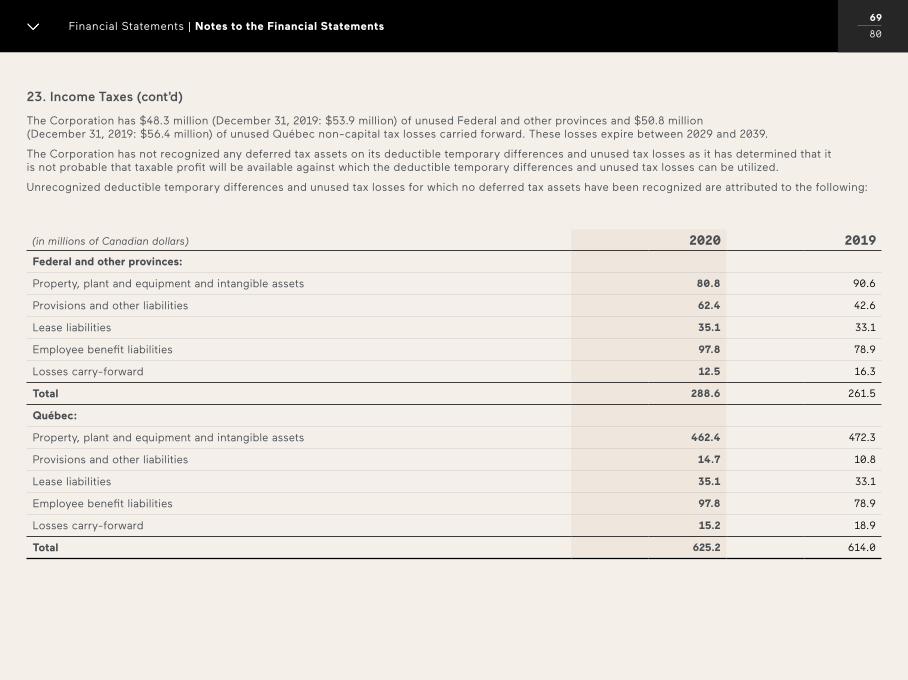
00 / 00 Financial Statements | Notes to the Financial Statements
23. Income Taxes (cont’d)
The Corporation has $48.3 million (December 31, 2019: $53.9 million) of unused Federal and other provinces and $50.8 million (December 31, 2019: $56.4 million) of unused Québec non-capital tax losses carried forward. These losses expire between 2029 and 2039.
The Corporation has not recognized any deferred tax assets on its deductible temporary differences and unused tax losses as it has determined that it is not probable that taxable profit will be available against which the deductible temporary differences and unused tax losses can be utilized.
Unrecognized deductible temporary differences and unused tax losses for which no deferred tax assets have been recognized are attributed to the following:
(in millions of Canadian dollars) 2020 2019
Federal and other provinces:
Property, plant and equipment and intangible assets 80.8 90.6
Provisions and other liabilities 62.4 42.6
Lease liabilities 35.1 33.1
Employee benefit liabilities 97.8 78.9
Losses carry-forward 12.5 16.3
Total 288.6 261.5
Québec:
Property, plant and equipment and intangible assets 462.4 472.3
Provisions and other liabilities 14.7 10.8
Lease liabilities 35.1 33.1
Employee benefit liabilities 97.8 78.9
Losses carry-forward 15.2 18.9
Total 625.2 614.0
69
80
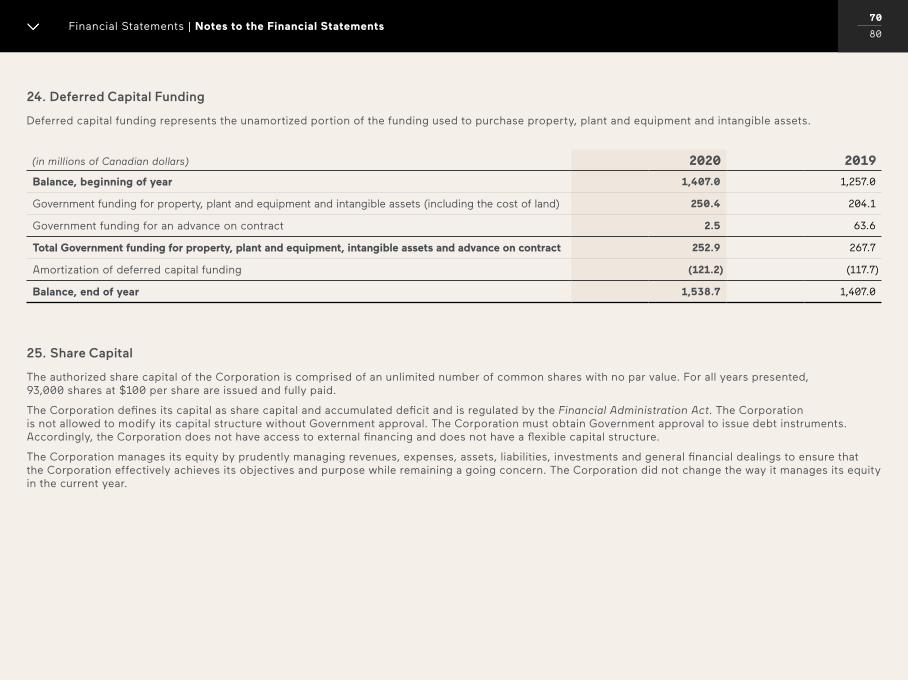
00 / 00 Financial Statements | Notes to the Financial Statements
24. Deferred Capital Funding
Deferred capital funding represents the unamortized portion of the funding used to purchase property, plant and equipment and intangible assets.
(in millions of Canadian dollars) 2020 2019
Balance, beginning of year 1,407.0 1,257.0
Government funding for property, plant and equipment and intangible assets (including the cost of land) 250.4 204.1
Government funding for an advance on contract 2.5 63.6
Total Government funding for property, plant and equipment, intangible assets and advance on contract 252.9 267.7
Amortization of deferred capital funding (121.2) (117.7)
Balance, end of year 1,538.7 1,407.0
25. Share Capital
The authorized share capital of the Corporation is comprised of an unlimited number of common shares with no par value. For all years presented, 93,000 shares at $100 per share are issued and fully paid.
The Corporation defines its capital as share capital and accumulated deficit and is regulated by the Financial Administration Act. The Corporation is not allowed to modify its capital structure without Government approval. The Corporation must obtain Government approval to issue debt instruments. Accordingly, the Corporation does not have access to external financing and does not have a flexible capital structure.
The Corporation manages its equity by prudently managing revenues, expenses, assets, liabilities, investments and general financial dealings to ensure that the Corporation effectively achieves its objectives and purpose while remaining a going concern. The Corporation did not change the way it manages its equity in the current year.
70
80
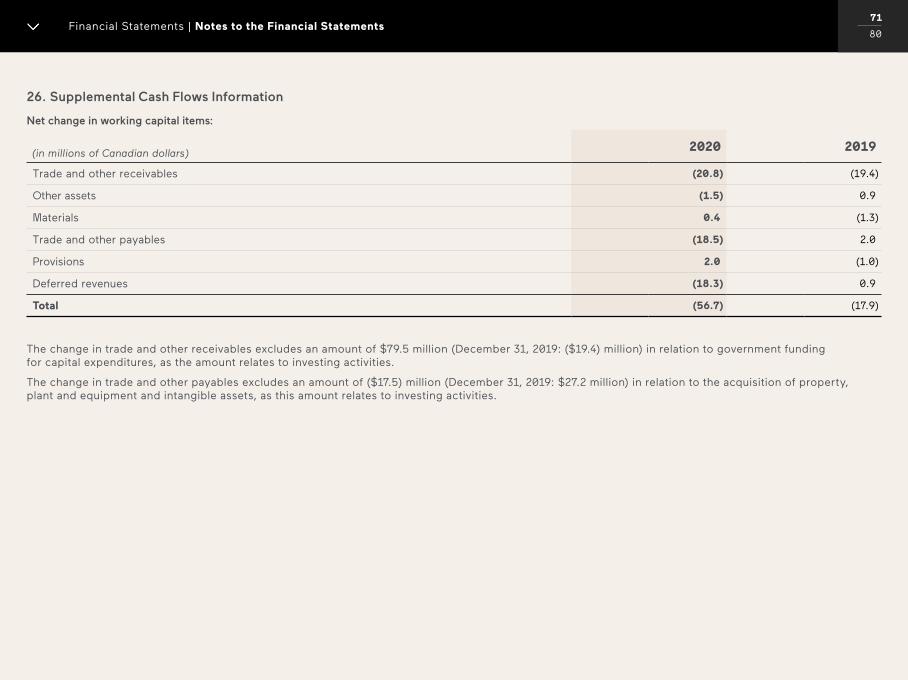
00 / 00 Financial Statements | Notes to the Financial Statements
26. Supplemental Cash Flows Information
Net change in working capital items:
(in millions of Canadian dollars)
2020 2019
Trade and other receivables (20.8) (19.4)
Other assets (1.5) 0.9
Materials 0.4 (1.3)
Trade and other payables (18.5) 2.0
Provisions 2.0 (1.0)
Deferred revenues (18.3) 0.9
Total (56.7) (17.9)
The change in trade and other receivables excludes an amount of $79.5 million (December 31, 2019: ($19.4) million) in relation to government funding for capital expenditures, as the amount relates to investing activities.
The change in trade and other payables excludes an amount of ($17.5) million (December 31, 2019: $27.2 million) in relation to the acquisition of property, plant and equipment and intangible assets, as this amount relates to investing activities.
71
80
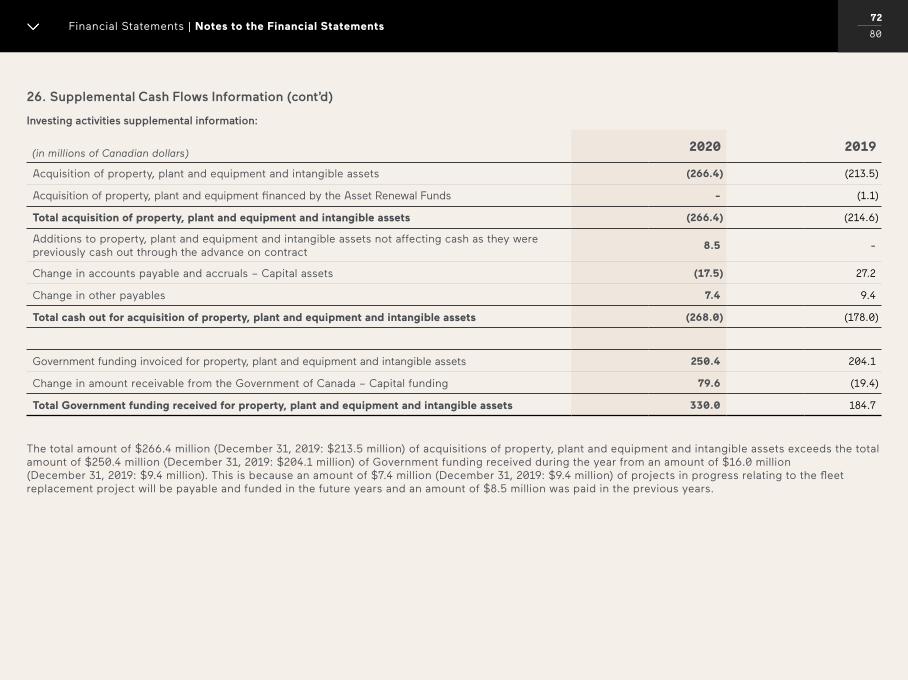
00 / 00 Financial Statements | Notes to the Financial Statements
26. Supplemental Cash Flows Information (cont’d)
Investing activities supplemental information:
(in millions of Canadian dollars)
2020 2019
Acquisition of property, plant and equipment and intangible assets (266.4) (213.5)
Acquisition of property, plant and equipment financed by the Asset Renewal Funds - (1.1)
Total acquisition of property, plant and equipment and intangible assets (266.4) (214.6)
Additions to property, plant and equipment and intangible assets not affecting cash as they were previously cash out through the advance on contract
8.5 -
Change in accounts payable and accruals – Capital assets (17.5) 27.2
Change in other payables 7.4 9.4
Total cash out for acquisition of property, plant and equipment and intangible assets (268.0) (178.0)
Government funding invoiced for property, plant and equipment and intangible assets 250.4 204.1
Change in amount receivable from the Government of Canada – Capital funding 79.6 (19.4)
Total Government funding received for property, plant and equipment and intangible assets 330.0 184.7
The total amount of $266.4 million (December 31, 2019: $213.5 million) of acquisitions of property, plant and equipment and intangible assets exceeds the total amount of $250.4 million (December 31, 2019: $204.1 million) of Government funding received during the year from an amount of $16.0 million (December 31, 2019: $9.4 million). This is because an amount of $7.4 million (December 31, 2019: $9.4 million) of projects in progress relating to the fleet replacement project will be payable and funded in the future years and an amount of $8.5 million was paid in the previous years.
72
80
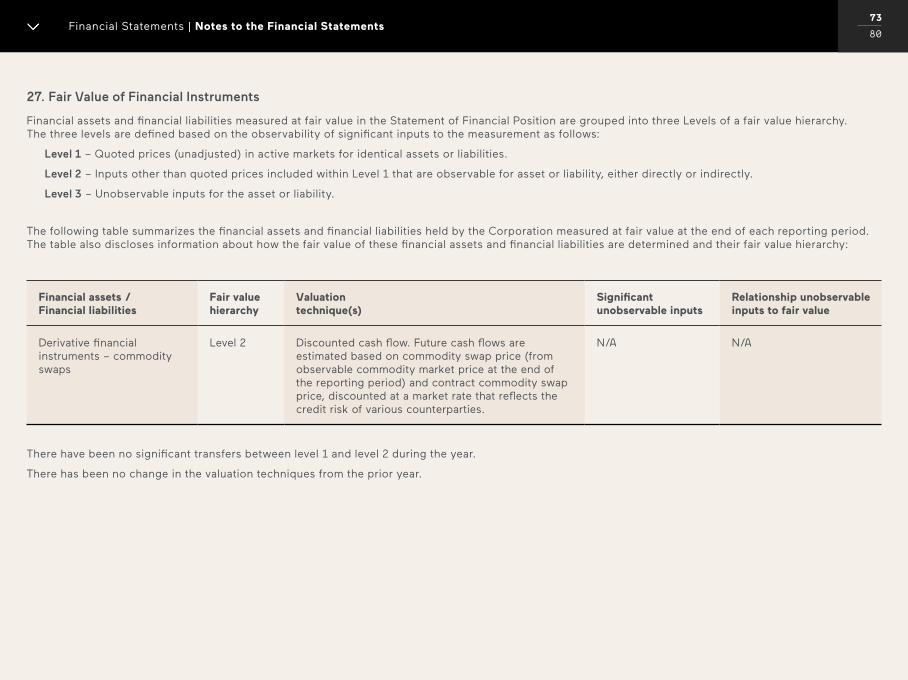
00 / 00 Financial Statements | Notes to the Financial Statements
27. Fair Value of Financial Instruments
Financial assets and financial liabilities measured at fair value in the Statement of Financial Position are grouped into three Levels of a fair value hierarchy. The three levels are defined based on the observability of significant inputs to the measurement as follows:
Level 1 – Quoted prices (unadjusted) in active markets for identical assets or liabilities.
Level 2 – Inputs other than quoted prices included within Level 1 that are observable for asset or liability, either directly or indirectly.
Level 3 – Unobservable inputs for the asset or liability.
The following table summarizes the financial assets and financial liabilities held by the Corporation measured at fair value at the end of each reporting period.The table also discloses information about how the fair value of these financial assets and financial liabilities are determined and their fair value hierarchy:
Financial assets / Financial liabilities
Fair value hierarchy
Valuation technique(s)
Significant unobservable inputs
Relationship unobservable inputs to fair value
Derivative financial instruments – commodity swaps
Level 2 Discounted cash flow. Future cash flows are estimated based on commodity swap price (from observable commodity market price at the end of the reporting period) and contract commodity swap price, discounted at a market rate that reflects the credit risk of various counterparties.
N/A N/A
There have been no significant transfers between level 1 and level 2 during the year.
There has been no change in the valuation techniques from the prior year.
73
80
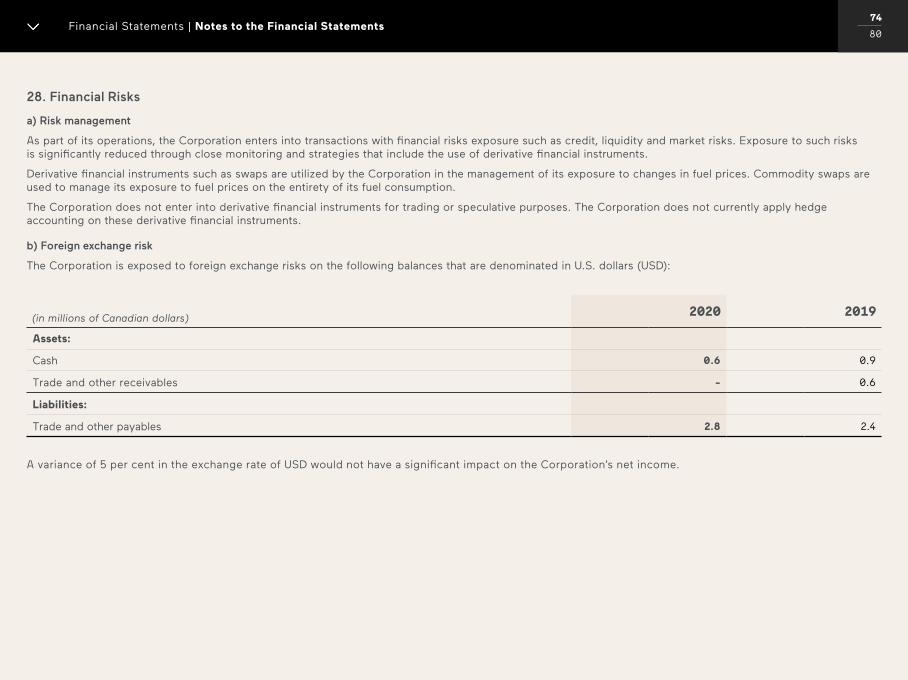
00 / 00 Financial Statements | Notes to the Financial Statements
28. Financial Risks
a) Risk management
As part of its operations, the Corporation enters into transactions with financial risks exposure such as credit, liquidity and market risks. Exposure to such risks is significantly reduced through close monitoring and strategies that include the use of derivative financial instruments.
Derivative financial instruments such as swaps are utilized by the Corporation in the management of its exposure to changes in fuel prices. Commodity swaps are used to manage its exposure to fuel prices on the entirety of its fuel consumption.
The Corporation does not enter into derivative financial instruments for trading or speculative purposes. The Corporation does not currently apply hedge accounting on these derivative financial instruments.
b) Foreign exchange risk
The Corporation is exposed to foreign exchange risks on the following balances that are denominated in U.S. dollars (USD):
(in millions of Canadian dollars)
2020 2019
Assets:
Cash 0.6 0.9
Trade and other receivables - 0.6
Liabilities:
Trade and other payables 2.8 2.4
A variance of 5 per cent in the exchange rate of USD would not have a significant impact on the Corporation’s net income.
74
80
00 / 00 Financial Statements | Notes to the Financial Statements
28. Financial Risks
c) Credit risk
Credit risk is the risk that one party to a financial instrument might not meet its obligations under the terms and conditions of the agreement. The carrying amount of financial assets is $27.4 million (December 31, 2019: $13.8 million) and represents the Corporation’s maximum exposure to credit risk. The Corporation does not use credit derivatives or similar instruments to mitigate this risk and, as such, the maximum exposure is the full carrying value or face value of its financial assets. The Corporation minimizes credit risk on cash, the Asset Renewal Fund and derivative financial instruments by dealing only with reputable and high-quality financial institutions. The Corporation’s exposure to credit risks on trade accounts receivable is reduced by applying a credit policy that establishes limits on the concentration of risk, requires assessing and monitoring of counterparty credit risk and sets credit limits. Only Canadian Government departments and agencies, Crown corporations issuing government travel warrants and travel agents who are members of the International Air Transport Association (Billing and Settlement Plan/Airline Reporting Corporation) are exempt from the Corporation’s credit approval process.
As at December 31, 2020, approximately 7.6 per cent (December 31, 2019: 8.6 per cent) of trade accounts receivable were over 90 days past due, while approximately 78.2 per cent (December 31, 2019: 71.8 per cent) of trade accounts receivable were current (under 30 days).
As at December 31, 2020, the loss allowance was $0.3 million (December 31, 2019: $0.2 million). The loss allowance is a forward-looking expected credit loss model based on past default experience of the debtor, adjusted as appropriated to reflect current conditions and estimates of future economic conditions.
d) Fuel price risk
In order to manage its exposure to changes in fuel prices and minimize volatility in operating cash flows, the Corporation enters into derivative contracts with financial intermediaries based on the price of a commodity (i.e. heating oil) or a market index. A fluctuation of 5 per cent in the USD price of heating oil or fuel would not have a significant impact on the financial statements.
e) Liquidity risk
The Corporation manages its liquidity risk by preparing and monitoring detailed forecasts of cash flows from operations and anticipated investing and funding activities. The liquidity risk is low since the Corporation does not have debt instruments to service and receives regular funding from the Government of Canada.
75
80
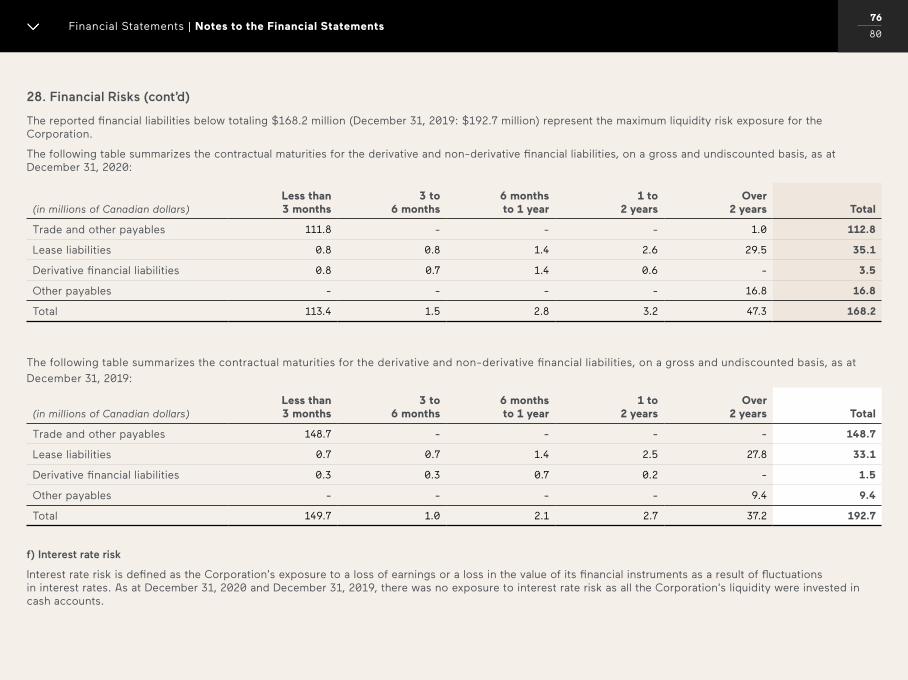
00 / 00 Financial Statements | Notes to the Financial Statements
28. Financial Risks (cont’d)
The reported financial liabilities below totaling $168.2 million (December 31, 2019: $192.7 million) represent the maximum liquidity risk exposure for the Corporation.
The following table summarizes the contractual maturities for the derivative and non-derivative financial liabilities, on a gross and undiscounted basis, as at December 31, 2020:
(in millions of Canadian dollars)Less than 3 months
3 to 6 months
6 months to 1 year
1 to 2 years
Over 2 years Total
Trade and other payables 111.8 - - - 1.0 112.8
Lease liabilities 0.8 0.8 1.4 2.6 29.5 35.1
Derivative financial liabilities 0.8 0.7 1.4 0.6 - 3.5
Other payables - - - - 16.8 16.8
Total 113.4 1.5 2.8 3.2 47.3 168.2
The following table summarizes the contractual maturities for the derivative and non-derivative financial liabilities, on a gross and undiscounted basis, as at
December 31, 2019:
(in millions of Canadian dollars)Less than 3 months
3 to 6 months
6 months to 1 year
1 to 2 years
Over 2 years Total
Trade and other payables 148.7 - - - - 148.7
Lease liabilities 0.7 0.7 1.4 2.5 27.8 33.1
Derivative financial liabilities 0.3 0.3 0.7 0.2 - 1.5
Other payables - - - - 9.4 9.4
Total 149.7 1.0 2.1 2.7 37.2 192.7
f) Interest rate risk
Interest rate risk is defined as the Corporation’s exposure to a loss of earnings or a loss in the value of its financial instruments as a result of fluctuations in interest rates. As at December 31, 2020 and December 31, 2019, there was no exposure to interest rate risk as all the Corporation’s liquidity were invested in cash accounts.
76
80
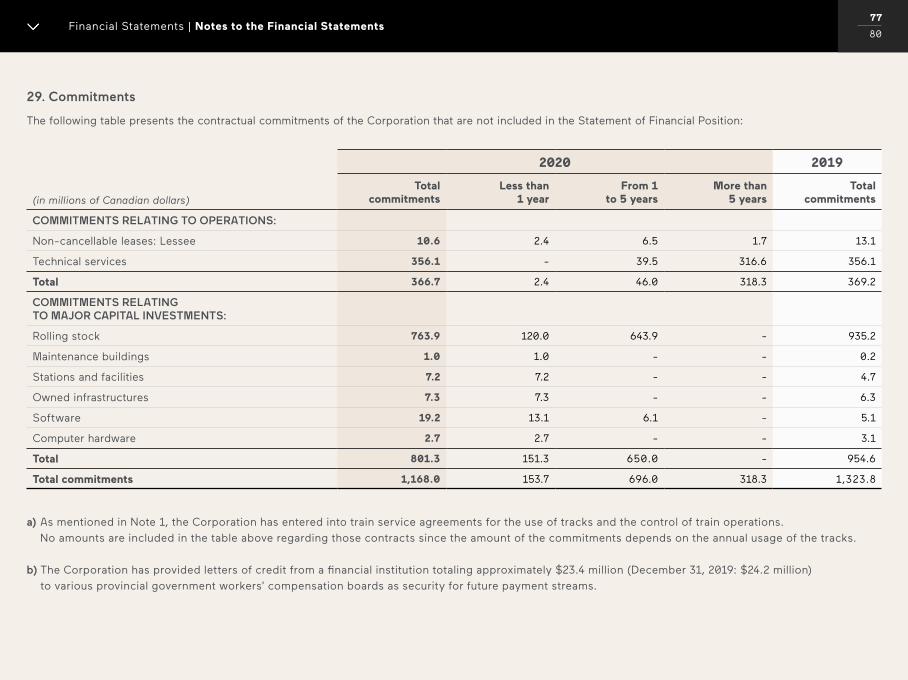
00 / 00 Financial Statements | Notes to the Financial Statements
29. Commitments
The following table presents the contractual commitments of the Corporation that are not included in the Statement of Financial Position:
2020 2019
(in millions of Canadian dollars)Total
commitmentsLess than
1 yearFrom 1
to 5 yearsMore than
5 yearsTotal
commitments
COMMITMENTS RELATING TO OPERATIONS:
Non-cancellable leases: Lessee 10.6 2.4 6.5 1.7 13.1
Technical services 356.1 - 39.5 316.6 356.1
Total 366.7 2.4 46.0 318.3 369.2
COMMITMENTS RELATING TO MAJOR CAPITAL INVESTMENTS:
Rolling stock 763.9 120.0 643.9 - 935.2
Maintenance buildings 1.0 1.0 - - 0.2
Stations and facilities 7.2 7.2 - - 4.7
Owned infrastructures 7.3 7.3 - - 6.3
Software 19.2 13.1 6.1 - 5.1
Computer hardware 2.7 2.7 - - 3.1
Total 801.3 151.3 650.0 - 954.6
Total commitments 1,168.0 153.7 696.0 318.3 1,323.8
a) As mentioned in Note 1, the Corporation has entered into train service agreements for the use of tracks and the control of train operations.
No amounts are included in the table above regarding those contracts since the amount of the commitments depends on the annual usage of the tracks.
b) The Corporation has provided letters of credit from a financial institution totaling approximately $23.4 million (December 31, 2019: $24.2 million)
to various provincial government workers’ compensation boards as security for future payment streams.
77
80
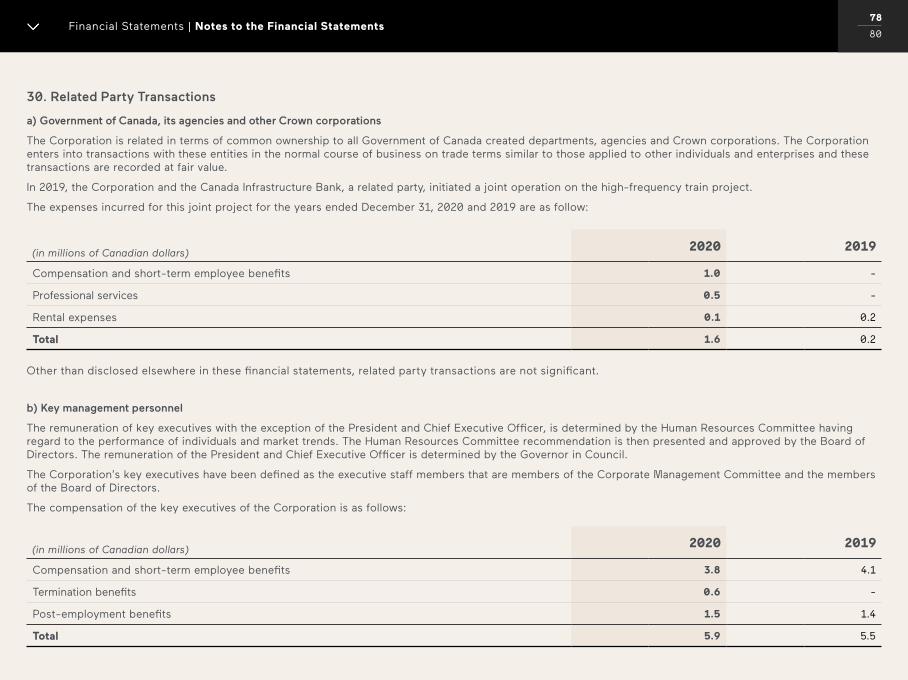
00 / 00 Financial Statements | Notes to the Financial Statements
30. Related Party Transactions
a) Government of Canada, its agencies and other Crown corporations
The Corporation is related in terms of common ownership to all Government of Canada created departments, agencies and Crown corporations. The Corporation enters into transactions with these entities in the normal course of business on trade terms similar to those applied to other individuals and enterprises and these transactions are recorded at fair value.
In 2019, the Corporation and the Canada Infrastructure Bank, a related party, initiated a joint operation on the high-frequency train project.
The expenses incurred for this joint project for the years ended December 31, 2020 and 2019 are as follow:
(in millions of Canadian dollars)
2020 2019
Compensation and short-term employee benefits 1.0 -
Professional services 0.5 -
Rental expenses 0.1 0.2
Total 1.6 0.2
Other than disclosed elsewhere in these financial statements, related party transactions are not significant.
b) Key management personnel
The remuneration of key executives with the exception of the President and Chief Executive Officer, is determined by the Human Resources Committee having regard to the performance of individuals and market trends. The Human Resources Committee recommendation is then presented and approved by the Board of Directors. The remuneration of the President and Chief Executive Officer is determined by the Governor in Council.
The Corporation’s key executives have been defined as the executive staff members that are members of the Corporate Management Committee and the members of the Board of Directors.
The compensation of the key executives of the Corporation is as follows:
(in millions of Canadian dollars)
2020 2019
Compensation and short-term employee benefits 3.8 4.1
Termination benefits 0.6 -
Post-employment benefits 1.5 1.4
Total 5.9 5.5
78
80
00 / 00 Financial Statements | Notes to the Financial Statements
30. Related Party Transactions (cont’d)
The Corporation may enter into transactions with corporations who employ close family members of key management personnel or Directors of the Board. These transactions are made in the normal course of business and are recorded at fair value. These transactions are not significant for the years ended December 31, 2020 and December 31, 2019.
c) Transactions with post-employment benefits plans
Transactions with the Corporation’s post-employment benefits plans are conducted in the normal course of business. The transactions with the Corporation’s post-employment benefit plans consist of contributions as determined by actuarial valuations, as disclosed in Note 22. There were no other significant transactions
during the year.
31. Non-Monetary Transactions
The Corporation recorded revenue from non-monetary transactions of approximately $0.5 million for the year ended December 31, 2020 (December 31, 2019: $2.1 million) under “Revenues from passengers” in the Statement of Comprehensive Income. The Corporation also recorded expenses from non-monetary transactions of approximately $0.6 million (December 31, 2019: $1.7 million) mainly under “Marketing and sales” in the Statement of Comprehensive Income. The nature of non-monetary transactions is mainly related to advertising activities.
79
80
Financial Statements | Notes to the Financial Statements
32. Contingencies
a) Environment
The Corporation’s operations are subject to numerous federal, provincial, and municipal environmental laws and regulations concerning among other things, the management of air emissions, wastewater, hazardous materials, wastes and soil contamination as well as the management and decommissioning of underground and aboveground storage tanks. A risk of environmental liability is inherent in railroad and related transportation operations, real estate ownership and other activities of the Corporation with respect to both current and past operations.
The Corporation has performed a review of all of its operations and of all of its sites and facilities at risk in order to determine the potential environmental risks. The sites and the facilities for which environmental risks were identified were or will be the subject of thorough studies and corrective actions were or will be taken if necessary in order to eliminate or to mitigate these risks. The continuous risk management process that is in place allows the Corporation to monitor its activities and properties under normal operating conditions as well as monitor accidents that occur. The properties likely to be contaminated or the activities or property, plant and equipment likely to cause a contamination are addressed, at the moment of their observation, by the development of an action plan according to the nature and the importance of the impact and the applicable requirements.
When remediation costs can be reasonably estimated, a provision is recorded based on the anticipated future costs (refer to Note 19).
However, the Corporation’s ongoing efforts to identify potential environmental concerns that may be associated with its properties may lead to future environmental investigations, which may result in the identification of additional environmental costs and liabilities. The magnitude of such additional liabilities and the costs of complying with environmental laws and containing or remediating contamination cannot be reasonably estimated due to:
(i) the lack of specific technical information available with respect to many sites;
(ii) the absence of any third-party claims with respect to particular sites;
(iii) the uncertainty regarding the ability to recover costs from any third parties with respect to particular sites;
(iv) the fact that the environmental responsibility has not been clearly attributed.
There can thus be no assurance that material liabilities or costs related to environmental matters will not be incurred in the future, or will not have a material adverse effect on the Corporation’s financial position.
b) Asset retirement
The Corporation has entered into certain operating leases where the lessor has the option of requesting that the land/structures or the other assets be returned in the same condition as they were originally leased, or of retaking control of these assets without any compensation to the Corporation for any additions or modifications made to the initial assets. Given the nature of the assets under contract and the options available to the lessor, the asset retirement obligation cannot be reasonably estimated. No liability has been recognized in the financial statements.
80
80

Corporate Directory
Corporate Directory01
02

Chairperson of the Board of DirectorsFrançoise Bertrand Montréal, Québec
Board MembersCynthia Garneau Montréal, Québec
Kathy Baig Laval, Québec
Grant Christoff Vancouver, British Columbia
Daniel Gallivan Halifax, Nova Scotia
Jonathan Goldbloom Montréal, Québec Miranda Keating Erickson Calgary, Alberta
Jane Mowat Toronto, Ontario
Glenn Rainbird Belleville, Ontario
Gail Stephens Victoria, British Columbia
Kenneth Tan Richmond, British Columbia
Geneviève Tanguay Montréal, Québec
Vianne Timmons Regina, Saskatchewan
Management TeamCynthia Garneau President and Chief Executive Officer
Marie-Claude Cardin Chief Financial Officer
Sonia Corriveau Chief Business Transformation Officer
Ben Marc Diendéré Chief Public Affairs and Communications Officer
Martin R Landry Chief Commercial Officer
Jean-François Legault Chief Legal and Risk Officer
Dominique Lemay Chief Operating Officer
Martine Rivard Chief Employee Experience Officer
Corporate SecretaryArden Furlotte Corporate Secretary
VIA Rail Office LocationsHeadquarters and Québec
3 Place Ville Marie Suite 500 Montréal, Québec H3B 2C9 514 871-6000
895 de la Gauchetière West Montréal, Québec H3B 4G1 514 989-2626
Atlantic
1161 Hollis Street Halifax, Nova Scotia B3H 2P6 902 494-7900
viarail.ca
Corporate Directory02
02
Ontario
123 Front Street West Suite 1500 Toronto, Ontario M5J 2M3 416 956-7600
West
146 -123 Main Street Winnipeg, Manitoba R3C 1A3 204 949-7483
1150 Station Street Vancouver, British Columbia V6A 4C7 604 640-3700
This directory reflects the 2021 VIA Rail structure as of the date of publication of this Annual Report.

Editor
Paul Molpeceres Corporate Communications, VIA Rail
Writer
Rick Petersen BLU Communications
Graphic design
Gauthier Designers
Contributors
Ben Marc Diendéré Chief Public Affairs and
Communications Officer
Contributors to the 2020 Annual Report
@viarailcanada
viarailcanada
VIA Rail Canada
@VIA_Rail
VIARailCanadaInc