Embed Size (px)
Citation preview

Journal of Communications and Information Networks, Vol.4, No.1, Mar. 2019 Research paper
Anomalous Power-Usage Behavior Detection fromSmart Home Wireless Communications
Jian Mao, Shishi Zhu, Jingdong Bian, Qixiao Lin, Jianwei Liu
Abstract—With the rapid development of Internet ofthings (IoT) technologies, smart home systems are gettingmore and more popular in our daily life. Besides provid-ing convenient functionality and tangible bene★ts, smarthome systems expose users to security risks. In this paper,we proposed SHGuard, an anomaly detection approachbased on power usage data exposed from wireless commu-nications in the smart home system. SHGuard monitorsand collects the electricity-usage data sent from the smartsockets. Based on the collected data, we developed amethod to identify/infer the type of device and formallyde★ned the user behavior pattern according to the deviceevent features, e.g., frequent sequence pattern set, thesupport degree, the sequence length and the occurrencetime of the power changing event. SHGuard extracts andbuilds the normal behavior pattern during the initializa-tion stage. It continuously infers the smart devices’ statesby monitoring the electricity usage data and updates theuser behavior patterns. Any abnormal behaviors will bedetected once the current user behavior pattern deviatesfrom the original pattern. We prototyped our method andevaluated SHGuard using UCI dataset. The experimentresults illustrated the ef★ciency of SHGuard.
Keywords—smart home, anomaly detection, Internet ofthings, wireless communication, network security
I. INTRODUCTION
R ecent years, the concept of Internet of things (IoT), con-necting every device in different scenarios, has been
Manuscript received Feb. 28, 2019; accepted Mar. 06, 2019. This workwas supported in part by the National Key R&D Program of China (No.2017YFB0802400), and the National Natural Science Foundation of China(Nos. 61402029, 61871023, U11733115). The associate editor coordinatingthe review of this paper and approving it for publication was W. Zhang.
J. Mao, S. S. Zhu, Q. X. Lin, J. W. Liu. School of Cyber Sci-ence and Technology, Beihang University, Beijing 100191, China (e-mail:[email protected]; [email protected]; [email protected]; [email protected]).
S. S. Zhu, J. D. Bian. School of Electronic and Information Engineer-ing, Beihang University, Beijing 100191, China (e-mail: [email protected];[email protected]).
widely known and accepted. Smart home, as a typical ap-plication of IoT, provides a more convenient, safe and intel-ligent life through activity recognition, event trigger, remotedevices access and control[1]. The typical smart home plat-forms include Samsung’s SmartThings, Amazon’s Echo, Ap-ple’s HomeKit, Vera Control’s Vera3, Google’s Weave/Brilloand AllSeen Alliance’s AllJoyn. Currently, the major concernof the most smart home manufacturers is the functionality oftheir systems rather than the security. This leads to a lot ofsevere security problems.
The security problems in smart home systems could be cat-egorized into three aspects: device security, protocol secu-rity and platform security. For example, at the device level,a smart light can be used as a convert channel to leak pri-vacy information[2]. At the protocol level, researchers iden-ti★ed a ☆aw from the mechanism of con★rming user’s phys-ical proximity in the smart lock BLE protocol[3]. It resultsin the fact that user’s intended operations cannot be executedcorrectly and intruders can gain unauthorized access. At theplatform level, Samsung’s SmartThings platform deploys acoarse-grained access control mechanism. Therefore, adver-saries can steal user’s sensitive data through malicious appli-cations and cause safety problems, such as burglary[4]. Tab. 1summaries security issues in the smart home environment.
To enhance the security of smart home systems, a lot of ef-forts have been devoted to design a ★ne-grained permissionmechanism to eliminate over-privilege problems and preventrelated attacks. For example, Jia et al.[11] proposed ContexIoT,a context-based permission system that helps users performeffective access control by providing integrate ★ne-grainedcontext to identify actions’ sensibility. Fernandes et al.[12]
proposed the FlowFence system, requiring applications thatuse sensitive data to declare their expected data ☆ow patternsand only allowing the declared data ☆ow while blocking otherundeclared ☆ows.
The existing schemes of the permission model are system-level solutions deployed at the server side, which means de-ploying these solutions in the smart home system needs thecooperation of platform servers or manufacturers. Moreover,users are required to participate in deciding whether to grantthe application’s permission or not. Frequent requests maygreatly affect the user experience and undermine the availabil-

14 Journal of Communications and Information Networks
Table 1 Smart home security issues
Aspect Description Attack vector Platform Reference
Device security
Remote control deviceWeak/default password; Identity authentication information inthe image; Unprotected debug interface
Device supportingremote login
[5-7]
Information leakage/use of☆ash to induce epilepsy
Unsafe device pairing program Smart LED light [2]
Secret surveillance Malware installed on the device Sony surveillance camera [8]
Spyware Pre-installed malicious ★rmware Scanning machine [9]
Protocol security
Device stealing data Unable to handle duplicate names in LAN Bonjour-enabled devices [10]
Unlock the door lock Misuse BLE range to con★rm the user’s physical proximity BLE smart lock [3]
BLE relay unlockMisuse BLE range to con★rm the user’s physical proximity;BLE replay attack
BLE smart lock [3]
Platform security
Code injection attack Stealing an OAuth token; Inject attack commands into smart app SmartThings [4]
Snif★ng door lock password Coarse-grained binding between smart app and smart device SmartThings [4]
Disable holiday mode Abuse the logic of benign smart app for event spoo★ng SmartThings [4]
Fake alarm Control device does not give appropriate permissions SmartThings [4]
Door lock access recordrevocation
Failure to ensure state consistency between device and server DGC door lock [3]
ity of the smart home system, considering the original inten-tion of smart home is to provide users with convenient servicesrather than disturbing them. In addition, the effectiveness ofthese user-aided solutions heavily depends on the users’ secu-rity awareness. It is a challenge for a user with few securityexperiences to make right decisions, and somehow may causecon☆icts on access control rules.
Our observation and intuition. The power-usage be-havior reveals a user’s habit, which can distinguish a nor-mal user’s operations from attacks. However, the traditionalway of obtaining power consumption data usually requiresretro★tting existing equipments to add a data acquisition com-ponent. In a typical smart home system, smart sockets areused to connect traditional appliances. In order to increaseusability and portability, we systematically study the smarthome wireless communication protocol and capture powerconsumption data from the wireless communication betweensmart switches and the Hub.
There are signi★cant differences among the power-usagecurves of different household appliances, e.g., Fig. 1(a) andFig. 1(b) show the power curves of an oven and a microwaveoven. Intuitively, the type of electrical appliances can be iden-ti★ed according to the features of the appliances’ power usagecurves. Furthermore, there are correlations between events ofusing a particular electrical appliance, which re☆ects user’spower-usage behavior. For instance, Alice usually turns onthe dishwasher after using the microwave oven, and Bob ismore likely to use the oven after using the microwave oven.In the smart home system, devices might be remotely con-trolled by attackers without causing the users’ caution. How-ever, no matter how the devices are controlled by attackers ordamaged accidentally, it will inevitably cause a power-usage
(a) (b)
Figure 1 Power curve of oven and microwave oven: (a) oven power; (b)microwave oven power
behavior deviation compared with the normal status.In this paper, we present SHGuard, an anomalous power-
usage behavior detection scheme based on smart home wire-less communication. SHGuard collects the power consump-tion data sent by smart sockets during the wireless communi-cation process. We build power consumption feature modelsto identify the appliance type based on the power consump-tion data and establish power-usage behavior dataset. Further,the sequential pattern mining algorithm is utilized to extracta user’s power-usage behaviors pattern, and the feature vec-tor set is created based on the power-usage behavior patternand related features. Based on the power-usage behavior se-quence set, we use classi★cation learning algorithms and trainan anomaly detector. SHGuard is a lightweight anomaly de-tection solution that can be executed without affecting the nor-mal usage of smart home devices and achieves a high detec-tion rate. Compared with the rule-based schemes discussedabove, anomaly detection is more user-friendly on accountthat the detecting process is transparent for users.
Contributions. In summary, we make the following con-tributions in this paper.
• We analyze the smart home wireless communication

Anomalous Power-Usage Behavior Detection from Smart Home Wireless Communications 15
protocol, develop a method to capture users’ power consump-tion data without affecting the normal operation of the smartdevices/appliances, and present an approach to identify thedevice type based on the power usage data.
• We propose an approach to detect anomaly behaviorscaused by remote attacks or internal damages by checkingconsistency of the current power-usage behavior and the user’snormal power-usage patterns.
• We prototype our approach and evaluate it by deploy-ing six learning classi★ers. The data set is from “individualhousehold electric power consumption data set” in the UCIdatabase. The evaluation results show that our approach iseffective and achieves a high detection rate (The highest F1scores in three experiments are 0.917, 0.898, and 0.842, re-spectively).
Paper organization. The rest of this paper is organizedas follows. Section II analyzes the vulnerability of the smarthome wireless communication protocol, proposes the methodof collecting power data, and introduces the architecture ofour scheme. Section III describes the design of our scheme,including the method of identifying the type of devices byusing electricity usage data and detecting anomaly based onpower-usage pattern. Section IV presents the implementationin detail and evaluates our scheme. We discuss closely relatedwork in section V and conclude the paper in section VI.
II. APPLIANCE POWER-USAGE ANALYSISVIA WIRELESS COMMUNICATIONS
We take the MiHome smart home wireless communicationprotocol as a case study to analyze the possibility of powerconsumption data acquisition without changing the devices.Tab. 2 illustrates the symbols used in this paper.
A. Analysis of Smart Home Wireless CommunicationProtocol
As shown in Fig. 2(a), in a smart home system, speci★-cally, in the MiHome system, smart switches/sockets1 con-nected with devices/appliances communicate with smart gate-way via ZigBee protocol. The gateway manages all the smartsockets and connects with the router through WiFi protocol tocommunicate to Xiaomi’s server.
The wireless communication protocol is based on UDP, andthe packet is not encrypted. When the collection device ac-cesses the local area network, it can arbitrarily initiate a re-quest for querying the status of a smart socket. It sends a uni-cast device status request packet to the UDP port 9898 of thesmart home gateway (The format of request packet is shown inTab. 3). The gateway returns a device status response packet
1In this paper, we use smart switches and sockets interchangeably.
Table 2 Notation list
Symbol Description
APj an appliance D a user electricity usage data, D ∈ D , |D |= n d date of collection, 3-tuple ds , de start date, end date of a power-usage behavior
FP a frequent sequence pattern set, |FP|= f L a labeled power-usage behavior data, L ∈ L , |L |= l
M
power consumption feature model of
an appliance, M∈ M , |M |= m N occurrence number vector
P a frequent sequence pattern
Pm, Rm,T m, Wm
rated power, duty ratio, work period, power consumption
of an appliance model
Ps occurrence set of FP
R duty ratio of a power-usage behavior
Rr, Tr, Wrduty ratio, work period, power consumption range
of an appliance
S a power-usage behavior sequence, |S|= c
SD support degree set of FP
SΣ support degree sum of a sequence
T duration of a power-usage behavior
t time of collection
∆ t power consumption sampling interval
ts, te start time, end time of a power-usage behavior
type type of an unknown household appliance
w power consumption of an appliance in ∆ t
wr power consumption range of a power-usage behavior
Table 3 Device status request packet format
Command Device identity
(cmd) (sid)
Table 4 Device status response packet format
Command Device type Device identity Device short identity Data
(cmd) (model) (sid) (short id) (data)
(shown in Tab. 4). The request and response are transmitted inplaintext and no access control measures have been taken. So,the power consumption of the currently connected appliancecan be obtained from the status information of the device, andwe can perform further analysis.
B. Obtaining Electrical Power Consumption DataAccording to the aforementioned analysis of smart home
wireless communication protocols, we can deploy a collectiondevice to obtain the power consumption data of the appliancethrough the smart socket and establish the user’s power-usage

16 Journal of Communications and Information Networks
WiFiZigBee
(a)
Router
WiFi ZigBee
SH-GW
(b)
Router
WiFi ZigBee
SH-GW
SHGuard
(c)
Figure 2 Smart home security issue and our intuition: (a) attacks to smart home; (b) anomaly caused by attacks; (c) anomaly based solution
dataset. The acquisition of the user’s power-usage dataset in-cludes three phases, gateway discovery phase, device identityrequest phase, and device status request phase.
• In gateway discovery phase, the collection device sendsthe smart home gateway discovery packet to the UDP multi-cast address and the smart home gateway sends a smart homegateway response packet to the collection device including itsown IP address and port number.
• In device identity request phase, the collection devicesends a target device sid request packet to the smart homegateway and the smart home gateway sends the target devicesid reponse packet to the collection device.
• In device status request phase, the collection devicesends a target device status request packet to the smart homegateway and the smart home gateway sends a target devicestatus response packet to the collection device.
The communication ☆ow is shown in Fig. 3. The targetdevice status response packet contains the LoadPower ★eld,which indicates the power of the load connected to the cur-rent smart socket. The collection device reads the status ofthe smart socket once in every ∆ t, which is called the powerconsumption sampling interval. After the collection devicereceives the status response packet of the target device, thecollection device extracts the value of the LoadPower ★eld inthe packet, and the value represents the power of the appli-ance connected to the smart socket. An electricity usage datavector is de★ned as
Dx= (
dx, tx,wx), (1)
where w = value×∆ t represents the power consumption ofthe smart socket in the time interval ∆ t; d and t are the col-lection date and time, respectively.
Following the above method and collecting the power datarepeatedly, we establish a user electricity usage dataset D as
D = { Dx |
Dx= (dx, tx,wx), x = 1,2, · · · ,n}. (2)
The dataset records the current load of smart socket, dateand time, which is collected every minute and n is the numberof collections. Taking the Xiaomi air puri★er 2 as an example,
Smart home gateway discovery packet
Smart home gateway reply packet
Target device sid request packet
Target device sid reply packet
Target device status request packet
Target device status reply packet
Phase Ⅰ:
Gateway
discovery
Phase ⅠⅠ:
Device ⅠD
request
Phase ⅠⅠⅠ:
Status
request
ShGuard SH-GW
Figure 3 Smart socket network topology
Pow
er c
onsu
mpti
on/w
h
12
10
8
6
4
2
0
09:23:0
0
09:24:0
0
09:25:0
0
09:26:0
0
09:27:0
0
09:28:0
0
09:29:0
0
09:30:0
0
09:31:0
0
09:32:0
0
Time (in 11/01/2019)
4.8 4.9 5.04.8 5.1
9.7 9.6 9.7 9.5 9.5
Figure 4 Power consumption data of air puri★er
the power consumption data changing with time are shownin Fig. 4. Selecting the ★rst record as an example, the cor-
responding electricity usage data vector is D1= (
d1, t1,w1),
where d1= (11,01,2019), t1 = 9× 60+ 23 = 563, and w1 =
4.8.
C. Constructing Electrical Power Consumption FeatureModel
To identify different appliances, we need to select the mostrepresentative and highly differentiated features to modelthem. As can be seen from the power-usage curves of differ-ent household appliances in Fig. 1, there are great differencesbetween them, e.g., the waveform amplitudes, the work cycleand the shape of waveforms. The amplitude of the waveformrepresents the rated power of the electrical appliance. The

Anomalous Power-Usage Behavior Detection from Smart Home Wireless Communications 17
Testing
Normal power-usage behavior
sequence set
Power datacollection
Applianceidentification
Power-usage behavior sequence
Power-usage behavior
sequence DB
Power-usage behavior sequence
feature vectorgeneration
Appliance-usagestatus checker
Power-usage behaviorsequence feature
vector data set
Classification learning alg. DB
Sequencepattern mining
Training
Figure 5 Anomaly detection based on the power-usage pattern
rated power is the power of the electrical appliance duringnormal operation. The work cycle refers to the time appli-ances taken from the start to end. Still, in Fig. 1, the ★rst halfof the power-time waveform of the oven is constant, while thelatter half ☆uctuates between the minimum and maximum val-ues. This is because the oven needs to set a target temperaturewhen it is used. When the oven is turned on, the oven will con-tinue to work at the rated power until the target temperature isreached. Then, the oven will stop working. When the tem-perature drops to a low temperature threshold, the oven willstart again and heat up at the rated power. As for a microwaveoven, it operates at rated power from the time it is turned onuntil it reaches the set working time, and there is no stage inwhich heating is stopped. We use the duty ratio to measure the☆uctuation of the power-time waveform of different electricalappliances.
Speci★cally, in order to build the electrical power consump-tion feature model of an appliance APj, we should refer to thetechnical documents of all types. Here, we use i to repre-sent different versions of an appliance type and extract fea-tures of the appliance APji, including rated power (Pm ji),work period (T m ji), duty ratio (Rm ji), where the work pe-riod T m ji refers to the duration of one duty cycle, the dutyratio Rm ji refers to the percentage of time that the house-hold appliance works during one working cycle as a per-centage of the duty cycle. If the power consumption sam-pling interval is ∆ tm, then the power consumption is Wm ji =
Pm ji ×∆ tm. Then we extract the power consumption rangeWr j, the duty ratio range Rr j and the work period range Tr j
of an appliance based on features of every type, where Wr j =
[mini{Wm ji},max
i{Wm ji}], Rr j = [min
i{Rm ji},max
i{Rm ji}],
Tr j = [mini{T m ji},max
i{T m ji}]. The power consumption fea-
ture model of a household appliance APj is as
M j= (Wr j,Rr j,Tr j). (3)
If there are m types of household appliances, the household
appliance power consumption feature model set is de★ned asM = {
M j |
M j= (Wr j,Rr j,Tr j), j = 1,2, · · · ,m}}.
D. Identifying Types of Appliance and Creating PowerUsage Dataset
Given the user electricity usage dataset D , we divide thedata into l subsets according to the duty cycle in a chrono-logical order, and each subset represents a power-usage be-
havior. The start date of the kth subset is dsk and the end
date is dek. The start time of the kth subset, tsk, is the time
when the ★rst power is non-zero, and the end time, tek, isthe time when the last power is non-zero, and the total timeperiod where power consumption is not zero is tonk. Fromthe start to end of the kth power-usage behavior, the maxi-mum value of power consumption is wmaxk; the minimumvalue of power consumption is wmink; the power consump-tion range is wrk = [wmink,wmaxk]; duration is Tk; the dutyratio is Rk = tonk/Tk. Given the power consumption featuremodel library M , if the following three conditions hold, thenwe consider the kth subset as a power-usage behavior that us-ing the APj, that is, typek = j.
wrk ⊆Wr j,
Rk ∈ Rr j,
Tk ∈ Tr j.
(4)
For the kth subset, we construct a power-usage behaviorvector
Lk, the format is as
Lk= (
dsk,
dek, tsk, tek,Tk, typek). (5)
Then we get the power-usage behavior dataset L , L = { Lk
| Lk= (dsk,dek, tsk, tek,Tk, typek), k = 1,2, · · · , l}.
E. Approach OverviewIn the smart home system shown in Fig. 2(a), due to the se-
curity vulnerabilities of the wireless communication protocols

18 Journal of Communications and Information Networks
and other design problems, attackers may compromise andcontrol the smart device remotely. In addition, the intrudersmay also break into the empty house and damage the house-hold equipments. Although users usually cannot be awareof such security/safety incidents, these attacks inevitably willcause the anomalies in power usage (as shown in Fig. 2(b)).Motivated by this observation and the analysis results in Sec-tion A., we develop an anomaly-detection-based solution (asshown in Fig. 2(c)), which takes as input the power usage datafrom wireless communications, and extracts power-usage be-havior2 to determine whether the smart devices are in the se-cure status.
III. ANOMALY DETECTION BASED ONTHE POWER-USAGE BEHAVIORS
A. Overall Architecture of SHGuardThe overall architecture of SHGuard is shown in Fig. 5.
The system includes the following steps.1) Power-Usage Behavior Sequence Collection: We de-
ploy collection devices to request the current load powerfrom smart sockets via WiFi communications. Following themethod proposed in Section II., we get the user’s electricityusage dataset, containing the power recorded by the smartsocket. We identify appliance types using the electrical powerconsumption feature model and obtain a power-usage behav-ior dataset. We convert it into a sequence set for future pro-cessing.
2) Power-Usage Behavior Sequence Feature Vector Con-struction: Given the normal power-usage behavior sequenceset that we obtained through daily monitoring, we perform se-quential pattern mining to get a sequence pattern set, whichre☆ects the user’s power-usage pattern since the sequenceset only has normal sequences and without abnormal se-quences. Based on the power usage pattern, we process apower-usage behavior sequence (including normal and abnor-mal sequences) and further create the corresponding sequencefeature vectors, which consist of the features of the sequencepattern occurrence set, sum of support degrees, length of se-quence and the occurrence vector of each appliance. There-fore, we build a power-usage behavior sequence feature vectordataset.
3) Appliance-Status Checker Training: An anomaly de-tection classi★er, which is called “appliance-usage statuschecker”, is trained using the power-usage behavior sequencefeature vector dataset. It can determine whether there is anabnormality in the tested power-usage behavior sequence.
2In this paper, we de★ne a power-usage behavior as a complete work cycleof an appliance.
Normal Sq_1
Abnormal Sq_1
A: B: C: D: E:
9:05 10:31 11:42 13:45 21:10
(a)
Normal Sq_2
Abnormal Sq_2
A: B: C: D: E:
8:02 9:41 10:47 15:43 22:14
(b)
Figure 6 Abnormal power usage sequences: (a) additional power-usage be-havior occurs; (b) normal power-usage behavior are missing
4) Anomaly Detection: We use a collection device that ac-cesses the user’s WiFi LAN to request the current load powerfrom smart sockets continuously. The obtained data will beprocessed by the “appliance identi★cation” module. After se-rialization on a daily basis, the output is a power-usage behav-ior sequence, which consists of all power-usage behaviors inone day. It will then be used to generate a power-usage be-havior sequence feature vector and the “appliance-usage sta-tus checker” will take it as input and output the decision of thecurrent appliance usage status, that is “Yes” or “No”.
B. Appliance-Usage Event Vector Construction1) Constructing Sequence Set: From the scheme of identi-
fying devices via electricity usage data, we can get the power-usage behavior dataset L , which contains the user behaviorrecord of using appliances. The power-usage behavior datasetis converted into a sequence set on a daily basis, that is, thebehavior of using the electrical appliances in the same day isorganized into an ordered sequence S according to the occur-rence time of the behavior. A power-usage behavior sequenceS = <s1,s2, · · · ,sc>, where c represents the number of power-usage behaviors in S, that is, electricity appliances are used ctimes in this day.
2) Sequential Pattern Mining: The formal description ofsequential pattern mining is as follows: The ordered list ofelements constitutes a sequence, which can be expressed asS = <s1,s2, · · · ,sc>. If there is another sequence U , satisfy-ing that each ordered element in U is a subset of an orderedelement in S, then U is a subsequence of S. SPADE is a clas-sic sequential pattern mining algorithm that uses the classiccombination of join step and pruning step, and introduces avertical list database.
The support degree of the sequence S refers to the ratio of

Anomalous Power-Usage Behavior Detection from Smart Home Wireless Communications 19
the data sequences containing S to all data sequences. Se-quence pattern mining usually requires the user to specifya support degree threshold and ★nds all sequence patternswhose support degree is greater than or equal to the thresh-old. If the support degree of the sequence S is greater than orequal to the threshold, the sequence S is a sequential pattern.
We choose the SPADE algorithm to perform sequentialpattern mining on power-usage behavior sequence datasetand obtain a frequent sequence pattern set. By sequen-tial pattern mining, the frequent sequence pattern set FP =
{P1,P2, · · · ,Pf } is obtained and the corresponding support de-gree of each frequent sequence is SD = {sd1,sd2, · · · ,sd f }.
3) Generating Behavior Sequence Feature Vector: Givena power-usage behavior sequence S = <s1,s2, · · · ,sc>, ★nd allthe items belonging to S in the frequent sequence pattern setFP to construct the occurrence set Ps = {psx|x = 1,2, · · · , f}.Wherein, if Px is a subsequence of S, psx = 1; otherwisepsx = 0. The support degree sum SΣ of S is calculated asSΣ = ∑
fx=1(sdx × psx). For m types of electrical appliances,
we construct the generation time vector N j of the jth appliance
as N j= (n1,n2, · · · ,n24). Taking one hour as a time period, if
the jth appliance is used in the ★rst hour, n1 = 1; otherwisen1 = 0, and the rest can be assigned in the same manner.
Given the sequence pattern occurrence set Ps, the supportdegree sum SΣ of the sequence s, the number c of power-usagebehaviors in S and the occurrence vector
N j of each appliance
as features, the feature vector v of a power-usage behaviorsequence set is de★ned as
v = (Ps,SΣ ,c, N1, · · · ,
N j, · · · ,
Nm). (6)
IV. IMPLEMENTATION AND EVALUATION
We implemented SHGuard in Python. Our experimentswere performed on a PC with an Intel(R) Core(TM) i5-4570CPU @ 3.20 GHz and 4 GB of RAM on an Ubuntu system.
The “individual household electric power consumption dataset” of the UCI database records the electricity consumptionof a household from 2006 to 2010. From the dataset, we selectthe following items as the raw data:
• date and time;• total power consumption of dishwasher, oven, mi-
crowave oven (corresponding to kitchen);• total power consumption of washing machine, dryer, re-
frigerator, and a lamp (corresponding to the laundry room);• total power consumption of the water heater and air con-
ditioner.SHGuard identi★es the type of electrical appliances in the
dataset based on the power consumption feature model of theappliance, and builds the power-usage behavior dataset. Tab. 5shows the number of power usage behavior in dataset.
Table 5 Statistics on the number of power-usage behavior
Type of appliance Number of behavior
Dishwasher 21
Oven 754
Microwave oven 2 573
Washing machine 810
Dryer 1 229
Water heater 2 731
Air conditioning 3 091
In the anomaly detection phase, we use the power-usagebehavior dataset acquired above as the normal power-usagebehavior dataset. As for abnormal power-usage behavior se-quence, in this paper, “abnormal” includes two scenarios:(i) unusual additional power usage events occur (as shown inFig. 6(a)). The additional events are caused by the compro-mised devices controlled by attackers; (ii) normal power us-age behaviors are missing (as shown in Fig. 6(b)) because theattacker shut down the compromised devices or the appliancecrashed accidentally.
A. Data PreprocessingFor sequential pattern mining, we need to preprocess the
power-usage behaviors dataset and convert it into the stan-dard input data format of the SPADE algorithm, which iss = (sequenceID,eventID, item). The sequenceID indicatesthe sequence number, the eventID indicates the timestamp (inminutes) when the event occurred, and the item indicates thetype of events. In this paper, the item is de★ned as the type ofthe used appliance specially.
First, we sort power-usage behaviors by date and time.Then we distinguish the behavior of using the same appliancemultiple times in the same day. For example, on March 2,2007, the dryer was used twice, and the two behaviors weremarked as dryer1 and dryer2 respectively. We conduct ananalysis on the frequency of one type of appliances used perday. The statistical result shows that the proportion of morethan 5 times is less than 1%. Without loss of generality, wejust keep the ★rst 5 usage records and discard the rest usagerecords of the appliance. Second, the power-usage behaviorsin the same day constitute a sequence, and the start time ofeach power-usage behavior is converted into minutes as thetimestamp. Then add the sequence number and timestampfor each power-usage behavior as sequenceID and eventID toform a standard input data.
B. EvaluationIn the device type identi★cation phase, we use the power
consumption feature model to identify the normal power-usage behavior in the “individual household electric powerconsumption data set”, which includes 11 066 normal power-usage behaviors.
20 Journal of Communications and Information Networks
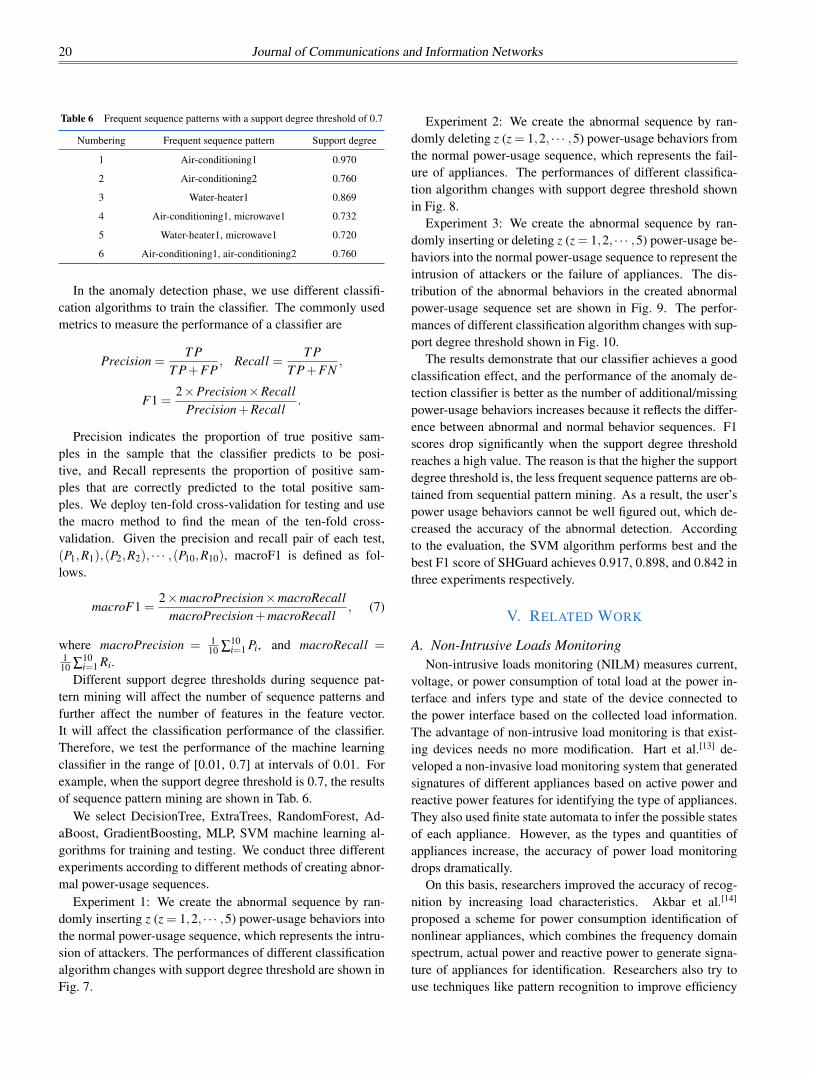
Table 6 Frequent sequence patterns with a support degree threshold of 0.7
Numbering Frequent sequence pattern Support degree
1 Air-conditioning1 0.970
2 Air-conditioning2 0.760
3 Water-heater1 0.869
4 Air-conditioning1, microwave1 0.732
5 Water-heater1, microwave1 0.720
6 Air-conditioning1, air-conditioning2 0.760
In the anomaly detection phase, we use different classi★-cation algorithms to train the classi★er. The commonly usedmetrics to measure the performance of a classi★er are
Precision =T P
T P+FP, Recall =
T PT P+FN
,
F1 =2×Precision×Recall
Precision+Recall.
Precision indicates the proportion of true positive sam-ples in the sample that the classi★er predicts to be posi-tive, and Recall represents the proportion of positive sam-ples that are correctly predicted to the total positive sam-ples. We deploy ten-fold cross-validation for testing and usethe macro method to ★nd the mean of the ten-fold cross-validation. Given the precision and recall pair of each test,(P1,R1),(P2,R2), · · · ,(P10,R10), macroF1 is de★ned as fol-lows.
macroF1 =2×macroPrecision×macroRecall
macroPrecision+macroRecall, (7)
where macroPrecision = 110 ∑
10i=1 Pi, and macroRecall =
110 ∑
10i=1 Ri.
Different support degree thresholds during sequence pat-tern mining will affect the number of sequence patterns andfurther affect the number of features in the feature vector.It will affect the classi★cation performance of the classi★er.Therefore, we test the performance of the machine learningclassi★er in the range of [0.01, 0.7] at intervals of 0.01. Forexample, when the support degree threshold is 0.7, the resultsof sequence pattern mining are shown in Tab. 6.
We select DecisionTree, ExtraTrees, RandomForest, Ad-aBoost, GradientBoosting, MLP, SVM machine learning al-gorithms for training and testing. We conduct three differentexperiments according to different methods of creating abnor-mal power-usage sequences.
Experiment 1: We create the abnormal sequence by ran-domly inserting z (z = 1,2, · · · ,5) power-usage behaviors intothe normal power-usage sequence, which represents the intru-sion of attackers. The performances of different classi★cationalgorithm changes with support degree threshold are shown inFig. 7.
Experiment 2: We create the abnormal sequence by ran-domly deleting z (z = 1,2, · · · ,5) power-usage behaviors fromthe normal power-usage sequence, which represents the fail-ure of appliances. The performances of different classi★ca-tion algorithm changes with support degree threshold shownin Fig. 8.
Experiment 3: We create the abnormal sequence by ran-domly inserting or deleting z (z = 1,2, · · · ,5) power-usage be-haviors into the normal power-usage sequence to represent theintrusion of attackers or the failure of appliances. The dis-tribution of the abnormal behaviors in the created abnormalpower-usage sequence set are shown in Fig. 9. The perfor-mances of different classi★cation algorithm changes with sup-port degree threshold shown in Fig. 10.
The results demonstrate that our classi★er achieves a goodclassi★cation effect, and the performance of the anomaly de-tection classi★er is better as the number of additional/missingpower-usage behaviors increases because it re☆ects the differ-ence between abnormal and normal behavior sequences. F1scores drop signi★cantly when the support degree thresholdreaches a high value. The reason is that the higher the supportdegree threshold is, the less frequent sequence patterns are ob-tained from sequential pattern mining. As a result, the user’spower usage behaviors cannot be well ★gured out, which de-creased the accuracy of the abnormal detection. Accordingto the evaluation, the SVM algorithm performs best and thebest F1 score of SHGuard achieves 0.917, 0.898, and 0.842 inthree experiments respectively.
V. RELATED WORK
A. Non-Intrusive Loads MonitoringNon-intrusive loads monitoring (NILM) measures current,
voltage, or power consumption of total load at the power in-terface and infers type and state of the device connected tothe power interface based on the collected load information.The advantage of non-intrusive load monitoring is that exist-ing devices needs no more modi★cation. Hart et al.[13] de-veloped a non-invasive load monitoring system that generatedsignatures of different appliances based on active power andreactive power features for identifying the type of appliances.They also used ★nite state automata to infer the possible statesof each appliance. However, as the types and quantities ofappliances increase, the accuracy of power load monitoringdrops dramatically.
On this basis, researchers improved the accuracy of recog-nition by increasing load characteristics. Akbar et al.[14]
proposed a scheme for power consumption identi★cation ofnonlinear appliances, which combines the frequency domainspectrum, actual power and reactive power to generate signa-ture of appliances for identi★cation. Researchers also try touse techniques like pattern recognition to improve ef★ciency

Anomalous Power-Usage Behavior Detection from Smart Home Wireless Communications 21
0.00 0.10 0.20 0.30 0.40 0.50 0.60 0.70
Support degree threshold
0.90
0.80
0.70
0.60
0.50
0.40
0.30
F1 s
core
AdaBoost ExtraTrees RandomForest SVM
DecisionTree GradientBoosting MLP
0.849
(a)
0.00 0.10 0.20 0.30 0.40 0.50 0.60 0.70
Support degree threshold
0.90
0.80
0.70
0.60
0.50
0.40
F1 s
core
AdaBoost ExtraTrees RandomForest SVM
DecisionTree GradientBoosting MLP
0.859
(b)
0.00 0.10 0.20 0.30 0.40 0.50 0.60 0.70
Support degree threshold
0.90
0.80
0.70
0.60
0.50
F1 s
core
AdaBoost ExtraTrees RandomForest SVM
DecisionTree GradientBoosting MLP
0.880
(c)
0.900
0.00 0.10 0.20 0.30 0.40 0.50 0.60 0.70
Support degree threshold
0.90
0.80
0.70
0.60
F1 s
core
AdaBoost ExtraTrees RandomForest SVM
DecisionTree GradientBoosting MLP
(d)
0.00 0.10 0.20 0.30 0.40 0.50 0.60 0.70
Support degree threshold
0.90
0.80
0.70
F1 s
core
AdaBoost ExtraTrees RandomForest SVM
DecisionTree GradientBoosting MLP
0.917
(e)
Figure 7 F1 changes with support degree threshold in the experiment 1: (a) 1 additional power usage event occurs; (b) 2 additional power usage events occur;(c) 3 additional power usage events occur; (d) 4 additional power usage events occur; (e) 5 additional power usage events occur
0.00 0.10 0.20 0.30 0.40 0.50 0.60 0.70
Support degree threshold
0.90
0.80
0.70
0.60
0.50
0.40
0.30
F1 s
core
0.847
AdaBoost ExtraTrees RandomForest SVM
DecisionTree GradientBoosting MLP
(a)
0.00 0.10 0.20 0.30 0.40 0.50 0.60 0.70
Support degree threshold
0.90
0.80
0.70
0.60
0.50
0.40
F1 s
core
0.856
AdaBoost ExtraTrees RandomForest SVM
DecisionTree GradientBoosting MLP
(b)
0.00 0.10 0.20 0.30 0.40 0.50 0.60 0.70
Support degree threshold
0.90
0.80
0.70
0.60
F1 s
core
0.865
AdaBoost ExtraTrees RandomForest SVM
DecisionTree GradientBoosting MLP
(c)
0.00 0.10 0.20 0.30 0.40 0.50 0.60 0.70
Support degree threshold
0.90
0.80
0.70
F1 s
core
0.881
AdaBoost ExtraTrees RandomForest SVM
DecisionTree GradientBoosting MLP
(d)
0.00 0.10 0.20 0.30 0.40 0.50 0.60 0.70
Support degree threshold
0.90
0.80
0.70
F1 s
core
0.898
AdaBoost ExtraTrees RandomForest SVM
DecisionTree GradientBoosting MLP
(e)
Figure 8 F1 changes with support degree in the experiment 2: (a) 1 power usage event is missing; (b) 2 power usage events are missing; (c) 3 power usageevents are missing; (d) 4 power usage events are missing; (e) 5 power usage events are missing
while ensuring the accuracy rate. Mueller et al.[15] used in-stantaneous power rather than step change in switching tran-sients as a feature and described behaviors of appliances basedon a hidden Markov model.
B. Security of IoT Communication ProtocolsThe IoT communication protocols are critical components
of an IoT system. Data transmissions among IoT devicesare achieved through different wireless communication pro-tocols (e.g., ZigBee, Z-Wave, bluetooth low energy (BLE),
WiFi and LTE-A). Recently, there are a lot of reports on theattacks to IoT communication protocols. Bonjour-enabled de-vices could be abused for performing the man-in-the-middleattack[10]. Attackers may perform the unlock operation by ex-ploiting the ☆aws in the smart lock BLE protocol[3]. To ana-lyze the security of related communication protocols, Granjalet al.[16] proposed a survey about existing protocols and mech-anisms of the IoT. Rahman et al.[17] explored the security ofconstrained application protocol (CoAP) over datagram trans-port layer security (DTLS). Chen et al.[18] compared the per-

22 Journal of Communications and Information Networks
Abnorm
alit
y d
istr
ibuti
on
170
160
150
140
130
120
110
100
90
80
1 additional b
ehavior
2 additional b
ehaviors
3 additional b
ehaviors
4 additional b
ehaviors
5 additional b
ehaviors
1 behavior miss
ing
2 behaviors miss
ing
3 behaviors miss
ing
4 behaviors miss
ing
5 behaviors miss
ing
145 143
131
140137
162 161
134
146
92
Figure 9 Number of different abnormal sequences in the experiment 3
0.00 0.10 0.20 0.30 0.40 0.50 0.60 0.70
Support degree threshold
0.90
0.85
0.80
0.75
0.70
0.65
0.60
0.55
0.50
0.45
F1 s
core
AdaBoost ExtraTrees RandomForest SVMDecisionTree GradientBoosting MLP
0.842
Figure 10 F1 changes with support degree threshold in the experiment 3
formances of IoT protocols, namely message queuing teleme-try transport (MQTT), CoAP, data distribution service (DDS)and a custom UDP-based protocol.
C. Security Enhancement of Smart Home1) Protection for Smart Home Communication Protocols:
Jose et al.[19] proposed a logic-based security algorithm toimprove smart home security. They classi★ed natural accesspoints as primary and secondary access points based on usage,and implemented logic-based detection by identifying normaluser behavior at these access points and requesting user au-thentication when necessary.
2) Design of a Secure Smart Home Hub: The hub commu-nicates with other smart home devices (e.g., smoke detectionsensors, etc.) through various short-range wireless communi-cation protocols (e.g., ZWave, ZigBee, etc.). Simpson et al.[20]
presented a secure smart home hub design that used a securitymanager located in a smart home hub to detect traf★c ☆ow.It learned all IoT devices at home and their usage patterns tointercept abnormal communication and protect vulnerable de-vices.
3) Assistance for Users to Properly Con★gure Devices:Most smart home platforms support user-customized trigger-ing rules to determine which devices could take action under
what conditions[21]. For example, IFTTT platform providesrule-making services by obtaining OAuth tokens on behalf ofusers. Fernandes et al.[22] found that IFTTT platform has somesecurity ☆aws, and attackers could abuse OAuth tokens be-longing to millions of users to manipulate their devices anddata. They designed a secure rule-making platform, dIFTTT,which used ★ne-grained OAuth tokens to ensure that attackerscannot abuse OAuths token to invoke unauthorized operations.
VI. CONCLUSION
In this paper, we proposed an anomaly detection ap-proach, SHGuard, based on power usage data exposed fromsmart home wireless communications. SHGuard captures theelectricity-usage data sent from the smart sockets. We pre-sented the method to identify the type of electricity devicesbased on the collected data and formally de★ned the user be-havior pattern according to the device event features. SH-Guard extracts and builds the normal behavior pattern dur-ing the initialization phase. It infers the smart devices’ statesby monitoring the electricity usage data and updates the userbehavior patterns. Any abnormal behaviors will be detectedonce the current user behavior pattern deviated from the orig-inal pattern. We evaluated SHGuard using UCI dataset andexperiment results illustrate the ef★ciency of SHGuard.
REFERENCES
[1] M. R. Alam, M. B. I. Reaz, M. A. M. Ali. A review of smart homes-past, present, and future [J]. IEEE Transactions on Systems, Man, andCybernetics, Part C (Applications and Reviews), 2012, 42(6): 1190-1203.
[2] E. Ronen, A. Shamir. Extended functionality attacks on IoT devices:The case of smart lights [C]//IEEE European Symposium on Securityand Privacy (EuroS&P), Saarbrucken, Germany, 2016: 3-12.
[3] G. Ho, D. Leung, P. Mishra, et al. Smart locks: Lessons for secur-ing commodity Internet of things devices [C]//Proceedings of the 11thACM on Asia Conference on Computer and Communications Security(ASIA CCS’16), Xi’an, China, 2016: 461-472.
[4] E. Fernandes, J. Jung, A. Prakash. Security analysis of emergingsmart home applications [C]//IEEE Symposium on Security and Pri-vacy (S&P), San Jose, California, USA, 2016: 636-654.
[5] Y. M. Pa Pa, S. Suzuki, K. Yoshioka, et al. IoTPOT: Analysing therise of IoT compromises [C]//Proceedings of the 9th USENIX Confer-ence on Offensive Technologies (WOOT’15), Washington, D.C., USA,2015: 9.
[6] T. Yu, V. Sekar, S. Seshan, et al. Handling a trillion (un★xable) ☆awson a billion devices: Rethinking network security for the Internet-of-Things [C]//Proceedings of the 14th ACM Workshop on Hot Topics inNetworks, Philadelphia, Pennsylvania, USA, 2015: 5.
[7] W. X. Qian, H. Y. Wu. Breaking smart speakers: We are listeningto you [C]//DEF CON 26—Hacking Conference, Las Vegas, Nevada,USA, 2018.
[8] Y. E. M. Guri, B. Zadov. Led-it-go: Leaking (a lot of) data from air-gapped computers via the (small) hard drive led [C]//Detection of Intru-

Anomalous Power-Usage Behavior Detection from Smart Home Wireless Communications 23
sions and Malware, and Vulnerability Assessment: 14th InternationalConference (DIMVA’2017), Bonn, Germany, 2017: 161-184.
[9] A. Al-Anwar, Y. Alkabani, M. W. El-Kharashi, et al. Defeating hard-ware spyware in third party IPs [C]//Saudi International Electronics,Communications and Photonics Conference, Riyadh, Saudi Arabia,2013: 1-5.
[10] X. Bai, L. Xing, N. Zhang, et al. Staying secure and unprepared:Understanding and mitigating the security risks of apple zeroconf[C]//IEEE Symposium on Security and Privacy (S&P), San Jose, Cali-fornia, USA, 2016: 655-674.
[11] Y. J. Jia, Q. A. Chen, S. Wang, et al. ContexIoT: Towards providingcontextual integrity to appi★ed IoT platforms [C]//Network and Dis-tributed System Security Symposium (NDSS’17), San Diego, Califor-nia, 2017.
[12] E. Fernandes, J. Paupore, A. Rahmati, et al. Flowfence: Practicaldata protection for emerging IoT application frameworks [C]//25thUSENIX Security Symposium (USENIX Security’16), Austin, TX,USA, 2016: 531-548.
[13] G. W. Hart. Nonintrusive appliance load monitoring [J]//Proceedingsof the IEEE, 1992, 80(12): 1870-1891.
[14] M. Akbar, Z. A. Khan. Modi★ed nonintrusive appliance load monitor-ing for nonlinear devices [C]//IEEE International Multitopic Confer-ence, Lahore, Pakistan, 2007: 1-5.
[15] J. A. Mueller, A. Sankara, J. W. Kimball, et al. Hidden Markov modelsfor nonintrusive appliance load monitoring [C]//North American PowerSymposium (NAPS), Pullman, WA, USA, 2014: 1-6.
[16] J. Granjal, E. Monteiro, J. Silva. Security for the Internet of things: Asurvey of existing protocols and open research issues [J]. IEEE Com-munications Surveys & Tutorials, 2015, 17(3): 1294-1312.
[17] R. A. Rahman, B. Shah. Security analysis of IoT protocols: A focusin coap [C]//3rd MEC International Conference on Big Data and SmartCity (ICBDSC), Muscat, Oman, 2016: 1-7.
[18] Y. Chen, T. Kunz. Performance evaluation of IoT protocols under aconstrained wireless access network [C]//International Conference onSelected Topics in Mobile Wireless Networking (MoWNeT), Cairo,Egypt, 2016: 1-7.
[19] A. C. Jose, R. Malekian. Improving smart home security: Integrat-ing logical sensing into smart home [J]. IEEE Sensors Journal, 2017,17(13): 4269-4286.
[20] A. K. Simpson, F. Roesner, T. Kohno. Securing vulnerable homeIoT devices with an in-hub security manager [C]//IEEE InternationalConference on Pervasive Computing and Communications Workshops(PerCom Workshops), Hawaii, USA, 2017: 551-556.
[21] M. W. Newman. Now we’re cooking: Recipes for end-user servicecomposition in the digital home [C]//26th CHI Conference, Florence,Italy, 2008: 05-10.
[22] E. Fernandes, A. Rahmati, K. Eykholt, et al. Internet of things securityresearch: A rehash of old ideas or new intellectual challenges [J]. IEEESecurity & Privacy, 2017, 15(4): 79-84.
ABOUT THE AUTHORS
Jian Mao [corresponding author] received her B.S.degree and Ph.D. degree from Xidian University,Shaanxi, China. She is an associate professor inSchool of Cyber Science and Technology, BeihangUniversity, Beijing, China. Her research interests in-clude cloud security, web security, and mobile secu-rity.
Shishi Zhu received her B.S. degree in electronicand information engineering from Beihang Univer-sity, Beijing, China in 2017 and currently she is amaster student in electronic and information engineer-ing from Beihang University, Beijing, China. Her re-search interests include mobile security and IoT secu-rity.
Jingdong Bian received his B.S. degree in electronicand information engineering from Jilin University,Jilin, China in 2016 and currently he is a master stu-dent in electronic and information engineering fromBeihang University, Beijing, China. His research in-terests include web security, mobile security and pri-vacy analysis.
Qixiao Lin received his B.S. degree in electronicand information engineering from Beihang Univer-sity, Beijing, China in 2018 and currently he is a mas-ter student in cyber science and technology from Bei-hang University, Beijing, China. His research inter-ests include mobile security and IoT security.
Jianwei Liu received his B.S. and M.S. degrees inelectronic and information from Shandong University,Shandong, China in 1985 and 1988. He received hisPh.D. degree in communication and electronic systemfrom Xidian University, Shaanxi, China in 1998. Cur-rently, he is a professor in School of Cyber Scienceand Technology, Beihang University, Beijing, China.His research interests include wireless communica-tion network, network security.


