Embed Size (px)
Citation preview

Antibiotic usage in South Africa: A longitudinal analysis of medicine claims
data
WE Agyakwa
25036718
Dissertation submitted in fulfilment of the requirements for the degree Magister Pharmaciae in Pharmacy Practice at the
Potchefstroom Campus of the North-West University
Supervisor: Prof MS Lubbe
Co-Supervisor: Dr JR Burger
Assistant Supervisor: Dr N Katende Kyenda
November 2014

i
Acknowledgements
All thanks and praise to the Almighty God. His unfailing love and faithfulness has been my
anchor and strength.
My sincerest gratitude goes to my supervisor, Prof. MS Lubbe for her extraordinary expertise,
leadership, patience and wonderful words of encouragement. I am grateful for the valuable time
spent to ensure perfection at all times.
To my co-supervisors, Dr. JR Burger and Dr. NL Katende-Kyenda, thank you for inspiring and
encouraging me to pursue excellence. I am grateful for the sacrifices made and the patience to
impact knowledge.
My gratitude goes to Ms. Marike Cockeran for the time and patience taken to ensure the
accuracy of the statitiscal analyses of the study.
Thank you, Ms. Anne-Marie Bekker, for your immense assistance during the data analyses.
Your kind words were always refreshing.
To Mrs. Helena Hoffman, I am very grateful for all the updates you provided with regard to my
study. I am thankful for the time taken to go through my dissertation and the compilation of the
reference list.
To the INTRA-ACP Mobility Scheme, I am grateful for funding my study in this institution.
Lastly, to my husband, Mr. Victor Owusu, thank you for supporting me throughout my study in
this institution. Your constant love and prayers have been central in completing this study.
Finally brothers, whaterver is true, whatever is honourable, whatever is just, whatever
is lovely, whatever is commendable, if there is any excellence, if there is anything
worthy of praise, think about these things.
Phlippians 4:8.

ii
Table of contents
Acknowledgements ........................................................................................................... i
List of tables .................................................................................................................... vii
List of figures ..................................................................................................................... x
List of acronyms and abbreviations ................................................................................... xi
Abstract and keywords ................................................................................................... xiv
Uittreksel en trefwoorde ................................................................................................... xvi
Preface ........................................................................................................................ xviii
Authors’ contributions (Study and manuscript 1).............................................................. xix
Authors’ contributions (Study and manuscript 2)............................................................... xx
Authors’ contributions (Study and manuscript 3).............................................................. xxi
Chapter 1: Introduction ................................................................................................... 1
1.2 Background ..................................................................................................... 1
1.3 Problem statement ......................................................................................... 4
1.4 Aim of study .................................................................................................... 5
1.4.1 General research goal ..................................................................................... 6
1.4.2 Specific research objectives ............................................................................ 6
1.5 Method of research ......................................................................................... 6
1.5.1 Literature review .............................................................................................. 7
1.5.2 Empirical investigation ..................................................................................... 7
1.5.2.1 Study design ................................................................................................... 7
1.5.2.2 Data source ..................................................................................................... 8
1.5.2.2.1 Validity and reliability of data ........................................................................... 8
1.5.2.3 Study population ........................................................................................... 10
1.5.2.4 Study variables.............................................................................................. 12
1.5.2.4.1 Independent variables ................................................................................... 12
1.5.2.4.2 Dependent variables ..................................................................................... 14
1.5.2.5 Statistical analyses ........................................................................................ 16

iii
Table of contents (continued)
1.5.2.5.1 Descriptive statistics ...................................................................................... 16
1.5.2.5.2 Inferential statistics ........................................................................................ 19
1.5.3 Measures to ensure validity of study results .................................................. 22
1.6 Ethical aspect of research ............................................................................. 28
1.7 Chapter division ............................................................................................ 28
1.8 Chapter summary .......................................................................................... 28
Chapter 2: Introduction to literature review ................................................................ 29
2.2 Antimicrobial agents ...................................................................................... 29
2.2.1 Classification of antimicrobial agents ............................................................. 29
2.2.2 Pharmacological sub-groups of antibiotics .................................................... 30
2.2.2.1 Penicillins ...................................................................................................... 30
2.2.2.2 Cephalosporins ............................................................................................. 34
2.2.2.3 Carbapenems and monobactams.................................................................. 35
2.2.2.4 Glycopeptides ............................................................................................... 36
2.2.2.5 Lipopeptides .................................................................................................. 37
2.2.2.6 Aminoglycosides ........................................................................................... 39
2.2.2.7 Macrolides ..................................................................................................... 40
2.2.2.8 Lincosamide .................................................................................................. 41
2.2.2.9 Tetracycline and related drugs ...................................................................... 42
2.2.2.10 Chloramphenicol ........................................................................................... 43
2.2.2.11 Sulphonamides and trimethoprim .................................................................. 44
2.2.2.12 Fluoroquinolones ........................................................................................... 45
2.2.2.12.1 Structural-activity relationship of fluoroquinolones ......................................... 46
2.2.2.12.2 Mechanism of action of fluoroquinolones....................................................... 46
2.2.2.12.3 Classification of fluoroquinolones .................................................................. 46
2.2.2.12.4 General pharmacokinetic properties of fluoroquinolones ............................... 49
iv
Table of contents (continued)
2.2.2.12.5 Clinical uses of fluoroquinolones ................................................................... 50
2.2.2.12.6 Drug-drug interactions involved with fluoroquinolones ................................... 51
2.2.2.12.7 Adverse drug reactions associated with fluoroquinolones ............................. 52
2.2.2.12.8 Use of fluoroquinolones in children less than eighteen years ........................ 53
2.3 Antimicrobial resistance ................................................................................ 58
2.3.1 Definition of antimicrobial resistance ............................................................. 58
2.3.2 Risk factors for emergence of antimicrobial resistance .................................. 58
2.3.3 Mechanisms of antimicrobial resistance ........................................................ 59
2.3.3.1 Efflux-mediated antimicrobial resistance ....................................................... 60
2.3.3.2 Alterations in cell wall structure ..................................................................... 60
2.3.3.3 Target site mutation ...................................................................................... 61
2.3.3.4 Protection of target site by proteins ............................................................... 61
2.3.3.5 Modifying enzymes ....................................................................................... 62
2.3.3.6 Acquisition of target by-pass system ............................................................. 62
2.3.4 Antibiotic resistance patterns ......................................................................... 62
2.3.5 Importance of antimicrobial resistance surveillance ....................................... 71
2.3.6 Impact of antimicrobial resistance ................................................................. 71
2.3.7 Measures to control antimicrobial resistance ................................................. 73
2.4 Global patterns of antimicrobial use .............................................................. 74
2.4.1 Patterns of antibiotic use in Europe ............................................................... 74
2.4.1.1 Patterns of fluoroquinolone use in Europe ..................................................... 76
2.4.2 Patterns of antibiotic use in America ............................................................. 77
2.4.2.1 Patterns of fluoroquinolone use in America ................................................... 78
2.4.3 Patterns of antibiotic use in Asia ................................................................... 79
2.4.4 Patterns of antibiotic use in Africa ................................................................. 79
2.4.4.1 Fluoroquinolone use in Africa ........................................................................ 80
2.4.5 Irrational use of antibiotics ............................................................................. 80
2.4.5.1 Determinants of antibiotic prescribing ............................................................ 82

v
Table of contents (continued)
2.4.5.2 Determinants of antibiotic dispensing and sales ............................................ 84
2.4.5.3 Determinants of patient use of antibiotics ...................................................... 86
2.4.6 Consequences of irrational antibiotic use ...................................................... 87
2.5 Measures to control the use of antibiotics ...................................................... 88
2.5.1 Restrictive interventions ................................................................................ 89
2.5.2 Educational or persuasive interventions ........................................................ 90
2.5.3 Structural interventions .................................................................................. 91
2.5.4 Measuring the outcome of interventions ........................................................ 93
2.6 Quantitative measurement of antibiotic use ................................................... 93
2.6.1 Units for describing antibiotic use .................................................................. 94
2.6.2 The concept of defined daily dose (DDD) and anatomical therapeutic
chemical (ATC) classification system ............................................................ 96
2.6.2.1 The anatomical therapeutic classification (ATC) system ............................... 96
2.6.2.2 Principles of ATC classification ..................................................................... 97
2.6.3 The defined daily dose (DDD) ....................................................................... 97
2.7 Chapter summary .......................................................................................... 98
Chapter 3: Results and discussion .............................................................................. 99
3.1 Introduction ................................................................................................... 99
3.2 Manuscript 1 ............................................................................................... 100
3.3 Manuscript 2 ............................................................................................... 119
3.4 Manuscript 3 ............................................................................................... 142
3.5 Additional results ......................................................................................... 163
3.5.1 PDDs of fluoroquinolones stratified by age groups ...................................... 163
3.5.2 PDDs of fluoroquinolones by prescribers’ specialty ..................................... 164
3.6 Chapter summary ........................................................................................ 183

vi
Table of contents (continued)
Chapter 4: Conclusion and recommendation ............................................................ 184
4.1 Introduction ................................................................................................. 184
4.2 Content of dissertation ................................................................................ 184
4.3 Conclusion from the study ........................................................................... 185
4.3.1 Conclusions from the literature review ......................................................... 185
4.3.2 Conclusions from the empirical investigation ............................................... 190
4.4 Limitations and strengths of the study ......................................................... 194
4.5 Recommendations ...................................................................................... 195
4.6 Chapter summary ........................................................................................ 196
References ................................................................................................................... 197
ANNEXURE A ............................................................................................................... 241
ANNEXURE B ............................................................................................................... 242
Associated presentation ................................................................................................ 319

vii
List of tables
Table 1.1 Objectives outlined from literature review and sections in which they are
addressed ....................................................................................................... 7
Table 1.2 Claim processing checks used in validating data by the PBM ......................... 9
Table 1.3 Selected data elements in the PBM used in the study ................................... 11
Table 1.4 Maximum recommended daily doses of fluoroquinolones in patients 18
years and below ............................................................................................ 16
Table 1.5 Checklist for conducting retrospective studies ............................................... 23
Table 2.1 Mechanism of action of pharmacological groups of antimicrobials................. 30
Table 2.2 A summary of the sub-pharmacological groups of penicillins, spectrum
of activity and clinical uses ............................................................................ 32
Table 2.3 Generations of cephalosporins, spectrum of activity and clinical uses ........... 35
Table 2.4 Spectrum of activity and clinical uses of carbapenems and monobactam...... 36
Table 2.5 A summary of the sub-pharmacological groups of lipopeptides ..................... 38
Table 2.6 Classification of fluoroquinolones according to three generations ................. 47
Table 2.7 Classification of fluoroquinolones into four generations with their
various characteristics and antimicrobial spectrum ........................................ 48
Table 2.8 A summary of the pharmacokinetics of the relevant fluoroquinolones in
clinical practice .............................................................................................. 49
Table 2.9 Clinical uses of the sub-pharmacological groups of fluoroquinolones ............ 50
Table 2.10 Approved fluoroquinolone dosage regimen in children younger than 18 years ..
...................................................................................................................... 54
Table 2.11 Studies evaluating the effectiveness of fluoroquinolones and incidence of
arthropathy in children younger than 18 years ............................................... 56
Table 2.12 Susceptibility patterns of relevant microorganisms in South Africa for 2010 ......
...................................................................................................................... 63

viii
List of tables (continued)
Table 2.13 An overview of the resistance patterns of clinically relevant micro-organisms in
Africa ............................................................................................................. 65
Table 2.14 Classification of ciprofloxacin of the anatomical therapeutic chemical (ATC)
classification system...................................................................................... 97
Table 3.1 PDD per prescription per year in patients 18 years and younger stratified by
age groups .................................................................................................. 166
Table 3.2 PDD per prescription per year in patients 18 years and younger stratified by
prescribers’ specialty ................................................................................... 172
Table B.1 Cohen’s d-value for the difference in the average number of antibiotic
prescriptions per patient per year ................................................................ 284
Table B.2 Cohen’s d-value for the difference in the average number of antibiotic
prescriptions per patient per year stratified by gender ................................. 285
Table B.3 Cohen’s d-value for the difference in the average number of antibiotic
prescriptions per patient per year stratified by age groups .......................... 286
Table B.4 Cohen’s d-value for the difference in the average number of
antibioticprescriptions per patient per year stratified by provinces ............... 289
Table B.5 Cohen’s d-value for the difference in the average number of antibiotic
prescriptions per patient per year according to age groups stratified by the
study period ................................................................................................ 292
Table B.6 Cohen’s d-value for the difference in the average number of antibiotic agents
claimed per year during the study period ..................................................... 294
Table B.7 Cohen’s d-value for the difference in the average number of antibiotic agents
claimed per year stratified by gender ........................................................... 294
Table B.8 Cohen’s d-value for the difference in the average number of antibiotic agents
claimed per year stratified by age groups .................................................... 295
Table B.9 Number of antibiotic prescriptions per patient per year according to seasonal
trends .......................................................................................................... 297
Table B.10 Antibiotic agents claimed from 2005 to 2012 ............................................... 300
Table B.11 DDD/1 000 inhabitants/year of fluoroquinolones prescribed in patients above
18 years ...................................................................................................... 304
ix
List of tables (continued)
Table B.12 Cohen’s d-value for the difference between the average DDDs per prescription
per partient per year of fluoroquinolones prescribed in patients above 18
years, 2005 - 2012 ...................................................................................... 306
Table B.13 Cohen’s d-value for the difference between the PDDs of fluoroquinolone
prescription per partient per year in patients 18 years and younger startified by
age groups, 2005 - 2012 ............................................................................. 308
Table B.13 Cohen’s d-value for the difference between the PDDs of fluoroquinolone
prescription per partient per year in patients 18 years and younger according
to prescribers’ specialty ............................................................................... 314

x
List of figures
Figure 1.1 Selection procedures for study population ......................................................... 10

xi
List of acronyms and abbreviations
A
AMR Antimicrobial resistance
ATC Anatomical Therapeutic Chemical
B
BSAC British Society for Antimicrobial Chemotherapy
C
CAP Community Acquired Pneumonia
CDC Centres for Disease Control
CMS Council for Medical Schemes
CSF Cerebro-spinal fluid
D
DDD Defined Daily Dose
DHP Dehydropeptidase
DID Defined Daily Dose per 1 000 Inhabitants per Day
DNA Deoxyribonucleic acid
E
ECDC European Centre for Disease Control
ESAC European Surveillance on Antibiotic Consumption
ESGAP European Study Group on Antibiotic Policies
F
FIDSSA Federation of Infectious Diseases Societies of South Africa
G
GABA Gaba-amino-butyric acid
GARP Global Antibiotic Resistance Partnership
GERM-SA Group for Enteric Respiratory and Meningeal disease Surveillance in South
Africa
GI Gastro – intestinal

xii
List of acronyms and abbreviations (continued)
H
HPCSA Health Professions Council of South Africa
I
IMS Intercontinental Marketing Services
K
kg kilogram
L
LRTI Lower respiratory tract infection
M
max. maximum
MDR Multidrug resistant
mg milligram
MIMS Monthly Index of Medical Specialties
MRSA Methicillin-resistant Staphylococcus aureus
MSSA Methicillin-susceptible Staphylococcus aureus
N
NASF National Antibiotic Surveillance Forum
P
PBM Pharmaceutical Benefit Management
PDD Prescribed Daily Dose
PMQR Plasmid-mediated Quinolone Resistance
Q
QRDR Quinolone Resistant Determining Region
R
RDD Recommended Daily Dose
RNA Ribonucleic acid
RTI Respiratory tract infection
xiii
List of acronyms and abbreviations (continued)
S
SAS Statistical Analyses System
STI Sexually Transmitted Infections
T
TB Tuberculosis
U
UTI Urinary tract infection
V
VAP Ventilator Associated Pneumonia
W
WHO World Health Organization

xiv
Abstract and keywords
Antibiotic usage in South Africa: A longitudinal analysis of medicine claims data
The main aim of the study was to determine the prescribing patterns of antibiotics with an
emphasis on fluoroquinolones in the private health sector of South Africa. The empirical study
followed a quantitative, descriptive, observational method using retrospective, longitudinal
medicine claims data provided by a nationally representative Pharmaceutical Benefit
Management company (PBM) from 1 January 2005 to 31 December 2012. Penicillins,
cephalosporins, carbapenems, aminoglycosides, chloramphenicol, fluoroquinolones,
macrolides, tetracyclines, sulphonamides and trimethoprim were considered in the study.
A total of 5 155 262 (44.8%) patients received at least one antibiotic prescription out of the total
number of registered beneficiaries included in the database. The average number of antibiotic
prescriptions per patient per year ranged from 2.22 ± 1.89 (95% CI 2.22-2.22) in 2005 to
1.98 ± 1.62 (95% CI 1.98-1.99) in 2012. The number of antibiotics per prescription per year
remained fairly constant at 1.05 ± 0.19 (95% CI 1.05-1.05) in 2005 to 1.06 ± 0.21 (95%
CI 1.06-1.06) in 2012. The prevalence of patients receiving antibiotic prescriptions decreased
from 46.1% (n = 789 247) in 2005 to 38.2% (n = 480 159) in 2012. Antibiotics were mostly
prescribed for females (54.9%, n = 2 831 686) and in patients aged 0 to 18 years (26.5%,
n = 1 366 824) and least in patients above 65 years (9.5%, n = 490 496). The prevalence of
patients receiving antibiotic prescriptions was highest in Gauteng (41.9%, n = 2 159 360) and
lowest in the Northern Cape (1.7%, n = 87 720). Antibiotics were mostly prescribed during the
winter period. Penicillins were the most prescribed antibiotics (43%) and carbapenem the least
(0.1%) out of the total number of antibiotics claimed. No practically significant association was
found between antibiotic prescribing and gender, age, province and season.
A total of 1 983 622 prescriptions for fluoroquinolones were claimed in patients older than 18
years. The average number of fluoroquinolone prescriptions per patient per year ranged from
1.45 ± 0.92 (95% CI 1.44-1.45) in 2005 to 1.31 ± 0.71 (95% CI 1.31-1.32) in 2012. The highest
prevalence of fluoroquinolone prescribing was observed in females (64.1%, n = 850 253) and in
patients between 45 and 65 years (38.6%, n = 511 542). The total fluoroquinolone use by the
study population decreased from 2.85 DID in 2005 to 2.41 DID in 2012. Norfloxacin was the
only first-generation fluoroquinolone prescribed. The second-generation fluoroquinolones
accounted for more than 50% of the total DID, with ciprofloxacin being the most used active
ingredient in this generation. Moxifloxacin was the most prescribed third-generation
fluoroquinolone; its use ranging from 0.51 DID in 2005 to 0.44 DID in 2012.

xv
Between 2005 and 2012, a total of 57 325 prescriptions for fluoroquinolones were claimed by
patients 18 years and younger. The prevalence of patients receiving fluoroquinolone
prescriptions decreased from 3.6% (n = 8 329) in 2005 to 2.9% (n = 3 310) in 2012.
Fluoroquinolones were mostly prescribed to females and in patients between 12 and 18 years.
In all age groups, prescribing was mainly done by general medical practitioners. Ciprofloxacin
was the most prescribed fluoroquinolone, followed by levofloxacin.
In conclusion, this study established estimates on the prevalence of antibiotic prescribing
covering an eight-year period. Secondly, baseline estimates for fluoroquinolone prescribing in
adults using the ATC/DDD methodology were determined. Fluoroquinolone prescribing patterns
in children and adolescents were determined, with specific reference to the comparison
between the prescribed daily and recommended daily dosages in the different age groups and
by prescribers’ specialties.
Keywords: antibiotics, fluoroquinolones, prescription claim database, trends, use, longitudinal,
patterns, children, adults, private health sector, South Africa

xvi
Uittreksel en trefwoorde
Antibiotika-gebruik in Suid-Afrika: ʼn Longitudinale ontleding van medisyne-eisedata
Die hoofdoel van die studie was om die voorskryfpatrone van antibiotika, met ʼn klem op
fluoorkinolone, in die private gesondheidsektor van Suid-Afrika, te bepaal. Die empiriese studie
het ʼn kwantitatiewe, beskrywende navorsingsontwerp gebruik deur van retrospektiewe,
longitudinale medisyne-eisedata, verkry vanaf ʼn nasionaal verteenwoordigende Farmaseutiese
Voordelebestuursmaatskappy, vir die tydperk 1 Januarie 2005 tot 31 Desember 2012, gebruik
te maak. Penisilline, kefalosporiene, karbapeneme, aminoglikosiede, chlooramfenikol,
fluoorkinolone, makroliede, tetrasikliene, sulfoonamiede en trimetoprim is tydens die studie in
ag geneem.
Altesaam 5 155 262 (44.8%) pasiënte, uit die totale aantal geregistreerde begunstigdes in die
databasis, het ten minste een antibiotikumvoorskrif ontvang. Die gemiddelde aantal
antibiotikumvoorskrifte per pasiënt per jaar het gewissel tussen 2.22 ± 1.89 (95% CI 2.22-2.22)
in 2005 en 1.98 ± 1.62 (95% CI 1.98-1.99) in 2012. Die aantal antibiotika per voorskrif per jaar
het redelik konstant gebly op 1.05 ± 0.19 (95% CI 1.05-1.05) in 2005 tot 1.06 ± 0.21 (95%
CI 1.06-1.06) in 2012. Die voorkoms van pasiënte wat antibiotikumvoorskrifte ontvang het, het
van 46.1% (n = 789 247) in 2005 tot 38.2% (n = 480 159) in 2012 afgeneem. Antibiotika is
meestal vir vroue (54.9 %, n = 2 831 686) en in pasiënte tussen die ouderdomme van 0 en 18
jaar (26.5%, n = 1 366 824) voorgeskryf. Antibiotikumvoorskrifte vir pasiënte ouer as 65 jaar
(9.5%, n = 490 496) was die minste. Die voorkoms van pasiënte wat antibiotikumvoorskrifte
ontvang het, was die hoogste in Gauteng (41.9%, n = 2 159 360) en die minste in die Noord-
Kaap (1.7%, n = 87 720). Antibiotika is meestal in die winter voorgeskryf. Uit die totale aantal
antibiotika geëis, was penisillien die mees voorgeskrewe antibiotikum (43%) en karbapenem die
minste (0.1%). Daar was geen prakties betekenisvolle assosiasie tussen antibiotikum
voorgeskryf en geslag, ouderdom, provinsie, en seisoen nie.
Altesaam 1 983 622 fluoorkinolienvoorskrifte was geëis vir pasiënte ouer as 18 jaar. Die
gemiddelde aantal fluoorkinolienvoorskrifte per pasiënt per jaar het gewissel tussen 1.45 ± 0.92
(95% CI 1.44-1.45) in 2005 en 1.31 ± 0.71 (95% CI 1.31-1.32) in 2012. Die hoogste voorkoms
van fluoorkinolienvoorskrifte is waargeneem in vroue (64.1% n = 850 253) en in pasiënte tussen
45 en 65 jaar (38.6%, n = 511 542). Totale fluoorkinolienverbruik deur die studiebevolking het
van 2.85 DID in 2005 tot 2.41 DID in 2012 afgeneem. Norfloksasien is die enigste eerste-
generasie-fluoorkinolien wat voorgeskryf is. Die tweede-generasie-fluoorkinolone was

xvii
verantwoordelik vir meer as 50% van die totale DID, met siprofloksasien as die mees verbruikte
aktiewe bestanddeel in hierdie generasie. Moxifloxacin was die mees voorgeskrewe derde-
generasie-fluoorkinolien; verbruik het gewissel tussen 0.51 DID in 2005 en 0.44 DID in 2012.
Tussen 2005 en 2012 is altesaam 57 325 fluoorkinolienvoorskrifte deur pasiënte 18 jaar en
jonger geëis. Die voorkoms van pasiënte wat fluoorkinolienvoorskrifte ontvang het, het van
3.6% (n = 8 329) in 2005 tot 2.9% (n = 3 310) in 2012 afgeneem. Fluoorkinolone is meestal vir
vroue en pasiënte tussen 12 en 18 jaar, voorgeskryf. Algemene mediese praktisyns was vir die
meerderheid van voorskrifte in alle ouderdomsgroepe verantwoordelik. Siprofloksasien, gevolg
deur levofloksasien, was die mees voorgeskrewe fluoorkinolone.
Ter samevatting het hierdie studie beramings rakende die voorkoms van die voorskryf van
antibiotika oor ʼn agt jaar-periode bepaal. Tweedens is basislynberamings vir die voorskryf van
fluoorkinolone in volwassenes met behulp van die ATC/DDD-metode bepaal.
Fluoorkinoloonvoorskryfpatrone in kinders en tieners is bepaal, met spesifieke verwysing na die
vergelyking tussen die voorgeskrewe daaglikse en aanbevole daaglikse dosisse in die
verskillende ouderdomsgroepe en voorskrywerspesialiteite.
Trefwoorde: antibiotika, fluoorkinolone, medisyne-eisedatabasis, tendense, verbruik,
longitudinaal, patrone, kinders, volwassenes, private gesondheidsektor, Suid-Afrika

xviii
Preface
This study was presented in article format. Three manuscripts were submitted for publication in
the following journals:
Southern African journal of infectious diseases (submitted)
Journal of antimicrobial chemotherapy (prepared)
Biomedical central paediatrics (prepared)
The chapters in this dissertation are outlined as follows:
Chapter 1 provides a comprehensive background to the study, followed by the research
method used.
Chapter 2 is the literature review, focusing on antibiotics (brief summary on the mechanism
of action, clinical uses and adverse effects of the various sub-pharmacological groups),
fluoroquinolones (mechanism of action, clinical uses, adverse effects, use in paediatrics,
and potential drug interactions); antimicrobial resistance; antibiotic usage patterns globally;
and interventions to promote rational antibiotic use.
Chapter 3 consists of the results and discussions section of the dissertation in the form of
manuscripts.
Chapter 4 is the conclusion, recommendations and limitations of the study.
The annexures and references will be at the end.
The co-authors mentioned in the manuscripts were the supervisor and co-supervisors during
the study period. The manuscripts that formed part of the dissertation were done upon their
approval. The contributions of each author are subsequently outlined.

xix
Authors’ contributions (Study and manuscript 1)
The contribution of each author for manuscript 1 entitled “Antibiotic prescribing patterns in
the South African private health sector (2005-2012)” is provided below:
Author Role in the study
Ms WE Agyakwa Literature review
Planning and designing the manuscript
Data and statistical analyses
Interpretation of results
Writing of dissertation
Prof MS Lubbe
(Supervisor)
Supervision of concept of study and manuscript
Data and statistical analysis
Supervision on writing of manuscript
Reviewing the manuscript carefully for final approval
Dr JR Burger
(Co-supervisor)
Dr NL Katende-Kyenda
(Co-supervisor)
Co-supervision of concept of study and manuscript
Data and statistical analyses
Supervision on writing of manuscript
Reviewing the manuscript carefully for final approval
Ms M Cockeran (Statistician) Verified all results from statistical analyses
The following statement provided by the co-authors confirms their roles in the study and their
permission that the manuscript may form part of the dissertation.
I declare that I have approved the above-mentioned manuscript and that my role in this study,
as indicated above, is a representation of my actual contribution, and I hereby give my consent
that it may be published as part of the MPharm study of WE Agyakwa.
…………………………….. ……………………………
Prof MS Lubbe Dr JR Burger
……………………………… …………………………….
Dr NL Katende-Kyenda Ms M Cockeran

xx
Authors’ contributions (Study and manuscript 2)
The contribution of each author for manuscript 2 entitled “Fluoroquinolone utilisation
patterns in adults in the private health sector of South Africa (2005-2012)” is provided
below:
Author Role in the study
Ms WE Agyakwa Literature review
Planning and designing the manuscript
Data and statistical analyses
Interpretation of results
Writing of dissertation
Prof MS Lubbe
(Supervisor)
Supervision of concept of study and manuscript
Data and statistical analysis
Supervision on writing of manuscript
Reviewing the manuscript carefully for final approval
Dr JR Burger
(Co-supervisor)
Dr NL Katende-kyenda
(Co-supervisor)
Co-supervision of concept of study and manuscript
Data and statistical analyses
Supervision on writing of manuscript
Reviewing the manuscript carefully for final approval
Ms M Cockeran (Statistician) Verified all results from statistical analyses
The following statement provided by the co-authors confirms their roles in the study and their
permission that the manuscript may form part of the dissertation.
I declare that I have approved the above-mentioned manuscript and that my role in this study,
as indicated above, is a representation of my actual contribution, and I hereby give my consent
that it may be published as part of the MPharm study of WE Agyakwa.
…………………………….. ……………………………
Prof MS Lubbe Dr JR Burger
……………………………… …………………………….
Dr NL Katende-Kyenda Ms M Cockeran

xxi
Authors’ contributions (Study and manuscript 3)
The contribution of each author for manuscript 3 entitiled “Prescribing patterns of
fluoroquinolones in children and adolescents in the private health sector of South Africa
(2005 – 2012)” is provided below:
Author Role in the study
Ms WE Agyakwa Literature review
Planning and designing the manuscript
Interpretation of results
Writing of dissertation
Prof MS Lubbe
(Supervisor)
Supervision of concept of study and manuscript
Data and statistical analysis
Data and statistical analyses
Supervision on writing of manuscript
Reviewing the manuscript carefully for final approval
Dr JR Burger
(Co-supervisor)
Dr NL Katende-kyenda
(Co-supervisor)
Co-supervision of concept of study and manuscript
Data and statistical analyses
Supervision on writing of manuscript
Reviewing the manuscript carefully for final approval
Ms M Cockeran (Statistician) Verified all results from statistical analyses
The following statement provided by the co-authors confirms their roles in the study and their
permission that the manuscript may form part of the dissertation.
I declare that I have approved the above-mentioned manuscript and that my role in this study,
as indicated above, is a representation of my actual contribution, and I hereby give my consent
that it may be published as part of the MPharm study of WE Agyakwa.
…………………………….. ……………………………
Prof MS Lubbe Dr JR Burger
……………………………… …………………………….
Dr NL Katende-Kyenda Ms M Cockeran

1
CHAPTER 1: INTRODUCTION
1.1 Introduction
This chapter focuses on the general overview of the study, centering on providing a background
to the study, defining the problem, questions that will be answered, aims, specific objectives and
methodology that will be utilised in the study. The chapter concludes with the division of
chapters.
1.2 Background
In the 1920s, when Sir Alexander Fleming accidentally discovered penicillin, little did the world
know that it will revolutionise the mystery behind “the germ theory of disease” (White, 2012:10).
The identification of the causative organism of infections allowed for a much better
understanding of their epidemiology, which, in turn, informed prevention strategies (Nelson &
Williams, 2007:15). Antibiotics, a major pharmacological group, have been found to be of great
benefit in plants and animals (Barbosa & Levy, 2000:303). This has permitted the indiscriminate
use of antibiotics resulting in resistance over prolonged use.
There is a global interest to control antibiotic usage. This stems from the fact that infections
cover a larger percentage of diseases that affect people; and South Africa is no exception.
According to the World Health Organization (WHO, 2013), infectious diseases form 60% of the
disease burden in the country, with 78% of lives being lost through limited access to available
and affordable antimicrobials needed to treat infections. Antimicrobial resistance (AMR) is an
important public health concern, because it has a medical, social and economic impact on a
population (WHO, 2014:36).
According to the World Health Organization (2001:1), antibiotic use is the “main driver of
resistance.” Iconic studies by Chen et al. (1999:234), Laxminayaran and Brown (2001:189), and
Turnidge and Christansen (2005:548) confirm antibiotic use correlating with the emergence of
resistance. For example, in a study by Goossens and his co-workers (2005:579-587), involving
sixteen European countries from January 1997 to December 2002, they identified a strong
correlation between Streptococcus pneumonia resistance and an increased use of the
macrolide, erythromycin. Higher consumption of clarithromycin also correlated with the
predominance of macrolide-resistant Streptococcus pneumoniae. Pakyz and his colleagues
(2012:1-2) found, in their study from 2002 to 2009 in the United States, a direct correlation
between fluoroquinolone-resistant Pseudomonas aeruginosa and fluoroquinolone use. A
decrease in the use of fluoroquinolones in the hospitals under study showed a decrease in

2
fluoroquinolone-resistant Pseudomonas aeruginosa. Ciprofloxacin and levofloxacin were
associated with a greater proportion of resistance.
In view of the assumption that an increased usage of antibiotics correlates with antimicrobial
resistance, information concerning the consumption pattern of antibiotics is crucial to explore
these dynamics (Mackenzie & Gould, 2005:105). Comprehensive data on the use of antibiotics
are important for the analyses and interpretation of prescribing habits, the evaluation of
compliance with clinical guidelines and linkage with antimicrobial resistance data. Countries are
encouraged, among other measures, to monitor volumes and patterns of use of antibiotics and
to evaluate the impact of control measures (WHO, 2001:1).
Analysing prescribing patterns validated with laboratory findings will assist in curbing emerging
antibiotic resistance patterns. In South Africa, there is a great scope to provide quality
management in the use of antibiotics. There is irrational use of antibiotics in both public and
private sectors in the form of prescribing antibiotics for cases that do not require them, e.g. flu,
prescribing for long durations, no de-escalation, and prescribing two or more antibiotics that are
not suitable (Visser et al., 2011:587).
In November 2001, the European Centre for Disease Control (ECDC) formed the European
Surveillance on Antibiotic Consumption (ESAC) project (ECDC, 2010:3). The aim of this project
involves the monitoring of antibiotic consumption in all the European countries and determining
the population’s exposure to antibiotics. The data sources include national sales,
reimbursement data and information from national drug registries. The number of DDDs (daily
defined doses) per one thousand (1 000) inhabitants per day; and the DDD per number of
packages per one thousand (1 000) inhabitants per day are the main indicators for reporting
consumption. Their goal was to document variations in antibiotic consumption and to translate
them into quality indicators for public health monitoring over a specified time and place. This
will, in turn, aid in providing appropriate interventions when needed and to assess the
effectiveness of previous programmes (ECDC, 2010:7).
A pilot antibiotic stewardship project was launched in the private healthcare sector of South
Africa in 2009 (Winters & Gelband, 2011:556). The aim of this project was to foster the
responsible use of antibiotics by raising awareness of prescribing issues (both misuse and
appropriateness of use of antibiotics) to solve the problem of emerging resistance (Hanlon &
Hodges, 2013:129-130). Antibiotic stewardship can help in reducing the platform of antibiotic
resistance being addressed by the Global Antibiotic Resistance Partnership (GARP) in South
Africa. The two main strategies for addressing resistance are to reduce the use in both humans
and livestock by reducing the incidence of infections (Winters & Gelband, 2011:556).

3
Currently, South Africa is faced with levofloxacin-non-susceptible Streptococcus pneumonia in
the treatment of multidrug resistant tuberculosis (MDR-TB) (von Gottberg et al., 2008:1108),
ciprofloxacin-resistant Salmonella typhi (Coovadia et al., 1992:91-100), and quinolone-resistant
gonococci (Lewis, 2011:215-220). There is also a huge burden of sexually transmitted infections
(STIs), which is a major cause of morbidity (Crowther-Gibson et al., 2011:567). The introduction
of checks and balances to monitor the use of fluoroquinolones in the treatment of these
infections is crucial in limiting the problem of antibiotic resistance.
Fluoroquinolones are useful antimicrobials in South Africa. They are indicated for chronic
bronchitis, community acquired pneumonia, sinusitis, complicated and uncomplicated urinary
tract infections and soft tissue infections (Snyman, 2012:291). Currently, five of the nine
fluoroquinolones that have been approved for human use are available in the South African
market, viz. levofloxacin, ciprofloxacin, moxifloxacin, gemifloxacin and ofloxacin. These
fluoroquinolones have good oral absorption and tissue penetration, relatively long elimination
half-lives which permit once or twice daily dosing, a relatively low rate of serious adverse
effects, and predictable drug-drug interactions (Jacoby & Hooper, 2012:119).
Factors influencing fluoroquinolone resistance include inadequate dosage, interactions reducing
bioavailability, treatment of prosthetic infections and prolonged use in cystic fibrosis. Clinically
significant drug-drug interactions involving fluoroquinolones include formation of chelates with
metal ions such as aluminium, magnesium and calcium. These chelates reduce the gastro-
intestinal absorption of the fluoroquinolones, and consequently reducing therapeutic activity
(Scholar & Pratt, 2000:272). Xanthine derivatives (theophylline and caffeine) inhibit the
metabolic pathway of fluoroquinolones; ciprofloxacin decreases the concentration of phenytoin,
whereas ofloxacin and moxifloxacin enhance the effects of warfarin and its derivatives
(Andriole, 2000:24). A combination of fluoroquinolones and non-steroidal anti-inflammatory
drugs can cause synergistic inhibition of the gamma-aminobutyric acid (GABA) receptors in the
central nervous system (Stahlmann & Lode, 1999:311). Nitrofurantoin is furthermore contra-
indicated with ciprofloxacin use (Griffin & d’Arcy, 1997:388). Anderson et al. (2012:56) believe
that fluoroquinolones still remain attractive antibiotics to preserve in this era despite their
clinically significant drug interactions. Though the fluoroquinolones may not be the most
prescribed antibiotics, monitoring their use over time will help in solving and preventing
resistance, as said by Lord Kevin (1824-1907), “If you can not measure it, you can not improve
it.”
We have approached an era where the pipeline has run dry for newer antibiotics. There is
strong interest in preserving what we already have before we reach a ‘nil-antibiotic era’. For
South Africa, the answer is in strengthening the Antibiotic Stewardship project (Hans &

4
Ramsamy, 2013:368).
According to Frenk and De Ferranti (2012:862), “The paradox of health care is that it is one of
the most powerful ways of fighting poverty, yet it can itself be an impoverishing factor for
families when societies do not ensure effective coverage with financial protection for all”. Health
economics has become relevant globally because every government’s objective is to increase
the quality of health with appreciable cost. South Africa devotes considerable financial and other
resources to the health sector far more than other middle-income countries (McIntyre & Doherty
2004:380). Healthcare in South Africa is divided into the public and private sector, financed by
four major groups, viz. government, households, employers and donors; the government being
the largest contributor. Households form the second largest source of funds where there is
payment of contributions to medical aid schemes, private insurances and out-of-pocket
payments. The private sector is the major consumer of healthcare spending. Approximately
50% of expenditure is by the private sector (McIntyre & Doherty, 2004:380).
Medical aid schemes cover a larger percentage of private health care in the country, with an
estimated coverage of 20% of the population (CMS, 2013:228). According to the Council for
Medical Schemes (2012:119), medications formed 16% and 15% of the total expenditure for
healthcare provided in 2010 and 2011, respectively. This decrease in the total cost on
medications has been credited to strategies implemented by the medical aid schemes through
generic substitution, pre-authorisation processes and a managed care approach (Kahne, 2013).
Based on a report by the Intercontinental Marketing Services (IMS) Health in 2010, for example,
Targocid® (piperacillin/tazobactam), Meronem™ (meropenem) and Augmentin™
(amoxicillin/clavulanate) were the top three antibiotics having 9.2, 8.4 and 5.6% of the total
market share (Essack et al., 2011:566). These antibiotics formed part of the top twenty drugs
from 2010 to 2012. Branded fluoroquinolones such as Tavanic® (levofloxacin) and Ciprobay®
(ciprofloxacin) formed 4.1 and 1.4%, respectively, of the total market share of antibiotics used in
2010; Tavanic® has seen a 5% growth in the market share from 2009 to 2010 (Essack et al.,
2011:566).
1.3 Problem statement
One of the most challenging issues facing the health sector is the emerging resistance to
antibiotics owing to improper prescribing and patient non-compliance. Fluoroquinolones have
been used for some time now to treat MDR-TB (Department of Health, 2012a). Tuberculosis
being a major health burden in South Africa, growing resistance to conventional treatment will
have a negative medical, social and economic impact on the country (Crowther-Gibson et al.,
2011:567). Resistance alone is costly to a country’s financial resources, because there is more

5
expenditure on newer drugs that are more costly compared to conventional treatments (CDC,
2013:11; ECDC, 2009:13; Engemann et al., 2003:586).
Medical aid schemes in South Africa are concerned about the increase in the cost of antibiotics.
There was an estimated 23% increase in the average cost of treatment involving antibiotics
between 2009 and 2010 (Kantor, 2011). The major challenge is that there are few publications
addressing the prescribing patterns of antibiotics and especially fluoroquinolones in the private
sector of South Africa.
The first step in solving emerging resistance is by monitoring the prescribing patterns of
antibiotics, either retrospectively or prospectively. Monitoring the use of antibiotics helps to
detect early signals of irrational use. Presently in South Africa, the only published information on
antibiotic consumption in the public sector is based on government tender documents.
Information from the private sector is available from IMS Health, relying on data from
wholesalers and direct sales from manufacturers to pharmacies (Essack et al., 2011:564-565).
There is, however, little information on antibiotic use in the private sector of South Africa using
prescription data employing the defined daily dose (DDD) unit of measurement for analysing
drug use (Truter et al., 1996:678). Additionally, a major setback in the use of the DDD is its
inaptness to monitor paediatric drug use (Liem et al., 2010:1301; Natsch et al., 1998:23). This
research seeks to analyse antibiotic use with special emphasis on fluoroquinolones in the
private sector.
The following research questions were developed to help address the aim of the study:
- What major pharmacological groups of antibiotics are used globally?
- What are the prescribing patterns and indications of fluoroquinolones in patients younger
than 18 years?
- Which quantitative methods are employed in measuring antibiotic use in healthcare
settings?
- What are the changes in antibiotic prescribing trends during the study period and their
implications?
- What is the total DDD/1 000 inhabitants/day of fluoroquinolones in patients older than 18
years during the study period?
- Are the prescribed daily doses (PDDs) and recommended daily doses (RDDs) of
fluoroquinolone use in patients younger than 18 years comparable?
1.4 Aim of study
The aim of the study can be described using the general research goal with specific objectives.

6
1.4.1 General research goal
The goal of this research project was to determine the prescribing patterns of antibiotics with an
emphasis on fluoroquinolones in the private health sector in South Africa, analysing eight years’
prescription data, obtained from a South African Pharmaceutical Benefit Management (PBM)
company.
1.4.2 The specific research objectives
The research project was conducted in two phases, consisting of a literature review and an
empirical investigation. The specific objectives for each of the phases follow in the subsequent
paragraphs.
Literature review
The objectives of the literature review were to:
- Conceptualise antibiotics and their use.
- Determine, from literature, fluoroquinolones as a pharmacological group of antibiotics,
their indications for use, side effects, drug-drug interactions and special precautions.
- Determine antibiotic prescribing patterns in Europe, the United States and Africa with an
emphasis on fluoroquinolones; as well as resistance patterns in Africa.
- Identify interventions set up to monitor and control the use of antibiotics globally.
Empirical study
The empirical study was aimed at:
- Investigating the prescribing patterns viz. age, gender, seasonal and geographic variations
over the eight-year period for the various pharmacological groups of antibiotics.
- Describing the prescribing patterns of the various groups of fluoroquinolones in children viz.
age, gender and speciality of prescribers over the study period; comparing the PDD to the
RDD.
- Investigating specifically the prescribing patterns of the various groups of fluoroquinolones
focusing on longitudinal prevalence variations using the defined daily dose (DDD) per 1 000
inhabitants per day for adults.
1.5 Method of research
To help address the main objectives of the study mentioned above, the study was based on two

7
main phases, focusing on the literature review and the empirical investigation.
1.5.1 Literature review
The Dictionary of Media and Communication (2014) defines a literature review as “a formal,
reflective survey of the most significant and relevant works of published and peer reviewed
academic research on a particular topic, summarising and discussing their findings and
methodologies in order to reflect the current state of knowledge in the field and key questions
raised”. Aveyard (2010:5) and Hart (2003:13) further explain that the importance of doing a
literature review is to provide more insight into the research topic and to allow the researcher to
make a critical analysis of the literature available to draw impartial conclusions. The study
reviewed books and published work from reliable sources, such as GoogleScholar,
EBSCOhost, ScienceDirect, and Scopus to be able to address the main objectives outlined.
Table 1.1 provides the section in which the above-mentioned objectives of the literature review
were answered.
Table 1.1 Objectives outlined from literature review and sections in which they are
addressed
Objective Paragraph or section that addresses the objective
To conceptualise antibiotics and their use. Refer to 2.1.1 to 2.1.2.12
To determine, from literature, fluoroquinolones as a
pharmacological group of antibiotics, their indications
for use, side effects, drug interactions and special
precautions.
Refer to 2.1.2.13 to 2.1.2.13.8
To determine antibiotics’ prescribing patterns in Europe,
the United States and Africa with an emphasis on the
fluoroquinolones; and resistance in Africa.
Refer to 2.3
To identify interventions set up to monitor and control
the use of antibiotics globally.
Refer to 2.4
1.5.2 Empirical investigation
The subsequent paragraphs focus on the study design, source of data, study population,
variables used and the method of analysing the data.
1.5.2.1 Study design
The study followed a quantitative, descriptive, observational design using retrospective,
longitudinal medicine claims data provided by a nationally representative Pharmaceutical
Benefit Management company (PBM). Observational studies are beneficial when variables in

8
the study can be identified and measured, excluding human interventions (Waning & Montagne,
2005:45). It also helps to provide information about the problems with drug use by variables
such as person, time and place. The study follows a descriptive nature to provide insight into
the trends in antibiotic use in the population. The study is also considered retrospective as
data were collected between 2005 and 2012. According to Motheral et al. (2003:90),
retrospective databases are useful in health-related studies because they provide large sample
sizes and long observation times. Additionally, they are relatively cheaper to obtain and are
expedient for time (Motheral et al., 2003:91).
1.5.2.2 Data source
Secondary data for the study were obtained from an administrative claims database of a South
African Pharmaceutical Benefit Management (PBM) company. The PBM company (name
withheld for confidentiality) has been in existence for twenty-four years providing services to
thirty-six medical schemes in South Africa. The company also processes approximately 300 000
real-time and 30 000 doctors’ transactions daily. Administrative claims databases are reliable
sources of data because there is the avoidance of recall bias as they do not rely on patients’
recall or interviews to obtain data. Data for the eight-year period were obtained from 1 January
2005 to 31 December 2012.
1.5.2.2.1 Validity and reliability of data
A vital aspect of good research is the validity and reliability of the data used. These are
important to help produce accurate results and interpretations. Waning and Montagne
(2005:123) define the validity of a measure as the degree to which the measure actually
measures what it is designed to measure. Reliability is the degree of stability exhibited when a
measurement is repeated under identical conditions (Waning & Montagne, 2005:123).
The PBM from which data were obtained for the study ensures the reliability and validity of data
through gate-keeping services, eligibility services, utilisation management services, clinical
management services and pricing management along with real-time benefit management.
These validation processes ensure that claiming standards are met; for example, in the case of
a missing or invalid product or member number, such a claim would be rejected. The PBM also
conducts supplementary services such as integrated pre-authorisation services, prescribed
minimum benefits (PMBs) and other conditions, and medicine management in capitation
environments. All unpaid claims were excluded from the data as part of a cleaning-up process.
The datasets were verified after each cleaning process by performing random data checks.
Park and Stergachis (2008:519) describe claims databases as multipurpose because they

9
provide administrative records and health service files. These databases must be of high
quality; information on individuals should be linkable across datasets; and patients in the
datasets must be traceable to provide longitudinal follow-up (Park & Stergachis, 2008:519).
Table 1.2 is a summary of measures to validate data used by the PBM.
Table 1.2 Claim processing checks to ensure validity of data by PBM
Data integrity validation process Example
Eligibility management Claim field format checks
Provider validation checks
Member validation checks
Verification of dependent codes
Checks for waiting period
Duplicate check
Medicine utilisation management Verification of refill limits and fill limitations per period
Product quantity limits
Pre-authorisation for products that require them
Patients specific exclusions
Drug to age range limitations
Drug to gender limitations
Invalid prescriber speciality
Broad category exclusions
Specific products excluded
Waiting periods
Clinical management Ingredients duplication and maximum daily dose exceeded
Therapeutic duplication
Drug-drug interaction
Drug-allergy interactions
Drug-age interactions
Drug-gender interactions
Drug-disease interactions
Drug-inferred health state interactions
Pricing management Continuous price file management
Application of reference pricing
Formulary management Management of chronic disease list prescribed minimum benefits and
non-chronic disease list conditions
Daily real-time benefit validation
Real-time benefit validation Real-time member validation and approval of claims

10
1.5.2.3 Study population
This section consists of the criteria utilised in the selection of the study population. The process
followed in extracting data for the study population is illustrated in Figure 1.1.
Figure 1.1 Selection procedures for study population
The following steps were employed in selecting the target population for the study:
Step 1: Retrieving data from the PBM central database
The elements selected from the PBM’s central database are shown in Table 1.3. An additional
field representing the Monthly Index of Medical Specialties (MIMS®) classification code was
included for each active ingredient that formed part of the dataset. The MIMS classification code
for antimicrobials is 18 and the sub codes 18.1 to 18.7 were selected from 1 January 2005 to 31
December 2012. Antibiotics analysed included the penicillins, cephalosporins, carbapenems,
macrolides, aminoglycosides, chloramphenicol, quinolones and tetracyclines. Data for
11 502 511 patients were obtained from the central PBM. The female-to-male ratio was 1.2:1.

11
Table 1.3 Selected data elements in the PBM used in the study
Type of data Selected database element
Membership Date of birth (to determine the age of the patient)
Gender
Anonymous membership identifier
Anonymous member dependent identifier
Medicine claims Anonymous prescriber type identifier
Anonymous provider identifier
National Pharmaceutical Product Interface (NAPPI®) code
Drug trade name
Quantity dispensed
Day’s supply
Date filled
Step 2: Applying inclusion criteria to obtain data subset for patients claiming ≥ one
antibiotic prescription
A total of 5 155 262 patients claiming one or more antibiotic prescriptions were extracted from
the database by applying the inclusion criteria (refer to Fig. 1.1). This formed 44.8% of the total
population (N = 11 502 511). The female-to-male ratio was 1.2:1.
Step 3: Study population was divided into two age groups (patients older than 18
years and patients 18 years and younger claiming ≥ one antibiotic
prescription)
The data subset was divided into main age groups: patients 18 years and younger and patients
older than 18 years who claimed antibiotic prescriptions over the study period.
A total of 3 788 438 patients older than 18 years were extracted from the dataset. They
represented 73.5% of the total number of patients who claimed antibiotic prescriptions during
the study period (n = 5 155 262).
A total of 1 366 824 patients 18 years and younger were extracted from the dataset. This study
population represented 26.5% of the total number of patients who claimed antibiotic
prescriptions during the study period (n = 5 155 262).
Step 4: Applying inclusion criteria to obtain data subset for patients claiming ≥ one
fluoroquinolone prescription in the two age groups
The data subset obtained from step 3 was further narrowed down applying the inclusion criteria
12
(refer to Fig. 1.1).
A total of 1 397 960 patients older than 18 years who claimed at least one fluoroquinolone
prescription during the study period were extracted from the dataset. This represented 37.0% of
the total number of patients older than 18 years who claimed at least one antibiotic prescription
(n = 3 788 438) and 27.1% of the total number of patients who claimed antibiotic prescriptions
(n = 5 155 262). The female-to-male ratio was 1.3:1.
A total of 49 540 patients 18 years and younger who claimed at least one fluoroquinolone
prescription during the study period were extracted from the dataset. This represented 3.6% of
the total number of patients 18 years and younger who claimed at least one antibiotic
prescription (n = 1 366 824) and 1% of the total number of patients who claimed antibiotic
prescriptions (n = 5 155 262). The female-to-male ratio was 1.2:1.
1.5.2.4 Study variables
A variable is described as a measurable characteristic relating to an individual or a group
(Oxford Concise Medical Dictionary, 2014). The subsequent sections focus on the various
independent and dependent variables employed in this study.
1.5.2.4.1 Independent variables
An independent variable is a characteristic being observed or measured and is hypothesised to
influence an event or outcome (CDC, 2012:20). Heiman (2014:24) further explains independent
variables as those manipulated by the investigator to produce an outcome of interest. The
independent variables analysed in the study were age, gender, geography, seasons and
specialty of prescriber. These variables were chosen to provide more insight into the trends in
antibiotic use over time. The following paragraphs describe the independent variables used in
the study.
Age
Age is an important characteristic of a population because most health-related concerns vary
with this variable (CDC, 2012:24). The ages of patients in the study were calculated by using
the age of the patient at the time of treatment with respect to their date of birth using 1 January
of the following year as reference. It is recommended that age groups be narrow enough to
detect any age-related patterns that may be present in the data. The age of the adult study
populations was stratified according to the following groups illustrated below:

13
Group 1 - 18<n≤ 30 years
Group 2 - 30<n ≤ 45years
Group 3 - 45<n≤ 65 years
Group 4 - above 65 years
The age group for the paediatric study population is also outlined as follows:
Group 1 - 0 ≤ n ≤ 5 years
Group 2 - 5 < n ≤12 years
Group 3 - 12 < n ≤18 years
Gender
Antibiotic use varies with respect to gender. Most studies evaluating antibiotic use in a given
population have observed a higher use in males compared to females (Abula & Kedir, 2004:36;
Amadeo et al., 2010:2248; Raveh et al., 2001:143; Stuart et al., 2012:1146). In the study,
gender was defined as patients being either male or female.
Geography
The Statistical Analysis System®, SAS 9.3® (SAS Institute Inc., 2012) programme was used to
group all prescriber practice addresses according to the postal codes indicated for every
prescriber’s practice to categorise them according to the nine provinces.
Prescribers
A prescriber is defined by the Oxford English Dictionary (2013) as a person who writes or
authorises a medical prescription. The prescribers were divided into the following categories:
- General medical practitioners: This group includes all the medical providers who are
registered with the Health Professions Council of South Africa (HPCSA) as a general
medical practitioner.
- Paediatricians.
- Pharmacotherapists: This group includes all qualified personnel who are registered with the
South African Pharmacy Council.
- Specialists: cardiologists, neurologists, obstetricians and gynaecologists, urologists and
oncologists.
- Other: This group includes prescribers such as dentists and dermatologists.

14
Seasons
The use of antibiotics has been found to change seasonally, with the most use occurring during
the winter months (Adrianssens et al., 2011a:S6-S7; Polk et al., 2004:499). The Centre for
Disease Control (2012:34) recommends the use of more than a year’s data to draw reasonable
conclusions of seasonal patterns of drug use (CDC, 2012:34). This study therefore employed
eight years’ data and is consequently valuable to explore seasonal trends. In this study, the
year was divided into three seasons, consisting of four months, marking each season, as
illustrated below:
Season 1 - January-April
Season 2 - May-August
Season 3 - September-December
1.5.2.4.2 Dependent variables
Dependent variables are described as outcome variables that are influenced by the
independent variables. The dependent variables from the study included the following:
- The average number of prescriptions per patient per year.
- The average number of antibiotic agents per prescription per patient.
- The major pharmacological groups of antibiotics prescribed per year.
- The different antibiotic agents prescribed per year.
- The defined daily doses (DDD)/1 000 inhabitants/day of fluoroquinolone use in adults.
- The average DDD per prescription per patient per year in adults.
- Comparison of the prescribed daily dose (PDD) and the recommended daily dose (RDD) of
fluoroquinolones in children was also analysed.
The following prescription-related measurements were done to help describe antibiotic use
during the study:
Prescription volume
A prescription is defined by the Oxford Online Dictionary (2013) as “an instruction written by a
medical practitioner that authorises a patient to be issued with a medicine or treatment”.
Medicine is defined by the Medicines and Related Substances Amendment Act (Act 72 of 2008)
as “any substance or mixture of substances used or purporting to be suitable for use or
manufactured or sold for use in the diagnoses, treatment, mitigation, modification, or prevention
of disease, abnormal physical or mental state or the symptoms thereof in humans; or restoring,

15
correcting or modifying any somatic or psychotic or organic function in humans, and include any
veterinary medicine” (Department of Health, 2009).
The number of prescriptions and medicine items claimed by beneficiaries was used to describe
the prescribing volume. Patients claiming at least one antibiotic using the MIMS® classification
(Sections 18.1 to 18.7) during the study period (January 1, 2005 to December 31, 2012) were
evaluated.
Defined daily doses (DDD), prescribed daily doses (PDD) and the recommended daily
doses (RDD)
The defined daily dose (DDD) is the assumed average maintenance dose per day for a drug
used for its main indication in adults (WHO, 2003:20). The DDD is a unit of measurement and it
is not a reflection of the prescribed daily dose. The DDD per 1 000 inhabitants per day provides
a rough estimate of the study population that are treated daily with a particular drug (WHO,
2013:26). This was calculated by determining the total amount of the drug dispensed (in
milligrams), divided by the DDD conversion factor and the population (using the total number of
beneficiaries covered by medical aid schemes registered under the PBM company during the
study period, as denominator for each respective year) to obtain the results in DDD-
inhabitants/year. The DDD/inhabitants/year was then divided by 365 days and multiplied by
1 000, to obtain the results in DDD/1000 inhabitants/day.
The prescribed daily dose (PDD) can be defined as the average dose prescribed according to a
representative sample of prescriptions (WHO, 2003:20). The PDDs were calculated from the
dataset by multiplying the quantity prescribed by the strength or the concentration per unit in
milligrams divided by the days’ supplied.
The maximum recommended daily dose for each fluoroquinolone, shown in Table 1.4, was
obtained by cross-referencing from the literature.

16
Table 1.4 Maximum recommended daily doses of fluoroquinolones in patients 18
years and below
Fluoroquinolone Route of
administration
Dose (mg/kg) Maximum daily
dose (mg)
References
Ciprofloxacin oral 15 – 20 1 500 BNF for children (2012);
Rossiter (2012); Department
of Health (2013); Sweetman
(2012); Takemoto et al.
(2010); WHO (2005)
intravenous 10 – 15 1 200
Ofloxacin oral 7.5 – 15 800 WHO (2008)
Levofloxacin oral 7.5 – 10 750 WHO (2008)
15 – 20 1 000 Department of Health (2013)
Moxifloxacin oral/ intravenous 7.5 – 10 400 Department of Health
(2013); WHO (2008)
Gatifloxacin oral 10 400 Sweetman (2012)
Norfloxacin - 800 Sweetman (2012)
Enoxacin oral - 800 Sweetman (2012)
Gemifloxacin oral - 320 Sweetman (2012)
Lomefloxacin oral - 400 Sweetman (2012)
1.5.2.5 Statistical analyses
The data were analysed by using Statistical Analysis System®, SAS 9.3® (SAS Institute Inc.,
2012). The afore-mentioned study variables (refer to section 1.5.2.4) were analysed using both
descriptive and inferential statistics. The paragraphs below provide a brief summary of the test
statistics employed to address the objectives of the empirical investigation.
1.5.2.5.1 Descriptive statistics
Heiman (2014:21) explains descriptive statistics as ways of organising and summarising sample
data to facilitate effective communication and describe their important characteristics.
Descriptive statistics also aid in predicting future outcomes in a population. The subsequent
paragraphs provide a brief summary of the various descriptive statistics utilised in the study.
Frequency and prevalence
The Oxford Online Dictionary (2013) defines the term frequency as “the rate at which something
occurs over a particular period of time or in a given sample”. Prevalence is the number of
existing cases at a point in time in a population size defined by specific characteristics (Waning
17
& Montagne, 2005:20). Prevalence is the probability of the occurrence of a condition and is
obtained by dividing the number of cases in the population by the total number in the
population. For the purpose of this study, the numerators consisted of patients receiving one or
more antibiotics and the denominator was the total number of patients in the database stratified
according to age and gender.
Median
The median is defined as “the middle observation if the sample size is odd and the average of
the two middle observations if the sample size is even, arranged in rank order”
(Hettmansperger, 2005:3103). The median of a distribution is the point that divides the sample
into two equal parts.
Average or mean
The mean is defined as “the central point or tendency of a set of numerical data” (Smith,
2005:3063). It is derived from the summation of the set of numerical observations divided by the
number of observation. Mathematically, average or mean is denoted by �� for a dataset
represented by x1, x2, x3...xn,
�� = (x1+ x2 + x3 + xn,)/n
Where �� is the average
xn is the individual values and
n is the sample size.
Minimum and maximum
Minimum is defined by the Oxford Online Dictionary (2014) as “the smallest value which a
variable takes”. Maximum is “the highest value a variable takes” (Oxford Online dictionary,
2014).
Range
The range is a type of descriptive statistic that crudely measures the distance between the two
most extreme scores in a distribution. It is given by:
Range = Highest score – Lowest score

18
The range roughly describes the spread of a distribution as it involves the least typical and most
frequent scores (Heiman, 2014:87).
Standard deviation
The standard deviation (SD) is an effective means of describing how data from a result differ
from each other (Heiman, 2014:86). It is defined as the positive square root of the variance,
where the variance of a group of data is a means of providing useful information on how the
individual data differ around the mean and how spread out a distribution is (Waning &
Montagne, 2005:85). The larger the standard deviation, the more variability there is in the
sample. The opposite is also true; the smaller the variability, the greater the consistency
between the results obtained. The standard deviation also describes how the mean accurately
describes the distribution of the data (Heiman, 2014:86). The standard deviation is given as
follows:
SD = √∑(𝑥1− ��)
2
𝑛−1
where SD is the standard deviation
x1 is the individual value
�� is the mean
n is the sample size
Standard error (SE)
The standard error provides useful information about the certainty of the mean. Similar to the
standard deviation, the larger the standard error, the more uncertain the standard mean. The
standard error of the mean is given by:
SE = √𝑆2
𝑁
Where SE is the standard error
S2 is the variance
N is the sample size
Confidence interval (CI)
The confidence interval (CI) is a range of values that contain a parameter of interest from a

19
sample population with a certain degree of certainty (Waning & Montagne, 2005:88). In this
study, the 95% CI was used. Mathematically, the 95% CI is calculated as follows:
95% CI = µ ± (2 × SE)
Where µ is the mean of the sample population
SE is the standard error of the mean.
The 95% CI simply means that an investigator is 95% certain that an estimate from the
population of interest falls between a range of values, also known as the confidence interval.
Additionally, the confidence interval is a means of indicating the statistical significance of results
obtained from a study (Waning & Montagne, 2005:88).
1.5.2.5.2 Inferential statistics
Inferential statistics are procedures performed to test hypotheses in a study and to determine
whether there are significant differences in association in order to minimise sampling errors
(Asadoorian & Kantarelis, 2005:2; Heiman, 2014:22; Waning & Montage, 2005:91). According
to Cohen (1988:4), the power of statistical tests is highly dependent on the criteria for
significance, the reliability of the sample results and the measure of the effect size.
Statistical significance
An acceptable level of chance occurrence (alpha, α), also referred to as the level of significance
(p-value), was determined before the collection of data to control type I error. The p-value is
defined as the probability of obtaining an outcome that is at least as extreme as the one that is
actually observed provided that the hypothesis is correct (Anders, 1993:36). It shows how
consistent the observed outcome is hypothesised. In this study, a p-value of 0.05 was used.
Observations with p-values less than or equal to 0.05 were considered to be statistically
significant and vice versa. The p-value is, however, sensitive to the size of the study population
and the magnitude of the differences observed between two groups (Waning & Montagne,
2005:92). Smaller p-values are easily obtained in large sample sizes, which may not be
necessarily practical in reality. Additionally, small differences observed between groups in large
study populations will be statistically significant and vice versa (Anders, 1993:41). The p-values,
however, do not give the strength of association between two groups and therefore the use of
effect size measures (Anders, 1993:41).

20
Statistical tests
The following tests were used to determine the statistical significance of the various study
variables and outcomes derived from the study:
a) The two-sample t-test
This is a test used to determine the statistical significance of the means of two independent
groups (Heiman, 2014:264). In this study, the t-test was used to determine the statistical
significance in antibiotic prescribing between males and females. The Statistical Analysis
System®, SAS 9.3® (SAS Institute Inc., 2012) was used in computing the t-test.
b) Analysis of variance (ANOVA)
The ANOVA is used to compare the variances between groups and that within groups (Carr,
2012:157). The test gives a test statistic known as the F-ratio, which gives a level of statistical
significance (i.e. the p-value) (Carr, 2012:157). In this study, the ANOVA was used to determine
the level of significance between antibiotic prescribing and the different age groups, provinces
and seasons. The Statistical Analysis System®, SAS 9.3® (SAS Institute Inc., 2012) was used in
computing ANOVA in this study.
c) Chi-square test (χ2)
The chi-square test is a means of determining the level of significance between two or more
groups of categorical data, displaying data by means of contingency tables (Heiman, 2014:252).
The chi-square statistic is determined from the observed and expected counts from the
contingency tables (Heiman, 2014:252). In this study, the chi-square test was used to determine
the level of significance between antibiotic prescribing and the different age groups by using the
Statistical Analysis System®, SAS 9.3® (SAS Institute Inc., 2012).
Effect size
Effect size is the degree to which a phenomenon exists (Cohen, 1988:4). Statistical significance
is most likely to occur in large sample sizes, though with very small effect sizes (Anders,
1993:41). In this study, the Cohen’s d-value and Cramer’s V were used to determine the effect
sizes of statistically significant results. The following paragraphs provide a brief summary on the
aforementioned effect size measures:

21
a) Cohen’s d-value
Cohen’s d-value is used to determine the effect size in a sample population when applying the t-
test (Cohen, 1988:24). It is the absolute difference between two population means divided by
the common standard deviation. Mathematically, it is given by:
d = |𝑋𝐴 − 𝑋𝐵
𝜎|
Where d is the effect size index
𝑋𝐵 and 𝑋𝐵
are the means of the two populations
σ is the standard deviation of either population (since they are assumed to be equal) (Cohen,
1988:24).
According to Cohen (1988:29), the measure of the effect size is categorised as follows:
Small effect size, d = 0.2
Medium effect size, d = 0.5
Large effect size, d = 0.8.
A d-value ≥ 0.8 was considered practically significant.
b) Cramer’s V
It is a measure of association used to adjust the chi-square statistic for the difference in sample
size and the dimensions of the contingency tables (Heiman, 2011:352). It is the most suitable
measure of association for tables with more than two rows and columns (Healey, 2013:293).
Mathematically, the Cramer’s V is given by:
V = √𝑥2
𝑛𝑡
Where V is the Cramer’s V value
𝑥2 is the chi-square statistic,
n is the sample size, and
t is the minimum of the number of rows minus one or the number of column minus 1.
The value of the Cramer’s V is interpreted as follows (Rea & Parker, 2005:189):
negligible association, V is > 0.0, ≤ 0.1;
weak association, V is > 0.1, ≤ 0.2;
moderate, V is > 0.2, ≤ 0.4;
relatively strong association, V is > 0.4, ≤ 0.6;

22
strong association, V is > 0.6, ≤ 0.8;
very strong association, V is > 0.8 to 1.0.
A Cramer’s V value ≥ 0.5 was considered to be practically significant.
1.5.3 Measures to ensure validity of the study
The use of databases for pharmacoepidemiological research has several advantages, such as
large sample sizes, limitation of biases (recall and reporting), lower costs in data acquisition and
shorter timeframe in data collection (Hall et al., 2012:1; Strom, 2006:188). Although the uses of
databases are advantageous, there are factors that limit their use. These factors include the
uncertainty of the validity of diagnoses; lack of information with regard to confounding;
incomplete data due to medications obtained without prescriptions or not included in the
patients’ health benefit plan (Strom, 2006:188). Additionally, the population in the database are
unstable due to patients’ changes in health plan and cancellation of plan.
To address these flaws, guidelines for good pharmacoepidemiological research from automated
databases have been enacted. In Table 1.4, a checklist to conduct studies utilising retrospective
databases has been provided to ensure the robustness of the study, adapted from Motheral et
al. (2003:90-97) and Hall et al. (2012:2-9), and The European Network of Centres for
Pharmacoepidemiology and Pharmacovigilance (2013:4-42).
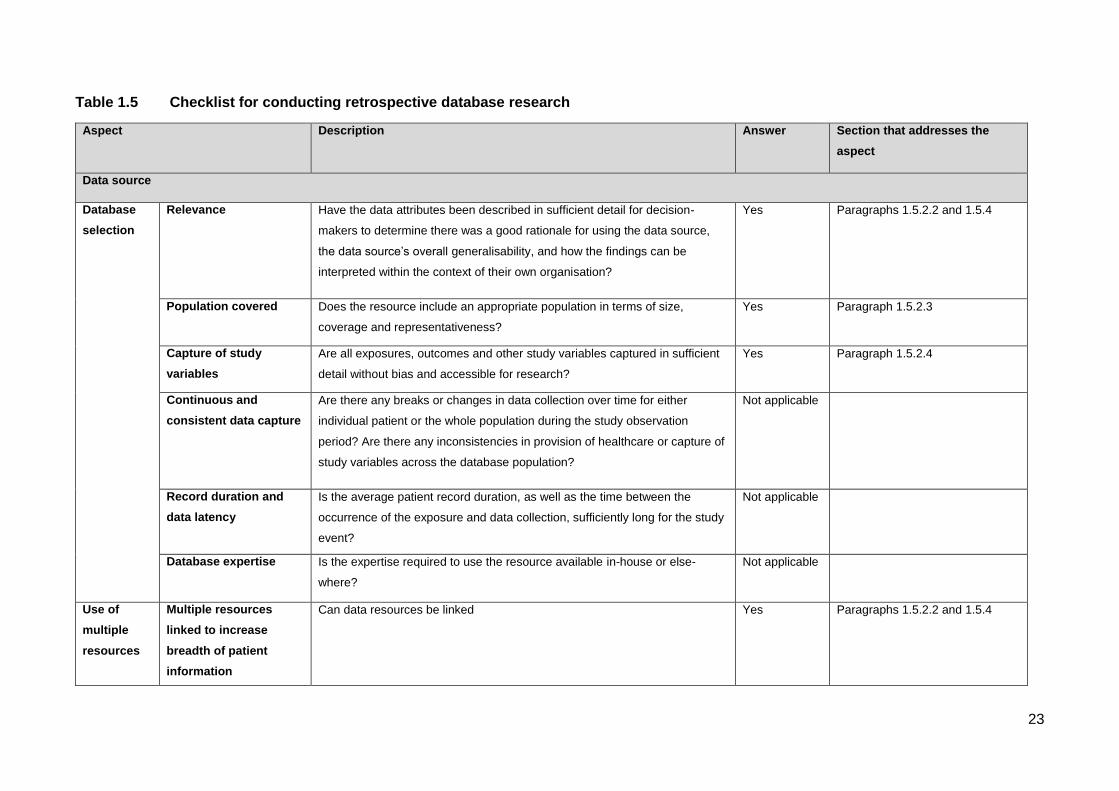
23
Table 1.5 Checklist for conducting retrospective database research
Aspect Description Answer Section that addresses the
aspect
Data source
Database
selection
Relevance Have the data attributes been described in sufficient detail for decision-
makers to determine there was a good rationale for using the data source,
the data source’s overall generalisability, and how the findings can be
interpreted within the context of their own organisation?
Yes Paragraphs 1.5.2.2 and 1.5.4
Population covered Does the resource include an appropriate population in terms of size,
coverage and representativeness?
Yes Paragraph 1.5.2.3
Capture of study
variables
Are all exposures, outcomes and other study variables captured in sufficient
detail without bias and accessible for research?
Yes Paragraph 1.5.2.4
Continuous and
consistent data capture
Are there any breaks or changes in data collection over time for either
individual patient or the whole population during the study observation
period? Are there any inconsistencies in provision of healthcare or capture of
study variables across the database population?
Not applicable
Record duration and
data latency
Is the average patient record duration, as well as the time between the
occurrence of the exposure and data collection, sufficiently long for the study
event?
Not applicable
Database expertise Is the expertise required to use the resource available in-house or else-
where?
Not applicable
Use of
multiple
resources
Multiple resources
linked to increase
breadth of patient
information
Can data resources be linked Yes Paragraphs 1.5.2.2 and 1.5.4

24
Table 1.5 Checklist for conducting retrospective database studies (continued)
Aspect Description Answer Section that addresses the
aspect
Data source
Use of multiple
resources
Multiple resources linked
to increase numbers
Are the data sources and data systems compatible in metrics, policy and
terminology?
Not applicable
Data storage and
analysis
In multi-institutional studies, should a central or distributed system be
used?
Not applicable
Extraction and
analysis of the
study population
Specification of
extraction
Are the following specified in detail: how to extract the study population and
variables, code lists and non-coded systems, retrieval and merging
additional external data, output and final analysis?
Yes Paragraphs 1.5.2.3.1 and 1.5.2.3.1
Privacy and
security
Compliance with privacy
and security policy
Have all relevant local, regional and national policies been complied with? Yes Paragraph 1.6
Limited use of identifying
information
Are all direct identifiers removed or masked? Whose responsibility is it to
ensure privacy?
Yes
Secure data storage and
transfer
Is there a formal data security policy, and has it been adhered to? Yes Paragraph 1.6
Review of policy and
procedures
Are regular policy reviews adhered to? Has the use of new database,
collection of additional patient or physician data, use of multiple resources,
or narrative data impacted confidentiality?
Not applicable
Quality and
validation
process
Overall database Have appropriate general quality checks been completed? Yes Paragraph 1.5.2.2.1
Study population Has the annotated programming code been reviewed by an independent
programmer?
Yes

25
Table 1.5 Checklist for conducting retrospective database studies (continued)
Aspect Description Answer Section that addresses the
aspect
Data source
Documentation Format Are rules of Guidelines for Good Pharmacoepidemiology practices
followed, including storage and indexing?
Yes Paragraph 1.5.3
Reliability and validity Have the reliability and validity of the data been described, including any
data quality checks and data cleaning procedures?
Yes Paragraph 1.5.4
Research methodology
Methods Data analysis plan Was a data analysis plan, including study hypotheses, developed a priori? Not applicable
Design selection Has the investigator provided a rationale for the particular research design? Yes The rationale for the study design is
explained in paragraph 1.5.2.1
Research design
limitations
Did the author identify and address potential limitations of the design? Yes Paragraph 4.4
Treatment effect For studies that are trying to make inferences about the effects of an
intervention, does the study include a comparison group and have the
authors described the process of identifying the comparison group and the
characteristics of the comparison group as they relate to the intervention
group?
Not applicable

26
Table 1.5 Checklist for conducting retrospective database studies (continued)
Aspect Description Answer Section that addresses the aspect
Study
population
and variable
definitions
Sample selection Have the inclusion and exclusion criteria and the steps used to
derive the final sample from the initial population been described?
Yes The study population was selected based on criteria
explained in paragraphs 1.5.2.3.1 and 1.5.2.3.2
Eligibility Are subjects eligible for the time period over which measurement
is occurring?
Yes The study covers an eight-year period following a
descriptive nature, refer to paragraph 1.5.2.1
Censoring Were inclusion/exclusion or eligibility criteria used to address
censoring and was the impact on study findings discussed?
Not
applicable
Operational
definitions
Are case (subjects) and end point (outcomes) criteria explicitly
defined using diagnoses, drug markers, procedure codes, and/or
other criteria?
Yes Patients claiming one or more antibiotics were used,
with the term antibiotics referring to the MIMS®
classification 18. 1 to 18.7; refer to paragraph 1.5.2.3.1.
Timing of outcome Is there a clear temporal (sequential) relationship between the
exposure and outcome?
Not
applicable
Event capture Are the data, as collected, able to identify the intervention and
outcomes if they actually occurred?
Not
applicable
Disease history Is there a link between the natural history of the disease being
studied and the time period for analysis?
Not
applicable
Resource valuation For the studies that examine costs, have the authors defined and
measured an exhaustive list of resources affected by the
intervention given the perspective of the study and have resource
prices been adjusted to yield a consistent valuation that reflects
the opportunity cost of the resource?
Not
applicable

27
Table 1.5 Checklist for conducting retrospective database studies (continued)
Aspect Description Answer Section that addresses the aspect
Statistics Control variables If the goal of the study is to examine treatment effects, what methods have
been used to control for other variables that may affect the outcome of
interest?
Not
applicable
Statistical model Have the authors explained the rationale for the model/statistical method
used?
Yes Refer to paragraph 1.5.3.
Influential cases Have the authors examined the sensitivity of the results to influential
cases?
Not
applicable
Relevant variables Have the authors identified all variables hypothesised to influence the
outcome of interest and included all available variables in their model?
Yes Refer to paragraph 1.5.2.4.
Testing statistical
assumptions
Do the authors investigate the validity of the statistical assumptions
underlying their analysis?
Not
applicable
Multiple tests If analyses of multiple groups are carried out, are the statistical tests
adjusted to reflect this?
Not
applicable
Model prediction If the authors utilise multivariate statistical techniques in their analysis, do
they discuss how well the model predicts what it is intended to predict?
Not
applicable
Discussion
and
conclusion
Theoretical basis Have the authors provided a theory for the findings and have they ruled out
other plausible alternative explanations for the finding?
Yes Refer to Chapter 3
Practical versus
statistical
significance
Have the statistical findings been interpreted in terms of their clinical or
economical relevance?
Yes Refer to Chapter 3
Generalizability Have the discussed covered the populations and settings to which the
results can be generalised?
Yes Refer to Chapter 3

28
1.6 Ethical aspect of research
Permission to conduct the study was obtained from the board of directors of the PBM, as well
as the Ethics Committee of the North-West University (NWU-0046-08-550). Data privacy and
confidentiality were maintained at all times; therefore, no patient or medical
scheme/administrator could be traced. Additionally, it was not possible to determine which
prescribers or providers (i.e. name of the prescriber/provider) were involved in the
prescribing/dispensing of the medicine items. The PBM providing the data for the study is
furthermore nowhere identified in this study. The researcher, study promoter and co-promoter
furthermore signed confidentiality agreements.
The research was not sponsored by the private pharmaceutical sector or the PBM providing the
data, minimising the potential for any bias in the study. All views expressed in this study are
those of the researcher and do not necessarily reflect the official policy or position of the
institution.
1.7 Chapter division
The study is presented in an article format. Chapter 1 describes the background to the study,
problem, aim of the research and research methodology. Chapter 2 provides a comprehensive
literature review of prescribing patterns of antibiotics and relevant topics to provide more insight
into the topic being analysed. Chapter 3 consists of manuscripts submitted to the proposed
journals involving the method of research, results and discussions. Chapter 4 provides detailed
discussions of the main findings, comparing these findings to relevant literature, limitations and
strengths of the study, as well as an elaborate list of recommendations for future studies.
1.8 Chapter summary
In this chapter, it has been established that the use of antibiotics has been linked with the
emergence of resistance. However, there is little published data on the consumption of
antibiotics in many countries. The main aim and method of research were also established. The
next chapter focuses on antibiotics, summarising the main sub-pharmacological groups;
antimicrobial resistance; patterns of antibiotic usage globally; and quantitative methods of
measuring antibiotic use.

29
CHAPTER 2: LITERATURE REVIEW
2.1 Introduction
This chapter focuses on providing a general summary of antibiotics and their use; determining,
from the literature, fluoroquinolones as a pharmacological group of antibiotics, their indications,
side effects, drug interactions and special precautions; determining resistance patterns in Africa;
antibiotics prescribing in Europe, the United States and South Africa, with an emphasis on
fluoroquinolones; and identifying interventions set up to monitor and control the use of
antibiotics in Europe, the United States, Africa and South Africa.
2.2 Antimicrobial agents
Antimicrobials are defined as low molecular microbial metabolites that limit the growth of micro-
organisms at low concentrations (Gelone & O’Donnell, 2005:1633; Lancini et al., 1995:1).
Chambers (2001a:1143) goes further to define antimicrobials as substances produced by
various species of micro-organisms that suppress the growth of other organisms. The term,
‘antimicrobials’, has also been used to refer to synthetic antimicrobial agents. Although
antimicrobial agents were discovered long ago, the beginning of modern chemotherapy started
with the discovery of penicillin (Garrold, 1964:1).
2.2.1 Classification of antimicrobial agents
Antimicrobial agents can be classified according to their mechanism of action and chemical
structure (Chambers, 2001a:1143; Gelone & O’Donnell, 2005:1633). Five bacterial targets have
been exploited in the development of antimicrobial drugs (Hooper, 2001:32; Sefton, 2002:558),
which include cell wall synthesis, protein synthesis, ribonucleic acid (RNA) and deoxyribonucleic
acid (DNA) syntheses, as well as intermediary metabolism in the bacteria cell. Table 2.1
illustrates the mechanism of action of the various antibacterial agents and examples for each
(adapted from Sefton, 2002:558; Chambers, 2001a:1144).

30
Table 2.1 Mechanism of action of pharmacological groups of antimicrobials
Mechanism of action Antimicrobial agents
Agents that inhibit synthesis of bacterial cell wall. Penicillin, cephalosporin and carbapenems
Agents that act directly on the cell membrane affecting
permeability resulting in leakage of intracellular components.
Polymyxin
Agents that affect the functions of the 30S and 50S
ribosomal subunits causing reversible inhibition of protein
synthesis.
Chloramphenicol, tetracycline, macrolides
Agents that irreversibly bind to 30S subunits of the
ribosomes altering protein subunits.
Aminoglycosides
Agents that affect bacterial nucleic acid synthesis. Rifampicin, quinolones
Antimetabolites. Sulphonamides and trimethoprim
2.2.2 Pharmacological sub-groups of antibiotics
For the purpose of this study, the major sub-pharmacological groups of antibiotics reviewed are
the penicillins, cephalosporins, carbapenems, aminoglycosides, chloramphenicol,
fluoroquinolone, macrolides, tetracycline, sulphonamides and trimethoprim. The subsequent
paragraphs summarise the mechanism of action, clinical uses and adverse reactions involving
these major groups of antibiotics for systemic use.
2.2.2.1 Penicillins
The penicillin antibiotics were discovered in 1928 from the isolation of a crude preparation from
the cultures of Penicillium notatum. They constitute natural and semisynthetic antibiotics derived
from the fungus. Penicillin consists of a thiazolidine ring attached to a four-membered β-lactam
ring with a side chain (Creticos & Sheagren, 1999:249).
Mechanism of action
Penicillins are generally bactericidal. Their mode of action involves inhibiting the transpeptidase
enzyme that catalyses the final step in cell wall biosynthesis, i.e. the cross-linking of
peptidoglycan, creating weak points by which the cell wall eventually ruptures (Yocum et al.,
1980:3977).
Adverse effects
The main adverse effects of penicillins are allergic-hypersensitivity reactions involving
anaphylactic reactions, serum sickness, contact dermatitis, phlebitis and direct toxicity (Creticos
& Sheagren, 1999:249). Gastro-intestinal disturbances in the form of nausea, vomiting,

31
epigastric pain, diarrhoea and black ‘hairy’ tongue have been associated with the use of
penicillins (Gelone & O’Donnell, 2005:1337).
Classification of penicillins
Penicillins are classified into five main groups, namely the natural penicillins, penicillinase-
resistant penicillin, amino-penicillin, extended spectrum penicillin and the beta-lactamase
combinations (Gelone & O’Donnell, 2005:1635; McEvoy et al., 2002:321). Table 2.2 provides a
general summary of the various clinically used penicillins.

32
Table 2.2 A summary of the sub-pharmacological groups of penicillins, spectrum of activity and clinical uses
Classification Antibiotic Susceptible organisms and clinical indications
Natural penicillin (Geddes & Gould,
2010a:5-38; Geddes & Gould,
2010b:59-56)
Benzyl penicillin – sodium
penicillin G, potassium
Penicillin G, procaine
penicillin, benzathine
penicillin G
They are active against all groups of haemolytic streptococci, Staphylococcus aureus, Haemophilus influenza
gonococci, Treponema pallidum, Anthrax bacillus, Corynebacterium diphtheria.
Used for penicillin-susceptible pneumococcal infections due to streptococcus, meningococcal infections, syphilis,
gonorrhoea, brain abscess, meningococcal and pneumococcal septicaemia, bacterial endocarditis, yaws, rat-bite
fever, lyme disease and diphtheria.
Acid-stable penicillin
Phenoxymethyl penicillin
(penicillin V),
phenoxyethylpenicillin
Streptococcus pyogenes, Streptococcus pneumonia, non-penicillase-producing Staphylococcus aureus,
Staphylococcus viridans, Clostridium species, Neisseria gonorrhoea are all susceptible.
Pharyngitis, scarlet fever, cellulitis, chemoprophylaxis of rheumatoid fever, pneumonia, sinusitis and otitis media.
Penicillinase-resistant penicillin
(Turnidge, 2010a: 92; Turnidge,
2010b:100-102; Turnidge, 2010c:
117-119)
Methicillin, nafcillin, They are more active in Staphylococcus aureus, Staphylococcus epidermidis resistant to penicillin G,
Streptococcus species, and Neisseria gonorrhoea.
Staphylococcal aureus infections and coagulase-negative staphylococci infections are treated effectively.
Oxacillin, cloxacillin,
dicloxacillin, flucloxacillin
Staphylococcus aureus, Staphylococcus epidermidis resistant to penicillin G, Streptococcus species Neisseria
gonorrhoea.
Skin and soft tissue infections, endocarditis, pneumonia, cellulitis, due to staphylococcal and streptococcal
organisms, surgical prophylaxis, cystic fibrosis, and staphylococcal toxic shock.
Aminopenicillin (Geddes & Gould,
2010c:65-83)
Ampicillin, amoxicillin,
becampicllin, betacillin,
cyclicillin, pirampicillin,
Staphylococcus aureus, Proteus mirabilis, Salmonella typhi, Shigella Enterococci, Listeria monocytogenes, group
B streptococci, Corynebacterium diphtheriae, Bacillus anthracis, Streptococcus pyogenes, and Streptococcus
pneumonia.
Indications include urinary tract infections due to susceptible organisms, upper respiratory tract infection caused
by susceptible organisms, group A streptococci pharyngitis, otitis media, sinusitis, and dental infections.
Extended spectrum (Norrby,
2010a:123-130; Tramontana et al.,
2010:135-145; Norrby, 2010b:152)
Carboxypenicillin
Carbecillin, ticarcillin,
carfecillin, carindacillin
Pseudomonas aeruginosa, Prevotella species, Fusobacterium species, Staphylococcus aureus, Streptococcus
species.
Indications include septicaemia and pneumonia or meningitis due to Pseudomonas aeruginosa.
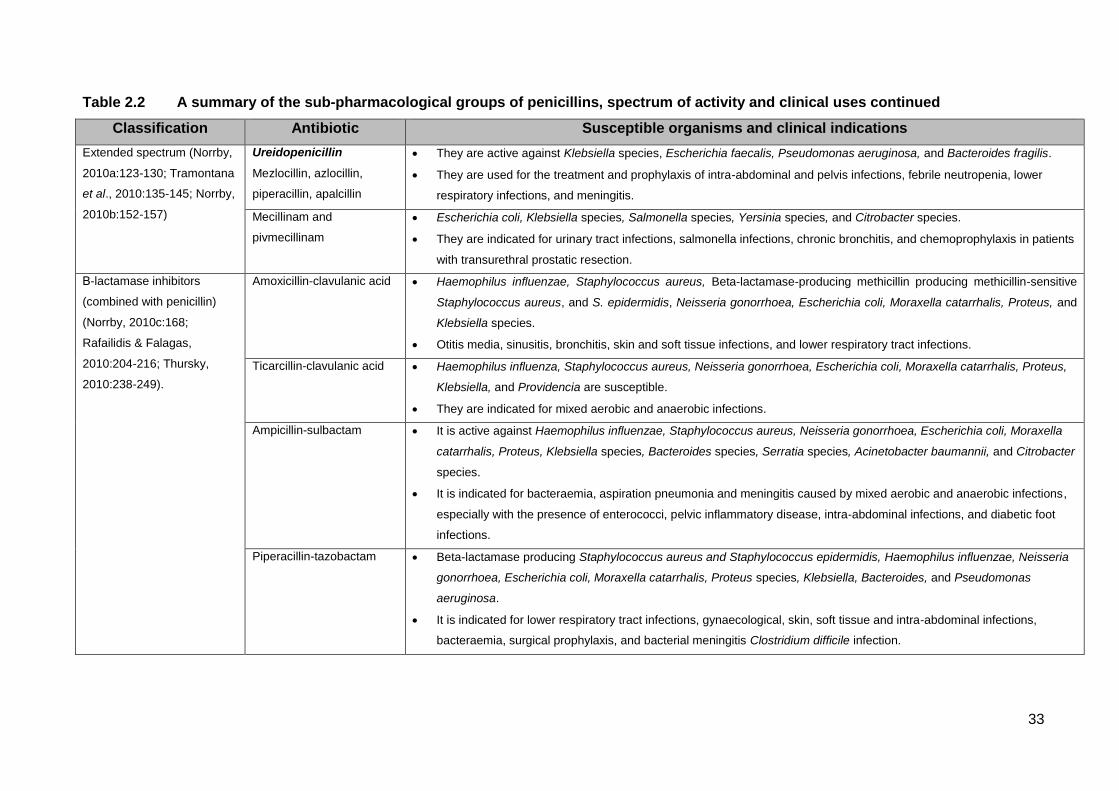
33
Table 2.2 A summary of the sub-pharmacological groups of penicillins, spectrum of activity and clinical uses continued
Classification Antibiotic Susceptible organisms and clinical indications
Extended spectrum (Norrby,
2010a:123-130; Tramontana
et al., 2010:135-145; Norrby,
2010b:152-157)
Ureidopenicillin
Mezlocillin, azlocillin,
piperacillin, apalcillin
They are active against Klebsiella species, Escherichia faecalis, Pseudomonas aeruginosa, and Bacteroides fragilis.
They are used for the treatment and prophylaxis of intra-abdominal and pelvis infections, febrile neutropenia, lower
respiratory infections, and meningitis.
Mecillinam and
pivmecillinam
Escherichia coli, Klebsiella species, Salmonella species, Yersinia species, and Citrobacter species.
They are indicated for urinary tract infections, salmonella infections, chronic bronchitis, and chemoprophylaxis in patients
with transurethral prostatic resection.
Β-lactamase inhibitors
(combined with penicillin)
(Norrby, 2010c:168;
Rafailidis & Falagas,
2010:204-216; Thursky,
2010:238-249).
Amoxicillin-clavulanic acid Haemophilus influenzae, Staphylococcus aureus, Beta-lactamase-producing methicillin producing methicillin-sensitive
Staphylococcus aureus, and S. epidermidis, Neisseria gonorrhoea, Escherichia coli, Moraxella catarrhalis, Proteus, and
Klebsiella species.
Otitis media, sinusitis, bronchitis, skin and soft tissue infections, and lower respiratory tract infections.
Ticarcillin-clavulanic acid Haemophilus influenza, Staphylococcus aureus, Neisseria gonorrhoea, Escherichia coli, Moraxella catarrhalis, Proteus,
Klebsiella, and Providencia are susceptible.
They are indicated for mixed aerobic and anaerobic infections.
Ampicillin-sulbactam It is active against Haemophilus influenzae, Staphylococcus aureus, Neisseria gonorrhoea, Escherichia coli, Moraxella
catarrhalis, Proteus, Klebsiella species, Bacteroides species, Serratia species, Acinetobacter baumannii, and Citrobacter
species.
It is indicated for bacteraemia, aspiration pneumonia and meningitis caused by mixed aerobic and anaerobic infections,
especially with the presence of enterococci, pelvic inflammatory disease, intra-abdominal infections, and diabetic foot
infections.
Piperacillin-tazobactam Beta-lactamase producing Staphylococcus aureus and Staphylococcus epidermidis, Haemophilus influenzae, Neisseria
gonorrhoea, Escherichia coli, Moraxella catarrhalis, Proteus species, Klebsiella, Bacteroides, and Pseudomonas
aeruginosa.
It is indicated for lower respiratory tract infections, gynaecological, skin, soft tissue and intra-abdominal infections,
bacteraemia, surgical prophylaxis, and bacterial meningitis Clostridium difficile infection.

34
2.2.2.2 Cephalosporins
Cephalosporins have a broader spectrum of action and inherent resistance to β-lactamase
degradation than the penicillins. The first active parent compound used in clinical practice was
Cephalosporin C isolated from Cephalosporium acremonium in 1948 (Malow & Sheagren,
1999:257-263; Petri, 2001a:1206).
Mechanism of action
The cephalosporins are bactericidal, like the penicillins. Their bactericidal action is mediated by
the inhibition of peptidoglycan cross-linkage in the bacteria cell wall (Gelone & O’Donnell,
2005:1642; Malow & Sheagren, 1999:257-263; McEvoy et al., 2002:129).
Classification of cephalosporins
The cephalosporins are classified according to four generations based on their gram-negative
spectrum and stability against beta-lactamases (McEvoy et al., 2002:129; Petri, 2001a:1206),
namely:
- 1st generation: narrow spectrum of activity and mostly potent against gram-positive
organisms and some gram-negative bacilli.
- 2nd generation: extended gram-negative activity and anaerobic organisms.
- 3rd generation: broader spectrum in vitro activity against gram-negative bacilli and reduced
gram-positive activity.
- 4th generation: gram-negative organisms with multiple resistance and able to cross the blood
brain barrier. This group had improved gram-positive activity, while maintaining expanded
gram-negative spectrum.
Table 2.3 provides an outline of the generations of cephalosporins, spectrum of activity and
clinical indications (adapted from Gelone & O’Donnell, 2005:1642; McEvoy, et al., 2002:139-
140; Petri, 2001a:1206).
Adverse reactions
Hypersensitivity reactions in the form of eosinophilia, drug fever, maculopapular rash, urticaria,
pruritus, and positive Coomb’s test have been reported. Phlebitis associated with the injectable
has been commonly associated with cephalosporins. Patients with a history of penicillin allergy
have a higher incidence of reactions to cephalosporins (Gelone & O’Donnell, 2005:1642; Malow
& Sheagren, 1999:257-263; McEvoy et al., 2002:137-138; Petri, 2001a:1212).

35
Table 2.3 Generations of cephalosporins, spectrum of activity and clinical uses
Generation Example Susceptible organisms and clinical indications
1st Cephalothin, cephrapirin,
cephradine, cephalexin,
cefodroxil, and cefazolin.
Staphylococcus aureus, Streptococcus pneumonia,
Streptococcus pyogenes, Streptococcus epidermidis,
Actinomyces species, Escherichia coli, Proteus, Klebsiella,
and Providencia species.
Treatment of urinary tract infections, respiratory tract
infections, orthopaedic and cardiovascular surgical
prophylaxis.
2nd Cefamandole, cefonicid,
cefuroxime, cefaclor, cefotetan,
cefprozil, ceforamide, cefoxitin,
cefmetazole, ceforanid, and
loracarbef
Haemophilus influenza, Escherichia coli, Proteus,
Enterobacter, Klebsiella, Staphylococcus aureus,
Citrobacter, Streptococcus pneumoniae, Moraxella
catarrhalis, Citrobacter, Acinetobacter, Serratia , Neisseria,
and Providencia species.
Treatment of community acquired pneumonia, urinary tract
infections by susceptible organisms, otitis media, and
sinusitis.
3rd Cefdinir, cefditonen, cefixime,
cefoperazone, cefotaxime,
cefpodoxime, ceftazidime,
ceftibuten, ceftizoxime,
ceftriaxone
E. coli, Klebsiella, Enterobacter, Acinetobacter, Serratia,
Providencia, Proteus, Morganella species, Neisseria
gonorrhoea, Bacillus fragilis, and Pseudomonas species.
Meningitis due to susceptible organisms, nosocomial
infections, gonorrhoea, pneumonia, and urinary tract
infections.
4th Cefepime Enterobacter, Acinetobacter, and Pseudomonas aeruginosa
Meningitis due to susceptible organisms.
2.2.2.3 Carbapenems and monobactams
Thienamycin was the first carbapenem isolated from Streptomyces cattleya (Zhanel et al.,
2007:1030). Monobactams consist of a β-lactam ring, with a thiazolidine ring and a sulphonate
group. Aztreonam, a synthetic member from this group, is resistant to hydrolysis by beta-
lactamases (Tattevin et al., 1999:265-271).
Mechanism of action
Carbapenems and monobactams inhibit the formation of intact cell walls by preventing the
bacteria from completing transpeptidation of peptidoglycal chains. They bind to different
penicillin-binding proteins other than in penicillins and cephalosporins. Imipenem, unlike
meropenem and ertapenem, is degraded by the enzyme dehydropeptidase (DHP-1), and
therefore it is co-administered with cilastin, which inhibits the enzyme and prevents

36
nephrotoxicity associated with imipenem (Baba, 2010:458; Petri, 2001a:1213; Tattevin et al.,
2005:265-271).
Adverse side effects
The most common side effects of carbapenems and monobactams include hypersensitive
reactions, phlebitis, rash, and gastro-intestinal side effects. Carbapenems are also associated
with seizures, Clostridium difficile colitis, hypersensitive reactions, haematological side effects,
hepatotoxicity and nephrotoxicity (Petri, 2001a:1213; Tattevin et al., 1999:265-271).
Table 2.4 provides a summary of the sub-pharmacological groups of carbapenems and
monobactams, their spectrum of activity and their clinical uses (adapted from Baba, 2010:458-
464; Hayashi & Paterson, 2010:472-475).
Table 2.4 Spectrum of activity and clinical uses of carbapenems and monobactam
Agent Susceptible organisms Clinical use
Carbapenem Staphylococcus aureus, Staphylococcus
epidermidis, Streptococcus pneumonia
(penicillin-resistant) Enterococci, Serratia
species, Klebsiella species, Haemophilus
species, Neisseria species, Pseudomonas
aeruginosa, Listeria monocytogenes,
Acinetobacter species, Proteus species,
Citrobacter species, Enterobacter species,
Bacteroides species, and Clostridia species.
Hospital-acquired and healthcare
associated pneumonia, complicated
urinary tract infections, acute pelvic
infection, lower respiratory tract
infections, intra-abdominal
infections, neutropenic fever,
severe diabetic foot infections, and
osteomyelitis.
Imipenem, meropenem
ertapenem, doripenem,
panipenem-betamipron,
biapenem.
Monobactam
Aztreonam
Escherichia coli, Proteus mirabilis, Klebsiella,
Enterobacter, Serratia, Providencia,
Citrobacter, Salmonella, Shigella,
Edwardsiella, Yersinia species,
Pseudomonas aeruginosa, and Neisseria
gonorrhoea.
Urinary tract infections, skin and
skin structure infections, cystic
fibrosis, respiratory tract infections,
bacterial meningitis, neonatal
sepsis, osteomyelitis, bacterial
gastroenteritis, malignant otitis
externa, otitis media, gonorrhoea
and perioperative prophylaxis.
2.2.2.4 Glycopeptides
The glycopeptides, vancomycin, telavancin and teicoplanin, are the clinically relevant forms
available for human use (Sulaiman et al., 1999:285-289; van Bambeke et al., 2004:914).

37
Mechanism of action
Glycopeptides inhibit late-stage peptidoglycan synthesis by binding to the bacterial cell wall
causing blockade of glycopeptide polymerisation (Allen & Nicas, 2003:513; Kahne et al.,
2005:432).
Spectrum of activity
Glycopeptides are active against methicillin/oxacillin susceptible Staphylococcus aureus,
coagulase-negative Staphylococcus, Streptococcus pyogenes, Streptococcus pneumonia,
Streptococcus agalactase, Clostridium difficile, Propionibacterium, Corynebacterium, Listeria
monocytogenes, Actinomyces and Lactobacillus species (Allen & Nicas, 2003:514).
Clinical uses
Glycopeptides are used to treat potentially life-threatening bacteraemia and endocarditis caused
by methicillin resistant Staphylococcus aureus (MRSA) and coagulase-negative Staphylococcus
aureus. It is an alternative therapy for patients allergic to penicillins in the treatment and
prophylaxis of endocarditis, pseudomembranous colitis, ventilator associated pneumonia (VAP)
susceptible to MRSA and osteomyelitis, meningitis, and Clostridium difficile-associated colitis.
Telivancin is also used for complicated skin structure infections (van Bambeke et al.,
2004:922-3).
Adverse effects
‘Red neck’ or ‘red man syndrome’ is the most common side effect of glycopeptides therapy
characterised by erythema, flushing or rash over upper torso and face, hypotension, and shock-
like symptoms. Local renal toxicities and ototoxicity, cutaneous reactions, and hematologic
toxicity are also associated with high plasma concentrations of the drug (McEvoy et al.,
2002:474-476; Sulaiman et al., 1999:288).
2.2.2.5. Lipopeptides
Lipopeptides have similar properties to glycopeptides, but have hydrophobic groups, making
them less prone to resistance (Allen & Nicas, 2003:512; Arhin et al., 2012:303; Nicasio et al.,
2010:654). Table 2.5 is a summary of the sub-pharmacological groups of lipopeptides, their
mechanism of action, spectrum of activity and their uses (adapted from Arhin et al., 2012:303;
Baltz, 2009:146; Kim et al., 2010:647; Straus & Hancock, 2006:1217).

38
Table 2.5 A summary of the sub-pharmacological groups of lipopeptides
Agent Mechanism of action, spectrum of activity, clinical uses
Daptomycin Daptomycin blocks septum formation caused by lipoteichoic acid. The compound requires
calcium ions necessary for the insertion and irreversible binding to the bacterial cytoplasmic
membrane. This results in the formation of pores allowing the efflux of potassium ions,
depolarising the cell membrane and eventually causing cell death.
Methicillin/oxacillin susceptible Staphylococcus aureus, Enterococci species, Clostridium
species, Corynebacterium, and Listeria monocytogenes are susceptible to daptomycin.
Complicated skin and skin structure infections, staphylococcal bacteraemia, endocarditis,
osteo-articular infections, central nervous system infections, community-acquired MRSA
infections and respiratory tract infections are effectively treated with daptomycin.
Oritavacin Oritavancin inhibits cell wall synthesis by forming complexes with the peptidoglycan chain;
this affinity exceeding that of vancomycin. Secondly, ortavancin binds to the cell membrane
causing changes in membrane potential and finally disrupting the cell membrane.
Methicillin-resistant/susceptible and vancomycin-resistant Staphylococcus aureus,
coagulase-negative methicillin resistant/susceptible Staphylococcus aureus, Streptococcus
species, and Clostridium species, are susceptible to oritavancin.
Oritavancin is useful in complicated skin and skin structure infections and bacteraemia.
Dalbavancin Dalbavancin, like the glycopeptides, inhibits peptidoglycan synthesis leading the cell to
rupture from changing internal osmotic pressure.
Methicillin susceptible and resistant Staphylococcus aureus, Streptococcus species, and
Enterobacter species are all susceptible to dalbavancin.
Skin and skin structure infections and catheter-related bloodstream infections are all
successfully treated with dalbavancin.
Telavancin Telavancin inhibits cell wall synthesis by interfering with peptidoglycan formation and is ten
times more potent than vancomycin. It also binds non-covalently to the cell membrane
disrupting the cell membrane and increasing the permeability of the cell, resulting in cell
death.
Telavancin is active against Staphylococcus aureus, Streptococcal species, Enterococcus
species, Actinomyces, Clostridium species, Corynebacterium species, Lactobacillus species
and Bacillus anthracis.
Complicated skin and skin structure infections and nosocomial pneumonia are treated with
telavancin.
Ramoplanin Ramoplanin sequesters peptidoglycan biosynthesic lipid intermediates, preventing the proper
use of these substrates in peptidoglycan synthesis. Owing to this unique mechanism, no
cross-resistance has been observed in ramoplanin.
Vancomycin-resistant enterococci, vancomycin-intermediate Clostridium difficile, coagulase-
negative Staphylococcus aureus and vancomycin-resistant Staphylococcus aureus.
Complicated skin and skin structure infections and nosocomial pneumonia are treated with
ramoplanin.

39
2.2.2.6 Aminoglycosides
The aminoglycosides consist of highly charged cationic six-membered rings with amino sub-
groups having rapid concentration-dependent bactericidal activity against most gram-negative
organisms. Members in this group include streptomycin, amikacin, gentamicin, kanamycin,
tobramycin, paromomycin, netilmicin, spectinomycin and neomycin. They are either
administered by parenteral route (intramuscular, intravenous, intrathecal, intraventricular), or by
oral inhalation (kanamycin, tobramycin); neomycin is the only exception administered by oral
route (Gilbert, 1999:273-284).
Mechanism of action
Aminoglycosides are bactericidal (dose dependent) and exert their action by irreversibly binding
to the 30S ribosomal subunit. This passive ionic interaction between the cationic drug and
anionic bacterial cell wall decreases protein synthesis by RNA resulting in cell death. Energy for
the uptake phase of the internalisation is dependent on aerobic metabolism; therefore,
aminoglycoside has minimum activity against anaerobic organisms. Aminoglycosides also have
a post-antibiotic effect depending on the strength used (Chambers, 2001b:1222; McEvoy et al.,
2002:1649).
Spectrum of action
Aminoglycosides exhibit in vitro activity against a wide range of aerobic gram-negative
pathogens, including Enterobacteriaceae, Pseudomonas species, Haemophilus influenzae,
Acinetobacter, Proteus, Citrobacter, Escherichia coli and Providencia species (Chambers,
2001b:1222). According to McEvoy et al. (2002:1649), Bacteroides, Entamoeba histolytica,
Trichomonas vaginalis, and Rickettsia are all resistant to aminoglycosides.
Clinical use
Aminoglycosides are used concomitantly with extended spectrum penicillin (carbecillin,
piperacillin and tazobactam, ticarcillin and clavulanic acid) for the treatment of serious
pseudomonal infections owing to the pathogens’ potential to exhibit inducible resistance to the
β-lactam (Chambers, 2001b:1225; Gelone & O’Donnell, 2005:1650; McEvoy et al., 2002:67).
Adverse effects
Toxicity is likely to occur if treatment is continued for more than ten days. The most common

40
adverse effects associated with therapy are ototoxicity and nephrotoxicity, mostly occurring in
patients with renal impairment, severe dehydration, and those receiving high aminoglycoside
dosage, prolonged therapy or in combination with other nephrotoxic or ototoxic drugs.
Aminoglycosides also affect the nervous system by causing neuromuscular blockade, apnoea,
respiratory depression and respiratory paralysis. Hypersensitive reactions, manifested by rash
and drug fever, have also been reported (Chambers, 2001b:1225; Gelone & O’Donnell,
2005:1650; Gilbert, 1999:277; McEvoy et al., 2002:67).
2.2.2.7 Macrolides
Erythromycin, clarithromycin, roxithromycin, dirithromycin, azithromycin, josamycin,
midecamycin and spiramycin are useful therapeutic macrolides (Gold & Moellering, 1999:291-
297). Gelone and O’Donnell (2005:1652) classify macrolides into three main groups according
to the time of discovery and pharmacokinetic profile, as illustrated below:
Group 1: Erythromycin is the prototype, inhibits cytochrome P450 and has a short duration
of action with frequent gastro-intestinal effects.
Group 2: Clarithromycin has improved spectrum of activity, less gastro-intestinal effects and
inhibits cytochrome P450 to a lesser extent.
Group 3: Azithromycin and dirithromycin do not affect cytochrome P450, they have
extended spectrum of action and longer half-lives.
Mechanism of action
Macrolides are bacteriostatic and bind reversibly to the 50S subunit of the bacterial ribosome
blocking protein elongation (Chambers, 2001c:1251; Gelone & O’Donnell, 2005:1652).
Spectrum of activity
Macrolides show potent activity against Streptococcus pyogenes, β-lactam haemolytic
streptococci, Streptococcus pneumonia, Neisseria gonorrhoea, Neisseria meningitides,
Haemophilus ducreyi, Bordetella pertussis, Moraxella catarrhalis, and Calymmatobacterium
granulomatis (Chambers, 2001c:1251; Gelone & O’Donnell, 2005:1652).
General clinical uses
Urinary tract infections caused by streptococci, lower respiratory caused by atypical organisms
(Mycoplasma pneumonia, Chlamydia pneumonia, Legionella pneumonia), community acquired
pneumonia (CAP), chancroid, granuloma inguinale, and skin infections caused by susceptible
41
organisms are successfully treated with macrolides for patients allergic to penicillin.
Erythromycin is used for the treatment diphtheria, Campylobacter jejuni enteritis, and for the
treatment of Acne vulgaris. Azithromycin is effective for the treatment of community acquired
pneumonia, multidrug resistant shigellosis, non-gonococcal urethritis, cervicitis and pelvic
inflammatory disease. Clarithromycin combined with a proton pump inhibitor, treats Helicobacter
pylori infections, and for Toxoplasma gondii when combined with pyramethamine. Spiramycin is
suitable for treating toxoplasmosis in pregnancy and prophylaxis against meningococcal
disease for persons in close contact with infected patients (Chambers, 2001c:1251; Gelone &
O’Donnell, 2005:1652).
Adverse effects
The most common adverse effects are gastro-intestinal disturbances (abdominal cramps,
nausea, vomiting), and hepatotoxity, resulting in hepatic cholestasis, especially in the elderly
(Chambers, 2001c:1252; Gelone & O’Donnell, 2005:1652-1654).
2.2.2.8 Lincosamides
Lincomycin and clindamycin are the most clinically relevant lincosamides and are functionally
related to macrolides.
Mechanism of action
Lincosamides exert their bactericidal action by binding to overlapping sites on the 50S subunits
of the ribosome, specifically locating the 23S ribosomal RNA, interfering with protein synthesis
(McEvoy et al., 2005:463).
Spectrum of activity
Lincosamides are active against Enterococcus durans, Bifidobacterium, Lactobacillus,
Eubacterium, Propionibacterium, Peptococcus, and Peptostreptococcus species, Actinomyces
species, Clostridium perfringens, and Clostridium tetani, Fusobacterium species (although F.
varium is usually resistant), Prevotella species, and Bacteroides species., including the B.
fragilis group (McEvoy et al., 2005:463).
Clinical uses
Severe anaerobic infections, abdominal and pelvic abscesses, polymicrobial contagious

42
infections, Acne vulgaris, and prophylaxis of endocarditis are treated with lincosamides.
Clindamycin in combination with quinine is indicated for the treatment of Plasmodium falciparum
infections (McEvoy et al., 2005:468).
Adverse drug effects
Gastrointestinal effects, alteration of bowel flora (overgrowth of the colon by toxigenic
Clostridium difficile), antibiotic-associated colitis with pseudomembranous formation are the
most common side effects associated with lincosamide therapy (McEvoy et al., 2005:468).
2.2.2.9 Tetracycline and related drugs
Tetracyclines are natural and semisynthetic antibiotic derivatives obtained from cultures of
Streptomyces. They include tetracycline, doxycycline, minocycline and lymecycline (Hooton,
1999:299-301).
Mechanism of action
Tetracyclines inhibit protein synthesis by blocking the binding of amino-acyl-tRNA to the mRNA-
ribosome-complex through reversibly binding to the 30S ribosomal subunit. Specificity is highly
dependent on selectivity on the bacterial ribosomes required for active energy-dependent
transport mechanism into the bacterial cell wall by a system not found in the mammalian cell
membranes (Chambers, 2001c:1241; Genole & O’Donnell, 2005:1654; Hooton, 1999:299-301).
Spectrum of activity
Tetracyclines are active against Mycoplasma, Chlamydia species, Balantidium coli, Vibrio
species, Coxiella burnetii and Legionella species (Chambers 2001c:1240; McEvoy et al.,
2005:432).
Clinical use
Tetracyclines are indicated for the treatment of rickettsia infections, Q-fever, chlamydial
infections, non-gonococcal urethritis, granuloma inguinale, pelvic inflammatory disease,
bartonella infections, brucellosis, burkholderia infection, gonorrhoea, plague, tularemia, anthrax,
Acne vulgaris, community acquired pneumonia, syphilis, Lyme disease, Helicobacter pylori
infections, cholera, yersinia infections and periodontitis, and travellers’ diarrhoea. Doxycycline is
used specifically for the prevention of malaria. Minocycline is also used for the treatment of

43
leprosy (Hooton, 1999:300; McEvoys et al., 2005:432).
Adverse effects
The most frequent adverse reactions to tetracyclines are dose related and include
gastrointestinal effects (nausea, vomiting, diarrhoea, bulky loose stools, anorexia, flatulence,
abdominal discomfort, epigastric burning) and distress. Stomatitis, glossitis, dysphagia, sore
throat, hoarseness, black hairy tongue, pancreatitis, and inflammatory lesions in the anogenital
region with candida overgrowth have also occasionally been reported (Chambers, 2001c:1246;
McEvoys et al., 2005:441).
Tetracyclines readily form chelates with multivalent cations (Al3+, Mg2+, Ca2+), and therefore
absorption of oral tetracyclines may be impaired in the presence of antacids, iron preparations
and laxatives (McEvoys et al., 2005:443). They are also avoided in children from birth to eight
years, because they form pigments in the developing teething and impair bone growth. These
pigments are as a result of the complexes formed from the interaction between the bone salts
and tetracyclines.
2.2.2.10 Chloramphenicol
Chloramphenicol was first isolated from Streptomyces venezuelae. It is used for severe
infections when other effective but less toxic agents cannot be used (Hooton, 1999:301-303).
Mechanism of action
Chloramphenicol inhibits protein synthesis by reversibly binding to the 50S subunit of the
bacterial 70S ribosome and consequently preventing the attachment of aminoacyl t-RNA to its
binding region. Chloramphenicol is bacteriostatic, but may be bactericidal in high doses or in
highly susceptible organisms. It also inhibits mitochondrial protein synthesis in mammalian cells
(Chambers, 2001c:1246; Hooton, 1999:301-303).
Spectrum of action
Chloramphenicol is active against Bacillus fragilis, Bacillus melaningenicus, Clostridium
species, fusobacterium species, Streptococcus pyogenes, Streptococcus pneumonia,
Haemophilus influenza, Neisseria gonorrhoea and Neisseria meningitides (Chambers,
2001c:1246).

44
Clinical indications
Chloramphenicol is useful in the treatment of typhoid fever, rickettsial disease and brucellosis,
especially when tetracycline is contraindicated (Chambers, 2001c:1247)
Adverse effects
One of the most serious adverse effects of chloramphenicol is bone marrow suppression due to
direct inhibition of mitochondrial protein synthesis causing aplastic anaemia and increasing the
risk of leukaemia. Gray syndrome, a type of circulatory collapse, also occurs in premature and
new-born infants receiving chloramphenicol (Chambers, 2001c:1246; Hooton, 1999:302).
2.2.2.11 Sulphonamides and trimethoprim
Clinically relevant sulphonamides include sulphamethoxazole, sulphamethizole, sulphadiazine,
sulphacytine and sulphisoxazole (Sanche & Ronald, 1999:313).
Mechanism of action
Sulphonamides are structural analogues of para-amino-benzoic acid (PABA) and pteridine,
which are precursors to the formation of folic acid necessary for DNA formation in bacteria.
Sulphonamides competitively block the production of the intermediary compound,
dihydropteroic acid, by interacting with the enzyme dihydripteroic acid synthase (Genole &
O’Donnell, 2005:1630; Sanche & Ronald, 1999:313).
Trimethoprim, on the other hand, inhibits the enzyme dihydrofolate reductase (DHFR), which
converts dihydrofolic acid into tetrahydrofolic acid (an important precursor in DNA synthesis).
Trimethoprim has less affinity for human DHFR, and therefore has minimal effects on human
DNA synthesis (Sanche & Ronald, 1999:315).
Sulphonamide and trimethoprim are combined to produce a synergistic effect in a fixed ratio of
trimethoprim/sulphamethoxazole (1:5), producing a mean steady-state serum concentration of
1:20 (Petri, 2001b:1172; Sanche & Ronald, 1999:316).
Spectrum of activity
Sulphonamides are active against both gram-positive and gram-negative aerobes, including
Streptococcus pneumonia, Haemophilus influenza, Haemophilus ducreyi, Bordetella pertussis,

45
Chlamydia trachomatis, Actinomyces species, Nocardia asteroides, Plasmodium falciparum,
Toxoplasma gondii, Bacillus anthracis, Clostridium tetani, and Clostridium perfringens (Genole
& O’Donnell, 2005:1631; Petri, 2001b:1172; Sanche & Ronald, 2005:315).
Clinical uses
The combination of sulphonamide and trimethoprim (also known as co-trimoxazole) is effective
in the treatment of acute otitis media, travellers’ diarrhoea, shigellosis, respiratory tract
infections, brucellosis, burkholderia infections, cholera, cyclospora infections, granuloma
inguinale, isosporiasis, treatment and prophylaxis of Pneumocystis jiroveci, toxoplasmosis, and
Whipple’s disease (Petri, 2001b:1177).
Adverse effects
The most frequent adverse effects of co-trimoxazole are adverse gastrointestinal effects and
sensitivity skin reactions. Epidermal necrolysis, exfoliative dermatitis, Stevens-Johnson
syndrome, serum sickness, and allergic myocarditis are the most severe allergic reactions
reported. Hematologic toxicity may occur with increased frequency in folate-depleted patients
(Genole & O’Donnell, 2005:1631; Petri, 2001b:1177; Sanche & Ronald, 1999:315).
Clinical indications
Nitro-imidazoles are useful for intra-abdominal infections, Helicobacter pylori infections,
trichomonas vaginitis, giardiasis, amoebiasis, as well as oral and dental infections (Dow &
Ronald, 1999:323; Snyman, 2012:312).
Side effects
The common side effects reported are nausea, anorexia, metallic taste, reversible neutropenia
and peripheral neuropathy (Dow & Ronald, 1999:324; Snyman, 2012:312).
2.2.2.12 Fluoroquinolones
The accidental discovery of nalidixic acid from the synthesis of chloroquine has become a
progenitor of the quinolones (Norris & Mandell, 1988:2). The quinolones are also referred to as
‘fluoroquinolones’, ‘4-quinolones’ and ‘quinolone carboxylic acid’ (Norris & Mandell, 1988:2). In
this study, the term ‘fluoroquinolone’ will be used to refer to this pharmacological group of
antibiotics. Fluoroquinolones are part of the few synthetic compounds that possess antibacterial
46
properties at low eukaryotic toxicity. Domagala (1994:685) is of the view that fluoroquinolones
represent a major pharmacological group of antibacterial agents with great therapeutic
potentials. Their discovery as antimicrobial agents represents a major advancement in
antimicrobial therapy, especially with their anti-pseudomonal property.
2.2.2.12.1 Structural-activity relationship of fluoroquinolones
Various structural features of fluoroquinolones are responsible for their antibacterial efficacy and
side effects profile. From Domagala (1994:686), Stahlmann and Lode (1999:305), and Wolfson
and Hooper (1985:581), they are:
The carbonyl and carboxyl groups at positions three and four are important for antibacterial
activity because they are responsible for mediating the DNA-gyrase complex.
The fluorine at position six is essential for high potency of the agent, and halogens at
position eight improve the oral absorption and activity against aerobes.
The cyclopropyl group and amino-acid substituent also improve overall antimicrobial activity.
Central nervous system (CNS) side effects with theophylline and non-steroidal anti-
inflammatory drugs (NSAIDS) and photosensitivity reaction are mainly influenced by the
seventh and eighth carbon substituent, respectively.
2.2.2.12.2 Mechanism of action of fluoroquinolones
The fluoroquinolones selectively interact with two bacterial targets, the related enzymes DNA
gyrase (topo-isomerase II), an essential bacterial enzyme that keeps the super-helical twists in
DNA and involved in DNA replication (Wolfson & Hooper, 1985:581), and topo-isomerase IV,
which acts in terminal stages of the separation of the interlinked daughter chromosomes
(Hooper, 2001:337). Fluoroquinolones are highly selective in nature. They have a higher affinity
for bacterial topo-isomerase compared to that found in humans (Norris & Mandell, 1988:31).
Fluoroquinolones form complexes with the two enzymes blocking the movement of the DNA-
replication fork, resulting in the inhibition DNA replication (Hooper, 2000:24).
According to King and colleagues (2000), the antibacterial effects of fluoroquinolones continue
for two to three hours at sub-inhibitory concentrations after exposure of the bacteria to the
drugs. This post-antibiotic effect is increased with longer bacteria-drug exposure and high
concentrations of the fluoroquinolones.
2.2.2.12.3 Classification of fluoroquinolones
Since the introduction of fluoroquinolones in the field of medicine, four major classification

47
systems have been proposed, viz. by Andriole and Schellhorn (1997:64); Ball (2000:18); King et
al. (2000); and Naber and Adam (1998:255). These classifications were based on in vitro
activity (increasing activity against gram-positive micro-organisms) and clinical indications.
Andriole and Schellhorn (1997:64) proposed a classification system for fluoroquinolones
(illustrated in Table 2.6) that categorises fluoroquinolones into three major generations (first,
early second, late second and third). The classification system by Ball (2000:18-20) is similar to
that by Andriole and Schellhorn, but is distinguished by the introduction of a new generation
(represented by 3B) with gemifloxacin as an example, having marked activity against gram-
positive and atypical respiratory tract infection pathogens.
In 1998, a committee was set up to develop a new system of classifying fluoroquinolones.
Naber and Adam (1998:255), appointed by the Paul Erhlich Society for Chemotherapy,
recommended a system for classifying fluoroquinolones. Their system grouped fluoroquinolones
into four main classes, neglecting the older generations, such as nalidixic acid, cinoxacin,
rosoxacin and pipemidic acid. Consequently, two years down the line, King and colleagues’
(2000) classification was developed based on Naber and Adam’s proposal with the inclusion of
the older groups that were neglected (provided in Table 2.7).
Currently, a fifth generation, represented by delafloxacin, is being deliberated on
(Somasundaram & Manivannan, 2013:298), but is still undergoing clinical trials (Anon., 2014). It
is proven to be more active against gram-positive micro-organisms, especially MRSA
(Somasundaram & Manivannan, 2013:298).
Table 2.6 Classification of fluoroquinolones according to three generations (Andriole
& Schellhorn)
Generation General characteristics Agent
First They exhibit good gram-negative efficacy and
are used for the treatment of urinary tract
infections
Nalidixic acid, pipedemic acid, oxolinic
acid
Early second
They have broader spectrum of action and
show more activity against gram-positive
pathogens compared to the first generation.
Norfloxacin, ofloxacin, ciprofloxacin,
pefloxacin enoxacin, fleroxacin,
lomefloxacin levofloxacin, rufloxacin

48
Table 2.6 Classification of fluoroquinolones according to three generations (Andriole
& Schellhorn) continued
Generation General characteristics Agents
Late second They are also more effective against gram-
positive pathogens, especially the
pneumococci.
Sparfloxacin, grepafloxacin,
tosufloxacin, pazufloxacin, gatifloxacin
Third They are effective against gram-positive and
anaerobic pathogens
Trovafloxacin, moxifloxacin,
clinafloxacin, du-6859a
Table 2.7 provides the classification of fluoroquinolones as proposed by King et al. (2000).
Table 2.7 Classification of fluoroquinolones in four generation with their various
characteristics and antimicrobial spectrum
Generation Agents Characteristics Antimicrobial spectrum
First Nalidixic acid
oxolinic acid
pipemidic acid
They are active against gram-
negative organisms and are useful
in the treatment of urinary tract
infections.
Enterobacteriaceae, Legionella species,
Mycoplasma species, Chlamydia species,
Haemophilus influenza, Neisseria gonorrhoea,
Neisseria meningitides, Moraxella catarrhalis,
Rickettsia, and Coxiella burnetii.
Second Norfloxacin,
ofloxacin
ciprofloxacin,
pefloxacin
enoxacin,
fleroxacin,
lomefloxacin,
levofloxacin
rufloxacin
They have a broader spectrum of
action compared to the first
generation, especially against gram-
positive organisms.
Enterobacteriaceae, Legionella species,
Mycoplasma species, Chlamydia species,
Haemophilus influenza, Neisseria gonorrhoea,
Neisseria meningitides, Moraxella catarrhalis,
Rickettsia, Coxiella burnetii, Pseudomonas
species, Staphylococcus aureus, and
Mycobacterium species.
Third Sparfloxacin,
grepafloxacin
gatifloxacin,
tosufloxacin
pazufloxacin
They are more effective against
gram-positive organisms, especially
the pneumococci.
The spectrum of activity is the same as the
second generation’s, with coverage against
penicillin-sensitive and penicillin-resistant
Streptococcus pneumoniae and extended
activity against atypical pathogens.
Forth Trovafloxacin,
moxifloxacin
clinafloxacin, DU-
6859a
They have better efficacy against
gram-positive pathogens and
anaerobes and less resistance
development.
They are similar to third-generation agents
plus broad anaerobic coverage.
From the four recommendations, numerous literature reports have adopted King et al.’s view on
the four generations of fluoroquinolones (Blondeau, 2004:75; Goldman & Kearns, 2011:3; Liu,
2010:355; Oliphant & Green, 2002:457; Scholar, 2002:165; Sharma et al., 2009:588).

49
2.2.2.12.4 General pharmacokinetic profile of fluoroquinolones
Fluoroquinolones are rapidly absorbed after oral and parenteral administration. Peak plasma
concentrations are reached one to three hours after administration (Scholar, 2003:166; Sharma
et al., 2009:597). Fluoroquinolones have long elimination half-lives, which permit a once or
twice daily dosing regimen (Stein, 1996:19). The presence of food does not affect the
bioavailability of fluoroquinolones (Oliphant & Green, 2002:455; Sharma et al., 2009:597). The
fluoroquinolones’ ability to penetrate cerebrospinal fluid is minimal and therefore not used for
the treatment of meningitis (Scholar, 2002:166). Protein binding is less than 25%, but higher in
enoxacin, but still considered clinically insignificant. Fluoroquinolones undergo renal or hepatic
clearance or both (Hooper & Wolfson, 1991:386-387; Oliphant & Green, 2002:455; Scholar,
2002:167). The pharmacokinetic profiles of the sub-pharmacological groups of fluoroquinolones
are summarised in Table 2.8.
Table 2.8 A summary of the pharmacokinetics of the relevant fluoroquinolones in
clinical practice
Fluoroquinolone Dose and route of
administration
Half-
life/hr
Distribution and excretion
Nalidixic acid
(McCormack, 2010:1255-
1257)
Oral, 1 g four times daily in adults 1.5 It is 93% protein bound and undergoes
hepatic conjugation, low tissue
concentration except in the urine
Cinoxacin (McCormack,
2010:1255-1257)
Oral, 250-500 mg twice daily;
Absorption is poor
1.1-2.7 16-83% protein bound and is excreted
unchanged in the urine
Pipemidic acid
(McCormack, 2010:1255)
Oral, 500 mg twice daily 3.1
Ciprofloxacin
(McCormack & Grayson,
2010:1278)
Oral, 250-750 mg twice daily;
Intravenously, 100-400 mg 12-
hourly, 60-70% absorption
3-5 16-40% protein bound, excreted by
renal and hepatic mechanisms, 50-75%
is excreted unchanged by the kidneys
Enoxacin (Sweetman,
2012)
Oral, 200-400 mg twice daily,
bioavailability of 80-90%
3-6 Enoxacin is 18-67% protein bound and
is excreted mainly via the kidneys
Norfloxacin (Stuart,
2010:1349-1350)
Oral, 400 mg twice daily
30-40% is rapidly absorbed
3-6.5 14% protein bound, metabolised in the
liver and mainly excreted via the
kidneys.
Ofloxacin (Munckhof,
2010:1367)
Oral and intravenous, 200-400 mg
twice daily. Bioavailability is
excellent with 95-100% absorption
5-8 Ofloxacin has negligible and excreted
via the kidneys
Levofloxacin (Chien et
al., 1998:887)
Oral or intravenous
250-750 mg once daily.
Bioavailability is more than 95%
6-8 24-38% protein binding and is excreted
via renal route consisting of glomerular
filtration and tubular secretion

50
Table 2.8 A summary of the pharmacokinetics of the relevant fluoroquinolones in
clinical practice (contd.)
Fluoroquinolone Dose and route of
administration
Half-
life/hr
Distribution and excretion
Gatifloxacin (Perry et al.
2002:172)
Oral and intravenous 400 mg
once daily. 96% bioavailability
8-14 20% protein bound and more than 80% is
excreted unchanged in the urine
Gemifloxacin
(Eliopoulos, 2010:1472)
Oral, 320 mg once daily. The
absolute bioavailability is 70%
7-9 61% protein bound and 60% of the drug
is excreted into the faeces
Moxifloxacin (Stass et
al., 1998:2063)
Oral or intravenously 400 mg daily 11-15 40-50% protein bound and eliminated by
hepatobiliary metabolism and excretion
Lomefloxacin (Gross &
Carbon, 1990:151)
Oral, 400 mg once daily with
bioavailability of 95%
6-8 10-15% protein bound and is eliminated
by both renal and non-renal mechanisms.
Majority of the drug is excreted
unchanged in urine
2.2.2.12.5 Clinical uses of fluoroquinolones
The clinical uses of the various sub-pharmacological groups of fluoroquinolones compiled from
King et al. (2000) and McEvoy et al. (2002:764-822) are summarised in Table 2.9.
Table 2.9 Clinical uses of the sub-pharmacological groups of fluoroquinolones
Quinolone Clinical uses
Nalidixic acid Uncomplicated urinary tract infections.
Cinoxacin Uncomplicated urinary tract infections.
Ciprofloxacin Uncomplicated urinary tract infections, skin and skin structure infections, urethral
and cervical gonococcal infection, bone and joint infections, infectious diarrhoea,
typhoid fever, and acute sinusitis.
Enoxacin Uncomplicated and complicated urinary tract infections, urethral and cervical
chlamydial and gonococcal infections.
Ofloxacin Uncomplicated and complicated urinary tract infections, skin and skin structure
infections, urethral and cervical gonococcal infection, prostatitis, urethral and
cervical chlamydial and gonococcal infections.
Levofloxacin Uncomplicated and complicated urinary tract infections, acute sinusitis, acute
exacerbations of chronic bronchitis, community acquired pneumonia (CAP), skin
and skin structure infections, intra-abdominal infections caused by susceptible
organisms.
Gatifloxacin Uncomplicated and complicated urinary tract infections, acute sinusitis, acute
exacerbations of chronic bronchitis, and community acquired pneumonia (CAP).
Gemifloxacin Upper and lower respiratory tract infections, and urinary tract infections.
Trovafloxacin Complicated urinary tract infections, skin and skin structure infections, urethral and
cervical gonococcal infection, prostatitis acute sinusitis, acute exacerbations of
chronic bronchitis, and CAP.
Moxifloxacin Acute sinusitis, acute exacerbations of chronic bronchitis and CAP.
Sparfloxacin Acute exacerbations of chronic bronchitis and CAP.

51
2.2.2.12.6 Drug-drug interactions involving fluoroquinolones
Fluoroquinolones are significant antibiotics with a broad antimicrobial spectrum, relatively good
pharmacokinetic properties, flexible dosage regimens and few severe adverse effects.
However, their clinical uses are adversely affected by some drugs affecting their
pharmacokinetic profiles and clinical uses. The subsequent paragraphs discuss the main
groups of drugs likely to cause potential drug interactions with fluoroquinolones when
administered together.
Antacids
Fluoroquinolones form chelates with multivalent cations such as aluminium ions (Al 3+),
magnesium ions (Mg2+), and calcium ions (Ca2+), present in antacids and laxatives, resulting in
a decrease in oral absorption (Mizuki et al., 1996:48-49). These complexes have reduced lipid-
solubility and prevent the absorption of the drug in the gut. Absorption of ciprofloxacin is
decreased by 85% and 40% when concomitantly administered with aluminium hydroxide and
calcium carbonate tablets, respectively. Norfloxacin absorption is also decreased by 90% when
given concomitantly with antacids, and 63% when given five minutes prior to fluoroquinolone
administration (Nix et al., 1990:434). The oral absorption of gatifloxacin is reduced by 45%, 68%
and 18%, respectively, when given two hours prior, concomitantly, and two hours after with the
administration of an aluminium containing antacid (Lober et al., 1999). Stahlmann & Lode
(2000:438) recommend the avoidance of antacids for peptic ulcer treatment in patients receiving
fluoroquinolones. However, if avoidance is inevitable, the fluoroquinolones must be taken first in
the morning, and the antacid two to six hours later.
Oral iron preparations
Ferrous sulphate and ferrous fumarate preparations have been found to decrease
fluoroquinolone absorption by 64% and 70%, respectively (Mizuki et al., 1996:48-49; Rodriquez
et al., 1999:240).
Sulcralfates
Sulcralfates consist of poorly absorbed basic aluminium salts of sucrose octasulfate, which form
chelates in the presence of fluoroquinolones. Administration of sulcralfates two hours prior to
and concomitantly with enoxacin decreased oral absorption by 43% and 98%, respectively
(Brouwers, 1992:271; van Slooten et al., 1991:580).

52
Acid secretion suppressants
The use of histamine (H2)-receptor antagonists, e.g. ranitidine and cimetidine has no effect on
the oral bioavailability on fluoroquinolones (Nix, 1990:434). However, the absorption of enoxacin
is reduced by 25% in the presence of ranitidine, because it requires an acidic medium for
maximal absorption. Patients should be advised to avoid metal-containing drugs if
fluoroquinolone therapy is to be initiated. If acid secretion suppression is required, an H2-
receptor antagonist or a proton pump inhibitor (PPI) can be used (Brouwers, 1992:272; Stass et
al., 2001:45).
Xanthine derivatives
The concentration of theophylline is increased due to reduced clearance, prolonging the half-life
(t1/2). This effect leads to severe adverse effects involving the central nervous system (CNS),
e.g. seizures. This marked increase has been found with concurrent administration of
theophylline and either ciprofloxacin or pefloxacin with a reduction in clearance of 30.4% and
29.4%, respectively (Mizuki et al., 1996:48-49; Staib et al., 1989:292).
The clearance of caffeine is also reduced in the presence of fluoroquinolones. Enoxacin has
been found to decrease caffeine clearance by 79%, which results in more adverse events
involving the CNS and gastro-intestinal tract (Staib et al., 1987:172).
Non-steroidal anti-inflammatory drugs (NSAIDs)
Fluoroquinolones inhibit the binding sites for gamma-aminobutyric-acid (GABA) in a dose-
dependent manner resulting in the excitation of the CNS (Akahane et al., 1994:2328; Sergev et
al., 1988:1626). According to Hori et al. (2003:317), the order of potency of the inhibition of
GABA receptor binding is norfloxacin> nalidixic acid> enoxacin> ofloxacin> ciprofloxacin. The
decrease in neuron response to GABA can be associated with the piperizine ring present in the
structure of fluoroquinolones.
2.2.2.12.7 Adverse drug reactions associated with fluoroquinolones
The major side effects associated with fluoroquinolones vary in incidence, severity and are
dependent on the structural configuration of the fluoroquinolone. The major effects are:
Gastro-intestinal effects involving nausea (Lober et al., 1999:1069), vomiting, dyspepsia and
abdominal pain (Stass & Kubitza, 1999:85).
Central nervous system (CNS) effects involving headaches (Stass et al., 1998:2062)
53
dizziness, tiredness and sleepiness (Saravolatz & Legget, 2003:1213).
Hypersensitivity reactions involving erythema, pruritus, urticaria and rash.
Photosensitivity reactions.
Arthralgia.
Tendonitis was first reported in pefloxacin. It affects the Achilles tendon and can be bilateral
leading to rupture occurring mostly in elderly patients on corticosteroid therapy and renal
failure (Meyers et al., 2013:229).
Cardiac effects: Grepafloxacin has been reported to cause prolongation of the QT interval
resulting in arrhythmias and torsades de pointes, and therefore has been withdrawn from
the market. The uses of gatifloxacin and moxifloxacin have also been reported to cause
arrhythmia (Lapi et al., 2012:1460).
Peripheral neuropathy: Cohen (2001:1541-1543) reviewed forty-five cases presented in
articles about the neurotoxicity and musculoskeletal effects of fluoroquinolones. All patients
reported at least one event involving the peripheral nervous system characterised by
tingling, numbness, pricking, burning sensation, pins/needles sensation, skin crawling
sensation and numbness.
2.2.2.12.8 Use of fluoroquinolones in children less than eighteen years
Fluoroquinolones in pre-clinical studies were found to induce changes in the immature articular
cartilage of the weight-bearing joints of young laboratory animals (Burkahdt et al., 1997:1199;
Gough et al., 1992:444). There are controversies with regard to the use of fluoroquinolones in
children below the age of 18 due to this safety warning, limiting its use (Goldman & Kearns,
2011:2; Kline et al., 2012:56). Despite the concerns raised on the adverse events presumed in
this population, there have been reports of fluoroquinolone prescriptions for this age group
(Arguedas et al., 2003:953; Cao et al., 1999:247; Chalumeau et al., 2003:717). Table 2.11
provides a summary of studies evaluating the use, effectiveness and safety of fluoroquinolones
in patients below the age of 18 years. These studies concluded recommending the use of
fluoroquinolones in this age group owing to their efficacy and low incidence of adverse effects,
especially arthralgia.
In 2006, the Committee on Infectious Diseases (2006:1290) recommended the use of
fluoroquinolones in children below 18 years in infections caused by MDR pathogens for which
there are no safer and more effective alternatives. Additionally, they have been indicated when
therapies by parenteral route are not possible and there are no other agents available. This
recommendation was based on the evaluation of several studies (refer to Table 2.11), which
reported the incidence of mild to moderate adverse events. The appropriate use of

54
fluoroquinolones in children younger than 18 years is limited to the following indications
recommended by Committee on Infectious Diseases (2006:1290):
Treatment of inhalational anthrax.
Urinary-tract infections caused by Pseudomonas aeruginosa or MDR pathogens.
Chronic pus-producing otitis media or malignant otitis externa caused by Pseudomonas
aeruginosa.
Exacerbation of pulmonary disease in cystic fibrosis.
Mycobacteria infections.
Gastro-intestinal infections caused by MDR Shigella, Salmonella typhi and Vibro cholera.
Life-threatening infections caused by fluoroquinolone-susceptible bacteria in children who
are allergic to safer alternative treatments.
Documented bacterial septicaemia or meningitis caused by bacteria with in vitro resistance
to approved therapy or in immuno-compromised children in whom there has been treatment
failure in approved therapies.
The recommended dosage in children younger than 18 years in diagnoses for which
fluoroquinolone is indicated is provided as follows in Table 2.10 (compiled from the BNF for
Children, 2012:302-303; Taketomo et al., 2010:853, 1013).
Table 2.10 Approved fluoroquinolone dosage regimen in children younger than 18
years
Table 2.10 Approved fluoroquinolone dosage regimen in children younger than 18
Fluoroquinolone Indication and dosage
Ciprofloxacin UTI
By mouth: in neonates 10 mg/kg 12 hourly; child (1 month to 18 years 10 mg/kg 12 hourly, dose doubled in severe infections (max. 750 mg 12 hourly).
By intravenous infusion over 60 minutes: in neonates 6 mg/kg 12 hourly; child (1 month to 18 years) 6 mg/kg 8 hourly increased to 10 mg/kg 8 hourly in severe infections (max. 400 mg every 8 hours).
Severe RTI/GI Infections
By mouth: in neonates 15 mg/kg 12 hourly; child (1 month to 18 years) 20 mg/kg 12 hourly (max. 750mg 12 hourly).
By intravenous infusion over 60 minutes: in neonates 10 mg/kg 12 hourly; child (1 month to 18 years) 10 mg/kg 8 hourly (max. 400 mg every 8 hours).
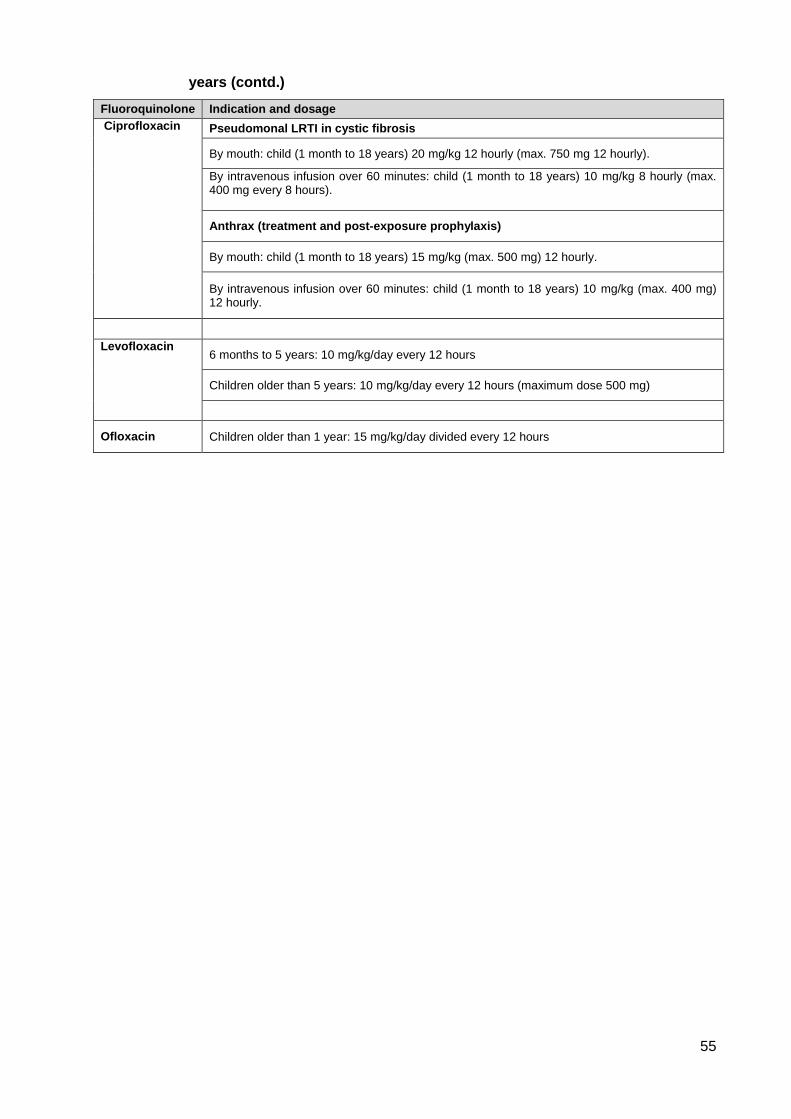
55
years (contd.)
Fluoroquinolone Indication and dosage
Ciprofloxacin
Pseudomonal LRTI in cystic fibrosis
By mouth: child (1 month to 18 years) 20 mg/kg 12 hourly (max. 750 mg 12 hourly).
By intravenous infusion over 60 minutes: child (1 month to 18 years) 10 mg/kg 8 hourly (max. 400 mg every 8 hours).
Anthrax (treatment and post-exposure prophylaxis)
By mouth: child (1 month to 18 years) 15 mg/kg (max. 500 mg) 12 hourly.
By intravenous infusion over 60 minutes: child (1 month to 18 years) 10 mg/kg (max. 400 mg) 12 hourly.
Levofloxacin
6 months to 5 years: 10 mg/kg/day every 12 hours
Children older than 5 years: 10 mg/kg/day every 12 hours (maximum dose 500 mg)
Ofloxacin Children older than 1 year: 15 mg/kg/day divided every 12 hours

56
Table 2.11 Studies evaluating the effectiveness of fluoroquinolones and incidence of arthropathy in children younger than 18 years
Year Location Number of
patients and
age
Drug therapy Indication Causative
organism
Cure rate Arthropathy
reported
Reference, year
1992 to June
1998
United States 7897
0-18 years
Ciprofloxacin,
levofloxacin and
ofloxacin
compared with
azithromycin
UTI and skin and
skin structure
infections
Not stated Not evaluated There was <1%
incidence of
arthropathy
Yee et al. (2002)
1994 Not stated 1795
0-18 years
Ciprofloxacin RTI, pneumonia,
cystic fibrosis,
bronchitis
Pseudomonas
aeruginosa and
Staphylococcus
aureus
Not evaluated 29 cases
reported, of which
25 (86%) were
resolved
Hampel et al.
(1997)
July 1995 to
August 1996
Vietnam 82
younger than 15
years
Ofloxacin
compared with
cefixime
Uncomplicated
typhoid fever
Salmonella typhi 97% cure rate
with ofloxacin as
opposed to 75%
in cefixime
Not evaluated Cao et al. (1999)
May 1996 to
June 2000.
Zimbabwe, South
Africa and
Bangladesh
253
1-12 years
Ciprofloxacin
therapy for 3 days
compared with 5
days therapy
Dysentery Shigella
dysenteriae
65 and 69% cure
rate for short-
term and long-
term therapy,
respectively.
8 reported cases
of arthralgia
The Zimbabwe,
Bangladesh,
South Africa
Dysentery Study
Group (2002)
April 1998 to
July 1999
North, Central
and South
America, Egypt,
South America
and Hungary
311
3 months to 12
years
Trovafloxacin
compared with
ceftriaxone
Meningitis Neisseria
meningitides and
Haemophilus
influenza.
Cure rates for
trovafloxacin and
ceftriaxone were
75% and 71%,
respectively.
Arthropathy
reported in
trovafloxacin
group was 1%
compared to 4%
in the ceftriaxone
group
Saez-Llorens et
al. (2002)

57
Table 2.11 A review of studies evaluating the effectiveness and incidence of arthropathy in children less than eighteen years (continued)
Year Location Number of
patients and
Age
Drug therapy Indication Causative
organism
Cure rate Arthropathy
reported
Reference, year
May 1998 to
September
2000
France 276
Children
younger than 19
years
All
fluoroquinolones
prescribed during
the study period
Cystic fibrosis,
urinary tract
infection,
gastro-intestinal
infections,
bone and joint
infection
Salmonella typhi
Shigella.
Not evaluated. Incidence of
arthropathy less
than 3.8%.
Chalumeau et al.
(2003)
Not stated United States,
Costa Rica,
Panama,
Argentina,
Thailand and
Venezuela.
115
6-48 months
Gatifloxacin,
10mg/kg/day for
10 days.
Recurrent acute
otitis media
Haemophilus
influenza,
Moraxella
catarrhalis,
Streptococcus
86% cure rate There were no
reported cases of
arthropathy
Arguedas et al.
(2003)

58
2.3. Antimicrobial resistance
2000 B.C. – Here, eat this root
1000 A.D. – That root is heathen. Here, say this prayer
1850 A.D. – That prayer is superstition. Here, drink this potion
1920 A.D. – That potion is snake oil. Here, swallow this pill
1945 A.D. – That pill is ineffective. Here, take this penicillin
1955 A.D. – Oops... bugs mutated. Here, take this tetracycline
1960-1999 A.D. – More “Oops”... Here, take this powerful antibiotic
2000 A.D. – The bugs have won, that antibiotic doesn't work anymore. Here, eat this root
Anonymous
Antimicrobials have been beneficial in saving lives, resulting in a significant reduction in
morbidity and mortality due to infectious diseases and have allowed major advances in surgery.
However, this unrealistic expectation with antibiotics having a magical ability to prevent or cure
infectious disease without the eventual loss of activity has led to overuse and misuse globally
(Kunin, 1995:107).
The concern about antibiotic resistance was raised by Sir Alexander Fleming (1945:9) when he
discovered penicillin. He remarked that “The time may come when penicillin can be bought by
anyone in the shops. Then there is the danger that the ignorant man may easily under dose
himself and by exposing his microbes to non-lethal quantities of the drug make them resistant.”
Walsh (2000:776) also rightly indicated that, “Once an antibiotic is proven to be effective and
enters widespread human therapeutic use, its days are numbered.” Presently, antimicrobials
are the only class of drugs that have become obsolete from use (WHO, 2012:33).
2.3.1 Definition of antimicrobial resistance
An organism is said to be resistant if it has the capacity to proliferate in the presence of the
antimicrobial agent it was originally sensitive to (WHO, 2001:15). Resistance renders standard
treatments ineffective, causing an increase in the prevalence of infections and the risk of spread
to others.
2.3.2 Risk factors for emergence of antimicrobial resistance
Many of the antibiotics available presently are no longer effective due to emerging resistance
caused by the following factors (Cohen, 1992:1053; Essack, 2006:51c; Harbath & Samore,
2005:794-795; Laxminarayan et al., 2013):

59
The characteristics of micro-organisms: Ability to exchange genetic material, having inherent
resistance, ability to survive changing environmental conditions, occupy certain ecological
niches, colonise and infect.
Environmental or human reservoirs in which resistant organisms are present.
Selective pressure influenced by patterns of antimicrobial prescribing and use: Inappropriate
use by physicians and patients, self-prescription, poor quality of antimicrobial agents
through counterfeit sales and dispensing by unauthorised personnel, long-term use posing
high risk of resistance, especially in developing countries.
Societal and technological changes: Lack of standard treatment guidelines in healthcare
facilities, lack of training for prescribers, pressures from the pharmaceutical industry.
Poor infection control surveillance systems: Inadequate logistics and equipment, and the
lack of trained professionals to monitor the spread of nosocomial infections pose a huge
setback in the curbing of antimicrobial resistance.
Lastly, poverty has been cited as a probable cause for the emergence and spread of
antimicrobial resistance. There is a lack of access to good healthcare, clean food and water,
good sanitation in most middle-income and developing countries, also rendering the
outbreak of infections and resistant strains.
2.3.3 Mechanisms of antimicrobial resistance
Resistance can be intrinsic or acquired (Sefton, 2002:560). Intrinsic resistance is a natural
phenomenon occurring in the absence of antimicrobial use; this implies that not all micro-
organisms are intrinsically susceptible to all antimicrobials. Acquired resistance refers to
adaptive mechanisms formed by micro-organisms in response to changes in the environment;
or the acquisition of genetic materials to form resistant genes (Sefton, 2002:560). Antimicrobial
resistance involves six major mechanisms (Denis et al., 2010:91; Sefton, 2002:560), namely:
Active expulsion of antibiotic from the bacterial cell by trans-membrane efflux system.
Modification of the bacterial cell envelope rendering it less permeable to the drug.
Modification of target site.
Production of protective proteins at target site.
Inactivation of the drug by specific enzymes before or after the drug enters the cell of the
bacterium.
Acquisition of target by-pass by a unique metabolic pathway.
Most micro-organisms employ more than one mechanism as defence in the presence of
antibiotics. The development of antibiotics has also been successful through the exploitation of
these mechanisms used by micro-organisms.
60
The subsequent paragraphs briefly describe the six main mechanisms of antimicrobial
resistance with some examples.
2.3.3.1 Efflux-mediated antimicrobials resistance
The first energy-dependent export of antimicrobials from bacteria that was first reported in
tetracyclines (Ball et al., 1980:12) is also seen in fluoroquinolones (Jacoby, 2005:121). The
efflux system falls into five categories, namely:
Major facilitator super family (MFS): The efflux pump genes coded as Bmr, pmrA, NorA
have been isolated in Bacillus subtilis (Neyfahk et al., 1991:4785), Streptococcus
pneumonia (Gill et al., 1999:189; Piddock et al., 2002:812), and Staphylococcus aureus
(Kaatz et al., 1993:1093), respectively mediating resistance to chloramphenicol and
quinolones. The efflux pump gene, LrfA, has also been identified in a study in
Mycobacterium segmatis (Takiff et al., 1996:366) to simulate Mycobacterium tuberculosis
resistance in quinolones.
ATP-binding cassette family (ABC): The ABC multidrug transporters are more
characterised in gram-positive organisms (Davidson & Chen, 2004:242). They are found in
Vibrio cholera, Staphylococcus marcescens, Staphylococcus enteritis and Clostridium
hathewayi. This system has also been cited to be responsible for fluoroquinolone resistance.
Resistance nodulation division (RND): The RNDs are found in the inner membrane of the
bacterial cell and their main functions are to transport substrates into the cells (Blair &
Piddock, 2009:512). The efflux systems encoded by the specific operons in Pseudomonas
aeruginosa and S. maltophilia, expressed by the mutational genes, are responsible for
quinolone resistance (Poole, 2000:2235-2237).
Small multidrug resistance (SMR): Confer resistance to a number of quaternary
ammonium compounds (QAC) (Bay et al., 2008:1816; Paulsen et al., 1996:590-592).
Multidrug and toxic compound resistance (MATE): Fluoroquinolone resistance reported
in Campylobacter, Citrobacter, Enterobacter, Escherichia coli, Klebsiella, Proteus and
Pseudomonas species is determined by a three-component efflux system encoded by
specific genes (Poole, 2005:21).
2.3.3.2 Alterations in cell wall structure
Gram-negative bacteria have a unique permeability barrier known as the outer membrane. This
layer consists of proteins responsible for transport activities and delimits a zone outside the
cytoplasm conferring passage selectivity (Sefton, 2002:560). Diffusion of hydrophobic drugs
such as macrolides and β-lactams through porin channels of the outer membrane is relatively
poor. From a study by Nikaido (1989:1832), the permeability of cephalosporins in Pseudomonas

61
aeruginosa is two times less than that of Escherichia coli. Decreased permeability can be due to
the following factors (Nikaido, 1989:1832):
Porin deficiency mutants: The loss of porins as observed in gram-negative bacteria may
decrease the uptake of many hydrophilic drugs across the outer membrane causing multi-
drug resistance, e.g. imipenem resistance as seen in Pseudomonas aeruginosa.
Mutations involving specific pathways: Bacteria produce specific pathways for the
transport of essential nutrients. Some antibiotics have been designed specifically to use
specified pathways in the outer membrane.
2.3.3.3 Target site mutation
Mutations occur at different sites of the bacteria genome and based on the origin of the mutated
gene. The determinants of resistance can be classified as: acquisition of foreign DNA
(transduction, transformation and conjugation), mutation of pre-existing genetic determinants
and mutation on acquired genes (Sefton, 2002:561; Spratt, 1994:388). Examples include DNA
gyrase-determined resistance to fluoroquinolones, ribosomal resistance to streptomycin through
alteration of a single amino-acid at the target site, penicillin resistance due to modified penicillin-
binding proteins, and sulphonamide and trimethoprim resistances due to altered
dihydropteroate synthase and dihydrofolate reductase, respectively (Denis et al., 2010:99-100).
Resistance in the quinolones is due to the alteration of DNA-gyrase, which has two subunits,
namely A and B, and DNA topo-isomerase IV, occurring within a domain referred to as the
fluoroquinolones resistant determining region (QRDR) (Hooper, 1999:38; Hopkins et al.,
2005:360-362; Nakamura, 1997:128). According to Spratt (1994:389-390), resistance to
sulphonamides and trimethoprim in Staphylococcus aureus occurs by the organisms obtaining a
gene encoding to a new target enzyme that has lower affinity to the antibiotic than the original
enzyme.
2.3.3.4 Protection of target site by proteins
The gene found to be responsible for the PMQR (plasmid-mediated quinolone resistance) has
been proven in studies to protect DNA-gyrase from being inhibited by the fluoroquinolones, but
unable to protect topo-isomerase IV (Martinez-Martinez et al., 1998:797). The mfpA gene has
been found to influence intrinsic resistance to Mycobacterium smegmatis. When the gene is
overexpressed, resistance to ciprofloxacin and sparfloxacin is increased (four- to eight-fold rise
in MICs) in Mycobacterium smegmatis and Mycobacterium bovis (Cremet et al., 2011:154).
Cremet and his co-workers (2011:155) later discovered other PMQR genes, namely aac(6’)-ibcr
and qepA. PMQR have also been reported in Italy (Longhi et al., 2012:1921), Japan (Saga et
62
al., 2007:799; Saito et al., 2007:601), the United Arab Emirates (Jacoby et al., 2003:560), South
Africa (Govender et al., 2009:1313; Keddy et al., 2010:879) and China (Wang et al.,
2003:2242).
2.3.3.5 Modifying enzymes
Enzymes involved in resistance mechanisms are either mediated by the plasmid or
chromosome (Sefton, 2002:560). Beta-lactamase production is the main cause of resistance in
Staphylococcus aureus, Haemophilus influenzae, Moraxella catarrhalis, Neisseria gonorrhoea
and enteric gram-negative rods (Wright, 2005:1462). Some beta-lactam drugs such as
flucloxacillin are stable against the β-lactamases produced by Streptococcus aureus, whereas
the newer cephalosporins are stable against many of the β-lactamases produced by these
organisms (Wright, 2005:1460). Other examples include aminoglycoside modifying enzymes
and chloramphenicol actelytransferases conferring resistance to aminoglycosides and
chloramphenicol, respectively (Sefton, 2002:560).
2.3.3.6 Acquisition of a target by-pass system
In sulphonamides and trimethoprim, for example, a target by-pass system, which confers
resistance, is formed by the mediation of the enzymes – dihydropteroate synthase and
tetrahydrofolate reductases, respectively (Sefton, 2002:560). The presence of PB2′ found in
methicillin-resistant Staphylococcus aureus (MRSA) renders the organism resistant to
flucloxacillin, because it binds loosely to β-lactams (Sefton, 2002:560).
2.3.4. Antibiotic resistance patterns
The tremendous increase in trade and human mobility brought about by globalisation has
enabled the rapid spread of infectious agents, especially drug-resistant strains. While developed
countries are able to afford the latest antibiotics to treat resistant infections, those in the
developing world have limited access to life-saving drugs in the combat against resistant
infections (WHO, 2001:11). The spread of antimicrobial resistance is not crippled by
boundaries. For example, in November 2013, New Zealand (one of the tightly quarantined
nations) reported the first death resulting from a totally drug-resistant bacterium known as
”KPC-Oxa 48” from a Vietnamese male patient (McKenna, 2013). There is no country, however
effective they are in containing resistance within its boundaries, which can protect itself from the
importation of resistant bacteria through travel and trade (WHO, 2001:11).
Africa, and South Africa for that matter, is faced with a huge infectious disease burden where

63
respiratory, meningeal and sexually transmitted diseases are highly prevalent (Crowther-Gibson
et al., 2011:567). Resistant strains of organisms already identified in South Africa, include:
Multi-drug resistant Streptococcus pneumonia, which is resistant to penicillins, macrolides,
chloramphenicol, fluoroquinolones (von Gottberg, 2008:328) and co-trimoxazole
(Appelbaum, 1992:77);
Methicillin-resistant Staphylococcus aureus (MRSA) (Marais et al., 2009:171);
Ciprofloxacin-resistant gonococci (Lewis, 2007:1149);
Carbapenem-resistant Klebsiella pneumonia, Enterobacter species, and Pseudomonas
aeruginosa (Brink et al., 2012:599);
New Delhi metallo-beta-lactamase (NDM) resistance in Enterobacteriaceae (Lowman et al.,
2011:874), and
MDR Mycobacterium tuberculosis (Brink et al., 2008:586).
Among the countries in Africa, South Africa has the most active surveillance system on
antibiotic resistance (Gelband & Duse, 2011:553). The National Antibiotic Surveillance Forum
(NASF) and the Group for Enteric Respiratory and Meningeal disease Surveillance in South
Africa (GERM-SA) are two highly recognised bodies in the public sector responsible for the
monitoring of resistance patterns. In the private health sector, the Federation of Infectious
Diseases Societies of South Africa (FIDSSA) conducts surveillance on several pathogens in
infectious diseases (Gelband & Duse, 2011:553).
Table 2.12 provides antimicrobial susceptibility data of some clinically important pathogens
identified in public hospitals from Johannesburg, Pretoria, Bloemfontein and Cape Town in 2010
(adapted from Bamford et al., 2011).
Table 2.12 Susceptibility patterns of relevant micro-organisms in South Africa for
2010
Susceptibility of organism/%
Drug Escherichia
coli
Klebsiella
species
Enterobacter
species
Drug Pseudomonas
aeruginosa
Acinetobacter
baumannii
Gentamicin 82 43 73 Piperacillin/
tazobactam
45 9
Amikacin 90 81 90 Cefepime 67 18
Ciprofloxacin 82 63 89 Ceftazidine 74 37
Ertapenem 100 98 96 Imipenem 66 21
Imipenem 100 100 96 Meropenem 68 20
Meropenem 100 100 100 Gentamicin 69 25
Amikacin 73 37
Ciprofloxacin 69 39

64
The susceptibility patterns for Staphylococcus aureus for cloxacillin, erythromycin and
clindamycin were 55, 54 and 73%, respectively (Bamford et al., 2011). This study confirms the
prevalence of resistant strains of micro-organisms affecting healthcare centres in South Africa.
In Table 2.13, the resistance patterns of some clinically relevant bacteria are outlined, analysing
country-specific trends. These studies reveal the incidence and prevalence of resistant micro-
organisms in Sub-Saharan Africa. There is confirmation in the emergence and increase in
resistance to conventional therapies and newer drugs, for example third generation
cephalosporins (ceftriaxone) and fluoroquinolones. The need to monitor resistance patterns is
therefore crucial in defining the prognosis of bacterial infections.

65
Table 2.13 An overview of the resistance patterns of clinically relevant micro-organisms in Africa
Location Inception Year Organism Source of isolate Number of isolates
Results Reference, year
Nigeria 1987-1992 Neisseria meningitides
Isolates were from CSF of children and adults
289 Prevalence of strains resistant to ampicillin, penicillin and co-trimoxazole increased from 7 to 75%, 14 to 75% and 39 to 87%, respectively
Emele (2000)
South Africa 1991-1998 Streptococcus pneumonia
Isolates were from the blood or CSF, population was not defined
7 406 Multidrug resistance increased from 19 to 25%
Huebner et al. (2000)
Resistance to penicillin increased from 9.6 to 18%
Morocco 1992-2000 Neisseria meningitides
Isolates were from the blood and CSF of children, ages not specified
163 4.3% of strains identified as multidrug-resistant
Zerouali et al. (2002)
Ghana January 1994 to June 1996
Escherichia coli The strains were isolated from wounds, urine, ear, nose, throat, sputum and aspirates, the population was not specified
11 380 88% resistant to ampicillin Ohene (1997)
82% resistant co-trimoxazole
Streptococcus pneumonia
30.6% resistant to penicillins
21.7% resistant to chloramphenicol
Staphylococcus aureus
18% resistant to flucloxacillin
Kenya 1994-2002 Haemophilus influenza
Isolates were cultured from the blood or CSF from patients in the paediatric ward
240 Resistance to trimethoprim/sulfamethozaxole increased from 6 to 27%
Scott et al. (2005)
Resistance to amoxicillin and chloramphenicol increased by 11% and 2%, respectively.

66
Table 2.13 An overview of the resistance patterns of clinically relevant micro-organisms in Africa (continued)
Location Inception Year Organism Source of isolate Number of isolates
Results Reference, year
Ivory Coast, Morocco, Senegal, Tunisia
1996-1997 Streptococcus pneumonia
Isolates were from CSF, blood and pus, population not stated
375 30% of isolates resistant to penicillin G Benbachir et al. (2001)
3.7% were resistant to amoxicillin
7.3% were resistant to cefotaxime-ceftriazone
8.6% were resistant to chloramphenicol
28% were resistant to erythromycin
38.3% were resistant to tetracycline
2.1% were resistant to rifampicin
36.4% were resistant to co-trimoxazole
Sub-Saharan Africa
1996-1997 Methicillin-resistant Staphylococcus aureus (MRSA)
The strains were isolated from surgical swabs and pus, blood and urine, population was not defined
1 440 26% prevalence in Nigeria Kesah et al. (2003)
27.7% prevalence in Kenya
21.3% prevalence in Cameroun
14.4% and 12.5% in Morocco and Senegal, respectively
Algeria 1996-2000 Streptococcus pneumonia
Isolates were from CSF, blood and pus, from children ages not specified
309 33% resistant to penicillin G Ramdani-Bouguessa & Rahal (2003)
Gambia 1996-2003 Streptococcus pneumonia
The isolates were obtained from children aged younger than 6 years with the infection during a Haemophilus influenzae vaccine effectiveness study and patients with invasive pneumococcal disease
531 1% resistant to trimethoprim/sulphadoxine, tetracycline and chloramphenicol from 1996 to 2000.
Adegbola et al. (2006)
3% were resistant to trimethoprim/sulphadoxine, tetracycline and chloramphenicol from 2000 to 2003.

67
Table 2.13 An overview of the resistance patterns of clinically relevant micro-organisms in Africa (continued)
Location Inception Year Organism Source of isolate Number of isolates
Results Reference, year
Egypt 1998-2003 Streptococcus pneumonia
Not specified 205 6% were resistant to ceftriazone Wasfy et al. (2005)
52% were resistant to tetracycline
59.7% were resistant to trimethoprim
11% were resistant t erythromycin
9% were resistant to chloramphenicol
Ethiopia 2000 Neisseria gonorrhoea
Isolates were from males with urethral discharge
142 92% resistant strains were identified in co-trimoxazole
Tadese et al. (2001)
87.5% were multidrug resistant
South Africa 2000-2006 Streptococcus pneumonia
18% were resistant to levofloxacin von Gottberg et al.
(2008)
South Africa 2003 to January 2005
Neisseria gonorrhoea
The strains were isolated from men and women with urethral and vaginal discharge, respectively
415 Ciprofloxacin-resistant strains increased from 24 to 42%
Moodley et al. (2001)
South Africa 2003-2007 Salmonella typhi Not specified 510 Prevalence of nalidixic resistant strains was 5%
Smith et al. (2010)
Malawi May-August 2007
Neisseria gonorrhoea
Isolates were from men with urethral discharge
126 19 and 77% of strains identified as penicillin- and tetracycline resistant, respectively
Brown et al. (2010)
Ethiopia September 2007 to January 2012
Streptococcus pneumonia
Isolates were from patients who visited the hospital
153 11% were resistant to ciprofloxacin Anagaw et al. (2013)
9.8% were resistant to ceftriaxone
31% were penicillin and tetracycline
South Africa 2009 Neisseria meningitides
The strain was isolated from the CSF of a Zimbabwean lady
1 The first isolation of plasmid fluoroquinolone-resistant strains
Du Plesis et al. (2010)

68
Table 2.13 An overview of the resistance patterns of clinically relevant micro-organisms in Africa (continued)
Location Inception Year Organism Source of isolate Number of isolates
Results Reference, year
DR Congo September 2010 to May 2011
Salmonella enterica serotype Typhi
Isolates were from blood cultures of children from birth to 10 years
118 94% of the strains were resistant to amoxicillin
Phoba et al. (2012)
23% were multidrug resistant and 41% were resistant to ciprofloxacin
Mozambique 2005 Neisseria gonorrhoea
The strains were isolated from men and women with urethral and vaginal discharge, respectively
270 7% of strains were resistant to kanamycin and 77% were resistant to tetracycline
Apalata et al. (2009)
Ethiopia 2006-2012 Neisseria gonorrhoea
Men and women with urethral and vaginal discharge, respectively
29 27.8% of strains were resistant to ceftriaxone, 41% were ciprofloxacin resistant; 94% and 92% were resistant to penicillin G and tetracycline, respectively.
Tibebu et al. (2013)
South Africa January 2006 to June 2006
Escherichia coli Isolates were from blood cultures, population not specified
471 84% of isolates were ampicillin resistant, 11, 10 and 6% were resistant to cefuroxime, ceftriaxone and cefipime, respectively; 11, 37 and 20% were resistant to piperacillin-tazobactam, amoxicillin-clavulanate and ciprofloxacin, respectively
Brink et al. (2007)
Klebsiella pneumonia
Isolates were from blood cultures, population not specified
636 98% resistance was observed in ampicillin, 52%, 46% and 44% resistance was seen in cefuroxime, ceftriaxone and Cefepime, respectively; resistance to ciprofloxacin, levofloxacin and ertapenem were 31%, 32% and 2% respectively.
Enterobacter spp. Isolates were from blood cultures, population not specified
244 Resistance to cefepime was 20%. Additionally, 30% and 12% showed resistance to piperacillin/tazobactam and ciprofloxacin respectively.

69
Table 2.13 An overview of the resistance patterns of clinically relevant micro-organisms in Africa (continued)
Location Inception Year Organism Source of isolate Number of isolates
Results Reference, year
South Africa January 2006 to June 2006
Pseudomonas aeruginosa
Isolates were from blood cultures, population not specified
382 Resistance to meropenem and imipenem were 42 and 45%, respectively. Resistance to cefepime, piperacillin-tazobactam and fluoroquinolones was 53, 48 and 46%, respectively
Brink et al. (2007)
Acinetobacter baumannii
Isolates were from blood cultures, population not specified
190 Isolates resistant to tobramycin were 19%, resistance to meropenem and imipenem are 32 and 33%, respectively. Resistance to ceftazidine and levofloxacin were 43 and 31%, respectively.
Staphylococcus aureus
Isolates were from blood cultures, population not specified
629 Resistance to oxacillin was seen in 36% of isolates; 11, 29 and 12% were resistant to rifampicin, trimethoprim/sulphamethoxazole and gentamicin, respectively.
Mozambique 2001-2005 Haemophilus influenza
Isolates were from blood cultures and CSF in children under five years.
106 39% of isolates were resistant to chloramphenicol; strains resistant to ampicillin and co-trimoxazole were 35 and 74%, respectively.
Roca et al.(2008)
Mozambique May 2001 to April 2006
Streptococcus pneumonia
Isolates from blood cultures in patients younger than 15 years
1 592 Isolates resistant to ampicillin, co-trimoxazole, erythromycin and penicillin were 11, 44, % and 11%, respectively.
Mandomando et al.
(2010)
Staphylococcus aureus
Isolates resistant to ampicillin, co-trimoxazole, erythromycin and penicillin were 90, 31, 35 and 90%, respectively
Haemophilus influenza
Resistance to ampicillin and co-trimoxazole was 46 and 77%, respectively.
Enterobacter spp. Resistance to ampicillin and co-trimoxazole was 90 and 20%, respectively.

70
Table 2.13 An overview of the resistance patterns of clinically relevant micro-organisms in Africa (continued)
Location Inception Year Organism Source of isolate Number of isolates
Results Reference, year
Mozambique
May 2001 to April 2006
Klebsiella pneumonia
Isolates from blood cultures in patients younger than 15 years
1 592
All strains were resistant to ampicillin with 70% being resistant to co-trimoxazole
Mandomando et al.
(2010)
Pseudomonas aeruginosa
80% of isolates were resistant to ampicillin with 70% resistant to co-trimoxazole
South Africa
2011 Klebsiella pneumoniae
The organism was isolated from urine
1 Incidence of Klebsiella pneumoniae carbapenemase (KPC-2)
Brink et al. (2011)
Klebsiella pneumoniae
The strain was isolated from sputum
1 Incidence of New Delhi Metallo-Beta-Lactamase (NDM-1)

71
2.3.5 Importance of antimicrobial resistance surveillance
According to Brooks et al. (2006:394), Cosgrove and Carmeli (2003:1433), and Masterton
(2008:21-22), information on the patterns of resistance in the society or in healthcare
institutions is crucial for the following reasons:
It can help determine the outcome of therapy for individual patients with specific
infections.
The physician and also the hospital can have an upper hand in the use of the
appropriate antimicrobial agents and dosing strategies to help reduce resistance.
It can provide knowledge on good infection and antibiotic control to prevent the
emergence of infections caused by resistant strains.
Important decisions on the type of programmes to fund and track to prevent the spread
of antimicrobial resistance can be obtained from information on resistance patterns.
2.3.6 Impact of antimicrobial resistance
The best way of describing the impact of resistance is to take a cursory look at the
happenings in the pre-antibiotic era. In the pre-antibiotic era, infections due to micro-
organisms were the major causes of morbidity and mortality causing tremendous
psychological effects on individuals and families (McKenna, 2013). A simple bruise led to
septic shock; ear infections caused deafness; sore throats led to heart failures; five out of
every thousand women died during childbirth, one out of nine died of skin infections; and
three out of ten people died from pneumonia (McKenna, 2013).
The present-day antibiotic era paints a brighter picture; though infectious diseases are a
burden, its prognosis is excellent. Major advances in surgery, organ transplants and cancer
chemotherapy owe their success to the discovery and development of antibiotics (Howard et
al., 2013; Laxminarayan et al., 2013; WHO, 2012:3). Antimicrobial resistance can be linked
to the pre-antibiotic era with many medical misadventures.
Presently, resistance to antibiotics causes an increase in morbidity, mortality and medical
costs associated with infections (Cohen, 1992:1053; Crowther-Gibson et al., 2011:567;
Laxminarayan et al., 2013). The risk of dying as a result of a serious infection caused by a
resistant strain is approximately twice that in patients with infections caused by susceptible
bacteria (WHO, 2012:3). The prognosis of an infection caused by resistant strains is
furthermore poor compared to that caused by susceptible strains. The impact of

72
antimicrobial resistance is usually assessed from the perspectives of the physician, patients,
hospital or healthcare institutions, third-party payers and the pharmaceutical industry
(Cosgrove & Carmeli, 2003:1434; McGowan, 2001:286).
The rates of morbidity and mortality increase due to the delay in providing effective therapies
for specific infections (Cohen, 1992:1053). These are found in instances where there is
resistance to the drug of choice for a specific infection or to the appropriate empiric therapy
for a given syndrome. Additionally, the alternate therapies are more costly than the empiric
therapy, causing economic disability to families. These alternative therapies are sometimes
difficult to administer. The alternate therapy may also be more toxic than the standard
therapy, with increased adverse effects (WHO, 2012:3).
A mathematical model was developed by the Canadian Committee on Antimicrobial
Resistance (2003:159) to determine the cost of providing care for patients with infections
from resistant strains. From their model, there was an estimated additional cost between 14
to 26 million dollars in direct hospitalisation, increased laboratory costs of 10 million dollars,
and cost of quarantining carriers of 16 million dollars to the Canadian health sector.
In the European Centre for Disease Prevention and Control (ECDC) technical report on the
trends and burden of antimicrobial resistance, the study showed that approximately 25 000
deaths in Europe were as a result of infections from resistant strains, mostly caused by
MRSA (ECDC, 2009:13). The cost of extra hospital days was estimated to be 2.5 million
euros, extra costs incurred by hospitals were estimated to be 900 million euros, and extra
outpatient costs were 10 million euros. Loss of productivity due to absence from work was
150 million euros, and loss of productivity due to death was estimated to be valued at 450
million euros (ECDC, 2009:13).
In the United States, it is estimated that two million infections are caused by resistant strains
of microorganisms, which results in 23 000 deaths annually (CDC, 2013:11). There has been
a request by the President’s budget to allocate $30 million annually for five years to combat
antimicrobial resistance alone (CDC, 2013:11). The total cost of antibiotic resistance in the
United States is estimated to be $20 billion in excess of direct medical cost (CDC, 2013:11).
In a study by Engemann and his colleagues (2003:586), patients with MRSA surgical site
infections were found to be at greater risk of mortality, longer duration of hospitalisation and
increased hospital costs, than patients with the same infection caused by methicillin-
susceptible Staphylococcus aureus (MSSA). Similar studies performed by Cosgrove et al.

73
(2005:171) and Reed et al. (2005:182) yielded comparable results. From de Kraker and his
colleagues’ study (2011:3), involving over 1 200 hospitals from 31 European countries, there
were an estimated 8 000 deaths recorded as a result of infections from resistant Escherichia
coli and MRSA. The extra cost resulting from treatment was estimated to be 62 million
euros.
From the studies mentioned above, it is clear that antimicrobial resistance is detrimental to
the individual and the society, causing medical, social and economic disadvantages. The
biggest threat to resistance is the inadequate funding for the discovery and development of
newer antibiotics (Piddock, 2013:1010), and research for newer antibiotics has slowed down.
Pharmaceutical companies envisaged a total eradication of infectious diseases and most
industries will market endless options for antibiotics. However, this is not the picture now
(Laxminayaran et al., 2013). The biggest fear of running out of options to treat infection has
already arrived as demonstrated by the case in New Zealand (McKenna, 2013).
Knowledge on the implications of resistance serves as a prompter to healthcare providers to
support the prevention of resistance; help formulate guidelines to influence appropriate
antibiotic prescribing; and also guide policymakers as to which programmes to fund
(Cosgrove, 2006:82). Medicine has come far and antimicrobial resistance puts achievements
such as organ transplantation, cancer chemotherapy and major surgery at a higher risk
(McKenna, 2013).
2.3.7 Measures to control antimicrobial resistance
In 2001, the World Health Organization (2001:4-7) addressed six strategies to combat the
spread of resistance globally. These strategies are:
Reduction in the burden of disease and the spread of infections;
Improvement of access to appropriate antimicrobials;
Improvement in the use of antimicrobials;
Strengthening the health system and the surveillance capacities;
Enforcement of regulations and enforcements; and
Encouraging the development of appropriate new drugs and vaccines.
Countries have adopted these strategies; for example, in the United Kingdom, a cross-
government antimicrobial strategy has been launched with the above objectives defining the
role of the commission (The Infectious Dieases and Blood Policy Team, 2013). In South

74
Africa, three main strategies viz. surveillance activities to monitor antimicrobial resistance,
vaccination; and infection prevention and control activities, are present to control
antimicrobial resistance (Gelband & Duse, 2011:554)
2.4 Global patterns of antimicrobial use
The WHO describes surveillance of antimicrobial use as the main ‘corner stone’ of national
and international efforts to control antimicrobial resistance (WHO, 2012:13). Monitoring the
use of antimicrobials is beneficial for the following reasons (Hans & Ramsamy, 2013:368;
WHO, 2012:13):
It provides vital information for decision-makers on public health issues through the
systematic collection and analysis of health-related data.
Surveillance data provide the information, insight and tools necessary to guide policy and
evaluate measures to promote the appropriate use of antibiotics at all levels of
healthcare.
It provides information on how and the quantity of antibiotics used in a setting.
It is seen as complementary to data on resistance to help inform policy decisions.
It is a vital tool in identifying priorities for public health interventions and educational
campaigns and regulatory measures through the appropriation of resources.
In view of the knowledge that antibiotic use correlates with an increase in resistance, it is
prudent to know the pattern of use of antibiotics in society. Knowledge about the pattern of
use of antibiotics is crucial for the development of interventions aimed at promoting rational
use (Wirtz et al., 2010:219). The subsequent paragraphs provide an overview of studies
performed to measure antibiotic use globally.
2.4.1 Patterns of antibiotic use in Europe
Antibiotic use in Europe has seen proper documentation over the past decade with several
studies from the European Surveillance of Antimicrobial Consumption (ESAC) and the
European Study Group on Antibiotic Policies (ESGAP). Iconic studies conducted to measure
antibiotic use in European countries are discussed in the subsequent paragraphs.
The use of antibiotics in 54 Dutch hospitals from 1991 to 1996 was investigated by Janknegt
et al. (2000:252). They reported an increase in all pharmacological groups of antibiotics
throughout the study period. Penicillins were the most widely used antibiotics, with

75
amoxicillin/clavulanate dominating. The use of quinolones also saw a steady increase, with
ciprofloxacin and norfloxacin being dominant.
In Gould’s study analysing antibiotic use in 140 European hospitals, the penicillins,
fluoroquinolones and cephalosporins were the most commonly used antibiotics during the
study period. The study, however, did not explore the reasons for use (Gould, 2005:122).
Cars et al.’s (2001:1853) study, involving 15 European countries in 1997, revealed that half
of the countries showed a minimum of 4% increase in antibiotic use. However, a notable
increase was seen in Italy and Luxembourg; 34% and 12%, respectively. A reduction in
antibiotic use was found in five of the countries, with Sweden leading and Greece showing
the least (Cars et al., 2001:1854). The most commonly used antibiotics were the broad-
spectrum penicillins, tetracyclines and macrolides. Fluoroquinolones were the most used
antibiotic in Portugal. Cars et al. attributed the variations in use to the differences in the
prevalence of bacterial infections, physicians and patients’ attitudes to antibiotics, historical
backgrounds, cultural and social factors, and variations in healthcare systems (Cars et al.,
2001:1853-1854).
Ferech et al. (2006:403-404) analysed outpatient antibiotic use in Europe from 1997 to 2003,
and revealed an increase in use for most of the European countries, especially in France
and Greece. However, notable reductions in antibiotic use were seen in countries such as
Belgium. In all 25 participating countries, penicillins were the most widely prescribed
antibiotic, followed by the fluoroquinolones. The use of other antibiotics, such as the
macrolides and tetracycline, remained constant during the study period. Ferech et al.
explained that variations in antibiotic use among the European countries were due to
differences in the incidence of community-acquired infections, culture, healthcare structures,
knowledge about antimicrobials, pharmaceutical market and regulatory practices.
Goossens et al. (2005:581-583) in their study from 1997 to 2002, also observed lower
antibiotic use in northern Europe and relatively higher consumption in the south. They noted
the growing use of newer antibiotics such as the macrolides, amoxicillin/clavulanic acid and
the quinolones, though the penicillins and the first-generation cephalosporins were the most
widely prescribed. Antibiotics were mostly prescribed by health practitioners in the south as
they labelled most respiratory tract infections as bronchitis, unlike those in the north, who
regarded these infections as either a common cold or influenza.
Adriaenssens et al. (2011a:6-7) confirmed the trend from Goossens et al. in 33 European

76
countries between 1997 and 2009. Greece showed the highest use of antibiotics as
compared to Cars et al.’s investigations in 1997, where Greece showed a decrease in
antibiotic use. Penicillins were the most widely used across all the countries and the use of
fluoroquinolones, especially the newer compounds, was seen to have a proportional
increase. Striking geographical variations have been observed across the European
countries, where narrow spectrum penicillins and the first generation cephalosporins are
mostly prescribed in the Nordic countries, compared to the southern European countries
where there is an increase in the use of amoxicillin/clavulanic acid.
In 2007, Dumartin et al. (2010:2030) analysed antibiotic usage patterns involving 530
hospitals (teaching and non-teaching, cancer and rehabilitation centres). The penicillins were
the most widely used antibiotics in all centres. Fluoroquinolones was the second most widely
used, especially in the rehabilitation and cancer centres. These centres were also observed
to have the highest use of glycopeptides and carbapenems.
2.4.1.1 Patterns of fluoroquinolone use in Europe
In the Netherlands, fluoroquinolones accounted for 6% of total antibiotic use in 1994 (Natsch
et al., 1998:23). The highest use of fluoroquinolones was recorded in patients above 75
years and was mostly used in the haematology and oncology wards, possibly for prophylaxis
in neutropenic patients (Natsch et al., 1998:23). The study, however, did not explore the use
of the sub-pharmacological groups of fluoroquinolones.
The analysis of fluoroquinolone use in 2003 by Ferech et al. (2006:424) showed that the use
of first-generation fluoroquinolones (mostly norfloxacin) formed 85% of fluoroquinolone
prescriptions in Croatia and approximately 40% in the Czech Republic, Sweden, France and
Slovenia. Cinoxacin was mainly used in Italy, flumequine in France, oxolinic acid in the
Czech Republic, Poland and Slovakia, piromidic acid in Italy, and rosoxacin in Portugal. The
second-generation fluoroquinolones were the most commonly used in Europe and exceeded
more than half of total fluoroquinolone use in all countries, except Croatia. Ciprofloxacin
alone constituted approximately 40% of total quinolone use in all countries. The use of
ofloxacin was very common in Israel and Slovakia, while levofloxacin use was dominant in
Italy. Among the third-generation quinolones, only gatifloxacin and moxifloxacin were
prescribed in Europe and their use was recorded in all except six countries. Moxifloxacin
represented the largest proportion of the third-generation fluoroquinolones. Gatifloxacin use
was only found in Germany.

77
Adriaessens et al. (2011b:6-7) performed a similar study assessing fluoroquinolone use from
1997 to 2007 in 33 European countries. From their study, there was a striking variation in
outpatient prescribing, with Italy emerging as the country with the highest use of quinolones
(levofloxacin being dominant). Belgium showed the highest third-generation fluoroquinolone
use (mainly moxifloxacin). The use of fluoroquinolones was dominant in southern Europe,
followed by Eastern Europe, and lowest in Northern Europe. The use of the second-
generation quinolones saw a steady increase, with a decrease in the use of the first-
generation quinolones in most countries. In countries such as Belgium, Luxembourg and
Portugal, for example, levofloxacin and moxifloxacin were prescribed in large quantities
during the winter periods. This trend was quite unclear owing to the fact that quinolones are
not first-line treatment for lower respiratory tract in ambulatory care in most European
countries. Older quinolones, such as norfloxacin and ofloxacin, were still being highly
prescribed in countries such as Croatia, but there was a decreasing trend in consumption in
most of the countries. Ciprofloxacin was still the most widely prescribed quinolone in clinical
practice and its consumption increased in many countries from 1997 to 2009. Adriaessens et
al. (2011b:6-7) suggested that the use of ciprofloxacin was probably heightened by the
expiration of the patent in 2003, which was followed by the introduction of generic brands.
The use of fluoroquinolones for the treatment of urinary tract infection was also increased
during the winter months, e.g. ciprofloxacin in Slovakia, Poland, Hungary, Latvia and the
Russian Federation.
2.4.2. Patterns of antibiotic use in America
Loeb et al. (2001:378) determined antibiotic use in facilities providing chronic care in Canada
from November 1996 to October 1997. Their study showed amoxicillin and ciprofloxacin
being the most commonly used antibiotics during the study. These antibiotics were mostly
prescribed for lower respiratory tract infections and urinary tract infections. Other antibiotics,
such as trimethoprim and the cephalosporins, were also used for the treatment of urinary
tract infections and soft tissue infection.
Raveh et al. (2001:142) conducted a study at a medical centre in the United States for the
elderly in 1998, showing that cephalosporins (cefuroxime and cefazolin) are the most
prescribed and used antibiotics. This was followed by ampicillin in combination with
gentamicin, amoxicillin/clavulanate and ciprofloxacin. The common diagnoses were
respiratory tract infections, urinary tract infections, sepsis, intra-abdominal infections and soft
tissue infection.
78
From the study by Goossens et al. (2007:1093), antibiotic use in the United States is
generally higher than in most European countries, with a higher preference in the use of
newer antibiotics. Tetracyclines, macrolides and fluoroquinolones were the most widely used
antibiotics in outpatients in the United States, contrary to consumption in Europe, where
penicillins were the most frequently used antibiotics during the study period. First-line
treatments for lower respiratory tract infection are the fluoroquinolones, doxycycline and the
macrolides. According to Goossens et al. (2007:1093), these differences can be attributed to
variations in treatment guidelines, health systems and marketing policies, e.g. the United
States has no all-inclusive national health plan, and there are essentially no deterrents to
prescribing any given outpatient antibiotic, other than the patient’s willingness to pay.
In South America, the increase in use of antibiotics is similar to the situation in Europe and
the United States. Wirtz and his colleagues’ (2010:220-222) study from 1997 to 2007
revealed an increase in use of antibiotics in Peru, Venezuela, Uruguay and Brazil, with
penicillins and quinolones being the most widely used antibiotics. However, in Mexico and
Colombia, antibiotic use decreased. The use of quinolones, especially ciprofloxacin,
increased throughout the study period, especially in Venezuela and Argentina. The increase
in macrolide, lincosamides and streptogramin use was greatest in Peru, followed by Brazil,
Argentina and Chile (Wirtz et al., 2010:220). The study could not associate the variation in
use to potential causes, but pointed out that the inappropriate prescribing by physicians,
public demand for antibiotics, the purchase of antibiotics without prescriptions and a lack of
regulations may have affected the trends in antibiotic use.
2.4.2.1 Patterns of fluoroquinolone use in America
In a study conducted by Polk et al. (2004:499) analysing the trends in fluoroquinolone use in
24 hospitals from 1999 to 2001, there was an estimated increase in total use by 15%. There
was an observed seasonal increase in total fluoroquinolone use during the fourth quarter of
each year and the subsequent first quarter of the following year. Levofloxacin was the most
commonly prescribed fluoroquinolone and its use increased from 64 to 82% of total
fluoroquinolone use. The use of ciprofloxacin decreased during the study period, but was
considered to be statistically insignificant (Polk et al., 2004:499). However, the use of
fluoroquinolones at the community level recorded ciprofloxacin being the most prescribed
until the first quarter of 2001. The introduction of newer fluoroquinolones, such as
gatifloxacin and moxifloxacin, contributed to the overall increase in fluoroquinolone use (Polk
et al., 2004:499).

79
In Goossens et al.’s (2007:1094) study in 2004, fluoroquinolones accounted for less than 1%
of total antibiotic use in the United States. Levofloxacin was the most prescribed
fluoroquinolone, followed by moxifloxacin. Goossens and colleagues’ study confirms Polk et
al.’s (2004:499) study with respect to levofloxacin being the most used fluoroquinolone in the
United States.
According to Wirtz et al. (2010:221), fluoroquinolone utilisation has increased in most
countries in South America, with ciprofloxacin being the most widely prescribed. The use of
newer drugs, such as levofloxacin, was highest in Venezuela, whereas moxifloxacin was the
most widely used quinolone in Mexico.
2.4.3 Patterns of antibiotic use in Asia
A year-long study by Kotwani and Holloway (2011:5-6) in New Delhi, India, revealed that
penicillins were the most commonly used antibiotics, followed by fluoroquinolones,
macrolides and cephalosporins. The use of the various antibiotics remained relatively
constant during the study period (December 2007 to November 2008). However,
fluoroquinolone use increased during the rainy seasons. This was attributed to the incidence
of diarrhoeal diseases during the rainy seasons.
2.4.4 Patterns of antibiotic use in Africa
A study by van den Boogaard et al. (2010:146) involving 14 pharmacies from February to
March 2009 in Tanzania determining the sale of antibiotics showed penicillins being the most
widely used antibiotic. This was followed by the fluoroquinolones, macrolides, tetracycline
and sulphonamides and trimethoprim. Their study did not ascertain the reasons for use.
According to Abula and Kedir (2004:36), analysing the usage patterns of antibiotics in
patients in a surgical ward at a teaching hospital in Ethiopia; ampicillin was the most widely
used antibiotic, forming approximately 40% of antibiotics dispensed. Ampicillin was mostly
used combined with chloramphenicol and metronidazole for pre-operative prophylaxis and
the treatment of infections.
In South Africa, antibiotic consumption in the private sector is derived from the Institute of
Medical Statistics (IMS) with data collected from wholesalers and direct sales from
manufacturers to pharmacies (Essack et al., 2011:565). The report, however, does not
measure antibiotic use according to the daily defined dose (DDD), as recommended,

80
causing a major challenge for meaningful comparison with the public health sector and other
countries. From the data from IMS, there has been an increment in the use of antibiotics by
approximately 6.5% from 2009 and 2010 with broad spectrum penicillins being the most
widely used, and the fluoroquinolones among the top five antibiotics (Essack et al.,
2011:565-566).
A study analysing antibiotic use from nine randomly selected primary healthcare clinics in
the South African private healthcare sector revealed that penicillins (amoxicillin) and the
sulphonamides (co-trimoxazole) were the most widely used antibiotics, especially for the
treatment of upper respiratory infections (Katende-Kyenda et al., 2006:704).
2.4.4.1 Fluoroquinolone use in Africa
In van den Boogaard and colleagues’ study (2010:146), fluoroquinolones formed 13% of
antibiotic sales in Moshi, a town in Tanzania, from February to March 2009. Ciprofloxacin
formed 74% of total fluoroquinolone use, followed by norfloxacin and levofloxacin less than
1% of total fluoroquinolone sales. The study, however, did not address the indication for use.
There is little information on the pattern of fluoroquinolone use in South Africa. According to
IMS data, the most frequently used fluoroquinolones are levofloxacin (Tavanic®),
moxifloxacin (Avelon®) and ciprofloxacin (Ciprobay®). These three fluoroquinolones were
part of the top twenty antibiotics in terms of market share in 2009 and 2010 in the private
sector (Essack et al., 2011:566). There is, however, little knowledge on the pattern of use of
fluoroquinolones in the country (Essack et al., 2011:566).
From these notable studies, the use of antibiotics has seen an increase globally. The
dominant use of penicillins (especially in combination with a beta-lactamase inhibitor) is
observed in most of these studies. Ciprofloxacin appears to be the most widely prescribed
fluoroquinolone globally.
2.4.5 Irrational use of antibiotics
Detailed knowledge of antibiotic use is necessary for the following reasons (WHO, 2013:25):
to implement national strategies for judicious antibiotic use;
to provide solutions to the threat posed by resistant micro-organisms;
to provide information as a first step in creating awareness of the careful use of

81
antibiotics to prescribers and policymakers. This will help define levels of appropriate use
in an institution; and
to be used as an assessment for testing the effectiveness of interventions introduced to
optimise the use of antibiotics in a healthcare facility.
Diseases of microbial origin are major causes of morbidity and mortality in the world,
especially in developing countries (Mukonzo et al., 2013:308). In South Africa, infections
form a significant proportion of the burden of disease, with human immune-deficiency
virus/acquired immune deficiency syndrome (HIV/AIDS) being the major cause of mortality
(Crowther-Gibson et al., 2011:567).
It is estimated that 50% of patients who visit healthcare facilities globally are prescribed with
at least one antimicrobial agent – of which a significant proportion is inappropriate (Abula &
Kedir, 2004:37; Al-Ghamdi et al., 2002:118; Gonzales et al., 2001:759; Katende-Kyenda et
al., 2006:705; Polk et al., 2007:671; Raveh et al., 2001:146; Tunger et al., 2000:134).
Several antibiotics, especially penicillins, macrolides and quinolones, are used incorrectly in
the treatment of presumed respiratory tract infections (Katende-Kyenda et al., 2006:705;
Wolff, 1993:347).
In some African countries, such as Nigeria, antibiotics are readily available in hospitals,
pharmacies, licensed medical stalls and drug stores, road side sellers and hawkers (Enato &
Uwaga, 2011:41). Unfortunately, they are dispensed without a prescription (Enato & Uwaga,
2011:41). In South Africa, in particular, the misuse of antibiotics is more common in the
private sector than the public sector because of the availability of drugs, physicians being
allowed to prescribe outside the standard treatment guidelines and the higher demand for
antibiotics (Essack et al., 2011:564). The widespread availability and irrational use have a
direct influence on the emergence of antimicrobial resistance. The inappropriate use of
antimicrobials by an individual causes selection-resistant organisms that spread in the
community (WHO, 2012:32).
Rational drug use is defined by the WHO (2012:33), as patients receiving medication
appropriate to their clinical needs in doses that meet their own individual requirement for an
adequate period of time and the lowest cost to them and the community. Gaur and English
(2006:343) also define the judicious use of antimicrobials as the usage of the drug only when
indicated, choosing a cost-effective agent which provide the appropriate coverage for the
diagnoses that is suspected and prescribing the optimal dose and duration of the
antimicrobial agent. From these two definitions, the diagnoses, choice of antimicrobial agent,

82
duration of therapy, dose and cost-effectiveness of the antimicrobial agent are of prime
importance in deciding what constitutes the prudent use of a drug. The opposite is also true
– irrational drug use constitutes over-prescribing, under-prescribing, dispensing
unnecessarily, and use without justification (WHO, 2012:33).
According to Radyowijati and Haak (2002:8), the prescribing and the community use of
antimicrobials are directly influenced by an amalgamation of medical, psychosocial, cultural,
geographical and political factors. Blommaert et al. (2014:544) pointed out factors such as
seasonal variations, healthcare expenditure on gross domestic income, aged population,
and the availability of standard treatment guidelines in health institutions correlating with high
antibiotic use in a population. Conversely, restrictions of marketing activities towards
prescribing, low population density, high educational attainment and some degree of atheism
are associated with lower use of antibiotics. The afore-mentioned factors fall under the three
main determinants of antimicrobial use, namely the prescriber, the dispenser and the patient
or the community. These likely determinants of antibiotic use are addressed in the
subsequent paragraphs.
2.4.5.1 Determinants of antibiotic prescribing
The concept of rational drug prescribing entails prescribers following a standard process of
prescribing in conformity with the formulary or standard treatment guidelines of the institution
(Chukwuani et al., 2002:180). Radyowijati and Haak (2003:741), Chukwuani et al.
(2002:189-194), Adorka et al. (2013:347), and Gaur and English (2006:344), from their
studies, outlined the following factors influencing the prescribing patterns of physicians:
Years of practice experience
Chukwuani et al. (2002:184) noted that prescribers with more than ten years of experience
mostly prescribed antibiotics empirically. According to Duse (2005:39), physicians are often
of the view that most illnesses have a bacterial aetiology and tend to treat patients
empirically. Appropriate prescribing patterns have been observed mostly in trainee
physicians than in permanent staff; and in non-teaching hospitals than in teaching hospitals.
Guar and English (2006:345) explained that trainees may be more acquainted with the most
recent advances in antimicrobial chemotherapy and follow guidelines more readily.

83
Time spent with the patient in the consulting room
It has been hypothesised that physicians tend to prescribe antibiotics when they have
shorter contact times with patients. Adorka et al. (2013:348) revealed that prescribers’
workload was directly related to inappropriate prescribing. Physicians, in a hurry to see all
patients, may not have patience to properly diagnose, subsequently resorting to the use of
antibiotics (which are mostly not indicated).
Patient demand and expectations for antibiotics
Prescribers fear that when they do not prescribe antibiotics for their patients they might lose
them to others who will. Britten and Ukoumunne (1997:1509), conducting a survey in
London, showed that patients’ expectations influence general practitioners’ prescribing in
that patients’ hopes of receiving a prescription mostly far exceed both the prescribers’
perceptions and the level of prescribing. However, in studies performed by Adorka et al.
(2013:347) and Huebner et al. (2003:506), prescribers in Lesotho and South Africa,
respectively, reported they were not influenced by patients’ expectation to receive an
antibiotic.
Inadequate information on the use of antibiotics among prescribers
The term ‘prescriber’ does not only refer to physicians, but a host of other healthcare
providers who are in the position to issue drugs in a defined setting with variable clinical
backgrounds, e.g. nurses, pharmacists and physician assistants, including those with no
medical background (Gaur & English, 2006:346). Irrational prescribing is common in
prescribers with little clinical background. Additionally, among those with clinical background,
medical representatives and commercially-oriented medical publications are their main
sources of information (Huebner et al., 2003:506).
Economic factors, e.g. economic incentives
In some instances, prescribers make gains by prescribing or even recommending certain
antibiotics (newer and expensive) for the drug manufacturer in the form of incentives. In
most of the cases, these antimicrobials are not clinically indicated (Gaur & English, 2006:92).

84
Inadequate and untimely laboratory results
Most physicians prescribe empirically, because few healthcare centres are equipped with
laboratories and even when they do, the results are sometimes unreliable (Adorka et al.,
2013:349; Chukwuani et al., 2002:190). Based on a Ugandan study by Mukonzo et al.
(2013:308), less than half of the study population’s diagnoses were confirmed with
laboratory findings. Reasons cited for the empiric treatment of patients included a large time
lapse between the request and the results of a laboratory finding, and the costs associated
with laboratory services patients were expected to pay.
Unstable antibiotic supply
According to Chukwuani et al. (2002:190), prescriber-attributed irrational prescribing is
sometimes caused by the unavailability of drugs in the hospital. Physicians have a higher
tendency to prescribe according to what is available than what will be most suitable for the
patient.
Fear of bad clinical outcome
The study by Adorka et al. (2013:348) describing the perception and attitudes of antibiotic
prescribing by healthcare providers in public institutions in Lesotho, confirms Huebner and
his colleagues’ work that approximately half of the physicians prescribe antibiotics with
unclear diagnoses or to prevent an infection even when bacterial infections are ruled out.
Antibiotics are sometimes used by physicians as a diagnostic tool to determine the nature of
a disease. Further investigations are then performed when the patient does not recover from
initial treatment.
2.4.5.2 Determinants of antibiotic dispensing and sales
The delivery systems of antibiotics are varied in most countries, ranging from hospitals,
pharmacies, private dispensing pharmacies, and licenced chemical sellers with all types of
clients drawn to each sector.
Pharmacists are recognised custodians of medications and are also mandated to manage
and supervise pharmacies. The central role of the pharmacist is to educate and advise
patients on the correct use of medicines. The pharmacist is therefore required to play an

85
important role in the rational use of antibiotics (Essack et al., 2011:564). In some
communities, the pharmacist is referred to as a ‘doctor’ due to his/her immense medical
knowledge. Pharmacists may dispense 5% greater or lesser quantities of prescribed
antibiotics. This freedom may have a direct influence on the dispensing patterns by
pharmacists (Essack et al., 2011:564). In some settings, dispensing technicians, pharmacy
attendants and even nurses are referred to as ‘pharmacists’ as they are seen working in the
pharmacy with some level of medical knowledge.
According to Radyowijati and Haak (2002:19), patients prefer to purchase drugs directly from
pharmacies, instead of seeing the physicians because:
there appears to be more ‘pharmacists’ than doctors in most countries;
the medicines are cheaper to purchase and there is no payment of consultation fees;
the community has a closer social and cultural relationship with pharmacy attendants;
and
visiting the pharmacy is less time consuming than visiting the hospital.
Factors such as economic incentives, patient demand, inadequate knowledge by
dispensers, influence from the pharmaceutical industry and a lack of regulations and
enforcements influence irrational dispensing (Radyowijati & Haak, 2003:741).
Economic incentives and client demand
Radyowijati and Haak (2003:741) conducted a review of literature on the determinants of
antibiotic use in low-income countries, and found that pharmacists are prepared to meet
patients’ demands by dispensing the quantity of antibiotics they can afford for the fear of
losing their profits, as patients may go elsewhere to purchase them. Additionally, most
pharmacies dispense antibiotics for ailments that do not warrant the use of antibiotics to
make extra profits. Pharmacists’ dispensing patterns are also influenced by pressure from
their suppliers who readily give incentives or commissions. Plachouras et al. (2010:2-3),
from their survey in Greece, showed that 53% of pharmacists from the study population
dispensed ciprofloxacin without prescriptions. Surprisingly, all pharmacists in the study
population dispensed amoxicillin/clavulanate as over-the-counter medications. These
antibiotics were sold without any comments made by the pharmacists or requests for
justification of use.

86
Lack of knowledge
In most African countries, pharmacists are not the only recognised dispensers. Pharmacy
technicians, pharmacy interns, pharmacy attendants – all with varied medical backgrounds –
are involved in the dispensing process (Radyowijati & Haak, 2003:741). Additionally, the role
of the pharmacist is limited to administrative work rather than consultative work; relegating
dispensing of drugs to the technicians and assistants. This affects the pharmacist’s inability
to influence what is being dispensed in the facility. Knowledge on recent developments in
antimicrobial chemotherapy may be lacking, affecting the rational use of antibiotics (Goel et
al., 1996:1155).
Lack of regulation and enforcement
Against the regulations of the profession, most antibiotics are routinely dispensed without
prescriptions. Mukonzo et al. (2013:308), from their study in Uganda, pointed out that
although regulations exist for the prohibition of the sale of antibiotics without prescriptions,
approximately 41% of the total antibiotics dispensed in their study were over-the-counter.
2.4.5.3 Determinants of patient use of antibiotics
The use of antibiotics in communities is strongly influenced by cultural preferences and
beliefs. Most patients believe that antibiotics are very powerful drugs capable of treating and
preventing all kinds of ailments (Radyowijati & Haak, 2003:741). There is also the perception
that taking antibiotics for long periods is harmful, and therefore not necessary to take the full
course of therapy. Ultimately, the subject of self-medication is seen to be a major driver of
irrational antibiotic use.
Self-medication is defined by the WHO (1998:3) as the selection of medicines by individuals
to treat self-recognised illnesses or symptoms. The main drivers of self-medication are the
purchasing of antibiotics without prescriptions, and the storage of unfinished or left-over
medication for future use (Chukwuani et al., 2002:192; Radyowijati & Haak, 2003:741).
Currently, many antibiotics are purchased online via the Internet, making it quite impossible
to address the issue of self-medication (Plachouras et al., 2010:3).
It is common to find patients purchasing a part of an antimicrobial therapy in most
developing countries due to financial restraint since most pay out-of-pocket (Gaur & English,
2006:347, Mukonzo et al., 2013:308). In a study by Awad et al. (2005:327), 74% of the

87
respondents from a study conducted in Sudan confirmed the use of an antibiotic without a
prescription. In Nigeria, Sakpota et al. (2010:6) noted the unwarranted use of ampicillin by
university students to manage menstrual cramps was as a result of purchasing the
medications without prescriptions. Radyowijati and Haak (2003:741) explained that
communities have their own way of using antibiotics upon the advice given by friends and
families, and past similar experience with an illness for which a particular antibiotic was
given. It has been hypothesised that the persistent prescribing patterns of physicians also
strongly influence self-medication by the community. Abasaeed et al. (2013:1051), in their
study in Abu Dhabi, noted that Co-amoxiclav® (i.e. amoxicillin/clavulanic acid as potassium
clavulanate combination) was the most widely prescribed antibiotic by doctors for upper
respiratory tract infections and the most widely purchased antibiotic without prescription for
cough.
Due to financial restraints, pharmacies are often the first call for medical assistance for most
communities. There is the avoidance of the extra charge for consultation and laboratory
investigations (Enato & Uwaga, 2011:41). Abasaeed et al. (2013:1051), in their study,
revealed that 95% of pharmacists dispense antibiotics to persistent patients without
prescriptions.
2.4.6. Consequences of irrational antibiotic use
Health consequences of inappropriate antibiotic use (Le Grand et al., 1999:91) include:
Adverse effects leading to morbidity and mortality due to irrational use of antibiotics;
Limited efficacy especially in taking sub-therapeutic doses of antibiotics;
Antibiotic resistance resulting from increased use of antibiotics as well as their use in
under-therapeutic dosage;
Drug dependence; and
Risk of infection from resistant strains of micro-organisms.
According to Pechere (2001:172) and Laxminyaran et al. (2013), antimicrobial resistance is
a result of natural selection endowing micro-organisms with some level of inherent
resistance. Studies have shown that the existence of resistant strains predates the use of
antibiotics. For example, Austin et al. (1999:1156), in their study, proved that the strength of
the selective pressure, i.e. the rate of drug consumption, is intimately and positively
associated with the rate of evolution of resistance. Penicillin-resistant Staphylococcus
aureus was identified in 1940 soon after penicillin was discovered and was administered to

88
only a few patients. The introduction of tetracycline in the 1950s saw the emergence of
resistance in Shigella species; erythromycin arrived on the scene in 1953, and erythromycin-
resistant Streptococcus pneumonia appeared in 1968. The introduction of methicillin met its
resistance two years later (Neu, 1992:1065). Levofloxacin, a synthetic antibiotic introduced
in 1996, saw resistance in the same year. The story is no different for antibiotics such as
linezolid and daptomycin (McKenna, 2013). Studies from Laxminayaran and Brown
(2001:189), Turnidge and Christansens (2005:548), Chen et al. (1999:234), and Goossens
et al. (2005:586) confirmed Austin and colleagues’ postulation. For most antibiotic-micro-
organism combinations, an increase in the consumption of a specific antibiotic or antibiotic
class is followed by an increase in resistance to the antibiotic or antibiotic class with a delay
of less than six months. Similarly, a decrease in consumption is generally followed by a
decrease in resistance (Monnet & Lopez, 2005:127).
Van de Sande-Bruinsma et al. (2008:1726) demonstrated the correlation between
antimicrobial use and resistance in Europe. They observed that the variation of consumption
coincides with the occurrence of resistance at country level. There was a high degree of
consistency between penicillin use and penicillin non-susceptibility in pneumococci, as well
as for fluoroquinolone use and an increase in fluoroquinolone resistance in Escherichia coli.
Hseuh et al. (2005:466) confirmed the work of Van de Sande-Bruinsma et al. (2008:1726) in
a 13-year study in a Taiwanese teaching hospital. In their study, Hseuh et al. (2005)
observed cross-resistance, where the widespread use of cefepime, ciprofloxacin and
carbapenems was significantly associated with the increase in cefotaxime and ciprofloxacin
resistance in Escherichia coli and carbapenem resistance in Pseudomonas aeruginosa,
respectively. An increase in the use of extended-spectrum cephalosporins was also
significantly related to the increased incidence of cefotaxime resistance in Klebsiella
pneumoniae. The increased use of fluoroquinolones was also significantly associated with
the increased incidence of cefotaxime resistance in Klebsiella pneumoniae and carbapenem
resistance in P. aeruginosa.
Resistance is an inevitable end that bacteria will sooner or later develop; however, its
misuse has been found to be a catalyst, speeding up the entire reaction process.
2.5 Measures to control the use of antibiotics
It is of no doubt that the use of antibiotics has greatly improved human life and consequently
specific measures need to be employed to guard these drugs judiciously. Assessing the

89
strategies developed by the World Health Organization in 2001 for the prevention and
control of antibiotic resistance (WHO, 2001:4-7), two complementary approaches sum it up,
namely: infection control measures to curb the spread of MDR organisms, and improving
antibiotic use for the treatment and prophylaxis of infections (Houvinen & Cars, 1998:613).
In view of the evidence that usage is the main driver of resistance, it is logical to reduce
resistance by reducing usage (Garcia-Rey et al., 2002:162; Livermore, 2005:451; Smith &
Coast, 2002:126). Although the overuse of antibiotics can cause the emergence of
resistance, appropriate changes in antibiotic use can lead to retrieval of susceptibility (Yates,
1999:25). Theoretically, any measure that optimises antimicrobial use has an effect on the
emergence and spread of resistance through changes in antibiotic selective pressure.
Several strategies have been adopted to influence the use of antibiotics to improve health
outcomes, namely: ensuring cost-effective therapy, reducing adverse health and ecological
effects, and ultimately reducing drug resistance (Allerberger et al., 2009:1175). Although a
reduction in the use of antimicrobials may not be immediately followed by a reduction in
resistance, the controlled use of antimicrobials is still of prime importance (Gaur & English,
2006:344).
The greatest success in optimising antimicrobial use has been seen with programmes that
use several strategies targeting antibiotic decision-making at several different points
(Dunagan & Medoff, 1992:266; Finch et al., 2004:44; Houvinen & Cars, 1998:613; Vlahoric-
Palcekski et al., 2000:101). According to Davey et al. (2013:6), interventions to optimise
antimicrobial use can be grouped as follows: restrictive or coercive, persuasive or
educational and structural interventions. A discussion on these interventions follows in
subsequent paragraphs.
2.5.1 Restrictive interventions
Davey et al. (2013:6) explained restrictive interventions as those aimed at limiting the
prescribers’ freedom to a selection of specified antibiotics. This involves the distribution of
learning materials, informative meetings, local consensus processes, educational outreach
visits, local opinion leaders, reminders given verbally, on paper or on computer, audits and
feedback.
Restrictive interventions to improve antibiotic use have been found to have more success
rates than educational interventions (Brown, 2006:164). Ozkurt et al. (2005:399-340) found a
70% decrease in the use of antibiotics and an 18% decrease in expenditure after the

90
implementation of a restriction policy. Basseti et al. (2001:534) and Erbay et al. (2003:311)
both agreed to the pronounced positive effects that the use of restrictive interventions has on
the overall susceptibilities of organisms, appropriate prescribing, improved patient outcomes
and reduced expenditure on antibiotics. Brown (2006:166) recommends enforcement by
health professionals, especially pharmacists, with the use of restrictive measures to ensure
the prudent use of antimicrobials. This is because the introduction of these measures may
cause adversarial relationships between prescribers (who may perceive this to be dictatorial)
and other health professionals. Examples of restrictive interventions that have been proven
to be effective include:
Antibiotic formulary restriction: Formulary guidelines are effective means of
controlling antibiotic use by reducing variations in the method and standard of care
(Brown, 2005:165; Dunagan & Medoff, 1992:266; Fishman, 2006:59-60; Yates,
1999:26).
Prior approval programmes: Justification of use approaches have been designed to
optimise antibiotic use. These may include prior approval by an infectious disease
specialist, antibiotic order forms and automatic stop orders that require validation for the
use of the antibiotics (Weistein, 2001:190; White et al., 1997:231).
Antibiotic cycling: Cycling or rotation is the programmed replacement of a class of
antibiotics with a different class having a similar spectrum of activity. These substitutions
may be followed by any number of substitutions, but the cycle must be repeated, with a
re-introduction of the original class/drug to introduce heterogeneity in the use of
antibiotics (Merz et al., 2004:2864). This allows resistance rates to the withdrawn drug to
stabilise, or even decrease, during the period of restriction and enabling it to be re-
introduced at a later date with its efficacy intact (Brown & Nathwani, 2005:6; Kollef,
2006:86; Masterton, 2005:4).
2.5.2 Educational or persuasive interventions
Persuasive interventions are said to complement the overall effect of other interventions.
The most effective form of education is individual instruction by an infectious disease expert
given at the time of antibiotic choice. Additionally, education must be a continuous effort; if
not, results are diminished over time (Brown, 2005:163). Education-based interventions are
most effective when the prescribing physician and dispenser see it as help rather than being
authoritative. Natsch (2005:125) believed the best approach is to provide real-time feedback
and educated suggestions and then to allow the physician to make the final choice based on
this information.

91
Advantages of the educational approach include reduced red tape, less conflict, a greater
variety in antibiotics prescribed, and the direct involvement of infection control specialists
and microbiologists (Brown, 2005:164). Additionally, the inclusion of physicians as
contributors in the implementation of improved antibiotic utilisation procedures results in
increased compliance. Educational interventions that have shown to be successful include
audit and feedback, computer-assisted decision support, educational outreach, mass media
and printed educational materials (Natsch, 2005:125).
2.5.3 Structural interventions
Structural interventions include the changing from paper to computerised records, prompt
laboratory testing, computerised decision support systems and the introduction of
organisations for quality monitoring mechanisms (Davey et al., 2013:6). The subsequent
paragraphs outline two major interventions developed to curb the use of antimicrobials.
Laboratory controls
The medical laboratory in the healthcare facility can help in the prudent use of antimicrobials
by providing clinical interpretation to laboratory reports; performing selective susceptibility
testing that includes antimicrobials listed in the hospital formulary; and reporting trends and
susceptibility patterns can be collected to guide optimal empirical therapy (Brown,
2006:170).
Antibiotic stewardship programmes
Antimicrobial stewardship, defined by Gerding (2001:403), and agreed by Fishman
(2006:55), is the optimal selection, dosage, and duration of antimicrobial treatment that
results in the best clinical outcome for the treatment or prevention of infection, with minimal
toxicity to the patient and minimal impact on subsequent resistance. Antimicrobial
stewardship is a key element of a multidimensional approach in the prevention of the
emergence of antimicrobial resistance. Optimising antimicrobial use by minimising exposure
to drugs, adjusting dosage, reducing obsolete therapies, and targeting therapies to the
appropriate organisms are seen as strategies to enhance patients’ safety as well as
decrease resistance. Practically, prescribing antimicrobial therapy only when it is of benefit
to the patient, targeting therapy to the right pathogens, and using the suitable drug, dose
and duration.

92
According to Allerberger et al. (2009:1177), the objectives of an antibiotic stewardship
programme are to:
ensure patients get effective, safe and cost-effective antibiotic treatment and prophylaxis;
prevent and control antimicrobial resistance by promoting its judicious use; and
reduce the incidence of difficult-to-treat infections caused by multi-drug resistant strains.
Statutory bodies, e.g. European Surveillance on Antibiotic Consumption (ESAC), British
Society for Antimicrobial Chemotherapy (BSAC), The Antibiotic Smart Use Program in
Thailand, Chennai Declaration in India, European Study Group on Antibiotic Policies
(ESGAP), and Global Antibiotic Resistance Partnership (GARP) in South Africa all aim at
promoting the objectives of antibiotic stewardship programme. The month of November has
furthermore been slated to raise awareness on antimicrobial resistance and the careful use
of antimicrobial agents in communities and hospitals in Europe, Canada, The United States
and Australia (Earnshaw et al., 2013:1003). The use of social media, conferences,
communication materials, and media is employed to educate the society on the prudent use
of antimicrobial agents.
In South Africa, the “Best Care….Always” campaign, supported by the Federation of
Infectious Diseases Societies of South Africa (FIDSSA), the Global Antimicrobial Resistance
Partnership (GARP) and the World Health Organization’s Alliance for Patient Safety, was
launched in 2009. It is a bold step for South Africa in adopting this multifaceted approach in
the implementation of antibiotic stewardship by placing an emphasis on infection prevention
and control (Gelband & Duse, 2011:596). Since its inception in 2009, the antibiotic
stewardship programme has seen positive impacts in some hospitals in the country. The
introduction of the programme in Netcare Sunninghill Hospital saw a reduction in length of
stay, admissions and duration of antibiotic therapy with improved patient outcomes (Hewitt,
2013). According to Bala et al. (2013:14-18), Dr George Mukhari hospital (Ga-Rankuwa,
Gauteng) shared similar experiences with the inception of the programme.
Countries such as the United States (Agwu et al., 2008:751; Fishman, 2006:55; Owens et
al., 2004:2008: 896), India (Voss & Ghafur, 2013:2) and most European countries
(Allerberger et al., 2009:1176; Gould, 1999:257; Nathwani et al., 2012:1-2; Pan et al.,
2013:178) have all embraced the concept of the antibiotic stewardship programme.

93
2.5.4 Measuring the outcomes of interventions
Measuring the outcomes of implemented interventions is expedient to assess their
effectiveness. The following parameters are recommended to assess the efficacies of
strategies (Brown, 2005:180-181):
Auditing compliance of the interventions;
Monitoring changes in total drug usage expressed in terms of the defined daily dose
(DDD) before and after implementation;
Monitoring changes in the usage of targeted drugs in DDD before and after
implementation;
Monitoring changes in mean durations of antibiotic prescription; and
Monitoring changes in mean duration of hospital stay.
2.6 Quantitative measurement of antibiotic use
Antibiotic resistance, without a doubt, has become a global health concern. There have been
several national and international strategies to solve the problem of resistance. These
strategies include monitoring resistance patterns and antibiotic use, and a reduction of
disease burden through infection control measures and vaccination. In view of the fact that
increased antibiotic use is directly linked to the increase in antibiotic resistance, information
on the use of antibiotics is of central importance (Finch et al., 2004:44; MacKenzie et al.,
2005:941). Appropriate methods to measure the use of antibiotics are therefore crucial in
order to determine the effectiveness of interventions instituted (Fridkin et al., 1999:245).
Levy (1997:3) proposed the theory that antimicrobial resistance can be minimised if the total
antibiotic use in a setting stayed below a critical quantitative level. This theory was based on
the assumption that the natural competition among micro-organisms and the potential for the
return of their susceptibility after antimicrobial therapy were a possibility that decreased with
increased antibiotic use.
In a survey by Lawton et al. (2000:258), it was noted that most healthcare institutions were
more likely to have programmes optimising the use of antibiotics than participating in
population-level surveillance of antibiotic consumption and analysis. Few published data on
antibiotic use are available, especially in South Africa, and the lack of reliable data has
hindered rational discussions on antibiotic use both in the hospital and community settings
(Essack et al., 2011:564). Additionally, the major challenge with these published data is the

94
varying units in which antibiotic use is measured. This makes it quite challenging to compare
consumption data with other hospitals or countries.
It has been established that antibiotics are misused by both healthcare professionals and
patients (Adorka et al., 2013:347; Chukwuani et al., 2002: 18; Guar & English, 2006:343;
Mukonzo et al., 2013:303; Plachouras et al., 2010:3; Radyowijati & Haak, 2002:8; Sakpota et
al., 2010:6); however, few studies have been aimed at describing or comparing the use of
antibiotics. This has created a barrier in introducing rational discussions about the desirable
level of use. Comparing the level of use with other countries can help answer the question,
“What is the right or considerable amount of antibiotics to be used by a country?” and
whether that level is appropriate (Hutchinson et al., 2004:29).
According to the WHO (2013:25), the quantitative measurement of antibiotic use is essential
for the following reasons:
enactment of policies for the control of antimicrobial resistance;
comparison of the use of antimicrobials at different levels of healthcare;
inform and educate stakeholders;
correlate data from antimicrobial resistance monitoring in humans, animals and food;
apply risk analysis processes pertaining to the issue of antimicrobial resistance; and
evaluate the impact of implementation of the prudent use of antimicrobials and of other
interventions.
2.6.1 Units to describe drug consumption
Numerous units of measurement have been used to describe antibiotic use with varying data
sources. The subsequent paragraphs outline the common units used in quantifying the use
of drugs in healthcare institutions.
Cost
The use of drugs can be expressed in terms of cost, for example, in rands. The first drug
statistics were done utilising cost figures. Cost studies are useful in analysing expenditure on
drugs and evaluating health policies. Additionally, they are beneficial in providing answers to
how much a society spends on drugs with respect to the total amount spent per individual,
percentage of healthcare cost and percentage of a gross national product (GNP) (Haaijer-
Ruskamp & Dukes, 1993:128). However, comparison based on costs is often

95
misrepresentative due to price differences between different formulations and different
national cost levels. Fluctuation in currencies, currency exchange rates, regulatory policies,
import duties resulting in changes in the prices of drugs may not permit the long-term
assessment of drug use applying cost figures (Haaijer-Ruskamp & Dukes, 1993:130). The
increased use of more expensive drugs may have a great influence on the overall cost and
vice versa, reflecting a false picture on consumption (WHO, 2003:39).
Prescription volume
The number of prescriptions is used to quantify drug use. The total number of prescriptions
may not provide a good assessment of total use, unless total amounts of drugs per
prescription are also considered (WHO, 2003:39). Quantifying drug use using prescriptions
must include the diagnoses, which are often not included on most prescriptions (Capella,
1993:61).
Number of units sold
The use of drugs can also be expressed in terms of the number of units dispensed or sold
(Capella, 1993:59). This is applicable when the use of a well-defined product is being
evaluated. However, quantifying drug use in this form is unreliable because of variations in
packing sizes and strength across countries. The challenge in using physical units of
measurement is that drugs with low efficacy may have a larger fraction of the total than
drugs with higher efficacy. Furthermore, the use of drugs expressed in the total count of
tablets will results in low strength preparations and short-acting preparations contributing
more than high strength and longer-acting preparations, respectively (WHO, 2003:39).
There are many studies quantifying drug use, but they have been reported using different
methods and measuring units (Adriaenssens et al., 2011a:6; Aswapokee et al., 1990:138;
Harbarth et al., 2002:1463; Kritsotakis & Gikas, 2006:703; Kuster et al., 2008:553; Polk et
al., 2007:668).
According to MacKenzie and Gould (2005:105), a meaningful unit must consist of a
numerator that represents the amount of antibiotic use, and a denominator that controls the
population size. The choice of the numerator is highly relevant to express and compare
antibiotic use. A unit of measurement and method of data management independent of sale
prices and packages sizes are mostly ideal. The unit must preferably be based on individual
prescriptions. The challenge with this method is the unavailability of these prescriptions in

96
most settings (MacKenzie & Gould, 2005:105). In order to address the concern of a
universal system and unit of measurement, it was expedient to have a universal
classification system and a unit of measurement to evaluate and compare drug use.
2.6.2 The concept of DDD and ATC classification systems
The daily defined dose (DDD) established by the World Health Organization in 1996 has
gained legitimacy and less objectiveness in the measurement of drug use (WHO, 2003:33).
This approach has solved the challenge of standardising prescriptions of antibiotics use
data. The concept of the DDD is to help monitor and benchmark the use of antibiotics in
different countries. Even though the ATC/DDD system for all drugs has been available since
the 1980s, it was less understood and used resulting in conflicting publications on antibiotic
use (Kuster et al., 2008:549).
2.6.2.1 The anatomical therapeutic chemical (ATC) classification system
In the anatomical therapeutic chemical (ATC) classification system, drugs are categorised
into 14 main groups according to the organ or system on which they act and their
therapeutic, pharmacological and chemical properties.
The main groups of the ATC classification system are divided into 14 main groups listed in
Annexure A. The fourteen major groups are stratified at five different levels. The first level
represents the anatomical group and the second level denotes the
pharmacological/therapeutic subgroups. The third and fourth levels are the
pharmacological/therapeutic and chemical/pharmacological/therapeutic subgroups,
respectively. The fifth level is the subgroup for the chemical substance. A complete
classification of ciprofloxacin illustrates the structure of the code in Table 2.14 (WHO,
2013:10).

97
Table 2.14 Classification of ciprofloxacin based on the anatomical therapeutic
chemical (ATC) classification system
ATC classification ATC category Description
J General anti-infectives for
systemic use
1st level, anatomical group
J01 Antibacterial for systemic use 2nd level, therapeutic main group
J01M Quinolone antibacterial 3rd level, therapeutic/pharmacological subgroup
J01MA Fluoroquinolones 4th level, chemical/therapeutic/pharmacological
subgroup
J01MA01 Ciprofloxacin 5th level, subgroup for chemical substance
2.6.2.2 Principles for ATC classification
In the anatomical therapeutic classification, drugs are grouped according to the clinical use
of the main active ingredient on the basic principle of only one ATC code for each route of
administration. Additionally, pharmaceutical forms with similar active ingredients and
strength have the same ATC code. The same ATC code is also assigned to drugs of
immediate and slow release. A drug can be assigned more than one ATC code if it is
available in more than one strength and routes of administration with different clinical uses.
Plain products are defined by the WHO (2013:24) as preparations containing one active
compound or medicinal product that, in addition to an active compound, contains auxiliary
substances intended to increase the stability of the preparation, and increase the duration or
absorption. Plain products are classified according to the general principle explained above.
Combination products are preparations containing two or more active ingredients (WHO,
2013:24). Combination products belonging to the same fourth level are normally classified
using the fifth level codes – 20 or 30. Combination products with two or more active
ingredients not belonging to the same fourth level are classified using the - 50 series (WHO,
2013:24).
2.6.3 The defined daily dose (DDD)
The definition of the defined daily dose (DDD) is the assumed average maintenance dose
per day for a drug used for its main indication in adults. DDDs are only assigned for drugs
with ATC codes (WHO, 2003:20). The DDD is a unit of measurement and it is not a
reflection of the prescribed daily dose. The DDD is unique for every assigned ATC code and
route of administration. The DDD reflects the average adult dose used for the main

98
indication; even special pharmaceutical forms intended for children are assigned the DDD
for adults (WHO, 2013:25). The DDD gives a unit of measurement not influenced by price,
currencies, package size and strength.
The DDD per 1 000 inhabitants per day provides a rough estimate of the study population
that is treated daily with a particular drug. This estimate is most useful for drugs for chronic
diseases. The adjustment of population is considered here most often to correct for differing
demographic factors (WHO, 2013:26).
The DDD per 100 bed-days is often used to evaluate drug use when in-patients are being
considered. The bed-days must be adjusted for the occupancy rate as the definition of bed-
days may vary from institutions. This unit is very useful for benchmarking in hospitals (WHO,
2013:26).
The DDD per inhabitants per year is an estimate of the average number of days for which
each inhabitant is treated annually, e.g. 10 DDDs per inhabitant per year implies that the use
of a drug is equivalent to the treatment of every inhabitant with a ten-day course during a
certain year (WHO, 2013:26).
Prescribed daily dose (PDD) can be defined as the average dose prescribed according to a
representative sample of prescriptions (WHO, 2003:20). This can be determined from
studies of prescriptions, medical and pharmacy records and patient interviews.
2.7 Chapter summary
In this chapter, antibiotics were defined and a summary of the various sub-pharmacological
groups was provided. Cursory analyses of the patterns of antibiotic usage globally were
performed. The irrational use of antibiotics was found to be a significant correlation to the
emergence of antibiotic resistance. Interventions set up to promote the prudent use of
antibiotics were identified, narrowing it to the quantitative measurement of antibiotic use
employing the Anatomical Therapeutic Classification (ATC) system and the defined daily
dose (DDD) as a unit of measurement developed by the WHO. The next chapter (Chapter 3)
will focus on the results and discussions of the empirical investigation phase of the study.
The results and discussion are presented in the form of three manuscripts.

99
CHAPTER 3: RESULTS AND DISCUSSION
3.1 Introduction
This chapter focuses on the results and discussion of the empirical investigation of the study
presented in an article format. The results and discussion are presented in three
manuscripts parts addressing the main objectives of the empirical investigation.
Manuscript one addressed the objective: investigating the prescribing patterns viz. age,
gender, seasonal and geographic variations over the eight year period for the various
pharmacological groups of antibiotics. Manuscript one was submitted to the Southern African
journal of infectious diseases.
Manuscript two addressed the objective: investigating specifically the prescribing patterns of
the various groups of fluoroquinolones in adults focusing on longitudinal prevalence
variations using the defined daily dose (DDD) per a 1 000 inhabitants per day as a unit of
measurement. Manuscript two was submitted to the Journal of antimicrobial chemotherapy.
Manuscript three addressed the objective: describing the prescribing patterns of the various
groups of fluoroquinolones in children viz. age, gender and speciality of prescribers over the
study period; comparing the prescribed daily dosages (PDD) to the recommended daily
doses (RDD). Manuscript three was submitted to Biomedical central paediatrics.
Each manuscript conformed to the guidelines for authors per requirement for each journal.
Additional results are presented at the end of this chapter.

100
3.2 Manuscript one
Article title
Antibiotic prescribing patterns in the South African private health sector (2005-2012)
Author information
Winifred E Agyakwa1 (BPharm), Martie S Lubbe1 (PhD), Johanita R Burger1 (PhD), Norah L
Katende-Kyenda2 (PhD), Marike Cockeran1 (MSc)
1 Medicine Usage in South Africa, Faculty of Health Sciences, North-West University,
Potchefstroom Campus, Potchefstroom.
2 Department of Pharmacology, School of Medicine, Walter Sisulu University, Nelson
Mandela Drive Campus, Mthatha.
Word count (Abstract)
250 words
Word count (Text)
2 223 words
Corresponding author
Martie S Lubbe, Medicine Usage in South Africa (MUSA), School of Pharmacy, North-West
University, Potchefstroom, 2520, South Africa. [email protected]
Disclosures
The views expressed in this study are our own and not influenced by the institution or funded
Conflict of interest declaration
None to declare.

101
Source of funding
The INTRA-ACP Mobility Scheme and the National Research Foundation funded the
research.

102
ABSTRACT
Background
There is global concern to control antibiotic usage, mainly because of an increase in
infections and the use of antibiotics. This study was aimed at investigating longitudinal
antibiotic prescribing patterns in the private health sector of South Africa.
Method
A longitudinal retrospective drug utilisation review was conducted using nationally
representative claims data from a South African Pharmaceutical Benefit Management
company for the period January 2005 to December 2012. Patients were grouped by gender,
age and province. Each year was divided into four-month periods to analyse seasonal trends.
Prevalence of patients receiving antibiotics, antibiotic prescription prevalence, average
number of prescriptions per patient and prevalence of pharmacological groups of antibiotics
were determined.
Results
During the study, 44.8% (n = 5 155 262) of patients received at least one antibiotic
prescription. The prevalence of patients receiving antibiotic prescriptions decreased by 7.9%.
Antibiotic prescriptions were higher in females (n = 2 831 686, 54.9%) and mostly prescribed
for patients aged 0 to 18 years (26.5%) and least in patients above 65 years (9.5%). The
prevalence of patients receiving antibiotic prescriptions was highest in Gauteng (41.9%) and
least in the Northern Cape (1.7%). Antibiotic prescriptions were highest during the winter
period. Penicillins were the most prescribed antibiotics (43.1%) and carbapenems the least
(0.1%). No practical association was found between antibiotic prescribing and gender, age,
province and season.
Conclusion
Antibiotic prescribing has generally decreased in the private health sector of South Africa.
Gender, age, province and season were weak predictors of antibiotic prescribing.
Keywords: antibiotics, prescriptions, patterns, gender, age, seasons, provinces

103
Introduction
Approximately 50% of patients who visit healthcare institutions are prescribed with at least
one antibiotic agent. [1, 2] Despite its wide usage, little data exist on the patterns of use in most
healthcare settings. [3] This has created a barrier in introducing rational discussions about the
desirable level of use. [4] In 2001, The European Centre for Disease Control (ECDC)
initialised the European Surveillance on Antibiotic Consumption (ESAC) project. [5] This
project was aimed at monitoring antibiotic consumption in all European countries and
determining the population’s exposure to antibiotics. A similar study has also been done in
the United States. [6] South Africa, however, has very little published data on the patterns of
antibiotic use. [3] In South Africa, antibiotic consumption in the private sector is derived from
Institute of Medical Statistics (IMS) with data collected from wholesalers and direct sales
from manufacturers to pharmacies. [3] The data from 2009 and 2010 indicated an increment in
the use of antibiotics by approximately 6.5%, with broad spectrum penicillins, carbapenems
and macrolides accounting for approximately 43% of the market share. [3] This present study
was aimed at investigating the antibiotic prescribing patterns by age and gender, as well as
seasonal and geographical distribution over the eight-year period in the private health sector
of South Africa.
Method
We conducted a retrospective drug utilisation review analysing nationally representative
medicine claims data for an eight-year period (1 January 2005 to 31 December 2012)
submitted to a privately-owned South African Pharmaceutical Benefit Management (PBM)
company. The data represent a third of South African patients with private medical aid. The
target population consisted of 11 502 511 patients of which 5 155 262 (44.8%) patients (study
population) claimed antibiotic prescriptions during the study period.
Variables
Variables (age groups, gender, geographical area and seasons) were expressed using
descriptive statistics such as frequencies (n), percentages (%), means, standard deviations and
95% confidence intervals (CI). Patients’ ages were determined on the date of the next year
following the treatment date and divided into four groups: children and adolescents (>0 and
≤18 years); young adults (>18 and ≤30 years); older adults (>30 and ≤45 years and >45 and
≤65 years); and the elderly (>65 years). The nine provinces of South Africa viz. Eastern Cape,

104
Free State, Gauteng, Limpopo, Northern Cape, North West, Mpumalanga, KwaZulu-Natal
and Western Cape were used as the main geographical areas. To determine a possible
seasonal influence on antibiotic prescribing patterns, each year (1 January to 31 December)
was divided into three categories of four-month periods viz. January to April, May to August
and September to December.
Statistical analyses
Descriptive and inferential statistics were used to analyse the data using the SAS Version 9.3.
[7] All statistically significant results were considered with a probability of p < 0.05. The
practical significance of results was computed when the p-value was statistically significant
(p ≤ 0.05).
A two-sample independent t-test was used to compare the average number of antibiotic
prescriptions per patient per year by gender. A one-way ANOVA, operationalised by the
general linear model (GLM) procedure, was used to compare the differences between the
average number of antibiotic prescriptions per patient per year between the different age
groups and provinces. Tukey’s multiple comparison test was performed to determine which
groups differ significantly from each other. Cohen’s d was used to evaluate the effect size
between the groups based on the mean values (with d ≥ 0.8 defined as a large effect with
practical significance). A chi-square test (χ2) was used to determine whether an association
exists between the prevalence of antibiotic items per prescription and gender, age groups,
seasons or provinces. The chi-square test (χ2) was also used to determine whether an
association exists between the pharmacological groups of antibiotics prescribed in the
different years. The Cramer’s V statistic was used to test the practical significance of this
association (with Cramer’s V ≥ 0.5 defined as practically significant).
Ethics
This study was approved by the Ethics Committee of the North-West University (NWU-
0046-08-550) and the board of directors of the South African Pharmaceutical Benefit
Management Company (PBM). Data were analysed anonymously. Data privacy and
confidentiality were maintained at all times; therefore, no patient or medical
scheme/administrator could be traced. Additionally, it was not possible to determine which
prescribers or providers (i.e. name of the prescriber/provider) were involved in the

105
prescribing/dispensing of the medicine items. The PBM providing the data for the study is
furthermore nowhere identified in this study. The researcher, study promoter and co-promoter
furthermore signed confidentiality agreements.
Results
Antibiotic use and study population
Patients receiving antibiotics decreased from 2005 (46.1%) to 2012 (38.2%); however,
peaking in 2007 at 49.0% (Table 1). Of the 64 132 203 prescriptions claimed during the study
period, 17.6% (n = 11 309 203) represented the total number of antibiotic prescriptions.
Antibiotic agents represented 7.9% (n = 11 986 624) out of the 152 489 789 medicine items
claimed. The number of prescriptions and antibiotic agents generally decreased from 2005 to
2012 (Table 1). The average number of antibiotic prescriptions per patient per year ranged
from 2.22 ± 1.89 (95% CI 2.22-2.22) in 2005 to 1.98 ± 1.62 (95% CI 1.98-1.99) in 2012. The
number of antibiotics per prescription per year remained fairly constant at 1.05 ± 0.19 (95%
CI 1.05-1.05) in 2005 to 1.06 ± 0.21 (95% CI 1.06-1.06) in 2012.

106
Table 1 Distribution of patients claiming antibiotics, antibiotic prescriptions and number of antibiotics claimed during the study
period
Year
Total number
of patients in
database
Number of
patients
claiming
antibiotics, n
(%)*
Total
number of
prescriptions
in database
Number of
antibiotic
prescriptions, n
(%) ǂ
Average number of
antibiotic prescription per
patient ± SD (95% CI)
Total number
of medicine
items in
database
Number of
antibiotic
claimed, n
(%)ᴪ
Average number of
antibiotic per
prescription ± SD (95%
CI)
2005 1 712 172 789 247 (46.1) 8 436 901 1 752 779 (20.8) 2.22 ± 1.89 (2.22 - 2.22) 19 500 774 1 857 824 (9.5) 1.05 ± 0.19 (1.05 - 1.05)
2006 1 757 926 803 415 (45.7) 8 951 720 1 849 677 (20.7) 2.30 ± 1.97 (2.30 - 2.31) 21 113 403 1 958 577 (9.3) 1.05 ± 0.19 (1.05 - 1.05)
2007 1 355 268 664 474 (49.0) 7 956 538 1 547 028 (19.4) 2.33 ± 1.95 (2.32 - 2.33) 19 075 705 1 638 741 (8.6) 1.05 ± 0.19 (1.05 - 1.05)
2008 1 123 660 533 334 (47.5) 6 819 678 1 214 111 (17.8) 2.28 ± 1.91 (2.27 - 2.28) 16 439 253 1 289 027 (7.8) 1.05 ± 0.20 (1.06 - 1.06)
2009 1 537 385 709 308 (46.1) 9 091 934 1 547 721 (17.0) 2.18 ± 1.75 (2.18 - 2.19) 21 648 991 1 639 988 (7.6) 1.05 ± 0.20 (1.05 - 1.06)
2010 1 455 737 637 133 (43.8) 8 588 146 1 358 941 (15.8) 2.13 ± 1.74 (2.13 - 2.14) 20 527 777 1 436 642 (7.0) 1.05 ± 0.19 (1.05 - 1.05)
2011 1 302 431 538 192 (41.3) 7 441 285 1 087 053 (14.6) 2.02 ± 1.63 (2.02 - 2.20) 17 766 594 1 151 168 (6.5) 1.05 ± 0.20 (1.05 - 1.05)
2012 1 257 932 480 159 (38.2) 6 846 001 951 920 (13.9) 1.98 ± 1.62 (1.98 - 1.99) 16 409 292 1 014 657 (6.2) 1.06 ± 0.21 (1.06 - 1.06)
TOTAL 11 502 511 5 155 262 (44.8) 64 132 203 11 309 230 (17.6) 152 489 789 11 986 624 (7.9)
* ǂ ᴪPercentages were calculated according to the total in each respective year

107
The ratio of females to males was 1.2:1. The frequency of antibiotic prescriptions was higher
in females (n = 2 831 686, 54.9%) than in males (n = 2 321 635, 45.0%) over the study
period; however, there was no practical association between the average number of antibiotic
prescriptions and gender (p < 0.0001, Cohen’s d-value < 0.2). The highest prevalence of
patients receiving antibiotic prescriptions was observed in patients between 0 and 18 years,
though decreasing from 29.4% (n = 232 132) in 2005 to 24.7% (n = 118 808) in 2012,
followed by patients between 45 and 65 years, increasing from 23.4% (n = 184 312) to 26.5%
(n = 127 002). The lowest prevalence of antibiotic prescriptions was observed in ages above
65 years. There was, however, no practical association between average number of antibiotic
prescriptions in the different age groups (p < 0.0001, Cohen’s d-value < 0.2) (Table 2).

108
Table 2 Antibiotic prescription per patient stratified by gender, age and province
Number of patients claiming antibiotics, n (%)§
Subgroup
2005
(N = 789 247)
2006
(N = 803 415)
2007
(N = 664 474)
2008
(N = 533 334)
2009
(N = 709 308)
2010
(N = 637 133)
2011
(N = 538 192)
2012
(N = 480 159)
Relative
change 2005
vs. 2012 (%)
p-value
Gender
Female 438 243 (55.5) 446 340 (55.6) 370 512 (55.8) 297 191 (55.7) 388 768 (54.8) 347 459 (54.5) 290 223 (53.9) 252 950 (52.7) -2.8 < 0.0001
Male 349 888 (44.3) 356 439 (44.4) 293 779 (44.2) 236 143 (44.3) 320 540 (45.2) 289 674 (45.5) 247 966 (46.1) 227 206 (47.3) +3.0
Unidentified gender 1 116 (0.2) 636 (0.08) 183 (0.03) 0 (0.0) 0 (0.0) 0 (0.0) 3 (0.0006) 3 (0.0006)
Age groups (years)
>0, ≤18 232 132 (29.4) 230 546 (28.7) 183 242 (27.6) 129 253 (24.2) 183 307 (25.8) 158 446 (24.9) 132 537 (24.6) 118 808 (24.7) -4.7 < 0.0001
>18, ≤30 106 193 (13.5) 112 523 (14.0) 94 051 (14.2) 72 799 (13.7) 111 217 (15.7) 99 629 (15.6) 82 286 (15.3) 71 895 (15.0) +1.5
>30, ≤45 202 058 (25.6) 201 322 (25.1) 159 319 (24.0) 123 152 (23.1) 160 876 (22.7) 144 230 (22.6) 123 967 (23.0) 111 855 (23.3) -2.3
>45, ≤65 184 312 (23.4) 193 784 (24.1) 170 033 (25.6) 153 763 (28.8) 184 269 (26.0) 166 968 (26.2) 140 439 (26.1) 127 002 (26.5) +3.1
> 65 64 552 (8.1) 65 240 (8.2) 59 362 (8.9) 54 367 (10.2) 69 553 (9.8) 67 860 (10.7) 58 963 (11.0) 50 599 (10.5) -2.4
Province
Gauteng 309 711 (39.2) 328 990 (41.0) 272 378 (41.0) 220 795 (41.4) 309 555 (43.6) 279 384 (43.9) 234 349 (43.5) 204 198 (42.5) +3.3
< 0.0001
KwaZulu-Natal 118 928 (15.0) 117 375 (14.6) 101 585 (15.3) 83 882 (15.7) 102 279 (14.4) 85 411 (13.4) 69 378 (12.9) 59 179 (12.3) -2.7
Western Cape 74 869 (9.5) 73 520 (9.2) 63 014 (9.5) 50 203 (9.4) 73 180 (10.3) 65 134 (10.2) 52 959 (9.8) 48 143 (10.0) +0.5
Limpopo 61 964 (7.9) 63 431 (7.9) 50 653 (7.6) 37 620 (7.1) 36 233 (5.1) 30 011 (4.7) 25 359 (4.7) 22 800 (4.8) -3.1
Eastern Cape 57 572 (7.3) 52 413 (6.5) 41 466 (6.2) 34 699 (6.5) 44 833 (6.3) 39 941 (6.3) 32 850 (6.1) 30 157 (6.3) -1.0
North West 50 601 (6.4) 56 922 (7.19) 48 193 (7.3) 36 507 (6.9) 48 322 (6.8) 45 215 (7.1) 37 400 (7.0) 35 003 (7.3) +0.9
Mpumalanga 47 726 (6.1) 55 436 (6.9) 45 840 (6.9) 36 363 (6.8) 48 851 (6.9) 46 561 (7.3) 44 263 (8.2) 42 124 (8.8) +2.7
Free State 33 983 (4.3) 35 527 (4.4) 27 896 (4.2) 23 337 (4.4) 31 710 (4.5) 30 589 (4.8) 26 834 (5.0) 24 240 (5.1) +0.8
Northern Cape 13 554 (1.7) 13 115 (1.6) 10 489 (1.6) 8 070 (1.5) 10 265 (1.5) 10 765 (1.7) 10 747 (2.0) 10 715 (2.2) +0.5
Unidentified 20 339 (2.6) 6 686 (0.8) 2 960 (0.5) 1 858 (0.4) 4 080 (0.6) 4 122 (0.7) 4 053 (0.8) 3 600 (0.8) -1.8
§ Percentages were calculated according to the total number of patients claiming antibiotics in each respective year.

109
Gauteng had the highest prevalence of patients receiving antibiotics, increasing from 39.2%
(n = 309 711) in 2005 to 42.5% (n = 204 198) in 2012. The Northern Cape had the lowest
prevalence of patients claiming antibiotics, however, increasing from 1.7% (n = 13 554) in
2005 to 2.2% (n = 10 715) in 2012 (Table 2). Patients receiving antibiotics in Limpopo,
KwaZulu-Natal and the Eastern Cape decreased by 3.1%, 2.7% and 1.0% respectively during
the study period (Table 2). There was no practical association between the prevalence of
patients receiving antibiotics in the different provinces (p < 0.0001, Cramer’s V ≤ 0.2).
The prescribing of antibiotics was highest from May to August, representing the winter
season in South Africa. Conversely, the prescribing of antibiotics was least January to April.
There was, however, no practical association throughout the study period between antibiotic
prescribing and seasonal trends (p < 0.0001, Cramer’s < 0.2).
Antibiotics prescribing
The penicillins were the most frequently prescribed antibiotics with relative use decreasing
from 44.5% (n = 825 997) in 2005 to 43.2% (n = 438 537) in 2012. This was followed by the
fluoroquinolones, with no significant change in the level of prescribing, remaining constant
from 16.3% in 2005 and 16.2% in 2012. The use of macrolides increased from 12.8% in 2005
to 15% in 2012. The carbapenems and chloramphenicols were the least prescribed in all age
groups. The use of carbapenems increased from 0.001% in 2005 to 0.02% in 2012 (Table 3).
Though statistically significant, there was no practical association between the number of
antibiotic agents claimed and age, gender or season (p < 0.0001, Cramer’s V < 0.2).

110
Table 3 Pharmacological groups of antibiotics prescribed during the study period
Medicine items claimed, n (%)**
Pharmacological
group
2005
(N = 1 857 824)
2006
(N = 1 958 577)
2007
(N = 1 638 741)
2008
(N = 1 289 027)
2009
(N = 1 639 988)
2010
(N = 1 436 642)
2011
(N = 1 151 168)
2012
(N = 1 014 657)
Relative
change
‘05 vs.
‘12 (%)
p-value
Penicillins 825 997 (44.5) 870 036 (44.4) 699 379 (42.7) 552 512 (42.9) 694 653 (42.4) 593 645 (41.3) 491 370 (43.2) 438 537 (43.2)
-1.3
< 0.0001
Quinolones 303 318(16.3) 326 384 (16.7) 291 361 (17.8) 232 849 (18.1) 288 161 (17.6) 255 982 (17.8) 193 742 (16.8) 164 617 (16.2) -0.1
Cephalosporins 285 531 (15.4) 283 576 (14.5) 235 902 (14.4) 166 709 (12.9) 227 393 (13.9) 196 139 (13.7) 149 889 (13.0) 133 344 (13.1)
-2.3
Macrolides 237 303 (12.8) 264 922 (13.5) 234 060 (14.3) 183 307 (12.2) 247 938 (15.1) 220 220 (15.3) 176 465 (15.2) 152 035 (15.0) +2.2
Sulphonamides/
Trimethoprim 99 074 (5.3) 110 909 (5.7) 93 980 (5.7) 86 867 (6.7) 101 682 (6.2) 100 061 (7.0) 85 757 (7.5) 78 889 (7.8) +2.5
Tetracyclines 97 172 (5.3) 93 355 (4.8) 74 784 (4.6) 59 278 (4.6) 67 694 (4.1) 58 239 (4.1) 45 396 (3.9) 40 286 (4.0) -1.3
Aminoglycosides 7 760 (0.4) 8 199 (0.4) 8 266 (0.5) 6 702 (0.5) 8 996 (0.6) 7 239 (0.5) 5 797 (0.5) 6 170 (0.6) +0.2
Chloramphenicol 1 652 (0.09) 1 177 (0.06) 982( 0.06) 773 (0.06) 824 (0.05) 1 009 (0.07) 849 (0.07) 554 (0.05) -0.04
Carbapenems 17 (0.001) 19 (0.001) 27 (0.002) 30 (0.002) 2 646 (0.2) 4 108 (0.3) 1 903 (0.2) 225 (0.02)
+0.02
**Percentage was calculated according to the total medicine items claimed for each year

111
The broad-spectrum penicillin (amoxicillin-clavulanic acid) was the most prescribed
antibiotic during the study period ranging from 25.7% in 2005 to 27.3% in 2012. Among the
macrolides, azithromycin and clarithromycin were observed to have a relative increase of
2.6% and 1% respectively from 2005 to 2012. The prescribing of sulphadoxine/trimethoprim
increased from 5.3% in 2005 to 7.8% in 2012. A notable decrease in prescribing was
observed in amoxicillin, cefaclor and erythromycin, with a cut-off point set at ±0.7% (Table
4). The prescribing of these three antibiotics decreased by 2.2, 1.4 and 0.9%, respectively.

112
Table 4 Notable relative changes in specific antibiotic agents from 2005 to 2012 (%)
Antibiotic agent 2005 2006 2007 2008 2009 2010 2011 2012
Relative
change 2005 vs.
2012
Increase
Amoxicillin/clavulanic acid 477 168 (25.7) 52 2050 (25.7) 432 832 (26.4) 353 407 (27.4) 450 654 (27.5) 37 7641 (26.3) 31 0051 (26.9) 273 433 (27.0) 1.3
Ciprofloxacin 157 264 (8.5) 170 663 (8.7) 150 828 (9.2) 120 524 (9.4) 148 966 (9.1) 137 261 (10.0) 105 945 (9.2) 93 574 (9.2) 0.7
Sulphadoxine/Trimethoprim 9 9074 (5.3) 110 909 (5.7) 93 980 (5.7) 86 867(6.7) 101 659 (6.2) 100 061(7.0) 85 757 (7.5) 78 889 (7.8) 2.5
Clarithromycin 94 400 (5.1) 109 462 (5.6) 99 528 (6.1) 73 439 (5.7) 101 434 (6.2) 92 010 (6.4) 72 848 (6.3) 61 809 (6.1) 1.0
Cefpodoxime 75 412 (4.1) 80 871 (4.1) 72 552 (4.4) 48 194 (3.7) 80 021 (4.9) 73 651 (5.1) 57 495 (5.0) 47 443 (4.7) 0.6
Azithromycin 46 880 (2.5) 57 549 (2.9) 57 991 (3.5) 51 613 (4.0) 81 604 (5.0) 72 560 (5.1) 59 553 (5.2) 52 018 (5.1) 2.6
Moxifloxacin 42 819 (2.3) 51 651 (2.6) 52 156 (3.2) 39 084 (3.0) 47 648 (2.9) 41 945 (2.9) 33 660 (2.9) 27 864 (2.8) 0.5
Levofloxacin 41 354 (2.2) 51 095 (2.6) 51 401 (3.1) 47 637 (3.7) 66 860 (4.1) 57 956 (4.0) 41 684 (3.6) 33 552 (3.3) 1.1
Ceftriaxone 14 820 (0.8) 16 657 (0.9) 14 985 (0.9) 13 223 (1.0) 17 810 (1.1) 15 944 (1.1) 13 427 (1.2) 15 875 (1.6) 0.8
Decrease
Amoxicillin 279 120 (15.0) 275 247 (14.1) 205 019 (12.5) 152 840 (11.9) 185 189 (11.3) 1 70315 (11.9) 144 699 (12.6) 129 926 (12.8) -2.2
Doxycycline 65 309 (3.5) 62 270 (3.2) 49 058 (3.0) 39 159 (3.0) 44 453 (2.7) 39 781 (2.8) 32 109 (2.8) 28 378(2.8) -0.7
Erythromycin 62 426 (3.4) 58 899 (3.0) 47 871 (2.9) 35 795 (2.8) 39 299 (2.4) 33 649 (2.3) 28 589 (2.5) 25 082 (2.5) -0.9
Cefaclor 32 399 (1.7) 25 859 (1.3) 11 817 (0.7) 6 171 (0.5) 6 768 (0.4) 5 260 (0.4) 3 936 (0.3) 3 090 (0.3) -1.4
Ofloxacin 15 857 (0.9) 16 336 (0.8) 11 929 (0.7) 7 904 (0.6) 5 954 (0.4) 3 997 (0.3) 1 898 (0.2) 1 932 (0.2) -0.7

113
Discussion
This large longitudinal study showed that total antibiotic use by patients decreased by
approximately 7.9% from 2005 to 2012. The penicillins and fluoroquinolones were the most
prescribed pharmacological group of antibiotics in this section of the private health sector of
South Africa. This trend confirms other studies conducted in Europe [5] and in South
America. [8] For example, Adriaenssens et al. [5] observed penicillins being widely prescribed
in 33 European countries, followed by the fluoroquinolones and macrolides from 1997 to
2009. However, in the United States [6], tetracycline, macrolides and fluoroquinolones were
the most widely prescribed antibiotics. It was interesting to note the gradual increase in the
use of broader spectrum antibiotics and a decline in the use of older antibiotics, confirming
this trend from studies done in European countries. The shift to these antibiotics has been
attributed to increased resistance to older antibiotics; major advancement in the diagnoses of
diseases; availability of these agents; better compliance as these antibiotics have flexible
dosage regiments; and fewer side effects associated with these antibiotics. [5, 9] The decrease
in total antibiotic use may be attributed to awareness and educational programmes aimed at
prescribers and patients on the dangers of irrational use; e.g., in 2009, the antibiotic
stewardship programme was introduced in the private health sector to promote prudent use.
[10]
Though there was no practical association between gender and prescribing prevalence, we
observed the prevalence of antibiotics prescribing higher in females than in males. This trend
confirms studies done in New Zealand [11] and in the Netherlands. [12] Our observation may be
due to the higher population of females than males in the database. These trends reflect the
demographic profile of beneficiaries covered by medical aid schemes registered in South
Africa in terms of the Medical Schemes annual report. [13] Additionally, according to the
national census in South Africa, there are more females than males in the total South African
population. [14] According to Verbrugge, health-seeking behaviour varies greatly by gender.
[15] Women are more sensitive to discomfort, more likely to perceive symptoms of an illness
and are more likely to report health-related issues than men. He attributed his findings to
societal expectations where males are encouraged to ignore symptoms of illness to prove
their virility. [15]
The study observed the highest antibiotic use in patients between the ages of 0 and 18 years
and patients between 45 and 65 years. Population statistics in South Africa reveal that one-
114
third of the population are below the age of fifteen years and approximately 7% above the age
of 65 years and may account for this observation. [14] These two population subgroups
represent children who are still developing immunity and adults with active lifestyles,
respectively. Studies have shown that children below 18 years are prone to respiratory tract
infections, and therefore they are more likely to be prescribed with an antibiotic. [16]
The provinces of Gauteng and KwaZulu-Natal had the highest number of patients claiming
antibiotics during the study period. These are two highly populated provinces in South
Africa with approximately 20% of the population residing in these provinces, respectively.
[14] Population density, urbanisation and migration may be possible causes of the increased
use in antibiotics associated with the increase in infectious diseases. The close proximity in
living areas may facilitate the spread of infections and consequently increase the use of
antibiotics. [17]
Studies performed in Europe [5] and America [9] have shown that antibiotics are mostly used
during the winter period, especially for the treatment of respiratory tract infections. Our study
confirms this trend with the highest prevalence in the winter season (May to August).
Although the indication for use was not analysed in the study, the magnitude of use of the
broad-spectrum penicillins (amoxicillin/clavulanic acid), azithromycin and
sulphadoxine/trimethoprim suggests a high incidence of respiratory tract infections during the
winter months. [5, 9]
Conclusion
From our study, gender, age, season and geographical areas were weak predictors of
antibiotic use. The increase in the use of sulphadoxine/trimethoprim, amoxicillin-clavulanic
acid and azithromycin can be attributed to its use in the treatment of respiratory tract
infections. We therefore recommend that effective interventions be instituted nationwide to
curb antibiotic use particularly during the winter seasons as many of these infections may be
of viral origin. Additionally, effective infection control methods should be directed at
Gauteng to reduce antibiotic use. We also recommend that future studies be conducted to
determine the future implications on the use of new broader-spectrum antibiotics such as
amoxicillin/clavulanic acid, azithromycin and levofloxacin; and their evidence in proper
infection control.

115
A limitation of this study was the inability to correlate use with diagnoses due to incomplete
data. Some prescribers failed to indicate the diagnoses on the prescriptions issued. It is also
not certain whether the antibiotics dispensed were actually consumed by the patient and
consequently may not accurately reflect antibiotic use in the population. Finally, the data
used represent only a section of patients registered as beneficiaries of medical schemes in
South Africa.

116
Acknowledgements
We thank Ms Anne-Marie Bekker for administrative support regarding the database. The
authors acknowledge the North-West University (Potchefstroom Campus), National Research
Foundation and INTRA-ACP Mobility Scheme for financial support.
117
References
1. Al-Ghamdi S, Gedebou M, Bilal NE. Nosocomial infections and misuse of antibiotics in a
provincial community hospital, Saudi Arabia. J Hosp Infect 2002;50(2): 115-21.
2. Polk RE, Fox C, Mahoney A, Letcavage J, MacDougall C. Measurement of adult
antibacterial drug use in 130 US hospitals: comparison of defined daily dose and days of
therapy. Clin Infect Dis 2007;44(5): 664-70.
3. Essack SY, Shellack N, Pople T, et al. Antibiotic supply chain and management in
human health. S Afr Med J 2011;101(8): 562-6.
4. Hutchinson JM, Patrick DM, Marra F, et al. Measurement of antibiotic consumption: a
practical guide to the use of the anatomical therapeutic chemical classification and
defined daily dose system methodology in Canada. Can J Infect Dis 2004;15(1): 29-35.
5. Adriaenssens N, Coenen S, Versporten A, et al. European Surveillance of Antimicrobial
Consumption (ESAC): outpatient antibiotic use in Europe (1997–2009). J Antimicrob
Chemother 2011; 66(Suppl. 6): S3-S12. [http://dx doi:10.1093/jac/dkr453]
6. Goossens H, Ferech M, Coenen S, Stephens P, The European Surveillance of
Antimicrobial Consumption Project Group. Comparison of outpatient system antibacterial
use in 2004 in the United States and 27 European countries. Clin Infect Dis 2007;44(8):
1091-95.
7. SAS Institute Inc. SAS for windows 9.3. Cary: North Carolina, 2012.
8. Wirtz VJ, Dreser A, Gonzales R. Trends in antibiotic utilization in eight Latin American
countries. Rev Panam Salud Publica 2010;27(3): 219-25.
9. Carrie AG, Metge CJ, Zhanel GG. Antibiotic use in a Canadian province, 1995-1998.
Ann Pharmacother 2000;34(4): 459-64.
10. Gelband H, Duse AG. Future directions for GARP. S Afr Med J. 2011;101(8): 596.
11. Norris P, Horsburgh S, Keown S, et al. Too much or too little? Prevalence and extent of

118
antibiotics in a New Zealand region. J Antimicrob Chemother 2011;66(8):1921-26.
[http://dx. 10.1093/jac/dkr194].
12. Haeseker MB, Dukers-Miujrers NHTM, Hoebe CJPA, Bruggeman CA, Cals JWL,
Verbon A. Trends in antibiotic prescribing in adults in Dutch general practice. PLos One
2012;7(12): 1-6. [http://dx. 10.1371/journal.pone.0051860].
13. Council for Medical Schemes. Annual report 2012-2013. Pretoria: Council for Medical
Schemes. https://www.medicalschemes.com/Publications.aspx (accessed 13 August
2014)
14. Statistics South Africa. Mid-year population estimates 2011. [Cited 2014 Jun 24].
Available from: http://www.statssa.gov.za/publications/P0302/P03022011.pdf
15. Verbrugge LM. Sex differentials in health. Public Health Rep 1982;97(5): 417-37.
16. Katende-kyenda NL, Lubbe MS, Serfontein JHP, Truter I. Inappropriateness of
antimicrobial prescription in private primary health care settings in South Africa. S Afr
Med J 2006;96(8): 704-5.
17. Alirol E, Getaz L, Stoll B, Chappuis F, Loutan L. Urbanisation and infectious diseases in
a globalized world. Lancet Infect Dis 2011;11(2): 131-41.

119
3.3 Manuscript two
Fluoroquinolone utilisation patterns in adults in the private health sector of South
Africa (2005-2012)
Winifred E Agyakwa1 (BPharm), Martie S Lubbe1 (PhD), Johanita R Burger1 (PhD), Norah L
Katende-Kyenda2 (PhD), Marike Cockeran1 (MSc)
1 Medicine Usage in South Africa, Faculty of Health Sciences, North-West University,
Potchefstroom Campus, Potchefstroom.
2 Department of Pharmacology, School of Medicine, Walter Sisulu University, Nelson
Mandela Drive Campus, Mthatha.
Corresponding author
Martie S Lubbe, Medicine Usage in South Africa (MUSA), School of Pharmacy, North-West
University, Potchefstroom, 2520, South Africa.
Email: [email protected]
Keywords: fluoroquinolones, prescription claims database, use, adults, trends, longitudinal,
South Africa

120
SYNOPSIS
Objectives
Fluoroquinolones represent major clinical advancements with their antipseudomonal activity
and relatively good clinical profiles. However, little data exist on their pattern of use in South
Africa. This study aims to describe their pattern of use in adults in the private health sector of
South Africa over an eight-year period (2005-2012).
Method
Prescription data on outpatient fluoroquinolone (J01MA) use at the active ingredient level in
patients above 18 years were collected from a nationally representative prescription claims
database from 2005 to 2012 using the Anatomical Therapeutic Chemical (ATC)/defined daily
dose (DDD) methodology. Fluoroquinolone prescribing was analysed based on age and
gender. Overall, fluoroquinolone use patterns were classified into three fluoroquinolone
generations and expressed in DDDs/1000 inhabitants/day (DID).
Results
Between 2005 and 2012, a total of 1 983 622 prescriptions for fluoroquinolones were
claimed. The highest prevalence of fluoroquinolone prescription was found in females (p <
0.0001, Cramer’s V = 0.02) and in patients between 45 and 65 years (p < 0.0001, Cramer’s V
= 0.04). Total fluoroquinolone use decreased from 2.85 DID in 2005 to 2.41 DID in 2012.
Norfloxacin was the only first-generation fluoroquinolone prescribed. The second-generation
fluoroquinolones accounted for more than 50% of the total DID, with ciprofloxacin being the
most used in this generation. Moxifloxacin was the most prescribed third-generation
fluoroquinolone; its use ranging from 0.51 DID in 2005 to 0.44 DID in 2012.

121
Conclusion
Overall, fluoroquinolone use decreased from 2005 to 2012. The use of a medicine claims
database, utilising the ATC/DDD methodology, is an effective method of describing and
comparing antibiotic use.

122
Introduction
“Antimicrobial resistance: no action today – no cure for tomorrow” 1 – this was the theme for
the 2011 World Health Day where antimicrobial resistance was named as one of the three
largest health threats to mankind. 2 Over the past seven decades, we have been living in an
optimistic world where antibiotics have been seen as ‘magic bullets’ in the treatment of
infectious diseases. 3 Although the issue of antibiotic resistance is not something new, its
imprints tend to flaw the major advancements in modern medicine. With the discovery of
fluoroquinolones, a major stride in antimicrobial chemotherapy was achieved owing to its
antipseudomonal property.4 This has made them the drug of choice for both complicated
respiratory and urinary tract infections in most patient groups.5, 6
Fluoroquinolones have become one of the fastest-growing antibiotic groups with regard to
use.7 Approximately 80% of European countries have shown an increase in fluoroquinolone
use over the past decade.7-10 For example, in Greece and Luxembourg, quinolone use increased
from 1.11 DID and 1.63 DID in 1997 to 2.63 DID and 2.83 DID’ in 2009, respectively.7 In
India, fluoroquinolones are the most used antibiotic group at all healthcare settings.11, 12
Furthermore, in the United States, fluoroquinolones are the most prescribed antibiotic group in
the adult population. Its use in the United States increased threefold from 7 million visits in
1995 to 22 million visits in 2002 due to changes in prescribing patterns for respiratory tract
infections and inappropriate prescribing.13 Latin American countries have also reported an
increase in fluoroquinolone use, where, in Venezuela, the use of fluoroquinolones tripled
within a ten-year period (+282%).14
Although fluoroquinolones are prescribed in South Africa, limited information is available on
their pattern of use. Where usage has been correlated with resistance, 15-18 it has become

123
expedient to monitor antimicrobial usage at all healthcare levels. The objective of this study
was to describe the trends in outpatient systemic fluoroquinolone use in patients older than 18
years over an eight-year period in a part of the private health sector of South Africa.
Method
We conducted a retrospective drug utilisation review analysing nationally representative
outpatient prescription claims data obtained from a privately-owned South African
Pharmaceutical Benefit Management (PBM) company. This database represents a third of the
South African private health sector population covered by medical aid. Data for an eight-year
period (1 January 2005 to 31 December 2012) for a total of 3 788 438 patients older than 18
years (male/female ratio 1.2:1) claiming at least one antibiotic prescription were obtained from
the database. The study population was grouped based on the following variables to determine
the prevalence of patients receiving fluoroquinolone prescriptions:
Gender: Although less than 1% of the study population had no identified gender, they were
included to show total fluoroquinolone use.
Age: Patients’ ages were determined on the date of the next year following the treatment
date and divided into four groups, namely: young adults (>18 and ≤30 years); older adults
(>30 and ≤45 years and >45 and ≤65 years); and the elderly (>65 years).
Fluoroquinolones were defined as all active substances available in South Africa at the time of
the study, belonging to the J01MA classification of the ATC index. Data obtained included the
NAPPI (National Pharmaceutical Product Index) code (a unique product identifier), the number
of dosages dispensed and the number of days’ supply. The data obtained were expressed in
DDD/1000 inhabitants/day. This was done by determining the total amount of the drug
dispensed (in grams), divided by the defined daily doses (DDD) (WHO, version 2013) 19

124
conversion factor and the population (using the total number of beneficiaries covered by the
medical aid schemes registered under the PBM company during the study period, as
denominator for each respective year) to obtain the results in DDD-inhabitants/year. The
DDD/inhabitants/year was then divided by 365 days and multiplied by 1 000, to obtain the
DDD/1000 inhabitants/day. 20 The average DDD per prescription per patient per year was also
determined to describe the trends over the study period. To enable comparison of
fluoroquinolone use, active substances were divided into the three generations, as proposed by
Ball, 21 who took into account their expanded antimicrobial spectrum and clinical indications.
Data were analysed using SAS version 9.3 software. 22 Statistically significant results were
considered with a probability of p < 0.05. The practical significance of results was computed
when the p-value was statistically significant (p ≤ 0.05). A two-sample independent t-test was
used to compare the average number of fluoroquinolone prescriptions per patient per year by
gender. A one-way ANOVA, operationalised with the general linear model (GLM) procedure,
was used to test differences between the average number of fluoroquinolone prescriptions per
patient per year, between the different age groups. Tukey’s multiple comparison test was
performed to determine which groups differ statistically significantly from each other. Cohen's
d-value was used to test the practical significance of the difference in means between two
groups (with d ≥ 0.8 defined as a large effect with practical significance). A chi-square test (χ2)
was used to determine the association between the prevalence of fluoroquinolone prescriptions
and gender and different age groups stratified by the study period. Cramer’s V statistic was
used to test the practical significance of these associations (with Cramer’s V ≥ 0.5 defined as
practically significant).

125
This study was approved by the Ethics Committee of the North-West University (ethics
application number NWU-0046-08-550) and the board of directors of the South African
Pharmaceutical Benefit Management Company (PBM).
Results
Fluoroquinolone use by study population
During the study period, 36.9% (n = 1 397 960) of the total number of patients who claimed
antibiotic prescriptions represented patients who claimed at least one fluoroquinolone
prescription. A total of 1 983 622 fluoroquinolone prescriptions and 1 998 552 fluoroquinolone
agents were claimed during the study period. The average number of fluoroquinolone
prescriptions per patient per year ranged from 1.45 ± 0.92 (95% CI 1.44 - 1.45) in 2005 to 1.31
± 0.71 (95% CI 1.31 - 1.32) in 2012.
The prevalence of males who received fluoroquinolone prescriptions as a percentage of the
total number of patients who received fluoroquinolone prescriptions increased from 38.2% (n =
77 009) in 2005 to 42.3% (n = 51 330) in 2012 compared to a decreasing trend in females
(Table 1). The highest prevalence of fluoroquinolone prescriptions was observed in the age
group 45 to 65 years, increasing from 34.8% (n = 69 991) in 2005 to 37.1% (n = 45 087) in
2012. No practically significant association was found between the prevalence of
fluoroquinolone prescriptions and gender (p < 0.0001, Cramer’s V = 0.02) or age group (p <
0.0001, Cramer’s V = 0.04) during the study period.
See table 1

126
Average DDD per prescription per patient
Table 2 provides the average DDD per prescription per patient per year for the various
fluoroquinolones prescribed during the study period. Though statistically significant
differences were found for most fluoroquinolones prescribed, it was not practically significant
(Cohen’s d-value ≤ 0.42).
See table 2
Fluoroquinolone use by generation
Figure 1 shows the compositional trends in fluoroquinolone use by the three generations from
2005 to 2012, expressed in DDD/1000 inhabitants/day (DID). The results show an increasing
trend in total fluoroquinolone use from 2.84 DID in 2005 to 3.69 DID in 2007, followed by a
decreasing trend from 3.57 DID in 2008 to 2.41 DID in 2012. The second generation
fluoroquinolones were the most used throughout the study period, followed by the third
generation fluoroquinolones.
Table 3 provides the relative use of fluoroquinolones according to the three generations at the
chemical substance level from 2005 to 2012. Norfloxacin was the only first-generation
fluoroquinolone; its utilisation decreased from 0.17 DID in 2005 to 0.07 DID in 2012. The
most used second-generation fluoroquinolone was ciprofloxacin. Its use ranged from 1.30 DID
in 2005 to 1.19 DID in 2012. This was followed by levofloxacin, which increased from 0.46
DID in 2005 to 0.67 DID in 2012; however, peaking at 1.04 DID in 2009. Enoxacin was the
least prescribed second-generation fluoroquinolone. It was prescribed from 2005 (0.0005 DID)
to 2007 (0.0003 DID). Moxifloxacin accounted for the most used third-generation
fluoroquinolone during the study period. Its use decreased from 0.51 DID in 2005 to 0.44 DID

127
in 2012. The use of gatifloxacin decreased over the study period from 0.19 DID in 2005 to
0.001 DID in 2008, making moxifloxacin the only third-generation fluoroquinolone being
prescribed from 2009 to 2012 at a prevalence percentage of 100%.
See Fig. 1
See Table 3
Discussion
This study shows the annual trend in fluoroquinolone use in a part of the private health sector
of South Africa. Contrary to other studies, our findings showed overall fluoroquinolone use
decreasing over the study period. In a study by Adriaenssens et al., 7 most European countries
showed an increasing trend in the use of fluoroquinolones from 1997 to 2009, where the
highest use was observed in Italy. Wirtz et al. 14 also reported an increasing trend in
fluoroquinolone use from 1997 to 2007 in eight Latin American countries, with the highest use
in Venezuela. In the United States, Linder et al. 13 reported a 200% increase in fluoroquinolone
prescribing from 1995 to 2002. However, in a recent report by Public Health England, 23 total
quinolone use from the community and hospitals decreased from 0.61 DID in 2011 to 0.58
DID in 2013. This decreasing trend was attributed to a decline in Clostridium difficile and
methicillin-resistant Staphylococcus aureus (MRSA) infections.23
The first-generation fluoroquinolones, e.g. norfloxacin, are often used to treat urinary tract
infections, whereas the second and third generations are mostly indicated for both respiratory
and urinary tract infections. 21 Similar to trends in several European countries, we observed a
decreasing trend in the use of the first-generation fluoroquinolone (predominantly norfloxacin)
over the study period.7, 8 In their study, Adriaenssens and colleagues7 attributed this trend in

128
European countries to emerging resistance. Due to a lack of clinical/diagnostic data, these
prescribing trends in our study population could not be verified.
The second-generation fluoroquinolones accounted for at least 75% of the total DID in each
year. This trend confirms findings from studies done in Tanzania, 24 Europe, 7, 8 the United
States 13, 25 and South America. 14 Ciprofloxacin alone accounted for more than 50% of the
total DID in this generation; however, its relative use began to decrease from 2008. Since the
1990s, ciprofloxacin had been used for the syndromic management of gonococci infections
until 2003, when there was a rapid emergence of ciprofloxacin-resistant gonococci strains in
South Africa. 26 To address the problem, the national guidelines for the treatment of gonococci
infections were revised in 2008; making cefixime (oral or intramuscular) the drug of choice. 27,
28 With more than 50% of gonococci cases managed by the private sector, 27 this change in
guidelines may explain the decreasing trend in ciprofloxacin prescribing practices from 2008.
It is, however, considered the first-line drug for typhoid fever and Shigella infections, 21 which
are also considered health risks in South Africa. 28
The average number of DDDs per prescription per patient for levofloxacin was observed to
increase across the study period. Levofloxacin is recommended in South Africa for use in the
treatment of lower respiratory tract infections, e.g. community acquired pneumonia, in
adults.29, 30 Since the number of DDDs is directly influenced by the quantity supplied, 20 the
observed possibly indicates a longer duration of therapy. A study by Schein et al. 31 showed
that the use of levofloxacin in the treatment of community acquired pneumonia compared to
moxifloxacin was more advantageous. Treatment with levofloxacin was associated with
shorter hospital days and lower costs, although others report the contrary with regard to better

129
safety and speed of clinical recovery with moxifloxacin. 32, 33 Pharmaceutical companies
enhance the advertising of their drugs before patent expiry to optimise earnings as the generic
brands invade the market. 34 The observed increase in use of levofloxacin in 2009 may be due
to its patent expiry at the end of 2010. 35
Similar to other studies, 7, 8, 13 our study showed that moxifloxacin accounted for the most used
third-generation fluoroquinolone during the study period. Its use in the South African private
health sector is indicated for complicated respiratory tract infections; 29, 30 however, this finding
cannot be linked to the prevalence of respiratory tract infections due to a lack of complete data
regarding diagnoses.
The use of gatifloxacin was observed from 2005 to 2008 in our study. Complaints surrounding
its safety and effectiveness, causing hyperglycaemia in both diabetic and non-diabetic
patients,36 led to the withdrawal of gatifloxacin in 2008 by the Food and Drugs Administration
(FDA) of the United States of America. 37 This may serve as a proxy for prescribers’
compliance to the FDA guidelines.
The prevalence of fluoroquinolone prescriptions was higher in females. Fluoroquinolones are
first-line agents for urinary tract infections in the non-pregnant population in South Africa.6
Females are furthermore found to be more susceptible to urinary tract infections than men are.
Studies have attributed the high incidence of urinary tract infections in women to frequent
sexual intercourse and genetic disposition.38-41 Additionally, antibiotic prescription claim rates
have been found to be higher in females.42, 43 Verbrugge 44 noted in his study that health-
seeking behaviour varied greatly by gender. According to Verbrugge, 44 women are more

130
sensitive to discomfort, more likely to perceive symptoms of an illness and are more eager to
report health-related issues than men.44 Men, on the other hand, are expected by society to
ignore symptoms of diseases to prove their masculinity.44
Several studies on the use of fluoroquinolones indicate a higher prevalence of fluoroquinolone
prescribing in patients 65 years of age, and they indicate that they are mainly used for the
treatment of urinary and lower respiratory tract infections common in this group of patients.10,
45-50 Our study, however, showed that prescribing peaked at an earlier age in patients between
45 and 65 years. These prescribing trends could, however, not be verified in the absence of the
patient’s diagnosis.
Conclusion
From the study, fluoroquinolone use has generally decreased in the private health sector of
South Africa. The relative increase in the use of levofloxacin may be an indication of the
prevalence of complicated respiratory tract infections.29, 30 Interventions to reduce
ciprofloxacin-resistant gonococci from 2008 26, 27 appear to be effective with reference to the
decreased ciprofloxacin prescribing patterns over the study period.
Measuring and displaying information on the use of drugs to prescribers, patients and policy-
makers are deemed as the first step in creating awareness for rational drug use. 51 The ATC
classification and the DDD unit of measurement have also created a platform to compare use
levels at different settings and different geographic locations. 20 We recommend that further
studies be conducted in other parts of the private or public health sector of South Africa to
compare use and help define desirable levels of use.

131
A limitation to this study was the inability to correlate fluoroquinolone use with diagnoses on
the database, as data fields on diagnoses were incomplete. We are also not certain whether
fluoroquinolones dispensed were actually consumed by patients and consequently may not
reflect actual total fluoroquinolone use in the population. Finally, the data used represent only a
section of patients registered as beneficiaries of medical schemes in South Africa.
However, to the best of our knowledge, this is the first study to be conducted measuring
fluoroquinolone use according to the ATC/DDD classification system utilising medicine claims
data in South Africa. The South African private health sector has coverage of approximately
20% of the country’s population, especially for those in employment. Medical aid schemes
remain the main means of financing in the South African private health sector. The PBM
Company processes approximately 300 000 real-time and 30 000 doctor transactions daily. The
reliability and validity of the data are ensured by gate-keeping services, eligibility services,
utilisation management services, clinical management services and pricing management along
with real-time benefit management.
Acknowledgements
We thank Ms Anne-Marie Bekker for administrative support regarding the database. The
authors acknowledge the North-West University (Potchefstroom Campus) and INTRA-ACP
Mobility Scheme for financial support.
Funding
This work was supported by the intra-ACP (African, Caribbean and Pacific) regions academic
mobility scheme and the National Research Foundation (NRF).

132
Transparency declaration
None to declare.

133
References
1. World Health Organisation (WHO). Combat antimicrobial resistance – World Health Day
2011. http://www.who.int/world-health-day/2011/WHD201_FS_EN.pdf.
2. Lodato EM. Updates on 2004 background paper, BP 6.1 antimicrobial resistance.
http://www.who.int/medicines/areas/priority_medicines/BP6_1AMR.pdf.
3. Amyes SGB. Magic bullets, lost horizons: the rise and fall of antibiotics. London: Taylor
& Francis, 2003.
4. Domagala JM. Structure-activity and structure-side-effect relationship for the quinolone
antibacterial. J Antimicrob Chemother 1994; 33: 685-706.
5. Norris S, Mandell GL. The quinolones: history and overview. In: Andriole VT, ed. The
Quinolones. London: Academic Press, 1988; 1-14.
6. South Africa Department of Health. Standard treatment guidelines and essential medicines
list – Third Edition. Pretoria: The National Department of Health, 2012.
7. Adriaenssens N, Coenen S, Versporten A et al. European Surveillance of Antimicrobial
Consumption (ESAC): outpatient antibiotic use in Europe (1997–2009). J Antimicrob
Chemother 2011; 66 Suppl 6: S3-S12.
8. Ferech M, Coenen S, Malhotra-Kumar S et al. European surveillance of antimicrobial
consumption: outpatient quinolone use in Europe. J Antimicrob Chemother 2006; 58: 423-
7.
9. Goossens H, Ferech M, Van der Stichele R et al. Outpatient antibiotic use in Europe and
association with resistance: a cross-national database study. Lancet 2005; 365: 579-87.
10. Muller-Pebody B, Muscat M, Pelle B et al. Increase and change in pattern of hospital
antimicrobial use, Denmark, 1997-2001. J Antimicrob Chemother 2004; 54: 1122-26.
11. Kotwani A, Holloway K, Chaudhury RR. Methodology for surveillance of antimicrobials
use among outpatients in Delhi. Indian J Med Res 2009; 129: 555-60.

134
12. Chandy SJ, Thomas K, Mathai E et al. Patterns of antibiotic use in the community and
challenges of antibiotic surveillance in a lower-middle-income setting: a repeated cross-
sectional study in Vellore, South India. J Antimicrob Chemother 2013; 68: 229-36.
13. Linder JA, Huang ES, Steinmann MA et al. Fluoroquinolone prescribing in the United
States, 1995 – 2005. Am J Med 2005; 118: 259-68.
14. Wirtz VJ, Dreser A, Gonzales R. Trends in antibiotic utilization in eight Latin American
countries. Rev Panam Salud Publica 2010; 27: 219-25.
15. Austin JD, Kristinsson KG, Anderson RM. The relationship between the volume of
antimicrobial consumption in human consumption and the frequency of resistance. Proc
Nat Acad Sci USA 1999; 96: 1152-6.
16. Laxminayaran R, Brown GM. Economics of antibiotic resistance: a theory for optimal use.
J Environ Eco 2001; 42: 183-206.
17. Levy SB. Antibiotic resistance: an ecological imbalance. Ciba Found Symp 1997; 207: 1-
9.
18. WHO (World Health Organization). Antimicrobial resistance global report on
surveillance. Geneva: WHO, 2014.
19. WHO (World Health Organization). WHO Collaborating Centre for Drug Statistics
Methodology. Guidelines for ATC classification and DDD assignment 2013. Oslo: WHO.
http://www.whocc.no/atc_ddd_publications/guidelines/.
20. Hutchinson JM, Patrick DM, Marra F et al. Measurement of antibiotic consumption: a
practical guide to the use of the anatomical therapeutic chemical classification and defined
daily dose system methodology in Canada. Can J Infect Dis 2004; 15: 29-35.
21. Ball P. Quinolone generation: natural history or natural selection. J Antimicrob Chemother
2000; 46: 17-24.
22. SAS Institute Inc. SAS for windows 9.3. Cary: North Carolina, 2012.

135
23. Public Health England. English surveillance programme for antimicrobial utilisation and
resistance (EUPAUR) report 2014. London: Public Health England, 2014.
https://www.gov.uk/government/uploads/system/uploads/attachment_data/file/362374/ESP
AUR_Report_2014__3_.pdf.
24. Van de Boogaard J, Semvua HH, Boeree MJ et al. Sale of fluoroquinolone in northern
Tanzania: a potential threat for fluoroquinolone use in tuberculosis treatment. J Antimicrob
Chemother 2010; 65: 145-7.
25. Goossens H, Ferech M, Coenen S et al. Comparison of outpatient system antibacterial use
in 2004 in the United States and 27 European countries. Clin Infect Dis 2007; 44: 1091-5.
26. Lewis, DA. Antibiotic-resistant gonococci – past, present and future. S Afr Med J 2007;
97: 1146-50.
27. Crowther-Gibson P, Govender N, Lewis DA et al. Human infections and antibiotic
resistance. S Afr Med J 2011; 101: 567-78.
28. National Institute for Communicable Disease. GERM-SA annual report 2013.
http://www.nicd.ac.za/assets/files/GERMS-SA%20AR%202013.pdf.
29. Working Group of the Infectious Diseases Group in Southern Africa. Updated guideline for
the management of upper respiratory tract infections in South Africa: 2008. South Afr J
Epidemiol Infect 2008; 23: 27-40.
30. Working Group of the South African Thoracic Society. Management of community-
acquired pneumonia in adults. S Afr Med J 2007; 97: 1296-1306.
31. Schein J, Janaqap-Benson C, Grant R et al. A comparison of levofloxacin and moxifloxacin
use in hospitalised community-acquired pneumonia (CAP) patients in the U.S: focus on
length of stay. Cur Med Res Opin 2008; 24: 895-906. doi: 10.1185/030079908X273408.
136
32. Anzueto A, Niederman MS, Pearle J et al. Community-Acquired Pneumonia Recovery in
the Elderly (CAPRIE): efficacy and safety of moxifloxacin therapy versus that of
levofloxacin therapy. Clin Infect Dis 2006; 42: 73-81.
33. Urueata-Robledo J, Ariza H, Jardin JR et al. Moxifloxacin versus levofloxacin against
acute exacerbation of chronic bronchitis: the Latin American cohort. Respir Med 2006;
100: 1504-11.
34. Method K. Going, going, gone: patents set to expire soon on many brand-name drugs.
http://drugtopics.modernmedicine.com/drug-topics/news/modernmedicine/modern-
medicine-feature-articles/going-going-gone?id=&sk=&date=&pageID=2.
35. DeRuiter J, Holston P. Drug patent expirations and the “patent cliff”.
http://www.uspharmacist.com/content/s/216/c/35249/
36. Baker J, Wolfe S, Lurie P. Petition to ban the antibiotic gatifloxacin (Tequin).
http://www.citizen.org/Page.aspx?pid=919.
37. Department of Health and Human Services. Food and Drugs Administration.
Determination that TEQUIN (Gatifloxacin) was withdrawn from sale for reasons of safety
or effectiveness http://www.gpo.gov/fdsys/pkg/FR-2008-09-09/pdf/E8-20938.pdf.
38. Fihn SD, Boyko EJ, Normand EH et al. association between the use of spermicide-coated
condoms and Escherichia coli urinary tract infections in young women. Am J Epidemiol
1996; 144: 512-20.
39. Hooton TM, Scholes D, Hughes JP et al. A prospective study of risk factors for
symptomatic urinary tract infections in young women. N Engl J Med 1996; 335: 468-74.
40. Lindsay EN. Epidemiology of urinary tract infections. Clinical Microbiology Letter 2002;
24: 135-140.
41. Foxman B. Epidemiology of urinary tract infections: incidence, morbidity and economic
costs. Am J Med 2002; 113(Suppl 1A): 5S-13S.

137
42. Griebling TL. Urologic diseases in American project: trends in resources use for urinary
tract infections in men. J Urol 2005; 173: 1288-94.
43. Anthony M, Lee KY, Betram CT et al. Gender and age difference in medications dispensed
from a national chain drug store. J Women’s Health 2008; 17: 735-43.
44. Verbrugge LM. Sex differentials in health. Public Health Rep 1982; 975: 417-37.
45. Gallini A, Taboulet F, Bourrel R. Regional variation in quinolone use in France and
associated factors. Eur J Clin Microbiol Infect Dis 2012; 31: 2911-18.
46. Litwin MS, Saigal CS. Urological diseases in America 2012.
http://urology.ucla.edu/workfiles/Research/UDA_2012_Compendium.pdf.
47. Majeed A, Moser K. Age- and sex- specific antibiotic prescribing patterns in general
practice in England and Wales in 1996. Br J Gen Pract 1999; 49: 735-6.
48. Blix HS, Engeland A, Litleskare I et al. Age- and gender-specific antibacterial prescribing
in Norway. J Antimicrob Chemother 2007; 59: 971-76.
49. Lallana-Alvarez MJ, Feja-Solana C, Armesto-Gomez J et al. Outpatient antibiotic
prescription in Aragon and the differences by age and gender. Enferm Infecc Microbiol
Clin 2012; 30: 591-6.
50. Franchi C, Sequi M, Bonati M et al. Differences in outpatient antibiotic prescription in
Italy’s Lombardy region. Infection 2011; 39: 299-308.
51. WHO (World Health Organization). Integrated surveillance of antimicrobial resistance: a
guide from a WHO advisory group. Geneva: WHO, 2013.
http://apps.who.int/iris/bitstream/10665/91778/1/9789241506311_eng.pdf.

138
Table 1 Distribution of patients claiming antibiotics and fluoroquinolone prescriptions (2005 – 2012)
Study period 2005 2006 2007 2008 2009 2010 2011 2012 Total
Patients receiving
antibiotics 557 115 572 869 482 765 404 081 525 915 478 687 405 655 361 351 3 788 438
Total antibiotic
prescriptions in
database
1 242 363 1 326 908 1 129 517 928 025 1 139 019 1 013 183 818 014 714 897 7 069 563
Total antibiotic items
in database 1 326 540 1 414 867 1 204 414 990 619 1 213 292 1 076 935 870 423 766 350 1 326 540
Fluoroquinolone
prescriptions 291 316 314 089 280 230 224 325 278 096 247 793 188 125 159 648 1 983 622
Fluoroquinolone
agents prescribed 293 251 316 046 282 219 226 161 280 463 249 928 189 582 160 902 1 998 552
Average prescription
per patient per year
± SD (95% CI)
1.45 ± 0.92
(1.44 – 1.45)
1.46 ± 0.92
(1.45 – 1.46)
1.47 ± 0.93
(1.47 – 1.48)
1.45 ± 0.90
(1.44 – 1.45)
1.41 ± 0.85
(1.41 – 1.42)
1.40 ± 0.833
(1.39 – 1.40)
1.36 ± 0.74
(1.33 – 1.34)
1.31 ± 0.71
(1.31 – 1.32)
Patients claiming
fluoroquinolones, n
(%)a
201 359 (36.1) 214 990 (37.5) 190 509 (39.5) 154 799(38.3) 196 646 (37.3) 177 481(37.1) 140 754 (34.7) 121 422 (33.6) 1 397 960
Gender, n (%)b p – value
Female 124 193 (61.7) 132 502 (61.6) 117 093 (61.5) 95 366 (61.6) 119 219 (60.6) 107 331 (60.5) 84 458 (60.0) 70 091 (57.7) 850 253
< 0.0001 Male 77 009 (38.2) 82 382 (38.3) 73 380 (38.5) 59 433 (38.4) 77 427 (39.4) 70 150 (39.5) 56 296 (40.0) 51 330 (42.3) 547 407
Unidentified 157 (0.08) 106 (0.05) 36 (0.02) - - - - 1 (0.00001) 300
Age groups, n (%)b
> 18 and ≤ 30 years 28 506 (14.2) 31 842 (14.8) 28 206 (14.8) 20 740 (13.4) 31 918 (16.2) 28 364 (16.0) 22 098 (15.7) 18 931 (15.6) 210 605
< 0.0001 > 30 and ≤ 45 years 71 571 (35.5) 73 872 (34.4) 61 478 (32.3) 45 486 (29.4) 57 319 (29.1) 50 061 (28.2) 39 778 (28.3) 34 613 (28.5) 434 170
> 45 and ≤ 65 years 69 991 (34.8) 76 594 (35.6) 70 090 (36.8) 61 131 (39.5) 72 644 (36.9) 65 004 (36.6) 51 001 (36.2) 45 087 (37.1) 511 542
> 65 years 31 291 (15.4) 32 682 (15.2) 30 735 (16.1) 27 442 (17.7) 34 765 (17.7) 34 052 (19.2) 27 877 (19.8) 22 791 (18.8) 241 635
a Percentages were calculated according to the total number of patients claiming antibiotics in each respective year
b Percentages were calculated according to the total number of patients claiming fluoroquinolones in each respective year
SD – standard deviation, CI – confidence interval, where p < 0.0001, Cramer’s V < 0.5
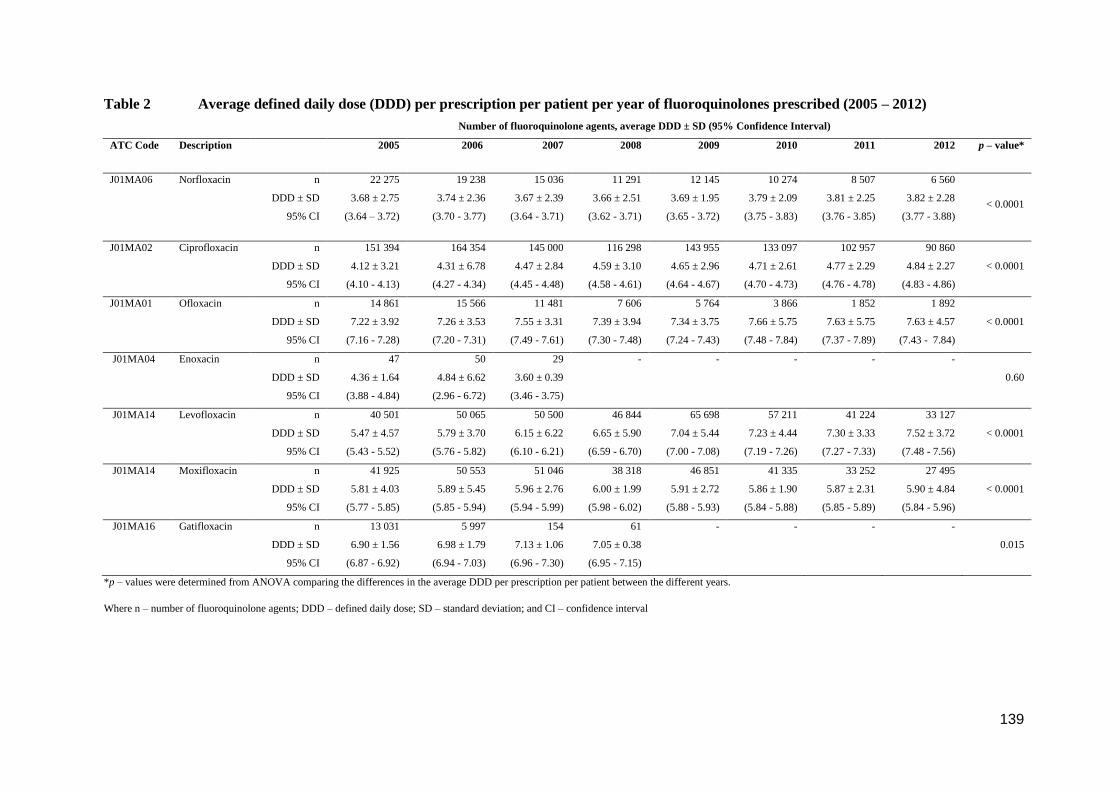
139
Table 2 Average defined daily dose (DDD) per prescription per patient per year of fluoroquinolones prescribed (2005 – 2012)
Number of fluoroquinolone agents, average DDD ± SD (95% Confidence Interval)
ATC Code Description 2005 2006 2007 2008 2009 2010 2011 2012 p – value*
J01MA06 Norfloxacin n
DDD ± SD
95% CI
22 275
3.68 ± 2.75
(3.64 – 3.72)
19 238
3.74 ± 2.36
(3.70 - 3.77)
15 036
3.67 ± 2.39
(3.64 - 3.71)
11 291
3.66 ± 2.51
(3.62 - 3.71)
12 145
3.69 ± 1.95
(3.65 - 3.72)
10 274
3.79 ± 2.09
(3.75 - 3.83)
8 507
3.81 ± 2.25
(3.76 - 3.85)
6 560
3.82 ± 2.28
(3.77 - 3.88) < 0.0001
J01MA02 Ciprofloxacin n
DDD ± SD
95% CI
151 394
4.12 ± 3.21
(4.10 - 4.13)
164 354
4.31 ± 6.78
(4.27 - 4.34)
145 000
4.47 ± 2.84
(4.45 - 4.48)
116 298
4.59 ± 3.10
(4.58 - 4.61)
143 955
4.65 ± 2.96
(4.64 - 4.67)
133 097
4.71 ± 2.61
(4.70 - 4.73)
102 957
4.77 ± 2.29
(4.76 - 4.78)
90 860
4.84 ± 2.27
(4.83 - 4.86)
< 0.0001
J01MA01 Ofloxacin n
DDD ± SD
95% CI
14 861
7.22 ± 3.92
(7.16 - 7.28)
15 566
7.26 ± 3.53
(7.20 - 7.31)
11 481
7.55 ± 3.31
(7.49 - 7.61)
7 606
7.39 ± 3.94
(7.30 - 7.48)
5 764
7.34 ± 3.75
(7.24 - 7.43)
3 866
7.66 ± 5.75
(7.48 - 7.84)
1 852
7.63 ± 5.75
(7.37 - 7.89)
1 892
7.63 ± 4.57
(7.43 - 7.84)
< 0.0001
J01MA04 Enoxacin n
DDD ± SD
95% CI
47
4.36 ± 1.64
(3.88 - 4.84)
50
4.84 ± 6.62
(2.96 - 6.72)
29
3.60 ± 0.39
(3.46 - 3.75)
- - - - -
0.60
J01MA14 Levofloxacin n
DDD ± SD
95% CI
40 501
5.47 ± 4.57
(5.43 - 5.52)
50 065
5.79 ± 3.70
(5.76 - 5.82)
50 500
6.15 ± 6.22
(6.10 - 6.21)
46 844
6.65 ± 5.90
(6.59 - 6.70)
65 698
7.04 ± 5.44
(7.00 - 7.08)
57 211
7.23 ± 4.44
(7.19 - 7.26)
41 224
7.30 ± 3.33
(7.27 - 7.33)
33 127
7.52 ± 3.72
(7.48 - 7.56)
< 0.0001
J01MA14 Moxifloxacin n
DDD ± SD
95% CI
41 925
5.81 ± 4.03
(5.77 - 5.85)
50 553
5.89 ± 5.45
(5.85 - 5.94)
51 046
5.96 ± 2.76
(5.94 - 5.99)
38 318
6.00 ± 1.99
(5.98 - 6.02)
46 851
5.91 ± 2.72
(5.88 - 5.93)
41 335
5.86 ± 1.90
(5.84 - 5.88)
33 252
5.87 ± 2.31
(5.85 - 5.89)
27 495
5.90 ± 4.84
(5.84 - 5.96)
< 0.0001
J01MA16 Gatifloxacin n
DDD ± SD
95% CI
13 031
6.90 ± 1.56
(6.87 - 6.92)
5 997
6.98 ± 1.79
(6.94 - 7.03)
154
7.13 ± 1.06
(6.96 - 7.30)
61
7.05 ± 0.38
(6.95 - 7.15)
- - - -
0.015
*p – values were determined from ANOVA comparing the differences in the average DDD per prescription per patient between the different years.
Where n – number of fluoroquinolone agents; DDD – defined daily dose; SD – standard deviation; and CI – confidence interval

140
Table 3 Trends in fluoroquinolone use expressed in DDD/1000 inhabitants-days (2005 – 2012)
DDD/1000 inhabitant-days (DID), n (%)*
Generation ATC Code Description 2005 2006 2007 2008 2009 2010 2011 2012
1st J01MA06 Norfloxacin 0.17 (6.0) 0.14 (4.6) 0.14 (3.8) 0.13 (3.6) 0.10 (3.0) 0.09 (2.8) 0.09 (3.3) 0.07 (2.9)
2nd J01MA02 Ciprofloxacin 1.30 (45.8) 1.42 (46.4) 1.70 (45.7) 1.63 (45.7) 1.51 (44.7) 1.48 (46.5) 1.29 (47.6) 1.19 (49.4)
J01MA04 Enoxacin 0.0004 (0.01) 0.0005 (0.02) 0.0003 (0.01) - - - - -
J01MA14 Levofloxacin 0.46 (16.2) 0.58 (19.0) 0.82 (22.2) 0.95 (26.6) 1.04 (30.8) 0.97 (30.5) 0.79 (29.2) 0.67 (27.6)
J01MA01 Ofloxacin 0.22 (7.7) 0.23 (7.5) 0.23 (6.2) 0.17 (4.8) 0.10 (3.0) 0.07 (2.2) 0.04 (1.5) 0.04 (1.7)
3rd J01MA16 Gatifloxacin 0.19 (6.7) 0.08 (2.6) 0.003 (0.1) 0.001 (0.03) - - - -
J01MA14 Moxifloxacin 0.51 (18.0) 0.60 (19.6) 0.80 (21.7) 0.70 (19.6) 0.62 (18.3) 0.57 (17.9) 0.51 (18.8) 0.44 (18.3)
Total 2.84 (100.0) 3.06 (100.0) 3.69 (100.0) 3.57 (100.0) 3.38 (100.0) 3.18 (100.0) 2.71 (100.0) 2.41 (100.0)
*Percentages were calculated according to the total DID in each respective year

141
Figure 1 Fluoroquinolone use by generations (2005 – 2012)
0.00
0.50
1.00
1.50
2.00
2.50
3.00
3.50
4.00
2005 2006 2007 2008 2009 2010 2011 2012
DD
D/1
00
0 in
hab
itan
st-d
ays
Study period (y)ear
3rd generation
2nd generation
1st generation

142
3.4 Manuscript three
Prescribing patterns of fluoroquinolones in children and adolescents in the private health
sector of South Africa (2005-2012)
Winifred E Agyakwa1 (BPharm), Martie S Lubbe1§ (PhD), Johanita R Burger1 (PhD), Norah L
Katende-Kyenda2 (PhD), Marike Cockeran1 (MSc)
1 Medicine Usage in South Africa, Faculty of Health Sciences, North-West University,
Potchefstroom Campus, Potchefstroom.
2 Department of Pharmacology, School of Medicine, Walter Sisulu University, Nelson
Mandela Drive Campus, Mthatha.
Corresponding author
§Martie S Lubbe, Medicine Usage in South Africa (MUSA), School of Pharmacy, North-West
University, Potchefstroom, 2520, South Africa.
Email: [email protected]
Keywords: fluoroquinolones, children, prescribers, prescription claims database, use, trends,
South Africa

143
SUMMARY
What is known and objective
The fluoroquinolones represent major clinical advancements; however, their use in patients 18
years and younger has been limited due to associated arthropathy and tendinopathy. There is
limited data on fluoroquinolone use in children in South Africa. The aim of this study was to
determine the prevalence of fluoroquinolone outpatient prescribing in patients 18 years and
younger from 2005 to 2012 in a section of the South African private health sector.
Method
Prescription data on outpatient fluoroquinolone (J01MA) use at the active ingredient level in
patients 18 years and younger were collected from a nationally representative prescription
claims database from 2005 to 2012. Fluoroquinolone prescribing was analysed based on age
groups, gender and prescribers’ speciality.
Results
Between 2005 and 2012, a total of 57 325 prescriptions for fluoroquinolones were claimed by
the study population. The prevalence of patients receiving at least one fluoroquinolone
prescription decreased from 3.6% (n = 8 329) in 2005 to 2.9% (n = 3 310) in 2012.
Fluoroquinolones were mostly prescribed to females and to patients between 12 and 18 years
(p < 0.0001, Cramer’s V < 0.5 for both trends). Prescribing in all the age groups was mainly
done by general medical practitioners (p < 0.0001, Cramer’s V ≤ 0.30). In all the age groups,
ciprofloxacin was the most prescribed fluoroquinolone, followed by levofloxacin.
What is new and conclusion
Fluoroquinolone prescribing was evident in all age groups during the study period. Overall,

144
fluoroquinolone prescribing decreased by 0.7% from 2005 to 2012. The specialty of the
prescriber was found to influence the prevalence of fluoroquinolone prescribing in all age
groups during the study period.

145
What is known and objective
The use of fluoroquinolones in patients 18 years and younger has raised scepticisms in the field
of medicine, limiting their use.1, 2 Although fluoroquinolones in pre-clinical studies were found
to induce changes in the immature articular cartilage of the weight-bearing joints, 3, 4 there have
been reports of fluoroquinolone use in paediatric patients.5, 6 The use of fluoroquinolones in
paediatrics has been limited to specific cases where prescribers’ judgements on weighing the
benefits against the risks are highly crucial.7 In the United States, more than eight million
prescriptions for ciprofloxacin were issued to patients younger than 18 years in 1996.5 In 2002,
520 000 prescriptions for fluoroquinolones were issued to children, although only ciprofloxacin
was approved by the FDA for inhalational anthrax.6
Over the past three decades, the favourable clinical outcomes of fluoroquinolones have
gradually shifted from ‘compassionate use’8 to ‘first-line’ drugs in certain clinical conditions.9
Numerous studies have indicated excellent cure rates with little or no incidence of arthralgia in
children.10-18 In 2006, the Committee on Infectious Diseases (CID) in the United States6
approved the use of fluoroquinolones in children younger than 18 years in infections caused by
multi-drug resistant (MDR) pathogens for which there are no safer and effective alternatives.
Fluoroquinolones are also recommended when therapies by parenteral route are not possible
and there are no other agents available.6 Furthermore, fluoroquinolones are approved for the
following indications: treatment of inhalational anthrax; urinary-tract infections and chronic
pus-producing otitis media or malignant otitis externa caused by Pseudomonas aeruginosa or
MDR pathogens; life-threatening infections caused by fluoroquinolone-susceptible bacteria in
children who are allergic to safer alternate treatments; and documented bacterial septicaemia or
meningitis caused by bacteria with in vitro resistance to approved therapy.6

146
In South Africa, levofloxacin, moxifloxacin and ofloxacin are second-line agents in the
management of MDR tuberculosis; 19, 20 ciprofloxacin is recommended for the treatment of
pulmonary exacerbation in cystic fibrosis21 and gastro-intestinal infections caused by Shigella,
Salmonella typhi and Vibrio cholerae.20 However, little data exist on the use of
fluoroquinolone in children and adolescents in clinical practice. The aim of this study was to
determine the prevalence of fluoroquinolone prescribing in patients 18 years and younger from
2005 to 2012 in a section of the South African private health sector.
Method
A retrospective drug utilisation study was used to investigate the use of fluoroquinolone agents
in patients 18 years and younger in a section of the private health sector of South Africa. The
data were obtained from a South African Pharmaceutical Benefit Management (PBM)
company. Fluoroquinolones were defined as all active substances belonging to the J01MA
classification of the ATC index. The study population comprised 1 366 824 children and
adolescents aged 18 years and younger who claimed at least one antibiotic prescription.
Variables
The prevalence of fluoroquinolone prescribing was analysed based on age, gender and
prescriber speciality. Patients’ ages were determined on the date of the next year following the
treatment date and divided into three groups: ≥0 and ≤5 years; >5 and ≤12 years and >12 and
≤18 years. The specialities of prescribers were grouped into five main categories, namely
general practitioners, paediatricians, specialists (e.g. oncologists, cardiologists, urologists,
neurologists, obstetricians/gynaecologists), pharmacotherapists and others (e.g. dentists and

147
dermatologists) to determine the prevalence of fluoroquinolone prescribing by prescriber in the
different age groups.
Statistical analyses
Basic descriptive statistics were used to describe the study population. Data were analysed
using SAS software, version 9.3.22 Statistically significant results were considered with a
probability of p < 0.05. The practical significance of results was computed when the p-value
was statistically significant (p ≤ 0.05). A two-sample independent t-test was used to compare
the average number of fluoroquinolone prescriptions per patient per year by gender. The chi-
square test (χ2) was used to determine the association between the prevalence of
fluoroquinolone prescriptions and gender; between the different age groups; and the
prescribers’ specialty stratified by the study period. Cramer’s V statistic was used to test the
practical significance of these associations (with Cramer’s V ≥ 0.5 defined as practically
significant).
Ethics
This study was approved by the Ethics Committee of the North-West University (NWU-0046-
08-550) and the board of directors of the South African Pharmaceutical Benefit Management
Company (PBM). Data privacy and confidentiality were maintained at all times; therefore, no
patient or medical scheme/administrator could be traced. Additionally, it was not possible to
determine which prescribers or providers (i.e. name of the prescriber/provider) were involved
in the prescribing/dispensing of the medicine items. The PBM providing the data for the study
is furthermore nowhere identified in this study. The researcher, study promoter and co-
promoter furthermore signed confidentiality agreements.

148
Results
Fluoroquinolone use by study population
A total of 49 540 patients, 18 years and younger, received at least one prescription for a
fluoroquinolone during the study period, representing 3.6% of the total number of patients
claiming antibiotic prescriptions (Table 1). The percentage of patients receiving
fluoroquinolone prescriptions decreased from 3.6% (n = 8 329) in 2005 to 2.9% (n = 3 310) in
2012; however, peaking at 4.4% (n = 5 697) in 2008 (Table 1). Overall, 57 325
fluoroquinolone prescriptions and 57 593 fluoroquinolone items were claimed. The average
number of fluoroquinolone prescriptions per patient per year ranged from 1.17 ± 0.53 (95% CI
1.16-1.18) in 2005 to 1.12 ± 0.42 (95% CI 1.10-1.13) in 2012. The average number of
fluoroquinolone items per prescription per year remained fairly constant at 1.01 ± 0.07 (95%
CI 1.00-1.01) in 2005 through to 1.00 ± 0.06 (95% CI 1.00-1.01) in 2012.
The prevalence of fluoroquinolone prescriptions was higher in females, ranging from 56.3%
(n = 4 690) in 2005 to 55.8% (n = 1 848) in 2012. The highest prevalence of patients receiving
fluoroquinolone prescriptions was observed in patients between 12 and 18 years, ranging from
80.5% (n = 6 706) in 2005 to 79.5% (n = 2 631) in 2005. The lowest prevalence was observed
in patients five years and younger; however, increasing from 3.1% (n = 261) to 5.3% (n = 175)
in 2012 (Table 1). No practically significant association was found between the prevalence of
patients claiming fluoroquinolone prescriptions by gender (p < 0.0001, Cramer’s V = 0.03) and
in the different age groups (p < 0.0001, Cramer’s V = 0.04) during the study period.
See table 1
149
Fluoroquinolones prescribed in the different age groups
In patients five years and younger, a total of 1 907 fluoroquinolone items were prescribed.
Ciprofloxacin accounted for 87% (n = 1 653) of fluoroquinolones prescribed in this age group,
followed by levofloxacin, representing 8.4% (n = 160) of the total number of fluoroquinolones
prescribed. Moxifloxacin represented 2.1% (n = 41). Gatifloxacin, gemifloxacin, lomefloxacin,
norfloxacin and ofloxacin represented less than 3% of the total fluoroquinolones prescribed
(Table 2).
A total of 7 987 fluoroquinolone items were prescribed in patients between five and 12 years
during the study period. Again, ciprofloxacin was the most prescribed fluoroquinolone,
accounting for 71.7% (n = 5 724) of all fluoroquinolones prescribed in this age group, followed
by levofloxacin and moxifloxacin, representing 7.3% (n = 160) and 7.2% (n = 577),
respectively. Ofloxacin and norfloxacin accounted for 6.7% (n = 536) and 4.5% (n = 359) of
the total number of fluoroquinolones prescribed during the study period (Table 2).
Patients between 12 and 18 years claimed a total of 47 696 fluoroquinolones. Again,
ciprofloxacin was the most prescribed fluoroquinolone representing 62.5% (n = 29 822) of
fluoroquinolones prescribed in this age group. This was followed by levofloxacin and
moxifloxacin, representing 11.9% (n = 5 659) and 11.5% (n = 5 484), respectively. Ofloxacin
and norfloxacin accounted for 5.6% (n = 2 694) and 5.0% (n = 2 374) of the total number of
fluoroquinolones prescribed, respectively. Gemifloxacin accounted for 2.8% (n = 1 322) of the
total number of fluoroquinolones prescribed. Gatifloxacin, lomefloxacin and enoxacin
represented less than 1% of the total number of fluoroquinolones prescribed.
See table 2

150
Fluoroquinolones by prescribers’ speciality
General medical practitioners prescribed the most fluoroquinolones during the study period in
all the age groups compared to paediatricians (Table 3). The least prescribing throughout the
study period was by pharmacotherapists. Though statistically significant, there was no practical
association between the number of fluoroquinolone prescribed and the type of prescriber in the
different age groups during the study period (p < 0.0001, Cramer’s V ≤ 0.30).
See table 3
Discussion
Fluoroquinolone prescribing was most prevalent in patients between 12 and 18 years. Most
fluoroquinolone prescribing was by general medical practitioners in the different age groups.
Ciprofloxacin was the most prescribed fluoroquinolone in all the different age groups during
the study period. In this study, we observed that fluoroquinolone prescribing in patients 18
years and younger generally decreased over the study period.
The high prescription rate by general medical practitioners can be accounted for by the higher
proportion of general medical practitioners than other prescribers in the private health sector of
South Africa;23 therefore, patients are more likely to be attended to by a general medical
practitioner.
Ciprofloxacin was the most prescribed fluoroquinolone in all the age groups. This finding
confirms reports from the United States of America5, 6 and France.24 Our findings may be as a
result of ciprofloxacin being the only fluoroquinolone approved for several indications in the
paediatric population of South Africa.20, 21 Ciprofloxacin is recommended for the treatment of

151
salmonella, Shigella and Vibrio cholerae infections in children.20, 25-29 Diarrhoeal diseases of
bacterial origin accounted for 8% of deaths in 2012.30 In 2005, an outbreak of Salmonella typi
infection with the highest prevalence in children from birth to 19 years occurred in South
Africa.31, 32 Molecular analyses revealed that strains from an earlier epidemic in 1993 were the
same as that which occurred in 2005 and a few subsequent cases in 2007 and 2009.31
Salmonella typhi infections and shigellosis are still prevalent in South Africa and with more
than 95% of strains susceptible to ciprofloxacin, 33 it is the drug of choice for the treatment in
this age group. 20, 25-29 A possible reason for the decrease in ciprofloxacin use during the study
period may be attributed to the decrease in the incidence of Salmonella typhi infections from
200634 to 2012.35 Furthermore, Shigella infection rates decreased from 2.2 cases per 100 000 in
200634 to 0.07 cases per 100 000 in 2012.35 An outbreak of cholera that occurred between
November 2008 and April 2009 in South Africa36 may account for the observed increase in the
use of ciprofloxacin within this period, as ciprofloxacin is the first-line drug in managing
cholera in South Africa in paediatrics.20
Ciprofloxacin is also approved in children for chemoprophylaxis of meningococcal diseases of
bacterial origin in close contact with cases.20, 37 The estimated incidence of meningococcal
meningitis in Africa is 38 cases per 100 000, compared to six cases per 100 000 in Europe.38
Although South Africa is not in the meningitis belt, there have been sporadic cases of the
disease occurring mostly during late winter and early spring.36, 39 High prevalence rates have
been reported in children younger than five years and young adults.39 In 2007, meningococcal
meningitis was a major cause of mortality in children younger than four years.40 The incidence
rate of meningococcal diseases has, however, decreased from 1.16 cases per 100 000 in 200534
to 0.44 cases per 100 000 in 2012 with the introduction of vaccination.35 This trend may also
further explain the general decrease in ciprofloxacin use over the study period.

152
Levofloxacin, moxifloxacin and ofloxacin are recommended for use in the treatment of MDR-
TB.19, 20, 41 However, the majority of tuberculosis cases in South Africa are managed in the
public sector. The use of fluoroquinolones in the private sector cannot be accounted for as data
regarding diagnoses were incomplete.
Our findings further revealed the prescribing of norfloxacin, enoxacin, gemifloxacin,
lomefloxacin and gatifloxacin, which have no approved indications in children by the
Department of Health of South Africa. The reasons for their use are not known as data
concerning diagnoses were incomplete.
A limitation to this study was the inability to correlate fluoroquinolone use with diagnoses as
data on diagnoses were not complete. Additionally, the data used represent only a section of
patients registered as beneficiaries of medical schemes in South Africa. However, to the best of
our knowledge, this is the first study to be conducted measuring fluoroquinolone use and the
influence of prescribers in patients 18 years and younger utilising medicine claims data in
South Africa. The South African private health sector has coverage of approximately 20% of
the country’s population, especially for those in employment.
What is new and conclusion
Overall, the prescribing of fluoroquinolones generally decreased over the study period. The
findings from this study revealed the use of some fluoroquinolones that are not approved in this
patient group. The specialities of prescribers influenced the prevalence of fluoroquinolone
prescribing in the different age groups. The use of fluoroquinolones is justified in certain
clinical conditions in this patient group; however, appropriate prescribing is crucial in limiting

153
resistance.
We recommend that further studies be conducted to link fluoroquinolone use with diagnoses to
evaluate the appropriateness of prescribing. Furthermore, further studies should be conducted
to determine the indications of use of fluoroquinolones with unapproved indications in South
Africa.
Funding
This work was supported by the intra-ACP (African, Caribbean and Pacific) regions academic
mobility scheme and the National Research Foundation (NRF).
Transparency declaration
None to declare.
Authors’ contribution
WEA was responsible for the planning and design of the manuscript, the statistical analysis,
interpretation of results and writing of the manuscript. MSL supervised the concept of the
study and manuscript, the statistical analysis, supervision on writing of the manuscript, and
reviewing the manuscript carefully for final approval. JRB and NLK co-supervised the study
and manuscript, the data and statistical analyses, supervision of manuscript, and reviewing the
manuscript carefully for final approval. MC mainly supervised the statistical analyses.
154
Acknowledgements
We thank Ms Anne-Marie Bekker for administrative support regarding the database. The
authors acknowledge the North-West University (Potchefstroom Campus) and INTRA-ACP
Mobility Scheme for financial support.

155
References
1. Goldman JA, Kearns GL. Fluoroquinolone use in paediatrics: focus on safety and place in
therapy. 18th Expert Committee on the selection and use of essential medicine (2011).
Available at:
http://www.who.int/selection_medicines/committees/expert/18/applications/fluoroquinolon
e_review.pdf (accessed 2 October 2014).
2. Kline JM, Wietholter JP, Kline V, Confer J. Paediatric antibiotic use: a focused review of
fluoroquinolones and tetracyclines. US pharmacist, 2012;37:56-59.
3. Burkhardt JE, Walterspiel JN, Schaad UB. Quinolone arthropathy in animal versus
children. Clin Infect Dis, 1997;25:1196-1204.
4. Gough AW, Kasali OB, Sigler RE, Baragi V. Quinolone arthropathy – acute toxicity to
immature articular cartilage. Toxicol Pathol, 1992;20:436-449.
5. Gendrel D, Moulin. Fluoroquinolones in paediatrics. Paediatr Drugs, 2001;3:365-377.
6. Committee on Infectious Diseases: The use of systemic fluoroquinolones. Paediatrics,
2006;118:1287-1292.
7. Hampel B, Hullman R, Schmidt H. Ciprofloxacin in paediatrics: worldwide clinical
experience clinical experience based on compassionate use – safety report. Pediatr Infect
Dis J, 1997;16:127-129.
8. Algasham AA, Nahata MC. Clinical use of fluoroquinolones – a reassessment. Ann
Pharmacother, 2000;34:347-59
9. Aradottir E, Yogev R. The use of fluoroquinolones in paediatrics – a reassessment. Semin
Pediatr Infect Dis, 1999;10:31-37.
10. Arguedas A, Sher L, Lopez E, Saez-Ilorens X, Hamed K, Skuba K et al. Open label,
multicentre study of gatifloxacin treatment in recurrent otitis media and acute otitis media
treatment failure. Pediatr Infect Dis J, 2003;22:949-955.

156
11. Chalumeau M, Tonnelier S, D’Athis P, Treluyer J, Gendrel D, Breart G et al.
Fluoroquinolone safety in paediatric patients: a prospective, multicentre, comparative
cohort study in France. Paediatrics, 2003;111:714-719.
12. Pradham KM, Arora NK, Jena A, Susheela AK, Bhan MK. Safety of ciprofloxacin therapy
in children: Magnetic resonance images, body fluid levels of fluoride and linear growth.
Acta Paediatr, 1995;84:555-560.
13. Redmond A, Sweeney L, MacFarland M, Mitchell M, Dagget S, Kubin R. Oral
ciprofloxacin in the treatment of Pseudomonas exacerbations of paediatric cystic fibrosis:
clinical efficacy and safety evaluation using magnetic resonance image scanning. J Int Med
Res, 1998;26:304-312.
14. Saez-Ilorens X, McCoig C, Feris JM, Vargas SL, Klugman KP, Hussey GD et al.
Quinolone treatment for paediatric bacterial meningitis: a comparative study of
trovafloxacin and ceftriaxone with or without Vancomycin. Pediatr Infect Dis J,
2002;21:14-22.
15. Schaad UB, Stoupis C, Wedgwood J, Tschaeppeler H, Vock P. Clinical, radiologic, and
magnetic resonance monitoring for skeletal toxicity in paediatric patients with cystic
fibrosis receiving a three-month course of ciprofloxacin. Pediatr Infect Dis J, 1991;10:723-
729.
16. Zimbabwe, Bangladesh, South Africa (Zimbasa) Dysentery study group. Multicentre,
randomised, double blind clinical trial of short course versus standard course oral
ciprofloxacin for Shigella dysentriae type 1 dysentery in children. Paediatr Infect Dis J,
2002;21:1136-1141.
17. Yee CI, Duffy C, Gerbino PG, Stryker S, Noel CJ. Tendon or joint disorders in children
after treatment with fluoroquinolones or azithromycin. Paediatr Infect Dis J, 2002;21:525-
529.

157
18. Danisovicová A, Brezina M, Belan S, Kayserová H, Kaiserová E, Hruskovic I et al. No
evidence of quinolone-induced arthropathy. Chemotherapy, 1994;40:209-214.
19. Department of Health (South Africa). Management of drug-resistant tuberculosis policy
guidelines 2012. Available at: http://www.health-e.org.za/wp-
content/uploads/2014/06/MDR-TB-Clinical-Guidelines-Updated-Jan-2013.pdf (accessed 2
October 2014).
20. Department of Health (South Africa). Hospital level paediatrics: standard treatment
guidelines and essential medicine list. Pretoria; 2013.
21. South African Cystic Fibrosis Consensus. 4th ed. 2012. Available at:
http://www.sacfa.org.za/newsletters/CFConsensusDocument2013.pdf (accessed 2 October
2014).
22. SAS Institute Inc: SAS for windows 9.3. Cary: North Carolina; 2012.
23. Econex Health Reform Note 7: Updated GP and specialist numbers for South Africa.
Available at:
http://www.mediclinic.co.za/about/Documents/ECONEX_Health%20reform%20note_7.pd
f (accessed 2 October 2014).
24. Genuini M, Prot-Labarthe S, Bourdon O et al. Fluoroquinolones in pediatrics: review of
hospital prescription use over 2 years. Int J Clin Pharmacol Ther, 2014;52:940-7. doi:
10.5414/CP202103.
25. WHO (World Health Organization). Pocket book of hospital care for children. WHO:
Geneva; 2005.
26. Taketomo CK, Hodding JH, Kraus DM. Paediatric dosage handbook. Ohio: Lexi-Comp;
2005.
27. BNF (British National Formulary) for children. London: BMJ; 2012.

158
28. Sweetman SC. Martindale: the complete drug reference. 37th ed. London: Pharmaceutical
press.
29. South Africa Medicine Formulary. Quinolones. Cape town: Health and medical publishing
group; 2012.
30. Day C, Gray A. Health Indicators. In: Padarath A, English R, (eds.) South African Health
Review 2012/13. Durban: Health Systems Trust; 2013. p207-276.
31. Keddy KH, Sooka A, Ismail H, Smith AM, Weber I, Letsoalo ME et al. Molecular
epidemiological investigation of a typhoid fever outbreak in South Africa, 2005: the
relationship to a previous epidemic in 1993. Epidemiol Infect, 2011;139:1239-42.
32. Archer BN: Epidemiology of typhoid fever in South Africa, 2003-2007. Available at:
http://www.ivi.int/popup/files/26th_Jan_Session/Archer%20BN%20-
%20Epi%20of%20Typhoid%20in%20SA.pdf (accessed 2 October 2014).
33. Group for Enteric, Respiratory and Meningeal Surveillance in South Africa. GERM-SA
annual report, 2013. Available at: http://nicd.ac.za/assets/files/GERMS-
SA%20AR%202013.pdf (accessed 2 October 2014).
34. Group for Enteric, Respiratory and Meningeal Surveillance in South Africa. GERM-SA
annual report, 2006. Available at: http://www.nicd.ac.za/assets/files/2006_GERMS-
SA_annual_report.pdf (accessed 3 October 2014).
35. Group for Enteric, Respiratory and Meningeal disease Surveillance in South Africa.
GERMS-SA Annual Report 2012. Available at:
http://www.nicd.ac.za/units/germs/germs.htm (accessed 2 October 2014).
36. Blumberg L, De Jong G, Thomas J, Archer BN, Cengimbo A, Cohen C: Outbreaks in
South Africa 2004-2011, the outbreak response unit of the NICD, and the vision of an
inspired leader. South Afr J Epidemiol Infect, 2011;26:195-197.

159
37. Department of Health (South Africa): Guidelines for the management, prevention and
control of meningococcal diseases in South Africa, 2011. Available at:
http://nicd.ac.za/assets/files/DoH%20Meningococcal%20Disease%20Guidelines%202011.
pdf (accessed 2 October 2014).
38. O’Brien KL, Wolfson LJ, Watt JP et al. Burden of disease caused by Streptococcus
pneumonia in children younger than 5 years: global estimates. Lancet, 2009;374:893-902.
39. Coulson GB, Von Gottberg A, Du Plesis M. Meningococcal disease in South Africa, 1999-
2002. Emerg Infect Disease, 2007;13:272 – 281.
40. Group for Enteric, Respiratory and Meningeal disease Surveillance in South Africa:
GERMS-SA Annual Report 2007. Available at:
http://www.nicd.ac.za/assets/files/2007_GERMS-SA_Annual_Report.pdf (accessed 3
October 2014).
41. WHO (World Health Organization). Guidelines for the programmatic management of drug-
resistant tuberculosis: emerging updates 2008. Geneva: WHO.

160
Table 1 Demographic distribution of the study population (2005-2012)
Study period 2005 2006 2007 2008 2009 2010 2011 2012 Total
Patients claiming
antibiotics 232 132 230 546 181 709 129 253 183 393 158 446 132 537 118 808 1 366 824
Total antibiotic
prescriptions 510 416 522 769 417 511 286 086 408 702 345 758 269 039 237 023 2 997 304
Patients claiming
fluoroquinolones, n (%)* 8 329 (3.6) 8 901 (3.7) 7 799 (4.3) 5 697 (4.4) 6 571 (3.6) 5 225 (3.3) 3 708 (2.8) 3 310 (2.9) 49 540 (3.6)
Fluoroquinolone
prescriptions, n (%) ** 9 741 (1.9) 10 305 (2.0) 9 105 (2.2) 6 654 (2.3) 7 659 (1.9) 6 019 (1.7) 4 144 (1.5) 3 698 (1.6) 57 325
Gender, n (%) *** p – value a
Female 4 690 (56.3) 4 942 (55.5) 4 343 (55.7) 3 169 (55.6) 3 678 (56.0) 2 911 (55.7) 2 093 (56.5) 1 848 (55.8) 27 674
< 0.0001 Male 3 618 (43.4) 3 951 (44.8) 3 452 (44.2) 2 528 (44.4) 2 893 (44.0) 2 314 (44.3) 1 615 (43.5) 1 462 (44.2) 21 833
Unidentified 21 (0.3) 8 (0.1) 4 (0.1) - - - - - 33
Age group (years)
n (% )**
≥ 0 and ≤ 5 261 (3.1) 283 (3.2) 242 (3.1) 130 (2.3) 252 (3.8) 246 (4.7) 190 (5.1) 175 (5.3) 1 779
< 0.0001 > 5 and ≤ 12 1 362 (16.4) 1 376 (15.4) 1 116 (14.3) 777 (13.6) 911 (13.9) 673 (12.9) 512 (13.8) 504 (15.2) 7 231
> 12 and ≤ 18 6 706 (80.5) 7 242 (81.4) 6 441 (82.6) 4 790 (84.1) 5 408 (82.3) 4 306 (82.4) 2 631 (81.1) 2 631 (79.5) 40 530
* Percentages were calculated according to the total number of patients receiving antibiotic prescriptions.
** Percentages were calculated according to the total number of antibiotic prescriptions in each year.
*** Percentages were calculated according to the total number of patients receiving fluoroquinolone prescriptions.
a p-values were determined from chi-square tests to determine the association that exists between the prevalence of patients receiving fluoroquinolone
prescriptions and the study period.
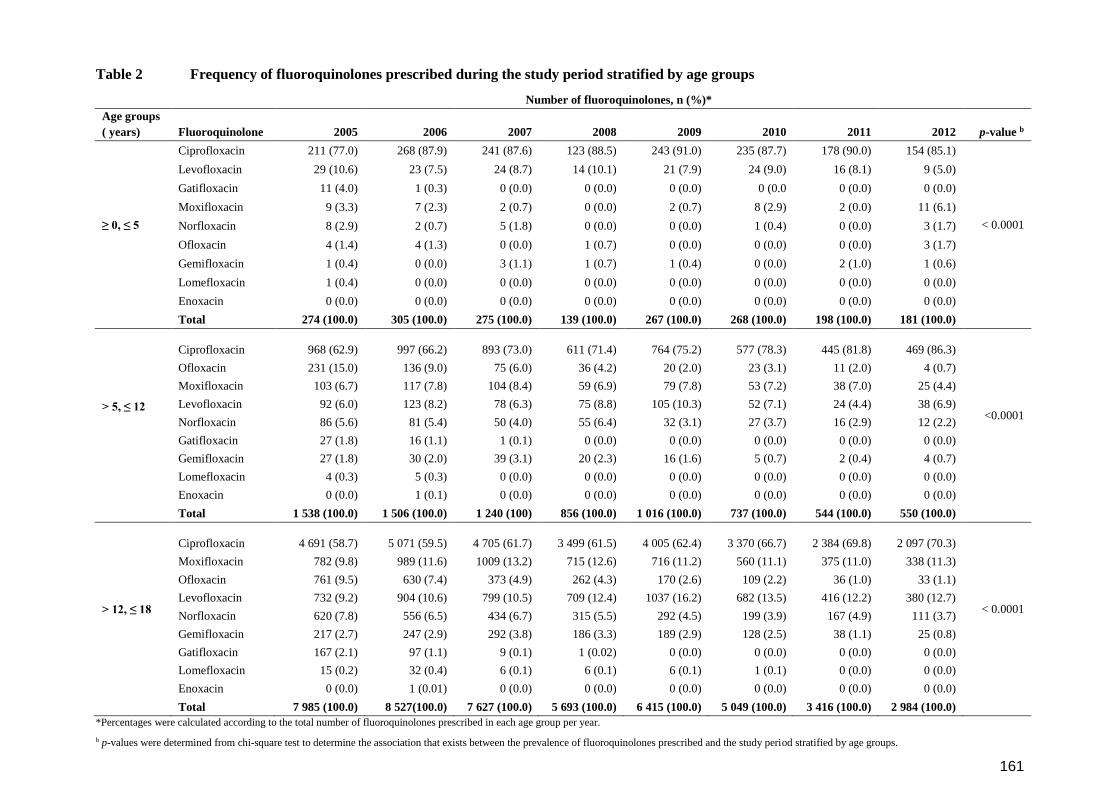
161
Table 2 Frequency of fluoroquinolones prescribed during the study period stratified by age groups
Number of fluoroquinolones, n (%)*
Age groups
( years) Fluoroquinolone 2005 2006 2007 2008 2009 2010 2011 2012 p-value b
≥ 0, ≤ 5
Ciprofloxacin 211 (77.0) 268 (87.9) 241 (87.6) 123 (88.5) 243 (91.0) 235 (87.7) 178 (90.0) 154 (85.1)
< 0.0001
Levofloxacin 29 (10.6) 23 (7.5) 24 (8.7) 14 (10.1) 21 (7.9) 24 (9.0) 16 (8.1) 9 (5.0)
Gatifloxacin 11 (4.0) 1 (0.3) 0 (0.0) 0 (0.0) 0 (0.0) 0 (0.0 0 (0.0) 0 (0.0)
Moxifloxacin 9 (3.3) 7 (2.3) 2 (0.7) 0 (0.0) 2 (0.7) 8 (2.9) 2 (0.0) 11 (6.1)
Norfloxacin 8 (2.9) 2 (0.7) 5 (1.8) 0 (0.0) 0 (0.0) 1 (0.4) 0 (0.0) 3 (1.7)
Ofloxacin 4 (1.4) 4 (1.3) 0 (0.0) 1 (0.7) 0 (0.0) 0 (0.0) 0 (0.0) 3 (1.7)
Gemifloxacin 1 (0.4) 0 (0.0) 3 (1.1) 1 (0.7) 1 (0.4) 0 (0.0) 2 (1.0) 1 (0.6)
Lomefloxacin 1 (0.4) 0 (0.0) 0 (0.0) 0 (0.0) 0 (0.0) 0 (0.0) 0 (0.0) 0 (0.0)
Enoxacin 0 (0.0) 0 (0.0) 0 (0.0) 0 (0.0) 0 (0.0) 0 (0.0) 0 (0.0) 0 (0.0)
Total 274 (100.0) 305 (100.0) 275 (100.0) 139 (100.0) 267 (100.0) 268 (100.0) 198 (100.0) 181 (100.0)
> 5, ≤ 12
Ciprofloxacin 968 (62.9) 997 (66.2) 893 (73.0) 611 (71.4) 764 (75.2) 577 (78.3) 445 (81.8) 469 (86.3)
<0.0001
Ofloxacin 231 (15.0) 136 (9.0) 75 (6.0) 36 (4.2) 20 (2.0) 23 (3.1) 11 (2.0) 4 (0.7)
Moxifloxacin 103 (6.7) 117 (7.8) 104 (8.4) 59 (6.9) 79 (7.8) 53 (7.2) 38 (7.0) 25 (4.4)
Levofloxacin 92 (6.0) 123 (8.2) 78 (6.3) 75 (8.8) 105 (10.3) 52 (7.1) 24 (4.4) 38 (6.9)
Norfloxacin 86 (5.6) 81 (5.4) 50 (4.0) 55 (6.4) 32 (3.1) 27 (3.7) 16 (2.9) 12 (2.2)
Gatifloxacin 27 (1.8) 16 (1.1) 1 (0.1) 0 (0.0) 0 (0.0) 0 (0.0) 0 (0.0) 0 (0.0)
Gemifloxacin 27 (1.8) 30 (2.0) 39 (3.1) 20 (2.3) 16 (1.6) 5 (0.7) 2 (0.4) 4 (0.7)
Lomefloxacin 4 (0.3) 5 (0.3) 0 (0.0) 0 (0.0) 0 (0.0) 0 (0.0) 0 (0.0) 0 (0.0)
Enoxacin 0 (0.0) 1 (0.1) 0 (0.0) 0 (0.0) 0 (0.0) 0 (0.0) 0 (0.0) 0 (0.0)
Total 1 538 (100.0) 1 506 (100.0) 1 240 (100) 856 (100.0) 1 016 (100.0) 737 (100.0) 544 (100.0) 550 (100.0)
> 12, ≤ 18
Ciprofloxacin 4 691 (58.7) 5 071 (59.5) 4 705 (61.7) 3 499 (61.5) 4 005 (62.4) 3 370 (66.7) 2 384 (69.8) 2 097 (70.3)
< 0.0001
Moxifloxacin 782 (9.8) 989 (11.6) 1009 (13.2) 715 (12.6) 716 (11.2) 560 (11.1) 375 (11.0) 338 (11.3)
Ofloxacin 761 (9.5) 630 (7.4) 373 (4.9) 262 (4.3) 170 (2.6) 109 (2.2) 36 (1.0) 33 (1.1)
Levofloxacin 732 (9.2) 904 (10.6) 799 (10.5) 709 (12.4) 1037 (16.2) 682 (13.5) 416 (12.2) 380 (12.7)
Norfloxacin 620 (7.8) 556 (6.5) 434 (6.7) 315 (5.5) 292 (4.5) 199 (3.9) 167 (4.9) 111 (3.7)
Gemifloxacin 217 (2.7) 247 (2.9) 292 (3.8) 186 (3.3) 189 (2.9) 128 (2.5) 38 (1.1) 25 (0.8)
Gatifloxacin 167 (2.1) 97 (1.1) 9 (0.1) 1 (0.02) 0 (0.0) 0 (0.0) 0 (0.0) 0 (0.0)
Lomefloxacin 15 (0.2) 32 (0.4) 6 (0.1) 6 (0.1) 6 (0.1) 1 (0.1) 0 (0.0) 0 (0.0)
Enoxacin 0 (0.0) 1 (0.01) 0 (0.0) 0 (0.0) 0 (0.0) 0 (0.0) 0 (0.0) 0 (0.0)
Total 7 985 (100.0) 8 527(100.0) 7 627 (100.0) 5 693 (100.0) 6 415 (100.0) 5 049 (100.0) 3 416 (100.0) 2 984 (100.0)
*Percentages were calculated according to the total number of fluoroquinolones prescribed in each age group per year.
b p-values were determined from chi-square test to determine the association that exists between the prevalence of fluoroquinolones prescribed and the study period stratified by age groups.

162
Table 3 Total fluoroquinolones prescribed by prescriber specialty during the study
period stratified by age groups
Number of fluoroquinolones, n (%)*
Year
Age
groups
(years)
Total
fluoroquinolones
prescribed (N)
General
medical
practice Paediatrician Specialist Pharmacotherapist Other p-value c
2005 ≥ 0, ≤ 5 274 199 (72.6) 50 (18.2) 4 (1.5) 4 (1.5) 17 (6.2)
< 0.0001 > 5, ≤ 12 1 538 1 399 (91.0) 63 (4.1) 15 (1.0) 1 (0.01) 60 (3.9)
> 12, ≤ 18 7 985 7 554 (94.6) 66 (0.8) 88 (1.1) 4 (0.1) 273 (3.4)
2006 ≥ 0, ≤ 5 305 217 (71.2) 67 (22.0) 4 (1.3) 0 (0.0) 17 (5.6)
< 0.0001 > 5, ≤ 12 1 506 1 365 (90.6) 65 (4.3) 17 (1.1) 1 (0.1) 58 (3.3)
> 12, ≤ 18 8 527 8 058 (94.5) 84 (1.0) 86 (1.0) 3 (0.04) 296 (3.5)
2007 ≥ 0, ≤ 5 275 185 (67.3) 73 (26.5) 3 (1.1) 0 (0.0) 14 (5.1)
< 0.0001 > 5, ≤ 12 1 240 1 118 (90.2) 60 (4.8) 13 (1.1) 0 (0.0) 49 (3.9)
> 12, ≤ 18 7 627 7 206 (94.5) 68 (0.9) 92 (1.2) 1 (0.01) 260 (3.4)
2008 ≥ 0, ≤ 5 139 88 (63.3) 37 (26.6) 2 (1.4) 0 (0.0) 12 (8.6)
< 0.0001 > 5, ≤ 12 856 745 (87.0) 60 (7.0) 13 (1.5) 0 (0.0) 38 (4.4)
> 12, ≤ 18 5 693 5 359 (94.1) 59 (1.0) 63 (1.1) 1 (0.02) 211 (3.7)
2009 ≥ 0, ≤ 5 267 143 (53.6) 97 (36.3) 2 (0.7) 0 (0.0) 25 (9.4)
< 0.0001 > 5, ≤ 12 1 016 864 (85.0) 101 (9.9) 6 (0.6) 0 (0.0) 45 (4.4)
> 12, ≤ 18 6 415 5 973 (93.1) 83 (1.3) 92 (1.4) 0 (0.0) 267 (4.2)
2010 ≥ 0, ≤ 5 268 123 (45.9) 115 (42.9) 4 (4.3) 0 (0.0) 26 (9.7)
< 0.0001 > 5, ≤ 12 737 614 (83.3) 77 (10.4) 11 (1.5) 0 (0.0) 35 (4.7)
> 12, ≤ 18 5 049 4 679 (92.7) 64 (1.3) 79 (1.6) 0 (0.0) 227 (4.5)
2011 ≥ 0, ≤ 5 198 104 (52.5) 80 (40.4) 3 (1.5) 0 (0.0) 11 (5.6)
< 0.0001 > 5, ≤ 12 544 472 (86.8) 43 (7.9) 8 (1.5) 0 (0.0) 21 (3.9)
> 12, ≤ 18 3 416 3 179 (93.1) 42 (1.2) 46 (1.3) 0 (0.0) 149 (4.4)
2012 ≥ 0, ≤ 5 181 106 (58.6) 64 (35.4) 1 (0.5) 0 (0.0) 10 (5.5)
< 0.0001 > 5, ≤ 12 550 468 (85.1) 55 (10.0) 7 (1.3) 0 (0.0) 20 (3.6)
> 12, ≤ 18 2 984 2 782 (93.2) 38 (1.3) 30 (1.0) 0 (0.0) 134 (4.5)
*Percentages were calculated according to the total number of fluoroquinolones prescribed in each age
group (N).
c Chi square test was used to determine the association that exists between the prevalence of fluoroquinolones
prescribed and the type of prescriber in the different age groups.

163
3.5 Additional results
The subsequent paragraphs and Tables 3.1 - 3.2 provide additional results which were
obtained from the empirical investigation.
3.5.1 PDDs of fluoroquinolones stratified by age groups
In Table 3.1, the PDDs (average dose) of fluoroquinolones prescribed for children and
adolescents stratified by age groups are provided. With reference to the maximum
recommended daily doses determined from literature for each fluoroquinolone in Table 1.4,
the following observations were made:
The PDDs and the maximum prescribed doses of gatifloxacin, lomefloxacin, moxifloxacin
and ofloxacin exceeded the maximum recommended daily dose in patients from birth to
five years in 2005.
The maximum prescribed doses and PDDs of gatifloxacin, gemifloxacin, lomefloxacin,
moxifloxacin, norfloxacin and ofloxacin exceeded the maximum recommended daily
dose in children above five to 12 years in 2005 and 2006.
In children above 12 to 18 years, the maximum recommended daily doses of
gatifloxacin, gemifloxacin, lomefloxacin, ofloxacin, moxifloxacin and norfloxacin were
exceeded in 2005 and 2006 with regard to the PDDs and maximum prescribed doses.
All PDDs of ciprofloxacin in all the age groups were below the maximum recommended
daily dose. There were, however, wide variations around the PDDs as shown by the
minimum and maximum doses prescribed. In all the age groups, the maximum doses
prescribed exceeded the maximum recommended daily dose (1 500 mg) throughout the
study period.
Enoxacin was only prescribed in children above five to 18 years in 2006. The PDD was
below the maximum recommended daily dose (refer to Table 1.4).
The PDDs of levofloxacin in all the age groups were below the maximum recommended
daily dose. Again, wide variations around the PDDs were observed. The maximum
doses prescribed for children from birth to five years and in children above 12 to 18
years, exceeded the maximum recommended daily dose in 2005 (refer to Table 3.1). In
children above five to 12 years, maximum prescribed doses exceeded the maximum
recommended daily dose in 2005 and 2006 (refer to Table 3.1).
Practically significant differences were found in the average PPDs between 2005 and the

164
subsequent years under study for norfloxacin in children above five to twelve years (Cohen’s
d-value ≥ 0.84); between 2006 and 2010 (Cohen’s d-value = 0.83) and between 2006 and
2011 (Cohen’s d-value = 1.04) in patients above twelve to 18 years.
For ofloxacin, practically significant differences were found in the average PPDs between
2005 and the subsequent years in patients above five to twelve years (Cohen’s d- value ≥
0.80); between 2006 and 2010, 2011, 2012 (Cohen’s d-value ≥1.43); and between 2007 and
2010, 2012 (Cohen’s d-value ≥ 0.87). Again, the same trend was found between 2008 and
2010, 2012 (Cohen’s d-value ≥ 0.82); and between 2009 and 2012 in this age group
(Cohen’s d-value = 1.03). In patients above five to twelve years, practically significant
differences were found in the average PPDs between 2005 and the other years under study
(Cohen’s d-value ≥ 1.16); and between 2006 and 2010 (Cohen’s d-value = 0.87).
Lastly for norfloxacin, practically significant differences were observed in the differences in
the average PPDs between 2005 and the other years under study (Cohen’s d-value ≥ 0.88).
High dosages prescribed during the study period may reflect uncertaities in dosages or
prescribing guidelines. The appropriateness of dosages prescribed could not be evaluated
due to incomplete diagnoses data and relevant data fields such as the weight and height of
patients.
3.5.2 PDDs of fluoroquinolones by prescribers’ specialty
Table 3.2 provides the PDDs of fluoroquinolones by prescribers’ specialty. General medical
practitioners were accountable for relative higher average PDDs prescribed for all
fluoroquinolones claimed. In 2007, general medical practitioners prescribed higher average
PDDs of ciprofloxacin than pharmacotherapist (Cohen’s d-value = 1.24). PDDs for ofloxacin
were observed to be higher in general medical practitioners than the rest of the prescribers
in 2005 (Cohen’s d-value ≥ 1.41) and in 2006 (Cohen’s d-value ≥ 0.80). Again in 2007,
PDDs by general medical practitioners differed significantly from other prescribers (Cohen’s
d-value = 1.01) and between the specialists and other prescribers (Cohen’s d-value = 1.63).
In 2009, high PDDs were observed in general medical practitioners compared to
paediatricians (Cohen’s d-value = 2.49); between the specialists and paediatricians (Cohen’s
d-value = 3.05); and between paediatricians and other prescribers (Cohen’s d-value = 2.38).
Finally in 2010, the differences in the PDDs between the general medical practitioners and
paediatricians was found to be practically significant (Cohen’s d-value = 1.59); as well as
that between the specialists and paediatricians (Cohen’s d-value = 1.67). Dosing of

165
fluoroquinolones in children is essential to achieve the desired therapeutics effects and limit
resistance (Alghasham & Nahata, 2000:348). Although high doses prescribed for
fluoroquinolones were observed by general medical practitioners, they could not be explored
further to draw satisfactory conclusions as data for diagnoses were incomplete.

166
Table 3.1 Prescribed daily doses per prescription per year stratified by age groups
≥0, ≤5 years
FQ
2005 2006 2007 2008 2009 2010 2011 2012 p -
value
Ciprofloxacin
n PDD ± SD
95% CI Min. Max. Med.
211 1 062.47 ± 787.44
(955.61 – 1 169.34) 57.14
2 500.00 1 000.00
268 910.13 ± 592.80
(838.83 - 981.43) 125.00
3 750.00 885.42
241 722.13 ± 409.50
(670.17 - 774.09) 28.57
2 500.00 625.00
123 776.83 ± 336.21
(716.81 - 836.84) 166.67
1 666.67 750
243 821.22 ± 390.02
(771.93 - 870.50) 142.86
2 500.00 750.00
235 818.93 ± 507.16
(753.75 - 884.11) 125.00
2 000.00 1 000.00
178 814.17 ± 344.53
(763.21 - 865.13) 40.00
1 666.67 1 000.00
154 769.06 ± 296.86
(721.80 - 816.31) 166.67
1 666.67 1 000.00
0.0001
Enoxacin
- - - - - - - - -
Gatifloxacin
n PDD ± SD
95% CI Min. Max. Med.
11 436.36 ± 332.48
(213.00 - 659.73) 200.00
1400.00 400.00
1 400.00 ± 0.00
- 400.00 400.00 400.00
- - - - - - 0.920
Gemifloxacin
n PDD ± SD
95% CI Min. Max. Med.
1 320.00 ± 0.00
- 320.00 320.00 320.00
-
3 320.00 ± 0.00
- 320.00 320.00 320.00
1 320.00 ± 00
- 320.00 320.00 320.00
1 320.00 ± 0.00
- 320.00 320.00 320.00
-
2 320.00 ± 0.00
- 320.00 320.00 320.00
1 320.00 ± 0.00
- 320.00 320.00 320.00
-
Levofloxacin
n PDD ± SD
95% CI Min. Max. Med.
29 586.21 ± 445.84
(416.62 - 755.80) 250.00
2 500.00 500.00
23 481.88 ± 115.02
(432.14 - 531.62) 250.00 833.33 500.00
24 508.68 ± 156.38
(442.65 - 574.71) 250.00
1 000.00 500.00
14 642.86 ± 212.91
(519.93 - 765.79) 142.86
1 000.00 500.00
21 572.28 ± 282.49
(443.69 - 700.87) 142.86
1 000.00 500.00
24 677.08 ± 280.52
(558.63 - 795.54) 250.00
1 000.00 500.00
16 492.19 ± 132.83
(421.41 - 562.97) 250.00 750.00 500.00
9 722.22 ± 291.67
(498.03 - 946.42) 250.00
1 000.00 750.00
0.10
Lomefloxacin n
PDD ± SD 1
1000.00 ± 0.00 - - - - - - - -

167
Table 3.1 Prescribed daily doses per prescription per year stratified by age groups (continued)
≥0, ≤5 years
FQ 2005 2006 2007 2008 2009 2010 2011 2012 p - value
Moxifloxacin
n PDD ± SD
95% CI Min. Max. Med.
9 466.67 ± 200.00
(312.93 – 620.00) 400.00
1 000.00 400.00
7 400 ± 0.00
- 400.00 400.00 400.00
2 300.00 ± 141.92
(-970.62 – 1 570.62) 200.00 400.00 300.00
-
2 400.00 ± 0.00
- 400.00 400.00 400.00
8 350.00 ± 92.58
(272.60 – 427.40) 200.00 400.00 400.00
2 400.00 ± 0.00
- 400.00 400.00 400.00
11 400.00 ± 0.00
- 400.00 400.00 400.00
0.36
Norfloxacin
n PDD ± SD
95% CI Min. Max. Med.
8 760.00 ± 375.23
(446.30 - 1073.70) 80.00
1200.00 800.00
2 800.00 ± 0.00
- 800.00 800.00 800.00
5 720.00 ± 178.89
(497.88 - 942.12) 400.00 800.00 800.00
- -
1 800.00 ± 0.00
- 800.00 800.00 800.00
-
3 800.00 ± 0.00
- 800.00 800.00 800.00
0.99
Ofloxacin
n PDD ± SD
95% CI Min. Max. Med.
4 1 250.00 ± 525.99
(413.03 – 2 086.97) 800.00
2 000.00 1 100.00
4 700.00 ± 346.41
(148.78 – 1 251.22) 200.00
1 000.00 800.00
-
1 800.00 ± 0.00
- 800.00 800.00 800.00
- - -
3 600.00 ±346.41
(-260.53 - 1460.53) 200.00 800.00 800.00
0.24

168
Table 3.1 Prescribed daily doses per prescription per year stratified by age groups (continued)
>5, ≤12 years
FQ
2005 2006 2007 2008 2009 2010 2011 2012 p -
value
Ciprofloxacin
n PDD ± SD
95% CI Min. Max. Med.
968 1 223.55 ± 578.64
(1 123.98 – 1 323.12) 16.67
5 000.00 1 000.00
997 1 009.23 ± 693.44
(966.13 – 1 052.32) 33.33
5 000.00 1 000.00
893 858.88 ± 404.75
(832.30 - 885.46) 125.00
1 666.67 833.33
611 886.08 ± 402.09
(854.13 - 918.02) 166.67
2 000.00 1 000.00
764 1 004.52 ± 2 893.16
(798.91 - 1210.13) 25.00
2 000.00 1 000.00
577 843.52 ± 392.40
(811.43 - 875.60) 125.00
2 000.00 833.33
445 851.81 ± 413.38
(813.30 - 890.32) 83.33
3 333.33 1 000.00
469 872.01 ± 366.48
(838.76 - 905.26) 16.67
1 875.00 1 000.00
0.0001
Enoxacin
n PDD ± SD
95% CI Min. Max. Med.
-
1 400.00 ± 0.00
- 400.00 400.00 400.00
- - - - - - .-
Gatifloxacin
n PDD ± SD
95% CI Min. Max. Med.
27 414.81 ± 207.00
(332.93 - 496.70) 200.00
1 400.00 400.00
16 442.50 ± 261.47
(303.17 - 581.83) 200.00
1 400.00 400.00
1 400.00 ± 0.00
- 400.00 400.00 400.00
- - - - - 0.92
Gemifloxacin
n PDD ± SD
95% CI Min. Max. Med.
27 399.01 ± 201.39
(319.34 - 478.68) 53.33
800.00 320.00
30 352.71 ± 196.30
(279.41 - 426.01) 53.33
800.00 320.00
39 307.69 ± 53.98
(290.19 - 325.19) 53.33
320.00 320.0
20 320.00 ± 0.00
- 320.00 320.00 320.00
16 320.00 ± 0.00
- 320.00 320.00 320.00
5 320.00 ± 0.00
- 320.00 320.00 320.00
2 320.00 ± 0.00
- 320.00 320.00 320.00
4 320.00 ± 0.00
- 320.00 320.00 320.00
0.24
Levofloxacin
n PDD ± SD
95% CI Min. Max. Med.
92 548.73 ± 491.54
(446.94 - 650.53) 83.33
2 500.00 500.00
123 469.50 ± 202.02
(433.44 - 505.56) 250.00
1 250.00 500.00
78 511.75 ± 256.14
(454.00 - 569.50) 166.67
1 000.00 500.00
75 542.78 ± 234.70
(488.78 - 596.78) 125.00
1 000.00 500.00
105 546.11 ± 236.04
(500.43 - 591.79) 83.33
1 000.00 500.00
52 367.38 ± 135.62
(329.62 - 405.13) 50.00
500.00 375.00
24 448.53 ± 213.46
(374.05 - 523.01) 125.00
1 000.00 500.00
38 389.25 ± 119.15
(350.09 - 428.42) 250.00 500.00 458.33
0.0002
Lomefloxacin
n PDD ± SD
95% CI Min. Max. Med.
4 900.00 ± 808.29
(-386.17 - 2186.17) 2..022
2 000.00 700.00
5 960.00 ± 654.22
(147.68 - 1772.32) 400.00
2 000.00 1 000.00
- - - - - - 0.91

169
Table 3.1 Prescribed daily doses per prescription per year stratified by age groups (continued)
>5, ≤12 years
FQ
2005 2006 2007 2008 2009 2010 2011 2012 p -
value
Moxifloxacin
n PDD ± SD
95% CI Min. Max. Med.
103 474.62 ± 246.18
(426.50 - 522.73) 66.67
2 000.00 400.00
117 449.00 ± 356.48
(383.73 - 514.28) 66.67
2 000.00 400.00
104 392.67 ± 40.82
(384.73 - 400.61) 66.67
400.00 400.00
59 400.00 ± 0.00
- 400.00 400.00 400.00
79 391.39 ± 45.59
(381.18 - 401.60) 80.00
400.00 400.00
53 391.95 ± 42.35
(380.28 - 403.62) 133.33 400.00 400.00
38 396.99 ± 18.54
(390.90 - 403.09) 285.71 400.00 400.00
24 400.00 ± 0.00
- 400.00 400.00 400.00
0.02
Norfloxacin
n PDD ± SD
95% CI Min. Max. Med.
86 985.74 ± 316.99
(917.77 - 1053.70) 160.00
2 000.00 1 200.00
81 898.27 ± 308.68
(830.02 - 966.53) 200.00
2 400.00 800.00
50 784.80 ± 129.52
(747.99 - 821.61) 200.00
1 200.00 800.00
55 761.45 ± 126.25
(727.32 - 795.58) 200.00 800.00 800.00
32 760.00 ± 130.11
(713.09 - 806.91) 240.00 800.00 800.00
27 699.26 ± 198.88
(620.58 - 777.93) 200.00 800.00 800.00
16 647.50 ± 211.77
(534.66 - 760.34) 200.00 800.00 800.00
12 766.67 ± 115.47
(693.30 - 840.03) 400.00 800.00 800.00
0.0001
Ofloxacin
n PDD ± SD
95% CI Min. Max. Med.
231 1 214.37 ± 503.09
(1 149.15 – 1 279.59) 100.00
2 400.00 1 000.00
136 912.49 ± 375.63 (848.79 - 976.19)
200.00 2 400.00
800.00
75 689.96 ± 144.51
(656.71 - 723.20) 66.67
800.00 666.67
36 669.44 ± 145.71
(620.14 - 718.74) 300.00 800.00 666.67
20 656.00 ± 209.55
(557.93 - 754.07) 120.00 800.00 733.33
23 347.83 ± 227.38
(249.50 - 446.15) 200.00 800.00 200.00
11 436.36 ± 196.33
(304.47 - 568.26) 200.00 800.00 400.00
4 250.00 ±100.00 (90.88 - 409.12)
200.00 400.00 200.00
0.0001

170
Table 3.1 Prescribed daily doses per prescription per year stratified by age groups (continued)
>12, ≤18 years
FQ
2005 2006 2007 2008 2009 2010 2011 2012 p -
value
Ciprofloxacin
n PDD ± SD
95% CI Min. Max. Med.
4 691 1 319.84 ± 959.03
(1 292.39 – 1 347.29) 25.00
2 500.00 1 000.00
5 071 1 081.04 ± 857.74
(1 057.42 - 1 104.66) 8.33
4 000.00 1 000.00
4 705 954.00 ± 355.30
(943.84 - 964.15) 50.00
1 666.67 1 000.00
3 499 956.70 ± 376.04
(944.23 - 969.17) 16.67
8 333.33 1 000.00
4 005 958.15 ± 345.79
(947.44 - 968.86) 33.33
1 666.67 1 000.00
3 370 930.59 ± 339.88
(919.11 - 942.06) 16.67
1 666.67 1 000.00
2 384 953.08 ± 328.73
(939.88 - 966.28) 16.67
1 666.67 1 000.00
2 097 945.65 ± 331.64
(931.45 - 959.86) 8.33
1 666.67 1 000.00
0.0001
Enoxacin
n PDD ± SD
95% CI Min. Max. Med.
-
1 700.00 ± 0.00
- 700.00 700.00 700.00
- - - - - - -
Gatifloxacin
n PDD ± SD
95% CI Min. Max. Med.
167 425.63 ± 174.69
(398.94 - 452.32) 140.00
1 400.00 400.00
97 444.18 ± 281.06
(387.54 - 500.83) 285.71
2 800.00 400.00
9 400.00 ± 0.00
- 400.00 400.00 400.00
1 400.00 ± 0.00
- 400.00 400.00 400.00
- - - - 0.88
Gemifloxacin
n PDD ± SD
95% CI Min. Max. Med.
217 367.41 ± 167.84
(344.95 - 389.86) 74.67
1 120.00 320.00
247 368.83 ± 262.10
(335.98 - 401.68) 53.33
533.33 320.00
292 314.56 ± 41.53
(309.77 - 319.34) 53.33
533.33 320.00
186 320.00 ± 0.00
- 320.00 320.00 320.00
189 315.23 ± 33.22
(310.46 - 319.99) 53.33
320.00 320.00
128 316.08 ± 27.08
(311.34 - 320.81) 80.00
320.00 320.00
38 320.00 ± 0.00
- 320.00 320.00 320.00
25 309.33 ± 53.33
(287.32 - 331.35) 53.33
1 000.00 500.00
0.0001
Levofloxacin
n PDD ± SD
95% CI Min. Max. Med.
732 534.48 ± 348.38
(509.20 - 559.75) 41.67
2 500.00 500.00
904 505.21 ± 246.53
(489.12 - 521.30) 41.67
1 000.00 500.00
799 530.83 ± 228.63
(514.96 - 546.71) 41.67
1 000.00 500.00
709 575.49 ± 217.08
(559.48 - 591.49) 83.33
1 000.00 500.00
1 037 611.64 ± 232.21
(597.49 - 625.79) 83.33
1 000.00 500.00
682 593.06 ± 210.01
(577.27 - 608.85) 83.33
1 000.00 500.00
416 594.25 ± 220.31
(573.01 - 615.48) 83.33
1 000.00 500.00
380 595.09 ± 208.72
(574.03 - 616.14) 125.00
1 000.00 500.00
0.0001
Lomefloxacin
n PDD ± SD
95% CI Min. Max. Med.
15 706.67 ± 549.63
(402.29 - 1011.04) 400.00
2 000.00 400.00
32 487.50 ± 143.12
(435.90 - 539.10) 200.00
1 000.00 400.00
6 400.00 ± 0.00
- 400.00 400.00 400.00
6 400.00 ± 0.00
- 400.00 400.00 400.00
6 400.00 ± 0.00
- 400.00 400.00 400.00
1 400.00 ± 0.00
- 400.00 400.00 400.00
- -
0.09

171
Table 3.1 Prescribed daily doses per prescription per year stratified by age groups (continued)
>12, ≤18 years
FQ
2005 2006 2007 2008 2009 2010 2011 2012 p -
value
Moxifloxacin
n PDD ± SD
95% CI Min. Max. Med.
782 581.36 ± 181.97
(454.17 - 708.56) 66.67
5 000.00 400.00
989 441.82 ± 229.78
(427.49 - 456.16) 66.67
2 000.00 400.00
1 009 394.10 ± 66.65
(389.98 - 398.22) 66.67
2 000.00 400.00
715 396.06 ± 34.50
(393.52 - 398.59) 66.67
400.00 400.00
716 398.90 ± 27.87
(396.86 - 400.95) 68.96
666.67 400.00
560 396.44 ± 29.11
(394.02 - 398.86) 66.67
400.00 400.00
375 396.63 ± 31.54
(393.43 - 399.83) 66.67
400.00 400.00
338 397.52 ± 23.63
(394.99 - 400.05) 133.33 400.00 400.00
0.0001
Norfloxacin
n PDD ± SD
95% CI Min. Max. Med.
620 1 143.29 ± 668.92
(1 090.53 – 1 196.05) 40.00
6 000.00 1 200.00
556 987.19 ± 529.29
(943.10 - 1031.29) 57.14
6 000.00 800.00
434 773.46 ± 106.70
(763.39 - 783.52) 80.00
800.00 800.00
315 783.40 ± 82.43
(774.26 - 792.54) 165.63 800.00 800.00
292 772.16 ± 106.43
(759.90 - 784.42) 80.00
800.00 800.00
199 764.23 ± 124.44
(746.84 - 781.63) 80.00
800.00 800.00
167 750.20 ± 139.97
(728.81 - 771.58) 82.76
800.00 800.00
111 779.10 ± 88.11
(762.53 - 795.67) 400.00 800.00 400.00
0.0001
Ofloxacin
n PDD ± SD
95% CI Min. Max. Med.
761 1 195.69 ± 549.88
(1 156.56 – 1 234.82) 66.67
4 000.00 1 000.00
630 958.23 ± 478.81
(920.77 - 995.69) 66.67
4 500.00 800.00
373 717.29 ± 135.46
(703.50 - 731.08) 200.00 800.00 800.00
262 685.98 ± 158.52
(666.69 - 705.26) 100.00 800.00 800.00
170 711.18 ± 152.60
(688.07 - 734.28) 200.00 800.00 800.00
109 599.74 ± 241.56
(553.88 - 645.60) 171.43 800.00 800.00
36 671.30 ± 223.70
(595.61 - 746.99) 200.00 800.00 800.00
33 647.47 ± 206.67
(574.19 - 720.75) 200.00 800.00 800.00
0.0001
Where FQ – Fluoroquinolone; n – number of fluoroquinolone agents; PDD – prescribed daily dose (average); SD – standard deviation; CI –
confidence interval ; Min. – minimum prescribed dose; Max. – maximum prescribed dose; and Med. - median

172
Table 3.2 Prescribed daily doses per prescription per year of fluoroquinolones in patients 18 years and younger stratified by
prescribers’ speciality
Year
General medical practice
Paediatrician Pharmacotherapist Specialist Other p - value
Ciprofloxacin
2005 n PDD ± SD
95% CI Min. Max. Med.
5 483 1 334.43 ± 1 103.74
(1 305.21 – 1 363.65) 50.00
5 000.00 1 000.00
119 657.34 ± 314.91
(600.17 - 714.50) 50.00
2 500.00 500.00
4 750.00 ± 288.68
(290.65 - 1209.35) 250.00
1 000.00 750.00
74 820.95 ± 450.49
(716.57 - 925.32) 250.00
3 750.00 1 000.00
190 743.53 ± 432.09
(681.70 - 805.37) 50.00
3 750.00 500.00
< 0.0001
2006 n PDD ± SD
95% CI Min. Max. Med.
5 906 1 088.65 ± 845.01
(1 067.10 – 1 110.21) 50.00
5 000.00 1 000.00
164 658.42 ± 286.27
(614.28 - 702.56) 50.00
1 500.00 500.00
3 666.67 ± 288.68
(-50.44 - 1383.78) 250.00
1 000.00 500.00
60 709.72 ± 302.41
(631.60 - 787.84) 50.00
1 500.00 500.00
200 733.37 ± 280.68
(694.23 - 772.51) 50.00
1 500.00 500.00
< 0.0001
2007 n PDD ± SD
95% CI Min. Max. Med.
5433 943.98 ± 370.03
(934.13 - 953.82) 50.00
1 666.67 1 000.00
173 737.03 ± 349.05
(684.65 - 789.41) 50.00
2 500.00 714.28
1 500.00 ± 0.00
- 500.00 500.00 500.00
58 802.75 ± 245.21
(738.28 - 867.22) 50.00
1 071.43 1 000.00
174 726.38 ± 282.98
(684.04 - 768.72) 50.00
1 666.67 500.00
< 0.0001
2008 n PDD ± SD
95% CI Min. Max. Med.
3893 956.85 ± 383.97
(944.78 - 968.91) 50.00
8 333.33 1 000.00
133 753.46 ± 287.31
(704.18 - 802.74) 50.00
1 666.67 714.29
1 1000.00 ± 0.00
- 500.00
1 000.00 1 000.00
52 682.05 ± 287.73
(601.95 - 762.16) 250.00
1 000.00 500.00
153 796.02 ± 276.65
(751.83 - 840.20) 50.00
1 500.00 500.00
< 0.0001
2009 n PDD ± SD
95% CI Min. Max. Med.
4516 982.78 ± 1229.70
(946.90 – 1 018.65) 50.00
2 500.00 1 000.00
242 713.25 ± 323.80
(672.25 - 754.25) 50.00
2 500.00 500.00
-
58 759.85 ± 282.07
(685.69 - 834.02) 50.00
1 500.00 1 000.00
194 760.51 ± 284.03
(720.29 - 800.73) 50.00
1 666.67 1 000.00
< 0.0001

173
Table 3.2 Prescribed daily doses per prescription per year of fluoroquinolones in patients 18 years and younger stratified by
prescribers’ speciality (continued)
Year
General medical practice
Paediatrician Pharmacotherapist Specialist Other p - value
Ciprofloxacin
2010 n PDD ± SD
95% CI Min. Max. Med.
3747 926.48 ± 351.79
(915.22 - 937.75) 50.00
2 000.00 1 000.00
224 806.22 ± 510.31
(739.03 - 873.41) 50.00
5 000.00 833.33
-
56 739.58 ± 264.39
(668.78 - 810.39) 50.00
1 000.00 770.83
155 785.07 ± 267.38
(742.64 - 827.50) 50.00
1 500.00 1 000.00
< 0.0001
2011 n PDD ± SD
95% CI Min. Max. Med.
2712 943.19 ± 346.84
(930.13 - 956.25) 50.00
3 333.33 1 000.00
150 746.75 ± 297.84
(698.69 - 794.80) 50.00
1666.67 714.28
-
37 787.26 ± 312.41
(683.09 - 891.42) 50.00
1 500.00 1 000.00
106 901.35 ± 329.12
(837.96 - 964.73) 50.00
2 500.00 1 000.00
< 0.0001
2012 n PDD ± SD
95% CI Min. Max. Med.
2443 940.79 ± 340.61
(927.27 - 954.30) 50.00
1 875.00 1 000.00
147 766.32 ± 291.56
(718.79 - 813.84) 50.00
1666.67 714.28
-
27 865.96 ± 256.28
(764.58 - 967.34) 50.00
1 500.00 1 000.00
102 740.94 ± 269.91
(687.93 - 793.96) 50.00
1 000.00 833.33
< 0.0001
Moxifloxacin
2005 n PDD ± SD
95% CI Min. Max. Med.
822 583.51 ± 176.99
(462.40 - 704.62) 400.00
2 000.00 400.00
11 400.00 ± 0.00
- 400.00 400.00 400.00
1 400.00 ± 0.00
- 400.00 400.00 400.00
10 400.00 ± 0.00
- 400.00 400.00 400.00
50 385.33 ± 59.16
(368.52 - 402.15) 400.00 400.00 400.00
0.93
2006 n PDD ± SD
95% CI Min. Max. Med.
1 005 448.36 ± 256.60
(432.48 - 464.25) 400.00 400.00 400.00
17 400.00 ± 0.00
- 400.00 400.00 400.00
-
15 377.78 ± 86.07
(330.12 - 425.44) 400.00 400.00 400.00
76 384.56 ± 66.26
(369.42 - 399.70) 400.00 400.00 400.00
0.09

174
Table 3.2 Prescribed daily doses per prescription per year of fluoroquinolones in patients 18 years and younger stratified by
prescribers’ speciality (continued)
Year
General medical practice
Paediatrician Pharmacotherapist Specialist Other p - value
Moxifloxacin
2007 n PDD ± SD
95% CI Min. Max. Med.
1 025 (393.58 ± 66.85)
2 000.00 400.00 400.00 400.00
6 400.00 ± 0.00
- 400.00 400.00 400.00
-
18 381.48 ± 78.57
(342.41 - 420.55) 400.00 400.00 400.00
66 400.00 ± 0.00
(389.48 - 397.67) 400.00 400.00 400.00
0.73
2008 n PDD ± SD
95% CI Min. Max. Med.
704 396.00 ± 34.77
(393.42 - 398.57) 400.00 400.00 400.00
8 400.00 ± 0.00
- 400.00 400.00 400.00
-
10 400.00 ± 0.00
- 400.00 400.00 400.00
52 400.00 ± 0.00
- 400.00 400.00 400.00
0.82
2009 n PDD ± SD
95% CI Min. Max. Med.
707 398.60 ± 30.17
(396.38 - 400.83) 400.00 400.00 400.00
17 400.00 ± 0.00
- 400.00 400.00 400.00
-
7 382.86 ± 45.36
(340.91 - 424.80) 400.00 400.00 400.00
66 394.55 ± 31.29
(386.85 - 402.24) 400.00 400.00 400.00
0.40
2010 n PDD ± SD
95% CI Min. Max. Med.
535 395.03 ± 34.04
(392.14 - 397.92) 400.00 400.00 400.00
10 400.00 ± 0.00
- 400.00 400.00 400.00
-
17 400.00 ± 0.00
- 400.00 400.00 400.00
59 397.29 ± 20.83
(391.86 - 402.72) 400.00 400.00 400.00
0.85
2011 n PDD ± SD
95% CI Min. Max. Med.
364 396.21 ± 32.53
392.86 400.00 400.00 400.00
7 400.00 ± 0.00
- 400.00 400.00 400.00
-
5 400.00 ± 0.00
- 400.00 400.00 400.00
39 400.00 ± 0.00
- 400.00 400.00 400.00
0.88
2012 n PDD ± SD
95% CI Min. Max. Med.
341 397.54 ± 23.53
(395.04 - 400.05) 400.00 400.00 400.00
2 400.00 ± 0.00
- 400.00 400.00 400.00
-
3 400.00 ± 0.00
- 400.00 400.00 400.00
27 400.00 ± 0.00
- 400.00 400.00 400.00
0.95

175
Table 3.2 Prescribed daily doses per prescription per year of fluoroquinolones in patients 18 years and younger stratified by
prescribers’ speciality (continued)
Year
General medical practice
Paediatrician Pharmaccotherapist Specialist Other p – value
Levofloxacin
2005 n PDD ± SD
95% CI Min. Max. Med.
757 544.47 ± 385.52
(516.97 - 571.98) 250.00
2 500.00 500.00
30 488.89 ± 202.63
(413.22 - 564.55) 250.00 500.00 500.00
1 250.00 ± 0.00
- 500.00 500.00 500.00
19 434.21 ± 183.37
(345.83 - 522.59) 250.00
1 000.00 500.00
46 508.39 ± 198.36
(449.48 - 567.29) 250.00
1 000.00 500.00
0.53
2006 n PDD ± SD
95% CI Min. Max. Med.
948 499.02 ± 243.54
(483.50 - 514.55) 250.00
2 500.00 500.00
18 541.67 ± 176.78
(453.76 - 629.58) 250.00 500.00 500.00
1 500.00 ± 0.00
- 500.00 500.00 500.00
26 518.03 ± 233.88
(423.56 - 612.50) 250.00
1 000.00 500.00
57 504.39 ± 197.59
(451.96 - 556.81) 250.00
1 000.00 500.00
0.95
2007 n PDD ± SD
95% CI Min. Max. Med.
803 530.99 ± 232.13
(514.91 - 547.07) 250.00
1 000.00 500.00
20 543.75 ± 237.82
(432.45 - 655.05) 250.00
1 000.00 500.00
-
23 510.87 ± 219.48
(415.96 - 605.78) 250.00
1 000.00 500.00
55 495.45 ± 189.36
(444.26 - 546.65) 250.00
1 000.00 500.00
0.69
2008 n PDD ± SD
95% CI Min. Max. Med.
729 573.56 ± 215.39
(557.90 - 589.22) 250.00
1 000.00 500.00
13 660.26 ± 264.53
(500.40 - 820.11) 250.00
1 000.00 500.00
-
12 666.67 ± 325.67
(459.75 - 873.59) 250.00
1 050.00 625.00
44 523.13 ± 219.67
(456.35 - 589.92) 250.00
1 000.00 500.00
0.09
2009 n PDD ± SD
95% CI Min. Max. Med.
1057 606.52 ± 233.34
(592.44 - 620.60) 250.00
1 000.00 500.00
15 486.11 ± 229.12
(359.23 - 612.99) 250.00
1 000.00 500.00
-
31 581.22 ± 251.86
(488.84 - 673.60) 250.00
1 000.00 500.00
60 620.44 ± 236.71
(559.29 - 681.59) 250.00
1 000.00 500.00
0.21
2010 n PDD ± SD
95% CI Min. Max. Med.
660 584.57 ± 214.09
(568.21 - 600.94) 250.00
1 000.00 500.00
11 481.82 ± 252.26
(312.35 - 651.29) 250.00
1 000.00 500.00
-
21 592.86 ± 254.60
(476.96 - 708.75) 250.00
1 000.00 500.00
66 549.24 ± 220.23
(495.10 - 603.38) 250.00
1 000.00 500.00
0.27

176
Table 3.2 Prescribed daily doses per prescription per year of fluoroquinolones in patients 18 years and younger stratified by
prescribers’ speciality (continued)
Year
General medical practice
Paediatrician Pharmacotherapist Specialist Other p – value
Levofloxacin
2011 n PDD ± SD
95% CI Min. Max. Med.
419 581.12 ± 217.38
560.25 250.00
1 000.00 500.00
6 652.78 ± 385.2
248.53 250.00
1000.00 708.33
-
10 455.00 ± 151.75
346.45 250.00 725.00 500.00
31 592.74 ± 245.73
502.61 250.00
1 000.00 500.00
0.27
2012 n PDD ± SD
95% CI Min. Max. Med.
384 580.53 ± 213.43
(559.12 - 601.95) 250.00
1 000.00 500.00
8 625.00 ± 231.46
(431.50 - 818.50) 250.00
1 000.00 500.00
-
8 437.50 ± 115.73
(340.75 - 534.25) 250.00 500.00 500.00
27 592.59 ± 220.88
(505.21 - 679.97) 250.00
1 000.00 500.00
0.26
Ofloxacin
2005 n PDD ± SD
95% CI Min. Max. Med.
979 1 212.82 ± 534.31
(1 179.31 – 1 246.33) 200.00
4 000.00 1 000.00
2 586.67 ± 301.70
(2 123.99 – 3 297.32) 200.00 800.00 586.67
1 400.00 ± 0.00
- 400.00 400.00 400.00
-
14 465.31 ± 196.49
(351.85 - 578.76) 200.00 800.00 400.00
0.0001
2006 n PDD ± SD
95% CI Min. Max. Med.
756 956.23 ± 461.90
(923.25 - 989.20) 200.00
4 000.00 800.00
4 600.00 ± 230.94
(232.52 - 967.48) 200.00 800.00 600.00
-
3 577.78 ± 384.90
(378.37 – 1 533.92) 200.00 800.00 800.00
7 506.12 ± 201.84
(319.45 - 692.79) 400.00 800.00 800.00
0.012
2007 n PDD ± SD
95% CI Min. Max. Med.
437 715.10 ± 134.44
(702.46 - 727.74) 200.00 800.00 800.00
- -
2 800.00 ± 0.00
- 400.00 400.00 400.00
9 577.78 ± 210.82
(415.73 - 739.83) 400.00 800.00 800.00
0.008
2008 n PDD ± SD
95% CI Min. Max. Med.
293 684.73 ± 156.02
(666.79 - 702.67) 200.00 800.00 800.00
- -
1 400.00 ± 0.00
- 400.00 800.00 800.00
5 720.00 ± 178.89
(497.88 - 942.12) 400.00 800.00 800.00
0.17

177
Table 3.2 Prescribed daily doses per prescription per year of fluoroquinolones in patients 18 years and younger stratified by
prescribers’ speciality (continued)
Year
General medical practice
Paediatrician Pharmacotherapist Specialist Other p – value
Ofloxacin
2009 n PDD ± SD
95% CI Min. Max. Med.
180 715.00 ± 148.79
(693.12 - 736.88) 200.00 800.00 800.00
5 344.00 ± 125.22
(188.52 - 499.48) 200.00 400.00 400.00
-
1 800.00 ± 0.00
- 400.00 800.00 800.00
4 700.00 ± 200.00
(381.76 - 1018.24) 200.00 800.00 800.00
< 0.0001
2010 n PDD ± SD
95% CI Min. Max. Med.
121 581.58 ± 247.34
(537.06 - 626.10) 200.00 800.00 666.67
9 200.00 ± 0.00
- 200.00 200.00 200.00
- -
2 600.00 ± 282.84
(-1 941.24 – 3 141.24) 400.00 800.00 600.00
< 0.0001
2011 n PDD ± SD
95% CI Min. Max. Med.
46 621.01 ± 238.24
(550.27 - 691.76) 200.00 800.00 800.00
- - -
1 400.00 ± 0.00
- 200.00 400.00 400.00
0.36
2012 n PDD ± SD
95% CI Min. Max. Med.
39 599.15 ± 238.48
(521.84 - 676.45) 200.00 800.00 666.67
- - -
1 800.00 ± 0.00
- 400.00 800.00 800.00
0.41
Enoxacin
2006 n PDD ± SD
95% CI Min. Max. Med.
2 550.00 ± 212.13
(-1 355.93 – 2 455.93) 200.00 700.00 550.00
- - - -
-

178
Table 3.2 Prescribed daily doses per prescription per year of fluoroquinolones in patients 18 years and younger stratified by
prescribers’ speciality (continued)
Year
General medical practice
Paediatrician Pharmacotherapist Specialist Other p – value
Gatifloxacin
2005 n PDD ± SD
95% CI Min. Max. Med.
159 434.47 ± 194.00
(404.08 - 464.85) 400.00
1 400.00 1 000.00
15 320.00 ± 101.42 (263.84 -376.16)
400.00 400.00 400.00
1 400.00 ± 0.00
- 400.00 400.00 400.00
-
28 428.57 ± 194.09
(353.31 - 503.83) 1 400.00
400.00 400.00
0.28
2006 n PDD ± SD
95% CI Min. Max. Med.
92 446.58 ± 288.49
(386.84 - 506.33) 400.00
2 800.00 400.00
9 364.44 ±73.33
(308.08 - 420.81) 400.00 400.00 400.00
265 369.82 ± 260.79 (338.28 - 401.36)
400.00 400.00 400.00
-
28 428.57 ± 194.09
(353.31 - 503.83) 400.00
1 400.00 400.00
0.63
2007 n PDD ± SD
95% CI Min. Max. Med.
10 400.00 ± 0.00
- 400.00 400.00 400.00
2 400.00 ± 0.00
- 400.00 400.00 400.00
- - -
-
2008 n PDD ± SD
95% CI Min. Max. Med.
1 400.00 ± 0.00
- 400.00 400.00 400.00
8 400.00 ± 0.00
- 400.00 400.00 400.00
- - -
-
Norfloxacin
2005 n PDD ± SD
95% CI Min. Max. Med.
701 1 126.92 ± 640.49
(1 079.43 – 1 174.42) 400.00
6 000.00 1 200.00
2 800.00 ± 0.00
- 400.00 800.00 800.00
1 800.00 ± 0.00
- 400.00 800.00 800.00
-
10 732.00 ± 215.03
(578.17 - 885.83) 400.00 800.00 800.00
0.21
2006 n PDD ± SD
95% CI Min. Max. Med.
626 979.62 ± 510.71
(939.53 – 1 019.70) 400.00
6 000.00 800.00
1 800.00 ± 0.00
- 400.00 800.00 800.00
-
2 800.00 ± 0.00
- 400.00 800.00 800.00
10 760.00 ± 126.49
(669.51 - 850.49) 400.00 800.00 800.00
0.53

179
Table 3.2 Prescribed daily doses per prescription per year of fluoroquinolones in patients 18 years and younger stratified by
prescribers’ speciality (continued)
Year General medical practice
Paediatrician Pharmacotherapist Specialist Other p - value
Norfloxacin
2007 n PDD ± SD
95% CI Min. Max. Med.
475 777.77 ± 103.23
(768.46 - 787.08) 400.00
4 200.00 800.00
1 400.00 ± 0.00
- 400.00 800.00 800.00
-
5 600.00 ± 282.84
(248.80 - 951.20) 400.00 800.00 800.00
8 710.00 ± 168.01
(569.54 - 850.46) 400.00 800.00 800.00
< 0.0001
2008 n PDD ± SD
95% CI Min. Max. Med.
363 780.86 ± 89.04
(771.67 - 790.05) 400.00 800.00 800.00
1 800.00 ± 0.00
- 400.00 800.00 800.00
-
2 800.00 ± 0.00
- 400.00 800.00 800.00
4 700.00 ± 200.00
(381.76 – 1 018.24) 400.00 800.00 800.00
0.35
2009 n PDD ± SD
95% CI Min. Max. Med.
315 771.40 ± 108.27
(759.39 - 783.40) 400.00 800.00 800.00
- -
180 338.89 325.30 400.00 800.00 800.00
7 742.86 ± 151.19
(603.03 - 882.68) 400.00 800.00 800.00
0.74
2010 n PDD ± SD
95% CI Min. Max. Med.
223 755.89 ± 137.37
(737.76 - 774.02) 400.00 800.00 800.00
2 800.00 ± 0.00
- 400.00 800.00 800.00
- -
2 800.00 ± 0.00
- 400.00 800.00 800.00
0.82
2011 n PDD ± SD
95% CI Min. Max. Med.
173 744.29 ± 147.70
(722.13 - 766.46) 400.00 800.00 800.00
- -
5 800.00 ± 0.00
- 400.00 400.00 400.00
4 620.00 ± 210.40
(285.21 - 954.79) 400.00 800.00 640.00
0.03
2012 n PDD ± SD
95% CI Min. Max. Med.
122 777.70 ± 90.99
(761.40 - 794.01) 400.00 800.00 800.00
- - -
4 800.00 ± 0.00
- 400.00 800.00 800.00
0.63

180
Table 3.2 Prescribed daily doses per prescription per year of fluoroquinolones in patients 18 years and younger stratified by
prescribers’ speciality (continued)
Year General medical practice
Paediatrician Pharmacotherapist Specialist Other p - value
Gemifloxacin
2005 n PDD ± SD
95% CI Min. Max. Med.
231 373.77 ± 176.04
(350.95 - 396.59) 320.00
1 120.00 320
- -
2 320.00 ± 0.00
- 320.00 320.00 320.00
12 320.00 ± 0.00
- 320.00 320.00 320.00
0.52
2006 n PDD ± SD
95% CI Min. Max. Med.
265 266.67 ± 92.38
(37.19 - 496.14) 320.00
3 413.00 320.00
3 320.00 ± 0.00
- 320.00 320.00 320.00
-
1 320.00 ± 0.00
- 320.00 320.00 320.00
18 320.00 ± 0.00
- 320.00 320.00 320.00
0.85
2007 n PDD ± SD
95% CI Min. Max. Med.
320 314.37 ± 41.37
(309.82 - 318.92) 320.00 533.33
320
1 320.00 ± 0.00
- 320.00 320.00 320.00
-
2 186.67 ± 188.56
(-1 507.49 – 1 880.83) 320.00 320.00 186.67
11 320.00 ± 0.00
- 320.00 320.00 320.00
0.0004
2008 n PDD ± SD
95% CI Min. Max. Med.
202 320.00 ± 0.00
- 320.00 320.00 320.00
1 320.00 ± 0.00
- 320.00 320.00 320.00
-
1 320.00 ± 0.00
- 320.00 320.00 320.00
3 320.00 ± 0.00
- 320.00 320.00 320.00
-
2009 n PDD ± SD
95% CI Min. Max. Med.
197 315.42 ± 32.55
(310.85 - 319.99)
1 320.00 ± 0.00
- 320.00 320.00 320.00
-
2 320.00 ± 0.00
- 320.00 320.00 320.00
6 320.00 ± 0.00
- 320.00 320.00 320.00
0.98
2010 n PDD ± SD
95% CI Min. Max. Med.
129 316.11 ± 26.97
(311.41 - 320.81) 320.00 320.00
- - -
4 320.00 ± 0.00
- 320.00 320.00 320.00
0.77

181
Table 3.2 Prescribed daily doses per prescription per year of fluoroquinolones in patients 18 years and younger stratified by
prescribers’ speciality (continued)
Year General medical practice
Paediatrician Pharmacotherapist Specialist Other p - value
Gemifloxacin
2011 n PDD ± SD
95% CI Min. Max. Med.
41 320.00 ± 0.00
- 320.00 320.00 320.00
1 320.00 ± 0.00
- 320.00 320.00 320.00
- - -
-
2012 n PDD ± SD
95% CI Min. Max. Med.
27 310.12 ± 51.32
(289.82 - 330.42) 320.00 320.00 320.00
- - -
3 320.00 ± 0.00
- 320.00 320.00 320.00
0.75
Lomefloxacin
2005 n PDD ± SD
95% CI Min. Max. Med.
20 760.00 ± 578.93
(489.05 - 1030.95) 400.00
2 000.00 400.00
- - - -
-
2006 n PDD ± SD
95% CI Min. Max. Med.
37 551.35 ± 303.33
(450.21 - 652.49) 400.00
2 000.00 400.00
- - - -
-
2007 n PDD ± SD
95% CI Min. Max. Med.
6 400.00 ± 0.00
- 400.00 400.00 400.00
- - - -
-
2008 n PDD ± SD
95% CI Min. Max. Med.
6 400.00 ± 0.00
- 400.00 400.00 400.00
- - - -
-

182
Table 3.2 Prescribed daily doses per prescription per year of fluoroquinolones in patients 18 years and younger stratified by
prescribers’ speciality (continued)
Year General medical practice
Paediatrician Pharmacotherapist Specialist Other p - value
Lomefloxacin
2009 n PDD ± SD
95% CI Min. Max. Med.
6 400.00 ± 0.00
- 400.00 400.00 400.00
- - - -
-
2010 n PDD ± SD
95% CI Min. Max. Med.
1 400.00 ± 0.00
- 400.00 400.00 400.00
- - - -
-
Where n – number of fluoroquinolone agents; PDD – prescribed daily dose (average); SD – standard deviation; CI – confidence interval; Min. –
minimum prescribed dose; Max. – maximum prescribed dose; and Med. - median

183
3.6 Chapter summary
In this chapter, three manuscripts were presented addressing the objectives of the empirical
investigation. The chapter concluded with additional results obtained from the empirical
investigation. The next chapter, which concludes the study, focuses on the conclusion,
strengths and limitations of the study, and recommendations for future studies.
184
CHAPTER 4: CONCLUSIONS, LIMITATIONS, STRENGTHS AND
RECOMMENDATIONS
4.1 Introduction
The focus of the final chapter is to draw conclusions from the study with regard to the
specific objectives outlined. This chapter begins with a brief overview of the content of the
dissertation and a summary of findings from the study. The strengths and limitations will be
outlined, concluding the chapter with recommendations for future studies.
4.2 Content of dissertation
This dissertation consisted of four chapters. Chapter 1 provided a general overview of the
study, centring on providing a background, defining the problem, research questions that will
be answered, the aim, specific objectives and methodology utilised in the study.
Chapter 2 focused on providing a general summary of antibiotics and their use from
literature. The fluoroquinolones as a pharmacological group of antibiotics were extensively
discussed in adults and in children 18 years and younger. This was followed by a
conceptualisation of antimicrobial resistance and the resistance patterns of clinically relevant
bacteria in sub-Saharan Africa. The global usage patterns of antibiotics, with an emphasis
on fluoroquinolones, were further investigated. The use of antibiotics was found to have a
significant correlation with the emergence of antibiotic resistance, and interventions set up to
monitor and control the use of antibiotics globally were identified. The chapter concluded
with the quantitative measurement of antibiotic use in health settings with an emphasis on
the ATC/DDD methodology.
Chapter 3, representing the results and discussions section of the dissertation, was
presented in the form of manuscripts. Additional results were presented in section 3.4. Three
manuscripts were presented with the following titles:
Manuscript 1: Antibiotic prescribing patterns in the South African private health sector
(2005-2012).
Manuscript 2: Fluoroquinolone utilisation patterns in adults in the private health sector of
South Africa (2005-2012).
Manuscript 3: Prescribing patterns of fluoroquinolones in children and adolescents in the
private health sector of South Africa (2005-2012).

185
4.3 Conclusions from the study
The goal of the study was to determine the prescribing patterns of antibiotics with an
emphasis on fluoroquinolones in the private health sector in South Africa, analysing eight
years’ medicine claims data. The study was based on two main approaches focusing on the
literature review and the empirical investigation. The empirical study followed a quantitative,
descriptive, observational design using retrospective, longitudinal medicine claims data
provided by a nationally representative Pharmaceutical Benefit Management company
(PBM). The conclusions from the specific research objectives follow in the subsequent
paragraphs.
4.3.1 Conclusions from the literature review
The objectives of the literature review outlined in paragraph 1.5, Chapter 1, were achieved in
Chapter 2 of this dissertation. The following paragraphs summarise the findings:
To conceptualise antibiotics and their use
Antimicrobials were defined as low molecular microbial metabolites that limit the growth of
micro-organisms at low concentrations (Gelone & O’Donnell, 2005:1633; Lancini et al.,
1995:1). The term has also been referred to semi-synthetic antimicrobials (Chambers,
2001a:1143). In this study, the following pharmacological group of antibiotics were
considered: penicillins, cephalosporins, carbapenems, aminoglycosides, chloramphenicol,
fluoroquinolone, macrolides, tetracycline, sulphonamides and trimethoprim. The
mechanisms of action of penicillins, cephalosporins, carbapenems, aminoglycosides,
chloramphenicol, macrolides, tetracycline, sulphonamides and trimethoprim were briefly
investigated. The spectrum of activity, adverse effects and clinical uses were summarised
briefly (refer to paragraphs 2.2.2.1 to 2.2.2.11).
Determine, from literature, fluoroquinolones as a pharmacological group of
antibiotics, their indications for use, side effects, drug interactions and special
precautions
Quinolones were extensively covered to achieve the goal of the study. It was established
from literature that they are a synthetic group of antibiotics originating from nalidixic acid
(Norris & Mandell, 1988:2). The fluorine at position six creates the fluoroquinolone group,

186
increasing their potency against aerobes (Domagala, 1994:686; Stahlmann & Lode,
1999:305; Wolfson & Hooper, 1985:581). The fluoroquinolones were found to be a very
important pharmacological group of antibiotics due to their anti-pseudomonal activity,
especially ciprofloxacin (Domagala, 1994:685). As discussed in paragraph 2.2.2.12.2, the
fluoroquinolones selectively interact with two bacterial targets, the related enzymes DNA
gyrase (topo-isomerase II), an essential bacterial enzyme that keeps the super-helical twists
in DNA and that are involved in DNA replication, and topo-isomerase IV, which act in
terminal stages of the separation of the interlinked daughter chromosomes (Wolfson &
Hooper, 1985:581).
Currently, five distinct generations have been proposed based on their spectrum of activity,
in vitro properties and clinical uses. The first four major classifications systems have been
proposed by Andriole and Schellhorn (1997:64); Ball (2000:18); King et al. (2000); and
Naber and Adam (1998:255). Andriole and Schellhorn (1997:64); and Ball (2000:18)
grouped fluoroquinolones into three main generations, whereas King et al. (2000); and
Naber and Adam (1998:255) grouped them into four main generations. None of these
classifications have been adopted universally, although several sources (Blondeau, 2004:75;
Goldman & Kearns, 2011:3; Liu, 2010:355; Oliphant & Green, 2002:457; Scholar, 2002:165;
Sharma et al., 2009:588) make reference to King and colleagues’ (2000) classification. The
latter classification system categorises fluoroquinolones into five main generations
(Somasundaram & Manivannan, 2013:298). The fifth group is represented by delafloxacin,
which is currently in the development phase (Anon., 2014).
From literature, it was established that fluoroquinolones possess good pharmacokinetic
profiles allowing flexible dosing. They were found to have rapid absorption after oral and
parenteral administration with peak plasma concentrations being reached one to three hours
after administration (Scholar, 2003:166; Sharma et al., 2009:597). Their long elimination
half-lives permit a once or twice daily dosing regimen (Stein, 1996:19) and their
bioavailability is not affected by the presence of food (Oliphant & Green, 2002:455; Sharma
et al., 2009:597). Fluoroquinolones undergo renal or hepatic clearance, or both (Hooper &
Wolfson, 1991:386-387; Oliphant & Green, 2002:455; Scholar, 2003:167).
Due to their broad antimicrobial spectrum, fluoroquinolones are agents of choice for the
treatment of uncomplicated and complicated urinary tract infections, acute sinusitis, acute
exacerbations of chronic bronchitis, community acquired pneumonia (CAP), skin and skin
structure infections, and intra-abdominal infections caused by susceptible organisms (King et

187
al., 2000; McEvoy et al., 2002:764-822).
The major side effects of fluoroquinolones were found to be dependent on the structural
configuration of the fluoroquinolone compound. The major side effects included gastro-
intestinal effects involving nausea (Lober et al., 1999:1069), vomiting, dyspepsia and
abdominal pain (Stass & Kubitza, 1999:85); central nervous system (CNS) effects involving
headache (Stass & Kubitza, 1999:85), dizziness, tiredness and sleepiness (Saravolatz &
Legget, 2003:1213); hypersensitivity reactions involving erythema, pruritus, urticaria and
rash; photosensitivity reactions, arthralgia; tendonitis (Meyers et al., 2013:229); prolongation
of the QT interval resulting in arrhythmias and torsades de pointes (Lapi et al., 2012:1460);
and peripheral neuropathy (Cohen, 2001:1541-1543)
From literature, fluoroquinolones in pre-clinical studies were found to induce changes in the
immature articular cartilage of the weight-bearing joints of young laboratory animals
(Burkahdt et al., 1997:1199; Gough et al., 1992:444). Studies have, however, reported few
or no incidence of arthralgia and tendonitis in patients (children) 18 years and younger
(Arguedas et al., 2003; Chalumeau et al., 2003; Goldman & Kearns, 2011:2; Hampel et al.,
1997; Saez-llorenz et al., 1997; Yee et al., 2002; Zimbabwe et al., 2002). Due to their
effectiveness and reported safety (refer to Table 2.9), in 2006, the Committee on Infectious
Diseases in the United States (2006:1290) recommended the use of fluoroquinolones in
children younger than 18 years in infections caused by MDR pathogens for which there are
no safer and effective alternatives. Additionally, they have been indicated when therapies by
parenteral route are not possible and there are no other agents available. This
recommendation was based on the evaluation of several studies that reported the incidence
of mild to moderate incidences of arthralgia.
Determine antibiotic prescribing patterns in Europe, United States and Africa with
an emphasis on fluoroquinolones; and resistance patterns in Africa
Antimicrobial resistance was found to be an intrinsic feature in microorganisms whereby the
organism has the ability to exchange genetic materials to survive changing environmental
conditions and occupy certain ecological niches (Cohen, 1992:1053). The following are
resistance mechanisms by microorganisms (Denis et al., 2010:91; Sefton, 2002:560):
Active expulsion of antibiotic from the bacterial cell by trans-membrane efflux system.
Modification of the bacterial cell envelope rendering it less permeable to the drug.
Modification of target site.

188
Production of protective proteins at target site.
Inactivation of the drug by specific enzymes before or after the drug enters the cell of the
bacteria.
Acquisition of target by-pass by a unique metabolic pathway.
Extrinsic factors such as selective pressures influenced by patterns of antimicrobial
prescribing and use, societal and technological changes, and poor infection control
surveillance systems were also attributed to the emergence of antimicrobial resistance
(Essack, 2006:51; Harbath & Samore, 2005:794-795; Laxminarayan et al., 2013).
It was established that globalisation has enabled the rapid spread of infectious disease
agents (WHO, 2001:11). Over the years, the incidence and prevalence of resistant strains
have been identified globally, and sub-Saharan Africa is no exception (refer to table 2.13).
Antimicrobial resistance was found to cause an increase in morbidity, mortality and medical
costs associated with infections (Canadian Committee on Antimicrobial Resistance,
2003:159; CDC, 2013:11; Cohen, 1992:1053; Cosgrove et al., 2005:171; Crowther-Gibson
et al., 2011:567; ECDC, 2009:13; Engemann et al., 2003:586; Goossens et al., 2007:1093;
Laxminarayan et al., 2013; McKenna, 2013; Reed et al., 2005:182). An improvement in the
use of antibiotics was found to be an integral part in controlling antimicrobial resistance
(WHO, 2001:4-7). In view of this, the global patterns of antibiotics were analysed. From the
iconic studies evaluated, the use of antibiotics showed an increase globally (Adriaenssens et
al., 2011a:6-7; Cars et al., 2001:1854; Dumartin et al., 2010:2030; Essack et al., 2011:565-
566; Ferech et al., 2006:403-404; Goossens et al., 2005:381-383; Gould, 2005:122;
Janknegt et al., 2000:252; Wirtz et al., 2010:220). The dominant use of penicillins (especially
in combination with a beta-lactamase inhibitor) was observed in most of these studies.
Among the fluoroquinolones, ciprofloxacin was the most widely prescribed (Adriaessens et
al., 2011b:6-7; Ferech et al., 2006:424; Goossens et al., 2007:1094; Kotwani & Holloway,
2011:5-6; Polk et al., 2004:499; Wirtz et al., 2010:220).
Identify interventions set up to monitor and control the use of antibiotics globally
Although the usage of antibiotics was strongly correlated with resistance (Austin et al.,
1999:1156; Pechere, 2001:172; Laxminyaran et al., 2013), irrational use was found to
accelerate resistance to a greater extent (WHO, 2013:25). From the literature, approximately
50% of all hospital visits ended with a prescription for an antibiotic, of which a significant
proportion was deemed inappropriate (Abula & Kedir, 2004:37; Al-Ghamdi et al., 2002:118;

189
Gonzales et al., 2001:759; Katende-Kyenda et al., 2006:705; Polk et al., 2007:671; Raveh et
al., 2001:146; Tunger et al., 2000:134). The appropriate use of antibiotics was found to be of
prime importance in combating resistance.
Three major groups of interventions for appropriate antibiotic use were identified and are
grouped as follows (Davey et al., 2013:6): restrictive, educational and structural
interventions. Measuring the outcomes of implemented interventions was found to be
expedient in assessing their effectiveness. Among the parameters recommended for
assessment, monitoring the changes in total and targeted drug usage before and after
implementation were found to be vital (Brown, 2005:180-181).
Units for measuring drug use such as cost figures (Haaijer-Ruskamp & Dukes, 1993:130),
prescription volume (WHO, 2003:39) and number of units dispensed (Capella, 1993:59)
were identified. These units were found to have major flaws in comparing drug use between
countries (MacKenzie & Gould, 2005:105). The ATC/DDD methodology was developed by
the WHO to address the shortcomings of the previous units (WHO, 2003:33). The
Anatomical Therapeutic Chemical (ATC) classification system categorises drugs into
fourteen main groups according to the organ or system on which they act and their
therapeutic, pharmacological and chemical properties; stratified at five different levels (refer
to Table 2.14). The first level represents the anatomical group; further narrowing down to the
fifth level represented by the chemical substance. Each drug is assigned a distinct ATC
code. For example, antibiotics for systemic use, according to the classification, belong to the
J01 group at the second level. Fluoroquinolones, a pharmacological group of antibiotics,
belong to the J01MA group at the fourth level (refer to Table 2.14).
The defined daily dose (DDD), defined as the assumed average maintenance dose per day
for a drug used for its main indication in adults, is a technical unit of measurement developed
to quantify drug use devoid of cost and physical units (WHO, 2003:20). DDDs are assigned
to drugs at the fifth level of the ATC classification (Hutchinson et al., 2004:30). Rates used to
express drug use such as DDD per 1 000 inhabitants, DDD per 100 bed-days, and the DDD
per inhabitants were identified from literature (WHO, 2013:26). For the purpose of this study,
outpatient antibiotic use in adults was quantified using DDD per 1 000 inhabitants (DID).
Quantifying drug use with the DDD, however, does not provide a true reflection of doses
prescribed to the patient as it is derived from the average maintenance dose in adults. The
prescribed daily dose (PDD) was further identified as an appropriate means of determining

190
the average dose prescribed according to a representative sample of prescriptions. A major
advantage of the PDD over the DDD is its appropriateness in describing drug use, especially
in children.
4.3.2 Conclusions from the empirical investigation
The objectives of the empirical investigation were realised in Chapter 3. Three manuscripts
were developed from the specific objectives outlined (refer to paragraph 1.4.2). The following
paragraphs summarise the findings:
Investigating the prescribing patterns of antibiotics viz. age, gender, seasonal and
geographic variation, over the eight-year period for the various pharmacological
groups of antibiotics
A total of 5 155 262 (44.8%) patients out of the total number of patients who claimed
prescriptions received at least one prescription for an antibiotic from 2005 to 2012. Of the
total number of prescriptions claimed during the study period, 17.6% represented antibiotic
prescriptions and antibiotic agents represented 7.9% of the total number of medicine items
claimed. Patients claiming antibiotic prescriptions decreased by 7.9% from 2005 to 2012.
The general decrease in antibiotic prescribing may be attributed to antibiotic stewardship
programmes initiated in the private health sector in 2009 to promote prudent antibiotic use
(Gelband & Duse, 2011:596). From the study, the frequency of antibiotic prescriptions was
higher in females (n = 2 831 686, 54.9%) than in males (n = 321 635, 45.1%). The higher
proportion of females in the total population of South Africa (Statistics South Africa, 2011)
and the pronounced health-seeking behaviour in females (Verbrugge, 1982:430) were
provided as possible reasons for the finding. Children and adolescents up to 18 years
claimed the most antibiotic prescriptions. The result confirms the high incidence of infections
in this age group, since their level of immunity is still under-developed (Katende-kyenda et
al., 2006:705).
Gauteng had the highest prevalence of patients receiving antibiotics, increasing by 3.3%
from 2005 to 2012. This confirmed factors such as high population density, urbanisation,
migration and the close proximity in living areas being associated with the increased spread
of infections and the use of antibiotics (Alirol et al., 2011:133). Conversely, the Northern
Cape had the lowest prevalence of patients claiming antibiotics. Patients claiming antibiotic
prescriptions in Limpopo, KwaZulu-Natal and the Eastern Cape decreased by 3.1%, 2.7%

191
and 1.0% respectively during the study period. However, there was no practical association
between the prevalence of patients receiving antibiotics and province (p < 0.0001, Cramer’s
V ≤ 0.2).
Consistent with studies from Europe (Adriaenssens et al., 2011a:7) and in South America
(Wirtz et al., 2010:220), penicillins were the most widely prescribed antibiotic. This was
followed by the fluoroquinolones, macrolides and cephalosporins. The carbapenems and
chloramphenicol were the least prescribed in all age groups. There was no practical
association between the number of antibiotic agents claimed with age, gender or season
(Cramer’s V < 0.2). The use of broad-spectrum antibiotics such as amoxicillin-clavulanic
acid, azithromycin, clarithromycin and the sulphadoxine/trimethoprim combination increased
more than 0.7% from 2005 to 2012.
Lastly, antibiotic prescribing was found to be high from the months of May to August
representing the winter season in South Africa. This confirmed trends in Europe
(Adriaenssens et al., 2011a:7) and America (Wirtz et al., 2010:220). However, no practically
significant association was found between antibiotic prescribing and seasonal trends
(p < 0.0001, Cramer’s V < 0.2) (refer to manuscript 1).
Investigating specifically the prescribing patterns of the various groups of
fluoroquinolones focusing on longitudinal prevalence variations using the defined
daily dose (DDD) per 1 000 inhabitants per day for adults
A total of 1 397 960 patients older than 18 years received 1 983 622 fluoroquinolone
prescriptions and 1 998 552 fluoroquinolone agents during the study period. Overall, the
prevalence of fluoroquinolone prescriptions decreased by 3.6% from 2005 to 2012. Contrary
to studies from Europe (Adriaenssens et al., 2011b:7), the United States (Linder et al.,
2005:263) and eight Latin American countries (Wirtz et al., 2010:220) that reported an
increase in the use of fluoroquinolones over the past decade, the present study showed a
decrease in the number of fluoroquinolone prescriptions claimed from 2005 to 2012.
The average number of fluoroquinolone prescriptions per patient per year ranged from
1.45 ± 0.92 (95% CI 1.44-1.45) in 2005 to 1.31± 0.71 (95% CI 1.31-1.32) in 2012. Females
received more fluoroquinolone prescriptions than males did over the study period; 60.8% vs.
39.2%. The high prescribing of fluoroquinolones in females may be associated with the
increased risk of having urinary tract infection due to the use of spermicides as birth control,

192
genetic disposition and sexual behaviour (Fihn et al., 1996:514; Foxman, 2002:6; Hooton et
al., 1996:469; Lindsay, 2002:135-136). The highest prevalence of fluoroquinolone
prescriptions was observed in the age group 45 to 65 years, representing 37% (n = 511 542)
of patients who received a prescription for fluoroquinolone. This finding was in contrast with
other studies that observed the highest use in patients above 65 years (Blix et al., 2007:973;
Franchi et al., 2011:304; Gallini et al., 2012:2913; Lallana-Alvarez et al., 2012:593; Litwin &
Saigal, 2012:365; Majeed & Moser, 1999:736). However, no practically significant
association was found between the prevalence of fluoroquinolone prescriptions and gender
(p < 0.0001, Cramer’s V = 0.02) or age group (p < 0.0001, Cramer’s V = 0.04) during the
study period. Additionally, no practically significant differences were found between the
average DDD per prescription per patient over the study period (Cohen’s d-value < 0.8).
Norfloxacin was the only first-generation fluoroquinolone prescribed. Its use decreased
during the study period confirming Adriaenssens et al.’s (2011b:6) study involving 33
European countries. The second-generation fluoroquinolones accounted for the majority of
all the fluoroquinolone agents prescribed during the study period. Ciprofloxacin was the most
prescribed fluoroquinolone, consistent with studies conducted in Europe (Adriaenssens et
al., 2011b:6), the United States (Goossens et al., 2007:1093, Linder et al., 2005:262), eight
Latin American countries (Wirtz et al., 2010:220) and Tanzania (Van de Boogaard et al.,
2010:146). The use of ciprofloxacin was, however, found to decrease over the study period.
This decrease was attributed to the shift from ciprofloxacin to cefixime in 2008 in the
treatment of gonococcal infection due to resistance to ciprofloxacin (Crowther-Gibson et al.,
2011:574). Levofloxacin was the second most prescribed fluoroquinolone, increasing by 0.21
DID from 2005 to 2012. Moxifloxacin and gatifloxacin were the only third-generation
fluoroquinolone prescribed. Moxifloxacin was the most prescribed fluoroquinolone in this
generation. Gatifloxacin use was only observed from 2005 to 2008 due to its withdrawal from
the market due to safety concerns in 2008 (Baker et al., 2006; FDA, 2008) (refer to
manuscript 2).
Describing the prescribing patterns of the various groups of fluoroquinolones in
children viz. age, gender and speciality of prescribers over the study period
comparing the prescribed daily dosages (PDD) to the recommended daily doses
(RDD)
A total of 1 366 824 patients, 18 years and younger, claimed antibiotic prescriptions, of
which 3.6% (n = 49 540) received at least one prescription for a fluoroquinolone during the

193
study period. The percentage of patients receiving fluoroquinolone prescriptions decreased
by 0.7% from 2005 to 2012. Overall, 57 325 prescriptions for fluoroquinolones and 57 593
fluoroquinolone agents were claimed.
The prevalence of fluoroquinolone prescriptions was higher in females throughout the study
period. The highest prevalence of patients receiving fluoroquinolone prescriptions was
observed in patients between 12 and 18 years; and the lowest prevalence was observed in
patients five years and younger, confirming the trends in France (Genuini et al., 2014) and
the United States (Committee on Infectious Diseases, 2006:1280). Ciprofloxacin was the
most prescribed fluoroquinolone in all the age groups, though its use decreased over the
study period. In South Africa, ciprofloxacin is the only fluoroquinolone with several
indications in paediatrics such as typhoid fever, shigellosis, cholera and chemoprophylaxis of
bacterial meningitis in close contact (Department of Health, 2013). From the literature,
although there were outbreaks of typhoid fever in 2005 (Keddy et al., 2011:140) and cholera
(Blumberg et al., 2011:196) between 2008 and 2009, the incidences of bacterial meningitis,
shigellosis and typhoid fever decreased over the study period.
Levofloxacin and moxifloxacin were the second most used fluoroquinolones in all the age
groups. They are included together with ofloxacin in the treatment of MDR-TB in children
(Department of Health, 2013). MDR-TB cases are mostly treated in the public health sector.
Usage in the private sector was not certain as data on diagnoses were incomplete (refer to
manuscript 3).
Dosing of fluoroquinolones in children is essential to achieve the desired therapeutic effects
and to limit resistance (Alghasham & Nahata, 2000:348). In 2005, maximum doses for
ofloxacin and moxifloxacin were exceeded in children five years and younger; and in children
between 12 and 18 years, maximum doses were exceeded for ofloxacin, moxifloxacin and
norfloxacin in 2005 and 2006. The reason for this observation was, however, not certain.
Practically significant differences were found in the average PPDs between 2005 and the
other years under study for norfloxacin in children between five and 12 years (Cohen’s d-
value ≥ 0.84); between 2006 and 2010 (Cohen’s d-value = 0.83) and between 2006 and
2011 (Cohen’s d-value = 1.04) in patients between 12 and 18 years. For ofloxacin,
practically significant differences were found in the average PPDs between 2005 and the
subsequent years in patients between five and 12 years (Cohen’s d-value ≥ 0.80); between
2006 and 2010, 2011, 2012 (Cohen’s d-value ≥ 1.43); between 2007 and 2010, 2012

194
(Cohen’s d-value ≥ 0.87); between 2008 and 2010, 2012 (Cohen’s d-value ≥ 0.82); and
between 2009 and 2012 (Cohen’s d-value = 1.03) in patients between five and 12 years,
practically significant differences were found in the average PPDs between 2005 and the
other years under study (Cohen’s d-value ≥ 1.16); and between 2006 and 2010 (Cohen’s d-
value = 0.87) (refer to paragraph 3.5.1). Lastly, for norfloxacin, practically significant
differences were observed in the differences in the average PPDs between 2005 and the
other years under study (Cohen’s d-value ≥ 0.88).
In all age groups, general medical practitioners accounted for most fluoroquinolone
prescribing. They were accountable for high doses prescribed for all fluoroquinolones
dispensed (refer to paragraph 3.4). In 2007, general medical practitioners prescribed higher
doses of ciprofloxacin than pharmacotherapists did (Cohen’s d-value = 1.24). PDDs for
ofloxacin were observed to be higher in general medical practitioners than the rest of the
prescribers in 2005 (Cohen’s d-value ≥ 1.41) and in 2006 (Cohen’s d-value ≥ 0.80). Again in
2007, PDDs by general medical practitioners differed significantly from other prescribers
(Cohen’s d-value = 1.01) and between the specialists and other prescribers (Cohen’s d-
value = 1.63). In 2009, high PDDs were observed in general medical practitioners compared
to paediatricians (Cohen’s d-value = 2.49); between the specialists and paediatricians
(Cohen’s d-value = 3.05); and between paediatricians and other prescribers (Cohen’s d-
value = 2.38). Finally, in 2010, the differences in the PDDs between the general medical
practitioners and paediatricians were found to be practically significant (Cohen’s d-value =
1.59); as well as that between the specialists and paediatricians (Cohen’s d-value = 1.67)
(refer to additional results). Although high doses prescribed for fluoroquinolones were
observed by general medical practitioners, they could not be explored further to draw
satisfactory conclusions as data for diagnoses were incomplete.
4.4 Limitations of study
The first limitation to this study was the inability to correlate antibiotic use with diagnoses as
data in this regard were incomplete. Strom (2006:169) explained that most claims are
reimbursed based on the right procedures taken during the outpatient encounter and not on
the diagnoses. Furthermore, most general practitioners are not well motivated to provide
diagnoses for a drug to be reimbursed (Strom, 2006:170); this may be true in the South
African setting.
Secondly, it was not certain whether antibiotics were actually consumed by patients and

195
consequently may not actually reflect total antibiotic use in the population. The medicine
claims data only furthermore provided information on outpatient encounters in the private
health sector and medications reimbursed by the PBM company. Thirdly, medicines not
covered by the medical aid and paid by the patient were excluded and consequently limits
the scope of the empirical investigation. Lastly, the data field for the weight of patients was
lacking in the database. This flaw affected the precise determination of the recommended
daily doses (RDD) of fluoroquinolones in patients 18 years and younger.
Despite these limitations, this is the first study to be conducted in South Africa measuring
fluoroquinolone use in adults according to the ATC/DDD classification system by the use of
medicine claims data. Furthermore, it is the first study comparing the prescribed daily doses
(PDD) to the recommended daily doses (RDD) of fluoroquinolones prescribed in patients 18
years and younger and the influence of the type of prescriber on the PDD in the private
health sector of South Africa utilising medicine claims data. The South African private health
sector has coverage of approximately 20% of the country’s population, especially for those in
employment. Medical aid schemes remain the main means of financing in the South African
private health sector. The PBM company processes approximately 300 000 real-time and
30 000 doctor transactions daily. The reliability and validity of the data were ensured by
gate-keeping services, eligibility services, utilisation management services, clinical
management services and pricing management along with real-time benefit management
(refer to paragraph 1.5.2.2.1).
According to Strom (2005:167), medicine claims databases are beneficial in
pharmacoepidemiological studies with regard to providing large sample populations
representative of the general population in the identification of rare events in drug use. This
is evident in the use of fluoroquinolones in patients 18 years and younger. The use of
information from the medicine claims database also provided a suitable denominator to
describe fluoroquinolone employing the ATC/DDD methodology. Finally, recall or interviewer
biases, which distort findings, were avoided in the study because of the use of medicine
claims data.
4.5 Recommendations
From the study, the following recommendations are proposed:
Effective interventions should be instituted nationwide to curb antibiotic use, particularly
during the winter seasons, as a majority of upper respiratory tract infections may be of
viral origin.

196
Proper and effective infection control methods should be directed at Gauteng to reduce
antibiotic use.
It is also recommended that further studies be conducted to determine the future
implications on the use of new broader-spectrum antibiotics such as
amoxicillin/clavulanic acid, azithromycin and levofloxacin; and their evidence in proper
infection control.
The ATC/DDD methodology must be used to quantitatively measure antibiotic use in
other health settings to enable comparison across different levels, e.g. the public and
private health sectors.
Further studies are recommended to identify the indication for use of fluoroquinolones
such enoxacin, gemifloxacin, lomefloxacin, gatifloxacin and norfloxacin, which are not
indicated in patients who are 18 years and younger.
Interventions must be aimed at prescribers, especially general medical practitioners, to
influence the prescribing habits with reference to prescribing unapproved
fluoroquinolones in patients who are 18 years and younger.
Prescribers should be encouraged to include the International Classification of Diseases
(ICD)-10 diagnoses codes on prescriptions issued to facilitate future epidemiological
studies.
Finally, appropriate interventions should be instituted to educate prescribers on the
recommended daily doses of fluoroquinolones approved in children.
4.6 Chapter summary
This final chapter completes the study by correlating the achievements of the study to the
specific objectives outlined from the beginning of the study. The strengths and limitations
were described, and recommendations for future research were made.

197
References
Abasaeed, A.E., Vleck, J., Abuelkhair, M.A., Andrajati, R. & Elnour, A.A. 2013. A
comparative study between prescribed and over-the-counter antibiotics. Saudi medical
journal, 34(15):1048-1054.
Abula, T. & Kedir, M. 2004. The pattern of antibiotic usage in surgical inpatients of a
teaching hospital in Northwest Ethiopia. Ethiopian journal on health development, 18(1):35-
39.
Adegbola, R.A., Hill, R.C., Secka, O., Ikumapayi, U.N., Lahai, G., Greenwood, B. & Corah,
T. 2006. Serotype and antimicrobial susceptibility patterns of isolates of Streptococcus
pneumoniae causing invasive disease in The Gambia, 1996-2003. Tropical medicine and
international health, 11(7):1128-1135.
Adorka, M., Dikokole, M., Mitonga, K.H. & Allen, K. 2013. Health care providers’ attitude
and perceptions in infection diagnoses and antibiotic prescribing in public health institutions
in Lesotho: A cross-sectional survey. African health sciences, 13(2):344-349.
Adriaenssens, N., Coenen, S., Versporten, A., Muller, A., Minalu, G., Faes, C.,
Vankerckhoven, V., Aerts, M., Hens, N., Molenberghs, G. & Goossens, H. 2011a.
European Surveillance of Antimicrobial Consumption (ESAC): Outpatient antibiotic use in
Europe (1997–2009). Journal of antimicrobial chemotherapy, 66(Suppl. 6):S3-S12.
Adriaenssens, N., Coenen, S., Versporten, A., Muller, A., Minalu, G., Faes, C.,
Vankerckhoven, V., Aerts, M., Hens, N., Molenberghs, G. & Goossens, H. 2011b.
European Surveillance of Antimicrobial Consumption (ESAC): outpatient quinolone use in
Europe (1997-2009). Journal of antimicrobial chemotherapy, 66(Suppl. 6):S47-S56.
Agwu, A.L., Lee, C.K.K., Jain, S.K., Murray, K.L., Topolski, J., McEvoy, R.E., Townsend, T.
& Lehmann, C.U. 2008. A world-wide-web antibiotic stewardship program improves
efficiency, communication and user satisfaction and reduces cost in tertiary care paediatric
medical centre. Clinical infectious diseases, 47(6):747-753.
Al-Ghamdi, S., Gedebou, M. & Bilal, N.E. 2002. Nosocomial infections and misuse of
antibiotics in a provincial community hospital, Saudi Arabia. Journal of hospital infections,
198
50(2):115-121.
Algasham, A.A. & Nahata, M.C. 2000. Clinical use of fluoroquinolones – a reassessment.
Annals of pharmacotherapy, 34(3):347-359.Aradottir, E. & Yogev, R. 1999. The use of
fluoroquinolones in paediatrics – a reassessment. Seminars in paediatric infectious
diseases, 10(1):31-37.
Allen, N.E. & Nicas, T.I. 2003. Mechanism of action of oritavancin and glycopeptides
antibiotics. Federation of European Microbiological Societies (FEMS) microbiology reviews,
26(5):511-532.
Allerberger, F., Gareis, R., Jindrak, V. & Struelens, M. 2009. Antibiotic stewardship
implementation in the European Union: The way forward. Expert review of anti-infective
therapy, 7(10):1175-1183.
Alirol, E., Getaz, L., Stoll, B., Chappuis, F. & Loutan, L. 2011. Urbanisation and infectious
diseases in a globalized world. Lancet infectious diseases, 11(2):131-141.
Akahane, K., Kimura, Y., Tsutomi, Y. & Hayakawa, I. 1994. Possible intermolecular
interaction between quinolones and biphenylacetic acid inhibits gamma-amino-butyric acid
receptor sites. Antimicrobial agents and chemotherapy, 38(10):2323-2329.
Amadeo, B., Zarb, P., Muller, A., Drapier, N., Vankerckhoven, V., Rogues, A., Davey, P. &
Goossens, H. 2010. European surveillance of antibiotic consumption (ESAC) point survey
2008: Paediatric antimicrobial prescribing in 32 hospitals of 21 European countries. Journal
of antimicrobial chemotherapy, 65(10):2247-2252.
Amyes, S.G.B. 2003. Magic bullets, lost horizons: the rise and fall of antibiotics. London:
Taylor & Francis.
Anagaw, B., Gezachew, M., Biadgelgene, F., Anagaw, B., Geleshe, T., Taddese, B., Getie,
B., Endris, M., Mulu, A. & Unakal, C. 2013. Antimicrobial susceptibility patterns of
Streptococcus pneumoniae over 6 years at Gondar university hospital, Northwest Ethiopia.
Asian pacific journal of tropical biomedicine, 3(7):536-541.
Anders, A. 1993. Biostatistics for epidemiologists. Florida: Lewis.

199
Anderson, R.J., Groundwater, P.W., Todd, A. & Worsely, A.J. 2012. Antibacterial agent:
chemistry, mode of action, mechanism of resistance and clinical application. West Sussex:
Wiley.
Andriole, V.T. 2000. The quinolones. 3rd ed. California: Academic Press.
Andriole, V.T. 2005. The quinolones: Past, present, and future. Clinical infectious
diseases, 41(Suppl. 2):S113-S119.
Andriole, V.T. & Schellhorn, C. 1997. Classification of fluoroquinolones by V. Andriole.
Infection, 26(1):64.
Anon. s.a. The history of medicine. http://www.who.int/infectious-disease-
report/2000/ch3.htm Date of access: 13 Aug. 2013.
Anon. 2014. Melinta Therapeutics Raises $70 Million to Support Delafloxacin NDA and
Selection of Multi-Drug Resistant Gram-Negative Candidates from RX-04 Platform.
http://www.melinta.com/news.php?c=25 Date of access: 1 Mar. 2014.
Anthony, M., Lee, K.Y., Betram, C.T., Abarca, J., Rehfeld, R.A., Malone, D.C., Freeman, M.
& Woosley, R.L. 2008. Gender and age difference in medications dispensed from a
national chain drug store. Journal of women’s health, 17(5):735-743.
Anzueto, A., Niederman, M.S., Pearle, J., Restrepo, M.I., Heyder, A. & Choudri, S.H. 2006.
Community-Acquired Pneumonia Recovery in the Elderly (CAPRIE): efficacy and safety of
moxifloxacin therapy versus that of levofloxacin therapy. Clinical infectious diseases,
42(1):73-81.
Apalata, K., Zimba, T.F., Sturm, W.A. & Moodley, P. 2009. Antimicrobial susceptibility
profile of Neisseria gonorrhoea isolated from patients attending a STD facility in Maputo,
Mozambique. Sexually transmitted diseases, 36(6):341-343.
Appelbaum, P.C. 1992. Antimicrobial resistance in Streptococcus pneumoniae: An
overview. Clinical infectious diseases, 15(1):77-83.
Aradottir, E. & Yogev, R. 1999. The use of fluoroquinolones in paediatrics – a
reassessment. Seminars in paediatric infectious diseases, 10(1):31-37.

200
Archer BN. 2008. Epidemiology of typhoid fever in South Africa, 2003 – 2007.
http://www.ivi.int/popup/files/26th_Jan_Session/Archer%20BN%20-
%20Epi%20of%20Typhoid%20in%20SA.pdf Date of access: 2 Oct. 2014.
Arguedas, A., Sher, L., Lopez, E., Saez-Ilorens, X., Hamed, K., Skuba, K. & Pierce P.F.
2003. Open label, multicentre study of gatifloxacin treatment in recurrent otitis media and
acute otitis media treatment failure. Paediatric infectious disease journal, 22(11):949-955.
Arhin, F.F., Belley, A., Far, A.R., Lehoux, D., Moeck, G. & Parr, T.R. 2012. Glycopeptides
and lipoglycopeptides. (In Dougherty, T.R. & Pucci, M.J., eds. Antibiotic discovery and
development. New York, NY: Springer. p. 301-346).
Asadoorian, M.O & Kantarelis, D. 2005. Essentials of inferential statistics. Maryland:
Univiersity Press.
Austin, J.D., Kristinsson, K.G. & Anderson, R.M. 1999. The relationship between the
volume of antimicrobial consumption in human consumption and the frequency of resistance.
Proceedings of the National Academy of Science, 96(3):1152-1156.
Aveyard, H. 2010. Doing a literature review in health and social science: A practical guide.
2nd ed. Berkshire: McGraw-Hill.
Awad, A., Eltayeb, I., Matowe, L. & Thalib, L. 2005. Self-medication in antibiotic and
antimalarials in the community of Khartoum state, Sudan. Journal of pharmacy and
pharmaceutical sciences, 8(2):326-331.
Baba, H. 2010. Aztreonam. (In Grayson, M.L., ed. Kucers’ the use of antibiotics. 6th ed.
London: Edward Arnold. p. 458-465).
Baker, J., Wolfe, S., & Lurie, P. 2006. Petition to ban the antibiotic gatifloxacin (Tequin™).
http://www.citizen.org/Page.aspx?pid=919 Date of access: 14 Sep. 2014.
Bala, T., Matlala, M., Maloba, M.R.B., Gous, A.G.S. & Mphahlele, D.J. 2013. Antimicrobial
stewardship at Dr. George Mukhari hospital.
http://www.sasocp.co.za/downloads/conference2013/AcademicSession7/12-
%20Bala%20Stewardship.pdf Date of access: 27 Sep. 2013.

201
Ball, P. 2000. Quinolone generation: Natural history or natural selection. Journal of
antimicrobial chemotherapy, 46(11):17-24.
Ball, P.R., Shales, S.W. & Chopra, I. 1980. Plasmid-mediated tetracycline resistance in
Escherichia coli involves increased efflux of the antibiotic. Biomedical and biophysical
research communications, 93(1):74-81.
Baltz, R.H. 2009. Daptomycin: mechanism of action and resistance, and biosynthetic
engineering. Current opinion in chemical biology, 13:144-151.
Bamford, C., Bonorchis, K., Ryan, K., Simpson, J., Elliott, E., Hoffmann, R., Naicker, P.,
Ismail, N., Mbelle, N., Nchabeleng, M., Nana, T., Sriruttan, C., Seethman, S. & Wadula, J.
2011. Antimicrobial susceptibility patterns of selected bacteria isolated from South Africa
public sector hospitals, 2010. South African medical journal, 26(4):243-250.
Barbosa, T.B. & Levy, S. 2000. The impact of antibiotic use and resistance development
and persistence. Drug resistance updates, 3:303-311.
Bassetti, M., di Biagio, A., Rebesco, B., Amalftano, M.E., Topal, J. & Bassetti, D. 2001. The
effect of formulary restriction in the use of antibiotics in an Italian hospital. European journal
of clinical pharmacology, 57(6-7):529-534.
Bay, D.C., Rommens, K.L. & Turner, R.J. 2008. Small multidrug resistance proteins: A
multidrug transporter family that continues to grow. Biochimica et biophysica acta,
1778(8):1814-1838.
Benbachir, M., Benrejeb, S., Boye, C.S., Dosso, M., Belabbes, H., Kamoun, A., Kaire, D. &
Elmdaghri, N. 2001. Two-years surveillance on antibiotic resistance in Streptococcus
pneumonia isolated from African cities. Antimicrobial agents and chemotherapy, 45(2):627-
629.
Blair, J.M.A. & Piddock, L.J.V. 2009. Structure, function and inhibition of RND efflux pumps
in gram positive bacteria: an update. Current opinion in microbiology, 12:512-519.
Blix, H.S., Engeland, A., Litleskare, I. & Rønning, M. 2007. Age- and gender-specific
antibacterial prescribing in Norway. Journal of antimicrobial chemotherapy, 59(5):971-976.
202
Blommaert, A., Marais, C., Hens, N., Coenen, S., Muller, A., Goossens, H. & Bentels, P.
2014. Determinants of between-country differences in ambulatory antibiotic use and
antibiotic resistance in Europe: a longitudinal observational study. Journal of antimicrobial
chemotherapy, 69(2):535-547.
Blondeau, J.M. 2004. Fluoroquinolones: Mechanism of action, classification and
development of resistance. Survey of ophthalmology, 49(Suppl. 2):73-78.
Blumberg, L., De Jong, G., Thomas, J., Archer, B.N., Cengimbo, A. & Cohen, C. 2011.
Outbreaks in South Africa 2004 – 2011, the outbreak response unit of the NICD, and the
vision of an inspired leader. South African journal of infectious diseases, 24(4):195-197.
BNF (British National Formulary) for children. 2012. London: BMJ.
Brink, A., Moolman, J., da Silva, M.C. & Botha, M. 2007. Antimicrobial susceptibility profile
of selected bacteraemic pathogens from private institutions in South Africa. South African
medical journal, 97(4):273-279.
Brink, A., Feldman, C., Richards, G., Moolman, J. & Senekal, M. 2008. Emergence of
extensive resistant drugs (XDR) among gram negative bacilli South Africa looms near.
South African medical journal, 98(8):586-589.
Brink, A.J., Coetzee, J., Clay, C.G., Sithole, S., Richards, G.A., Poirel, L. & Nordman, P.
2011. Emergence of new delhi metallo-beta-lactamase (NDM-1) and Klebsiella pneumoniae
carbapenemase (KPC-2) in South Africa. Journal of clinical microbiology, 50(2):525-528.
Brink, A., Coetzee, J., Clay, C., Corcoran, C., van Greure, J., Deetlefs, J.D., Nutt, L.,
Feldman, C., Richards, G., Nordman, P. & Poirel, L. 2012. The spread of carbapenem-
resistant enterobacteriaceae in South Africa. South African medical journal, 102(7):599-561.
Britten, N. & Ukuommune, O. 1997. The influence of patients hopes of receiving a
prescription on doctors’ perception and the decision to prescribe: a questionnaire survey.
British medical journal, 315(7121):1506-1510.
Brooks, J.T., Ochieng, J.B., Okoth, G., Shapiro, R.L., Wells, R.G., Bird, M., Bopp, C., Chege,
W., Beatty, M.E., Chiller, T., Vulule, J.M., Mintz, E. & Slutsker, L. 2006. Surveillance for
bacterial diarrhoea and antimicrobial resistance in rural western Kenya, 1997-2003. Clinical

203
infectious diseases, 43(4):393-401.
Brouwers, J.R.B.J. 1992. Drug interactions with quinolone antibacterials. Drug safety,
7(4):268-281.
Brown, E.M. 2006. Interventions to optimise antibiotic prescribing in hospitals: The UK
approach. (In Gould, I.M. & van der Meer, J.W.M., eds. Antibiotic policies: theory and
practice. New York, NY: Kluwer Academic. p. 159-182).
Brown, E.M. & Nathwani, D. 2005. Antibiotic cycling or rotation: A systematic review of the
evidence of efficacy. Journal of antimicrobial chemotherapy, 55(1):6-9.
Brown, L.B., Krysiak, R., Kamanga, G., Mapanje, C., Kanyamula, H., Banda, B., Mhango, C.,
Hoffman, M., Kamwendo, D., Hobbs, M., Hosseinipour, M.C., Martinson, F., Cohen, M.S. &
Hoffman, I.F. 2010. Neisseria gonorrhoeae antimicrobial susceptibility in Lilongwe, Malawi,
2007. Sexually transmitted diseases, 37(3):169-172.
Burkhardt, J.E., Walterspiel, J.N. & Schaad, U.B. 1997. Quinolone arthropathy in animal
versus children. Clinical infectious diseases, 25(5):1196-1204.
Canadian Committee on Antimicrobial Resistance. 2003. Antimicrobial resistance: A deadly
burden no country can afford to ignore. Canada communicable disease report, 29(18):157-
164.
Cao, X.T., Kneen, R., Nguyen, T.A., Truong, D.L., White, N.J. & Parry, C.M. 1999. A
comparative study of ofloxacin and cefixime for treatment of typhoid in children. The Dong
Nai paediatric centre typhoid study group. Paediatric infectious disease journal, 18(3):245-
248.
Capella, D. 1993. Descriptive tools and analysis. (In Dukes, M.N.G., ed. Drug utilization
studies, methods and uses. Copenhagen: WHO. p. 55-78).
Carr, J. 2012. Statistics. (In Page, P., Carr, J., Eardley, W., Chadwick, D. & Porter, K., eds.
An introduction to clinical research. New York, NY: Oxford University Press. p. 139-164).
Carrie, A.G., Metge, C.J., Zhanel, G.G. 2000. Antibiotic use in a Canadian province, 1995-
1998. Annals of pharmacotherapy, 34(4):459-464.

204
Cars, O., Molstad, S. & Melander, A. 2001. Variations in antibiotic use in the European
Union. The lancet, 358(9289):1272-1273.
CDC (Centers for Disease Control and Prevention). 2012. Principles of epidemiology in
public health. 3rd ed. Atlanta: CDC.
http://www.cdc.gov/ophss/csels/dsepd/SS1978/SS1978.pdf Date of access: 13 Mar. 2014.
CDC (Centers for Disease Control and Prevention). 2013. Antimicrobial threats in the
United States, 2013. http://www.cdc.gov/drugresistance/threat-report-2013/pdf/ar-threats-
2013-508.pdf Date of access: 15 Nov. 2014.
Chalumeau, M., Tonnelier, S., d’Athis, P., Treluyer, J., Gendrel, D., Breart, G. & Pons, G.
2003. Fluoroquinolone safety in paediatric patients: A prospective, multicentre, comparative
cohort study in France. Paediatrics, 111(6):714-719.
Chambers, H.F. 2001a. Antimicrobial agents: General considerations. (In Hardman, J.G.,
Limbird, L.E., Goodman, L.S. & Gilman, A.G., eds. Goodman and Gilman’s: The
pharmacological basis of therapeutics. 10th ed. New York, NY: McGraw-Hill. p. 1143-
1170).
Chambers, H.F. 2001b. Antimicrobial agents: The aminoglycosides. (In Hardman, J.G.,
Limbird, L.E., Goodman, L.S. & Gilman, A.G., eds. Goodman and Gilman’s: the
pharmacological basis of therapeutics. 10th ed. New York, NY: McGraw-Hill. p. 1219-
1238).
Chambers, H.F. 2001c. Antimicrobial agents: Protein synthesis inhibitors and miscellaneous
antibacterial. (In Hardman, J.G., Limbird, L.E., Goodman, L.S. & Gilman, A.G., eds.
Goodman and Gilman’s: The pharmacological basis of therapeutics. 10th ed. New York,
NY: McGraw-Hill. p. 1239-1272).
Chandy, S.J., Thomas, K., Mathai, E., Antonisamy, B., Holloway, K.A. & Stalsby, L.C. 2013.
Patterns of antibiotic use in the community and challenges of antibiotic surveillance in a
lower-middle-income setting: a repeated cross-sectional study in Vellore, South India.
Journal of antimicrobial chemotherapy, 68(1):229-236.
Chen, D.K., McGeer, A., de Azavedo, J.C. & Low, D.E. 1999. Decreased susceptibility of
Streptococcus pneumonia to fluoroquinolones in Canada. The New England journal of

205
medicine, 341(4):233-239.
Chien, S., Wong, F.A., Fowler, C.L., Callery-d’Amico, S.V., Williams, R.R., Nayak, R. &
Chow, A.T. 1998. Double-blind evaluation of the safety and pharmacokinetics of multiple
oral once-daily 750-milligram and 1-gram doses of levofloxacin in healthy volunteers.
Antimicrobial agents and chemotherapy, 42(2):885-888.
Chukwuani, C.M., Onifade, M. & Sumonu, K. 2002. Survey of drug use practice and
antibiotic prescribing patterns at a general hospital in Nigeria. Pharmacy world and science,
24(5):188-197.
CMS see Council for Medical Schemes.
Cohen, J. 1988. Statistical power analysis for the behavioural sciences. New York, NY:
Lawrence Erlbaum.
Cohen, J.S. 2001. Peripheral neuropathy associated with the fluoroquinolones. The annals
of pharmacotherapy, 35:1540-1547.
Cohen, M.L. 1992. Epidemiology of drug resistance: Implication for a post-antimicrobial
flora. Science, 257(5073):166-174.
Committee on Infectious Diseases. 2006. The use of systemic fluoroquinolones.
Paediatrics, 118(3):1287-1292.
Coovadia, Y.M., Gathiram, V., Bhamjee, A., Garrat, R.M., Mlisana, K., Pillay, N., Madlalose,
T. & Short, M. 1992. An outbreak of multidrug-resistant salmonella typhi in South Africa.
QJM: An international journal of medicine, 82(2):91-100.
Cosgrove, S.E. 2006. The relationship between antimicrobial resistance and patient
outcomes: mortality, length of stay and health cost. Clinical infectious diseases, 42(Suppl.
2):S82-S89.
Cosgrove, S.E. & Carmeli, Y. 2003. The impact of antimicrobial resistance on health and
economic outcomes. Clinical infectious diseases, 36(11):1433-1437.
Cosgrove, S.E., Qi, Y., Kaye, K.S., Harbarth, S., Karchnier, A.W. & Carmeli, Y. 2005. The

206
impact of methicillin resistance in Staphylococcus aureus bacteraemia on patient outcomes:
Mortality, length of stay hospital charges. Infection control and hospital epidemiology,
26(2):166-174.
Coulson, G.B., Von Gottberg, A. & Du Plesis, M. 2007. Meningococcal disease in South
Africa. Emerging infectious diseases, 13(2):272-281.
Council for Medical Schemes. 2012. Annual report for 2011-2012. Pretoria.
https://www.medicalschemes.com/files/Annual%20Reports/CMSAR20112012.pdf Date of
access: 23 Sep. 2013.
Council for Medical Schemes. 2013. Annual report for 2012-2013. Pretoria.
https://www.medicalschemes.com/Publications.aspx (accessed 13 August 2014).
Creticos, C.M. & Sheagren, J.N. 1999. Penicillins. (In Root, R.K., ed. Clinical infectious
diseases: A practical approach. New York, NY: Oxford University. p. 249-256).
Crowther-Gibson, P., Govender, N., Lewis, D. A., Bamford, C. & Brink, A. 2011. Human
infections and antibiotic resistance. South Africa medical journal, 101(8):567-576.
Cremet, L., Caroff, N.M., Dauvergne, S., Reynaud, A., Lepelletier, D. & Corvec, S. 2011.
Prevalence of plasmid-mediated quinolone resistance determinants in ESBL
Enterobacteriaceae clinical isolates over a one-year period in a French hospital. Pathologie
biologie, 59(3):151-156.
Danisvicová, A., Brezina, M., Belan, S., Kayserová, H., Kaiserová, E., Hrushovic, I.,
Orosová, K., Dluholucky, S., Galova, K. & Matheova, E. 1994. No evidence of quinolone-
induced arthropathy. Chemotherapy, 40(3):209-214.
Davey, P., Brown, E., Charani, E., Fenelon, L., Gould, I.M., Holmes, A., Ramsamy, C.R.,
Wifften, P.J. & Wilcox, M. 2013. Interventions to improve antibiotic prescribing practices for
hospital inpatients. Cochrane database system reviews, 4:CD003543.
Davidson, A.L. & Chen, J. 2004. ATP-binding cassette transporters in bacteria. Annual
review of biochemistry, 73(1):241-268.
Day, C. & Gray, A. 2013. Health and related indicators. (In Padarath, A. & English, R., eds.
207
South African health review. Durban: Health Systems Trust. p. 218-272).
De Kraker, M.E.A., Davey, P.G. & Grundman, H. 2011. Mortality and hospital stay
associated with resistant Staphylococcus aureus and Escherichia coli bacteraemia:
estimating the burden of antibiotic resistance in Europe. PLoS medicine, 8(10):1-8.
Denis, O., Rodriguez-Villalobos, H. & Struelens, M.J. 2010. The problem of resistance. (In
Finch, R.G., Greenwood, D., Norrby, S.R. & Whitley, R.J., eds. Antibiotic and
chemotherapy. 9th ed. New York, NY: Saunders Elsevier. p. 91-204).
Department of Health see South Africa.
DeRuiter, J. & Holston P. 2012. Drug patent expirations and the “patent cliff”. US
pharmacists, 37(6):12-20. http://www.uspharmacist.com/content/s/216/c/35249/ Date of
access: 14 Sep. 2014.
FDA (Food and Drugs Administration). 2008. Determination that Tequin™ (gatifloxacin)
was withdrawn from sale for reasons of safety or effectiveness. Federal register,
73(175):52357. http://www.gpo.gov/fdsys/pkg/FR-2008-09-09/pdf/E8-20938.pdf Date of
access: 14 Sep. 2014.
Dictionary of Media and Communication. 2014. Literature review.
http://www.oxfordreference.com.nwulib.nwu.ac.za/view/10.1093/oi/authority.2011080310010
9844 Date of access: 13 Mar. 2014.
Domagala, J.M. 1994. Structure-activity and structure-side-effect relationship for the
quinolone antibacterial. Journal of antimicrobial chemotherapy, 33(4):685-706.
Dow, G. & Ronald, A.R. 1999. Miscellaneous antibacterial agents. (In Root, R.K., ed.
Clinical infectious diseases: A practical approach. New York, NY: Oxford University. p. 322-
324).
Du Plesis, M., de Gouveia, L., Skosana, H., Thomas, J., Blumberg, L., Klugman, K.P. & von
Gottberg, A. 2010. Invasive Neisseria meningitidis with decreased susceptibility to
fluoroquinolones in South Africa. Journal of antimicrobial chemotherapy, 65(10):2258-2260.
Dumartin, C., L’Hériteau, F., Péfau, M., Bertrand, X., Jarno, P., Boussant, S., Angora, P.,

208
Lacavé, L., Saby, K., Savey, K., Nguyen, F., Carbonne, A. & Rogue, A. 2010. Antibiotic use
in 530 French hospitals: Results from surveillance network at hospital and ward levels in
2007. Journal of antimicrobial chemotherapy, 65(9):2028-2036.
Dunagan, W.C. & Medoff, G. 1993. Formulary control of antimicrobial usage. Diagnostic
microbiology and infectious disease, 16(3):265-274.
Duse, A.G. 2005. Infection control in developing countries with particular emphasis on
South Africa. South African epidemiology and infection, 20(2):37-41.
Earnshaw, S., Mendez, A., Monnet, D.L., Hicks, L., Cruickshank, M., Weekes, L., Njoo, H. &
Ross, S. 2013. Global collaboration to encourage prudent antibiotic use. The lancet
infectious diseases, 13(12):1003-1004.
ECDC see European Centre for Disease Prevention and Control.
Econex Health Reform Note 7. 2010. Updated GP and specialist numbers for South Africa.
http://www.mediclinic.co.za/about/Documents/ECONEX_Health%20reform%20note_7.pdf
Date of access: 2 Oct. 2014.
Eliopoulos, G.M. 2010. Gemifloxacin. (In Grayson, M.L., ed. Kucers’ the use of antibiotics.
6th ed. London: Edward Arnold. p. 1466-1474).
Emele, F.E. 2000. Etiologic spectrum and pattern of antimicrobial drug susceptibility in
bacterial meningitis in Sokoto, Nigeria. Acta paediatric, 89(8):942-946.
Enato, E.F.O. & Uwaga, C.F. 2011. Profile of antimicrobial drug use pattern in a Nigerian
metropolitan city. International journal of health research, 4(1):37-44.
Engemann, J.J., Carmeli, Y., Cosgrove, S.E., Fowler, V.G., Brostein, M.Z., Trivette, S.L.,
Briggs, J.P., Sexton, D.J. & Kaye, K.S. 2003. Adverse clinical and economic outcomes
attributable to methicillin resistance among patients with Staphylococcus aureus surgical site
infection. Clinical infectious diseases, 36:592-598.
Erbay, A., Coplan, A., Bodur, A.H., Cenk, M.A., Samore, M.H. & Ergonul, O. 2003.
Evaluation of antibiotic usage in a hospital with an antibiotic restriction policy. International
journal of antimicrobial agents, 21(4):308-312.

209
Essack, S.Y. 2006. Strategies for the prevention and containment of antibiotic resistance.
South African family practice, 48(1):51a:51d.
Essack, S.Y., Shellack, N., Pople, T. & Merwe, L. 2011. Antibiotic supply chain and
management in human health. South African medical journal, 101(8):562-566.
European Centre for Disease Prevention and Control & European medicines agency
technical report. 2009. The bacterial challenge: A time to react.
http://www.ema.europa.eu/docs/en_GB/document_library/Report/2009/11/WC500008770.pd
f Date of access: 27 Nov. 2013.
European Centre for Disease Prevention and Control. 2010. Surveillance on antimicrobial
consumption in Europe.
http://www.ecdc.europa.eu/en/publications/Publications/antimicrobial-antibiotic-consumption-
ESAC-report-2010-data.pdf Date of access: 16 Nov. 2014.
Farinotti, R., Trouvin, J.H., Bocquet, V., Vermenie, N. & Carbon, C. 1988.
Pharmacokinetics of ofloxacin after single and multiple intravenous infusions in healthy
subjects. Antimicrobial agents and chemotherapy, 32(10):1590-1592.
Ferech, M., Coenen, S., Malhotra-Kumar, S., Dvorakova, K., Hendrickx, E., Suetens, C. &
Goossens, H. 2006. European surveillance of antimicrobial consumption: Outpatient
quinolone use in Europe. Journal of antimicrobial chemotherapy, 58(2):423-427.
Fihn, S.D., Boyko, E.J., Normand, E.H., Chen, C.L., Grafton, J.R., Hunt, M., Yabro, P.,
Scholes, D. & Stergachis, A. 1996. Association between the use of spermicide-coated
condoms and Escherichia coli urinary tract infections in young women. American journal of
epidemiology, 144(5):512-20.
Finch, R.G., Metlay, J.P., Davey, P.G. & Baker, J.J. 2004. Educational intervention to
improve antibiotic use in the community: Report from the Intervention Forum on Antibiotic
Resistance Colloquium, 2002. The lancet, 4(1):44-53.
Fishman, N. 2006. Antimicrobial stewardship. Association of Professionals in Infection
Control, 34(Suppl. 5):S55-S63.
Fleming, A. 1945. Penicillin – Nobel prize lecture.

210
http://www.nobelprize.org/nobel_prizes/medicine/laureates /1945/fleming-lecture.pdf Date of
access: 29 Aug. 2013.
Foxman, B. 2002. Epidemiology of urinary tract infections: incidence, morbidity and
economic costs. The American journal of medicine, 113(Suppl 1A):5S-13S.
Franchi, C., Sequi, M., Bonati, M., Nobili, A, Pasini, L., Bortolotti, A., Fortino, I., Merlino, L. &
Clavenna, A. 2011. Differences in outpatient antibiotic prescription in Italy’s Lombardy
region. Infection, 39(4):299-308.
Frenk, J. & de Ferrant, D. 2012. Universal health coverage: Good health, good economics.
The lancet, 380(9845):862-864.
Fridkin, S.K., Steward, C.D., Edwards, J.R., Pryor, E.R., McGowan, J.E., Archibald, L.K.,
Gaynes, R.P. & Tenover, F.C. 1999. Surveillance of antimicrobial use and antimicrobial
resistance in United States hospitals: Project ICARE phase 2. Clinical infectious diseases,
29(2):245-252.
Gallini, A., Taboulet, F. & Bourrel, R. 2012. Regional variation in quinolone use in France
and associated factors. European journal of clinical microbiology and infectious diseases,
31(11):2911-2918.
Garcia-Rey, C., Aguilar, L., Baquero, F., Casal, J. & Dal-Ré, R. 2002. Importance of local
variations in antibiotic consumption and geographical differences of erythromycin and
penicillin resistance in Streptococcus pneumonia. Journal of clinical microbiology,
40(1):159-164.
Garrold, L.P. 1964. The penicillins. (In Schnitzer, R., ed. Experimental chemotherapy.
New York, NY: Academic Press. p. 1-36).
Gaur, A.H. & English, B.K. 2006. The judicious use of antibiotics – an investment towards
optimized health care. Indian journal of paediatrics, 73(4):343-350.
Geddes, A.M. & Gould, I.M. 2010a. Benzylpenicillin. (In Grayson, M.L., ed. Kucers’ the
use of antibiotics. 6th ed. London: Edward Arnold. p. 5-58).
Geddes, A.M. & Gould, I.M. 2010b. Phenoxypenicillin. (In Grayson, M.L., ed. Kucers’ the

211
use of antibiotics. 6th ed. London: Edward Arnold. p. 59-64).
Geddes, A.M. & Gould, I.M. 2010c. Ampicillin, and other ampicillin-like penicillin. (In
Grayson, M.L., ed. Kucers’ the use of antibiotics. 6th ed. London: Edward Arnold. p. 65-
92.)
Gelband, H. & Duse, A.G. 2011. Future directions for GARP. South African medical
journal, 101(8):596.
Gelone, S. & O’Donnell, J.A. 2005. Anti-infectives. (In Troy, D.B., ed. Remington’s: The
science and practice of pharmacy. 21st ed. Philadelphia: Lippincott Williams & Wilkins. p.
1626-1684).
Gendrel, D. & Moulin, F. 2001. Fluoroquinolones in paediatrics. Paediatric drugs, 3(5):365-
377.
Genuini, M., Prot-Labarthe, S., Bourdon, O., Doit, C., Augard, Y., Naudin, J. & Lorrot, M.
2014. Fluoroquinolones in pediatrics: review of hospital prescription use over 2 years. The
international journal of clinical pharmacology and therapeutics, 52(11):940-947.
Georgopapadakou, N.H., Smith, S.A. & Sykes, R.B. 1982. Mode of action of azthreonam.
Antimicrobial agents and chemotherapy, 21(6):95-957.
Gerding, D.D. 2001. The search for good antimicrobial stewardship. Journal of quality
improvement, 27(8):403-404.
Gilbert, D.N. 1999. Aminoglycosides. (In Root, R.K., ed. Clinical infectious diseases: A
practical approach. New York, NY: Oxford University. p. 273-284).
Gill, M.J., Brenwald, N.P. & Wise, R. 1999. Identification of an efflux pump gene, pmrA,
associated with fluoroquinolone resistance in Streptococcus pneumonia. Antimicrobial
agents and chemotherapy, 43(1):187-189.
Goel, P., Ross-Degnan, D., Berman, P. & Soumerai, S. 1996. Retail pharmacies in
developing countries: A behaviour and intervention framework. Social science and
medicine, 42(8):1155-1161.

212
Gold, H.S. & Moellering, R.C. 1999. Macrolides and clindamycin. (In Root, R.K., ed.
Clinical infectious diseases: A practical approach. New York, NY: Oxford University. p. 291-
297).
Goldman, J.A. & Kearns, G. 2011. Fluoroquinolone use in paediatrics: Focus on safety and
place in therapy. Geneva: WHO.
Gonzales, R. Malone, D.C., Maselli, J.H. & Sande, M.A. 2001. Excessive antibiotic use for
respiratory infection in the United States. Clinical infectious diseases, 33(6):757-762.
Goossens, H., Ferech, M., van der Stichele, R. & Elseviers, M. 2005. Outpatient antibiotic
use in Europe and association with resistance: A cross-national database study. The lancet,
365(9459):579-587.
Goossens, H., Ferech, M., Coenen, S. & Stephens, P. 2007. Comparison of outpatient
system antibacterial use in 2004 in the United States and 27 European countries. Clinical
infectious diseases, 44(8):1091-1095.
Gough, A.W., Kasali, O.B., Sigler, R.E. & Baragi, V. 1992. Quinolone arthropathy – acute
toxicity to immature articular cartilage. Toxicology pathology, 20(3):436-449.
Gould, I.M. 1999. Stewardship of antibiotic use and resistance surveillance: The
international scene. Journal of hospital infection, 43(Suppl.1):S253-S260.
Gould, I.M. 2005. Antibiotic policies in European hospitals. Medecines et maladies
infectieuses, 35(Suppl. 2):S123-124.
Govender, N., Smith, A.A., Karstaedt, A.S. & Keddy, K.H. 2009. Plasmid-mediated
quinolone resistance in Salmonella from South Africa. Journal of medical microbiology,
58(10):1393-1394.
Griebling, T.L. 2005. Urologic diseases in America project: trends in resources use for
urinary tract infections in men. The journal of urology, 173(4):1288-1294.
Griffin, J.P. & d’Arcy, P.F. 1997. A manual of adverse drug interactions. 5th ed.

213
Amsterdam: Elsevier.
Gross, I. & Carbon, C. 1990. Pharmacokinetics of lomefloxacin in healthy
volunteers:comparison of 400 milligrams once daily and 200 milligrams twice daily given
orally for 5 days. Antimicrobial agents and chemotherapy, 34(1):15-152.
Group for Enteric, Respiratory and Meningeal Surveillance in South Africa. 2006. GERM-
SA annual report, 2006. http://www.nicd.ac.za/assets/files/2006_GERMS-
SA_annual_report.pdf Date of access: 3 Oct. 2014.
Group for Enteric, Respiratory and Meningeal disease Surveillance in South Africa: GERMS-
SA Annual Report 2007. http://www.nicd.ac.za/assets/files/2007_GERMS-
SA_Annual_Report.pdf Date of access: 3 Oct. 2014.
Group for Enteric, Respiratory and Meningeal Disease Surveillance in South Africa. 2012.
GERMS-SA Annual Report 2012. http://www.nicd.ac.za/units/germs/germs.htm Date of
access: 3 Oct. 2014.
Group for Enteric, Respiratory and Meningeal Disease Surveillance in South Africa. 2013.
GERM-SA annual report, 2013. http://nicd.ac.za/assets/files/GERMS-
SA%20AR%202013.pdf Date of access: 2 Oct. 2014.
Haaijer-Ruskamp, F.M. & Dukes, M.N.G. 1993. The economic aspects of drug use. (In
Dukes, M.N.G., ed. Drug utilization studies, methods and uses. Copenhagen: WHO. p.
125-146).
Haeseker, M.B., Dukers-Miujrers, N.H.T.M., Hoebe, C.J.P.A., Bruggeman, C.A., Cals, J.W.L.
& Verbon, A. 2012. Trends in antibiotic prescribing in adults in Dutch general practice. Plos
one, 7(12):1-6.
Hall, G.C., Sauer, B., Bourke, A., Brown, J.S., Reynolds, M.W. & Lo Casale, R. 2012.
Guidelines for good database selection and use in pharmacoepidemiology research.
Pharmacoepidemiology and drug safety, 21(1):1-10.
Hampel, B., Hullman, R. & Schmidt, H. 1997. Ciprofloxacin in paediatrics: Worldwide
clinical experience clinical experience based on compassionate use – safety report. The
paediatric infectious disease journal, 16(1):127-129.

214
Hanlon, G. & Hodges, N. 2013. Essential microbiology for pharmacy and pharmaceutical
science. New Jersey: John Wiley.
Hans, K.S.S. & Ramsamy, Y. 2013. Surveillance alone plays a key role in curbing the
overuse of antimicrobials: The major role of antibiotic stewardship. South African medical
journal, 103(6):368.
Harbarth, S., Albrich, W. & Brun-Buisson, C. 2002. Outpatient antibiotic use and prevalence
of antibiotic-resistant pneumococci in France and Germany: A socio-cultural perspective.
Emerging infectious diseases, 8(12):1460-1468.
Harbarth, S. & Samore, M.H. 2005. Antimicrobial resistance determinants and future
control. Emerging infectious disease, 11(6):794-801.
Harder, K.J., Nikaido, H. & Matsuhashi, M. 1981. Mutants of Escherichia coli that are
resistant to certain beta-lactam compounds lack the ompF porin. Antimicrobial agents and
chemotherapy, 20(4):549-552.
Hart, C. 2003. Doing a literature review. London: SAGE.
Hayashi, Y. & Paterson, D.L. 2010. Carbapenems. (In Grayson, M.L., ed. Kucers’ the use
of antibiotics. 6th ed. London: Edward Arnold. p. 471-499).
Healey, J.F. 2013. The essentials of statistics: A tool for social research. 3rd ed.
California: Wadsworth.
Heiman, G.W. 2014. Basic statistics for the behavioural sciences. 7th ed. California: Jon-
David Hague.
Hewitt, B. 2013. Antibiotic stewardship, Netcare Sunninghill hospital: Back to winning ways.
http://www.sasocp.co.za/downloads/conference2013/AcademicSession6/7%20Hewitt%20B
%20-%20Antibiotic%20Stewardship.pdf Date of access: 27 Sep. 2013.
Hettmansperger, T. 2005. Median. (In Armitage, P. & Colton, T., eds. Encyclopaedia of
biostatistics. 2nd ed. West Sussex: John Wiley. p. 3103-3104).
Hoban, D.J., Doern, G.V., Fluit, A.C., Roussel-Delvallez, M. & Jones, R.W. 2001.

215
Worldwide prevalence of antimicrobial resistance in Streptococcus pneumonia, Haemophilus
influenza and Moraxella catarrhalis in the SENTRY antimicrobial surveillance program,
1997-1999. Clinical infectious diseases, 32(Suppl. 2):S81-S93.
Hoffken, G., Lode, H., Prinzing, C., Borner, K. & Koeppe, P. 1985. Pharmacokinetics of
ciprofloxacin after oral and parenteral administration. Antimicrobial agents and
chemotherapy, 27(3):375-379.
Hooper, D.C. 2000. Mechanism of action and resistance of older and new fluoroquinolones.
Clinical infectious diseases, 31(Suppl. 2):S24-S28.
Hooper, D.C. 2001. Mechanism of action of antimicrobials: Focus on fluoroquinolones.
Clinical infectious diseases, 32(Suppl. 1):S9-S15.
Hooper, D.C. & Wolfson, J.S. 1985. The fluoroquinolones: pharmacology, clinical uses and
toxicities in humans. Antimicrobial agents and chemotherapy, 28(5):716-721.
Hooper, D.C. & Wolfson, J.S. 1991. Fluoroquinolone antimicrobial agents. Drug therapy,
324(6):385-394.
Hooton, T.M. 1999. Tetracycline and chloramphenicol. (In Root, R.K., ed. Clinical
infectious diseases: A practical approach. New York, NY: Oxford University. p. 299-303).
Hooton, T.M., Scholes, D., Hughes, J.P., Winter, C., Roberts, P.L., Stergachis, A. & Stamm,
W.E. 1996. A prospective study of risk factors for symptomatic urinary tract infections in
young women. The new England journal of medicine, 35(7):468-74.
Hopkins, K.L., Davies, R.H. & Threlfall, E.J. 2005. Mechanism of quinolone resistance in
Escherichia coli and salmonella: Recent development. International journal of antimicrobial
agents, 25(5):358-373.
Hori, S., Kizu, J. & Kawamura, M. 2003. Effects off anti-inflammatory drug on convulsant
activity of quinolones: A comparative study of drug interaction between quinolones and anti-
inflammatory drugs. Journal of infection chemotherapy, 9(4):314-320.
Houvenin, P. & Cars, O. 1998. Control of antimicrobial resistance: Time for action. British
medical journal, 317(7159):613-614.

216
Howard, S.J., Catchpole, M., Watson, J. & Davies, S.C. 2013. Antimicrobial resistance:
Global response needed. The lancet infectious diseases, 13(12):1001-1003.
Hseuh, P., Chen, W. & Luh, K. 2005. Relationship between antimicrobial use and
antimicrobial resistance in gram negative causing nosocomial infections from 1991-2003 at a
university in Taiwan. International journal of antimicrobial agents, 26(6):463-472.
Huebner, R.E., Wasas, A.D. & Klugman, K.P. 2000. Trends in antimicrobial resistance and
serotype distribution of blood and cerebrospinal fluid isolates of Streptococcus pneumonia in
South Africa, 1991-1998. International journal of infectious diseases, 4:214-218.
Huebner, R.E., Wasas, A.D. & Klugman, K.P. 2003. Antibiotic prescribing practices for
common childhood illnesses in South Africa. South African medical journal, 93(7):505-507.
Hutchinson, J.M., Patrick, D.M., Marra, F., Ng, E., Bowie, W.R., Heule, L., Muscat, M. &
Monnet, D.L. 2004. Measurement of antibiotic consumption: A practical guide to the use of
the anatomical therapeutic chemical classification and defined daily dose system
methodology in Canada. Canadian journal of infectious disease, 15(1):29-35.
Isturiz, R.E. & Carbon, C. 2000. Antibiotic use in developing countries. Infection control
and hospital epidemiology, 21(6):394-397.
Jacoby, G.A. 2005. Mechanism of resistance to quinolones. Clinical infectious diseases,
41(Suppl. 2):S120-S126.
Jacoby, G.A., Chow, N. & Waites, K.B. 2003. Prevalence of plasmid-mediated quinolone
resistance. Antimicrobial agents and chemotherapy, 47(2):559-562.
Jacoby, G.A. & Hooper, D.C. 2012. Review of the quinolone family (In Pucci, M.J. &
Dougherty, T.J., eds. Antibiotic discovery and development. New York, NY: Springer. p.
119-146).
Janknegt, R., Lashof, D.A., Gould, I.M. & van der Meer, J.W.M. 2000. Antibiotic use in
Dutch hospitals, 1991 – 1996. Journal of antimicrobial chemotherapy, 45(2):251-256.
Kaatz, G.W., Seo, S.M. & Ruble, C.A. 1993. Efflux-mediated fluoroquinolone resistance in
Staphylococcus aureus. Antimicrobial agents and chemotherapy, 37(5):1086-1094.

217
Kahne, D., Leimkuhler, C., Lu, W. & Walsh, C. 2005. Glycopeptides and lipopeptides
antibiotics. Chemical reviews, 105(2):425-448.
Kahne, T. 2013. Medical schemes “getting grip with drug budgets”.
http://www.bdlive.co.za/business/healthcare/2013/07/10/medical-schemes-getting-to-grips-
with-drug-budgets Date of access: 24 Feb. 2014.
Kantor, G.S. 2011. Global forum perspective: Measuring antibiotic utilisation for
improvement.
http://www.cddep.org/blog/posts/global_forum_perspectives_dr_gareth_s_kantor_senior_clin
ical_consultant_discovery_health_#sthash.uBJuLmUc.BNEgyfA5.dpuf Date of access: 11
Jun. 2013.
Katende-Kyenda, N.L., Lubbe, M.S., Serfontein, J.H.P. & Truter, I. 2006. Usage of
antimicrobial agents in a private primary healthcare setting in South Africa. International
journal of pharmacy practice, 14(4):283-287.
Keddy, K.H., Smith, A.A., Sooka, A., Ismail, H. & Oliver, S. 2010. Fluoroquinolone-resistant
typhoid, South Africa. Emerging infectious diseases, 16(5):879-880.
Keddy, K.H., Sooka, A., Ismail, H., Smith, A.M., Weber, I., Letsoalo, M.E. & Harris, B.N.
2011. Molecular epidemiological investigation of a typhoid fever outbreak in South Africa,
2005: the relationship to a previous epidemic in 1993. Epidemiology and infection,
139(8):1239-1245.
Kesah, C., Redjeb, B.S., Odugbemi, T.O., Boye, C.S.B., Dosso, M., Achola, J.O.N., Koulla-
Shiro, S., Benbachir, M., Rahal, K. & Borg, M. 2003. Prevalence of methicillin-resistant
Staphylococcus aureus in eight African hospitals and Malta. Clinical microbiology and
infections, 9(2):153-156.
Kim, A., Kuti, J.L. & Nicolau, D.P. 2010. Dalbavancin. (In Grayson, M.L., ed. Kucers’ the
use of antibiotics. 6th ed. London: Edward Arnold. p. 645-653).
King, D.E., Malone, R. & Lilley, S.H. 2000. New classification and update on the quinolone
antibiotics. American family physician, 61(9):2741-2748.
Kline, J.M., Wietholter, J.P. Kline, V. & Confer, J. 2012. Paediatric antibiotic use: A focused

218
review of fluoroquinolones and tetracyclines. US pharmacist, 37(8):56-59.
Kollef, M.H. 2006. Is antibiotic recycling the answer to preventing emergence of bacterial
resistance in the intensive care unit? Clinical infectious diseases, 43(Suppl. 2):S82-S88.
Koornhof, H.J., Wasa, A. & Klugman, K. 1992. Antimicrobial resistance in Streptococcus
pneumonia: A South African perspective. Clinical infectious diseases, 15(1):84-94.
Kotwani, A., Holloway, K. & Chaudhury, R.R. 2009. Methodology for surveillance of
antimicrobials use among outpatients in Delhi. The Indian journal of medical research,
129(5):555-560.
Kotwani, A. & Holloway, K. 2011. Trends in antibiotic use among outpatients in New Delhi,
India. Biomedical central infectious diseases, 11(1):1-9.
Kritsotakis, E.I. & Gikas, A. 2006. Surveillance of antibiotic use in hospitals: Methods,
trends and targets. Clinical microbiology and infection, 12(8):710-705.
Kunin, C.M. 1995. Use of antimicrobial drugs in developing countries. International journal
of antimicrobial agents, 5(2):107-113.
Kuster, S.P., Ruef, C., Ledergerber, B., Hintermann, A., Deplazes, C., Nueber, L. & Weber,
R. 2008. Quantitative antibiotic use in hospitals: Comparison of easuremnt, literature review
and recommendation for a standard of reporting. Infection, 26(6):549-559.
Lallana-Alvarez, M.J., Feja-Solana, C., Armesto-Gomez, J., Bjerrum, L. & Rabanaque-
Hernandez, M.J. 2012. Outpatient antibiotic prescription in Aragon and the differences by
age and gender. Enfermedades infecciosas y microbiologica clinica, 30(10):591-596.
(Abstract).
Lancini, G., Parenti, F. & Gallo, G.G. 1995. Antibiotics – a multidisciplinary approach. New
York, NY: Plenum.
Lapi, F., Wilchesky, M., Kezouh, A., Benisty, J.I., Ernst, P. & Suissa, S. 2012.
Fluoroquinolones and the risk of serioud arrhythmia: A population-based study. Clinical
infectious diseases, 55(11):1457-1465.

219
Lawton, R.M., Fridkin, S.K., Gaynes, R.P. & McGowan, J.E. 2000. Practices to improve
antimicrobial use at 47 US hospitals: The status of the 1997 SHEA/IDSA position paper
recommendations. Infection control and hospital epidemiology, 21(4):256–259.
Laxminayaran, R. & Brown, G.M. 2001. Economics of antibiotic resistance: A theory for
optimal use. Journal of environmental economics and management, 42(2):183-206.
Laxminayaran, R., Duse, A., Wattal, C., Zaidi, A.K.M., Wertheim, H.F.L., Sumpradit, N.,
Vlieghe, E., Hara, G.L., Gould, I.M., Goossens, H., Greko, C., So, A.D., Bigdeli, M., Tomson,
G., Woodjouse, W., Ombaka, E., Peralta, A.Q., Qamar, F.N., Mir, F., Kariuki, S., Bhutta,
Z.A., Coates, A., Bergstrom, R., Wright, G.D., Brown, E.D. & Cars, O. 2013. Antibiotic
resistance – the need for global solutions. The lancet infectious diseases,
http://www.thelancet.com/journals/laninf/article/PIIS1473-3099(13)70318-9/fulltext Date of
access: 20 Nov. 2013.
Le Grand, A., Hogerzeil, H.V. & Haaijer-Ruskamp, F.M. 1999. Intervention research in
rational use of drugs: A review. Health policy planning, 14(2):89-102.
Levy, S.B. 1992. Active reflux mechanism for antimicrobial resistance. Antimicrobial agents
and chemotherapy, 36(4):695-703.
Levy, S.B. 1997. Antibiotic resistance: An ecological imbalance. Ciba Foundation
Symposium, 207:1-9.
Lewis, D.A. 2007. Antibiotic-resistant gonococci – past, present and future. South African
medical journal, 97(11):1146-1150.
Lewis, D.A. 2011. Antimicrobial-resistant gonorrhoea in Africa: An important public health
threat in need of a regional gonococcal antimicrobial surveillance programme. Southern
African journal of infectious diseases, 26(4):215-220.
Liem, T.B.Y., Heerdink, E.R., Egberts, A.C.G. & Rademaker, C.M.A. 2010. Quantifying
antibiotic use in paediatrics: A proposal for neonatal DDDs. European journal of clinical
microbiology and infectious diseases, 29(10):1301-1303.
Linder, J.A., Huang, E.S., Steinmann, M.A., Gonzales, R. & Stafford, R.S. 2005.
Fluoroquinolone prescribing in the United States, 1995 – 2005. The American journal of

220
medicine, 118(3):259-268.
Lindsay, E.N. 2002. Epidemiology of urinary tract infections. Clinical microbiology
newsletter, 24(18):135-140.
Lipsitch, M. & Samore, M.H. 2002. Antimicrobial use and antimicrobial resistance: A
population perspective. Emerging infectious disease, 8(4):634-640.
Litwin, M.S. & Saigal, C.S. 2012. Urological diseases in America 2012.
http://urology.ucla.edu/workfiles/Research/UDA_2012_Compendium.pdf Date of access: 24
Sep. 2014.
Liu, H.H. 2010. Safety profile of fluoroquinolones: Focus on levofloxacin. Drugs, 3(5):353-
369.
Livermore, D.M. 2005. Minimising antimicrobial resistance. The lancet infectious diseases,
5(7):450-459.
Lober, S., Ziege, S., Rau, M., Schreiber, G., Mignot, A., Koeppe, P. & Lode, H. 1999.
Pharmacokinetics of gatifloxacin and interaction with an antacid containing aluminium and
magnesium. Antimicrobial agents and chemotherapy, 43(5):1067-1071.
Lodato, E.M. 2004. Updates on 2004 background paper, BP 6.1 antimicrobial resistance.
http://www.who.int/medicines/areas/priority_medicines/BP6_1AMR.pdf Date of access: 2
Sept. 2014.
Lode, H., Borner, K. & Koeppe, P. 1998. Pharmacodynamics of fluoroquinolones. Clinical
infectious diseases, 27(1):33-39.
Loeb, M., Simor, A.E., Landry, L., Walter, S., McArthur, M., Duffy, J., Kwan, D. & McGeer, A.
2001. Antibiotic use in Ontario facilities that provide chronic care. Journal of general
internal medicine, 16(6):376-383.
Longhi, C., Conte, M.P., Marazzato, M., Lebba, V., Totino, V., Santangelo, F., Gallinelli, C.,
Pallechi, L., Riccobano, E., Schippa, S. & Comanducci, A. 2012. Plasmid-mediated
fluoroquinolone resistance determinants in Escherichia coli from community uncomplicated
urinary tract infection in an area of high prevalence of quinolone resistance. European

221
journal of clinical microbiology and infectious diseases, 31(8):1917-1921.
Lord, K. 2008. Quotations. http://zapatopi.net/kelvin/quotes/ Date of access: 16 Nov.
2014.
Lowman, W., Sriruttan, C., Nana, T., Bosman, N., Duse, A., Venturas, J. Clay, E. & Coetzee,
J. 2011. NDM-1 has arrived: First report of a carbapenem resistance mechanism in South
Africa. South African medical journal, 101(2):873-875.
MacKenzie, F.M. & Gould, I.M. 2005. Quantitative measurement of antibiotic use. (In
Gould, I.M. & van der Meer, J.W.M., eds. Antibiotic policies: Theory and practice. New
York, NY: Kluwer Academic. p. 105-118).
MacKenzie, F.M., Struelens, M.J., Towner, K.J. & Gould, I.M. 2005. Report on the
consensus conference on antibiotic resistance and control (ARPAC). Clinical microbiology
and infection, 11(11):938-954.
Majeed, A. & Moser, K. 1999. Age- and sex- specific antibiotic prescribing patterns in
general practice in England and Wales in 1996. The British journal of general practice,
49(446): 735-736.
Malow, J.B. & Sheagren, J.B. 1999. Cephalosporins. (In Root, R.K., ed. Clinical infectious
diseases: A practical approach. New York, NY: Oxford University. p. 257-263).
Mandomando, I., Sigaúque, B., Morais, L., Espasa, M., Vallès, X., Sacarlal, J., Macete, E.,
Aide, P., Quintò, L., Nhampossa, T., Machevo, S., Bassat, Q., Menéndez, C., Ruiz, J., Roca,
A. & Alonso, P.L. 2010. Antimicrobial drug resistance trends of bacteremia isolates in a
rural hospital in southern Mozambique. The American journal of tropical medicine and
hygiene, 83(1):152-157.
Marais, E., Aithma, N., Perovic, O., Oosthusyen, W.S., Musenge, E. & Duse, A.G. 2009.
Antimicrobial susceptibility of methicillin-resistant Staphylococcus aureus isolated from
South Africa. South African medical journal, 99(3):170-174.
Martinez-Martinez, L., Pascual, A. & Jacoby, G.A. 1998. Quinolone resistance from a
transferable plasmid. The lancet, 351(9105):797-799.

222
Masterton, R.G. 2005. Antibiotic recycling: more than it might seem. Journal of
antimicrobial chemotherapy, 55(1):1-5.
Masterton, R. 2008. The importance and future antimicrobial surveillance studies. Clinical
infectious diseases, 47(Suppl. 1):S21-S31.
McCormack, J. 2010. Nalidixic acid and other older quinolones. (In Grayson, M.L., ed.
Kucers’ the use of antibiotics. 6th ed. London: Edward Arnold. p. 1249-1264).
McCormack, J. & Grayson, M.L. 2010. Ciprofloxacin. (In Grayson, M.L., ed. Kucers’ the
use of antibiotics. 6th ed. London: Edward Arnold. p. 1265-1346).
McEvoy, G.K., Miller, J.L., Snow, E.K. & Welsh, O.H. 2005. AHFS drug information.
Wisconsin: American Society for Health-System Pharmacists.
McGowan, J.E. 2001. Economic impact of antimicrobial resistance. Emerging infectious
disease, 7(2):286-292.
McIntyre, D.E. & Doherty, J.E. 2004. Health financing and expenditure – progress since
1994 and remaining challenges. (In van Rensburg, H.C.J., ed. Health and health care in
South Africa. Pretoria: Van Schaik. p. 378-410).
McKenna, M. 2013. Imagining the post-antibiotic future.
https://medium.com/p/892b57499e77 Date of access: 22 Nov. 2013.
Merz, L.R., Warren D.K., Kollef, M.H. & Fraser, V.J. 2004. Effects of an antibiotic cycling
program on antibiotic prescribing practices in an intensive care unit. Antimicrobial agents
and chemotherapy, 48(8):2861-2865.
Meyers, A.M., Rivhards, G.A., Barrow, A.P. & Bocchiola, F. 2013. Inappropriate use of
fluoroquinolone (Levofloxacin/Tavanic) resulting in partial Achilles tendon rupture
complicated by deep venous thrombosis. South African medical journal, 31(6):229-230.
Method K. 2009. Going, going, gone: patents set to expire soon on many brand-name
drugs. http://drugtopics.modernmedicine.com/drug-topics/news/modernmedicine/modern-
medicine-feature-articles/going-going-gone?id=&sk=&date=&pageID=2 Date of access: 2
Sep. 2014.

223
Mizuki, Y., Fujiwara, I. & Yamaguchi, T. 1996. Pharmacokinetic reactions related to the
chemical structures of the fluoroquinolones. Journal of antimicrobial chemotherapy,
37(Suppl. A):A41-A55.
Monnet, D.L. & Lopez-Lazano, J.M. 2005. Relationship between antibiotic consumption and
resistance in European hospitals. Medicine et maladies infectieuses, 35(Suppl. 2):S127-
S128.
Monroe, S. & Polk, R. 2000. Antimicrobial use and bacterial resistance. Current opinion in
microbiology, 3:496-501.
Moodley, P., Pillay, C., Goga, R., Kharsamy, A.B.M. & Sturm, A.W. 2001. Evolution in the
trends of antimicrobial resistance in Neisseria gonorrhoea isolated in Durban over a five year
period: Impact of the introduction of syndromic management. Journal of antimicrobial
chemotherapy, 48(6):853-859.
Motheral, B., Brooks, J., Clark, M.A., Crown, W.H., Davey, P., Hutchins, D., Martin, B.C. &
Stang, P. 2003. A checklist for retrospective database studies – report of the ISPOR Task
Force on retrospective database. Value in health, 6(2):90-97.
Mukonzo, J.K., Namuwenge, P.M., Okure, G., Mwensige, B., Namusisi, O.K. & Mokanga, D.
2013. Over-the-counter sub-optimal dispensing of antibiotics in Uganda. Journal of
multidisciplinary healthcare, 6:303-310.
Muller-Pebody, B., Muscat, M., Pelle, B., Klein, B.M., Brandt, C.T. & Monnet, D.L. 2004.
Increase and change in pattern of hospital antimicrobial use, Denmark, 1997-2001. Journal
of antimicrobial chemotherapy, 54(6):1122-1126.
Munckhof, W.J. 2010. Ofloxacin. (In Grayson, M.L., ed. Kucers’ the use of antibiotics. 6th
ed. London: Edward Arnold. p. 1361-1395).
Naber, K.G. & Adam, D. 1998. Classification of fluoroquinolones. International journal of
antimicrobial agents, 10(4):255-257.
Nakamura, S. 1997. Mechanism of quinolone resistance. Journal of infection
chemotherapy, 3:128-138.

224
Nathwani, D., Sneddon, J., Patton, A. & Malcolm, W. 2012. Antibiotic stewardship in
Scotland: Impact of national programme. Antimicrobial resistance and infection control, 1:7.
National Institute for Communicable Disease. 2013. GERM-SA annual report 2013.
http://www.nicd.ac.za/assets/files/GERMS-SA%20AR%202013.pdf Date of access: 24 Sep.
2014.
Natsch, S., Hekster, Y.A., de Jong, R., Heerdink, E.R., Herings, R.M.C. & van der Meer,
J.W.M. 1998. Application of the ATC/DDD methodology to monitor drug use. European
journal of clinical microbiology and infectious diseases, 17(1):20-24.
Natsch, S. 2005. Audits of antibiotic prescribing. Medicines et maladies infectieuses,
35(Suppl. 2):S125-S126.
Nelson, K. & Williams, M.C., eds. 2007. Infectious Disease Epidemiology: Theory and
Practice. 3rd ed. Massachusetts: Jones & Bartlett.
Neu, H.C. 1992. The crisis in antibiotic resistance. Science, 257(5073):1064-1073.
Neyfakh, A.A., Bidnenko, V.E. & Chen, L.B. 1991. Efflux-mediated multidrug resistance in
Bacillus subtilis: Similarities and dissimilarities with the mammalian system. Proceedings of
the National Academy of Science, 88(1991):4781-4785.
Ng, E.Y., Truckis, M. & Hooper, D.C. 1996. Quinolone resistant mutations in topoisomerase
IV: relationship between flqA locus and genetic evidence that topoisomerase IV is the
primary target and DNA gyrase is the secondary target of fluoroquinolones in
Staphylococcus aureus. Antimicrobial agents and chemotherapy, 40(8):1881-1888.
Nicasio, A.M., Kuti, J.L. & Nicolau, D.P. 2010. Telavacin. (In Grayson, M.L., ed. Kucers’
the use of antibiotics. 6th ed. London: Edward Arnold. p. 654-660).
Niedermann, M.S. 2005. Principles of application of antibiotic use. International journal of
antimicrobial agents, 26(Suppl. 3):S170-S175.
Nikaido, H. 1989. Outer membrane barrier as a mechanism of antimicrobial resistance.
Antimicrobial agents and chemotherapy, 33(11):1831-1836.
225
Nix, D.E., Wilton, J.H., Ronald, B., Dislerath, L., Williams, V.C. & Norman, A. 1990.
Inhibition of norfloxacin absorption by antacids. Antimicromial agents chemotherapy,
34(3):432-435.
Norrby, S.R. 2010a. Carbenicillin, carindacillin, carfecillin, ticarcillin. (In Grayson, M.L., ed.
Kucers’ the use of antibiotics. 6th ed. London: Edward Arnold. p. 123-134).
Norrby, S.R. 2010b. Mecillinam (amdicocillin) and pivmecillinam. (In Grayson, M.L., ed.
Kucers’ the use of antibiotics. 6th ed. London: Edward Arnold. p. 152-159).
Norrby, S.R. 2010c. Clavulanic acid. (In Grayson, M.L., ed. Kucers’ the use of antibiotics.
6th ed. London: Edward Arnold. p. 167-174).
Normark, B.H. & Normark, S. 2002. Evolution and spread of antibiotic resistance. Journal
of internal medicine, 252:91-106.
Norris, P., Horsburgh, S., Keown, S., Arroll, B., Lovelock, K., Cumming, J., Herbison, P.,
Crampton, P. & Becket, G. 2011. Too much or too little? Prevalence and extent of
antibiotics in a New Zealand region. Journal of antimicrobial chemotherapy, 66(8):1921-
1926.
Norris, S. & Mandell, G.L. 1988. The quinolones: History and overview. (In, Andriole V.T.,
ed. The Quinolones. London: Academic Press. p. 1-14).
O’Brien, K.L., Wolfson, L.J., Watt. J.P., Henkle, E., Deloria-knoll, M., Lee, E., Mullholland, K.,
Levine, O.S. & Cherian, T. 2009. Burden of disease caused by Streptococcus pneumonia
in children younger than 5 years: global estimates. Lancet, 374(9693):893-902.
Obritsch, M.D., Fisc, D.N., MacLaren, R. & Jung, R. 2004. National surveillance of
antimicrobial resistance in Pseudomonas aeruginosa isolate obtained from intensive care
unit patients from 1993-2002. Antimicrobial agents and chemotherapy, 48(12):4606-4610.
Ohene, A. 1997. Bacterial pathogens and their antimicrobial susceptibility in Kumasi,
Ghana. East African medical journal, 74(4):450-455.

226
Okeke, I.N., Laxminarayan, R., Bhutta, Z.A., Duse, A.G., Jenkins, P., O’Brien, T.F., Pablos-
Mendez, A. & Klugman, K.P.A. 2005. Antimicrobial resistance in developing countries: Part
1: recent trends and current status. The lancet, 5(8):481-493.
Oliphant, C.M. & Green, G.M. 2002. Quinolones: A comprehensive review. American
family physician, 65(3):455-464.
Owens, R.C., Fraser, G.L. & Stogsdill, P. 2004. Antimicrobial stewardship program as a
means to optimize antimicrobial use. Pharmacotherapy, 24(7):896-908.
Oxford English Dictionary. 2014. Frequency.
http://www.oxforddictionaries.com/definition/english/frequency?q=frequency Date of access:
13 Mar. 2014.
Oxford English Dictionary. 2014. Maximum.
http://www.oed.com.nwulib.nwu.ac.za/view/Entry/115275?redirectedFrom=maximum#eid
Date of access: 12 Nov. 2014.
Oxford English Dictionary. 2014. Minimum.
http://www.oed.com.nwulib.nwu.ac.za/view/Entry/118854?redirectedFrom=minimum#eid
Date of access: 12 Nov. 2014.
Oxford English Dictionary. 2014. Prescriber.
http://www.oed.com.nwulib.nwu.ac.za/view/Entry/150646?redirectedFrom=prescriber#eid
Date of access: 5 May 2014.
Oxford English Dictionary. 2014. Prescription.
http://www.oxforddictionaries.com/definition/english/prescription Date of access: 13 Mar.
2014.
Oxford Concise Medical Dictionary. 2014. Variable.
http://www.oxfordreference.com.nwulib.nwu.ac.za/view/10.1093/acref/9780199557141.001.0
001/acref-9780199557141-e-10628 Date of access: 13 Mar. 2014.
Ozkurt, Z., Erol, S., Kadanali, A., Ertek, M., Ozden, K. & Tasyaran, M.A. 2005. Changes in
antibiotic use, cost and consumption after an antibiotic restriction policy applied by infectious
disease specialists. Japanese journal of infectious diseases, 58(6):338-343.

227
Pakyz, A.L., Lee, J.A., Ababneb, M.A., Harpe, S.E., Oinonen, M.J. & Polk, R.E. 2012.
Fluoroquinolone use and fluoroquinolone-resistant Pseudomonas aeruginosa is declining in
US academic medical centre hospitals. Journal of antimicrobial chemotherapy, 67(6):1562-
1564.
Pan, A., Gagliotti, C. Resi, D. & Morro, M.L. 2013. Antimicrobial stewardship programme in
Emilia-Romagna, Italy. Journal of global antimicrobial resistance, 1(3):175-179.
Pao, S.S., Paulsen, I.T. & Saier, M.H. 1998. Major facilitator super family. Microbiology
and molecular biology reviews, 62(1):1-35.
Park, B.J. & Stergachis, A. 2008. Automated database in pharmacoepidemiological studies.
(In Hartzema, A.G., Tilson, H.H. & Chan, K.A., eds. Pharmacoepidemiology and therapeutic
risk management. Ohio: Harvey Whitney. p. 519-544).
Paruk, F., Richards, G., Scribante, J., Bhagwanjee, S., Mer, M. & Perrie, H. 2012. Antibiotic
prescription practices and their relationship to outcome in South African intensive care units:
findings of the prevalence of infection in South African intensive care units (PISA) study.
South African medical journal, 102(7):613-616.
Paulsen, I.T., Brown, M.H. & Skurray, R.A. 1996. Proton-dependent multidrug efflux
systems. Microbiology and molecular biology reviews, 60(4):575-608.
Pechere, J.C. 2001. Patients’ interviews and misuse of antibiotics. Clinical infectious
diseases, 33(Suppl. 3):S170-S173.
Perry, C.M., Ormrod, D., Hurst, M. & Onrust, S. 2002. Gatifloxacin: A review of its uses in
the management of bacterial infections. Drugs, 62(1):169-207.
Petri, W.A. 2001a. Antimicrobial agents: Penicillins, cephalosporins and other beta-lactams
antibiotics. (In Hardman, J.G., Limbird, L.E., Goodman, L.S. & Gilman, A.G., eds. Goodman
and Gilman’s: The pharmacological basis of therapeutics. 10th ed. New York, NY: McGraw-
Hill. p. 1189-1218).
Petri, W.A. 2001b. Antimicrobial agents: Sulphonamides, trimethoprim, sulfamethozaxole,
quinolones and agents for urinary tract infections. (In Hardman, J.G., Limbird, L.E.,
Goodman, L.S. & Gilman, A.G., eds. Goodman and Gilman’s: The pharmacological basis of

228
therapeutics. 10th ed. New York, NY: McGraw-Hill. p. 1171-1188).
Phoba, M., Lunguya, O., Mayimon, D.V., di Mputu, P.L., Vanhoof, R., Verhaegen, J., van
Geet, C., Muyember, J. & Jacobs, J. 2012. Multidrug resistant Salmonella entericus,
Democratic Republic of the Congo. Emerging infectious diseases, 18(10):1692-1693.
Philips, C.J. 2012. Introduction. (In Pradelli, L. & Wertheimer, A., eds.
Pharmacoeconomics – principles and practice. Torino: Piazza Carlo Emanuel. p. 6-17).
Piddock, L.J.V. 2013. Antibiotic action: Helping deliver action plans and strategies. The
lancet infectious diseases, 13(12):1009-1011.
Piddock, L.V.J., Johnson, M.M., Simjee, S. & Pumbwe, L. 2002. Expressions of efflux pump
gene pmrA in fluoroquinolone resistant and susceptible clinical isolates of Streptococcus
pneumonia. Antimicrobial agents and chemotherapy, 46(3):808-812.
Plachouras, D., Kavatha, D., Antoruadou, A., Giannitsioti, E., Poulakou, G.,
Kanellakopoulou, K. & Giamarellou, H. 2010. Dispensing of antibiotics without prescriptions
in Greece, 2008: Another link in the antibiotic resistance chain. Eurosurveillance, 15(7):1-4.
Polk, R.E., Johnson, C.K., McClish, D., Wenzel, R.P. & Edmond, M.P. 2004. Predicting
hospital rates of fluoroquinolone-resistant Pseudomonas aeruginosa from fluoroquinolone
use in US hospitals and their surrounding communities. Clinical infectious diseases,
39(4):497-503.
Polk, R.E., Fox, C., Mahoney, A., Letcavage, J. & MacDougal, C. 2007. Measurement of
adult antibacterial drug use in 130 US hospitals: Comparison of defined daily dose and days
of therapy. Clinical infectious diseases, 44(5):664-670.
Poole, K. 2000. Efflux-mediated resistance to fluoroquinolones in gram negative.
Antimicrobial agents and chemotherapy, 44(9):2233-2241.
Poole, K. 2005. Efflux-mediated antimicrobial resistance. Journal of antimicrobial agents,
56:20-51.
Pradham, K.M., Arora, N.K., Jena, A., Susheela, A.K. & Bhan, M.K. 1995. Safety of
ciprofloxacin therapy in children: magnetic resonance images, body fluid levels of fluoride

229
and live growth. Acta paediatrica, 84(5):555-560.
Public Health England. 2014. English surveillance programme for antimicrobial utilisation
and resistance (EUPAUR) report 2014. London: Public Health England.
https://www.gov.uk/government/uploads/system/uploads/attachment_data/file/362374/ESPA
UR_Report_2014__3_.pdf Date of access: 24 Sep. 2014.
Putman, M., van Veen, H.W. & Konings, W.N. 2000. Molecular properties of bacterial
multidrug transporters. Microbiology and molecular biology reviews, 64(4):672-693.
Radyowijati, A. & Haak, H. 2002. Determinants of antimicrobial use in the developing world.
Child health research project special report, 4(11):1-36.
Radyowijati, A. & Haak, H. 2003. Improving antibiotic use in low income countries: An
overview of evidence of determinants. Social science and medicine, 57(4):733-744.
Rafailidis, S. & Falagas, M.E. 2010. Ampicillin/sulbactam. (In Grayson, M.L., ed. Kucers’
the use of antibiotics. 6th ed. London: Edward Arnold. p. 1204-216).
Ramdani-Bouguessa, N. & Rahal, K. 2003. Serotype distribution and antimicrobial
resistance of Streptococcus pneumonia isolated in Algiers, Algeria. Antimicrobial agents
and chemotherapy, 47(2):824-826.
Raveh, D., Levy, Y., Schlesinger, Y., Greenberg, A., Rudensky, B. & Yinnon, A.M. 2001.
Longitudinal surveillance of antibiotic use in the hospital. Quarterly journal of medicine,
94(3):141-152.
Rea, L.M. & Parker, R.A. 2005. Designing and conducting survey research: A
comprehensive guide. 3rd ed. California: Wadsworth.
Redmond, A., Sweeney, L., MacFarland, M., Mitchell, M., Daggett, S. & Kubin, R. 1998.
Oral ciprofloxacin in the treatment of pseudomonas exacerbations of paediatric cystic
fibrosis: clinical efficacy and safety evaluation using magnetic resonance image scanning.
The journal of international medical research, 26(6):304-312.
Reed, S.D., Friedman, J.Y., Engemann, J.J., Griffiths, R.I., Anstrom, K.J., Stryjewski, M.E.,
Szezech, L.A., Reller, B., Corey, R., Schulman, K.A. & Fowler, V.G. 2005. Costs and

230
outcomes among haemodialysis-dependent patients with methicillin-resistant or methicillin-
susceptible Staphylococcus aureus in bacteraemia. Infection control and hospital
epidemiology, 26(2):175-183.
Roca, A., Quinto, L., Abacassamo, F., Morais, L., Valles, X., Espasa, M., Siquaquo, B.,
Sacarlal, J., Macete, E., Nhacole, A., Mandomando, I., Levine, M.M. & Alonso, P.L. 2008.
Invasive Haemophilus influenza disease in children less than five years in Manhica, a rural
area of southern Mozambique. Tropical medicine and international health, 13(6):818-826.
Rodríquez Cruz, M.S., Gonzáles Alonso, I., Sánchez-Navarro, A. & Sayalero Marinero, M.L.
1999. In vitro study of the interaction between quinolones and polyvalent cations.
Pharmaceutica acta helvetiae, 73(5):237-245.
Rossiter, D. 2012. South African Medicine Formulary. Cape Town: South African Medical
Association.
Saez-Ilorens, X., McCoig, C., Feris, J.M., Vargas, S.L., Klugman, K.P., Hussey, G.D., Frenk,
R.R., Falleiros-Carvalho, L.H., Arguedas, A.G., Bradley, J., Arrietta, A.C., Waid, E.R.,
Pancorbo, S., McCracken, G.H. & Marques, S.R. 2002. Quinolone treatment for paediatric
bacterial meningitis: A comparative study of trovafloxacin and ceftriaxone with or without
Vancomycin. Paediatric infectious disease journal, 21(1):14-22.
Saga, T., Akasaka, T., Takase, H., Tanaka, M. & Sato, K. 2007. First detection of the
plasmid-mediated quinolone resistance determinant qnrA in Enterobacteriaceae clinical
isolate in Japan. International journal of antimicrobial agents, 29(6):738-739.
Saito, R., Kumita, W., Sato, K., Chida, T., Okamura, N., Moriya, K. & Koike, K. 2007.
Detection of plasmid-mediated quinolone resistance associated with qnrA in Escherichia coli
clinical isolate producing CTX-M-9 beta-lactamase in Japan. International journal of
antimicrobial agents, 29(5):600-602.
Sakpota, A.R., Coker, M.E., Rosenberg, G.R.E., Atkison, N.L., Sweet, S.J., Sopeju, P.O.,
Otivhia, E., Ayepola, O.O., Olajuyigbe, O.O., Shiveman, L., Pottinger, P.S. & Ojo, K.K.
2010. Self-medication with antibiotics for the treatment of menstrual symptoms in southwest
Nigeria: a cross-sectional study. Biomedical central public health, 10:1-10.
Sanche, S.E. & Ronald, A.R. 1999. Sulphonamides and trimethoprim. (In Root, R.K., ed.

231
Clinical infectious diseases: A practical approach. New York, NY: Oxford University. p. 313-
317).
Saravolatz, L.D. & Legget, J. 2003. Gatifloxacin, gemifloxacin and moxifloxacin: The role of
three newer fluoroquinolones. Clinical infectious diseases, 37:1210-1215.
SAS (Statistical Analysis System®). 2012. SAS for windows 9.3®. Cary: North Carolina.
Schaad, U.B., Stoupis, C., Wedgwood, J., Tschaeppeler, H. & Vock, P. 1991. Clinical,
radiologic, and magnetic resonance monitoring for skeletal toxicity in paediatric patients with
cystic fibrosis receiving a three-month course of ciprofloxacin. The paediatric infectious
diease journal, 10(10):723-729.
Schein, J., Janaqap-Benson, C., Grant, R., Sikirica, V., Doshi, V. & Olson, W. 2008. A
comparison of levofloxacin and moxifloxacin use in hospitalised community-acquired
pneumonia (CAP) patients in the U.S: focus on length of stay. Current medical research and
opinion, 24(3):895-906.
Scholar, E.M. 2002. Fluoroquinolones: Past, present and future of a novel group of
antibacterial agents. American journal of pharmacy education, 66(2):164-172.
Scholar, E.M. & Pratt, W.B. 2000. Antimicrobial drugs. 2nd ed. New York, NY: Oxford
University Press.
Scott, J.A.G., Mwarumba, S., Ngetsa, C., Njenga, S., Lowe, B.S., Slack, M.P.E, Berkley,
J.A., Mwangi, I., Maitland, K., English, M. & Marsh, K. 2005. Progressive increase in
antimicrobial resistance among invasive isolates of Haemophilus influenza obtained from
children admitted in a hospital in Kilifi, Kenya from 1994-2002. Antimicrobial agents and
chemotherapy, 49(7):3021-3024.
Sefton, A.M. 2002. Mechanisms of antimicrobial resistance: Their clinical relevance in the
new millennium. Drugs, 62(4):557-566.
Sharma, P.C., Jain, A. & Jain, S. 2009. Fluoroquinolone antibacterials: A review on
chemistry, microbiology and therapeutic prospects. Polish Pharmaceutical Society,
66(6):587-604.

232
Smith, A.M., Govender, N. & Keddy, K.H. 2010. Quinolone-resistant Salmonella typhi in
South Africa, 2003-2007. Epidemiology and infection, 138(1):86-90.
Smith, R.D. & Coast, J. 2002. Antimicrobial resistance: A global response. Bulletin of the
World Health Organization, 80(2):126-133.
Smith, W. 2005. The mean. (In Armitage, P & Colton, T., eds. Encyclopaedia of
biostatistics. 2nd ed. West Sussex: John Wiley. p. 3063-3064).
Snyman, J.R., ed. 2012. (MIMS) Monthly Index of Medical Specialties. Pretoria: MIMS. p.
291-297.
Somasundaram, S. & Manirannan, K. 2013. An overview of fluoroquinolones. Annual
review and research in biology, 3(3):296-313.
South Africa. Department of Health. 2009. Medicine and Related Substances Control Act,
2008 (72 of 2008). Government Gazette, 3214:2-40.
South Africa. Department of Health. 2011. Guidelines for the management, prevention and
control of meningococcal diseases in South Africa, 2011.
http://nicd.ac.za/assets/files/DoH%20Meningococcal%20Disease%20Guidelines%202011.p
df Date of access: 3 Oct. 2014.
South Africa. Department of Health. 2012a. Management of drug-resistant tuberculosis
policy guidelines. http://www.hst.org.za/sites/default/files/TBpolicy.pdf Date of access: 2
Oct. 2014.
South Africa. Department of Health. 2012b. Standard treatment guidelines and essential
medicines list. 3rd ed. Pretoria.
South Africa. Department of Health. 2013. Hospital level paediatrics: Standard treatment
guidelines and essential medicines list. 3rd ed. Pretoria.
South African Cystic Fibrosis Association. 2012. South African Cystic Fibrosis Consensus
document. 4th ed. http://www.sacfa.org.za/newsletters/CFConsensusDocument2013.pdf
Date of access: 2 Oct. 2014.

233
Spratt, B.G. 1994. Resistance to antibiotics mediated by target alteration. Science,
264(5157):388-393.
Stahlmann, R. & Lode, H. 1999. Fluoroquinolones. (In Root, R.K., ed. Clinical infectious
diseases: A practical approach. New York, NY: Oxford University. p. 305-312).
Stahlmann, R. & Lode, H. 2000. Safety overview: Toxicity, adverse effects and drug
interactions. (In Andriole, V.T., ed. The quinolones. 3rd ed. California: Academic Press.
p. 398-442).
Staib, A.H., Harder, S., Fuhr, U. & Wack, C. 1989. Interaction of quinolone with theophylline
metabolism in man: Investigation with lomefloxacin and pipemidic acid. International journal
of clinical pharmacology, therapy and toxicology, 26(6):289-293.
Staib, A.H., Stille, W., Dietlein, G., Shah, P.M., Harder, S., Mieke, S. & Beer, C. 1987.
Interaction between quinolones and caffeine. Drugs, 34(Suppl. 1):170-174.
Stass, H. & Kubitza, D. 1999. Pharmacokinetics and elimination of moxifloxacin after oral
and intravenous administration in man. Journal of antimicrobial chemotherapy, 43(Suppl.
B):B83-B90.
Stass, H., Bottcher, M. & Ochmann, K. 2001. Evaluation of the influence of antacids and H2
antagonists in the absorption of moxifloxacin after oral administration of a 400mg dose to
healthy volunteers. Clinical pharmacokinetics, 40(Suppl. 1):39-48.
Stass, H., Dalhoff, A., Kubitza, D. & Schuhly, U. 1988. Pharmacokinetics; safety and
tolerability of ascending doses of moxifloxacin, a new 8-methoxy quinolone administered to
healthy subjects. Antimicrobial agents and chemotherapy, 42(8):2060-2065.
Stass, H., Kubitza, D., Halabi, A. & Delesen, H. 2002. Pharmacokinetics of moxifloxacin a
novel 8-methoxy-quinolone in patients with renal dysfunction. Journal of clinical
pharmacology, 53:232-237.
Statistics South Africa. 2011. Mid-year population estimates 2011.
http://www.statssa.gov.za/publications/P0302/P03022011.pdf Date of access: 23 July 2014.
Stein, G.E. 1996. Pharmacokinetics and pharmacodynamics of the newer fluoroquinolone.

234
Clinical infectious diseases, 23(Suppl. 1):S19-S24.
Straus, S.K. & Hancock, R.E.W. 2006. Mode of action of the new antibiotic for the gram
positive pathogens Daptomycin: Comparison with cationic antimicrobial peptides and
lipopeptides. Biochemical et biophysica acta, 1758(9):1215-1223.
Strom, B.L. 2006. Overview of automated databases in pharmacoepidemiology. (In Strom,
B.L. & Kimel, S.E., eds. Textbook of pharmacoepidemiology. West Sussex: John Wily &
Sons. p. 167-172).
Stuart, R.L. 2010. Norfloxacin. (In Grayson, M.L., ed. Kucers’ the use of antibiotics. 6th
ed. London: Edward Arnold. p. 1347-1360).
Stuart, R.L., Wilson, J., Bellaard-Smith, E., Brown, R., Wright, L., Vandergraaf, S. &
Gillespie, E.E. 2012. Antibiotic use and misuse in residential aged care facilities. Internal
medicine journal, 42(10):1145-1149.
Sulaiman, A.S., Rakaita, R.M. & Murray, B.E. 1999. Glycopeptides. (In Root, R.K., ed.
Clinical infectious diseases: A practical approach. New York, NY: Oxford University. p. 285-
289).
Sweetman. S.C. 2012. Martindale: the complete drug reference. 37th ed. London:
Pharmaceutical press.
Tadese, A., Mekonne, A., Kassu, A. & Asmelash, T. 2001. Antimicrobial sensitivity of
Neisseria gonorrhoea in Gonda, Ethiopia. East African medical journal, 78(5):259-261.
Taketomo, C.K., Hodding, J.H. & Kraus, D.M. 2005. Paediatric dosage handbook. 17th ed.
Ohio: Lexi-Comp.
Takiff, H.E., Gimino, M., Musso, M.C., Weisbrod, T., Martinez, R., Deldago, M.B., Salazar,
L., Bloom, B.R. & Jacobs, W.R. 1996. Efflux pump of the proton anti-porter family confers
low-level fluoroquinolone resistance in Mycobacterium smegmatis. Proceedings of The
National Academy of Science, 93(1):362-366.
Tattevin, P., Breton, G. & Carbon, C. 1999. Other beta-lactam antibiotics: Penems,
carbapenems and monobactams. (In Root, R.K., ed. Clinical infectious diseases: A

235
practical approach. New York, NY: Oxford University. p. 265-271).
The European Network of Centres for Pharmacoepidemiology and Pharmacovigilance.
2013. Guide on methodological standards in pharmacoepidemiology (revision 2).
http://www.encepp.eu/standards_and_guidances/documents/ENCePPGuideofMethStandard
sinPE_Rev2.pdf Date of access: 4 Aug. 2014.
The Zimbabwe, Bangladesh, South Africa (Zimbasa) Dysentery study group. 2002.
Multicentre, randomised, double blind clinical trial of short course versus standard course
oral ciprofloxacin for Shigella dysentriae type 1 dysentery in children. Paediatric infectious
disease journal, 21(3):1136-1141.
Thursky, K. 2010. Piperacillin-tazobactam. (In Grayson, M.L., ed. Kucers’ the use of
antibiotics. 6th ed. London: Edward Arnold. p. 238-248).
Tibebu, M., Shibabaw, A., Medhin, G. & Kassu, A. 2013. Neisseria gonorrhoea non-
susceptibility to cephalosporins and quinolones in North-west Ethiopia. Biomedical central
infectious diseases, 13(1):1-6.
Tramontana, A., Thursky, K. & Norrby, S.R. 2010. Mezlocillin, azlocillin, apalcillin and
piperacillin. (In Grayson, M.L., ed. Kucers’ the use of antibiotics. 6th ed. London: Edward
Arnold. p. 135-151).
Truter, I., Wiseman, K. & van W. Kotze, T.J. 1996. The defined daily dose as a measure of
drug consumption in South Africa. South African medical journal, 86(6):675–679.
Tunger, O., Dinc, G., Ozbakkloglu, B., Atman, U.C. & Algun, U. 2000. Evaluation of rational
antibiotic use. International journal of antimicrobial agents, 15(2):131-135.
Turnidge, J. 1999. Pharmacokinetics and pharmacodynamics of fluoroquinolones. Drugs,
58(Suppl. 2):29-36.
Turnidge, J. 2010a. Methicillin. (In Grayson, M.L., ed. Kucers’ the use of antibiotics. 6th
ed. London: Edward Arnold. p. 93-99).
Turnidge, J. 2010b. Isoxazoyl penicillin: Oxacillin, dicloxacillin, flucloxacillin. (In Grayson,
M.L., ed. Kucers’ the use of antibiotics. 6th ed. London: Edward Arnold. p. 100-114).

236
Turnidge, J. 2010c. Nafcillin. (In Grayson, M.L., ed. Kucers’ the use of antibiotics. 6th ed.
London: Edward Arnold. p. 115-122).
Turnidge, J. & Christainsens, K. 2005. Antibiotic use and resistance – proving the obvious.
The lancet, 36(9459):548-549.
The Infectious Dieases and Blood Policy Team. 2013. UK five year antimicrobial resistance
(AMR) strategy 2013 to 2018: Measuring success. London: Department of Health.
Urueata-Robledo, J., Ariza, H., Jardim, J.R., Caballero, A., García-Calderón, A., Amábile-
Cuevas, C.F., Hernández-Oliva, G. & Vivar-Orozco, R. 2006. Moxifloxacin versus
levofloxacin against acute exacerbation of chronic bronchitis: the Latin American cohort.
Respiratory medicine, 100(9):1504-1511.
Van Bambeke, F., Laethem, Y.V., Couralin, P. & Tulkens, P.M. 2004. Glycopeptide
antibiotics from conventional molecules to new derivatives. Drugs, 64(9):913-936.
Van de Boogaard, J., Semvua, H.H., Boeree, M.J., Aarnoutse, R.E. & Kibiki, G.S. 2010.
Sale of fluoroquinolone in northern Tanzania: A potential threat for fluoroquinolone use in
tuberculosis treatment. Journal of antimicrobial chemotherapy, 65(1):145-147.
Van de Sande-Bruinsma, N., Grundmann, H., Verlon, D., Tiermersma, E., Monen, J.,
Goossens, H. & Ferech, M. 2008. European antimicrobial resistance surveillance system,
ESAC project group, antimicrobial use and antimicrobial resistance in Europe. Emerging
infectious disease, 14(11):1722-1730.
Van Slooten, A.D., Nix, D.E., Wilton, J.H., Love, J.H., Spivey, J.M. & Golstein, H.R. 1991.
Combined use of ciprofloxacin and sulcralfates. Annals of pharmacotherapy, 25(6):578-582.
Verbrugge, L.M. 1982. Sex differentials in health. Public health reports, 97(5):417-437.
Vincent, J., Dogolo, L., Barns, B.A., Willavise, S.A. & Teng, R. 1988. Single- and multiple-
dose administration, dosing regimens, and pharmacokinetics of trovafloxacin and
alatrofloxacin in humans. European journal of clinical microbial infectious disease, 17:427-
430.
Visser, A., Moore, D., Whitelaw, A., Kantor, G. & Lawman, W. 2011. Interventions. South
237
African medical journal, 101(8):587-595.
Vlahoric-Placevski, V., Morovic, M. & Placevski, G. 2000. Antibiotic utilization at the
university hospital after introducing an antibiotic policy. European journal of clinical
pharmacology, 56(1):97-101.
Von Gottberg, A., Klugman, K.P., Cohen, C., Wolter, N., De Gouveia, L., Du Plesis, M.,
Mpembe, R., Quan, V., Whitelaw, A., Hoffman, R., Govender, N., Meiring, S., Smith, A.A. &
Schrag, S. 2008. Emergence of levofloxacin non-susceptible Streptococcus pneumoniae
and treatment for multi-drug resistant tuberculosis in children in South Africa: A cohort
observational surveillance study. The lancet, 371(9618):1108-1113.
Voss, A. & Ghafur, A. 2013. The Chennai declaration – Indian doctors fight against
antimicrobial resistance. Antimicrobial resistance and infection control, 2:7.
Walsh, C. 2000. Molecular mechanisms that confer antibacterial drug resistance. Nature,
406(6797):775-781.
Wang, M., Tran, J.H., Jacoby, G.A., Zhang, Y., Wang, F. & Hooper, D.C. 2003. Plasmid-
mediated quinolone resistance in clinical isolates of Escherichia coli from Shanghai, China.
Antimicrobial agents and chemotherapy, 47(7):2242-2248.
Waning, B. & Montagne, M. 2005. Pharmacoepidemiology: principles and practices. New
York, NY: McGraw Hill.
Wasfy, M.O., Pimentel, G., Abdel-Maksoud, M., Russel, K.L., Barrozo, C.P., Klena, J.D.,
Earhart, K. & Hajjeh, R. 2005. Antimicrobial susceptibility and serotype distribution of
Streptococcus pneumonia causing meningitis in Egypt, 1998-2003. Journal of antimicrobial
chemotherapy, 55(6):958-964.
Weinstein, R.A. 2001. Controlling antimicrobial resistance in hospitals: Infection control and
use of antibiotics. Emerging infectious disease, 7(2):188-192.
White, A.L., Atmar, K.G., Wilson, J., Cate, T.R., Stager, C.E. & Greenberg, S.B. 1997.
Effects of requiring prior authorization for selected antimicrobials: Expenditures,
susceptibilities, and clinical outcomes. Clinical infectious diseases, 25(2):230-399.
238
White, R.J. 2012. Early history of antibiotic discovery - empiricism. (In Pucci, M.J. &
Dougherty, T.J., eds. Antibiotic discovery and development. New York, NY: Springer. p.
10-21).
WHO see World Health Organization.
Winters, C. & Gelband, H. 2011. The Global Antibiotic Resistance Partnership (GARP).
South African medical journal, 101(8):556.
Wirtz, V.J., Dreser, A. & Gonzales, R. 2010. Trends in antibiotic utilization in eight Latin
American countries. Pan American journal of public health, 27(3):219-225.
Wolff, M.J. 1993. Use and misuse of antibiotics in Latin America. Clinical infectious
diseases, 17(Suppl. 2):S346-S351.
Wolfson, J.S. & Hooper, D.C. 1985. The fluoroquinolones; structures, mechanism of action
and resistance, and spectra of activity in vitro. Antimicrobial agents and chemotherapy,
28(4):581-586.
Working Group of the Infectious Diseases Group in Southern Africa. 2008. Updated
guideline for the management of upper respiratory tract infections in South Africa: 2008.
South African journal of epidemiology and infections, 23(4):27-40.
Working Group of the South African Thoracic Society. 2007. Management of community-
acquired pneumonia in adults. South African medical journal, 97(12):1296-1306.
World Health Organization. 1998. The role of the pharmacist in self-care and self-
medication. The Hague: WHO.
http://apps.who.int/medicinedocs/pdf/whozip32e/whozip32e.pdf Date of access: 14 Jan.
2014.
World Health Organization. 2001. WHO global strategy for the containment of antimicrobial
resistance. Geneva: WHO.
http://whqlibdoc.who.int/hq/2001/WHO_CDS_CSR_DRS_2001.2.pdf Date of access: 21
May 2013.
World Health Organization. 2003. Introduction to drug utilisation research. Oslo: WHO.
239
http://www.who.int/medicine/areas/quality_safety/safety_efficacy/Dru%
20utilisation%research.pdf. Date of access: 21 May 2013.
World Health Organization. 2005. Pocket book of hospital care for children. WHO: Geneva.
World Health Organization. 2008. Guidelines for the programmatic management of drug-
resistant tuberculosis: emerging updates 2008. Geneva: WHO.
World Health Organisation. 2011. Combat antimicrobial resistance – World Health Day
2011. http://www.who.int/world-health-day/2011/WHD201_FS_EN.pdf Date of access: 26
Sep. 2014.
WHO World Health Organization. 2012. WHO Collaborating Centre for Drug Statistics
Methodology - guidelines for ATC classification and DDD assignment 2013. Oslo: WHO.
http://www.whocc.no/atc_ddd_publications/guidelines/ Date of access: 26 Sep. 2013.
World Health Organization. 2013. Integrated surveillance of antimicrobial resistance: A
guide from a WHO advisory group. Geneva: WHO.
http://apps.who.int/iris/bitstream/10665/91778/1/9789241506311_eng.pdf Date of access:
26 Sep. 2013.
World Health Organization. 2014. Antimicrobial resistance global report on surveillance.
Geneva: WHO.
http://apps.who.int/iris/bitstream/10665/112642/1/9789241564748_eng.pdf?ua=1 Date of
access: 4 Aug. 2014.
Wright, G.D. 2005. Bacterial resistance to antibiotics: Enzymatic degradation and
modification. Science, 57(10):1451-1470.
Yates, R.R. 1999. New intervention strategies for reducing antimicrobial resistance.
Emerging resistance and therapeutic options, 115(Suppl. 3):S24-S27.
Yee, C.I., Duffy, C., Gerbino, P.G., Stryker, S. & Noel, C.J. 2002. Tender and joint
disorders in children after treatment with fluoroquinolones or azithromycin. Paediatric
infectious disease journal, 21(2):1136-1141.
Yocum, R.R., Rasmussen, J.R. & Strominger, J.L. 1980. The mechanism of action of
240
penicillin. The journal of biological chemistry, 255(9):3977-3986.
Zerouali, K., Elmdaghri, N., Boudouma, M. & Benbachir, M. 2002. Sero-groups, serotypes,
sero-subtypes and antimicrobial susceptibilities of Neisseria meningitidis isolates in
Casablanca, Morocco. European journal of clinical microbiology and infectious diseases,
21(6):483-485.
Zhanel, G.G., Wielse, R., Dilay, L., Thomson, K., Rubintsein, E., Hoban, D.J., Noreddin,
A.M. & Karlowsky, J.A. 2007. Comparative review of the carbapenems. Drugs, 67(7):1027-
1052.

241
ANNEXURE A – SUPPLEMENT TO CHAPTER 2
This supplement contains additional information to the literature review phase of the study
(refer to chapter 2).
ANNEX. A.1 ATC systems main groups
A Alimentary tract and metabolism
B Blood and blood forming organs
C Cardiovascular system
D Dermatologicals
G Genito-urinary system and sex hormones
H Systemic hormonal preparations, excl. sex hormones and insulins
J Anti-infectives for systemic use
L Antineoplastic and immune-modulating agents
M Musculo-skeletal system
N Nervous system
P Antiparasitic products, insecticides and repellents
R Respiratory system
S Sensory organs
V Various

242
ANNEXURE B – SUPPLEMENT TO CHAPTER 3
This supplement contains information, tables and figures relevant to the empirical
investigation of the study (refer to chapter 3).
Annex. C.1 Author Guidelines - Southern African Journal of Infectious Diseases
Manuscripts submitted to the SAJID must be in the form of Research Articles, Brief Reports,
Clinical Case Studies, Correspondence, Reviews, State-of-the-Art Articles, Commentaries
and Opinion Papers, Editorials or Supplement Articles. The Journal welcomes the
publication of Guidelines, Conference Proceedings Newsletters or Press
Releases, and Book Reviews. Articles, Brief reports and Reviews are peer reviewed; other
categories are reviewed by the Editors. Commentaries and Editorials are generally invited
contributions, indicating the authors’ identity, while manuscripts in the form of Reviews, and
State-of-the-Art Articles may also be requested by the Editors.
All manuscripts must have conflict of interest and funding statements. When authors submit
a manuscript, whether an article or a letter, they are responsible for disclosing all financial
and personal relationships that might bias their work. To prevent ambiguity, authors must
state explicitly whether potential conflicts do or do not exist. Authors should do so in the
manuscript on a conflict-of-interest notification page that follows the title page.
Manuscripts describing research in human subjects or animals must indicate ethics
clearance from appropriate research review committees. When reporting experiments on
human subjects, authors should indicate whether the procedures followed were in
accordance with the ethical standards of the responsible committee on human
experimentation (institutional and national) and with the Helsinki Declaration of 1975, as
revised in 2008. When reporting experiments on animals, authors should indicate whether
the institutional and national guide for the care and use of laboratory animals was followed.
Articles describe original investigations at an acceptable degree of completion, constituting
an advance in the field. Articles must not exceed 3500 words of text, without counting the
abstract, references or legends, and illustrations and tables must be limited to the minimum
necessary for clear and concise presentation. The abstract must either be structured,
using Background, Methods, Results, and Conclusions as headings and comprising no more
than 250 words, or unstructured with a 200 word limit. Articles are limited to a maximum of 7

243
insets (tables and figures combined) and 50 references.
Brief Reports present complete studies that are narrower in scope than those described in
Articles or that present new developments. Manuscripts that are descriptive or primarily
methodological in nature, or that describe in vitro chemotherapeutic studies should, in
general, be submitted as Brief Reports. Brief Reports include an abstract (no more than 100
words) and are limited to a total of no more than 2000 words of text, a total of 2 inserts
(tables or figures), and 15 references.
Correspondence (letters) must be submitted in reference to a previous publication in SAJID
(within the previous 12 months), or relate to a topical matter in line with the interests of
FIDSSA, PHASA or their affiliated societies. Please prepare the letter in manuscript format,
including a title page. The letter must not exceed 750 words of text, 1 insert (table or figure)
and 10 references.
Commentaries and Editorials are generally invited by the Editor and are overviews of articles
in SAJID, or of other research in epidemiology or infectious diseases, or matters relating to
public health and other issues of special interest to FIDSSA, PHASA or their associated
societies. Unsolicited commentaries are also considered.
Reviews and State-of-the-Art Articles that are research oriented or fall within the fields of
interests of FIDSSA, PHASA or any of their affiliated societies will be considered for
publication by SAJID. Prospective authors of such manuscripts are advised to communicate
with the Editor in advance to ensure that a specific contribution is deemed appropriate and
timely. Manuscripts of Reviews and State-of-the-Art Articles will be peer-reviewed.
Reviewers
The Journal would encourage authors to supply the names of at least 2 potential reviewers
for their manuscript, as well as to indicate any reviewers they would feel may have a
potential conflict of interest with regard to their submission.
Supplements
Requirements for supplement manuscripts generally follow those for SAJID manuscripts,
including conflict of interest and funding statements. Inquiries relating to suitability of topic,

244
programme organisation, production and costs should be made to the Editor.
Evaluation of manuscripts
Review procedure. The Editor-in-Chief and Emeritus Editor screen all unsolicited manuscript
submissions and some of these are rejected without further review. All other manuscripts are
sent to a minimum of two outside experts for review. After receipt of the reviewers’ reports,
the Editor-in-Chief and the Emeritus Editor with administrative assistance of the Journal
Secretary discuss the merits of the manuscripts and the Editor-in-Chief makes the final
decision to accept, reject, or request revision of the manuscript. A request for revision does
not guarantee ultimate acceptance of the revised manuscript
Related manuscripts. If there appears to be significant overlap between a manuscript
submitted to SAJID and another submitted manuscript by the same authors to SAJID or
another journal, the editors will take the matter up with the corresponding author, and based
on the response, take appropriate action (ask for modification, or reject with detailed
explanation). Further action may include informing the appropriate authority in the authors’
resident institution and if overlapping is discovered after publication in SAJID, publishing an
appropriate announcement to that effect in the journal.
DOCUMENT REQUIREMENTS
Checklist: The following are required for your manuscript to be processed:
Covering Letter
All manuscripts submitted to SAJID must be accompanied by a letter declaring that the
manuscript has not been submitted or accepted for publication elsewhere. This letter must
confirm and declare that all authors have seen and approved the content and have
contributed significantly to the work. Authors should suggest potential unbiased reviewers
who are qualified to review their manuscript. A covering letter must also accompany a
revised submission and must address issues raised in the review process.
Manuscript Preparation
The SAJID complies with the Uniform Requirements for Manuscripts Submitted to
Biomedical Journal Journals (Ann Intern Med 2000; 133:229-231

245
editorial]; http://www.icmje.org, full text). Text, tables, references, and legends must be
double- spaced. Italics should be used for genus and species names and for genes but not
for in vivo, in vitro, in situ, et al., or other Latin-derived expressions. For layout of manuscript
and appropriate style see a recent issue of SAJID.
Title page. On the title page, please supply a running head of not more than 40 characters
and spaces, a title of not more than 160 characters and spaces, the names and affiliations of
all the authors, and word counts of the abstract and text. Each author’s first name,
subsequent initials and surname must be used.
Footnote page. Footnotes must include:
Statement that authors either have or have not a commercial or other association that might
pose a conflict of interest (e.g. pharmaceutical stock ownership, consultancy, advisory board
membership, relevant patents, or research funding)
Statement naming sources of financial support (including grant numbers)
Name, date (month and year), and location (city, and country if not South Africa) of a
meeting at which all or part of the information has been presented (include an abstract
number, if available)
Name, address, telephone and fax numbers, and e-mail address of the person to whom
correspondence should be addressed
Current affiliations and addresses for authors whose affiliations have changed since
completion of the study
Abstract. The abstract for an Article may be structured with the headings Background,
Methods, Results, and Conclusions (250-word limit) or unstructured (200-word limit).
Abstracts of Brief Reports should be no more than 100 words. Whether structured or
unstructured, the abstract must state the purpose of the research, the methods used, the
results, and the conclusions. Do not cite references in the abstract. Include up to 10 key
words, separate from the abstract. Please remember that the abstract is particularly useful
for literature retrieval purposes.
Text. The text of Articles must be no longer than 3500 words, and that of Brief Reports no
longer than 2000 words. The Methods section must include a statement that informed
consent was obtained from patients or their parents or guardians, and human
experimentation guidelines of the National Department of Health (http://www.doh.gov.za) or

246
the South African Medical Research Council (MRC; http://www.sahealthinfo.org/ethics/index.
htm) and /or those of the authors’ institution(s ) were followed in the conduct of clinical
research or that animal experimentation guidelines (see MRC website above) were followed
in animal studies.
References. Articles are generally limited to 50 references, Brief Reports to 15 references.
Only works that have been published or accepted for publication can be included in the
reference list. Unpublished observations by the authors (authors’ unpublished data) personal
communications (SP Stanley, personal communication), and manuscripts submitted for
publication (J Odendaal, S Coovadia and J Radebe, submitted) should be mentioned
parenthetically in the text Please number references in order of appearance; those cited only
or first in tables or figures are numbered according to the order in which the table or figure is
cited in the text. Example: If table 3 is cited in the text after reference 20, a new reference
cited in table 3 will be reference 21.
References must follow the Uniform Requirements for Manuscripts Submitted to Biomedical
Journals (http://www.icmje.org, full text). Provide all authors’ (or editors’) names when there
are fewer than 7; for 7 or more, list the first 3 and add “et al.” Titles of journals not listed
in Index Medicus should be spelt out in full. Reference to a doctoral thesis or Master’s
dissertation should include the author, title, institution, location, year and publication
information, if published. For online resources, include a URL and date accessed. Accuracy
of references is the responsibility of the authors.
Examples of the proper format are as follows:
Sonnenberg P, Glyn Thomas R, Glynn JR, Shearer S, Godfrey-Faussett, Murray J. Clinical
and radiological features of pulmonary disease due to culture-positive Mycobacterium
tuberculosis or non-tuberculous mycobacteria in South African gold miners. South Afr J
Epidemiol Infect 2005; 20: 130-135
Marin M, Nguyen HQ, Langidrik JR, et al. Measles transmission and vaccine effectiveness
during a large outbreak on a densely populated island: Implications for vaccination policy.
Clin Infect Dis 2006; 42: 315-319
Strebel PM, Papania MJ, Halsey NA. Measles vaccine. In: Plotkin SA, Orenstein WA, eds.
Vaccines. 4th ed. Philadelphia: WB Saunders, 2004: 389-440.
247
Mothibeli KM, McGee L, Smith AM, Klugman KP. Molecular epidemiology of pneumococcal
serotype 3 isolates.[abstract ID P56]. In: Programme and Abstract Book of the 1st Joint
Congress of the Federation of Infectious Diseases Societies of Southern Africa (Sun City,
North-West Province). Johannesburg: Presentations Graphics, 2005: 42.
World Health Organization. Initiative for vaccine research. Available at: http://www.who.int/va
ccine_research/diseases/measles/en/. Accessed 1 February 2005.
Acknowledgment(s). The page preceding the references may include a statement thanking
those who assisted substantially with work relevant to the study.
Statistical analysis. The statistical analyses used should be identified both in the text and in
all tables and figures where the results of statistical comparison are shown.
Units of measure. All Data should be expressed in metric units; use of SI units is
encouraged. Use ºC for temperature.
Tables and figures. Articles are limited to a maximum of seven inserts (tables and figures
combined), Brief Reports to a maximum of two inserts. Data should not be repeated in both
a table and a figure. Abbreviations and acronyms used in tables and figures must be
explained in the table footnotes and figure legends, even if already defined in the text.
Tables should be numbered in the order of mention in the text. Tables should be typed
double-spaced throughout, with no vertical or internal rules. Footnotes and accompanying
explanatory material should be kept to a minimum. Footnotes should be placed below the
table and designated by superscript lowercase letters (listed in order of location when the
table is read horizontally). Each column must have an appropriate heading describing the
data in the column below, and units of measure must be clearly indicated. For further
instructions on the preparation of tables in Word , consult the Special Instructions for Tables.
Figures should be also numbered in the order of mention in the text and should appear at
the end of the manuscript and references. Your figures should be prepared in accordance
with the Guidelines for Submission of Artwork. Letters, numbers, and symbols should be
clear and of sufficient size to be legible when the figures are reduced. Photomicrographs
should have internal scale markers. Figures reproduced from other publications must be
accompanied by permission from the copyright holder. If the manuscript is accepted, the

248
author will be required to send one complete set of glossy, hard-copy figures.
Figure legends should be double-spaced and appear on a separate page preceding the
figures. Any abbreviations or symbols used but not defined in the figure itself must be
defined in the legend.
Style. Authors are referred to the American Medical Association Manual of style: A Guide for
Authors and Editors (9th ed., Williams& Wilkins, 1997) and the Chicago Manual of
Style (15th ed., University of Chicago Press, 2003).For commercially obtained products
mentioned in the text, list the full names of manufacturers. Generic names of drugs and
other chemical compounds should be used.
Nomenclature. SAJID recommends the latest widely accepted nomenclature, as set out in
documents prepared by recognised international agencies e.g. the International Journal of
Systematic and Evolutionary Microbiology, Bergey’s Manual of Determinative
Bacteriology (9th ed., revised, Williams& Wilkins, 1993), Virus Taxonomy – The
Classification and Nomenclature of Viruses: Sixth Report of the International Committee on
Taxonomy of Viruses (Springer-Verlag, 1995). The latter document also supplies standard
abbreviations for virus species.
Clinical trials registration. All clinical trials must be registered in a registry that is
electronically accessible to the public, free of charge. Registration should occur before
patient enrolment and the registry’s URL and the trial’s registration number must be supplied
at the end of the manuscript’s abstract. For information on acceptable registries, consult the
ICMJE Web site, http://www.icmje.org . The National Library of Medicine’s registry which is
free and open to all investigators, generally meets with the requirements of journals for the
publication of clinical trials.

249
Annex. B.2 Author guidelines – Journal of antimicrobial chemotherapy
Article types and format
All documents should be double spaced, with wide margins. A clear, legible single font
(which is readily available internationally) and point size should be employed throughout. For
symbols, please use the 'insert symbol' function and ONLY select characters from the
'normal text' subset. All submitted articles should be line numbered (using continuous line
numbers). To do this in Word, use File, Page Setup, Layout, Line Numbers and select
continuous line numbering. Please DO NOT insert page numbers (as the pdf proof created
by the online submission system will automatically be page numbered).
All articles should include a title page comprising: article title; author names and their
affiliations (each affiliation address must be given separately and in full); telephone, fax and
e-mail contact details for the corresponding author; a short running title; and 3-5 keywords
(very general terms such as 'bacteria' and 'human' and terms already present in the title
should be avoided, as should non-standard abbreviations). In addition, all articles must
include a Funding section (if reporting original research) and a Transparency declarations
section.
Original articles and Brief reports must have a structured synopsis. The headings for the
structured synopsis are as follows: Objectives, Patients and methods (or Methods), Results,
and Conclusions.
Original articles. There is no length limit for this format; however, papers must be written as
concisely as possible. Original articles are divided into the following sections: Synopsis (250
words maximum), Introduction, Materials (or Patients) and methods, Results, Discussion,
Acknowledgements, Funding, Transparency declarations and References. Repetition of
content between sections must be avoided. A combined Results and Discussion section is
acceptable.
Brief reports. These should have the same format as Original articles, but should have no
more than two figures/tables, should have a maximum of 20 references and should not
exceed 1500 words of text.
Antimicrobial practice. Articles on topics related to the use of antimicrobials, format as for
Original articles/Brief reports.

250
Correspondence. Letters on topics of concern or interest in the field of antimicrobial
chemotherapy, particularly arising from papers or letters already published in the Journal.
These should be addressed to the Editor-in-Chief and must not exceed 800 words, one
figure or table and 10 references.
Case reports. JAC will publish Case reports that are of sufficient calibre and potential
importance, and they should be submitted in the form of Correspondence (see above).
Please note that patient anonymity MUST be preserved in Case reports (see the later
section on Ethics approval and patient consent/privacy).
Systematic review articles. There is no length limit for this format. A systematic review, as
defined by the Cochrane Handbook, is ‘A review of a clearly formulated question that uses
systematic and explicit methods to identify, select, and critically appraise relevant research,
and to collect and analyse data from the studies that are included in the review. Statistical
methods (meta-analysis) may or may not be used to analyse and summarize the results of
the included studies.’ They should include a structured synopsis (with appropriate headings;
these may differ from the headings used for Original articles etc.).
Review articles. There is no length limit for this format. These generally aim to give an
overview of a field suitable for a wide audience, and they should include a synopsis (250
words maximum). Most reviews are invited. We are pleased to consider unsolicited reviews,
but authors are encouraged to consult the Editor-in-Chief in advance of writing to avoid
duplicating commissioned material.
Leading articles. These are usually in the region of 800-1000 words and may contain the
expression of opinion as well as fact. They should address a topical subject, perhaps taking
a particular viewpoint and throwing new light on a current debate. A leading article should
include a short synopsis (150 words maximum) that should convey the topics and ideas the
article covers. Those wishing to contribute a Leading article are encouraged to contact the
Editor-in-Chief to discuss their ideas before writing to prevent clashes with any articles
already in the pipeline.
Please note that on publication all Original articles and Brief reports, as well as Antimicrobial
practice papers, will be published under the heading of Original research so that articles on
similar topics can be grouped together when assigned to an issue. In addition each piece of
Correspondence will be published as either a Research letter or a Letter to the Editor.
251
Peer review
After preliminary examination of the submission by Editorial Office staff to check that all the
necessary elements are present, the paper is passed to the Editor-in-Chief. The Editor-in-
Chief then assigns the paper to an appropriate Senior Editor. The Senior Editor is then
responsible for selecting an Editor to handle the article. Articles can be rejected immediately
by the Editor-in-Chief, a Senior Editor or an Editor without further peer review. The assigned
Editor is responsible for selecting referees and obtaining referee reports.
The usual number of referees is two, however, the Editors reserve the right to make a
decision on a paper on the basis of one referee report, or seek the opinion of more than two
referees if they judge this to be necessary or desirable. Leading articles and
Correspondence are not routinely sent for external refereeing, but the Editor-in-Chief, Senior
Editors and Editors reserve the right to seek the opinion of one or more external referees if
they judge this to be necessary or desirable. Senior Editors, Editors and referees are asked
to consider whether they have any conflicts of interest when they are assigned a paper, and
if necessary to decline to handle the paper. See the section ‘Conflicts of interest’ for more
information on this subject.
If an Editor decides upon rejection of a paper, it is passed back to the handling Senior Editor
for approval of this decision. All rejection correspondence therefore originates from a Senior
Editor. Authors should regard rejection as final and only resubmit if they have been invited to
do so. Papers may be rejected for a number of reasons, including: (i) they may be of only
peripheral interest and perhaps more suitable for submission to a different journal; (ii) they
may be, in the opinion of the reviewers, scientifically flawed; (iii) they may be unclear or
overly long; or (iv) they may not make a significant contribution to the literature.
Requests that a revised version of a paper be submitted for consideration are sent direct to
the corresponding author from the Editor responsible. Any revised version should be
submitted within 6 weeks of the revision request or the Journal reserves the right to consider
the manuscript as a new submission that may be subject to further refereeing.
The Editor-in-Chief, Senior Editors and Editors reserve the right to request more rounds of
revision and resubmission/refereeing, or reject a paper outright, if they judge that any
revised version does not adequately address the concerns raised by the referees and the
Editor. Once the Editor is satisfied that a revised version has adequately dealt with any
points raised they may accept the paper.
Authors can appeal against a decision by contacting the handling Senior Editor, but unless

252
there has been a gross misunderstanding of the submitted article by the Editor and referees,
rejection appeals are not likely to be successful. Authors should appreciate that if they
resubmit an article that has been rejected without substantially modifying it in line with the
suggestions of the Editor and referees, it is almost certain to be rejected again.
After acceptance the paper is sent for copy-editing and typesetting prior to production of
proofs for author correction.
The Journal maintains the right to edit any paper to the extent necessary to achieve clarity
and precision of expression and to conform with English usage and the Journal's
conventions. Please note that if authors ignore requests to conform with Journal style at the
revision stage, these changes may be enforced during copy-editing and proof production.
Articles submitted by Editors of the Journal
JAC does not bar Editors (including Senior Editors and the Editor-in-Chief) from submitting
articles to the Journal. Articles submitted by Editors are handled in the same fashion as
other articles subject to the following considerations: these articles are never assigned to the
submitting Editor, or an Editor from the same institution; the submitting Editor is unable to
access details of their article through the online submission system; and, like other authors,
the submitting Editor will not know the identity of the handling Editor (in cases of rejection) or
referees.
Supplement articles
Supplement articles are subject to peer review and may be rejected. Unless specialist
external expertise is required, this peer review is conducted among the team of Editors that
is dealing with the Supplement.
Proofs
An e-mail containing a link to the proof is sent to the corresponding author. The proof should
be read carefully, paying particular attention to any tables, figures and references, and
corrections (and answers to any queries) should be submitted to the JAC Editorial Office as
soon as possible. Authors should pay particular attention that they check any dosage
directions, owing to the seriousness of any error entering the printed record. Extensive
changes at the proof stage are not permitted. Authors may be charged for correction of their
non-typographical errors. The Journal reserves the right not to comply with changes marked
on the Author's proof if these are contrary to the style set down in the Instructions to Authors.
In the event of important developments in a field that affect the paper arising after the final

253
revision, a 'Note added in proof' may be permitted. Please note that Supplementary data
files are largely unedited and are not proofed out.
JAC Advance Access
JAC Advance Access is the Journal's system for the early online publication of articles
ahead of the monthly printed journal issue. Advance Access papers are posted as soon as
possible, in exactly the same format as they appear in the issue (i.e. once author and proof-
reader corrections have been incorporated) – in order to protect the integrity and accuracy of
the scientific record we believe that it is very important that articles are only published once
they have been copy-edited, typeset and proof-checked. JAC Advance Access significantly
reduces time from acceptance to publication for JAC articles (to approximately 4-6 weeks). If
you are a subscriber to the Journal you can view the Advance Access papers by
visiting www.jac.oxfordjournals.org and clicking the Advance Access link.
Offprints
The corresponding author will receive a unique URL that gives access to the electronic
version of their published paper free of charge. If authors wish to purchase print offprints
they can do so via the Oxford Journals Author Services site where they can also complete
the licence agreement. Orders from the UK will be subject to the current UK VAT charge. For
orders from elsewhere in the EU you or your institution should account for VAT by way of a
reverse charge. Please provide us with your or your institution’s VAT number.
Journal policies
Material offered for publication must be original, unpublished and not under simultaneous
consideration by another journal. Any previous publication of the material (including
abstracts in conference proceedings or posters, or in a clinical trials results database) must
be declared in the covering letter, as well as in the Acknowledgements section of the paper.
For these purposes the posting of essentially raw data on a website without significant
analysis, is not considered to represent prior publication. In addition, authors must include in
the covering letter details of ANY previous submission of the work to JAC that has been
rejected. The manuscript number of the earlier submission must be provided, as well as a
point-by-point response to the comments made in the decision e-mail for the previous

254
submission.
Authors should not fragment their research into least publishable units. Authors must be
aware that JAC may decline to publish articles if this approach becomes evident. Authors
are fully responsible for the accuracy of all data in their articles. JAC reserves the right to
use plagiarism detection software on any submitted material. JAC is a member of the
Committee on Publication Ethics (COPE), and strives to adhere to its code of conduct and
guidelines. For further information see http://www.publicationethics.org.uk/. Authors are also
expected to behave ethically and unacceptable practices include: (i) plagiarism; (ii)
fabrication or falsification of data; (iii) omission of legitimate authors, Funding information or
financial conflicts of interest; (iv) inclusion of authors who have not made a significant
contribution to the design and execution of the work described; and (v) redundant/duplicate
publication.
In-press papers or papers under editorial consideration
In-press and submitted papers that are important for the review of a paper MUST be
uploaded when the paper is submitted and referred to in the covering letter that
accompanies the submission. Authors should be aware of the issues of redundant/duplicate
publication. For further information, please see the following Editorial: Reeves DS, Wise R,
Drummond CWE. Duplicate publication: a cautionary tale. J Antimicrob Chemother 2004;53:
411-2.
Sequence data
When reporting sequences they must be submitted to one of the three major databases and
an accession number must be provided before publication.
If a sequence has been submitted but an accession number has not yet been provided or
the sequence is not yet available to the public then authors must submit the annotated
submission PDF file (or .txt or .docx file). If a PDF file is submitted then authors must also
provide the .txt or .docx file so that the Editor and referees can analyse it.

255
Supplementary data
Please note that it is also possible to submit files containing Supplementary data. The
Supplementary data (for example large tables of MICs, or a questionnaire) can be lodged
with the version of the paper published online as an extra resource for readers.
Supplementary data is largely unedited and is not proofed out so authors should ensure that
they provide high quality, accurate files. In addition, authors must ensure that they cite the
Supplementary data within the article. Please contact the Editorial Office if you would like
further details.
Authorship
The authorship of the paper should be confined to those who have made a significant
contribution to the design and execution of the work described. In the case of clinical
trials/randomized control trials it is compulsory for the contribution of each author to be
clearly stated in the Transparency declarations section, after the information on conflicts of
interest. Authors of other types of article may indicate the contribution made by each author
if they wish.
JAC recommends that authors review the ICMJE criteria for authorship before submission
(http://www.icmje.org/#author).
Author signed submission forms
When submitting a paper online authors should simultaneously provide a written statement,
signed by all the authors indicating that they have complied with the stipulations in the
Instructions to Authors (the statement MUST include the title of the paper and the
COMPLETE list of authors). A copy with the original signatures must be scanned and e-
mailed (preferred) or faxed to the Editorial Office as soon as possible after online submission
([email protected]/+44-121-212-9822). A blank form is available at
http://www.oxfordjournals.org/jac/for_authors/signature.pdf. If at any stage during
consideration the authorship of the article changes, the authors must supply a signed
statement from ALL the authors (including any whose names are being removed) explicitly
indicating the nature of the changes and their agreement.

256
Please note that the Journal requires the original signatures of ALL authors. This is the only
way in which the Journal can be certain that all authors agree with the submission. If it is
impossible to obtain the signature of a particular author (owing to death, loss of contact or
other reasons), the corresponding author should explain the circumstances.
Please also note that electronic signatures or copied and pasted signatures are not
acceptable.
Changes in authorship
The author list of any submission should be decided upon and fixed BEFORE submission.
Other than in exceptional circumstances the Journal does not allow addition or removal of
author names after submission. A satisfactory explanation for any proposed changes in
authorship will be required and ALL authors will be required to supply new signed consent
forms that reflect the changes. We will also require a signed consent form from any person
whose name has been removed indicating that they agree to the removal of their name from
the author list. Owing to the complexity of these rules we strongly advise authors to fix the
author list before submission and not to attempt to make changes later.
'Umbrella' groups and authorship
Many large collaborative studies (frequently resistance surveys) are organized under a
group name that represents all of the participants. JAC will not accept a group name as an
'author' of an article. All articles must have at least one named individual as author. Authors
of large collaborative studies should list the author(s) of the article and follow this with 'on
behalf of the GROUP NAME'. The names of all of the participants should then be listed in
the Acknowledgements section.
Professional medical writers and editorial assistance
Professional medical writers and other forms of writing assistance have an important role to
play in the clear communication of scientific results. However, unless this role is openly
explained and acknowledged unfounded suspicions about this role will
continue. JAC encourages the open and precise description of any such assistance received
by authors in relation to any article. It is possible that writers may qualify for authorship of a
manuscript, we recommend that authors review the ICMJE criteria for authorship before

257
submission (http://www.icmje.org/#author).
The precise role of the writer or service in the origin or preparation of the manuscript must be
declared in the Transparency declarations section; we recommend that the name of the
writer (and their agency where applicable) or the service is provided. If this support was
funded, the source must be declared in the Funding section.
Responsibilities of the corresponding author
For each paper submitted to JAC there must be a single corresponding author. As the
representative of the authors, the corresponding author must ensure that all authors are
given access to submitted and revised versions of papers. The corresponding author is
responsible for the collation of the authors' signatures on submission letters and also the
collation and communication of proof corrections to the Journal. The corresponding author
should be the signatory of the publication licence form. As the authors' nominated
representative, the corresponding author will be held primarily accountable for any failure to
comply with the Instructions to Authors or generally accepted standards of good practice.
This does not absolve other authors of responsibility, however.
The corresponding author will act as the primary contact for correspondence regarding the
paper, and as such authors should take care not to appoint a corresponding author likely to
be absent for extended periods (such as a sabbatical) during the consideration of the paper
as this is likely to cause unacceptable delays.
Please note that papers submitted via ScholarOne Manuscripts must be submitted through
the account of the corresponding author listed on the paper, not through the account of one
of the other authors or the account of a third party who is not on the author list. This is to
ensure that there can be no argument regarding the identification of the corresponding
author. In addition, the authors listed during the submission process on the ScholarOne
Manuscripts website must fully match the author list of the actual submitted article.
Research involving humans
Authors must indicate in the Methods whether the research was conducted in accordance
with the Declaration of Helsinki and national and institutional standards. If approval was
obtained from an Ethics Committee the authors should indicate this, as well as any
approval/reference number. Written informed consent must be obtained from study
participants and the existence of this consent must be stated in the article.

258
Patient privacy
Patients have a right to privacy. Any information that might result in identification of
individuals must be omitted, especially if it is not directly clinically relevant. Patient age, sex,
admission dates and co-morbidities should be removed as far as possible. If it is possible
that a patient could be identified, the authors must obtain written informed consent from the
individual(s) concerned and state that this has been obtained in the article. Publication
consent forms should be retained by the authors and not supplied to the Journal. If the
patient is deceased the next of kin should be contacted. If consent cannot be obtained the
authors must explain the circumstances briefly in the article, as well as in detail in the
covering letter. In rare circumstances where relevant clinical details mean that the patient
can be identified, the patient/next of kin must be shown the manuscript before submission
and made aware as part of the informed consent process that the article may appear on the
internet.
Research involving animals
Authors must state their compliance with relevant institutional and national standards for
animal care and experimentation, together with the details of any authorities that licensed
the experiments.
Funding
ALL papers submitted to JAC reporting original research MUST include a ‘Funding’ section.
This section should appear after the 'Acknowledgements' section. Details of all funding
sources for the work in question must be given. Authors must list any internal funding. If no
specific funding has been received then this should be clearly stated; equally if data have
been generated as part of the routine work of an organization, this too should be stated. On-
going financial support for any of the authors should also be included under the Funding
heading. If a professional medical writer or similar service was involved in the origin or
preparation of a manuscript and this support was funded, the source must be declared in the
funding section.
Sources of funding may of course still be thanked in the Acknowledgements section, but
should not be listed again in the Transparency declarations (see below), unless there is an
important reason for doing so. For example if the funder played any decision-making role in
259
the research this must be stated.
The following rules should be followed:
The sentence should begin: ‘This work was supported by …’
The full official funding agency name should be given, i.e. ‘the National Cancer Institute at
the National Institutes of Health’ or simply 'National Institutes of Health' not ‘NCI' (one of
the 27 subinstitutions) or 'NCI at NIH’ (full RIN-approved list of UK funding agencies is
at http://www.rin.ac.uk/files/List-of-major-UK-research-funders.pdf)
Grant numbers should be complete and accurate and provided in brackets as follows:
‘(grant number ABX CDXXXXXX)’
Multiple grant numbers should be separated by a comma as follows: ‘(grant numbers ABX
CDXXXXXX, EFX GHXXXXXX)’
Agencies should be separated by a semi-colon (plus ‘and’ before the last funding agency)
Where individuals need to be specified for certain sources of funding the following text
should be added after the relevant agency or grant number 'to (author initials)'.
An example is given here: ‘This work was supported by the National Institutes of Health (P50
CA098252 and CA118790 to R. B. S. R.) and the Alcohol & Education Research Council
(HFY GR667789).
Conflicts of interest
Conflicts of interest have the potential to affect authors, referees and Editors (including
Senior Editors and the Editor-in-Chief). JAC has the following systems in place to deal with
conflicts of interest:
Authors. Authors are required to include a Transparency declarations section in every
submission to the Journal (for details see below).
Referees. When invited to act, and again when they agree to act, referees are reminded to
consider whether they have any potential conflicts of interest. Referees are asked to discuss
any perceived potential conflict with the Editor of the article who will reach a decision as to
whether it is appropriate that the referee acts on the article or whether they should withdraw.
260
Editors. The Editor-in-Chief, Senior Editors and Editors register their interests (including
personal and business interests) with the BSAC. The BSAC Register of Interests is held at
BSAC Headquarters, is updated periodically and is available for inspection. When an article
is assigned to a Senior Editor or an Editor they are reminded to consider whether there are
any potential conflicts of interest, and if so, to discuss them with the handling Senior Editor
or the Editor-in-Chief, who will come to a decision as to whether it is appropriate for them to
act on the article, or whether it should be reassigned.
Transparency declarations
In the interests of openness, ALL papers submitted to JAC MUST include a ‘Transparency
declarations’ section (which should appear at the end of the paper, before the ‘References’
section). We suggest authors concentrate on transparency declarations (i.e. conflicts of
interest) of a financial nature, although relevant non-financial disclosures can also be made.
Authors should consider making a declaration if they answer 'Yes' to any of the following
questions:
1. Have you in the period of research leading up to this publication accepted any of the
following from an organization (including government departments or granting bodies) that
may in any way be financially affected by the conclusions of your article (e.g. reimbursement
for attending a symposium, a fee for speaking, a consultancy fee, funds for research other
than directly for this work, funds for a member of staff, any other substantial material
benefit)?
2. Do you directly own any stocks or shares in a company that might be financially affected
by the conclusions of your article?
3. Has the funder of the research played any decision-making role in the design, execution,
analysis or reporting of the research?
4. Have you received the assistance of a professional medical writer or similar service? [The
precise role of the writer or service in the origin or preparation of the manuscript must be
declared and we recommend that the name of the writer (and their agency where applicable)
or the service is provided.]
5. Have you accepted any reimbursement for preparing your article?

261
Authors should either include appropriate declarations or state ‘None to declare’.
Importantly, the declarations should be kept as concise as possible, should avoid giving
financial details (e.g. sums received, numbers of shares owned etc.), and should be
restricted to declarations that are specific to the paper in question. Authors will of course
need to consider whether or not the transparency declarations need to be amended when
revisions are submitted.
The burden of responsibility rests with all authors, who must ensure that appropriate
declarations are included. The corresponding author will be responsible for obtaining the
relevant information from all of their co-authors. By signing a submission form each author is
stating that they have made any necessary transparency declaration. All authors should
carefully consider the embarrassment and potential damage to their reputation that could
result should they fail to declare an interest that is revealed subsequently.
If only some authors need to make a declaration it must be made clear that the remaining
authors have nothing to declare, for example:
'A.B. has received funds for speaking at symposia organized on behalf of Panacea Ltd and
has also received funds for research from Panacea. C.D. is a member of the Panacea
advisory board for fantastazole. All other authors: none to declare.’
All papers submitted to JAC must include a transparency declarations section; papers that
do not include such a section will not enter the review process; they will be returned to the
corresponding author so that the appropriate section can be added. Following resubmission
the paper will then be progressed to peer-review.
In the case of clinical trials/randomized control trials it is compulsory for the contribution of
each author to be clearly stated in the Transparency declarations section, after the
information on conflicts of interest. Authors of other types of article may indicate the
contribution made by each author if they wish.
Other useful information
In some instances (often when the authors themselves have no interests to declare) it may
be helpful to readers as background information to give brief details of organizations that do

262
have an interest but do not appear elsewhere in the article, for example ‘Fantastazole is
owned by Wonder Pharmaceuticals’.
Misconduct
We will energetically pursue accusations of misconduct directed at authors, Editors or
referees and have a number of sanctions at our disposal including the option to inform
employers about accusations and ask them to mount their own internal investigations.
Accusations should not be made lightly or in the absence of the likelihood of supporting
evidence being obtainable. The Journal may take the view that accusations are malicious if
supporting evidence cannot be found and may direct sanctions against accusers in such
cases. Any accusation of misconduct should be addressed to the Editor-in-Chief (unless it
involves the Editor-in-Chief, in which case it should be directed to the Chairman of the
Advisory Board). JAC is a member of COPE and will follow its guidelines on the handling of
investigations into research misconduct.
Clinical trials/Randomized controlled trials
Registration and data publication
Authors must register their trials in one of the databases dedicated to registration of trials. In
addition, authors must state the database and provide the unique registration number – both
in the abstract and in the main body of the paper.
JAC will consider for publication clinical trials for which there has been prior publication of
trial data in results databases (such as http://www.clinicalstudyresults.org/about/ or others),
however, authors MUST declare in the covering letter and the Acknowledgements section of
the article that they have previously published data in a results database.
Contributions
The contribution of each author must be clearly stated in the Transparency declarations
section, after the information on conflicts of interest.

263
Reporting standards
All involved in the publication of health intervention research have a duty to patients and
society at large to ensure that this research is reported in a complete, accurate and
transparent fashion. This includes authors, referees, Editors and Journals. JAC takes this
responsibility seriously and endorses the work of organizations such as the EQUATOR
network (http://www.equator-network.org/), an international initiative that seeks to improve
the reliability and value of the medical research literature. There is a wide range of reporting
guidelines, each specific for different types of study. Some of those for study types that are
frequent in JAC are mentioned specifically below. Authors should consult the EQUATOR
network website (http://www.equator-network.org/) for links to the latest versions of
guidelines, which are organized by the study type.
Randomized controlled trials
Authors should comply with the Consolidated Standards of Reporting Trials (CONSORT)
statement (www.consort-statement.org/) and use the resources within it (for example the
checklist and flow diagram) to ensure they have addressed potential criticisms and provided
all necessary information. Authors should include a CONSORT flow diagram in their article,
and provide a copy of the completed checklist.
Systematic reviews and meta-analyses
For systematic reviews and meta-analyses of randomized controlled trials authors should
comply with the PRISMA statement (which replaces the QUORUM statement), which
consists of a checklist and flow diagram (http://www.prisma-statement.org/index.htm).
Authors should include a PRISMA flow diagram in their article, and provide a copy of the
completed checklist.
Outbreaks and intervention studies in nosocomial infection
Authors should comply with the ORION statement (www.idrn.org/orion.php), which is the
CONSORT equivalent for infection control studies. Its purpose is to increase the quality of
research and reporting in the area of nosocomial infection.

264
Economic evaluations
Authors of articles describing economic evaluations of antimicrobial interventions are
encouraged to make use of the following resources, where applicable, in order to ensure that
their work is both optimal and adequately described.
International Society of Pharmacoeconomics and Outcomes Research (ISPOR) Checklist for
retrospective database studies, which can be accessed at:http://www.ispor.org/workpaper/he
althscience/ret_dbTFR0203.asp. Quality of Health Economic Studies (QHES) Instrument.
See Table 1 in:http://www.amcp.org/data/jmcp/Formulary Management-53-61.pdf
Permissions
Authors must obtain permission from the original publisher and, if requested, the original
author (i.e. the corresponding author of the article from which the figure/table has come) for
reproducing/modifying figures/tables. Request the following when seeking to reproduce any
kind of third party material:
(i) non-exclusive rights to reproduce the material in the specified article and journal.
(ii) print and electronic rights, preferably for use in anyform or medium.
(iii) the right to use the material for the life of the work.
(iv) world-wide English-language rights. If rights for all languages can be secured, this is
preferable.
(v) the right to use images with a resolution of 150 dpi in the PDF version of the journal or 72
dpi in the HTML version.
include a statement indicating that permission has been obtained in the relevant
legend/footnote.
provide the Editorial Office with copies of any relevant paperwork.
For further details, as well as a template permissions request letter, please contact
the JAC Editorial Office.
Copyright
Upon receipt of accepted manuscripts at Oxford Journals authors will be invited to complete
an online copyright licence to publish form. Papers funded by the Wellcome Trust or RCUK
will be given the option to select the Creative Commons Attribution licence (CC-BY) in

265
compliance with their open access policies. Please note that by submitting an article for
publication you confirm that you are the corresponding/submitting author and that Oxford
University Press ("OUP") may retain your email address for the purpose of communicating
with you about the article and you agree to notify OUP immediately if your details change. If
your article is accepted for publication OUP will contact you using the email address you
have used in the registration process. Please note that OUP does not retain copies of
rejected articles No article will be published unless the signed licence has been received at
Oxford Journals. Faxing a copy of the form when requested will assist in the rapid
publication of your article.
As the Author(s), copyright of the Article remains yours (or your employer’s if your employer
claims copyright in your work).
JOURNAL STYLE
General
In addition to reading the information provided here, authors should consult a recent issue of
the Journal for the layout and conventions used. The past tense should be used throughout
for description of the results of the paper, the present tense should be used when referring to
previously established and generally accepted results. Where possible, SI units should be
used. Please ensure that characters with a similar appearance are consistent throughout the
document and not from different Unicode sub ranges as with the Greek Delta.
Language editing
Particularly if English is not your first language, before submitting your manuscript you may
wish to have it edited for correct usage of English. This is not a mandatory step, but may
help to ensure that the academic content of your paper is fully understood by journal editors
and reviewers. Language editing does not guarantee that your manuscript will be accepted
for publication. If you would like information about one such service provided by SPi, please
click http://www.oxfordjournals.org/for_authors/language_services.html. There are other
specialist language editing companies that offer similar services and you can also use any of
these. Authors are liable for all costs associated with such services.

266
Spelling
British spelling should be used. Spelling should follow that of the Oxford Dictionary for
Scientific Writers and Editors and where this gives no guidance the Concise Oxford
Dictionary. Spelling of drug names should conform with that given in the latest edition of
the British National Formulary (published by the British Medical Association and the Royal
Pharmaceutical Society of Great Britain and available online athttp://www.bnf.org/bnf), but
please note that JAC will continue to use methicillin (not meticillin).
Abbreviations
Non-standard abbreviations should be defined at the first occurrence and introduced only
where multiple use is made. See here for abbreviations that may be used without definition,
as well as antimicrobial abbreviations (which may be used in Tables and Figures).
Dosage and routes of administration
Dosage frequencies should be given in full in English at each occurrence. Abbreviations are
not permitted. Routes of administration other than intramuscular (im) and intravenous (iv),
which may be abbreviated after definition, should be given in full in English.
MICs
Please note that all MIC data in JAC must be expressed in terms of mg/L (not μg/mL).
Bacterial nomenclature
When genus and species are given together use a capital letter for the genus and a
lowercase letter for the species and italicize both e.g. Staphylococcus aureus. After the initial
use in the text of the full name of an organism the generic name should then be abbreviated
to the initial letter, e.g. E. coli. When the genus is used as a noun or adjective use lowercase
roman unless the genus is specifically referred to e.g. 'staphylococci and streptococci' but
'organisms of the genera Staphylococcus and Streptococcus'. The name of an order has an
initial capital but is not italicized, e.g. Enterobacteriaceae. For genera in the plural, use
lowercase roman, e.g. salmonellae. When the species is used alone use lowercase e.g.
viridans streptococci. For trivial names, use lowercase roman e.g. meningococcus. Authors
should use bacterial names present in the Approved List of Bacterial Names, Amended
Edition (1989), Skermanm, V.B.D., McGowan, V. & Sneath, P.H.A., Eds, ASM Press,

267
Washington, DC, USA (ISBN 1-55581-014-4), with subsequent alterations validly published
by announcement in Validation Lists of the International Journal of Systematic and
Environmental Microbiology (formally the International Journal of Systematic Bacteriology). A
full list of validly published bacterial names is given at http://www.bacterio.cict.fr/allnames.ht
ml
Genetic and amino acid nomenclature
Bacterial genetics. Genotype designations are indicated with italic lowercase three-letter
locus codes (e.g. par,his, ara). If several loci are involved in a related function the individual
loci are designated by the addition of an uppercase italic letter to the locus code
(parC, ompF). Phenotype designations (for example the protein product of a bacterial gene)
are given in roman type with an initial capital letter (OmpF, LacZ). Erythromycin gene
nomenclature should follow that described in: Roberts MC, Sutcliffe J, Courvalin P, Jensen
LB, Rood J & Seppala H. Nomenclature for macrolide and macrolide-lincosamide-
streptogramin B resistance determinants. Antimicrob Agents Chemother 1999; 43: 2823-30.
Yeast genetics. Wild-type alleles are all uppercase and italicized (LEU2), mutant alleles are
all lowercase and italicized (leu2), and gene products are capitalized on the first letter and
are not italicized (Leu2).
General. Authors should ensure that they confine discussion of changes in amino acid
sequence to the context of the protein (e.g. OmpF) and nucleotide changes to the context of
the gene (e.g. ompF). Please also be aware of the difference between a mutant (a strain
with one or more mutations) and a mutation (a change in the sequence of the genetic
material).
Amino acids. The full residue names or three-letter abbreviations are preferred in the text
(e.g. a methionine residue at position 184 should be symbolized Met-184). The single letter
codes may be used in figures. Amino acid changes should be designated Met-184→Val or
M184V.
When comparing nucleotide or amino acid sequences authors should exercise care in the
use of the term homology. Homology should only be used when a common evolutionary
origin is being implied; it is incorrect to give a percentage homology between two sequences.
The wing of a bird and the human arm are homologous structures (they are believed to have
a common evolutionary origin), homology cannot be quantified. For sequence comparison
authors should use the terms identity and similarity. Sometimes 'equivalent' or 'counterpart'
is more appropriate than 'homologue'.

268
Beta-lactamase nomenclature
Authors submitting articles reporting the identification of new beta-lactamases must provide
evidence that they have contacted the relevant clearinghouse (http://www.lahey.org/Studies/
to deposit the new sequence data and receive a unique designation for the new enzyme.
Macrolide-lincosamide-streptogramin resistance determinant nomenclature
Nomenclature for macrolide-lincosamide-streptogramin resistance determinants should
follow the structure suggested by: Roberts MC, Sutcliffe J, Courvalin P et al. Nomenclature
for macrolide and macrolide-lincosamide-streptogramin B antibiotic resistance
determinants. Antimicrob Agents Chemother 1999; 43: 2823-30. A new gene must have
≤79% amino acid identity with all previously characterized MLS genes before receiving a
new unique name. Adding subscripts or superscripts to established genes is not acceptable.
See:http://faculty.washington.edu/marilynr/. Before submitting a sequence to GenBank or
submitting a manuscript for publication, please contact Professor Marilyn Roberts
([email protected]). Once a new name has been assigned you must indicate in
your article that you have received approval by the nomenclature centre for the new gene
name.
Tetracycline resistance determinant nomenclature
Nomenclature for tetracycline resistance determinants should follow that suggested by: Levy
SB, McMurry LM, Barbosa TM et al. Nomenclature for new tetracycline resistance
determinants. Antimicrob Agents Chemother1999; 43: 1523-4. A new gene must have ≤79%
amino acid identity with all previously characterized tet genes before receiving a new unique
name. Adding subscripts or superscripts to established genes is not acceptable.
See: http://faculty.washington.edu/marilynr/. The Levy Group is responsible for coordinating
the naming of new tet genes and before submitting a sequence to GenBank or submitting a
manuscript for publication, please contact Laura McMurry ([email protected]). Once
a new name has been assigned you must indicate in your article that you have received
approval by the nomenclature centre for the new gene name.

269
qnr gene/allele nomenclature
Authors submitting articles reporting the identification of new qnr genes or alleles must
provide evidence that they have contacted the relevant clearinghouse
(http://www.lahey.org/qnrStudies/) to deposit the new sequence data and receive a unique
designation. Authors should consult Jacoby G, Cattoir V, Hooper D et al.qnr gene
nomenclature. Antimicrob Agents Chemother 2008; 52: 2297-9.
FICI data
Fractional inhibitory concentration index (FICI) experiments are performed in order to study
drug interactions and they must be interpreted in the following way:
FICI<=0.5 = synergy
FICI>4.0 = antagonism
FICI>0.5-4 = no interaction
For further information please see the following Editorial:
Odds FC. Synergy, antagonism, and what the chequerboard puts between them. J
Antimicrob Chemother 2003;52: 1.
Microarray data
Authors of articles containing microarray data must ensure that the full datasets are lodged
with an appropriate publicly available online database (the data must not be supplied for
publication as Supplementary data alongside the article). The data should be supplied with
the submitted article if they are not already publicly available. The name of the database and
the accession numbers should be provided in the article. Authors must ensure that their data
are available for public scrutiny from the online publication date of their article at the latest.
Chemistry
General nomenclature. The IUPAC recommendations on chemical nomenclature should be
followed (IUPAC Compendium of Chemical Terminology (1987, ISBN 0 632 01767 8,
Blackwell Scientific Publications, Oxford). All chemical names are run together except those

270
of acids, acetals, esters, ethers, glycosides, ketones and salts, which are printed as separate
words; hyphens are used to separate numbers, Greek letters and some configurational
prefixes, e.g. p-nitrophenol. Italics are used for certain prefixes, e.g. cis-, trans- and N. Small
capitals are used for dextro- and laevo- prefixes, e.g. L-glutamine.
Drugs. Spelling of drug names should conform with that given in the latest edition of the
British National Formulary. Chemical or generic names of drugs should be used; trade
names may be referred to once only upon first use of the generic or chemical name. The
content of proprietary formulations should be given if relevant. Generic names should not be
abbreviated in the text; abbreviations may be used in Tables if there is limited space. If
compounds are referred to by code name or company number either the structure or a
reference to a paper illustrating the structure must be given, any previous code names or
designations should be given on first use.
Supplier locations are required for all smaller/local suppliers.
References
Authors are responsible for the accuracy of all references, which must be checked against
the original material. Reference citations should be restricted to those that are essential for
introducing the purpose and context of the paper, describing methods that are not given in
detail, and for discussing the results and any relevant issues raised by them. Authors are
responsible for ensuring that references are quoted accurately and not taken out of context.
References must not be cited in the synopsis.
Where possible authors should avoid citing conference abstracts or posters (partly because
they are not peer reviewed and also because they often report interim findings and the final
published studies can often come to substantially different conclusions) and authors MUST
NOT cite abstracts that are more than 2 years old without excellent justification for doing so.
In addition, abstracts must only be cited if they appear in published abstract books, journal
supplements or in a permanent online archive.
References should be cited in the text using sequential numbers. Superscript numbers
should be used and should be placed after any punctuation. When referring to several
references, separate individual numerals by a comma or a hyphen for a range greater than
two references. For instance: This was first discovered by Jones,1 and later confirmed by
several other groups of investigators.2,3,5-7

271
Papers accepted for publication, but not yet published, may be included in the reference list;
they should be listed as 'in press', with the name of the journal and the likely year of
publication. Submitted work should be quoted as 'unpublished results'. Personal
communications and unpublished results, which are permitted in the text only, must include
the initials and surnames of all the workers involved; for the former citation, the person’s
affiliation must be stated, e.g. ‘(J. Bloggs, NIH, personal communication)’, and documentary
evidence (an e-mail will suffice) from the person quoted, showing their agreement to be so
quoted, must be provided (the agreement must include the exact wording that appears in the
paper). All references should be listed numerically at the end of the text. Each reference
should be preceded by a number (not superscript) followed by a full stop. Please see the
following examples. Failure to conform to Journal style will result in the manuscript being
returned to authors.
Examples
Journal reference (<= three authors)
Sanschagrin F, Levesque RC. A specific peptide inhibitor of the class B metallo-B-lactamase
L-1 fromStenotrophomonas maltophilia identified using phage display. J Antimicrob
Chemother 2005; 55: 252-5.
Journal reference (> three authors)
Williams I, Gabriel G, Cohen H et al. Zidovudine-the first year of experience. J
Infect 1989; 18 Suppl 1: 23-31.
Whole book
Long HC, Blatt MA, Higgins MC et al. Medical Decision Making. Boston: Butterworth-
Heinemann, 1997.
Book chapter
Manners T, Jones R, Riley M. Relationship of overweight to haitus hernia and reflux
oesophagitis. In: Newman W, ed. The Obesity Conundrum. Amsterdam: Elsevier Science,
1997; 352-74.
NCCLS/CLSI methods
National Committee for Clinical Laboratory Standards. Methods for Dilution Antimicrobial
Susceptibility Tests for Bacteria That Grow Aerobically—Sixth Edition: Approved Standard
M7-A6. NCCLS, Wayne, PA, USA, 2003.
Clinical and Laboratory Standards Institute. Performance Standards for Antimicrobial

272
Susceptibility Testing: Fifteenth Informational Supplement M100-S15. CLSI, Wayne, PA,
USA, 2005.
Meeting abstract
Hou Y, Qiu Y, Vo NH et al. 23-O derivatives of OMT: highly active against H. influenzae.
In: Abstracts of the Forty-third Interscience Conference on Antimicrobial Agents and
Chemotherapy, Chicago, IL, 2003. Abstract F-1187, p. 242. American Society for
Microbiology, Washington, DC, USA.
Online material
References to online material should be given in the reference list. Please note that URLs for
the suppliers of materials must not be given in either the text or the references. The Journal
does not accept any responsibility for the content of web pages cited.
NB – it is no longer necessary to provide the ‘date last accessed’ for URLs.
Panel on Antiretroviral Guidelines for Adults and Adolescents. Guidelines for the Use of
Antiretroviral Agents in HIV-1-Infected Adults and Adolescents. Department of Health and
Human Services. http://aidsinfo.nih.gov/contentfiles/lvguidelines/AdultandAdolescentGL.pdf.
Tables
These should be employed sparingly and should be generally comprehensible without
reference to the text. Each table should be supplied on a separate sheet and numbered
consecutively using Arabic numerals in the order they are referred to in the text. Each must
have a brief descriptive heading. Column headings must clearly explain the content of the
column and indicate any units used. Footnotes should be kept to a minimum. Tables must
be created using the Table function in Word; they must not be inserted as images. Each data
item should occupy a single cell and return characters should not be used within any
Table. JAC reserves the right to move complicated Tables to online-only Supplementary
data.
Figures
These must be employed sparingly to demonstrate important specific points. Figures should
be numbered using Arabic numerals in the order in which they are referred to in the text. In

273
figure LEGENDS, symbols should be described in words (e.g. filled circles, open squares
etc.). Wherever possible, figures should be two-dimensional. Authors should NOT supply
'three-dimensional' figures unless this is actually necessary to represent the data. The
quality of reproduction in JAC is limited by the quality of the submitted material. All figures
must be of high quality - they should be sharply focused, have good contrast and any
lettering must be clear and legible. Colour illustrations can be reproduced if there is sufficient
scientific merit in doing so. Authors will be expected to pay for the cost of colour origination
in the print version of the Journal (£350/US$600/€525.00 per figure). Alternatively, black and
white figures can appear in the printed version of an article with colour versions appearing
online (for which there is no charge) – figure legends will need to be suitably worded, e.g.
This figure appears in colour in the online version of JAC and in black and white in the print
version of JAC. Please state your preferred option (i.e. agreement to pay
£350/US$600/€525.00 per figure for print and online colour or preference for online-only
colour with no charge) in your covering letter.
Guidance for preparation of Figures
Figures should be sized to fit a single column of the Journal where possible (88 mm) or a
double column if necessary (180 mm). The preferred font for lettering is Times; lettering
should have an upper case height of 2 mm and a lower case height of 1 mm at publication
size (corresponding to point size 8). Line thickness should be set at 0.5 points. Shading used
on line drawings should be clear and distinctive; shades of grey and heavy stippling do not
reproduce well. Lines and symbols should be drawn boldly enough to withstand reduction.
The preferred symbols are filled circles, open circles, filled squares, open squares, filled
triangles and open triangles, and should be no smaller than 1 mm (height/diameter) at
publication size. Part labels should be lower case letters within parentheses, e.g. (a), (b), (c)
etc.
Authors must be ready to supply original gel pictures if requested to do so.

274
Annex. B.3 Author Guidelines - Journal of Clinical Pharmacy and Therapeutics
1. General
The Journal of Clinical Pharmacy and Therapeutics (JCPT) provides a forum for clinicians,
pharmacists and pharmacologists to explore and report on issues of common interest. It
welcomes five main types of articles
• Editorials
• Original research
• Review articles (including Mini-reviews)
• Commentaries
• Case reports
As our main interest is on novelty, irrespective of the type of contribution, the sub-headings
should identify what is known and what is new. A clear description of these aspects is
important as they are used by us to filter submissions at the very first stage. This helps us to
return manuscripts quickly to authors for submission elsewhere.
Please read the instructions below carefully for details on the submission of manuscripts, the
Journal's requirements and standards as well as information concerning the procedure after
a manuscript has been accepted for publication in JCPT.
2. Ethical Guidelines
JCPT has adopted the following ethical guidelines for publication and research.
2.1 Authorship and Acknowledgements
Authorship: Authors submitting a paper do so on the understanding that the manuscript has
been read and approved by all authors and that all authors agree to the submission of the
manuscript to the Journal.
JCPT adheres to the definition of authorship set up by The International Committee of
Medical Journal Editors (ICMJE). According to the ICMJE authorship criteria, all named
authors should meet the following conditions: 1) substantial contributions to conception and
design of, or acquisition of data or analysis and interpretation of data, 2) drafting the article
or revising it critically for important intellectual content and 3) final approval of the version to

275
be published. Participation solely in the acquisition of funding or the collection of data does
not justify authorship. All people who fulfil the criteria for authorship should be listed as
authors. Contributors who do not qualify as authors should be mentioned in
Acknowledgements.
The Editors recognise that complex, large-scale and multi-centre research will often result in
a significant number of people fulfilling the authorship criteria. However, they reserve the
right to ask the lead author to justify the inclusion of more than six authors.
Acknowledgements: Under Acknowledgements please specify contributors to the
research/article other than the authors accredited. Please note that research funders are
now listed separately under Source of Funding.
2.2 Conflict of Interest and Source of Funding
JCPT requires that sources of financial support for the work reported within the manuscript
are fully acknowledged, and any potential conflicts of interest noted.
Conflict of Interest: All manuscripts submitted to the Journal require a statement about
authors' conflicts of interest. Please disclose any possible conflict of interest under the
heading 'Conflicts of Interest' on the title page of your manuscript. Any reported conflicts of
interest will be published in a highlighted box as part of the article. If no conflicts of interest
are reported, the box will include the statement "No conflicts of interest have been declared".
Possible conflicts of interest include financial interests relating to issues discussed in the
manuscript (e.g. patent ownership, stock ownership, consultancies and speaker’s fees).
Source of Funding: Authors are required to specify the sources of funding for their research
when submitting a manuscript. These include the individuals and organisations that supplied
resources for interventions as well as those that funded researcher time and other research
costs. All sources of funding should be named and their location (town, state/county,
country) included. The information should be provided on the title page of the manuscript
and will be disclosed in the published article.
2.3 Appeal of Editorial Decisions
The Editors make careful judgements about the selection of manuscripts for publication,
taking into account the extent to which the manuscript is consistent with the aims and scope
of the Journal and their own and referees' assessments of the quality of the work and the
contribution it is likely to make to knowledge, policy and practice. We are able to accept only
a proportion of the manuscripts that are submitted to the Journal, and recognise that authors

276
are often disappointed when we decline to publish their manuscripts. We strongly discourage
routine appeals against such decisions. Authors who believe there were serious flaws in our
editorial judgement may appeal decisions by e-mailing the editorial office with a detailed
explanation of their concerns.
2.4 Permissions
If all or parts of previously published illustrations are used, permission must be obtained from
the copyright holder concerned. It is the author's responsibility to obtain these permissions in
writing and provide copies to the Publishers.
2.5 Copyright Assignment
If your paper is accepted, the author identified as the formal corresponding author for the
paper will receive an email prompting them to login into Author Services; where via the Wiley
Author Licensing Service (WALS) they will be able to complete the license agreement on
behalf of all authors on the paper.
For authors signing the copyright transfer agreement
If the OnlineOpen option is not selected the corresponding author will be presented with the
copyright transfer agreement (CTA) to sign. The terms and conditions of the CTA can be
previewed in the samples associated with the Copyright FAQs below:
CTA Terms and Conditions http://authorservices.wiley.com/bauthor/faqs_copyright.asp.
For authors choosing OnlineOpen
If the OnlineOpen option is selected the corresponding author will have a choice of the
following Creative Commons License Open Access Agreements (OAA):
Creative Commons Attribution Non-Commercial License OAA
Creative Commons Attribution Non-Commercial-NoDerivs License OAA
To preview the terms and conditions of these open access agreements please visit the
Copyright FAQs hosted on Wiley Author Services http://authorservices.wiley.com/bauthor/fa
qs_copyright.aspand visit http://www.wileyopenaccess.com/details/content/12f25db4c87/Co
pyright--License.html.

277
If you select the OnlineOpen option and your research is funded by The Wellcome Trust and
members of the Research Councils UK (RCUK) you will be given the opportunity to publish
your article under a CC-BY license supporting you in complying with Wellcome Trust and
Research Councils UK requirements. For more information on this policy and the Journal’s
compliant self-archiving policy please visit: http://www.wiley.com/go/funderstatement.
For RCUK and Wellcome Trust authors click on the link below to preview the terms and
conditions of this license: Creative Commons Attribution License OAA. To preview the terms
and conditions of these open access agreements please visit the Copyright FAQs hosted on
Wiley Author Services http://authorservices.wiley.com/bauthor/faqs_copyright.aspand
visit http://www.wileyopenaccess.com/details/content/12f25db4c87/Copyright--License.html.
3. Submission of Manuscripts
Manuscripts should be submitted electronically via http://mc.manuscriptcentral.com/jcpt.
Authors may track the status of their own manuscripts. Complete instructions for submitting
papers are available online and a user ID and password can be obtained from the first visit.
Further assistance can be obtained from: [email protected]. If you cannot submit
online or have a general query, please contact Professor Alain Li Wan Po (Editor-in-Chief)
Papers do not attract page charges. OnlineOpen is available to authors of primary
research articles who wish to make their article available to non-subscribers on publication,
or whose funding agency requires grantees to archive the final version of their article. With
OnlineOpen, the author, the author's funding agency, or the author's institution pays a fee
(currently $3000) to ensure that the article is made available to non-subscribers upon
publication via Wiley Online Library, as well as deposited in the funding agency's preferred
archive. For the full list of terms and conditions, see http://olabout.wiley.com/WileyCDA/Secti
on/id-406241.html.
Prior to acceptance you should not inform the Editorial Office that you intend to publish your
paper OnlineOpen. All OnlineOpen articles are treated in the same way as any other article.
They go through the Journal's standard peer-review process and will be accepted or rejected
based on their own merit.
278
4. Manuscripts Types Accepted
Original research: Reports in this section should have a structured summary and a main
text, both of which must have the following sub-headings: What is known and Objective;
Methods; Results and discussion; What is new and Conclusion.
The maximum word-length for reports of original research is 3000 words excluding tables,
figures, references and summary. We encourage submission of additional supporting
material for online-only publication but this should be clearly identified and labeled as ‘Online
appendix A1’ etc. within the text.
Review articles: These contributions should have a structured summary and a main text
both of which must have the following sub-headings: What is known and Objective; Methods;
Results and discussion; What is new and Conclusion. If your review is not a systematic
review, then it should be submitted as a commentary. A mini-review can be submitted either
as a commentary or as a systematic review depending on the methodology used. The
maximum word-length for a Review is 5000 words excluding tables, figures, references and
summary. A mini-review is by definition shorter than this but we impose no specific word-
length. We encourage submission of additional supporting material for online-only
publication but this should be clearly identified and labeled as ‘Online appendix A1’ etc.
within the text.
Commentaries: A commentary should have:
(i) a structured summary of no more than 150 words with the following subheadings: What is
known and Objective; Comment; What is new and Conclusion.
(ii) a main text with the same sub-headings as the summary but with a maximum of 2000
words excluding references.
In both the summary and the main text, the Comment section should make up the bulk of the
contribution (> 90%).
Editorials: Generally these are contributed by our own Editors to describe specific
developments at the Journal but may also include invited contributions from leading experts
on highly topical subjects for which the novelty is obvious. These expert contributions may
vary considerably in length and style so as to ensure particularly rapid publication.
Case reports: A case report should have:
(i) a summary of not more than 100 words
(ii) a main text of not more than 1500 words excluding references.
Both sections should have the following sub-headings: What is known and objective; Case

279
description; What is new and Conclusion. In both sections the case-description should make
up the bulk (> 90%) of the contribution. We encourage submission of additional supporting
material for online-only publication but this should be clearly identified and labelled as
‘Online appendix A1’ etc. within the text.
Letters: Correspondence is invited. Letters will only be considered if they contain
constructive comments on published articles and if they are received in time to allow the
authors a right of reply. Publication of correspondence is at the discretion of the Editor.
5. Manuscript Format and Structure
5.1 Format
Language: The language of publication is English. Authors for whom English is a second
language should have their manuscript professionally edited by an English speaking person
before submission to make sure the English is of high quality. A list of independent suppliers
of editing services can be found at http://authorservices.wiley.com/bauthor/english_language
.asp. All services are paid for and arranged by the author, and use of one of these services
does not guarantee acceptance or preference for publication.
Units and Spellings: Système International (SI) units should be used, as given in Units,
Symbols and Abbreviations (4th edition, 1988), published by the Royal Society of Medicine
Services Ltd, 1 Wimpole Street, London W1M 8AE, UK. Other abbreviations should be used
sparingly and only if a lengthy name or expression is repeated throughout the text. Spelling
should conform to that used in The Concise Oxford Dictionary, published by Oxford
University Press. Authors should strenuously avoid the use of jargon or obscure technical
terms. The typescript should be on A4 paper on one side only, double spaced with a wide
margin on each side. The title and short title (to be printed at the head of alternate pages),
authors' names, qualifications and the department(s) where the work was carried out, and
the name and full postal address of the author to whom all correspondence should be sent,
should be typed on a separate sheet. Please include a telephone, a fax number and an e-
mail address.
5.2 References
The Journal follows the Vancouver style.
References should be numbered sequentially as they occur in the text and identified in the
main text by numbers in superscript after the punctuation. The reference list should be

280
prepared on a separate sheet from the main text, and references should be listed
numerically. The following are examples of the style.
1. Finkelstein E, Quintillani R, Lee R, Bracci A, Nightingale CH. Pharmacokinetics of oral
cephalosporins: cephradine and cephalexin. Journal of Pharmaceutical Sciences,1978; 67,
1447-1450.
2. Aikawa R, Nakamo M, Arita TC. Fluorimetric determination of cephalexin in
urine. Chemical and Pharmaceutical Bulletin, 1976; 24, 235-2355.
The Editor and Publisher recommend that citation of online published papers and other
material should be done via a DOI (digital object identifier), which all reputable online
published material should have — see www.doi.org for more information. If an author cites
anything which does not have a DOI they run the risk of the cited material not being
traceable.
We recommended the use of a tool such as Reference Manager for reference management
and formatting. Reference Manager reference styles can be searched for
here:http://www.refman.com/support/rmstyles.asp.
5.3 Figures and Tables
Figures: All graphs, drawings and photographs are considered figures and should be
numbered in Arabic numerals e.g. Fig. 1, Fig. 2, etc. in order of appearance. Each figure
should have a legend and all legends should be typed together on a separate sheet and
numbered correspondingly. If all or parts of previously published illustrations are used,
permission must be obtained from the copyright holder concerned. It is the author's
responsibility to obtain these in writing and provide copies to the Publisher.
In the full-text online edition of the Journal figure legends may be truncated in abbreviated
links to the full screen version. Therefore the first 100 characters of any legend should inform
the reader of key aspects of the figure.
Tables: Clear tables presenting relevant data are welcome. If tables of important data are
particularly lengthy (e.g. tables reporting details of a large number of studies included in a
systematic review), the Editors may suggest that some are published as supporting online
material. Each table must be typewritten on a separate sheet and should be numbered
consecutively with Arabic numerals, e.g. Table 1, and given a short caption. No vertical rules

281
should be used. Units should appear in parentheses in the column headings and not in the
body of the table. All abbreviations should be defined in a footnote.
Electronic Artwork: We would like to receive your artwork in electronic form. Please save
vector graphics (e.g. line artwork) in Encapsulated Postscript format (EPS), and bitmap files
(e.g. half-tones) in Tagged Image File Format (TIFF). Ideally, vector graphics that have been
saved in metafile (.WMF) or pict (.PCT) format should be embedded within the body of the
text file.
Further information can be obtained at Wiley Blackwell's guidelines for figures:http://authorse
rvices.wiley.com/bauthor/illustration.asp.
5.4 Colour Artwork
It is the policy of the JCPT for authors to pay the full cost for the reproduction of their colour
artwork. Therefore, please note that if there is colour artwork in your manuscript when it is
accepted for publication, Wiley Blackwell require you to complete and return a Colour Work
Agreement form before your paper can be published.
Any article received by Wiley Blackwell with colour work will not be published until the form
has been returned. If you are unable to access the Internet, or are unable to download the
form, please contact the Production Editor for a form. In compliance with the Payment Card
Industry Data Security Standard, the Colour Work Agreement Form should be sent by post
or courier to the address below, should you require colour:
Customer Services (OPI)
John Wiley & Sons Ltd
European Distribution Centre
New Era Estate
Oldlands Way
Bognor Regis
West Sussex PO22 9NQ8
5.5 Supporting Information
Supporting Information can be a useful way for an author to include important but ancillary
information with the online version of an article. Examples of Supporting Information include
additional tables, data sets, figures, movie files, audio clips, 3D structures, and other related
nonessential multimedia files. Supporting Information should be cited within the article text,
and a descriptive legend should be included. It is published as supplied by the author, and a

282
proof is not made available prior to publication; for these reasons, authors should provide
any Supporting Information in the desired final format.
For further information on recommended file types and requirements for submission, please
visit:http://authorservices.wiley.com/bauthor/suppinfo.asp.
6. After Acceptance
Upon acceptance of a paper for publication, the manuscript will be forwarded to the
Production Editor who is responsible for the production of the Journal.
Online Production Tracking: Online production tracking is available for your article through
Wiley Blackwell's Author Services. Author Services enables authors to track their article —
once it has been accepted — through the production process to publication online and in
print. Authors can check the status of their articles online and choose to receive automated
e-mails at key stages of production. Authors will receive an e-mail with a unique link that
enables them to register and have their article automatically added to the system. Please
ensure that a complete e-mail address is provided when submitting the manuscript.
Visit http://authorservices.wiley.com/ for more details on online production tracking and for a
wealth of resources including FAQs and tips on article preparation, submission and more.
Proof Corrections: The corresponding author will receive an e-mail alert containing a link to
a website. A working e-mail address must therefore be provided for the corresponding
author. The proof can be downloaded as a PDF (portable document format) file from this
site.
Acrobat Reader will be required in order to read this file. This software can be downloaded
(free of charge) from the following website: www.adobe.com/products/acrobat/readstep2.htm
l. This will enable the file to be opened, read on screen, and printed out in order for any
corrections to be added. Further instructions will be sent with the proof. Hard copy proofs will
be posted if no e-mail address is available; in your absence, arrange for a colleague to
access your e-mail to retrieve the proofs.
Early View Publication: JCPT is covered by Wiley Blackwell’s Early View service. Early
View articles are complete full-text articles published online in advance of their publication in
a printed issue. Early View articles are complete and final. They have been fully reviewed,
revised and edited for publication, and the authors' final corrections have been incorporated.
Because they are in final form, no changes can be made after online publication. The nature
of Early View articles means that they do not yet have volume, issue or page numbers, so
these articles cannot be cited in the traditional way. They are given a Digital Object Identifier
(DOI), which allows the article to be cited and tracked before it is allocated to an issue. After
283
print publication, the DOI remains valid and can continue to be used to cite and access the
article.
Search Engine Optimization for Your Paper: By optimizing your article for search engines,
you will increase the chance of someone finding it. This in turn will make it more likely to be
viewed and/or cited in another work. Consult our SEO Tips for Authors page in order to
maximize online discoverability for your published research. Included are tips for making
your title and abstract SEO-friendly, choosing appropriate keywords, and promoting your
research through social media.
Offprints: Free access to the final PDF offprint of your article will be available via Author
Services only. Please therefore sign up for Author Services if you would like to access your
article PDF offprint and enjoy the many other benefits the service offers. Additional paper
offprints may be ordered online. Please click on this link, fill in the necessary details and
ensure that you type information in all of the required fields.
If you have queries about offprints, please email [email protected].
Note to NIH Grantees: Pursuant to NIH mandate, Wiley Blackwell will post the accepted
version of contributions authored by NIH grant-holders to PubMed Central upon acceptance.
This accepted version will be made publicly available 12 months after publication. For further
information, see www.wiley.com/nihmandate.
Author Material Archive Policy: Please note that unless specifically requested, Wiley
Blackwell will dispose of all hardcopy or electronic material submitted two months after
publication. If you require the return of any material submitted, please inform the Editorial
Office or Production Editor as soon as possible if you have not yet done so.
Clinical Case Reports: We work together with Wiley’s Open Access Journal, Clinical Case
Reports, to enable rapid publication of good quality case reports that we are unable to
accept for publication in our Journal. Authors of case reports rejected by our Journal will be
offered the option of having their case report, along with any related peer reviews,
automatically transferred for consideration by the Clinical Case Reports Editorial Team.
Authors will not need to reformat or rewrite their manuscript at this stage, and publication
decisions will be made a short time after the transfer takes place. Clinical Case Reports will
consider case reports from every clinical discipline including Medicine, Nursing, Dentistry,
and Veterinary Science and may include clinical images or clinical videos. Clinical Case
Reports is a Wiley Open Access journal and article publication fees apply. For more
information please go to www.clinicalcasesjournal.com.

284
Table B.1 Cohen’s d-value for the difference in the average number of antibiotic prescriptions per patient per year
Average number of prescription per patient claiming antibiotics during study period
2005
(2.22 ± 1.89)
2006
(2.30 ± 1.97)
2007
(2.33 ± 1.95)
2008
(2.28 ± 1.91)
2009
(2.18 ± 1.75)
2010
(2.13 ± 1.74)
2011
(2.02 ± 1.63)
2005 (2.22 ± 1.89) 0.00
2006 (2.30 ± 1.97) 0.04 0.00
2007 (2.33 ± 1.95) 0.06 0.02 0.00
2008 (2.28 ± 1.91) 0.03 0.01 0.03 0.00
2009 (2.18 ± 1.75) 0.02 0.06 0.08 0.05 0.00
2010 (2.13 ± 1.74) 0.05 0.09 0.1 0.08 0.03 0.00
2011 (2.02 ± 1.63) 0.11 0.14 0.16 0.14 0.09 0.06 0.00
2012 (1.98 ± 1.62) 0.13 0.16 0.18 0.16 0.11 0.09 0.03

285
Table B.2 Cohen’s d-value for the difference in the average number of antibiotic prescriptions per patient per year stratified by
gender
Average number of prescription per patient claiming antibiotics by gender
2005
(2.26 ± 1.90)
2006
(2.35 ± 2.00)
2007
(2.38 ± 1.97)
2008
(2.32 ± 1.92)
2009
(2.22 ± 1.76)
2010
(2.16 ± 1.73)
2011
(2.03 ± 1.61)
Female
2005 (2.26 ± 1.90) 0.00
2006 (2.35 ± 2.00) 0.05 0.00
2007 (2.38 ± 1.97) 0.06 0.02 0.00
2008 (2.32 ± 1.92) 0.03 0.02 0.03 0.00
2009 (2.22 ± 1.76) 0.02 0.07 0.08 0.05 0.00
2010 (2.16 ± 1.73) 0.05 0.10 0.11 0.08 0.03 0.00
2011 (2.03 ± 1.61) 0.12 0.16 0.18 0.15 0.11 0.08 0.00
2012 (1.98 ± 1.58) 0.15 0.19 0.20 0.18 0.14 0.10 0.03
2005
(2.17 ± 1.86)
2006
(2.24 ± 1.92)
2007
(2.27 ± 1.92)
2008
(2.22 ± 1.90)
2009
(2.14 ± 1.75)
2010
(2.10 ± 1.74)
2011
(2.01 ± 1.66)
Male
2005 (2.17 ± 1.86) 0.00
2006 (2.24 ± 1.92) 0.04 0.00
2007 (2.27 ± 1.92) 0.05 0.02 0.00
2008 (2.22 ± 1.90) 0.03 0.01 0.03 0.00
2009 (2.14 ± 1.75) 0.02 0.05 0.07 0.04 0.00
2010 (2.10 ± 1.74) 0.04 0.07 0.09 0.06 0.02 0.00
2011 (2.01 ± 1.66) 0.09 0.12 0.14 0.11 0.07 0.05 0.00
2012 (1.98 ± 1.66) 0.10 0.14 0.15 0.14 0.09 0.07 0.02

286
Table B.3 Cohen’s d-value for the difference in the average number of antibiotic prescriptions per patient per year stratified by
age groups
Average number of prescription per patient claiming antibiotics by age
2005 2006 2007 2008 2009 2010 2011
Age (years) (2.20 ± 1.76) (2.27 ± 1.82) (2.23 ± 1.81) (2.21 ± 1.76) (2.23 ± 1.72) (2.18 ± 1.69) (2.03 ± 1.53)
≥0, ≤18
2005 (2.20 ± 1.76) 0.00
2006 (2.27 ± 1.82) 0.04 0.00
2007 (2.23 ± 1.81) 0.02 0.02 0.00
2008 (2.21 ± 1.76) 0.01 0.03 0.05 0.00
2009 (2.23 ± 1.72) 0.02 0.02 0.04 0.01 0.00
2010 (2.18 ± 1.69) 0.01 0.05 0.07 0.02 0.03 0.00
2011 (2.03 ± 1.53) 0.10 0.13 0.15 0.10 0.12 0.09 0.00
2012 (2.00 ± 1.50) 0.11 0.15 0.17 0.12 0.13 0.11 0.02
(2.02 ± 1.65) (2.07 ± 1.69) (2.08 ± 1.65) (2.01 ± 1.57) (1.96 ± 1.49) (1.91 ± 1.44) (1.82 ± 1.36)
>18, ≤30
2005 (2.02 ± 1.65) 0.00
2006 (2.07 ± 1.69) 0.03 0.00
2007 (2.08 ± 1.65) 0.03 0.06 0.00
2008 (2.01 ± 1.57) 0.01 0.04 0.04 0.00
2009 (1.96 ± 1.49) 0.04 0.07 0.07 0.03 0.00
2010 (1.91 ± 1.44) 0.07 0.09 0.10 0.06 0.03 0.00
2011 (1.82 ± 1.36) 0.12 0.15 0.16 0.12 0.09 0.06 0.00
2012 (1.80 ± 1.34) 0.13 0.16 0.17 0.13 0.11 0.08 0.01
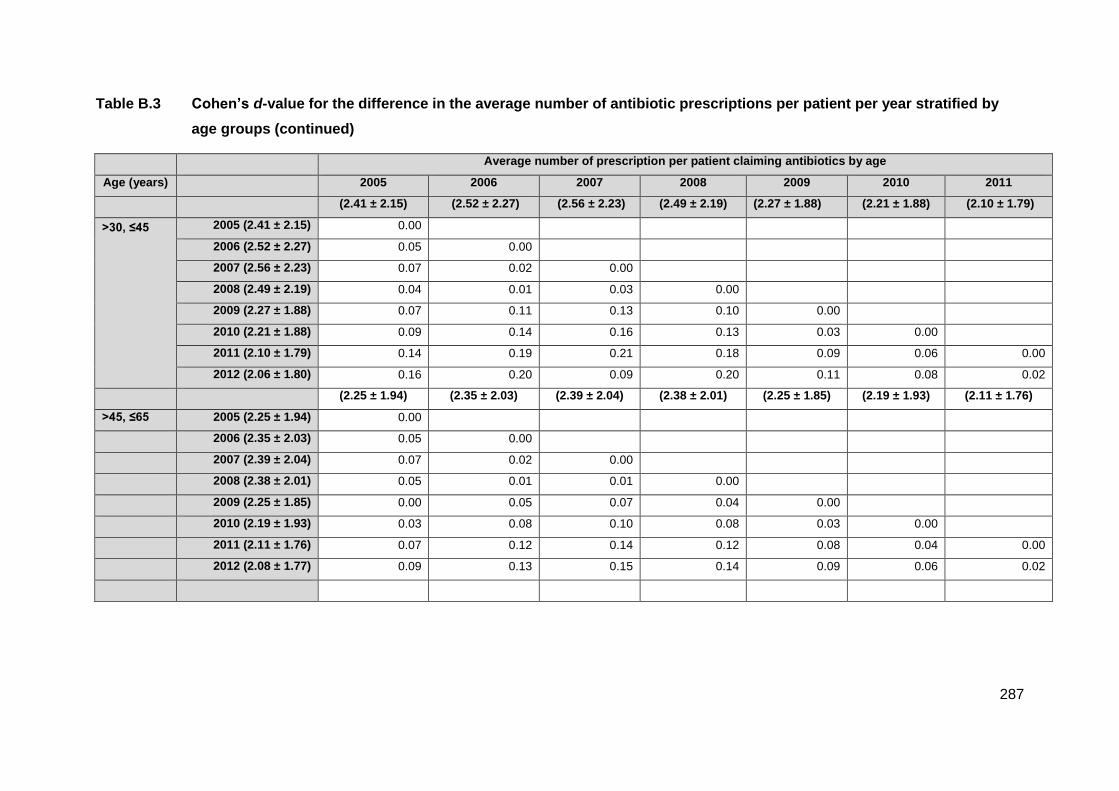
287
Table B.3 Cohen’s d-value for the difference in the average number of antibiotic prescriptions per patient per year stratified by
age groups (continued)
Average number of prescription per patient claiming antibiotics by age
Age (years) 2005 2006 2007 2008 2009 2010 2011
(2.41 ± 2.15) (2.52 ± 2.27) (2.56 ± 2.23) (2.49 ± 2.19) (2.27 ± 1.88) (2.21 ± 1.88) (2.10 ± 1.79)
>30, ≤45
2005 (2.41 ± 2.15) 0.00
2006 (2.52 ± 2.27) 0.05 0.00
2007 (2.56 ± 2.23) 0.07 0.02 0.00
2008 (2.49 ± 2.19) 0.04 0.01 0.03 0.00
2009 (2.27 ± 1.88) 0.07 0.11 0.13 0.10 0.00
2010 (2.21 ± 1.88) 0.09 0.14 0.16 0.13 0.03 0.00
2011 (2.10 ± 1.79) 0.14 0.19 0.21 0.18 0.09 0.06 0.00
2012 (2.06 ± 1.80) 0.16 0.20 0.09 0.20 0.11 0.08 0.02
(2.25 ± 1.94) (2.35 ± 2.03) (2.39 ± 2.04) (2.38 ± 2.01) (2.25 ± 1.85) (2.19 ± 1.93) (2.11 ± 1.76)
>45, ≤65 2005 (2.25 ± 1.94) 0.00
2006 (2.35 ± 2.03) 0.05 0.00
2007 (2.39 ± 2.04) 0.07 0.02 0.00
2008 (2.38 ± 2.01) 0.05 0.01 0.01 0.00
2009 (2.25 ± 1.85) 0.00 0.05 0.07 0.04 0.00
2010 (2.19 ± 1.93) 0.03 0.08 0.10 0.08 0.03 0.00
2011 (2.11 ± 1.76) 0.07 0.12 0.14 0.12 0.08 0.04 0.00
2012 (2.08 ± 1.77) 0.09 0.13 0.15 0.14 0.09 0.06 0.02

288
Table B.3 Cohen’s d-value for the difference in the average number of antibiotic prescriptions per patient per year stratified by
age groups (continued)
Average number of prescription per patient claiming antibiotics by age
Age (years) 2005
(1.97 ± 1.54)
2006
(2.10 ± 1.57)
2007
(2.04 ± 1.60)
2008
(2.04 ± 1.62)
2009
(2.03 ± 1.60)
2010
(2.04 ± 1.63)
2011
(1.92 ± 1.50)
>65
2005 (1.97 ± 1.54) 0.00
2006 (2.10 ± 1.57) 0.03 0.00
2007 (2.04 ± 1.60) 0.04 0.02 0.00
2008 (2.04 ± 1.62) 0.04 0.02 0.00 0.00
2009 (2.03 ± 1.60) 0.04 0.01 0.01 0.01 0.00
2010 (2.04 ± 1.63) 0.04 0.02 0.00 0.00 0.01 0.00
2011 (1.92 ± 1.50) 0.03 0.06 0.08 0.07 0.11 0.07 0.00
2012 (1.81 ± 1.37) 0.10 0.13 0.14 0.14 0.14 0.14 0.07

289
Table B.4 Cohen’s d-value for the difference in the average number of antibiotic prescriptions per patient per year stratified by provinces
Province Average number of prescription per patient claiming antibiotics by province, (Average ± SD)
2005 (2.05 ± 1.74)
2006 (2.18 ± 1.85)
2007 (2.25 ± 1.81)
2008 (2.27 ± 1.86)
2009 (2.18 ± 1.75)
2010 (2.12 ± 1.73)
2011 (2.07 ± 1.73)
Eastern Cape
2005 (2.05 ± 1.74) 0.00
2006 (2.18 ± 1.85) 0.07 0.00
2007 (2.25 ± 1.81) 0.11 0.04 0.00
2008 (2.27 ± 1.86) 0.11 0.05 0.01 0.00
2009 (2.18 ± 1.75) 0.07 0.00 0.04 0.05 0.00
2010 (2.12 ± 1.73) 0.04 0.03 0.07 0.08 0.03 0.00
2011 (2.07 ± 1.73) 0.01 0.06 0.10 0.11 0.06 0.03 0.00
2012 (2.06 ± 1.62) 0.01 0.06 0.10 0.11 0.07 0.03 0.01
2005 (2.05 ± 1.64)
2006 (2.16 ± 1.73)
2007 (2.21 ± 1.73)
2008 (2.17 ± 1.77)
2009 (2.10 ± 1.70)
2010 (2.12 ± 1.73)
2011 (2.02 ± 1.63
Free State
2005 (2.05 ± 1.64) 0.00
2006 (2.16 ± 1.73) 0.06 0.00
2007 (2.21 ± 1.73) 0.09 0.03 0.00
2008 (2.17 ± 1.77) 0.07 0.01 0.02 0.00
2009 (2.10 ± 1.70) 0.03 0.03 0.06 0.04 0.00
2010 (2.12 ± 1.73) 0.04 0.02 0.05 0.03 0.01 0.00
2011 (2.02 ± 1.63) 0.02 0.08 0.11 0.08 0.05 0.06 0.00
2012 (1.96 ± 1.62) 0.06 0.12 0.14 0.12 0.08 0.09 0.04
2005 (2.24 ± 1.89)
2006 (2.35 ± 1.99)
2007 (2.36 ± 1.97)
2008 (2.30 ± 1.89)
2009 (2.20 ± 1.70)
2010 (2.14 ± 1.68)
2011 (2.00 ± 1.63)
Gauteng
2005 (2.24 ± 1.89) 0.00
2006 (2.35 ± 1.99) 0.06 0.00
2007 (2.36 ± 1.97) 0.06 0.01 0.00
2008 (2.30 ± 1.89) 0.03 0.03 0.03 0.00
2009 (2.20 ± 1.70) 0.02 0.08 0.08 0.05 0.00
2010 (2.14 ± 1.68) 0.05 0.11 0.11 0.08 0.03 0.00
2011 (2.00 ± 1.63) 0.13 0.18 0.18 0.19 0.12 0.08 0.00
2012 (1.96 ± 1.52) 0.15 0.20 0.20 0.18 0.14 0.11 0.02

290
Table B.4 Cohen’s d-value for the difference in the average number of antibiotic prescriptions per patient per year stratified by provinces (continued)
Province Average number of prescription per patient claiming antibiotics by province, (Average ± SD)
2005 (2.49 ± 2.26)
2006 (2.55 ± 2.35)
2007 (2.55 ± 2.30)
2008 (2.42 ± 2.12)
2009 (2.28 ± 1.89)
2010 (2.23 ± 1.91)
2011 (2.08 ± 1.73)
Kwazulu-Natal
2005 (2.49 ± 2.26) 0.00
2006 (2.55 ± 2.35) 0.03 0.00
2007 (2.55 ± 2.30) 0.03 0.00 0.00
2008 (2.42 ± 2.12) 0.03 0.06 0.06 0.00
2009 (2.28 ± 1.89) 0.09 0.11 0.11 0.07 0.00
2010 (2.23 ± 1.91) 0.12 0.14 0.14 0.09 0.03 0.00
2011 (2.08 ± 1.73) 0.18 0.20 0.20 0.16 0.11 0.08 0.00
2012 (2.04 ± 1.68) 0.20 0.22 0.22 0.18 0.13 0.10 0.02
2005 (2.30 ± 1.94)
2006 (2.38 ± 2.00)
2007 (2.31 ± 1.92)
2008 (2.25 ± 1.87)
2009 (2.09 ± 1.65)
2010 (2.04 ± 1.65)
2011 (1.94 ± 1.60)
Limpopo
2005 (2.30 ± 1.94) 0.00
2006 (2.38 ± 2.00) 0.04 0.00
2007 (2.31 ± 1.92) 0.01 0.04 0.00
2008 (2.25 ± 1.87) 0.03 0.07 0.03 0.00
2009 (2.09 ± 1.65) 0.11 0.15 0.11 0.09 0.00
2010 (2.04 ± 1.65) 0.13 0.17 0.14 0.11 0.03 0.00
2011 (1.94 ± 1.60) 0.19 0.22 0.19 0.17 0.09 0.06 0.00
2012 (1.94 ± 1.63) 0.19 0.22 0.19 0.17 0.09 0.06 0.00
2005 (2.30 ± 1.91)
2006 (2.27 ± 1.85)
2007 (2.40 ± 1.97)
2008 (2.37 ± 2.05)
2009 (2.28 ± 1.88)
2010 (2.24 ± 1.89)
2011 (2.18 ± 1.85)
Mpumalanga
2005 (2.30 ± 1.91) 0.00
2006 (2.27 ± 1.85) 0.02 0.00
2007 (2.40 ± 1.97) 0.05 0.08 0.00
2008 (2.37 ± 2.05) 0.03 0.03 0.01 0.00
2009 (2.28 ± 1.88) 0.10 0.01 0.06 0.04 0.00
2010 (2.24 ± 1.89) 0.03 0.02 0.08 0.06 0.02 0.00
2011 (2.18 ± 1.85) 0.06 0.05 0.11 0.09 0.05 0.03 0.00
2012 (2.13 ± 1.84) 0.09 0.08 0.14 0.11 0.08 0.06 0.03

291
Table B.4 Cohen’s d-value for the difference in the average number of antibiotic prescriptions per patient per year stratified by provinces (continued)
Province Average number of prescription per patient claiming antibiotics by province, (Average ± SD)
2005
(2.14 ± 1.71) 2006
(2.31 ± 1.82) 2007
(2.29 ± 1.77) 2008
(2.32 ± 2.02) 2009
(2.10 ± 1.64) 2010
(2.04 ± 1.58) 2011
(1.95 ± 1.53)
North-West
2005 (2.14 ± 1.71) 0.00
2006 (2.31 ± 1.82) 0.09 0.00
2007 (2.29 ± 1.77) 0.08 0.01 0.00
2008 (2.32 ± 2.02) 0.09 0.01 0.01 0.00
2009 (2.10 ± 1.64) 0.02 0.12 0.11 0.11 0.00
2010 (2.04 ± 1.58) 0.06 0.15 0.14 0.14 0.04 0.00
2011 (1.95 ± 1.53) 0.11 0.20 0.24 0.18 0.09 0.06 0.00
2012 (1.94 ± 1.60) 0.12 0.20 0.20 0.19 0.10 0.06 0.01
2005
(1.89 ± 1.45) 2006
(1.99 ± 1.55) 2007
(2.08 ± 1.58) 2008
(2.09 ± 1.69) 2009
(2.04 ± 1.62) 2010
(2.01 ± 1.59) 2011
(1.98 ± 1.58)
Northern Cape
2005 (1.89 ± 1.45) 0.00
2006 (1.99 ± 1.55) 0.06 0.00
2007 (2.08 ± 1.58) 0.12 0.06 0.00
2008 (2.09 ± 1.69) 0.12 0.06 0.01 0.00
2009 (2.04 ± 1.62) 0.09 0.03 0.02 0.03 0.00
2010 (2.01 ± 1.59) 0.08 0.01 0.04 0.05 0.02 0.00
2011 (1.98 ± 1.58) 0.06 0.01 0.06 0.07 0.04 0.02 0.00
2012 (1.89 ± 1.55) 0.00 0.06 0.12 0.12 0.09 0.08 0.06
2005
(1.96 ± 1.52) 2006
(1.97 ± 1.54) 2007
(2.02 ± 1.56) 2008
(1.98 ± 1.54) 2009
(2.10 ± 1.84) 2010
(2.07 ± 1.82) 2011
(2.00 ± 1.76)
Western Cape
2005 (1.96 ± 1.52) 0.00
2006 (1.97 ± 1.54) 0.01 0.00
2007 (2.02 ± 1.56) 0.04 0.03 0.00
2008 (1.98 ± 1.54) 0.01 0.01 0.03 0.00
2009 (2.10 ± 1.84) 0.08 0.07 0.04 0.07 0.00
2010 (2.07 ± 1.82) 0.06 0.05 0.03 0.05 0.02 0.00
2011 (2.00 ± 1.76) 0.02 0.01 0.01 0.01 0.05 0.04 0.00
2012 (1.97 ± 1.73) 0.01 0.00 0.03 0.01 0.07 0.05 0.03

292
Table B.5 Cohen’s d-value for the difference in the average number of antibiotic prescriptions per patient per year according to age groups stratified by the study period
Study period Age (years) Average number of prescription per patient claimed by age, Average ± SD
≥0, ≤18 (2.20 ± 1.76) >18, ≤30 (2.02 ± 1.65) >30, ≤45 (2.41 ± 2.15) >45, ≤65 (2.25 ± 1.94)
2005
≥0, ≤18 (2.20 ± 1.76) 0.00
>18, ≤30 (2.02 ± 1.65) 0.10 0.00
>30, ≤45 (2.41 ± 2.15) 0.10 0.18 0.00
>45, ≤65 (2.25 ± 1.94) 0.03 0.12 0.07 0.00
> 65 (1.97 ± 1.54) 0.13 0.03 0.20 0.14
≥0, ≤18 (2.27 ± 1.82) >18, ≤30 (2.07 ± 1.69) >30, ≤45 (2.52 ± 2.27) >45, ≤65 (2.35 ± 2.03)
2006
≥0, ≤18 (2.27 ± 1.82) 0.00 0.00
>18, ≤30 (2.07 ± 1.69) 0.11 0.00
>30, ≤45 (2.52 ± 2.27) 0.11 0.20 0.00
>45, ≤65 (2.35 ± 2.03) 0.04 0.14 0.07 0.00
> 65 (2.10 ± 1.57) 0.09 0.02 0.19 0.12
≥0, ≤18 (2.23 ± 1.81) >18, ≤30 (2.08 ± 1.65) >30, ≤45 (2.56 ± 2.23) >45, ≤65 (2.39 ± 2.04)
2007
≥0, ≤18 (2.23 ± 1.81) 0.00
>18, ≤30 (2.08 ± 1.65) 0.08 0.00
>30, ≤45 (2.56 ± 2.23) 0.15 0.22 0.00
>45, ≤65 (2.39 ± 2.04) 0.08 0.15 0.08 0.00
> 65 (2.04 ± 1.60) 0.10 0.02 0.23 0.17
≥0, ≤18 (2.21 ± 1.76) >18, ≤30 (2.01 ± 1.57) >30, ≤45 (2.49 ± 2.19) >45, ≤65 (2.38 ± 2.01)
2008
≥0, ≤18 (2.21 ± 1.76) 0.00
>18, ≤30 (2.01 ± 1.57) 0.11 0.00
>30, ≤45 (2.49 ± 2.19) 0.13 0.22 0.00
>45, ≤65 (2.38 ± 2.01) 0.08 0.18 0.05 0.00
> 65 (2.04 ± 1.62) 0.17 0.02 0.21 0.17
≥0, ≤18 (2.23 ± 1.72) >18, ≤30 (1.96 ± 1.49) >30, ≤45 (2.27 ± 1.88) >45, ≤65 (2.25 ± 1.85)
2009
≥0, ≤18 (2.23 ± 1.72) 0.00
>18, ≤30 (1.96 ± 1.49) 0.16 0.00
>30, ≤45 (2.27 ± 1.88) 0.02 0.16 0.00
>45, ≤65 (2.25 ± 1.85) 0.01 0.16 0.01 0.00
> 65 (2.03 ± 1.60) 0.12 0.04 0.13 0.12

293
Table B.5 Cohen’s d-value for the difference in the average number of antibiotic prescriptions per patient per year according to age groups stratified by the study period (continued)
Study period Age (years) Average number of prescription per patient claimed by age, Average ± SD
≥0, ≤18 (2.18 ± 1.69) >18, ≤30 (1.91 ± 1.44) >30, ≤45 (2.21 ± 1.88) >45, ≤65 (2.19 ± 1.93)
2010
≥0, ≤18 (2.18 ± 1.69) 0.00
>18, ≤30 (1.91 ± 1.44) 0.16 0.00
>30, ≤45 (2.21 ± 1.88) 0.02 0.16 0.00
>45, ≤65 (2.19 ± 1.93) 0.01 0.15 0.01 0.00
> 65 (2.04 ± 1.63) 0.08 0.08 0.09 0.08
≥0, ≤18 (2.03 ± 1.53) >18, ≤30 (1.82 ± 1.36) >30, ≤45 (2.10 ± 1.79) >45, ≤65 (2.11 ± 1.76)
2011
≥0, ≤18 (2.03 ± 1.53) 0.00
>18, ≤30 (1.82 ± 1.36) 0.14 0.00
>30, ≤45 (2.10 ± 1.79) 0.04 0.16 0.00
>45, ≤65 (2.11 ± 1.76) 0.05 0.16 0.01 0.00
> 65 (1.92 ± 1.50) 0.07 0.07 0.10 0.11
≥0, ≤18 (2.00 ± 1.50) >18, ≤30 (1.80 ± 1.34) >30, ≤45 (2.06 ± 1.80) >45, ≤65 (2.08 ± 1.77)
2012
≥0, ≤18 (2.00 ± 1.50) 0.00
>18, ≤30 (1.80 ± 1.34) 0.13 0.00
>30, ≤45 (2.06 ± 1.80) 0.03 0.14 0.00
>45, ≤65 (2.08 ± 1.77) 0.05 0.16 0.01 0.00
> 65 (1.81 ± 1.37) 0.13 0.01 0.14 0.15

294
Table B.6 Cohen’s d-value for the difference in the average number of antibiotic agents claimed during study period
Average number of medicine items claimed during study period
2005 (1.05 ± 0.19)
2006 (1.05 ± 0.19)
2007 (1.05 ± 0.19)
2008 (1.05 ± 0.20)
2009 (1.05 ± 0.20)
2010 (1.05 ± 0.19)
2011 (1.05 ± 0.20)
2005 (1.05 ± 0.19) 0.00 2006 (1.05 ± 0.19) 0.00 0.00
2007 (1.05 ± 0.19) 0.00 0.00 0.00 2008 (1.05 ± 0.20) 0.00 0.00 0.00 0.00
2009 (1.05 ± 0.20) 0.00 0.00 0.00 0.00 0.00 2010 (1.05 ± 0.19) 0.00 0.00 0.00 0.00 0.00 0.00
2011 (1.05 ± 0.20) 0.00 0.00 0.00 0.00 0.00 0.00 0.00
2012 (1.06 ± 0.21) 0.05 0.05 0.05 0.05 0.05 0.05 0.05
Table B.7 Cohen’s d-value for the difference in the average number of antibiotic agents claimed per year stratified by gender
2005
(1.06 ± 0.20) 2006
(1.05 ± 0.20) 2007
(1.02 ± 0.15) 2008
(1.06 ± 0.21) 2009
(1.06 ± 0.21) 2010
(1.06 ± 0.20) 2011
(1.06 ± 0.21)
Female
2005 (1.06 ± 0.20) 0.00 2006 (1.05 ± 0.20) 0.05 0.00
2007 (1.02 ± 0.15) 0.20 0.15 0.00 2008 (1.06 ± 0.21) 0.00 0.05 0.19 0.00
2009 (1.06 ± 0.21) 0.00 0.05 0.19 0.00 0.00 2010 (1.06 ± 0.20) 0.00 0.05 0.20 0.00 0.00 0.00
2011 (1.06 ± 0.21) 0.00 0.05 0.19 0.00 0.00 0.00 0.00
2012 (1.06 ± 0.22) 0.00 0.05 0.18 0.00 0.00 0.00 0.00
2005
(1.05 ± 0.19) 2006
(1.05 ± 0.19) 2007
(1.05 ± 0.19) 2008
(1.06 ± 0.20) 2009
(1.05 ± 0.20) 2010
(1.05 ± 0.20) 2011
(1.05 ± 0.20)
Male
2005 (1.05 ± 0.19) 0.00 2006 (1.05 ± 0.19) 0.00 0.00
2007 (1.05 ± 0.19) 0.00 0.00 0.00 2008 (1.06 ± 0.20) 0.05 0.05 0.06 0.00
2009 (1.05 ± 0.20) 0.00 0.00 0.00 0.05 0.00 2010 (1.05 ± 0.20) 0.00 0.00 0.00 0.05 0.00 0.00
2011 (1.05 ± 0.20) 0.00 0.00 0.00 0.05 0.00 0.00 0.00
2012 (1.06 ± 0.21) 0.05 0.05 0.05 0.00 0.05 0.05 0.05

295
Table B.8 Cohen’s d-value for the difference in the average number of antibiotic agents claimed per year stratified by age groups
Average number antibiotic agents items claimed age groups
Average number antibiotic agents items claimed age groups
Study
≥0, ≤18 >18, ≤30 >30, ≤45 >45, ≤65 Study Period
≥0, ≤18 >18, ≤30 >30, ≤45 >45, ≤65
period (1.04 ± 0.17 ) (1.06 ± 0.21) (1.07 ± 0.21) (1.06 ± 0.20) (1.04 ± 0.17) (1.05 ± 0.21) (1.07 ± 0.21) (1.05 ± 0.19)
2005
≥0, ≤18 0.00
2006
≥0, ≤18 0.00
(1.04 ± 0.17 ) (1.04 ± 0.17)
>18, ≤30 0.10
>18, ≤30 0.09
(1.06 ± 0.21) (1.05 ± 0.21)
>30, ≤45 0.15 0.06
>30, ≤45 0.16 0.06
(1.07 ± 0.21) (1.07 ± 0.21)
>45, ≤65 0.08 0.02 0.08
>45, ≤65 0.08 0.01 0.07
(1.06 ± 0.20) (1.05 ± 0.19)
> 65 0.08 0.17 0.23 0.15
> 65 0.07 0.16 0.22 0.15
(1.02 ± 0.14) (1.03 ± 0.14)
≥0, ≤18 >18, ≤30 >30, ≤45 >45, ≤65
≥0, ≤18 >18, ≤30 >30, ≤45 >45, ≤65
(1.04 ± 0.17) (1.06 ± 0.21) (1.07 ± 0.21) (1.06 ± 0.19) (1.04 ± 0.18) (1.06 ± 0.22) (1.07 ± 0.22) (1.06 ± 0.20)
2007
≥0, ≤18 0.00
2008
≥0, ≤18 0.00
(1.04 ± 0.17) (1.04 ± 0.18)
>18, ≤30 0.10
>18, ≤30 0.09
(1.06 ± 0.21) (1.06 ± 0.22)
>30, ≤45 0.15 0.05
>30, ≤45 0.14 0.05
(1.07 ± 0.21) (1.07 ± 0.22)
>45, ≤65 0.09 0.00 0.06
>45, ≤65 0.09 0.00 0.05
(1.06 ± 0.19) (1.06 ± 0.20)
> 65 0.07 0.17 0.22 0.16
> 65 0.07 0.16 0.21 0.16
(1.02± 0.14) (1.03 ± 0.15)

296
Table B.8 Cohen’s d-value for the difference in the average number of antibiotic agents claimed per year stratified by age groups (continued)
Average number of antibiotic agents claimed by age
groups Average number of antibiotic agents claimed by age groups
Study ≥0, ≤18 >18, ≤30 >30, ≤45 >45, ≤65 Study period
≥0, ≤18 >18, ≤30 >30, ≤45 >45, ≤65
period (1.04 ± 0.19) (1.06 ± 0.22) (1.07 ± 0.22) (1.06 ± 0.21) (1.04 ± 0.18) (1.06 ± 0.22) (1.07 ± 0.22) (1.06 ± 0.20)
2009
≥0, ≤18 0.00
2010
≥0, ≤18 0.00
(1.04 ± 0.19) (1.04 ± 0.18)
>18, ≤30 0.09 >18, ≤30 0.1 0.00
(1.06 ± 0.22) (1.06 ± 0.22)
>30, ≤45 0.12 0.03 >30, ≤45 0.12 0.02
(1.07 ± 0.22) (1.07 ± 0.22)
>45, ≤65 0.07 0.01 0.04 >45, ≤65 0.09 0.00 0.03
(1.06 ± 0.21) (1.06 ± 0.20)
> 65 0.06 0.15 0.18 0.14 > 65 0.05 0.15 0.17 0.13
(1.03 ± 0.15) (1.03 ± 0.15)
≥0, ≤18 >18, ≤30 >30, ≤45 >45, ≤65
≥0, ≤18 >18, ≤30 >30, ≤45 >45, ≤65
(1.04 ± 0.18) (1.06 ± 0.22) (1.07 ± 0.22) (1.06 ± 0.21) (1.05 ± 0.19) (1.07 ± 0.23) (1.07 ± 0.24) (1.07± 0.22)
2011 ≥0, ≤18 0.00
2012 ≥0, ≤18 0.00
(1.04 ± 0.18) (1.05 ± 0.19)
>18, ≤30 0.1
>18, ≤30 0.10
(1.06 ± 0.22) (1.07 ± 0.23)
>30, ≤45 0.12 0.02
>30, ≤45 0.12 0.03
(1.07 ± 0.22) (1.07 ± 0.24)
>45, ≤65 0.09 0.02 0.04
>45, ≤65 0.10 0.00 0.03
(1.06 ± 0.21) (1.07± 0.22)
> 65 0.05 0.16 0.18 0.14
> 65 0.06 0.15 0.18 0.15
(1.03 ± 0.15) (1.03 ± 0.16)

297
Table B.9 Number of antibiotic prescriptions per patient per year according to seasonal trends
2005
(N = 1 174 679) 2006
(N = 1 220 991) 2007
(N = 1 022 803)
Season 1 Season 2 Season 3 Season 1 Season 2 Season 3 Season 1 Season 2 Season 3
Female 203 679 (30.9) 259 410 (39.4) 196 045 (29.7) 226 399 (33.0) 273 135 (39.8) 187 481 (27.3) 199 279 (34.5) 224 328 (38.8) 153 937 (26.7)
Male 159 323 (31.0) 205 550 (40.0) 149 089 (29.0) 174 511 (32.7) 214 309 (40.2) 144 324 (27.1) 152 137 (34.2) 175 129 (39.4) 117 765 (28.5)
Unidentified 496 (29.7) 653 (29.0) 434 (29.4) 378 (45.4) 290 (34.9) 164 (19.7) 109 (47.8) 119 (52.19) 0 (0.0)
Age
>0, ≤18 109 207 (31.2) 140 089 (40.0) 100 761 (28.8) 118 180 (33.3) 141 983 (40.1) 94 318 (26.6) 100 763 (35.6) 110 103 (38.8) 72 582 (25.6)
>18, ≤30 48 137 (32.0) 58 221 (38.7) 44 189 (29.4) 54 025 (33.3) 64 463 (39.7) 43 897 (27.0) 48 867 (35.6) 54 104 (39.5) 34 164 (24.9)
>30, ≤45 96 882 (31.3) 120 206 (38.8) 92 722 (30.0) 104 894 (33.2) 124 660 (39.4) 86 685 (27.4) 88 679 (34.9) 98 096 (38.6) 67 188 (26.5)
>45, ≤65 82 681 (30.2) 110 131 (40.2) 81 296 (29.7) 95 467 (32.3) 119 074 (40.3) 81 001 (27.4) 86 404 (32.8) 103 690 (39.4) 73 021 (27 8)
> 65 26 591 (7.3) 36 966 (41.0) 26 600 (29.5) 28 722 (31.1) 37 554 (40.7) 26 068 (28.2) 26 812 (31.5) 33 583 (39.4) 24 747 (29.1)
Provinces
Eastern Cape 21 734 (26.7) 35 434 (43.5) 24 231 (29.8) 25 145 (32.5) 31 553 (40.8) 20 584 (26.6) 21 646 (34.2) 24 429 (38.7) 17 095 (27.1)
Free State 14 256 (29.3) 20 433 (41.9) 14 036 (28.8) 16 296 (31.0) 22 297 (42.4) 13 995 (26.6) 14 054 (33.5) 16 985 (40.4) 10 980 (26.1)
Gauteng 145 547 (31.4) 183 872 (39.6) 134 734 (29.0) 163 976 (32.5) 204 321 (40.5) 136 509 (27.0) 141 967 (33.7) 168 770 (40.0) 111 202 (26.4)
Kwazulu-Natal 60 003 (32.4) 71 839 (38.8) 53 465 (28.9) 62 038 (33.6) 72 577 (39.3) 50 254 (27.2) 57 998 (36.0) 59 489 (36.9) 43 603 (27.1)
Limpopo 31 767 (33.6) 35 232 (37.2) 27 657 (29.2) 34 317 (34.7) 37 966 (38.4) 26 728 (27.0) 28 700 (36.8) 28 852 (37.0) 20 516 (26.3)
Mpumalanga 24 003 (32.9) 28 117 (38.5) 20 838 (28.6) 27 042 (32.2) 33 397 (39.8) 23 500 (28.0) 25 452 (35.3) 27 612 (38.3) 19 031 (26.4)
North-West 22 311 (30.1) 27 444 (37.0) 24 340 (32.9) 29 722 (33.7) 34 906 (39.6) 23 608 (26.8) 25 992 (34.8) 29 342 (39.3) 19 329 (25.9)
Northern Cape
4 895 (26.3) 7 434 (40.0) 6 322 (33.9) 5 941 (51.7) 7 809 (41.7) 4 983 (26.6) 4 984 (32.2) 6 322 (40.8) 4 175 (27.0)
Western Cape 31 336 (29.6) 43 374 (40.9) 31 296 (29.5) 31 962 (30.7) 41 355 (39.7) 30 857 (29.6) 29 373 (32.3) 36 440 (40.1) 25 042 (27.6)
Not indicated 7 646 (26.6) 12 434 (43.3) 8 649 (30.1) 4 849 (65.95) 1 553 (21.1) 951 (12.9) 1 359 (39.7) 1 335 (39.0) 729 (21.3)

298
Table B.9 Number of antibiotic prescriptions per patient per years according to seasonal trends (continued)
2008
(N = 808 310) 2009
(N = 1 060 275) 2010
(N = 940 992)
Season 1 Season 2 Season 3 Season 1 Season 2 Season 3 Season 1 Season 2 Season 3
Female 166 911 (36.6) 173 352 (38.0) 115 907 (25.4) 200 599 (34.1) 231 772 (39.4) 155 796 (26.5) 175 609 (33.8) 202 006 (38.9) 141 492 (27.3)
Male 128 784 (36.6) 135 334 (38.4) 88 022 (25.0) 158 378 (33.6) 188 816 (40.0) 124 914 (26.5) 140 404 (33.3) 165 759 (39.3) 115 722 (27.4)
Age
≥0, ≤18 74 513 (37.8) 75 522 (38.28) 47 272 (24.0) 95 475 (33.9) 115 024 (40.9) 70 772 (25.2) 82 478 (34.2) 93 404 (38.7) 65 210 (27.1)
>18, ≤30 40 300 (38.6) 39 690 (38.0) 24 343 (23.3) 53 792 (34.1) 63 762 (40.4) 40 322 (25.5) 46 929 (33.5) 55 879 (39.9) 37 221 (26.6)
>30, ≤45 71 810 (37.3) 73 274 (38.0) 47 652 (24.70 84 022 (34.5) 94 742 (38.9) 64 550 (26.5) 72 350 (33.7) 83 344 (38.8) 59 036 (27.5)
>45, ≤65 83 005 (35.2) 91 125 (38.6) 61 964 (26.3) 93 137 (33.5) 109 080 (39.2) 75 819 (27.3) 83 080 (33.5) 97 293 (39.2) 67 732 (27.3)
> 65 26 067 (33.5) 29 075 (37.4) 22 698 (29.2) 32 551 (32.6) 37 980 (38.1) 29 247 (29.3) 31 176 (32.1) 37 845 (39.0) 28 015 (28.9)
Province
Eastern Cape 19 432 (36.9) 19 993 (37.9) 13 278 (25.2) 22 534 (33.6) 26 206 (39.1) 18 343 (27.4) 19 900 (33.8) 22 207 (37.7) 16 812 (28.5)
Free State 12 180 (35.2) 13 766 (39.8) 8 627 (25.0) 14 917 (32.1) 18 735 (40.4) 12 757 (27.5) 14 467 (32.5) 17 860 (40.1) 12 233 (27.5)
Gauteng 122 279 (36.1) 130 653 (38.5) 86 271 (25.4) 157 537 (33.6) 188 230 (40.2) 122 631 (26.2) 139 184 (33.4) 167 164 (40.1) 110 889 (26.6)
Kwazulu-Natal
48 662 (37.9) 48 320 (37.6) 31 502 (24.5) 55 399 (35.8) 59 039 (38.2) 40 179 (26.0) 45 628 (35.7) 46 706 (36.6) 35 444 (27.7)
Limpopo 21 630 (38.2) 21 051 (37.2) 13 929 (25.6) 19 297 (36.4) 20 222 (38.1) 13 545 (25.5) 15 007 (34.6) 16 691 (38.4) 11 737 (27.0)
Mpumalanga 20 596 (36.6) 21 289 (37.8) 14 393 (25.6) 25 083 (33.6) 29 455 (39.4) 20 206 (27.0) 23 086 (32.9) 26 973 (38.5) 20 056 (28.6
North-West 20 822 (37.7) 20 914 (37.9) 13 524 (24.5) 23 495 (33.2) 28 460 (40.2) 18 854 (26.6) 21 701 (33.2) 26 052 (40.0) 17 567 (26.9)
Northern Cape
4 154 (35.1) 4 578 (38.7) 3 099 (26.19) 4 704 (31.7) 6 010 (40.5) 4 118 (27.8) 4 743 (30.78) 6 276 (40.7) 4 388 (28.5)
Western Cape 25 041 (35.2) 27 293 (38.3) 18 886 (26.5) 34 187 (32.4) 42 333 (40.2) 28 876 (27.4) 30 366 (32.6) 35 981 (38.6) 26 940 (28.9)
Not indicated 899 (41.9) 829 (38.6) 420 (19.6) 1 824 (37.1) 1 898 (38.6) 1 201 (24.4) 1 931 (39.1) 1 855 (37.6) 1 148 (23.3)
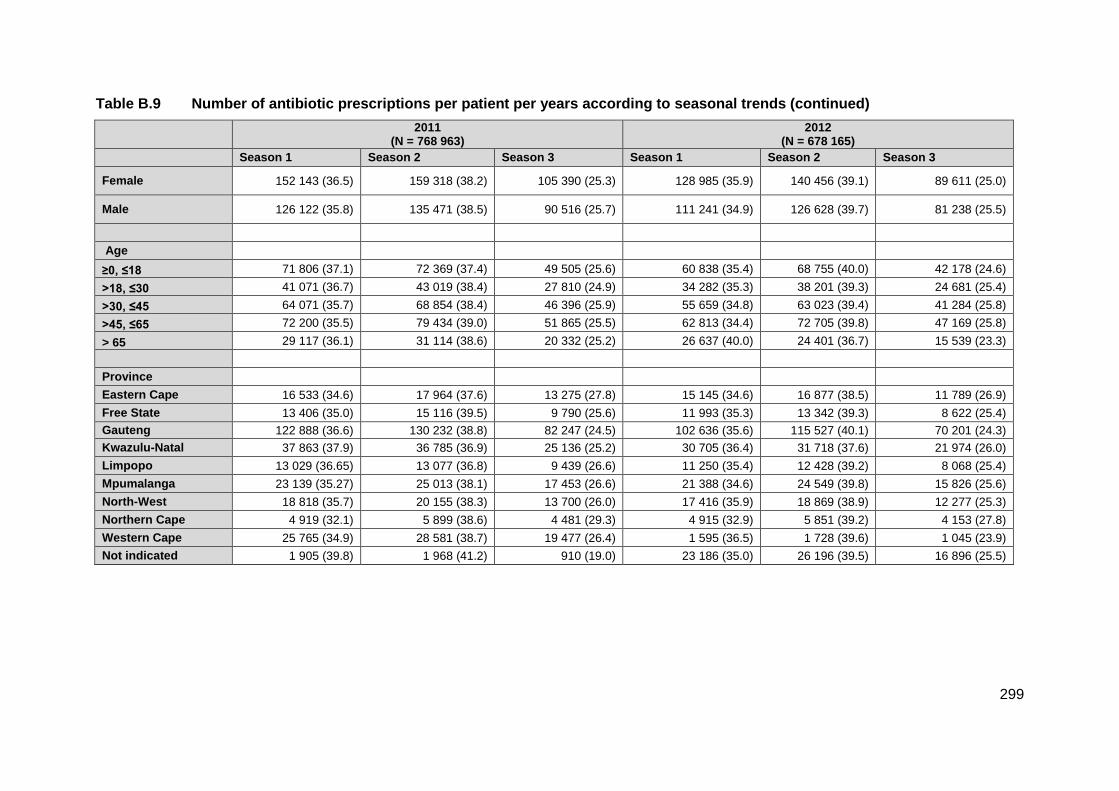
299
Table B.9 Number of antibiotic prescriptions per patient per years according to seasonal trends (continued)
2011
(N = 768 963) 2012
(N = 678 165)
Season 1 Season 2 Season 3 Season 1 Season 2 Season 3
Female 152 143 (36.5) 159 318 (38.2) 105 390 (25.3) 128 985 (35.9) 140 456 (39.1) 89 611 (25.0)
Male 126 122 (35.8) 135 471 (38.5) 90 516 (25.7) 111 241 (34.9) 126 628 (39.7) 81 238 (25.5)
Age
≥0, ≤18 71 806 (37.1) 72 369 (37.4) 49 505 (25.6) 60 838 (35.4) 68 755 (40.0) 42 178 (24.6)
>18, ≤30 41 071 (36.7) 43 019 (38.4) 27 810 (24.9) 34 282 (35.3) 38 201 (39.3) 24 681 (25.4)
>30, ≤45 64 071 (35.7) 68 854 (38.4) 46 396 (25.9) 55 659 (34.8) 63 023 (39.4) 41 284 (25.8)
>45, ≤65 72 200 (35.5) 79 434 (39.0) 51 865 (25.5) 62 813 (34.4) 72 705 (39.8) 47 169 (25.8)
> 65 29 117 (36.1) 31 114 (38.6) 20 332 (25.2) 26 637 (40.0) 24 401 (36.7) 15 539 (23.3)
Province
Eastern Cape 16 533 (34.6) 17 964 (37.6) 13 275 (27.8) 15 145 (34.6) 16 877 (38.5) 11 789 (26.9)
Free State 13 406 (35.0) 15 116 (39.5) 9 790 (25.6) 11 993 (35.3) 13 342 (39.3) 8 622 (25.4)
Gauteng 122 888 (36.6) 130 232 (38.8) 82 247 (24.5) 102 636 (35.6) 115 527 (40.1) 70 201 (24.3)
Kwazulu-Natal 37 863 (37.9) 36 785 (36.9) 25 136 (25.2) 30 705 (36.4) 31 718 (37.6) 21 974 (26.0)
Limpopo 13 029 (36.65) 13 077 (36.8) 9 439 (26.6) 11 250 (35.4) 12 428 (39.2) 8 068 (25.4)
Mpumalanga 23 139 (35.27) 25 013 (38.1) 17 453 (26.6) 21 388 (34.6) 24 549 (39.8) 15 826 (25.6)
North-West 18 818 (35.7) 20 155 (38.3) 13 700 (26.0) 17 416 (35.9) 18 869 (38.9) 12 277 (25.3)
Northern Cape 4 919 (32.1) 5 899 (38.6) 4 481 (29.3) 4 915 (32.9) 5 851 (39.2) 4 153 (27.8)
Western Cape 25 765 (34.9) 28 581 (38.7) 19 477 (26.4) 1 595 (36.5) 1 728 (39.6) 1 045 (23.9)
Not indicated 1 905 (39.8) 1 968 (41.2) 910 (19.0) 23 186 (35.0) 26 196 (39.5) 16 896 (25.5)

300
Table B.10 Antibiotic agents claimed from 2005 to 2012
Number of medicine items claimed, n (%)
Active substance
2005 (N = 1 857 824)
2006 (N = 1 958 577)
2007 (N = 1 6387 41)
2008 (N = 1 289 027)
2009 (N = 1 639 988)
2010 (N = 1 436 642)
2011 (N = 1 151 168)
2012 (N = 1 014 657)
Relative change 2005 vs. 2012 (%)
Aminoglycosides
Gentamicin 6 668 (0.4) 6 933 (0.4) 7 108 (0.4) 5 875 (0.5) 7 696 (0.5) 6 056 (0.4) 4 948 (0.4) 5 378 (0.5) +0.1
Amikacin 511(0.03) 758(0.04) 587 (0.04) 386(0.03) 302 (0.02) 341 (0.02) 194 (0.02) 189 (0.02) -0.01
Kanamycin 337 (0.02) 311 (0.02) 271 (0.02) 191(0.01) 556 (0.03) 383 (0.03) 297 (0.03) 224 (0.02) 0.0
Streptomycin 126 (0.01) 139 (0.01) 172 (0.01) 112 (0.01) 156 (0.01) 130 (0.01) 126 (0.01) 106 (0.01) 0.0
Tobramycin 83 (0.0) 41 (0.0) 115 (0.01) 130 (0.01) 285 (0.02) 328 (0.02) 232 (0.02) 271 (0.03) +0.03
Netilmicin 35 (0.0) 17 (0.0) 12 (0.0) 8 (0.0) 1 (0.0) 1 (0.0) 0 (0.0) 0(0.0) 0.0
Penicillins
Amoxicillin/clavulanic 477 168 (25.7) 52 2050 (25.7) 432 832 (26.4) 353 407 (27.4) 450 654 (27.5) 37 7641 (26.3) 31 0051 (26.9) 273 433 (27.0) +1.3
Amoxicillin 279 120 (15.0) 275 247 (14.1) 205 019 (12.5) 152 840 (11.9) 185 189 (11.3) 1 70315 (11.9) 144 699 (12.6) 129 926 (12.8) -2.2
Amoxicillin/ Flucloxacillin 25 744 (1.4) 27 004 (1.4) 21 656 (1.3) 17 138 (1.3) 15 047 (0.9) 14 984 (1.0) 12 232 (1.1) 11 039 (1.1) -0.3
Ampicillin/cloxacillin 11 285 (0.6) 11 236 (0.6) 9 956 (0.6) 7 430 (0.6) 7 368 (0.5) 5 801 (0.4) 4 336 (0.4) 3 679 (0.5) -0.1
Cloxacillin 7 962 (0.4) 8 110 (0.4) 7 399 (0.5) 6 411 (0.5) 8 756 (0.5) 7 093 (0.5) 5 372 (0.5) 5 551 (0.6) +0.2
Penicillin 6 566 (0.4) 7 255 (0.4) 5 368 (0.3) 4 532 (0.4) 5 032 (0.3) 3 179 (0.2) 2 863 (0.3) 2 576 (0.3) -0.1
Ampicillin 5 320 (0.3) 5 365 (0.3) 3 707 (0.2) 2 360 (0.2) 2 680 (0.2) 1 439 (0.1) 1 354 (0.1) 1 111 (0.1) -0.2
Benzathine penicillin 4 934 (0.3) 5 006 (0.3) 3 985 (0.2) 3 067 (0.2) 3 914 (0.2) 2 915 (0.2) 2 454 (0.2) 2 383 (0.2) -0.1
Flucloxacillin 4 541 (0.2) 4 643 (0.2) 3 131 (0.2) 1 272 (0.1) 2 584 (0.2) 1 505 (0.1) 1 161 (0.1) 1 154 (0.1) -0.1
Benzyl penicillin 1 634 (0.1) 1 575 (0.08) 1 595 (0.1) 1 596 (0.1) 2 504 (0.2) 1 730 (0.1) 132 (0.1) 1 297 (0.1) +0.0
Procaine penicillin 1 711 (0.1) 2 539 (0.1) 2 008 (0.1) 2 221 (0.2) 4 329 (0.3) 3 960 (0.3) 3 031 (0.3) 3 618 (0.4) +0.3
Piperacillin 6 (0.0) 3 (0.0) 1 (0.0) 1 (0.0) 3 (0.0) 0 (0.0) 9 (0.0) 0 (0.0) 0.0
Procaine penicillin 0 (0.0) 0 (0.0) 1 (0.0) 235 (0.02) 1 009 (0.06) 853 (0.1) 626 (0.05) 507 (0.05) +0.05

301
Table B.10 Antibiotic agents claimed from 2005 to 2012 (continued)
Number of medicine items, n (%)
Active substance
2005 (N = 1 857 824)
2006 (N = 1 958 577)
2007 (N = 1 638 741)
2008 (N = 1 289 027)
2009 (N = 1 639 988)
2010 (N = 1 436 642)
2011 (N = 1 151 168)
2012 (N = 1 014 657)
Relative change 2005 vs. 2012 (%)
Cephalosporins
Cefuroxime 85 217 (4.6) 91 266 (4.7) 83 217 (5.1) 60 658 (4.7) 82 182 (5.0) 70 734 (4.9) 51 504 (4.5) 45 058 (4.4) -0.2
Cefpodoxime 75 412 (4.1) 80 871 (4.1) 72 552 (4.4) 48 194 (3.7) 80 021 (4.9) 73 651 (5.1) 57 495 (5.0) 47 443 (4.7) +0.6
Cefaclor 32 399 (1.7) 25 859 (1.3) 11 817 (0.7) 6 171 (0.5) 6 768 (0.4) 5 260 (0.4) 3 936 (0.3) 3 090 (0.3) -1.4
Cefprozil 23 376 (1.3) 22 501 (1.2) 21 564 (1.3) 13 088 (1.0) 18 137 (1.1) 12 627 (0.9) 8 335 (0.7) 6 957 (0.7) -0.6
Cephalexin 18 708 (1.0) 13 801 (0.7) 10 351 (0.6) 6 329 (0.5) 8 280 (0.5) 6 952 (0.5) 5 715 (0.5) 4 875 (0.5) -0.5
Cefotaxime 15 597 (0.8) 14 993 (0.8) 12 645 (0.8) 10 425 (0.8) 11 815 (0.7) 7 841 (0.6) 6 304 (0.6) 6 834 (0.7) -0.1
Ceftriaxone 14 820 (0.8) 16 657 (0.9) 14 985 (0.9) 13 223 (1.0) 17 810 (1.1) 15 944 (1.1) 13 427 (1.2) 15 875 (1.6) +0.8
Loracarbef 7 038 (0.4) 5 719 (0.3) 1 960 (0.1) 1 136 (0.1) 2 578 (0.2) 4 019 (0.3) 1 821 (0.2) 164 (0.02) -0.38
Cefadroxil 5 819 (0.3) 4 991 (0.6) 4 453 (0.3) 3 254 (0.3) 2 570 (0.2) 1 435 (0.1) 780 (0.1) 257 (0.03) 0.0
Cefazolin 3 081 (0.2) 2 435 (0.1) 1 818 (0.1) 1 976 (0.2) 2 816 (0.2) 2 437 (0.2) 2 109 (0.2) 1681 (0.2) 0.0
Cephradine 2 557 (0.1) 3 695 (0.2) 2 354 (0.1) 1 877 (0.2) 2 212 (0.1) 1 080 (0.1) 728 (0.1) 544 (0.05) -0.05
Cefixime 664 (0.04) 49 (0.002) 13 (0.0) 1 (0.0) 3 (0.0) 5 (0.0) 721 (0.1) 2 656 (0.3) +0.26
Cefoxitin 213 (0.01) 330 (0.02) 469 (0.03) 136 (0.01) 27 (0.002) 28 (0.002) 17 (0.001) 30 (0.003) -0.01
Ceftazidime 213 (0.01) 160 (0.01) 200 (0.01) 98 (0.01) 166 (0.01) 124 (0.01) 103 (0.01) 109 (0.01) 0.0
Ceftibuten 124 (0.01) 0 (0.0) 0 (0.0) 0 (0.0) 0 (0.0) 0 (0.0) 0 (0.0) 0 (0.0) -0.01
Cefpirome 109 (0.01) 128 (0.01) 83 (0.01) 75 (0.01) 120 (0.01) 136 (0.01) 113 (0.01) 32 (0.003) -0.01
Cefamandole 80 (0.004) 61 (0.003) 66 (0.0) 6 (0.0) 3 (0.0) 30 (0.002) 0 (0.0) 2 (0.0) 0.0
Cefradine 71 (0.004) 0 (0.0) 0 (0.0) 0 (0.0) 0 (0.0) 0 (0.0) 0 (0.0) 0 (0.0) 0.0
Cephalothin 30 (0.002) 39 (0.002) 41 (0.002) 23(0.002) 3 (0.0) 13 (0.0) 36 (0.003) 4 (0.0) 0.0
Cefepime 8 (0.0) 21 (0.001) 35 (0.002) 24 (0.002) 28 (0.002) 27 (0.002) 13 (0.001) 24 (0.002) 0.0
Cefozolin 2 (0.0) 0 (0.0) 0 (0.0) 15 (0.0) 14 (0.001) 14 (0.001) 26 (0.002) 12 (0.001) 0.0
Cefalexin 0 (0.0) 0(0.0) 0 (0.0) 0 (0.0) 0 (0.0) 31 (0.002) 385 (0.03) 117 (0.01) +0.01
Ceftazidime 0 (0.0) 0 (0.0) 0 (0.0) 0 (0.o) 2 (0.0) 0 (0.0) 0 (0.0) 0 (0.0) 0.0

302
Table B.10 Antibiotic agents claimed from 2005 to 2012 (continued)
Number of medicine items claimed, n (%)
Active substance
2005 (N = 1 857 824)
2006 (N = 1 958 577)
2007 (N = 1 638 741)
2008 (N = 1 289 027)
2009 (N = 1 639 988)
2010 (N = 1 436 642)
2011 (N = 1 151 168)
2012 (N = 1 014 657)
Relative change 2005 vs. 2012 (%)
Fluoroquinolones
Ciprofloxacin 157 264 (8.5) 170 663 (8.7) 150 828 (9.2) 120 524 (9.4) 148 966 (9.1) 137 261 (10.0) 105 945 (9.2) 93 574 (9.2) +0.7
Levofloxacin 41 354 (2.2) 51 095 (2.6) 51 401 (3.1) 47 637 (3.7) 66 860 (4.1) 57 956 (4.0) 41 684 (3.6) 33 552 (3.3) +1.1
Moxifloxacin 42 819 (2.3) 51 651 (2.6) 52 156 (3.2) 39 084 (3.0) 47 648 (2.9) 41 945 (2.9) 33 660 (2.9) 27 864 (2.8) +0.5
Norfloxacin 22 989 (1.2) 19 875 (1.0) 15 525 (1.0) 11 661 (0.9) 12 469 (0.8) 10 500 (0.7) 8 689 (0.8) 6 685 (0.7) -0.5
Ofloxacin 15 857 (0.9) 16 336 (0.8) 11 929 (0.7) 7 904 (0.6) 5 954 (0.4) 3 997 (0.3) 1 898 (0.2) 1 932 (0.2) -0.7
Gatifloxacin 13 236 (0.7) 6 107 (0.3) 164 (0.01) 62 (0.01) 0 (0.0) 1 (0.0) 2 (0.0) 0 (0.0) -0.7
Gemifloxacin 9 009 (0.5) 9 764 (0.5) 8 965 (0.6) 5 747 (0.5) 5 982 (0.4) 4 274 (0.3) 1 863 (0.2) 1 010 (0.1) -0.4
Lomefloxacin 743 (0.04) 841 (0.04) 364 (0.02) 230 (0.02) 281 (0.02) 48 (0.003) 1 (0.0) 0 (0.0) -0.04
Enoxacin 47 (0.003) 52 (0.003) 29 (0.002) 0 (0.0) 1 (0.0) 0 (0.0) 0 (0.0) 0 (0.0) 0.0
Macrolides
Clarithromycin 94 400 (5.1) 109 462 (5.6) 99 528 (6.1) 73 439 (5.7) 101 434 (6.2) 92 010 (6.4) 72 848 (6.3) 61 809 (6.1) +1.0
Erythromycin 62 426 (3.4) 58 899 (3.0) 47 871 (2.9) 35 795 (2.8) 39 299 (2.4) 33 649 (2.3) 28 589 (2.5) 25 082 (2.5) -0.9
Azithromycin 46 880 (2.5) 57 549 (2.9) 57 991 (3.5) 51 613 (4.0) 81 604 (5.0) 72 560 (5.1) 59 553 (5.2) 52 018 (5.1) +2.6
Telithromycin 17 497 (0.9) 21 775 (1.1) 15 828 (1.0) 13 618 (1.1) 18 421 (1.1) 16 496 (1.2) 12 127 (1.1) 10 539 (1.0) +0.1
Roxithromycin 16 093 (0.9) 17 237 (0.9) 12 790 (0.8) 8 842 (0.7) 7 095 (0.4) 5 446 (0.4) 3 311 (0.3) 2 546 (0.3) -0.6
Tetracyclines
Doxycycline 65 309 (3.5) 62 270 (3.2) 49 058 (3.0) 39 159 (3.0) 44 453 (2.7) 39 781 (2.8) 32 109 (2.8) 28 378(2.8) -0.7
Oxytetracycline 9 507 (0.5) 8 996 (0.5) 6 517 (0.4) 5 201 (0.4) 5 514 (0.3) 3 611 (0.3) 2 638 (0.2) 2 179 (0.2) -0.3
Minocycline 9 135 (0.5) 7 309 (0.4) 5 072 (0.3) 3 241 (0.3) 3 434 (0.2) 2 377 (0.2) 1 359 (0.1) 1 190 (0.1) -0.4
Lymecycline 1 247 (0.7) 13 978 (0.7) 13 587 (0.8) 11 030 (0.9) 13 714 (0.8) 12 248 (0.9) 9 207 (0.8) 8 498 (0.8) +0.1
Tetracycline 743 (0.04) 802 (0.04) 550 (0.03) 647 (0.05) 579 (0.04) 222 (0.02) 83 (0.01) 41 (0.004) -0.04

303
Table B.10 Antibiotic agents claimed from 2005 to 2012 (continued)
Number of medicine items claimed, n (%)
Active substance
2005 (N = 1 857 824)
2006 (N = 1 958 577)
2007 (N = 1 638 741)
2008 (N = 1 289 027)
2009 (N = 1 639 988)
2010 (N = 1 436 642)
2011 (N = 1 151 168)
2012 (N = 1 014 657)
Relative change 2005 vs. 2012 (%)
Co-trimoxazole 0 (0.0) 0 (0.0) 0 (0.0) 0 (0.0) 23 (0.001) 0 (0.0) 0 (0.0) 0 (0.0) 0.0
Chloramphenicol 1 652 (0.09) 1 177 (0.06) 982 (0.06) 773 (0.06) 824 (0.05) 1 009 (0.07) 849 (0.07) 554 (0.05) -0.04
Aztreonam 1 (0.0) 0 (0.0) 0 (0.0) 0 (0.0) 1 (0.0) 0 (0.0) 3 (0.0) 0 (0.0) 0.0
Ertapenem 4 (0.0) 15 (0.001) 18 (0.001) 20 (0.001) 50 (0.003) 52 (0.004) 58 (0.005) 48 (0.005) 0.0
Imipenem/cilastatin 7 (0) 3 (0.0) 2 (0.0) 2 (0.0) 11 (0.001) 13 (0.001) 7 (0.0) 3 (0.0) 0.0
Linezolid 0 (0.0) 0 (0.0) 52 (0.003) 0 (0.0) 85 (0.01) 59 (0.004) 37 (0.003) 41 (0.004) 0.0
Meropenem 5 (0.0) 1 (0.0) 7 (0.0) 8(0.0) 7 (0.0) 24 (0.002) 14 (0.002) 10 (0.001) 0.0
Trimethoprim 9 9074 (5.3) 110 909 (5.7) 93 980 (5.7) 86 867(6.7) 101 659 (6.2) 100 061(7.0) 85 757 (7.5) 78 889 (7.8) +2.5

304
Table B.11 DDD/1 000 inhabitant/days of fluoroquinolones prescribed in patients above 18 years
Year Generation ATC Code Fluoroquinolone Total DDD DDD/Inhabitant-year
DDD/1000 Inhabitant-days
2005 1st J01MA06 Norfloxacin 85 229 0.06 0.18
2nd J01MA02 Ciprofloxacin 623 160 0.47 1.29
J01MA04 Enoxacin 205 0.0002 0.0004
J01MA14 Levofloxacin 221 663 0.17 0.46
J01MA01 Ofloxacin 107 315 0.08 0.22
3rd J01MA16 Gatifloxacin 89 887 0.07 0.19
J01MA14 Moxifloxacin 243 569 0.18 0.51
Total 1 371 028 1.04 2.85
2006 1st J01MA06 Norfloxacin 71 872 0.05 0.14
2nd J01MA02 Ciprofloxacin 707 654 0.52 1.42
J01MA04 Enoxacin 242 0.0002 0.0005
J01MA14 Levofloxacin 289 867 0.21 0.58
J01MA01 Ofloxacin 113 000 0.08 0.23
3rd J01MA16 Gatifloxacin 41 879 0.03 0.08
J01MA14 Moxifloxacin 298 009 0.22 0.60
Total 1 522 523 1.12 3.06
2007 1st J01MA06 Norfloxacin 55 252 0.05 0.14
2nd J01MA02 Ciprofloxacin 647 984 0.62 1.70
J01MA04 Enoxacin 105 0.0001 0.0003
J01MA14 Levofloxacin 310 741 0.30 0.82
J01MA01 Ofloxacin 86 664 0.08 0.23
2007 3rd J01MA16 Gatifloxacin 1 098 0.001 0.003
J01MA14 Moxifloxacin 304 317 0.29 0.80
Total 1 406 161 1.35 3.69
2008 1st J01MA06 Norfloxacin 41 3625 0.05 0.13
2nd J01MA02 Ciprofloxacin 534 333 0.59 1.62
J01MA14 Levofloxacin 311 392 0.35 0.95
J01MA01 Ofloxacin 56 231 0.06 0.17
3rd J01MA14 Moxifloxacin 229 850 0.26 0.70
Total 1173169 1.31 3.57
2009 1st J01MA06 Norfloxacin 44 777 0.04 0.10
2nd J01MA02 Ciprofloxacin 669 510 0.55 1.51
J01MA04 Enoxacin 7 0.00001 0.00002
J01MA14 Levofloxacin 462 385 0.38 1.04
J01MA01 Ofloxacin 42 295 0.03 0.10
J01MA14 Moxifloxacin 276 778 0.23 0.62
Total 1 495 752 1.23 3.38

305
Table B.11 DDD/1000 Inhabitant/days of fluoroquinolones prescribed in patients above 18 years (continued)
Year Generation ATC Code Description Total DDD DDD/Inhabitan/year DDD/1000
Inhabitant-days
2010 1st J01MA06 Norfloxacin 38 979 0.03 0.09
2nd J01MA02 Ciprofloxacin 627 396 0.54 1.48
J01MA14 Levofloxacin 413 515 0.36 0.97
J01MA01 Ofloxacin 29 619 0.03 0.07
3rd J01MA16 Gatifloxacin 7 0.00001 0.00002
J01MA14 Moxifloxacin 242 231 0.21 0.57
Total 1 351 748 1.16 3.18
2011 1st J01MA06 Norfloxacin 32 378 0.03 0.09
2nd J01MA02 Ciprofloxacin 491 032 0.47 1.29
J01MA14 Levofloxacin 300 820 0.29 0.79
J01MA01 Ofloxacin 14 130 0.01 0.04
3rd J01MA16 Gatifloxacin 14 0.00001 0.00004
J01MA14 Moxifloxacin 195 186 0.19 0.51
Total 1 033 561 0.99 2.71
2012 1st J01MA06 Norfloxacin 25 076 0.02 0.07
2nd J01MA02 Ciprofloxacin 439 373 0.43 1.19
J01MA14 Levofloxacin 249 192 0.25 0.67
J01MA01 Ofloxacin 14 439 0.01 0.04
3rd J01MA14 Moxifloxacin 162 226 0.16 0.44
Total 0.88 2.41

306
Table B.12 Cohen’s d-value for the differences between the average DDDs per prescription per patient per year for fluoroquinolones prescribed in patients above 18 years, 2005 – 2012
Ciprofloxacin
2005 (4.12 ± 3.21) 2006 (4.41 ± 6.78) 2007 (4.47 ± 2.84) 2008 (4.59 ± 3.10) 2009 (4.65 ± 2.96) 2010 (4.71 ± 2.61) 2011 (4.77 ± 2.29)
2006 (4.41 ± 6.78) 0.05 -
2007 (4.47 ± 2.84) 0.09 0.04 -
2008 (4.59 ± 3.10) 0.13 0.08 0.03 -
2009 (4.65 ± 2.96) 0.14 0.09 0.05 0.02 -
2010 (4.71 ± 2.61) 0.16 0.11 0.07 0.03 0.02 -
2011 (4.77 ± 2.29) 0.18 0.12 0.08 0.05 0.03 0.01 -
2012 (4.84 ± 4.57) 0.19 0.14 0.10 0.07 0.05 0.03 0.02
Levofloxacin
2005 (5.47 ± 4.57) 2006 (5.79 ± 3.70) 2007 (6.15 ± 6.22) 2008 (6.65 ± 5.90) 2009 (7.04 ± 5.44) 2010 (7.23 ± 4.44) 2011 (7.30 ± 3.33)
2006 (5.79 ± 3.70) 0.07 -
2007 (6.15 ± 6.22) 0.14 0.07 -
2008 (6.65 ± 5.90) 0.24 0.18 0.10 -
2009 (7.04 ± 5.44) 0.32 0.26 0.18 0.08 -
2010 (7.23 ± 4.44) 0.36 0.30 0.22 0.12 0.04 -
2011 (7.30 ± 3.33) 0.38 0.31 0.24 0.13 0.05 0.01 -
2012(7.30 ± 3.72) 0.42 0.36 0.28 0.18 0.10 0.06 0.05
Gatifloxacin
2005 (6.90 ± 1.56) 2006 (6.98 ± 1.79) 2007 (7.13 ± 1.06) 2008 (7.05 ± 0.38) 2009 2010 2011
2006 (6.98 ± 1.79) 0.05 -
2007 (7.13 ± 1.06) - - -
2008 (7.05 ± 0.38) - - - -

307
Table B.12 Cohen’s d-value for the differences between the average DDDs per prescription per patient per year for fluoroquinolones prescribed in patients above 18 years, 2005 – 2012 (continued)
Moxifloxacin
2005 (5.81 ± 4.03) 2006 (5.89 ± 5.45) 2007 (5.96 ± 2.76) 2008 (6.00 ± 1.99) 2009 (5.91 ± 2.72) 2010 (5.86 ± 2.31) 2011 (5.87 ± 2.31)
2006 (5.89 ± 5.45) 0.02 -
2007 (5.96 ± 2.76) 0.04 0.02 -
2008 (6.00 ± 1.99) 0.05 0.03 - -
2009 (5.91 ± 2.72) 0.03 - - 0.03 -
2010 (5.86 ± 2.31) - - 0.03 0.04 - -
2011 (5.87 ± 2.31) - - 0.03 - - - -
2012 (5.90 ± 4.84) 0.3 - - 0.03 - - -
Norfloxacin
2005 (3.68 ± 2.75) 2006 (3.74 ± 2.36) 2007 (3.67 ± 2.39) 2008 (3.66 ± 2.51) 2009 (3.69 ± 1.95) 2010 (3.79 ± 2.09) 2011 (3.81 ± 2.25)
2006 (3.74 ± 2.36) 0.02 -
2007 (3.67 ± 2.39) 0.00 0.03 -
2008 (3.66 ± 2.51) 0.01 0.03 0.00 -
2009(3.69 ± 1.95) 0.00 0.02 0.01 0.01 -
2010 (3.79 ± 2.09) 0.05 0.02 0.05 0.05 0.04 -
2011 (3.81 ± 2.25) 0.05 0.03 0.06 0.06 0.05 0.01 -
2012 (3.82 ± 2.28) 0.06 0.04 0.06 0.07 0.06 0.01 0.01

308
Table B.12 Cohen’s d-value for the differences between the average DDDs per prescription per patient per year for fluoroquinolones prescribed in patients above 18 years, 2005 – 2012 (continued)
Ofloxacin
2005 (7.22 ± 3.92) 2006 (7.26 ± 3.53) 2007 (7.55 ± 3.31) 2008 (7.39 ± 3.94) 2009 (7.34 ± 3.75) 2010 (7.66 ± 5.75) 2011 (7.63 ± 5.75)
2006 (7.26 ± 3.53) - -
2007 (7.55 ± 3.31) 0.08 0.07 -
2008 (7.39 ± 3.94) 0.04 - - -
2009 (7.34 ± 3.75) - - 0.05 - -
2010 (7.66 ± 5.75) 0.11 0.10 - 0.07 0.08 -
2011 (7.63 ± 5.75) 0.10 0.09 - - - - -
2012 (7.63 ± 4.57) 0.10 0.09 - - - - -
Table B.13 Cohen’s d-value for differences between PDDs (mg) of fluoroquinolones prescriptions per year in patients 18 years and below stratified by age groups, 2005 - 2012
Ciprofloxacin, ≥0, ≤5 years
2005
(1 062.47 ± 787.44) 2006
(910.13 ± 592.80) 2007
(722 .13± 409.50) 2008
(776.83 ± 336.21) 2009
(821.22 ± 390.02) 2010
(818.93 ± 507.16) 2011
(814.17 ± 344.53)
2006 (910.13 ± 592.80) 0.31 -
2007 (722 .13± 409.50) 0.68 0.38 -
2008 (776.83 ± 336.21) 0.57 0.27 - -
2009 (821.22 ± 390.02) 0.48 0.18 0.20 0.09 -
2010 (818.93 ± 507.16) 0.49 0.18 0.19 0.08 - -
2011 (814.17 ± 344.53) 0.50 0.19 0.18 0.07 0.01 0.01 -
2011 (769.06 ± 296.86) 0.59 0.28 0.09 0.02 0.10 0.10 0.09

309
Table B.13 Cohen’s d-value for differences between PDDs (mg) of fluoroquinolones prescribed per year in patients 18 years and below stratified by age groups, 2005 – 2012 (continued)
Ciprofloxacin
>5, ≤12 years
2005
(1 223.55 ± 578.64) 2006
(1 009.23 ± 693.44) 2007
(858.88 ± 404.75) 2008
(886.08 ± 402.09) 2009
(1 004.52 ± 893.16) 2011
(851.81 ± 413.38) 2012
(872.01 ± 366.48)
2006 (1 009.23 ± 693.44) 0.16 -
2007(858.88 ± 404.75) 0.28 0.12 -
2008 (886.08 ± 402.09) 0.16 0.09 0.02 -
2009 (1 004.52 ± 893.16) 0.17 0.00 0.11 0.09 -
2010 (843.52 ± 392.40) 0.29 0.13 0.01 0.03 0.12 -
2011 (851.81 ± 413.38) 0.28 0.12 0.11 0.03 0.12 0.01 -
2012 (872.01 ± 366.48) 0.27 0.11 0.01 0.01 0.10 0.02 0.02
>12, ≤18 years
2005
(1 319.84 ± 959.03) 2006
(1 081 ± 857.74) 2007
(954.70 ± 376.04) 2008
(956.70 ± 376.04) 2009
(958.15 ± 345.79) 2010
(930.59 ± 339.88) 2011
(953.08 ± 328.73)
2006 (1 081.41 ± 857.74) 0.40 -
2007 (954.70 ± 376.04) 0.62 0.21 -
2008 (956.70 ± 376.04) 0.61 0.21 0.00 -
2009 (958.15 ± 345.79) 0.61 0.21 0.01 0.00 -
2010 (930.59 ± 339.88) 0.66 0.25 0.04 0.04 0.05 -
2011 (953.08 ± 328.73) 0.62 0.22 0.00 0.01 0.01 0.04 -
2012 (945.65 ± 331.64) 0.63 0.23 0.01 0.02 0.02 0.03 0.01

310
Table B.13 Cohen’s d-value for differences between PDDs (mg) of fluoroquinolones prescribed per year in patients 18 years and below stratified by age groups, 2005 – 2012 (continued)
Gemifloxacin
>12, ≤18 years
2005
(367.41 ± 167.840) 2006
(368.83 ± 262.10) 2007
(314.56 ± 41.53) 2008
(320.00 ± 0.00) 2009
(315.23 ± 33.22) 2010
(316.08 ± 27.08) 2011
(320.00 ± 0.00)
2006 (368.83 ± 262.10) 0.01 -
2007 (314.56 ± 41.53) 0.39 0.40 -
2008 (320.00 ± 0.00) 0.35 0.36 0.04 -
2009 (315.23 ± 33.22) 0.39 0.40 0.00 0.04 -
2010 (316.08 ± 27.08) 0.38 0.39 0.01 0.03 0.01 -
2011 (320.00 ± 0.00) 0.35 0.36 0.04 0.00 0.04 0.03 -
2012 (309.33 ± 53.33) 0.43 0.44 0.04 0.08 0.04 0.05 0.08
Levofloxacin
>5, ≤12 years
2005
(548.73 ± 491.54) 2006
(469.50 ± 202.02) 2007
(511.75 ± 256.14) 2008
(542.78 ± 234.70) 2009
(546.11 ± 236.04) 2010
(367.38 ± 135.62) 2011
(448.53 ± 213.46)
2006 (469.50 ± 202.02) 0.29 -
2007 (511.75 ± 256.14) 0.13 0.15 -
2008 (542.78 ± 234.70) 0.02 0.27 0.11 -
2009 (546.11 ± 236.04) 0.01 0.28 0.12 0.01 -
2010 (367.38 ± 135.62) 0.66 0.37 0.52 0.64 0.65 -
2011 (448.53 ± 213.46) 0.36 0.08 0.23 0.34 0.35 0.29 -
2012 (389.25 ± 119.15) 0.58 0.29 0.44 0.52 0.57 0.08 0.21

311
Table B.13 Cohen’s d-value for differences between PDDs (mg) of fluoroquinolones prescribed per year in patients 18 years and below stratified by age groups, 2005 – 2012 (continued)
Levofloxacin
>12, ≤18 years
2005
(534.48 ± 348.38) 2006
(505.21 ± 246.53) 2007
(530.83 ± 228.63) 2008
(575.49 ± 217.08) 2009
(611.64 ± 232.21) 2010
(593.06 ± 210.01) 2011
(594.25 ± 220.31)
2006 (505.21 ± 246.53) 0.29 -
2007 (530.83 ± 228.63) 0.13 0.10 -
2008 (575.49 ± 217.08) 0.17 0.29 0.18 -
2009 (611.64 ± 232.21) 0.31 0.43 0.33 0.15 -
2010 (593.06 ± 210.01) 0.25 0.36 0.25 0.07 0.08 -
2011 (594.25 ± 220.31) 0.24 0.36 0.26 0.08 0.07 0.00 -
2012 (595.09 ± 208.72) 0.25 0.33 0.26 0.08 0.07 0.01 0.00
Moxifloxacin
>5 and ≤ 12 years
2005
(474.62 ± 246.18) 2006
(449.00 ± 356.48) 2007
(392.67 ± 40.82) 2008 (400.00
± 0.00) 2009
(391.39 ± 45.99) 2010
(760.00 ± 130.11) 2011
(647.50 ± 211.77)
2006 (449.00 ± 356.48) 0.13 -
2007 (392.67 ± 40.82) 0.42 0.29 -
2008(400.00 ± 0.00) 0.39 0.25 0.04 -
2009 (391.39 ± 45.99) 0.43 0.25 0.01 0.04 -
2010 (760.00 ± 130.11) 0.43 0.29 0.00 0.04 0.00 -
2011 (647.50 ± 211.77) 0.40 0.27 0.00 0.02 0.03 0.03 -
2012 (766.67 ± 115.47) 0.39 0.25 0.00 0.00 0.04 0.04 0.02

312
Table B.13 Cohen’s d-value for differences between PDDs (mg) of fluoroquinolones prescribed per year in patients 18 years and below stratified by age groups, 2005 – 2012 (continued)
Moxifloxacin
>12 and ≤ 18 years
2005
(581.36 ± 181.97) 2006
(441.82 ± 229.78) 2007
(394.10 ± 66.65) 2008
(396.06 ± 34.50) 2009
(398.90 ± 27.87) 2010
(396.44 ± 29.11) 2012
(397.52 ± 23.63)
2006 (441.82 ± 229.78) 0.20 -
2007 (394.10 ± 66.65) 0.27 0.07 -
2008 (396.06 ± 34.50) 0.27 0.07 0.00 -
2009 (398.90 ± 27.87) 0.26 0.06 0.01 0.00 -
2010 (396.44 ± 29.11) 0.27 0.07 0.00 0.00 0.00 -
2011 (396.63 ± 31.54) 0.27 0.07 0.00 0.00 0.00 0.00 -
2012 (397.52 ± 23.63) 0.27 0.06 0.00 0.00 0.00 0.00 0.00
Norfloxacin
>5 and ≤ 12 years
2005
(985.74 ± 316.99) 2006
(898.27 ± 308.48) 2007
(784.80 ± 129.52) 2008
(761.45 ± 129.52) 2009
(760.00 ± 130.11) 2010
(699.26 ± 198.88) 2011
(647.50 ± 211.77)
2006 (898.27 ± 308.48) 0.36 -
2007 (784.80 ± 129.52) 0.84 0.47 -
2008 (761.45 ± 129.52) 0.93 0.57 0.10
2009 (760.00 ± 130.11) 0.94 0.58 0.10 0.01
2010 (699.26 ± 198.88) 1.19 0.83 0.36 0.26 0.25
2011 (647.50 ± 211.77) 1.41 1.04 0.57 0.47 0.47 0.22
2012 (766.67 ± 115.47) 0.91 0.55 0.08 0.02 0.03 0.28 0.50

313
Table B.13 Cohen’s d-value for differences between PDDs (mg) of fluoroquinolones prescribed per year in patients 18 years and below stratified by age groups, 2005 – 2012 (continued)
>12 and ≤ 18 years
2005
(1 143.29 ± 668.92) 2006
(987.19 ± 529.29) 2007
(773.46 ± 106.70) 2008
(783.40 ± 82.43) 2009
(772.16 ± 106.43) 2010
(764.23 ± 124.44) 2012
(779.10 ± 88.11)
2006 (987.19 ± 529.29) 0.38 -
2007 (773.46 ± 106.70) 0.90 0.52 -
2008 (783.40 ± 82.43) 0.88 0.50 0.02 -
2009 (772.16 ± 106.43) 0.91 0.53 0.00 0.03 -
2010 (764.23 ± 124.44) 0.93 0.54 0.02 0.05 0.02 -
2011 (750.20 ± 139.97) 0.96 0.58 0.06 0.08 0.05 0.03 -
2012 (779.10 ± 88.11) 0.89 0.51 0.52 0.01 0.02 0.04 0.07
Ofloxacin
>5 and ≤ 12 years
2005
(1 214. 37 ± 503.09) 2006
(912.49 ± 375.63) 2007
(689.96 ± 144.51) 2008
(669.96 ± 144.51) 2009
(656.00 ± 209.55) 2010
(347.83 ± 227.38) 2011
(436.36 ± 196.33)
2006 (912.49 ± 375.63) 0.77 -
2007 (689.96 ± 144.51) 1.33 0.56 -
2008 (669.96 ± 144.51) 1.38 0.62 0.05 -
2009 (656.00 ± 209.55) 1.42 0.65 0.09 0.03 -
2010 (347.83 ± 227.38) 2.20 1.43 0.87 0.82 0.78 -
2011 (436.36 ± 196.33) 1.97 2.21 0.64 0.59 0.56 0.22 -
2012 (250.00 ± 100.00) 2.45 1.68 1.12 1.06 1.03 0.25 0.47

314
Table B.13 Cohen’s d-value for differences between PDDs (mg) of fluoroquinolones prescribed per year in patients 18 years and below stratified by age groups, 2005 – 2012 (continued)
>12 and ≤ 18 years
2005
(1 195.69 ± 549.88) 2006
(958.23 ± 478.81) 2007
(717.29 ± 135.46) 2008
(685.98 ± 158.52) 2009
(711.18 ± 152.60) 2010
(599.74 ± 241.56) 2011
(671.30 ± 223.70)
2006 (958.23 ± 478.81) 0.58 -
2007 (717.29 ± 135.46) 1.16 0.59 -
2008 (685.98 ± 158.52) 1.24 0.66 0.08 -
2009 (711.18 ± 152.60) 1.18 0.60 0.01 0.06 -
2010 (599.74 ± 241.56) 1.45 0.87 0.29 0.21 0.27 -
2011 (671.30 ± 223.70) 1.27 0.70 0.11 0.04 0.10 0.17 -
2012 (647.47 ± 206.67) 1.33 0.76 0.17 0.09 0.15 0.12 0.06
Table B.14 Cohen’s d-value for difference between average PDDs (mg) of fluoroquinolones claimed by patients 18 years and below according to prescribers’ specialty
Year Ciprofloxacin
2005
General medical practice
(1 334.43 ± 1 103.74) Paediatrician
(657.34 ±314.91) Specialist
(820.95 ± 450.49) Pharmacotherapist
(750.00 ± 288.68)
Paediatrician (657.34 ± 314.91) 0.63 -
Specialist (820.95 ± 450.49) 0.48 0.15 -
Pharmacotherapist (750.00 ± 288.68) 0.55 0.09 0.07 -
Other (743.53 ± 432.09) 0.55 0.08 0.07 0.01
2006
General medical practice
(1 088.65 ± 845.01) Paediatrician
(658.42 ± 286.47) Specialist
(709.72 ± 302.41) Pharmacotherapist
(666.67 ± 288.86)
Paediatrician (658.42 ± 286.47) 0.52 -
Specialist (709.72 ± 302.41) 0.46 0.06 -
Pharmacotherapist (666.67 ± 288.86) 0.51 0.01 0.05 -
Other (733.37 ± 280.68) 0.43 0.09 0.03 0.08

315
Table B.14 Cohen’s d-value for difference between average PDDs (mg) of fluoroquinolones claimed by patients 18 years and below according to prescribers’ specialty (continued)
Year Ciprofloxacin
2007
General medical practice
(943.98 ± 370.03) Paediatrician
(737.03 ± 349.05) Specialist
(802.75 ± 245.21) Pharmacotherapist
(500.00 ± 0.00)
Paediatrician (737.03 ± 349.05) 0.57 -
Specialist (802.75 ± 245.21) 0.39 0.18 -
Pharmacotherapist (500.00 ± 0.00) 1.24 0.65 0.83 -
Other (726.38 ± 282.98) 0.59 0.03 0.21 0.62
2008
General medical practice
(956.85 ± 383.97) Paediatrician
(753.46 ± 287.31)
Specialist
(682.05 ± 287.73)
Pharmacotherapist (1 000.00 ± 0.00)
Paediatrician (753.46 ± 287.31) 0.54 -
Specialist (682.05 ± 287.73) 0.73 0.19 -
Pharmacotherapist (1 000.00 ± 0.00) 0.11 0.65 0.84 -
Other (796.02 ± 276.65) 0.43 0.11 0.30 0.54
2009
General medical practice
(982.78 ± 229.70) Paediatrician
(713.25 ± 323.80) Specialist
(759.85 ± 282.07) Pharmacotherapist
Paediatrician (713.25 ± 323.80) 0.23 -
Specialist (759.85 ± 282.07) 0.19 0.00 -
Other (760.51 ± 284.03) 0.19 0.14 0.00 -
Pharmacotherapist - - - -
2010
General medical practice
(926.48 ± 351.79) Paediatrician
(806.22 ± 510.31) Specialist
(759.85 ± 282.07) Pharmacotherapist
Paediatrician (806.22 ± 510.31) 0.34 -
Specialist (759.85 ± 282.07) 0.52 0.19 -
Other (785.07 ± 267.38) 0.39 0.06 0.13 -
Pharmacotherapist - - - -

316
Table B.14 Cohen’s d-value for difference between average PDD of fluoroquinolones claimed by patients 18 years and below according to prescribers’ specialty (continued)
Year Ciprofloxacin
2011
General medical practice
(943.19 ± 346.84) Paediatrician
(746.75 ± 297.84) Specialist
(787.26 ± 312.41) Pharmacotherapist
Paediatrician (746.75 ± 297.84) 0.57 -
Specialist (787.26 ± 312.41) 0.45 0.12 -
Other (901.35 ± 329.12) 0.12 0.45 0.33 -
Pharmacotherapist - - - -
2012
General medical practice
(940.79 ± 340.61) Paediatrician
(766.32 ± 340.61) Specialist
(865.96 ± 256.28) Pharmacotherapis
Paediatrician (766.32 ± 340.61) 0.52 -
Specialist (865.96 ± 256.28) 0.22 0.30 -
Other (740.94 ± 269.91) 0.60 0.08 0.37
Pharmacotherapist - - -
Gemifloxacin
2007
General medical practice (314.37 ± 41.37)
Paediatrician (320.00 ± 00)
Specialist (186.87 ± 188.56)
Pharmacotherapist
Paediatrician (320.00 ± 00) 0.13 -
Specialist (186.87 ± 188.56) 3.04 3.18 -
Other (320.00 ± 0.00) 0.13 0.00 3.18
Pharmacotherapist - - -
Norfloxacin
2007
General medical practice
(777.77 ± 103.23) Paediatrician (800.00 ± 0.00)
Specialist (600.00 ± 282.84)
Pharmacotherapist
Paediatrician (800.00 ± 0.00) 3.53 -
Specialist (600.00 ± 282.84) 1.66 1.87 -
Other (710.00 ± 168.01) 0.63 2.89 1.03 -
Pharmacotherapist - - - -

317
Table B.14 Cohen’s d-value for difference between average PDD of fluoroquinolones claimed by patients 18 years and below according to prescribers’ specialty (continued)
Ofloxacin
2005
General medical practice
(1 212.82 ± 534.31) Paediatrician
(585.67 ± 301.70) Specialist
Pharmacotherapist (400.00 ± 00)
Paediatrician (585.67 ± 301.70) 1.18 -
Pharmacotherapist (400.00 ± 0.00) 1.53 0.53 - -
Other (465.31 ± 196.49) 1.41 0.23 - -
Specialist - - -
2006
General medical practice
(956.23 ± 461.90) Paediatrician
(600.00 ± 230.94) Specialist
Pharmacotherapist (577.78 ± 384.90)
Paediatrician (600.00 ± 230.94) 0.78 -
Pharmacotherapist (577.78 ± 384.90) 0.82 0.05 - -
Other (506.12 ± 201.84) 0.98 0.20 - -
Specialist - - -
2007
General medical practice
(715.10 ± 134.44) Paediatrician
(715.10 ± 134.44) Specialist
(800.00± 00) Pharmacotherapist
Paediatrician (715.10 ± 134.44) - -
Specialist (800.00± 00) 0.62 - -
Other (577.78 ± 210.82) 1.01 - 1.63 -
Pharmacotherapist - - - -
2009
General medical practice
(715.00 ± 148.79) Paediatrician
(344.00 ± 125.22) Specialist
(800.00 ± 00) Pharmacotherapist
Paediatrician (344.00 ± 125.22) 2.49 -
Specialist (800.00 ± 00) 0.57 3.05 -
Pharmacotherapist - - - -
Other (700.00 ± 200.00) 0.10 2.38 0.67 -

318
Table B.14 Cohen’s d-value for difference between average PDD of fluoroquinolones claimed by patients 18 years and below according to prescribers’ specialty (continued)
Ofloxacin
2010
General medical practice
(581.58 ± 247.34) Paediatrician (200.00 ± 0.00)
Specialist (600.00 ± 282.84)
Pharmacotherapist
Paediatrician (200.00 ± 0.00) 1.59 -
Specialist (600.00 ± 282.84) 0.08 1.67 -
Pharmacotherapist - - - -
Other - - - -

319


