Embed Size (px)
Citation preview
Anticipating Conflict Facilitates ControlledStimulus-response Selection
Angel Correa1,2, Anling Rao2, and Anna C. Nobre2
Abstract
& Cognitive control can be triggered in reaction to previousconflict, as suggested by the finding of sequential effects inconflict tasks. Can control also be triggered proactively bypresenting cues predicting conflict (‘‘proactive control’’)?We exploited the high temporal resolution of ERPs and con-trolled for sequential effects to ask whether proactive con-trol based on anticipating conflict modulates neural activityrelated to cognitive control, as may be predicted from theconflict-monitoring model. ERPs associated with conflict de-tection (N2) were measured during a cued flanker task. Sym-bolic cues were either informative or neutral with respectto whether the target involved conflicting or congruent re-sponses. Sequential effects were controlled by analyzing thecongruency of the previous trial. The results showed that cueingconflict facilitated conflict resolution and reduced the N2 la-
tency. Other potentials (frontal N1 and P3) were also modu-lated by cueing conflict. Cueing effects were most evident aftercongruent than after incongruent trials. This interaction be-tween cueing and sequential effects suggests neural overlapbetween the control networks triggered by proactive and re-active signals. This finding clarifies why previous neuroimagingstudies, in which reactive sequential effects were not con-trolled, have rarely found anticipatory effects upon conflict-related activity. Finally, the high temporal resolution of ERPswas critical to reveal a temporal modulation of conflict de-tection by proactive control. This novel finding suggests thatanticipating conflict speeds up conflict detection and resolu-tion. Recent research suggests that this anticipatory mecha-nism may be mediated by preactivation of ACC during thepreparatory interval. &
INTRODUCTION
Most classic models of cognition posit a control systemthat selects stimuli and responses according to taskgoals (e.g., Norman & Shallice, 1986; Kahneman, 1973;Atkinson & Shiffrin, 1968). This system is engaged underconflicting situations, such as when simultaneously oc-curring events call for multiple and incompatible re-sponses (Eriksen & Eriksen, 1974), and after negativebehavioral outcomes, such as errors (for a review, seeRidderinkhof, Ullsperger, Crone, & Nieuwenhuis, 2004).After conflict or errors, behavioral measures reveal amore deliberate mode of responding (‘‘sequential ef-fects,’’ Gratton, Coles, & Donchin, 1992; ‘‘posterror slow-ing,’’ Rabbitt, 1966).
Neural models of conflict monitoring (e.g., Botvinick,Braver, Barch, Carter, & Cohen, 2001) posit that theACC detects conflict and recruits DLPF cortex to biasstimulus-response selection through top–down signals.Neuroimaging research has confirmed increased ACCactivation by conflict, followed by decreased ACC activa-tion on the subsequent conflicting trial, suggesting suc-cessful conflict reduction by an increased attentional set(Kerns et al., 2004; Botvinick, Nystrom, Fissell, Carter, &Cohen, 1999).
Conflict monitoring is triggered in reaction to previousconflict (‘‘reactive control’’), as suggested by the findingof sequential effects in conflict tasks (Gratton et al., 1992).Gratton et al. (1992) used a flanker task (Eriksen &Eriksen, 1974) and found that the conflict effect (RT dif-ference between incongruent and congruent conditions)was reduced when the previous trial was incongruentrather than congruent. However, top–down control isnot only triggered reactively but also proactively (Logan& Zbrodoff, 1982). Logan and Zbrodoff (1982) induced‘‘proactive control’’ by presenting cues predicting con-flict in a Stroop (1935) task. The results showed that theanticipation of an incongruent trial reduced the conflicteffect. Thus, proactive control is analogous to attentionalorienting more generally, during which expectationsabout a particular event attribute trigger top–down biasesof relevant stimulus/response representations (Kastner &Ungerleider, 2000).
Although the conflict-monitoring model was primarilybased on reactive control (Botvinick et al., 2001), a clearprediction can also be made for proactive control. Be-havioral facilitation of conflict resolution by proactivecontrol should be associated with modulations of conflict-related neural activity (e.g., decreased ACC activity). How-ever, neuroimaging studies using conflict-predicting cueshave led to inconclusive results (Luks, Simpson, Dale, &Hough, 2007; Sohn, Albert, Jung, Carter, & Anderson,1Universidad de Granada, Spain, 2University of Oxford, UK
D 2008 Massachusetts Institute of Technology Journal of Cognitive Neuroscience 21:8, pp. 1461–1472
2007; Fassbender, Foxe, & Garavan, 2006; Luks, Simpson,Feiwell, & Miller, 2002). The scarce evidence showingthat proactive control modulates conflict processing couldbe explained by two factors: (1) the limited temporal res-olution of hemodynamic measures or (2) the masking ofproactive control effects due to modulatory effects causedby reactive control. None of these studies manipulatingproactive control considered the effect of previous trialcongruency. If proactive and reactive control share neu-ral mechanisms, then the effects of proactive controlwould be most evident when reactive control is low (i.e.,after congruent rather than incongruent trials).
Here, we (1) exploited the high temporal resolutionof ERPs and (2) controlled for the effects of reactivecontrol in a cued flanker task to ask whether proactivecontrol modulates neural activity related to conflict.Previous research using conflict tasks and ERPs hasidentified two frontal potentials related to cognitivecontrol. A negative deflection is observed after stimulithat carry incongruent versus congruent response ten-dencies (N2; Kopp, Rist, & Mattler, 1996) as well as afteran incorrect response (error-related negativity—‘‘ERN’’or ‘‘Ne’’; Gehring, Goss, Coles, Meyer, & Donchin, 1993;Falkenstein, Hohnsbein, Hoormann, & Blanke, 1990).ACC is thought to constitute an important source toboth the N2 and the ERN (Debener et al., 2005; van Veen& Carter, 2002), which, respectively, have been inter-preted as indices of conflict detection (van Veen & Carter,2002) and error detection (reviewed by Falkenstein,Hoormann, Christ, & Hohnsbein, 2000).
The central hypothesis of this study was that the an-ticipation of conflict should modulate control-relatedpotentials. Two ERP analyses were conducted on control-related ERPs: stimulus locked and response locked. Thestimulus-locked analysis tested whether conflict process-ing, as indexed by the N2 potential, was attenuated bycueing conflict. Additionally, this analysis allowed us toexplore whether proactive and reactive control operatethrough a common attentional system, as suggested bytheir analogous behavioral effects (Gratton et al., 1992;Logan & Zbrodoff, 1982). We compared modulationsof stimulus-locked potentials by cueing versus by previousconflict processing. If their neural mechanisms overlap,proactive and reactive control should interact in theirmodulation of conflict-related neural processing. Stron-ger effects of proactive control should hence be ex-pected under low versus high reactive control. On theother hand, if proactive and reactive control involve in-dependent mechanisms, we should observe dissociablemodulations of conflict processing.
The response-locked analysis tested whether error-related processing indexed by the ERN and the ensu-ing ‘‘error positivity’’ (Pe; Falkenstein et al., 1990, 2000)was modulated by cueing conflict. High time pressurefor responding was imposed to ensure reliable numbersof error trials for ERP analysis (e.g., Nieuwenhuis et al.,2006; Ullsperger, Bylsma, & Botvinick, 2005).
METHODS
Participants
Twenty participants from the University of Oxford (aged19–49, nine women) took part voluntarily in the exper-iment. Data from one participant were rejected due toexcessively low accuracy during task performance (58%correct). The experimental methods were noninvasiveand had ethical approval from the University of Oxford.
Stimuli and Task
Participants completed a cued flanker task under hightime pressure. They were to respond according to thedirection pointed by a central arrow while ignoring thedirection of the flanking arrows. The target was pre-ceded by a cue stimulus, which was either informativeor neutral with respect to the congruency between thecentral and flanking arrows. Informative cues were 100%predictive (‘‘cued’’ condition). A green checkmark indi-cated that the central and the flanking arrows would becongruent. A red cross indicated they would be incon-gruent. A yellow question mark provided no predictionabout congruency (‘‘neutral’’ condition). A sufficientlylong interval was used between the cue and the flankerarray (1000–1500 msec) to enable the implementationof endogenously generated expectations about the up-coming stimulus congruency (e.g., see Monsell, 2003;Gratton et al., 1992; Muller & Rabbitt, 1989). The cuestimulus subtended 1.28 � 1.28. Target arrays consistedof five white arrows (1.48 � 18 each) appearing in arow and centered on the fixation point (a gray dot with0.38 diameter). The direction of the central arrow (leftor right) could be the same (congruent) or different(incongruent) from that of the flankers. All f lankerspointed in the same direction.
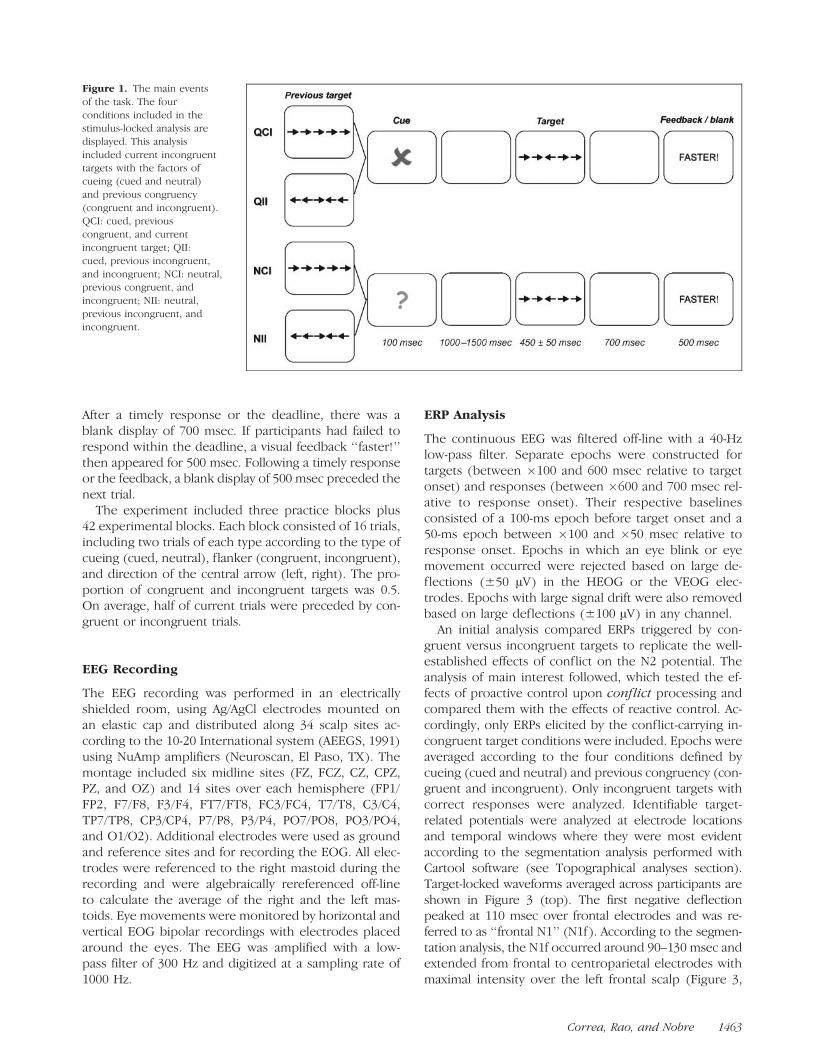
Figure 1 illustrates the main events of the task for thefour incongruent conditions used to compare proactivecueing and reactive sequential effects. These includedcueing (cued and neutral) and congruency of the targeton the previous trial (‘‘previous congruency’’: congru-ent and incongruent).
Each trial began with a fixation point presented cen-trally for a random interval that ranged between 500and 1000 msec. The cue was then presented centrallyfor 100 msec and followed by a blank display for a ran-dom interval of 1000–1500 msec. The target array thenappeared and remained until the participant respondedor a maximum deadline elapsed. The deadline was setat 450 msec and was adjusted across blocks to main-tain a good level of performance that was below ceiling(around 70%). The deadline was increased by 50 msecif the error rate was above 35% in the preceding blockor was decreased by 50 msec if it was below 25%. Theparticipant had to press the ‘‘z’’ key with the left indexfinger or the ‘‘m’’ key with the right index finger,according to the direction pointed by the central arrow.
1462 Journal of Cognitive Neuroscience Volume 21, Number 8
After a timely response or the deadline, there was ablank display of 700 msec. If participants had failed torespond within the deadline, a visual feedback ‘‘faster!’’then appeared for 500 msec. Following a timely responseor the feedback, a blank display of 500 msec preceded thenext trial.
The experiment included three practice blocks plus42 experimental blocks. Each block consisted of 16 trials,including two trials of each type according to the type ofcueing (cued, neutral), flanker (congruent, incongruent),and direction of the central arrow (left, right). The pro-portion of congruent and incongruent targets was 0.5.On average, half of current trials were preceded by con-gruent or incongruent trials.
EEG Recording
The EEG recording was performed in an electricallyshielded room, using Ag/AgCl electrodes mounted onan elastic cap and distributed along 34 scalp sites ac-cording to the 10-20 International system (AEEGS, 1991)using NuAmp amplifiers (Neuroscan, El Paso, TX). Themontage included six midline sites (FZ, FCZ, CZ, CPZ,PZ, and OZ) and 14 sites over each hemisphere (FP1/FP2, F7/F8, F3/F4, FT7/FT8, FC3/FC4, T7/T8, C3/C4,TP7/TP8, CP3/CP4, P7/P8, P3/P4, PO7/PO8, PO3/PO4,and O1/O2). Additional electrodes were used as groundand reference sites and for recording the EOG. All elec-trodes were referenced to the right mastoid during therecording and were algebraically rereferenced off-lineto calculate the average of the right and the left mas-toids. Eye movements were monitored by horizontal andvertical EOG bipolar recordings with electrodes placedaround the eyes. The EEG was amplified with a low-pass filter of 300 Hz and digitized at a sampling rate of1000 Hz.
ERP Analysis
The continuous EEG was filtered off-line with a 40-Hzlow-pass filter. Separate epochs were constructed fortargets (between �100 and 600 msec relative to targetonset) and responses (between �600 and 700 msec rel-ative to response onset). Their respective baselinesconsisted of a 100-ms epoch before target onset and a50-ms epoch between �100 and �50 msec relative toresponse onset. Epochs in which an eye blink or eyemovement occurred were rejected based on large de-flections (±50 AV) in the HEOG or the VEOG elec-trodes. Epochs with large signal drift were also removedbased on large deflections (±100 AV) in any channel.
An initial analysis compared ERPs triggered by con-gruent versus incongruent targets to replicate the well-established effects of conflict on the N2 potential. Theanalysis of main interest followed, which tested the ef-fects of proactive control upon conflict processing andcompared them with the effects of reactive control. Ac-cordingly, only ERPs elicited by the conflict-carrying in-congruent target conditions were included. Epochs wereaveraged according to the four conditions defined bycueing (cued and neutral) and previous congruency (con-gruent and incongruent). Only incongruent targets withcorrect responses were analyzed. Identifiable target-related potentials were analyzed at electrode locationsand temporal windows where they were most evidentaccording to the segmentation analysis performed withCartool software (see Topographical analyses section).Target-locked waveforms averaged across participants areshown in Figure 3 (top). The first negative deflectionpeaked at 110 msec over frontal electrodes and was re-ferred to as ‘‘frontal N1’’ (N1f ). According to the segmen-tation analysis, the N1f occurred around 90–130 msec andextended from frontal to centroparietal electrodes withmaximal intensity over the left frontal scalp (Figure 3,
Figure 1. The main events
of the task. The four
conditions included in the
stimulus-locked analysis aredisplayed. This analysis
included current incongruent
targets with the factors ofcueing (cued and neutral)
and previous congruency
(congruent and incongruent).
QCI: cued, previouscongruent, and current
incongruent target; QII:
cued, previous incongruent,
and incongruent; NCI: neutral,previous congruent, and
incongruent; NII: neutral,
previous incongruent, andincongruent.
Correa, Rao, and Nobre 1463
bottom). The N1f was therefore analyzed during 90–130 msec over frontal to centroparietal electrode posi-tions (F3/Z/4, FC3/Z/4, C3/Z/4, and CP3/Z/4). The P1overlapped temporally with the N1f, peaking at 120 msec,and was maximal over occipital electrodes (O1/2, PO3/4,and PO7/8). N1 peaked at 170 msec and was also maximalover occipital electrodes (O1/2, PO3/4, and PO7/8). P1 andN1 were analyzed during 110–130 and 160–180 msec overthree occipital positions (O1/2, PO3/4, and PO7/8). TheN2 peaked at about 305 msec over frontal electrodes andwas analyzed during 290–330 msec at F3/Z/4 and FC3/Z/4.The P3 peaked at 425 msec and was broadly distributedover the central scalp. The P3 was analyzed during 360–460 msec at FC3/Z/4, C3/Z/4, CP3/Z/4, and P3/Z/4.
An analysis of response-related ERPs focused onwhether cueing conflict modulated error processing. Theepochs were averaged separately for errors and correctresponses during incongruent trials, according to thecueing conditions (cued and neutral). Responses to con-gruent targets led to insufficient numbers of observationson the error condition and hence were not analyzed.Likewise, conditions with previous congruent and incon-gruent targets were collapsed to gain statistical power.
Error analyses followed the same approach as for tar-gets, using periods defined by topographical segmenta-tion and electrodes showing the maximal distributionof potentials. Around the time of response, ERPs elic-ited by errors contained an ERN that peaked at about20 msec after the response (see Figure 4, top)1 and wasfocally distributed over frontocentral electrodes (Fig-ure 4, bottom, Map 2). This was followed by positive-going potentials, similar to the Pe, which separated intotwo different topographical states (Maps 4 and 5). ERPselicited by correct responses were characterized by apositive potential, the ‘‘correct positivity’’ (Pc), at thesame time range as the ERN, which was distributed overcentral electrodes (Figure 4, bottom, ‘‘Map 3’’). ThePc was then followed by continued positive potentialssubdivided into two topographical states. The ERN wasanalyzed at 0–40 msec over frontal and frontocentralelectrodes (F3/Z/4 and FC3/Z/4). The Pe was analyzedover frontal to central electrodes (F3/Z/4, FC3/Z/4, andC3/Z/4) at two epochs: early Pe (50–110 msec, Map 4)and late Pe (250–290 msec, Map 5) (van Veen & Carter,2002). Analyses of correct responses included the Pcat 0–40 msec over frontal to central electrodes: F3/Z/4,FC3/Z/4, and C3/Z/4 (see Map 3).
Mean amplitude values were obtained for the tempo-ral window of each potential and submitted to repeatedmeasures ANOVAs. Target-related analyses consisted ofone ANOVA, which tested the effects of cueing, previouscongruency, electrode position, and electrode side.Response-related analyses included separate ANOVAs forerror and correct conditions with the factors of cueing,electrode position, and electrode side. Significant ef-fects of electrode position and electrode side were notreported, unless they involved interactions with either
cueing or previous congruency. Peak latencies of the mainpotentials of interest (N2 and ERN) and potentials show-ing amplitude modulation (N1f and P3) were also sub-jected to ANOVAs. The latency analyses included the sametemporal windows as the mean amplitude analyses andfocused on the electrode showing the highest activity: F3electrode for the N2, N1f, and ERN potentials and Cz forthe P3. The criterion to include data from a participantin either target or response-related analyses consisted of20 artifact-free trials per condition. This criterion led tothe exclusion of two participants from the target-relatedanalyses and three participants from the response-relatedanalyses.
Topographical Analysis
The topographical analysis determined how the distri-bution of voltage over the scalp (topographical maps)evolved over time in each experimental conditionand compared the distributions across conditions, usingCartool software (D. Brunet, Geneva, Switzerland; http://brainmapping.unige.ch/Cartool.php). The segmentationconsisted of a spatiotemporal cluster analysis of theERP group-averaged data normalized for global fieldpower (with the constraints that each scalp topographyshould remain stable for at least 20 msec and that thecorrelation between different topographies should notexceed 90%). The choice of the optimal number of to-pographies that best explained the whole data was basedon a cross-validation criterion (Pascual-Marqui, Michel,& Lehmann, 1995). The output of this segmentationanalysis consists of a set of topographical maps that rep-resent stable periods of electrical field patterns, whichreflect dissociable functional states of the brain (seeFigure 4, center and bottom). Different maps reflect dif-ferent stages of information processing with different un-derlying brain sources (Lehmann, 1987). This procedureserved to guide the selection of the optimal temporalwindows and electrodes for the ERP analysis. Moreover,the segmentation analysis served to compare the topo-graphical maps and their time courses across differentexperimental conditions. The comparison across condi-tions (e.g., Figure 4, Maps 2 and 3) was performedstatistically at the single-subject level through a fittingprocedure. The topographical maps identified for thegroup-average were fitted to the scalp topography ofeach participant and for each time point of data. Duringthis procedure, data from each subject and conditionwere compared with the maps identified at the group-average level, using a spatial correlation. Each time pointof the data of each participant was then labeled with themap with which it had the highest spatial correlation.For each participant, the number of milliseconds duringwhich one specific map was present on each conditionwas computed. These values would indicate whether onemap was dominant over another map for a given con-dition. These values were compared across conditions
1464 Journal of Cognitive Neuroscience Volume 21, Number 8
with ANOVAs with the maps and the experimental con-ditions as factors. An interaction involving the factormap would indicate that a particular experimental condi-tion was better explained by one map than another, andtherefore that a different configuration of brain genera-tors better explains the results.
RESULTS
Behavioral Results
Error rates and mean RTs from 19 participants weresubmitted to separate repeated measures ANOVAs withthe factors of cueing (cued and neutral), previous con-gruency (congruent and incongruent), and congruency(congruent and incongruent). Error rates constitutedthe main dependent variable of interest because RTswere highly constrained by our time-pressure procedure.Table 1 shows detailed data for all conditions.
The analysis of the error rates only considered re-sponses given within the deadline (18% rejected). TheANOVA showed a main effect of congruency (i.e., theconflict effect), F(1,18) = 80.07, p < .001, so that in-congruent targets induced higher error rates than con-gruent targets (Figure 2, top left).
A significant main effect of previous congruency,F(1,18) = 6.19, p = .023, revealed that fewer errorswere committed after an incongruent trial (18%) thanafter a congruent trial (20%). These two effects alsointeracted significantly leading to sequential effects2
(previous congruency by congruency), F(1,18) = 8.25,p = .01. Specifically, the conflict effect was smallerwhen the previous trial was incongruent (20%) ratherthan congruent (24%). Cueing also modulated the con-flict effect (cueing by congruency), F(1,18) = 12.75, p =.002, which was smaller on cued (19%) compared withneutral (25%) conditions. Follow-up analysis of incon-gruent targets showed that cueing conflict tended to re-duce error rates, especially when the previous trialwas congruent, F(1,18) = 3.49, p = .078 (see Figure 2,bottom left).
The RT analysis only considered responses that wereslower than 100 msec and within the deadline (14% re-jected). The main effect of congruency was significant,
F(1,18) = 53.1, p < .001, revealing slower responsesfor incongruent (296 msec) compared with congruent(261 msec) trials. The main effect of cueing was alsosignificant, F(1,18) = 26.41, p < .001; responses werefaster in valid versus neutral targets. The interaction be-tween previous congruency and congruency (sequen-tial effects) was only marginally significant, F(1,18) =2.92, p = .1, which may be due to the strong constraintsplaced upon speeded responses. The interaction be-tween cueing and congruency was significant, F(1,18) =15.1, p = .001, showing larger cueing effects on congru-ent versus incongruent trials (see also Gratton et al.,1992, Experiment 3). Most relevant, follow-up analysisof RTs in the incongruent condition revealed a signifi-cant effect of cueing, with faster RTs in cued (294 msec)versus neutral (299 msec) conflicting targets, F(1,18) =5.21, p = .035.
Combined, the analyses of error rates and RTs showthat that the anticipation of conflict can speed up andimprove the performance during conflict resolution. Fig-ure 2 (bottom) shows cueing benefits on both errors andRT to incongruent targets. The neural correlates of thisattentional improvement in conflict resolution were stud-ied by ERPs to the incongruent condition.
Electrophysiological Results
Target-locked ERPs
Figure 2 (top right) shows that congruent and incon-gruent targets were processed differently. Consistentwith previous research (Kopp et al., 1996), the fronto-central N2 was sensitive to different degrees of conflictbetween congruent and incongruent conditions despitebeing matched for stimulus frequency (50%). The con-flict effect was evident as a larger and later N2 for in-congruent compared with congruent targets, F(1,16) =7.93, p = .01.3 This electrophysiological correlate ofconflict processing was consistent with the conflict ef-fect observed on behavior. Once the conflict effect wasvalidated, the ERP analyses focused on incongruent tar-gets yielding correct responses. These analyses testedwhether processing of a conflicting stimulus was mod-ulated by cueing when sequential effects were controlled.
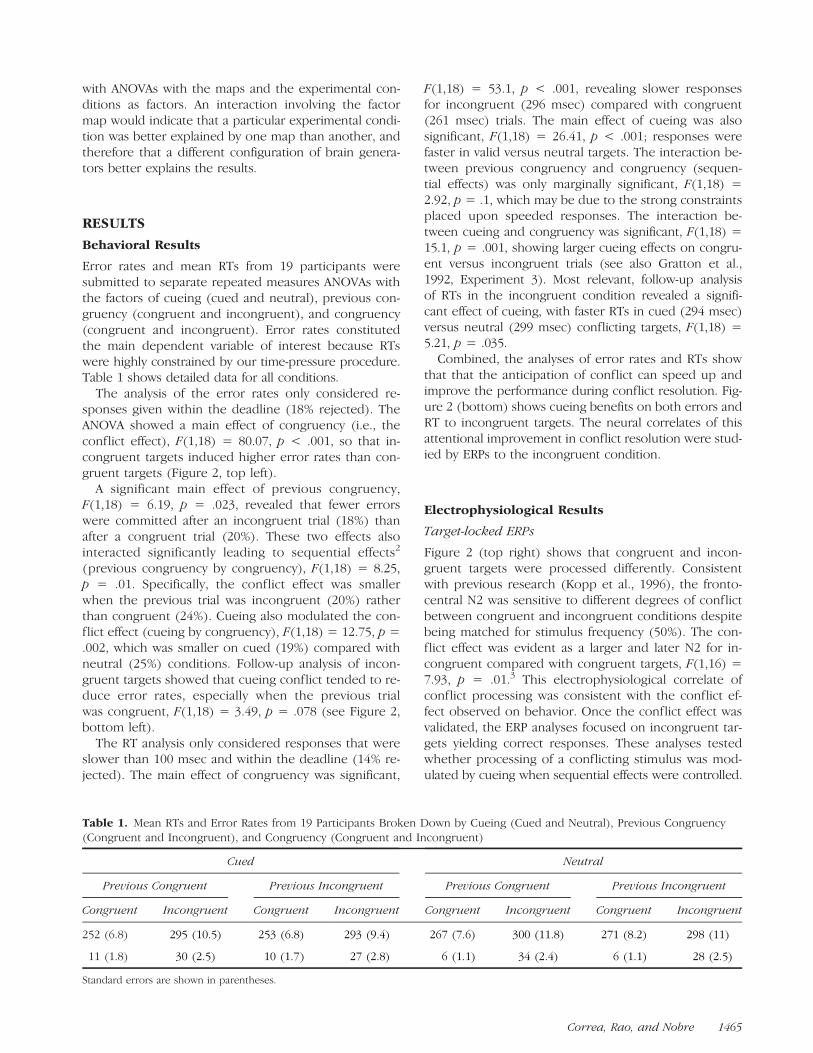
Table 1. Mean RTs and Error Rates from 19 Participants Broken Down by Cueing (Cued and Neutral), Previous Congruency(Congruent and Incongruent), and Congruency (Congruent and Incongruent)
Cued Neutral
Previous Congruent Previous Incongruent Previous Congruent Previous Incongruent
Congruent Incongruent Congruent Incongruent Congruent Incongruent Congruent Incongruent
252 (6.8) 295 (10.5) 253 (6.8) 293 (9.4) 267 (7.6) 300 (11.8) 271 (8.2) 298 (11)
11 (1.8) 30 (2.5) 10 (1.7) 27 (2.8) 6 (1.1) 34 (2.4) 6 (1.1) 28 (2.5)
Standard errors are shown in parentheses.
Correa, Rao, and Nobre 1465
The ANOVA performed on the mean amplitudes of theN2 showed an interaction between cueing and electrodeside, F(2,32) = 3.57, p = .04, and a further three-way in-teraction between cueing, previous congruency, and elec-trode side, F(2,32) = 3.30, p = .05. Together, these effectsdemonstrated that previous incongruent targets reliably
attenuated the N2 over right frontal electrodes (F4 andFC4), F(1,16) = 4.32, p = .05, but only in the absence ofpredictive cueing (i.e., on neutral conditions; see Figure 3,NII vs. NCI). The N2 appeared to be attenuated by cueingover left frontal electrodes, but this did not reach statis-tical significance (F3 and FC3), F(1,16) = 1.37, p = .26.
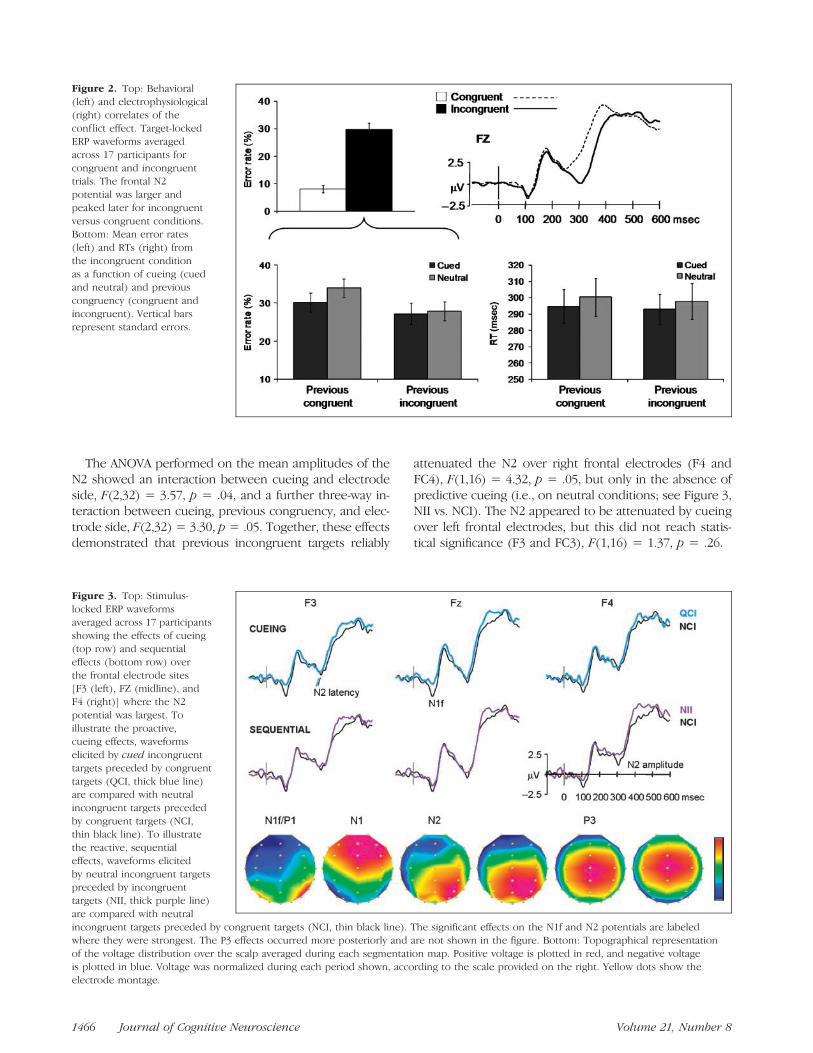
Figure 2. Top: Behavioral
(left) and electrophysiological
(right) correlates of the
conflict effect. Target-lockedERP waveforms averaged
across 17 participants for
congruent and incongruenttrials. The frontal N2
potential was larger and
peaked later for incongruent
versus congruent conditions.Bottom: Mean error rates
(left) and RTs (right) from
the incongruent condition
as a function of cueing (cuedand neutral) and previous
congruency (congruent and
incongruent). Vertical barsrepresent standard errors.
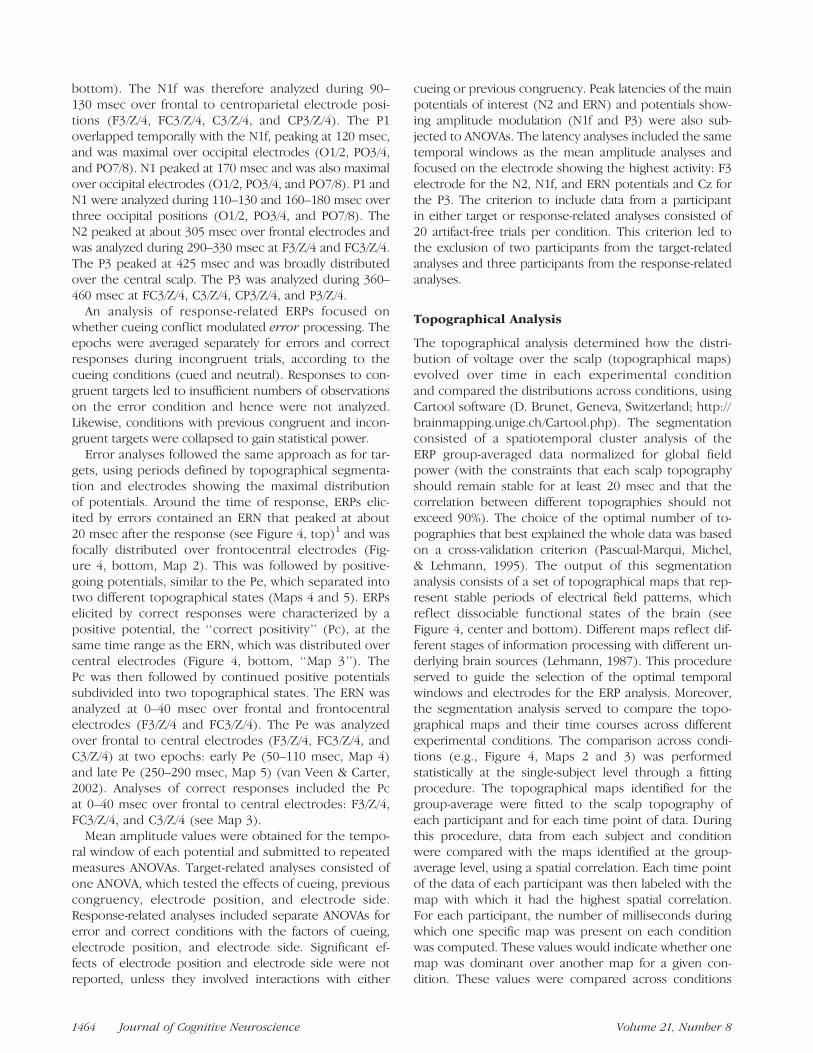
Figure 3. Top: Stimulus-
locked ERP waveforms
averaged across 17 participants
showing the effects of cueing(top row) and sequential
effects (bottom row) over
the frontal electrode sites[F3 (left), FZ (midline), and
F4 (right)] where the N2
potential was largest. To
illustrate the proactive,cueing effects, waveforms
elicited by cued incongruent
targets preceded by congruent
targets (QCI, thick blue line)are compared with neutral
incongruent targets preceded
by congruent targets (NCI,thin black line). To illustrate
the reactive, sequential
effects, waveforms elicited
by neutral incongruent targetspreceded by incongruent
targets (NII, thick purple line)
are compared with neutral
incongruent targets preceded by congruent targets (NCI, thin black line). The significant effects on the N1f and N2 potentials are labeledwhere they were strongest. The P3 effects occurred more posteriorly and are not shown in the figure. Bottom: Topographical representation
of the voltage distribution over the scalp averaged during each segmentation map. Positive voltage is plotted in red, and negative voltage
is plotted in blue. Voltage was normalized during each period shown, according to the scale provided on the right. Yellow dots show theelectrode montage.
1466 Journal of Cognitive Neuroscience Volume 21, Number 8
Crucially, the analysis of the N2 latency revealed a re-liable main effect of cueing, F(1,16) = 5.15, p = .04, suchthat the N2 peaked earlier for cued (303 msec) com-pared with neutral conditions (310 msec). Figure 3 (top)shows that the N2 peak and the subsequent rising oc-curred earlier for cued (QCI) versus neutral (NCI) con-ditions.4 In contrast to cueing, previous congruency didnot modulate the N2 latency (F < 1).
The analysis of the early N1f revealed a significant at-tenuation by cueing, F(1,16) = 4.42, p = .05. This maineffect was modulated by the congruency of the previoustrial (cueing by previous congruency), F(1,16) = 4.98, p =.04. When the previous trial was congruent, the N1f wasclearly attenuated by the cued condition (QCI) as com-pared with the neutral condition (NCI), F(1,16) = 8.27,p = .01 (Figure 3). When the previous trial was incon-gruent, the cueing effect was far from significant (F < 1).In contrast to cueing, previous congruency did not exerta main effect upon the N1f, F(1,16) < 1, in either cued(QII vs. NCI), F(1,16) = 1.66, p = .2, or neutral con-ditions (NII vs. NCI), F(1,16) = 1.08, p = .3. No sig-nificant main effects of cueing, previous congruency, orinteractions were observed for the latency of the N1fpotential (all Fs < 1).
The P1 potential showed a significant interaction be-tween cueing, previous congruency, and electrode po-sition, F(2,32) = 3.81, p = .03. When effects were testedat the separate electrode locations, however, the inter-action only approached a trend over electrodes PO3/4,F(1,16) = 2.83 p = .11, but remained clearly nonsignif-icant over O1/2 and PO7/8 ( ps > .2). The N1 analysisshowed no significant effects of cueing or previouscongruency (Fs < 1) or interactions ( ps > .1).
The P3 analysis also showed an interaction betweencueing and previous congruency, F(1,16) = 9.20, p = .01.When the previous trial was congruent, the P3 was en-hanced by cued rather than neutral conditions, F(1,16) =8.01, p = .01. When the previous trial was incongruent,the cueing effect was far from significant (F < 1). Analo-gously, previous congruency was only significant on neu-tral conditions, F(1,16) = 7.53, p = .01, rather than oncued conditions (F < 1). Both cueing and previous con-gruency effects consisted of an enhancement on the P3amplitude. Cueing also interacted with electrode positionand side, F(6,96) = 3.02, p = .01, revealing the largestcueing effect over the central left electrode (C3), F(1,16) =4.83, p = .04. The latency of the P3 potential was notmodulated by cueing, F(1,16) = 1.37, p = .26, or previouscongruency (F < 1).
Response-locked ERPs
Figure 4 (top) shows that errors elicited an ERN peak-ing shortly after the response (Map 2). The ANOVAshowed no effect of cueing on either ERN amplitude,F(1,15) < 1, or latency, F(1,15) < 1. The ERN was fol-
lowed by two positive peaks (early and late Pe, Maps 4and 5). The ANOVAs showed no effects of cueing onthe amplitudes of either early or late Pe, F(1,15) = 1.39,p = .26 and F(1,15) < 1, respectively.
Correct responses were associated with the Pc po-tential (Pc, Map 3), which was observed in the sametime range as the ERN on error conditions. The ampli-tude of the Pc was enhanced by cueing, F(1,15) = 14.28,p = .002. Following the Pc, the topographical seg-mentation (Figure 4, center) suggested that waveformselicited by correct responses contained the same two pos-itive potentials observed on error conditions but greatlyanticipated in time (100–150 msec earlier than in errorconditions).
Topographical Analysis of Response-locked ERPs
Topographical analyses were performed to test the fol-lowing two observations based on the morphology ofthe waveforms: (a) whether the ERN and the Pc haddifferent topographies associated to errors and correctresponses, respectively, and (b) whether the similari-ties in the two positive peaks after the ERN and thePc for errors and correct responses, respectively, corre-sponded to similar topographical distributions that wereoffset in time.
Figure 4 (center) shows the time course of the seg-mentation maps corresponding to stable voltage top-ographies, colored on the global field power waveform,for each of the four conditions. The progression of mapswas equivalent for all the conditions except during theperiod of the ERN and the Pc (Maps 2 and 3). Map 2 wasonly present on error conditions, whereas Map 3 wasonly present on correct responses. The topographicalrepresentation of these segments (Figure 4, bottom)showed a frontal negativity that was specific to Map 2but not Map 3, which was slightly lateralized to the lefthemisphere. In the group-averaged waveforms (Figure 4,top), this negativity corresponds to the ERN potentialthat was specifically observed on error conditions.
An ANOVA testing the preponderance of Maps 2 and3 across conditions between �100 and +60 msec con-firmed the difference in distribution for error versuscorrect trials. The interaction between response and to-pographical map was significant, F(1,15) = 26.12, p <.001. For errors, the ERN topography (Map 2) was signif-icantly dominant over Map 3 (65% of the entire 160-mstemporal window vs. 35%), t(15) = 2.1, p = .027, one-tailed. In contrast, for correct responses, Map 3 was sig-nificantly dominant over Map 2 (63% vs. 37%), t(15) =1.77, p = .048, one-tailed.
The maps after the ERN map (Maps 4–6) followed iden-tical sequences for both error and correct responses.The main difference consisted of Map 4 (early Pe) beingpresent for a longer duration on errors than on correctresponses. This visual impression was tested by ANOVAs
Correa, Rao, and Nobre 1467
testing the preponderance of Maps 4 and 5 for errorsand correct responses over three consecutive 80-msbins from 0 to 240 msec. The interaction between re-sponse, topographical map, and time bin was significant,F(2,30) = 7.58, p = .002. For errors, Map 4 was signifi-cantly dominant over Map 5 during the first time bin(77% vs. 23%), t(15) = 3.05, p = .004, one-tailed, andthe second bin (68% vs. 32%), t(15) = 2.04, p = .029,one-tailed, but not at the third bin (56% vs. 44%), t(15) =0.59, p = .28, one-tailed. In contrast, for correct re-
sponses, Map 4 was dominant over Map 5 during the firsttime bin only (80% vs. 20%), t(15) = 3.91, p < .001, one-tailed, but not at the second bin (60% vs. 40%), t(15) = 1,p = .18, one-tailed. At the third bin, the pattern reversedsignificantly, so that Map 5 was now dominant over Map 4(75% vs. 25%), t(15) = 2.24, p = .02, one-tailed, suggest-ing that the processing stage indexed by topographicalMap 4 was resolved at that time for correct responses. Inbrief, Map 4 remained for longer after errors (0–160 msec)than after correct responses (0–80 msec).
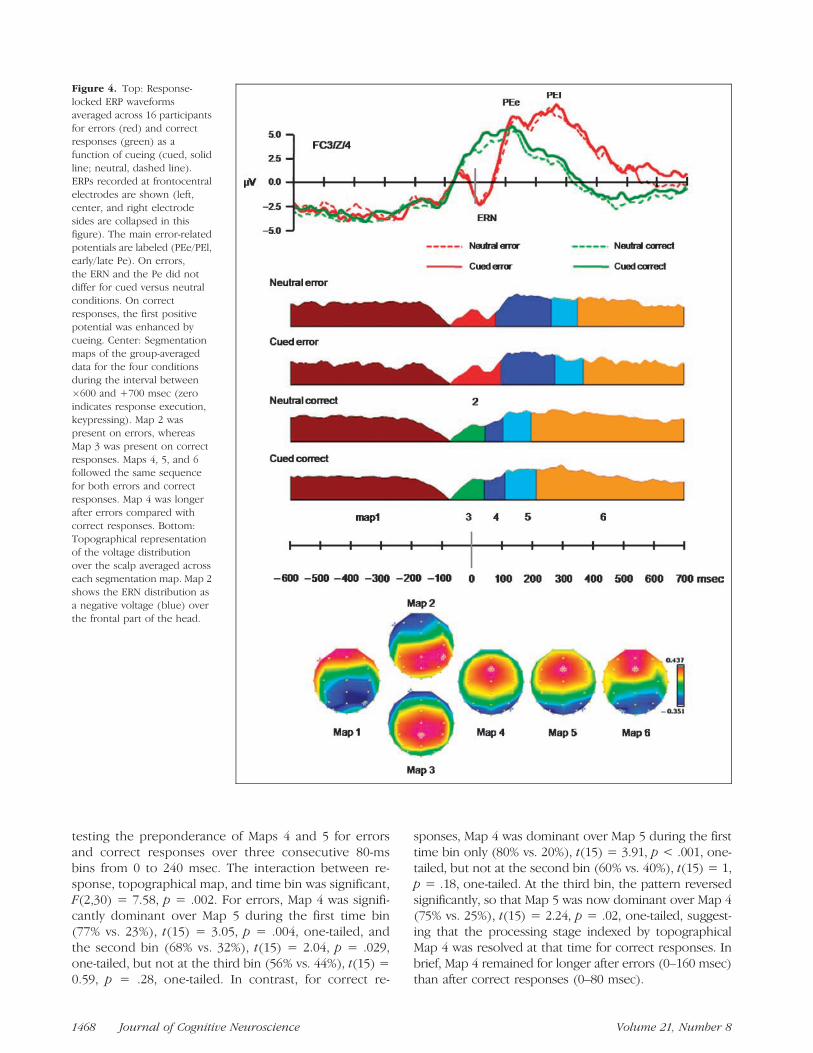
Figure 4. Top: Response-
locked ERP waveforms
averaged across 16 participants
for errors (red) and correctresponses (green) as a
function of cueing (cued, solid
line; neutral, dashed line).ERPs recorded at frontocentral
electrodes are shown (left,
center, and right electrode
sides are collapsed in thisfigure). The main error-related
potentials are labeled (PEe/PEl,
early/ late Pe). On errors,
the ERN and the Pe did notdiffer for cued versus neutral
conditions. On correct
responses, the first positivepotential was enhanced by
cueing. Center: Segmentation
maps of the group-averaged
data for the four conditionsduring the interval between
�600 and +700 msec (zero
indicates response execution,
keypressing). Map 2 waspresent on errors, whereas
Map 3 was present on correct
responses. Maps 4, 5, and 6followed the same sequence
for both errors and correct
responses. Map 4 was longer
after errors compared withcorrect responses. Bottom:
Topographical representation
of the voltage distribution
over the scalp averaged acrosseach segmentation map. Map 2
shows the ERN distribution as
a negative voltage (blue) over
the frontal part of the head.
1468 Journal of Cognitive Neuroscience Volume 21, Number 8
DISCUSSION
Modulation of Conflict Processing by Proactiveand Reactive Control
The analysis of behavioral performance confirmed thatboth proactive and reactive control effectively facilitatedconflict resolution. This facilitation was also reflected inERP measures. The main finding showed that proactivecueing altered the time course of conflict processing.
We expected proactive anticipation of conflict to en-gage increased top–down control, hence to facilitateconflict detection, as indexed by the N2 potential. Thehigh temporal resolution of ERPs was critical to un-cover that proactive control enhanced on-line conflictprocessing by reducing the latency of the N2. Thisnovel finding reveals the ability to prepare for conflictbased on predictive information. More generally, thisfinding confirms that top–down attention is not onlyconstrained to cued physical attributes of forthcomingstimuli and responses (for a review, see Nobre, 2004).Rather, in the present study, cueing prompted the an-ticipation of conflict and the need to engage the con-trol system for cautious stimulus-response selection.As a result, conflict was detected and resolved morerapidly. The rapid detection of conflict was particularlyuseful under the task parameters of the current exper-iment, which imposed very high temporal pressure forresponding. When more deliberate processing is possi-ble under normal conditions of time pressure (beingall the remaining task parameters identical to the cur-rent experiment), the effects of proactive cueing of con-flict may become less conspicuous (A. Correa, A. Rao,J. Lupianez, and A. C. Nobre, unpublished observations).
The temporal modulation of conflict detection by pro-active control had remained unnoticed so far. Hemody-namic neuroimaging studies have provided unclear results,probably because the technique is highly insensitive toshort-lived or latency effects. During the anticipatory in-terval, increments in ACC activation have been observedin some studies (Sohn et al., 2007; Luks et al., 2002)but not others (Luks et al., 2007; Fassbender et al., 2006;MacDonald, Cohen, Stenger, & Carter, 2000). Duringconflict processing, decrements in ACC activation selec-tively related to cued conditions have been observed insome studies (Luks et al., 2007; Sohn et al., 2007) butnot others (Fassbender et al., 2006; Luks et al., 2002).The inconsistency of the fMRI results has then precludedestablishing strong conclusions about the role of ACCin anticipatory conflict monitoring. Importantly, however,the present ERP results strongly suggest that conflict pro-cessing can be anticipated. As recently suggested, thisanticipatory mechanism may be mediated by preactiva-tion of ACC during the preparatory interval (Sohn et al.,2007).
An additional explanation for the absence of proac-tive modulations upon ACC activity considers that theprevious studies cueing conflict did not control for se-
quential effects. It is possible that proactive cueing couldnot attenuate ACC activity further when it was alreadyattenuated by reactive control. Therefore, this possibil-ity assumes that proactive and reactive control involvecommon or interacting neural mechanisms. To our knowl-edge, the current study is the first to test this assumptionby comparing neural modulation resulting from bothtypes of control directly. The temporally rich dependentvariables provided by ERPs were able to identify particu-lar stages during which proactive and reactive controlinteract. From early through late neural target process-ing, proactive control was most effective under low reac-tive control. Specifically, the attenuation of the early N1fby cueing was stronger after congruent versus incongruenttrials and the amplification of the late P3 was only signifi-cant after congruent trials. Analogously, reactive controlwas only effective in the absence of proactive control: N2attenuation and P3 amplification by previous conflict wereonly significant on neutral versus cued conditions. Theseinteractions suggest neural overlap or crosstalk betweenthe control networks triggered by proactive and reactivesignals.
The overlap between proactive and reactive controlwas only partial, however: Each modulated conflict pro-cessing with distinct time courses and spatial distribu-tions. The anticipatory effects of proactive control uponconflict processing started early (frontal N1 at 110 msec)5
and later became lateralized to the left hemisphere (P3).In contrast, the effects of reactive control started later(N2) and were lateralized to the right. Moreover, the N2latency was selectively reduced by cueing, thus illustratingthe proactive nature of this type of control over morereactive sequential effects. Overall, these findings wouldsuggest multiple rather than a single control mechanism,although such differences could be specific to our exper-imental procedure. For example, signals for reactive ver-sus proactive control took place at different times, whichcould have led to differential modulations of processing.Further research will be useful to clarify whether neuralmechanisms subserving reactive and proactive control canbe more clearly dissociated.
Our results regarding reactive control are consistentwith neuroimaging research showing that incrementsin ACC activity on incongruent conditions correlate withsubsequent reductions of ACC activity and behavioralconflict (for a review, see Botvinick, Cohen, & Carter,2004; Durston et al., 2003), even when repetition primingeffects are controlled (Notebaert, Gevers, Verbruggen, &Liefooghe, 2006; Kerns et al., 2004; see also Ullspergeret al., 2005; but see Nieuwenhuis et al., 2006; Mayr,Awh, & Laurey, 2003). Previous ERP studies control-ling for priming effects have provided mixed results. Inone case, the sequential modulation of conflict-relatedprocessing survived (Scerif, Worden, Davidson, Seiger,& Casey, 2006), but in another case it was abolished(Wendt, Heldmann, Munte, & Kluwe, 2007). Our behav-ioral analysis showed that priming did not account for
Correa, Rao, and Nobre 1469
the reductions in conflict effect exerted by either proac-tive or reactive control. Nevertheless, because we had in-sufficient trials to confirm our ERP results after controllingfor stimulus-response repetitions, these must be takenwith caution.
Electrophysiological Correlates ofError Processing
Assuming that the ERN reflects ACC activity related toresponse-related conflict (Botvinick et al., 2004) or errordetection (Debener et al., 2005), we hypothesized thatthe anticipation of error in conflict trials would modu-late the ERN. Unexpectedly, we observed no modulationof the ERN. In light of the strong interactions betweencueing and sequential effects we observed in the analysisof target-related processing, it is possible that modula-tion of the ERN would be detectable in conditions of lowreactive control. However, due to an insufficient num-ber of error trials in the different conditions of previouscongruency, this possibility could not be tested here.
The analysis of map topographies revealed that theERN was specific to trials with incorrect responses, rep-licating earlier studies (Gehring et al., 1993; Falkensteinet al., 1990). The absence of the typical ERN topogra-phy on ‘‘correct’’ conditions replicates previous research(e.g., Ullsperger, von Cramon, & Muller, 2002) but con-trasts with reports of the so-called ‘‘correct responsenegativity’’ (Bartholow et al., 2005; Falkenstein et al.,2000; Vidal, Hasbroucq, Grapperon, & Bonnet, 2000).The current topographical analysis showed that theERPs associated with errors and correct responses weregenerated by differing configuration of neural sourcesrather than differing only in the overall strength of theiractivation.
Rather surprisingly, the topographical analysis furtherrevealed that, following the ERN, the stages of neuralprocessing in error trials were equivalent to those incorrect trials, although protracted in time. This find-ing questions the specificity of the Pe potential to errorprocessing (Falkenstein et al., 1990, 2000). Our findingssuggest instead that a common late stage of postre-sponse processing is achieved in both correct and errortrials (e.g., contextual updating), but that the conflictand/or error detection delays the onset of this stage inerror trials.
In summary, proactive control based on the anticipa-tion of conflict significantly modulated subsequent tar-get processing and did so through neural mechanismsthat interacted with reactive control based on sequentialeffects. The effects of proactive control were maximalwhen controlled stimulus-response selection was not al-ready engaged by reactive signals coming from conflictin the previous trial. The present findings suggest thatanticipating conflict enhances cognitive control by speed-ing up conflict detection and resolution.
Acknowledgments
This research was supported by the Spanish Ministerio deEducacion y Cultura with postdoctoral grants (EX-2005-1028and RYC-2007-00296) to A. C. and by an award from the JamesS. McDonnell Foundation to A. C. N.
Reprint requests should be sent to Angel Correa, Departa-mento de Psicologıa Experimental y Fisiologıa del Comporta-miento, Campus Universitario de Cartuja s/n, 18011, Granada,Spain, or via e-mail: [email protected].
Notes
1. The use of a standard keyboard as response device mayhave delayed (and jittered) the registration of the responseevent, which might explain the unusually short apparent laten-cies (and amplitudes) observed for the ERN.2. Given the controversy on whether sequential effects re-flect top–down conflict monitoring (Notebaert et al., 2006;Ullsperger et al., 2005; Kerns et al., 2004) or bottom–up prim-ing effects due to stimulus-response repetitions (Nieuwenhuiset al., 2006; Mayr et al., 2003), the influence of priming wastested by including ‘‘repetition’’ as a within-subjects factor(e.g., Mayr et al., 2003). Repetition exerted no influence oneither the Cueing � Congruency interaction (F < 1) or thePrevious congruency � Congruency interaction, F(1,18) = 1.27,p = .27. In light of this null effect and because of restricted trialnumbers, this variable was not analyzed further in the ERPanalyses.3. Note that Figure 2 shows the N2 peaking at about 250 msecfor congruent targets, thus falling outside the time windowused in the analysis. In any case, the conflict effect was clearlyreliable for a broader time window of 240–300 msec includingboth incongruent and congruent N2 peaks [mean amplitudeeffect: F(1,16) = 11.05, p = .004].4. It could be argued that this latency difference may havedetermined the mean amplitude results. A peak amplitudeanalysis was performed on the N2, which replicated the meanamplitude data. This analysis replicated the significant inter-action between cueing and electrode side, F(2,32) = 4.06, p =.027, and the three-way interaction between cueing, previouscongruency, and electrode side, F(2,32) = 3.19, p = .055,which showed that sequential effects attenuated the N2 peakamplitude over right frontal electrodes under neutral cueingconditions (mean peak amplitudes: 1.33 AV for previous con-gruent vs. 2.61 AV for previous incongruent), F(1,16) = 5.10,p = .038.5. The early N1f potential has not been specifically associatedwith conflict processing. However, the attentional modula-tion observed here is reminiscent of ERP studies on attentionand emotion, which reported attenuation of the anterior N1when fearful faces were attended (e.g., Holmes, Vuilleumier,& Eimer, 2003). Hence, it might be that our N1f was reflect-ing emotional processing in reaction to conflict and/or theprediction of error.
REFERENCES
AEEGS. (1991). American Electroencephalographic Society(AEEGS) guidelines for standard electrode positionnomenclature. Journal of Clinical Neurophysiology,8, 200–202.
Atkinson, R., & Shiffrin, R. (1968). Human memory: Aproposed system and its control processes. In K. Spence& J. Spence (Eds.), The psychology of learning and
1470 Journal of Cognitive Neuroscience Volume 21, Number 8
motivation: Advances in research and theory (Vol. 2,pp. 742–775). New York: Academic Press.
Bartholow, B. D., Pearson, M. A., Dickter, C. L., Sher, K. J.,Fabiani, M., & Gratton, G. (2005). Strategic control andmedial frontal negativity: Beyond errors and responseconflict. Psychophysiology, 42, 33–42.
Botvinick, M. M., Braver, T. S., Barch, D. M., Carter, C. S.,& Cohen, J. D. (2001). Conflict monitoring and cognitivecontrol. Psychological Review, 108, 624–652.
Botvinick, M. M., Cohen, J. D., & Carter, C. S. (2004).Conflict monitoring and anterior cingulate cortex:An update. Trends in Cognitive Sciences, 8, 539–546.
Botvinick, M. M., Nystrom, L. E., Fissell, K., Carter, C. S.,& Cohen, J. D. (1999). Conflict monitoring versusselection-for-action in anterior cingulate cortex. Nature,402, 179–181.
Debener, S., Ullsperger, M., Siegel, M., Fiehler, K., vonCramon, D. Y., & Engel, A. K. (2005). Trial-by-trialcoupling of concurrent electroencephalogram andfunctional magnetic resonance imaging identifies thedynamics of performance monitoring. Journal ofNeuroscience, 25, 11730–11737.
Durston, S., Davidson, M. C., Thomas, K. M., Worden, M. S.,Tottenham, N., Martinez, A., et al. (2003). Parametricmanipulation of conflict and response competition usingrapid mixed-trial event-related fMRI. Neuroimage, 20,2135–2141.
Eriksen, B. A., & Eriksen, C. W. (1974). Effects of noiseletters upon the identification of a target letter in anonsearch task. Perception and Psychophysics, 16,143–149.
Falkenstein, M., Hohnsbein, J., Hoormann, J., & Blanke, L.(1990). Effects of errors in choice reaction tasks on theERP under focused and divided attention. In C. H. M. Brunia,A. W. K. Gaillard, & A. Kok (Eds.), Psychophysiologicalbrain research 1990 (pp. 192–195). Tilburg: TilburgUniversity Press.
Falkenstein, M., Hoormann, J., Christ, S., & Hohnsbein, J.(2000). ERP components on reaction errors and theirfunctional significance: A tutorial. Biological Psychology,51, 87–107.
Fassbender, C., Foxe, J. J., & Garavan, H. (2006). Mappingthe functional anatomy of task preparation: Primingtask-appropriate brain networks. Human Brain Mapping,27, 819–827.
Gehring, W. J., Goss, B., Coles, M. G. H., Meyer, D. E., &Donchin, E. (1993). A neural system for error detectionand compensation. Psychological Science, 4, 385–390.
Gratton, G., Coles, M. G., & Donchin, E. (1992). Optimizingthe use of information: Strategic control of activation ofresponses. Journal of Experimental Psychology: General,121, 480–506.
Holmes, A., Vuilleumier, P., & Eimer, M. (2003). The processingof emotional facial expression is gated by spatial attention:Evidence from event-related brain potentials. CognitiveBrain Research, 16, 174–184.
Kahneman, D. (1973). Attention and effort. London:Prentice Hall.
Kastner, S., & Ungerleider, L. G. (2000). Mechanisms ofvisual attention in the human cortex. Annual Reviewof Neuroscience, 23, 315–341.
Kerns, J. G., Cohen, J. D., MacDonald, A. W., III, Cho, R. Y.,Stenger, V. A., & Carter, C. S. (2004). Anterior cingulateconflict monitoring and adjustments in control. Science,303, 1023–1026.
Kopp, B., Rist, F., & Mattler, U. (1996). N200 in the flankertask as a neurobehavioral tool for investigating executivecontrol. Psychophysiology, 33, 282–294.
Lehmann, D. (1987). Principles of spatial analyses. InA. S. Gevins & A. Remond (Eds.), Handbook ofelectroencephalography and clinical neurophysiology:Methods of analysis of brain electrical and magneticsignals (Vol. 1, pp. 309–354). Amsterdam: Elsevier.
Logan, G. D., & Zbrodoff, N. J. (1982). Constraints onstrategy construction in a speeded discriminationtask. Journal of Experimental Psychology: HumanPerception and Performance, 8, 502–520.
Luks, T. L., Simpson, G. V., Dale, C. L., & Hough, M. G.(2007). Preparatory allocation of attention andadjustments in conflict processing. Neuroimage, 35,949–958.
Luks, T. L., Simpson, G. V., Feiwell, R. J., & Miller, W. L.(2002). Evidence for anterior cingulate cortex involvementin monitoring preparatory attentional set. Neuroimage,17, 792–802.
MacDonald, A. W., Cohen, J. D., Stenger, V. A., & Carter, C. S.(2000). Dissociating the role of the dorsolateral prefrontaland anterior cingulate cortex in cognitive control. Science,288, 1835–1838.
Mayr, U., Awh, E., & Laurey, P. (2003). Conflict adaptationeffects in the absence of executive control. NatureNeuroscience, 6, 450–452.
Monsell, S. (2003). Task switching. Trends in CognitiveSciences, 7, 134–140.
Muller, H. J., & Rabbitt, P. M. (1989). Reflexive and voluntaryorienting of visual attention: Time course of activationand resistance to interruption. Journal of ExperimentalPsychology: Human Perception and Performance, 15,315–330.
Nieuwenhuis, S., Stins, J. F., Posthuma, D., Polderman, T. J.,Boomsma, D. I., & de Geus, E. J. (2006). Accountingfor sequential trial effects in the flanker task: Conflictadaptation or associative priming? Memory andCognition, 34, 1260–1272.
Nobre, A. C. (2004). Probing the flexibility of attentionalorienting in the human brain. In M. I. Posner (Ed.),Cognitive neuroscience of attention (pp. 157–179).New York: Guilford Press.
Norman, D. A., & Shallice, T. (1986). Attention to action:Willed and automatic control of behaviour. In R. J. Davidson,G. E. Schwartz, & D. Shapiro (Eds.), Consciousnessand self-regulation: Advances in research and theory(pp. 1–18). New York: Plenum Press.
Notebaert, W., Gevers, W., Verbruggen, F., & Liefooghe, B.(2006). Top–down and bottom–up sequential modulationsof congruency effects. Psychonomic Bulletin and Review,13, 112–117.
Pascual-Marqui, R. D., Michel, C. M., & Lehmann, D. (1995).Segmentation of brain electrical activity into microstates:Model estimation and validation. IEEE Transactions onBiomedical Engineering, 42, 658–665.
Rabbitt, P. M. A. (1966). Errors and error correction in choicereaction tasks. Journal of Experimental Psychology, 71,264–272.
Ridderinkhof, K. R., Ullsperger, M., Crone, E. A., &Nieuwenhuis, S. (2004). The role of the medial frontalcortex in cognitive control. Science, 306, 443–447.
Scerif, G., Worden, M. S., Davidson, M., Seiger, L., & Casey,B. J. (2006). Context modulates early stimulus processingwhen resolving stimulus-response conflict. Journal ofCognitive Neuroscience, 18, 781–792.
Sohn, M. H., Albert, M. V., Jung, K., Carter, C. S., &Anderson, J. R. (2007). Anticipation of conflict monitoringin the anterior cingulate cortex and the prefrontal cortex.Proceedings of the National Academy of Sciences, U.S.A.,104, 10330–10334.
Correa, Rao, and Nobre 1471
Stroop, J. R. (1935). Studies of interference in serial verbalreactions. Journal of Experimental Psychology, 18,643–662.
Ullsperger, M., Bylsma, L. M., & Botvinick, M. M. (2005).The conflict adaptation effect: It’s not just priming.Cognitive, Affective, and Behavioral Neuroscience, 5,467–472.
Ullsperger, M., von Cramon, D. Y., & Muller, N. G.(2002). Interactions of focal cortical lesions with errorprocessing: Evidence from event-related brain potentials.Neuropsychology, 16, 548–561.
van Veen, V., & Carter, C. S. (2002). The timing ofaction-monitoring processes in the anterior cingulatecortex. Journal of Cognitive Neuroscience, 14, 593–602.
Vidal, F., Hasbroucq, T., Grapperon, J., & Bonnet, M. (2000).Is the ‘‘error negativity’’ specific to errors? BiologicalPsychology, 51, 109–128.
Wendt, M., Heldmann, M., Munte, T. F., & Kluwe, R. H.(2007). Disentangling sequential effects of stimulus- andresponse-related conflict and stimulus-response repetitionusing brain potentials. Journal of Cognitive Neuroscience,19, 1104–1112.
1472 Journal of Cognitive Neuroscience Volume 21, Number 8


