Embed Size (px)
Citation preview
Exp Astron (2011) 30:59–81DOI 10.1007/s10686-011-9220-y
ORIGINAL ARTICLE
Apodized Lyot coronagraph for SPHERE/VLT: II.Laboratory tests and performance
Géraldine Guerri · Jean-Baptiste Daban · Sylvie Robbe-Dubois ·Richard Douet · Lyu Abe · Jacques Baudrand · Marcel Carbillet ·Anthony Boccaletti · Philippe Bendjoya · Carole Gouvret · Farrokh Vakili
Received: 5 October 2010 / Accepted: 4 March 2011 / Published online: 24 March 2011© Springer Science+Business Media B.V. 2011
Abstract SPHERE (which stands for Spectro-Polarimetric High-contrast Ex-oplanet REsearch) is a second-generation Very Large Telescope (VLT) in-strument dedicated to high-contrast direct imaging of exoplanets whose first-light is scheduled for 2011. Within this complex instrument one of the centralcomponents is the apodized Lyot coronagraph (ALC). The principal aim ofthis paper is to report the first laboratory experiment of the ALC designedfor the SPHERE instrument. The performance and sensitivity of the opticalconfiguration was first numerically studied with an end-to-end approach (seethe results in paper I subtitled “Detailed numerical study”). Made confidentby the results, we then tested a prototype on an infrared coronagraphic bench.We measured the transmission profiles of the apodizer prototype and thecoronagraphic performance of the apodized Lyot coronagraph in Y, J, and Hbands. The coronagraph sensitivity to lateral and longitudinal misalignmentsof its three main components (apodizer, coronagraphic mask and Lyot stop)was finally studied in H band. We can conclude that the prototype meets theSPHERE technical requirements for coronagraphy.
G. Guerri (B) · J.-B. Daban · S. Robbe-Dubois · R. Douet · L. Abe · M. Carbillet ·P. Bendjoya · C. Gouvret · F. VakiliUMR 6525 H. Fizeau, Université Nice Sophia Antipolis/CNRS/Observatoire de la Côted’Azur, Parc Valrose, 06108 Nice cedex 2, Francee-mail: [email protected]
J. Baudrand · A. BoccalettiUMR 8109 LESIA, Observatoire de Meudon/CNRS, 5 Place J. Janssen,92195 Meudon, France
Present Address:G. GuerriDépartement d’Astrophysique, Géophysique et Océanographie, Centre Spatial de Liège,Avenue Pré-Aily, 4031 Angleur, Belgique

60 Exp Astron (2011) 30:59–81
Keywords Stellar coronagraphy · Apodized Lyot coronagraph · SPHERE ·Laboratory tests
1 Introduction
The main goal of the second-generation Very Large Telescope (VLT) instru-ment SPHERE (Spectro-Polarimetric High-contrast Exoplanet REsearch—Beuzit et al. [4]) being to achieve direct imaging of exoplanets with a possiblefirst spectral characterization, coronagraphy is almost mandatory. A number ofconcepts have been proposed these last years with very exciting developmentsin the field of stellar coronagraphy. In the framework of SPHERE and asa result of its preliminary studies, the four-quadrant phase mask Rouanet al. [18] in one hand, and the apodized Lyot coronagraph (ALC—Aimeet al. [2]) in the other hand, have been chosen (in addition to the classical Lyotcoronagraph). A first article, subtitled “Detailed numerical study”, underlinesthe most interesting aspects of the whole end-to-end numerical studies we haveachieved during the design of the ALC for SPHERE/VLT. The present paperreports on the laboratory experiments and tests performed for the ALC forSPHERE/VLT.
The purpose of this paper is twofold.After having briefly recalled the principle of the ALC in Section 2, we de-
scribe in Section 3 the experimental setup of the coronagraphic testbed we usedto test the ALC, i.e. the infrared (IR) coronagraphic bench of the Laboratoired’Etudes Spatiales et d’Instrumentation en Astrophysique (LESIA) at ParisObservatory. Section 4 deals with the detailed characteristics of the three maincomponents of the ALC prototype tested: apodizer, coronagraphic mask, andLyot stop.
Then, we present in Section 5 the laboratory tests of the ALC prototype.They concern measurements of the apodizer transmission profile and of theALC coronagraphic performances in Y, J and H bands, and also the study ofthe ALC sensitivity to lateral and longitudinal misalignment of its componentsin H band.
2 Principle of the Apodized Lyot coronagraph
2.1 Preliminary
Bernard Lyot introduced in 1930 the principle of the classical Lyot coro-nagraph (Lyot [14]). Unfortunately, the achieved contrast is not sufficientenough to image an exoplanet at the level of 10−6 flux contrast. In thiscontext, Soummer and Aime [19] proposed a dramatic improvement with theprinciple of the prolate Apodized Lyot Coronagraph. In Fig. 1, we presentthe principle of the Apodized Lyot Coronagraph (ALC) adapted to our study,i.e. the ALC designed for SPHERE. In this figure, we can see that, because

Exp Astron (2011) 30:59–81 61
Fig. 1 Principle of SPHERE Apodized Lyot Coronagraph: a entrance pupil, b apodizer, c pointspread function (PSF) at the focus of the telescope, d PSF when the Lyot occulting coronagraphicmask is settled, e pupil image before the Lyot stop introduction, f Lyot stop, g Pupil image with theLyot stop, h final coronagraphic PSF (the contrast scale has been enhanced for better visibility)
the VLT entrance pupil is not a simple circular aperture and has a centralobscuration and four spiders, the apodizer transmission function has a bagelshape (Soummer [20], Carbillet et al. [8]). Furthermore, the best coronagraphicperformance is obtained, in the theory, when the Lyot stop has the same shapeas the entrance pupil one.
2.2 Overview of apodizer manufacturing techniques
Apodizing masks have been commonly used in optics for 20 years, for instancefor laser beam shaping. However, the shape of the transmission profiles and thetolerance bounds are totally different and less constraining than those neededto perform astronomical high dynamic range imaging. That is why one of theALC critical realization point is the manufacturing of the apodizer. Severalworldwide institutes are currently testing various apodization techniques: wecan cite for instance thin layer deposition, ion implantation, HEBS™glass(Canyon Materials, Soummer et al. [21], Abe et al. [1]) or use of a Mach-Zehnder interferometer (Carlotti et al. [9]). The main challenge is to obtainan apodizer that meets as much as possible the strong specifications and whichintroduces the lowest wavefront errors.

62 Exp Astron (2011) 30:59–81
Fig. 2 Optical setup of the IR bench (Boccaletti et al. [6])
3 Experimental setup of the IR bench
Figure 2 shows the optical setup of the IR bench (Boccaletti et al. [6]) atLESIA. This bench was designed to test the coronagraph prototypes whichwill be mounted on the SPHERE instrument: the Half Wave—Four QuadrantPhase Mask (HW-4QPM—Mawet et al. [17], Boccaletti et al. [5]) developpedby the LESIA and the Apodized Lyot Coronagraph (ALC) we are currentlydevelopping. This bench mimics the optical conditions of SPHERE: theaperture ratio is F/40 which leads to an entrance pupil diameter of 18 mm.The optical design is achromatic and very stigmatic owing to an all reflectiveassembly based on an off-axis parabola. The estimated Strehl Ratio is about97%. The available artificial light source is a polychromatic pigtailed super-continuum source delivering a large flat spectrum from visible to near-IR. Theoutput radiation is singlemode from 0.45 μm to 2.5 μm with a mean opticalpower of 1 mW/nm. In addition, several spectral filters are available. Table 1
Table 1 Spectral filters characteristics
Band Central λ (μm) FWHM value (nm) Peak transmission (%)
Y 1.063 52 (R = 20) 88J 1.191 41 (R = 30) 85H 1.68 240 (R = 7) 55
FWHM stands for full width at half-maximum
Exp Astron (2011) 30:59–81 63
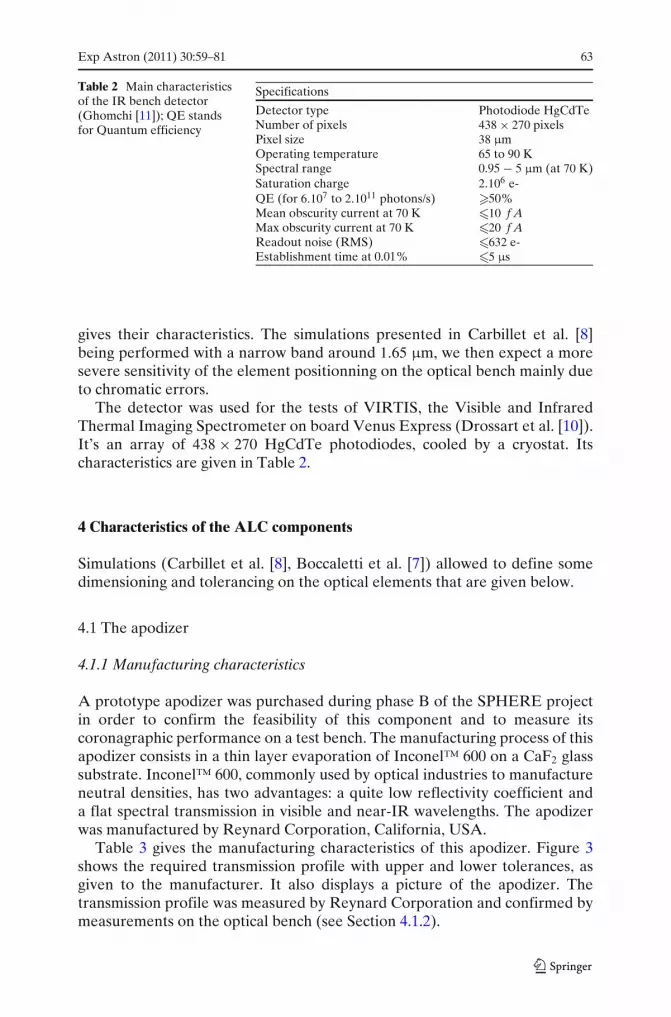
Table 2 Main characteristicsof the IR bench detector(Ghomchi [11]); QE standsfor Quantum efficiency
Specifications
Detector type Photodiode HgCdTeNumber of pixels 438 × 270 pixelsPixel size 38 μmOperating temperature 65 to 90 KSpectral range 0.95 − 5 μm (at 70 K)Saturation charge 2.106 e-QE (for 6.107 to 2.1011 photons/s) �50%Mean obscurity current at 70 K �10 f AMax obscurity current at 70 K �20 f AReadout noise (RMS) �632 e-Establishment time at 0.01% �5 μs
gives their characteristics. The simulations presented in Carbillet et al. [8]being performed with a narrow band around 1.65 μm, we then expect a moresevere sensitivity of the element positionning on the optical bench mainly dueto chromatic errors.
The detector was used for the tests of VIRTIS, the Visible and InfraredThermal Imaging Spectrometer on board Venus Express (Drossart et al. [10]).It’s an array of 438 × 270 HgCdTe photodiodes, cooled by a cryostat. Itscharacteristics are given in Table 2.
4 Characteristics of the ALC components
Simulations (Carbillet et al. [8], Boccaletti et al. [7]) allowed to define somedimensioning and tolerancing on the optical elements that are given below.
4.1 The apodizer
4.1.1 Manufacturing characteristics
A prototype apodizer was purchased during phase B of the SPHERE projectin order to confirm the feasibility of this component and to measure itscoronagraphic performance on a test bench. The manufacturing process of thisapodizer consists in a thin layer evaporation of Inconel™ 600 on a CaF2 glasssubstrate. Inconel™ 600, commonly used by optical industries to manufactureneutral densities, has two advantages: a quite low reflectivity coefficient anda flat spectral transmission in visible and near-IR wavelengths. The apodizerwas manufactured by Reynard Corporation, California, USA.
Table 3 gives the manufacturing characteristics of this apodizer. Figure 3shows the required transmission profile with upper and lower tolerances, asgiven to the manufacturer. It also displays a picture of the apodizer. Thetransmission profile was measured by Reynard Corporation and confirmed bymeasurements on the optical bench (see Section 4.1.2).

64 Exp Astron (2011) 30:59–81
Table 3 Manufacturingcharacteristics of the apodizer
OD: outer diameter; ID: innerdiameter
Characteristics
Spectral range 950–2320 nmSize: OD of the Inconel layer 19.8 ± 0.1 mm
ID of the Inconel layer 1.0 ± 0.05 mmProfile: circular symmetry ±5%
transmission See Fig. 3Outside diameter of the substrate 30 ± 0.1 mmThickness of the substrate 4 ± 0.1 mmScratch/dig 10/5Optical surface quality λ/10 PTV @ 633 nmParallelism <5 arcsecMaterial CaF2Coating material Inconel 600Anti-reflection coating R < 1% for 950–2320 nm
4.1.2 Apodizer transmission measurement
The principle of the measurement is to acquire pupil images with and withoutapodizer, called respectively apodized and reference images. After a darksubtraction, a long exposure is generated for both pupil image types. Then,the apodized long exposure is divided by the reference one in order to avoidthe inhomogenous illumination of the reference pupil. The radial transmissionvalues of the apodizer are finally computed from this divided long exposureimage.
Figure 4 shows an example of a reference and an apodized long exposurepupil image obtained in H band. Both long exposures are obtained by co-adding 50 snapshots of a 2-ms exposure time. In the pupil images, we can notetwo main defects that are taken into account in the data processing: firstly, bad
0 2 4 6 8 10 12 14 16 18 200
10
20
30
40
50
60
70
80
90
100
Distance (mm)
Tran
smis
sion
(%
)
Transmission profile targetTransmission lower toleranceTransmission upper tolerance
Fig. 3 Specification on the transmission profile of the apodizer. Note that the central transparentarea of the apodizer was designed to be used during the alignment procedure, but has no effecton the performance during the observations as it corresponds to the telescope central obstruction.Right: picture of the apodizer

Exp Astron (2011) 30:59–81 65
Fig. 4 2D (left) and 3D(right) views of longexposures in H band: (top)reference and (bottom)apodized images (integrationtime = 2 ms; images size =128 × 128 pixels; pixel scale =100 μm; intensity normalizedto unity)
pixels of the detector are visible and we can also see in the 3-D images that thepupil is not perfectly uniformly illuminated.
Figure 5 shows the radial mean profile of the divided image in Y, J, andH bands, as measured on the optical bench and compared to the theoreticaltolerances.
These transmission profile measurements fit quite well the measurementscarried out by Reynard Corp. itself. However, the three profiles are out of
0 1 2 3 4 5 6 7 8 9 100
0.1
0.2
0.3
0.4
0.5
0.6
0.7
0.8
0.9
1
Distance from center (mm)
Ave
rage
nor
mal
ised
rad
ial t
rans
mis
sion
pro
files
H filter measured profileJ filter measured profileY filter measured profileTransmission lower toleranceTransmission upper toleranceCentral Obscuration
Fig. 5 Transmission profiles of the apodizer in Y, J, and H bands, compared to the tolerancebounds

66 Exp Astron (2011) 30:59–81
the tolerance limits between radius 2.5 mm and radius 4 mm. Furthermore,the Y band measurements also show that the transmission exceeds the upperlimit close to the pupil edge. The transmission profile is quite constant from Yto H band, thus showing the achromatism of the Inconel coating. The globaltransmission coefficient value of the apodizer is 65% ± 3% in J and H bandsand 68% ± 3% in Y band.
Because of the non-respect of the tolerance limits between 2.5 and 4 mm, wefound useful to study the effect of this discrepancy in operational conditions,i.e. on SPHERE in the presence of residual atmospheric and static aberrations.The results of the simulations will be presented in Section 4.5.
4.2 The pupil mask
Testing the ALC with an obscured entrance pupil was mandatory since theapodizer transmission profile is optimized with respect to the pupil geometry.The pupil mask was laser-cut in a stainless steel sheet (STEEC, France).Its design simulates the exact VLT pupil at the scale 1/444, with an outerpupil diameter of 18 mm (see Fig. 6). Table 4 gives the main manufacturingtolerancing.
This entrance pupil mask was set in the optical path at the same place asthat of the theoretical entrance pupil.
Fig. 6 Left: picture of the VLT pupil mask. Right: mechanical blueprint of this pupil mask

Exp Astron (2011) 30:59–81 67
Table 4 Pupil maskspecifications
Technical specifications
Centering of the 2 disks ±10 μmOuter diameter tolerancing ±20 μmInner diameter tolerancing ±10 μmArms straightness 5 μm
4.3 The Lyot coronagraphic mask
The Lyot coronagraphic mask was manufactured by photolithography by thefrench company Micromodule. A chromium-coated opaque disk is depositedon a transparent silica substrate. Table 5 gives the manufacturing characteris-tics of this element.
Several coronagraphic masks of different diameters were set on the samesubstrate: presently only the 4λ/D @ 1.67 μm mask was used for these tests;Foucault knives were also set to make the alignment process more convenient.
4.4 The Lyot stop
In the relayed pupil plane, the beam diameter is 10 mm on the test bench.According to Soummer [20], the Lyot stop shape should be similar to the pupilmask one. The Lyot stop parameters were optimized by numerical simulations(Carbillet et al. [8]) taking into account phase error due to the apodizerdeposit. The result is that the outer diameter is 0.96 times the pupil imagediameter, i.e. 9.6 mm, and the arms width is 3 times the pupil image armswidth, i.e. 0.150 mm. The Lyot stop was manufactured like the pupil mask by astainless steel sheet laser-cut (STEC, France). The manufacturing tolerancingis the same as the pupil mask one.
4.5 Simulations of the real apodizer prototype performances on the SPHEREinstrument compared with the theoretical ones
Simulations were carried out to evaluate the Reynard apodizer performancewith respect to the performance of the theoretical ideal apodizer. They wereperformed using the same simulation tool as Carbillet et al. [8]. The resultsfor SPHERE main observing mode in the H2H3 bands are presented in
Table 5 Manufacturingcharacteristics of the Lyotcoronagraphic mask
D: pupil diameter
Characteristics
Mask diameter 4λ/D = 267 μm @ 1.67 μmMask diameter tolerancing ±1%Mask optical density Light attenuation >106
Substrate material IR SilicaSubstrate quality λ/4 PTV @ 633 nmSubstrate parallelism <1′Scratch/dig 10/5Anti-Reflection coating 0.5%

68 Exp Astron (2011) 30:59–81
0 5 10 15 20 25 30 35 4010
−5
10−4
10−3
10−2
10−1
100
Off−axis distance (λ/D units)
Ave
rage
rad
ial p
rofil
esComparison Reynard Apodizer vs Theoretical apodizer
Reynard mean apodized reference PSFTheoretical mean apodized reference PSFReynard mean coronagraphed imageTheoretical mean coronagraphed image
Fig. 7 Comparison of the ALC performances on the SPHERE instrument with the theoreticalapodizer and with the manufactured apodizer with atmospheric residuals and static aberrations
Fig. 7. In this simulation, atmospheric residuals and static aberrations are takeninto account with the default setting parameters. In this figure, Reynard’sand theoretical apodizer coronagraphic images are nearly superimposed. Thedegradation of the rejection ratio is evaluated to 4%. We can conclude that thenoncompliance with the theoretical profile of the apodizer is not critical.
5 Laboratory tests of the ALC performances
In addition to the measurement of the chromatic transmission profiles of theapodizer prototype (as presented in Section 4.1.2), the tests performed on theIR bench had two more purposes:
– To measure the coronagraphic performances of the apodized Lyot coro-nagraph in Y, J, and H band with this apodizer prototype and a 4λ/Dcoronagraphic mask.
– To study the sensitivity to lateral and longitudinal (defocus) misalignmentsof the three components of the ALC: apodizer, coronagraphic mask andLyot stop.
Exp Astron (2011) 30:59–81 69
All these tests were made using a Fianium super continuum source, withpolychromatic filters in Y, J, and H band.
They were carried out with the same Lyot coronagraphic mask, of a dimen-sion of 4λ/D @ 1.67 μm, i.e. 267 μm.
5.1 Coronagraphic performance in Y, J, and H bands
5.1.1 SPHERE requirements for coronagraphy
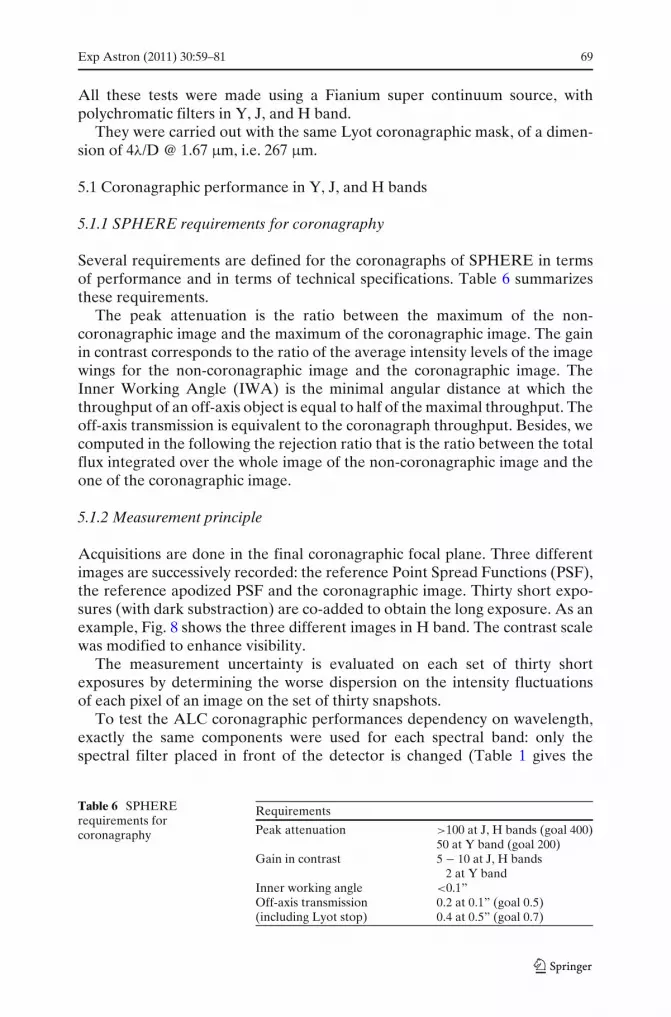
Several requirements are defined for the coronagraphs of SPHERE in termsof performance and in terms of technical specifications. Table 6 summarizesthese requirements.
The peak attenuation is the ratio between the maximum of the non-coronagraphic image and the maximum of the coronagraphic image. The gainin contrast corresponds to the ratio of the average intensity levels of the imagewings for the non-coronagraphic image and the coronagraphic image. TheInner Working Angle (IWA) is the minimal angular distance at which thethroughput of an off-axis object is equal to half of the maximal throughput. Theoff-axis transmission is equivalent to the coronagraph throughput. Besides, wecomputed in the following the rejection ratio that is the ratio between the totalflux integrated over the whole image of the non-coronagraphic image and theone of the coronagraphic image.
5.1.2 Measurement principle
Acquisitions are done in the final coronagraphic focal plane. Three differentimages are successively recorded: the reference Point Spread Functions (PSF),the reference apodized PSF and the coronagraphic image. Thirty short expo-sures (with dark substraction) are co-added to obtain the long exposure. As anexample, Fig. 8 shows the three different images in H band. The contrast scalewas modified to enhance visibility.
The measurement uncertainty is evaluated on each set of thirty shortexposures by determining the worse dispersion on the intensity fluctuationsof each pixel of an image on the set of thirty snapshots.
To test the ALC coronagraphic performances dependency on wavelength,exactly the same components were used for each spectral band: only thespectral filter placed in front of the detector is changed (Table 1 gives the
Table 6 SPHERErequirements forcoronagraphy
Requirements
Peak attenuation >100 at J, H bands (goal 400)50 at Y band (goal 200)
Gain in contrast 5 − 10 at J, H bands2 at Y band
Inner working angle <0.1”Off-axis transmission 0.2 at 0.1” (goal 0.5)(including Lyot stop) 0.4 at 0.5” (goal 0.7)

70 Exp Astron (2011) 30:59–81
(a) (b) (c)
Fig. 8 Laboratory measurement in H band: a reference non apodized PSF, b reference apodizedPSF, c coronagraphed image. These images are displayed using a log brightness scale, normalizedto the same exposure time
spectral filters characteristics). This reproduces the main observational modeof SPHERE which consists in simultaneous observations in two differentspectral bands.
Note that to obtain the reference PSFs, we used the same optimalconfigurations as those as the HW-4QPM tests, inherited from the previousexperiment.
5.1.3 Peak attenuation and rejection ratio measurements
Figure 9 shows the measurements in H band (top), J band (middle), and Yband (bottom) of the reference non apodized PSF (integration time Ti = 1 ms),the apodized PSF (Ti = 1.5 ms) and the coronagraphed image (Ti = 300 msin H, 850 ms in J, and 1,000 ms in Y band), compared with simulations.The latter takes into account the real transmission profile of the Reynardapodizer, as measured in Section 4.1.2. The other relevant parameters are: noatmospheric residuals, no aberrations and broadband imaging in H, J, Y bandrespectively. The same coronagraphic mask is used in J and Y bands as in Hband. Therefore, the entrance PSF is obstructed by a larger focal plane maskwith an equivalent diameter in J band of 5.6λ/D @ 1.191 μm, and in Y bandof 6.3λ/D @ 1.063 μm.
In H band, the effect of the apodizer is clearly visible through the shift ofthe Airy rings between the reference PSF and the apodized PSF. For off-axisdistances greater than 2λ/D, there is an offset in intensity between experimen-tal results and simulations for both types of reference PSF. This discrepancy,also present in the HW-4QPM data, is likely due to non linearities of theIR detector at low flux that cannot be completely compensated as this wouldrequire a large amount of additional calibrations. The discrepancy is presenton both reference PSFs and is of a lesser importance on the coronagraphicimage. Furthermore, we can see on 2D images that the PSFs are not radiallysymmetrical: for a given off-axis distance, the intensity levels on the radialprofiles are locally affected. Anyway, we can qualitatively note from Fig. 9that the wings contrast measured with the Reynard apodizer seems to complywith our expectations. For a quantitative analysis, Table 7 gives the ALC

Exp Astron (2011) 30:59–81 71
Fig. 9 Laboratorymeasurement in H band (top),J band (middle), and Y band(bottom): average radialprofiles compared withsimulations
0 2 4 6 8 10 12 14 16 18 2010
−8
10−7
10−6
10−5
10−4
10−3
10−2
10−1
100
Off−axis distance (λ/D units)
Ave
rage
nor
mal
ised
rad
ial p
rofil
es
Measured Reference PSFSimulated Reference PSFMeasured Reference apodized PSFSimulated Reference apodized PSFMeasured Coronagraphed imageSimulated Coronagraphed image
0 0.09 0.17 0.26 0.35 0.43 0.52 0.61 0.69 0.78 0.87
Off−axis distance (arcsec)
0 2 4 6 8 10 12 14 16 18 2010
−7
10−6
10−5
10−4
10−3
10−2
10−1
100
Off−axis distance (λ/D units)
Ave
rage
nor
mal
ised
rad
ial p
rofil
es
Measured Reference PSFSimulated Reference PSFMeasured Reference apodized PSFSimulated Reference apodized PSFMeasured Coronagraphed imageSimulated Coronagraphed image
0 0.06 0.12 0.18 0.25 0.31 0.37 0.43 0.49 0.55 0.61
Off−axis distance (arcsec)
0 2 4 6 8 10 12 14 16 18 2010
−7
10−6
10−5
10−4
10−3
10−2
10−1
100
Off−axis distance (λ/D units)
Ave
rage
nor
mal
ised
rad
ial p
rofil
es
Measured Reference PSFSimulated Reference PSFMeasured Reference apodized PSFSimulated Reference apodized PSFMeasured Coronagraphed imageSimulated Coronagraphed image
0 0.05 0.11 0.16 0.22 0.27 0.33 0.38 0.44 0.49 0.55
Off−axis distance (arcsec)

72 Exp Astron (2011) 30:59–81
Table 7 ALC performances in H band: comparison between experiment and simulation
Criterion Experimental Theoreticalvalue value
Peak attenuation 270 ± 10 250 ± 30(from the reference PSF)
Peak attenuation 190 ± 10 150 ± 20(from the apodized reference PSF)
Rejection ratio 200 ± 40 205 ± 25(from the reference PSF)
Rejection ratio 140 ± 30 135 ± 20(from the apodized reference PSF)
The uncertainties on the theoretical values take into account the manufacturing error of thecoronagraphic mask
coronagraphic performances deduced from these measurements comparedwith simulations: they agree with expectations. The peak attenuation and therejection values are respectively obtained with a dispersion of ±3% and ±20%on the thirty snapshots images. The rejection value presents a higher dispersionthan the peak attenuation as its estimate takes into account a higher numberof pixels. The uncertainties given on the theoretical values take into accountthat the coronagraphic mask was manufactured with a tolerance of ±1% on itsdiameter value.
In J band, there is the same discrepancy between reference measured curvesand simulated ones as in H band. Also, the wings contrasts are more altered bythe background residuals and optical aberrations. During the integration, wenoted the presence of a residual aberration in the J band PSF, whose effect wasto split the image of two spider arms in one diagonal direction. Nevertheless,the global behaviour of the PSF is consistent with the simulations.
The ALC nulling performances in J and Y band are given in Table 8. Therejection ratios are obtained with a dispersion of ±20%.
The peak attenuation is not evaluated as we noted a discrepancy betweenthe measured and the theoretical PSFs that could be generated by a defocus ofthe Lyot stop, introducing some residual diffraction at the center of the PSF.
Table 8 ALC performances in J and Y bands: comparison between experiment and simulation
Criterion Experimental Theoreticalvalue value
J rejection ratio 190 ± 40 150 ± 5(from the reference PSF)
J rejection ratio 120 ± 25 100 ± 5(from the apodized reference PSF)
Y rejection ratio 180 ± 35 160 ± 5(from the reference PSF)
Y rejection ratio 110 ± 25 110 ± 5(from the apodized reference PSF)
Exp Astron (2011) 30:59–81 73
Anyway, the ALC coronagraphic performances are paramount and Table 8shows a good agreement between experimental and theoretical rejectionratios.
5.1.4 Determination of the Inner Working Angle (IWA) value
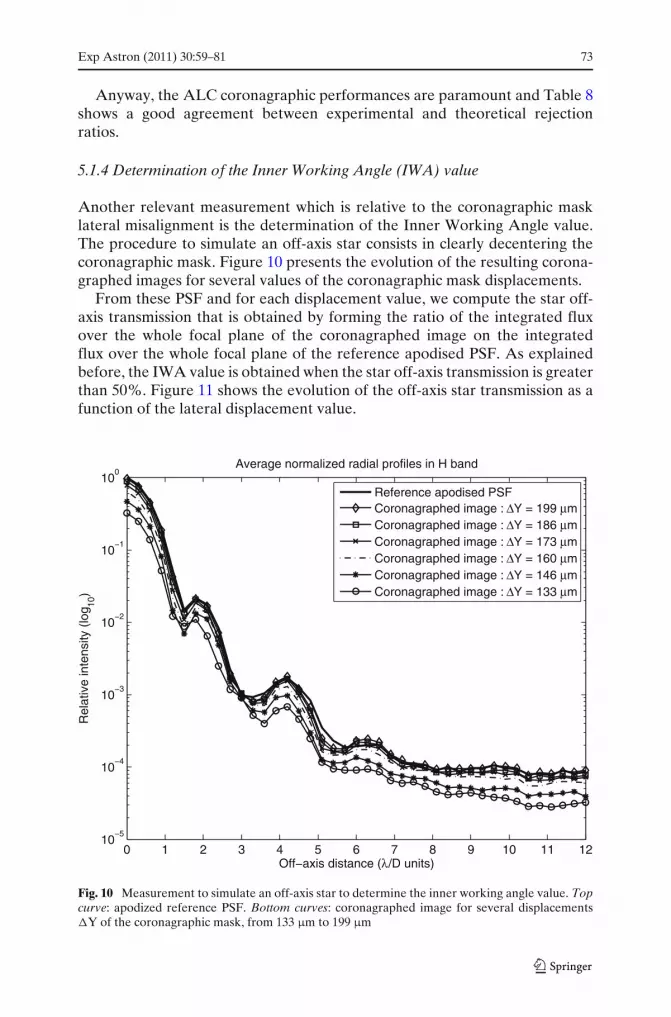
Another relevant measurement which is relative to the coronagraphic masklateral misalignment is the determination of the Inner Working Angle value.The procedure to simulate an off-axis star consists in clearly decentering thecoronagraphic mask. Figure 10 presents the evolution of the resulting corona-graphed images for several values of the coronagraphic mask displacements.
From these PSF and for each displacement value, we compute the star off-axis transmission that is obtained by forming the ratio of the integrated fluxover the whole focal plane of the coronagraphed image on the integratedflux over the whole focal plane of the reference apodised PSF. As explainedbefore, the IWA value is obtained when the star off-axis transmission is greaterthan 50%. Figure 11 shows the evolution of the off-axis star transmission as afunction of the lateral displacement value.
0 1 2 3 4 5 6 7 8 9 10 11 1210
−5
10−4
10−3
10−2
10−1
100
Off−axis distance (λ/D units)
Rel
ativ
e in
tens
ity (
log 10
)
Average normalized radial profiles in H band
Reference apodised PSFCoronagraphed image : ΔY = 199 μmCoronagraphed image : ΔY = 186 μmCoronagraphed image : ΔY = 173 μmCoronagraphed image : ΔY = 160 μmCoronagraphed image : ΔY = 146 μmCoronagraphed image : ΔY = 133 μm
Fig. 10 Measurement to simulate an off-axis star to determine the inner working angle value. Topcurve: apodized reference PSF. Bottom curves: coronagraphed image for several displacements�Y of the coronagraphic mask, from 133 μm to 199 μm

74 Exp Astron (2011) 30:59–81
1 1.1 1.2 1.3 1.4 1.50
0.1
0.2
0.3
0.4
0.5
0.6
0.7
0.8
0.9
1
Displacements values (coronagraphic mask radius units)
Sta
r no
rmal
ized
tran
smis
sion
Fig. 11 Determination of the IWA: evolution of the off-axis star transmission versus the lateraldisplacement value. The IWA value is estimated at 1.67 μm
The IWA value is obtained for a displacement value equal to 1.15times the coronagraphic mask radius, i.e. 153 μm which corresponds to2.29 λ/D @ 1.67 μm. This value is clearly consistent with our expectationsextrapolated from the simulations made by Guyon et al. [13].
5.1.5 Conclusion about the performances
Table 9 summarizes the ALC performances obtained in laboratory. Note thatthe off-axis transmission corresponds to the product of the apodizer globaltransmission by the Lyot stop transmission.
Table 9 Overview of theALC performances
H band J band Y band
PSF peak attenuation 270Gain in PSF contrast 24 21 20Off-axis transmission 58.5% 58.5% 61.2%Inner working angle 2.29λ/D

Exp Astron (2011) 30:59–81 75
Despite the technical imperfections mentioned in the previous sections, themeasured ALC performances meet the SPHERE requirements for coronagra-phy given in Table 6.
5.2 Lateral misalignment sensitivity
In this section, the three main components of the ALC, the apodizer, the coro-nagraphic mask, and the Lyot stop, are successively laterally and longitudinallymisaligned from their ideal position.
In order to determine the specifications on the positioning of these compo-nents, several coronagraphic metrics were used. We plotted the evolution ofthe peak attenuation and the rejection ratios as a function of the displacementvalue: an example concerning the apodizer lateral misalignment is given onFig. 12 and will be discussed in the following. For each misalignment value,we also determined the contrast evolution, i.e. the ratio between the averageradial profile of the coronagraphed image with the displacement, and theaverage radial profile of the coronagraphed image for the ideal position: we
0 1/180 1/90 1/45 2/45 1/15 4/45 1/9 13/90 1/60
0.2
0.4
0.6
0.8
1
Displacements values (pupil radius units)
Nor
mal
ized
ext
inct
ion
and
reje
ctio
n ra
tios
Fig. 12 Example of coronagraphic metrics used to determine the specifications on the position-ning of the ALC components: evolution of the peak attenuation (solid) and rejection ratio (dash-dotted) as a function of the apodizer lateral displacement values �X, from 0 to 1/6 fraction of thepupil plane radius (ie from 0 to 1.5 mm). For the optical layout, the beam radius is equal to 9 mm

76 Exp Astron (2011) 30:59–81
looked for the displacement value inducing a loss of contrast smaller than 10%;that corresponds to the average level of noise.
In the following, the displacements values are given first in upr ie units ofpupil radius for the apodizer and the Lyot stop and in λ/D for the focal planecoronagraphic mask and then in μm (or mm) between brackets for the threemain ALC components.
Figure 13 shows the resulting coronagraphed images obtained in H-band forlateral displacements �X or �Y of the apodizer (top), the Lyot coronagraphicmask (middle), and the Lyot stop (bottom).
The sensitivity of the ALC performances to the apodizer lateral misaligne-ment is not severe: the PSF radial profiles curves are merged for displacementvalues below 2/45 upr (ie 400 μm). The displacement of 2/45 upr (ie 400 μm)corresponds to a drift in the coronagraphic metrics, and to a contrast lossexceeding 10%. This latter value is chosen for the tolerance and correspondsto 5.10−3 times the radius of the apodizer. Furthermore, for values greaterthan 13/90 upr (ie 1,300 μm), the sudden degradation of the PSF shapes andcontrasts is due to the fact that the apodizer central transmission peak (used tomake apodizer alignment more convenient) is no more occulted by the centralobscuration of the pupil mask.
As expected, the ALC performances are very sensitive to the coronagraphicmask lateral misalignement: a 0.15 λ/D (ie 10 μm)-displacement alreadyinduces important variations of the coronagraphed image shape, confirmedby the metrics. Therefore, the acceptable misalignment limit is lower than0.15 λ/D (ie 10 μm): a tolerance value of few μm might be appropriate whichis equivalent to a few hundredths of the coronagraphic mask radius.
The ALC sensitivity to lateral misalignment on the Y axis of the Lyot stopis quite important beyond 4 λ/D. The tolerance value amounts to ±2.10−3 upr(ie ±40 μm) which corresponds to 8 thousandths of the Lyot stop outer radius.
Figure 14 shows the resulting coronagraphed images obtained in H-bandfor longitudinal displacements (defocus) �Z of the apodizer (top), the focalplane coronagraphic mask (middle), and the Lyot stop (bottom). We remindfor the following that the aperture ratio is F/40 for the focal plane and that thediameter of the beam is 18 mm in the entrance pupil and 10 mm in the relayedpupil plane.
The relatively similar shape of all curves shows that the ALC is quiteinsensitive to the apodizer defocus. Let us note that the 0 mm position meansthat the apodizer is in the pupil plane, or as close as possible. A few mm ofdefocus lead to a loss of contrast in the coronagraphed image wings whichincreases with displacement: for example, a 1/9 upr (ie 1 mm) defocus inducesa change of the contrast from 0.6 10−5 to 0.8 10−5 at 8λ/D from the PSF center.A longitudinal Z positioning specification for the apodizer can be establishedat ±5/18 upr (ie ±2.5 mm).
The displacement from −14.98λ/D to 44.94λ/D (ie from −1 mm to 3 mm)of the Lyot coronagraphic mask along the optical axis away from the sup-posed best focus position is not symmetrical due to a mechanical stop. Fromour measurements, we can set a longitudinal positioning specification of

Exp Astron (2011) 30:59–81 77
Fig. 13 Coronagraphedimages. Lateral displacementsof the apodizer (top), �Xfrom 0 to 1/6 upr (ie 1.5 mm)along the lateral X-axis.Lateral displacements of thefocal plane coronagraphicmask (middle), �Y from 0 to0.75λ/D (ie from 0 to 50 μm)along the lateral Y-axis.Lateral displacements of theLyot stop (bottom), �Y from0 to 1.10−2 upr (ie from 0 to200 μm) along the lateralY-axis. upr stands for units ofpupil radius
0 1 2 3 4 5 6 7 8 9 10 11 1210
−6
10−5
10−4
10−3
10−2
10−1
100
Off−axis distance (λ/D units)
Rel
ativ
e in
tens
ity (
log 10
)
Average normalised radial profiles in H band
Reference apodised PSFCoronagraphed PSF : ΔX = 0 upr (ie 0 μm)Coronagraphed PSF : ΔX = 1/180 upr (ie 50 μm)Coronagraphed PSF : ΔX = 1/90 upr (ie 100 μm)Coronagraphed PSF : ΔX = 1/45 upr (ie 200 μm)Coronagraphed PSF : ΔX = 2/45 upr (ie 400 μm)Coronagraphed PSF : ΔX = 1/15 upr (ie 600 μm)Coronagraphed PSF : ΔX = 4/45 upr ie (800 μm)Coronagraphed PSF : ΔX = 1/9 upr (ie 1000 μm)Coronagraphed PSF : ΔX = 13/90 upr (ie 1300 μm)Coronagraphed PSF : ΔX = 1/6 upr (ie 1500 μm)
0 1 2 3 4 5 6 7 8 9 10 11 1210
−6
10−5
10−4
10−3
10−2
10−1
100
Off−axis distance (λ/D units)
Rel
ativ
e in
tens
ity (
log 10
)
Average normalised radial profiles in H band
Reference apodised PSFCoronagraphed image : ΔY = 0 λ/D (ie 0 μm)Coronagraphed image : ΔY = 0.15 λ/D (ie 10 μm)Coronagraphed image : ΔY = 0.3 λ/D (ie 20 μm)Coronagraphed image : ΔY = 0.45 λ/D (ie 30 μm)Coronagraphed image : ΔY = 0.6 λ/D (ie 40 μm)Coronagraphed image : ΔY = 0.75 λ/D (ie 50 μm)
0 1 2 3 4 5 6 7 8 9 10 11 1210
−6
10−5
10−4
10−3
10−2
10−1
100
Off−axis distance (λ/D units)
Rel
ativ
e in
tens
ity (
log 10
)
Average normalized radial profiles in H band
Reference apodised PSFCoronagraphed image : ΔY = 0 upr (ie 0 μm)
Coronagraphed image : ΔY = 1.10−3 upr (ie 20 μm)
Coronagraphed image : ΔY = 2.10−3 upr (ie 40 μm)
Coronagraphed image : ΔY = 3.10−3 upr (ie 60 μm)
Coronagraphed image : ΔY = 4.10−3 upr (ie 80 μm)
Coronagraphed image : ΔY = 5.10−3 upr (ie 100 μm)
Coronagraphed image : ΔY = 1.10−2 upr (ie 200 μm)
±14.98λ/D (ie ±1 mm) for the coronagraphic mask which corresponds to thecontrast specification. More accurate evaluations of this effect are expectedon the final bench, on which measurement noise will be lower and mechanicaldisplacement better controlled.

78 Exp Astron (2011) 30:59–81
Fig. 14 Coronagraphedimages. Longitudinaldisplacements of the apodizer(top), �Z from 0 to 5/9 upr(ie from 0 to 5 mm).Longitudinal displacements ofthe focal plane coronagraphicmask (middle), �Z from−14.98λ/D to 44.94λ/D (iefrom −1 to 3 mm).Longitudinal displacements ofthe Lyot stop (bottom), �Zfrom −2 upr to 1.2 upr (iefrom −10 to 6 mm). uprstands for units of pupil radius
0 1 2 3 4 5 6 7 8 9 10 11 12 13 1410
−6
10−5
10−4
10−3
10−2
10−1
100
Off−axis distance (λ/D units)
Rel
ativ
e in
tens
ity (
log 10
)
Average normalised radial profiles in H band
Reference apodised PSFCoronagraphed PSF : ΔZ = 0 upr (ie 0 mm)Coronagraphed PSF : ΔZ = 1/18 upr (ie 0.5 mm)Coronagraphed PSF : ΔZ = 1/9 upr (ie 1 mm)Coronagraphed PSF : ΔZ = 1/6 upr (ie 1.5 mm)Coronagraphed PSF : ΔZ = 2/9 upr (ie 2 mm)Coronagraphed PSF : ΔZ = 5/18 upr (ie 2.5 mm)Coronagraphed PSF : ΔZ = 1/3 upr (ie 3 mm)Coronagraphed PSF : ΔZ = 7/18 upr (ie 3.5 mm)Coronagraphed PSF : ΔZ = 4/9 upr (ie 4 mm)Coronagraphed PSF : ΔZ = 1/2 upr (ie 4.5 mm)Coronagraphed PSF : ΔZ = 5/9 upr (ie 5 mm)
0 1 2 3 4 5 6 7 8 9 10 11 12 13 1410
−6
10−5
10−4
10−3
10−2
10−1
100
Off−axis distance (λ/D units)
Rel
ativ
e in
tens
ity (
log 10
)
Average normalised radial profiles in H band
Reference apodised PSFCoronagraphed PSF : ΔZ = −14.98 λ/D (ie −1 mm)Coronagraphed PSF : ΔZ = −7.49 λ/D (ie −0.5mm)Coronagraphed PSF : ΔZ = 0 λ/D (ie 0 mm)Coronagraphed PSF : ΔZ = 7.49 λ/D (ie 0.5 mm)Coronagraphed PSF : ΔZ = 14.98 λ/D (ie 1 mm)Coronagraphed PSF : ΔZ = 29.96 λ/D (ie 2 mm)Coronagraphed PSF : ΔZ = 44.94 λ/D (ie 3 mm)
0 1 2 3 4 5 6 7 8 9 10 11 12 13 1410
−6
10−5
10−4
10−3
10−2
10−1
100
Off−axis distance (λ/D units)
Rel
ativ
e in
tens
ity (
log 10
)
Average normalized radial profiles in H band
Reference apodised PSFCoronagraphed PSF : ΔZ = −2 upr (ie −10 mm)Coronagraphed PSF : ΔZ = −1.6 upr (ie −8 mm)Coronagraphed PSF : ΔZ = −1.2 upr (ie −6 mm)Coronagraphed PSF : ΔZ = −0.8 upr (ie −4 mm)Coronagraphed PSF : ΔZ = −0.4 upr (ie −2 mm)Coronagraphed PSF : ΔZ = 0 upr (ie 0 mm)Coronagraphed PSF : ΔZ = 0.4 upr (ie 2 mm)Coronagraphed PSF : ΔZ = 0.8 upr (ie 4 mm)Coronagraphed PSF : ΔZ = 1.2 upr (ie 6 mm)
Considering the Lyot stop, the best contrast is obtained for a displacement�Z of −0.4 upr (ie −2 mm). In fact, the field depth of the alignment toolallowing the Lyot stop adjustment in the pupil plane is too large to be accurate

Exp Astron (2011) 30:59–81 79
enough. This shows the importance to iteratively adjust the Lyot stop positionfrom contrast estimates, and brings two interesting results:
– The effect of a few mm-defocus of the Lyot Stop is almost null up todistances of 4λ/D.
– The sensitivity of the contrast becomes severe for defocus greater than 1.2upr (ie 6 mm).
Besides, we can notice a leap in the image profiles shapes between the −1.2upr (ie −6 mm) and the −1.6 upr (ie −8 mm) displacements: this is due to edgediffraction in the center of the coronagraphic pupil plane leading to re-injectingsome energy in the final focal plane. These results show that a longitudinal Zpositioning specification of ±0.8 upr (ie ±4 mm) is realistic for the Lyot stop.
In conclusion Table 10 gives the specifications on absolute positioning forthe three ALC components: apodizer, Lyot coronagraphic mask and Lyotstop. This leads identifying what the critical elements are for the mechanicalpositioning on the coronagraphic optical bench and for the direct imaging ob-servational mode: the coronagraphic mask in both positions, and the Lyot stopin the lateral position. Furthermore, we can notice that the same tendencieswere found with another ALC prototype in the visible that was tested with thehigh dynamic range imaging bench at Fizeau laboratory (Guerri et al. [12]).
The measurements are compared with the simulations performed by Car-billet et al. [8], when available. We chose to estimate the longitudinal sensi-tivity only experimentally, as computation of Fresnel diffraction is not trivial.Nevertheless, we expected the X-Y positionings to be more critical than theZ positioning. Considering the X-Y positionings, the differences betweenexperiment and simulation may be caused by the following:
– The measurements were performed in a larger H band. The sensitivityis then more severe for the Lyot mask and stop. Concerning the Lyotmask displacement, we can also notice in Fig. 13 that the performancedegradation is significant for off-axis distances as close as λ/D, while thesimulations don’t take into account the effects below 2λ/D.
Table 10 Synthesis of the tolerances values on the positioning of the ALC components obtainedby measurements and compared with simulations (Carbillet et al. [8])
X-Y position Z position
MeasurementsApodizer ±1/18 upr (ie ±500 μm) ±5/18 upr (ie ±2.5 mm)Lyot mask ±0.075 − 0.15 λ/D (ie ± 5–10 μm) ±14.98 λ/D (ie ±1 mm)Lyot stop ±2 10−3 upr (ie ±40 μm) ±0.8 upr(ie ±4 mm)
SimulationsApodizer ±3/100 upr (ie ±270 μm)Lyot mask ±0.375 λ/D (ie ± 25 μm)Lyot stop ±4.75 10−3 upr (ie ±95 μm)
X-Y stands for lateral position and Z for longitudinal position. upr stands for units of pupil radius
80 Exp Astron (2011) 30:59–81
– The edges of the manufactured apodizer are less sharp than the simulatedprofile. This can explain why its lateral positioning is in fact more tolerant.
6 Conclusion
We have presented the results of the experimental characterization in thenear-IR of the Apodized Lyot Coronagraph prototype that was designed forthe SPHERE instrument. Several type of measurements were carried out, themain conclusions that can be drawn are:
– Apodizer characterization: the apodizer global transmission coefficient is65% ± 3% in J and H bands and 68% ± 3% in Y band, as expected.
– ALC coronagraphic performances in Y, J, and H bands: the PSFs globallook and the extinction ratio are consistent with the simulations.
– Estimate of the ALC sensitivity to the lateral and longitudinal misalign-ment of its three main components: the coronagraph is very sensitive tolateral displacements of the coronagraphic mask and of the Lyot stop, andto the Lyot stop defocus.
Although the metal coated apodizer’s prototype meets the requirements, itappeared that the profile is not reproducible within the specifications. It wasthen decided to explore the use of other technologies. Further prototypingis presently carried out with variable density microdot technology. Theseapodizers consist of an array of pixels with spatially variable density. Theadvantage compared to the present prototype is the excellent agreementbetween the obtained and expected profiles. Their physical properties havebeen demonstrated in laboratory (Martinez et al. [16]).
From the set of results presented in this paper, we can assess the man-ufacturing error will have no impact on the SPHERE instrument detectionlimit and the ALC instrument will comply the final SPHERE instrumentspecifications. The sensitivity study is applicable to any type of apodizer,including microdots.
Acknowledgements The experiments reported in this article were supported by the district ofProvence Alpes Côte d’Azur (PACA), CNRS (Centre National de la Recherche Scientif ique,France) and ASHRA (Action Spécif ique Haute Résolution Angulaire).
G. Guerri is grateful to the CNRS, the Région Provence Alpes Côte d’Azur (France), and Sud-Est Optique de Précision (France) for having supported her PhD thesis.
G. Guerri is grateful to the “Communauté Française de Belgique—Action de rechercheconcertée—Académie Wallonie—Europe” for supporting her Post-Doctoral grant.
SPHERE is an instrument designed and built by a consortium consisting of LAOG (Lab-oratoire d’Astrophysique de Grenoble, France), MPIA (Max-Planck-Institute für Astronomie,Heidelberg, Germany), LAM (Laboratoire d’Astrophysique de Marseille, France), LESIA (Lab-oratoire d’Études Spatiales et d’Instrumentation en Astrophysique, Meudon, France), Labora-toire H. Fizeau (Nice, France), INAF–OAPD (Istituto Nazionale di AstroFisica–OsservatorioAstrof isico di Padova, Italy), Observatoire de Genève (Switzerland), ETH (EidgenössischeTechnische Hochschule, Zürich, Switzerland), NOVA (Nederlandse Onderzoekschool voor deAstronomie, Leiden, The Netherlands), ONERA (Of f ice National d’Études et de Recherches

Exp Astron (2011) 30:59–81 81
Aérospatiales, Châtillon, France), and ASTRON (Dwingeloo, The Netherlands), in collaborationwith ESO (European Southern Observatory, Garching-bei-München, Germany).
References
1. Abe, L., Venet, M., Enya, K., et al.: Multi-stage apodized pupil Lyot coronagraph experimentalresults. Proc. SPIE 7014, 701467–701467-11 (2008)
2. Aime, C., Soummer, R., Ferrari, A.: Total coronagraphic extinction of rectangular aperturesusing linear prolate apodizations. A&A 389, 334 (2002)
3. Aime, C., Soummer, R.: The Usefulness and Limits of Coronagraphy in the Presence of PinnedSpeckles. ApJ 612, L85 (2004)
4. Beuzit, J.-L., Feldt, M., Dohlen, K., et al.: SPHERE: a ‘Planet Finder’ instrument for the VLT.The Messenger 125, 29 (2006)
5. Boccaletti, A., Abe, L., Baudrand, J., et al.: Prototyping coronagraphs for exoplanet charac-terization with SPHERE. Proc. SPIE 7015, 70151B (2008)
6. Boccaletti, A., Daban, J.-B.: SPHERE—Coronagraph Test Report. ESO document, VLT-TRE-SPH-14690-228 (2007)
7. Boccaletti, A., Daban, J.-B.: SPHERE—Coronagraph Design Report. ESO document, VLT-TRE-SPH-14690-229 (2007)
8. Carbillet, M., Bendjoya, P., Abe, L., et al.: Apodized Lyot coronagraph for SPHERE/VLT: I.Detailed numerical study. Exp. Astron. (2011). doi:10.1007/s10686-011-9219-4
9. Carlotti, A., Ricort, G., Aime, C., et al.: Apodized apertures using a Mach–Zehnder inter-ferometer. Laboratory results. In: Proc. of the conference In the spirit of Bernard Lyot, 24C(2007)
10. Drossart, P., Piccioni, G., Coradini, A., et al.: VIRTIS imaging spectrometer for theESA/Venus express mission, Proc. SPIE 5543, 175 (2004)
11. Ghomchi, Y.: PhD Thesis: caractéristaion et étalonnage du détecteur infrarouge del’instrument VIRTIS-H pour la mission cométaire Roseta, Université Paris VI (2001)
12. Guerri, G., Robbe-Dubois, S., Daban, J.B., et al.: Apodized Lyot coronagraph for VLT-SPHERE: laboratory tests and performances of a first prototype in the visible. Proc. SPIE70143, 70143J (2008)
13. Guyon, O., Pluzhnik, E.A., Kuchner, M.J., et al.: Theoretical limits on extrasolar terrestrialplanet detection with coronagraphs. ApJS 167, 81 (2006)
14. Lyot, B.: La couronne solaire étudiée en dehors des éclipses. C. R. Acad. Sci. Paris 191, 834(1930)
15. Lyot, B.: The study of the solar corona and prominences without eclipses. MNRAS 99, 538(1939)
16. Martinez, P., Dorrer, C., Kasper, M., Boccaletti, A., Dohlen, K.: Design, analysis, and testingof a microdot apodizer for the apodized pupil Lyot coronagraph. II. Impact of the dot size.A&A 500, 1281 (2009)
17. Mawet, D., Riaud, P., Baudrand, J., Baudoz, P., Boccaletti, A., Dupuis, O., Rouan, D.: Thefour-quadrant phase-mask coronagraph: white light laboratory results with an achromaticdevice. A&A 448, 801 (2006)
18. Rouan, D., Riaud, P., Boccaletti, A., et al.: The four-quadrant phase-mask coronagraph. I.Principle. PASP 112, 1479 (2000)
19. Soummer, R., Aime, C., Falloon, P.: Stellar coronagraphy with prolate apodized circularapertures. A&A 397, 1161 (2003)
20. Soummer, R.: Apodized pupil Lyot coronagraphs for arbitrary telescope apertures. ApJ 618,L161 (2005)
21. Soummer, R., Sivaramakrishnan, A., Oppenheimer, B.R., Macintosh, B.A.: The gemini planetimager Apodized pupil Lyot coronagraph. BAAS 38, 1110 (2006)


